
the Creative Commons Attribution 4.0 License.
the Creative Commons Attribution 4.0 License.
 | 07 Oct 2026
Historical climate extremes in Europe and the connection between spring precipitation and summer heat
Laura Lipfert
Ralf Hand
Angela-Maria Burgdorf
Christian Pfister
Heinz Wanner
Stefan Brönnimann

Hot European summers are often preceded by dry springs such as in 2022, but also in 1473 or 1540, two well-known summers of catastrophic heat. Spring precipitation deficits deplete soil moisture levels, which can amplify extreme summer temperature anomalies in Europe through land-atmosphere feedback mechanisms and altered atmospheric circulation. However, the link is not particularly strong, and hence long time series might help to better elucidate the mechanisms. Starting from documentary data and an atlas of temperature, precipitation, and atmospheric circulation over Europe for climate extremes in the last 600 years, we explore this relationship in more detail. We analyse the extreme heat summer of 1473, which followed dry spring conditions in Southeastern Europe related to a positive East Atlantic pattern. We then use the ModE-RA paleo-reanalysis and combine it with an analysis of 11 760 years of atmospheric model simulations as well as other reanalyses and reconstructions. Using a moving climatology approach with LOESS regressions to calculate anomalies, we identify significant negative correlations between winter-spring precipitation and summer temperatures in all data sets in the latitude band 36–48° N (strongest over southeastern Europe), corresponding to known moisture-limited regions. Moreover, apart from precipitation anomalies, hot summers are preceded by increased blocking over north-central Europe and a positive East Atlantic pattern. Conversely, dry winter-springs are followed by more frequent blocking over northern Europe and, in model simulations, an increase in frequency and intensity of summer heatwaves. A linear regression approach for temperature in the northern Mediterranean region shows that precipitation in April and May has a strong, direct influence that does not vanish when taking the detailed atmospheric circulation in winter, spring, and summer into account, and hence cannot be explained by the effect of circulation on both, spring precipitation and summer temperature.
- Article
(8253 KB) - Full-text XML
-
Supplement
(23083 KB) - BibTeX
- EndNote


Some of the hottest recent European summers, such as 2022, were preceded by dry springs. The latest example is 2026, when numerous heat records were broken across Europe after a very dry spring. Spring precipitation deficits play a crucial role in establishing conditions for summer heat extremes in Europe, primarily by influencing soil moisture levels (see review by Seneviratne et al., 2010). Reduced spring rainfall depletes soil moisture, which limits evaporative cooling during the summer and thereby amplifies summer temperature extremes (Vautard et al., 2007; Fischer et al., 2007; Seneviratne et al., 2010; Rousi et al., 2023; Böhnisch et al., 2025). These feedback mechanisms are particularly prominent in Southern Europe, where soil moisture is often a limiting factor for evapotranspiration, creating conditions favorable to heatwaves that can then propagate northward into Central Europe through atmospheric circulation patterns (Vautard et al., 2007; Fischer et al., 2007; Pardo and Paredes-Fortuny, 2024). Studying this connection is relevant for understanding climate variability and change, but also for seasonal forecasting. Often compound heat and drought events develop as the summer starts from an already low water balance.
Several studies have analyzed the relationship between spring precipitation and summer heat extremes in Europe, employing various methods to explore the mechanisms. Many studies rely on model simulations to quantify the contributions of land-atmosphere coupling and soil moisture dynamics and explore the potential evolution of these mechanisms under varying climatic conditions (Seneviratne et al., 2010; Quesada et al., 2012; Rousi et al., 2023; Böhnisch et al., 2025). Other studies utilize observational data of the past to explore these relationships over specific time frames, for example, by analyzing observations from meteorological stations in central and southeastern Europe (Hirschi et al., 2011) or by using reanalysis products (Quesada et al., 2012; Träger-Chatterjee et al., 2013) to examine soil moisture's impact on heat extremes. However, due to data limitations, most studies with observational data do not extend beyond the mid-20th century.
One exception is the study by Wang et al. (2011) that analyzed observational data spanning 1901 to 2005 to examine the connection between winter and early spring precipitation deficits and summer heat extremes in Europe. Their findings highlight how these precipitation deficits, modulated by the North Atlantic Oscillation (NAO), influence soil moisture states, subsequently affecting summer temperature variability and drought severity, particularly in the Mediterranean region.
There are, however, several well-documented cases of spring precipitation deficits followed by summer heat in earlier centuries, most notably the year 1540 (Lipfert et al., 2026). At the same time, there are equally interesting exceptions of hot summers following wet springs (such as in 2024). Analyzing these years as case studies, as well as statistically, could furthermore contribute to a better understanding of present and future summers. A recent publication by Pfister and Wanner (2021) discusses climatically extreme seasons in Europe (cold/warm, wet/dry) of the last 1000 years with respect to their impacts. The recent ModE-RA paleo-reanalysis dataset family (Valler et al., 2024) allows producing an “Atlas of European climate extremes since 1421”, which is the Supplement to this article, comprising maps of temperature, precipitation, sea-level pressure (SLP), and 500 hPa geopotential height (GPH) anomalies for a total of 107 described extreme seasons (Pfister and Wanner, 2021) that overlap with ModE-RA. We use this atlas as a starting point and select suitable case studies, as all seasons in the atlas are well covered with documentary data. Then we use the entire 600-year time period and combine the ModE-RA products with other reconstructions and reanalyses to explore the relationship between dry springs and hot summers in Europe in more detail. Using documentary sources, we extend the time period even further back, to the early 14th century. We thus cover the Little Ice Age (LIA) as well as the transition to the era of anthropogenically caused global warming. Our approach not only extends the temporal scope, allowing analyses of hydroclimate and atmospheric circulation over the past 600 years, but also provides empirical evidence for the mechanisms driving these relationships, offering new insights into past climate variability and its relevance for understanding future risks.
2.1 Climate data and simulations
To analyze spring precipitation and summer temperatures across Europe, we use seasonal means from ModE-RA, a 20-member global gridded monthly paleo-reanalysis spanning the period from 1421 to 2008, with a horizontal resolution of approximately 1.8° by 1.8° (T63) (Valler et al., 2024). The reanalysis integrates an ensemble of transient model simulations (ModE-Sim; Hand et al., 2023) and observational data using an offline data assimilation approach (Valler at al., 2024). Assimilated climate information includes natural proxies, documentary records, and instrumental measurements. From the late 17th century onward, ModE-RA is increasingly using measurements, leading to an increase in the reconstruction skill (a decrease in the ensemble spread), while the influence of the prior (i.e. the model simulations ModE-Sim) becomes weaker.
We further analyze a 20-member ensemble of the underlying atmospheric simulations ModE-Sim. The simulations are performed using the ECHAM6 general circulation model. The model utilizes ten distinct realizations of HADISST2 (Titchner and Rayner, 2014) in addition to ten of their recombinations as boundary conditions for sea-surface temperature (SST) and sea ice from 1850 on. Before 1850, the ensemble relies on SST reconstructions by Samakinwa et al. (2021). Radiative and volcanic forcings follow the standard PMIP4 protocol (Jungclaus et al., 2017), while land-surface conditions for ECHAM6 are provided by the JSBACH integrated land-surface model.
Alongside ModE-RA and ModE-Sim, we investigate ModE-RAclim, an alternative version of ModE-RA that uses 100 randomly selected years from the ModE-Sim ensemble to generate the prior state, thereby improving covariance estimation. With this approach, the prior and covariance structure are time-invariant. Thus, any time variation in ModE-RAclim results solely from assimilated observations, not from model boundary conditions. In contrast, ModE-RA uses 20 distinct transient members of ModE-Sim, retaining the impact of boundary conditions (Valler et al., 2024).
In addition to the ModE dataset family, we also used the reanalysis datasets ERA5 (Hersbach et al., 2020) and 20CRv3 (Slivinski et al., 2019). The latter two were used to calculate atmospheric blocking. The Tibaldi-Molteni algorithm (Tibaldi and Molteni, 1990) was applied to ERA5 and all 80 members of 20CRv3 (see Rohrer et al., 2020, for details). Further, we used a reconstruction of seasonal mean Tibaldi-Molteni blocks that extends back to 1728 and is based on the seasonal frequencies of reconstructed daily weather types (Pfister et al., 2025). The blocking reconstruction is described in more detail by Brönnimann et al. (2025).
2.2 Documentary data
Investigating dry springs in the pre-instrumental period requires specific evidence. Prior to the early 16th century, this mainly includes narrative reports, such as “the spring was dry”, occasionally including observed impacts of droughts on pastures. In the English countryside, spring was perceived as an event rather than a season. Summer began when the growing season started, i.e., at a variable date in April or May. It lasted until the harvest season, autumn, in August and September (Pribyl and Cornes, 2020). From 1500, estimated spring precipitation is available for the Czech Lands (Dobrovolný et al., 2014) and for other countries increasingly in the form of the number of rain days obtained from weather diaries. From 1665, monthly rainfall is documented for Paris (Pliemon et al., 2023; Slonosky, 2002). Continuous evidence on hot summers is obtained from proxy data such as grape harvest dates (Labbé et al., 2019), evidence of wine-must quality (Pfister et al., 2024), and wine-must yields (Pfister et al., 2026). Information on summer droughts is mainly based on observed duration of periods without effective rain, low river levels, and drying up of springs. A considerable amount of evidence comes from the Euro-Climhist database (Pfister et al., 2017, https://www.euroclimhist.unibe.ch/, last access: 1 October 2026). Seasonal temperature indices are available from the late 12th century (https://boris.unibe.ch/191962/, last access: 1 October 2026) but are currently being revised.
2.3 Methods
2.3.1 Atlas of European climate extremes since 1421
The “Atlas of European climate extremes since 1421” (Supplement) shows maps of anomalies relative to the period 1500–1900 for the ensemble means of 2 m temperature, 500 hPa GPH (overlaid contours), precipitation, and SLP (overlaid contours). Each season includes these four fields for all three data sets (ModE-RA, ModE-RAclim, ModE-Sim). All maps of all seasons and all data sets are shown on the same color scale and contour spacing. Note that maps for other seasons, for all four variables and all three data sets can conveniently be generated in ClimeApp (Warren et al., 2024). The documentary sources listed in the Appendix complement the Atlas maps.
2.3.2 Seasonal precipitation and temperature
For the analysis, we calculate seasonal anomalies in ModE-RA, ModE-RAclim, and ModE-Sim using a moving climatology. For this, we apply a LOESS (Locally Weighted Scatterplot Smoothing) algorithm (Cleveland, 1979). This method performs a series of localized linear regressions. The smoothing parameter is selected to correspond to a moving window of approximately 31 years. A key advantage of using LOESS regression is its ability to include data from both the beginning and end of the time series. Consequently, we have more seasons to analyze, and this enhances our ability to investigate the relationship between dry springs and hot summers in Central and Southern Europe. Seasonal anomalies were calculated for January–May (JFMAM, January and February were included since part of the area has snow in winter, which might contribute to spring moisture), total precipitation, and June–August (JJA) 2 m temperature. This approach, using a moving climatology to calculate the anomalies, enables the comparison of temperature and precipitation anomalies across different centuries, providing a robust framework for historical climate analyses. Note that the LOESS approach was applied to all variables, fields and indices used in this paper, except when stated otherwise.
The geographical definitions of the European regions used in this study were based on the IPCC 6th Assessment Report (IPCC, 2021). These standardized regional definitions ensure comparability with previous research and consistency in defining climate patterns across different time periods.
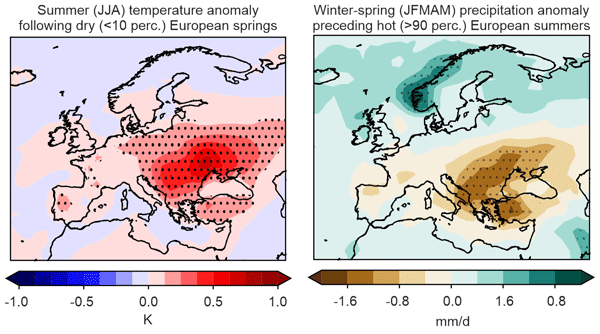
We then performed a composite analysis in which we analyzed the relation between JFMAM precipitation and JJA temperature forward and backward, i.e., we calculated composites of 2 m temperature for all summers following very dry springs (i.e., JFMAM precipitation anomalies below the 10th percentile). Conversely, we plotted composite maps for JFMAM precipitation that preceded hot summers (2 m temperature anomalies above the 90th percentile). For these composite analyses, all members and years from the ModE-RA reanalysis dataset were included separately. We also calculated respective composites for the six circulation indices described in the next section. Statistical testing of the composites was performed with a t-test.
A threshold of 10 percent means we are selecting a one-in-ten year event. This is an often-used threshold, including in the IPCC (2021) report. It corresponds very roughly to a 1.5 °C warmer summer or a winter-spring season with 30 % less precipitation. These are relevant anomalies, while at the same time the sample is large and reconstruction quality good.
2.3.3 Atmospheric circulation
To address atmospheric circulation, we analyzed, in addition to fields of 500 hPa GPH and SLP, atmospheric circulation indices, derived from ModE-RA data (Valler et al., 2024). These comprise three indices based on SLP: the NAO (difference between 9° W/40° N and 22.5° W/64° N), the East Atlantic pattern (EA, 30° E/55° N minus 20° W/55° N), and the Scandinavian pattern (SCA: 15° E/40° N minus 30° E/64° N). These patterns have been shown to be relevant both for winter-spring precipitation and summer drought in Europe (e.g., Wang et al., 2011; Halifa-Marín et al., 2025). In addition, three indices of the jet stream over the Atlantic-European sector describing the strength, tilt, and latitude (STR; TIL, LAT) of the jet at 500 hPa were used (for details see Brönnimann et al., 2025; especially jet latitude was shown to be strongly associated with summer drought). Note that while the latter indices are close to mutually independent, the former are not (NAO is correlated with SCA), and the former and the latter are correlated, i.e., NAO is correlated with STR (r=0.19 to 0.61 depending on the season), EA with TIL (−0.69 to −0.71), and SCA with LAT (−0.15 to 0.51). However, with these six indices, we hope to capture circulation effects on temperature and precipitation rather comprehensively. All indices were calculated based on (non-standardised) anomalies from the long-term (1421–2008) mean seasonal cycle.
We then used a regression approach to predict JJA 2 m temperature from spring predictors (see Wilks, 2020). In addition to monthly precipitation in (January to May) and the six atmospheric circulation indices (each for January–February and March–May), the predictors included 2 m temperature anomalies in the Western North Atlantic (35–55° N, 70–40° W, March–May, identified to be linked to European heatwaves in Lipfert et al., 2024) as well as in the NINO3.4 region (May) and global mean Aerosol Optical Depth at 550 nm in the 12 preceding months (June–May) from PMIP4 (Jungclaus et al., 2017) and Sato et al. (1993). The latter series is the only one that we did not filter with a LOESS filter (Wilks, 2020). Note that the same stratospheric aerosol data were also used in ModE-Sim, which forms the basis of ModE-RA. A second regression model included the six circulation indices for JJA.
2.3.4 Blocking and heatwaves
Further, we analyzed composites of atmospheric blocking in the same way as temperature and preciptation, i.e., the blocking frequency in summers following dry springs and in springs preceding hot summers. However, as blocking is not included in ModE-RA, we used three different, shorter blocking data sets: reconstructions back to 1728 (Brönnimann et al., 2025), 20CRv3 back to 1806, and ERA5 back to 1940. For consistency, the list of dry springs and hot summers for all data sets was calculated from the ensemble mean of ModE-RA.
Finally, we also analyzed JJA heatwaves to assess their relationship with spring precipitation anomalies. In a previous paper, we thoroughly tested the ability of the ensemble of atmospheric simulations ModE-Sim to simulate heatwave variability across the Northern Hemisphere (Lipfert et al., 2024). The heatwave definition we use follows the standard heatwave definition requiring a minimum of three consecutive days exceeding a 90th percentile threshold based on an 11 d moving window and a 31-year running mean climatology (Lipfert et al., 2024; note that this is comparable to the LOESS approach). easonal heatwave characteristics were calculated for JJA and correlated with JFMAM precipitation anomalies for 1420–2003 (1436–1993 due to the 31-year running average).
3.1 Case studies
Before delving into the statistical analysis of climate data, it is worth summarizing the documentary sources for the hot summers that follow dry springs. Pfister and Wanner (2021) give detailed information on 14 hot summers in Central Europe after 1421 (1471, 1473, 1536, 1540, 1545, 1556, 1590, 1616, 1666, 1684, 1706, 1719, 1859, 1947), which are therefore included in the Atlas. Further summers prior to 1421 can be added. In total, 22 years were classified; detailed descriptions of all of them are given in the Appendix. In 9 years (1304, 1361, 1393, 1473, 1504, 1516, 1540, 1706, and 1719), a dry spring was followed by summer heat and drought. In the 4 years 1375, 1503, 1536, and 1684, the spring drought preceding the summer drought was limited to May. In the three years 1590, 1616, and 1947, the summer heat and drought were shifted in time. Evidence of a relationship between dry springs and dry summers is thus found in 16 of the 22 cases. The dry springs in 1420, 1559, 1603, 1638, and 1686 were not followed by a very dry summer, and in 1326, the relationship is uncertain.
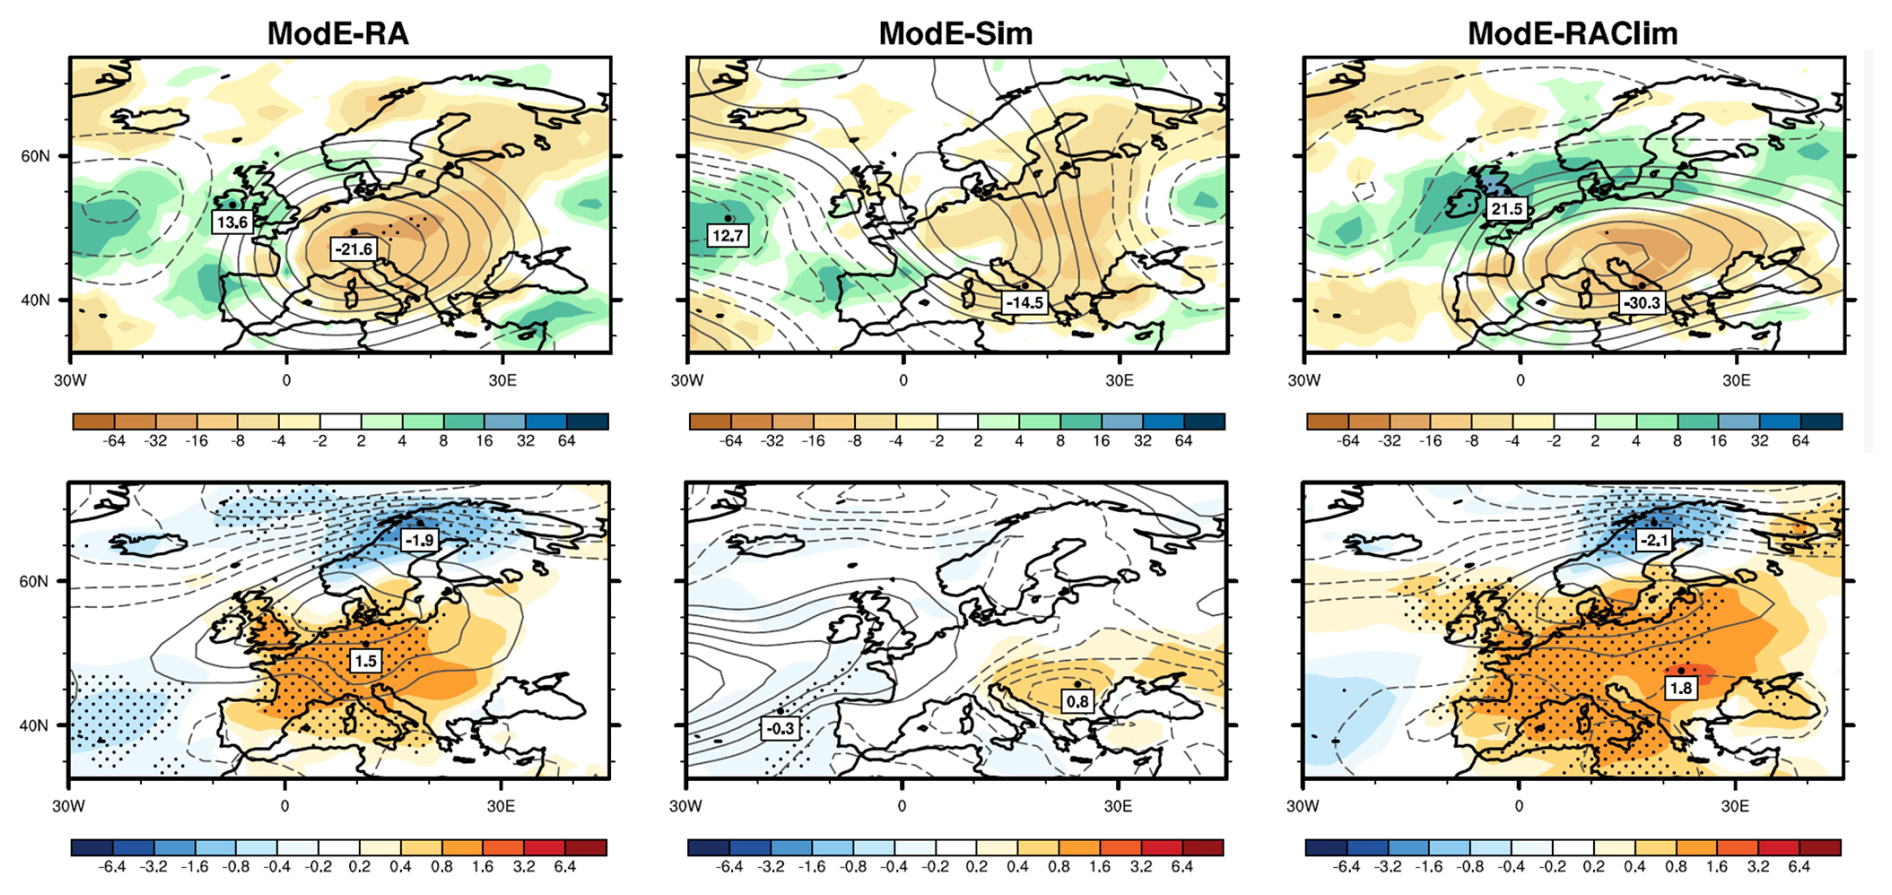
Figure 1(top) MAM 1473 total precipitation (mm) and SLP anomalies (contour lines) as well as (bottom) JJA 1473 2 m temperature and 500 hPa GPH anomalies (contour lines) for (left) ModE-RA, (middle) ModE-Sim, and (right) ModE-RAclim. Contour distance is 1 hPa for SLP and 10 GPH for 500 hPa GPH (negatives dashed, zero not shown). Stippling indicates where at least 15 out of 20 members agree in sign. Minima and maxima in temperature and precipitation are indicated.
The most prominent examples of very hot summers preceded by dry springs are 1473 and 1540, with 1473 showing the longest duration and greatest geographical extent. In a previous article on extreme summers (Lipfert et al., 2026), we analyzed 1540 and 1590, though not in relation to spring precipitation. We found that both were associated with positive 500 hPa GPH anomalies arguably linked to omega (1540) or dipole (1590) blocking patterns, but differed clearly in temporal development. Here we analyze the case of 1473 in more detail, as it was among the most extreme summers of the past 600 years. In fact, Cook et al. (2022) describe the period 1400–1480 in Europe as a “megadrought”. They also address the period around 1800 as a megadrought.
Documentary sources (see Appendix) describe an extremely dry year in a region stretching from France to Russia. Rivers dried out and fires ravaged. The dryness lasted until early the next winter and was followed by locust invasion in 1474. Anomaly maps of temperature and 500 hPa GPH in JJA, as well as precipitation and SLP in spring of 1473 (here we show the climatological spring season, MAM, as in Pfister and Wanner, 2021) are shown in Fig. 1 from the “Atlas”. The summer was hot throughout central Europe, extending east and west. Scandinavia was cold, and southern Europe was near normal. A large 500 hPa GPH anomaly was centered over Germany. We find a slightly stronger (in 18 out of 20 members), less tilted (i.e., more zonal, 20 out of 20), and poleward shifted jet (20 out of 20) over the Atlantic European sector. The preceding spring shows a negative precipitation anomaly over Central and Eastern Europe. The SLP anomaly shows a distinct positive EA pattern. In fact, the EA index was positive in 19 out of 20 members.
The comparison between ModE-RA, ModE-RAclim, and ModE-Sim shows that the largest part of the temperature signal stems from the assimilated observations. This is indicated by the fact that ModE-RA and ModE-RAclim are very similar. However, there is also a forced component (i.e., the signal arising from model boundary conditions, which arguably largely stems from volcanic aerosols and SSTs), and there is also similarity between ModE-Sim and ModE-RAclim, even though they are mutually independent. ModE-Sim shows a similar spring precipitation anomaly with the largest deficits over south-eastern Europe. There is also a slightly positive EA pattern in spring in ModE-Sim, similar to that in ModE-RAclim and ModE-RA.
In the following, we analyze the relations statistically and test, e.g., whether the EA pattern is a frequent precursor of hot summers and whether the spatial shift (the dry area in spring is farther east than the hot area in summer) is a recurring feature.
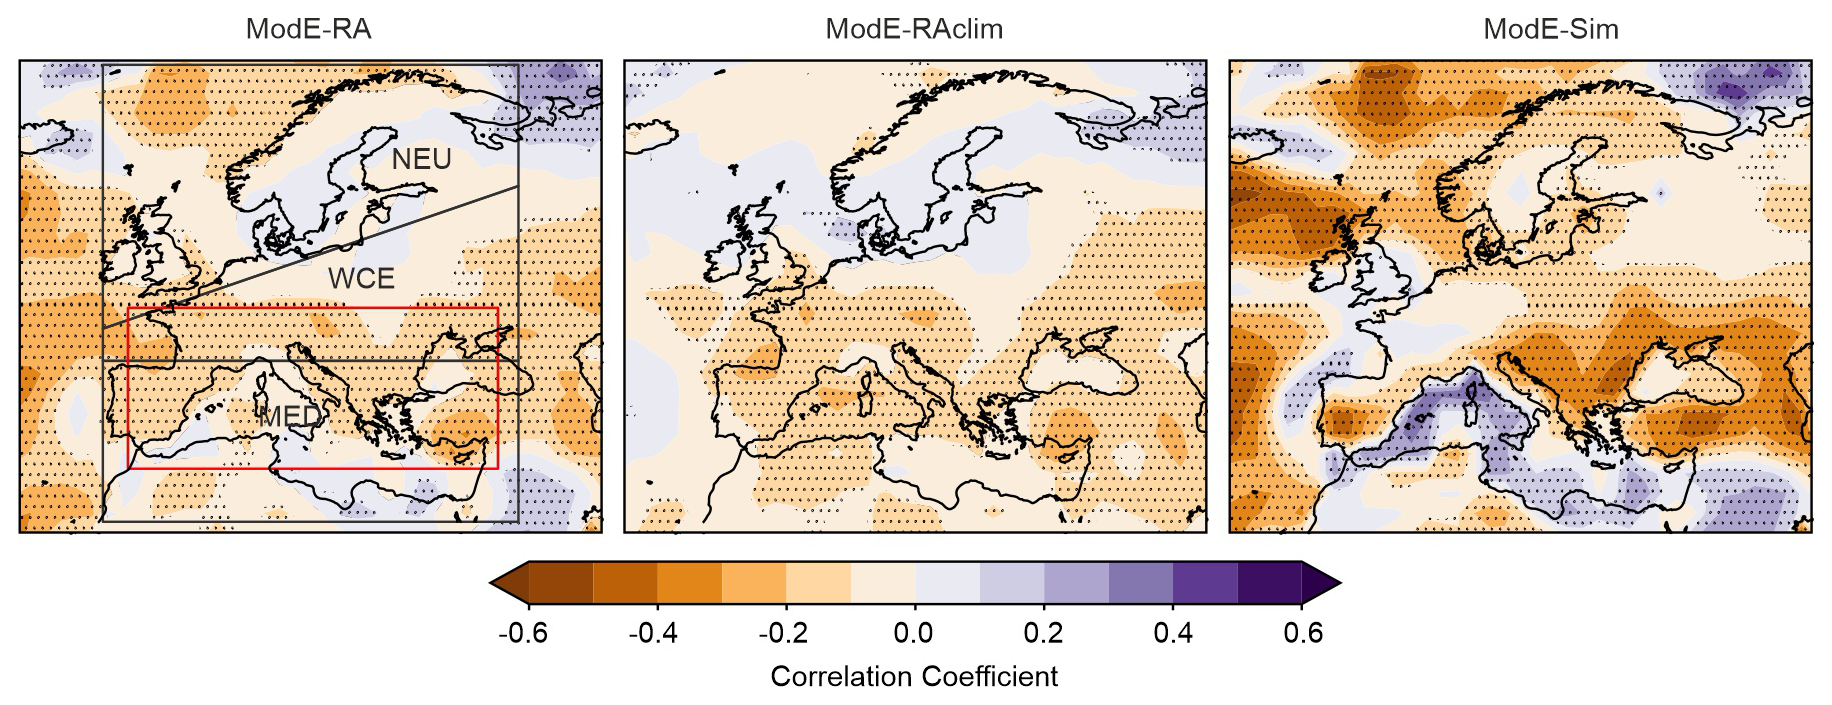
Figure 2Gridpoint-based correlations between JFMAM precipitation anomalies and JJA 2 m temperature anomalies for (left) ModE-RA, (middle) ModE-RAclim, and (right) ModE-Sim, 1421–2008. Stippling indicates significance at the 95 % confidence level. The left figure shows the IPCC regions NEU, WCE, and MED. The red rectangle shows the region used for the regression approach.
3.2 Correlations across Europe
To investigate the link between spring precipitation deficits and summer heat extremes across Europe, we first examined grid-point-based Pearson correlations between JFMAM precipitation anomalies and JJA 2 m temperature anomalies calculated using the LOESS approach. This analysis was done for ModE-RA, Mode-RAclim, and ModE-Sim, for each ensemble member.
The spatial correlations in ModE-RA reveal significant regional variability across Europe (Fig. 2). Correlations are negative in a band stretching ca. 36–48° N, indicating a general tendency for drier springs to be associated with hotter summers. Although significant, the correlations are around −0.2 or slightly weaker. Correlation is near zero in northern Europe. This suggests that spring precipitation plays no significant role in modulating summer heat extremes in Northern Europe, likely due to weaker land-atmosphere interactions and lower evapotranspiration sensitivity, as supported by Hirschi et al. (2011). We therefore do not consider the IPCC region “Northern Europe” further. The significant correlations in West Central Europe (WCE) and the Mediterranean (MED) indicate an association between spring precipitation deficits and summer heat extremes, consistent with the region's strong land-atmosphere coupling identified in prior studies (Seneviratne et al., 2010). In several areas (e.g., the Mediterranean), we see a land-sea gradient. However, by analyzing correlation coefficients, we can capture only linear relationships and with the grid-point-based approach, we investigate only co-located spring precipitation deficits and hot summer temperatures. To address these issues, we conducted composite analyses.
Correlations in ModE-RAclim are similar to those in ModE-RA, whereas in the pure model simulations (ModE-Sim) without observation input, they are somewhat stronger and positive over the Mediterranean Sea. This comparison shows that the signal in ModE-RA is largely observation-driven. In the following, we show results only for ModE-RA, except for the heatwave analysis (and we exclude the ocean surface from the interpretation). As ModE-RA and ModE-RAclim are monthly data sets, heatwaves can only be analyzed in ModE-Sim.
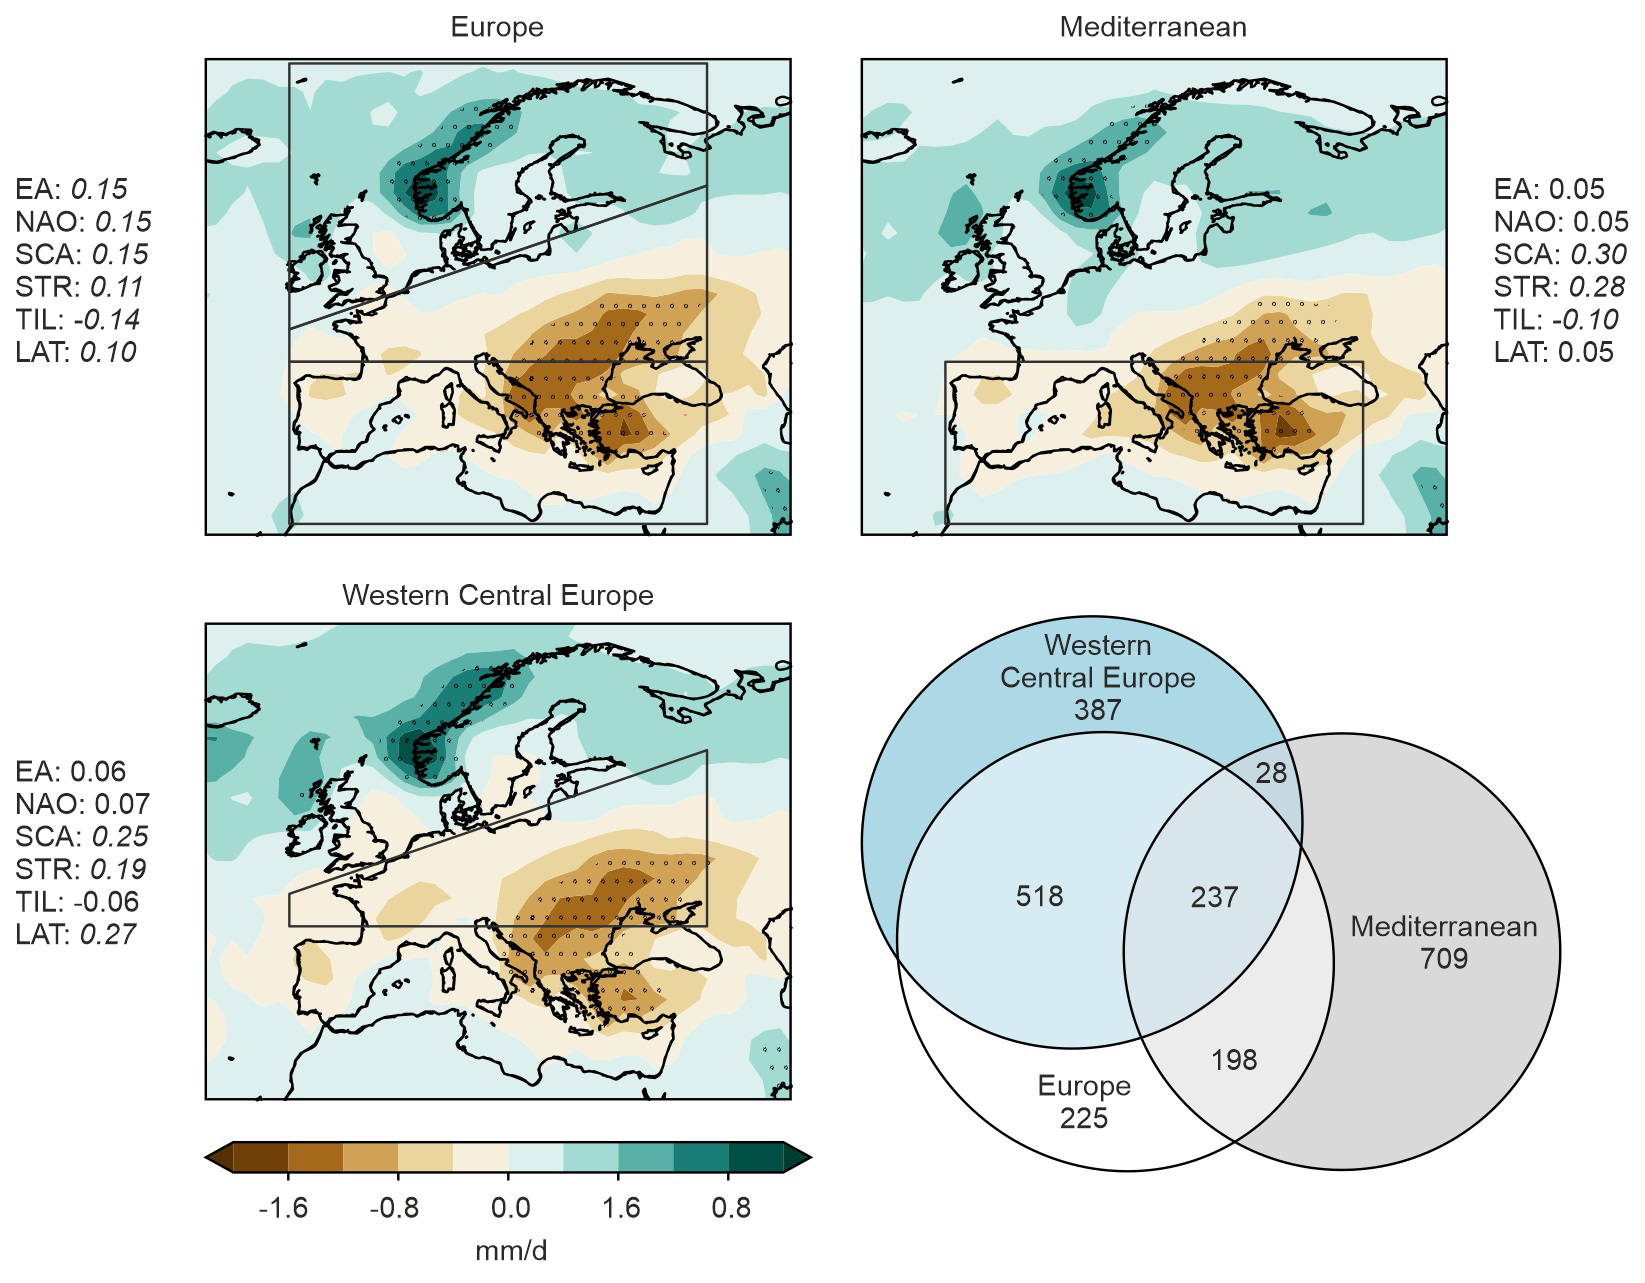
Figure 3Composites of ModE-RA JFMAM precipitation anomalies for all years and ensemble members with JJA 2 m temperature >90th percentile in Europe, MED and WCE. Stippling indicates precipitation anomalies larger than two standard deviations. The averages of the six circulation indices, here standardised for better intercomparison are also indicated (p<0.05 in italics). The lower right shows an Euler diagram of the number of cases.
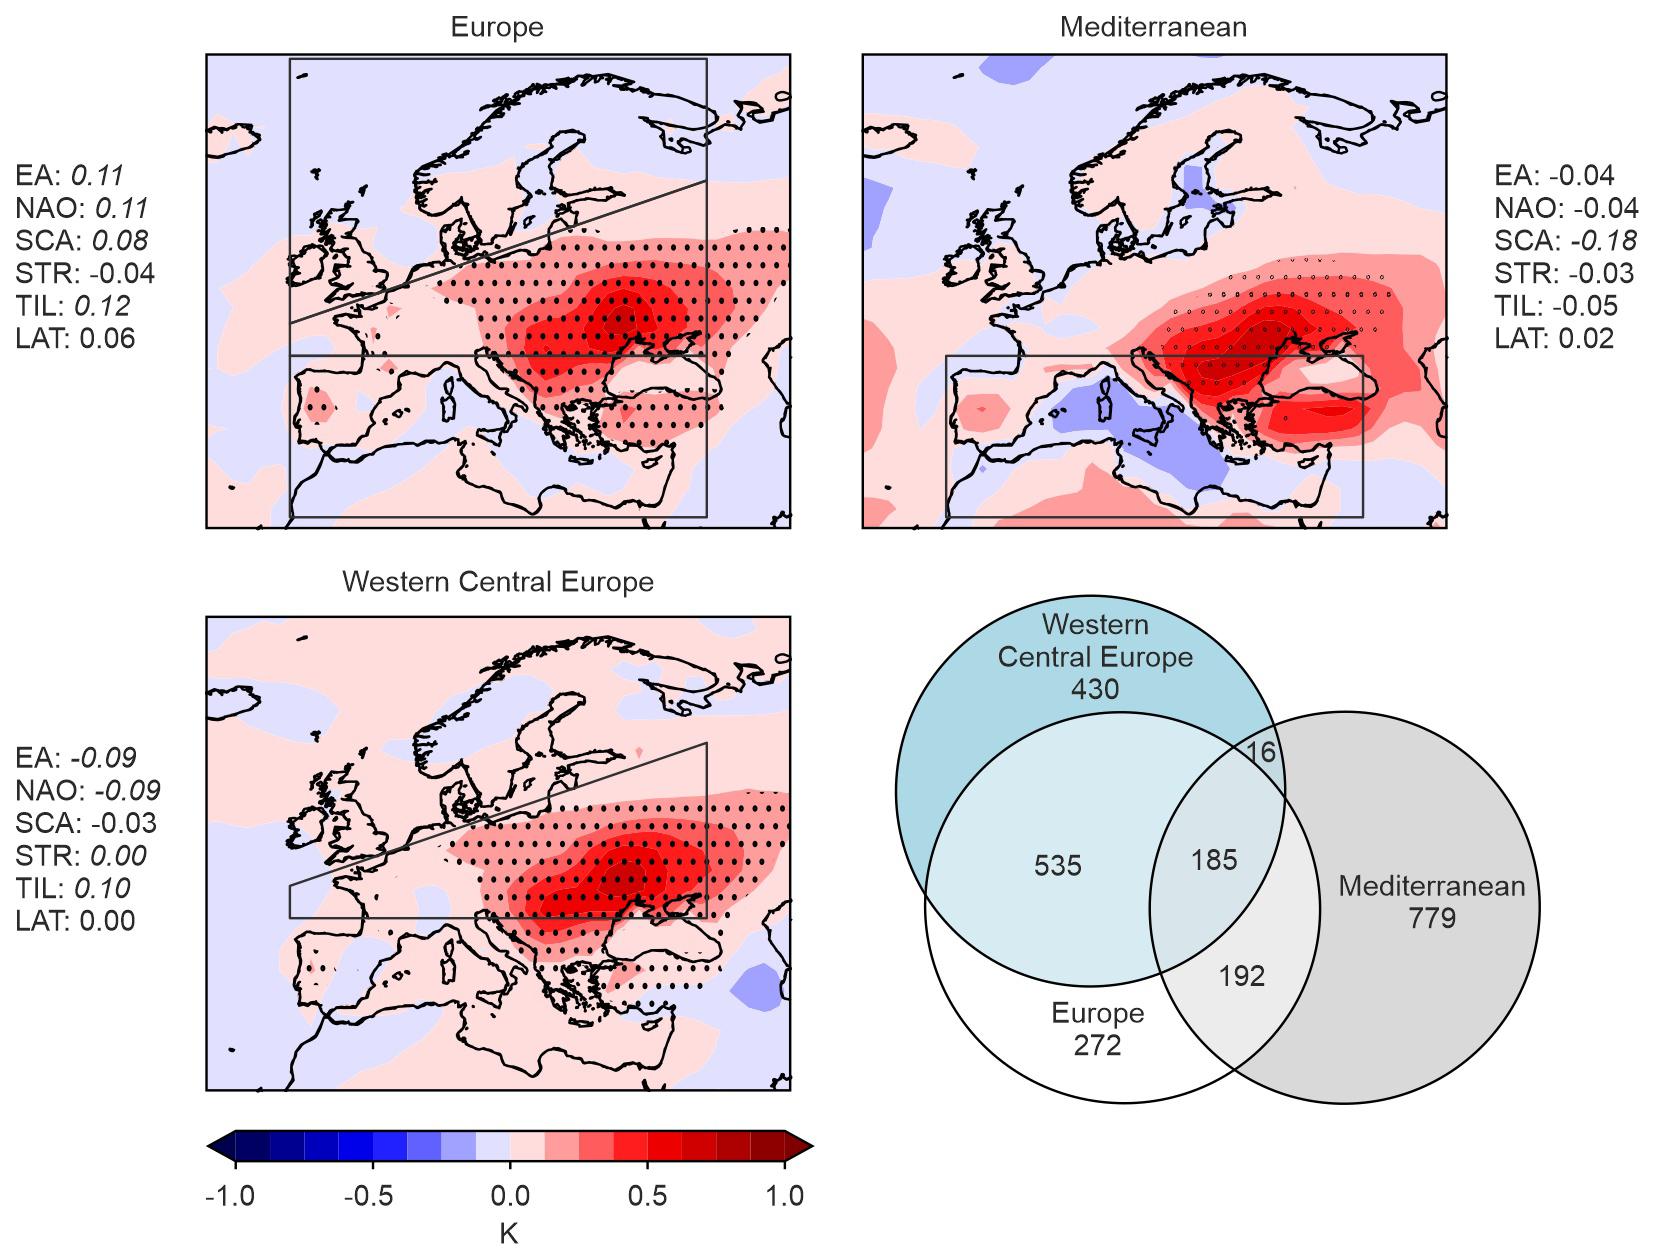
Figure 4Composites of ModE-RA JJA 2 m temperature anomalies for all years and ensemble members with JFMAM precipitation <10th percentile in Europe, MED, and WCE. Stippling indicates 2 m temperature anomalies exceeding two standard deviations. The averages of the six circulation indices, here standardised for better intercomparison are also indicated (p<0.05 in italics). The lower right shows an Euler diagram of the number of the cases.
3.3 Composite analysis
3.3.1 Temperature and precipitation
We analyze composites of ModE-RA JFMAM precipitation anomalies of all years for which the JJA temperature anomalies exceed the 90th percentile (Fig. 3) as well as composites of JJA 2 m temperature anomalies for all years where JFMAM precipitation falls below the 10th percentile (Fig. 4) for three specific regions (entire Europe, Western-Central Europe, and the Mediterranean). Recall that the analysis is performed per member, thus comprising years (which, however, are not entirely independent). The 10th percentile thus corresponds to 1176 years per region. However, the Euler diagrams show significant overlap among the selected cases across the three regions.
Before looking at spatial maps, it is interesting to note that, for Europe, 15 % of the selected hot-summer years were also dry-spring years; for Western Central Europe, the number is 17 %, and for the Mediterranean, even 23 %. Hence, the association is strongest in the Mediterranean.
Analyzing the reconstructed fields, we find that precipitation in JFMAM in years with hot summers tends to be anomalously low in South-Eastern Europe but wet in Norway. Both signatures are statistically significant. The core region of precipitation deficit exhibits an amplitude of 1.4 mm d−1. The differences between the regions for which the temperature percentile is taken (Europe, WCE, and MED) are small, consistent with the large overlap in selected cases. For the region Europe, we find significant changes in atmospheric circulation, such as a positive EA pattern (similar to that in 1473), NAO, SCA, and TIL. The signs are the same for WCE and MED, though generally less significant. WCE is more closely associated with SCA, whereas MED is more closely associated with LAT.
Composites for 2 m temperature in summers following dry springs (Fig. 4) again show very similar spatial patterns, with significant warming (approaching 1 K) centered over South Eastern Europe and extending east and west. In contrast to the JFMAM precipitation composite, the JJA 2 m temperature composite shows a land-sea contrast over the Mediterranean, although cooling is nowhere significant. Dry springs are followed by negative EA, NAO, and SCA, thus a sign change in all three indices with respect to springs preceding hot summers. No clear results are found for jet indices.
The plots confirm that there is a relation between summer temperature and winter-spring precipitation, both when analyzing forward or backward. All composites identify Southeastern Europe as the region showing the most pronounced effects. We expect this effect to be strongest in regions where evaporation is moisture-limited (McVicar et al., 2012), and this is indeed the case. The affected area is independent of the study region that we choose for the composites.
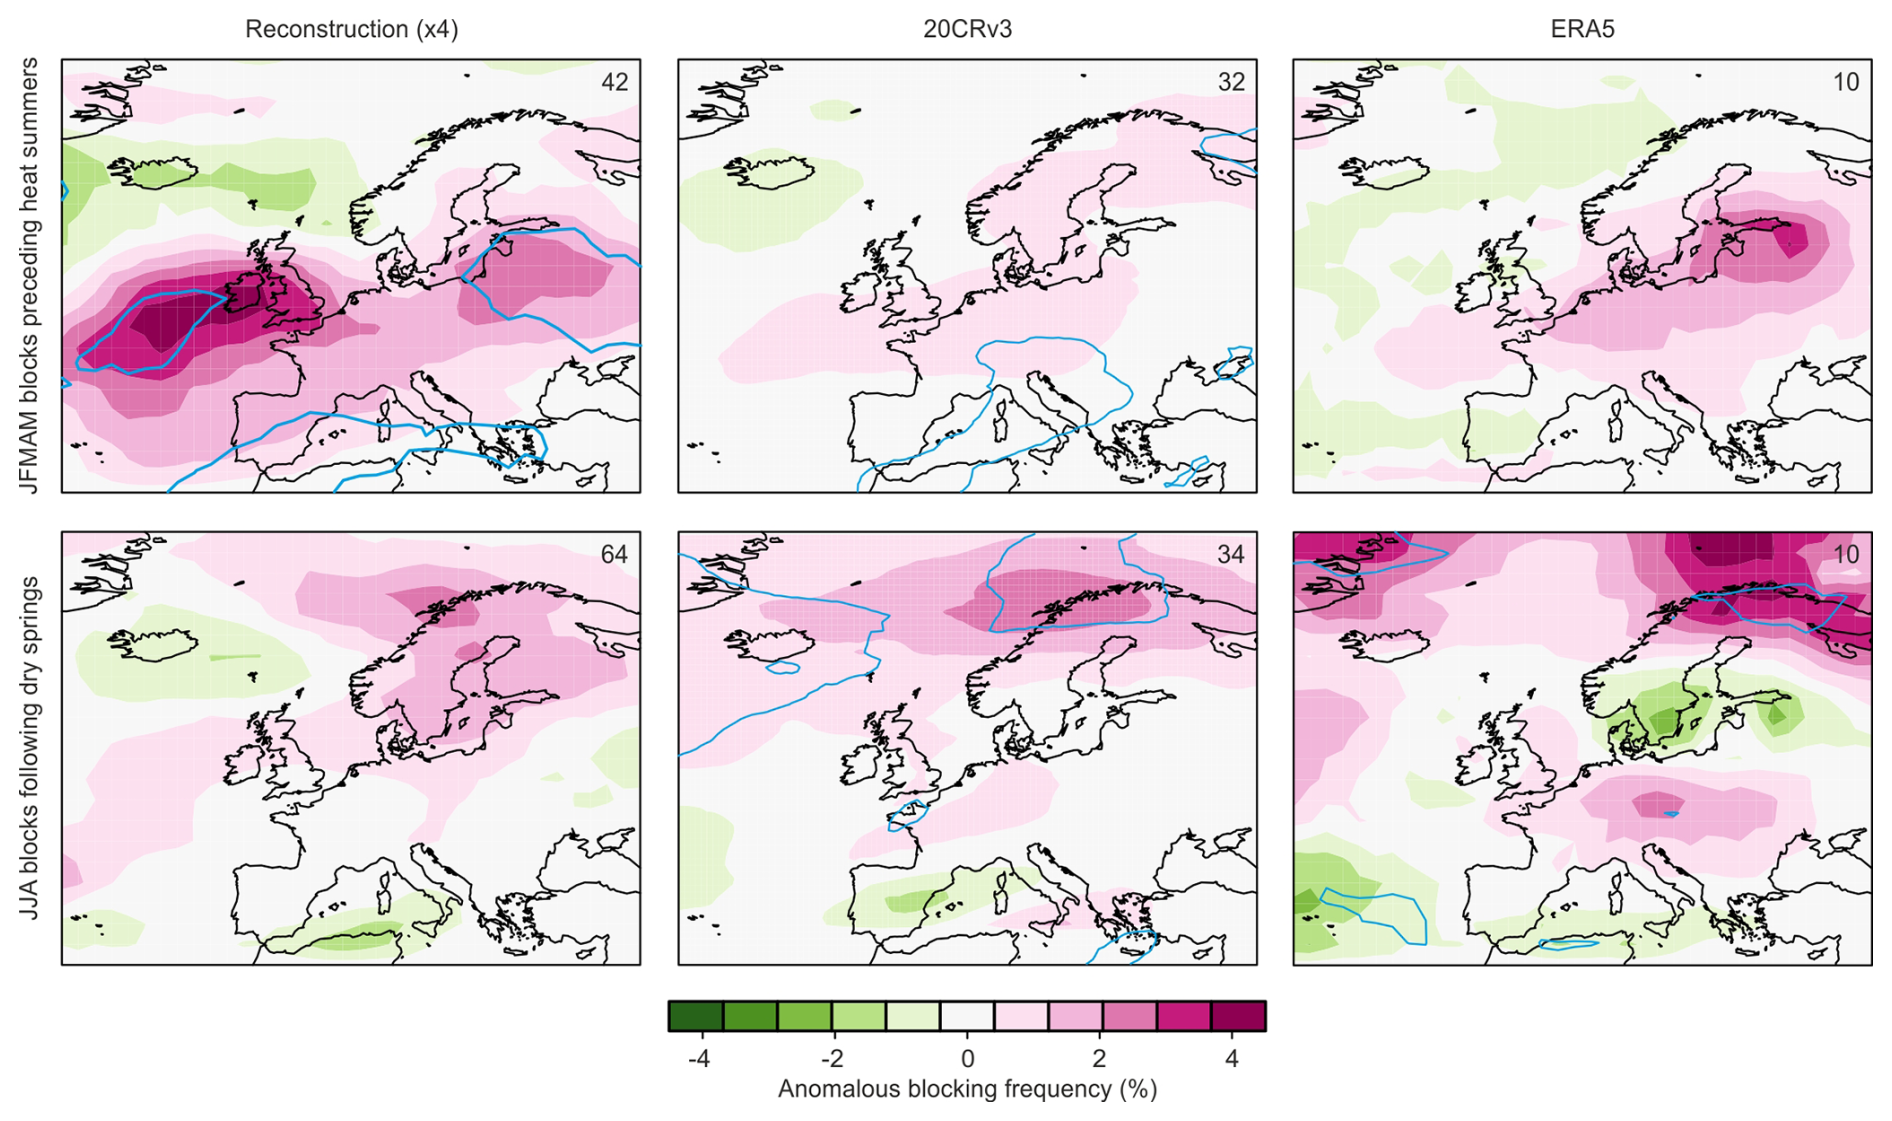
Figure 5Anomalies in blocking in JFMAM preceding heat summers in Europe (top) and in JJA following dry springs in Europe (bottom) in three different data sets (left to right). Blue lines indicate significant (p<0.05, t-test) anomalies. Numbers in the top left indicate the spatial average of blocking (italics indicate significance), and the number of cases is indicated in the top right.
3.3.2 Atmospheric circulation and blocking
To better address the atmospheric circulation involved in the coupling, we analyzed blocking frequency. Given the overlap among the selected cases, we analyzed only the region of Europe. Three different data sets are analyzed: a statistical reconstruction back to 1728, 20CRv3, and ERA5. Note that the first of these data sets has large uncertainties but covers most events. The second is clearly less reliable than ERA5, but is also longer. The consistency between the analyses of the three data sets nevertheless allows some conclusions. The analysis (Fig. 5) shows that JFMAM blocking frequency preceding hot summers tends to be higher in an area stretching from West of Ireland to the Baltic states, i.e., at the southern flank of the storm track extension. This imprint is typical for a poleward-shifted jet (Brönnimann et al., 2025). Conversely, JJA blocking frequency following dry JFMAM is increased in northern Scandinavia. A secondary maximum over Central Europe is only marginally or not significant.
3.4 Regression analysis
Is the spring-summer link really due to precipitation, or could atmospheric circulation alone explain it by driving both, the precipitation deficit in spring and the heat in summer? To test this, we focused on the identified region with the strongest correlation, namely 8° W–38° E, 38–48° N. We further considered only land grid cells and computed regional averages of precipitation (here treating January–May as separate months) and JJA 2 m temperature, which is the predictand. Further explanatory variables were chosen to capture oceanic influences, volcanic eruptions, as well as atmospheric circulation (all six atmospheric circulation indices, each for January–February and for March–May). We then proceeded with a backward selection until all p-values were below 0.1, while keeping all five precipitation series. In addition, we also performed the same procedure for a model that additionally has all six atmospheric circulation indices for June–August to test whether spring precipitation arises as a significant predictor even if summer atmospheric circulation is accounted for directly.
The two models were similar in terms of the variables retained from the preceding spring: these included volcanic aerosols, the indices SCA and TIL, and either the NAO (spring model) or STR (spring-summer model) in MAM. Some January–February indices were kept (NAO or TIL). In the summer model, five summer circulation indices were kept. In terms of precipitation, April and particularly May were significant in both models (January at p<0.1 in the spring-summer model). This brief analysis shows that precipitation in late spring influences JJA temperature beyond what is already captured in atmospheric circulation (neither spring nor summer).
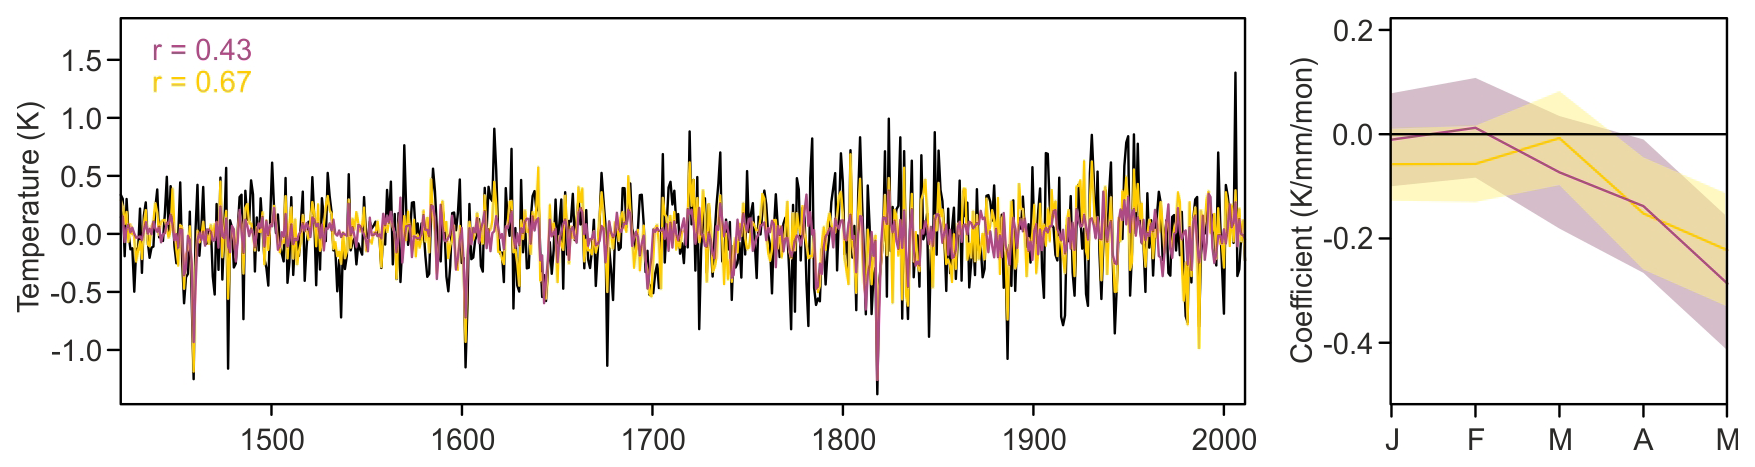
Figure 6Time series of JJA 2 m temperatures in the land area between 8° W and 38° E, 36–48° N in ModE-RA (black) and predicted from the regression models based on spring-only predictors (purple) and spring-summer predictors (orange). Right: Coefficients (95 % confidence intervals shaded) for precipitation in January to May in the two models.
Observed and fitted JJA temperatures are shown in Fig. 6. The spring-only model explains 19 % of the variance (r=0.43), the spring-summer model 45 % (r=0.67). Note that, although in the former model all predictors lead the predictand, they are not fully independent, particularly in the early part of the record; hence this result cannot be interpreted as indicating predictability. This is because seasonal observations such as tree ring width or grape harvest dates are assimilated using a forward model that may also include April or May temperatures (which in turn are influenced, e.g., by the NAO). Note also that the AOD predictor is the same as that used to force the model, which is the basis of ModE-RA, and that we use the ensemble mean which smoothes out variability. Hence, the 19 % explained variance should not be confounded with a forecast skill.
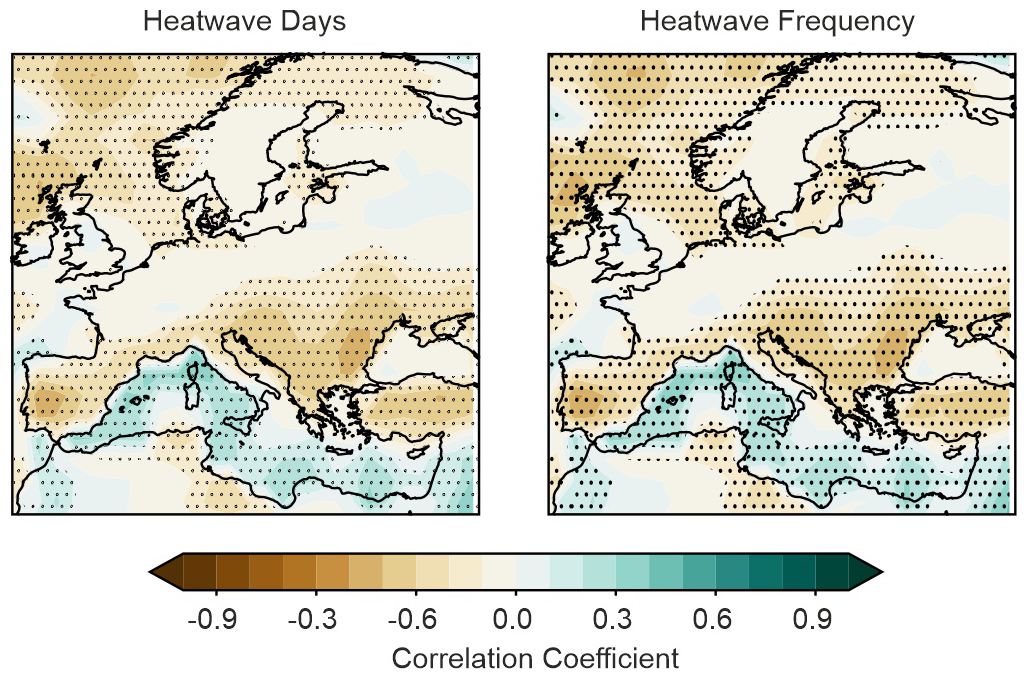
Figure 7Correlation between ModE-Sim January–May precipitation anomalies (with respect to a 31-year running mean) and June–August heatwave days and frequency. Hatching indicates significant correlations.
3.5 Heatwave indices
Finally, we analyzed the connection between different heatwave indices and a spring precipitation deficit. For this, we use the heatwave characteristics calculated in Lipfert et al. (2024) and calculate them within ModE-Sim, the underlying atmospheric model simulations of ModE-RA. Results show the same pattern as for the seasonal means, i.e., negative correlations between heatwave days or frequency with winter-spring precipitation. As for the ModE-Sim seasonal results, the correlation reverses over the Mediterranean Seas, and it is somewhat stronger than for JJA temperature. Again, the moisture limited regions, and in particular, southeastern Europe show the strongest negative correlations.
We find a link between dry springs and warm summers in climate reconstructions, consistent with other studies (e.g., Vautard et al., 2007; Fischer et al., 2007; Seneviratne et al., 2010; Rousi et al., 2023; Böhnisch et al., 2025, Padro and Paredes-Fortuny, 2024). Based on documentary data, we find that 16 of 22 hot summers, were preceded by dry springs. Analyzing the momentous summer of 1473 in detail, we find not only a very dry spring but also specific features of spring atmospheric circulation (positive EA and SCA patterns, positive jet latitude) that are confirmed as typical in statistical analyses. This also concerns the shift in the area of hot summer with respect to the area of dry spring. At the same time, we also note that not all heat summers are preceded by a dry spring. Statistical analyses of ModE-RA showed overall rather weak gridpoint-wise correlations. Nevertheless, the signal is consistent across the family of ModE-RA products, i.e., it appears in the underlying model simulations (ModE-Sim), in a product constrained by observations alone (ModE-RAclim), and in the combination, the paleo-reanalysis ModE-RA.
Composite analyses confirm that hot summers (>90th percentile) are often preceded by drier-than normal springs and that dry springs (<10th percentile) are often followed by hotter-than normal summers. The region whose precipitation deficit affects Europe most strongly is southeastern Europe. To further study the interaction over southeastern Europe it would be useful to have long reconstructions of daily weather types over this region, or types relevant for entire Europe. Our blocking reconstruction is based on Swiss weather types and may not well capture southeastern Europe.
In the correlation analysis, we found the strongest correlations in a latitude band between 36 and 48° N. This corresponds well to the area where evaporation is moisture-limited. A regression analysis of land area temperature in this region confirms a link that is indeed driven by spring precipitation rather than arising from atmospheric circulation effects on both. Further, the analysis confirmed a result from the documentary data, namely that April, and particularly, May precipitation deficits have the largest effect on summer temperature. Also note that including summer atmospheric circulation in the analysis did not change the coefficients for April and May precipitation. Finally, the analysis of daily data sets shows that dry springs not only lead to hot summers but also to more intense heatwaves and more frequent blocking. As to possible precursors, the most consistent link to spring atmospheric circulation was to a positive EA pattern.
No direct connection to the LIA is seen. Extreme summer droughts can be traced back to 1252, i.e. before the start of the LIA around 1350. However, the LIA was also a period with more frequent volcanic eruptions, which cause cool summers due to direct forcing unrelated to winter-spring precipitation. This could make the composite statistics worse, but is included in the regression model. The NAO showed a cluster with negative values in the second half of the 17th century, but overall does not exhibit a particular behaviour during the LIA, neither do EA or SCA (Brönnimann et al., 2024) or the jet indices.
The last phase of the LIA was caused by a series of volcanic eruptions in the early 19th century, to which the Earth system reacted strongly (Brönnimann et al., 2019). The following decades might still have been characterized by recovery, while volcanic activity remained high throughout the 19th and early 20th century. There are no notable dry-spring-hot-summer events in this period.
Establishing the relation between a winter-spring precipitation deficit and summer heat is relevant for understanding climate variability and change, as the most recent summer of 2026 has demonstrated. The Europe-wide spring precipitation deficit, also covering southeastern Europe, was followed by an exceptionally hot summer in Western and Central Europe (a figure showing the anomalies in ERA5 with respect to 1991–2020 is appended to the Atlas, p. 109). In this case, as in most others, the summer heat was accompanied by a lack of rainfall, thus exacerbating the already low water balance and leading to severe compound heat and drought. For the future, according to the EURO-CORDEX simulations, precipitation will likely increase in the north and decrease in the south of Europe with the zero line shifting north from winter to summer. Southeastern Europe, which was identified as a key area, is likely to see an increase in precipitation in winter and spring (e.g., Ivušić et al., 2024), whereas Europe south of ca. 50° N will suffer from a decrease in summer precipitation. This work uses an “Atlas of European Climate Extremes since 1421” which presents an analysis in of climatic extremes in ModE-RA, as discussed in detail in Pfister and Wanner (2021). The atlas is published as a Supplement to this paper.
Although this study investigates a link between dry springs and hot summers, it should be pointed out that seasonal predictability was not the focus of the paper and the results cannot be taken as a measure of it due to our experimental setup. Nevertheless, we think that a better understanding of this link is relevant to understanding past and present extreme events.
All links indicated in this Appendix refer to the Euro-Climhist Database (Pfister et al., 2017).
1304: Spring dry: summer hot and dry
No winter frost was experienced in Mainz (DE) and in Wroclaw (PL) (Alexandre, 1987, 428), A hot spring spurred vegetation growth. Ripe grapes were already found in Alsace in early July. Spring and summer were (almost) without rain. The period between April and July was extremely warm and dry. Most wells dried up and the Rhine could be crossed on horseback in several places between Strasbourg and Basel, just like on the Danube between Klosterneuburg and Krems, (AT). Large grape harvests of exceptional quality were gathered in Colmar, (FR) Metz (FR) and Rouen (FR). A second flowering of trees was observed in Tyrol, Austria, indicating hot conditions in September and October. The entire year was very warm. (Pfister and Wanner, 2021: 176).
1326: Spring uncertain, summer hot and dry
Paris (FR): No rain during four months in summer. No thunderstorm. Low level of rivers. Egmond (NL): no rain during summer. Caen (FR), Tournai (BE): Drying up of sources. Low level of rivers. (Alexandre, 1987: 443).
“Manorial accounts from the Bishopric of Winchester […], in southeast England, and Norwich Cathedral Priory […], primarily in Norfolk, pasture fell short everywhere, and this had severe repercussions for milk production; in Norfolk, trees withered in the dry conditions, and the harvest was very short” (Pribyl, 2017; Titow, 1960). “In 1326 […]. there was such a drought over all of England, in summer as in other times of the year, that men had to lead their livestock to water, in some parts of the country for three or four leagues [ca. 9–12 miles]. Wells and streams, cisterns and marshes dried out […] The river Thames was for almost the whole year salty.” (Pribyl and Cornes, 2019).
1361: Spring dry; summer hot and dry
Paris (FR): Spring very warm and very dry. Summer “tempéré”. Mainz (DE): Summer without any thunderstorm. Constance (DE), Liège (BE), and Wroclaw (PL): Heat and drought during the entire summer. Zwettl (AT): Parched soil. In Prussia grain was burning in the fields (Alexandre, 1987: 490; Buisman, 1996: 204). Winchester (UK): As a consequence of severe drought stress, the meadows did not produce a usable forage yield (Titow, 1970: 319). In England the spring-summer 1361 had the highest temperature in a reconstruction based on grain harvest dates for the period 1256–1431 (Pribyl et al., 2012; Pribyl, 2017).
1375: May dry; summer hot and dry
Mainly sunny and hot from May to August in Mainz (DE). At full maturity, the grapes were dried out. As in 1540, the start of the grape harvest was delayed until the next rainy period in mid-September, which was “useful for the grapes” Good grape harvest in Constance (DE) (Alexandre, 1987: 514). In Basel (CH) and Limburg an der Lahn (DE) the period was almost without rain for 14 weeks. A hot summer (including spring) and warm autumn were recorded in England (Pfister and Wanner, 2021: 177).
1393: Spring dry; summer hot and dry
The drought started in April affecting the Low Countries, the London and Paris basins, Germany, Switzerland, Austria and the Czech Lands. The vine bloom ended in early June. Grapes in Beaune were picked extremely early. It didn't rain in Zürich, Switzerland, for 13 weeks. The drought lasted until November. Lake Zürich and the Rhine in Mainz dropped to very low levels. Springs and soils dried up. The Vltava river in the Czech Lands could be crossed without wetting the feet. Its water turned green, probably due to algae, which prevented people from drinking it (Pfister and Wanner, 2021: 177).
1420: Spring dry; summer hot, but not dry
Metz (FR): Spring very warm. Soest (DE): February, March, April, May hot and dry. Basel (CH): summer drought. Lichtensteig (CH): May very hot and dry, pastures dry. Rötteln (DE): March and April very warm. Stuttgart: good weather during the year (Alexandre, 1987: 568). Dry spring-summer in England (Titow, 1970: 337). Drought impacts are not reported in the evidence contained in the catalogue of Alexandre (1987), and the year is not mentioned in the synthesis by Glaser and Kahle (2020) for Germany and by Brázdil et al. (2019) for the Czech Lands.
1473: Spring dry; summer hot and dry
The winter of 1473 was rainy in Metz (FR), and without snow and ice in Basel, Switzerland. Fruit trees began flowering in early March, which points to extremely high temperatures during the preceding weeks. April turned so hot, that vines were already in bloom at the end of this month. In May people could hardly bear the heat. Ripe grapes were found in early July. Grapes, mostly white varieties, were picked from the second half of August in many regions. Independent sources report four to five months without noteworthy precipitation. Not a drop fell in Basel from 29 June to mid-September. At that time, many trees had already dropped their leaves and looked “like at Christmas”. The Moselle being the most important western tributary of the Rhine became a trickle. Rivers in the Czech Lands, the Danube in Hungary, the Oder and Vistula in Poland, and rivers in western Russia could be forded. “Forests, woods, thickets, and forested hills burned with fire” in Poland and in Belarus. There was no way to put it out, and it was impossible to extinguish the flame before the fire devoured the roots (Przybylak et al. 2020).
A second flowering of fruit trees, indicating extremely high temperatures, was observed in autumn. In December, “spring-like” temperatures still prevailed and spring flowers were found. In Metz (FR) the subsequent winter of 1474 was again rainy without frost. The Basel diarist Johannes Knebel noted that even the “high mountains” – i.e. probably the peak of the Black Forest, Germany, at an altitude of 1493 m – were without snow. A snowfall on 2 March 1474, put an end to this 14-month-long warm spell. Central and Eastern Europe were ravaged by wildfires. Large parts of Italy also suffered from drought, according to selective evidence. In Modena and most of the other regions of the Po Valley, it did not rain from the beginning of 1473 until March 1474. Wells within eight miles of town dried up. A lot of cattle died and grain harvests failed, which led to famine. Major swarms of locusts (Locusta migratoria) invaded Central Europe in 1474 and 1475 (Pfister and Wanner, 2021: 188).
1503: May dry; summer hot and dry
Temperatures in May and those in summer were extremely high in Central Europe (Dobrovolný et al., 2010). Precipitation was below average in the Czech Lands (Dobrvolný et al., 2014) and in Switzerland (http://www.echdb.unibe.ch/selection/occ/en/pf-3458-5, last access: 1 October 2026). Processions for rain were held in Geneva (http://www.echdb.unibe.ch/selection/occ/en/pf-4091-1, last access: 1 October 2026). In Eastern France it was the worst drought since 1473. No rain fell from early May to 12 June, when a rain spell temporarily refreshed the vegetation. Throughout the summer, the weather was so hot and dry that there was hardly any grass in the meadows. Most crops were lost due to the severe heat and drought. In many places, the vines were scorched by the dry wind, and trees such as pear and apple trees. Rivers were very low. Precipitation was more abundant in the surrounding hills, probably due to thunderstorms. Vegetables, fruit, meat and dairy products were expensive (translated from old French by Laurent Litzenburger). (Bruneau, 1933: 19, Larchey, 1857: 445f).
1504: spring dry; summer hot and dry
Metz (FR): No rain from 1 April to 15 June, severe damage to most cultivated crops. Subsequently intensive rain for several days”. Summer: low precipitation (Prague Czech Republic). Midsummer: low water, many springs failed (Mellingen, Canton Argovia, Switzerland).
1516: spring dry; summer hot and dry
The winter was rainy, without snow and almost without frost (http://www.echdb.unibe.ch/selection/occ/en/ll-0002-391, last access: 1 October 2026). The period from April to October was very warm and dry in Central Europe (Dobrovolný et al., 2010, 2014) and in Eastern France (http://www.echdb.unibe.ch/selection/occ/en/ll-0004-22, last access: 1 October 2026). People thought that the drought was the worst since 1473 (http://www.echdb.unibe.ch/selection/occ/en/pf-4023-3, last access: 1 October 2026). The wine was excellent (Pfister et al., 2024). The drought was so persistent that rivers dropped to very low levels. This made it possible to repair the bridges (Marchal, 1859). Water had to be fetched over some distance for 16 weeks in the Swiss town of Winterthur. Large quantities of fish were sold at the market for a long time. Mortality was high in some regions (http://www.echdb.unibe.ch/selection/occ/en/ll-0004-22, last access: 1 October 2026).
1536: May dry: summer hot and dry
The heat and drought began in May of this year and lasted until November, when roses were seen flowering for a second time. In August a procession for rain was held in Paris. Forest and settlement fires were frequent in Saxony, Germany, and in the Czech Lands. Cattle died from heat and starvation. Grape harvests were early, abundant and sweet. Spring, Summer and Autumn temperatures were extremely high (Dobrovolný et al., 2010). Annual precipitation was very low (http://www.echdb.unibe.ch/selection/occ/en/pf-5001-142, last access: 1 October 2026).
1540: spring dry; summer hot and dry
This year was the hottest and driest in Western and Central Europe, next to 1473. Annual temperatures were the highest since 1500. The drought covered an area reaching from western France to Poland and from central Italy to northern Germany. Estimated annual precipitation both on the Swiss Plateau and in Krakow, Poland, was only about a quarter of the 20th century average. Large rivers became runnels that could be waded or crossed on horseback, while smaller watercourses dried out completely. The level of Lake Constance was so low that the lake floor, with its irregular topography, was visible. Forest fires became rampant in many parts of the continent; infernos that nobody could get under control. Town fires in Germany, were more frequent in 1540 than in any other peace year since 1000 AD. Cattle all over Europe died of thirst and hunger. Transport ships carried only a fraction of their usual cargo, while many watercourses were not navigable at all (Pfister and Wanner, 2021: 199–200). In 1546 and 1547, the Czech Lands and Lower Austria were ravaged by locust invasions (Brázdil et al., 2014, pp. 348–349, Rohr, 2019).
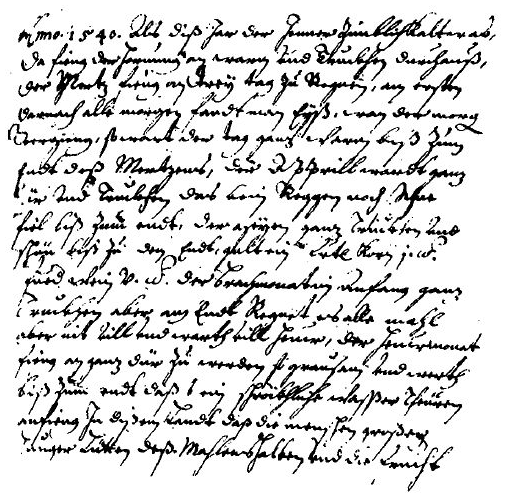
Figure A1The the wine-grower Hans Stolz from Guebwiller (France), provides a detailed report of the weather and its impact during the drought of 1540 (Stolz, 1979).
1559: spring dry; summer hot, but not dry
April was quite warm and rather dry in Central Europe (http://www.echdb.unibe.ch/selection/occ/en/pf-4097-577, last access: 1 October 2026), the Swiss precipitation Index was moderately dry (−0.67) while the Czech Lands were extremely dry (http://www.echdb.unibe.ch/selection/occ/en/pf-5001-233, last access: 1 October 2026). Summer was warm in Central Europe (Dobrovolný et al., 2010), with Switzerland experiencing a moderately dry season. (http://www.echdb.unibe.ch/selection/occ/en/pf-4046-3807, last access: 1 October 2026). From 18 July onwards, it became so hot that grapes stopped growing in many places. Everyone was longing for rain. A period of rain began on 18 September (http://www.echdb.unibe.ch/selection/occ/en/pf-3168-4, last access: 1 October 2026). Precipitation was low in the Czech lands, but this year is not listed among the droughts in Germany (Glaser and Kahle, 2020) and in the list by Brázdil et al. (2019).
1590: spring variable; summer hot and dry
This extremely hot and dry summer is atypical, because it was not preceded by a warm and dry spring. April was rather warm in Central Europe, but May was cold (Dobrovolný et al., 2010) and the first weeks in June were rainy in Switzerland . The heatwave only began in the last week of June lasting until the end of August. Water became scarce in the Alps, because not even a drop of dew fell, as had been the case during the scorching summer of 1540, as the painter and schoolteacher Hans Ardüser from the Swiss Canton Grisons reports (http://www.echdb.unibe.ch/selection/occ/en/pf-3177-37, last access: 1 October 2026). In Slany, in the Czech Lands, no rain fell between 3 June and 21 September. The level of the Elbe and Vltava rivers was low, and the soil dried out to dust which made sowing in autumn difficult. Harvests were poor in the Czech Lands (Brázdil et al., 2019). In Poland the drought lasted from the end of May to the end of autumn. The Odra river became so shallow that it could be crossed. The river mills stopped working (Przybylak et al., 2020).
1603: spring dry; summer hot, but not dry
Spring was mainly dry in Switzerland (http://www.echdb.unibe.ch/selection/occ/en/pf-5006-10, last access: 1 October 2026). Lucerne scientist Renward Cysat reported that it had never rained much before 6 May that year (http://www.echdb.unibe.ch/selection/occ/en/pf-2332-327, last access: 1 October 2026). He recorded nine very hot days in June, whereby the hot spell continued into early July (http://www.echdb.unibe.ch/selection/occ/en/pf-2332-33, last access: 1 October 2026). The first ripe grapes appeared in early July (http://www.echdb.unibe.ch/selection/occ/en/pf-2332-332, last access: 1 October 2026). In August, Cysat recorded 21 hot days, albeit it snowed in the Alps on the 13th of this month (http://www.echdb.unibe.ch/selection/occ/en/pf-2332-328, last access: 1 October 2026). Autumn was warm, with fruit trees blooming a second time, whereby the fruit did not ripen. The warm weather continued into winter (http://www.echdb.unibe.ch/selection/occ/en/pf-2332-323, last access: 1 October 2026). In Germany, thunderstorms were frequent (Glaser, 2001). 1603 is not recorded as a drought year in Germany (Glaser and Kahle, 2020), nor in the Czech Republic (Brázdil et al., 2019).
1616: spring dry; summer hot and drought spatially different
This drought mainly affected eastern Central Europe. In Germany, the warm, dry conditions began in mid-April. Tree rings indicated a 40 % precipitation deficit for spring and summer. In Switzerland, no rain was reported during the 54 d period between 6 June and 30 July. In the Czech Lands, the drought began in April or May and lasted until late December. The soil dried out, pastures and meadows withered and spring crops failed. The “hunger stone” on the left bank of the Elbe near Děčín commemorates this disaster. Central European temperatures were 2.7 °C (± 0.49 °C) above the 1961–90 average (Pfister and Wanner, 2021: 212).
1638: spring dry, summer rather warm, but not dry
April and May were extremely warm in Central Europe, which spurred vegetation growth (Dobrovolný et al., 2010). Spring was dry in the Czech Lands, but no impact is mentioned. June and July were rather warm in Central Europe (Dobrovolný et al., 2010), and dry in the Czech Lands (Dobrovolný et al., 2014).
1684: May dry: summer hot and dry outside the Alps
Spring was extremely dry in Prague and Zurich, accompanied by above-average temperatures in Paris and average temperatures in Central Europe. March was cold there, April was average, and May was extremely warm and dry (Rousseau, 2009). The summer was extremely hot in Paris and Central Europe and extremely dry in Zurich and Prague. Very high temperatures were recorded in June and August, while July was somewhat cooler. There was a lot of rain in the Swiss mountains. A heatwave with northeasterly winds set in for about five months from early May. Prayers for rain were already being held in Germany in May. Grain crops suffered in the Czech Lands. Bush and forest fires were rampant. The sun turned blood red behind a veil of stinking, dry fog, probably caused by forest fire aerosols. Many trees in London dropped their leaves (Pfister and Wanner, 2021: 213). Water reservoirs dried up in Poland. The drought destroyed grain and flax, and grass turned to ash. Cattle died due to a lack of grass and water. The drought began at the end of June and continued until September (Przybylak et al., 2020).
1686: spring dry, summer average
Spring was very warm and dry in Central Europe (Dobrovolný et al., 2010, 2014) and rather warm in Paris (Rousseau, 2009). This was mainly due to very high temperatures in May following average temperatures in April. In Paris the season was rather warm (Rousseau, 2009). Summer temperatures were average in Central Europe and drought impacts are not mentioned.
1706: Spring dry; summer hot and dry
Spring (mainly April) was dry in Zürich according to the number of rain days (http://www.echdb.unibe.ch/selection/occ/de/pf-4067-28, last access: 1 October 2026) and in Paris based on instrumental measurements (Slonosky, 2002). Drought impacts are mentioned for Germany in Glaser and Kahle (2020), and for the Czech Lands (Brázdil et al., 2019).
1719: Spring dry; summer hot and dry
May was extremely dry in Zürich and Paris (MAM) based on instrumental measurements (Pfister, 1978; Slonosky 2002). Drought impacts are mentioned in Glaser and Kahle (2020), in the Czech Lands (Brázdil et al., 2019) and in Europe (Pfister and Wanner, 2021: 225).
1947: spring dry: summer hot, dry from late summer
Spring temperatures in Central Europe were 1.4 °C above the 1961–1990 average. The season was dry on the Swiss Plateau and extremely dry in the Czech Lands. Summer temperatures were 1.9 °C above the 1961–1990 average (Dobrovolný et al., 2010, 2014). In general, precipitation deficits were larger in the Czech Lands than in the Swiss Plateau. In the Czech Lands, the 1947 event was one of the three most significant hydrological drought episodes since the late 1880s. Harvests of cereals and other agricultural crops were very low. River Elbe discharges at Decín were 50 % below the long-term mean. The agricultural drought mainly affected fodder crops, wheat and potatoes (Brázdil et al., 2016).
In Switzerland, the drought only became noticeable as the summer progressed. When water levels reached their lowest point in September and October, shipping on the Rhine below Basel was suspended. Smaller rivers dried up much more severely. In autumn, the city of Bern's drinking water supply reached its capacity limit. In agriculture, the drought had the most severe impact on fodder production (Schorer, 1992). In many ways, the drought in 1947 appears to be quite similar to 1590. Several of the above mentioned historical droughts, were longer lasting and more severe than the event in 1947, in particular the mega droughts in 1473 and 1540.
The ModE-RA, ModE-RAclim, and ModE-Sim data (Valler et al., 2024) can be downloaded from DKRZ (https://www.wdc-climate.de/ui/entry?acronym=ModE-RA, last access: 1 October 2026). ERA5 reanalysis data are available from the Copernicus Climate Change Service Data Store. NOAA/CIRES/DOE 20th Century Reanalysis (V3) data were provided by the NOAA PSL, Boulder, Colorado, USA, from their website at https://psl.noaa.gov (last access: 1 October 2026). Euro-Climhist (Pfister et al., 2017) is available from https://www.euroclimhist.unibe.ch/ (last access: 14 April 2026). The blocking reconstructions (Brönnimann et al., 2025) are available from the BORIS Portal at https://doi.org/10.48620/36384 (Brönnimann, 2025).
The supplement related to this article is available online at https://doi.org/10.5194/cp-22-1863-2026-supplement.
LL and SB conceived the study and performed the analyses. RH performed the model simulations, AMB produced the Atlas, CP and HW contributed documentary data and assisted in the interpretation. All authors contributed to writing the articles and commented on the drafts and review reports.
The contact author has declared that none of the authors has any competing interests.
Publisher's note: Copernicus Publications remains neutral with regard to jurisdictional claims made in the text, published maps, institutional affiliations, or any other geographical representation in this paper. The authors bear the ultimate responsibility for providing appropriate place names. Views expressed in the text are those of the authors and do not necessarily reflect the views of the publisher.
The simulations underlying ModE-RA were performed at the Swiss National Supercomputing Centre (CSCS).
This research has been supported by the Schweizerischer Nationalfonds zur Förderung der Wissenschaftlichen Forschung (grant no. 219746) and the European Commission, Horizon 2020 Framework Programme (grant no. 787574).
This paper was edited by Shiling Yang and reviewed by Olivier Planchon and Carla Mateus.
Alexandre, P.: Le climat en Europe au Moyen Âge. Contribution à l'histoire des variations climatiques de 1000 à 1425, d'après les sources narratives de l'Europe occidentale, Éditions de l'École des Hautes Études en Sciences Sociales, Paris, https://excerpts.numilog.com/books/9782307442172.pdf (last access: 2 October 2026), 1987.
Böhnisch, A., Felsche, E., Mittermeier, M., Poschlod, B., and Ludwig, R.: Future patterns of compound dry and hot summers and their link to soil moisture droughts in Europe, Earths Future, 13, https://doi.org/10.1029/2024EF004916, 2025.
Brázdil, R., Řezníčková, L., Valášek, H., Kiss, A., and Kotyza, O.: Past locust outbreaks in the Czech Lands: do they indicate particular climatic patterns?, Theor. Appl. Climatol., 116, 343–357, https://doi.org/10.1007/s00704-013-0950-9, 2014.
Brázdil, R., Raška, P., Trnka, M., Zahradníček, P., Valášek, H., Dobrovolný, P., Řezníčková, L., Treml, P., and Stachon, Z.: The Central European drought of 1947: causes and consequences, Clim. Res., 70, 161–178, https://doi.org/10.3354/cr01387, 2016.
Brázdil, R., Demarée, G. R., Kiss, A., Dobrovolný, P., Chromá, K., Trnka, M., Dolák, L., Řezníčková, L., Zahradníček, P., Limanowka, D., and Jourdain, S.: The extreme drought of 1842 in Europe as described by both documentary data and instrumental measurements, Clim. Past, 15, 1861–1884, https://doi.org/10.5194/cp-15-1861-2019, 2019.
Brönnimann, S.: Blocking Frequency 1728–2020, BORIS Portal [data set], https://doi.org/10.48620/36384, 2025
Brönnimann, S., Franke, J., Nussbaumer, S. U., Zumbühl, H. J., Steiner, D., Trachsel, M., Hegerl, G. C., Schurer, A., Worni, M., Malik, A., Flückiger,J., and Raible, C. C.: Last phase of the Little Ice Age forced by volcanic eruptions, Nat. Geosci., 12, 650–656, 2019.
Brönnimann, S., Filipiak, J., Chen, S., and Pfister, L.: The weather of 1740, the coldest year in central Europe in 600 years, Clim. Past, 20, 2219–2235, https://doi.org/10.5194/cp-20-2219-2024, 2024.
Brönnimann, S., Franke, J., Valler, V., Hand, R., Samakinwa, E., Lundstad, E., Burgdorf, A.-M., Lipfert, L., Pfister, L., Imfeld, N., and Rohrer, M.: Past hydroclimate extremes in Europe driven by Atlantic Jet stream and recurrent weather patterns, Nat. Geosci., 18, 246–253, https://doi.org/10.1038/s41561-025-01654-y, 2025.
Bruneau, C.: La Chronique de Philippe de Vigneulles, Société d'histoire et d'archéologie de la Lorraine, Vol. 4, Metz, https://metz1500.univ-lorraine.fr/s/metz-1500/item/432 (last access: 2 October 2026), 1933.
Buisman, J.: Duizend jaar weer, wind en water in de Lage Landen, II, 1300–1450, edited by: van Engelen, A. F. V., ISBN 9051941439, 1996.
Cleveland, W. S.: Robust locally weighted regression and smoothing scatterplots, J. Am. Stat. Assoc., 74, 829–836, https://doi.org/10.2307/2286407, 1979.
Cook, B. I., Smerdon, J. E., Cook, E. R., Williams, A. P., Anchukaitis, K. J., Mankin, J. S., Allen, K., Andreu, L., Ault, T. R., Belmecheri, S., Coats, S., Coulthard, B., Fosu, B., Grierson, P., Griffin, D., Herrera, D. A., Ionita, M., Lehner, F., Leland, C., Marvel, K., Morales, M. S., Mishra, V., Ngoma, J., Nguyen, H. T. T., O’Donnell, A., Palmer, J., Rao, M. P., Rodriguez, M., Seager, R., Stahle, D. W., Stevenson, S., Thapa, U. K., Varuolo, A. M., and Wise, E. K.: Megadroughts in the Common Era and the Anthropocene, Nat. Rev. Earth Environ., 3, 741–757, 2022.
Dobrovolný, P., Moberg, A., Brázdil, R., Pfister, C., Glaser, R., and Böhm, R.: Monthly, seasonal and annual temperature reconstructions for Central Europe since AD 1500, Clim. Change, 101, 69–107, 2010.
Dobrovolný, P., Brázdil, R., Trnka, M., Kotyza, O., and Valášek, H.: Precipitation reconstruction for the Czech Lands, AD 1501–2010, Int. J. Climatol., https://doi.org/10.1002/joc.3957, 2014.
Fischer, E. M., Seneviratne, S. I., Lüthi, D., and Schär, C.: Contribution of land–atmosphere coupling to recent European summer heat waves, Geophys. Res. Lett., 34, https://doi.org/10.1029/2006GL029068, 2007.
Glaser, R.: Klimageschichte Mitteleuropas, Primus Verlag, Darmstadt, ISBN 978-3-89678-405-6, 2001.
Glaser, R. and Kahle, M.: Reconstructions of droughts in Germany since 1500 – combining hermeneutic information and instrumental records in historical and modern perspectives, Clim. Past, 16, 1207–1222, https://doi.org/10.5194/cp-16-1207-2020, 2020.
Halifa-Marín, A., Torres-Vázquez, M. A., Trigo, R., Vicente-Serrano, S. M., Turco, M., Jiménez-Guerrero, P., and Montávez, J. P.: Beyond the NAO: The East Atlantic Pattern's Role in Early 20th-Century Meteorological Droughts in Western Europe., Int. J. Climatol., 45, e70045, https://doi.org/10.1002/joc.70045, 2025.
Hand, R., Samakinwa, E., Lipfert, L., and Brönnimann, S.: ModE-Sim – a medium-sized atmospheric general circulation model (AGCM) ensemble to study climate variability during the modern era (1420 to 2009), Geosci. Model Dev., 16, 4853–4866, https://doi.org/10.5194/gmd-16-4853-2023, 2023.
Hersbach, H., Bell, B., Berrisford, P., Hirahara, S., Horányi, A., Muñoz-Sabater, J., Nicolas, J., Peubey, C., Radu, R., Schepers, D., Simmons, A., Soci, C., Abdalla, S., Abellan, X., Balsamo, G., Bechtold, P., Biavati, G., Bidlot, J., Bonavita, M., De Chiara, G., Dahlgren, P., Dee, D., Diamantakis, M., Dragani, R., Flemming, J., Forbes, R., Fuentes, M., Geer, A., Haimberger, L., Healy, S., Hogan, R.J., Hólm, E., Janisková, M., Keeley, S., Laloyaux, P., Lopez, P., Lupu, C., Radnoti, G., de Rosnay, P., Rozum, I., Vamborg, F., Villaume, S., and Thépaut, J.-N.: The ERA5 global reanalysis. Q. J. Roy. Meteor. Soc., 146, 1999–2049, https://doi.org/10.1002/qj.3803, 2020.
Hirschi, M., Seneviratne, S. I., Alexandrov, V., Boberg, F., Boroneant, C., Christensen, O.B., Formayer, H., Orlowsky, B., and Stepanek, P.: Observational evidence for soil-moisture impact on hot extremes in southeastern Europe, Nat. Geosci., 4, 17–21, https://doi.org/10.1038/ngeo1032, 2011.
Ivušić, S., Güttler, I., and Horvath, K.: Overview of mean and extreme precipitation climate changes across the Dinaric Alps in the latest EURO-CORDEX ensemble, Clim. Dynam., 62, 10785–10815, https://doi.org/10.1007/s00382-024-07476-9, 2024.
IPCC: Climate Change 2021: The Physical Science Basis, Cambridge University Press, https://doi.org/10.1017/9781009157896, 2021.
Jungclaus, J. H., Bard, E., Baroni, M., Braconnot, P., Cao, J., Chini, L. P., Egorova, T., Evans, M., González-Rouco, J. F., Goosse, H., Hurtt, G. C., Joos, F., Kaplan, J. O., Khodri, M., Klein Goldewijk, K., Krivova, N., LeGrande, A. N., Lorenz, S. J., Luterbacher, J., Man, W., Maycock, A. C., Meinshausen, M., Moberg, A., Muscheler, R., Nehrbass-Ahles, C., Otto-Bliesner, B. I., Phipps, S. J., Pongratz, J., Rozanov, E., Schmidt, G. A., Schmidt, H., Schmutz, W., Schurer, A., Shapiro, A. I., Sigl, M., Smerdon, J. E., Solanki, S. K., Timmreck, C., Toohey, M., Usoskin, I. G., Wagner, S., Wu, C.-J., Yeo, K. L., Zanchettin, D., Zhang, Q., and Zorita, E.: The PMIP4 contribution to CMIP6 – Part 3: The last millennium, scientific objective, and experimental design for the PMIP4 past1000 simulations, Geosci. Model Dev., 10, 4005–4033, https://doi.org/10.5194/gmd-10-4005-2017, 2017.
Labbé, T., Pfister, C., Brönnimann, S., Rousseau, D., Franke, J., and Bois, B.: The longest homogeneous series of grape harvest dates, Beaune 1354–2018, and its significance for the understanding of past and present climate, Clim. Past, 15, 1485–1501, https://doi.org/10.5194/cp-15-1485-2019, 2019.
Larchey, L.: Journal de Jehan Aubrion, bourgeois de Metz, avec sa continuation par Pierre Aubrion (1465–1512), Metz, 1857.
Lipfert, L., Hand, R., and Brönnimann, S.: A global assessment of heatwaves since 1850, Geophys. Res. Lett., 51, https://doi.org/10.1029/2023GL106212, 2024.
Lipfert, L., Hand, R., and Brönnimann, S.: Comparing 600 years of extremely hot Central European summers to future projections, Sci. Rep., https://doi.org/10.1038/s41598-026-45507-z, 2026.
Marchal, L.: La Chronique de Lorraine, Société d'Archéologie Lorraine, Nancy, 5, 336 pp., 1859.
McVicar, T. R., Roderick, M. L., Donohue, R. J., Li, L. T., Van Niel, T. G., Thomas, A., Grieser, J., Jhajharia, D., Himri, Y., Mahowald, N. M., Mescherskaya, A. V., Kruger, A. C., Rehman, S., and Dinpashoh, Y.: Global review and synthesis of trends in observed terrestrial near-surface wind speeds: Implications for evaporation, J. Hydrol., 416–417, 182–205, 2012.
Pardo, S. K. and Paredes-Fortuny, L.: Uneven evolution of regional European summer heatwaves under climate change, Weather Clim. Extremes, 43, 100648, https://doi.org/10.1016/j.wace.2024.100648, 2024.
Pfister, C.: Climate and economy in eighteenth-century Europe, J. Interdiscipl. Hist., 9, 223–243, 1978.
Pfister, C. and Wanner, H.: Climate and Society in Europe, Haupt, Bern, ISBN 978-3-258-08234-9, 2021.
Pfister, C., Rohr, C., and Jover, A. C. C.: Euro-Climhist: eine Datenplattform der Universität Bern zur Witterungs-, Klima- und Katastrophengeschichte, Wasser Energie Luft, 109, 45–48, 2017 (data available at: https://www.euroclimhist.unibe.ch/, last access: 14 April 2026).
Pfister, C., Brönnimann, S., Altwegg, A., Brázdil, R., Litzenburger, L., Lorusso, D., and Pliemon, T.: 600 years of wine must quality and April to August temperatures in western Europe 1420–2019, Clim. Past, 20, 1387–1399, https://doi.org/10.5194/cp-20-1387-2024, 2024.
Pfister, L., Wilhelm, L., Brugnara, Y., Imfeld, N., and Brönnimann, S.: Weather type reconstruction using machine learning approaches, Weather Clim. Dynam., 6, 571–594, https://doi.org/10.5194/wcd-6-571-2025, 2025.
Pfister, C., Brönnimann, S., Litzenburger, L., Thejll, P., Altwegg, A., Brázdil, R., Kiss, A., Landsteiner, E., Ljungqvist, F. C., and Pliemon, T.: Wine must yields as indicators of May to July climate in Central Europe, 1416–1988, Clim. Past, 22, 541–559, https://doi.org/10.5194/cp-22-541-2026, 2026.
Pliemon, T., Foelsche, U., Rohr, C., and Pfister, C.: Precipitation reconstructions for Paris based on the observations by Louis Morin, 1665–1713 CE, Clim. Past, 19, 2237–2256, https://doi.org/10.5194/cp-19-2237-2023, 2023.
Pribyl, K.: Farming, Famine and Plague, Springer, Cham, ISBN 978-3-319-85789-3, 2017.
Pribyl, K. and Cornes, R. C.: Droughts in medieval England (Part 1), Weather, 75, 168–172, https://doi.org/10.1002/wea.3599, 2019.
Pribyl, K. and Cornes, R. C.: Droughts in medieval England (Part 2), Weather, 75, 196–198, https://doi.org/10.1002/wea.3529, 2020.
Pribyl, K., Cornes, R., and Pfister, C.: Reconstructing medieval April–July mean temperatures in East Anglia, 1256–1431, Clim. Change, 113, 393–412, https://doi.org/10.1007/s10584-011-0327-y, 2012.
Przybylak, R., Oliński, P., Koprowski, M., Filipiak, J., Pospieszyńska, A., Chorążyczewski, W., Puchałka, R., and Dąbrowski, H. P.: Droughts in the area of Poland in recent centuries in the light of multi-proxy data, Clim. Past, 16, 627–661, https://doi.org/10.5194/cp-16-627-2020, 2020.
Quesada, B., Vautard, R., Yiou, P., Hirschi, M., and Seneviratne, S. I.: Asymmetric European summer heat predictability from wet and dry southern winters and springs, Nat. Clim. Change, 2, 736–741, https://doi.org/10.1038/nclimate1536, 2012.
Rohr, C.: Apocalyptic riders in the borderlands. Dealing with locust invasion, diseases and war in fifteenth- and sixteenth-century Eastern and Southern Austria, in: The Dance of Death in Late Medieval and Renaissance Europe, edited by: Kiss, A. and Pribyl, K., Taylor and Francis, 107–124, https://doi.org/10.4324/9780429491085, 2019.
Rohrer, M., Martius, O., Raible, C. C., and Brönnimann, S.: Sensitivity of blocks and cyclones in ERA5 to spatial resolution and definition, Geophys. Res. Lett., 47, e2019GL085582, https://doi.org/10.1029/2019GL085582, 2020.
Rousi, E., Fink, A. H., Andersen, L. S., Becker, F. N., Beobide-Arsuaga, G., Breil, M., Cozzi, G., Heinke, J., Jach, L., Niermann, D., Petrovic, D., Richling, A., Riebold, J., Steidl, S., Suarez-Gutierrez, L., Tradowsky, J. S., Coumou, D., Düsterhus, A., Ellsäßer, F., Fragkoulidis, G., Gliksman, D., Handorf, D., Haustein, K., Kornhuber, K., Kunstmann, H., Pinto, J. G., Warrach-Sagi, K., and Xoplaki, E.: The extremely hot and dry 2018 summer in central and northern Europe from a multi-faceted weather and climate perspective, Nat. Hazards Earth Syst. Sci., 23, 1699–1718, https://doi.org/10.5194/nhess-23-1699-2023, 2023.
Rousseau, D.: Les températures mensuelles en région parisienne de 1676 à 2008, La Météorologie, 8e série 67, 43–55, 2009.
Samakinwa, E., Valler, V., Hand, R., Neukom, R., Gómez-Navarro, J .J., Kennedy, J., Rayner, N. A., and Brönnimann, S.: An ensemble reconstruction of global monthly sea surface temperature and sea ice concentration 1000–1849, Sci. Data, 8, 261, https://doi.org/10.1038/s41597-021-01043-1, 2021.
Sato, M., Hansen, J. E., McCormick, M. P., and Pollack, J. B.: Stratospheric aerosol optical depths, 1850–1990, J. Geophys. Res.-Atmos., 98, 22987–22994, https://doi.org/10.1029/93JD02553, 1993.
Schorer, M.: Extreme Trockensommer in der Schweiz und ihre Folgen für Natur und Wirtschaft, Geographica Bernensia G40, Geographisches Institut der Universität Bern, https://doi.org/10.4480/GB2021.G40, 1992.
Seneviratne, S. I., Corti, T., Davin, E. L., Hirschi, M., Jaeger, E. B., Lehner, I., Orlowsky, B., and Teuling, A. J.: Soil moisture–climate interactions, Earth-Sci. Rev., 99, 125–161, 2010.
Slivinski, L. C., Compo, G. P., Whitaker, J. S., Sardeshmukh, P. D., Giese, B. S., McColl, C., Allan, R., Yin, X., Vose, R., Titchner, H., Kennedy, J., Spencer, L. J., Ashcroft, L., Brönnimann, S., Brunet, M., Camuffo, D., Cornes, R., Cram, T. A., Crouthamel, R., Domínguez-Castro, F., Freeman, J. E., Gergis, J., Hawkins, E., Jones, P. D., Jourdain, S., Kaplan, A., Kubota, H., Blancq, F. L., Lee, T.-C., Lorrey, A., Luterbacher, J., Maugeri, M., Mock, C. J., Moore, G. K., Przybylak, R., Pudmenzky, C., Reason, C., Slonosky, V. C., Smith, C. A., Tinz, B., Trewin, B., Valente, M. A., Wang, X. L., Wilkinson, C., Wood, K., and Wyszyński, P.: Towards a more reliable historical reanalysis: Improvements for version 3 of the Twentieth Century Reanalysis system, Q. J. Roy. Meteor. Soc., 145, 2876–2908, https://doi.org/10.1002/qj.3598, 2019.
Slonosky, V. C.: Wet winters, dry summers? Three centuries of precipitation data from Paris, Geophys. Res. Lett., 29, 1887, https://doi.org/10.1029/2001GL014302, 2002.
Stolz, W.: Die Hans Stolzsche Gebweilet Chronik, Zeugenbericht über den Bauernkrieg am Oberrhein, Stolz, Freiburg, 1979.
Tibaldi, S. and Molteni, F.: On the operational predictability of blocking, Tellus A, 42, 343–365, https://doi.org/10.3402/tellusa.v42i3.11882, 1990.
Titchner, H. A. and Rayner, N. A.: The Met Office Hadley Centre sea ice and sea surface temperature data set, version 2: 1. Sea ice concentrations, J. Geophys. Res.-Atmos., 119, 2864–2889, https://doi.org/10.1002/2013JD020316, 2014.
Titow, J.: Evidence of weather in the account rolls of the bishopric of Winchester 1209–1350, Econ. Hist. Rev., 12, 360–407, 1960.
Titow, J.: Le climat à travers les rôles de comptabilité de l'évêché de Winchester (1350–1450), Ann. Hist. Sci. Soc., 25, 312–350, https://doi.org/10.3406/ahess.1970.422220, 1970.
Träger-Chatterjee, C., Müller, R. W., and Bendix, J.: Analysis of extreme summers and prior late winter/spring conditions in central Europe, Nat. Hazards Earth Syst. Sci., 13, 1243–1257, https://doi.org/10.5194/nhess-13-1243-2013, 2013.
Valler, V., Franke, J., Brugnara, Y., Samakinwa, E., Hand, R., Burgdorf, A.-M., Lipfert, L., Friedman, A., Lundstad, E., and Brönnimann, S.: ModE-RA: a global monthly paleo-reanalysis of the modern era 1421 to 2008, Sci. Data, 11, 36, https://doi.org/10.1038/s41597-023-02733-8, 2024 (data available at: https://www.wdc-climate.de/ui/entry?acronym=ModE-RA, last access: 1 October 2026).
Vautard, R., Yiou, P., D'Andrea, F., de Noblet, N., Viovy, N., Cassou, C., Polcher, J., Ciais, P., Kageyama, M., and Fan, Y.: Summertime European heat and drought waves, Geophys. Res. Lett., 34, https://doi.org/10.1029/2006GL028001, 2007.
Wang, G., Dolman, A. J., and Alessandri, A.: A summer climate regime over Europe modulated by the North Atlantic Oscillation, Hydrol. Earth Syst. Sci., 15, 57–64, https://doi.org/10.5194/hess-15-57-2011, 2011.
Warren, R., Bartlome, N. E., Wellinger, N., Franke, J., Hand, R., Brönnimann, S., and Huhtamaa, H.: ClimeApp: data processing tool for monthly, global climate data from the ModE-RA palaeo-reanalysis, 1422 to 2008 CE, Clim. Past, 20, 2645–2662, https://doi.org/10.5194/cp-20-2645-2024, 2024.
Wilks, D. S.: Statistical Methods in the Atmospheric Sciences, Fourth Edn., Elsevier, ISBN 978-0128158234, 2020.