the Creative Commons Attribution 4.0 License.
the Creative Commons Attribution 4.0 License.
 | 28 Feb 2024
Astronomically paced climate and carbon cycle feedbacks in the lead-up to the Late Devonian Kellwasser Crisis
Nina M. A. Wichern
Or M. Bialik
Theresa Nohl
Lawrence M. E. Percival
R. Thomas Becker
Pim Kaskes
Philippe Claeys
David De Vleeschouwer
Repeated carbon isotope excursions and widespread organic-rich shale deposition mark the Middle and Upper Devonian series. Various explanations such as extensive volcanism and land plant evolution have been given for these perturbations and the general sensitivity of the Devonian oceans to the development of anoxia, but their repeated nature suggests that astronomical forcing may have controlled their timing. Here, a cyclostratigraphic study of the Kellwasser Crisis at the Frasnian–Famennian stage boundary (ca. 372 Ma) is carried out. The Kellwasser Crisis was one of the most ecologically impactful of the Devonian perturbations and is ranked among the “Big Five” Phanerozoic mass extinctions. The studied site is the Winsenberg roadcut section in the Rhenish Massif, Germany, which represents a quiet tropical shelf basin setting. Centimetre-scale elemental records, generated by portable X-ray scanning, allow for testing of the hypothesis that a 2.4 Myr eccentricity node preceded the Upper Kellwasser event. The study's results are supportive of this hypothesis. We find enhanced chemical weathering (K2O Al2O3) during the period leading up to the Upper Kellwasser and a peak in distal detrital input (SiO2 CaO) and riverine runoff (TiO2 Al2O3) just prior to the start of the Upper Kellwasser event. We interpret this pattern as the long-term eccentricity minimum facilitating excessive regolith build-up in the absence of strong seasonal contrasts. The Earth's system coming out of this node would have rapidly intensified the hydrological cycle, causing these nutrient-rich regoliths to be eroded and washed away to the oceans, where they resulted in eutrophication and anoxia. An astronomical control on regional climate is observed beyond this single crisis. Wet–dry cycles were paced by 405 kyr eccentricity, with both the Lower and Upper Kellwasser events taking place during comparatively drier times. A precession-sensitive monsoonal climate system prevailed on shorter timescales. Intensification of this monsoonal system following the node may have caused the widespread regolith erosion. We estimate the total duration of the Kellwasser Crisis at ca. 900 kyr, with the individual events lasting for ca. 250 and 100 kyr, respectively. If astronomical control indeed operated via regolith development in monsoonal climates, then land plants may have played an important role. This would not have been through evolutionary steps directly triggering Kellwasser perturbations but by gradually strengthening the climatic response to orbital forcing via soil development – creating soils thick enough to meaningfully respond to orbital forcing – and intensifying the hydrological cycle.
- Article
(21952 KB) - Full-text XML
- BibTeX
- EndNote


The Middle and Late Devonian (ca. 393–359 Ma) global carbon cycle experienced frequent perturbations (Buggisch and Joachimski, 2006; Cramer and Jarvis, 2020). During these events, organic-rich shales were repeatedly deposited across the globe, with positive carbon isotope (δ13C) excursions on the order of +1 ‰ to +4 ‰ (Becker et al., 2020). The organic-rich shale deposition occurred synchronously in different continental and oceanic domains, and these deposits are strongly correlated with the complex sequence of Devonian global events, including the two major mass extinctions at the Frasnian–Famennian and Devonian–Carboniferous boundaries (Joachimski et al., 2002; McGhee, 2012; Kaiser et al., 2016). These characteristics suggest repetitive and non-regional causal processes.
A potential repetitive and global control mechanism is astronomical forcing. However, organic-rich shale deposition does not occur at perfectly regular or predictable intervals, which excludes astronomical forcing as the sole causal mechanism. Current discussions of triggering mechanisms focus on tectonic processes (e.g. Averbuch et al., 2005), enhanced volcanic activity (Racki, 2020a; and references therein), sea level and ocean circulation changes (Wilde and Berry, 1984), and the expansion of land plants (Algeo and Scheckler, 1998). Consequently, carbon cycle perturbations may have occurred against a background of various interlinked secular and long-term cyclic processes that are punctuated by astronomical forcing (De Vleeschouwer et al., 2017).
To understand the broader pattern and underlying mechanisms of Devonian anoxic events, we must analyse and compare the conditions that gave rise to individual perturbations. One intriguing case study is the Kellwasser Crisis at the Frasnian–Famennian stage boundary (∼372 Ma, Harrigan et al., 2021), which had a profound impact on marine biota and is ranked among the “Big Five” mass extinctions of the Phanerozoic (Raup and Sepkoski, 1982; Sepkoski, 1996; McGhee et al., 2013). The Kellwasser Crisis consists of two distinctive intervals: the Lower (LKW) and Upper (UKW) Kellwasser events (Schindler, 1990a; Carmichael et al., 2019). Both events are associated with short-term transgressive episodes (e.g. Becker et al., 2016a; Mottequin and Poty, 2016). The ultimate cause of the Kellwasser Crisis remains debated, and examples include extensive volcanism (Racki, 1999; Ma et al., 2016; Racki et al., 2018; Racki, 2020a; Kabanov et al., 2023); climatic cooling (Copper, 1986; Joachimski and Buggisch, 1993, 2002; Song et al., 2017; Huang et al., 2018; Pier et al., 2021); and land–plant-induced eutrophication (Algeo et al., 1995; Algeo and Scheckler, 1998; De Vleeschouwer et al., 2017). Several of the proposed mechanisms are not mutually exclusive and combinations of causes have often been suggested.
Astronomical forcing could have controlled several of the factors described above, and an astronomical influence on climate during the Kellwasser interval has already been proposed (De Vleeschouwer et al., 2017; Whalen et al., 2017; Da Silva et al., 2020; Lu et al., 2021; Ma et al., 2022). Yet, the different astrochronologies are not all in agreement (De Vleeschouwer et al., 2017; Ma et al., 2022), with significant implications for the controlling parameters of the Kellwasser Crisis. De Vleeschouwer et al. (2017) proposed that a particular sequence of orbital changes led to the Late Devonian climate crossing a tipping point into widespread anoxic conditions in the oceans (Fig. 1). Prior to the UKW, a 2.4 Myr eccentricity minimum (or “node”) created relatively stable climate conditions for several tens of thousands of years. During an eccentricity minimum, the Earth's orbit is close to circular, and the modulation of precession is dampened. Large seasonal contrasts are thus suppressed. In this stable climate, thick regoliths could form on the continents, promoted by newly developed coastal forests. A subsequent rapid increase in eccentricity led to stark precessional contrasts towards the onset of the UKW. The resulting intensified monsoonal climate during precession maxima triggered the release of nutrients from the continents into the oceans as the regolith was more readily eroded and washed away. This sudden nutrient input led to eutrophication, anoxia, and black shale deposition (Fig. 1). The hydrological cycle weakens again during the next precession minimum. However, phosphorus recycling from the sediments is promoted under anoxic conditions (Van Cappellen and Ingall, 1996; Smart et al., 2022). Once anoxia has been established during a precession maximum, this mechanism may result in sustained anoxia, even in the absence of consistent high nutrient input. Subsequent work by other authors has established cyclostratigraphic interpretations that support the “eccentricity minimum hypothesis” (Da Silva et al., 2020; Lu et al., 2021). Additional lines of evidence such as micrometeorite dust flux (Schmitz et al., 2019) and osmium isotopes (Percival et al., 2019) provided independent evidence for a low-eccentricity state and enhanced nutrient fluxes during this interval, respectively. This model has been challenged by Ma et al. (2022), who proposed that a combination of an eccentricity maximum and an obliquity maximum resulted in enhanced seasonal contrast and strengthened monsoons as this combination results in maximum insolation.
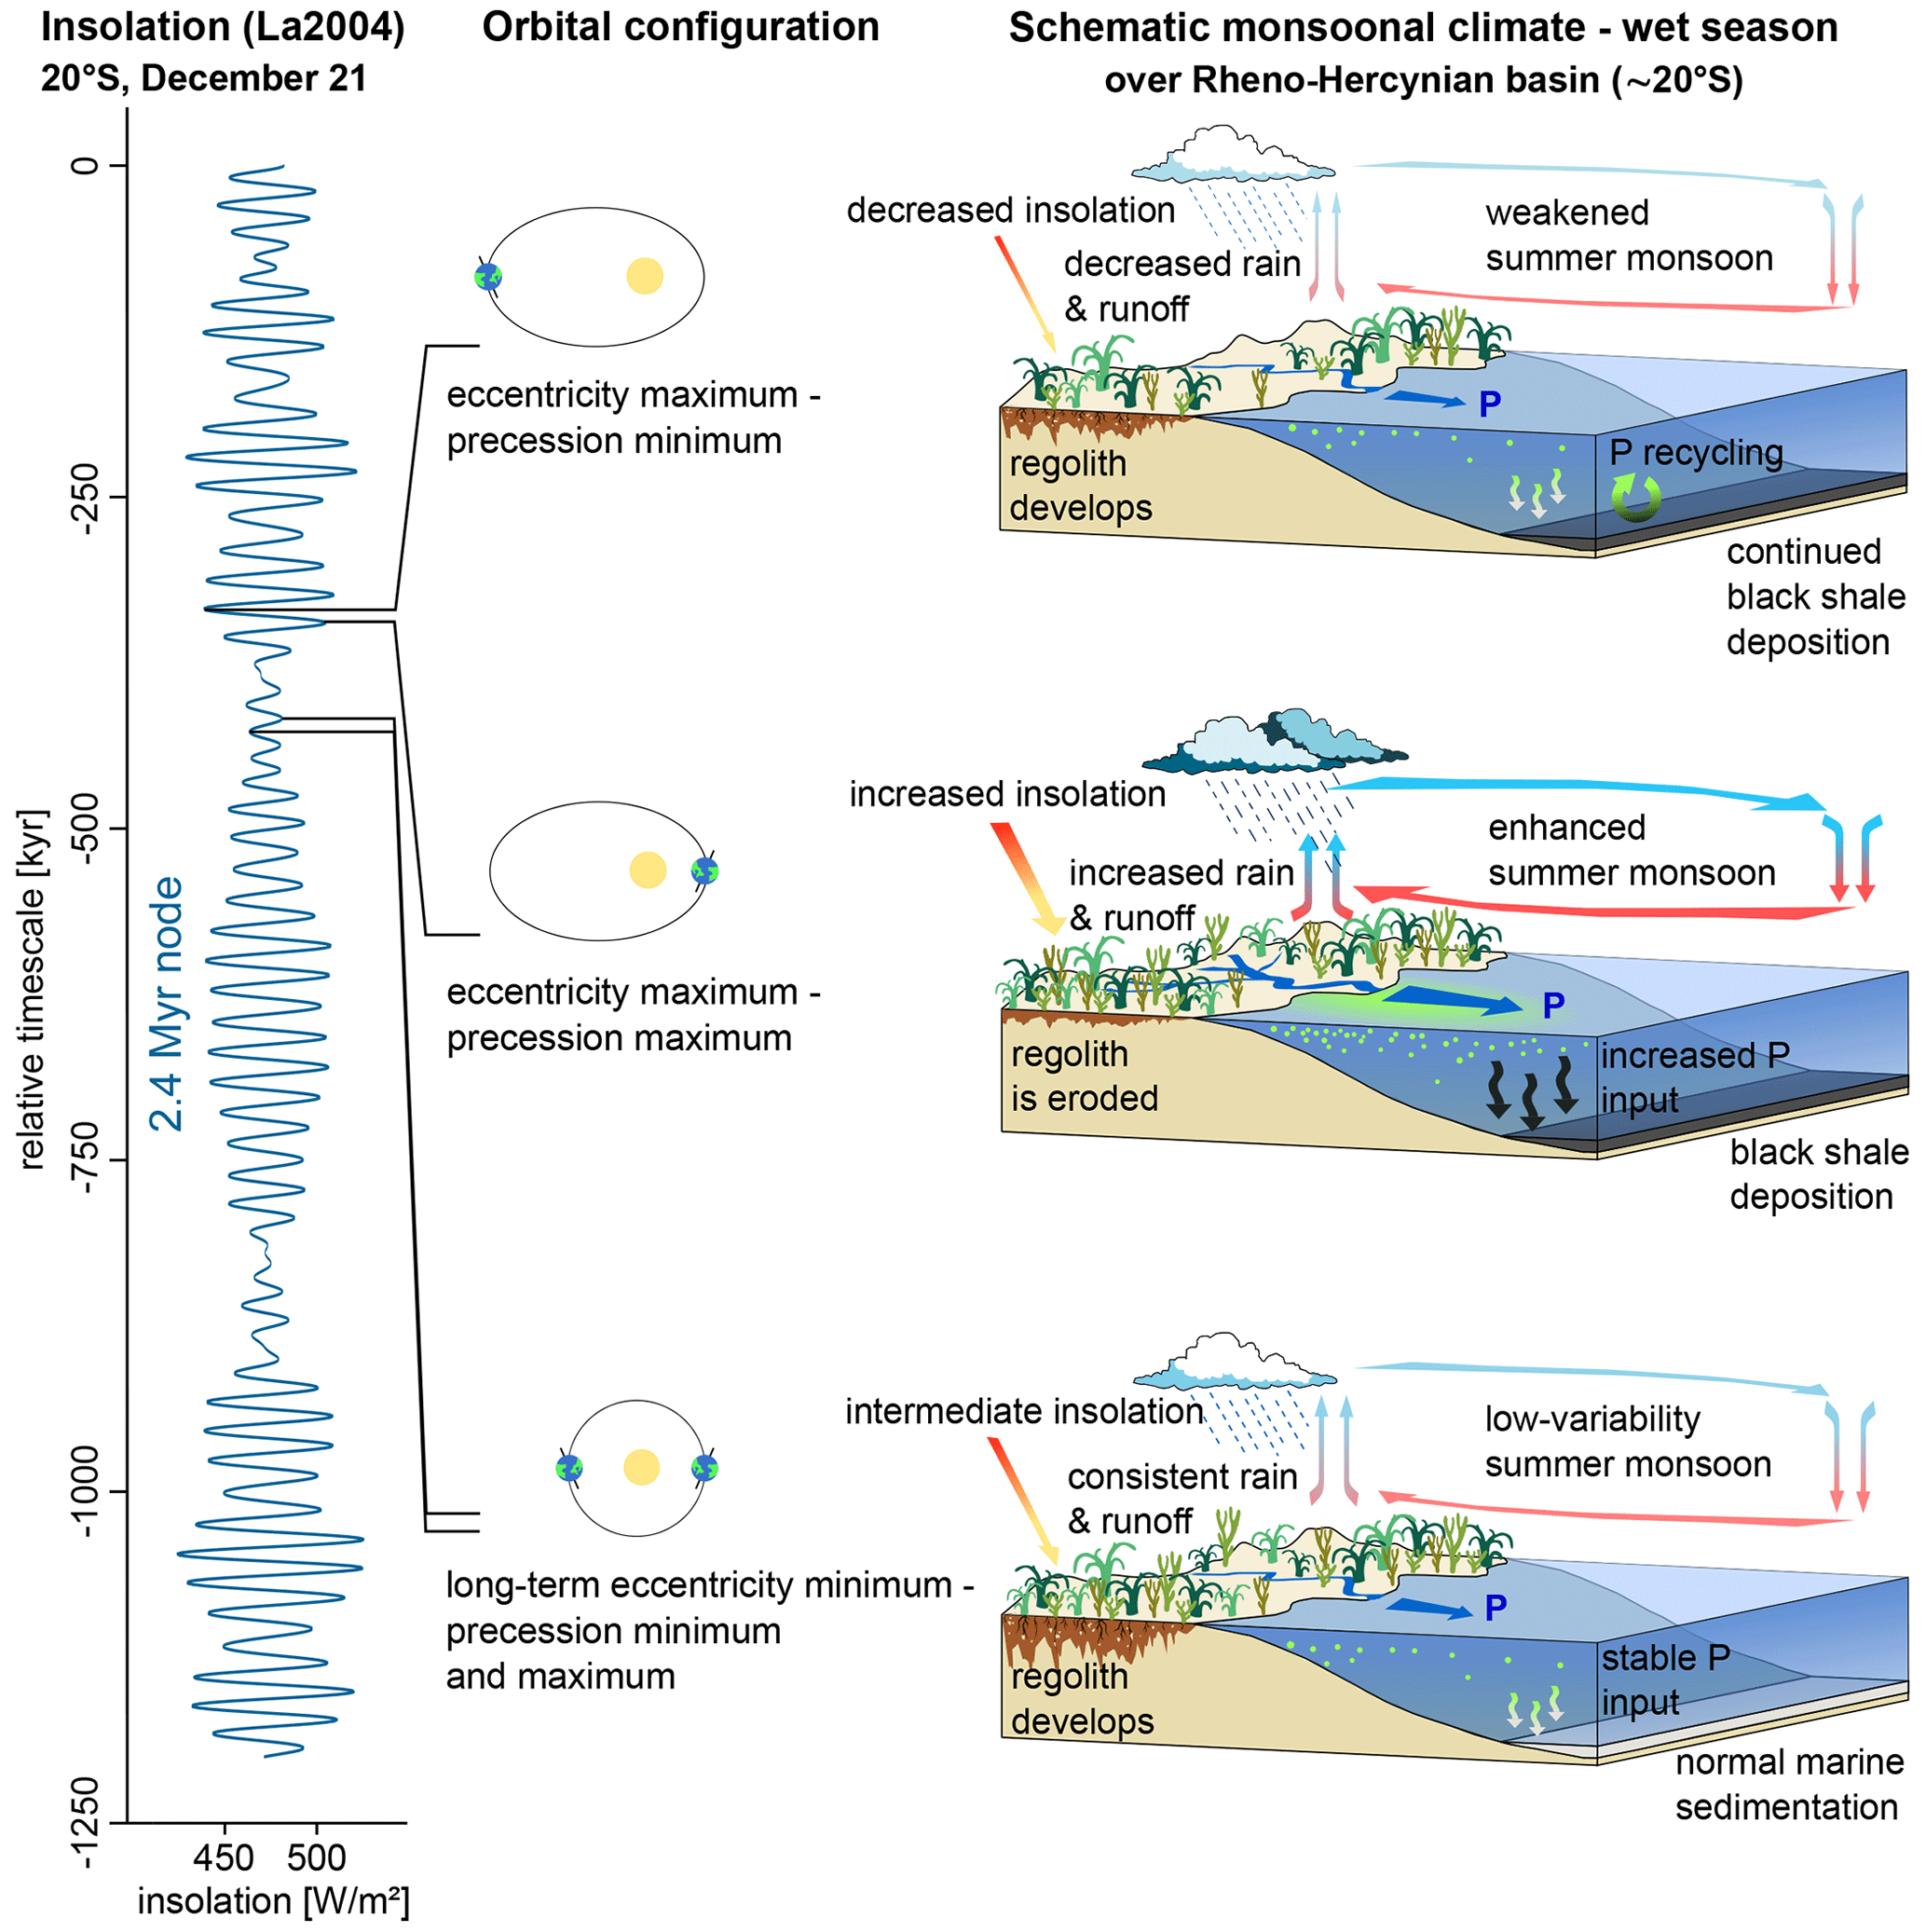
Figure 1Schematic illustration of the eccentricity minimum hypothesis, after De Vleeschouwer et al. (2017). During the eccentricity minimum within a 2.4 Myr node, seasonal contrasts are reduced, promoting regolith build-up on the continents (bottom panel). This regolith and the nutrients it contains are subsequently eroded during the first intense precession maximum that occurs as Earth's orbital configuration comes of out the node. Especially important is the limiting nutrient phosphorus (P). This leads to eutrophication (middle panel). The hydrological cycle weakens again during the following precession minimum, but phosphorus recycling under the established anoxic conditions is able to sustain anoxia and black shale deposition (top panel).
To address the astrochronology debate and to improve our understanding of environmental changes under different overarching climate states, we set out to investigate the astronomical pacing of the Kellwasser. In this study, we conduct a centimetre-scale resolution cyclostratigraphic study of the Kellwasser Crisis in the Rhenish Massif of Germany.
The Winsenberg roadcut is exposed along the Bredelarer Strasse between the village of Adorf (Diemelsee) and the Christiane Mine (Grube Christiane), at 51°22′17.1′′ N, 8° 47′51.0′′ E (Fig. 2a, b), and has been previously studied by various authors. The sediments were deposited in an intertropical outer-shelf basinal setting, several hundreds of kilometres off the coast of southern Euramerica (Fig. 2c, d; Meischner, 1971; Gereke, 2007; van Hulten, 2012). The exposed rocks belong to the macroscopically banded Winsenberg Formation (also called “Adorf Bänderschiefer”; Becker et al., 2016b), which consists of grey-brown marls, micritic/microsparitic limestones that are sometimes dolomitized (Gereke, 2007), and silty or pyritic shales, with reddish-brown weathered surfaces (Fig. A1c, d). The restricted fauna consists of benthic and planktonic ostracods, tentaculitoids, deeper-water conodonts (Palmatolepis biofacies), trace fossils, and rare ammonoids. These represent pelagic assemblages that are typical of offshore deposition below the euphotic zone and with variable seafloor oxygenation (Piecha, 1993; Gereke, 2007; Becker et al., 2016b). Most of the carbonate in the Winsenberg section is likely derived from shallower, more proximal settings (see thin sections in Piecha, 1993; Gereke, 2007), such as the drowned Brilon Reef and adjacent volcanic seamounts to the north of Winsenberg (Stritzke, 1990; Becker, 1993; Pas et al., 2013; Hartenfels et al., 2016). It should be noted that all reefs in the eastern Rhenish Massif had drowned prior to the Kellwasser Crisis (e.g. Becker et al., 2016a).
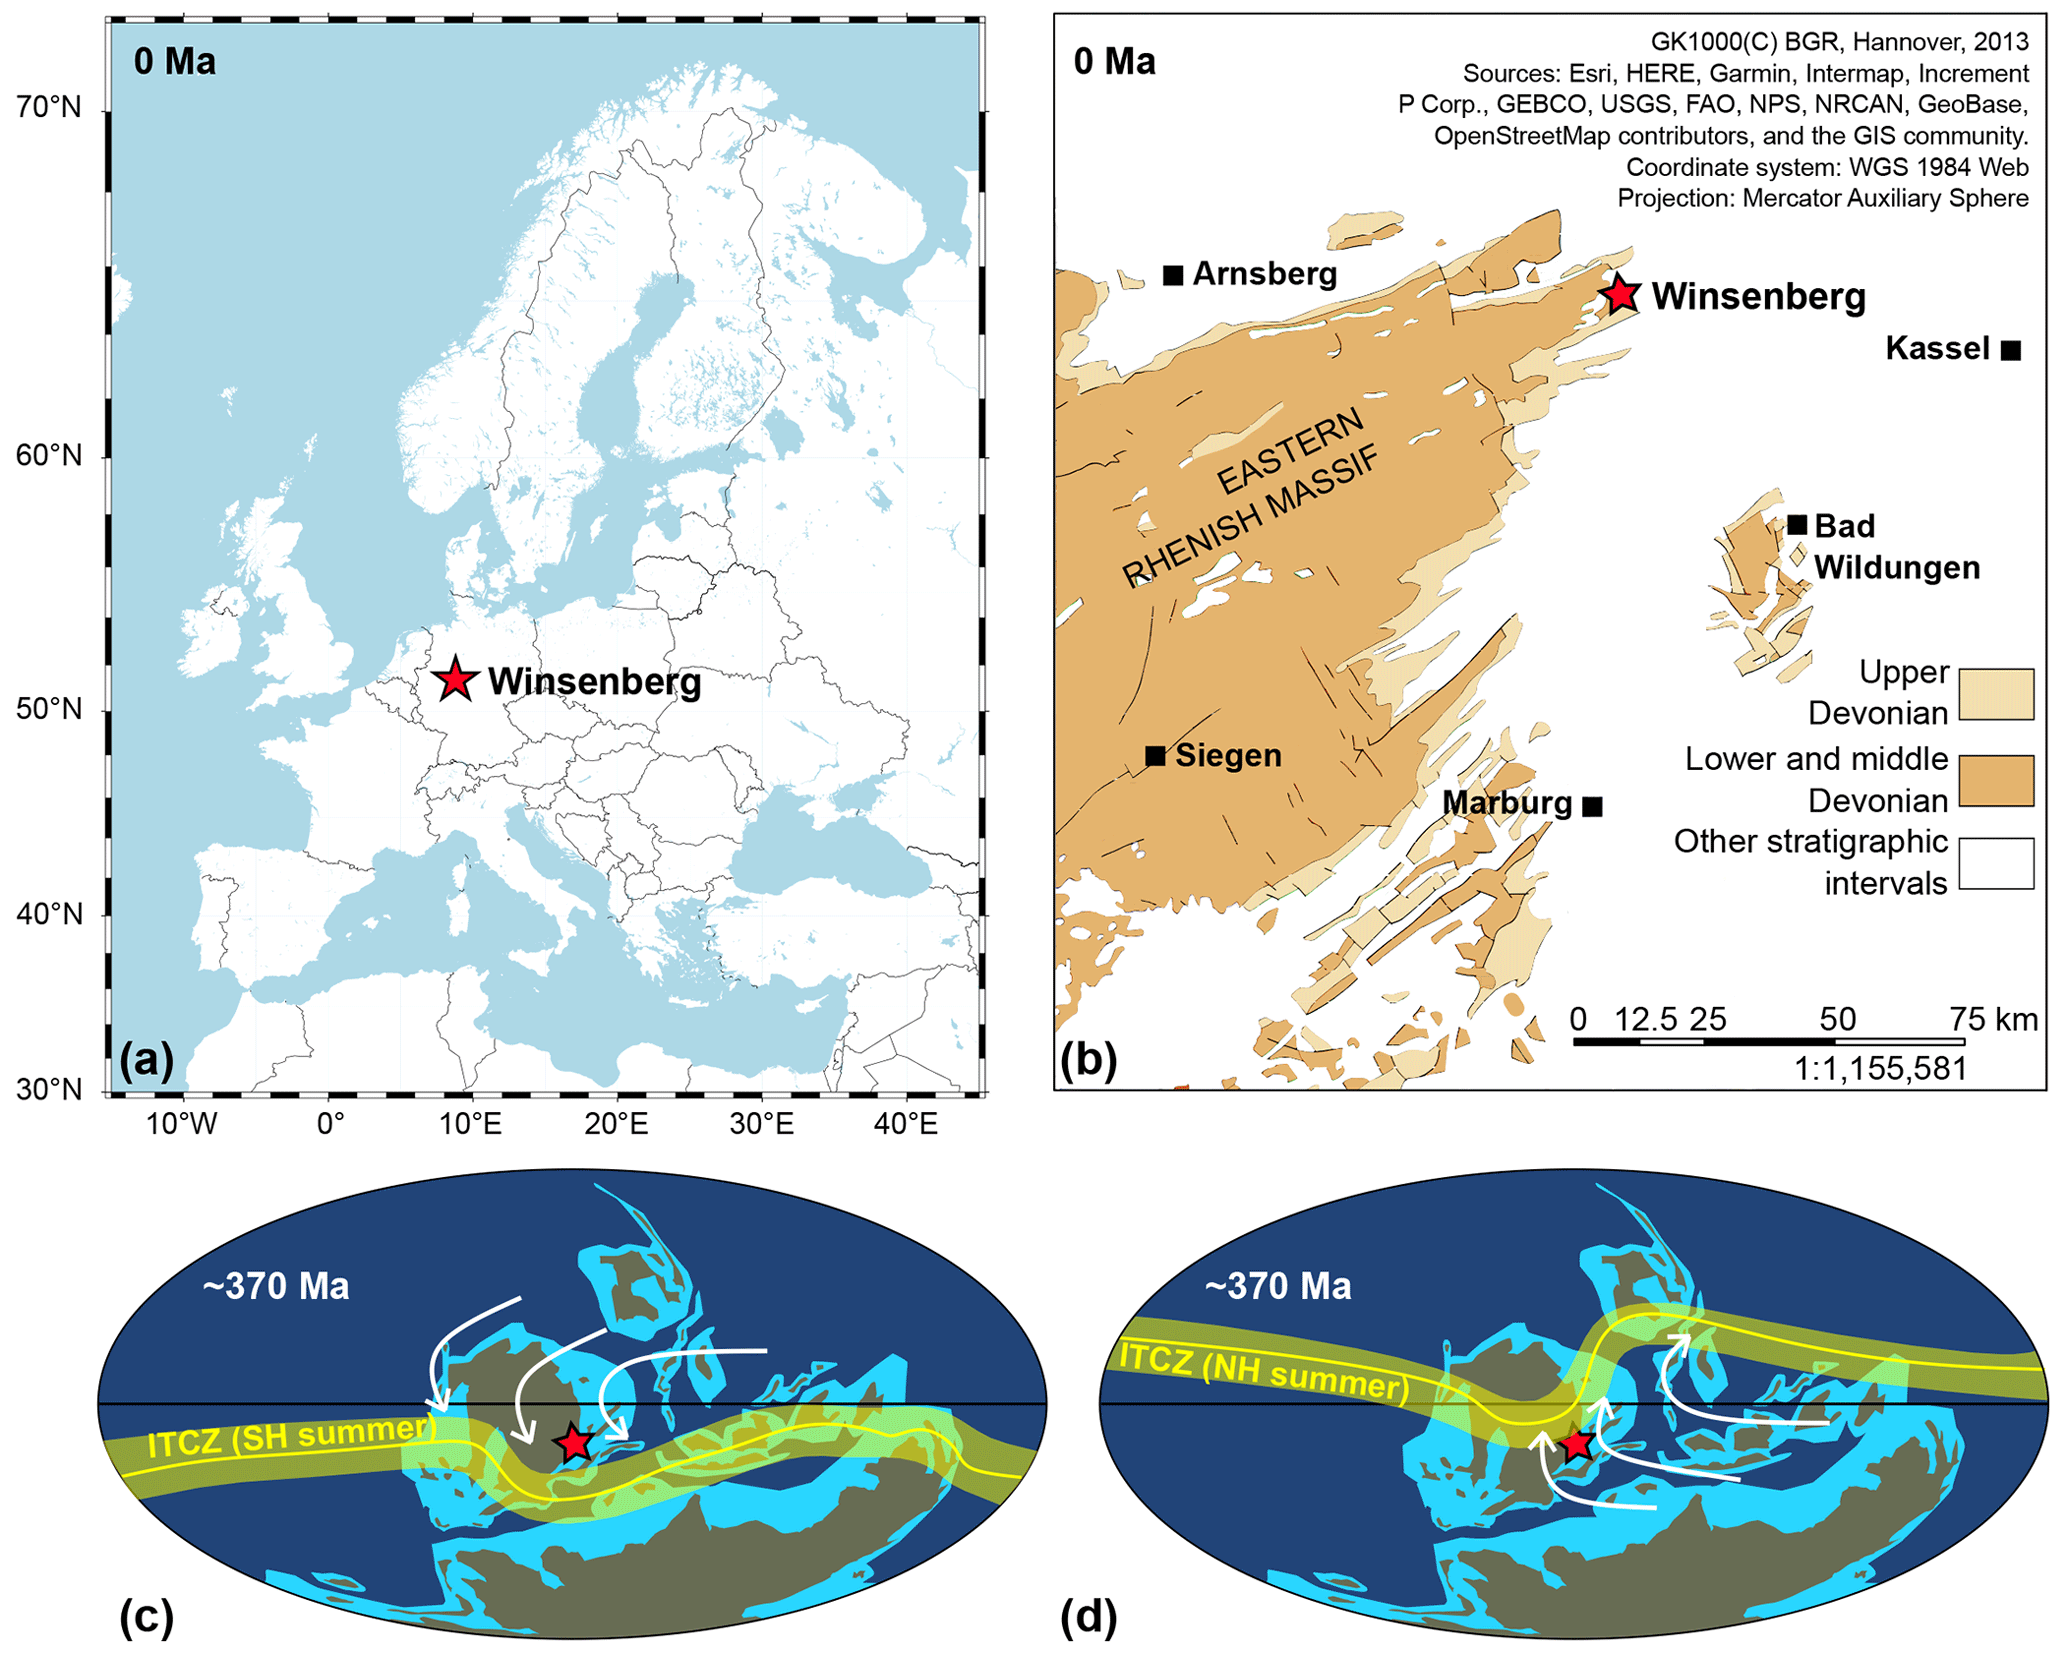
Figure 2(a) Modern-day location of the Winsenberg section within Germany. (b) Modern-day location of the Winsenberg section within the Devonian outcrops of the Rhenish Massif. (c) Late Devonian location of the Winsenberg section in southeastern Laurentia. Included is the approximate position of the Northern Hemisphere (NH) summer Intertropical Convergence Zone (ITCZ) in yellow. Associated prevailing trade winds are drawn as white arrows. (d) The same as panel (c) for the Southern Hemisphere (SH) summer. The Late Devonian map is inspired by Blakey (2016). ITCZ positions are based on De Vleeschouwer et al. (2014). The geological map is based on the GK1000 map from the German Bundesanstalt für Geowissenschaften und Rohstoffe (BGR). © OpenStreetMap contributors 2022. Distributed under the Open Data Commons Open Database License (ODbL) v1.0.
The 12 m long studied section spans the strata that record the LKW and UKW events (Fig. 3a). Just below the LKW horizon, a 72 cm thick limestone bed with centimetre-scale internal variations in the carbonate content is present, termed the Usseln Limestone (Gereke, 2007) (Fig. A1a). This unit was logged and sampled for carbonate δ13C but not further analysed in this study. The LKW event is expressed as a ca. 170 cm thick interval of dark shales and limestones (0.8–2.2 wt % total organic carbon, TOC; Fig. A1b), the latter of which increase in abundance towards the top. This black shale and limestone expression is typical of German Kellwasser sections (Schindler 1990a, b; Riquier et al., 2006; Carmichael et al., 2019). Benthic ostracod bloom beds are found near the top of the LKW level (Becker et al., 2016b). Lower Kellwasser black shale deposition is followed by a ca. 6 m thick succession of Winsenberg Formation marls, limestones, and shales. Some of these shales are dark in colour and contain up to 1.5 wt % TOC. The UKW horizon itself comprises a ca. 70 cm thick interval of dark shales and micritic limestones (0.4–1.2 wt % TOC; Fig. A1e). The UKW black shale is followed by five thin, regionally traceable black shales (ca. 0.8 wt % TOC), termed fa-bs 1 to 5 (Famennian black shale 1 to 5) (Gereke, 2007; Becker et al., 2016b). The lowest of these shales, fa-bs-1, separates two distinctive, weathered marker limestones without bioclasts but with another benthic ostracod bloom and large pyrite concretions that were probably filling burrows (Gereke, 2007; Becker et al., 2016b). The remaining post-UKW black shales (fa-bs 2 to 5) are interbedded with marls and nodular limestones (Figs. 3a, A1f). An expanded log with bed numbering and sampling positions can be found in Fig. A2. The lithology of the Winsenberg section was briefly described by Franke (1991; Aar valley road section), Franke et al. (1996; Aar valley road section), Becker (1984; road section NW Winsenberg), Schindler and Königshof (1997; SW Grube Christiane), Gereke and Schindler (2012; Grube Christiane), and Becker et al. (2016b; Winsenberg roadcut) and studied in detail by Piecha (1993; Profile AD 1) and Gereke (2007; Grube Christiane), including clastic sedimentology and carbonate microfacies. Carbon isotopes were studied by Joachimski (1997; Grube Christiane) describing the two characteristic positive excursions at the LKW and UKW horizons. The section's burial history was determined by Königshof (1992) on the basis of conodont alteration indices. These indices suggested burial temperatures of +300 °C, highlighting a strong potential for late burial diagenetic alteration. Conodont biostratigraphy was carried out by Königshof (1992) and Gereke (2007), with zonal re-assignments and additional data in Becker et al. (2016b). This confirmed the position of the Frasnian–Famennian boundary at the top of the UKW horizon (Fig. 3a). There is no absolute age control available for this section; however, in the Steinbruch Schmidt section ca. 70 km southeast of Winsenberg, a bentonite between the LKW and UKW horizons was recently dated at 372.36±0.053 Ma using U–Pb zircon dating (Percival et al., 2018). While this date precisely pinpoints the age of the Kellwasser Crisis, the only available constraints on its duration are those based on recent stratigraphic studies (De Vleeschouwer et al., 2017; Da Silva et al., 2020; Ma et al., 2022).
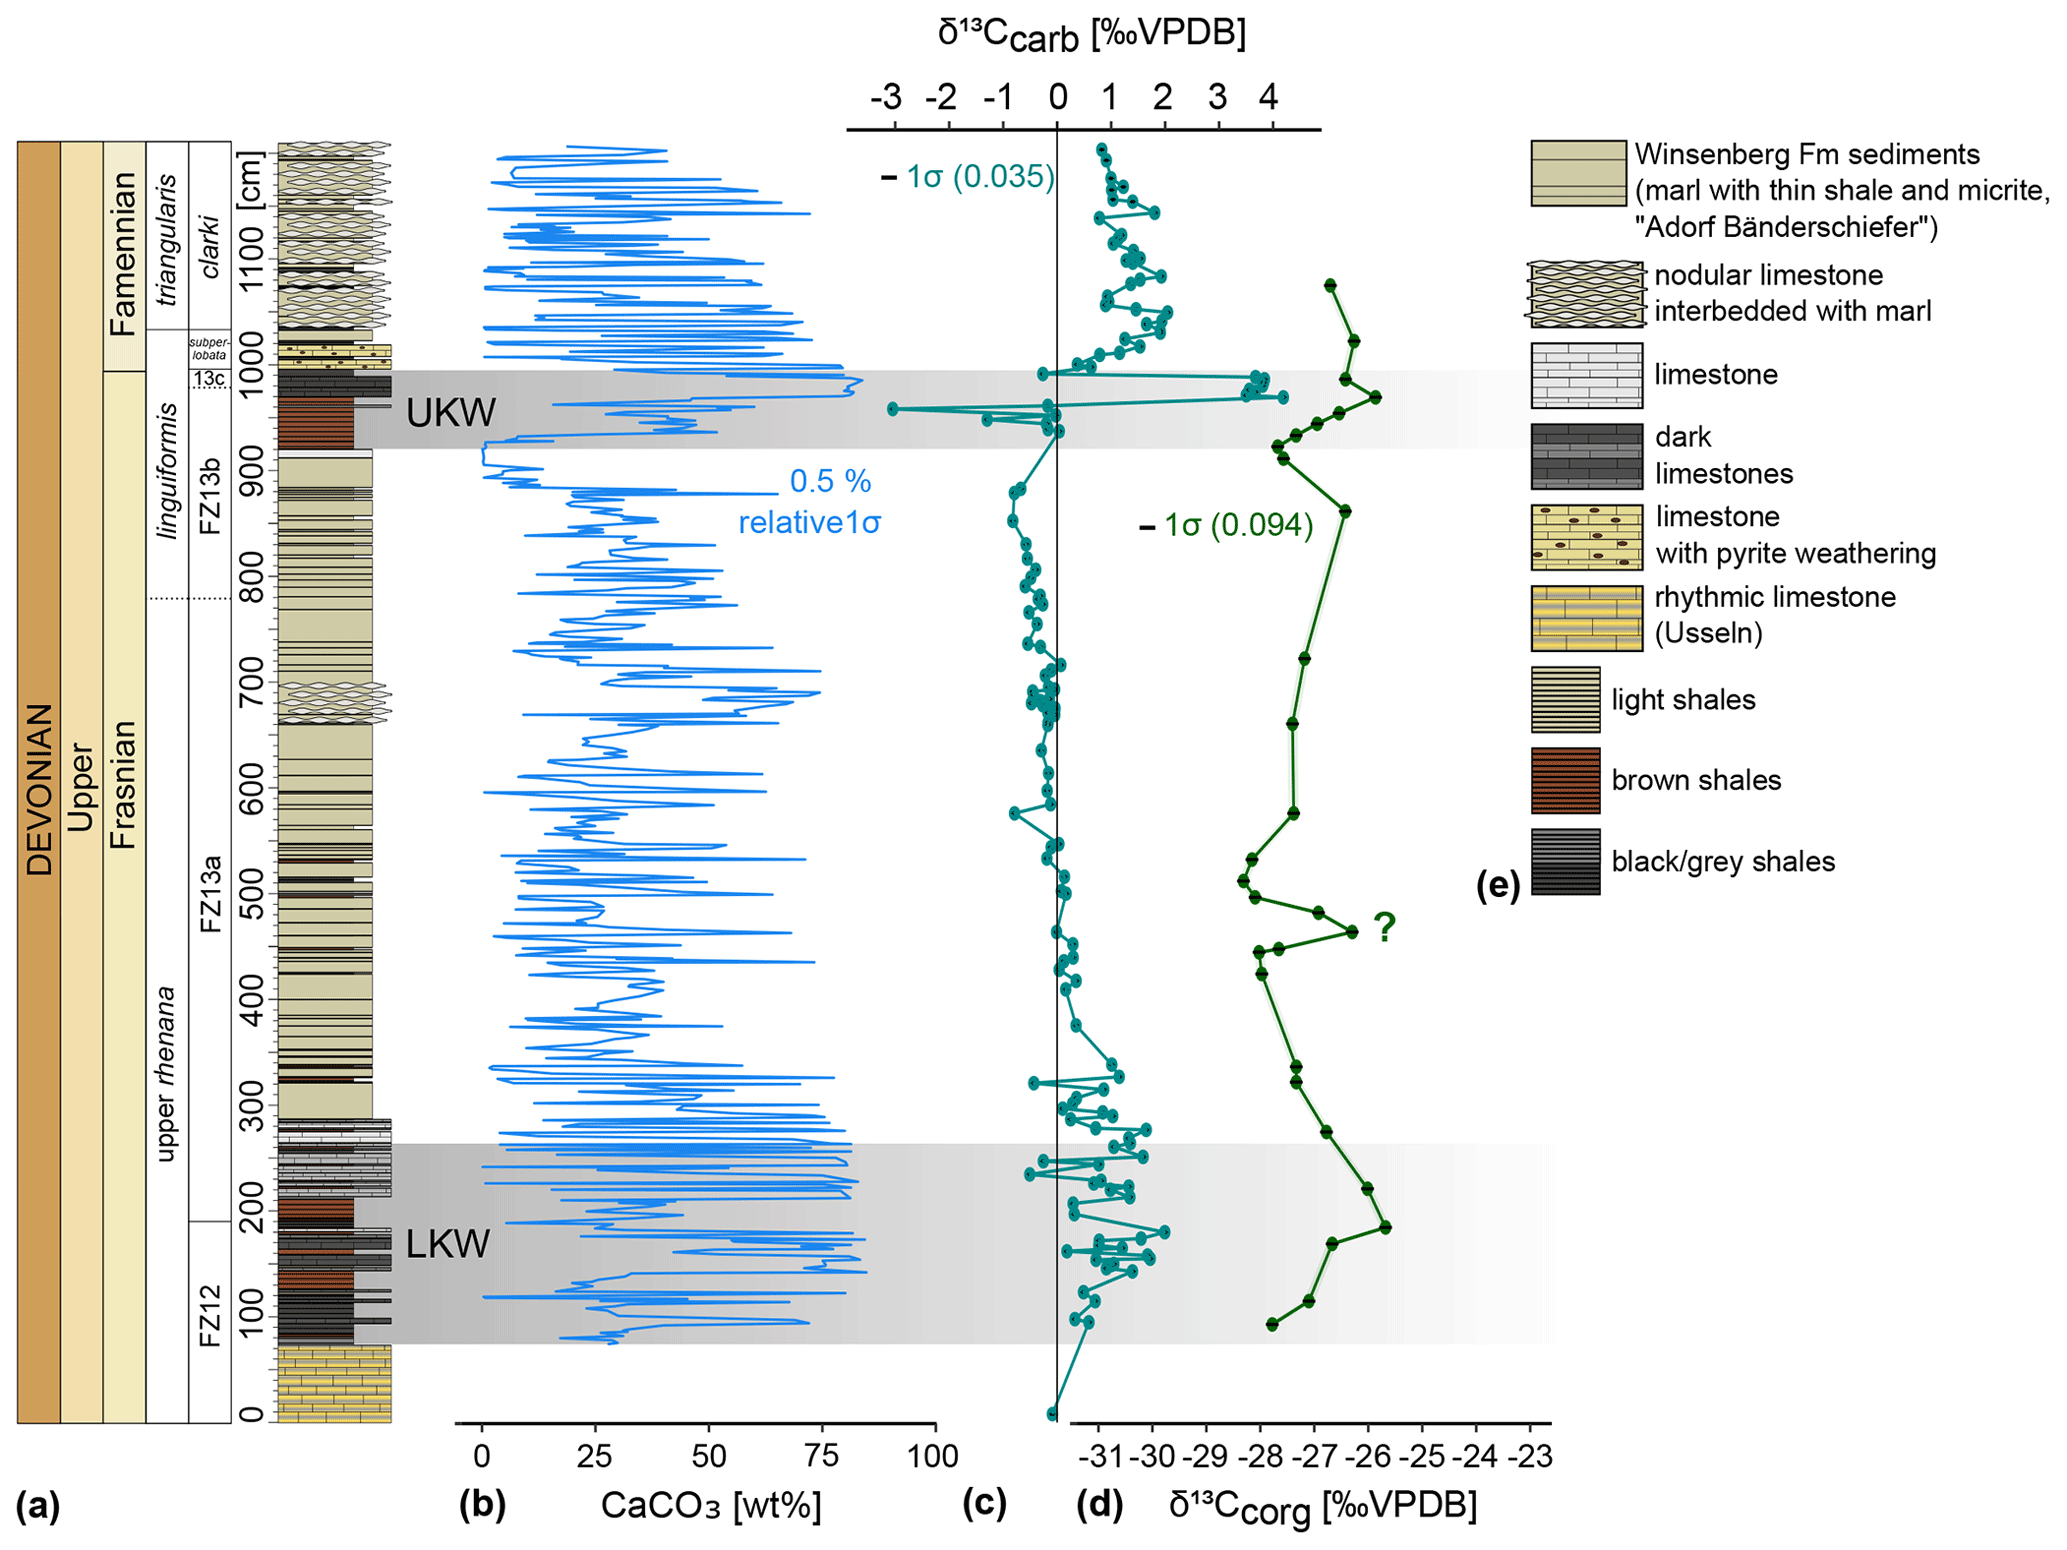
Figure 3(a) Lithologic column (this study) and conodont biostratigraphy by Königshof (1992) and Gereke (2007), with minor additions by Becker (2016b). (b) CaCO3 content, as quantified from pXRF CaO data. (c) Carbonate δ13C data showing the two positive excursions within the LKW and UKW intervals. (d) Organic carbon δ13C data showing a similar trend to the carbonate δ13C record. The peak around 460 cm does not correspond to any known global or regional excursion. (e) Legend for the lithological column.
3.1 Sampling
We logged 12 m of the outcrop from the Usseln Limestone bed that underlies the LKW to 2 m above the top of the UKW horizon (Fig. 3a). The weathered outer surface of the outcrop was removed, and hand samples were taken every 1–3 cm (N=556). Recent dating efforts have estimated the duration of the LKW–UKW interval to have been 800–1600 kyr (De Vleeschouwer et al., 2017; Percival et al., 2018; Da Silva et al., 2020; Lu et al., 2021; Ma et al., 2022). Hence, even for the longest-duration estimate, our sample spacing still ensures ∼5 samples per ∼19 kyr precession cycle.
3.2 Carbonate and organic carbon δ13C
The δ13C composition of 144 carbonate-rich samples was analysed (δ13Ccarb). Measurements on powdered samples weighing 120–150 µg were carried out on a Thermo Scientific DELTA V Plus mass spectrometer at the University of Münster. An in-house carbonate standard, Kabonat-1 (δ13C = 1.46 ‰; δ18O = −1.19 ‰), was used for calibration. An external standard (NBS −2.20 ‰) was used to monitor the long-term performance. All δ13C values are reported relative to VPDB (Vienna Pee Dee Belemnite). The in-house standard Karbonat-1 had a δ13C standard deviation (SD) of 0.04 ‰ (N=54). The external standard NBS-19 has an SD of 0.02 ‰ (N=10) and a mean offset of +0.04 ‰, relative to the accepted value. Duplicate δ13Ccarb measurements of 15 samples were consistent with the SD of 0.04 ‰ determined from the Karbonat-1 standard.
In addition, a lower-resolution (N=48) organic matter carbon isotope series (δ13Corg) was constructed from measurements performed at the Archaeology, Environmental Changes and Geo-Chemistry research group (AMGC) of the Vrije Universiteit Brussel (Belgium). In total, 35 of these samples had sufficient organic content to determine δ13Corg. The procedure described in Liu et al. (2021) was followed. Briefly, the samples were decarbonated with 10 % HCl in two steps, rinsed with Milli-Q water, and dried in an oven at 50 °C. Weighing before and after decarbonation resulted in a rough CaCO3 content estimate for each sample, assuming limited dissolution of other minerals. This content was compared to the CaCO3 estimate obtained through pXRF (Sect. 3.3.2). Total organic carbon (TOC) contents and δ13Corg compositions were determined on a Euro EA Elemental Analyser (CHNS) and EuroVector HT-PyrOH combustion system coupled to a Nu Instruments Horizon 2 isotope ratio mass spectrometer. The results were calibrated using two international standards, IAEA-C6 (sucrose δ13C = −10.45 ‰) and IA-R068 (soy protein δ13C = −25.22 ‰), together with reference material IVA33802151, which is calibrated against these international standards (organic-rich sediment δ13C = −28.85 ‰). This calibration was verified with a further reference material, IVA33802153 (organic-poor soil δ13C = −22.88 ‰). All δ13C values are reported relative to VPDB. Standard deviations for all standards were as follows: IAEA-C6 (sucrose) 0.095 ‰, IA-R068 (soy protein) 0.065 ‰, IVA33802151 (organic-rich sediment) 0.042 ‰, and IVA33802153 (organic-poor soil) 0.201 ‰. The samples have a δ13C SD of 0.039 ‰, based on duplicate measurements of five samples.
3.3 Portable XRF
3.3.1 Portable XRF analyses on powdered material
All samples were analysed using portable X-ray fluorescence (pXRF) in a laboratory environment. From each hand sample, a powder was drilled using a handheld Dremel drill with a diamond drill bit. The XRF analysis of a homogenized powder instead of a whole-rock surface minimizes errors due to surface irregularities and compositional heterogeneities. Moreover, drilling by hand allows for avoiding weathered surfaces and secondary veins, as long as these are large enough to be visible. The powders were sieved through a 180 µm sieve to remove any coarse debris prior to XRF analysis. The 90th percentile (D90) of all analysed samples was ≤50 µm. This grain size adheres to the guidelines provided in Claisse and Samson (1961) and Quye-Sawyer et al. (2015) (Appendix B1). The powders were loaded into plastic vials covered with Chemplex Prolene thin film. XRF measurements were carried out on a Bruker S1 TITAN 800 handheld XRF instrument with a graphene window and 8 mm collimator at the University of Münster. Measurements were carried out in spectrometer mode with the following settings: 40 keV, 20 µA, 75 s, and no filters. The spectra were deconvoluted within the Bruker ARTAX software. Reproducibility after repackaging the powders was <0.5 wt % for all major elements based on three duplicate measurements of five samples.
3.3.2 Calibration and quantification of element contents
To calibrate the data, a set of 10 sedimentary rock standards from the GeoReM dataset (NIST SRM-1c, JLs-1, VB-K2, SGR-1, BX-N, KH, JDO-1, COQ-1, SARM-46, and JMS-2; Jochum and Nohl, 2008) was analysed following the same procedure. Their measured values can be found under the “Data Availability” section at the end of the paper. This dataset was supplemented with 11 mixtures of quartz (Fluka Chemika 00653) and calcium carbonate (Merck A965776). The result is a linear calibration for all the elements used here that can be used semi-quantitatively (Fig. C1).
The calibrated pXRF results were validated through comparison with acid digestion data. CaCO3 data obtained from the calibrated pXRF measurements was compared to CaCO3 estimates from the δ13Corg acid digestion of the same samples. Both datasets show the same trends, albeit with a ∼8 wt % offset. The offset likely originates from components aside from CaCO3 being digested as well (Fig. C2). Nevertheless, the slope is close to unity (1.072; Fig. C2). Tracking relative changes using spectral analysis is therefore expected to give reliable results, at least for CaCO3 (Fig. 3b).
3.4 Selection and interpretation of elemental ratio proxies
Three elemental ratios were chosen for analysis based on their use as palaeoclimatic indicators: SiO2 CaO for total continent-derived detrital input, TiO2 Al2O3 for riverine input, and K2O Al2O3 for chemical weathering. Aluminium is on the light end of elements that can still be reliably detected with pXRF. Comparison with SiO2 and TiO2 suggests that it tracks a similar detrital signal (Fig. C3). SiO2 CaO is interpreted to mirror the total detrital (distal terrestrial) input over the total carbonaceous (proximal marine) input. Silica is interpreted to be chiefly detrital, as conodont sample residues and thin sections do not contain notable amounts of biogenic skeletal silica such as hexactinellid spicules or radiolaria (except Bed 05 in Gereke, 2007; see his pl. 1; Fig. 4; around 220 cm in this study's profile). The local carbonate is fine-grained and mostly recrystallized (Piecha, 1993). It is interpreted as detritus derived from the drowned Brilon reef in the north (see the facies model of Eder et al., 1977), admixed with minor amounts of small shells (ostracods and tentaculitoids) and possibly with planktonic calcimicrobes (Calcitarcha, sensu Versteegh et al., 2009) that, if originally present, were lost by diagenesis. The SiO2 CaO ratio represents the largest variability within the major oxides of the dataset (Fig. C4). As it represents a major component of the purported palaeoclimatic signal, spectral analysis and tuning was focussed on this record. A log10 transformation was carried out on the SiO2 CaO record prior to this analysis, as the log-transformed SiO2 CaO record carries a more stationary signal. To ensure CaO does not import a diagenetic signal in the analysis, the ratio of SiO2 CaO and the ratio of the diagenetically stable TiO2 Al2O3 (see below) were compared. Though the amplitude differs, the same signal curve is obtained, suggesting a predominantly primary signal (Fig. C5).
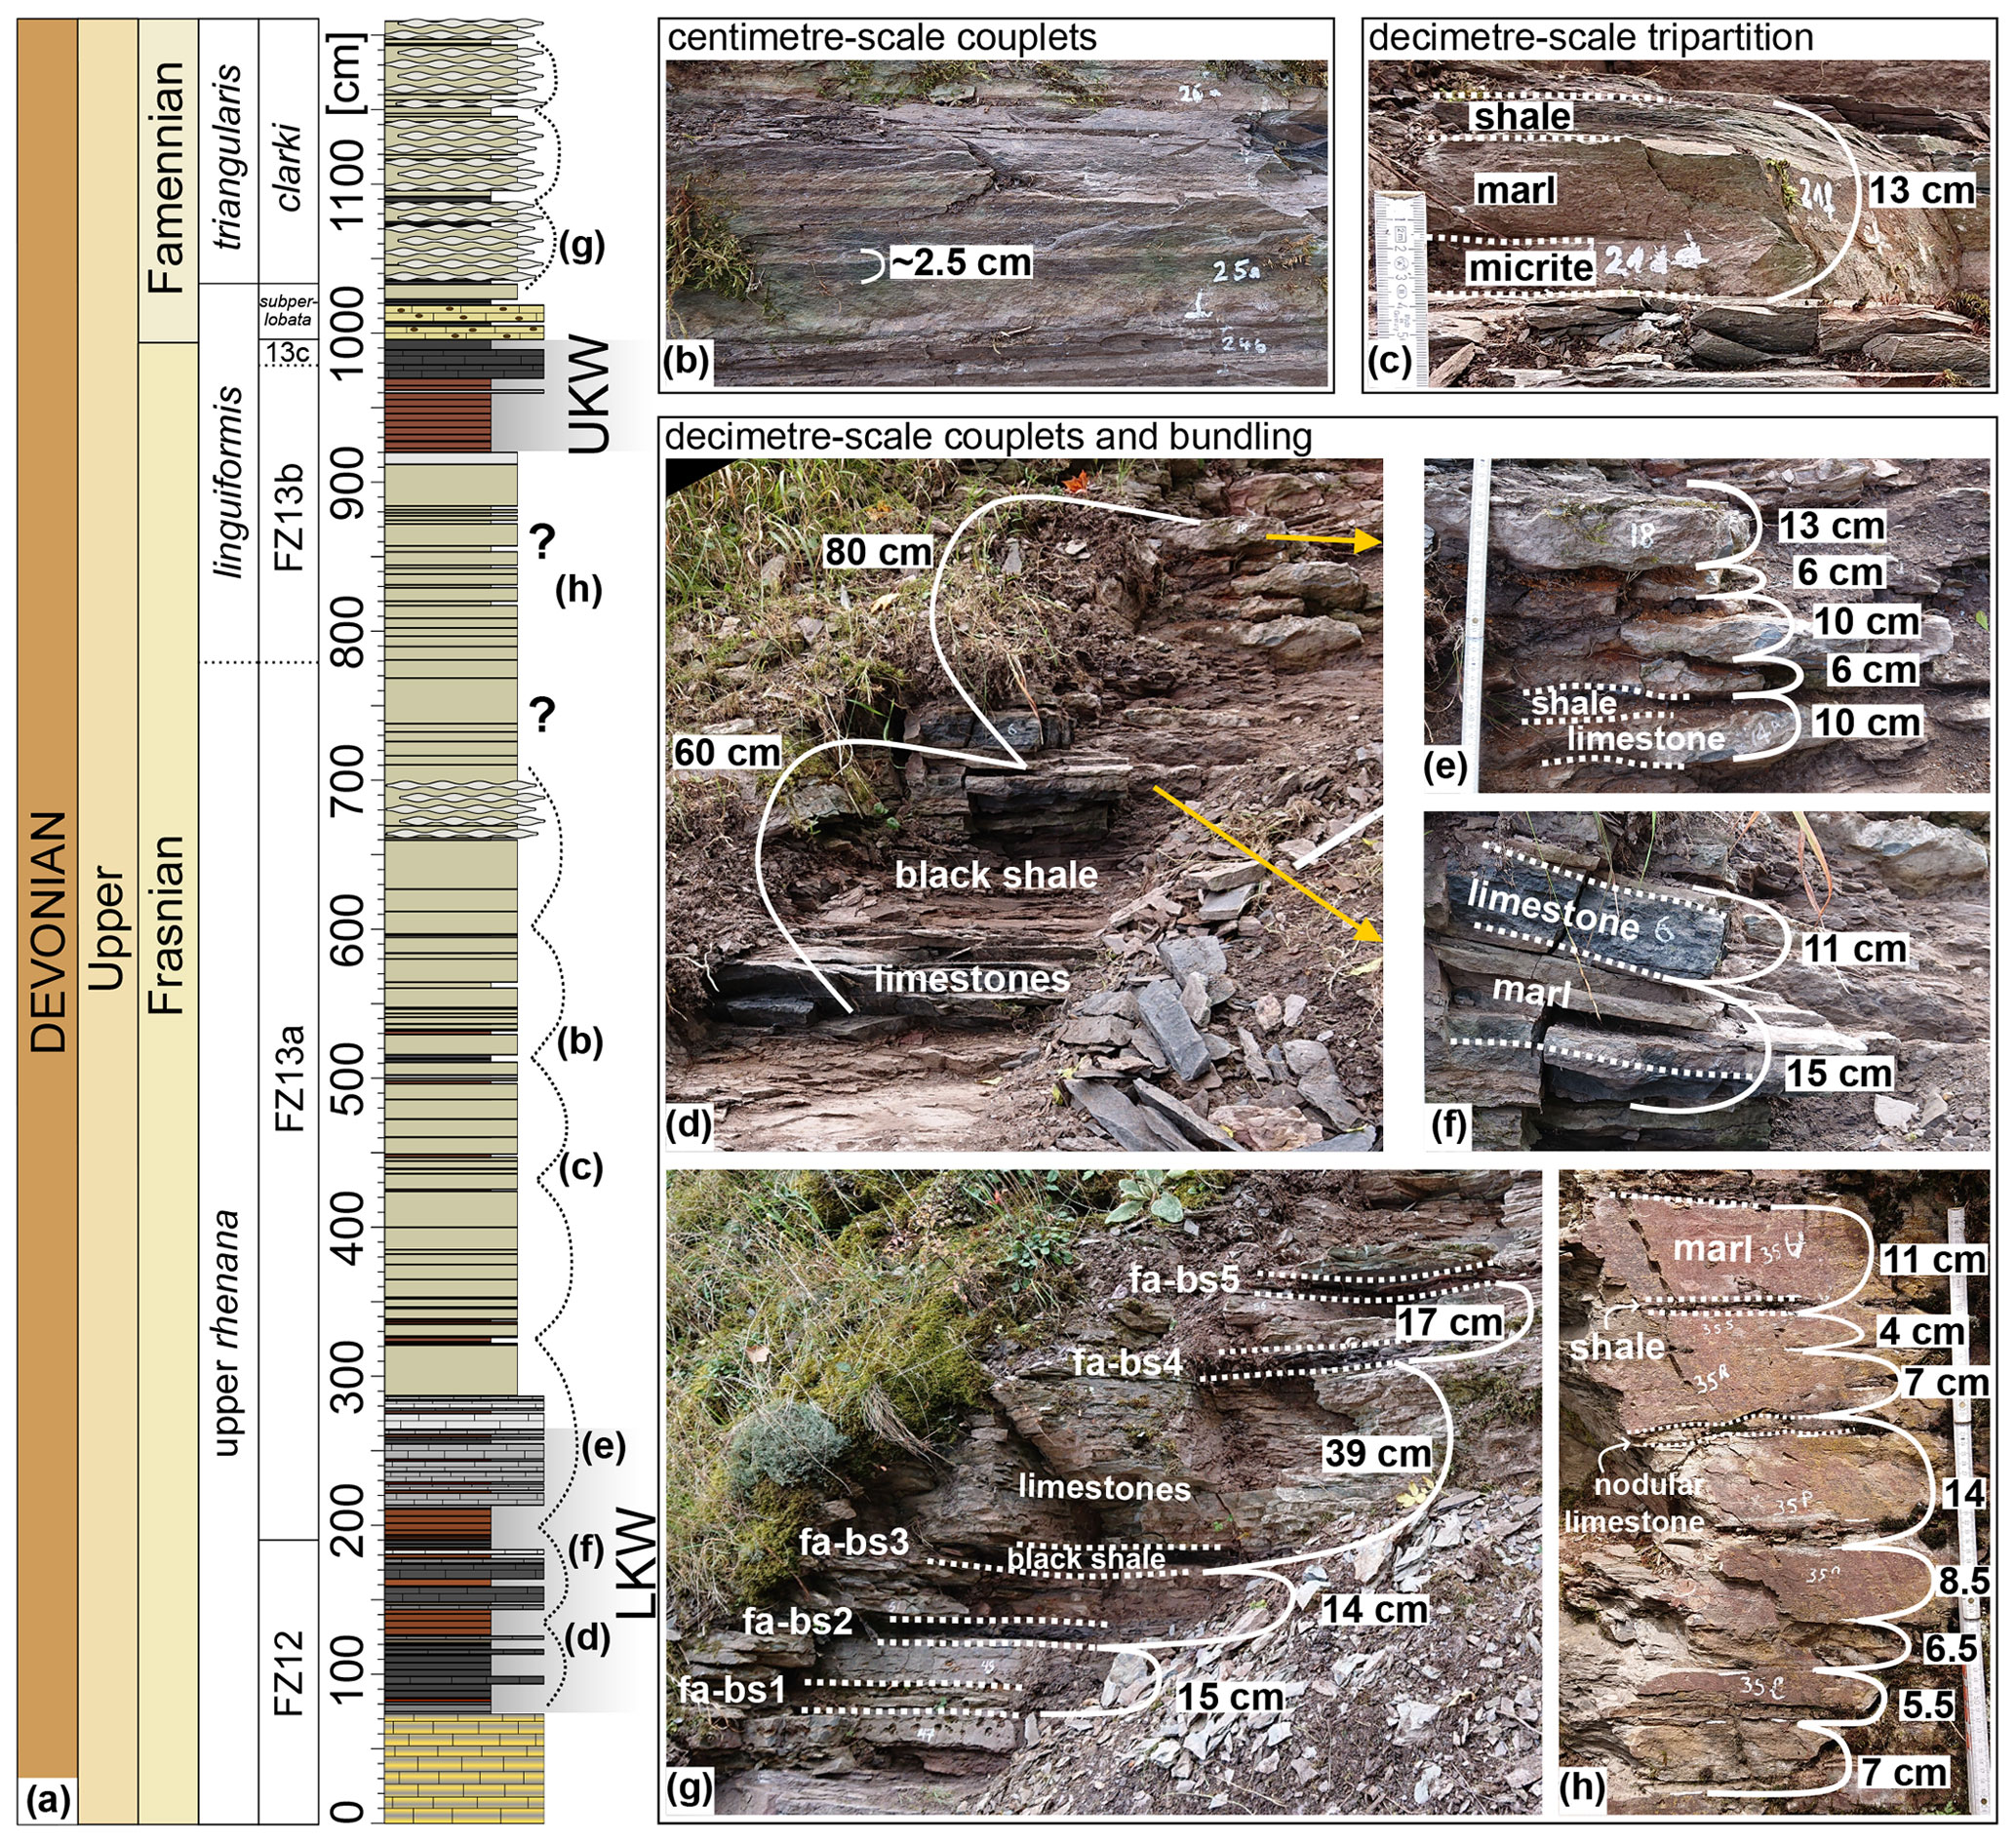
Figure 4Rhythmic lithologies observed in the Winsenberg section. (a) Log with locations of photos (b)–(h) marked. Visual interpretations of bundles are drawn with dotted lines. (b) Centimetre-scale light–dark carbonate-rich and shale-rich couplets. Inter-Kellwasser interval, around 520 cm. (c) Example of a well-expressed decimetre-scale tripartition of the Winsenberg Formation (Fm), consisting of a thin unit of micrite, a thick unit of marl, and a thin unit of shale. Inter-Kellwasser interval, around 440 cm. (d) Sub-metre-scale bundling of limestone-rich and shale-rich intervals. Lower Kellwasser, around 70 cm. (e) Detail of photo (d) showing decimetre-scale couplets of thick limestones and thin shales. Lower Kellwasser, around 220 cm. (f) Detail of photo (d) showing decimetre-scale couplets of thick limestones and thin marls. Lower Kellwasser, around 150 cm. (g) Sub-metre-scale bundling of black shale–limestone couplets. Above Upper Kellwasser, around 1000 cm. These post-Kellwasser five black shales occur in several sections in the Rhenish Massif and are labelled fa-bs 1–5 (Gereke, 2007). (h) Interval that lacks clear shale bundling but shows bundling through marl thickness. Couplets of thick marl and thin shale, with intermittent thin nodular limestone beds. Below the Upper Kellwasser, around 820 cm.
The TiO2 Al2O3 ratio is interpreted as a riverine input signal. Ti is associated with the coarser mineral fraction and Al with the finer clay fraction, and therefore, most Ti is expected to reach the basin not by dust but through riverine transport (Calvert and Pedersen, 2007), where it was further distributed by long-distance currents. Since the Winsenberg roadcut was far from the coast and the influence of local drainage systems, potential coastal differences in the siliciclastic provenance were likely homogenized by intra-basinal transport. Piecha (1993) found no evidence for aeolian silt transport. Both Ti and Al are considered diagenetically stable (Wintsch and Kvale, 1994; Young and Nesbitt, 1998). Their changing ratios are therefore assumed to reflect a primary signal. Furthermore, using a ratio of detrital elements, such as TiO2 Al2O3, we avoid tracking distortions that arose from early differential diagenesis (Munnecke and Samtleben, 1996). Detrital elements bound to clay minerals are not mobilized during early diagenetic carbonate dissolution and reprecipitation (Nohl et al., 2021). Using a ratio, changes due to enrichment or dilution as a result of this carbonate dissolution and reprecipitation are accounted for (Westphal et al., 2010; Nohl et al., 2021). This is especially important in cyclostratigraphic studies, as differential diagenesis can produce limestone–marl alternations that can look similar to astronomically forced cyclic successions (Westphal, 2006; Nohl et al., 2020). The different TiO2 Al2O3 ratios in limestones, marls, and clays in the studied section point to a primary signal that can be attributed to environmental changes, regardless of subsequent differential diagenesis (Fig. C6; see also Nohl et al., 2021).
K2O Al2O3 is interpreted as a chemical weathering signal. Both K and Al are associated with clays, but K is leached more readily than Al and lost from the sediment, so a lower K2O Al2O3 is assumed to reflect more intense chemical weathering conditions (Nesbitt et al., 1980; Clift et al., 2014; Hu et al., 2016). K is much less diagenetically stable than Ti and Al, as its content can increase in shales with depth due to diagenetic illitization of smectite (Wintsch and Kvale, 1994). However, its similarity to the other detrital elements suggests that this process is not significant in this section (Fig. C3).
3.5 X-ray diffraction
Chemical weathering leads to the formation of secondary clay minerals from primary minerals. To determine whether changes in the K2O Al2O3 chemical weathering proxy correlate to changes in clay mineral content, the mineralogy of four samples was analysed using qualitative X-ray diffraction (XRD). The powdered sample was smeared onto a glass sample holder with a rough texture. The samples were then measured on a Philips X'Pert Pro Diffractometer at the University of Münster, Germany. This instrument is equipped with a Cu anode (1.5405 Å) and was operated with the following settings: 45 kV voltage, 40 mA current, 0.02° θ step size, 1 s per measurement step, 3–50° 2θ measuring range, 30 runs per sample, and no sample rotation. The data were analysed with the X'Pert proprietary software and in R, using the powdR package (Butler and Hillier, 2021). This methodology permits only the general identification of clay types and their relative abundances.
3.6 Spectral analysis
Spectral analysis and the subsequent construction of a floating astronomical timescale was carried out on the pXRF-generated log10 (SiO2 CaO) record to discern potential periodicities that can be linked to Milanković cycles. Significant periodicities were identified using the multi-taper method (MTM; Thomson, 1982) with three Slepian tapers. Changes in these periodicities with depth, suggesting sedimentation rate changes, were inferred from evolutive harmonic analysis (EHA) and continuous wavelet transform (CWT) spectra. The relevant periodicities were then bandpass filtered using a Gaussian filter. Testing of the inferred amplitude modulation patterns was carried out using TimeOpt. With the exception of the wavelet analysis, for which the biwavelet package was used (Gouhier et al., 2021), all analyses were carried out using the astrochron package for R (Meyers, 2014). Outliers were removed from the TiO2 Al2O3 and K2O Al2O3 records using astrochron's boxplot-algorithm-based trim function, as outliers can impede spectral analysis (carried out in the time domain for these records). This was not necessary for the SiO2 CaO record due to the log10 transformation. All records were linearly detrended.
4.1 Identification of carbon isotope excursions
Both δ13Ccarb and δ13Corg records show positive excursions near the LKW and the UKW horizons, as is typical of Euramerican Kellwasser sections (Joachimski et al., 2002; Carmichael et al., 2019, and references therein). The magnitudes of these excursions are +2 ‰ δ13Corg for both LKW and UKW and +2 ‰ and +4 ‰ δ13Ccarb for the LKW and UKW, respectively (Fig. 3c, d). These values match other observed positive excursions in both δ13Ccarb and δ13Corg, which range between +1 ‰ and +4 ‰ (Joachimski and Buggisch, 1993; Joachimski et al., 2001; Bond et al., 2004; Hartkopf-Fröder et al., 2007; Kaiho et al., 2013; Ma et al., 2016; De Vleeschouwer et al., 2017; Whalen et al., 2017; Song et al., 2017). Both carbon isotope excursions extend well above the top of the LKW and UKW horizons, as has been observed in several previous records (Joachimski and Buggisch, 1993; Song et al., 2017; Da Silva et al., 2020). After the rapid carbon cycle perturbation that caused the LKW and UKW excursions, the return to background conditions was apparently gradual.
The sharp peak of +4 ‰ δ13Ccarb within the UKW (at ∼9.65 m) corresponds to a lithology change from shale to limestone (Fig. 3c). These very high values could be related to the export of shallow-water carbonates to the site, which often have a heavier δ13Ccarb value than deep-water (local) carbonates (Swart, 2008). However, the carbonate in the two corresponding limestone beds is purely micritic, and there are almost no bioclasts in the finely laminated limestone (Piecha, 1993, pl. 21; Fig. 4; Gereke, 2007, pl. 1; Figs. 1–2), so this interpretation cannot be proven by the presence of shallow shelf faunal assemblages. There is no evidence for scouring at the base or grading within the beds either. An alternative explanation is that this sharp shift represents diagenetic alteration, where the shift in δ13Ccarb values is exacerbated by early diagenetic movement of carbonate. There is a δ13Corg peak in between the LKW and UKW horizons around 4.6 m, based on two data points (Fig. 3d). This ca. +2 ‰ excursion does not correspond to lithology changes, and it is unclear whether this peak represents a diagenetic feature or a real environmental signal. Minor/short intra-Kellwasser positive excursions have previously been observed in selected sections (e.g. Vogelsberg in Thuringia (Germany) and Coumiac (southern France); Joachimski and Buggisch, 1993) but may represent local features. Considering the high burial temperatures the deposits experienced (Königshof, 1992), oxygen isotopes likely underwent diagenetic alteration and were therefore not used in this study. Carbon isotopes are generally more stable than oxygen isotopes and are therefore expected to have remained relatively unaltered (Veizer et al., 1999). This is supported by the lack of correlation between bulk CaCO3 oxygen and carbon isotopes (R2=0.002; see carbonate isotope data under the “Data availability” section). Some alteration of the organic carbon isotopes cannot be excluded, however (see also Joachimski, 1997). The studied rocks crossed the oil window (Königshof, 1992), which poses limitations to the δ13Corg palaeoenvironmental interpretation and long-range correlation potential.
4.2 Cyclostratigraphic interpretation and tuning
4.2.1 Lithological variations and rhythmicity within the section
The Winsenberg lithologies exhibit hierarchical rhythmicity, including bundling that is typical of eccentricity-modulated precession (Fig. 4a). On the smallest scale, centimetre-thick light–dark alternations are visible within individual beds (Fig. 4b). Rhythmic centimetre-scale alternations are also present within the Usseln Limestone below the LKW. As these are likely millennial-scale in nature and not sampled at an adequate resolution, they will not be discussed further.
On a decimetre-scale, there are the tripartitions of the Winsenberg Formation/Adorf-Bänderschiefer. In their well-developed facies, these consist of thin micritic limestone, thick marl, and a thin shale, sometimes dark in colour (Fig. 4c; compare Piecha, 1993). Based on this thickness distribution, we interpret these lithological cycles as dilution cycles, whereby a more or less steady carbonate flux is diluted by a more variable (and possibly climate-driven) clay flux. The lithologic tripartitions are easily identified by their dark shale component (Fig. 4a). These dark shales form bundles of 2–3 (not 5–6). If the triplets represent precession cycles, then they are formed via a threshold climate response, similar to the Neogene sapropels in the Mediterranean (e.g. Lourens et al., 1992). In their less well-developed facies, the Winsenberg rocks consist mostly of marl, with no clear, or very thin, limestone and shale. In the log, these intervals lack thin dark shales and alternate with well-expressed intervals (Fig. 4a). The interval below the UKW is poorly expressed in its entirety (Fig. 4a; ca. 650–900 cm). The shales here are thin, and the limestone is often missing, save for some thin nodular intervals, making it more of a bipartition between marl and shale (Fig. 4h). Above the UKW, the Winsenberg Formation consists of centimetre-scale nodular limestone and marl alternations, instead of the tripartition (Fig. A1f), but this may be a diagenetic feature. These limestones and marls are punctuated by five thin black shales (fa-bs 1–5), in bundles of 3 and 2, respectively (Fig. 4g), similar to the dark shales in between the LKW and UKW. These five shales are regionally traceable (Gereke, 2007), which lends credence to an allogenic forcing for their deposition.
In the Kellwasser intervals, bipartitions of dark shale and limestone are observed. These are further grouped into bundles of 3–10 couplets (Fig. 4d–f). There are 10 couplets only that occur together in the uppermost part of the LKW, and there might be a minor repetition here due to a small fault (Gereke, 2007). The bundles are separated by homogenous shaly intervals that lack limestones. This grouping of bundles is best observed in the thicker LKW, as the UKW only consists of one such grouping (Fig. 4a). Similar to the shale bundles, these limestone bundles may represent precession cycles controlled by a threshold process.
The bundles of shales and limestones, separated by a more homogenous interval consisting of either marls or shales, may represent 100 kyr eccentricity that acts as a modulator on precession (Fig. 4a, d, g). These cycles are ca. 40–80 cm thick. The lithological succession is assumed to have preserved a primary environmental signal supported by the corresponding geochemical record of diagenetically stable TiO2 Al2O3 ratios (Fig. C5). The study interval lies above the last turbiditic Flinz limestones, thick-bedded micritic limestones (Adorf limestone with goniatites; Becker et al., 2016b), and below an assumed tuffite (Piecha, 1993). These would represent stochastic depositional events interrupting the rhythmic sedimentation.
4.2.2 Astrochronology
The astronomical time calibration of the Winsenberg section was carried out on the log(SiO2 CaO) series (Fig. 5a, b). The MTM analysis of the log(SiO2 CaO) record in the depth domain does not show a frequency distribution that can be readily interpreted as a Milanković imprint (Fig. D1). If a Milanković signature were present, it is likely distorted by changes in apparent sedimentation rate and/or differential compaction. Sedimentation rate changes and/or differential compaction are expected, given the sedimentological changes throughout the section. The log(SiO2 CaO) evolutive harmonic analysis (EHA) and continuous wavelet transform (CWT) spectra look similar and both reveal shifts in the dominant periodicities throughout the section (Fig. 5c, d). These shifts approximately coincide with changes in lithology, from shale and limestone to marl-dominated lithology, so it is plausible that these represent changes in the accumulation rate (Fig. 5b). To correct for the changing sedimentation rate, the record was not split up according to lithological changes, as the resulting segments would be too short to assess aspects such as amplitude modulation. Instead, we opted for tracking accumulation rate changes throughout the record by manually tracing the clearest wavelength (10–25 cm) in the EHA spectrum (Fig. 5c). This approach can be considered to be an evolutive minimal tuning approach. Frequency tracing was straightforward in the middle part of the record but more complicated at the edges. The sharp peaks at the UKW especially distort the spectrum (Fig. 5b, c). The traced interpretation is less certain here and at the edges. Although the tracing itself was carried out on the EHA spectrum, observed shifts in the CWT spectrum were used as reference, as its signal is clearer in the lowermost and uppermost part of the record (Fig. 5c, d). To correct for accumulation rate changes, it is necessary to assign a set periodicity to the traced frequency. If one were to make no assumptions about what this periodicity might be, it could be set to an arbitrary value and converted to a “time domain”. However, there are several indications that the selected periodicity may reflect a precession imprint: (1) in the EHA plot, it shows the characteristic braiding pattern that arises from the interaction of the different precessional components (Fig. 5c) (Meyers et al., 2012); (2) the frequency range it occupies fits with the observed bundling in the lithology (Fig. 5a, b); and (3) there is a weak wavelength around 1 m that may correspond to short eccentricity in this interpretation (easier to observe in the CWT plot; Fig. 5d). The traced frequency was converted to changes in apparent sedimentation rate (accumulation rate), by assigning it to 19 kyr precession (Fig. 5e). A duration of 19 kyr was chosen as an approximate average of all precessional components, based on Waltham (2015), at 372 Ma. This step results in reconstructed sedimentation rates between 0.65 and 1.22 cm kyr−1 (Fig. 5e), which can be considered plausible for deep-water distal shales and carbonates. Finally, the accumulation rates were used to transfer all elemental proxy records, as well as the carbon isotope records, from the depth to the time domain (Fig. 6).
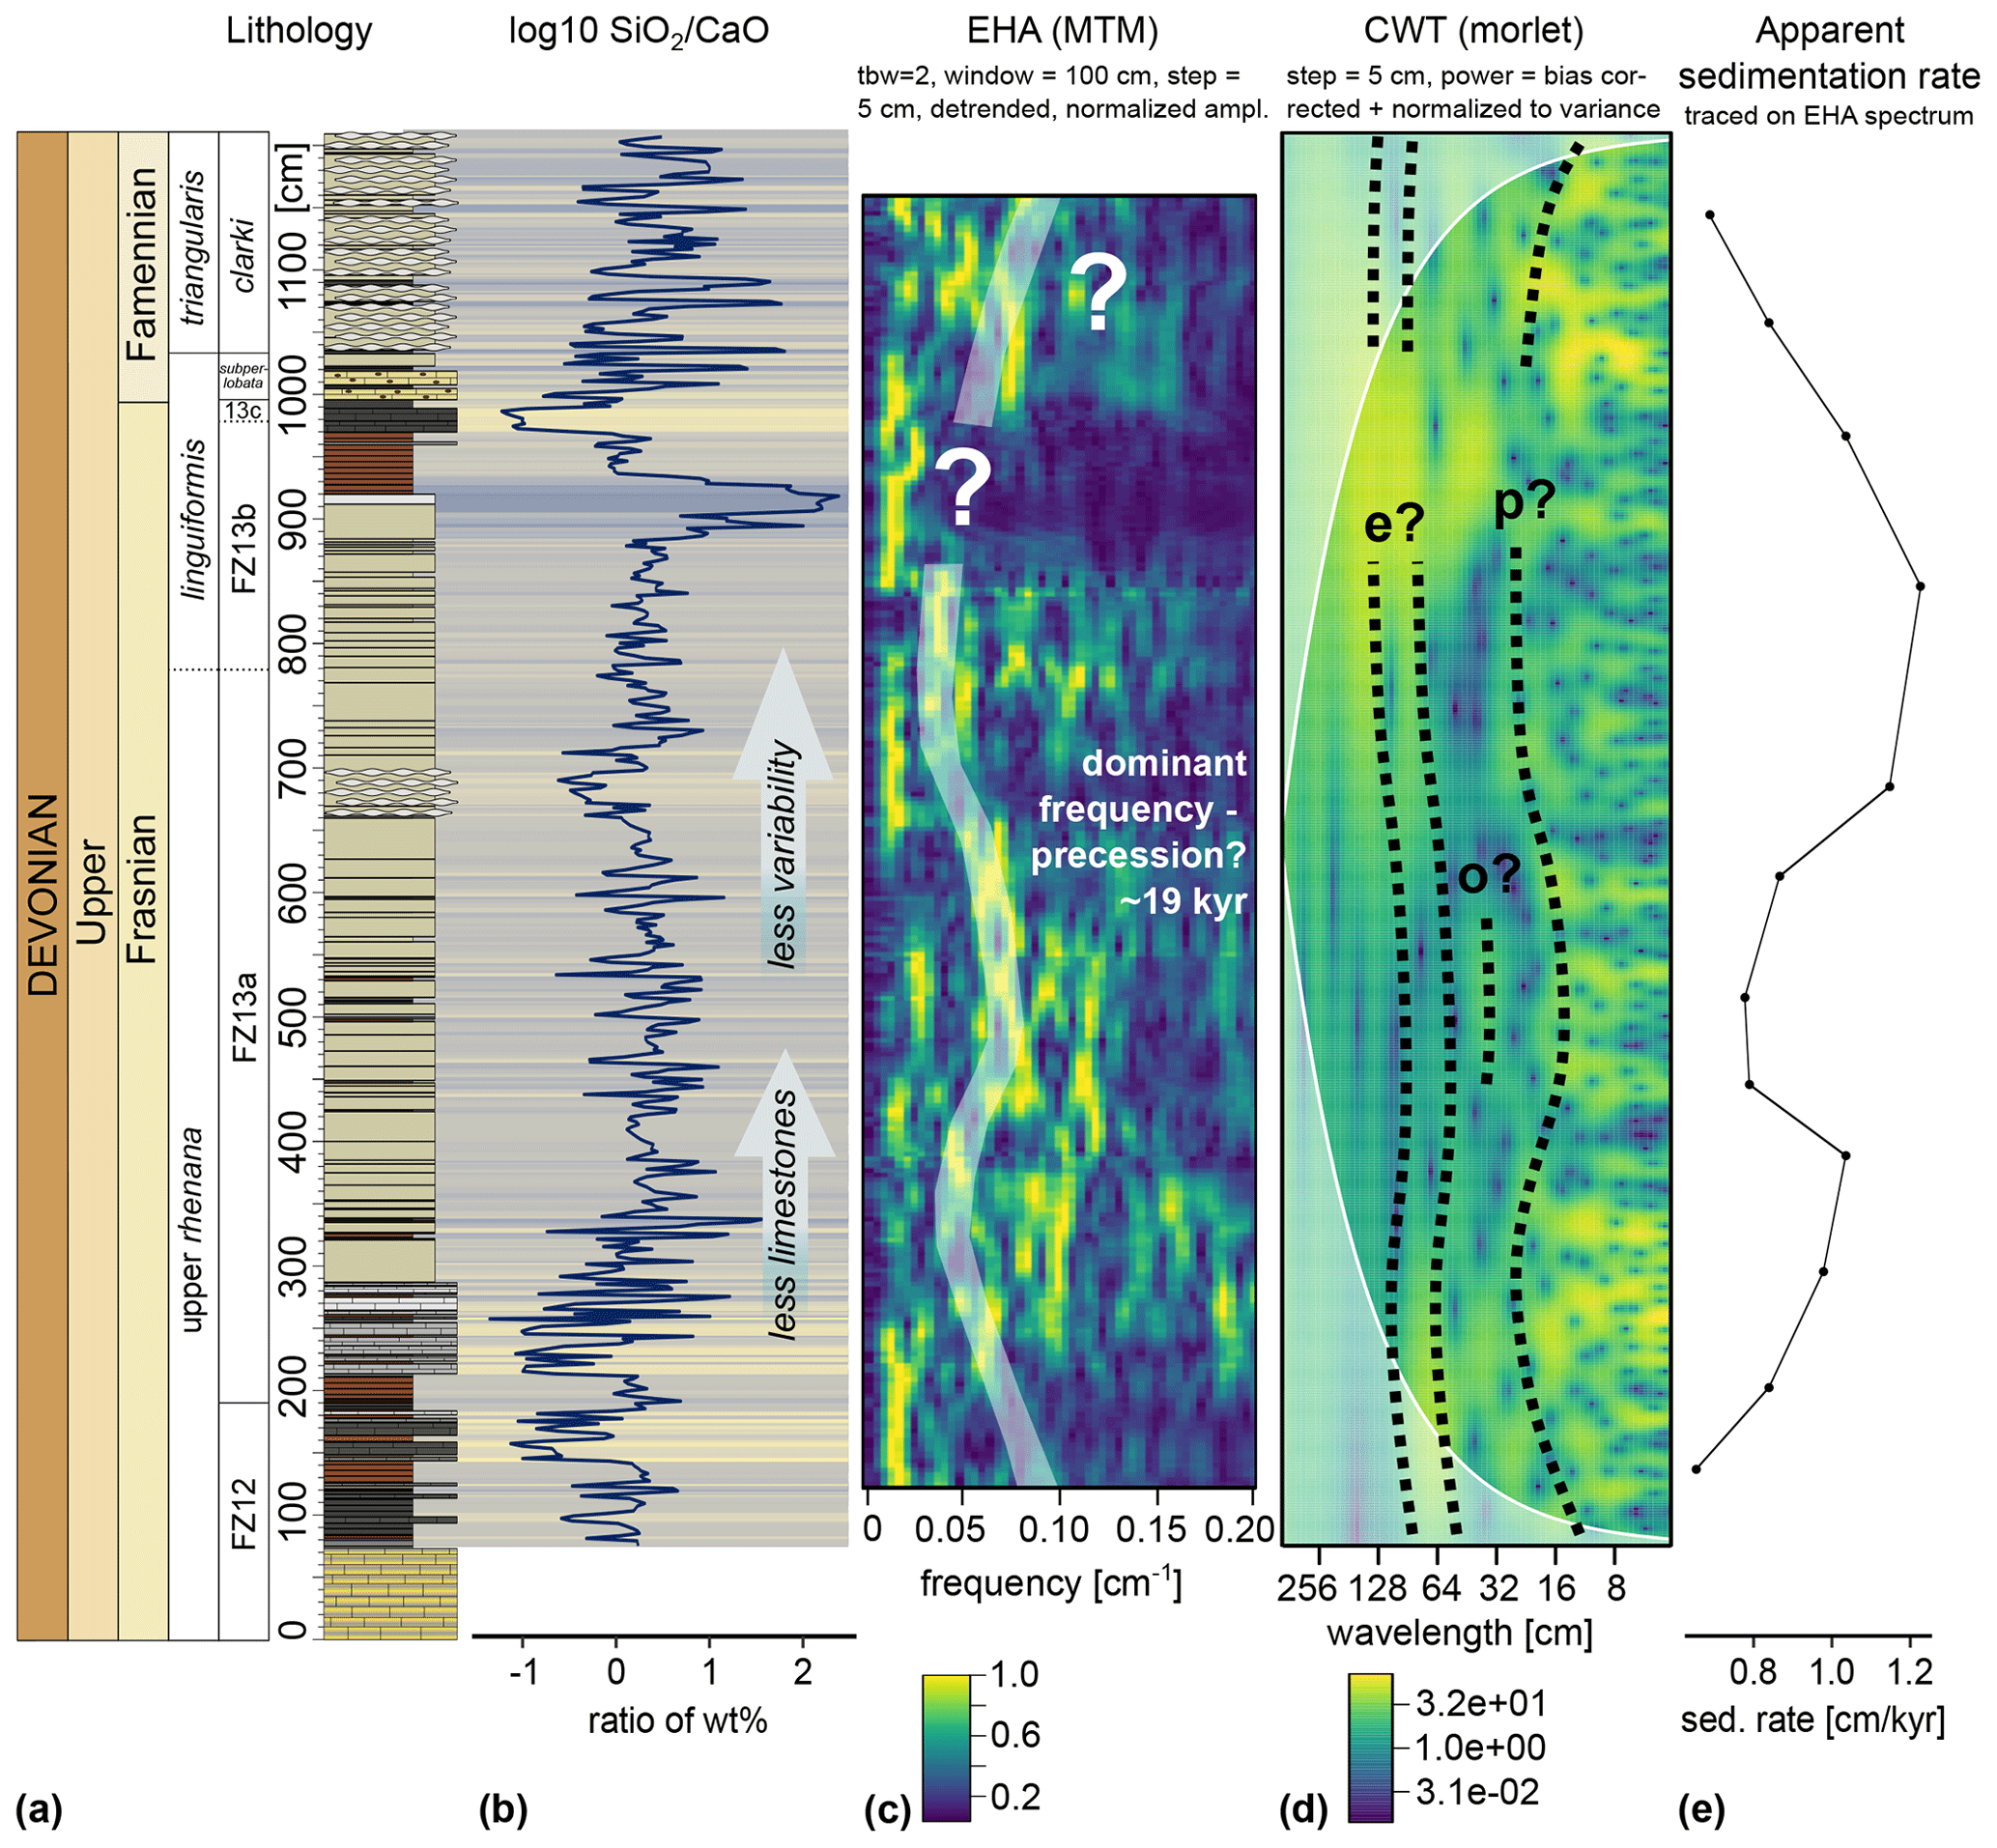
Figure 5Depth domain analysis of the log(SiO2 CaO) signal. (a) Conodont biostratigraphy and lithology of the section. (b) log(SiO2 CaO) record. The background is colour coded according to its values, with dark blue for high log(SiO2 CaO) and beige for low log(SiO2 CaO). This emphasizes the correlation between the log(SiO2 CaO) record and the lithology. Gradual lithological changes (less limestone content and less overall variability) are marked with arrows. (c) Evolutive harmonic analysis (EHA) plot of the log(SiO2 CaO) record, suggesting sedimentation changes throughout the record. The frequency that was easiest to identify and tentatively interpreted as precession is marked with a translucent white band. This band was traced to generate Fig. 5e. (d) Continuous wavelet transform (CWT) spectra of the log(SiO2 CaO) record, showing similar but not identical changes to the EHA record. Interpretation of the periodicities are given, where e is for 100 kyr eccentricity, o is for obliquity, and p is for precession. (e) Sedimentation rate changes generated by tracing the frequency identified in panel (c). A version of this figure without interpretations in panels (c) and (d) is shown in Fig. D2.
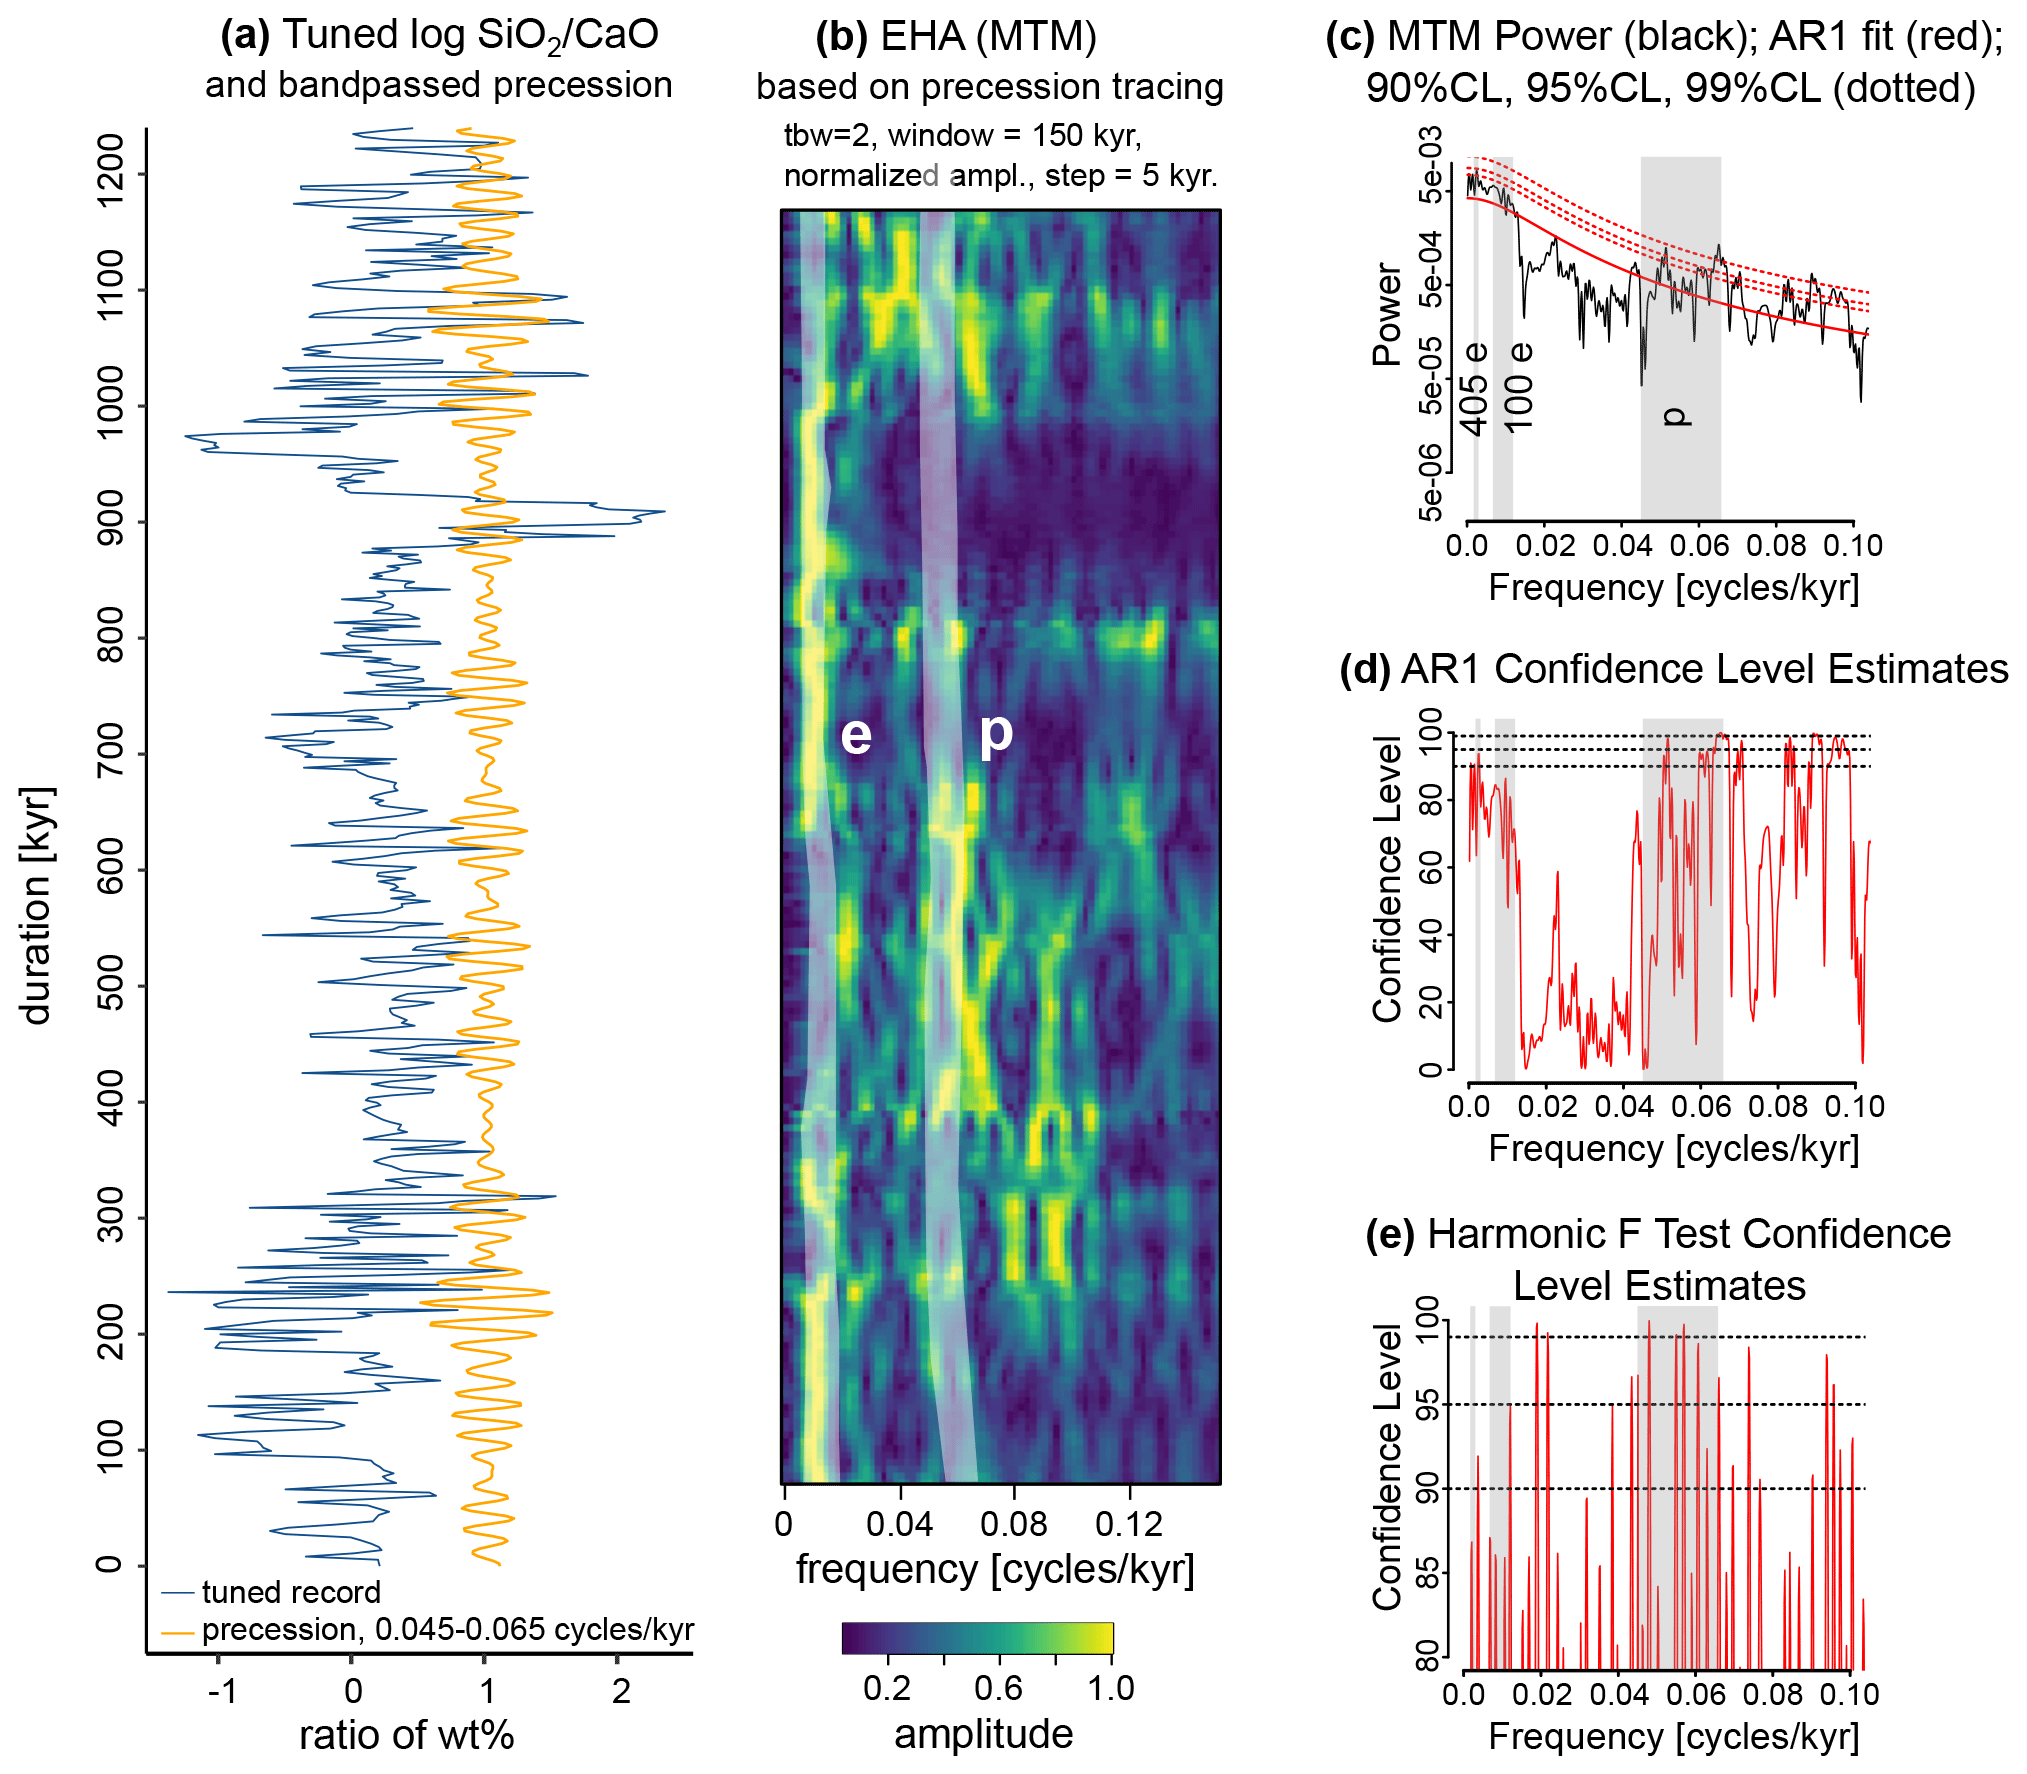
Figure 6Time domain frequency analysis. (a) log(SiO2 CaO) time series and bandpassed precession (amplitude true to scale but shifted horizontally). (b) Evolutive harmonic analysis (EHA) plot of the tuned log(SiO2 CaO) record, indicating that the frequencies present are now mostly “straightened out”; i.e. the record has been corrected for sedimentation rate changes. (c) MTM power spectrum of the tuned log(SiO2 CaO) record, with 405 kyr eccentricity, 100 kyr eccentricity, and precession frequency intervals marked in grey. (d) AR1 confidence level estimates, again with eccentricity and precession marked in grey. (e) Harmonic F test confidence estimates, again with eccentricity and precession marked in grey.
4.2.3 Time domain
MTM spectral analysis applied to the time domain shows periodicities corresponding to precession, 100 kyr eccentricity, and 405 kyr eccentricity (Fig. 6a, b). Not all peaks are significant at the 90 % confidence level (Fig. 6c–e). Moreover, the 90 %–95 % confidence level (CL) boundary that is widely applied in cyclostratigraphy does not suffice to rule out false positives, according to rigorous statistical analysis (Vaughan et al., 2011; Smith, 2020; Weedon, 2022; Smith, 2023). We therefore rely on other lines of evidence to support our cyclostratigraphic interpretation. When the suspected astronomical components are bandpass filtered, the expected amplitude modulation patterns are mostly observed for all three cyclicities (Fig. 7a, b). Moreover, the bandpass filtered precession and 100 kyr eccentricity amplitude modulation pattern corresponds to the bundling observed in the rock record (Fig. 7a, b), including the regionally traceable thin black shales above the UKW (fa-bs 1 to 5). The fact that an astronomical signature is found in these regionally extensive beds supports an allogenic origin of the signal.
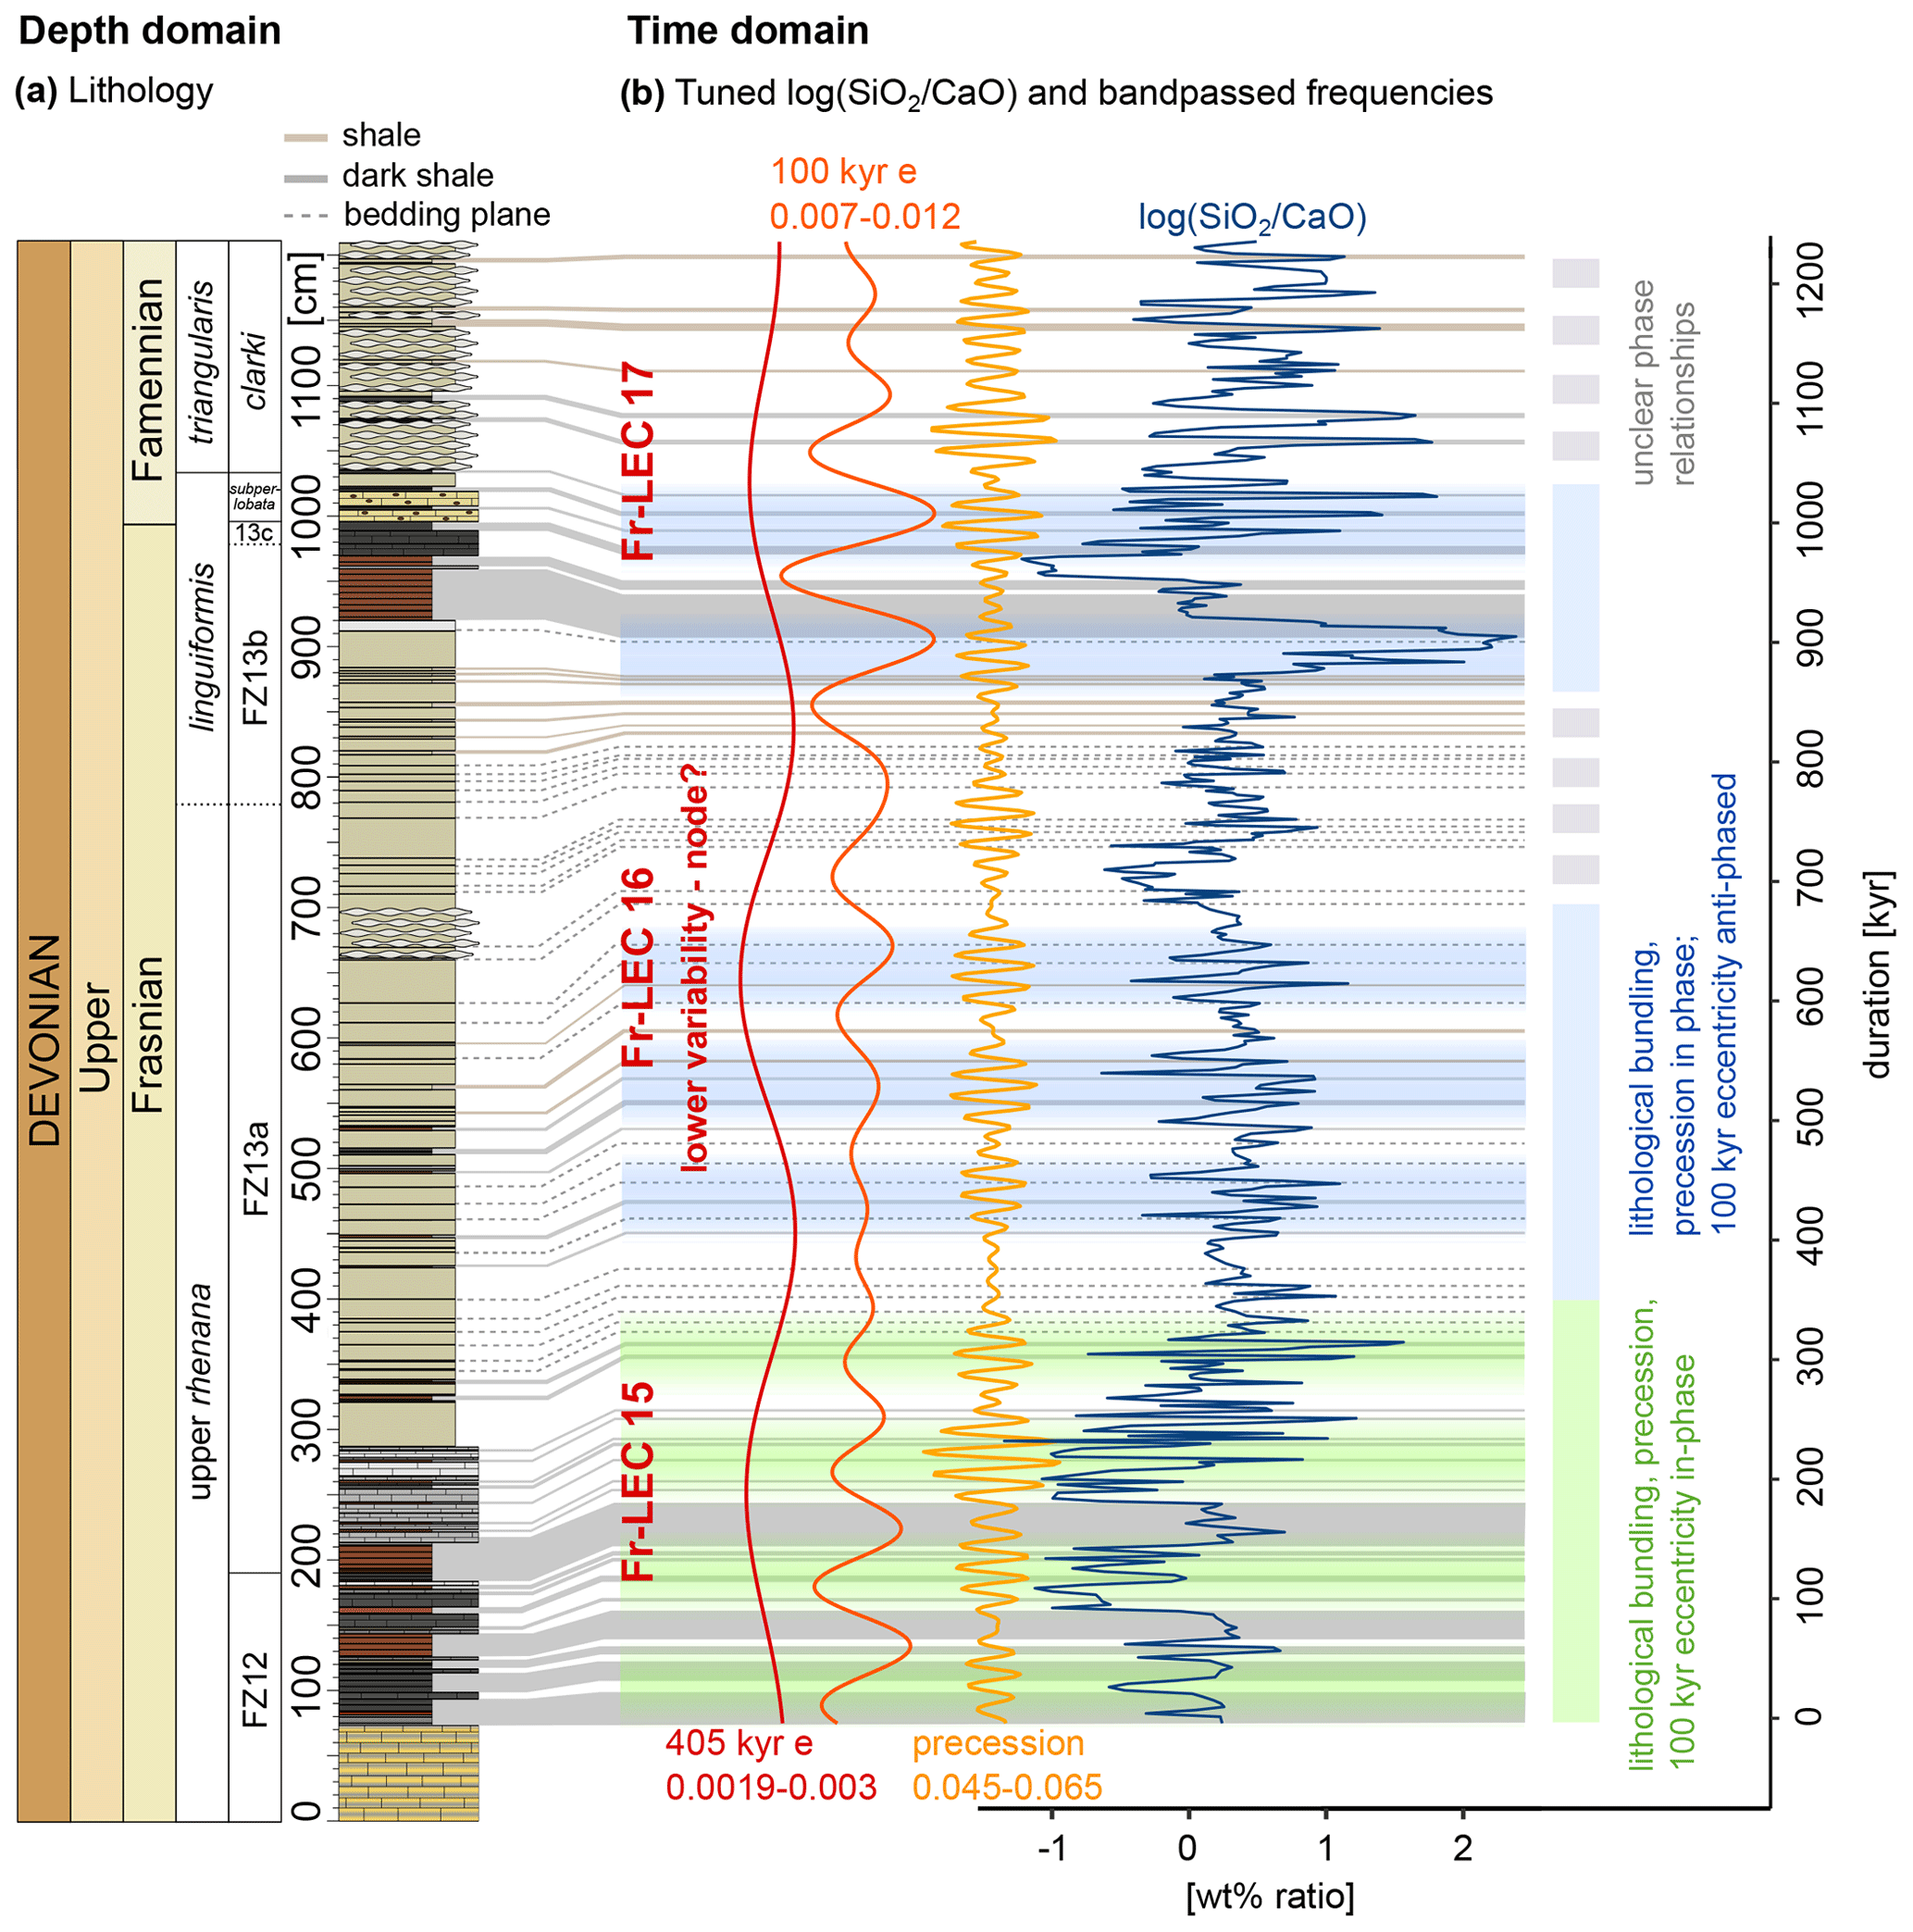
Figure 7(a) Depth domain biostratigraphy and lithology, correlated to the time domain are all shales, dark shales, and bedding planes. (b) log(SiO2 CaO) time series and bandpassed 405 kyr eccentricity, 100 kyr eccentricity, and precession. Bandpass amplitudes are true to scale but shifted relative to the log(SiO2 CaO) record. The three identified 405 kyr cycles that span the Kellwasser Crisis are marked Fr-LEC 15 to 17 (Fr-LEC is for Frasnian long eccentricity cycle). Intervals where there is a clear correlation between bundling observed in the lithology, the log(SiO2 CaO) record, the precession filter, and the 100 kyr eccentricity filter are marked in green and blue. Intervals where this correlation is less clear and the astrochronology is less certain are marked in grey.
Not all stratigraphic intervals of the record are constrained equally well. Our confidence in the proposed astronomical interpretation is highest in the bottom half of the studied record (1–6 m; Fig. 7a), although we cannot exclude edge effects in the lowermost part. In this lower half, clear cycles in both lithology (bundling of shales and limestones and grouping of these bundles) and elemental ratios can be observed in the depth domain (Fig. 7b). Further up the section, the traced frequency becomes obscured in the interval just below the UKW, the UKW horizon itself, and just above. This uncertainty results in a less robust astrochronology and phase relationship between lithological bundling and bandpassed eccentricity and precession in the upper half of the section (Fig. 7b). Especially within the UKW black shale, the astronomical imprint is more difficult to discern due to the sharp shifts in both lithology and the elemental ratios.
Power in the obliquity band is only detected in the tuned K2O Al2O3 record (Fig. 8a–c). When the obliquity frequency is bandpassed; however, the log(SiO2 CaO) and TiO2 Al2O3 records show a similar, but weaker, signal compared to K2O Al2O3 (Fig. 8d–f). The Hilbert transform of the K2O Al2O3 obliquity signal exhibits a 165 kyr periodicity (Fig. 8f). The similarity of this amplitude modulation to the expected stable 173 kyr obliquity modulation lends further support to the validity of this astronomical floating timescale. Other studies that found an obliquity signal in records of similar age and palaeolatitude detected a strong signal in δ13C records, not in XRF records (Da Silva et al., 2020), or only weakly in magnetic susceptibility records (De Vleeschouwer et al., 2017). This difference is likely related to the global nature of the carbon cycle (and, by extension, the K2O Al2O3 weathering proxy; see also Sect. 4.3.3). In other words, while monsoonal climate dynamics in the Winsenberg hinterland were chiefly determined by precession-dominated local insolation changes, weathering intensity in the same hinterland was likely more sensitive to obliquity-sensitive variations in the global carbon cycle (e.g. pCO2-driven temperature variations). The lack of any quasi-rhythmic signal in the majority of this study's δ13C record (Fig. 3c, d) suggests some degree of diagenetic alteration, albeit (strongly) negative values are absent. This lack of rhythmicity is especially peculiar, considering that a rather strong obliquity imprint in a δ13C signal was obtained from a nearby Kellwasser site of Steinbruch Schmidt (Da Silva et al., 2020).
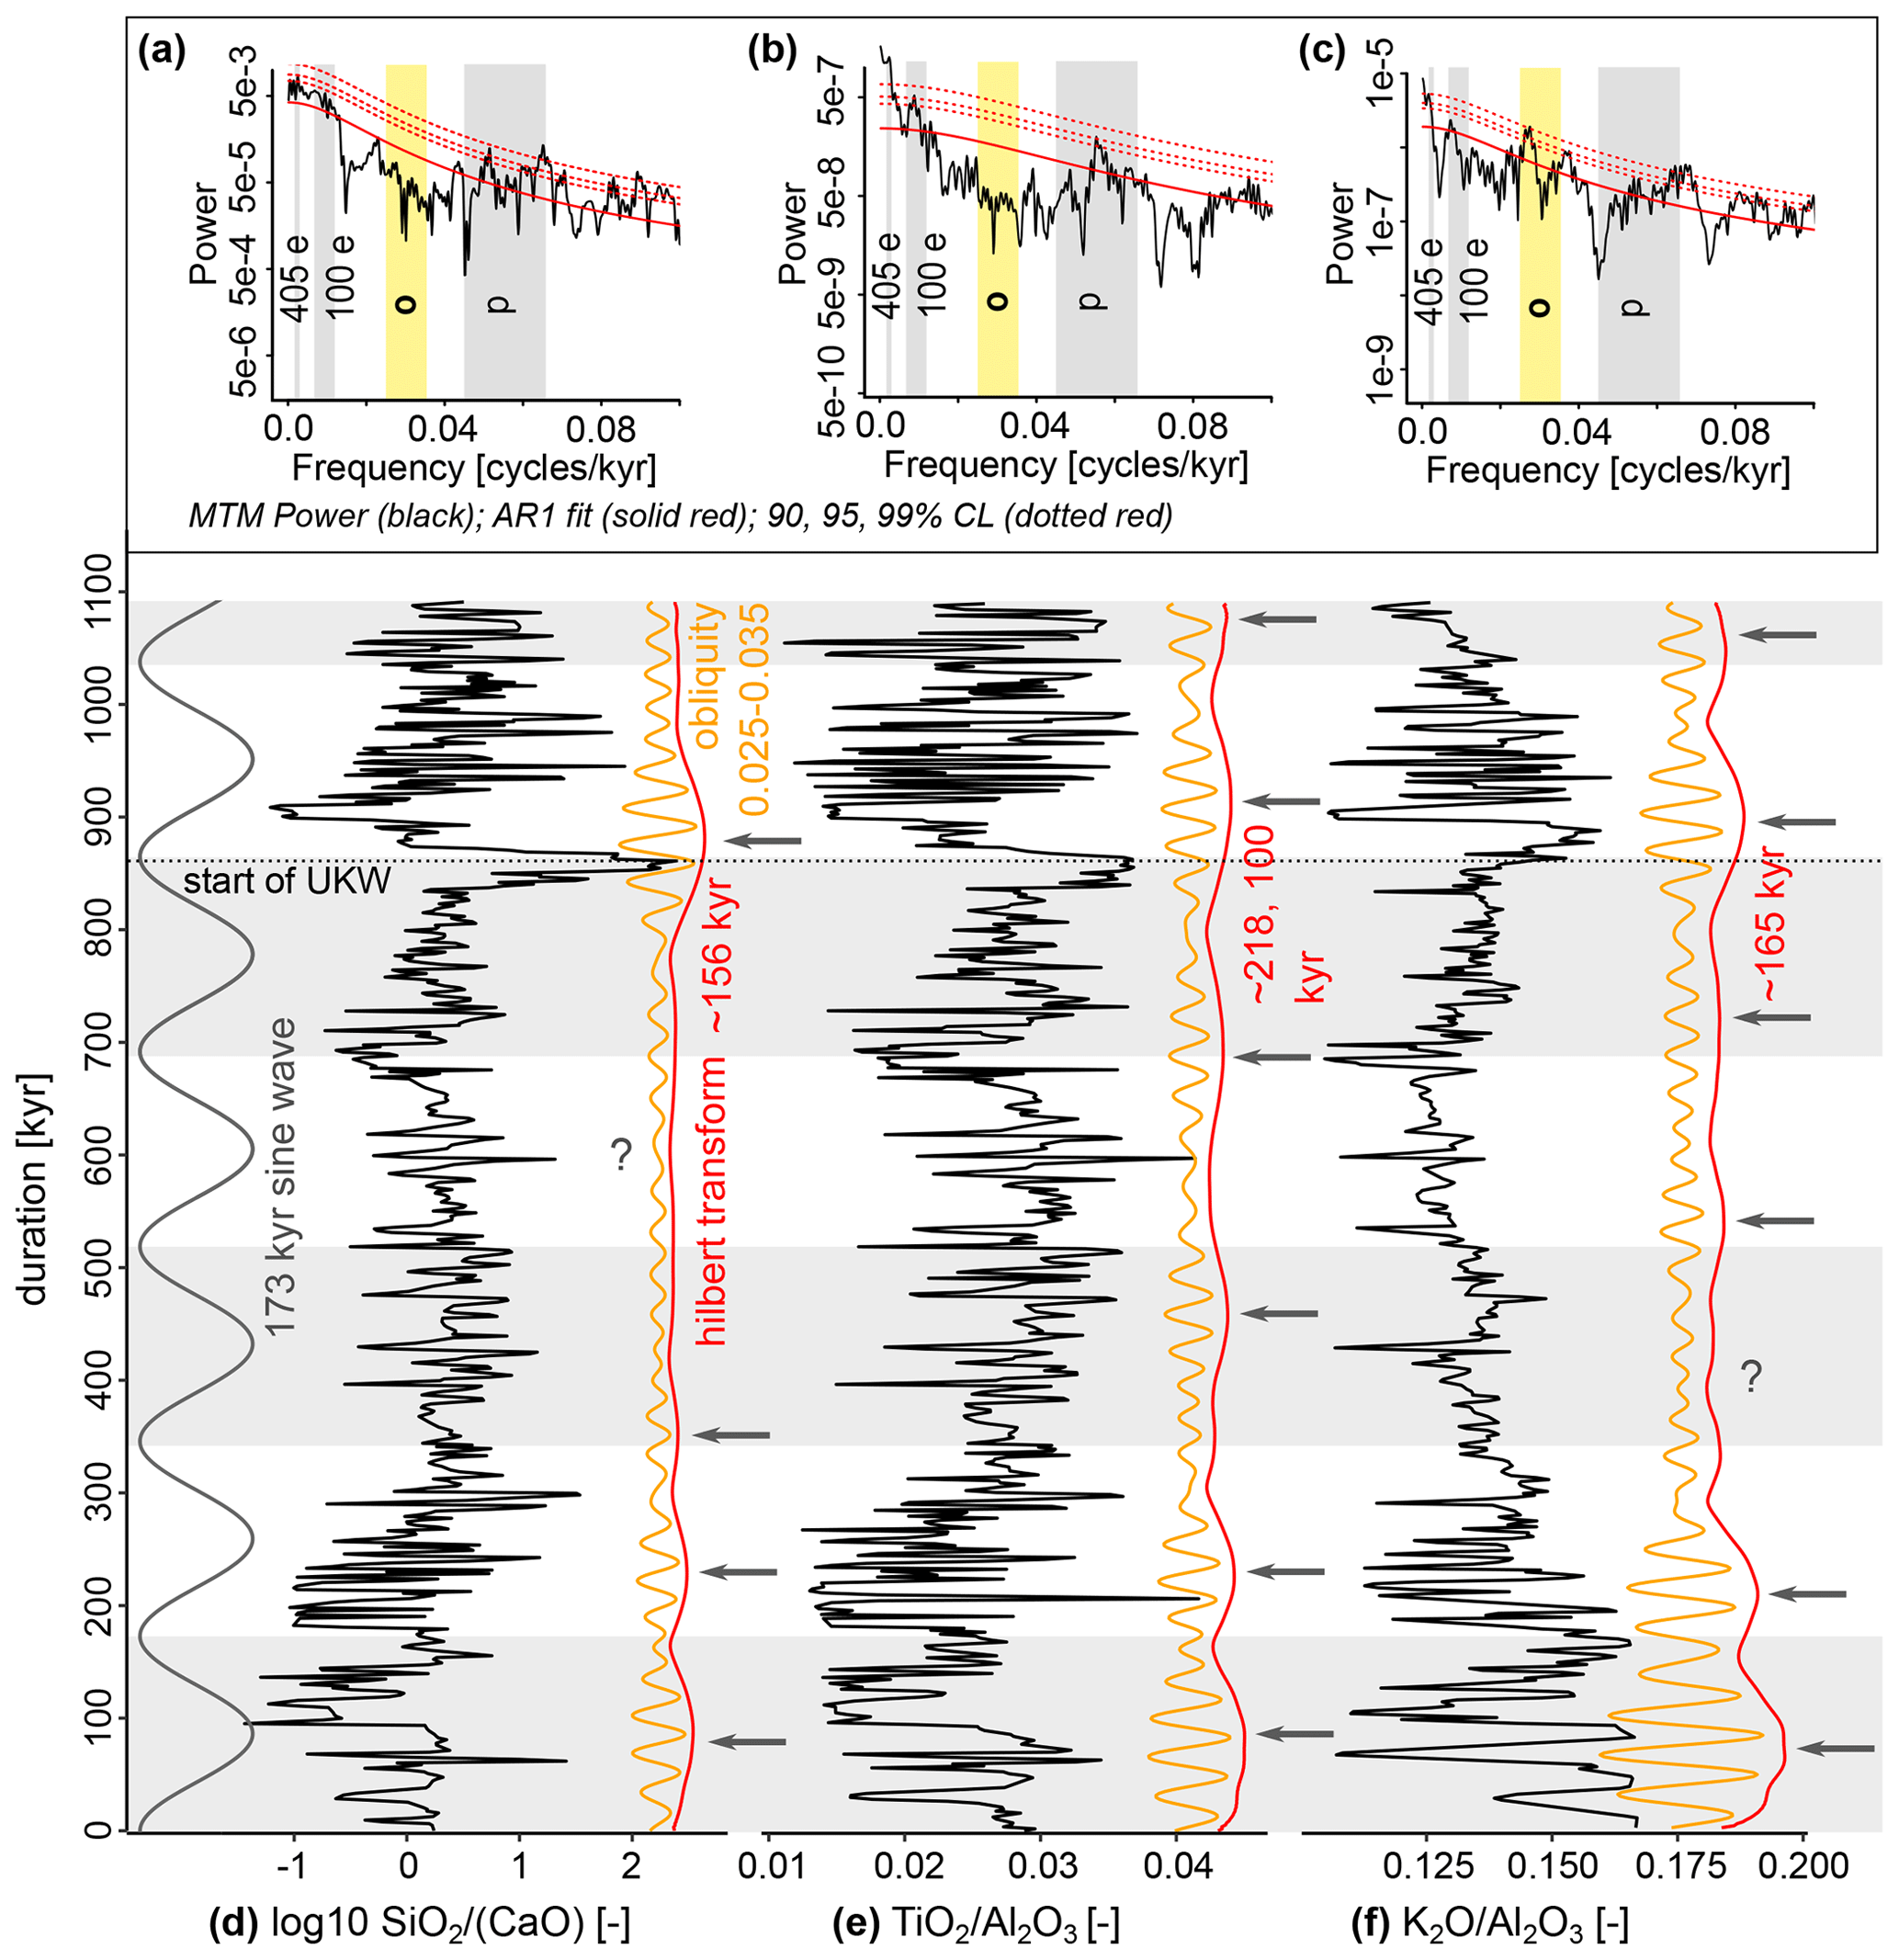
Figure 8Obliquity signals in tuned log(SiO2 CaO) (a, d), TiO2 Al2O3 (b, e), and K2O Al2O3 (c, f) records. Panels (a)–(c) show the MTM power spectrum (time–bandwidth product, tbw = 2), with the obliquity (o) interval (0.025–0.035) shaded in yellow. Other astronomical parameters (405 kyr eccentricity, 100 kyr eccentricity, and precession) are shaded in grey. Panels (d)–(f) show the respective proxy record (black), filtered obliquity (orange), and the Hilbert transform of filtered obliquity (red). MTM-inferred periodicities of this Hilbert transform are noted in red. Identified cycles are marked with grey arrows. On the left of panel (d), a 173 kyr sine wave is plotted (arbitrary x axis), and its cycles are marked with white and grey bands.
To assess the fit of the observed amplitude modulation more objectively, we employ the TimeOpt approach (Meyers, 2015). TimeOpt assesses the amplitude modulation of a range of cycles and matches the cycles with the optimal amplitude modulation fit to precession and 100 kyr eccentricity (or 100 and 405 kyr eccentricity) for a range of plausible sedimentation rates (Meyers, 2015). However, it can also be used to confirm or dispute our interpretation of the amplitude modulation using the time domain, rather than the depth domain, as input. For a record that is already time-calibrated, confirmation of the astrochronology is attained when the optimal synthetic “sedimentation rate” as estimated by TimeOpt is equal to 1 cm kyr−1. This means that the amplitude modulation in our constructed floating age model (Fig. 6) is equal to the “best fit” as calculated by TimeOpt. Note that this synthetic sedimentation rate is not the same as the real inferred sedimentation rate, which, incidentally, was also estimated as fluctuating around 1 cm kyr−1 (Fig. 5e). Using this approach, we applied TimeOpt to the log(SiO2 CaO) time series. The synthetic sedimentation rate input ranges between 0.4 and 1.7, corresponding to a duration of 560 to 2375 kyr for the Kellwasser Crisis as a whole (from the onset of the LKW δ13C excursion to the onset of the UKW δ13C excursion) and ca. 700 to 3000 kyr for the sampled interval of the Winsenberg section. This duration range covers the minimum and maximum estimates for the duration of the Kellwasser interval currently available in literature (Whalen et al., 2017; Ma et al., 2022). The input eccentricity and precession periodicities were taken from Waltham (2015) at 372 Ma. Testing precession amplitude modulation resulted in an optimal synthetic sedimentation rate of 1.1 cm kyr−1 (Fig. 9a). The 10 % deviation from 1 cm kyr−1 can be explained by the fact that precession was characterized as a single 19 kyr periodicity, instead of a combination of four components.
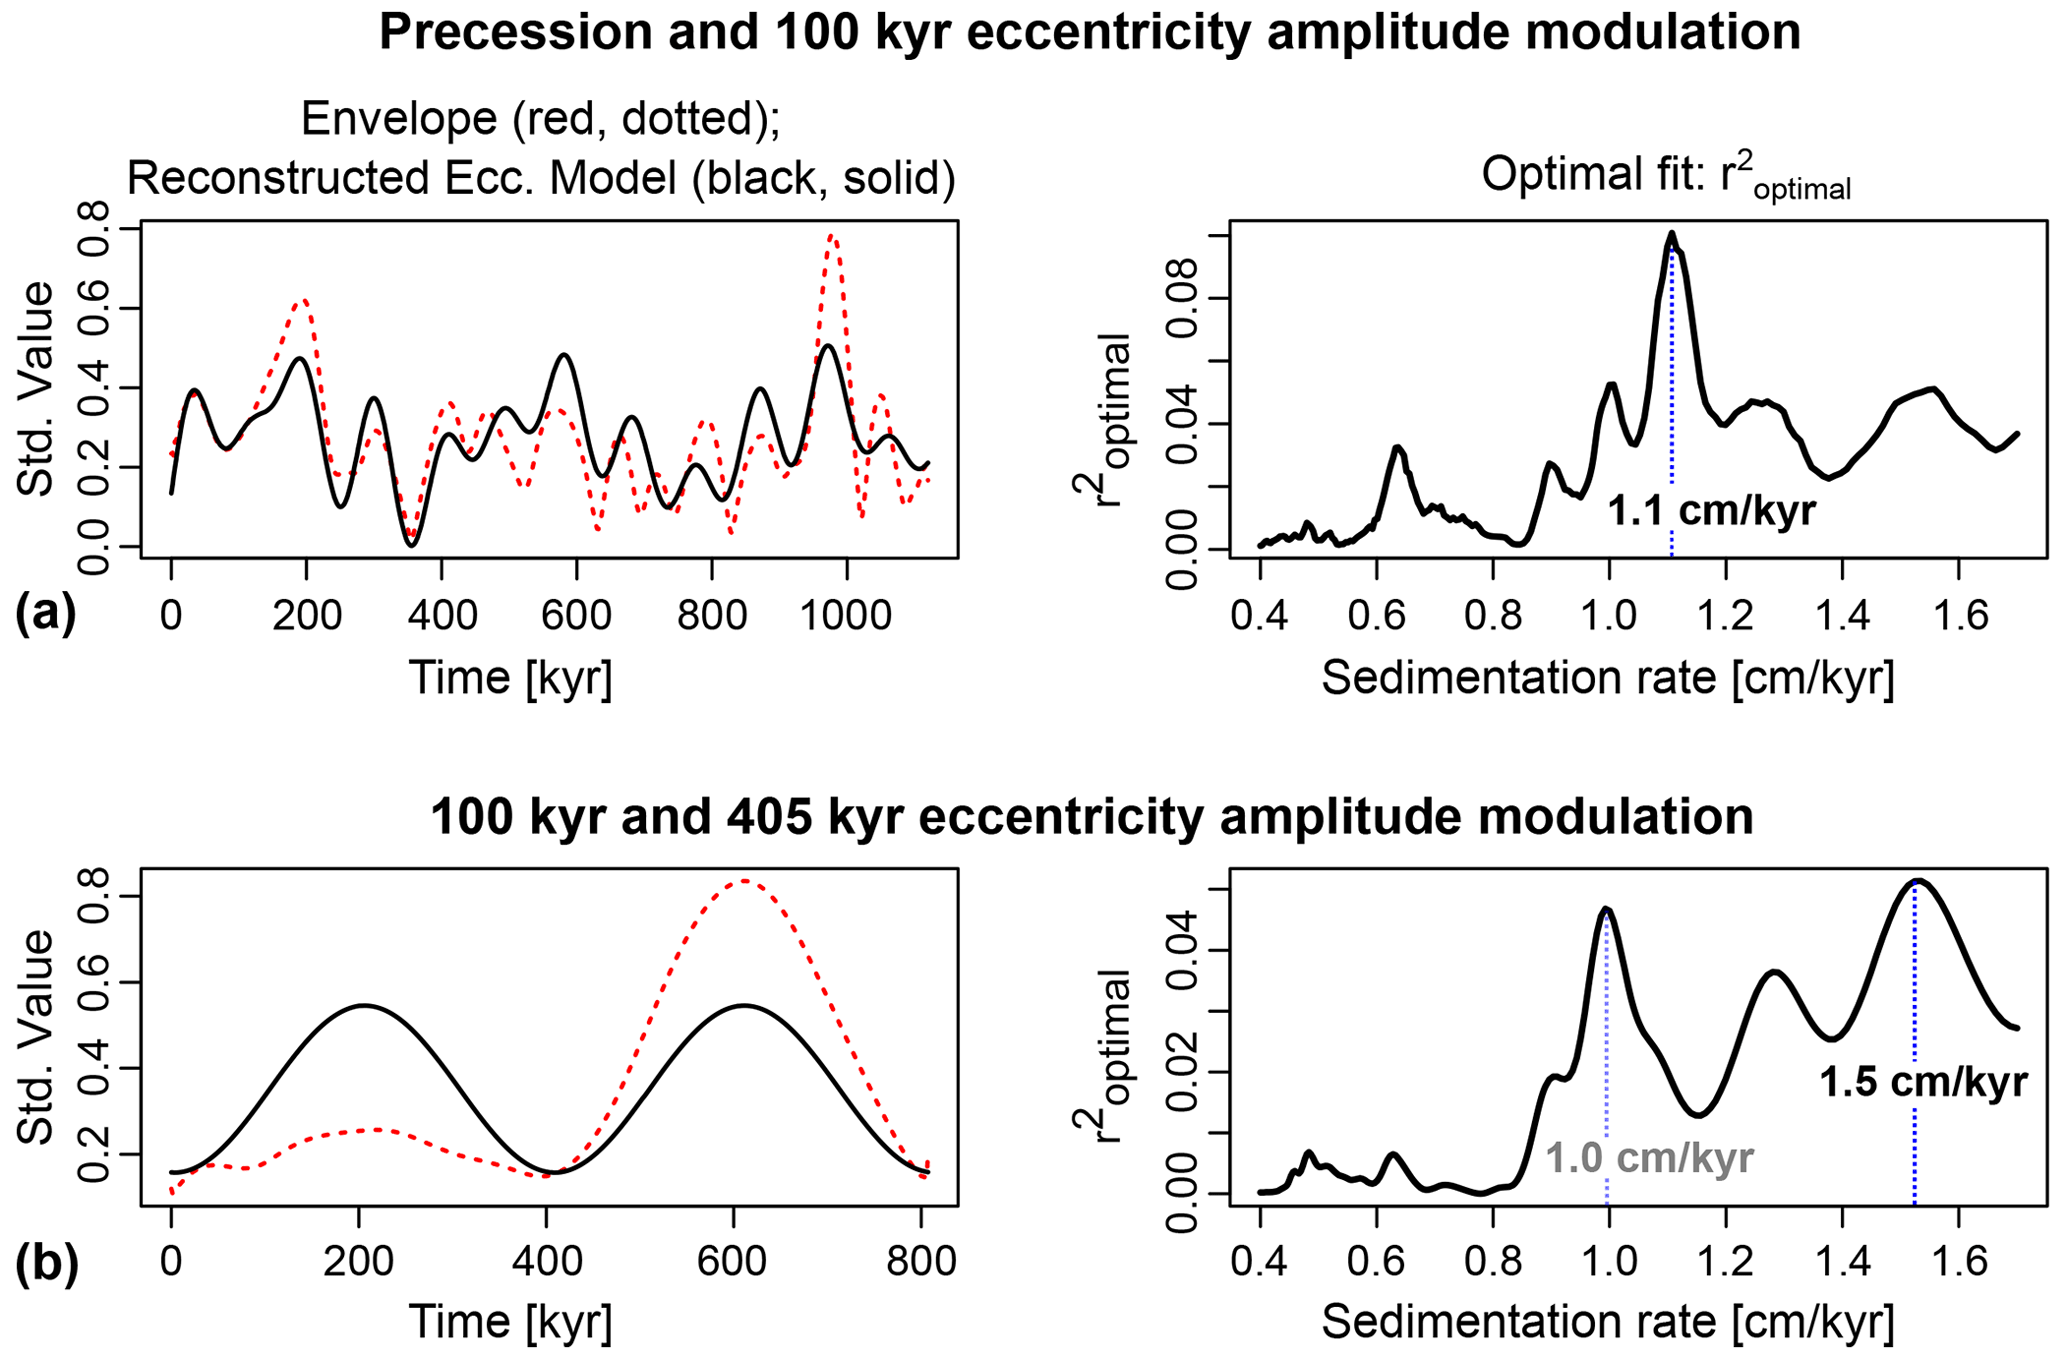
Figure 9TimeOpt analysis of the time-calibrated log(SiO2 CaO) series, carried out to assess the amplitude modulation fit. In the different panels, actual and reconstructed amplitude modulation envelopes are plotted on the left, and sedimentation rate optimization on the right. (a) TimeOpt results for 100 kyr eccentricity amplitude modulation of precession. The sedimentation rate is 1.1 cm kyr−1, close to unity. The corresponding optimal duration is ca. 1100 kyr for the entire record, and ca. 800 kyr for the LKW–UKW interval. (b) TimeOpt results for 405 kyr eccentricity amplitude modulation of 100 kyr eccentricity. The sedimentation rate is 1.5 cm kyr−1, which is far from unity. The corresponding optimal duration is ca. 800 kyr for the entire record and ca. 600 kyr for the LKW-UKW interval. There is a second, almost equally strong peak around 1.0 cm kyr−1, corresponding to ca. 1200 kyr for the entire record and ca. 900 kyr for the LKW–UKW interval.
In the TimeOpt analysis that assesses the modulation of the 100 kyr eccentricity cycles by 405 kyr eccentricity, one obtains an optimal synthetic sedimentation rate of 1.5 cm kyr−1 is obtained, with only two instead of three 405 kyr cycles detected in the Winsenberg section (Fig. 9b). This result corresponds to a duration of 600 kyr for the Kellwasser Crisis, defined as the time span between the onset of the LKW and UKW δ13Ccarb excursions, and 800 kyr for the entire studied interval. This option implies that the LKW and UKW occur in two consecutive 405 kyr cycles, which has not been proposed in other cyclostratigraphic studies. However, there is a peak in optimal synthetic sedimentation rate at 1.0 cm kyr−1 as well, which is almost as high as the peak at 1.5 cm kyr−1. In this scenario, the total Kellwasser Crisis corresponds to ca. 900 kyr and encompasses three 405 kyr cycles. The LKW thereby occurred during the earliest one (Fr-LEC 15 in De Vleeschouwer et al., 2017) and the UKW during the last of them (Fr-LEC 17), with a full 405 kyr cycle between the two Kellwasser events (i.e. Fr-LEC 16; Fig. 7b). As the precession-scale amplitude variability is considerably lower within Fr-LEC 16 compared to the other two cycles across all proxies, this cycle may represent a 2.4 Myr eccentricity node (see also Sect. 4.3.4). This TimeOpt result is in good agreement with the amplitude modulation of precession and eccentricity, as well as the observations in the lithology (Fig. 7b). We thus conclude that TimeOpt reinforces our astronomical interpretation of a duration of 900 kyr for the Kellwasser Crisis at Winsenberg.
The duration of the interval just below and within the UKW horizon, from ca. 8.90 to 9.90 m, cannot be precisely determined. Sharp shifts in the log(SiO2 CaO) record, from very high values just below the UKW horizon to very low within the UKW limestones, hamper a robust astrochronology in this interval (Fig. 5a–c). However, if its depositional mechanism was similar to the LKW, then the time present in one ca. 70 cm thick dark shale–black limestone grouping is about one 100 kyr eccentricity cycle. The duration of LKW black shale deposition in our astrochronology is ∼250 kyr, encompassing three such groupings (Fig. 7b). The UKW only contains one grouping, which is why we suggest a duration of ∼100 kyr for UKW black shale deposition at Winsenberg. This implies that the five to six thin marl–limestone cycles recognized within the UKW at other sections, such as Schmidt Quarry or Aeke Valley (Schindler, 1990a), represent precession cycles. A similar result was also found for the eastern USA (Lu et al., 2021).
Cyclostratigraphic duration estimates for the Kellwasser Crisis as a whole, as well as for the LKW and UKW events, show variations of several 100 kyr periods (Gong et al., 2001; Chen and Tucker, 2003; De Vleeschouwer et al., 2017; Whalen et al., 2017; Da Silva et al., 2020; Lu et al., 2021; Ma et al., 2022). We find ∼900 kyr between the onset of the LKW and onset of the UKW carbon isotope excursion, which is within the range of previous estimates. While most previous duration estimates cluster around 500–600 kyr (Whalen et al., 2017; De Vleeschouwer et al., 2017; Da Silva et al., 2020; Lu et al., 2021), the current study still agrees with these interpretations regarding there being one 405 kyr eccentricity cycle between the LKW and UKW. The difference in shape of δ13C curves from different sections may account for at least some of the discrepancies in duration estimates, as it is not always clear where the base of an excursion should be defined.
4.3 Palaeoclimatic interpretation
4.3.1 Phase relationships between proxies
All XRF-derived ratios (Fig. 10) exhibit precession cycles with 100 kyr eccentricity amplitude modulation, as well as 100 kyr eccentricity cycles modulated by 405 kyr eccentricity (Fig. D3). On precession and 100 kyr eccentricity timescales, organic-rich shaly lithology, SiO2 CaO (high detrital input), TiO2 Al2O3 (wetter climate), and K2O Al2O3 (less weathering) exhibit positive correlation (Fig. 10d–f; note the inverted y axis of the K2O Al2O3 record). TiO2 Al2O3, SiO2 CaO, and K2O Al2O3 are generally higher in shales and marls and lower in carbonates (Fig. C5). This phase relationship is most clearly defined on the precession scale. While it is still present on the 100 kyr eccentricity scale, this phase relationship has less coherency there. On timescales of several hundreds of thousands of years, K2O Al2O3 becomes anti-phased with SiO2 CaO and TiO2 Al2O3 (Fig.10d–f).
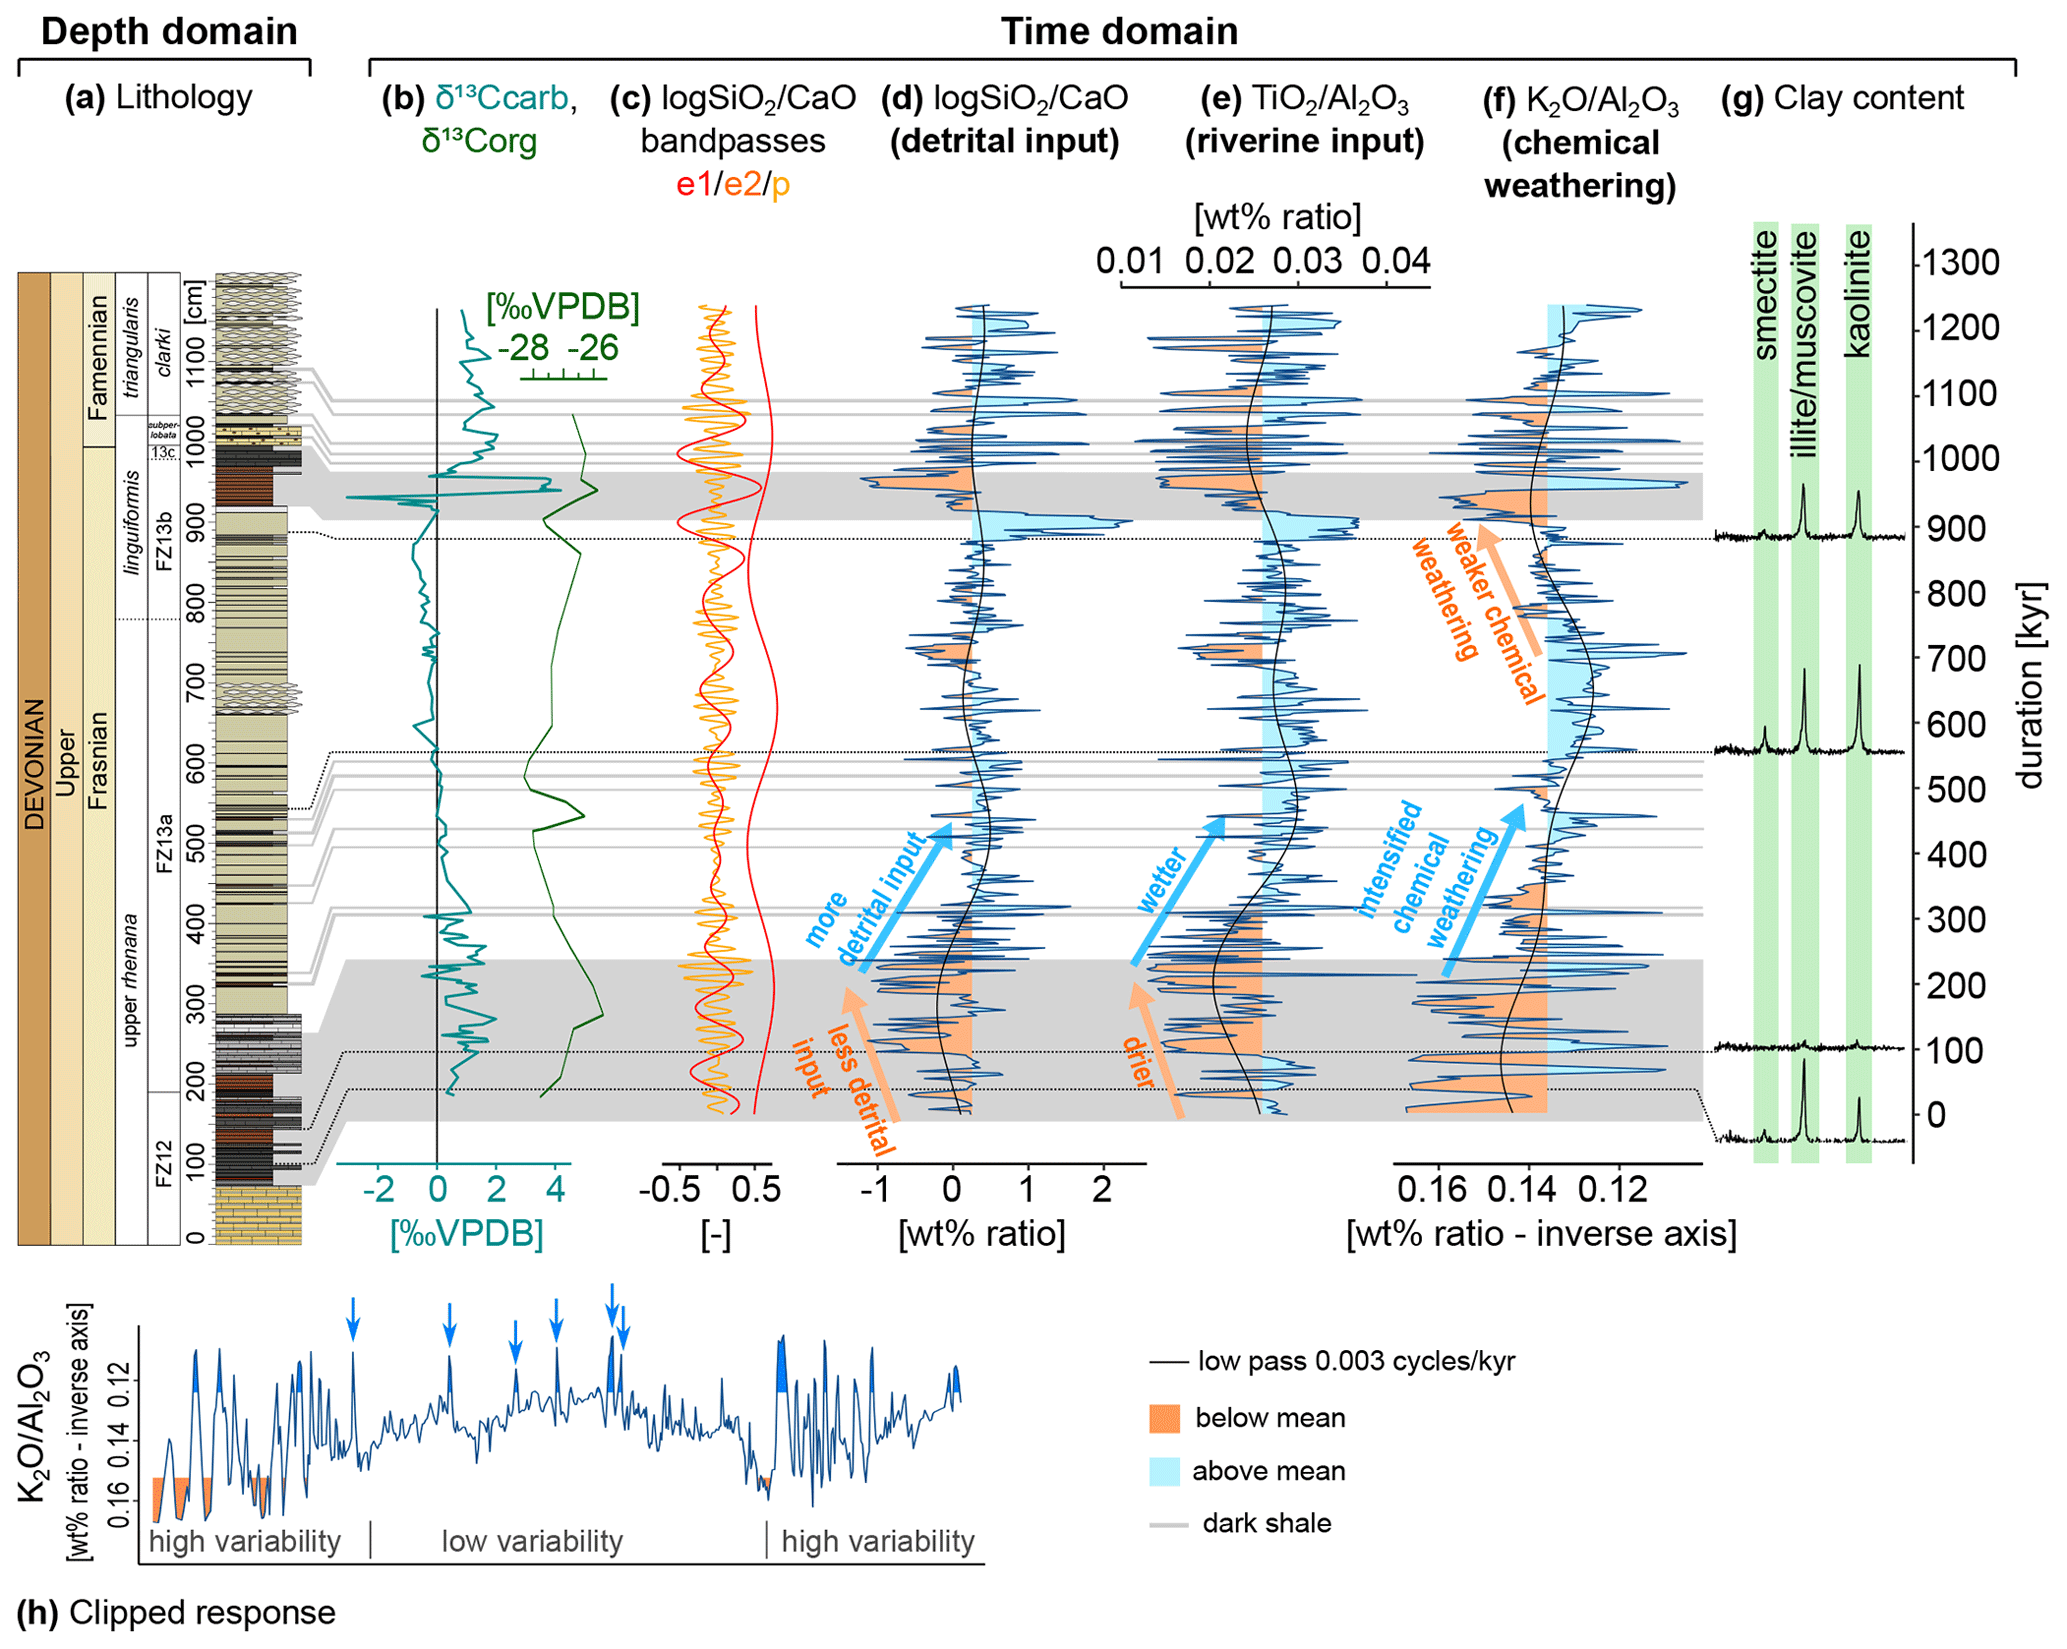
Figure 10Tuned proxy records. (a) Depth domain, biostratigraphy, and lithological column. Dark (organic-rich) shale intervals are marked with grey bands and connect the depth and time domains. Panels (b)–(h) are in the time domain. (b) δ13C records. (c) 405 kyr eccentricity (e1), 100 kyr eccentricity (e2), and precession (p) filters extracted from the log(SiO2 CaO) record (identical to the filters in Fig. 7b). (d) log(SiO2 CaO) record, interpreted as tracking total detrital input. (e) TiO2 Al2O3 record, interpreted as tracking riverine input and therefore linked to precipitation and wet–dry climate changes. (f) K2O Al2O3 record, interpreted as tracking chemical weathering. Note that the y axis is inverted as low K2O Al2O3 values correspond to more intense chemical weathering. In panels (e)–(g), values below and above their respective mean are coloured to better visualize intervals dominated by low or high values. A low-pass filter at 0.003 cycles kyr−1 is added to better visualize low-frequency trends. (g) Relative clay content throughout the section, as measured qualitatively through XRD. Three clay types are identified, namely smectite, illite/muscovite (could not be distinguished), and kaolinite. (h) K2O Al2O3 plot illustrating the clipped response, skewed towards intense chemical weathering even during the low-variability interval.
The interpretation of K2O Al2O3 as a weathering signal is tentatively supported by the section's clay content, as inferred from XRD analysis. Periods of weaker chemical weathering correspond to relatively low kaolinite content (relative to the other clay minerals) and higher abundance when weathering rates are high (Fig. 10f, g). Kaolinite forms under humid conditions that are conducive to intense chemical weathering (Robert and Chamley, 1987, and references therein). This result is consistent with the findings of Devleeschouwer et al. (2002) for sedimentary rocks from the Steinbruch Schmidt section, deposited on a pelagic seamount, although in shallower depth than Winsenberg. Their clay mineral analysis indicated that the highest kaolinite content occurs within the interval between the LKW and UKW horizons, while the highest illite content occurs in the dark Kellwasser intervals. Illite is thought to form under reduced chemical weathering conditions (Griffin et al., 1968). However, in this study its presence could not be distinguished from muscovite, which is known to occur at Winsenberg (Piecha, 1993; Becker et al., 2016b). The relative height of the illite/muscovite peak, however, follows the same pattern as found in Devleeschouwer et al. (2002) (highest in the Kellwasser horizons). Peak illite abundances in the Kellwasser horizons were also reported from the Anajdam section in the Moroccan Meseta (Riquier et al., 2007), which is significant as its provenance was from the continent of Gondwana rather than Euramerica. As weathering rates are predicted to increase in wetter climates, this anti-phasing of TiO2 Al2O3 and K2O Al2O3 on longer timescales meets the expectation. The phase relationship on shorter timescales, on the other hand, is counterintuitive.
4.3.2 Long-term climatic trends
Riverine input (TiO2 Al2O3) and chemical weathering (K2O Al2O3) proxies at Winsenberg covaried on timescales of several hundreds of thousands of years. The duration and timing of these runoff and weathering cycles suggest that they were paced by 405 kyr eccentricity (Fig. 10d–f). The runoff and weathering cycles exhibit a minimum around both the LKW and the UKW horizons, similar to Kellwasser beds in other settings and locations (Riquier et al., 2006; Pujol et al., 2006). Long-term wet/dry cycles are the most straightforward explanation for the covariance in these signals. Enhanced precipitation during wetter periods would result in more runoff, as well as provide the humid conditions that promote chemical weathering. The chemical weathering signal may also be (partially) controlled by temperature, with higher temperatures accelerating the reactions associated with weathering. Global temperatures and atmospheric pCO2 were shown to be paced by the 405 kyr eccentricity cycle in the carbon cycle modelling study of Vervoort et al. (2021), but precession–resolution temperature data for the Kellwasser Crisis is lacking (Zhang et al., 2021).
The steady decrease in K2O Al2O3 between the base of the section to ca. 700 kyr suggests a gradual enhancement of chemical weathering and soil profile development. In optimal conditions (easily weathered basaltic bedrock, modern vegetation, and tropical climate), potassium can be depleted from soils within 100 kyr if no new material is being exhumed (Chadwick et al., 1999). The timescales of modern riverine source to sink pathways are also on the order of hundreds of thousands of years (Li et al., 2016). However, in this case, weathering rates may have been significantly slower because of bedrock type (old red sandstone continent) and/or more primitive vegetation and/or a continuous supply of new weathered material as plants colonized new areas (Smart et al., 2022). A steady increase in weathering rates over ∼700 kyr therefore seems plausible (Fig. 10f).
4.3.3 Short-term climatic trends
All records show a higher variability during and in the immediate aftermath of both the LKW and the UKW horizons compared to the inter-Kellwasser interval, most clearly in the K2O Al2O3 record (Fig. 10h). Wet–dry cycles paced by precession, as inferred from the TiO2 Al2O3 runoff proxy, suggest a monsoonal climate mechanism (Fig. 10c–e). This is supported by the broader context of the studied site. During the Kellwasser event, the study area was located at the southern palaeotropics (Blakey, 2016; Scotese, 2021). The likely Intertropical Convergence Zone (ITCZ) positions throughout the year would enable moisture transport to the hinterlands via trade winds (Fig. 2c, d). Lithological climate indicators in the hinterland suggest prevailing arid conditions via the presence of evaporites, with wetting and drying cycles via the presence of calcretes (Boucot et al., 2013; Cao et al., 2019). These wet–dry cycles are consistent with a Late Devonian monsoon system that was particularly sensitive to astronomical insolation forcing (De Vleeschouwer et al., 2014).
On these monsoonal timescales, however, riverine runoff and chemical weathering proxies are anti-phased. This counterintuitive correlation requires an explanation as it opposes the long-term signal. The change in the sign of the correlation also complicates the identification of eccentricity minima and maxima. Both the TiO2 Al2O3 and K2O Al2O3 records show a clipped response, with K2O Al2O3 more so than TiO2 Al2O3 (Fig. 10e, f, h). Across the record, wetter intervals and intervals with intense chemical weathering are similar in TiO2 Al2O3 and K2O Al2O3 amplitude, respectively. The amplitude of the opposing signals, however, varies. The stable inter-Kellwasser interval is characterized by the absence of intense aridity and weak chemical weathering. If the inter-Kellwasser interval does represent a 2.4 Myr eccentricity minimum (see also Sect. 4.3.4), then the low seasonal contrast and minimal eccentricity climatic state is rather wet and favours strong chemical weathering. Conversely, eccentricity maxima are expected to be expressed as arid climates that favour weak chemical weathering. This is true for 405 kyr eccentricity but not for 100 kyr eccentricity due to the anti-correlation on these timescales. This observation suggests that a different mechanism is controlling one of these proxies on ≤100 kyr timescales. With the limitations of the evidence at hand, we propose several possible mechanisms that could explain the observed pattern: temperature control, sea level overprint, and mechanical vs. chemical weathering – or a combination of any of the three.
On precessional timescales, chemical weathering may be primarily controlled by temperature change, rather than precipitation change. An anti-correlation between riverine runoff and chemical weathering implies the alternation of wet and cool climates and arid and warm climates with weak or strong chemical weathering, respectively. This hypothesis is supported by Late Devonian climate modelling, showing wet–cool and arid–warm monsoonal cycles in southeastern equatorial Euramerica (De Vleeschouwer et al., 2014). Moreover, the simulated precession-forced mean annual temperature changes have a wide range (24–28 °C), which was at least equally important as precession-driven changes in mean annual precipitation (1200–1620 mm yr−1) (De Vleeschouwer et al., 2014). Unfortunately, there is currently no astronomically resolved temperature proxy series available to test this hypothesis at the precession scale.
Alternatively, TiO2 Al2O3 may be controlled by a fluctuating coastal position (sea level) rather than tracking precipitation on precessional timescales. A changing distance to the continent, re-routing of river discharge with changes in the coastline, and the presence/absence of estuaries that trap sediments could all result in TiO2 Al2O3 fluctuations at the studied site. There is evidence for rapid sea level change during this period (Johnson et al., 1985; Buggisch, 1991; Becker and House, 1994; Devleeschouwer et al., 2002; Racki, 2005; Bond and Wignall, 2008). However, there is no sea level record at the precession scale available to test this hypothesis. Moreover, disentangling sea level changes from climate changes (or processes that cause climate change) for distal marine sites is difficult, especially without rigid time control.
Finally, on short timescales, mechanical weathering and subsequent erosion may have dominated chemical weathering, even under humid climate conditions. During wet periods, both TiO2 Al2O3 and K2O Al2O3 increase as bedrock (containing fresh titanium and potassium) and soils (containing leached potassium) are eroded and washed into the ocean. In modern catchments, chemical weathering responds on precession timescales (Clift et al., 2008). Even small primitive Devonian plants could have had a major effect on chemical weathering (Lenton et al., 2012). However, vegetation coverage was still mostly limited to specific coastal areas (Kabanov et al., 2023) and lowlands in the Devonian (Gibling and Davies, 2012; Boyce and Lee, 2017). The chemical weathering taking place in these areas may not have sufficed to override erosion from the more sparsely vegetated hinterland on these timescales. Testing this hypothesis requires modelling the response of Devonian vegetation to precipitation changes and subsequent weathering impacts (Boyce and Lee, 2017; Brugger et al., 2019).
As chemical weathering is linked to the global carbon cycle via silicate weathering and CO2 drawdown, K2O Al2O3 is expected to be more sensitive to global changes than TiO2 Al2O3, which is interpreted as a regional monsoonal signal governed by low-latitude precession forcing. The chemical weathering signal at Winsenberg also records obliquity (Fig. 8), which is generally associated with high-latitude changes and teleconnections extending from these regions.
4.3.4 Do the Kellwasser events coincide with eccentricity maxima or minima?
The well-developed triplets (thin micritic limestone, thick marl, and a thin shale) in the inter-Kellwasser interval are interpreted as wet/dry precession cycles, with the highest TiO2 Al2O3 values occurring in the darker shales (Fig. 10, C5). Due to the low variability in both TiO2 Al2O3 and K2O Al2O3 within the inter-Kellwasser interval, however, it is difficult to identify 100 kyr intervals with either high or low values and definitively link these to minima or maxima.
In the Kellwasser intervals, on the other hand, 100 kyr eccentricity is expressed as groupings of homogenous dark shales and limestone–shale couplets (Fig. 3a–d). Limestone–shale couplets occur in 100 kyr periods of low TiO2 Al2O3 and K2O Al2O3 (Fig. 10a, e, f), with lowest TiO2 Al2O3 and K2O Al2O3in the limestone. The thickness of the (thicker) limestones varies, while the (thinner) shales stays rather constant. While the cycles in the inter-Kellwasser interval are consistent with dilution cycles, the cycles within the Kellwasser intervals are therefore interpreted as carbonate productivity cycles. Most of the carbonate in the Winsenberg section is likely derived from more proximal settings. Therefore, increased carbonate input can be linked to increased primary productivity in proximal waters, as a result of eutrophication (controlled by runoff, TiO2 Al2O3, and/or chemical weathering, K2O Al2O3). Both black shale and black limestone in the Kellwasser intervals are likely of microbial origin (amorphous Corg in black shales, with calcifying microbes in the limestones inferred from a lack of other calcifiers and the absence of active reefs), suggesting alternating blooms of organic and calcitic microbes as environmental conditions favoured one over the other.
The limestone–shale couplet intervals in the Kellwasser beds represent the highest lithological variability and are, therefore, most likely to reflect eccentricity maxima. These intervals co-occur with intervals of a more arid climate (lower TiO2 Al2O3, Fig. 10a, e). This pattern favours the interpretation that eccentricity maxima correspond to more “arid” periods, at least in this region. More accurately, they reflect periods where both parts of the wet/dry precession cycle are expressed and precipitation was seasonally distributed across the year. Conversely, eccentricity minima would correspond to a weaker expression of the precession cycle, with precipitation being more evenly distributed throughout the year, leading to an overall wetter signal. This shift to an annually wet climate during eccentricity minima is supported by modelling of the Devonian climate response to astronomical forcing (De Vleeschouwer et al., 2014). The K2O Al2O3 signal, then, is more likely to reflect a different controlling mechanism on ≤100 kyr timescales.
Ultimately, the exact mechanism linking astronomical forcing to runoff and chemical weathering changes cannot be determined with certainty from the data at hand. It can be inferred, however, that the studied location likely experienced precessional forcing of wet-dry monsoonal climate cycles during the Late Devonian.
4.3.5 Timing of the Kellwasser Crisis relative to the long-term eccentricity cycle
As astronomical forcing influenced the climate during the Kellwasser Crisis, it may have played a role in the timing of the crisis as well. The current study finds mixed evidence regarding the hypothesis that the UKW began in the aftermath of a 2.4 Myr eccentricity minimum, but most observations are in support of it. All analysed proxies show high variability within and succeeding LKW and UKW strata, just above the UKW level, and low variability in between (Fig. 10). This pattern is consistent with a 2.4 Myr eccentricity node preceding the UKW. The astrochronological interpretation indicates one 405 kyr eccentricity cycle between the LKW and UKW, with the UKW starting within the next 405 kyr cycle (Fig. 7b). TiO2 Al2O3, K2O Al2O3, and clay records suggest a stable but wet climate in the inter-Kellwasser interval. The stability would allow for limited erosion, while the overall wet climate would facilitate vegetation growth, further enhancing soil formation (Algeo and Scheckler, 1998; see also Fig. 1). A steady increase in chemical weathering similarly supports a long-term eccentricity minimum. Soil removal is likely to occur under strong wet–dry seasonality due to stronger and more frequent flood events. A climate modelling study links eccentricity minima with annually wet climates in this region (De Vleeschouwer et al., 2014). We also observe an increase in obliquity signal strength just prior to the UKW (Fig. 8). During an eccentricity minimum, the relative obliquity signal is expected to gain in power, as it is the only astronomical parameter not being suppressed (De Vleeschouwer et al., 2017).
Yet, even within the inter-Kellwasser interval, clear precession amplitude modulation patterns occur in all proxy records and lithology bundles (Figs. 7b, 10). These patterns are not consistent with low eccentricity because amplitude modulation of precession in 100 kyr bundles is suppressed during a 2.4 Myr node.
Following the proposed 2.4 Myr eccentricity minimum, a stronger precession signal and enhanced seasonal contrasts would manifest as Earth's orbital configuration shifted to a more pronounced eccentricity. These conditions are better reflected in a larger variability across total detrital input, runoff, and chemical weathering proxies. Just prior to the UKW, total detrital input and runoff reach maximum values, consistent with a large influx of nutrient-rich terrestrial material. This influx could have triggered eutrophic conditions in the shelf basin. Such an astronomically influenced terrestrial–marine connection was also proposed by Lu et al. (2021), who linked astronomically paced fluxes in terrestrial matter to the onset of the Upper Kellwasser equivalent in the Chattanooga Shale in Tennessee, USA. Terrestrially derived eutrophication supports the top-down model for anoxia during the Kellwasser, at least for settings on the continental shelf (Carmichael et al., 2019). A similar scenario has also been proposed for the Hangenberg Crisis at the end of the Devonian (Qie et al., 2023). Detrital pulses preceding Devonian anoxic events have been inferred for both the Kellwasser (Lash, 2017) and earlier Middle–Late Devonian anoxic events (Kabanov et al., 2023), although their interpretations differ (sea level fall vs. enhanced continental weathering). In pelagic settings of the Rhenish Massif, the spore influx was reduced prior to the UKW (Hartkopf-Fröder et al., 2007), which does not fit with an increased terrestrial influx to the oceans. Elevated geochemical productivity proxies, including nutrient values (Ba, Ba Al, Cu Al, total P, and P2O5), have repeatedly been recorded from within the Kellwasser intervals but only rarely from the immediate pre-Kellwasser intervals (Pujol et al., 2006; Riquier et al., 2006, 2007; Percival et al., 2020). Therefore, some uncertainty remains regarding the role of continentally sourced nutrients causing anoxia.
If the timing of the UKW is controlled by a 2.4 Myr eccentricity node, then the timing of the LKW is not. In the presented astronomical interpretation, the LKW does occur just after a 405 kyr minimum (Fig. 7), although there is no data prior to the LKW itself, and the start of the record may therefore be affected by spectral edge effects. A 405 kyr minimum would have led to similar conditions to a 2.4 Myr minimum, just much shorter in duration. The regolith nutrient gun would therefore be less effective, which is in agreement with the less catastrophic nature of the LKW. This occurrence just after a 405 kyr minimum is suspicious, and the timing of the LKW may also have been controlled by astronomical forcing. Cyclostratigraphic analysis of pre-LKW strata would be needed to confirm this. As the UKW itself, it requires an additional mechanism that persisted across the entire Kellwasser Crisis (such as volcanism; see Sect. 4.3.6 below) to explain why this 405 kyr node resulted in anoxia. This additional mechanism might have been sufficient to enable astronomical forcing to push the climate system past its tipping point and into anoxia.
4.3.6 Implications for the cause of the Kellwasser Crisis
The K2O Al2O3 data suggests that the UKW was preceded by a prolonged period of intense chemical weathering, facilitated by a period of reduced seasonal contrast. However, Devonian carbon cycle perturbations and black shale deposition do not occur in regular 2.4 Myr intervals (Becker et al., 2020; Denayer et al., 2021). The other Devonian perturbations were also not as severe as the Kellwasser Crisis (McGhee et al., 2013), with the end-Devonian Hangenberg Crisis as a potential exception (Bambach, 2006; Kaiser et al., 2016). This points to additional, and perhaps different, underlying mechanisms for individual carbon cycle perturbations. In particular, ocean circulation changes, both stagnation and rigorous overturning (Southam et al., 1982; Kabanov et al., 2023), are important to consider, as they can directly contribute to the observed anoxia (bottom-up deoxygenation). Due to lacking detailed bathymetry or oceanic crust for the Devonian, however, it is difficult to constrain this factor. We focus here on processes related to chemical weathering on the continents, as that is what the proxies available in this study can tell us.
Land plant evolution, especially the development of extensive root systems and seeds, has long been hypothesized to have enhanced silicate weathering and induced marine eutrophication (Berner, 1992; Algeo et al., 1995; Algeo and Scheckler, 1998). An orbitally mediated stable wet period may have created the optimal conditions for plants to transiently expand their continental coverage. Widespread LIP and arc volcanism can also increase silicate weathering efficiency via CO2 outgassing that increases temperatures, as well as the emplacement of readily weathered fresh basalts in the case of continental volcanism (Racki, 2020a; Kabanov et al., 2023). Volcanism, therefore, has the potential to cause a similar top-down-induced anoxia. Large-scale volcanic events have been radioisotopically dated to around the age of the Kellwasser Crisis (Courtillot et al., 2010; Ricci et al., 2013; Polyansky et al., 2017; Percival et al., 2018; Ernst et al., 2020), and mercury enrichments around the Frasnian–Famennian boundary have been interpreted to show a temporal and causal relationship between the two (Racki, 2020a, and references therein). This is especially true for the mid-European study area, where widespread ash layers have been shown to be temporary close to the Kellwasser horizons (Winter, 2015). Land plants could have acted in concert with widespread volcanism as well. An initial massive volcanic outgassing could have led to transient CO2-induced warming, resulting in the proliferation of land plants and subsequent enhanced weathering and nutrient export to the oceans. Massive eutrophication-induced marine blooms would have resulted in large-scale biomass burial, resulting in cooling via CO2 drawdown, as well as anoxia (Schobben et al., 2019; Pisarzowska and Racki, 2020). However, a volcanic influence on the Kellwasser Crisis has been questioned due to the lack of mercury enrichments at some records, particularly in North America (Zhang et al., 2021; Zhao et al., 2022; Zheng et al., 2023; Pippenger et al., 2023; Zhou et al., 2023). Alternatively, plants could have played a minor, amplifying, and predominantly regional role in exacerbating anoxia (Kabanov et al., 2023); this could also fit with the Winsenberg record, which records regional conditions in the hinterland.
Rather than looking at the role of plant evolution as distinct adaptive pulses with immediate consequences, it can also be considered to represent a long-term change in the boundary conditions. The eccentricity minimum hypothesis relies on the presence of a regolith that can respond to astronomically forced climate change by growing thicker or eroding and thinning. Early Palaeozoic soils were very thin and immature in the absence of rooting land plants and burrowing organisms (Driese and Mora, 2001; Jutras et al., 2009; Mitchell et al., 2023). They likely had a very low buffering capacity regarding astronomical forcing. The capacity of the regolith to respond to astronomical forcing therefore increased throughout the Devonian, influenced by land plant evolution (Driese and Mora, 2001; Genise et al., 2016; Alekseeva et al., 2016). Increasing vegetation lushness through time as ecosystems matured could have increased the efficiency of nutrient output from these soils for a given weathering efficiency (D'Antonio et al., 2020). The presence of land plants, especially deep-rooted arborescent trees of the Late Devonian, may also have intensified the hydrological cycle via evapotranspiration, albedo, and surface turbulence changes (Berner, 1992; Algeo et al., 2001; Boyce and Lee, 2017; Ibarra et al., 2019). A land–plant-induced intensified hydrological cycle may in turn have strengthened the monsoonal response to astronomical forcing.
From this perspective, the introduction of (especially vascular and rooted) land plants may have been a facilitating long-term factor that made the Devonian climate system susceptible to anoxia, similar to palaeogeography and long-term climate modes. The greenhouse, mostly ice-free Devonian period saw wide cratonic overflooding and extensive shallow epicontinental seas (Kaiser et al., 2016; Scotese, 2021). Epicontinental seas were also widespread in the Cretaceous, another period punctuated by oceanic anoxia (Trabucho-Alexandre et al., 2012; Scotese, 2021; van der Meer et al., 2022). These shallow seas were prone to evaporation, eustatic, and climatic cycles (Johnson et al., 1985; Becker et al., 2020) and formed a basinal configuration that is conductive to black shale deposition (Trabucho-Alexandre et al., 2012). As with the Mesozoic oceanic anoxic events (OAEs), Devonian anoxic events are unique in the sense that they likely cannot all be explained by the exact same sequence of events (Jenkyns, 2010; Kabanov et al., 2023). For some anoxic events, perhaps just astronomical forcing would have been enough to push the climate system past its tipping point in this anoxia-prone world primed by the advent of land plants and/or volcanism (e.g. Percival et al., 2020). For other events, widespread volcanism might have been enough even without a favourable orbital configuration. And other events might reflect a perfect storm of widespread volcanism and astronomical forcing. Such a combination of astronomical forcing and volcanism has been proposed for Mesozoic OAEs (Batenburg et al., 2016; Ait-Itto et al., 2023). Given the growing body of work indicating an influence on the timing of the Kellwasser Crisis, it is possible that the Kellwasser Crisis was another of these perfect storms (De Vleeschouwer et al., 2017; Da Silva et al., 2020; Lu et al., 2021; Ma et al., 2022; this study).
However, there are issues with a volcanic cause for the Kellwasser Crisis, as outlined above. Additionally, unlike the Mesozoic warming events, the Kellwasser Crisis is more notably marked by climate cooling (LKW) or an overheating-cooling couplet (UKW; Joachimski and Buggisch, 2002; Balter et al., 2008; Huang et al., 2018). Thus, the Kellwasser Crisis may also have represented a solely astronomically forced event, or even a different kind of perfect storm that combined a favourable orbital configuration with another (non-volcanic) factor.
Cyclostratigraphic analysis of the Winsenberg roadcut section in the Rhenish Massif, Germany, estimates the duration of the Kellwasser Crisis at ca. 900 kyr (from the start of the Lower Kellwasser carbon isotope excursion to the start of the Upper Kellwasser excursion). The Lower Kellwasser spanned ca. 250 kyr, while the Upper Kellwasser duration is estimated at ca. 100 kyr. These values fall within the range of previous duration estimates. The confidence in the astrochronological interpretation changes throughout the record. In some intervals, there is a rather large uncertainty, but in other intervals, climate interactions can be discerned at a precession scale. The phase relationships between proxies change depending on the timescale. On 100 kyr eccentricity and precession timescales, eccentricity-modulated precession forcing of the monsoon is inferred from terrestrially sourced proxy records. Total detrital and riverine input are out of phase with chemical weathering, a counterintuitive observation that can have multiple causes. On 405 kyr eccentricity timescales, total detrital and riverine input are in phase with chemical weathering, suggesting long wet–dry climate cycles. The Lower and Upper Kellwasser occurred within drier but highly variable climates. During the inter-Kellwasser interval, a wetter but more stable climate with high chemical weathering rates prevailed. This stable period is linked to a 2.4 Myr eccentricity minimum characterized by prolonged low seasonal contrasts. It therefore lends support to the eccentricity minimum hypothesis, which poses that Upper Kellwasser anoxia developed as a result of long-term nutrient build-up on the continents during this eccentricity minimum, followed by the release of these nutrients to the oceans and subsequent eutrophication once the climate system came out of this long stable period. This model is also consistent with a top-down development of anoxia for the Kellwasser Crisis, although this may be a regional signature. Both widespread volcanism and the expansion of land plants can intensify chemical weathering and lead to eutrophication and both have been proposed as causes for the Kellwasser Crisis before. Here, it is proposed that long-term changes to the climate system's boundary conditions induced by land plants (soil development and intensification of the hydrological cycle) increased the capacity of the Earth's climate to respond to astronomical forcing. With that, the capacity of astronomical forcing to tip the climate system over a tipping point increased as well, leading to the prevalence of anoxic events in the Middle and Late Devonian. The Kellwasser Crisis itself is thought to have been the result of a combination of astronomical forcing and widespread volcanism (although other causes cannot be ruled out yet), with the first controlling the timing, and the second making the Devonian Earth system more prone to widespread ocean oxygen deficiency.
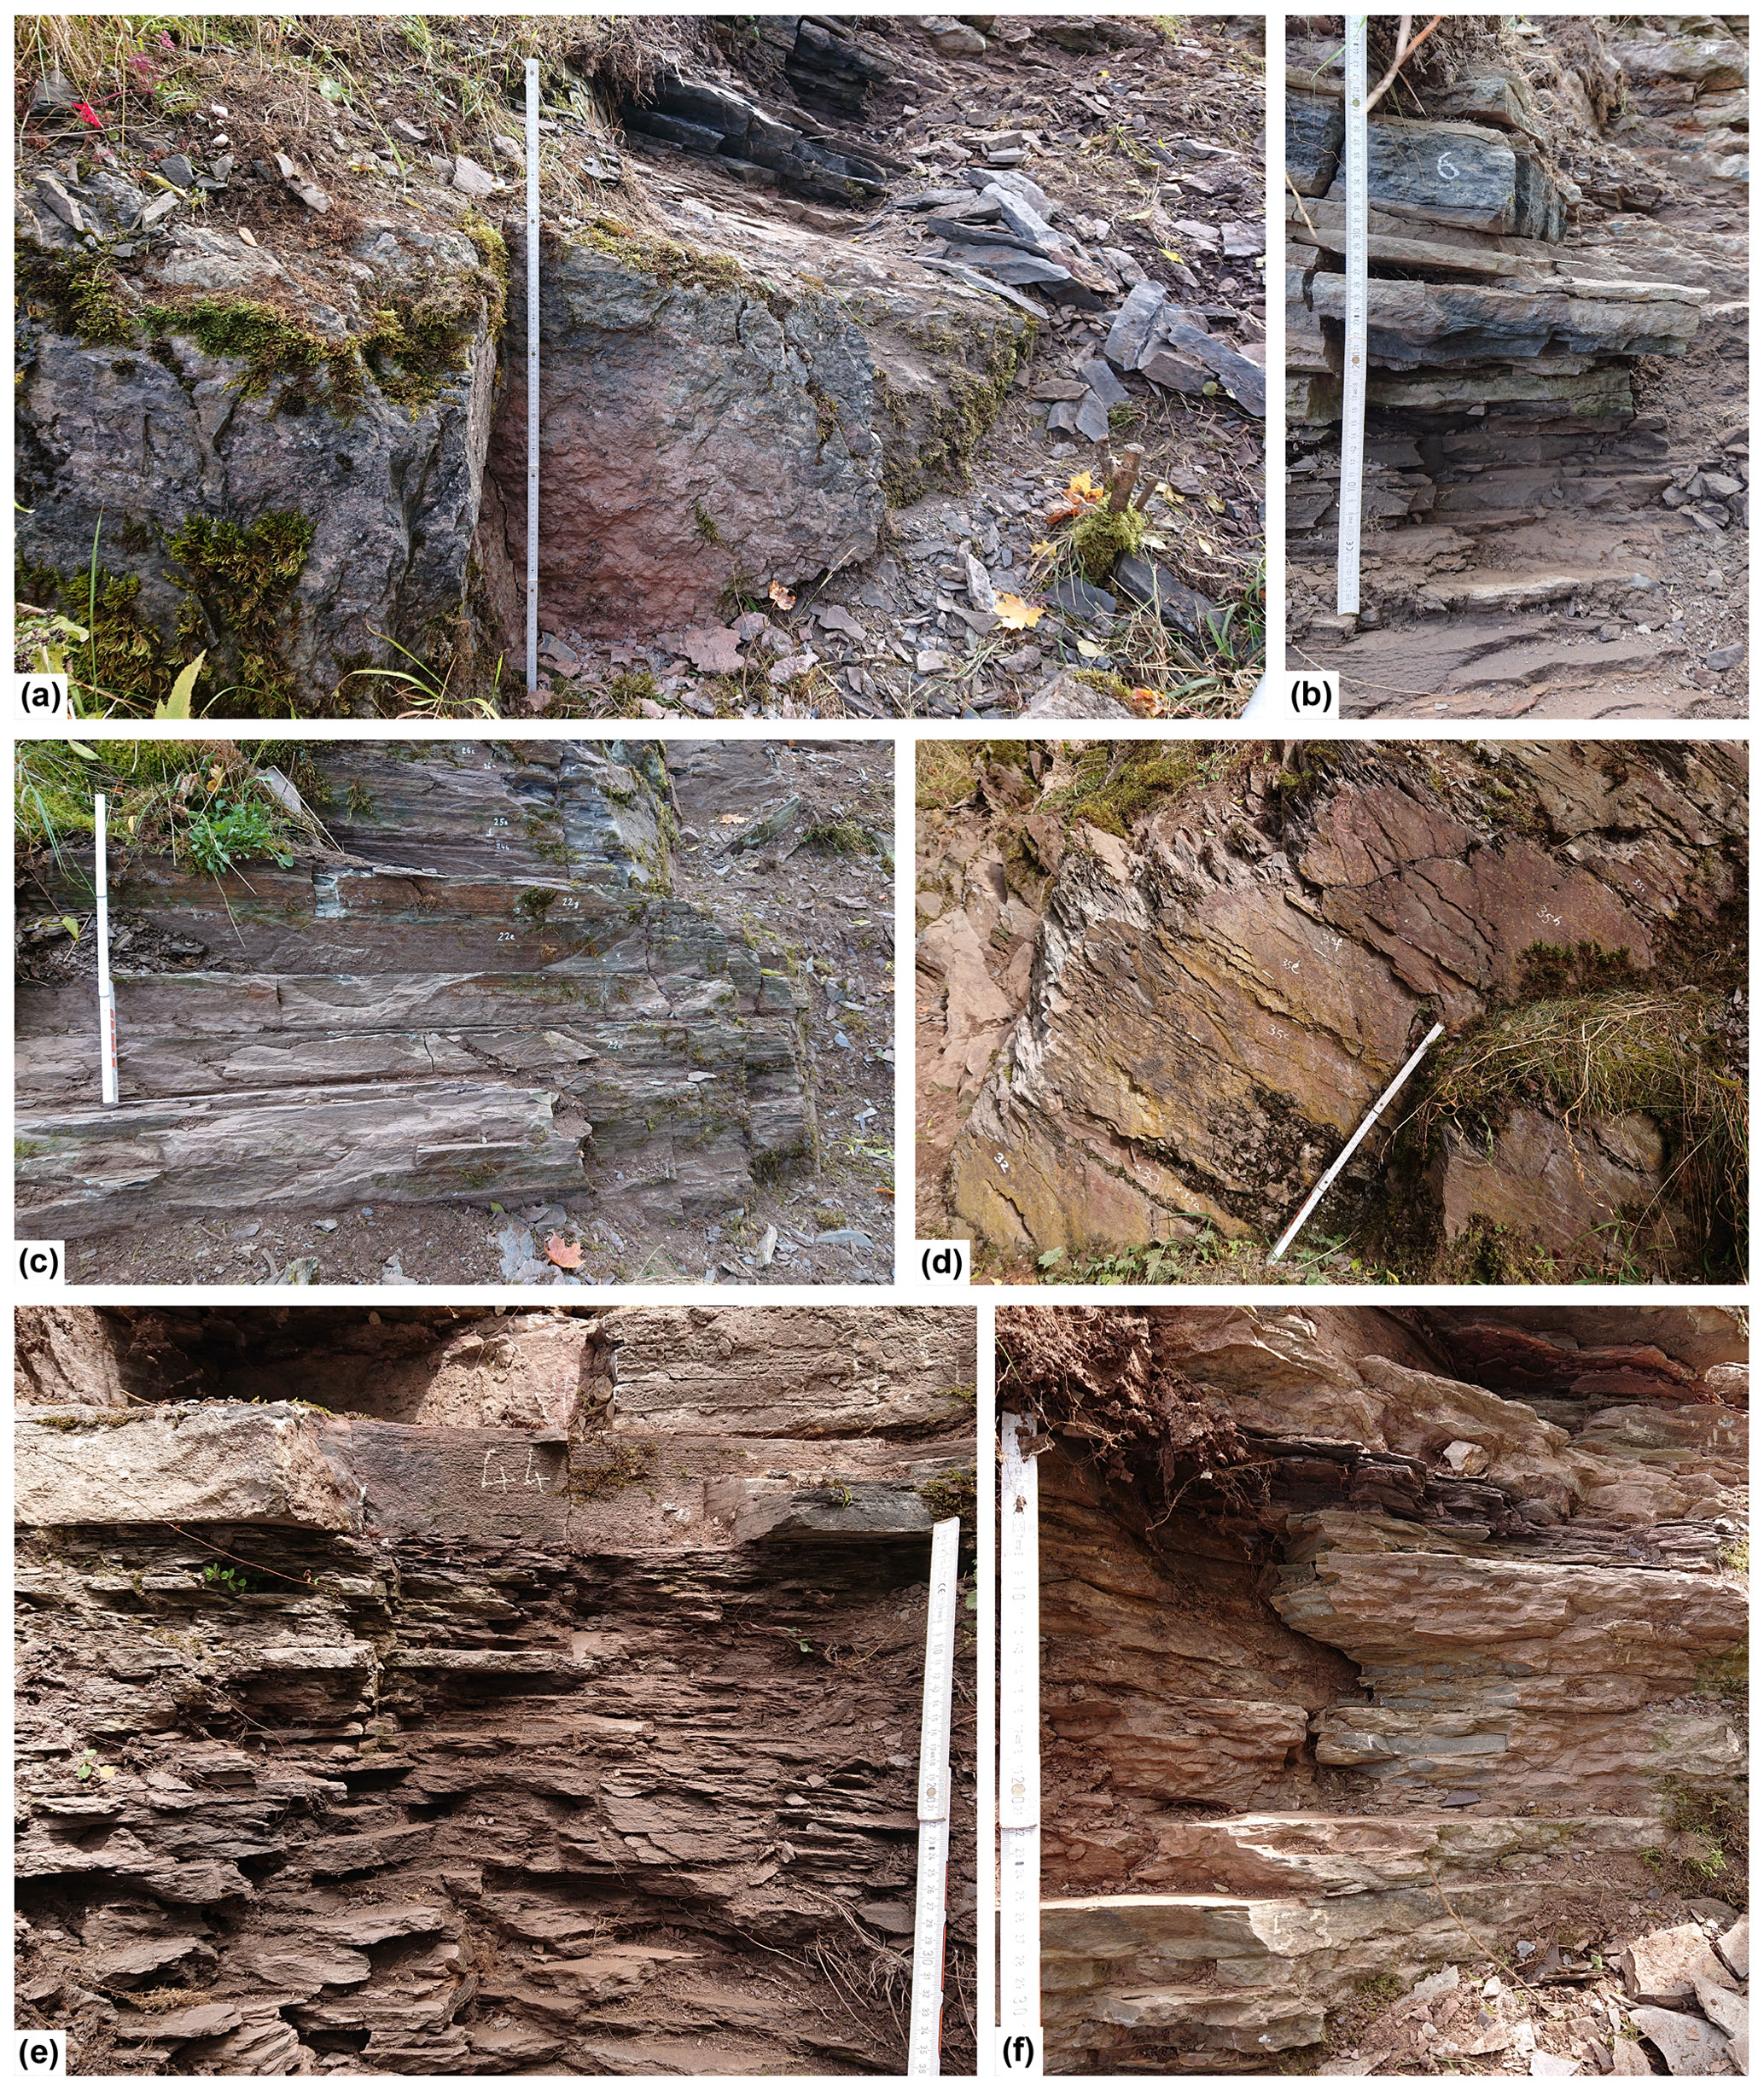
Figure A1Overview photos of the Winsenberg outcrop. (a) Usseln Limestone just below the LKW. Ruler for scale (1 m). (b) Detail of black shales and limestones (bed 6) in the LKW. Ruler for scale, ca. 46 cm here. (c) Winsenberg Fm facies in between the LKW and UKW. Ruler for scale (ca. 60 cm here). (d) Winsenberg Fm beds just below the UKW. Ruler for scale (ca. 60 cm here). (e) Black shales and limestones (beds 44 and 45) in the UKW. Ruler for scale (ca. 35 cm here). (f) Nodular thinly bedded limestones and thin black shales above the UKW. Ruler for scale (ca. 30 cm here).
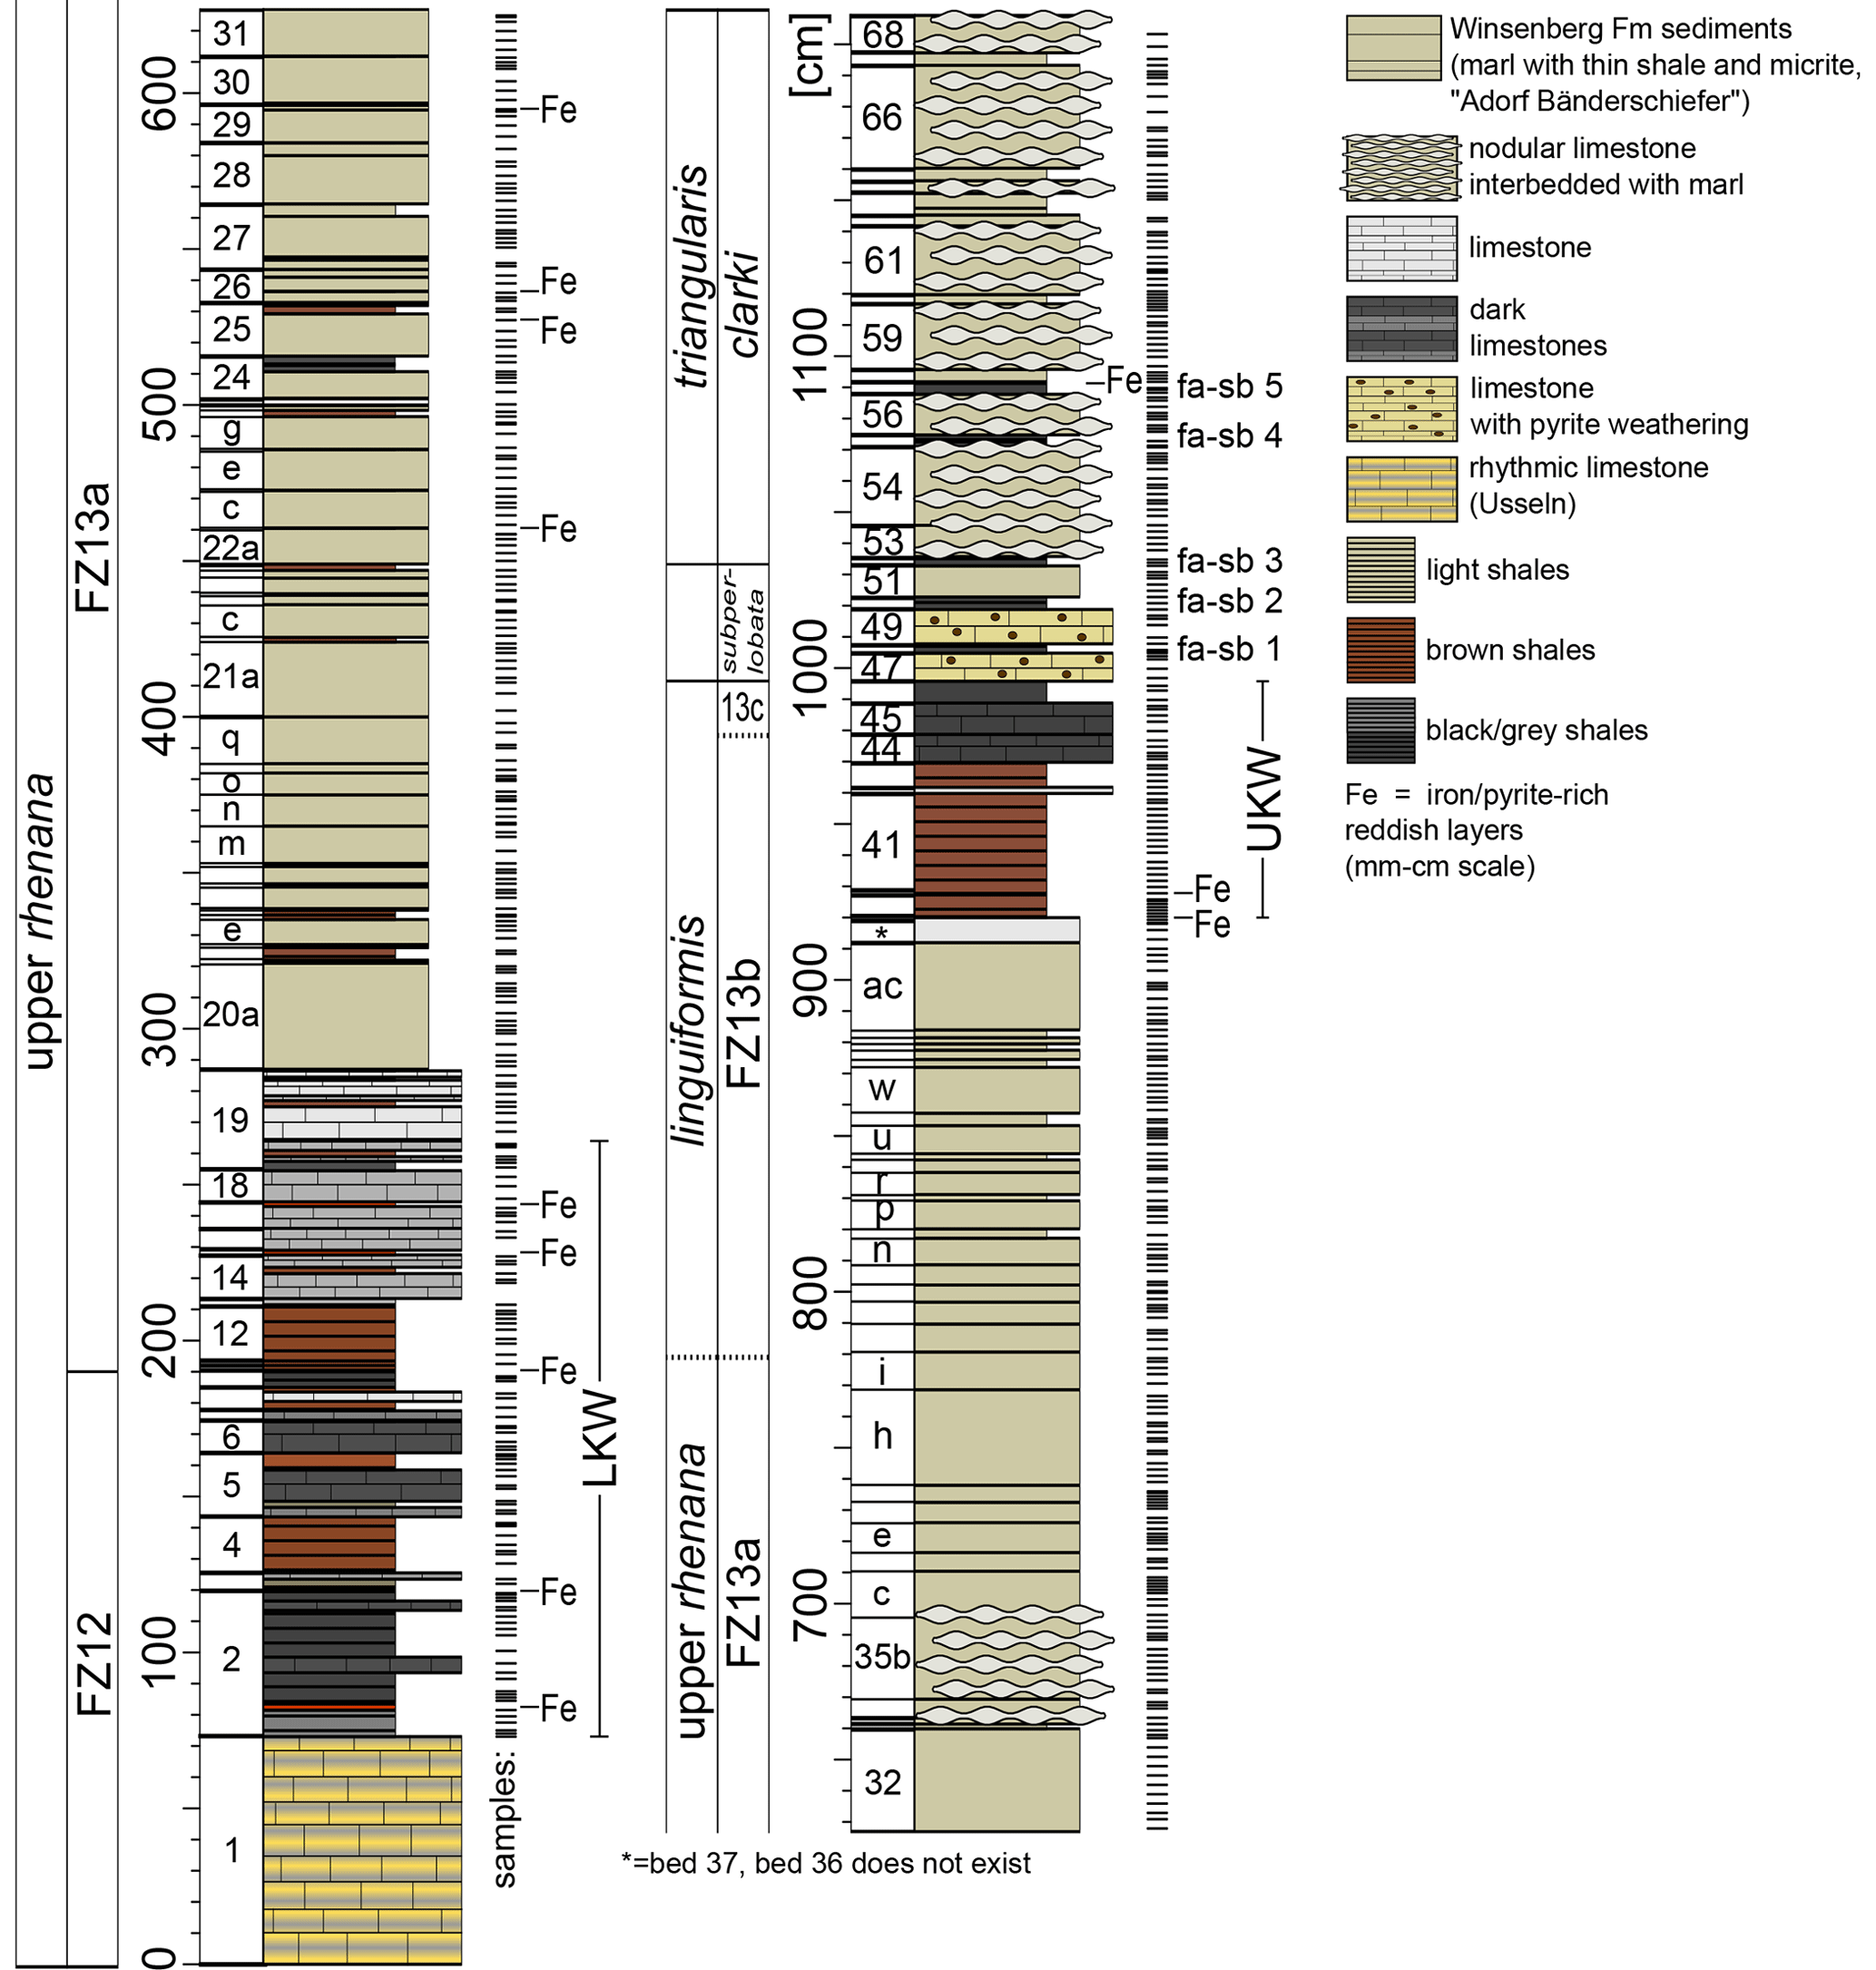
Figure A2Expanded log of the Winsenberg roadcut section with bed numbering, sample placement, and additional information on iron and/or pyrite-rich millimetre- to centimetre-thick seams. Exact samples heights and corresponding beds can be found in the supplementary materials.
Grain size analysis was carried out for a set of samples (black shale, grey shale, marl, and limestone) in order to ensure that the grain size distribution was narrow enough to limit the grain size effect associated with XRF (Claisse and Samson, 1961). Particle size measurements were performed in the particle size laboratory at MARUM, University of Bremen, with a Beckman Coulter LS 13 320 Laser Diffraction Particle Size Analyzer. Prior to the measurements, the terrigenous sediment fractions were isolated by removing organic carbon, calcium carbonate, and biogenic opal by boiling the samples (in about 200 mL water) with 10 mL H2O2 (35 %; until the reaction stopped), 10 mL HCl (10 %; 1 min), and 6 g NaOH pellets (10 min), respectively. After every preparation step the samples were diluted (dilution factor >25). Finally, remaining aggregates were destroyed prior to the measurements by boiling the samples with 0.3 g tetra-sodium diphosphate decahydrate (Na4P2O7 ⋅ 10H2O, 3 min) (see also McGregor et al., 2009). Sample preparation and measurements were carried out with deionized, degassed, and filtered water (filter mesh size 0.2 µm) to reduce the potential influence of gas bubbles or particles within the water. The obtained results provide the particle size distribution of a sample from 0.04 to 2000 µm divided into 116 particle size classes. The calculation of the particle sizes relies on the Fraunhofer diffraction theory and the Polarization Intensity Differential Scattering (PIDS) for particles from 0.4 to 2000 µm and from 0.04 to 0.4 µm, respectively. The reproducibility is checked regularly by replicate analyses of three internal glass bead standards and is found to be better than ±0.7 µm for the mean and ±0.6 µm for the median particle size (1 SD). The average standard deviation integrated over all size classes is better than ±4 vol % (note that the standard deviation of the individual size classes is not distributed uniformly). All provided statistic values are based on a geometric statistic. Portable XRF results were shown to be similar for intermediate (125–250 µm) and fine (63–125 µm) powders by Quye-Sawyer et al. (2015). The powders were therefore not ground down to a finer grain size.
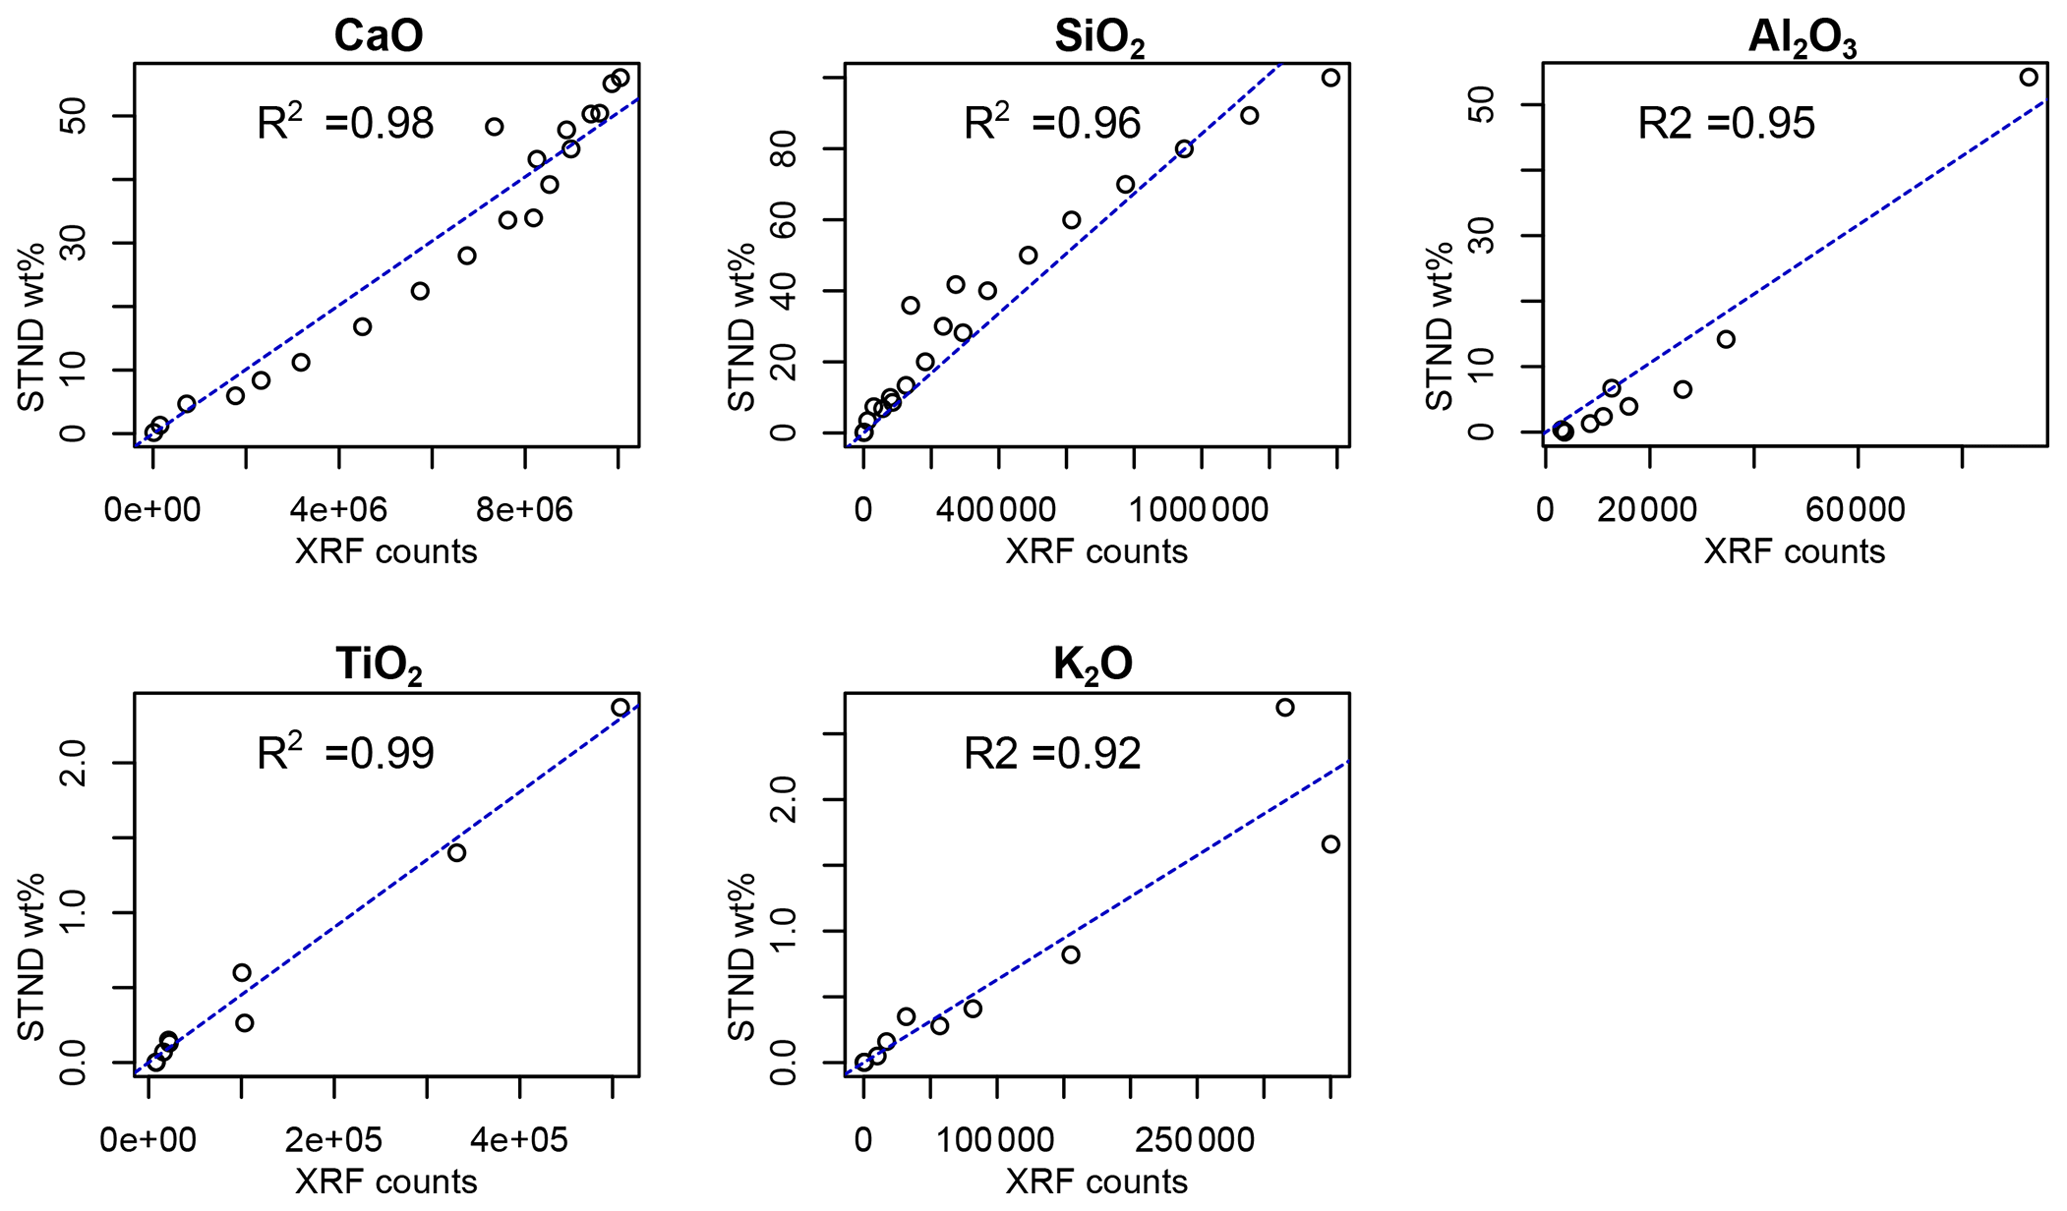
Figure C1Scatterplots of the pXRF counts versus standard concentrations (in wt %) for the elements used in this study, used to construct linear calibrations for each element (dotted blue line). Measured on a set of 10 sedimentary standards, as well as synthetic CaCO3-SiO2 mixtures.
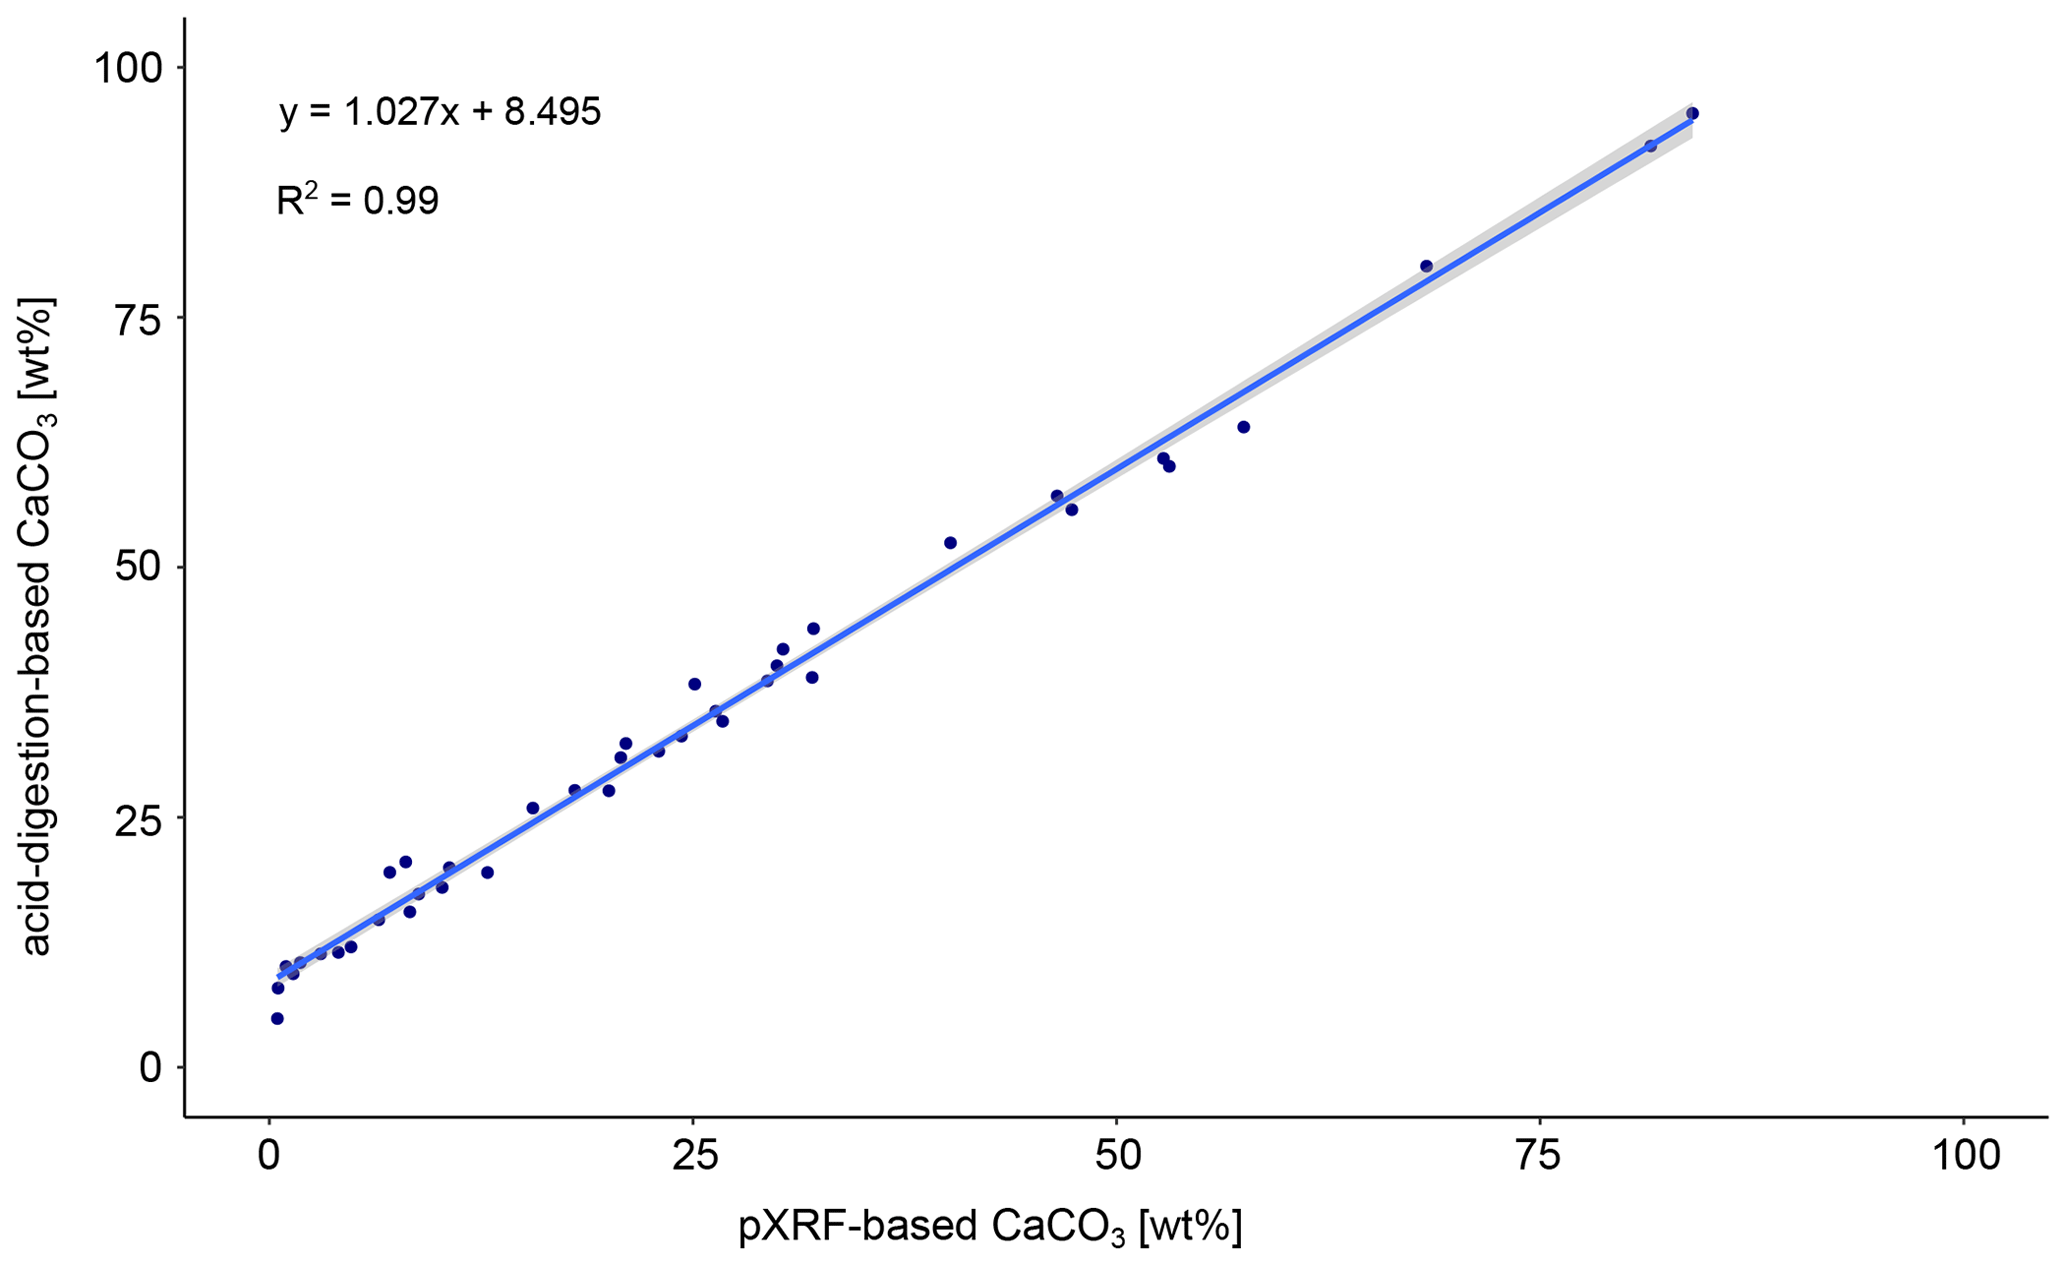
Figure C2Scatterplot showing the pXRF-based CaCO3 versus acid-digestion-based CaCO3 content of a subset of samples from the Winsenberg section. While there is a ca. 8 wt % offset between the two, the slope is close to unity, and the fit is good (R2=0.99), suggesting that the trend in CaCO3 as estimated from pXRF is reliable.
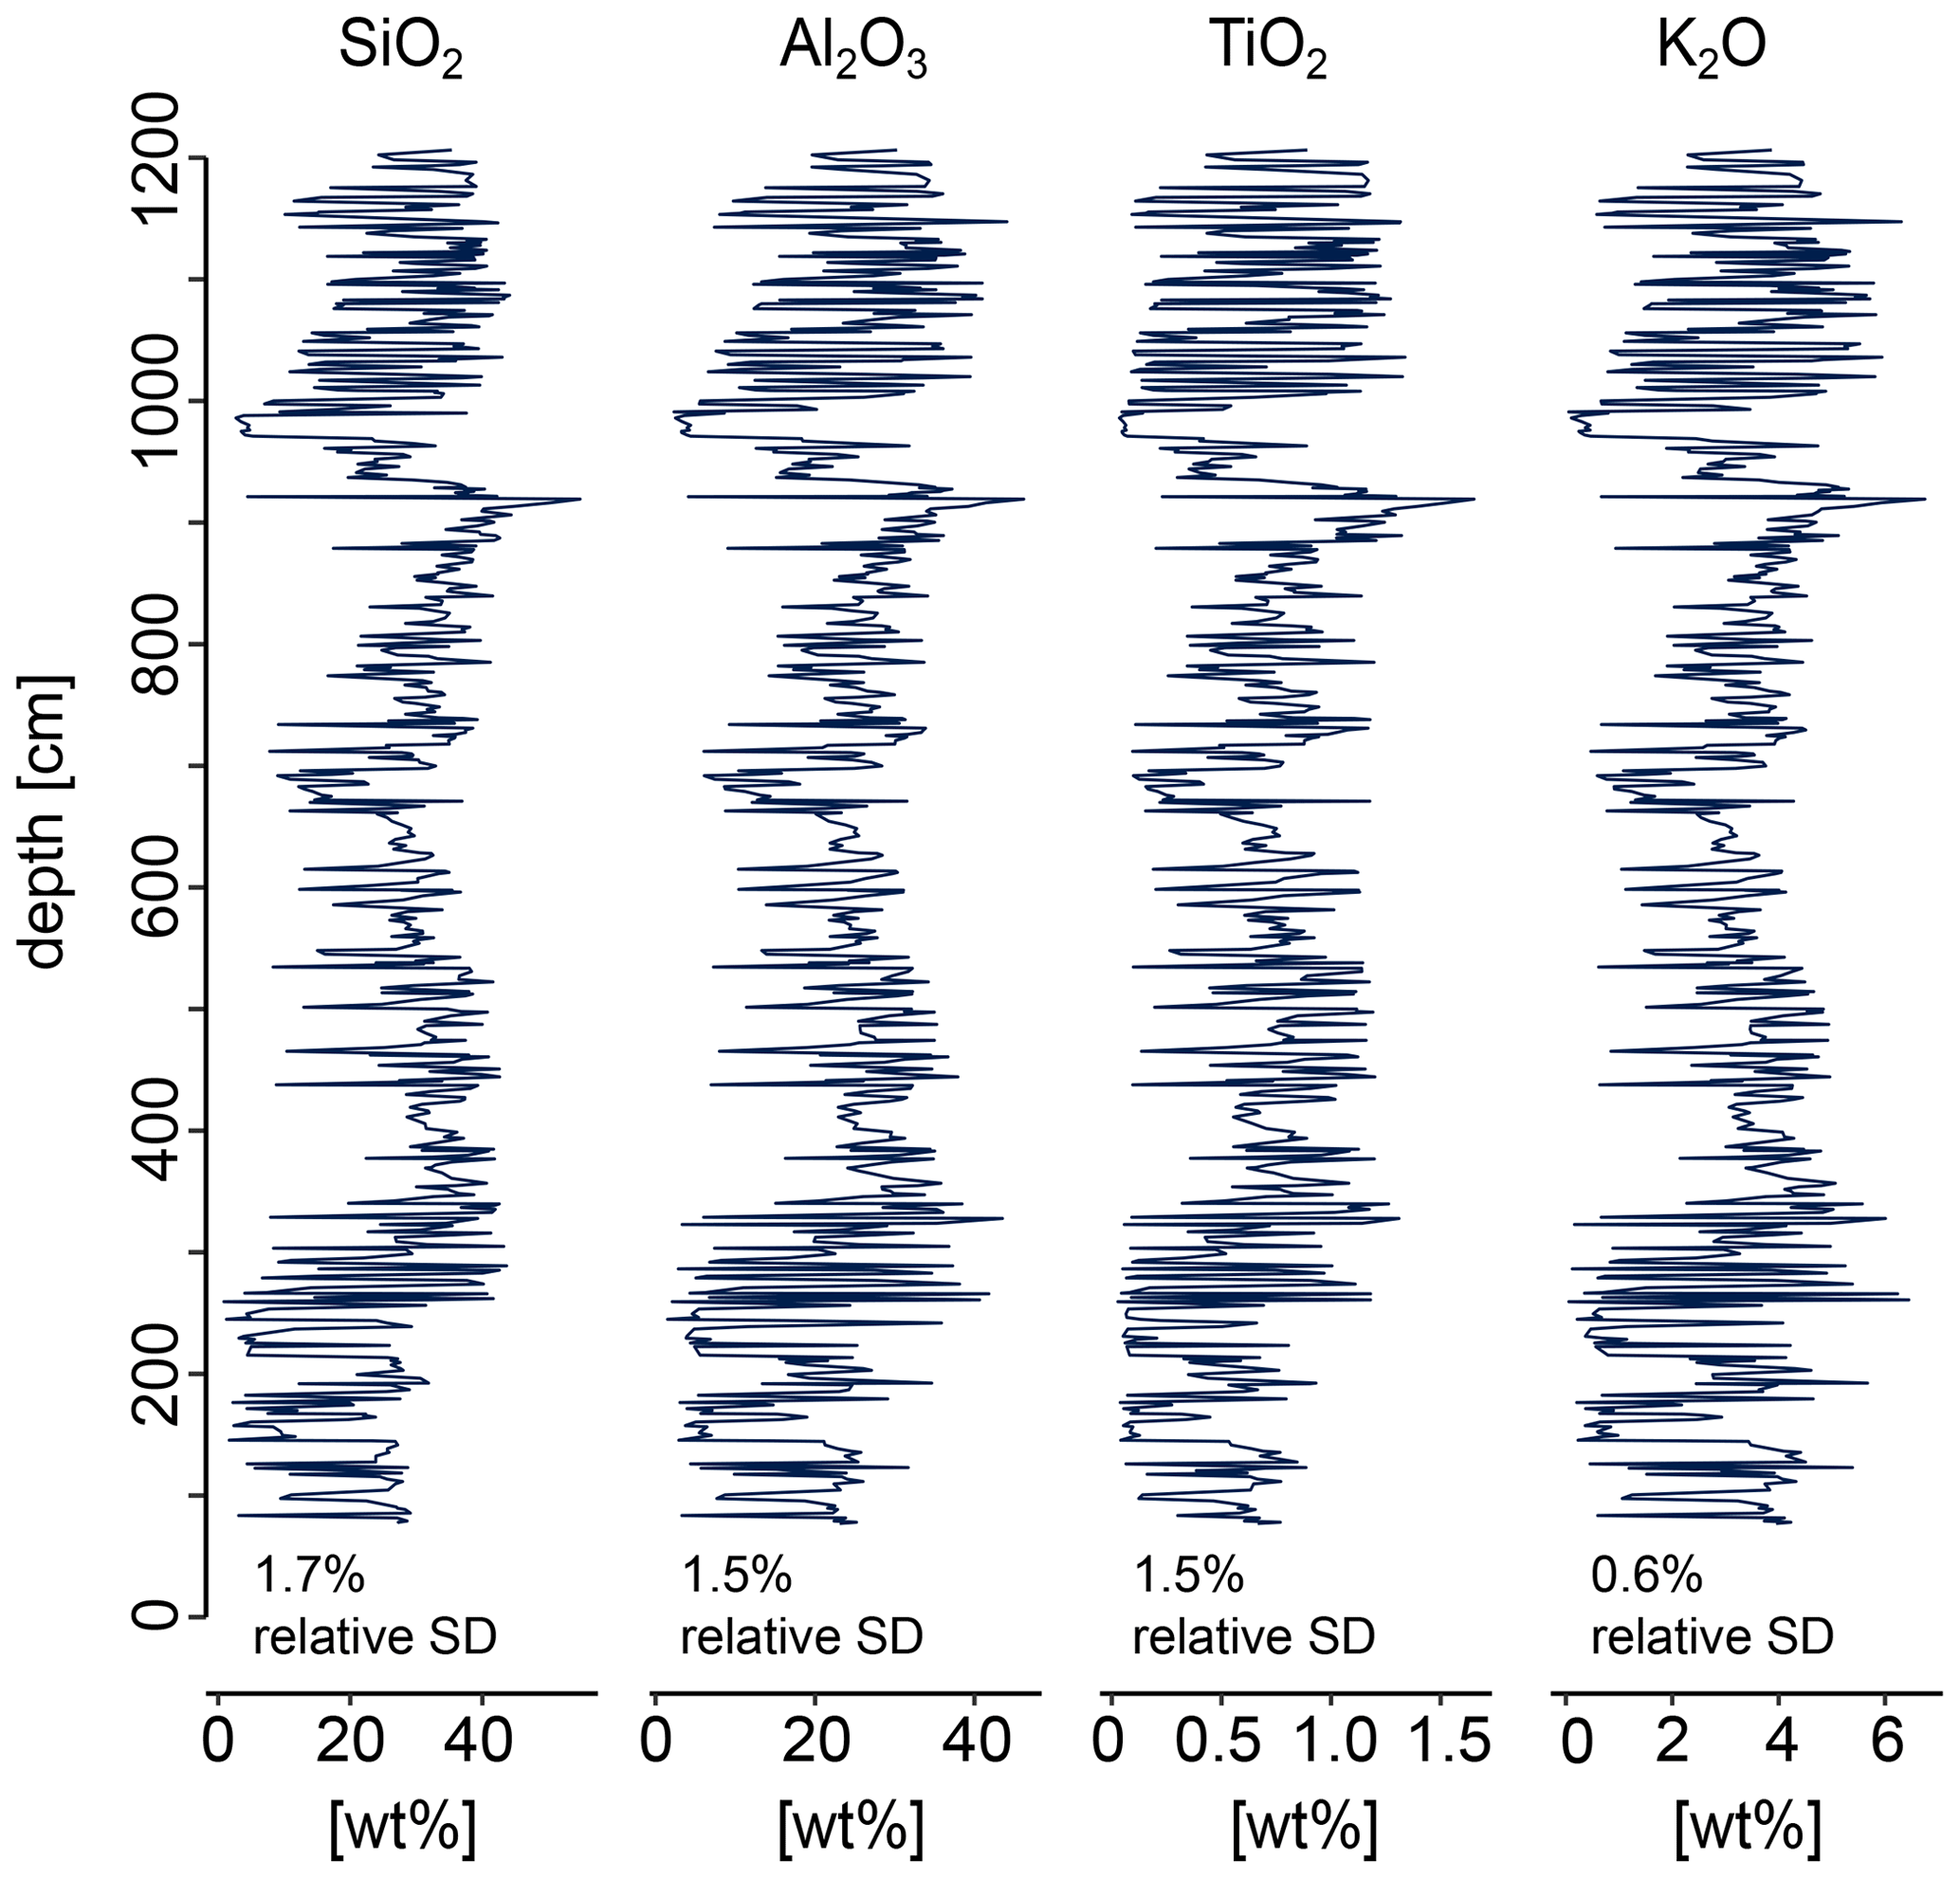
Figure C3pXRF-generated depth records of selected oxides. Their similar behaviour is interpreted as all of them having the same dominant detrital source. SD is for standard deviation.
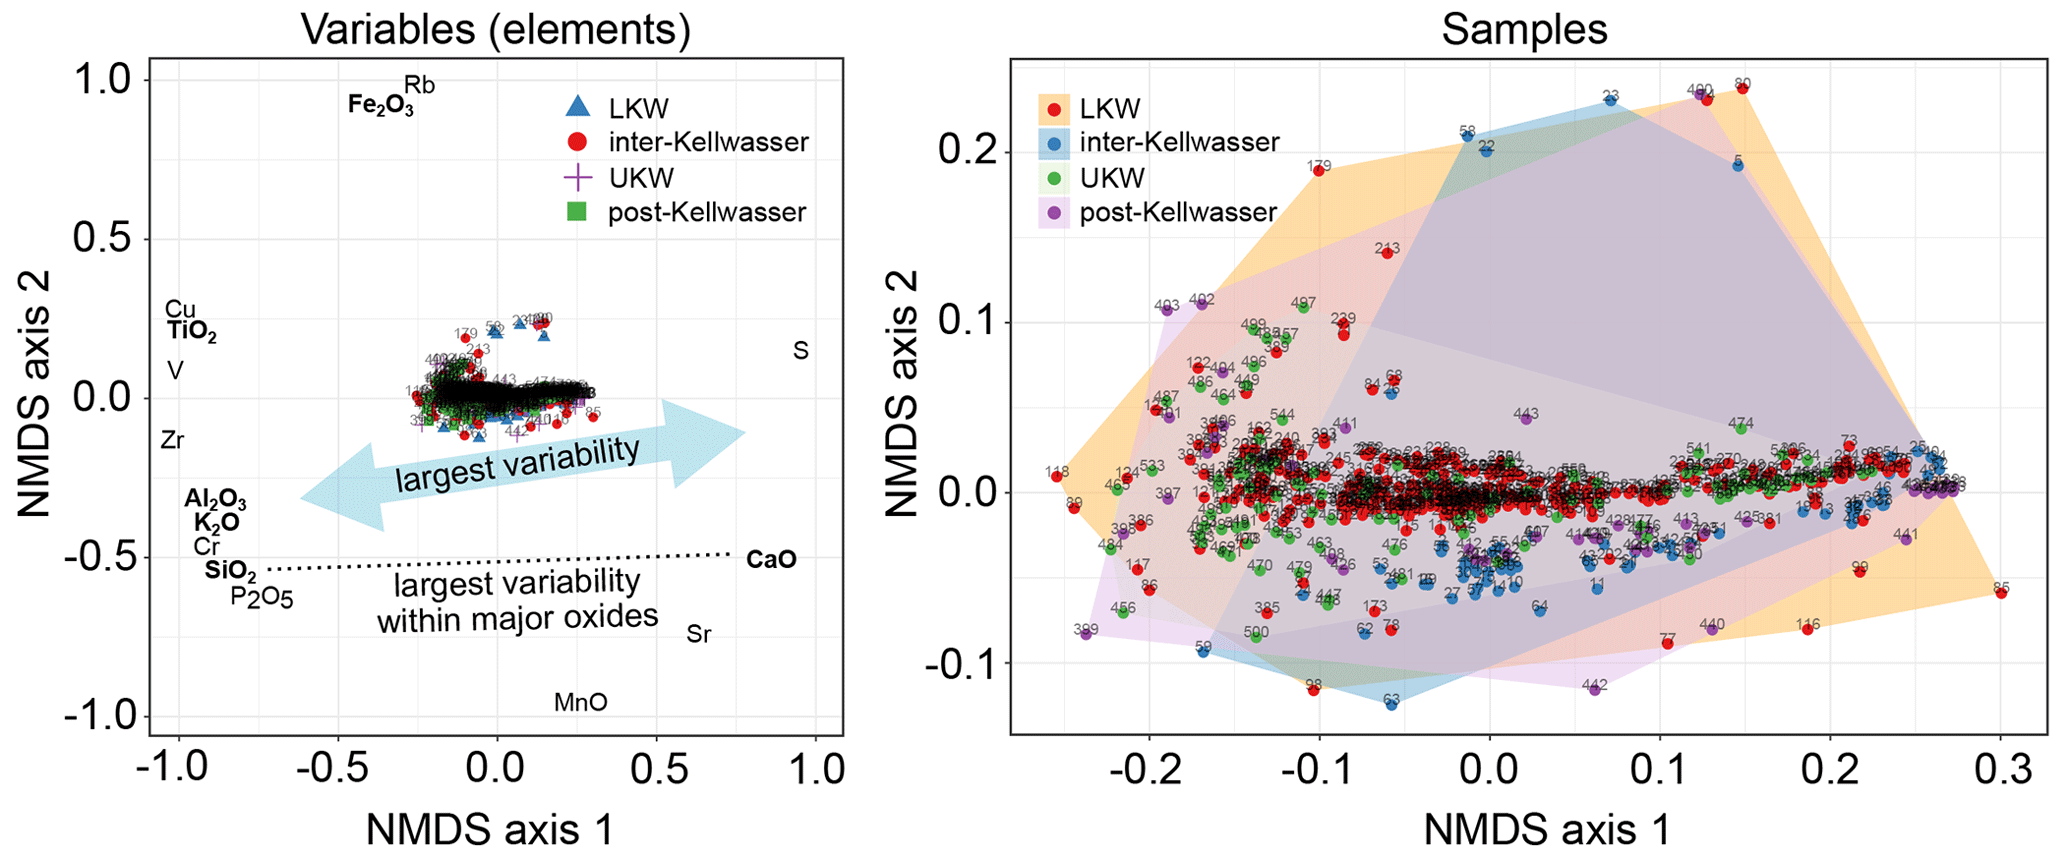
Figure C4Results of non-metric multidimensional scaling (NMDS) analysis of pXRF-generated elements. On the left, the elements are plotted in NMDS space, along with all measured samples. On the right, only the samples are plotted, grouped by stratigraphic interval. The largest variability within the major oxides is represented by the CaO–SiO2 axis.
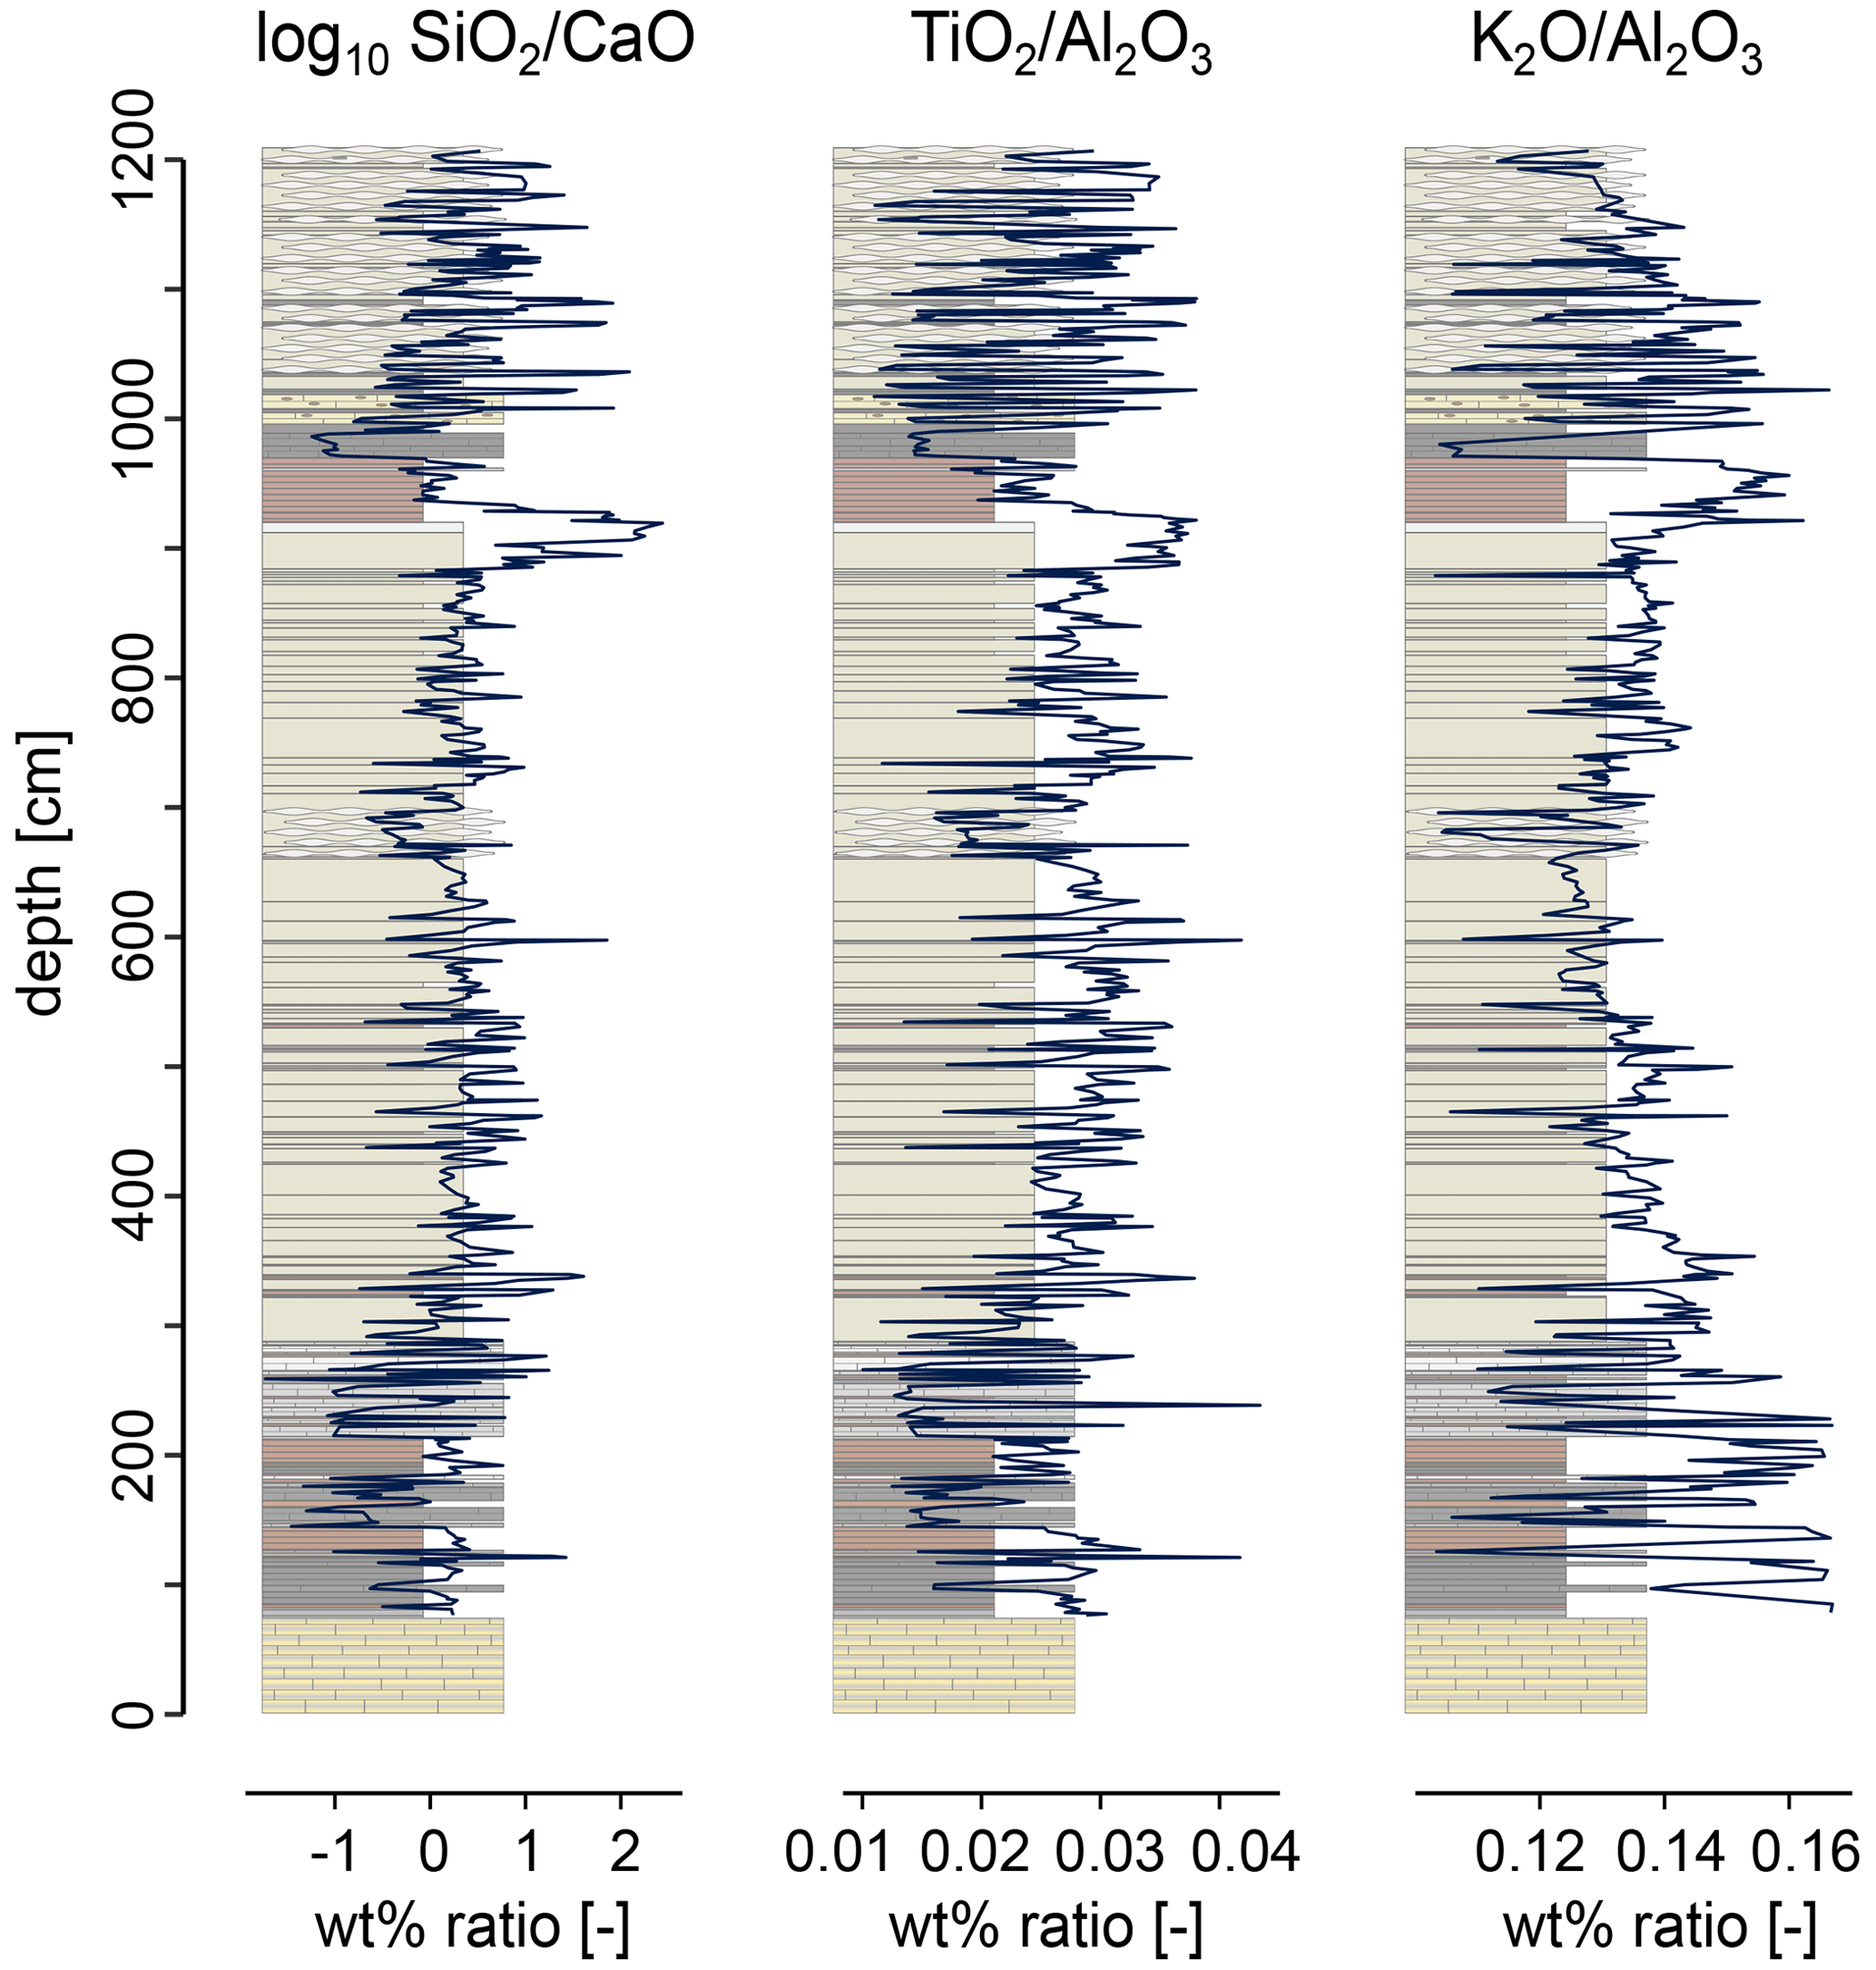
Figure C5Proxies in the depth domain, showing that, despite subtle changes, all three signals are similar and therefore likely all track detrital (terrestrial) signals. Lithologs are plotted in the background to indicate the proxies' relationship to the lithology.
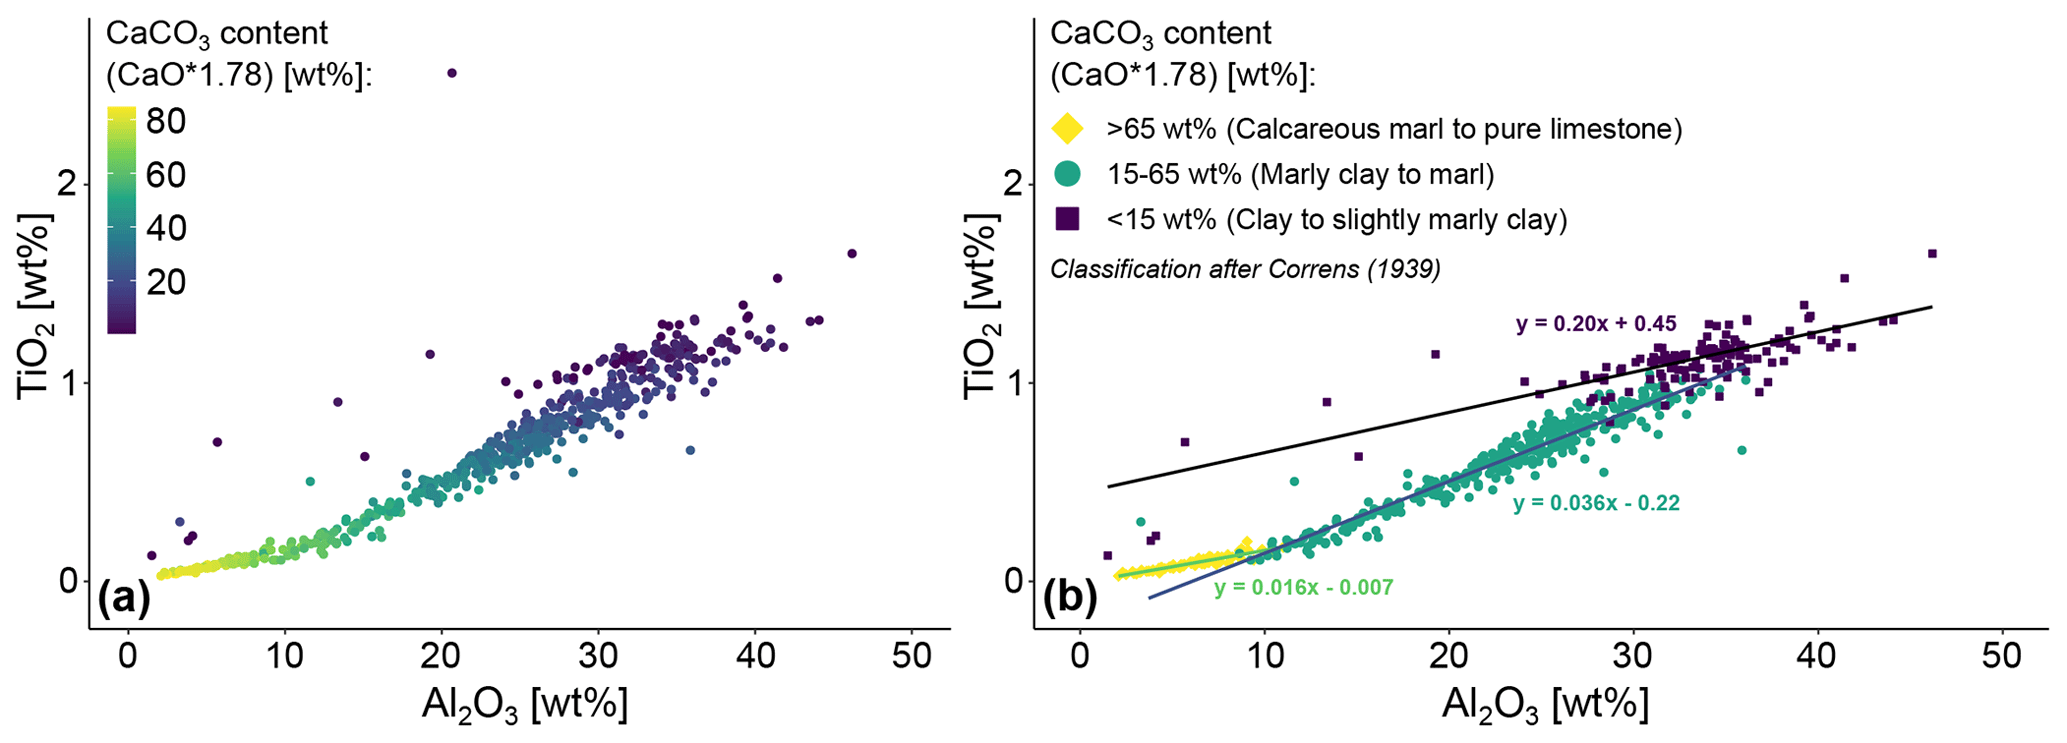
Figure C6TiO2 vs. Al2O3 scatterplots, coloured by carbonate content (estimated as CaO ×1.78 to obtain wt % CaCO3). All measured pXRF data points are included. (a) TiO2 vs. Al2O3 scatterplot coloured using a continuous colour scale for CaCO3 content. It is clear from this plot that the data cannot be represented by a single slope. (b) Same data as panel (a), now with three discrete ranges of carbonate content and corresponding slopes identified. The carbonate cut-off values of 15 wt % and 65 wt % were chosen to reflect the observed changes in slope, while still adhering to an existing classification scheme (here Correns, 1939). These distinct TiO2-Al2O3 relationships within the different lithologies point to an environmental rather than a purely diagenetic origin of the TiO2 Al2O3 signal (for an explanation see Nohl et al., 2021). Note that the pXRF results are only semi-quantitative and that the values on the x and y axes are therefore estimates.
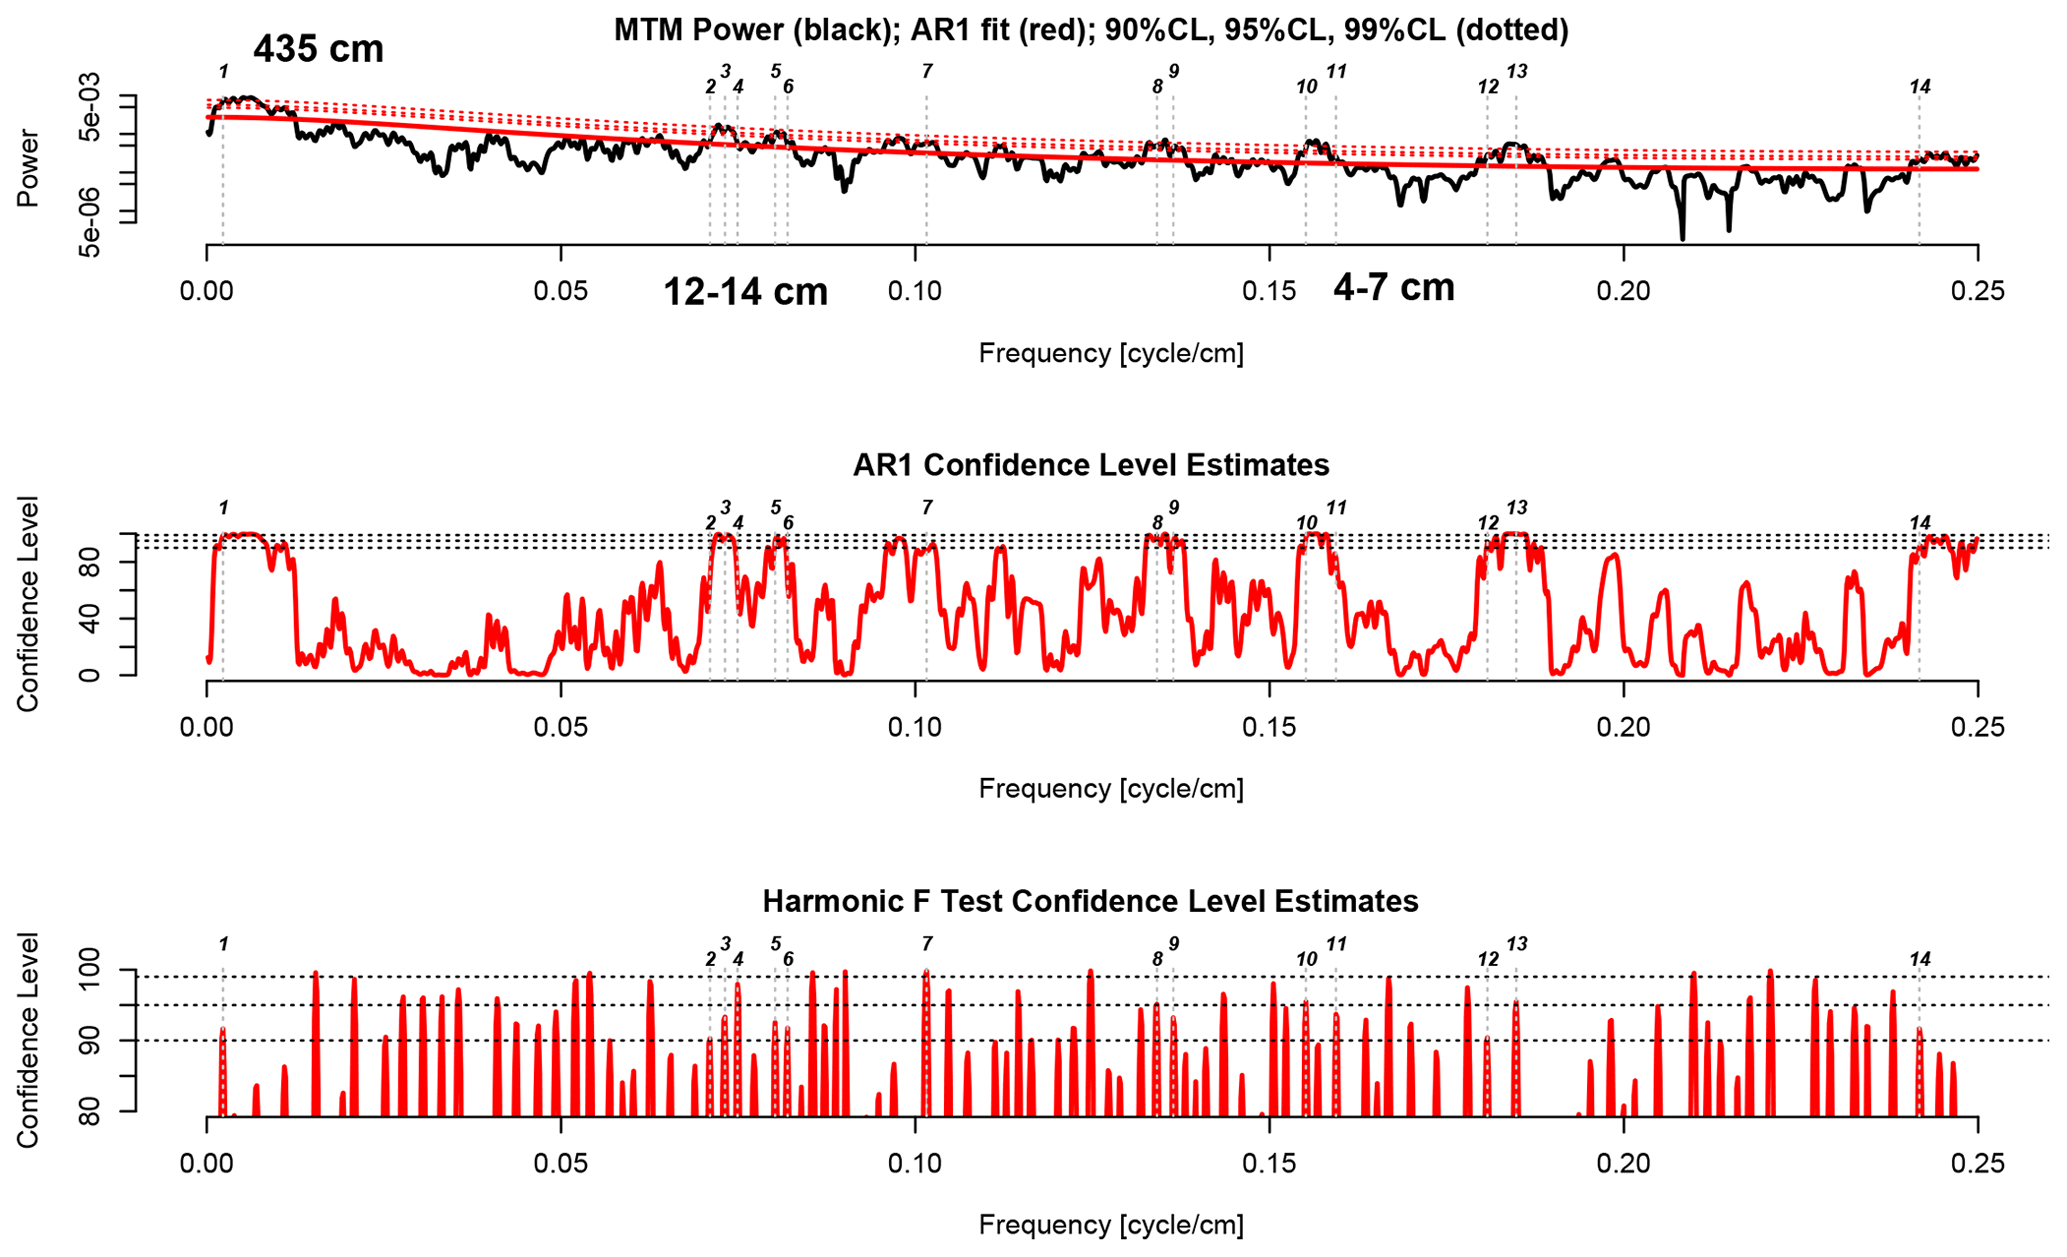
Figure D1Multi-taper method spectral analysis of the detrended log(SiO2 CaO) record along with confidence level estimates, generated with astrochron software. The significant periodicities at 90 % CL are noted in the top plot (length in cm).
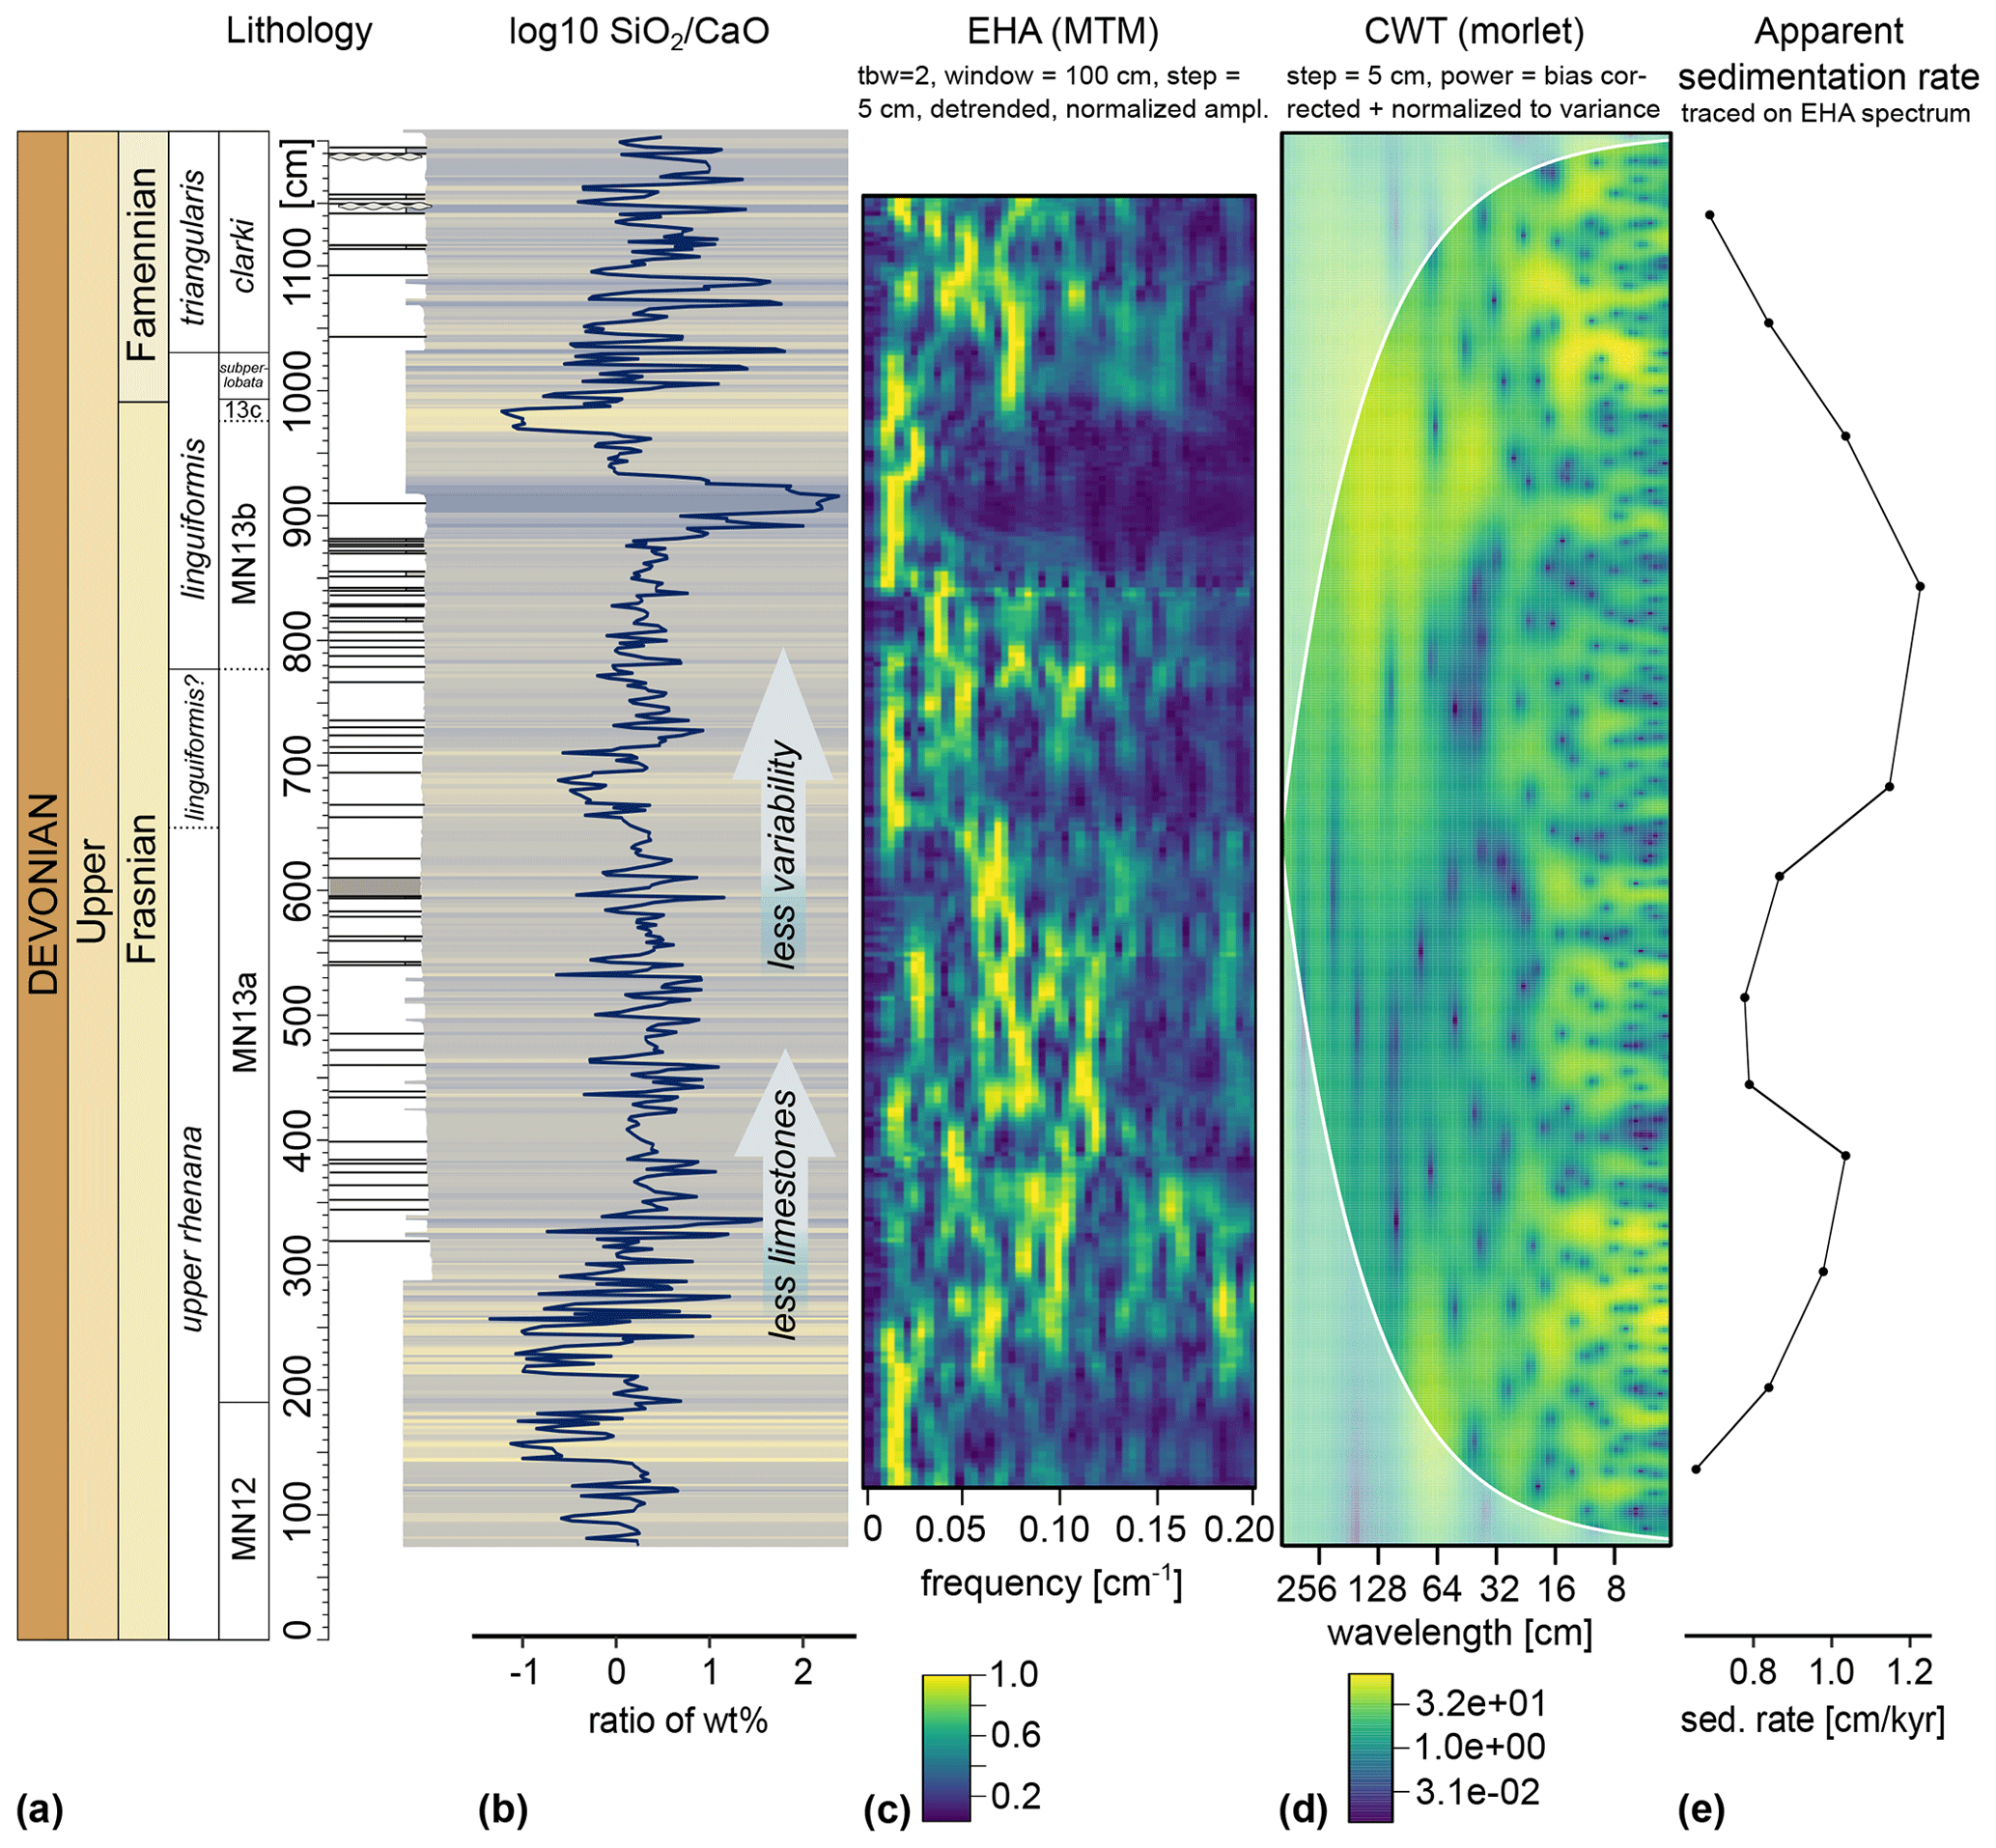
Figure D2Depth domain analysis of the SiO2 CaO signal, with cyclostratigraphic interpretations removed. (a) Conodont biostratigraphy and lithology of the section. (b) log(SiO2 CaO) record. The background is colour coded according to its values, with dark blue for high log(SiO2 CaO), and beige for low log(SiO2 CaO). This emphasizes the correlation between the log(SiO2 CaO) record and the lithology. Gradual lithological changes (less limestone content and less overall variability) are marked with arrows. (c) Evolutive harmonic analysis (EHA) plot of the log(SiO2 CaO) record, suggesting sedimentation changes throughout the record. (d) Continuous wavelet transform (CWT) spectra of the log(SiO2 CaO) record, showing similar but not identical changes to the EHA record. (e) Sedimentation rate changes generated by tracing the frequency identified in Fig. D2c.
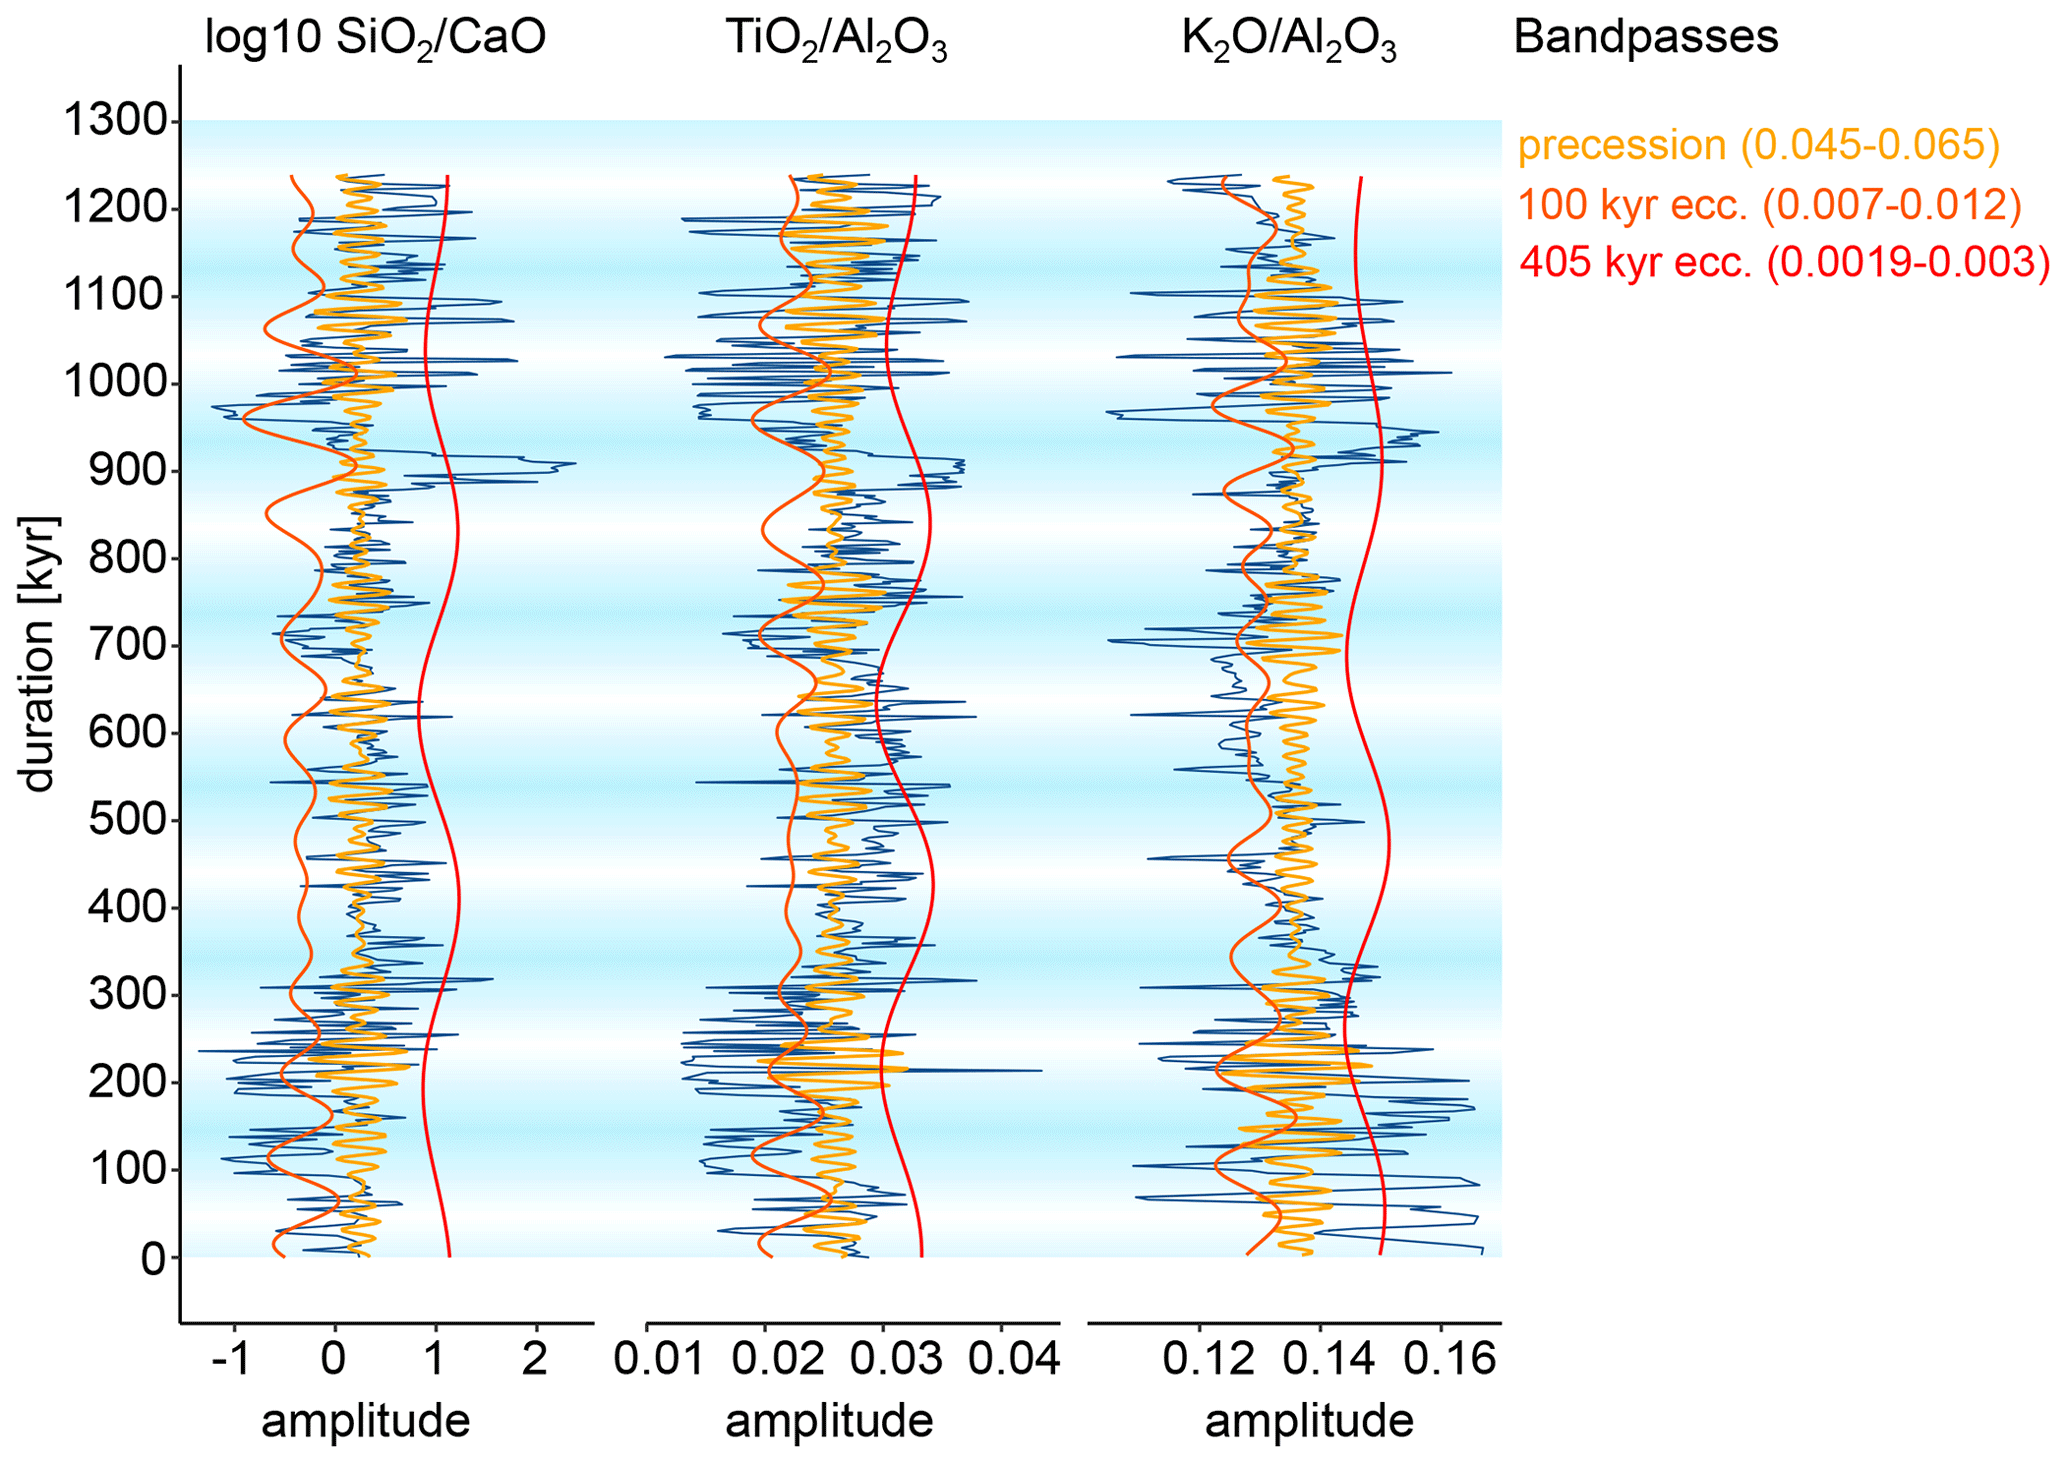
Figure D3Astrochronologically calibrated proxy records with bandpassed precession, 100 kyr eccentricity, and 405 kyr eccentricity. The general patterns are similar across all proxies, including amplitude modulation patterns, but there are mismatches between them as well. The 100 kyr bands (defined by the duration axis on the left) are indicated in blue and white to allow for better comparison between the three proxy records.
All code is available on the following Zenodo repository: https://doi.org/10.5281/zenodo.10160298 (Wichern, 2023).
A PANGAEA DOI is available at https://doi.pangaea.de/10.1594/PANGAEA.965390 (Wichern et al., 2024).
NMAW sampled the section, carried out pXRF and carbon isotope analyses, carried out spectral analysis, did the initial data interpretation, and wrote the original draft. DDV designed the study and oversaw pXRF and spectral analysis. NMAW, TN, LMEP, and DDV collected the samples. OMB and LMEP assisted with the interpretation of geochemical data. TN carried out the interpretation of diagenetic signatures. RTB assisted with lithological interpretations and regional geological correlations. PK and PC assisted with the pXRF calibration. All authors contributed to the editing of the paper and discussion of its contents.
The contact author has declared that none of the authors has any competing interests.
Publisher’s note: Copernicus Publications remains neutral with regard to jurisdictional claims made in the text, published maps, institutional affiliations, or any other geographical representation in this paper. While Copernicus Publications makes every effort to include appropriate place names, the final responsibility lies with the authors.
This project is part of IGCP-652 “Reading Time in Palaeozoic sedimentary rocks”. David De Vleeschouwer acknowledges the support of the CycloNet project, funded by the Research Foundation Flanders (FWO; grant no. W000522N). The authors thank Rohit Samant (University of Bremen) for assisting with pXRF sample preparation; Artur Fugmann (University of Münster) for carrying out the carbonate carbon isotope measurements; Jürgen Titschack (MARUM, Bremen) for carrying out grain size measurements; Peter Schmid-Beurmann (University of Münster) for carrying out XRD measurements; David Verstraeten (VUB) for assisting with organic carbon analyses; and Benjamin Bomfleur (University of Münster) for discussions about the feedback mechanisms between climate, carbon cycle, and Devonian land plants. Lawrence Percival thanks the FWO (postdoctoral fellowship no. 12P4522N). Nina Wichern thanks DAAD for a travel grant to present this work at the 2023 Subcommission on Devonian Stratigraphy meeting in Geneseo, NY, USA. Philippe Claeys thanks VUB Strategic Research and FWO Hercules for financially supporting the lab facilities. Pim Kaskes thanks FWO for doctoral fellowship no. 11E6621N. This article benefited greatly from reviews by Thomas Algeo and Damien Pas.
This research has been supported by the Deutsche Forschungsgemeinschaft (grant no. 451461400). Lawrence Percival has been supported by the FWO (postdoctoral fellowship no. 12P4522N). Pim Kaskes has been supported by the FWO (doctoral fellowship no. 11E6621N).
This open-access publication was funded by University of Münster.
This paper was edited by Yves Godderis and reviewed by Damien Pas and Thomas Algeo.
Ait-Itto, F.-Z., Martinez, M., Deconinck, J.-F., and Bodin, S.: Astronomical calibration of the OAE1b from the Col de Pré-Guittard section (Aptian–Albian), Vocontian Basin, France, Cretaceous Res., 150, 105618, https://doi.org/10.1016/j.cretres.2023.105618, 2023.
Alekseeva, T., Kabanov, P., Alekseev, A., Kalinin, P., and Alekseeva, V.: Characteristics of early Earth's critical zone based on middle–late Devonian paleosol properties (Voronezh high, Russia), Clays Clay Miner., 64, 677–694, https://doi.org/10.1346/CCMN.2016.064044, 2016.
Algeo, T. J. and Scheckler, S. E.: Terrestrial-marine teleconnections in the Devonian: links between the evolution of land plants, weathering processes, and marine anoxic events, Philos. T. R. Soc. B, 353, 113–130, https://doi.org/10.1098/rstb.1998.0195, 1998.
Algeo, T. J., Berner, R. A., Maynard, J. B., and Scheckler, S. E.: Late Devonian oceanic anoxic events and biotic crises: “rooted” in the evolution of vascular land plants?, GSA Today, 5, 45–66, 1995.
Algeo, T. J., Scheckler, S. E., and Maynard, J. B.: 12. Effects of the Middle to Late Devonian Spread of Vascular Land Plants on Weathering Regimes, Marine Biotas, and Global Climate, in: Plants Invade the Land, edited by: Gensel, P. G. and Edwards, D., Columbia University Press, 213–236, https://doi.org/10.7312/gens11160-013, 2001.
Averbuch, O., Tribovillard, N., Devleeschouwer, X., Riquier, L., Mistiaen, B., and Van Vliet-Lanoe, B.: Mountain building-enhanced continental weathering and organic carbon burial as major causes for climatic cooling at the Frasnian-Famennian boundary (c. 376 Ma)?, Terra Nova, 17, 25–34, https://doi.org/10.1111/j.1365-3121.2004.00580.x, 2005.
Balter, V., Renaud, S., Girard, C., and Joachimski, M. M.: Record of climate-driven morphological changes in 376 Ma Devonian fossils, Geology, 36, 907, https://doi.org/10.1130/G24989A.1, 2008.
Bambach, R. K.: Phanerozoic Biodiversity Mass Extinctions, Annu. Rev. Earth Pl. Sc., 34, 127–155, https://doi.org/10.1146/annurev.earth.33.092203.122654, 2006.
Batenburg, S. J., De Vleeschouwer, D., Sprovieri, M., Hilgen, F. J., Gale, A. S., Singer, B. S., Koeberl, C., Coccioni, R., Claeys, P., and Montanari, A.: Orbital control on the timing of oceanic anoxia in the Late Cretaceous, Clim. Past, 12, 1995–2009, https://doi.org/10.5194/cp-12-1995-2016, 2016.
Becker, R. T.: Die Geologie des Gebietes nördlich von Adorf zwischen Rhenetal und R 3487 (MBL 4618 Adorf). Unveröffentlichte Diplom-Kartierung, Ruhr-University Bochum, Bochum, 68 pp., 1984.
Becker, R. T.: Stratigraphische Gliederung und Ammonoideen-Faunen im Nehdenium (Oberdevon II) von Europa und Nord-Afrika, Courier Forschungsinstitut Senckenberg, 155, 1–405, Schweizerbart, ISBN 9783510611164, 1993.
Becker, R. T. and House, M. R.: Kellwasser Events and goniatite successions in the Devonian of the Montagne Noire with comments on possible causations, Courier Forschungsinstitut Senckenberg, 169, 45–77, https://www.researchgate.net/publication/262715543_Kellwasser-Events_and_goniatite_successions_in_the_Devonian_of_the_Montagne_Noire_with_comments_on_possible_causations (last access: 14 February 2024), 1994.
Becker, R. T., Aboussalam, Z. S., Hartenfels, S., Nowak, H., Juch, D., and Drozdzewski, G.: Drowning and sedimentary cover of Velbert Anticline reef complexes (northwestern Rhenish Massif), Münstersche Forschungen zur Geologie und Paläontologie, 108, 76–101, 2016a.
Becker, R. T., Piecha, M., Gereke, M., and Spellbrink, K.: The Frasnian/Famennian boundary in shelf basin facies north of Diemelsee-Adorf., Münstersche Forschungen zur Geologie und Paläontologie, 108, 220–231, 2016b.
Becker, R. T., Marshall, J. E. A., Da Silva, A. C., Agterberg, F. P., Gradstein, F. M., and Ogg, J. G.: Chapter 22 – The Devonian Period., in: Geologic Time Scale 2020, edited by: Gradstein, F. M., Ogg, J. G., Schmitz, M. D., and Ogg, G. M., vol. 2, Elsevier, 733–810, https://doi.org/10.1016/B978-0-12-824360-2.00022-X, 2020.
Berner, R. A.: Weathering, plants, and the long-term carbon cycle, Geochim. Cosmochim. Ac., 56, 3225–3231, https://doi.org/10.1016/0016-7037(92)90300-8, 1992.
Blakey, R. C.: Global Paleogeography, https://deeptimemaps.com/ (last access: 14 February 2024), 2016.
Bond, D., Wignall, P. B., and Racki, G.: Extent and duration of marine anoxia during the Frasnian–Famennian (Late Devonian) mass extinction in Poland, Germany, Austria and France, Geol. Mag., 141, 173–193, https://doi.org/10.1017/S0016756804008866, 2004.
Bond, D. P. G. and Wignall, P. B.: The role of sea-level change and marine anoxia in the Frasnian–Famennian (Late Devonian) mass extinction, Palaeogeogr. Palaeocl., 263, 107–118, https://doi.org/10.1016/j.palaeo.2008.02.015, 2008.
Boucot, A. J., Xu, C., Scotese, C. R., and Morley, R. J.: Phanerozoic Paleoclimate: An Atlas of Lithologic Indicators of Climate, SEPM (Society for Sedimentary Geology), Tulsa, Oklahoma, USA, SEPM Society for Sedimentary Geology, https://doi.org/10.2110/sepmcsp.11, 2013.
Boyce, C. K. and Lee, J.-E.: Plant Evolution and Climate Over Geological Timescales, Annu. Rev. Earth Pl. Sci., 45, 61–87, https://doi.org/10.1146/annurev-earth-063016-015629, 2017.
Brugger, J., Hofmann, M., Petri, S., and Feulner, G.: On the Sensitivity of the Devonian Climate to Continental Configuration, Vegetation Cover, Orbital Configuration, CO2, Concentration, and Insolation, Paleoceanogr. Paleocl., 34, 1375–1398, https://doi.org/10.1029/2019PA003562, 2019.
Buggisch, W.: The global Frasnian-Famennian “Kellwasser Event”, Geol. Rundsch., 80, 49–72, https://doi.org/10.1007/BF01828767, 1991.
Buggisch, W. and Joachimski, M. M.: Carbon isotope stratigraphy of the Devonian of Central and Southern Europe, Palaeogeogr. Palaeocl., 240, 68–88, https://doi.org/10.1016/j.palaeo.2006.03.046, 2006.
Butler, B. M. and Hillier, S.: powdR: An R package for quantitative mineralogy using full pattern summation of X-ray powder diffraction data, Comput. Geosci., 147, 104662, https://doi.org/10.1016/j.cageo.2020.104662, 2021.
Calvert, S. E. and Pedersen, T. F.: Chapter fourteen elemental proxies for palaeoclimatic and palaeoceanographic variability in marine sediments: interpretation and application, in: Developments in Marine Geology, vol. 1, Elsevier, 567–644, https://doi.org/10.1016/S1572-5480(07)01019-6, 2007.
Cao, W., Williams, S., Flament, N., Zahirovic, S., Scotese, C., and Müller, R. D.: Palaeolatitudinal distribution of lithologic indicators of climate in a palaeogeographic framework, Geol. Mag., 156, 331–354, https://doi.org/10.1017/S0016756818000110, 2019.
Carmichael, S. K., Waters, J. A., Königshof, P., Suttner, T. J., and Kido, E.: Paleogeography and paleoenvironments of the Late Devonian Kellwasser event: A review of its sedimentological and geochemical expression, Global Planet. Change, 183, 102984, https://doi.org/10.1016/j.gloplacha.2019.102984, 2019.
Chadwick, O. A., Derry, L. A., Vitousek, P. M., Huebert, B. J., and Hedin, L. O.: Changing sources of nutrients during four million years of ecosystem development, Nature, 397, 491–497, https://doi.org/10.1038/17276, 1999.
Chen, D. and Tucker, M. E.: The Frasnian–Famennian mass extinction: insights from high-resolution sequence stratigraphy and cyclostratigraphy in South China., Palaeogeogr. Palaeocl., 193, 87–111, https://doi.org/10.1016/S0031-0182(02)00716-2, 2003.
Claisse, F. and Samson, C.: Heterogeneity Effects in X-Ray Analysis, Adv. x-ray anal., 5, 335–354, https://doi.org/10.1154/S0376030800001671, 1961.
Clift, P. D., Hodges, K. V., Heslop, D., Hannigan, R., Van Long, H., and Calves, G.: Correlation of Himalayan exhumation rates and Asian monsoon intensity, Nat. Geosci., 1, 875–880, https://doi.org/10.1038/ngeo351, 2008.
Clift, P. D., Wan, S., and Blusztajn, J.: Reconstructing chemical weathering, physical erosion and monsoon intensity since 25 Ma in the northern South China Sea: A review of competing proxies, Earth-Sci. Rev., 130, 86–102, https://doi.org/10.1016/j.earscirev.2014.01.002, 2014.
Copper, P.: Frasnian/Famennian mass extinction and cold-water oceans, Geology, 14, 835, https://doi.org/10.1130/0091-7613(1986)14<835:FMEACO>2.0.CO;2, 1986.
Correns, C. W.: Die Sedimentgesteine, in: Die Entstehung der Gesteine, edited by: Barth, T. F. W., Correns, C. W., and Eskola, P., Springer Berlin Heidelberg, Berlin, Heidelberg, 116–262, https://doi.org/10.1007/978-3-642-86244-1_2, 1939.
Courtillot, V., Kravchinsky, V. A., Quidelleur, X., Renne, P. R., and Gladkochub, D. P.: Preliminary dating of the Viluy traps (Eastern Siberia): Eruption at the time of Late Devonian extinction events?, Earth Planet. Sc. Lett., 300, 239–245, https://doi.org/10.1016/j.epsl.2010.09.045, 2010.
Cramer, B. D. and Jarvis, I.: Carbon Isotope Stratigraphy, in: Geologic Time Scale 2020, Elsevier, 309–343, https://doi.org/10.1016/B978-0-12-824360-2.00011-5, 2020.
Da Silva, A.-C., Sinnesael, M., Claeys, P., Davies, J. H. F. L., de Winter, N. J., Percival, L. M. E., Schaltegger, U., and De Vleeschouwer, D.: Anchoring the Late Devonian mass extinction in absolute time by integrating climatic controls and radio-isotopic dating, Nat. Sci. Rep., 10, 1–12, https://doi.org/10.1038/s41598-020-69097-6, 2020.
D'Antonio, M. P., Ibarra, D. E., and Boyce, C. K.: Land plant evolution decreased, rather than increased, weathering rates, Geology, 48, 29–33, https://doi.org/10.1130/G46776.1, 2020.
Denayer, J., Prestianni, C., Mottequin, B., Hance, L., and Poty, E.: The Devonian – Carboniferous boundary in Belgium and surrounding areas, Palaeobio. Palaeoenv., 101, 313–356, https://doi.org/10.1007/s12549-020-00440-5, 2021.
De Vleeschouwer, D., Crucifix, M., Bounceur, N., and Claeys, P.: The impact of astronomical forcing on the Late Devonian greenhouse climate, Global Planet. Change, 20, 65–80, https://doi.org/10.1016/j.gloplacha.2014.06.002, 2014.
De Vleeschouwer, D., Da Silva, A.-C., Sinnesael, M., Chen, D., Day, J. E., Whalen, M. T., Guo, Z., and Claeys, P.: Timing and pacing of the Late Devonian mass extinction event regulated by eccentricity and obliquity, Nat. Commun., 8, 2268, https://doi.org/10.1038/s41467-017-02407-1, 2017.
Devleeschouwer, X., Herbosch, A., and Préat, A.: Microfacies, sequence stratigraphy and clay mineralogy of a condensed deep-water section around the Frasnian/Famennian boundary (Steinbruch Schmidt, Germany), Palaeogeogr. Palaeocl., 181, 171–193, https://doi.org/10.1016/S0031-0182(01)00478-3, 2002.
Driese, S. G. and Mora, C. I.: 13. Diversification of Siluro-Devonian Plant Traces in Paleosols and Influence on Estimates of Paleoatmospheric CO 2 Levels, in: Plants Invade the Land, edited by: Gensel, P. G. and Edwards, D., Columbia University Press, 237–254, https://doi.org/10.7312/gens11160-014, 2001.
Eder, W., Engel, W., and Franke, W.: Pasläogeographie an der Wende Mittel-/Oberdevon (Faziesübergang Schelf/Becken am Beispiel von Briloner Massenkalk, Padberger Kalk und Flinz; Aufschlüsse 4 bis 6), Geotagung '77 Göttingen, Exkursions-Führer I, 22–29, 1977.
Ernst, R. E., Rodygin, S. A., and Grinev, O. M.: Age correlation of Large Igneous Provinces with Devonian biotic crises, Global Planet. Change, 185, 103097, https://doi.org/10.1016/j.gloplacha.2019.103097, 2020.
Franke, W.: Devon und Unterkarbon des Waldecker Landes-Ein Paläogeographischer Querschnitt (Exkursion C am 4. April 1991), Jahresberichte und Mitteilungen des Oberrheinischen Geologischen Vereins, Neue Folge, 73, 57–78, 1991.
Franke, W., Meischner, D., and Oncken, O.: Geologie eines passiven Plattenrandes: Devon und Karbon im Rechtsrheinischen Schiefergebirge., Exkursion der Geologischen Vereinigung, Nr. 3, Gießen, Göttingen, Potsdam, 74 pp., 1996.
Genise, J. F., Bedatou, E., Bellosi, E. S., Sarzetti, L. C., Sánchez, M. V., and Krause, J. M.: The Phanerozoic Four Revolutions and Evolution of Paleosol Ichnofacies, in: The Trace-Fossil Record of Major Evolutionary Events, vol. 40, edited by: Mángano, M. G. and Buatois, L. A., Springer Netherlands, Dordrecht, 301–370, https://doi.org/10.1007/978-94-017-9597-5_6, 2016.
Gereke, M.: Die oberdevonische Kellwasser-Krise in der Beckenfazies von Rhenohercynikum und Saxothuringikum (spätes Frasnium, frühestes Famennium, Deutschland), Kölner Forum Geol. Paläont., 17, 1–199, 2007.
Gereke, M. and Schindler, E.: “Time-Specific Facies” and biological crises – The Kellwasser Event interval near the Frasnian/Famennian boundary (Late Devonian), Palaeogeogr. Palaeocl., 367–368, 19–29, https://doi.org/10.1016/j.palaeo.2011.11.024, 2012.
Gibling, M. R. and Davies, N. S.: Palaeozoic landscapes shaped by plant evolution, Nat. Geosci., 5, 99–105, https://doi.org/10.1038/ngeo1376, 2012.
Gong, Y.-M., Li, B.-H., Wang, C.-Y., and Wu, Y.: Orbital cyclostratigraphy of the Devonian Frasnian–Famennian transition in South China, Palaeogeogr. Palaeocl., 168, 237–248, https://doi.org/10.1016/S0031-0182(00)00257-1, 2001.
Gouhier, T. C., Grinsted, A., and Simko, V.: R package biwavelet: Conduct Univariate and Bivariate Wavelet Analyses (Version 0.20.21), GitHub [code], https://github.com/tgouhier/biwavelet (last access: 14 February 2024), 2021.
Griffin, J. J., Windom, H., and Goldberg, E. D.: The distribution of clay minerals in the World Ocean, Deep Sea Research and Oceanographic Abstracts, 15, 433–459, https://doi.org/10.1016/0011-7471(68)90051-X, 1968.
Harrigan, C. O., Schmitz, M. D., Over, D. J., Trayler, R. B., and Davydov, V. I.: Recalibrating the Devonian time scale: A new method for integrating radioisotopic and astrochronologic ages in a Bayesian framework, GSA Bulletin, 134, 1931001948, https://doi.org/10.1130/B36128.1, 2021.
Hartenfels, S., Becker, R. T., and Aboussalam, Z. S.: Givetian to Famennian stratigraphy, Kellwasser, Annulata and other events at Beringhauser Tunnel (Messinghausen Anticline, eastern Rhenish Massif), Münstersche Forschungen zur Geologie und Paläontologie, 108, 196–219, 2016.
Hartkopf-Fröder, C., Kloppisch, M., Mann, U., Neumann-Mahlkau, P., Schaefer, R. G., and Wilkes, H.: The end-Frasnian mass extinction in the Eifel Mountains, Germany: new insights from organic matter composition and preservation. in: Devonian Events and Correlation, edited by: Becker, R. T., and Kirchgasser, W. T., Geological Society, London, Special Publications, 278, 173–196, https://doi.org/10.1144/SP278.8, 2007.
Hu, D., Clift, P. D., Wan, S., Böning, P., Hannigan, R., Hillier, S., and Blusztajn, J.: Testing chemical weathering proxies in Miocene–Recent fluvial-derived sediments in the South China Sea, Geol. Soc. Lond. Spec. Publ., 429, 45–72, https://doi.org/10.1144/SP429.5, 2016.
Huang, C., Joachimski, M. M., and Gong, Y.: Did climate changes trigger the Late Devonian Kellwasser Crisis? Evidence from a high-resolution conodont δ18O PO 4 record from South China, Earth Planet. Sc. Lett., 495, 174–184, https://doi.org/10.1016/j.epsl.2018.05.016, 2018.
Ibarra, D. E., Rugenstein, J. K. C., Bachan, A., Baresch, A., Lau, K. V., Thomas, D. L., Lee, J.-E., Boyce, C. K., and Chamberlain, C. P.: Modeling the consequences of land plant evolution on silicate weathering, Am. J. Sci., 319, 1–43, https://doi.org/10.2475/01.2019.01, 2019.
Jenkyns, H. C.: Geochemistry of oceanic anoxic events, Geochem. Geophy. Geosy., 11, Q03004, https://doi.org/10.1029/2009GC002788, 2010.
Joachimski, M. M.: Comparison of organic and inorganic carbon isotope patterns across the Frasnian–Famennian boundary, Palaeogeogr. Palaeocl., 132, 133–145, https://doi.org/10.1016/S0031-0182(97)00051-5, 1997.
Joachimski, M. M. and Buggisch, W.: Anoxic events in the late Frasnian – Causes of the Frasnian-Famennian faunal crisis?, Geology, 21, 675–678, https://doi.org/10.1130/0091-7613(1993)021<0675:AEITLF>2.3.CO;2, 1993.
Joachimski, M. M. and Buggisch, W.: Conodont apatite δ18O signatures indicate climatic cooling as a trigger of the Late Devonian mass extinction, Geology, 30, 711, https://doi.org/10.1130/0091-7613(2002)030<0711:CAOSIC>2.0.CO;2, 2002.
Joachimski, M. M., Ostertag-Henning, C., Pancost, R. D., Strauss, H., Freeman, K. H., Littke, R., Sinninghe Damsté, J. S., and Racki, G.: Water column anoxia, enhanced productivity and concomitant changes in δ13C and δ34S across the Frasnian–Famennian boundary (Kowala – Holy Cross Mountains/Poland), Chem. Geol., 175, 109–131, https://doi.org/10.1016/S0009-2541(00)00365-X, 2001.
Joachimski, M. M., Pancost, R. D., Freeman, K. H., Ostertag-Henning, C., and Buggisch, W.: Carbon isotope geochemistry of the Frasnian–Famennian transition., Palaeogeogr. Palaeocl., 181, 91–109, https://doi.org/10.1016/S0031-0182(01)00474-6, 2002.
Jochum, K. P. and Nohl, U.: Reference materials in geochemistry and environmental research and the GeoReM database, Chem. Geol., 253, 50–53, https://doi.org/10.1016/j.chemgeo.2008.04.002, 2008.
Johnson, J. G., Klapper, G., and Sandberg, C. A.: Devonian eustatic fluctuations in Euramerica, Geol. Soc. Am. Bull., 96, 567, https://doi.org/10.1130/0016-7606(1985)96<567:DEFIE>2.0.CO;2, 1985.
Jutras, P., Quillan, R. S., and LeForte, M. J.: Evidence from Middle Ordovician paleosols for the predominance of alkaline groundwater at the dawn of land plant radiation, Geology, 37, 91–94, https://doi.org/10.1130/G25447A.1, 2009.
Kabanov, P., Hauck, T. E., Gouwy, S. A., Grasby, S. E., and van der Boon, A.: Oceanic anoxic events, marine photic-zone euxinia, and controversy of sea-level fluctuations during the Middle-Late Devonian, Earth-Sci. Rev., 241, 104415, https://doi.org/10.1016/j.earscirev.2023.104415, 2023.
Kaiho, K., Yatsu, S., Oba, M., Gorjan, P., Casier, J.-G., and Ikeda, M.: A forest fire and soil erosion event during the Late Devonian mass extinction, Palaeogeogr. Palaeocl., 392, 272–280, https://doi.org/10.1016/j.palaeo.2013.09.008, 2013.
Kaiser, S. I., Aretz, M., and Becker, R. T.: The global Hangenberg Crisis (Devonian–Carboniferous transition): review of a first-order mass extinction, in: Devonian Climate, Sea Level and Evolutionary Events, edited by: Becker, R. T., Königshof, P., and Brett, C. E., Geological Society, London, Special Publications, 423, 387–437, https://doi.org/10.1144/SP423.9, 2016.
Königshof, P.: Der Farbanderungsindex von Conodonten (CAI) in palaozoischen Gesteinen (Mitteldevon bis Unterkarbon) des Rheinischen Schiefergebirges – Eine Erganzung zur Vitrinitreflexion, Courier Forschungsinstitut Senckenberg, Frankfurt/Main, Schweizerbart, 118 pp., ISBN 978-3-510-61122-5, 1992.
Lash, G. G.: A multiproxy analysis of the Frasnian-Famennian transition in western New York State, U.S.A, Palaeogeogr. Palaeocl., 473, 108–122, https://doi.org/10.1016/j.palaeo.2017.02.032, 2017.
Lenton, T. M., Crouch, M., Johnson, M., Pires, N., and Dolan, L.: First plants cooled the Ordovician, Nat. Geosci., 5, 86–89, https://doi.org/10.1038/ngeo1390, 2012.
Li, C., Yang, S., Zhao, J., Dosseto, A., Bi, L., and Clark, T. R.: The time scale of river sediment source-to-sink processes in East Asia, Chem. Geol., 446, 138–146, https://doi.org/10.1016/j.chemgeo.2016.06.012, 2016.
Liu, Z., Percival, L. M. E., Vandeputte, D., Selby, D., Claeys, P., Over, D. J., and Gao, Y.: Upper Devonian mercury record from North America and its implications for the Frasnian–Famennian mass extinction, Palaeogeogr. Palaeocl., 576, 110502, https://doi.org/10.1016/j.palaeo.2021.110502, 2021.
Lourens, L. J., Hilgen, F. J., Gudjonsson, L., and Zachariasse, W. J.: Late Pliocene to early Pleistocene astronomically forced sea surface productivity and temperature variations in the Mediterranean, Mar. Micropaleontology, 19, 49–78, https://doi.org/10.1016/0377-8398(92)90021-B, 1992.
Lu, M., Lu, Y., Ikejiri, T., Sun, D., Carroll, R., Blair, E. H., Algeo, T. J., and Sun, Y.: Periodic oceanic euxinia and terrestrial fluxes linked to astronomical forcing during the Late Devonian Frasnian–Famennian mass extinction, Earth Planet. Sc. Lett., 562, 116839, https://doi.org/10.1016/j.epsl.2021.116839, 2021.
Ma, K., Hinnov, L., Zhang, X., and Gong, Y.: Astronomical climate changes trigger Late Devonian bio- and environmental events in South China, Global Planet. Change, 215, 103874, https://doi.org/10.1016/j.gloplacha.2022.103874, 2022.
Ma, X., Gong, Y., Chen, D., Racki, G., Chen, X., and Liao, W.: The Late Devonian Frasnian–Famennian Event in South China – Patterns and causes of extinctions, sea level changes, and isotope variations, Palaeogeogr. Palaeocl., 448, 224–244, https://doi.org/10.1016/j.palaeo.2015.10.047, 2016.
McGhee, G. R.: Extinction: Late Devonian Mass Extinction, in: Encyclopedia of Life Sciences (eLS), edited by: John Wiley & Sons, Ltd, Wiley, Chichester, https://doi.org/10.1002/9780470015902.a0001653.pub3, 2012.
McGhee, G. R., Clapham, M. E., Sheehan, P. M., Bottjer, D. J., and Droser, M. L.: A new ecological-severity ranking of major Phanerozoic biodiversity crises, Palaeogeogr. Palaeocl., 370, 260–270, https://doi.org/10.1016/j.palaeo.2012.12.019, 2013.
McGregor, H. V., Dupont, L., Stuut, J.-B. W., and Kuhlmann, H.: Vegetation change, goats, and religion: a 2000-year history of land use in southern Morocco, Quaternary Sci. Rev., 28, 1434–1448, https://doi.org/10.1016/j.quascirev.2009.02.012, 2009.
Meischner, D.: Clastic sedimentation in the Variscan Geosyncline east of the River Rhine, in: Sedimentology of Parts of Central Europe, International Sedimentological Congress, 9–43, ISBN 3782910346, 1971.
Meyers, S. R.: Astrochron: An R Package for Astrochronology, https://cran.r-project.org/package=astrochron (last access: 14 February 2024), 2014.
Meyers, S. R.: The evaluation of eccentricity-related amplitude modulation and bundling in paleoclimate data: An inverse approach for astrochronologic testing and time scale optimization, Paleoceanography, 30, 1625–1640, https://doi.org/10.1002/2015PA002850, 2015.
Meyers, S. R., Sageman, B. B., and Arthur, M. A.: Obliquity forcing of organic matter accumulation during Oceanic Anoxic Event 2, Paleoceanography, 27, PA3212, https://doi.org/10.1029/2012PA002286, 2012.
Mitchell, R. L., Kenrick, P., Pressel, S., Duckett, J., Strullu-Derrien, C., Davies, N., McMahon, W. J., and Summerfield, R.: Terrestrial surface stabilisation by modern analogues of the earliest land plants: A multi-dimensional imaging study, Geobiology, 21, 454–473, https://doi.org/10.1111/gbi.12546, 2023.
Mottequin, B. and Poty, E.: Kellwasser horizons, sea-level changes and brachiopod–coral crises during the late Frasnian in the Namur–Dinant Basin (southern Belgium): a synopsis, in: Devonian Climate, Sea Level and Evolutionary Events, edited by: Becker, R. T., Königshof, P., and Brett, C. E., Geological Society, London, Special Publications, 423, 235–250, https://doi.org/10.1144/SP423.6, 2016.
Munnecke, A. and Samtleben, C.: The formation of micritic limestones and the development of limestone-marl alternations in the Silurian of Gotland, Sweden, Facies, 34, 159–176, https://doi.org/10.1007/BF02546162, 1996.
Nesbitt, H. W., Markovics, G., and price, R. C.: Chemical processes affecting alkalis and alkaline earths during continental weathering, Geochim. Cosmochim. Ac., 44, 1659–1666, https://doi.org/10.1016/0016-7037(80)90218-5, 1980.
Nohl, T., Wetterich, J., Fobbe, N., and Munnecke, A.: Lithological dependence of aragonite preservation in monospecific gastropod deposits of the Miocene Mainz Basin: Implications for the (dia-)genesis of limestone–marl alternations, J. Sediment. Res., 90, 1500–1509, https://doi.org/10.2110/jsr.2020.057, 2020.
Nohl, T., Steinbauer, M. J., Sinnesael, M., and Jarochowska, E.: Detecting initial aragonite and calcite variations in limestone–marl alternations, Sedimentology, 68, 3102–3115, https://doi.org/10.1111/sed.12885, 2021.
Pas, D., Da Silva, A.-C., Cornet, P., Bultynck, P., Königshof, P., and Boulvain, F.: Sedimentary development of a continuous Middle Devonian to Mississippian section from the fore-reef fringe of the Brilon Reef Complex (Rheinisches Schiefergebirge, Germany), Facies, 59, 969–990, https://doi.org/10.1007/s10347-012-0351-z, 2013.
Percival, L. M. E., Davies, J. H. F. L., Schaltegger, U., De Vleeschouwer, D., Da Silva, A. C., and Föllmi, K. B.: Precisely dating the Frasnian–Famennian boundary: implications for the cause of the Late Devonian mass extinction, Sci. Rep., 8, 1–10, https://doi.org/10.1038/s41598-018-27847-7, 2018.
Percival, L. M. E., Selby, D., Bond, D. P. G., Rakociński, M., Racki, G., Marynowski, L., Adatte, T., Spangenberg, J. E., and Föllmi, K. B.: Pulses of enhanced continental weathering associated with multiple Late Devonian climate perturbations: Evidence from osmium-isotope compositions, Palaeogeogr. Palaeocl., 524, 240–249, https://doi.org/10.1016/j.palaeo.2019.03.036, 2019.
Percival, L. M. E., Bond, D. P. G., Rakociński, M., Marynowski, L., Hood, A. v. S., Adatte, T., Spangenberg, J. E., and Föllmi, K. B.: Phosphorus-cycle disturbances during the Late Devonian anoxic events, Global Planet. Change, 184, 103070, https://doi.org/10.1016/j.gloplacha.2019.103070, 2020.
Piecha, M.: Stratigraphie, Fazies und Sedimentpetrographie der-rhythmisch und zyklisch abgelagerten, tiefoberdevonischen-Beckensedimente im Rechtsrheinischen Schiefergebirg (Adorf-Bänderschiefer), Courier Forschungsinstitut Senckenberg, Schweizerbart, ISBN 78-3-510-61110-2, 1–151, 1993.
Pier, J. Q., Brisson, S. K., Beard, J. A., Hren, M. T., and Bush, A. M.: Accelerated mass extinction in an isolated biota during Late Devonian climate changes, Sci. Rep., 11, 24366, https://doi.org/10.1038/s41598-021-03510-6, 2021.
Pippenger, K. H., Estrada, L., Jones, D. S., and Cohen, P. A.: Appalachian Basin mercury enrichments during the Late Devonian Kellwasser Events and comparison to global records, Palaeogeogr. Palaeocl., 627, 111751, https://doi.org/10.1016/j.palaeo.2023.111751, 2023.
Pisarzowska, A. and Racki, G.: Comparative carbon isotope chemostratigraphy of major Late Devonian biotic crises, in: Stratigraphy & Timescales, vol. 5, Elsevier, 387–466, https://doi.org/10.1016/bs.sats.2020.08.001, 2020.
Polyansky, O. P., Prokopiev, A. V., Koroleva, O. V., Tomshin, M. D., Reverdatto, V. V., Selyatitsky, A. Yu., Travin, A. V., and Vasiliev, D. A.: Temporal correlation between dyke swarms and crustal extension in the middle Palaeozoic Vilyui rift basin, Siberian platform, Lithos, 282–283, 45–64, https://doi.org/10.1016/j.lithos.2017.02.020, 2017.
Pujol, F., Berner, Z., and Stüben, D.: Palaeoenvironmental changes at the Frasnian/Famennian boundary in key European sections: Chemostratigraphic constraints, Palaeogeogr. Palaeocl., 240, 120–145, https://doi.org/10.1016/j.palaeo.2006.03.055, 2006.
Qie, W., Zhang, J., Luo, G., Algeo, T. J., Chen, B., Xiang, L., Liang, K., Liu, X., Pogge Von Strandmann, P. A. E., Chen, J., and Wang, X.: Enhanced Continental Weathering as a Trigger for the End-Devonian Hangenberg Crisis, Geophys. Res. Lett., 50, e2022GL102640, https://doi.org/10.1029/2022GL102640, 2023.
Quye-Sawyer, J., Vandeginste, V., and Johnston, K. J.: Application of handheld energy-dispersive X-ray fluorescence spectrometry to carbonate studies: opportunities and challenges, J. Anal. Atom. Spectrom., 30, 1490–1499, https://doi.org/10.1039/c5ja00114e, 2015.
Racki, G.: The Frasnian-Famennian biotic crisis: How many (if any) bolide impacts?, Geol. Rundsch., 87, 617–632, https://doi.org/10.1007/s005310050235, 1999.
Racki, G.: Toward understanding Late Devonian global events: few answers, many questions, in: Developments in Palaeontology and Stratigraphy, vol. 20, Elsevier, 5–36, 2005.
Racki, G.: A volcanic scenario for the Frasnian–Famennian major biotic crisis and other Late Devonian global changes: More answers than questions?, Global Planet. Change, 189, 103174, https://doi.org/10.1016/j.gloplacha.2020.103174, 2020a.
Racki, G.: Volcanism as a prime cause of mass extinctions: Retrospectives and perspectives, in: Mass Extinctions, Volcanism, and Impacts: New Developments, Vol. 544, edited by: Adatte, T., Bond, D. P. G., and Keller, G., Geol. Soc. Am., 1–34, https://doi.org/10.1130/2020.2544(01), 2020b.
Racki, G., Rakociński, M., Marynowski, L., and Wignall, P. B.: Mercury enrichments and the Frasnian-Famennian biotic crisis: A volcanic trigger proved?, Geology, 46, 543–546, https://doi.org/10.1130/G40233.1, 2018.
Raup, D. M. and Sepkoski, J. J.: Mass extinctions in the marine fossil record, Science, 215, 1501–1503, https://doi.org/10.1126/science.215.4539.1501, 1982.
Ricci, J., Quidelleur, X., Pavlov, V., Orlov, S., Shatsillo, A., and Courtillot, V.: New 40Ar/39Ar and K–Ar ages of the Viluy traps (Eastern Siberia): Further evidence for a relationship with the Frasnian–Famennian mass extinction, Palaeogeogr. Palaeocl., 386, 531–540, https://doi.org/10.1016/j.palaeo.2013.06.020, 2013.
Riquier, L., Tribovillard, N., Averbuch, O., Devleeschouwer, X., and Riboulleau, A.: The Late Frasnian Kellwasser horizons of the Harz Mountains (Germany): two oxygen-deficient periods resulting from different mechanisms, Chem. Geol., 233, 137–155, https://doi.org/10.1016/j.chemgeo.2006.02.021, 2006.
Riquier, L., Averbuch, O., Tribovillard, N., Albani, A. E., Lazreq, N., and Chakiri, S.: Environmental changes at the Frasnian–Famennian boundary in Central Morocco (Northern Gondwana): integrated rock-magnetic and geochemical studies, in: Devonian Events and Correlations, edited by: Becker, R. T., and Kirchgasser, W. T., Geological Society, London, Special Publications, 278, 197–217, https://doi.org/10.1144/SP278.9, 2007.
Robert, C. and Chamley, H.: Cenozoic evolution of continental humidity and paleoenvironment, deduced from the kaolinite content of oceanic sediments, Palaeogeogr. Palaeocl., 60, 171–187, https://doi.org/10.1016/0031-0182(87)90031-9, 1987.
Schindler, E.: Die Kellwasser-Krise (hohe Frasne-Stufe, Ober-Devon), Göttinger Arbeiten zur Geologie und Paläontologie, 46, 1–115, 1990a.
Schindler, E.: The late Frasnian (Upper Devonian) Kellwasser Crisis, in: Extinction Events in Earth History, edited by: Kauffman, E. G. and Walliser, O. H., vol. 30, Springer, Berlin, Heidelberg, 151–159, https://doi.org/10.1007/BFb0011143, 1990b.
Schindler, E. and Königshof, P.: Sedimentology and microfacies of Late Devonian Kellwasser limestones in relation to palaeobathymetry (Upper Kellwasser horizon, late Frasnian), Zentral-blatt für Geologie und Paläontologie, Teil I, Stuttgart, 597–607, 1997.
Schmitz, B., Feist, R., Meier, M. M. M., Martin, E., Heck, P. R., Lenaz, D., Topa, D., Busemann, H., Maden, C., Plant, A. A., and Terfelt, F.: The micrometeorite flux to Earth during the Frasnian–Famennian transition reconstructed in the Coumiac GSSP section, France, Earth Planet. Sc. Lett., 522, 234–243, https://doi.org/10.1016/j.epsl.2019.06.025, 2019.
Schobben, M., Van De Schootbrugge, B., and Wignall, P. B.: Interpreting the Carbon Isotope Record of Mass Extinctions, Elements, 15, 331–337, https://doi.org/10.2138/gselements.15.5.331, 2019.
Scotese, C. R.: An Atlas of Phanerozoic Paleogeographic Maps: The Seas Come In and the Seas Go Out, Annu. Rev. Earth Pl. Sc., 49, 679–728, https://doi.org/10.1146/annurev-earth-081320-064052, 2021.
Sepkoski, J. J.: Patterns of Phanerozoic Extinction: a Perspective from Global Data Bases, in: Global Events and Event Stratigraphy in the Phanerozoic, edited by: Walliser, O. H., Springer Berlin Heidelberg, Berlin, Heidelberg, 35–51, https://doi.org/10.1007/978-3-642-79634-0_4, 1996.
Smart, M. S., Filippelli, G., Gilhooly III, W. P., Marshall, J. E. A., and Whiteside, J. H.: Enhanced terrestrial nutrient release during the Devonian emergence and expansion of forests: Evidence from lacustrine phosphorus and geochemical records, GSA Bulletin, 135, 1879–1898, https://doi.org/10.1130/B36384.1, 2022.
Smith, D.: Misplaced confidence: limits to statistical inference in cyclostratigraphy, Boletín Geológico y Minero, 131, 291–307, https://doi.org/10.21701/bolgeomin.131.2.005, 2020.
Smith, D. G.: The Orbital Cycle Factory: Sixty cyclostratigraphic spectra in need of re-evaluation, Palaeogeogr. Palaeocl., 628, 111744, https://doi.org/10.1016/j.palaeo.2023.111744, 2023.
Song, H., Song, H., Algeo, T. J., Tong, J., Romaniello, S. J., Zhu, Y., Chu, D., Gong, Y., and Anbar, A. D.: Uranium and carbon isotopes document global-ocean redox-productivity relationships linked to cooling during the Frasnian-Famennian mass extinction, Geology, 45, 887–890, https://doi.org/10.1130/G39393.1, 2017.
Southam, J. R., Peterson, W. H., and Brass, G. W.: Dynamics of anoxia, Palaeogeogr. Palaeocl., 40, 183–198, https://doi.org/10.1016/0031-0182(82)90089-X, 1982.
Stritzke, R.: Die Karbonatsedimentation im Briloner Vorriffbereich, Geologisches Jahrbuch, 95, 253–315, 1990.
Swart, P. K.: Global synchronous changes in the carbon isotopic composition of carbonate sediments unrelated to changes in the global carbon cycle, P. Natl. Acad. Sci. USA, 105, 13741–13745, https://doi.org/10.1073/pnas.0802841105, 2008.
Thomson, D. J.: Spectrum estimation and harmonic analysis, Proc. IEEE, 70, 1055–1096, https://doi.org/10.1109/PROC.1982.12433, 1982.
Trabucho-Alexandre, J., Hay, W. W., and de Boer, P. L.: Phanerozoic environments of black shale deposition and the Wilson Cycle, Solid Earth, 3, 29–42, https://doi.org/10.5194/se-3-29-2012, 2012.
Van Cappellen, P. and Ingall, E. D.: Redox Stabilization of the Atmosphere and Oceans by Phosphorus-Limited Marine Productivity, Science, 271, 493–496, https://doi.org/10.1126/science.271.5248.493, 1996.
van der Meer, D. G., Scotese, C. R., Mills, B. J. W., Sluijs, A., van den Berg van Saparoea, A.-P., and van de Weg, R. M. B.: Long-term Phanerozoic global mean sea level: Insights from strontium isotope variations and estimates of continental glaciation, Gondwana Res., 111, 103–121, https://doi.org/10.1016/j.gr.2022.07.014, 2022.
van Hulten, F. F. N.: Devono-carboniferous carbonate platform systems of the Netherlands, Geol. Belg., 15, 284–296, 2012.
Vaughan, S., Bailey, R. J., and Smith, D. G.: Detecting cycles in stratigraphic data: Spectral analysis in the presence of red noise, Paleoceanography, 26, 2011PA002195, https://doi.org/10.1029/2011PA002195, 2011.
Veizer, J., Ala, D., Azmy, K., Bruckschen, P., Buhl, D., Bruhn, F., Carden, G. A. F., Diener, A., Ebneth, S., Godderis, Y., Jasper, T., Korte, C., Pawellek, F., Podlaha, O. G., and Strauss, H.: 87Sr 86Sr, δ13C and δ18O evolution of Phanerozoic seawater, Chem. Geol., 161, 59–88, https://doi.org/10.1016/S0009-2541(99)00081-9, 1999.
Versteegh, G. J. M., Servais, T., Streng, M., Munnecke, A., and Vachard, D.: A discussion and proposal concerning the use of the term calcispheres, Palaeontology, 52, 343–348, https://doi.org/10.1111/j.1475-4983.2009.00854.x, 2009.
Vervoort, P., Kirtland Turner, S., Rochholz, F., and Ridgwell, A.: Earth System Model Analysis of How Astronomical Forcing Is Imprinted Onto the Marine Geological Record: The Role of the Inorganic (Carbonate) Carbon Cycle and Feedbacks, Paleoceanogr. Paleoclimatol., 36, e2020PA004090, https://doi.org/10.1029/2020PA004090, 2021.
Waltham, D.: Milankovitch period uncertainties and their impact on cyclostratigraphy, J. Sediment. Res., 85, 990–998, https://doi.org/10.2110/jsr.2015.66, 2015.
Weedon, G. P.: Problems with the current practice of spectral analysis in cyclostratigraphy: Avoiding false detection of regular cyclicity, Earth-Sci. Rev., 235, 104261, https://doi.org/10.1016/j.earscirev.2022.104261, 2022.
Westphal, H.: Limestone–marl alternations as environmental archives and the role of early diagenesis: a critical review, Int. J. Earth Sci., 95, 947–961, https://doi.org/10.1007/s00531-006-0084-8, 2006.
Westphal, H., Hilgen, F., and Munnecke, A.: An assessment of the suitability of individual rhythmic carbonate successions for astrochronological application, Earth-Sci. Rev., 99, 19–30, https://doi.org/10.1016/j.earscirev.2010.02.001, 2010.
Whalen, M. T., De Vleeschouwer, D., Payne, J. H., Day, J. E., Over, D. J., and Claeys, P.: Pattern and timing of the Late Devonian biotic crisis in Western Canada: insights from carbon isotopes and astronomical calibration of magnetic susceptibility data., New Advances in Devonian Carbonates: Outcrop Analogs, Reservoirs, and Chronostratigraphy, SEPM Special Publication, 107, 185–201, https://doi.org/10.2110/sepmsp.107.02, 2017.
Wichern, N. M. A.: NMAWichern/winsenberg_astro: Winsenberg_supplementary_code (Version v2023), Zenodo [code], https://doi.org/10.5281/zenodo.10160298, 2023.
Wichern, N. M. A., Bialik, O. M., Nohl, T., Percival, L., Becker, R. T., Kaskes, P., Claeys, P., De Vleeschouwer, and D.: Multiproxy dataset (pXRF, carbon isotopes, TOC, XRD) of the Devonian Kellwasser Crisis interval (ca. 372 Ma) at Winsenberg, Germany, PANGAEA [data set], https://doi.pangaea.de/10.1594/PANGAEA.965390, 2024.
Wilde, P. and Berry, W. B. N.: Destabilization of the oceanic density structure and its significance to marine “extinction” events, Palaeogeogr. Palaeocl., 48, 143–162, https://doi.org/10.1016/0031-0182(84)90041-5, 1984.
Winter, J.: Volcanism and Kellwasser Crisis – Zircon tephrostratigraphy, identification and origin of distal fallout ash layers (Upper Devonian, Dinant Syncline, Rhenish Slate Mountains, Harz Mountains), Zeitschrift der Deutschen Gesellschaft für Geowissenschaften, 166, 227–251, https://doi.org/10.1127/1860-1804/2015/0092, 2015.
Wintsch, R. P. and Kvale, C. M.: Differential Mobility of Elements in Burial Diagenesis of Siliciclastic Rocks, J. Sediment. Res., 64, 349–361, https://doi.org/10.1306/D4267D9D-2B26-11D7-8648000102C1865D, 1994.
Young, G. M. and Nesbitt, H. W.: Processes controlling the distribution of Ti and Al in weathering profiles, siliciclastic sediments and sedimentary rocks, J. Sediment. Res., 68, 448–455, https://doi.org/10.2110/jsr.68.448, 1998.
Zhang, X., Joachimski, M. M., and Gong, Y.: Late Devonian greenhouse-icehouse climate transition: New evidence from conodont δ18O thermometry in the eastern Palaeotethys (Lali section, South China), Chem. Geol., 581, 120383, https://doi.org/10.1016/j.chemgeo.2021.120383, 2021.
Zhao, H., Shen, J., Algeo, T. J., Racki, G., Chen, J., Huang, C., Song, J., Qie, W., and Gong, Y.: Mercury isotope evidence for regional volcanism during the Frasnian-Famennian transition, Earth Planet. Sc. Lett., 581, 117412, https://doi.org/10.1016/j.epsl.2022.117412, 2022.
Zheng, W., Gilleaudeau, G. J., Algeo, T. J., Zhao, Y., Song, Y., Zhang, Y., Sahoo, S. K., Anbar, A. D., Carmichael, S. K., Xie, S., Liu, C.-Q., and Chen, J.: Mercury isotope evidence for recurrent photic-zone euxinia triggered by enhanced terrestrial nutrient inputs during the Late Devonian mass extinction, Earth Planet. Sc. Lett., 613, 118175, https://doi.org/10.1016/j.epsl.2023.118175, 2023.
Zhou, Y., Li, Y., Zheng, W., ShunlinTang, Pan, S., Chen, J., Xiao-Fang, H., Shen, J., and Algeo, T. J.: The role of LIPs in Phanerozoic mass extinctions: An Hg perspective, Earth-Sci. Rev., 249, 104667, https://doi.org/10.1016/j.earscirev.2023.104667, 2023.
- Abstract
- Introduction
- Geological setting and lithology
- Methods
- Results and discussion
- Conclusions
- Appendix A: Lithology of the Winsenberg section
- Appendix B: Grain size analysis
- Appendix C: pXRF elemental analysis
- Appendix D: Spectral analysis
- Code availability
- Data availability
- Author contributions
- Competing interests
- Disclaimer
- Acknowledgements
- Financial support
- Review statement
- References