the Creative Commons Attribution 4.0 License.
the Creative Commons Attribution 4.0 License.
 | 06 May 2026
Northern Greenland transect stacked ice cores as a proxy for winter extreme events in Europe
Alessandro Gagliardi
Norel Rimbu
Gerrit Lohmann
Monica Ionita
High-resolution ice core records from the Greenland ice sheet provide critical insights into past climate variability across seasonal to multidecadal timescales. A key proxy in these reconstructions is the concentration of stable oxygen isotopes (δ18O), which reflects both regional climatic conditions, such as temperature, as well as atmospheric and oceanic circulation patterns. While some studies have linked δ18O variability to synoptic-scale phenomena, particularly atmospheric blocking, its relationship to extreme hydroclimatic events in Europe remains underexplored. This study demonstrates that a stacked record of δ18O from the Northern Greenland Transect (NGT), spanning 1602–2011, serves as a proxy for hydroclimatic extremes in Europe. The connection between δ18O anomalies and European atmospheric circulation patterns is investigated across two periods: the observational era (1920–2011) and a longer historical context (1602–2003) using paleoclimate reanalysis data. Composite analysis reveals that years characterized by low δ18O values in the NGT record correspond to an increased frequency of atmospheric blocking over Europe. These blocking events are associated with distinct hydroclimatic extremes. Specifically, the analysis shows a consistent pattern of enhanced frequency of extreme precipitation along Norwegian coast and more frequent extreme drier conditions over southern Europe during such years. The persistence of this linkage in both modern observations and long-term reconstructions underscores the robustness and temporal stability of the relationship between Greenland δ18O variability and European hydroclimatic extremes driven by atmospheric blocking.
- Article
(15729 KB) - Full-text XML
- BibTeX
- EndNote


The frequency of extreme weather events is rising due to climate change, leading to significant loss of life and substantial socio-economic costs (Faranda et al., 2023b; Bakke et al., 2023; Ma et al., 2024; Ionita and Nagavciuc, 2025). These events typically last from a few days (e.g. heatwaves, cold spells) up to months (e.g. droughts). In recent years, Europe has experienced an increasing frequency of extreme weather events (e.g. IPCC, 2023; Vautard et al., 2023; Dong and Sutton, 2025). Several factors contribute to this trend. Scaife et al. (2008) linked the rise in extreme events to long-term changes in the North Atlantic Oscillation (NAO), while García-Burgos et al. (2023) attributed it to a combination of jet stream dynamics and atmospheric blockings. Atmospheric blocking plays a key role in extreme weather by disrupting the jet stream, creating meanders that foster conditions conducive to severe events (Kautz et al., 2022). Additionally, Faranda et al. (2023a) found that certain atmospheric circulation patterns are becoming more frequent, increasing the recurrence of extreme events, while others are declining, leading to fewer corresponding extremes. Kornhuber and Messori (2023) also demonstrated that high-amplitude wave-4 events have become more common across the Northern Hemisphere, enhancing the likelihood of extreme weather in both North America and Europe. Understanding the past evolution of extreme weather events is crucial for investigating changes in underlying physical processes, validating climate models, and societal impacts (Yiou et al., 2012; Xu et al., 2024; Brönnimann et al., 2025).
Reconstructing extreme weather events remains challenging because most proxies lack the temporal resolution needed to capture short-term variability. A few proxies offer daily-scale data, but they usually reflect local rather than regional conditions (Yan et al., 2020). For instance, tree-ring networks, mainly sensitive to summer conditions, have recently been combined with deep learning to reconstruct summer atmospheric blocking over the past millennium (Karamperidou, 2024). However, their time span is shorter than that of other archives and mainly on the mid-latitudes. On the other hand, the repeated occurrence of extreme weather events may reasonably leave a detectable imprint in the proxies, even when their temporal resolution is lower than the timescale of such events and therefore detected at seasonal or annual resolution (Brönnimann et al., 2025).
Ice cores records can be used for multidecadal and longer time scale reconstructions (e.g. Meeker et al., 1997; Vinther et al., 2010; Rimbu and Lohmann, 2010; Chylek et al., 2011). The high temporal resolution ice cores from the Greenland ice sheet gives valuable information on climate variations from seasonal to multidecadal time scales (e.g. Andersen et al., 2004; Holme et al., 2019). The variability of the stable oxygen isotopes δ18O from Greenland ice cores is linked to changes in the general climate and associated teleconnection patterns such as NAO or the Atlantic Multidecadal Oscillation (AMO) (Barlow et al., 1993; Appenzeller et al., 1998; Vinther et al., 2003; Chylek et al., 2011). Some studies, though, have identified strong links between Greenland δ18O variability and atmospheric weather regimes (Rimbu and Lohmann, 2010; Ortega et al., 2014) and relationship with atmospheric blocking during boreal winter months (Rimbu et al., 2007, 2017, 2021). However, the isotopic signal recorded in the ice cores is affected by many different physical processes from large-scale to very local spatial scales (Casado and Orsi, 2023). To reduce the effects of local phenomena on the variability of the δ18O, a possible solution is to compile a stack of different ice cores. A stacked δ18O series is a combination of different δ18O ice cores measurements obtained from different drilling campaigns and locations covering different time ranges. Stacking measurements from different locations has the major advantage of averaging out different local processes affecting the δ18O variability (Holme et al., 2019). This allow not only to extend the temporal domain of the proxy but also to average out local process. Anyhow, the linkage between the variability of the δ18O and the atmospheric circulation even at synoptic scale has been already addressed in the literature (Ortega et al., 2014; Rimbu et al., 2021), but not put in the perspective of the frequency of occurrence of extreme weather events.
The primary objective of this study is to investigate whether there is a physical linkage between the variability measured in the Northern Greenland Transect (NGT) stacked stable oxygen isotope δ18O (Hörhold et al., 2023) and the frequency of occurrence of extreme weather events over Europe during the boreal winter months. Two periods are studied: observational period (1920–2011) and long-term perspective period (1602–2003).
The paper is structured as follows: Sect. 2 outlines the datasets and methods used for investigation the atmospheric circulation and the associated extreme climate events, while Sect. 3 describes the results obtained for the observational and long-term perspective periods. Lastly, Sect. 4 summaries the results.
2.1 Data
The proxy used is the NGT stacked stable oxygen isotope record δ18O obtained from 21 ice cores drilled mainly from the 16 different locations in central and Northern Greenland overlapping on a common period (Hörhold et al., 2023). In particular, the stacking methodology adopted for computing the NGT stacked series is the average of δ18O from all different ice cores considered (Hörhold et al., 2023). The NGT stacked δ18O series is provided as anomalies with respect to period 1961–1990. The NGT stacked δ18O series is available from 1000 to 2011 with annual resolution. However, the series used in this study is limited from the 1602 due to the paleoreanalysis dataset described in the last paragraph of this section. For more details on the stacking method and data sources see Hörhold et al. (2023).
The atmospheric circulation during boreal winter months (December, January and February; hereafter DJF) in the observational period (1920–2011) is investigated using the third version of the 20th Century reanalysis (20CRv3) (Slivinski et al., 2019), which provides daily data and a spatial resolution of 1.0°×1.0°. In particular, the atmospheric variables used in this study are the geopotential height at 500 hPa, Z500, along with the zonal u and meridional v components of the wind at the same pressure level. The specific humidity q, the zonal, and meridional components of the wind at different pressure levels (300–1000 hPa) are used to investigate the water vapor transported by the atmosphere. The pressure levels are limited between 300–1000 hPa because most water vapor is in the lower troposphere. In particular, the water vapor transport is determined by the Integrated Vapor Transport (IVT) (Peixoto and Oort, 1992),
where g is the gravitational acceleration in m s−2, u, and v are the zonal and meridional components of the wind in m s−1, q the specific humidity, and dp is the pressure difference between two adjacent pressure levels.
The extreme conditions regarding temperature and precipitation over Europe in boreal winters are assessed in the observational period using the E-OBS dataset (Cornes et al., 2018). In particular, two ETCCDI extreme indices are considered: TN10p and PRCPTOT. The TN10p index is defined as the percentage of days when the minimum temperature is below the 10th percentile over a given period, while the PRCPTOT is the cumulated rainfall in days when at least 1 mm of rainfall occurred. In the case of this study, the TN10p and PRCPTOP are computed for each single month DJF in the observational period. The two extreme indices are computed using the Python package icclim (Aoun et al., 2024). A comparison is also made with the 20CRv3 dataset and a new dataset of reconstructed extreme indices named CRAI (Plésiat et al., 2024). The main goal of the CRAI dataset is to reconstruct climate extreme indices, particularly for periods and regions with sparse observational data. This dataset uses a deep-learning algorithm that combines U-net architecture and partial convolutional layers (Kadow et al., 2020). This dataset is used in comparison with E-OBS to provide a more complete overview of extreme temperature and precipitation conditions across Europe, considering the data sparsity present in some regions of the E-OBS dataset, especially in the period 1920–1950.
The Ensemble Kalman Filter (EKF) v2 Paleoreanalysis (Valler et al., 2022) is used to investigate atmospheric circulation patterns, temperature and precipitation in the boreal winters in the long-term perspective period (1602–2003). The EKF dataset has monthly time resolution and spatial resolution of 1.85°×1.85°. This data set provides an optimized combination of model outputs and paleoclimate reconstructions obtained by different proxies through data assimilation techniques. In particular, the technique adopted in this dataset uses the ensemble-based Kalman filtering to assimilate historical and instrumental measurements of temperature, precipitation and pressure together with paleoclimate records from tree-rings and corals. The model used for modeling the atmosphere is the atmospheric-only module of the general circulation model ECHAM5.4 (Roeckner et al., 2003). It is worth noting that prior 1850, the paleoclimate records from tree rings play a major role in this paleoreanalysis dataset. Even though, the use of primarily tree rings may introduce some biases due to the different growth rates for each species, tree line sampling, water availability (Bradley, 2015), the contribution from tree rings is mainly focused in mid-latitude in summer time. Indeed, as stated in Valler et al. (2022), the climate reconstruction is mainly driven by the model output. See Valler et al. (2022) for details on the data assimilation techniques and proxies adopted.
2.2 Methods
The principal method of investigation in this paper is the composite map analysis (DelSole and Tippett, 2022). The aim of the composite analysis is to identify relations between two physical variables during the occurrence of particular extreme conditions in one of the two variables. In this case, we identify the years when the NGT stacked δ18O series exceeds two threshold values considered extreme and then analyses the atmospheric variables to characterize the average atmospheric circulation during those years. The choice of these threshold values is a trade-off between capturing years when δ18O series takes extreme values and having a congruous number of observations available to carry out the composite analysis. The two threshold values chosen are ±1σ, where is the standard deviation and the average of the NGT stacked δ18O series xi during the period considered, respectively. The values of the NGT stacked δ18O series exceeding these two thresholds represent the 30 % most extreme values and permit to have enough number of years to analyze. It follows that positive years are whenever the NGT stacked δ18O series assumes values larger than 1σ. Similarly, negative years are whenever δ18O series is lower than the −1σ. Throughout the paper, the years where δ18O series takes values above (below) the thresholds are named positive (negative) years. The standard deviation for both the observational and long-term periods is then calculated and used to identify the positive and negative years of the NGT stacked δ18O series in each period.
To assess the presence of atmospheric blocking, the 1D-index (Tibaldi and Molteni, 1990), hereafter TM90, and the geopotential height modification of the potential-vorticity-based 2D-index (Schwierz et al., 2004; Trevisiol et al., 2022), hereafter S04, are computed with the Mid-Latitude Evaluation System (MiLES) software (Davini, 2019). A description of the modified TM90 and S04 index is provided below as implemented in Davini (2019). For details on TM90 index, see Tibaldi and Molteni (1990), and for details on S04 index, see Schwierz et al. (2004).
In the TM90 index, for each longitude λ, the geopotential height gradients GHGS and GHGN are computed as:
where , , , and . A longitude λ is labeled as blocked if and , for any values of Δ.
In the S04 index, for each grid point at longitude λ and latitude ϕ, from 30 to 75° N, the daily anomaly of the geopotential height is computed. A grid point is labeled as blocked if the geopotential height anomaly exceeds the 90th percentile of the geopotentail heigth anomalies between 50 and 80° N. In order to detect areas of large-scale blocking, further requirements are needed. It is then required that the grid points must be blocked together, along with any grid points marked as blocked in a box of 10° longitude by 5° latitude, for at least five days.
To asses the effect of the large-scale atmospheric circulation on boreal winter temperature and precipitation in the long-term perspective, spatial index of the geopotential height at 500 hPa, average temperature and precipitation are computed, weighting each grid point by , where ϕ is the latitude. The spatial indices are then standardized for a better comparison. A probability density function is estimated using the non-parametric kernel estimator for identifying changes in the distribution. To quantify those changes, the ratio between the probability density functions in the negative and positive years is computed. Along with the probability density function, the 90 % confidence intervals are computed using the simple resampling with replacement bootstrap technique. The simple replacement can be used in this application because there is no serial correlation between monthly data.
All daily atmospheric variables were averaged to derive their corresponding monthly values. A linear detrend is performed by each month and each grid point to remove the trend and seasonality. The NGT stacked δ18O series has also been detrended, but each single detrending has been carried out for the observational and long-term perspective periods.
The ice core locations forming the NGT stacked used for the analysis in both observational (1920–2011) and long-term perspective (1602–2003) periods are shown in Fig. 1a. The δ18O time series in the observational period (Fig. 1b) shows one main set of extremely consecutive positive years between 1927–1932. This period of consecutive years, during which the NGT stacked δ18O series remains well above 1 ‰, is consistent with a change in large-scale atmospheric circulation and in relation to the NAO with Central and Southern Greenland ice cores (Hatvani et al., 2022; Schalamon et al., 2025). Consecutive extreme positive years are also observed in the beginning of the 2000 and towards the end of the series, which is consistent with the other warming period found in Greenland documented in Schalamon et al. (2025). The consecutive extreme negative years are more evenly spread along the period, but mostly from 1980 onward. The δ18O series from a long-term perspective period (Fig. 1c) exhibits a well spread succession of consecutive extreme positive and negative years, even though it is often observed at least two extreme consecutive years. See Table 1 for the list of extremely positive and negative years.
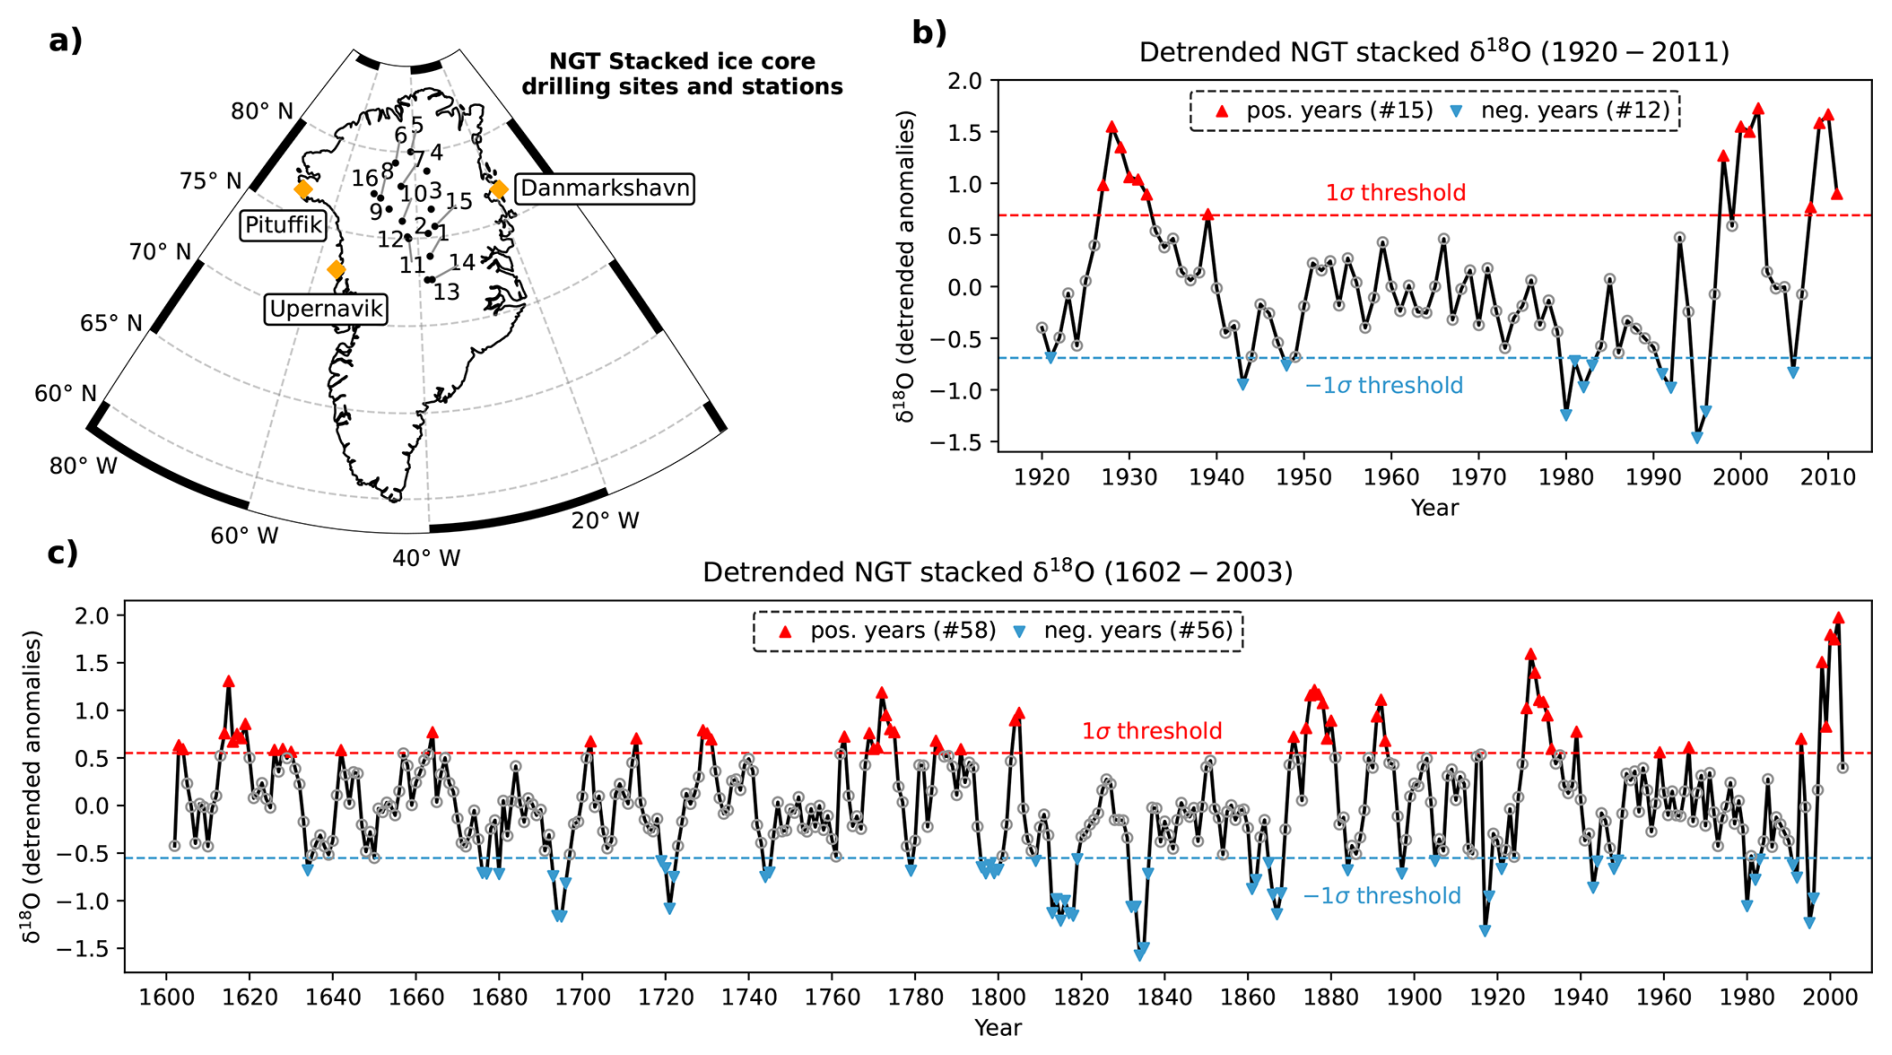
Figure 1Ice cores locations (dots) and weather stations (diamonds) used in NGT Stacked ice cores (a). The detrended anomalies of NGT stacked δ18O series over the period 1920–2011 and 1602–2003 (b, c). The upward-pointing red triangles refer to years whenever the δ18O is above the threshold 1σ (pos. years) (σ= standard deviation). Similarly, downward-pointing blue triangles refer to years below the threshold −1σ (neg. years).
Table 1List of all the positive (pos.) and negative (neg.) years in the observational (1902–2011) and long-term perspective (1602–2003) periods whenever δ18O is above and below the ±1σ threshold (σ= standard deviation).
The two sets of positive and negative years presented in Table 1 were identified by first linear detrending the NGT stacked δ18O time series over both the observational and long-term perspective periods and then selecting the years exceeding the the two thresholds presented above (+1σ; −1σ). Detrending the NGT stacked δ18O time series separately for these periods may lead to different threshold values, which could result in different identification of positive and negative years. However, the similarity between the two sets suggests that detrending over these distinct periods has little impact on the positive and negative years identification. Furthermore, the linear detrending does not affect much the main pattern (Fig. A1).
A few considerations are presented regarding the suitability of applying a linear detrending to both the observational and long-term perspective series. Hörhold et al. (2023) identified a negative linear trend in the NGT stacked series from its beginning until approximately 1800, followed by a positive trend extending to 2013. This pattern suggests that a piecewise linear detrending may be appropriate. However, when a simple linear regression model is fitted to the overlapping period between 1602–1800, which corresponds to the interval of the negative trend reported by Hörhold et al. (2023) and the long-term perspective period in this study, a marginally statistically significant positive trend is obtained (p≈0.10, Fig. A2). Nevertheless, a piecewise linear detrending was applied to the NGT stacked δ18O series from 1602 to 2003 using the data-driven approach developed by Jekel and Venter (2019). Two positive trends with different slopes were detected: the first from 1602 to 1995 and the second from 1995 to 2003. A comparison between the years identified using linear and piecewise detrending was then performed (Fig. A3). Under linear detrending, 56 years of the detrended NGT stacked δ18O series are below the −1σ threshold, whereas under piecewise detrending, 57 years are below this threshold, with 53 years in common (Fig. A4). Given the substantial overlap, linear detrending is considered suitable for the long-term perspective period. For the observational period, the use of linear detrending is already justified by the findings of Hörhold et al. (2023).
3.1 Observational period (1920–2011)
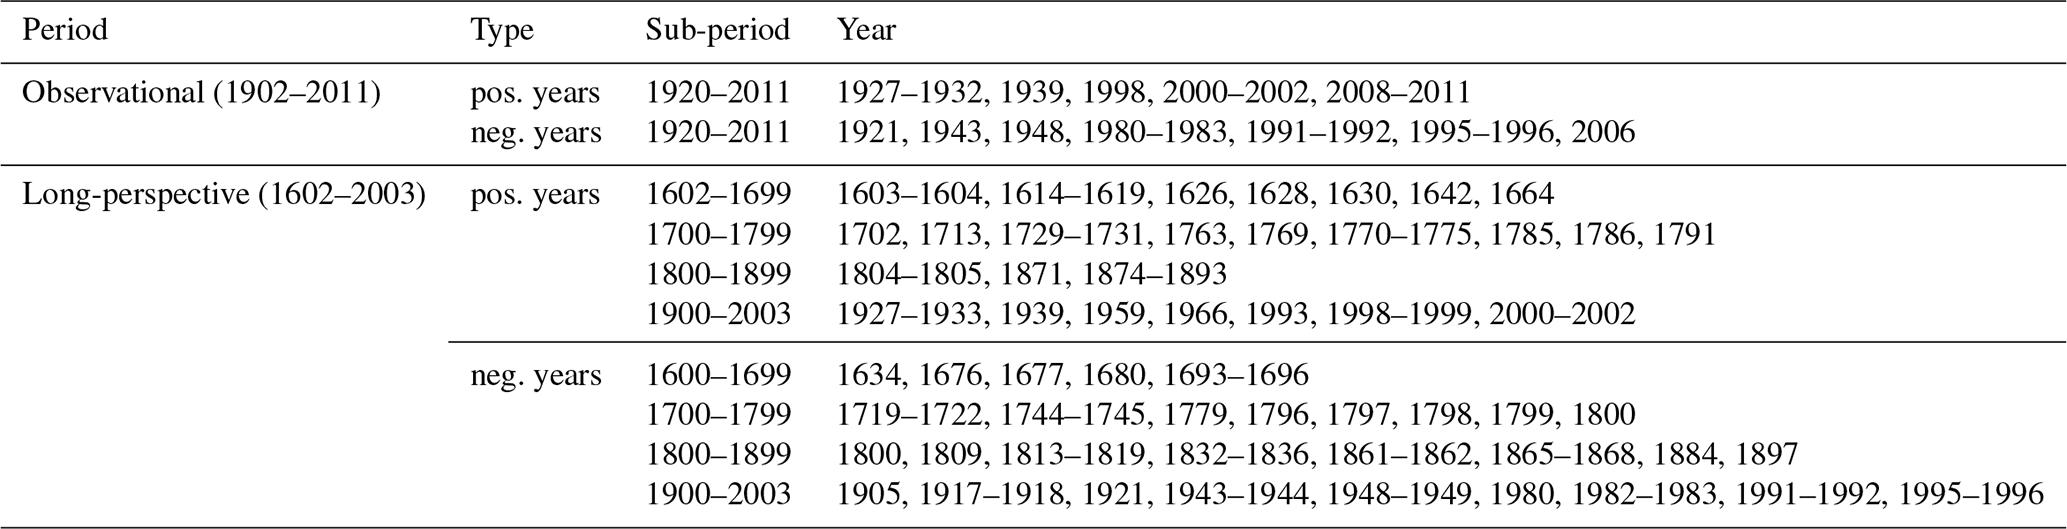
The first noticeable aspect is that average atmospheric circulation over Europe during positive years shows no well-defined anomaly pattern (Fig. 2a), whereas during negative years, a more pronounced pattern emerges (Fig. 2b). The average pattern in negative years features a high-pressure system extending from the Azores Islands to the Baltic Sea and low-pressure system over Greenland. The atmospheric circulation pattern in the negative years resembles the atmospheric circulation in the positive phase of NAO. Before discussing the relationship between the high-pressure system over Europe in the negative years and NAO, additional analyses focusing on this high-pressure system are conducted from a more dynamical perspective, particularly in relation to atmospheric blocking.
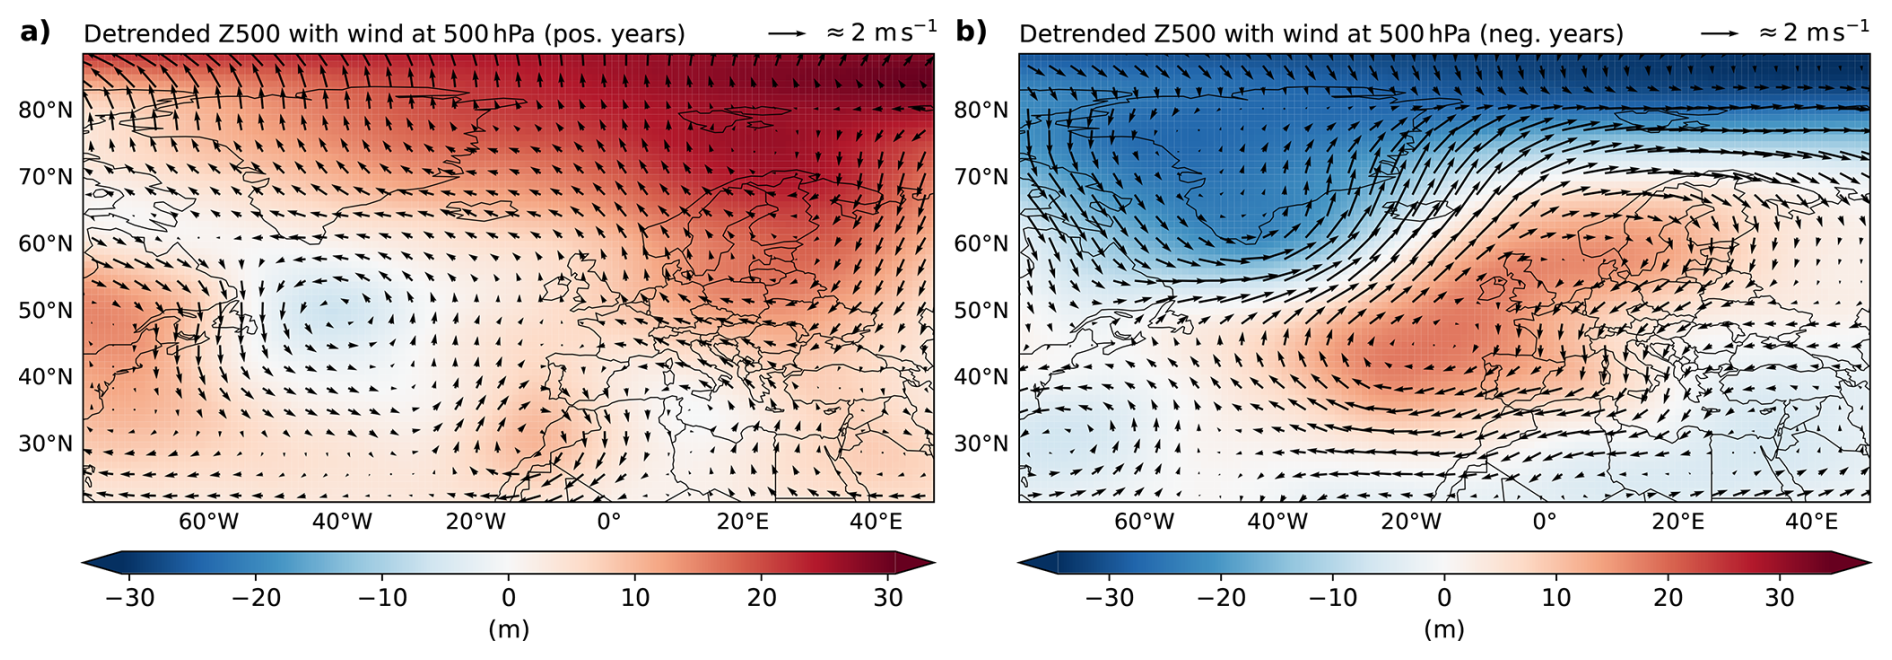
Figure 2The composite maps of the detrended anomalies of the geopotential height (shaded) and the wind (vector) at 500 hPa (Z500) in DJF on the positive (a) and negative years (b) of the NGT stacked ice core record for the observational period (1920–2011).
To assess whether the high-pressure system over Europe is a sign of atmospheric blocking, a 1D and a 2D blocking index are used. The TM90 and S04 indices associated with negative δ18O years show an increase in frequency of atmospheric blocking occurring over Europe (Fig. 3a) compared to positive years. Specifically, the TM90 index indicates an increase of blocking frequency at around 60° N and between 10° W and 35° E, with its peak around 15–25° E. The S04 index (Fig. 3b) permits also to analyze the spatial pattern of the atmospheric blocking, which matches the extent of the high-pressure system (Fig. 2b). It corroborates an increase of blocking around the same region, the Baltic Sea.
Figure 3Detrended monthly averaged Tibaldi and Molteni (1990) (a) and Schwierz et al. (2004) (b) atmospheric blocking indices on the winter season (DJF) in the negative years the NGT stacked ice core record for the period 1920–2011.
The variability of δ18O found in Greenland ice cores is affected by the NAO (Appenzeller et al., 1998; Vinther et al., 2003) and the dipole structure in the geopotential height observed during the negative years (Fig. 2b) resembles the pattern typically associated with the positive phase of the NAO. However, two aspects should be considered before classifying such an atmospheric circulation pattern as the NAO in the positive phase. First, the atmospheric configuration during the positive NAO phase depicts a high-pressure system located over the Azores islands (e.g. Wallace and Gutzler, 1981), whereas the pattern illustrated in Fig. 2b exhibits a broader spatial extent over continental Europe. Moreover, Yao and Luo (2018) presented evidence that different stages of the NAO are associated with varying occurrences of atmospheric blocking over Europe. In particular, the high-pressure system observed during the negative years in the NGT stacked δ18O ice cores (Fig. 3b) presents similar southwest/northeast direction of blocking occurrence during the decaying phase of the positive phase of NAO (Yao and Luo, 2018). Second, as discussed before, in Weißbach et al. (2016) the northern Greenland ice cores are found to be less affected by the NAO compared to central and southern Greenland ice cores due to their high-latitude location and topography. In conclusion, it is complex to classify the dipole structure in the geopotential height observed during the negative years of the NGT stacked δ18O series (Fig. 2b) as a pure atmospheric configuration of the positive phase of NAO.
Years characterized by particularly low δ18O values in NGT stacked series are associated with an increased frequency of atmospheric blocking events that prevent water vapor from reaching Greenland. The increased presence of atmospheric blocking over Europe makes the jet stream deviate northward but eastward of Greenland. This jet stream diversion reduces the transport of O18-enriched moisture toward Greenland, resulting in colder condensation temperatures and therefore more depleted δ18O precipitation (Rimbu et al., 2017). Such blocking events favor the development of extreme events (e.g.: Rex, 1950; Kautz et al., 2022). Indeed, the frequency of occurring of atmospheric blocking over Europe is approximately four times higher than in years showing positive δ18O values. The relationship between negative δ18O years and the occurrence of atmospheric blocking events has been tested by selecting the years with extreme low values of NGT stacked δ18O and assessing the frequency of occurrence of atmospheric blocking events. This relationship is further examined by analyzing the distribution of NGT stacked δ18O series during years with increase and reduced atmospheric blocking events. Years in which the TM90 atmospheric blocking index exceeds , where σ represents the standard deviation of atmospheric blocking frequency, and at least for 12° longitude between 10° W and 20° E are marked as years with increased (reduced) blocking events. The distribution of δ18O during blocking events exhibits a shift in the mean and a skew toward negative values, supporting the proposed linkage (Fig. A5).
Consequently, the relationship between negative δ18O values and atmospheric blocking is supported by the presented evidence, which demonstrates a physical connection between δ18O variability and changes in atmospheric circulation that may contribute to an increased frequency of extreme events. For these reasons, the subsequent analyses investigate the influence of such atmospheric blocking structures on temperature and precipitation over Europe during negative δ18O years.
The increase of frequency of atmospheric blocking over Europe entails a change in the regional pattern of temperature and precipitation (Fig. 4). The position and spatial extent of atmospheric blocking facilitate the poleward transport of warm, moist air from the Atlantic Ocean (Fig. 4a and b) toward the Norwegian coast, leading to higher temperatures (Fig. 4c) and increased precipitation (Fig. 4d). The temperature increase results from warm-air advection, while the precipitation increase is driven by heat loss and the orographic uplift of these relatively warm and moist air masses along the Norwegian coast, which boosts condensation and precipitation formation. The resulting loss of moisture on the windward side is likely what facilitates the subsequent adiabatic compression and warming over Sweden (Fig. 4c), a process characteristic of föhn winds.
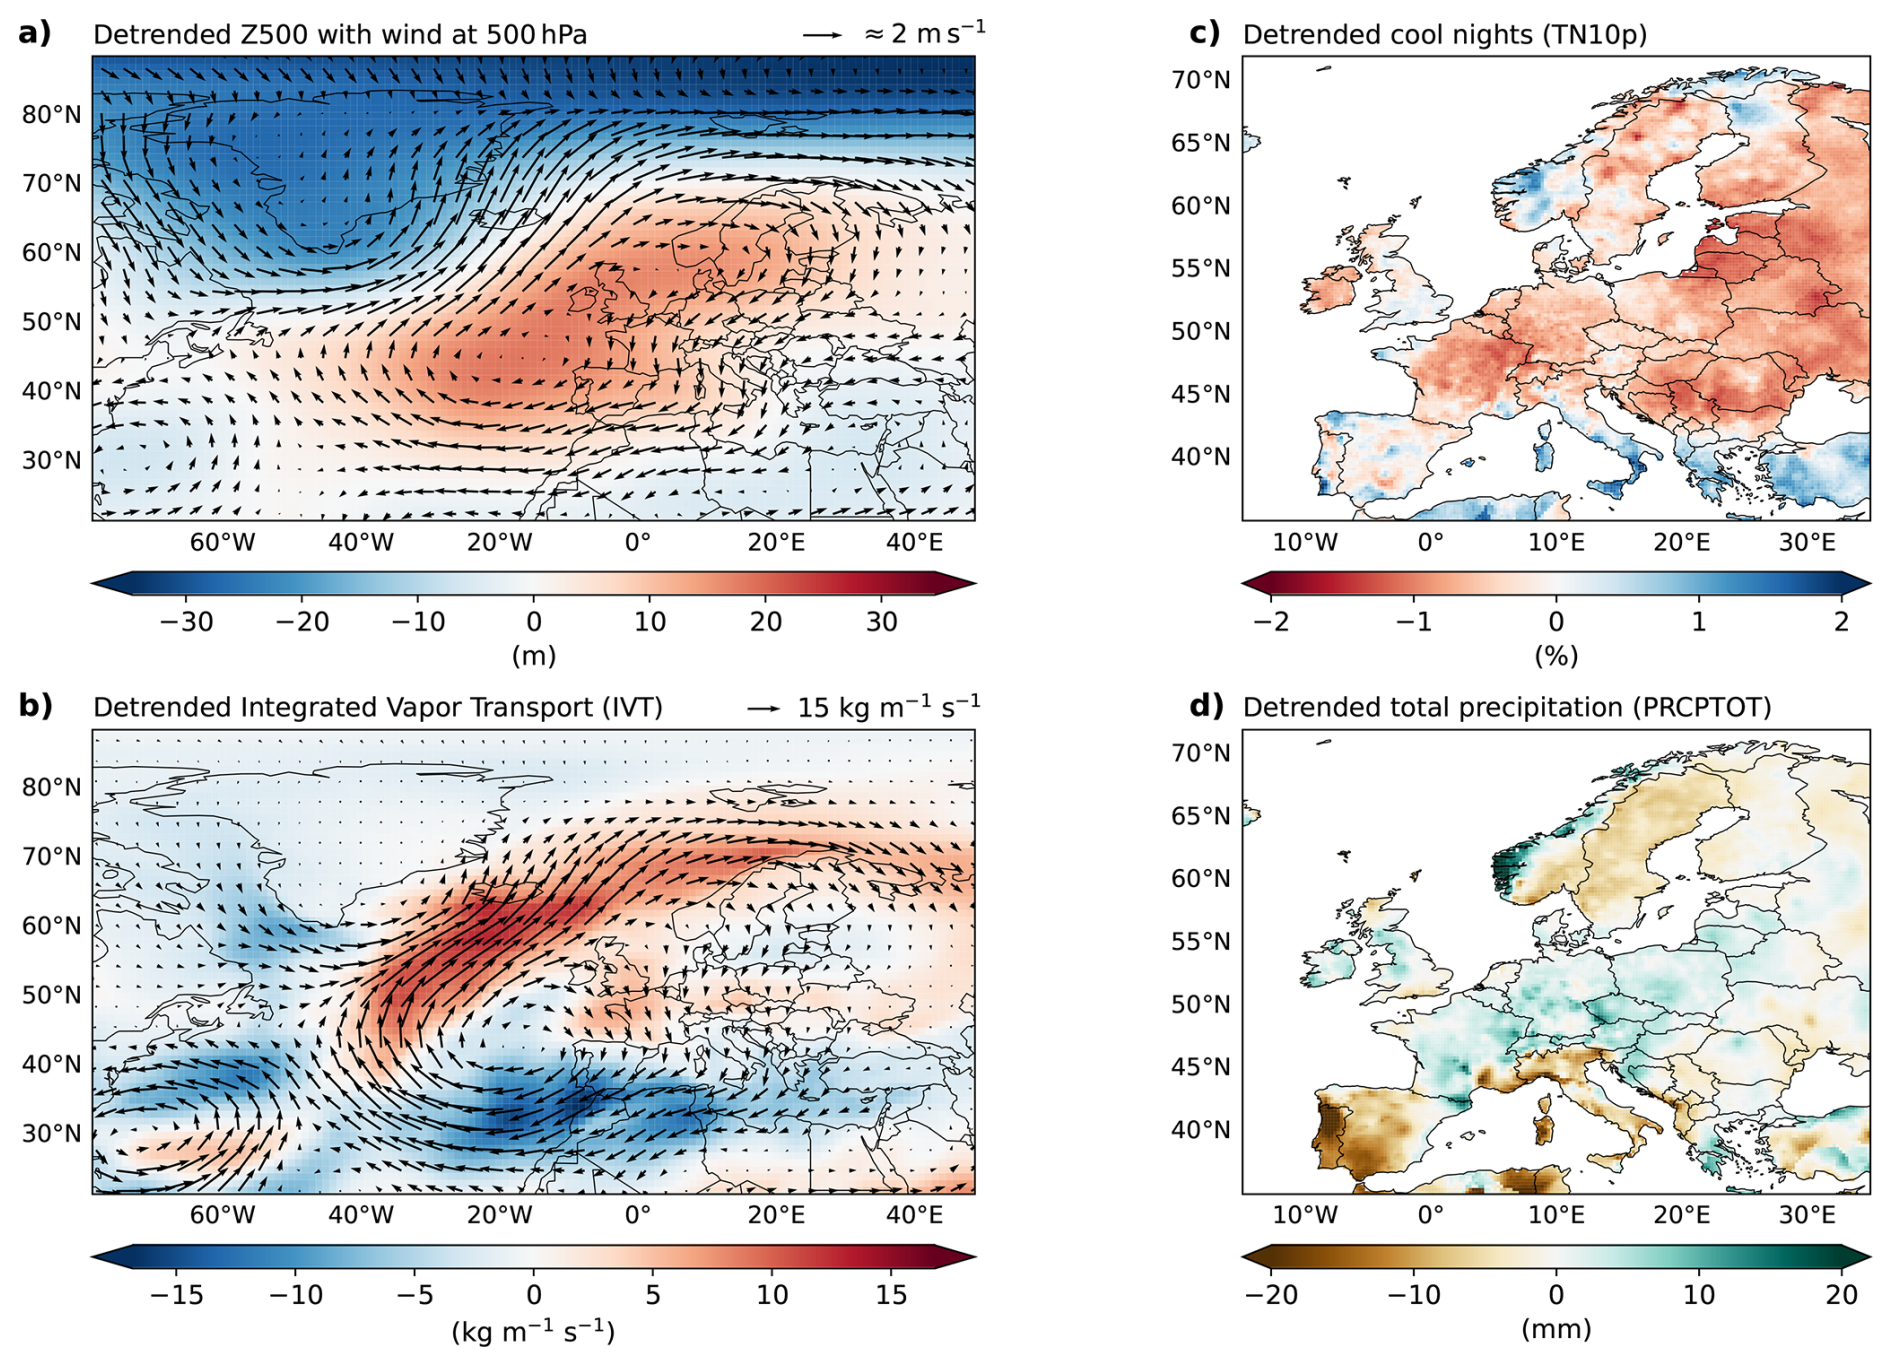
Figure 4The composite maps of the detrended monthly anomalies of the geopotential height (shaded) at 500 hPa (Z500) and the wind (vector) at 500 hPa (a), detrended integrated vapor transport (IVT) (b), detrended cool nights index TN10p (c), and detrended total precipitation index PRCPTOT (d) on the winter season (DJF) in the negative years the NGT stacked ice core record for the period 1920–2011.
Concurrently, the atmospheric blocking also facilitate advection of cold air masses from the Nordic region toward mid-latitudes, which leads to colder and drier conditions over southern Europe (Fig. 4c and d). As a result, temperatures drop in western Turkey, Greece, and, to a lesser extent, in southern Italy and the Iberian Peninsula. Additionally, moist air masses from the Atlantic, which would typically influence southern Europe, are diverted toward Scandinavia, reducing precipitation in this region. Furthermore, central Europe shows a pattern of increased temperature and precipitation. This is likely due to a portion of Atlantic air masses reaching the region, contributing to both warming and wetter conditions.
It is also worth noting that the spatial distribution of TN10p over Scandinavia appears irregular. This irregularity is likely a result of the sparse coverage of the E-OBS dataset before 1950, which affects the computation of temperature indices and leads to irregularities in the observed spatial patterns. On this purpose, the same analysis is carried out using CRAI dataset for TN10p, which shows consistent results with the results obtained using E-OBS dataset. Therefore, the sparsity of E-OBS before 1950 does not affect much the spatial patterns of temperature (Fig. A6). Similarly, the same plot is carried out with the 20CRv3 dataset (Fig. A7) that show similar patterns obtained using the CRAI dataset.
3.2 Long-term period (1602–2003)
The atmospheric circulation in the negative years during the long-perspective period (Fig. 5a) follows closely the atmospheric circulation in the negative years of the observational period (Fig. 2b). The high-pressure system is present over Europe and in particular over the northern France and southern Great Britain. The particular circular shape of the high-pressure system has to be ascribed on average conditions as discussed in the previous section. In this case, the presence of the atmospheric blocking is not possible to assess by computing atmospheric blocking indices since the EKF dataset provides only monthly data, and therefore, the TM90 and S04 indices cannot be computed. On the other hand, the association between high-pressure patterns and the increased frequency of synoptic-scale blocking circulation has been demonstrated by Yiou and Nogaj (2004).
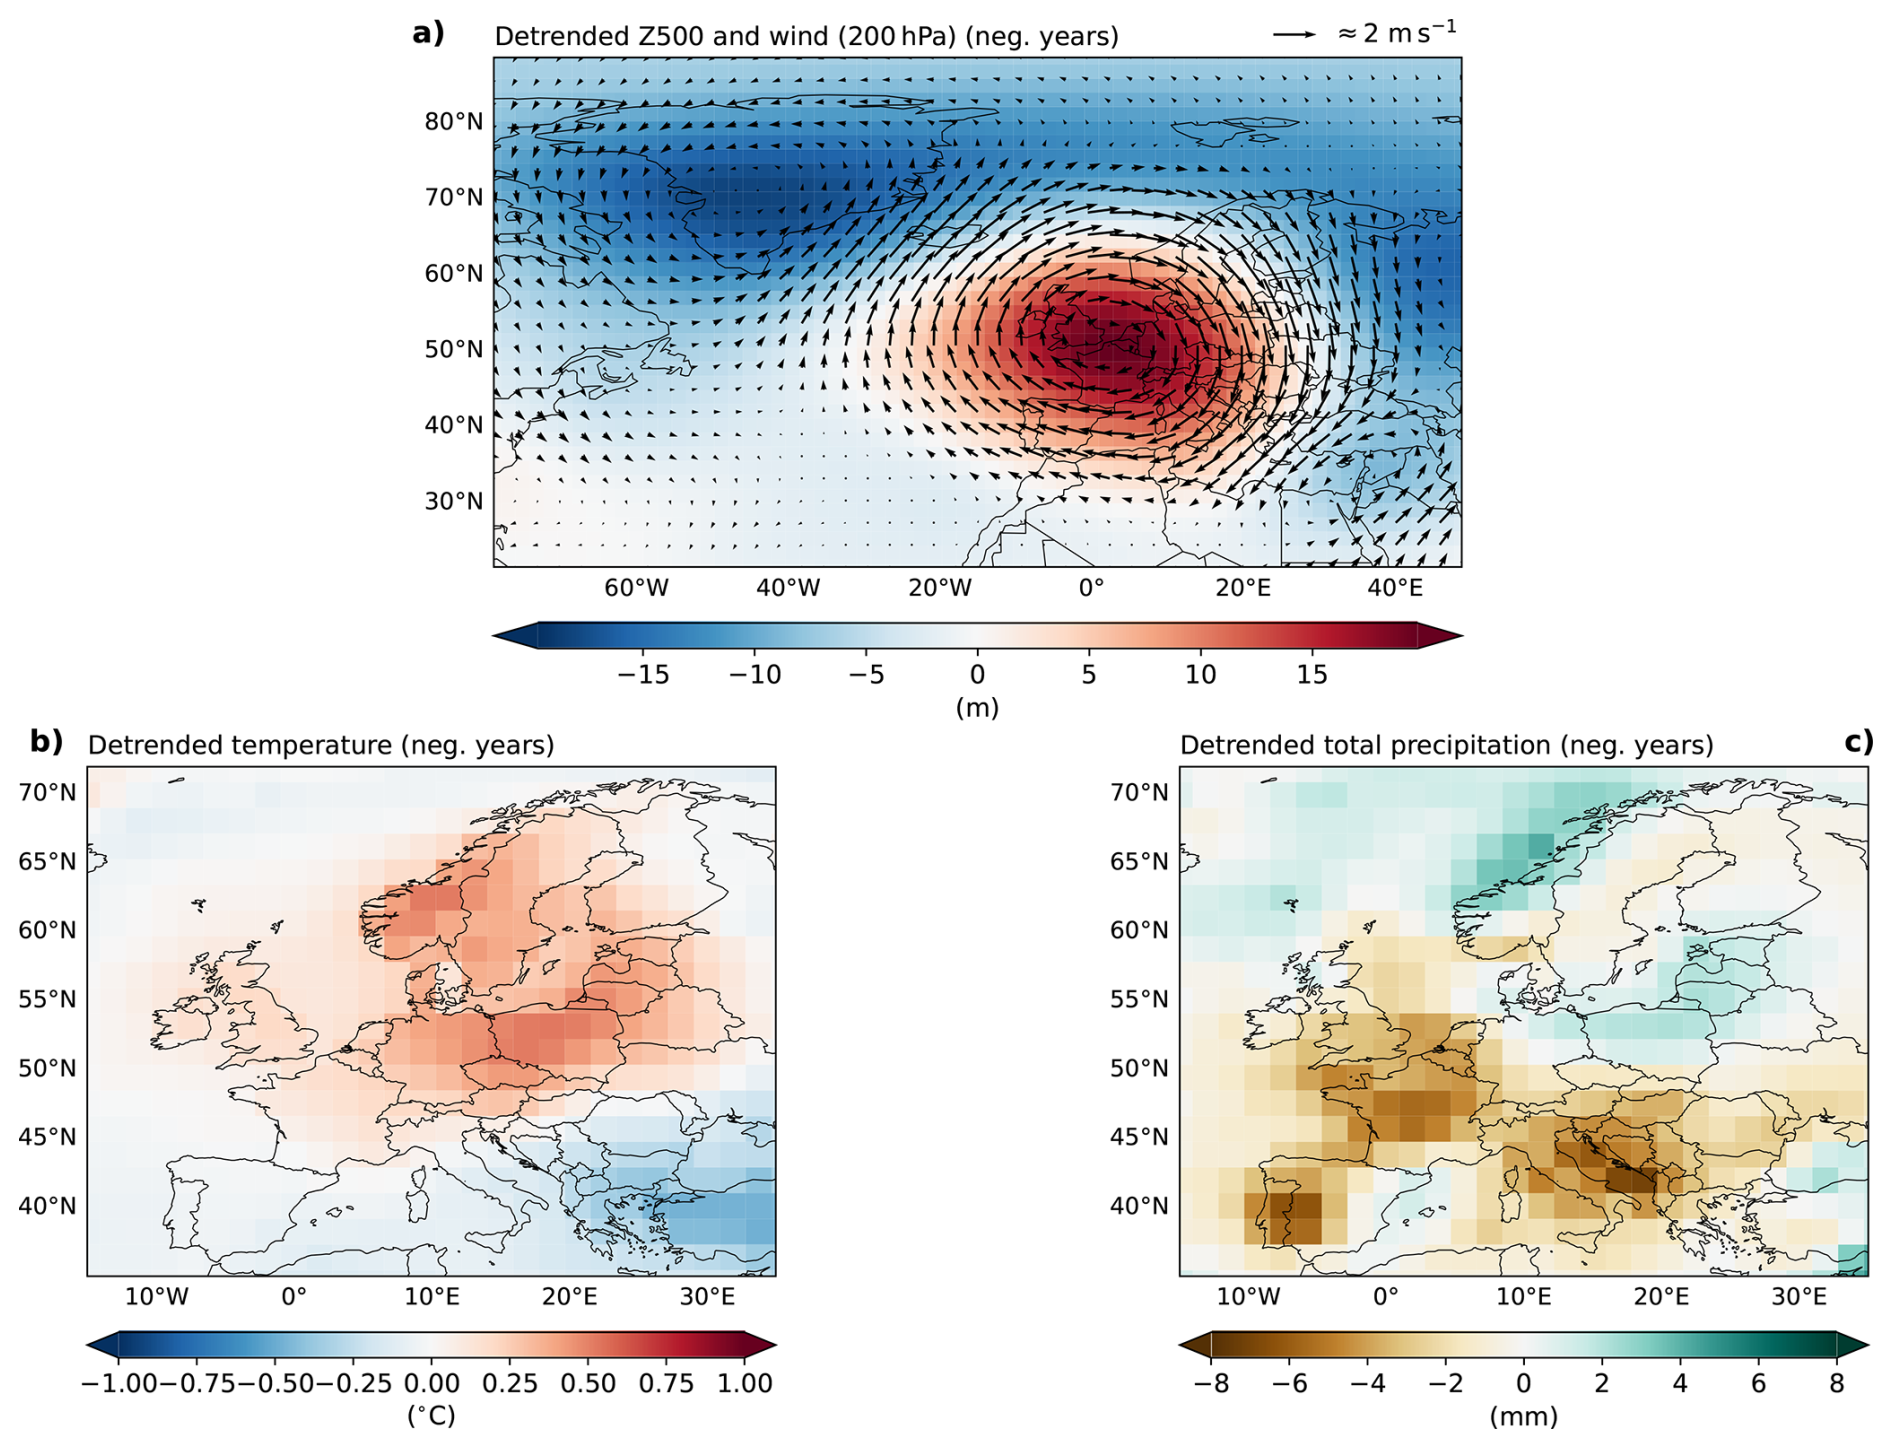
Figure 5The composite maps of the detrended monthly anomalies of the geopotential height (shaded) at 500 hPa (Z500) and the wind (vector) at 250 hPa (a), detrended 2 m temperature (b), and detrended total precipitation (c) on the winter season (DJF) in the negative years the NGT stacked ice core record for the period 1602–2003.
The physical explanation outlined in the previous section for the observational period aligns well with the effect of the atmospheric blocking on temperature and precipitation over Europe observed in the long-term perspective period. In particular, it is observed a rise in temperature and increase in precipitation in Norwegian coastal areas due to atmospheric transport of moist and relative warmer air masses. On the contrary, in southern Europe a decrease in precipitation due redirection of the moist air masses toward the Nordic regions and a decrease in temperature due to cold advection of Nordic air masses is observed as well. The observed patterns in temperature and precipitation in the long-term perspective (Fig. 5b and c) result to show more homogeneous patterns than the observational period due to the use, in this case, of a reanalysis product.
Even if the geopotential height anomalies associated with the high-pressure system over Europe and the low-pressure system (see Fig. A8a) differ statistically from zero, the main effects of the high-pressure system on temperature and precipitation are not. The consistency of the results between the observational and long-term perspective periods and the statistical significance of the geopotential height pattern suggests a non-significant shift in the mean.
To further investigate whether the observed atmospheric blocking affects temperature and precipitation, the distribution of weighted averages of temperature and precipitation in the following selected grid boxes
- (i)
“central Europe” for the geopotential height (38–55° N and 5° W–20° E);
- (ii)
“Baltic region” for temperature (50–64° N and 7–23° E);
- (iii)
“Scandinavia” for precipitation (60–70° N and 7–30° E);
- (iv)
“southern Europe” for precipitation (35–50° N and 10° W–50° E).
are estimated using the method of Kernel Density Estimation (KDE).
The distribution of the indices derived from these four boxes corroborate the hypothesis of a change in the distribution of the temperature and precipitation (Fig. 6). The geopotential height index over the central Europe region during negative years is not only statistically different from zero but also presents positive anomalies ranging from +1σ to +2σ. These anomalies occur between 52 % and 93 % more frequently than in the distribution of positive years, with peaks reaching 120 % around +1.5σ (Fig. 6a). The temperature index over the Baltic region indicates warmer conditions from +1σ, occurring approximately 15 % more often than during positive years and increasing up to 58 % around +1.5σ, although the signal appears visually less pronounced (Fig. 6c). In contrast, the precipitation index over Scandinavia shows a clear shift toward heavier rainfall between +0.5σ and +1.5σ, with frequencies increasing from about 15 % to 38 %, and peaks reaching 70 % around +1σ, compared with positive years. Similarly, the precipitation index over southern Europe reveals drier conditions from −0.5σ to −2σ, with increases of 20 % to 42 % and a peak of 75 % around −1.5σ, relative to positive years. The changes in the precipitation index distributions over Scandinavia and southern Europe are statistically significant compared with their corresponding distributions during positive years.
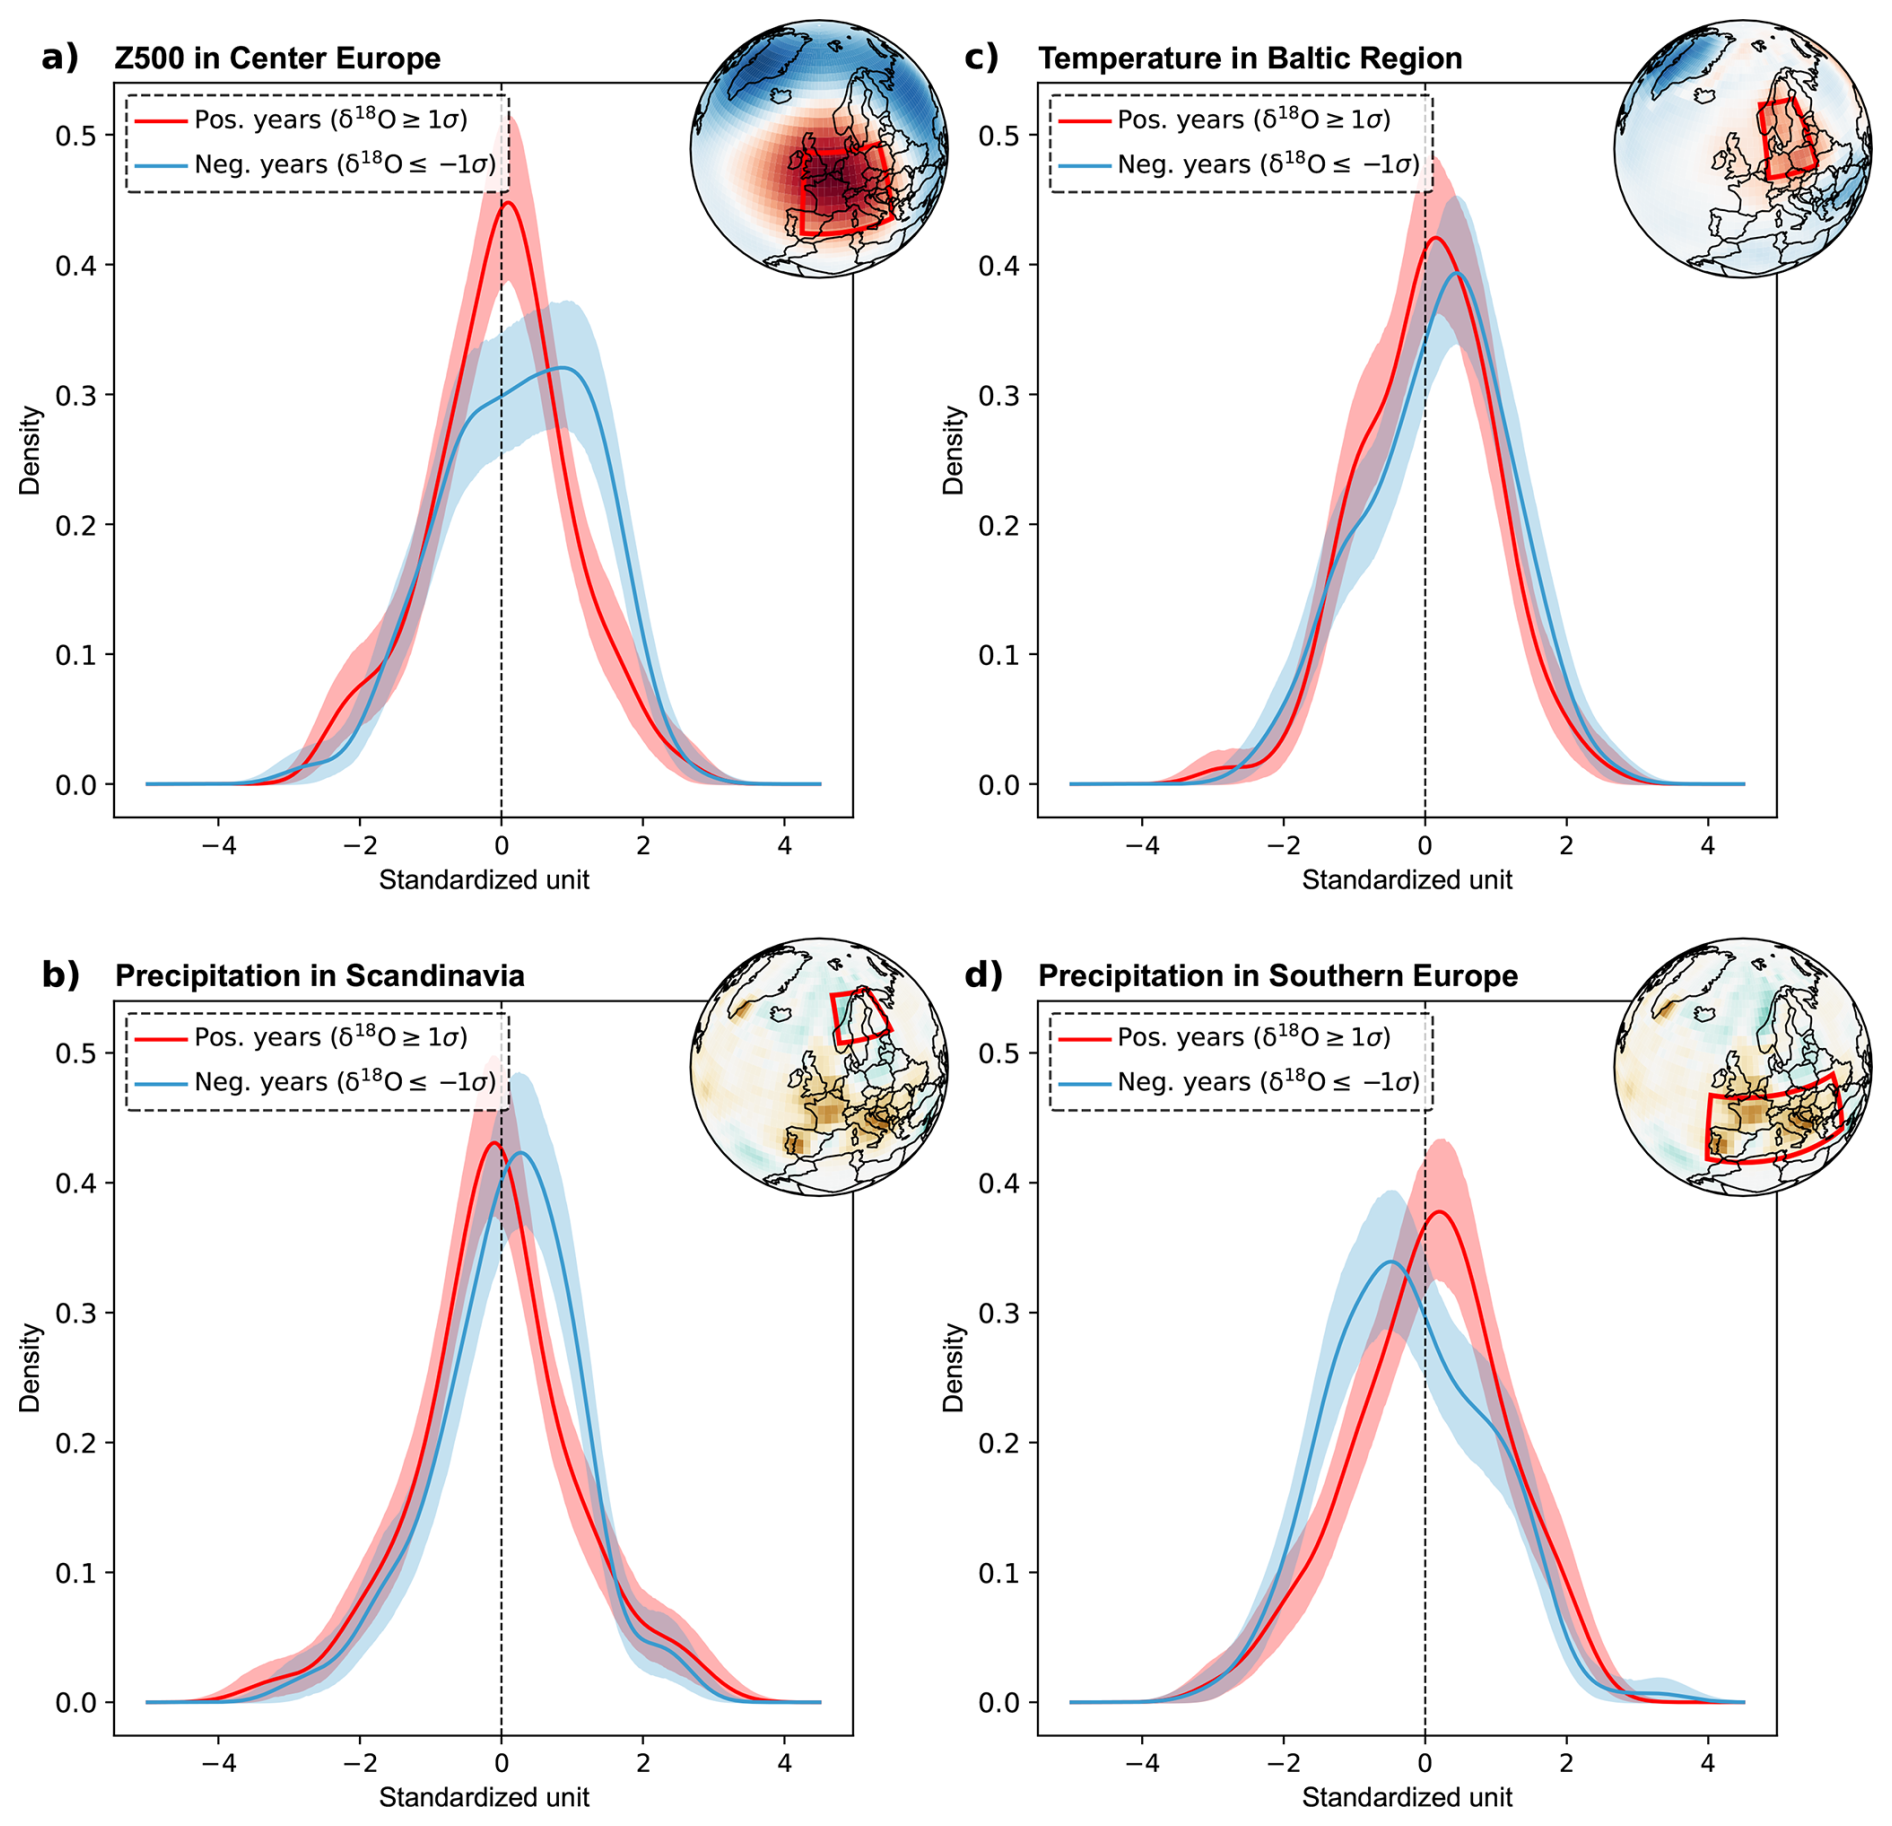
Figure 6Probability density functions of the standardized monthly field average for the following atmospheric variables: geopotential height at 500 hPa (Z500) (a), 2 m temperature over the selected box (b), and precipitation (c, d). All indices are calculated for winter (DJF) during the negative years of the NGT-stacked ice core δ18O record, covering the period 1602–2003. The shaded bands represent the 90 % confidence intervals. The corresponding analysis boxes are shown with solid red lines in the upper-right map of each panel. See the main text for the coordinates used for the NGT-stacked ice record.
Since EKF dataset provides monthly data, it is possible to investigate further if the change in distribution of precipitation occurs among all winter months or only throughout some particular months. Investigating the monthly distribution may help determine if opposite monthly changes hide variations at the seasonal scale.
The probability density function of the indexes is then estimated for the monthly values of the indexes (i)–(iv) computed from the boxes “central Europe”, “Baltic region”, “Scandinavia” and “southern Europe”, as defined above (Fig. 7). The distribution of geopotential height over the “Central Europe” region exhibits a higher occurrence of positive anomalies, ranging from +1σ to +2σ, during January and February, with peak frequencies of 141 % and 88 %, respectively, relative to the positive years. Consistently, the precipitation distributions over “Scandinavia” and “Southern Europe” show distinct changes toward wetter conditions (from +1σ to +2σ, with peak occurrences of 78 %) and drier conditions (from +1σ to +2σ, with peak occurrences of 100 %), respectively, compared to the positive years. In contrast, the temperature index over the “Baltic region” shows no notable difference from that of the entire season (Fig. 7b). However, positive anomalies exceeding +2σ occur more frequently in December during the negative years in the “Baltic region” than in the positive years.
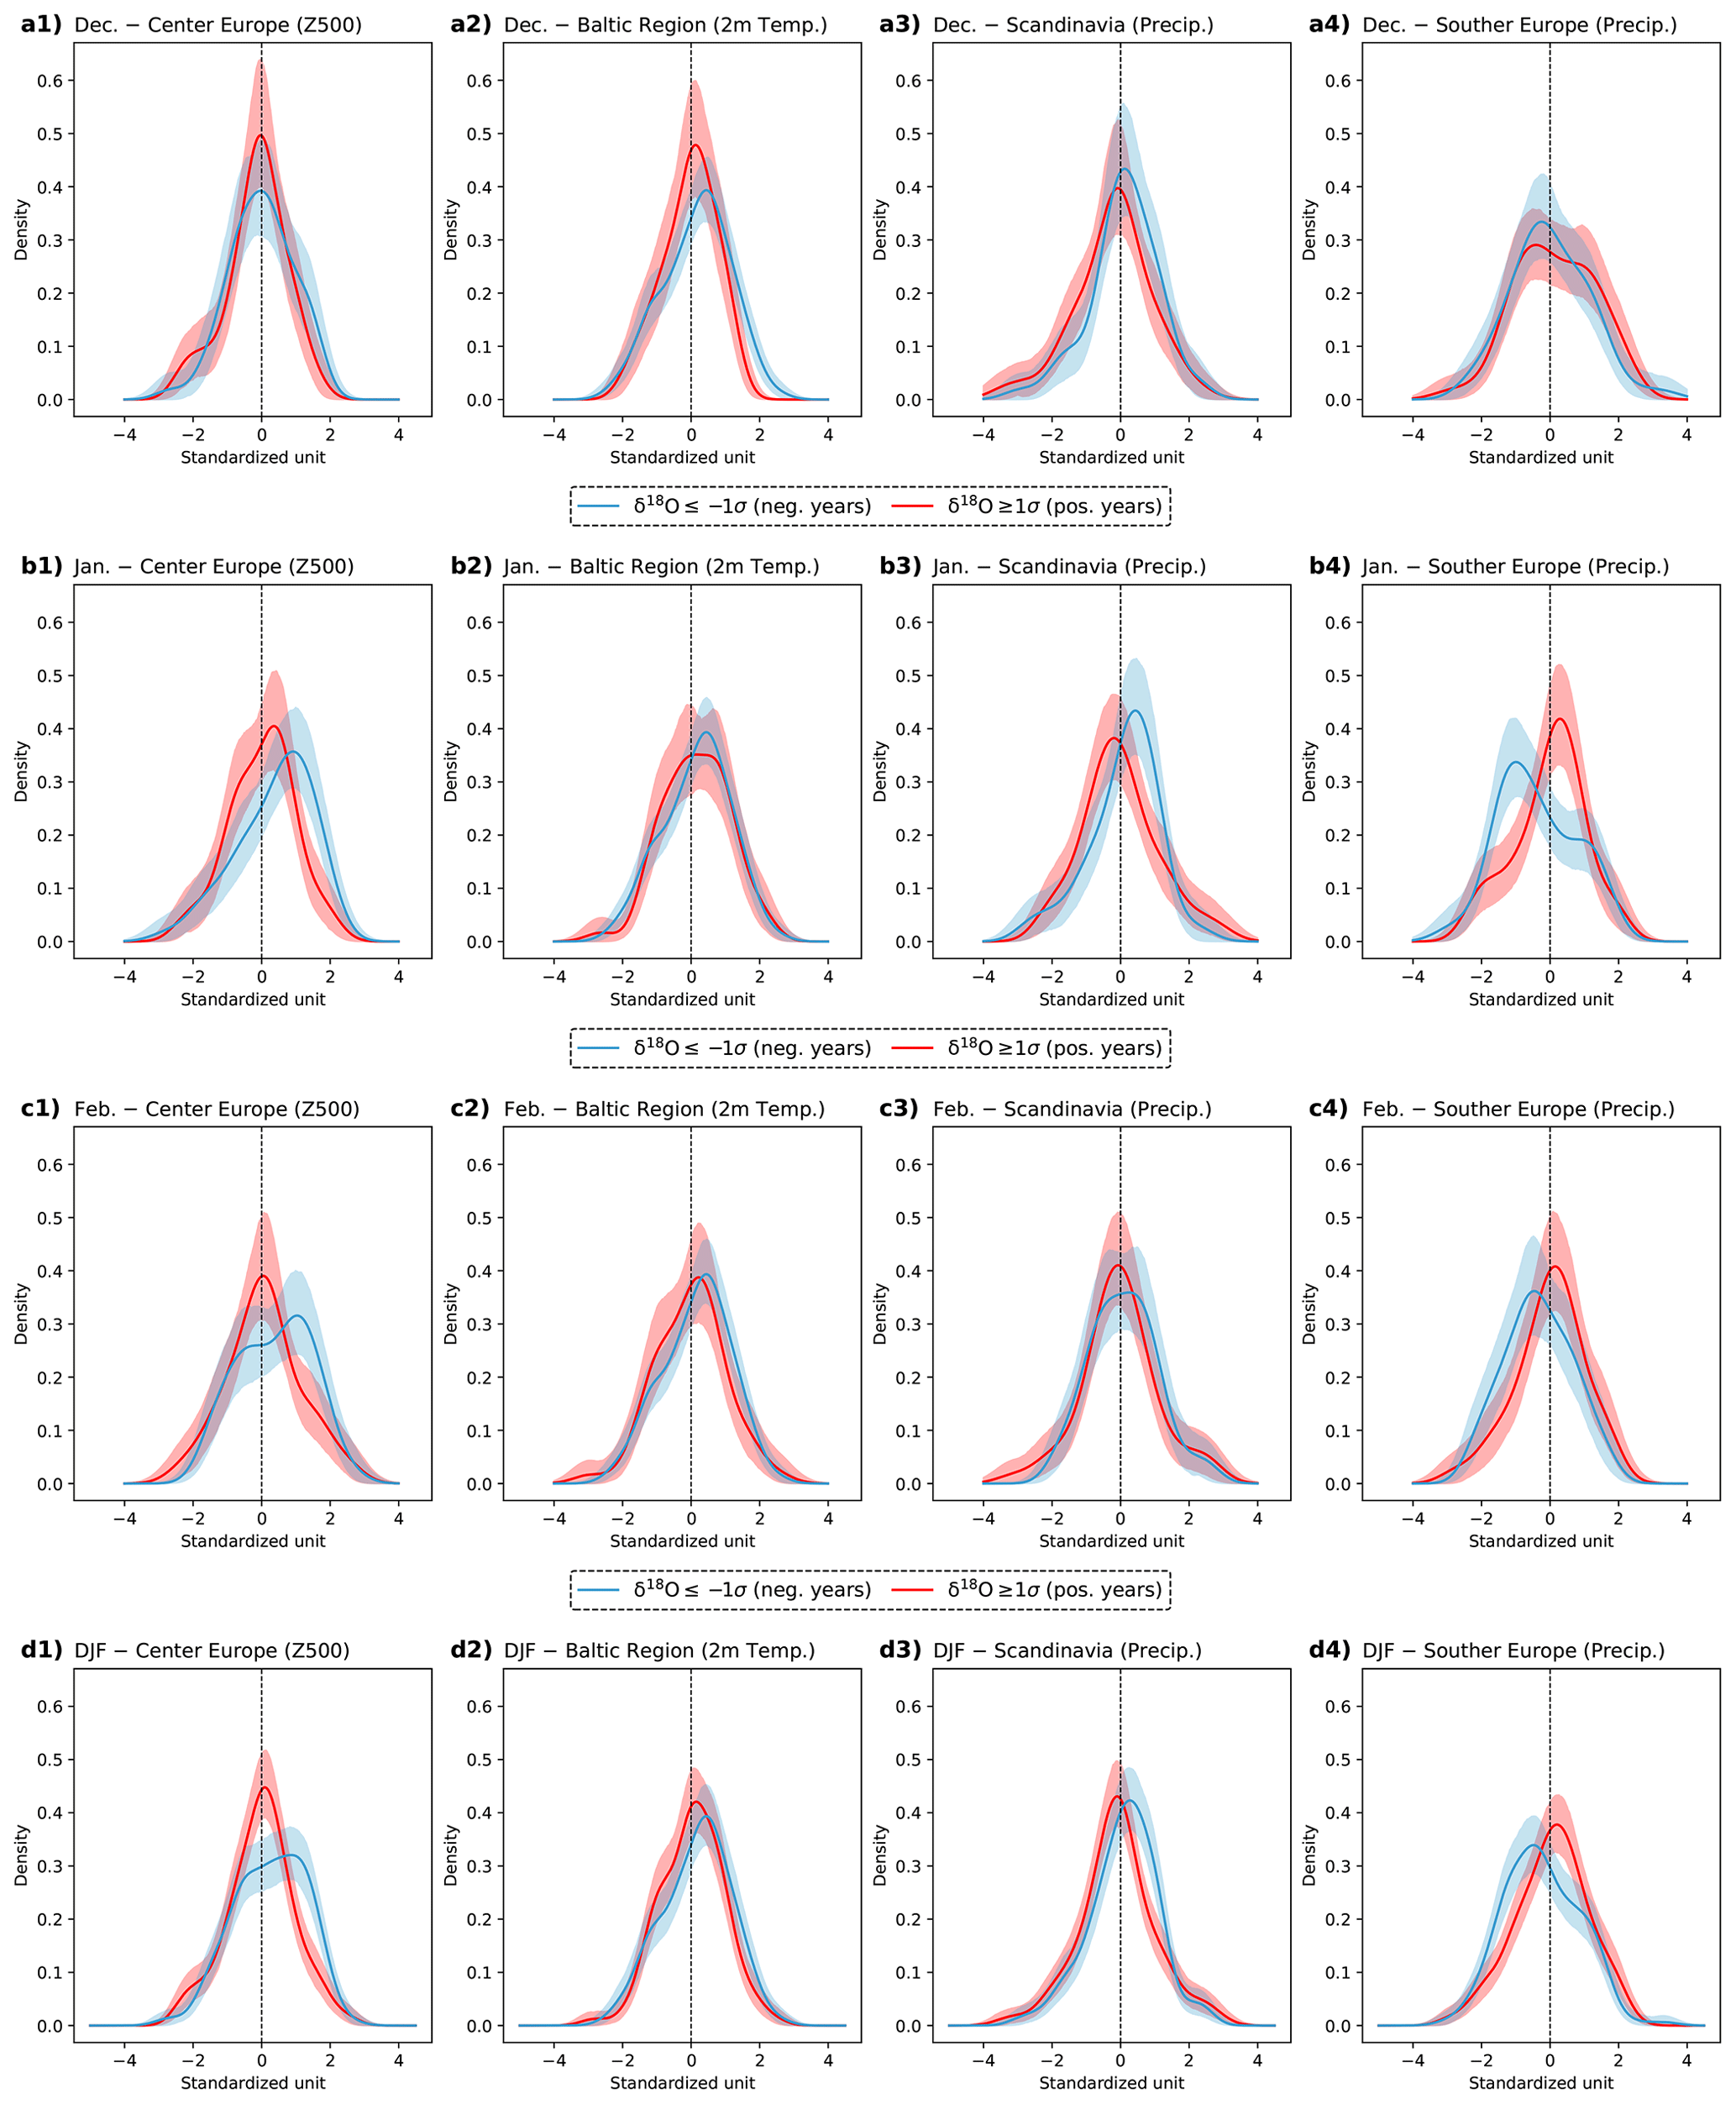
Figure 7Comparison of the estimated probability density functions of the monthly standardized field average (a–c) of the atmospheric variables depicted in (a–d) in DJF in the negative years the NGT stacked ice core record for the period 1602–2003. Shaded areas are the 90 % confidence interval.
The composite analysis presented in this study suggests more frequent blocking activity in the northeast Atlantic/western Europe during 1602–2003 period (Fig. 5a). This pattern suggests a northward shift in the jet stream in this region during low δ18O periods as a direct consequence of the blocking. Consistent with our results, Brönnimann et al. (2025) reported that an equatorward shift of the North Atlantic jet stream is associated with lower blocking frequency over Europe and more frequent floods in western Europe and the Alps. Indeed, the correlation between the index of the North Atlantic jet latitude (Brönnimann et al., 2025) and the NGT stacked δ18O time series, although small , is significant at 95 % confidence level, during this period.
The analyses presented demonstrate that negative years in the NGT stack δ18O series reflect a large-scale atmospheric circulation pattern that favors the recurrence of extreme weather events, supporting the use of δ18O as a proxy for such events. Furthermore, this relationship can be further linked to external forcings, such as solar variability and volcanic eruptions, and their influence the occurrence of extremes, possibly through similar mechanisms that favor atmospheric blocking over Europe, which are also recorded in the NGT stacked δ18O series.
Previous studies (e.g. Woollings et al., 2010; Lockwood et al., 2010) suggest that, during the observational period, low solar winters are associated with more (less) frequent blocking over western Europe (Greenland), a pattern that resembles our NGT blocking pattern (Fig. 3b). Indeed the correlation between our NGT δ18O record and total solar irradiance over the period 1610–2003, although low, is significantly positive (, 95 % level). However, the blocking pattern associated with low solar forcing during the observational period (Barriopedro et al., 2008; Woollings et al., 2010), extends more northeastward leading to extreme cold conditions over most part of Europe. This is not inconsistent with the NGT temperature pattern in this study (Fig. 5b) showing mild conditions over much part of northwestern Europe for low NGT years during 1602–2003.
Volcanic eruptions from tropical and extratropical regions are related to a northward shift in the Atlantic jet stream (Brönnimann et al., 2025) as well as to positive NAO (e.g. Woods and Baldini, 2025). However, the atmospheric response to particular volcanic events presents specific characteristics (Tejedor et al., 2024). For instance, the Krakatoa eruption in 1883 caused changes in atmospheric circulation during the following winter, favoring a high-pressure system over Europe (Schaller et al., 2009; Paik et al., 2023). In 1884, a minimum is observed in the NGT stacked δ18O series. By averaging the effects of twelve major volcanic eruptions, Robock and Mao (1992) identified a cooling signal over northern Africa and southern Europe, and a warming over northern Europe. The associated mean sea-level pressure anomalies show a pattern consistent with the geopotential height anomalies observed during negative years in the NGT stacked δ18O series. Furthermore, the eruptions of El Chichón in 1982 and Pinatubo in 1991 are also associated with warming across northern Europe and very low values of δ18O in the NGT stacked series. Although the warming observed in the Northern Hemisphere, particularly over Europe and Asia, occurred after the Pinatubo eruption, it has been attributed to internal variability rather than to a causal effect of the eruption (Polvani et al., 2019).
The large-scale atmospheric circulation associated with the extremely high and low values observed in the NGT stacked δ18O series during the observational (1920–2011) and long-term (1602–2003) periods is investigated using composite analysis. The atmospheric circulation during the negative years for the observational period shows an anomaly pattern resembling an atmospheric blocking over Europe extended from Azores Islands to Baltic Sea.
The absence of a consistent large-scale atmospheric circulation pattern during years with positive δ18O anomalies highlights that low δ18O values in the NGT stacked δ18O time series are more strongly influenced by specific large-scale atmospheric circulation features.
The atmospheric blocking indices TB90 and S04 corroborate that the anomaly in the geopotential height are associated with an increase in atmospheric blocking over the Baltic Sea. The atmospheric blocking anomaly pattern is found to have an impact on the hydroclimatic conditions over Europe in the observational period. In particular, in the observational period, the results exhibit an average increase of precipitation in Norwegian coastal and drier conditions over southern Europe. This provides good empirical evidence supporting that NGT stacked δ18O is a good proxy for hydroclimatic conditions over Europe (Pfahl, 2014). However, the limited amount of observations does not allow to carry out statistical significance.
The availability of paleoreanalysis permits to assess whether the pattern of the atmospheric blocking over Europe present in the observational period is also present in the long-term perspective period (1602–2003). Results in Sect. 3.2 outline an analogous pattern of an high-pressure system centered over northern France and Southern Great Britain that increases precipitation in the Norwegian coastal areas and decreases precipitation in southern Europe. This high-pressure system pattern result to be statistical significant (Fig. A8). Distributions of box-based indices for geopotential height, temperature, and precipitation in the areas reveal a statistical significant change in the hydroclimatic conditions (Figs. 6 and 7). In particular, wetter conditions for Norwegian coastal areas and drier conditions for southern Europe are observed. Wetter and drier conditions are associated with warmer and colder conditions. Moreover, the period of major change in the distribution of the precipitation during the winter is January. The shift in the distributions of temperature and precipitation presented (Figs. 6 and 7) are not located at the tail of their distributions. However, the values around which the changes in the distribution of temperature and precipitation occur still represent, or are close to representing, extreme conditions. Since the data are monthly, it is not possible to classify these as extreme meteorological events. Nevertheless, given the consistency of the results with the observational period, it is reasonable to interpret these shifts in the historical temperature and precipitation distributions as being influenced by the occurrence of particularly intense phenomena.
This study demonstrates that the NGT stacked δ18O time series reliably captures signals of extreme hydroclimatic conditions in Europe, mainly through its variability linked to atmospheric blocking patterns. The consistent association between low δ18O anomalies and blocking-induced hydroclimatic events, such as extreme precipitation along the Norwegian coast and anomalously low temperatures and drought conditions in Southern Europe, across both observational and long-term periods provides robust evidence for using δ18O as a proxy to reconstruct past European climate variability and extremes.
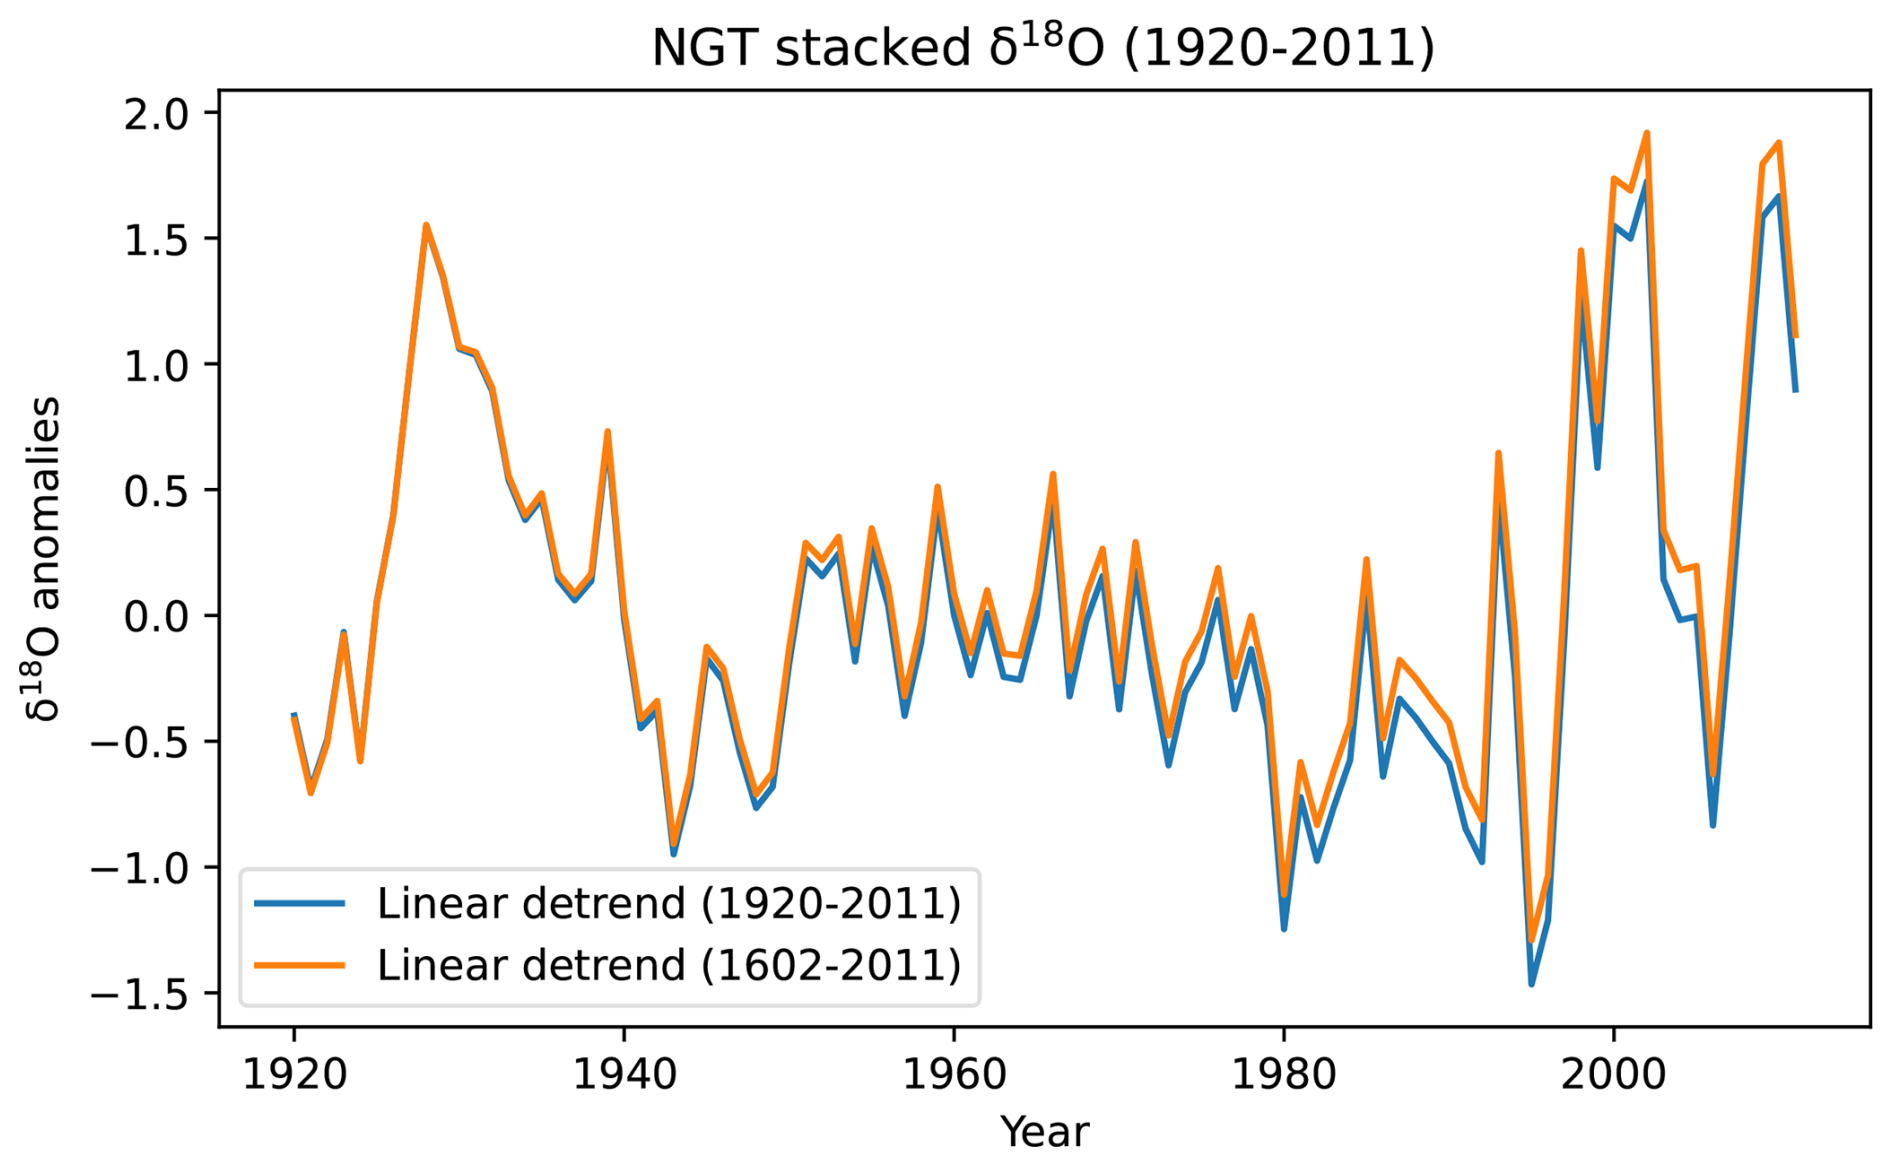
Figure A1Comparison of linear detrending the NGT stacked δ18O record over 1920–2011 with two different fitting periods. The blue line shows the trend estimated by fitting the linear model exclusively to the 1920–2011 period, while the orange line shows the trend derived from a fit over the full 1602–2011 period and evaluated over the same 1920–2011 window.
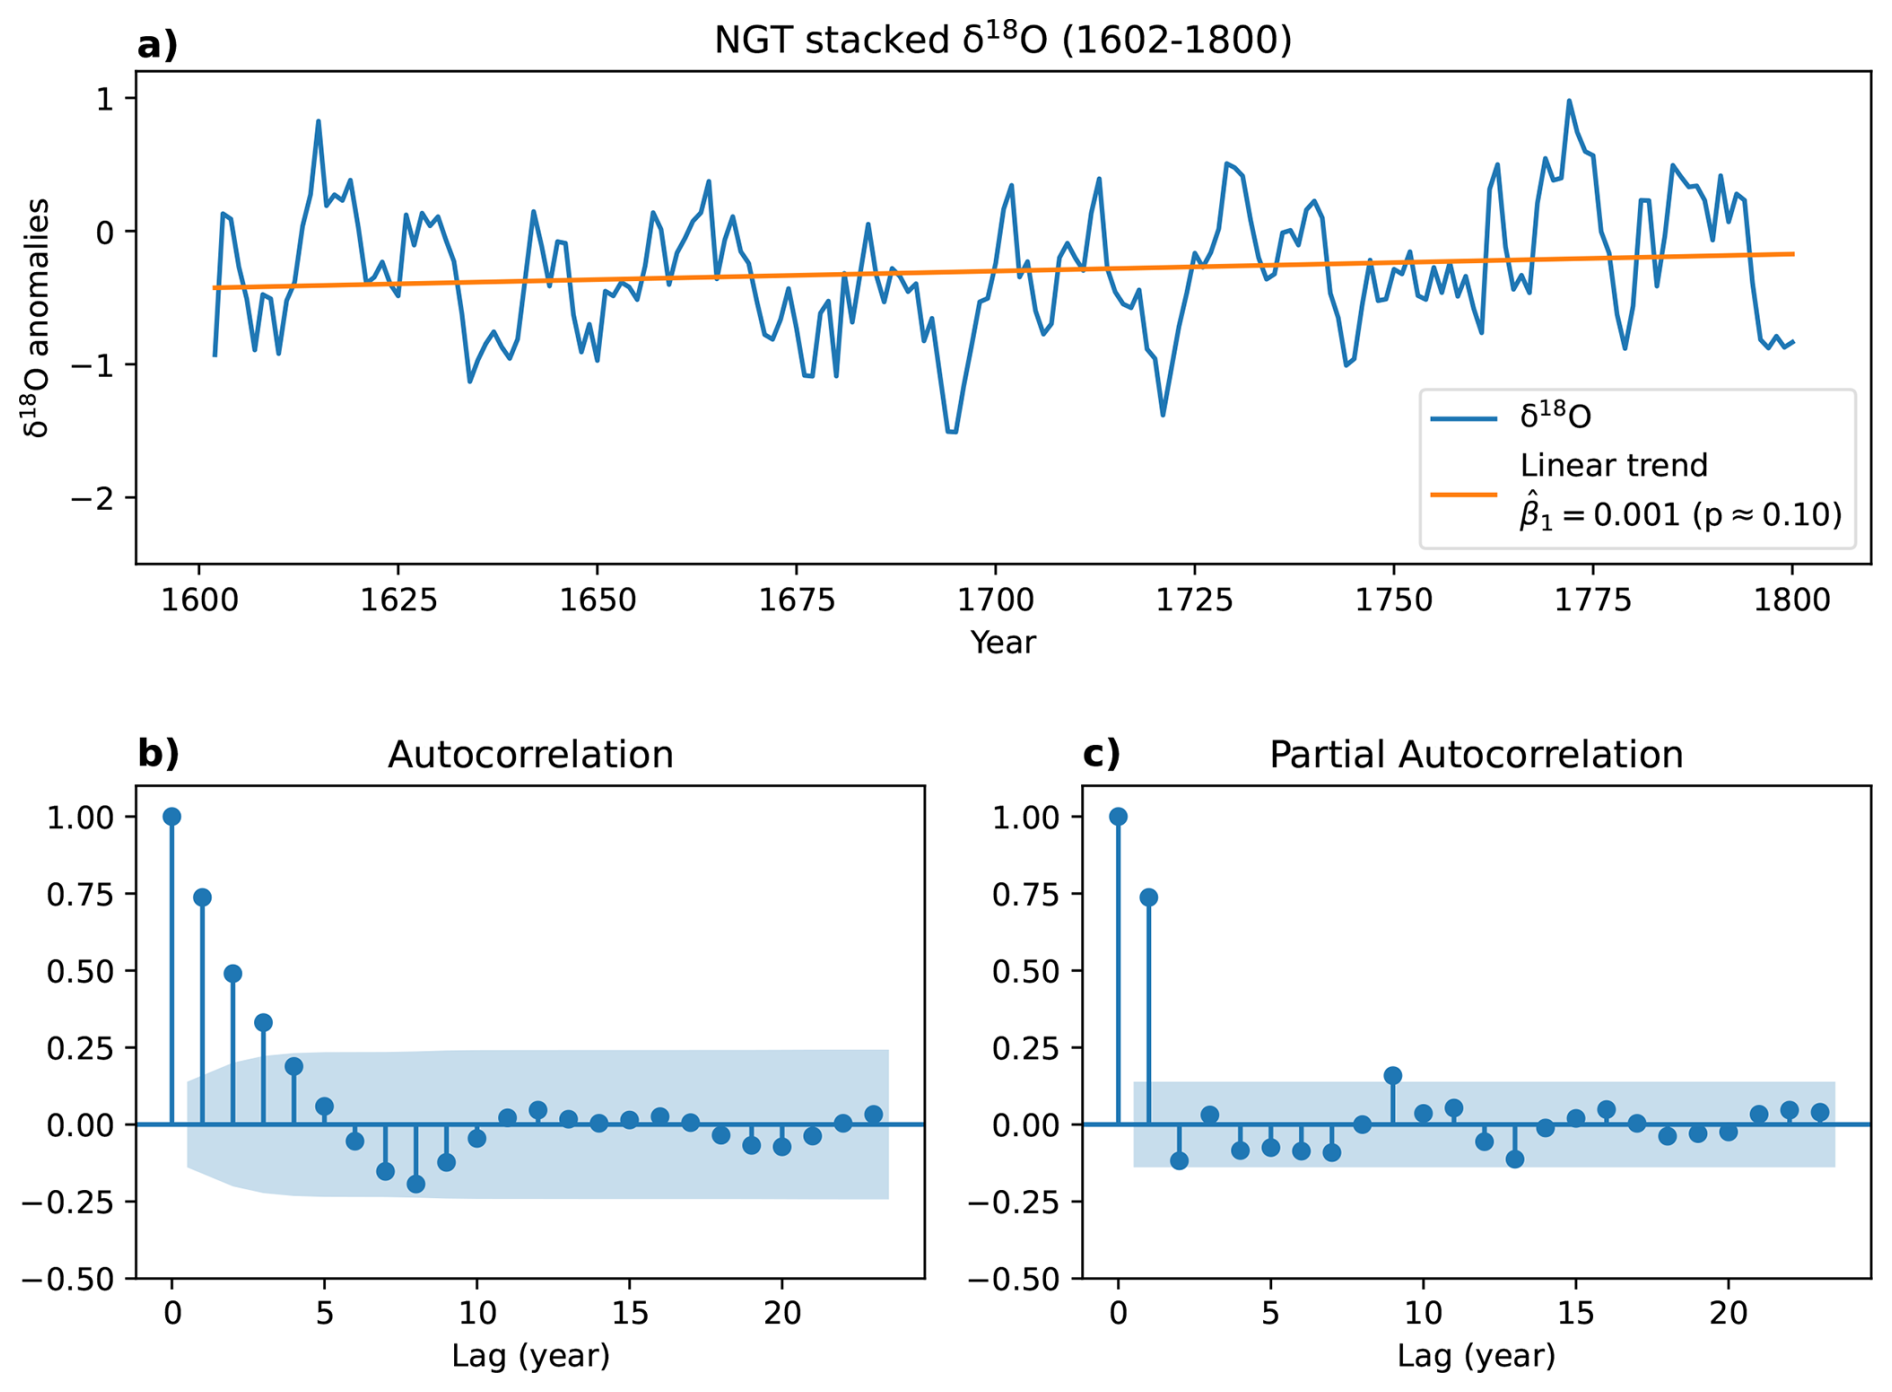
Figure A2(a) Positive linear trend in the NGT stack δ18O series over the period 1602–1800. The uncertainty in the trend estimate is quantified using a Heteroskedasticity and Autocorrelation Consistent (HAC) covariance estimator, which accounts for the autocorrelation structure, modelled as a first-order autoregressive process AR(1), present in the regression residuals, as shown in (b) and (c). Shaded areas are the 95 % confidence intervals.
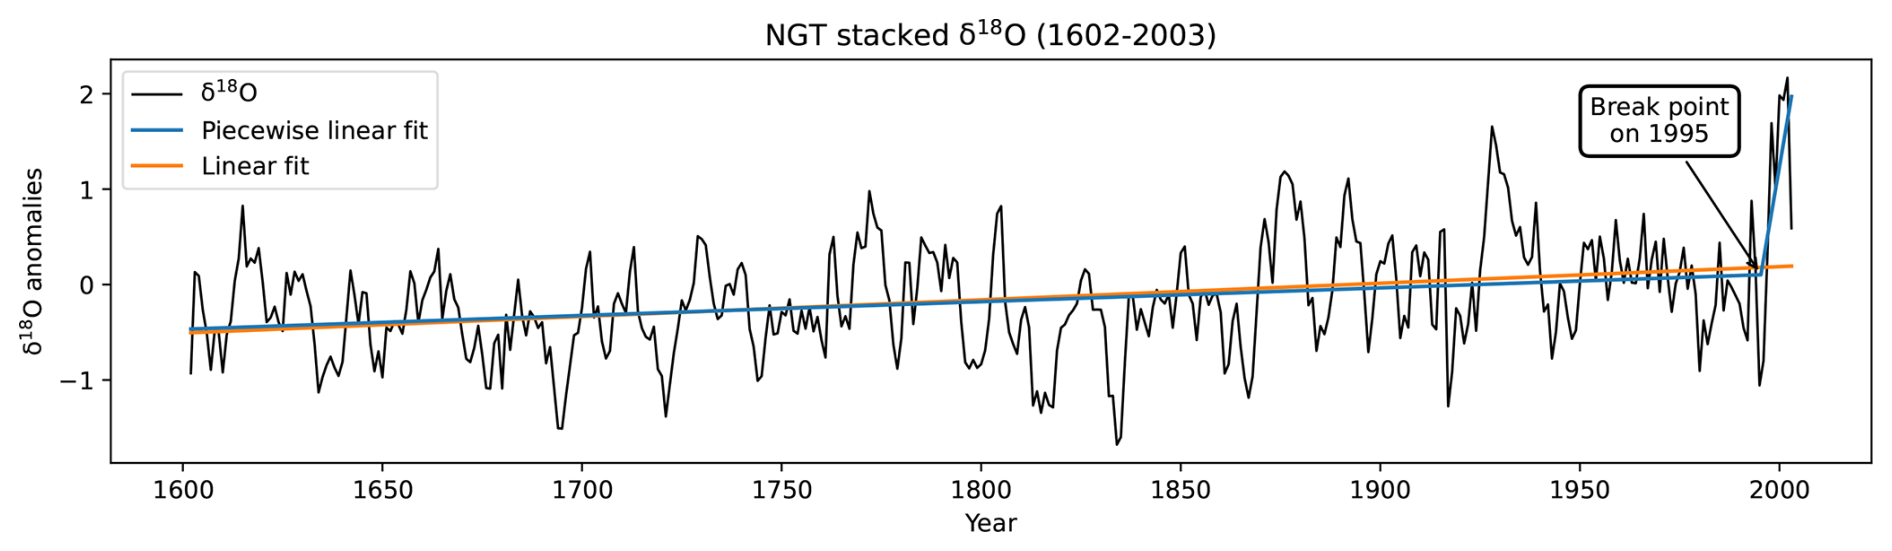
Figure A3Comparison between the trend obtained by linear and piecewise regression. The linear and piecewise trend are almost indistinguishable exception made for 1995 onward. The changes in the positive and negative years due to a different detrending method are shown in Fig. A4.
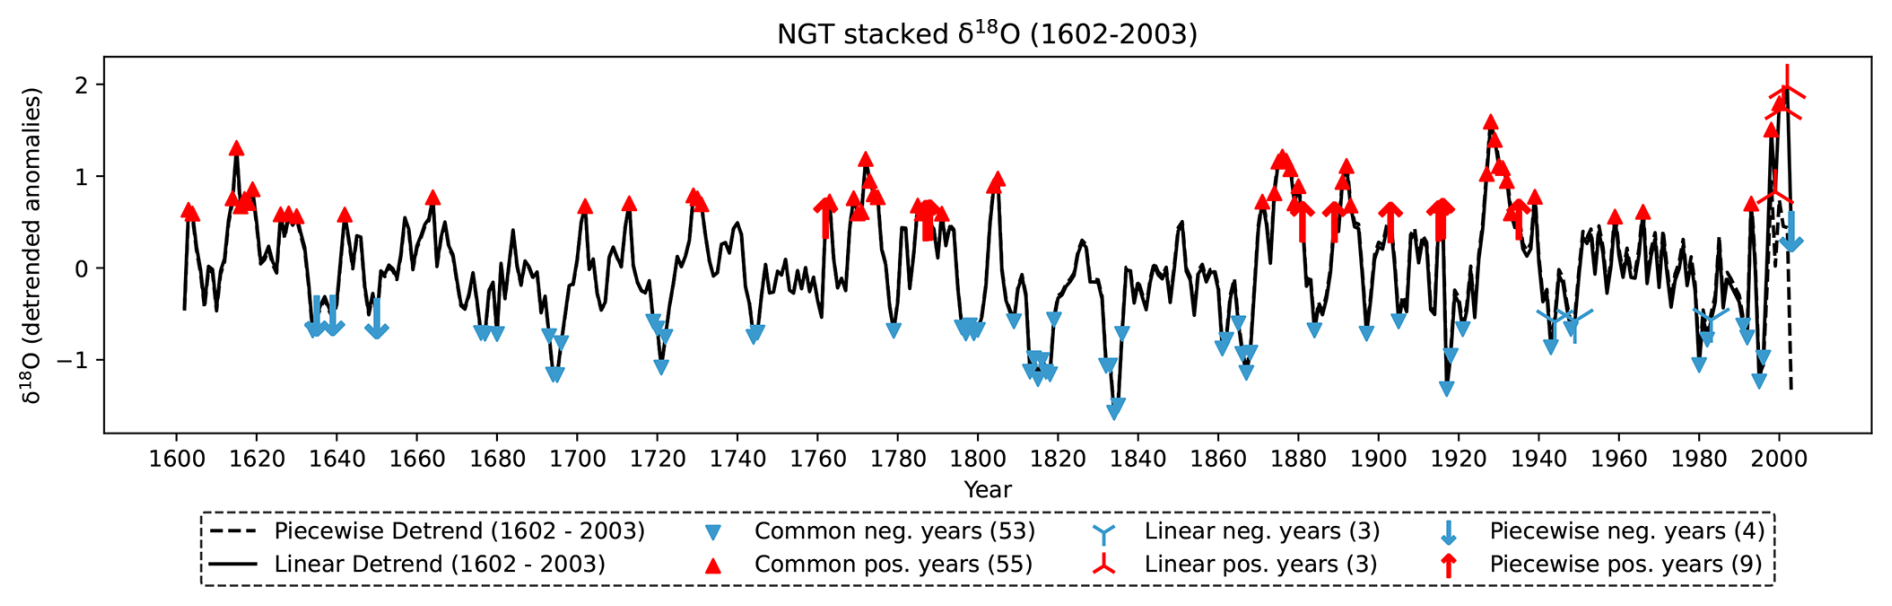
Figure A4Comparison between the NGT stacked δ18O series detrended using linear (solid line) and piecewise (dashed line) methods. Upward- and downward-pointing triangles mark positive and negative anomalous years identified by both methods. Upward- and downward-pointing tripods indicate years identified exclusively by the linear method, while upward- and downward-pointing arrows indicate years identified exclusively by the piecewise method.
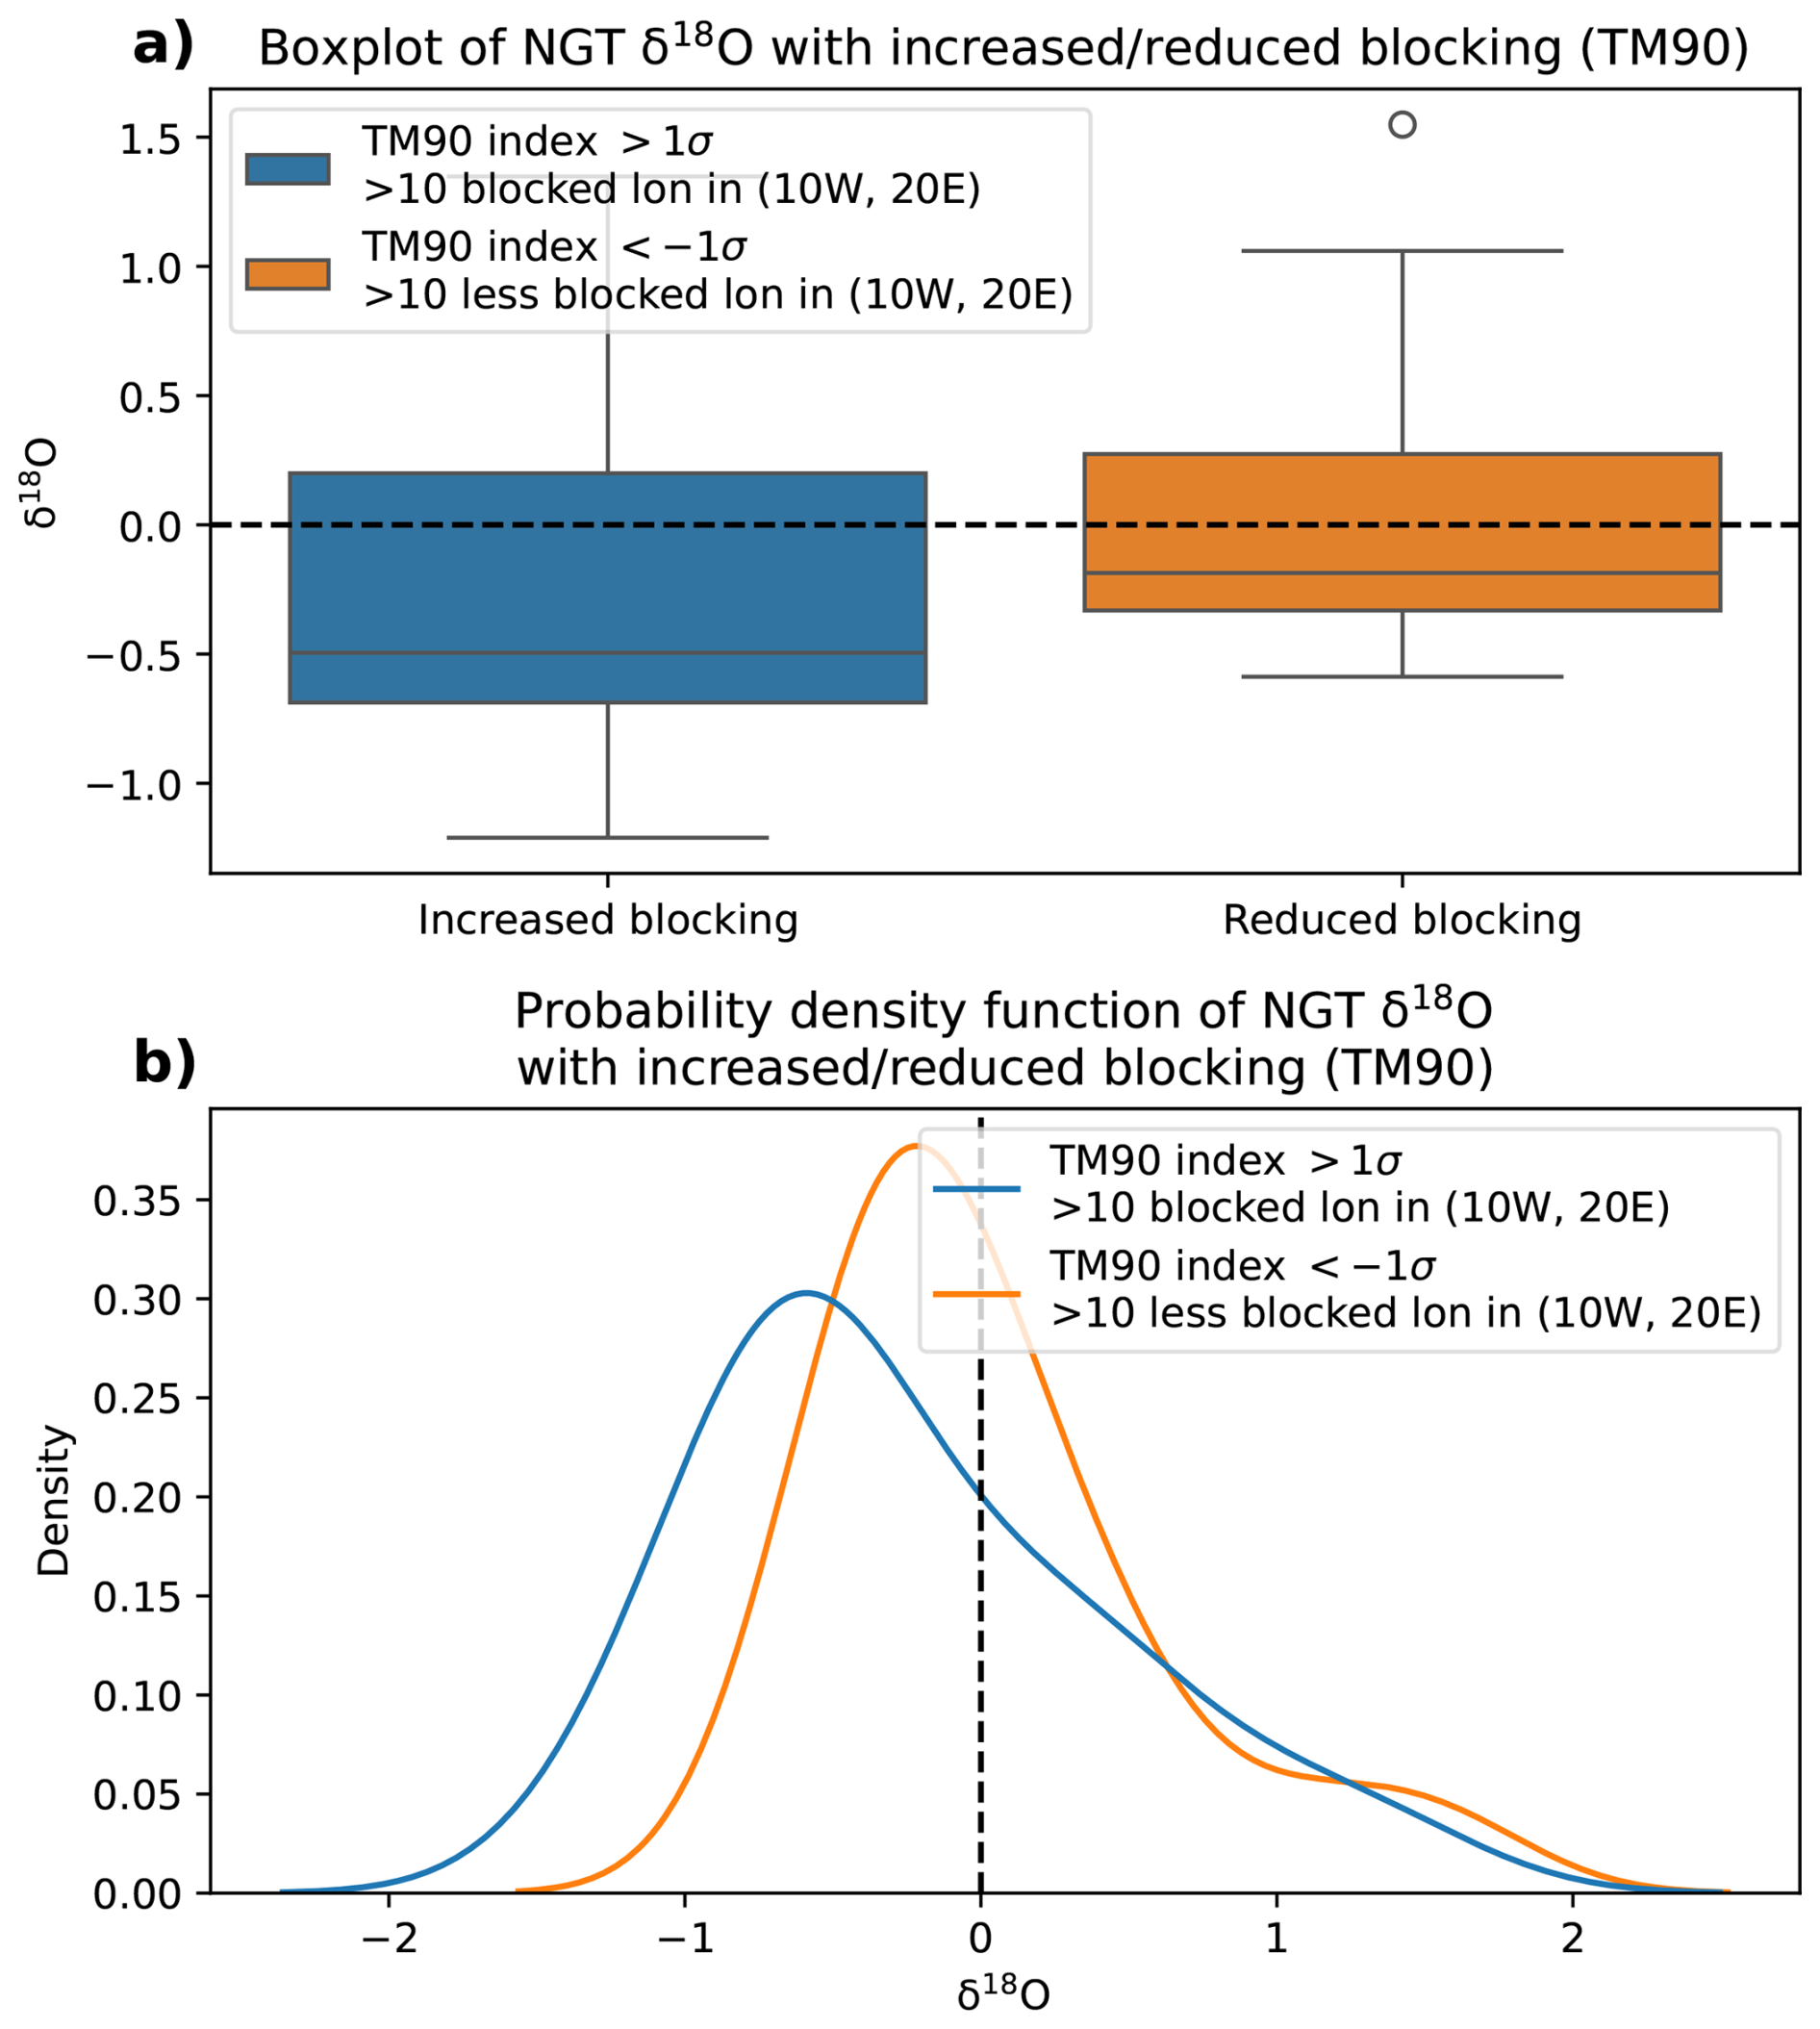
Figure A5Boxplot (a) and probability density function (b) of NGT stacked δ18O during years of extreme block events activity. Years in which the TM90 atmospheric blocking index exceeds , where σ is the standard deviation of atmospheric blocking frequency in the observational period, and at least for 12° longitude between 10° W and 20° E are marked as years with increased (reduced) blocking events.
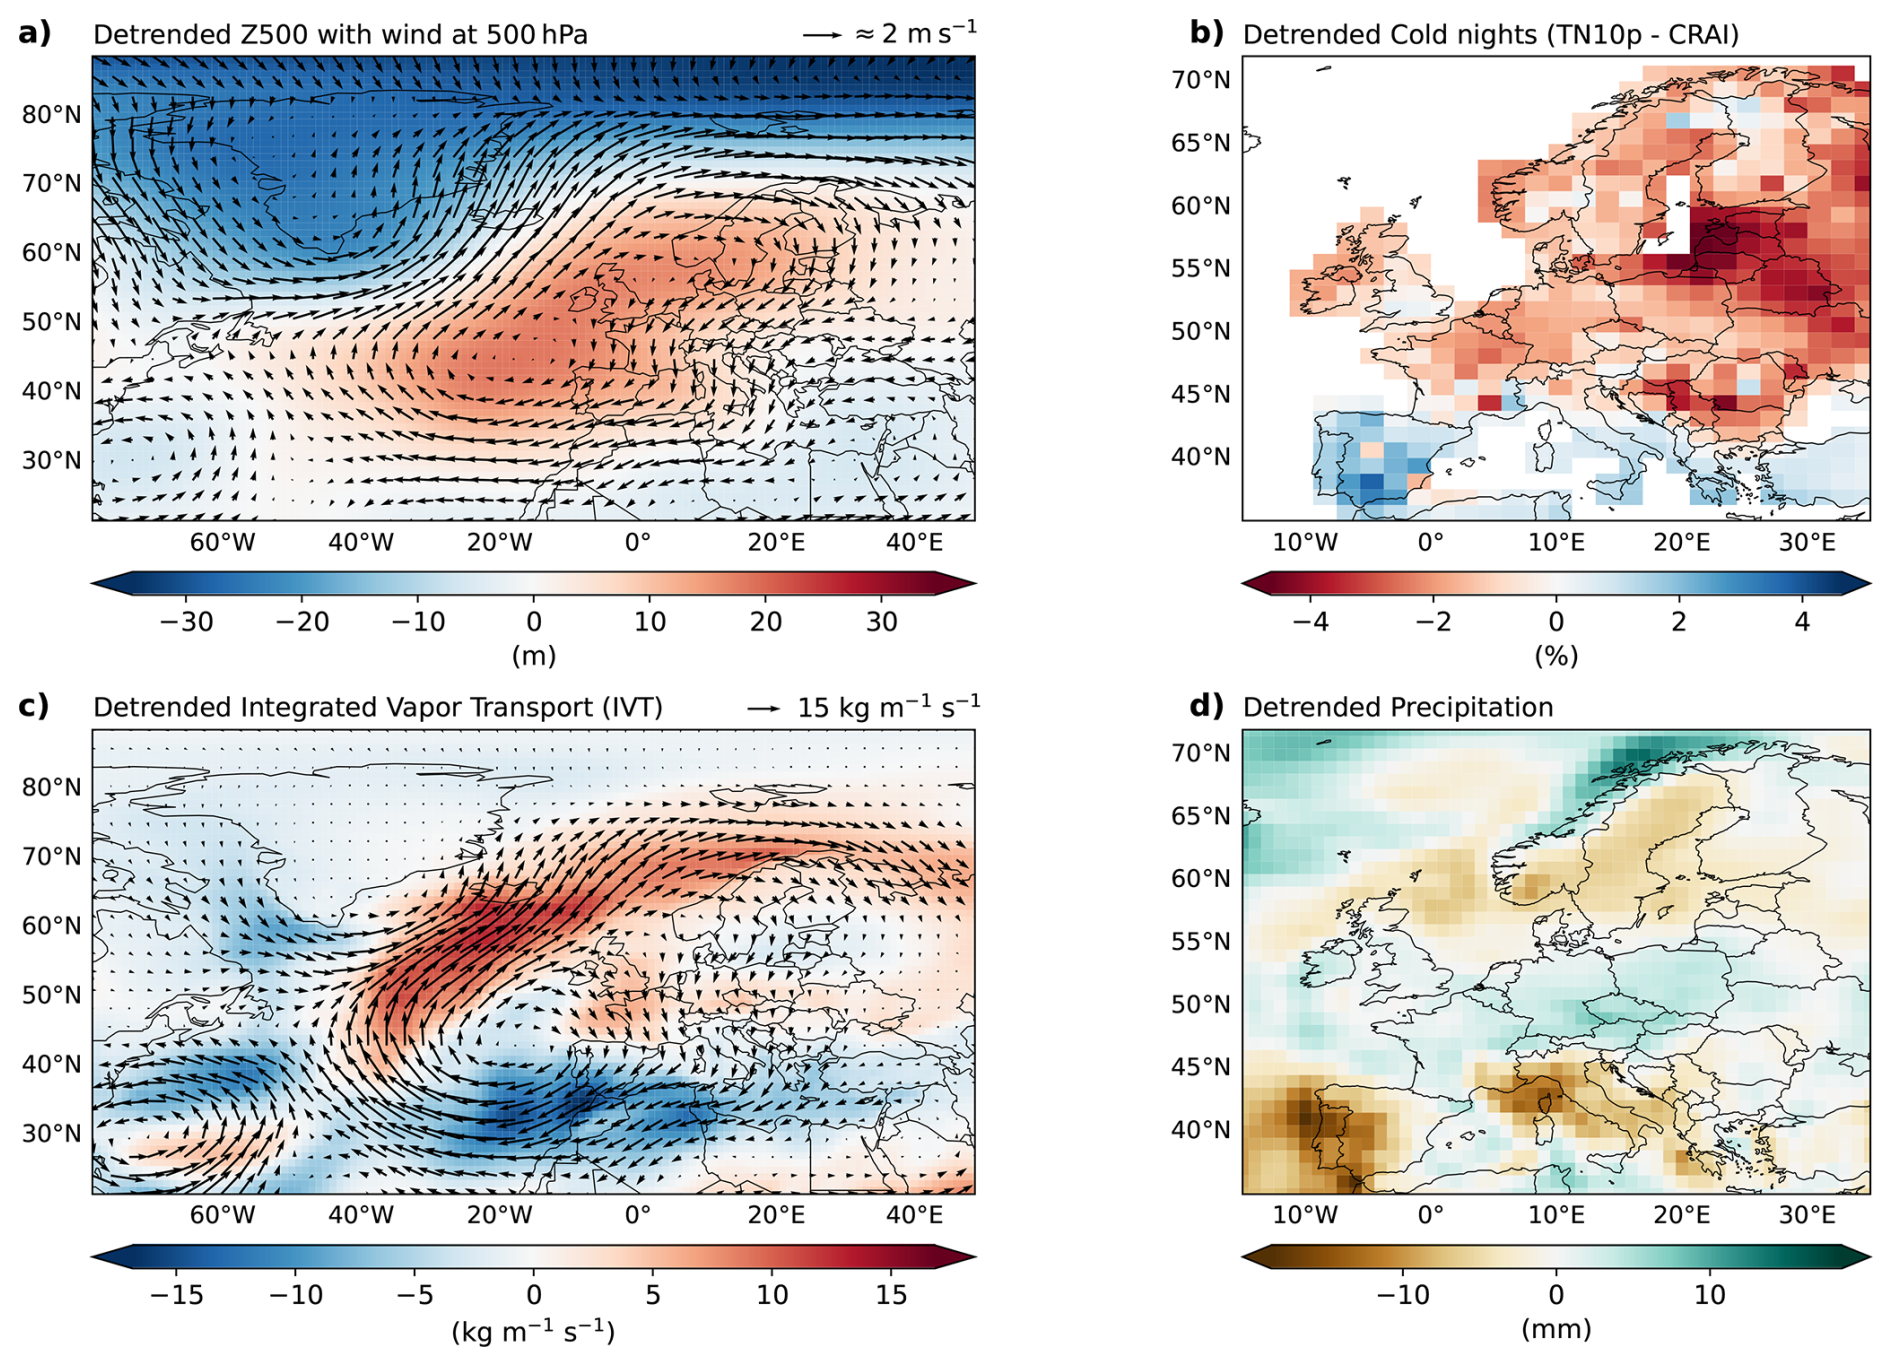
Figure A6As Fig. A7, but panel (b) uses CRAI dataset.
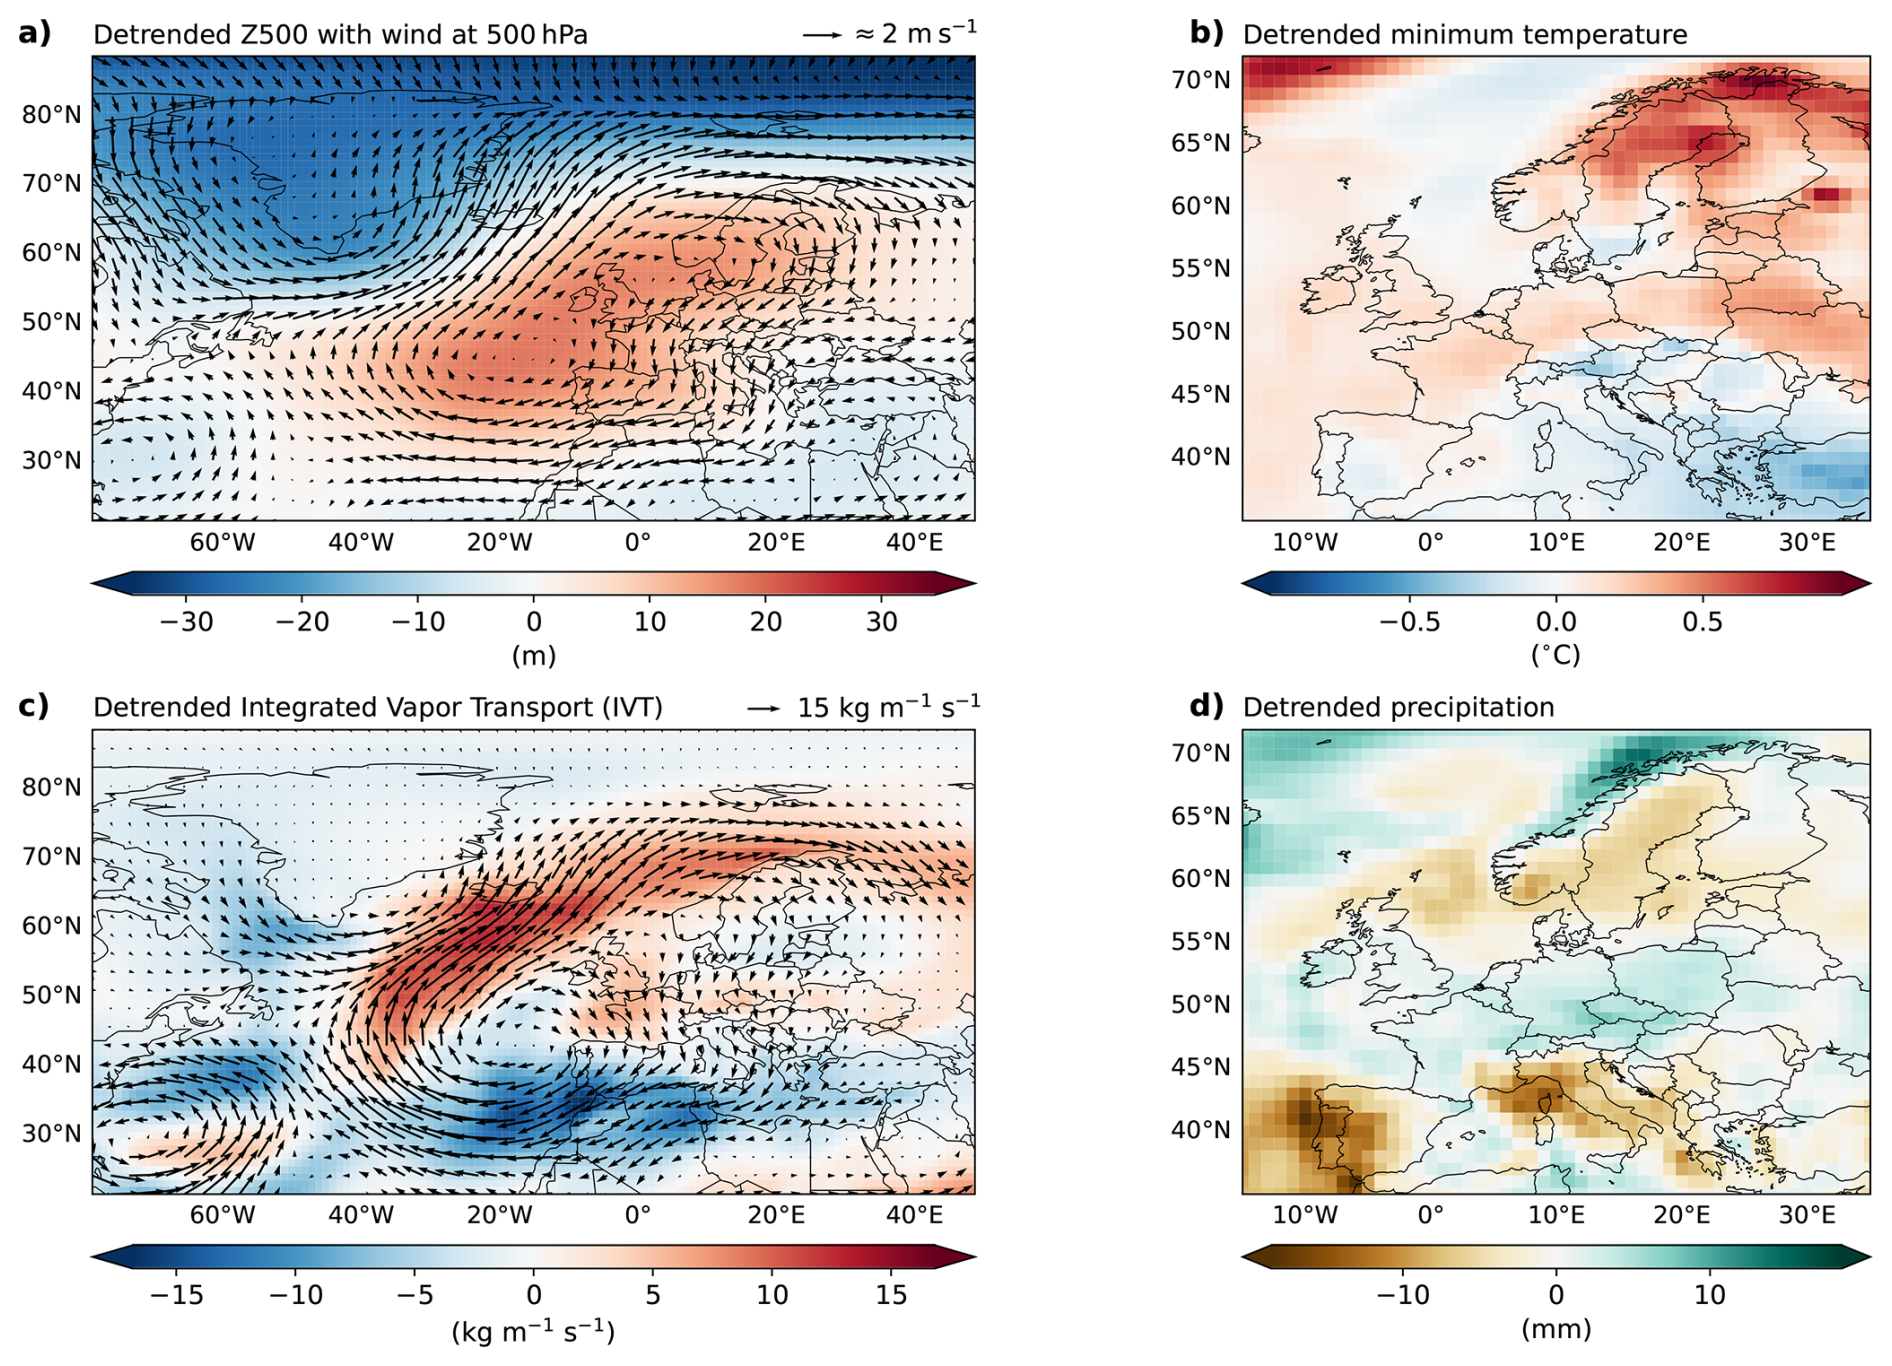
Figure A7As Fig. 2, but panel (b) and (d) are, respectively, the detrended minimum temperature and total precipitation using 20CRv3.
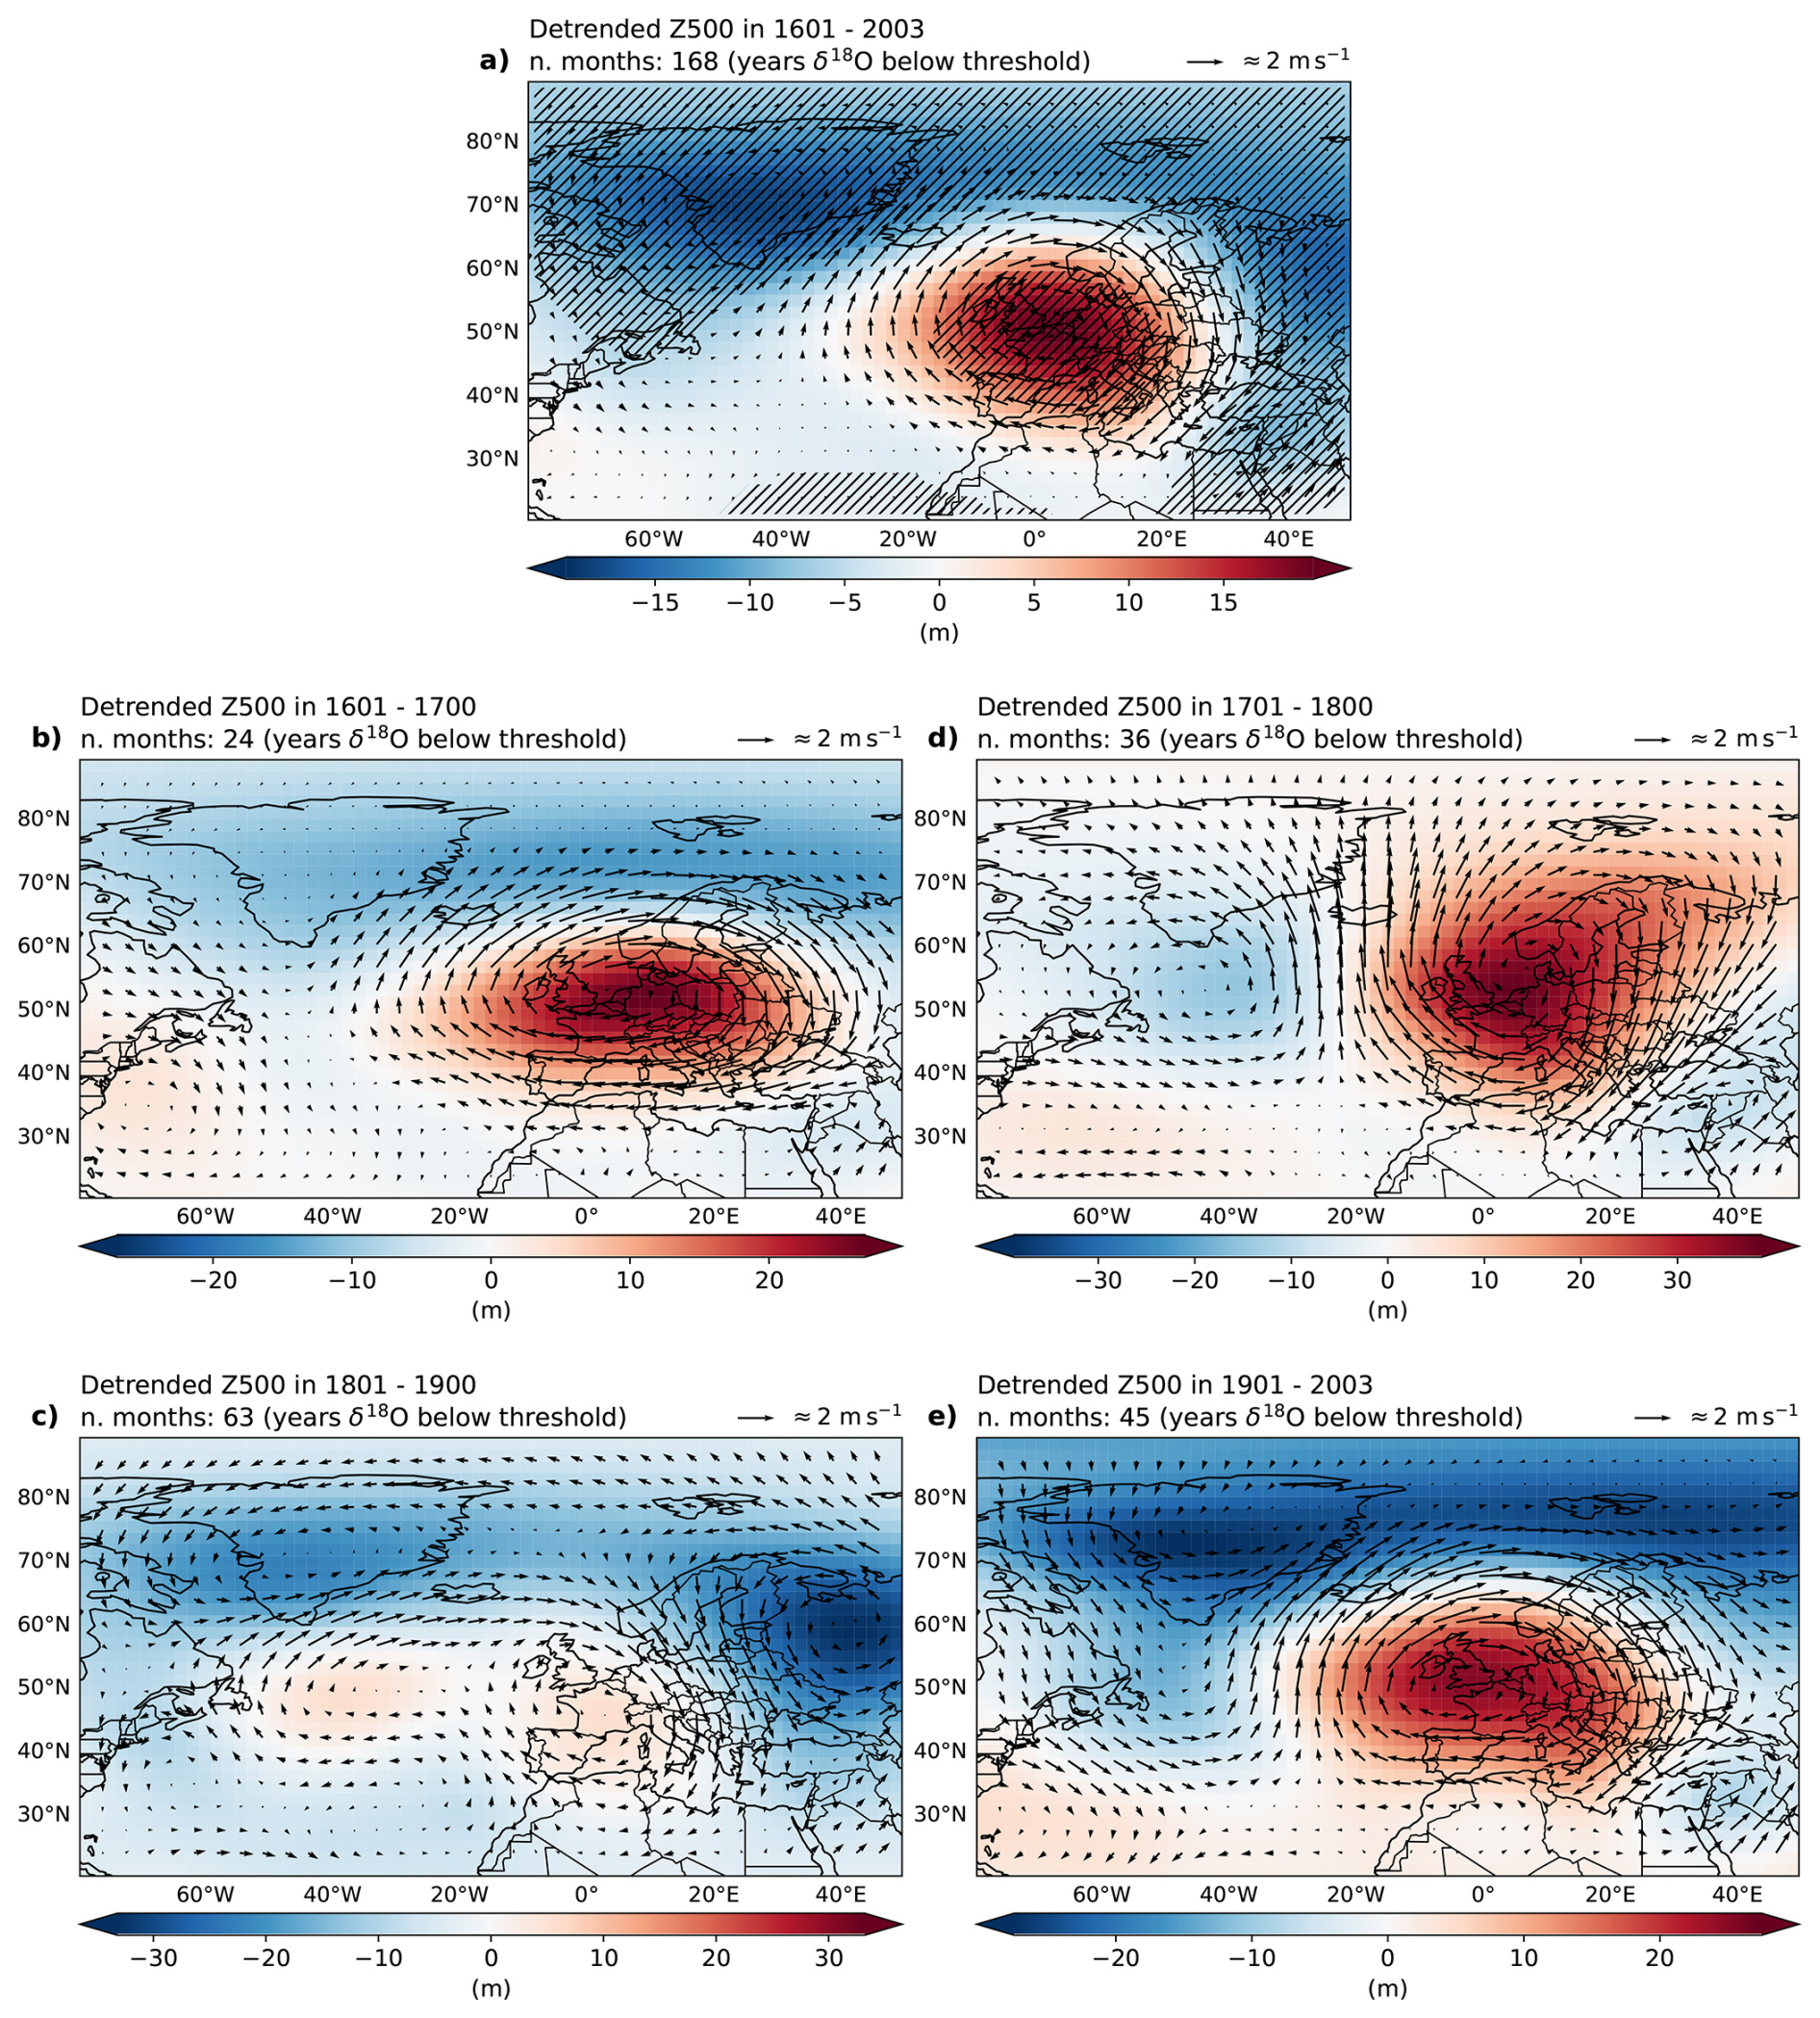
Figure A8The composite maps of the detrended monthly anomalies of the geopotential height (shaded) at 500 hPa (Z500) and the wind (vector) at 200 hPa on the winter season (DJF) in the negative years the NGT stacked ice core record for the period: (a) 1602–2003, (b) 1601–1700, (c) 1701–1800, (d) 1801–1900, and (e) 1901–2003. Hatched areas in panel (a) are statistically different from zero at 90 % also taking into account the false discovery rate (FDR) at 10 % (Wilks, 2016).
The code of the analysis is available contacting the corresponding author upon request.
The NGT stacked stable oxygen isotope record δ18O is available from Hörhold et al. (2023). The 20th Century Reanalysis (V3) (Slivinski et al., 2019) is freely available online (https://psl.noaa.gov/data/gridded/data.20thC_ReanV3.html, last access: August 2024). The CRAI dataset (Plésiat et al., 2024) is freely available in the link indicated in the publication. The 1D and 2D atmospheric blocking algorithm is available online (https://github.com/oloapinivad/MiLES, Davini, 2019). The paleo-reanalysis dataset EKF400v2 is available at Franke et al. (2020). The E-OBS (Cornes et al., 2018) data is freely available online https://surfobs.climate.copernicus.eu/dataaccess/access_eobs.php (last access: August 2024). The Python package icclim (Aoun et al., 2024) is freely available online (https://github.com/cerfacs-globc/icclim).
Conceptualization and methodology, AG, NR, MI; Formal analysis, AG, NR, MI; Investigation, AG, NR, MI; Resources, AG, NR, MI, GL; Data curation, AG; Writing – original draft preparation, AG; writing – review and editing, AG, NR, GL, MI; All authors have significantly contributed to the preparation of this manuscript.
The contact author has declared that none of the authors has any competing interests.
Publisher's note: Copernicus Publications remains neutral with regard to jurisdictional claims made in the text, published maps, institutional affiliations, or any other geographical representation in this paper. The authors bear the ultimate responsibility for providing appropriate place names. Views expressed in the text are those of the authors and do not necessarily reflect the views of the publisher.
AG was supported by the International Science Program for Integrative Research in Earth Systems (INSPIRES) at AWI, via the project “Greenland Ice Cores as Proxy for European Extremes”. MI, GL, and NR were partially supported by Helmholtz Association through the joint program “Changing Earth – Sustaining our Future” (PoF IV) program of the AWI. MI was also supported by the Helmholtz Climate Initiative REKLIM. The authors gratefully acknowledge the German Climate Computing Centre (DKRZ) for providing computing time on the supercomputer Levante. The authors gratefully acknowledge support by the Open Access publication fund of Alfred-Wegener-Institut Helmholtz-Zentrum für Polar- und Meeresforschung.
This research has been supported by the Alfred Wegener Institute Helmholtz Centre for Polar and Marine Research (grant no. PS87010202). The article processing charges for this open-access publication were covered by the Alfred-Wegener-Institut Helmholtz-Zentrum für Polar- und Meeresforschung.
This paper was edited by Nancy Bertler and reviewed by Mathieu Casado, Pascal Yiou, and one anonymous referee.
Andersen, K. K., Azuma, N., Barnola, J.-M., Bigler, M., Biscaye, P., Caillon, N., Chappellaz, J., Clausen, H. B., Dahl-Jensen, D., Fischer, H., Flückiger, J., Fritzsche, D., Fujii, Y., Goto-Azuma, K., Grønvold, K., Gundestrup, N. S., Hansson, M., Huber, C., Hvidberg, C. S., Johnsen, S. J., Jonsell, U., Jouzel, J., Kipfstuhl, S., Landais, A., Leuenberger, M., Lorrain, R., Masson-Delmotte, V., Miller, H., Motoyama, H., Narita, H., Popp, T., Rasmussen, S. O., Raynaud, D., Rothlisberger, R., Ruth, U., Samyn, D., Schwander, J., Shoji, H., Siggard-Andersen, M.-L., Steffensen, J. P., Stocker, T., Sveinbjörnsdóttir, A. E., Svensson, A., Takata, M., Tison, J.-L., Thorsteinsson, T., Watanabe, O., Wilhelms, F., White, J. W. C., and members, North Greenland Ice Core Project: High-resolution record of Northern Hemisphere climate extending into the last interglacial period, Nature, 431, 147–151, https://doi.org/10.1038/nature02805, 2004. a
Aoun, A., Christian, Natalia, xavier, marev711, Bärring, L., bekozi, Bourgault, P., Gasteratos, P., Irving, D., and bascrezee: cerfacs-globc/icclim: 7.0.0, Zenodo [code], https://doi.org/10.5281/zenodo.11093617, 2024. a, b
Appenzeller, C., Stocker, T. F., and Anklin, M.: North Atlantic Oscillation dynamics recorded in Greenland ice cores, Science, 282, 446–449, https://doi.org/10.1126/science.282.5388.446, 1998. a, b
Bakke, S. J., Ionita, M., and Tallaksen, L. M.: Recent European drying and its link to prevailing large-scale atmospheric patterns, Sci. Rep.-UK, 13, 21921, https://doi.org/10.1038/s41598-023-48861-4, 2023. a
Barlow, L. K., White, J. W. C., Barry, R. G., Rogers, J. C., and Grootes, P. M.: The North Atlantic Oscillation signature in deuterium and deuterium excess signals in the Greenland Ice Sheet Project 2 Ice Core, 1840–1970, Geophys. Res. Lett., 20, 2901–2904, https://doi.org/10.1029/93GL03305, 1993. a
Barriopedro, D., García-Herrera, R., and Huth, R.: Solar modulation of Northern Hemisphere winter blocking, J. Geophys. Res.-Atmos., 113, https://doi.org/10.1029/2008JD009789, 2008. a
Bradley, R. S.: Chapter 13 – tree rings, in: Paleoclimatology, edited by: Bradley, R. S., Academic Press, San Diego, 3rd edn., https://doi.org/10.1016/B978-0-12-386913-5.00013-2, 453–497, 2015. a
Brönnimann, S., Franke, J., Valler, V., Hand, R., Samakinwa, E., Lundstad, E., Burgdorf, A.-M., Lipfert, L., Pfister, L., Imfeld, N., and Rohrer, M.: Past hydroclimate extremes in Europe driven by Atlantic jet stream and recurrent weather patterns, Nat. Geosci., 18, 246–253, https://doi.org/10.1038/s41561-025-01654-y, 2025. a, b, c, d, e
Casado, M. and Orsi, A. J.: New perspectives on the isotopic paleothermometer, Past Global Changes Magazine, 31, 100–101, https://doi.org/10.22498/pages.31.2.100, 2023. a
Chylek, P., Folland, C. K., Dijkstra, H. A., Lesins, G., and Dubey, M. K.: Ice-core data evidence for a prominent near 20 year time-scale of the Atlantic Multidecadal Oscillation, Geophys. Res. Lett., 38, https://doi.org/10.1029/2011GL047501, 2011. a, b
Cornes, R. C., van der Schrier, G., van den Besselaar, E. J. M., and Jones, P. D.: An ensemble version of the E-OBS temperature and precipitation data sets, J. Geophys. Res.-Atmos., 123, 9391–9409, https://doi.org/10.1029/2017JD028200, 2018. a, b
Davini, P.: MiLES – Mid Latitude Evaluation System, Zenodo [code], https://doi.org/10.5281/zenodo.2578139, 2019. a, b, c
DelSole, T. and Tippett, M.: Statistical Methods for Climate Scientists, Cambridge University Press, ISBN 978-1-108-47241-8, 2022. a
Dong, B. and Sutton, R. T.: Drivers and mechanisms contributing to excess warming in Europe during recent decades, npj Climate and Atmospheric Science, 8, 41, https://doi.org/10.1038/s41612-025-00930-3, 2025. a
Faranda, D., Messori, G., Jezequel, A., Vrac, M., and Yiou, P.: Atmospheric circulation compounds anthropogenic warming and impacts of climate extremes in Europe, P. Natl. Acad. Sci. USA, 120, e2214525120, https://doi.org/10.1073/pnas.2214525120, 2023a. a
Faranda, D., Pascale, S., and Bulut, B.: Persistent anticyclonic conditions and climate change exacerbated the exceptional 2022 European-Mediterranean drought, Environ. Res. Lett., 18, 034030, https://doi.org/10.1088/1748-9326/acbc37, 2023b. a
Franke, J., Valler, V., Brugnara, Y., and Brönnimann, S.: Ensemble Kalman Fitting Paleo-Reanalysis Version 2 (EKF400_v2), https://doi.org/10.26050/WDCC/EKF400_v2.0, World Data Center for Climate (WDCC) at DKRZ [data set], 2020. a
García-Burgos, M., Ayarzagüena, B., Barriopedro, D., and García-Herrera, R.: Jet configurations leading to extreme winter temperatures over Europe, J. Geophys. Res.-Atmos., 128, e2023JD039304, https://doi.org/10.1029/2023JD039304, 2023. a
Hatvani, I. G., Topál, D., Ruggieri, E., and Kern, Z.: Concurrent changepoints in Greenland ice core δ18O records and the North Atlantic Oscillation over the past millennium, Atmosphere-Basel, 13, 93, https://doi.org/10.3390/atmos13010093, 2022. a
Holme, C., Gkinis, V., Lanzky, M., Morris, V., Olesen, M., Thayer, A., Vaughn, B. H., and Vinther, B. M.: Varying regional δ18O–temperature relationship in high-resolution stable water isotopes from east Greenland, Clim. Past, 15, 893–912, https://doi.org/10.5194/cp-15-893-2019, 2019. a, b
Hörhold, M., Münch, T., Weißbach, S., Kipfstuhl, S., Freitag, J., Sasgen, I., Lohmann, G., Vinther, B., and Laepple, T.: Modern temperatures in central–north Greenland warmest in past millennium, Nature, 613, 503–507, https://doi.org/10.1038/s41586-022-05517-z, 2023. a, b, c, d, e, f, g, h
Ionita, M. and Nagavciuc, V.: 2024: the year with too much summer in the eastern part of Europe, Weather, 80, 288–295, https://doi.org/10.1002/wea.7696, 2025. a
IPCC: Climate Change 2021: The Physical Science Basis. Contribution of Working Group I to the Sixth Assessment Report of the Intergovernmental Panel on Climate Change, Cambridge University Press, Cambridge, UK and New York, NY, USA, https://doi.org/10.1017/9781009157896, 2023. a
Jekel, C. F. and Venter, G.: pwlf: A Python Library for Fitting 1D Continuous Piecewise Linear Functions, https://github.com/cjekel/piecewise_linear_fit_py (last access: September 2025), 2019. a
Kadow, C., Hall, D. M., and Ulbrich, U.: Artificial intelligence reconstructs missing climate information, Nat. Geosci., 13, 408–413, https://doi.org/10.1038/s41561-020-0582-5, 2020. a
Karamperidou, C.: Extracting paleoweather from paleoclimate through a deep learning reconstruction of Last Millennium atmospheric blocking, Communications Earth and Environment, 5, 535, https://doi.org/10.1038/s43247-024-01687-y, 2024. a
Kautz, L.-A., Martius, O., Pfahl, S., Pinto, J. G., Ramos, A. M., Sousa, P. M., and Woollings, T.: Atmospheric blocking and weather extremes over the Euro-Atlantic sector – a review, Weather Clim. Dynam., 3, 305–336, https://doi.org/10.5194/wcd-3-305-2022, 2022. a, b
Kornhuber, K. and Messori, G.: Recent increase in a recurrent pan-Atlantic wave pattern driving concurrent wintertime extremes, B. Am. Meteorol. Soc., 104, E1694–E1708, https://doi.org/10.1175/BAMS-D-21-0295.1, 2023. a
Lockwood, M., Harrison, R. G., Woollings, T., and Solanki, S. K.: Are cold winters in Europe associated with low solar activity?, Environ. Res. Lett., 5, 024001, https://doi.org/10.1088/1748-9326/5/2/024001, 2010. a
Ma, Q., Chen, Y., and Ionita, M.: European summer wet-bulb temperature: spatiotemporal variations and potential drivers, J. Climate, 37, 2059–2080, https://doi.org/10.1175/JCLI-D-23-0420.1, 2024. a
Meeker, L. D., Mayewski, P. A., Twickler, M. S., Whitlow, S. I., and Meese, D.: A 110,000-year history of change in continental biogenic emissions and related atmospheric circulation inferred from the Greenland Ice Sheet Project Ice Core, J. Geophys. Res.-Oceans, 102, 26489–26504, https://doi.org/10.1029/97JC01492, 1997. a
Ortega, P., Swingedouw, D., Masson-Delmotte, V., Risi, C., Vinther, B., Yiou, P., Vautard, R., and Yoshimura, K.: Characterizing atmospheric circulation signals in Greenland ice cores: insights from a weather regime approach, Clim. Dynam., 43, 2585–2605, https://doi.org/10.1007/s00382-014-2074-z, 2014. a, b
Paik, S., Min, S.-K., Son, S.-W., Lim, E.-P., McGregor, S., An, S.-I., Kug, J.-S., and Yeh, S.-W.: Impact of volcanic eruptions on extratropical atmospheric circulations: review, revisit and future directions, Environ. Res. Lett., 18, 063003, https://doi.org/10.1088/1748-9326/acd5e6, 2023. a
Peixoto, J. P. and Oort, A. H.: Physics of Climate, American Institute of Physics, New York, NY, USA, ISBN 978-0883187128, 1992. a
Pfahl, S.: Characterising the relationship between weather extremes in Europe and synoptic circulation features, Nat. Hazards Earth Syst. Sci., 14, 1461–1475, https://doi.org/10.5194/nhess-14-1461-2014, 2014. a
Plésiat, É., Dunn, R. J. H., Donat, M. G., and Kadow, C.: Artificial intelligence reveals past climate extremes by reconstructing historical records, Nat. Commun., 15, 9191, https://doi.org/10.1038/s41467-024-53464-2, 2024. a, b
Polvani, L. M., Banerjee, A., and Schmidt, A.: Northern Hemisphere continental winter warming following the 1991 Mt. Pinatubo eruption: reconciling models and observations, Atmos. Chem. Phys., 19, 6351–6366, https://doi.org/10.5194/acp-19-6351-2019, 2019. a
Rex, D. F.: Blocking action in the middle troposphere and its effect upon regional climate, Tellus, 2, 196–211, https://doi.org/10.3402/tellusa.v2i3.8546, 1950. a
Rimbu, N. and Lohmann, G.: Decadal variability in a central Greenland high-resolution deuterium isotope record and its relationship to the frequency of daily atmospheric circulation patterns from the North Atlantic region, J. Climate, 23, 4608–4618, https://doi.org/10.1175/2010JCLI3556.1, 2010. a, b
Rimbu, N., Lohmann, G., and Grosfeld, K.: Northern Hemisphere atmospheric blocking in ice core accumulation records from northern Greenland, Geophys. Res. Lett., 34, https://doi.org/10.1029/2006GL029175, 2007. a
Rimbu, N., Lohmann, G., Werner, M., and Ionita, M.: Links between central Greenland stable isotopes, blocking and extreme climate variability over Europe at decadal to multidecadal time scales, Clim. Dynam., 49, 649–663, https://doi.org/10.1007/s00382-016-3365-3, 2017. a, b
Rimbu, N., Ionita, M., and Lohmann, G.: A synoptic scale perspective on Greenland ice core δ18O variability and related teleconnection patterns, Atmosphere-Basel, 12, https://doi.org/10.3390/atmos12030294, 2021. a, b
Robock, A. and Mao, J.: Winter warming from large volcanic eruptions, Geophys. Res. Lett., 19, 2405–2408, https://doi.org/10.1029/92GL02627, 1992. a
Roeckner, E., Bäuml, G., Bonaventura, L., Brokopf, R., Esch, M., Giorgetta, M., Hagemann, S., Kirchner, I., Kornblueh, L., Manzini, E., Rhodin, A., Schlese, U., Schulzweida, U., and Tompkins, A.: The Atmospheric General Circulation Model ECHAM 5. PART I: Model Description, Max-Planck-Institut für Meteorologie, ISSN 0937-1060, 2003. a
Scaife, A. A., Folland, C. K., Alexander, L. V., Moberg, A., and Knight, J. R.: European climate extremes and the North Atlantic oscillation, J. Climate, 21, 72–83, https://doi.org/10.1175/2007JCLI1631.1, 2008. a
Schalamon, F. R., Scher, S., Trügler, A., Hartl, L., Schöner, W., and Abermann, J.: The role of large-scale atmospheric patterns for recent warming periods in Greenland from 1900–2015, Weather Clim. Dynam., 6, 1075–1088, https://doi.org/10.5194/wcd-6-1075-2025, 2025. a, b
Schaller, N., Griesser, T., Fischer, A., Stickler, A., and Onnimann, S.: Climate effects of the 1883 Krakatoa eruption: historical and present perspectives, Vierteljahrsschrift der Naturforschenden Gesellschaft in Zürich, 154, 31–40, 2009. a
Schwierz, C., Croci-Maspoli, M., and Davies, H. C.: Perspicacious indicators of atmospheric blocking, Geophys. Res. Lett., 31, https://doi.org/10.1029/2003GL019341, 2004. a, b, c
Slivinski, L. C., Compo, G. P., Whitaker, J. S., Sardeshmukh, P. D., Giese, B. S., McColl, C., Allan, R., Yin, X., Vose, R., Titchner, H., Kennedy, J., Spencer, L. J., Ashcroft, L., Brönnimann, S., Brunet, M., Camuffo, D., Cornes, R., Cram, T. A., Crouthamel, R., Domínguez-Castro, F., Freeman, J. E., Gergis, J., Hawkins, E., Jones, P. D., Jourdain, S., Kaplan, A., Kubota, H., Blancq, F. L., Lee, T.-C., Lorrey, A., Luterbacher, J., Maugeri, M., Mock, C. J., Moore, G. K., Przybylak, R., Pudmenzky, C., Reason, C., Slonosky, V. C., Smith, C. A., Tinz, B., Trewin, B., Valente, M. A., Wang, X. L., Wilkinson, C., Wood, K., and Wyszyński, P.: Towards a more reliable historical reanalysis: improvements for version 3 of the Twentieth Century Reanalysis system, Q. J. Roy. Meteor. Soc., 145, 2876–2908, https://doi.org/10.1002/qj.3598, 2019. a, b
Tejedor, E., Polvani, L. M., Steiger, N. J., Vuille, M., and Smerdon, J. E.: No evidence of winter warming in Eurasia following large, low-latitude volcanic eruptions during the last millennium, J. Climate, 37, 5653–5673, https://doi.org/10.1175/JCLI-D-23-0625.1, 2024. a
Tibaldi, S. and Molteni, F.: On the operational predictability of blocking, Tellus A, 42, 343–365, https://doi.org/10.1034/j.1600-0870.1990.t01-2-00003.x, 1990. a, b, c
Trevisiol, A., Gilli, L., and Faggian, P.: Short and long-term projections of Rossby wave packets and blocking events with particular attention to the Northern Hemisphere, Global Planet. Change, 209, 103750, https://doi.org/10.1016/j.gloplacha.2022.103750, 2022. a
Valler, V., Franke, J., Brugnara, Y., and Brönnimann, S.: An updated global atmospheric paleo-reanalysis covering the last 400 years, Geosci. Data J., 9, 89–107, https://doi.org/10.1002/gdj3.121, 2022. a, b, c
Vautard, R., Cattiaux, J., Happé, T., Singh, J., Bonnet, R., Cassou, C., Coumou, D., D'Andrea, F., Faranda, D., Fischer, E., Ribes, A., Sippel, S., and Yiou, P.: Heat extremes in Western Europe increasing faster than simulated due to atmospheric circulation trends, Nat. Commun., 14, 6803, https://doi.org/10.1038/s41467-023-42143-3, 2023. a
Vinther, B. M., Johnsen, S. J., Andersen, K. K., Clausen, H. B., and Hansen, A. W.: NAO signal recorded in the stable isotopes of Greenland ice cores, Geophys. Res. Lett., 30, https://doi.org/10.1029/2002GL016193, 2003. a, b
Vinther, B., Jones, P., Briffa, K., Clausen, H., Andersen, K., Dahl-Jensen, D., and Johnsen, S.: Climatic signals in multiple highly resolved stable isotope records from Greenland, Quaternary Sci. Rev., 29, 522–538, https://doi.org/10.1016/j.quascirev.2009.11.002, 2010. a
Wallace, J. M. and Gutzler, D. S.: Teleconnections in the geopotential height field during the Northern Hemisphere winter, Mon. Weather Rev., 109, 784–812, https://doi.org/10.1175/1520-0493(1981)109<0784:TITGHF>2.0.CO;2, 1981. a
Weißbach, S., Wegner, A., Opel, T., Oerter, H., Vinther, B. M., and Kipfstuhl, S.: Spatial and temporal oxygen isotope variability in northern Greenland – implications for a new climate record over the past millennium, Clim. Past, 12, 171–188, https://doi.org/10.5194/cp-12-171-2016, 2016. a
Wilks, D. S.: “The stippling shows statistically significant grid points”: how research results are routinely overstated and overinterpreted, and what to do about it, B. Am. Meteorol. Soc., 97, 2263–2273, https://doi.org/10.1175/BAMS-D-15-00267.1, 2016. a
Woods, O. T. and Baldini, J. U. L.: The impact of hemispherically asymmetrical volcanic aerosol injections on the North Atlantic Oscillation, Sci. Rep.-UK, 15, 31329, https://doi.org/10.1038/s41598-025-16232-w, 2025. a
Woollings, T., Lockwood, M., Masato, G., Bell, C., and Gray, L.: Enhanced signature of solar variability in Eurasian winter climate, Geophys. Res. Lett., 37, https://doi.org/10.1029/2010GL044601, 2010. a, b
Xu, G., Broadman, E., Dorado-Liñán, I., Klippel, L., Meko, M., Büntgen, U., De Mil, T., Esper, J., Gunnarson, B., Hartl, C., Krusic, P. J., Linderholm, H. W., Ljungqvist, F. C., Ludlow, F., Panayotov, M., Seim, A., Wilson, R., Zamora-Reyes, D., and Trouet, V.: Jet stream controls on European climate and agriculture since 1300 CE, Nature, 634, 600–608, https://doi.org/10.1038/s41586-024-07985-x, 2024. a
Yan, H., Liu, C., An, Z., Yang, W., Yang, Y., Huang, P., Qiu, S., Zhou, P., Zhao, N., Fei, H., Ma, X., Shi, G., Dodson, J., Hao, J., Yu, K., Wei, G., Yang, Y., Jin, Z., and Zhou, W.: Extreme weather events recorded by daily to hourly resolution biogeochemical proxies of marine giant clam shells, P. Natl. Acad. Sci. USA, 117, 7038–7043, https://doi.org/10.1073/pnas.1916784117, 2020. a
Yao, Y. and Luo, D.: An asymmetric spatiotemporal connection between the Euro-Atlantic blocking within the NAO life cycle and European climates, Adv. Atmos. Sci., 35, 796–812, https://doi.org/10.1007/s00376-017-7128-9, 2018. a, b
Yiou, P. and Nogaj, M.: Extreme climatic events and weather regimes over the North Atlantic: when and where?, Geophys. Res. Lett., 31, https://doi.org/10.1029/2003GL019119, 2004. a
Yiou, P., García de Cortázar-Atauri, I., Chuine, I., Daux, V., Garnier, E., Viovy, N., van Leeuwen, C., Parker, A. K., and Boursiquot, J.-M.: Continental atmospheric circulation over Europe during the Little Ice Age inferred from grape harvest dates, Clim. Past, 8, 577–588, https://doi.org/10.5194/cp-8-577-2012, 2012. a