
the Creative Commons Attribution 4.0 License.
the Creative Commons Attribution 4.0 License.
 | 19 Aug 2026
Increased abyssal ocean density stratification across the Middle Pleistocene Transition
Nicola C. Thomas
Heather L. Ford
Mervyn Greaves
David A. Hodell
The cause of the fundamental reorganisation of the climate system during the Middle Pleistocene Transition (MPT; ∼ 1.25–0.65 million years ago (Ma)), when glacial cycles intensified and lengthened from 41 thousand year (kyr) to quasi-100 kyr periodicity, remains one of the enduring unsolved questions in palaeoclimate science. Increasing attention has focused on the role of the marine carbon cycle, with enhanced carbon storage in the deep sea linked to changes in deep-water temperature and salinity that increase abyssal ocean density stratification. Here we report new high-resolution reconstructions of deep-water temperature and the isotopic composition of seawater (δ18Oseawater), a proxy for ice volume and salinity, from North Atlantic Site U1385, using paired benthic foraminiferal and oxygen isotope (δ18O) analyses. Together with published records, we present basin-scale and globally distributed compilations of deep-water temperature and δ18Oseawater to assess changes in abyssal ocean stratification for the past 1.5 million years (Myr). Across the MPT, interbasinal gradients suggest North Atlantic deep-water became colder while Pacific deep-water became more saline during glacial periods after ∼ 930 thousand years ago (ka). Deep-ocean δ18Oseawater increased in both the Atlantic and Pacific across the MPT indicating increased continental ice volume. But, the increase was greater in the Pacific than the Atlantic, which we suggest reflects increased salinity of Southern Component Water (SCW). We propose the following sequence of changes during the MPT as a working hypothesis: (1) freshwater input to the marginal seas around Antarctica was reduced beginning at 930 ka by decreased melting of the Antarctic Ice Sheet and/or marine ice shelves and increased sea ice formation in the Southern Ocean; (2) the salinity and density of SCW increased, resulting in enhanced abyssal ocean density stratification and rendering the deep ocean a more effective carbon trap; (3) together with increased export production of organic matter and reduced deep-to-surface water exchange in the Southern Ocean, carbon storage in the deep ocean increased, lowering glacial atmospheric pCO2; (4) lower pCO2 permitted the growth of larger continental ice sheets, which reached a critical size and lengthened the glacial cycles. Our hypothesis supports an important role for abyssal ocean density stratification in the MPT, and requires further testing with additional benthic -δ18O records, numerical model simulations, and forthcoming atmospheric pCO2 and mean ocean temperature results from the Beyond EPICA–Oldest Ice core from Antarctica.
- Article
(20521 KB) - Full-text XML
-
Supplement
(16768 KB) - BibTeX
- EndNote


The Middle Pleistocene Transition (MPT), which occurred between ∼ 1.25 and 0.65 million years ago (Ma), marks a major reorganisation of the global climate system and remains a central topic of palaeoclimate research since its first recognition over 50 years ago (Shackleton and Opdyke, 1976). Benthic foraminiferal oxygen isotope (δ18O) records are marked by a shift from dominant 41 thousand years (kyr) to quasi-100 kyr glacial-interglacial cycles across the MPT. There was no commensurate change in orbital forcing (Clark et al., 2006; Pisias and Moore, 1981), suggesting processes internal to the climate system were responsible. The exact cause(s) of the MPT remain(s) an open question (see reviews by Berends et al., 2021a; Clark et al., 2006; Herbert, 2023; and McClymont et al., 2013). Uncertainties include whether the transition was gradual or abrupt (Sosdian and Rosenthal, 2009; Elderfield et al., 2012; Ford et al., 2016; Legrain et al., 2023) and whether it was driven primarily by Northern or Southern Hemisphere processes (An et al., 2024; Basak et al., 2026; Chalk et al., 2017; Farmer et al., 2019; Hines et al., 2024; Pérez-Montero et al., 2026; Starr et al., 2021; Williams et al., 2024; Wirths et al., 2025; Yehudai et al., 2021). Most hypotheses invoke a long-term global cooling, commonly attributed to a reduction in atmospheric carbon dioxide (pCO2) (Berends et al., 2021a; Clark et al., 2006; Willeit et al., 2019). Yet, despite extensive work, the relative roles and interactions of ice-sheet dynamics and carbon-cycle feedbacks, and their timing, remain poorly constrained.
Proposed explanations for the MPT can be broadly grouped into three categories: (i) internal ice-sheet dynamics, most notably the regolith hypothesis invoking progressive changes in basal conditions leading to the exposure of high-friction crystalline bedrock (Clark et al., 2006; Clark and Pollard, 1998); (ii) changes in ice-sheet geometry and extent, particularly involving North American and/or Antarctic ice sheets (An et al., 2024; Bintanja and Van De Wal, 2008; Elderfield et al., 2012; Raymo et al., 2006; Wirths et al., 2025); and (iii) feedbacks associated with long-term changes in the global carbon cycle, including deep-sea carbon storage and atmospheric pCO2 variability (Berger et al., 1999; Chalk et al., 2017; Farmer et al., 2019; Lear et al., 2016; Qin et al., 2022; Shackleton, 2000; Thomas et al., 2022; Willeit et al., 2019). Increasing attention has been paid to the potential role of marine carbon cycle processes (Herbert, 2023), which are closely linked to changes in deep ocean circulation during the MPT (Hall et al., 2001; Hasenfratz et al., 2019; Kim et al., 2021; Li et al., 2026; Martínez-Garcia et al., 2010; Pena and Goldstein, 2014; Qin et al., 2022; Raymo et al., 1997). A “thermohaline circulation crisis” (Pena and Goldstein, 2014) (THC) was proposed for the deep Atlantic across the MPT, but the magnitude and extent of such an event have been questioned recently (Basak et al., 2026; Hines et al., 2024; Williams et al., 2024). Furthermore, recent findings from Allan Hills blue ice area of Antarctica show no significant decline in mean atmospheric pCO2 over the MPT (Marks-Peterson et al., 2026), which does not necessarily preclude changes in the glacial values of atmospheric pCO2 because the mean values are likely weighted towards interglacial periods. More recently, modelling simulations suggest that declining atmospheric pCO2 and sea-level change may have driven a threshold response of the Antarctic Ice Sheet, resulting in expanded ice shelves and increasingly strong coupling between Antarctic ice-sheet variability, Northern Hemisphere ice volume, and other climate components following the MPT (Yun and Timmermann, 2026). Forthcoming atmospheric pCO2 measurements from the Beyond-EPICA ice core are highly anticipated and will likely resolve the timing and magnitude of atmospheric pCO2 changes across the MPT.
Whilst numerous studies implicate enhanced carbon storage in the deep sea and lowered glacial atmospheric pCO2 across the MPT (Billups et al., 2018; Chalk et al., 2017; Farmer et al., 2019; Gildor and Tziperman, 2001; Hodell et al., 2003; Jaccard et al., 2013; Lear et al., 2016; Sigman et al., 2010; Starr et al., 2021; Thomas et al., 2022), no direct comparisons of the temperature and salinity controls on the density of deep water masses have been made between the North Atlantic and Pacific Ocean basins across the transition. This limits assessment of large-scale changes in abyssal density structure, and their potential role in carbon storage and atmospheric pCO2 change (Adkins, 2013; Broecker and Peng, 1998, 1982). Here, we combine new and previously published records of -derived deep-water temperature and oxygen isotopic composition of seawater (δ18Oseawater), a proxy for both ice volume and salinity, to evaluate how abyssal ocean density structure changed across the MPT.
Benthic δ18O records are invaluable tools for reconstructing glacial-interglacial variability of the Quaternary (Shackleton, 1967; Shackleton and Opdyke, 1973). However, interpretation of benthic δ18O records is complicated because the signal is dependent on both temperature and the δ18Oseawater, the latter varying with global ice volume and regional hydrography including salinity changes at sites of deep-water formation (Waelbroeck et al., 2002). Deconvolution of benthic δ18O into its temperature and δ18Oseawater components has been accomplished by paired measurement of and δ18O of calcite (Elderfield et al., 2010, 2012; Ford et al., 2016; Ford and Raymo, 2020; Hasenfratz et al., 2017, 2019; Sosdian and Rosenthal, 2009), with estimates of propagated uncertainty (Thirumalai et al., 2016). Other indirect approaches include inverse modelling that combines benthic δ18O data with ice sheet models of varying complexity (Berends et al., 2021b; Bintanja and Van De Wal, 2008) and an iterative process-based approach that assesses changes in relationships between the oxygen isotopic composition of ice (δ18Oice), sea level, temperature, and δ18Oseawater (Rohling et al., 2021). More recently, changes in global mean sea surface temperatures (ΔGMSST) combined with proxy-based deep ocean temperature estimates, have been used to infer changes in mean ocean temperature (ΔMOT), enabling separation of temperature and ice volume components from a global benthic δ18O stack (Clark et al., 2024, 2025a). These different approaches can yield widely divergent interpretations of Quaternary temperature and ice volume evolution. For example, during Marine Isotope Stage (MIS) 22 (∼ 900 ka), Rohling et al. (2021) infer a substantial increase in ice volume with limited deep-water cooling, consistent with earlier -based reconstructions (Elderfield et al., 2012; Ford and Raymo, 2020) (Fig. S1 in the Supplement). In contrast, the reconstruction of Clark et al. (2025a) shows pronounced deep-water cooling with relatively little change in ice volume across the MPT.
Here we present a new 1.5-million-year-long record of North Atlantic deep-water temperature, using measured in calcite of two infaunal benthic foraminifera (Uvigerina peregrina and Globobulimina affinis) from sediment cores recovered at International Ocean Discovery Program (IODP) Site U1385 (37°34.3′ N, 10°7.6′ W, 2578 metres below sea level [m b.s.l.]) from the Iberian Margin (Hodell et al., 2015, 2023a) (Figs. 1, S2 and S3; Table 1). The -derived temperature is paired with benthic δ18O to isolate the δ18Oseawater signal (Sect. 2.3; Figs. 2 and S4). Our record provides an important complement to existing North Atlantic data from Deep Sea Drilling Project (DSDP) Site 607 (Sosdian and Rosenthal, 2009), where -derived temperature estimates were based partly on Cibicidoides wuellerstorfi. These results were called into question because this epibenthic taxon can be affected by changes in carbonate ion concentrations of bottom waters (Yu and Broecker, 2010) (Sect. 3.1; Supplement). This criticism was subsequently refuted (Sosdian and Rosenthal, 2010) prompting additional measurements of infaunal benthic taxa (Uvigerina spp.) at Site 607 (Ford et al., 2016).
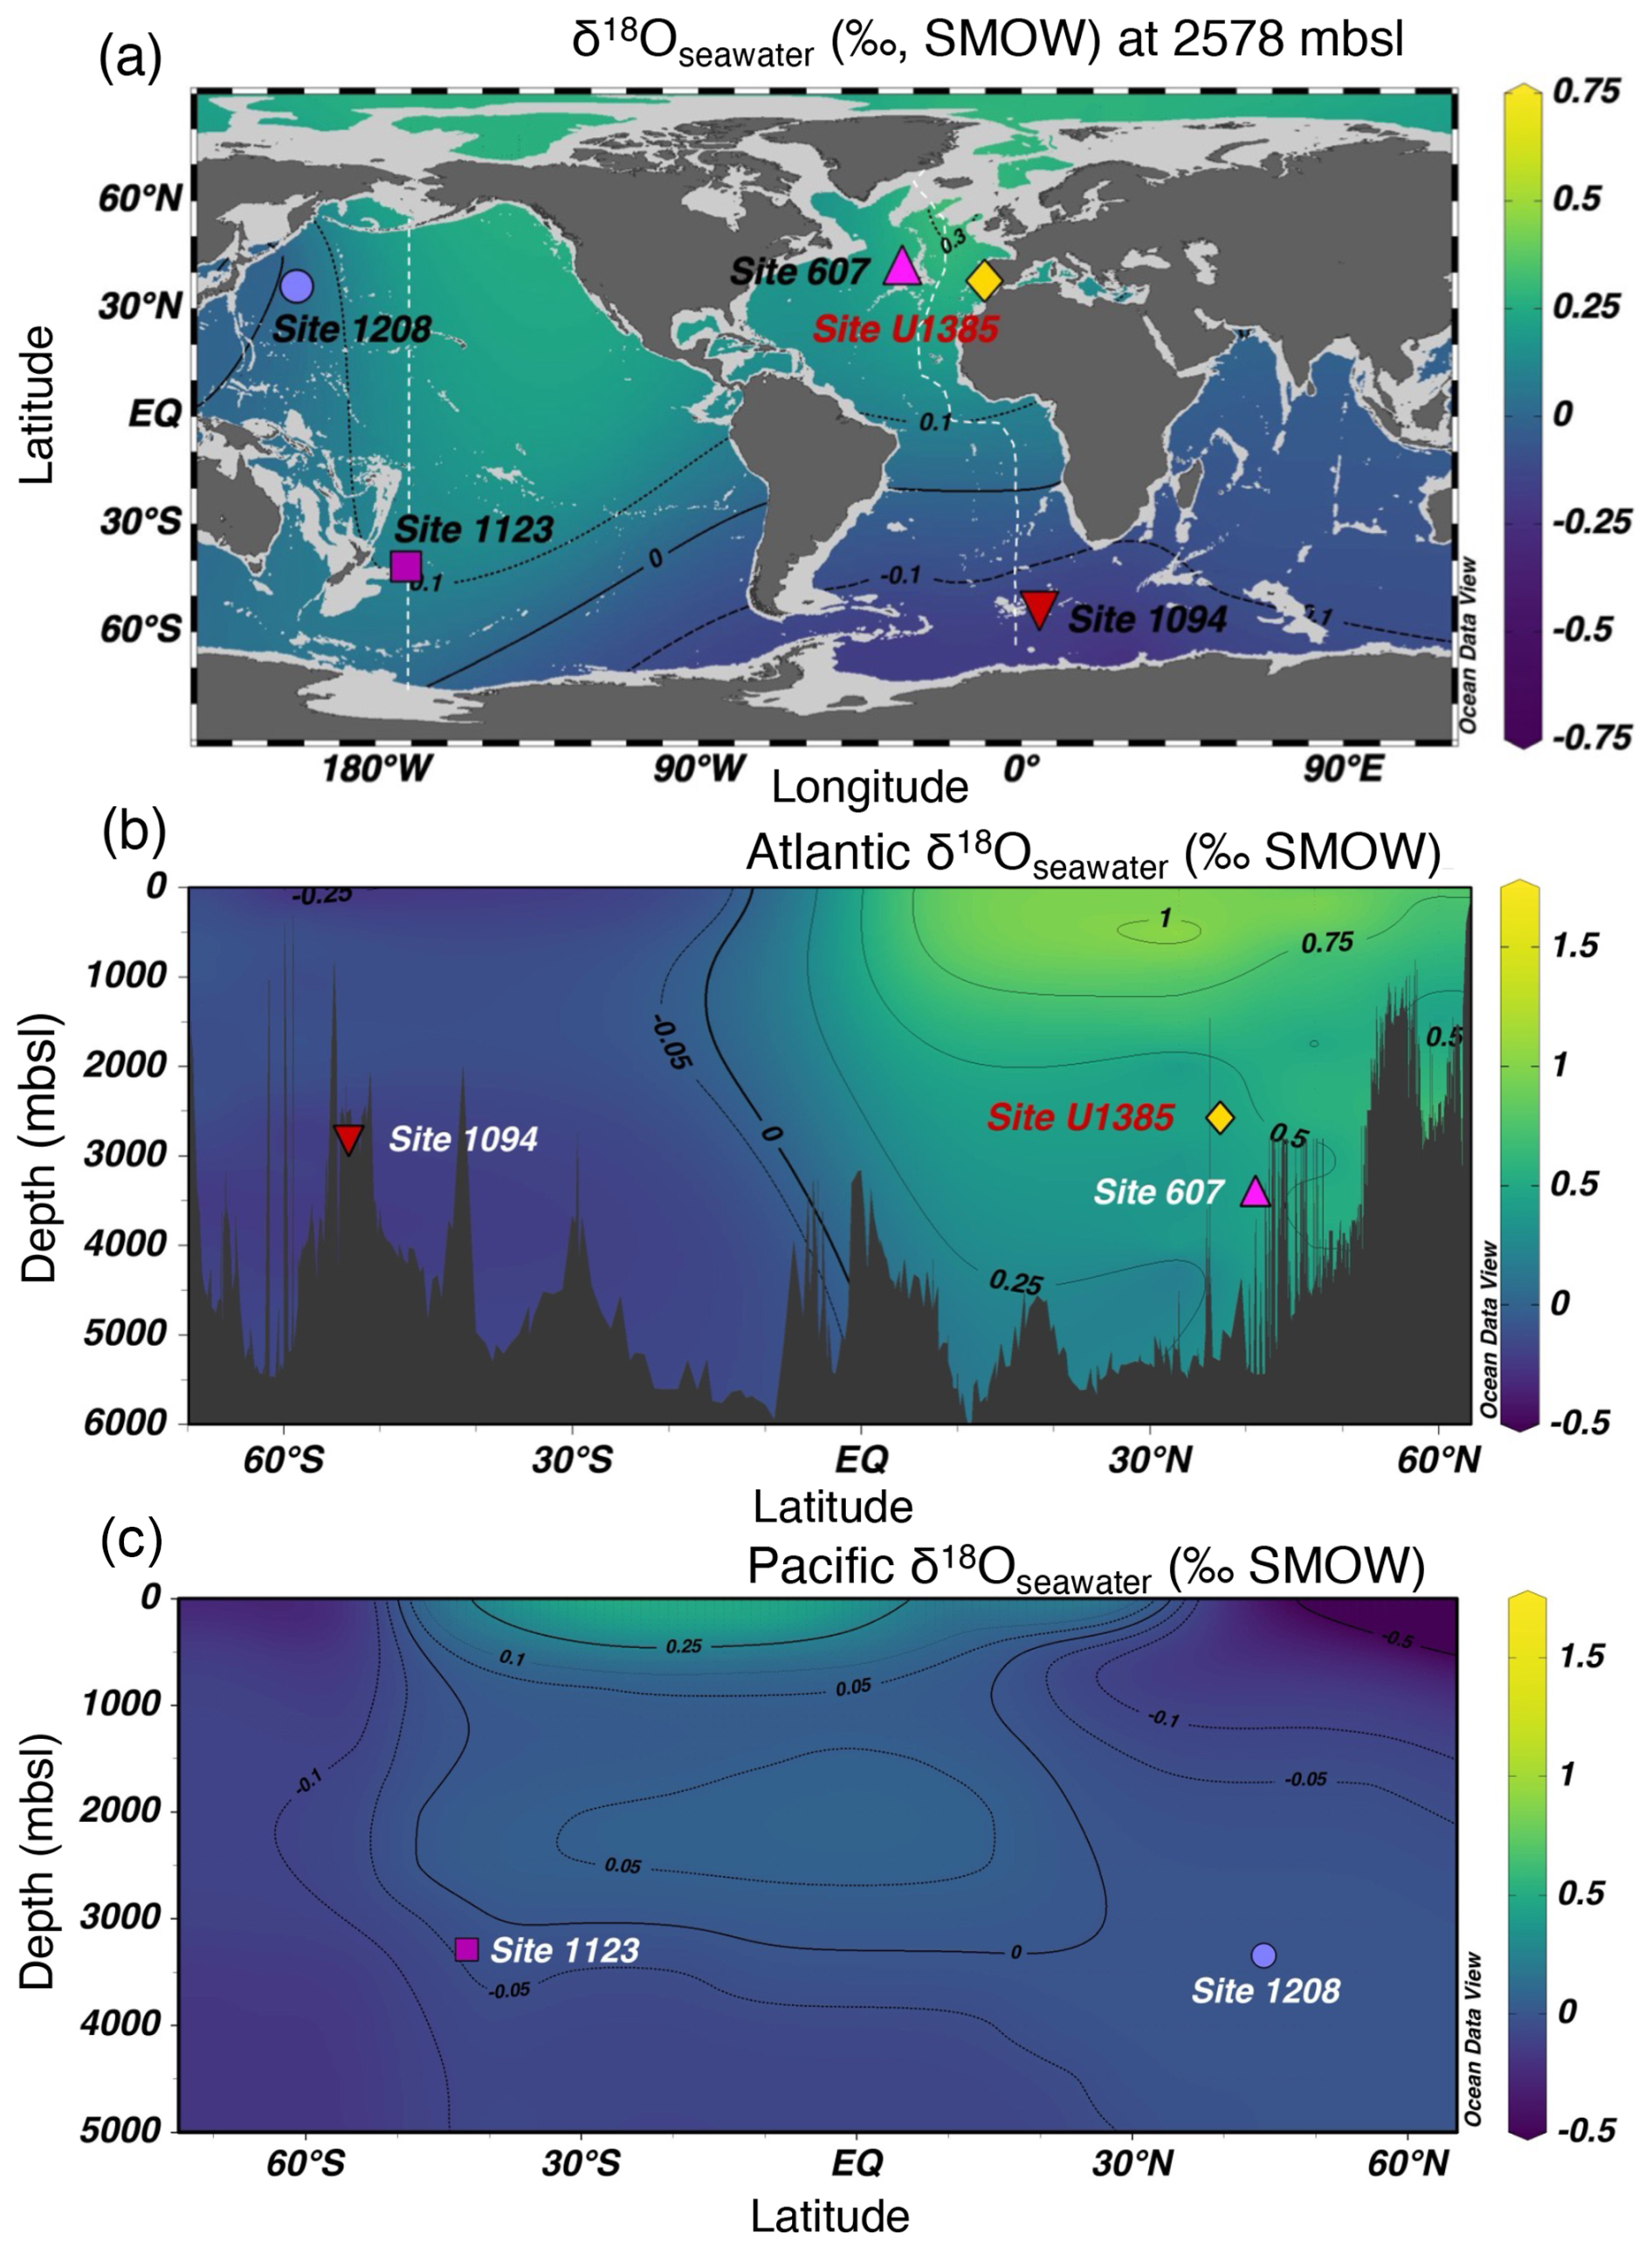
Figure 1Meridional profiles of deep-water δ18Oseawater showing the site locations. (a) δ18Oseawater at 2578 m b.s.l., corresponding to the depth of IODP Site U1385 (this study; yellow diamond) in the Northeast Atlantic, along with the geographic location of other sites referenced in the text: North Atlantic DSDP Site 607 (Ford et al., 2016; Sosdian and Rosenthal, 2009) (pink triangle); Southwestern Pacific ODP Site 1123 (Elderfield et al., 2012) (purple square); North Pacific ODP Site 1208 (Ford and Raymo, 2020) (lilac circle); and the Southern Ocean ODP Site 1094 (Hasenfratz et al., 2019) (red inverted triangle) located in the Atlantic sector of the Antarctic Zone. Meridional transects shown in panels (b) and (c) are indicated by white dashed lines. (b, c) Atlantic and Pacific meridional profiles of deep-water δ18Oseawater (‰, SMOW) showing site locations. Maps were created using GLODAPv2.2021 and GLODAPv2.2023 and GEOSECS in Ocean Data View (Schlitzer, 2019; http://odv.awi.de/, last access: 7 July 2026). Data for panel (c) are from (LeGrande and Schmidt, 2006).
Table 1Site location details and modern-day deep-water properties.
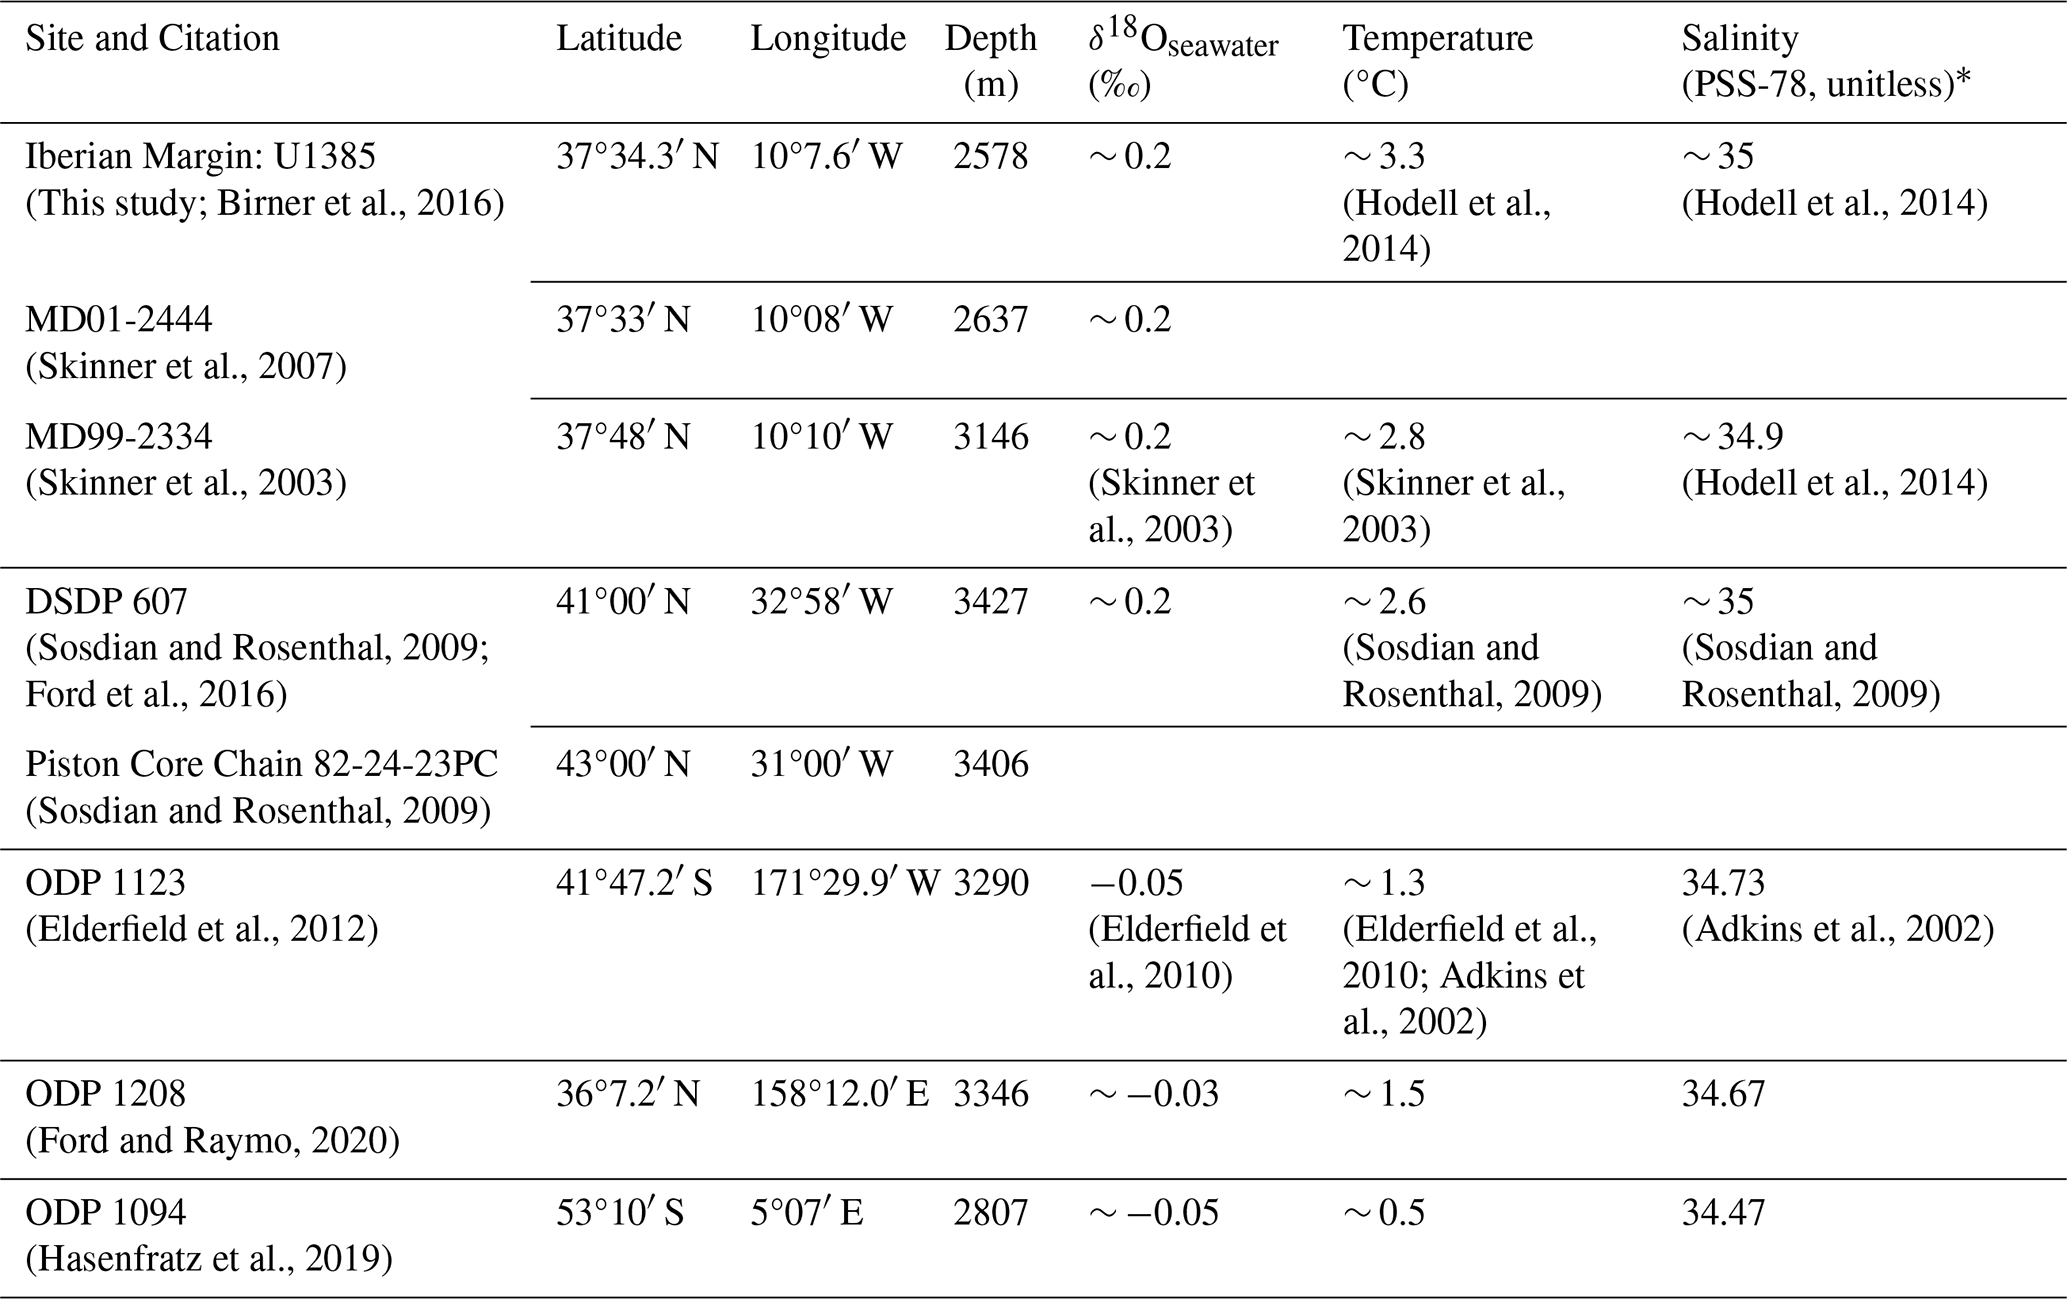
* Note: All salinity values reported follow the Practical Salinity Scale (PSS-78) and are unitless.
Unless otherwise stated, temperature and salinity values are from GLODAPv2.2021 and GLODAPv2.2023 and GEOSECS accessed via Ocean Data View (Schlitzer, 2019; http://odv.awi.de/, last access: 7 July 2026), while δ18Oseawater data for Sites 1123 and 1208 are from LeGrande and Schmidt (2006). Coordinates and water depths are taken from the original site publications cited in the first column.
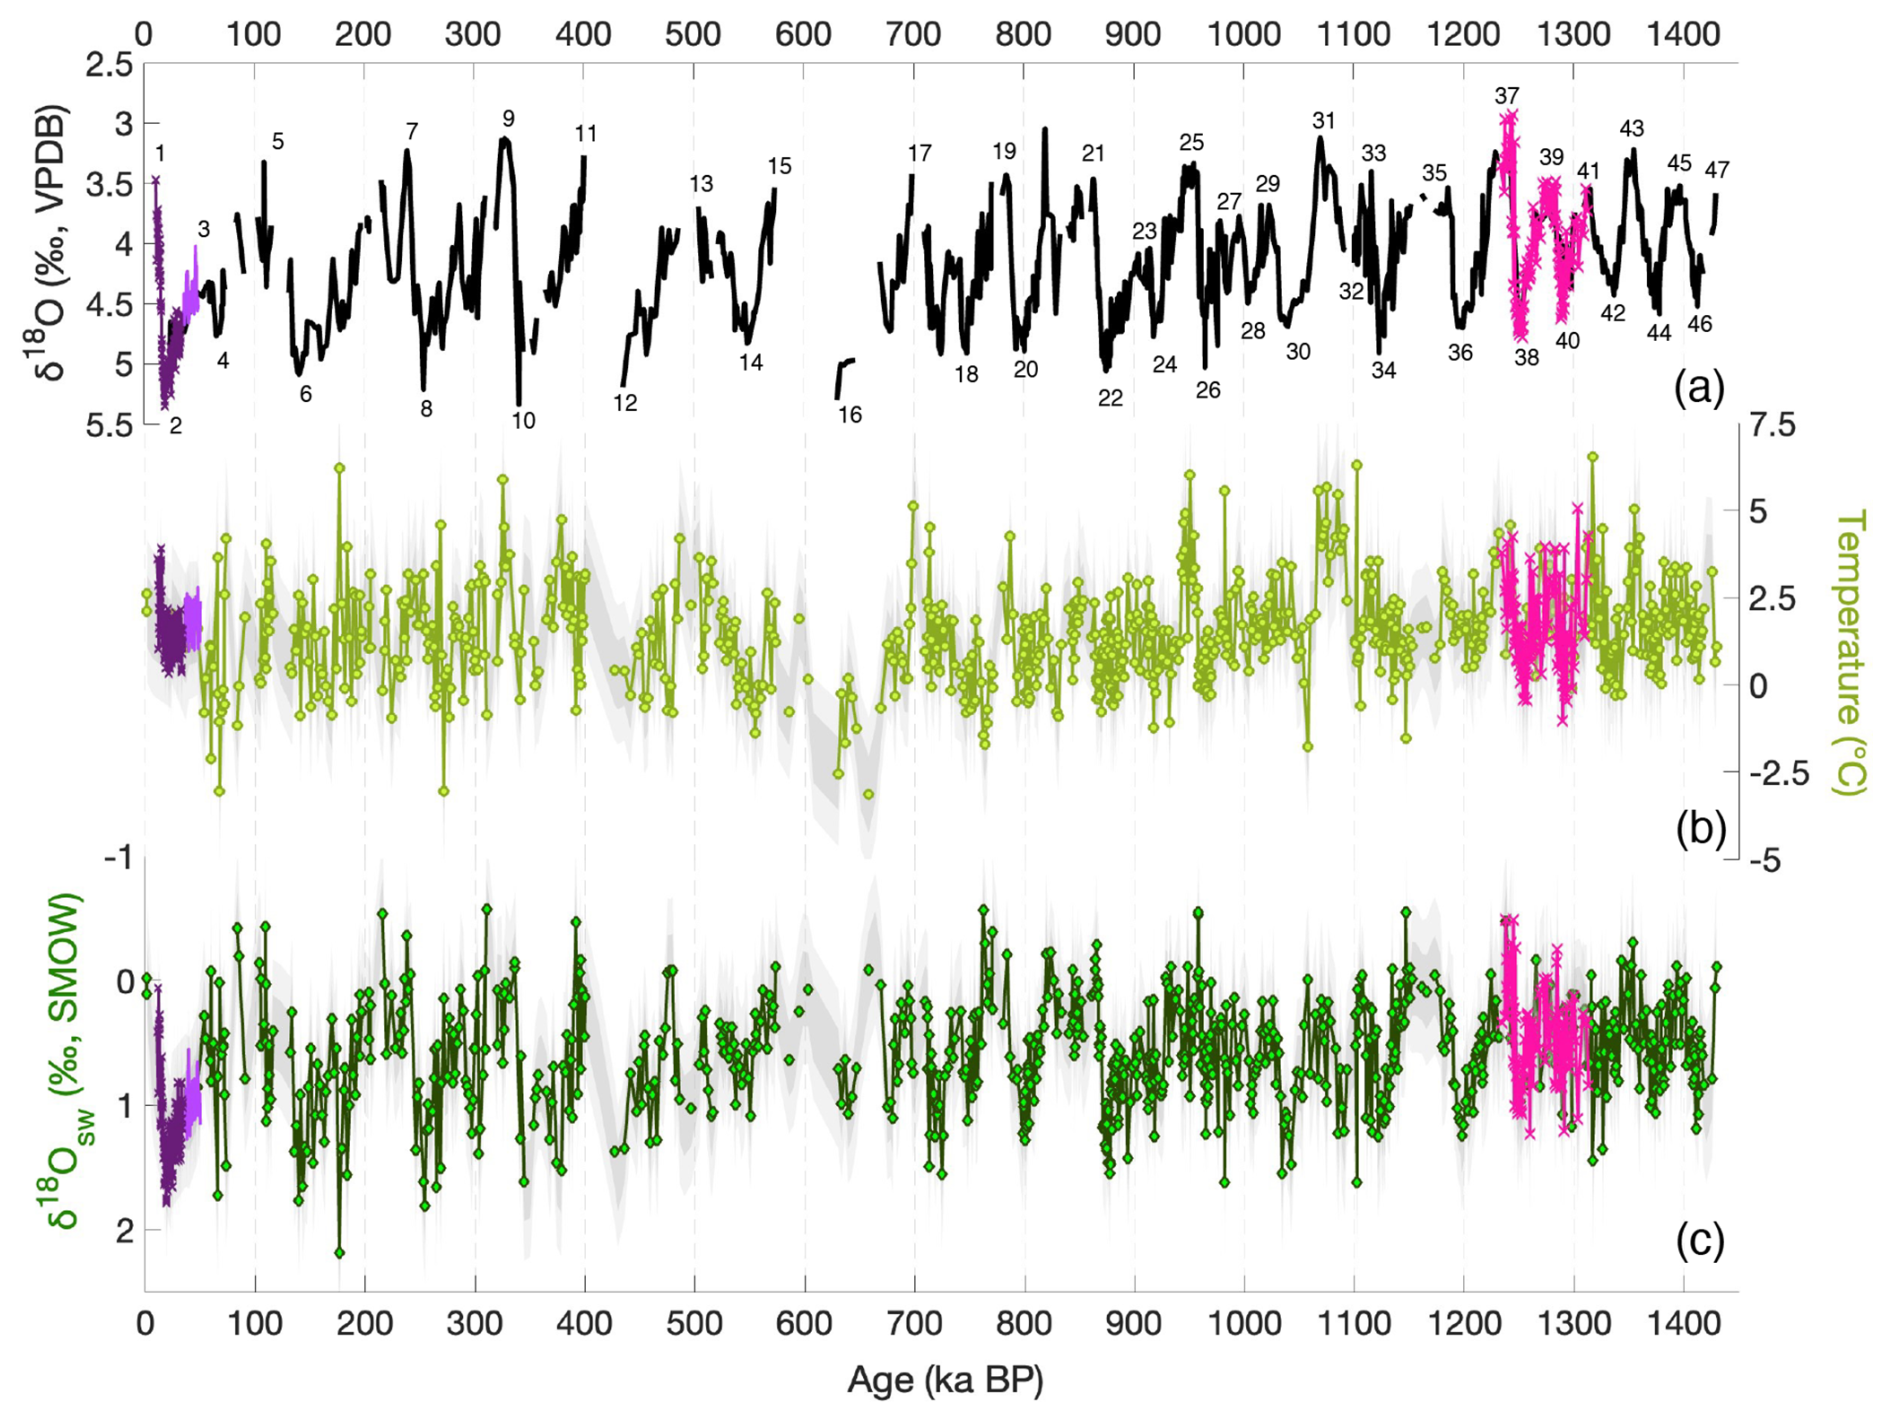
Figure 2Iberian Margin deep-water -derived temperature and δ18Oseawater estimated using PSU Solver. (a) Composite benthic δ18O record, primarily Uvigerina peregrina, with Cibicidoides wuellerstorfi and Globobulimina affinis values adjusted to Uvigerina peregrina by +0.64 ‰ and −0.30 ‰ respectively (black line). Numbers denote Marine Isotope Stage (MIS) interglacials (odd, above) and glacials (even, below). (b) -derived deep-water temperature (light green line and markers) with 1σ and 2σ uncertainty envelopes (dark and light grey, respectively) incorporating both analytical and calibration uncertainties. (c) Deconvolved δ18Oseawater (dark green line and markers; note the inverted axis) with uncertainties as in (b). All panels show Site U1385 (this study) together with records from Birner et al. (2016) (pink lines with crosses during MIS 41–37), MD01-2444 (Skinner and Elderfield, 2007) (light purple line) and MD99-2334 (Skinner et al., 2003) (dark purple line with crosses).
We combine (stack) North Atlantic records from Sites U1385 and 607 (Ford et al., 2016; Sosdian and Rosenthal, 2009) and compare them with equivalent Pacific records (Sites 1123 and 1208; Elderfield et al., 2012; Ford and Raymo, 2020) to reconstruct the basinal histories of temperature and salinity change (Sect. 2.5–2.6). The Atlantic and Pacific records are then combined with Site 1094 from the South Atlantic sector of the Southern Ocean (Hasenfratz et al., 2019) (Figs. 1, S2 and S3; Table 1) to produce globally distributed stacks. Although relatively few long reconstructions based on deconvolved benthic –δ18O records are available for stacking over the past 1.5 million years (Myr), some distinct differences emerge in the patterns of inferred deep-ocean temperature and salinity change between the North Atlantic and Pacific basins.
All study sites are deeper than 2500 m and are considered representative of the deep ocean (Figs. 1, S2 and S3; Table 1). Today, Sites U1385 (2578 m b.s.l.) and 607 (3427 m b.s.l.; Ford et al., 2016; Sosdian and Rosenthal, 2009) are bathed by North Atlantic Deep Water (NADW) and exhibit similar seawater physical properties (Table 1). Although both sites lie within the deep North Atlantic, they are influenced by different mixtures of deep-water masses. In the modern ocean, Sites U1385 and 607 occupy different parts of Lower North Atlantic Deep Water and receive varying proportions of Labrador Sea Water, Iceland–Scotland Overflow Water, Denmark Strait Overflow Water and Antarctic Bottom Water (Liu and Tanhua, 2021). The relative contributions of these water masses to each site also likely varied through glacial–interglacial cycles. Modern hydrographic observations nevertheless place both sites within the Lower North Atlantic Deep Water neutral density range (γn ≈ 27.95–28.10 kg m−3). The North Atlantic stack is therefore intended to represent the average properties of deep North Atlantic waters rather than a single homogeneous water mass. Pacific Sites 1123 (3290 m b.s.l.; Elderfield et al., 2012) and 1208 (3346 m b.s.l.; Ford and Raymo, 2020) are located within Lower Circumpolar Deep Water (LCDW) and Pacific Deep Water (PDW) (Elderfield et al., 2012; Ford and Raymo, 2020; Insua et al., 2014), respectively, and share broadly similar physical properties originating from the Southern Ocean (Talley, 2013). The deep western boundary current (DWBC) of the Southwest Pacific is the main pathway through which most of the cold deep water formed around Antarctica enters the Pacific Ocean (Chandler et al., 2024). The deep water gradually mixes as it flows northward modifying its properties, leading to the formation of Pacific Deep Water (PDW). Given the locations of Site 1123 within the DWBC and 1208 in the PDW, it is reasonable to assume they broadly reflect conditions in the deep Pacific.
Deep Pacific sites are ∼ 1.2 °C colder and ∼ 0.3 lower in salinity (PSS-78) than those in the North Atlantic, reflecting the formation of relatively warm and salty NADW (Figs. S2 and S3; Table 1). Correspondingly, the δ18Oseawater values of the Atlantic sites are on average higher (∼ 0.25 ‰) higher than those of the deep Pacific (Fig. 1; Table 1) (Frew et al., 2000). The Atlantic and Pacific records are merged with Site 1094 (2807 m b.s.l.; Hasenfratz et al., 2019) from the South Atlantic sector of the Southern Ocean, which is currently bathed by LCDW.
2.1 Site details and chronology
Four holes drilled at Site U1385 were spliced to produce a continuous composite section extending to 166.5 m composite depth (mcd), corresponding to a basal age of ∼ 1.45 Ma during Marine Isotope Stage (MIS) 47 (Hodell et al., 2015, 2023a). The Site U1385 age model was established by alignment of the benthic oxygen isotope (δ18O) record to the LR04 reference stack (Hodell et al., 2023a; Lisiecki and Raymo, 2005), with chronostratigraphic ages assigned by linear interpolation between age-depth control points.
All previously published records used to compile the ocean stacks are presented on their original published age models. Most are based on alignment of benthic foraminiferal δ18O to LR04, including DSDP Site 607 combined with Chain 82-24-23PC (Ford et al., 2016; Sosdian and Rosenthal, 2009), and Ocean Drilling Program (ODP) Site 1123 (Elderfield et al., 2012). ODP Site 1208 (Ford and Raymo, 2020) was aligned to the Prob-stack using the HMM-Stack MATLAB code (Ahn et al., 2017; Ford and Raymo, 2020; Lin et al., 2014; Butcher et al., 2017), which is also based on the LR04 age model. The ODP Site 1094 age model (Hasenfratz et al., 2019) was derived by graphical alignment of benthic δ18O to LR04, with the original chronology of Jaccard et al. (2013) retained where benthic foraminifera were sparse (e.g. MIS 4).
The Iberian Margin piston cores MD99-2334 and MD01-2444 were independently aligned to Greenland ice-core records through synchronisation of Dansgaard–Oeschger events recorded in planktonic δ18O (Shackleton, 2000; Skinner et al., 2003; Skinner and Elderfield, 2007). Owing to the close agreement in both structure and absolute benthic δ18O values with Site U1385 over the interval of overlap, no further adjustments to these published age models were applied.
2.2 Stable isotopes
Oxygen and carbon isotopes were measured previously using Cibicidoidies wuellerstorfi from the >212 µm sediment coarse fraction (Hodell et al., 2023a, b). Additional analyses were made using Uvigerina peregrina and Globobulimina affinis selected from the 212–355 µm coarse fraction. All benthic oxygen isotope data were corrected to Uvigerina using an offset of 0.64 ‰ for C. wuellerstorfi and −0.3 ‰ for G. affinis. Tests were crushed between glass slides to facilitate cleaning. Isotopic measurements were made at the Godwin Laboratory for Palaeoclimate Research, Department of Earth Sciences, University of Cambridge following previously described methods (Hodell et al., 2015). Instrument precision was better than ±0.08 ‰ (1σ) for δ18O and ±0.06 ‰ (1σ) for δ13C.
Species-specific benthic δ18O offsets are commonly assumed to be constant when correcting between co-occurring taxa, although temporal variations have been reported (Hoogakker et al., 2010). Where same-species paired δ18O measurements were unavailable C. wuellerstorfi δ18O values were supplemented. Comparison of paired δ18O measurements from C. wuellerstorfi and G. affinis (n= 3580) at Site U1385 indicates that the corrected values agree closely with a mean residual difference of only −0.02 ‰ ± 0.23 ‰ (1σ). Restricting the comparison to 98 available paired samples used for the analyses yields a similarly small residual difference of −0.04 ‰ ± 0.26 ‰ (1σ). Together with the high sedimentation rate at Site U1385 (∼ 11 cm kyr−1; Hodell et al., 2015) and interpolation of the reconstructions to 3 kyr resolution (Sect. 2.6), this suggests that any temporal offset associated with differing microhabitats is likely to be negligible relative to the temporal resolution of the study.
2.3 Foraminiferal analyses
Benthic , deep-water temperature and δ18Oseawater records from Site U1385 extend back to ∼ 1.45 Ma, spanning MIS 1–47. measurements on Uvigerina peregrina and Globobulimina affinis were conducted at ∼ 20 cm intervals, corresponding to a mean temporal resolution of ∼ 2000 years (yr), except for two intervals sampled at higher resolution: ∼ 4 cm spacing between ∼ 980–860 thousand years ago (ka) over MIS 27–21, and ∼ 5 cm spacing between ∼ 1300–1240 ka (MIS 40–37; Birner et al., 2016) yielding a temporal resolution of ∼ 500 years.
Three noticeable breaks (> 15 kyr) occur in the -derived temperature and δ18Oseawater records because of low foraminiferal abundance between MIS 6–5 (∼ 132–116 ka), and MIS 16–15 (∼ 630–603 ka). In addition, a near 30 kyr hiatus removed the interval at Site 339-U1385 between MIS 12–11 (∼ 430–400 ka) at Termination V (Hodell et al., 2015, 2023a), which has now been recovered in companion Site 397-U1385 (Hodell et al., 2026). To produce a near-continuous Iberian Margin record spanning the past 1.5 Myr, Site U1385 records were supplemented through the last glacial cycle with -derived temperature and δ18Oseawater data measured on Globobulimina affinis at nearby piston cores MD01-2444 covering 50–35 ka during the early glacial interval (Skinner and Elderfield, 2007), and MD99-2334 spanning 35–10 ka during the late glaciation (Skinner et al., 2003) (Fig. 2; Table 1). Following Skinner et al. (2007) a constant temperature offset of +0.6 °C was applied to -derived temperatures from the deeper Core MD99-2334 to account for cooler modern deep-water temperature at that site location (Hodell et al., 2014; Skinner et al., 2003, 2007; Skinner and Elderfield, 2007; Table 1).
After data quality screening (Sect. 2.4), we report results for 864 samples of Uvigerina peregrina and 202 samples of Globobulimina affinis. All samples were oxidatively cleaned following the procedure of Barker et al. (2003). Trace elements were measured at the Godwin Laboratory for Palaeoclimate Research (Cambridge, UK) using inductively coupled plasma-optical emission spectroscopy (ICP-OES). Most analyses were performed on a Varian VISTA instrument (Birner et al., 2016) with the remaining ∼ 180 samples measured using an Agilent 5100 ICP-OES. Both instruments used the intensity-ratio calibration method of de Villiers et al. (2002). Interlaboratory comparison studies have validated the use of laboratory standards employed as reference materials for foraminiferal analyses (Greaves et al., 2008). Repeated measurements of standards showed instrument precision for determinations to be better than 0.5 % relative standard deviation (r.s.d.) (Greaves, 2008; Greaves et al., 2008; de Villiers et al., 2002). Based on long-term standard reproducibility and 47 sets of replicate analyses (including four triplicates) measured on multiple aliquots of the same sample, the pooled standard deviation is ±0.09 mmol mol−1 (1σ), corresponding to a mean precision of 8.2 % r.s.d. (see PANGAEA Data Repository, Thomas et al., 2026).
-derived deep-water temperatures from Uvigerina peregrina and Globobulimina affinis show generally good agreement in both variability and mean values within uncertainty (1.4 ± 1.5 and 1.6 ± 1.0 °C, respectively) (Fig. S4a). Both species record similar mean δ18Oseawater values (∼ 0.6 ‰ ± 0.4 ‰; Fig. S4b). This agreement is consistent with the application of species-specific –temperature calibrations applied in this study (Elderfield et al., 2006, 2010, 2012; Weldeab et al., 2016) and justifies combining the two datasets. The individual Uvigerina peregrina and Globobulimina affinis time series were used as inputs for the PSU Solver calibration procedures described in Sect. 2.5 and combined into single records of deep-water temperature and δ18Oseawater (Fig. 2).
2.4 Data quality evaluation
ratios derived from foraminiferal calcite tests can be used to estimate palaeotemperatures provided that stringent cleaning procedures are followed (Barker et al., 2003; Larsson and Jung, 2025). To evaluate the efficiency of these cleaning procedures and to assess the effects of authigenic precipitation, we analysed element Ca ratios of co-measured trace elements – primarily Fe and Mn, but also Al, Ba, K, Na, Si, Ti and Zn (Barker et al., 2003; Elderfield et al., 2012; Greaves, 2008; Hasenfratz et al., 2017). Contamination by silicates and clay minerals can lead to significant uncertainty in measured values. Therefore, the removal of contaminant silicates is a critical step in the cleaning protocol, and its success can be evaluated through downcore covariation of and (or ) records (Barker et al., 2003). records from the two foraminiferal species were assessed separately, as Globobulimina affinis is known to exhibit elevated ratios relative to other benthic foraminiferal species (Skinner et al., 2003; Weldeab et al., 2016). At Site U1385, five Uvigerina peregrina and three Globobulimina affinis samples were excluded from the dataset following identification of anomalously high co-occurring and values (Barker et al., 2003). Sample exclusion was based on co-occurring Fe/Ca– anomalies rather than a fixed threshold (Fig. S5). The dataset presented here includes Uvigerina peregrina samples with and values of up to 0.45 mmol mol−1 and 0.33 mol mol−1, respectively (and Globobulimina affinis values up to 0.79 mmol mol−1 and 0.28 mol mol−1), which exceed the typical (< 0.1 mmol mol−1) and (< 0.03 mol mol−1) values reported by Barker et al. (2003) and Elderfield et al. (2012).
Consistent with observations of Uvigerina spp. at Site 1123 (Elderfield et al., 2012), values for Uvigerina peregrina at Site U1385 show a slight downcore increase, with lowest glacial values rising from ∼ 0.012 mmol mol−1 at 60 ka to ∼ 0.045 mmol mol−1 at ∼ 1415 ka (Fig. S6). Although the maximum value for Uvigerina peregrina at Site U1385 (0.28 mmol mol−1) is lower than the 0.36 mmol mol−1 reported for Site 1123 (Elderfield et al., 2012), values exceeding ∼ 0.1 mmol mol−1 may suggest the presence of authigenic Mn–Fe-oxide coatings on some foraminiferal tests (Elderfield et al., 2012; Hasenfratz et al., 2017, 2019). The incorporation of Mn into calcite tests has been shown to be species-specific (van Dijk et al., 2025). In Uvigerina peregrina, values range from 0.01 to 0.28 mmol mol−1, while in Globobulimina affinis, values are generally higher, ranging from 0.04 to 1.88 mmol mol−1, with two anomalous specimens exceeding this upper value. Despite these elevated values, the absence of a positive correlation between and indicates that the presence of Mn–Fe oxides does not significantly influence variability. We therefore interpret the higher values as reflecting variable contributions from authigenic Mn–Fe-oxide coatings (Skinner et al., 2003), or from species-specific Mn incorporation during biomineralization (van Dijk et al., 2025).
Diagenetic Mn–Fe-oxide coatings commonly form on foraminiferal shells in deep-sea sediment cores used in palaeoceanographic reconstructions. In oxygenated porewater dissolved manganese is precipitated onto carbonate tests as Mn4+ oxides, later becoming remobilized as Mn2+ and forming Mn-rich oxide coatings when organic matter undergoes anaerobic decomposition deeper in the sediment (Barker et al., 2003; Boiteau et al., 2012). These Mn-rich coatings can substantially impact bulk ratios and introduce bias into deep-water temperature reconstructions (Hasenfratz et al., 2017). Site specific studies reveal relatively consistent ratios in foraminiferal coatings, ranging globally between 0.17–0.32 mol mol−1 [see Hasenfratz et al. (2017) Table 1 and references therein]. Regionally the upper end of this range – between 0.26 to 0.32 mol mol−1 – is most applicable to the Atlantic Ocean, although individual sites may deviate notably from basin-wide averages (Hasenfratz et al., 2017). These ratios can be used to correct ratios associated with the calcite lattice using the following equation (Hasenfratz et al., 2017):
To maintain consistency, we applied a coating correction following Eq. (1), with the coating term fixed at 0.32 mol mol−1, and applied uniformly to all data (Hasenfratz et al., 2017; de Lange et al., 1992) (Fig. S7). This value represents the maximum adjustment in the direction of lower temperatures and yields the least discrepancy between Site U1385 temperatures and those from the Pacific and South Atlantic. The correction has minimal influence on glacial values.
In total, was initially determined on 911 Uvigerina peregrina and 264 Globobulimina affinis samples. After quality control, we retain results for 864 samples of Uvigerina peregrina (including replicates) and 202 samples of Globobulimina affinis measurements, having excluded 42 and 59 samples, respectively, based on co-measured trace element indicators of potential contamination. Samples were rejected according to the following criteria:
-
Clay contamination: Low [Ca] (< 10 ppm) coupled with high (> 5.5 mmol mol−1), and (> 0.4 mmol mol−1), almost always associated with elevated .
-
Additional indicators of clay influence: > 0.4, > 0.4, > 0.005 mmol mol−1, or very low (< 0.1 mol mol−1) due to elevated .
-
Analytical blank effects: Low [Ca] combined with anomalously high values, suggesting contamination during measurement.
2.5 PSU Solver: Calibration equations for -derived deep-water temperature and δ18Oseawater
Deep-water temperature and δ18Oseawater estimates were calculated for Site U1385 over the past 1.5 Ma using an updated Python version of Paleo-Seawater Uncertainty Solver (PSU Solver) originally developed in MATLAB (Thirumalai et al., 2016). Uncertainties associated with –temperature calibration slopes and intercepts were propagated explicitly within a Monte Carlo framework by sampling calibration slopes and intercepts within their reported uncertainties during each iteration (n= 1000). Input data comprise foraminiferal and benthic δ18O measurements. Standard laboratory uncertainties of 0.08 ‰ for δ18O and 0.05 mmol mol−1 for were applied as inputs to the PSU Solver (Thirumalai et al., 2016). Species-specific –temperature calibrations were employed within the PSU Solver framework (Table 2).
For Uvigerina peregrina, we used the linear –temperature calibration of Elderfield et al. (2012):
Core-top -derived temperatures (∼ 2.5 °C; Figs. 2 and S4) are consistent with modern deep-water temperatures (∼ 2–3 °C) at the Iberian Margin (Hodell et al., 2014; Skinner et al., 2003), supporting the applicability of the Elderfield et al. (2012) –temperature calibration at this site.
For Globobulimina affinis, we applied the calibration of Weldeab et al. (2016):
To reconstruct δ18Oseawater we used the oxygen-isotope palaeothermometry equation (Elderfield et al., 2010, 2012):
Age model uncertainty was set at ±2 kyr, which represents both the optimal resolution for combining the records of differing resolution and the mean resolution of the five records.
Table 2Species-specific –temperature calibrations.
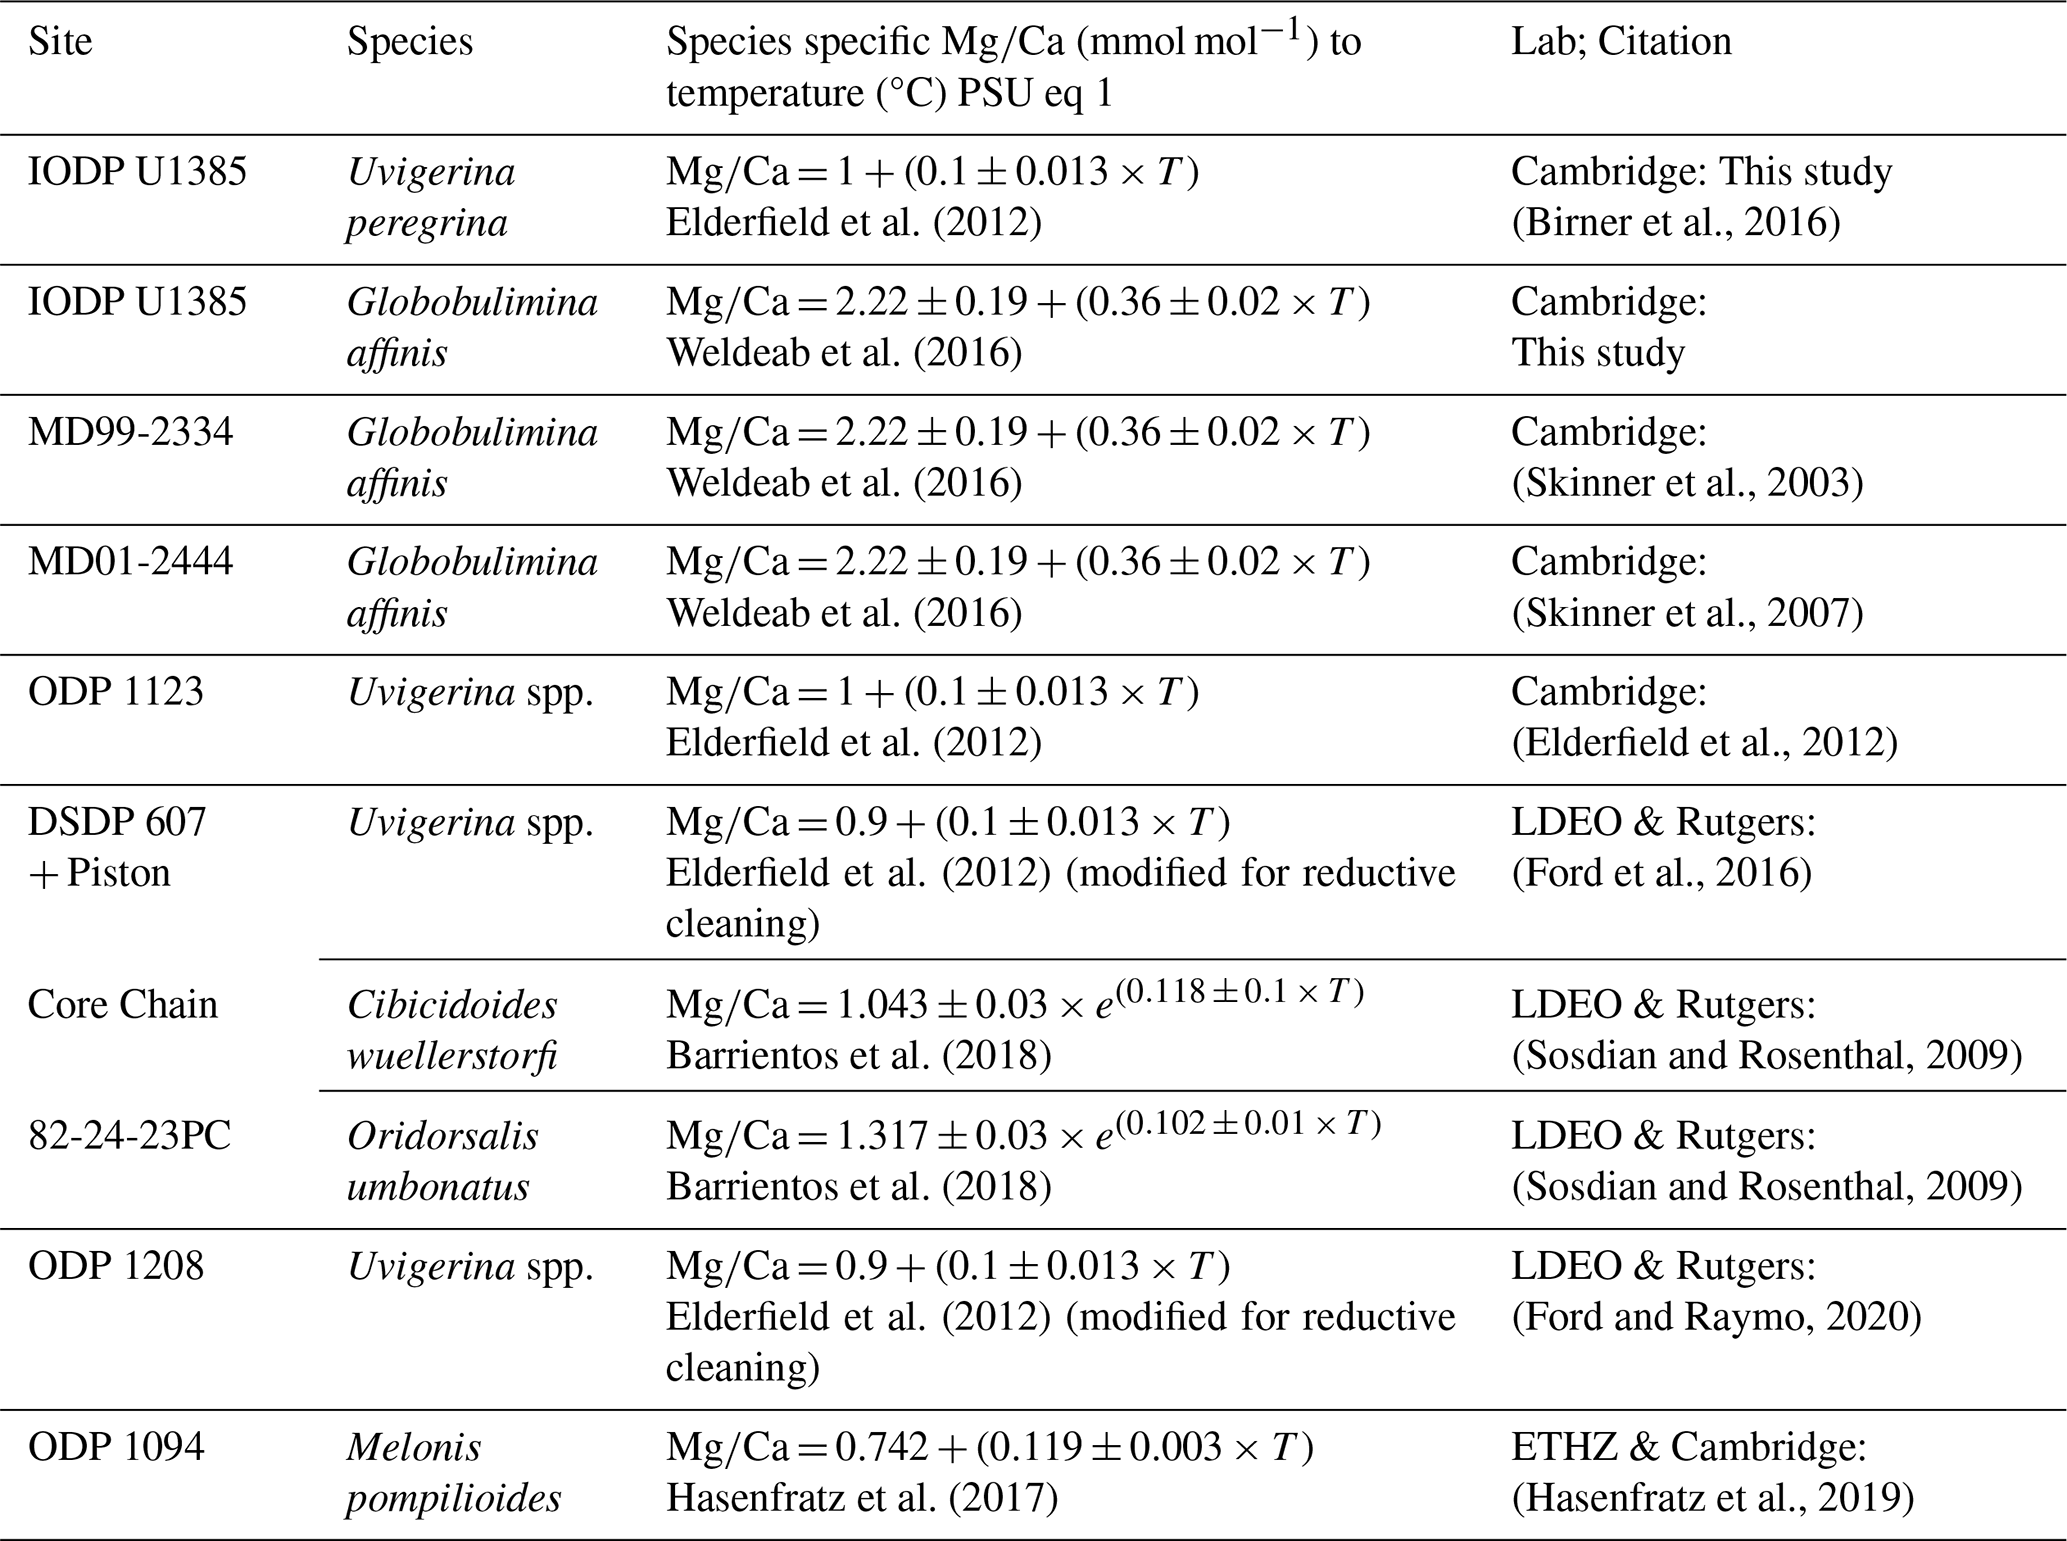
Abbreviations: LDEO, Lamont-Doherty Earth Observatory (Columbia University, New York, USA); ETHZ, Geological Institute, ETH Zurich (Zurich, Switzerland).
2.6 Stacking temperature and δ18Oseawater records
The rationale for stacking records of temperature and δ18Oseawater is the same as that given for oxygen isotope records (Imbrie et al., 1984; Lisiecki and Raymo, 2005); that is, to improve the signal noise ratio and reduce the influence of local variability. Although stacked records provide more representative regional and/or global mean signals of temperature and ice volume they also tend to dampen the amplitude of the signal owing to misalignments and smoothing. Stacked deep-water temperature and δ18Oseawater records were constructed for the North Atlantic using Sites U1385 (this study; Birner et al., 2016), MD01-2444 (Skinner and Elderfield, 2007), MD99-2334 (Skinner et al., 2003) and Site 607 (Ford et al., 2016; Sosdian and Rosenthal, 2009). The deep Pacific stack was derived using Sites 1123 (Elderfield et al., 2012) and 1208 (Ford and Raymo, 2020) (Figs. S8 and S9). Globally distributed mean deep ocean temperature (MDOT) and mean deep ocean δ18Oseawater stacks (Figs. 3a and 4a respectively) incorporate these records together with ODP Site 1094 located in the South Atlantic sector of the Southern Ocean (Hasenfratz et al., 2019) (Fig. S10).
Prior to stacking, temperature and δ18Oseawater estimates were interpolated to a regular 3 kyr time step using MATLAB's interp function. Uncertainty envelopes were estimated using bootstrap resampling (n= 1000), assuming normally distributed errors defined by the reported standard deviations (1σ) (Figs. 3 and 4). Gaps in the original age models were identified, and interpolated values were excluded where age gaps exceeded ∼ 6 kyr. At each interpolated time step, stacked estimates were calculated using either arithmetic or volumetrically weighted averaging of available basin-scale records. Uncertainties in non-weighted stacks were estimated by propagating the combined calibration and analytical errors in quadrature and incorporating inter-record variance, such that the uncertainty of the mean reflects both measurement uncertainty and the spread between paired estimates. For weighted stacks, basin weights were defined using fixed deep ocean volume fractions following the volumetric approach of Lisiecki and Stern (2016) (see their Table S2) and renormalised to unity at each time step to reflect the ocean volume represented by the available records. This ensures that stacked estimates reflect the relative deep ocean volume of the contributing basins without introducing bias when one or more basins are absent. Only half of the stacked data points (n= 268) include contributions from all three basins (North Atlantic, Southern Ocean and Pacific), together representing 43.6 % of the global ocean volume (Table S1). The impact of data gaps in the Site 1094 record appears to exert little influence on the weighted MDOT and mean δ18Oseawater reconstructions (Fig. S11).
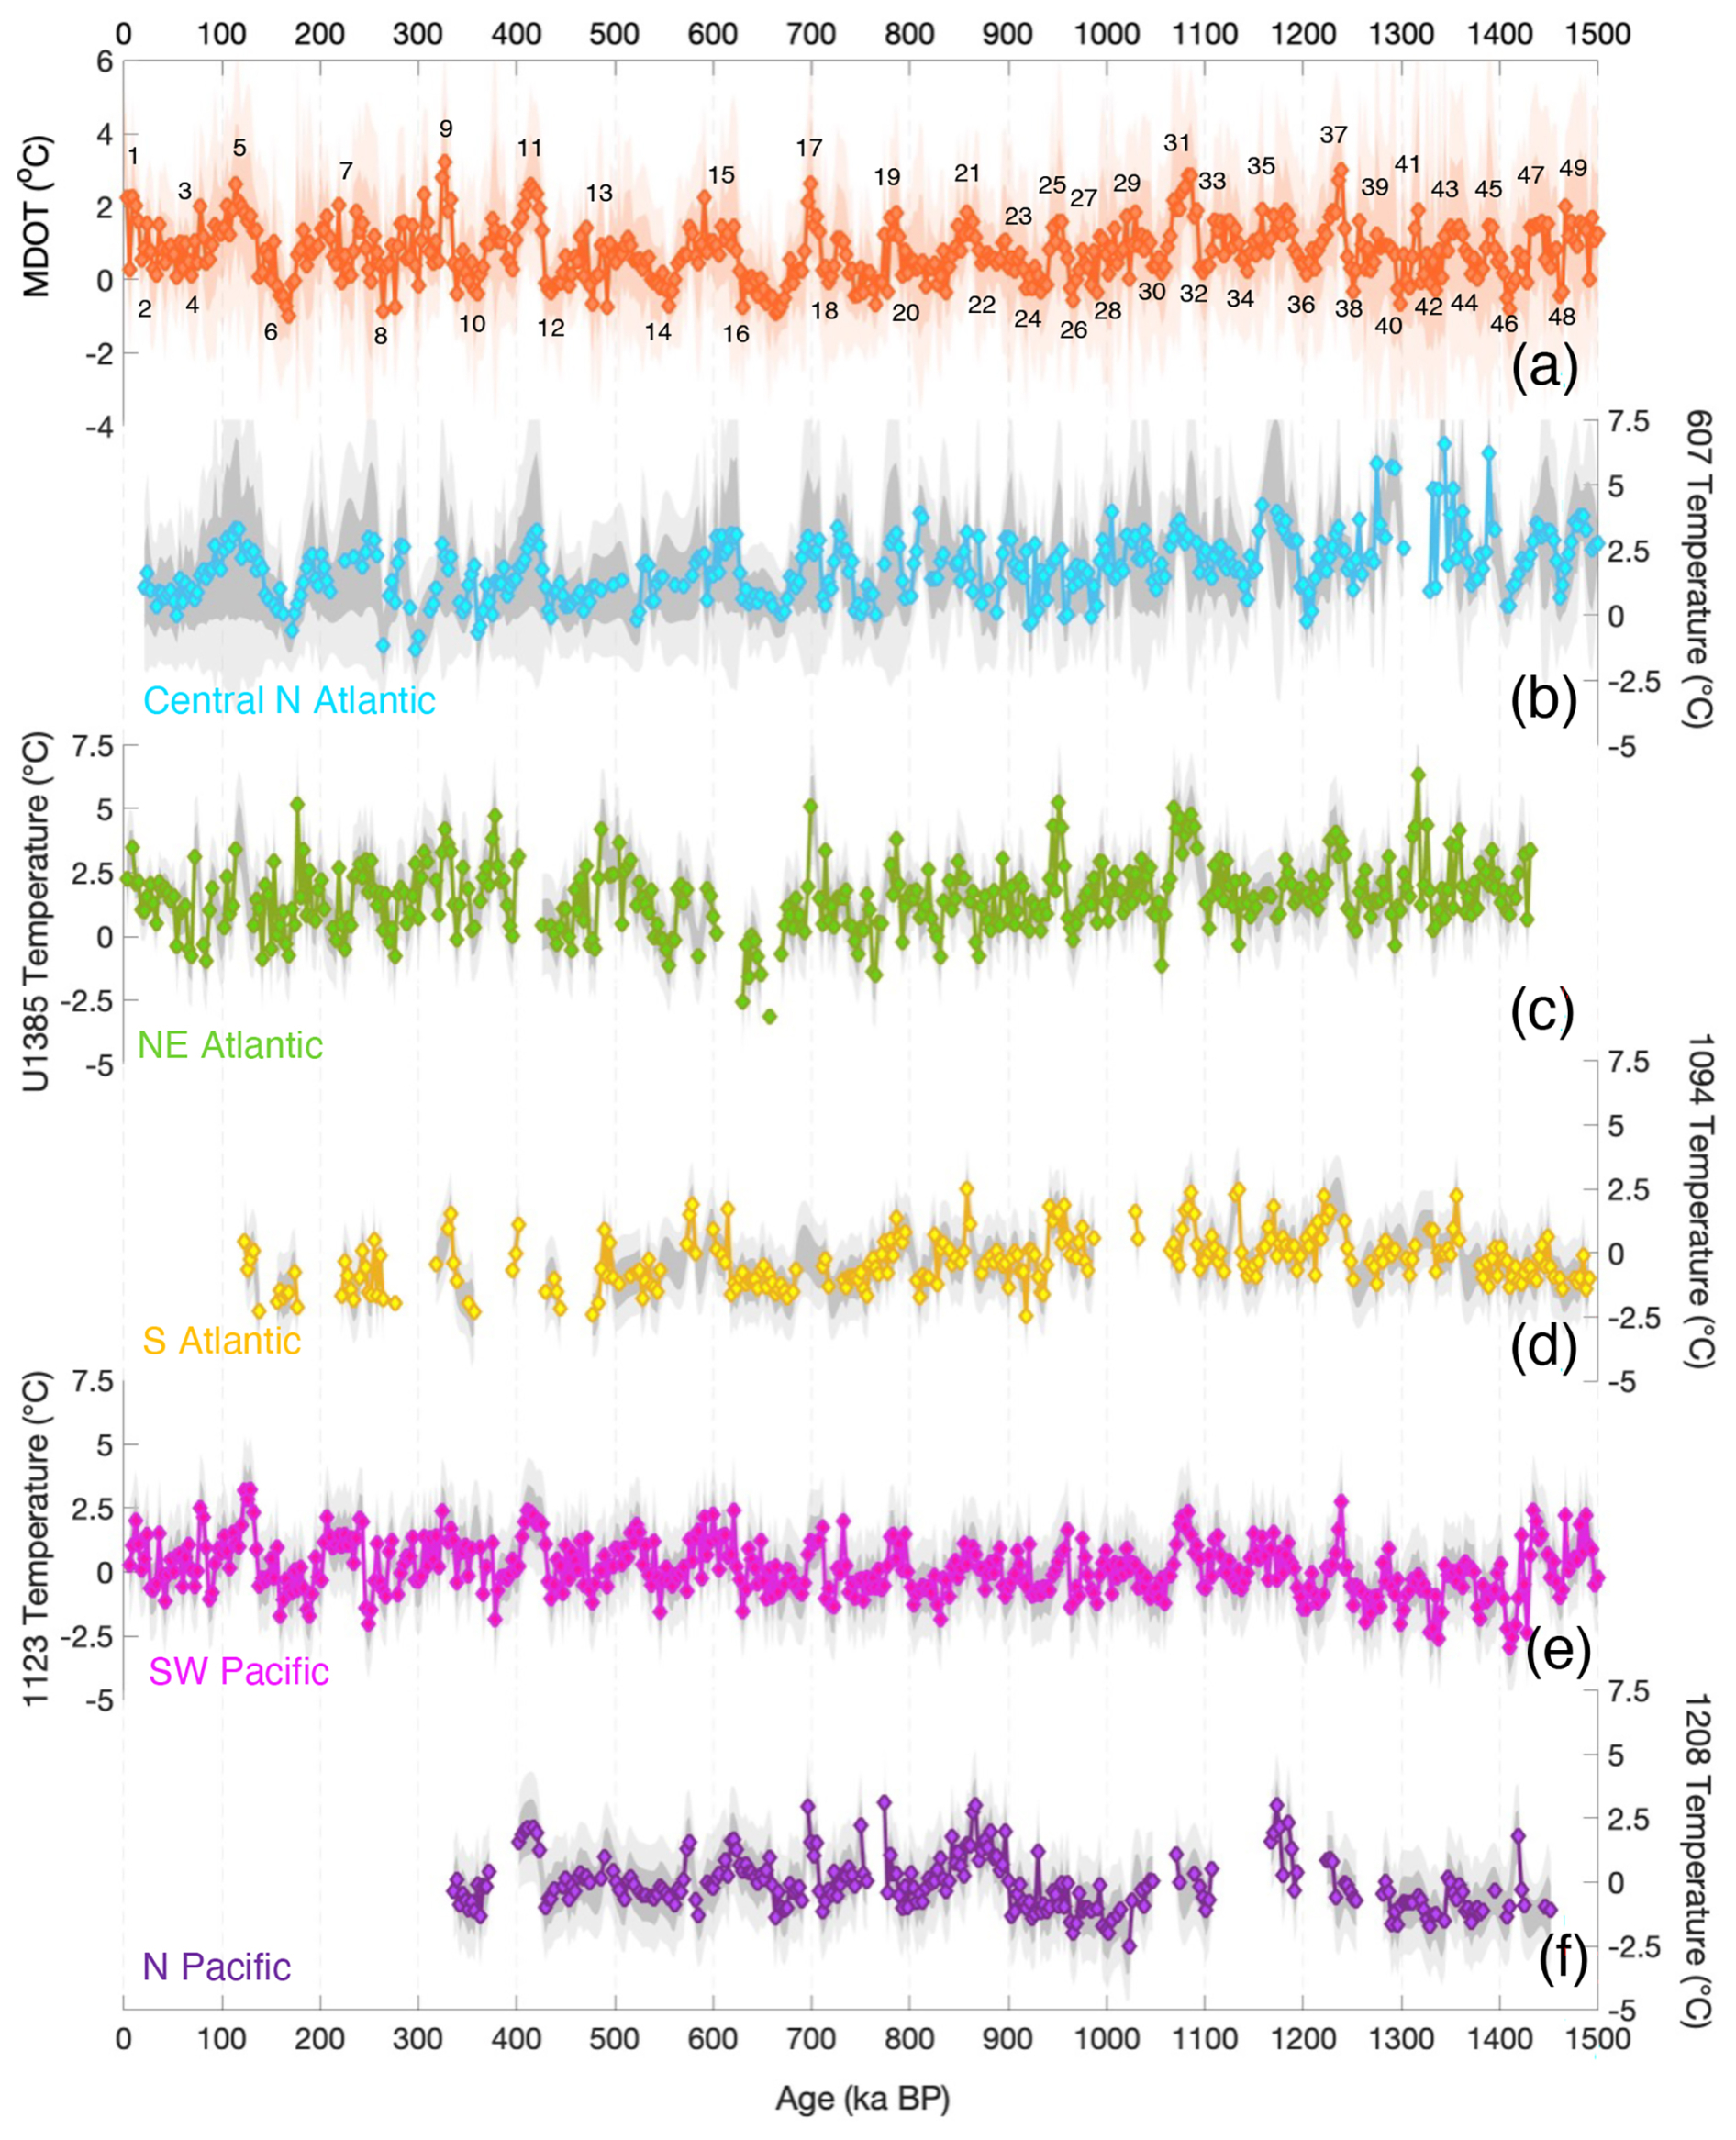
Figure 3Interpolated and bootstrapped -derived temperature records for all sites. (a) Non-weighted mean deep ocean temperature stack (MDOT; this study, orange line and markers), with MIS numbers denoting glacial (below) and interglacial (above) stages. -derived temperature records for: (b) DSDP Site 607 (Ford et al., 2016; Sosdian and Rosenthal, 2009) (light blue); (c) IODP Site U1385 (this study, including additional Iberian Margin records (Birner et al., 2016; Skinner et al., 2003; Skinner and Elderfield, 2007) (light green); (d) ODP Site 1094 (Hasenfratz et al., 2019) (yellow); (e) ODP Site 1123 (Elderfield et al., 2012) (light pink); and (f) ODP Site 1208 (Ford and Raymo, 2020) (dark purple). -derived temperature records were interpolated on a 3 kyr interval and subsequently bootstrapped. Shading represents 1σ and 2σ error margins (dark and light grey respectively), propagated from both analytical and calibration sources.
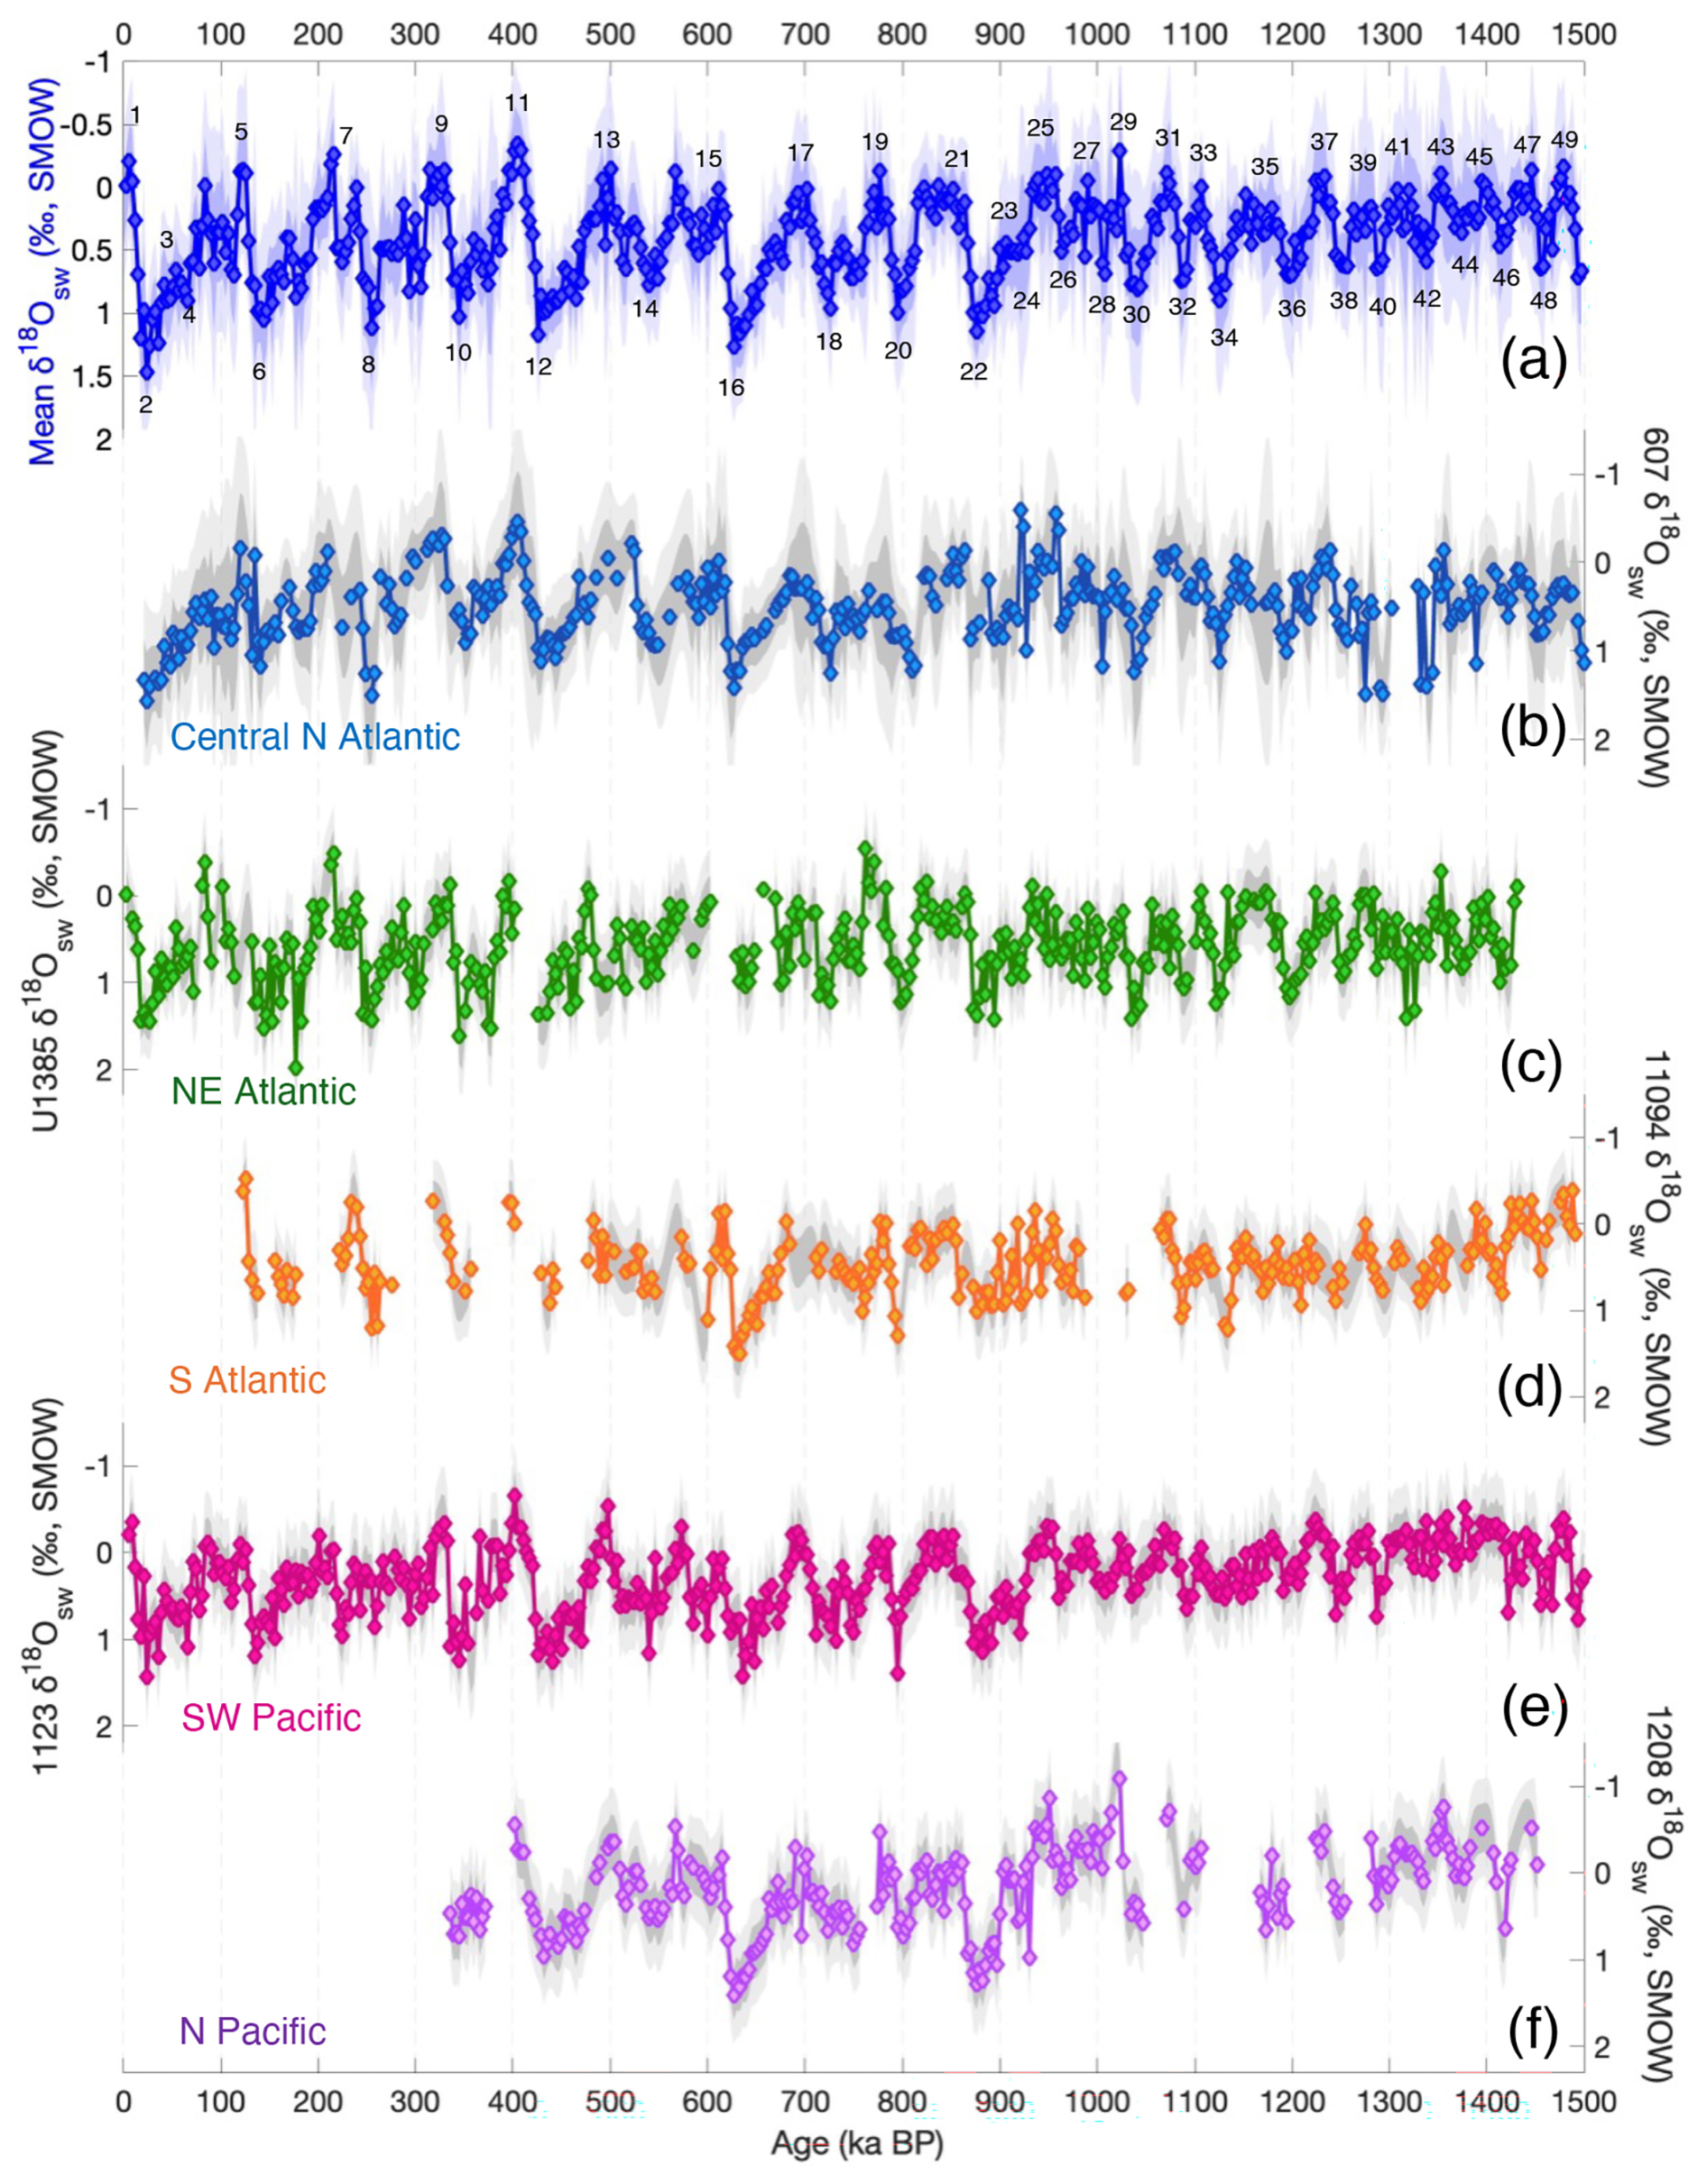
Figure 4Interpolated and bootstrapped δ18Oseawater records for all sites. (a) Non-weighted mean δ18Oseawater stack (this study; blue line and markers) with MIS numbers denoting glacial stages (below) and interglacial stages (above). Interpolated and bootstrapped δ18Oseawater records for: (b) DSDP Site 607 (Ford et al., 2016; Sosdian and Rosenthal, 2009) (blue); (c) IODP Site U1385 (this study, including additional Iberian Margin records (Birner et al., 2016; Skinner et al., 2003; Skinner and Elderfield, 2007) (green); (d) ODP Site 1094 (Hasenfratz et al., 2019) (orange); (e) ODP Site 1123 (Elderfield et al., 2012) (pink); and (f) ODP Site 1208 (Ford and Raymo, 2020) (purple). All δ18Oseawater records were interpolated to a 3 kyr interval and subsequently bootstrapped. Shading denotes 1σ and 2σ error margins (dark and light grey respectively), propagated from both analytical and calibration uncertainties.
At each time step t, volumetrically weighted stacked estimates were calculated as
where xi(t) is the basin-scale estimate (temperature or δ18Oseawater) and N(t) is the number of available basins. Weights were defined as
where Vi denotes the deep ocean volume fraction represented by basin i, and the denominator represents the total volume of all basins available at time t.
Total uncertainty was estimated by propagating intra-basin variance and incorporating an inter-basin variance term that captures the spread of basin-scale estimates about the weighted mean:
where σi(t) represents the reported 1σ uncertainty of basin i, and the second term represents inter-basin variability. Where only a single basin contributed to the stack, the uncertainty reduces to the reported basin 1σ value. This approach assumes that residual chronological misalignment between records is small relative to the interpolated 3 kyr resolution. Uncertainty envelopes incorporate analytical, calibration and age uncertainties propagated through a Monte Carlo framework, with basin-scale uncertainty additionally reflecting inter-site variability.
Change-point analysis was applied to the interpolated stacks (3 kyr resolution) using MATLAB's findchangepts function to identify statistically significant shifts in the mean state of the record. The analysis detects a primary breakpoint at ∼ 930 ka in both mean averaged and basin-volume weighted δ18Oseawater stacks, marking the most prominent transition in the time series.
3.1 Comparison of Sites U1385 and 607 deep-water records
North Atlantic Sites U1385 and 607 temperature and δ18Oseawater records generally show similar values and trends over the past 1.5 Myr (Figs. 5b and 6b), but there are some differences in the magnitude of the -derived temperature changes. Greater cooling is expressed at Site 607, where temperatures show decreasing trends of ∼ 1.2 °C between 1500–900 ka and ∼ 1.6 °C over the past 1.5 Myr. In contrast, Site U1385 shows no statistically significant long-term cooling prior to 900 ka, and a decreasing trend of ∼ 0.8 °C across the full record. At times, differences between the two temperature records (e.g. between 1180–1150 ka and ∼ 400–350 ka) correspond to measurements of Cibicidoides wuellerstorfi at Site 607, which is more prone to carbonate ion changes and dissolution than infaunal benthic taxa. However, the cooler temperatures at Site 607 cannot be attributed solely to a carbonate ion effect because Uvigerina spp. also give high temperatures between ∼ 1400–1300 ka (Ford et al., 2016; Sosdian and Rosenthal, 2009) and may instead reflect hydrographic differences between the eastern and western North Atlantic basins (Chalk et al., 2019). Despite the subtle differences in the records, the close similarity in both temperature and δ18Oseawater data from the two sites supports their integration into a North Atlantic stack.
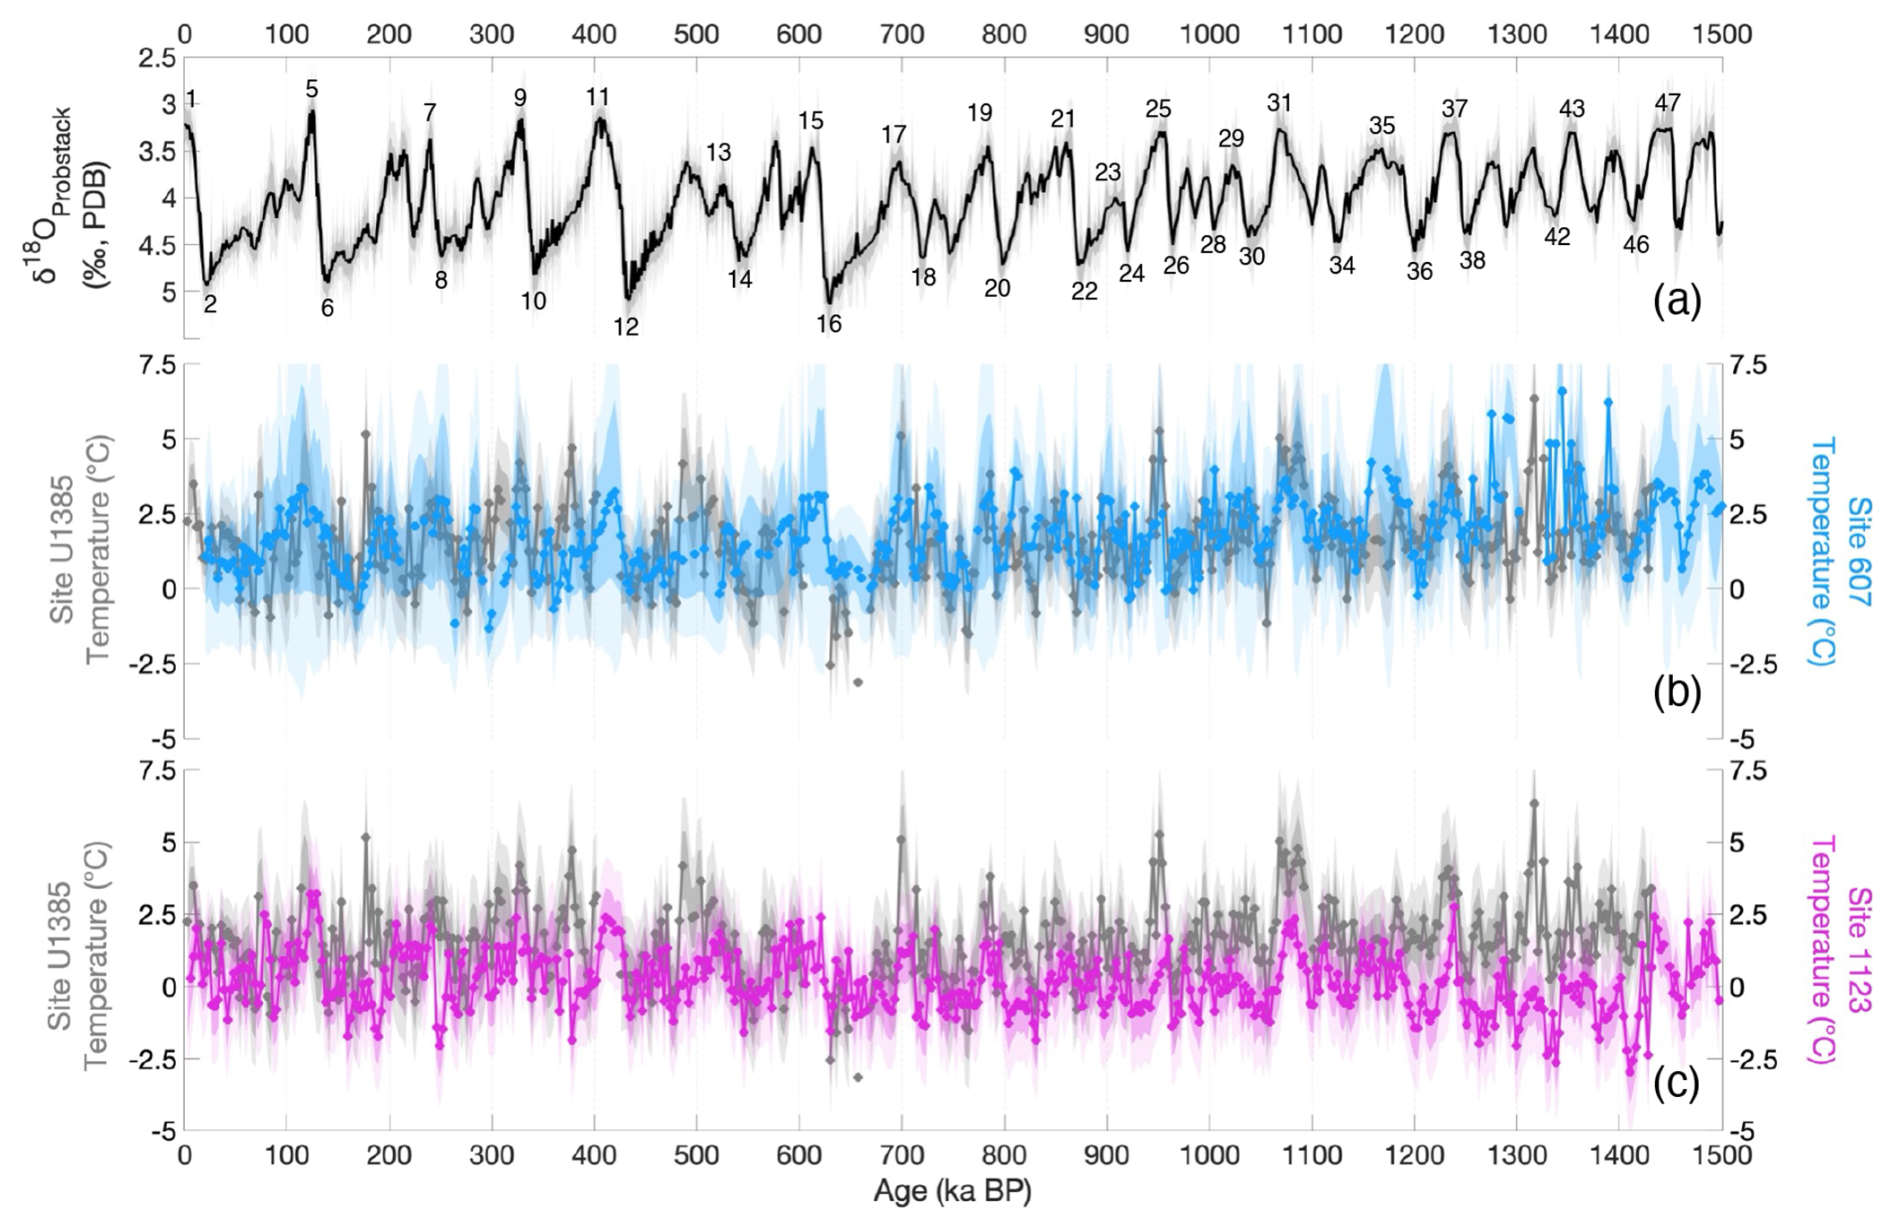
Figure 5Comparison of -derived deep-water temperature from Site U1385 versus Sites 607 and 1123. (a) Prob-stack benthic δ18O (Ahn et al., 2017) (black line), with MIS numbers denoting glacials (below) and interglacials (above). -derived deep-water temperatures from Site U1385 (grey) are compared with (b) Site 607 (Ford et al., 2016; Sosdian and Rosenthal, 2009) (blue), and (c) Site 1123 (Elderfield et al., 2012) (pink). Site 607 exhibits a gradual cooling through time (Ford et al., 2016; Sosdian and Rosenthal, 2009), whereas Site 1123 documents relatively stable, near-freezing temperatures during glacial maxima (Elderfield et al., 2012). Dark and light shading represent 1σ and 2σ uncertainties, respectively, estimated by propagating analytical and calibration uncertainties in quadrature, and accounting for inter-record variance. Records are interpolated to 3 kyr resolution and bootstrapped.
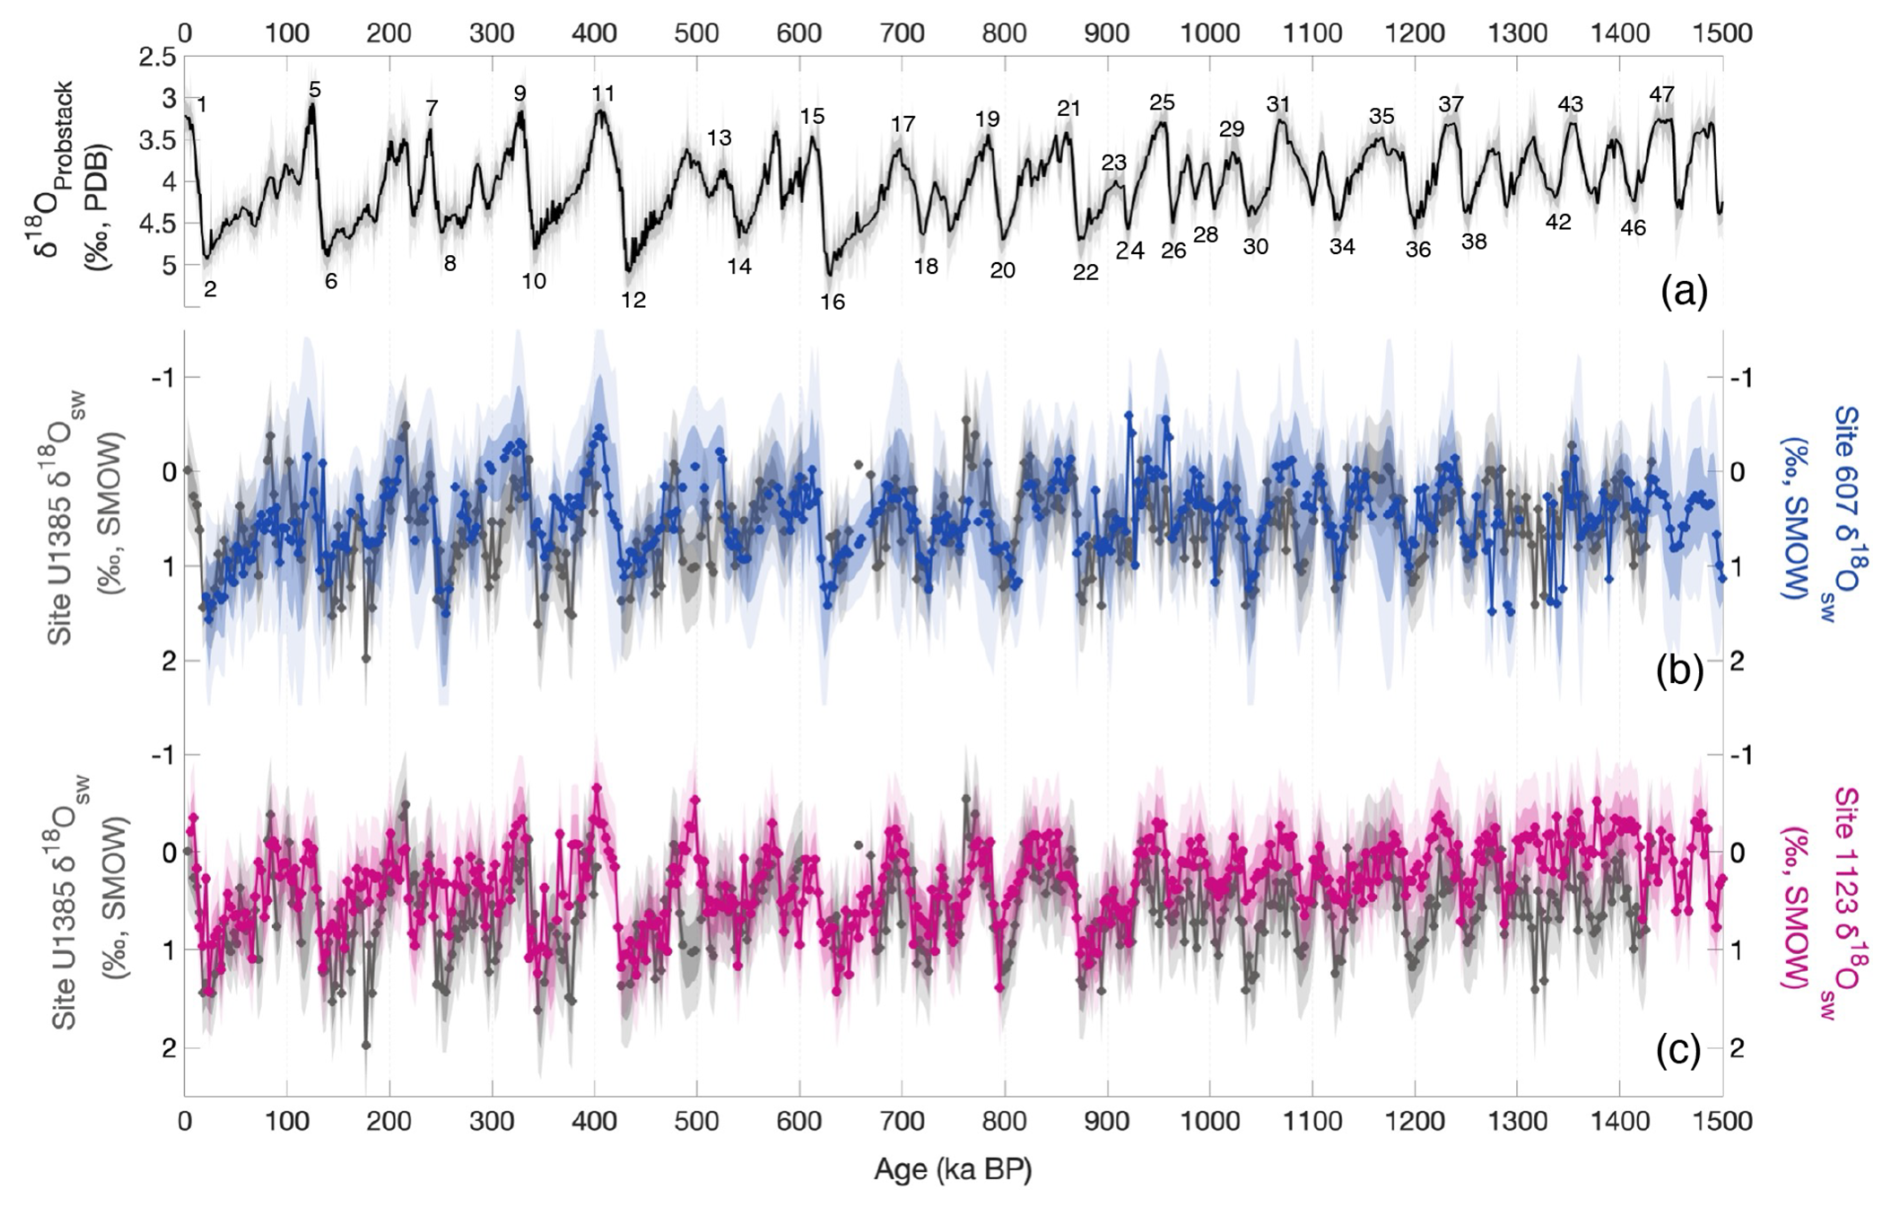
Figure 6Comparison of benthic δ18Oseawater records from Site U1385 with Sites 607 and 1123. (a) Prob-stack benthic δ18O (Ahn et al., 2017) (black line), with MIS numbers denoting glacial (even) and interglacial (odd) stages. Deep-water δ18Oseawater from Site U1385 (dark grey) is compared with (b) Site 607 (Ford et al., 2016; Sosdian and Rosenthal, 2009) (dark blue), and (c) Site 1123 (Elderfield et al., 2012) (dark pink). Records are interpolated at a 3 kyr interval and bootstrapped. Dark and light shading indicates 1σ and 2σ uncertainty envelopes, respectively. No clear long-term trend in δ18Oseawater (ice volume/salinity) is observed at Site 607 (Ford et al., 2016; Sosdian and Rosenthal, 2009), whereas Site 1123 records an abrupt increase in Antarctic ice volume (salinity) ∼ 900 ka (Elderfield et al., 2012).
3.2 Deep Atlantic-Pacific gradients in deep-water temperature and δ18Oseawater
Whereas the benthic δ18Ocalcite records are similar between the Atlantic and Pacific (Fig. 7a), the deconvolved temperature and δ18Oseawater records are not. Comparisons between Atlantic and Pacific deep-water temperature and δ18Oseawater stacks show greater inter-basin differences before ∼ 930 ka than afterwards. From 1500 to 930 ka (MIS 49 to 24), North Atlantic deep-water was on average ∼ 2.5 ± 1.5 °C warmer than the deep Pacific during both glacial and interglacial stages (Fig. 7b). After ∼ 930 ka, this temperature difference decreases to ∼ 1.1 ± 1.4 °C primarily reflecting cooling of glacial North Atlantic deep-water while deep Pacific temperatures show only minor changes. Prior to 930 ka, deep ocean glacial δ18Oseawater values in the Pacific were distinctly less than those of the Atlantic. Across the MPT, glacial deep ocean δ18Oseawater increased markedly in the Pacific and more modestly in the deep Atlantic (Fig. 7c). After 930 ka, glacial deep-water temperature and δ18Oseawater values from the Atlantic and Pacific were more similar.
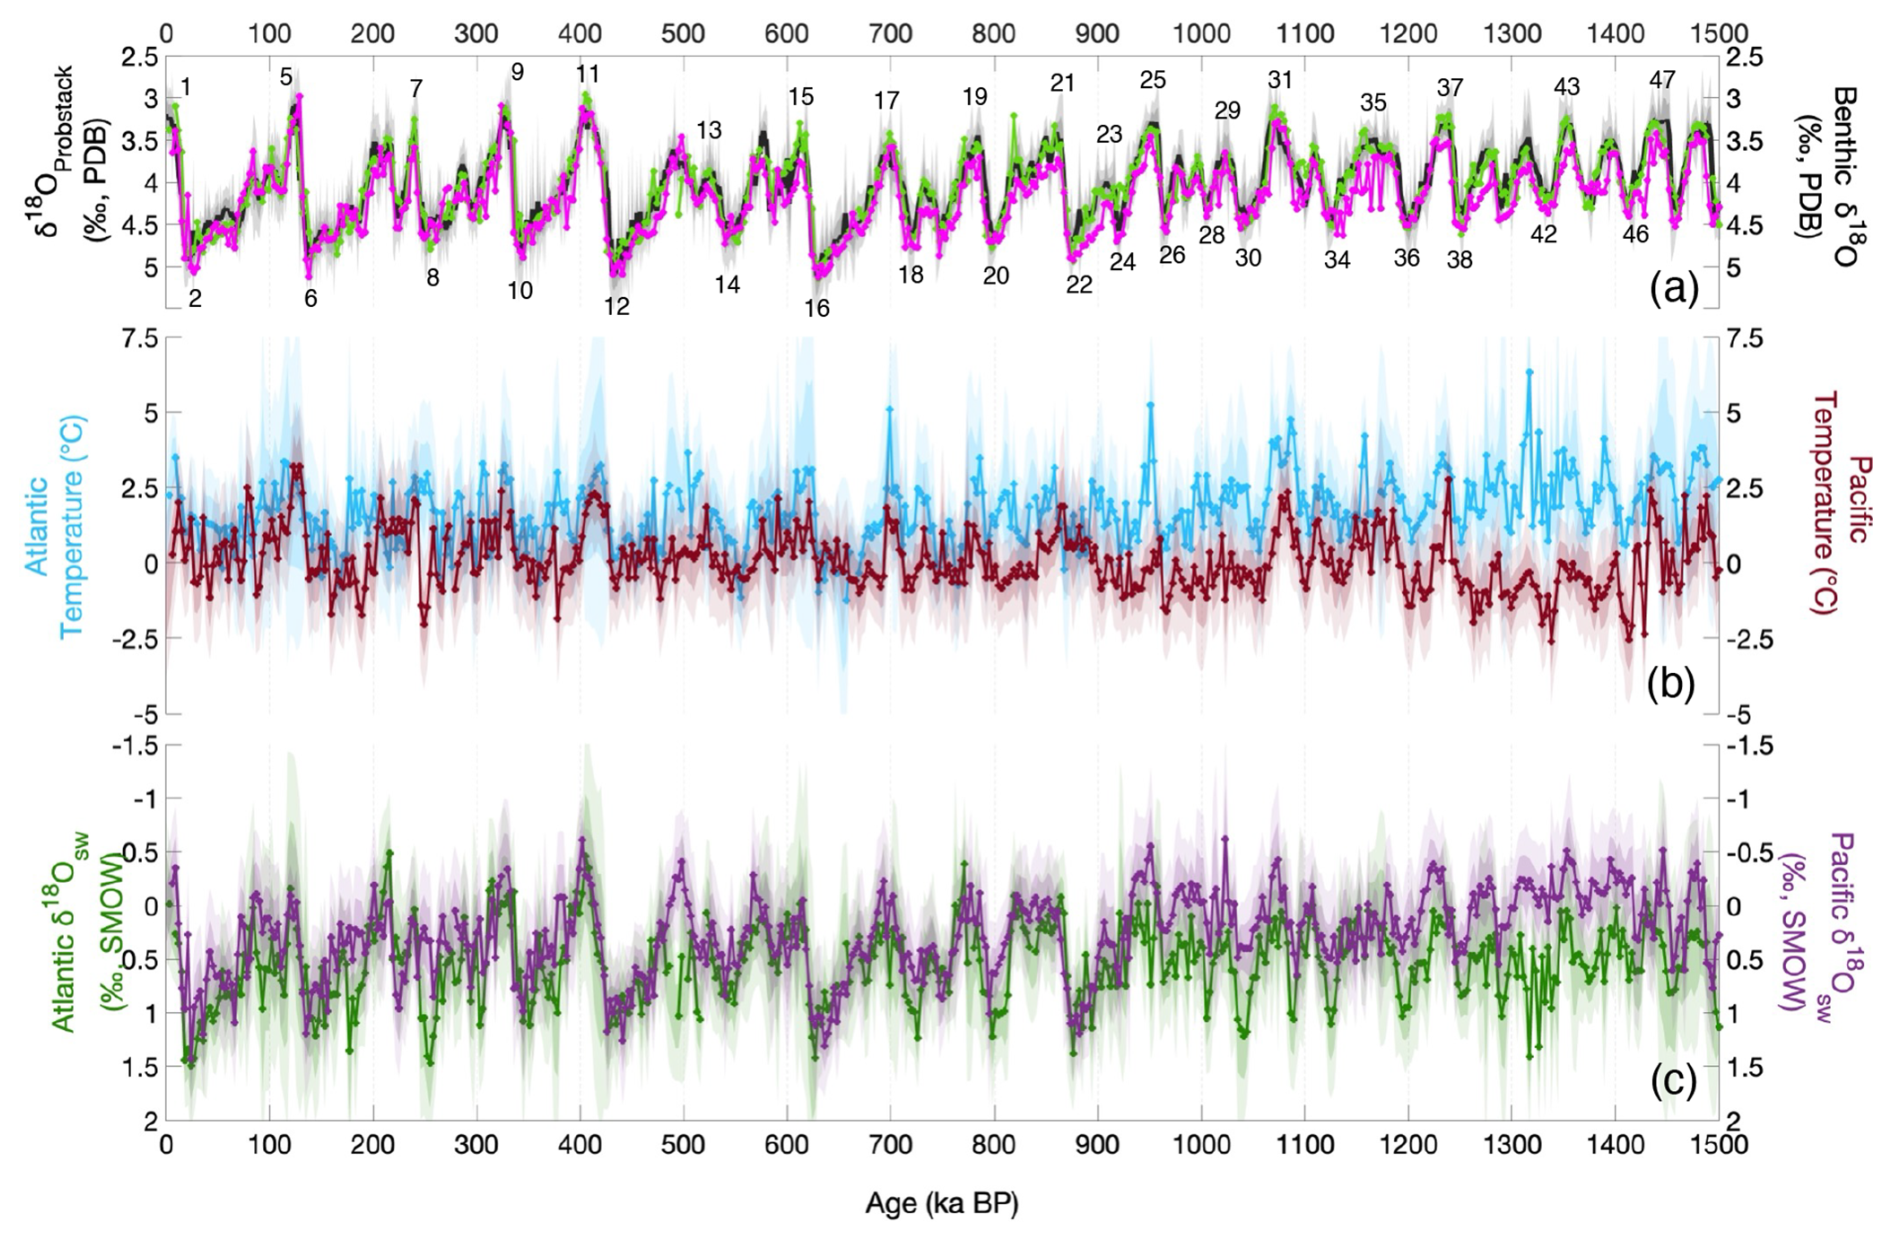
Figure 7Comparison of North Atlantic and Pacific Ocean deep-water temperature and benthic δ18Oseawater stacks. (a) Prob-stack benthic δ18O (Ahn et al., 2017) (black line), overlain with contributing benthic δ18O records for the Atlantic (this study; Ford et al., 2016; Sosdian and Rosenthal, 2009) (bright green) and Pacific (Elderfield et al., 2012; Ford and Raymo, 2020) (bright pink) stacks in (b) and (c). MIS numbers denote glacial (even) and interglacial (odd) stages. (b) Stacked deep-water temperatures for the Pacific (red) and North Atlantic (blue) with dark and light shading indicating 1σ and 2σ uncertainties respectively. (c) Stacked deep-water δ18Oseawater for the Pacific (purple) and North Atlantic (green) with uncertainties as in (b). Stacks and associated uncertainties represent mean of manually aligned, interpolated (3 kyr resolution) and bootstrapped records, with uncertainties reflecting both analytical error and the spread between paired estimates (see Sect. 2.6).
Deep-water temperatures at Site 1094 in the Atlantic sector of the Southern Ocean (Hasenfratz et al., 2019) are similar to those of the deep Pacific prior to ∼ 900 ka (Fig. S10), but are generally slightly colder thereafter consistent with the modern temperature difference between the two sites (Fig. S2; Table 1). No substantial change in glacial temperatures occurred at Site 1094 across the MPT (Fig. S10). The δ18O values of seawater at Site 1094 are more similar to those of the deep North Atlantic record. Prior to the MPT, a gradient in δ18Oseawater existed between Site 1094 and the deep Pacific, whereas the values converge after 930 ka.
All five records were stacked to produce global signals of deep ocean temperature (> 2500 m) and δ18Oseawater change. The non-weighted MDOT stack (Fig. S12c) shows a modest gradual decrease in glacial deep-water temperatures from ∼ 1050 to 925 ka primarily related to cooling in the deep North Atlantic. At ∼ 930 ka, the non-weighted mean δ18Oseawater stack (Fig. S12b) increases abruptly. This change is more pronounced in ocean volume-weighted records because of the proportionally greater influence of Pacific deep ocean temperature, which shows a warming from MIS 24 through 22 (Fig. 8). Mean glacial δ18Oseawater values in the ocean volume-weighted stack increase from 0.38 ‰ ± 0.08 ‰ prior to ∼ 930 ka to 0.80 ‰ ± 0.11 ‰ thereafter, representing a mean difference of ∼ 0.42 ‰ that is statistically significant (p< 0.001).
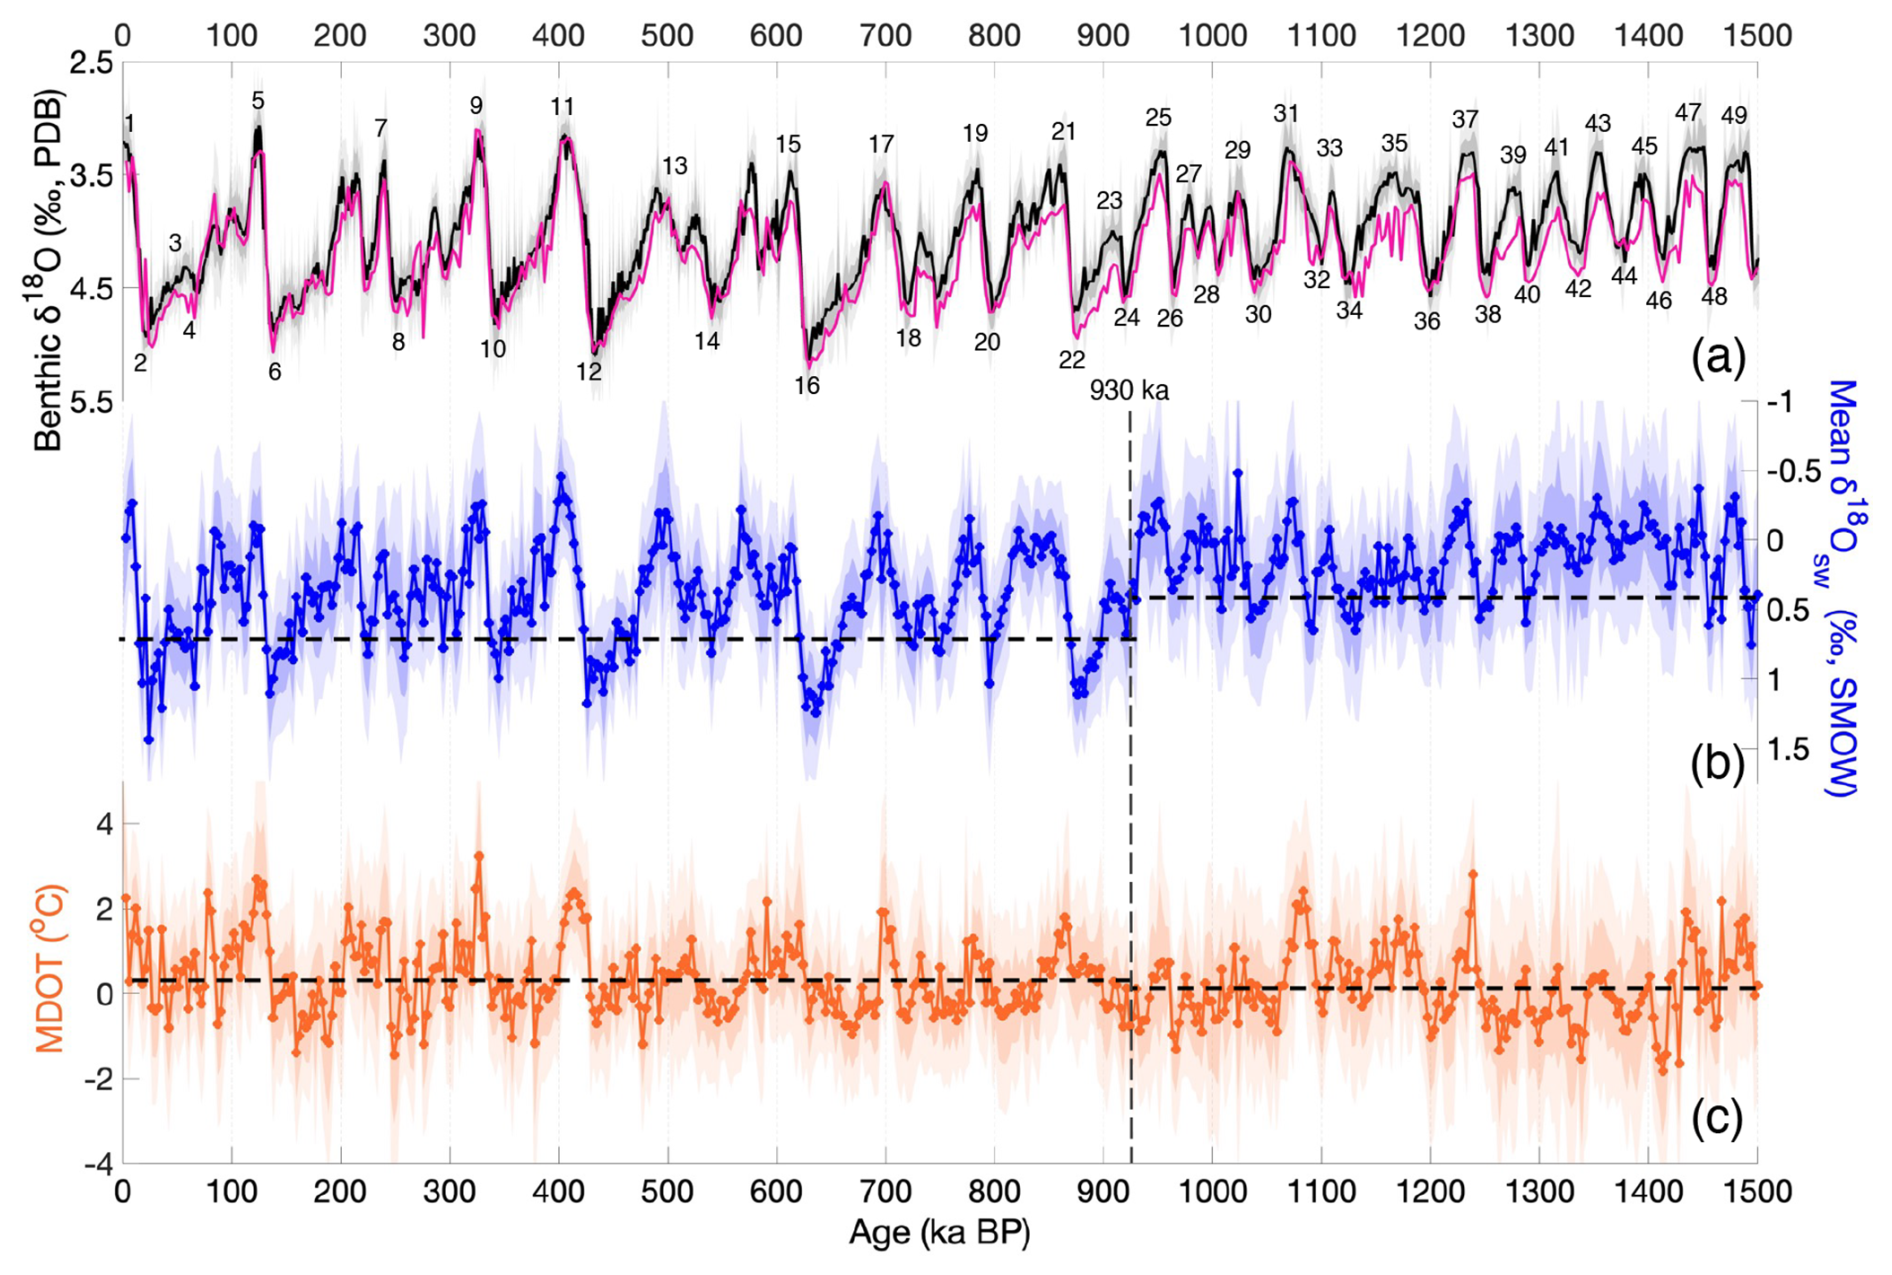
Figure 8MDOT and mean δ18Oseawater stacks weighted by ocean-basin volume. (a) Basin-volume–weighted benthic δ18O stack compiled from Atlantic, Pacific and Southern Ocean records used in this study (pink) overlaid on Prob-stack benthic δ18O (Ahn et al., 2017) (black). MIS numbers denote glacial (even) and interglacial (odd) stages. (b) Globally distributed basin-volume–weighted mean deep-water δ18Oseawater stack (blue). Horizontal dashed lines indicate the glacial mean values for intervals before and after 930 ka. (c) Ocean volume–weighted MDOT stack (orange); the horizontal dashed lines indicate the total mean values for the intervals before and after 930 ka. The vertical dashed line marks 930 ka. Ocean-basin volume weighted stacks were constructed following the approach of Lisiecki and Stern (2016) (Sect. 2.6). Uncertainty envelopes incorporate analytical, calibration and age uncertainties propagated through a Monte Carlo framework, with basin-scale uncertainty additionally reflecting inter-record variability.
4.1 Basinal differences in abyssal temperature and salinity
Although the deep Atlantic and Pacific stacks contain only two records each, we suggest they are broadly representative of deep-water mass properties in the two basins. Comparison of Atlantic and Pacific temperature and δ18Oseawater records indicate differences in the magnitude of temperature and δ18Oseawater changes across the MPT (Fig. 7b, c). The deep North Atlantic cooled during glacials between ∼ 1050 to 925 ka whereas the deep Pacific remained cold, both before and after the MPT. The magnitude of cooling in the deep North Atlantic is supported by a decrease (∼ 2 °C) in high-latitude North Atlantic sea surface temperature (SST) at Site 982 on the Rockall Plateau (58° N, 16° W; Lawrence et al., 2009) (Fig. 9b), and nearby Site 983 (McClymont et al., 2008), both located close to the source region of deep-water formation. Because deep water derived from the Southern Ocean is colder than that sourced from the North Atlantic, part of the cooling may also result from an expansion of southern sourced water into the deep North Atlantic during glacial stages. Cooling coincides with an abrupt increase in neodymium isotopes (ϵNd) at Site 607 that has been previously interpreted as indicating an increased contribution of Southern Component Water (SCW) in the deep Atlantic (Kim et al., 2021; Pena and Goldstein, 2014) (Fig. 9d), with similar deep circulation changes inferred for the Pacific (Li et al., 2026). An alternative interpretation is that neodymium isotope changes in the Atlantic reflect changes in the end-member Nd value of NCW alongside more modest circulation changes (Pöppelmeier et al., 2020, 2022; Williams et al., 2024; Zhao et al., 2019). Nevertheless, an increase in the δ13C gradient between the intermediate and deep North Atlantic also supports a greater proportion of SCW in the North Atlantic across the MPT (Fig. 9e; Lang et al., 2016; Lisiecki, 2014).
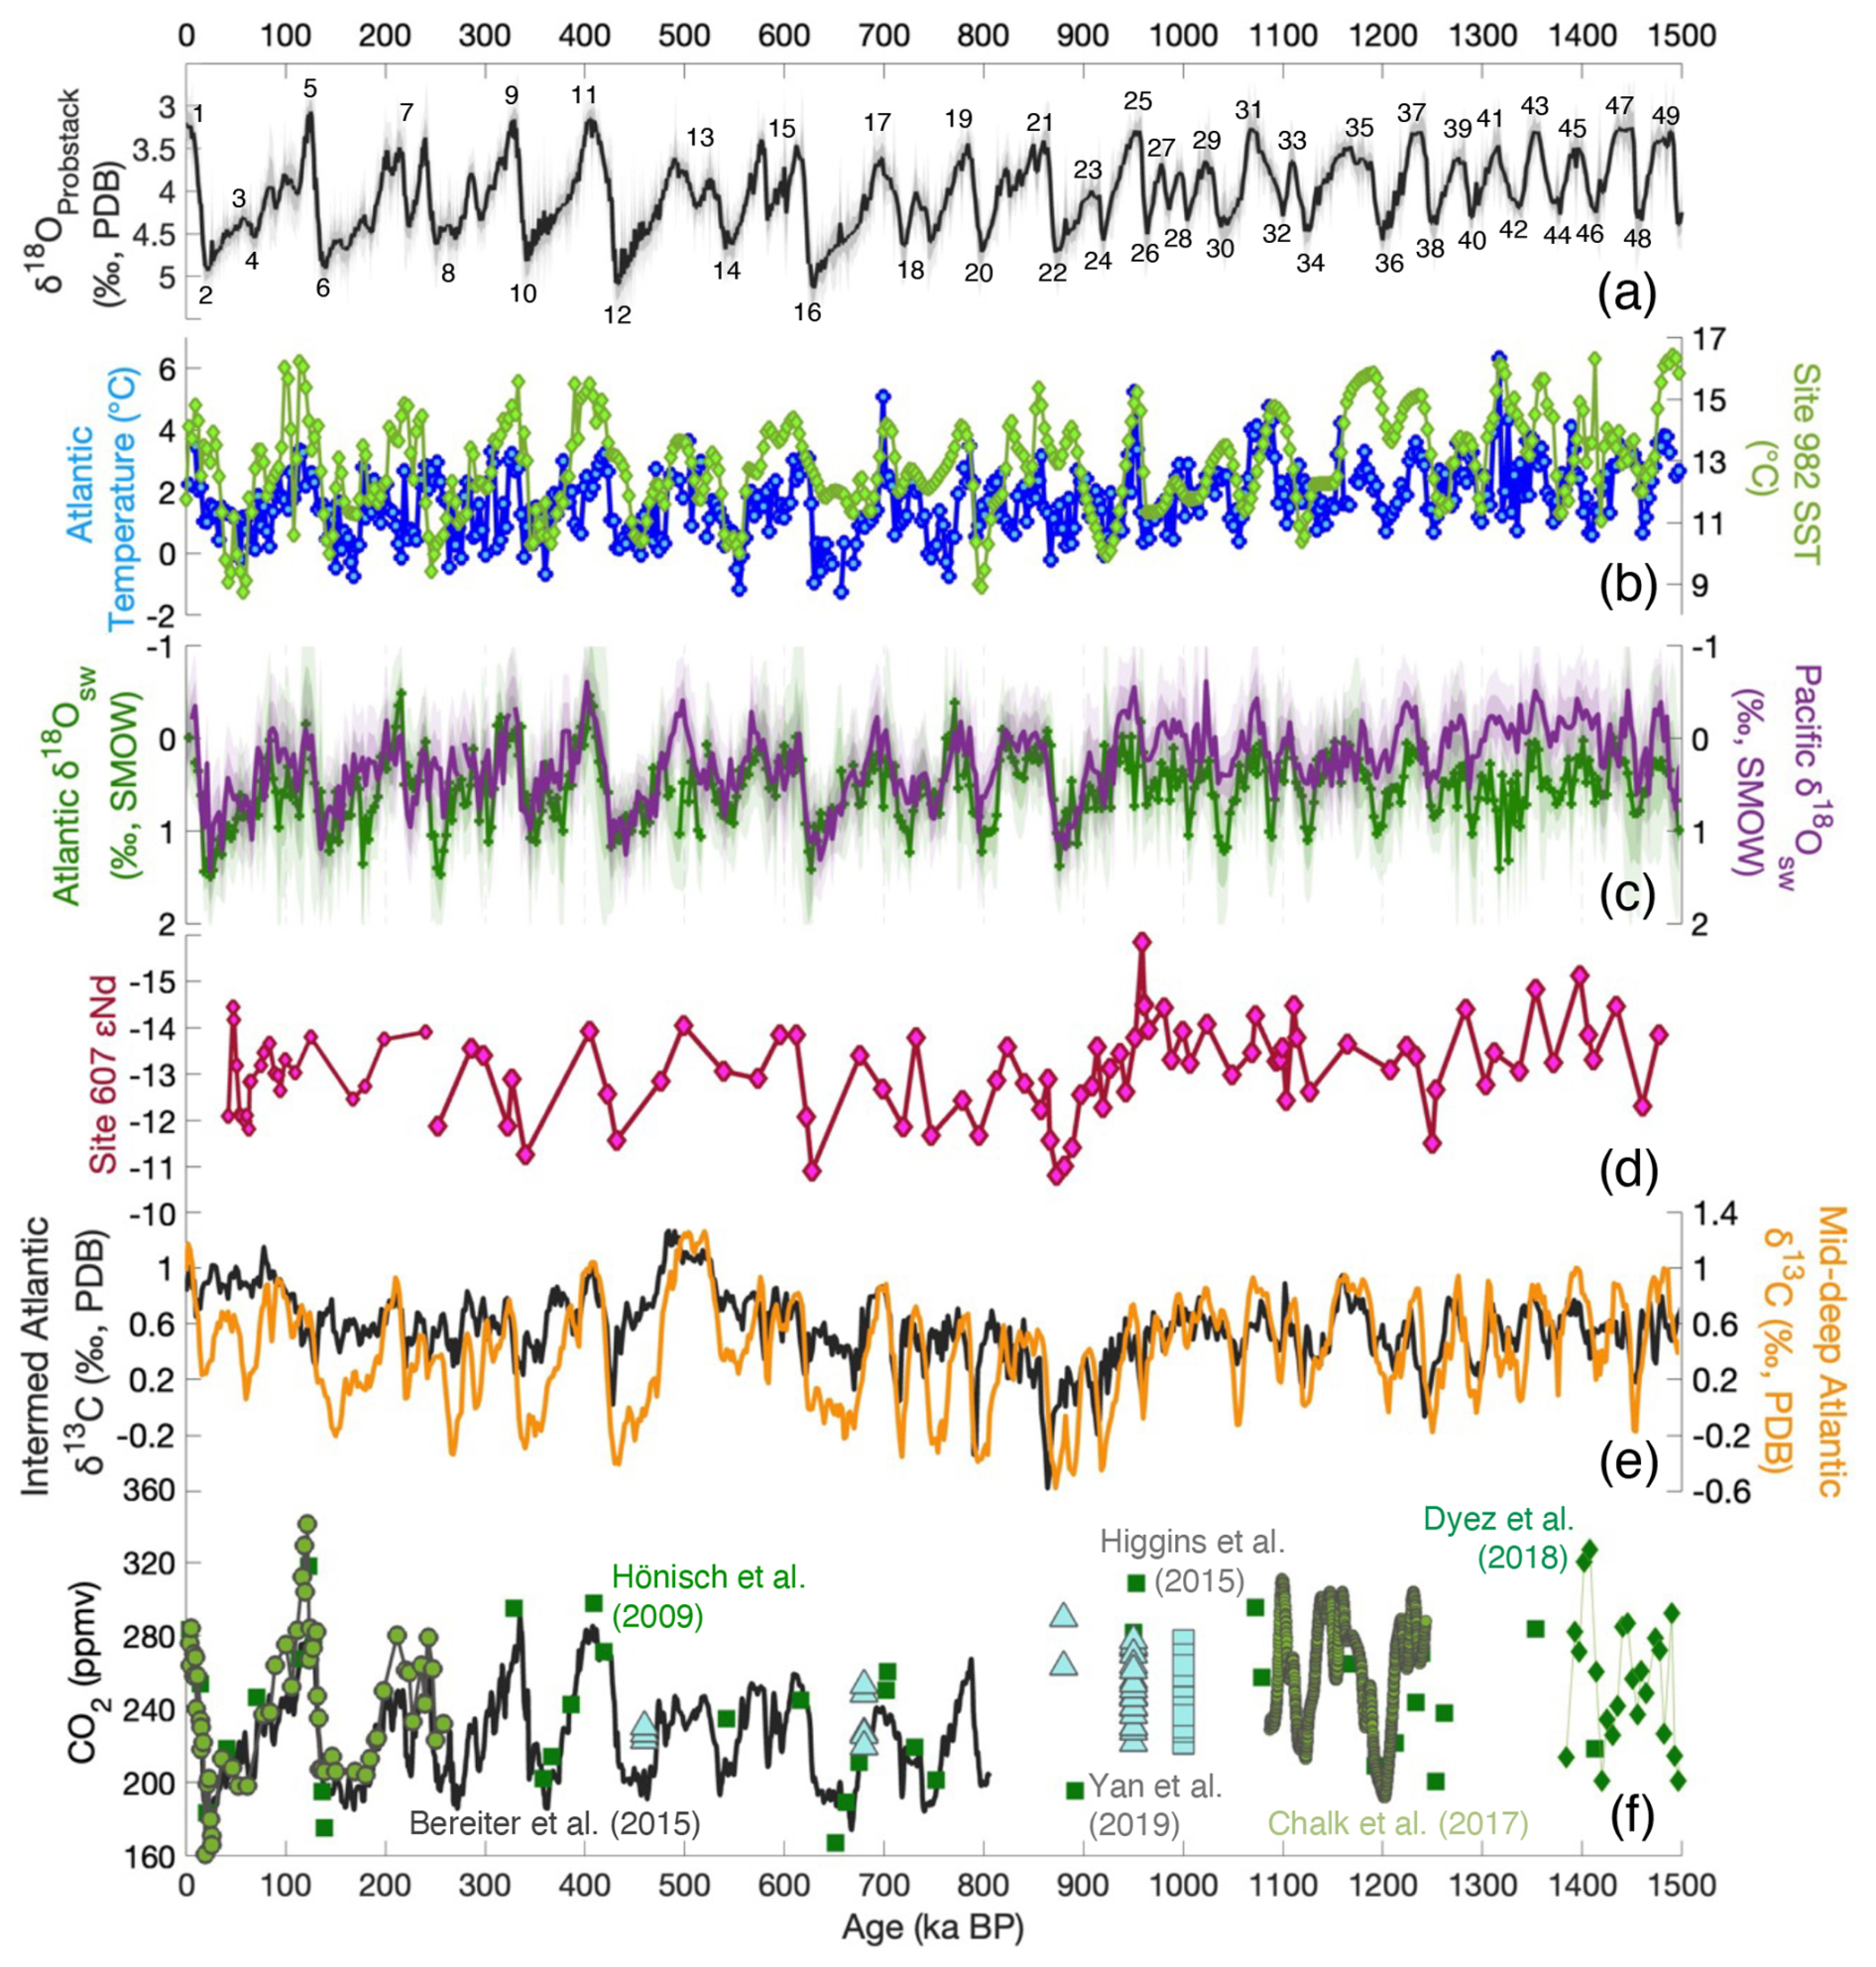
Figure 9Comparison of deep-water temperature, salinity, ocean circulation and atmospheric pCO2 records over the last 1.5 Ma. (a) Benthic δ18O Prob-stack (Ahn et al., 2017) (black line), MIS numbers denote glacial (below) and interglacial (above) stages. (b) Alkenone U-derived, sea surface temperature (SST) record from ODP Site 982 (Lawrence et al., 2009) (green line with markers) overlaying the Atlantic stack for deep-water temperature (this study; blue line with markers). (c) Atlantic (green) and Pacific (purple) δ18Oseawater stacks (this study). (d) DSDP Site 607/V30-97 ϵNd proxy for North Atlantic Ocean circulation changes (Kim et al., 2021) (dark pink line with pink diamonds). (e) Carbon isotope gradient between regional δ13C stacks (Lisiecki, 2014) for the intermediate depth North Atlantic (black) and middle deep Atlantic (orange). Low δ13C reflects reduced ventilation in the deep Atlantic. (f) Atmospheric pCO2 records (presented as in Thomas et al., 2022): Antarctic 800 kyr ice core data (Bereiter et al., 2015) (black line); Allan Hills Blue Ice (blue triangles (Yan et al., 2019) and blue squares (Higgins et al., 2015)); and δ11B-based reconstructed pCO2 [(Dyez et al., 2018) green line with diamonds; (Hönisch et al., 2009) solid green squares; (Chalk et al., 2017) early Pleistocene light green line/small circles, and late Pleistocene light green circles]. Chronology for Atlantic and Pacific stacks is available in Sect. 2.1, all other records are presented on their original timescales.
Cooling of Northern Component Water (NCW), assuming its salinity remained approximately constant, would increase its density and create a stratification inversion with deeper water masses in the absence of a density increase of SCW (Knorr et al., 2021). The δ18Oseawater in both the deep North Atlantic and Pacific increases across the MPT reflecting expansion of continental ice sheets, but the increase is considerably greater in the Pacific than the Atlantic (Fig. 7c). We attribute the greater increase in Pacific δ18Oseawater to an increase in the salinity and density of SCW, which may have shoaled the boundary between NCW and SCW in the deep Atlantic if the density contrast between the two water masses increased (Fig. 9c, e) (Song et al., 2025). Glacial-interglacial change in the global ocean density stratification in much of the deep ocean (> 2000 m) is controlled by surface freshwater forcing in the Southern Ocean (Sun et al., 2016). Increased salinity can be achieved by decreasing meltwater input to the marginal seas around Antarctica (e.g. Weddell and Ross Seas) either from the Antarctic ice sheet and/or grounded ice shelves. Sea ice expansion around Antarctica also raises salinity through brine rejection and expands the depth range of SCW (Ferrari et al., 2014), but sea ice formation does not significantly alter the δ18Oseawater of seawater (Kim and Timmermann, 2024; Toyota et al., 2013).
Raymo et al. (2006) suggested the East Antarctic ice sheet was terrestrial-based with melting margins before the MPT and transformed to a marine-based ice sheet afterward, which would have decreased meltwater to marginal seas. Hemispheric ΔSST reconstructions exhibit little precession-band variability (Clark et al., 2025b) and have been interpreted as evidence against this mechanism. However, precession is often underestimated by spectral analysis in relatively low-resolution stacked records with chronologic error and noise (Liautaud, 2021; Liautaud et al., 2020). We therefore include the mechanism proposed by Raymo et al. (2006) as one of several possible explanations for the increase in salinity of Antarctic marginal seas. An unconformity in the Ross Sea Embayment that spans the MPT has been interpreted to represent widespread expansion of a marine-based ice sheet (McKay et al., 2012) into the Ross Sea where AABW is formed today. Adkins (2013) proposed that cooling of NADW during glacial stages of the late Pleistocene decreased melting rates of floating Antarctic ice shelves. Adkins (2013) suggested decreased meltwater input led to the formation of a cold and salty version of Antarctic Bottom Water, and this water mass filled the deep ocean basins. We observe cooling of the high-latitude and deep North Atlantic across the MPT at the same time as the inferred salinity increase of the deep Pacific, which may support the mechanism outlined by Adkins (2013).
The freshwater fluxes to marginal seas can also be decreased by exporting freshwater to lower latitude via iceberg discharge and sea ice (Ferrari et al., 2014; Jansen, 2017). Starr et al. (2021) reported an increase in IRD in the Subantarctic Zone across the MPT and suggested this reflected increased transport of meteoric freshwater away from Antarctica. This process could have contributed to increased salinity in source areas of SCW formation, especially in the Weddell Sea sector. At the same time, increased transport of icebergs and sea ice from Antarctica increased the freshwater flux to the subantarctic, strengthened the halocline and slowed deep-to-surface exchange that controls carbon dioxide release to the atmosphere (Hasenfratz et al., 2019).
4.2 Implications for carbon storage
Although we cannot pinpoint which of the many processes discussed above was responsible for increased salinification and densification of SCW – some or all may have contributed – increased stratification of the glacial deep ocean may have played a role in enhancing ocean carbon storage and lowering atmospheric pCO2 concentrations (Adkins, 2013). Increased deep ocean stratification provides a physical mechanism by which sinking organic carbon can be remineralised and accumulate in the deep sea. In the process, oxygen is consumed, nutrients are released, and total dissolved inorganic carbon (DIC) increases, although carbonate ion decreases. Several studies have reported an increase in deep-sea nutrients and lowered carbonate ion and oxygen concentrations in the deep Atlantic (e.g. Fig. 9e; Farmer et al., 2019; Lear et al., 2016; Lisiecki, 2014; Thomas et al., 2022) and Pacific (Diz et al., 2020; Peng et al., 2026; Qin et al., 2022) across the MPT.
Increased stratification of the deep ocean by itself is insufficient to increase deep-ocean carbon storage. Instead, enhanced storage requires a more efficient biological pump, whereby a greater proportion of nutrients in the deep ocean are regenerated through remineralisation of sinking organic matter rather than supplied as preformed nutrients during deep-water formation (Marinov et al., 2006, 2008; Sigman et al., 2010). The biological pump exports organic matter from the surface ocean that is remineralised at depth. In the Southern Ocean, biological export production is thought to have increased owing to iron fertilization from dust over the MPT (Martínez-Garcia et al., 2011). The return of deep water towards the surface in the upwelling region of the Antarctic Circumpolar Current (ACC) ventilates the deep ocean through gas exchange in the Southern Ocean. This surface/deep exchange of water was reduced (“isolated”) during glacial periods because of a strengthened halocline and reduced upwelling (Sigman et al., 2021). At Site 1094 across the MPT, Hasenfratz et al. (2019) suggested a reduction in deep water supply to the surface and a concomitant freshening of surface waters that strengthened the halocline, thereby reducing carbon dioxide release to the atmosphere. The strength of the Westerlies and ACC are also important for the upwelling of deep-water masses from the ocean interior in the Antarctic Zone, although changes may be asynchronous in different sectors of the Southern Ocean (Lamy et al., 2024; Sun et al., 2016).
Most hypotheses and models to explain the MPT invoke a glacial atmospheric pCO2 decline to promote the growth of larger ice sheets; indeed, it is difficult to explain the MPT without this radiative cooling especially in the tropics (Herbert, 2023). Some studies have indicated a modest drop (∼ 20 ppm) in concentrations of glacial atmospheric pCO2 across the MPT (Chalk et al., 2017; Higgins et al., 2015; Hönisch et al., 2009; Yan et al., 2019) (Fig. 9f), whereas others have found no mean change (Marks-Peterson et al., 2026). Our findings are also broadly consistent with recent modelling simulations suggesting that declining atmospheric pCO2 and sea-level change may have triggered a threshold response of the Antarctic Ice Sheet, resulting in enhanced coupling between Antarctic ice-sheet variability, atmospheric pCO2 and Northern Hemisphere glaciation following the MPT (Yun and Timmermann, 2026).
4.3 Mean Deep Ocean Temperature
A critical question for the MPT is by how much and how fast did global deep ocean temperature and ice volume change? Global stacking of mean deep ocean temperature and δ18Oseawater records (derived from paired benthic –δ18O) can address this question and be compared to other more indirect approaches of estimating temperature and ice volume changes from benthic δ18O records. Although only 5 long records of tandem benthic δ18O– measurements exist spanning the last 1.5 Myr, we stacked the records first with equal weighting to reconstruct global records and then weighted by the volumes of different ocean basins (Lisiecki and Stern, 2016) (Sect. 2.6) to better estimate global averages. Whereas the unweighted glacial MDOT record shows a slight decrease after ∼ 900 ka, it is biased by the cooling of the deep Atlantic at Site 607 (Fig. S12c). Considering the much smaller volume of the deep North Atlantic compared to the deep Pacific, the volume-weighted MDOT stack is more representative and shows minimal change across the MPT (Fig. 8c).
We compare our stacked volume-weighted MDOT record with similar estimates derived by other methods. Rohling et al. (2021) (R21) calculated deep-sea temperatures (DST) using benthic δ18O and estimates of δ18Oseawater from sea level reconstructions. Our MDOT reconstruction agrees well with R21 before ∼ 1200 ka, although after ∼ 1200 ka R21 exhibits larger-amplitude changes (Fig. 10a). Neither record shows substantial cooling of deep ocean temperatures across the MPT. Chandler and Langebroek (2024) similarly used benthic δ18O, and sea level reconstructions to estimate changes in mean Circumpolar Deep Water temperature (MCDWT) for the past 800 ka, including Sites 1123 and 1094 but using slightly different calibrations than this study (Fig. 10b). For the last 800 kyr, our MDOT agrees well with MCDWT, indicating the slightly different approaches yield similar results. Lastly, we compare our MDOT estimates with changes in mean ocean temperature (MOT) reconstructed using noble gas () from the EPICA ice core (Grimmer et al., 2025) and shallow ice cores recovered from the Allan Hills blue ice area, Antarctica (Shackleton et al., 2026) (Fig. 10c). The latter likely records a weighted averaging of glacial and interglacial conditions. There is good agreement between the two, especially considering that our MDOT does not include the entire ocean recorded by noble gas MOT. Both records show little change in MDOT or MOT across the MPT (Shackleton et al., 2026).
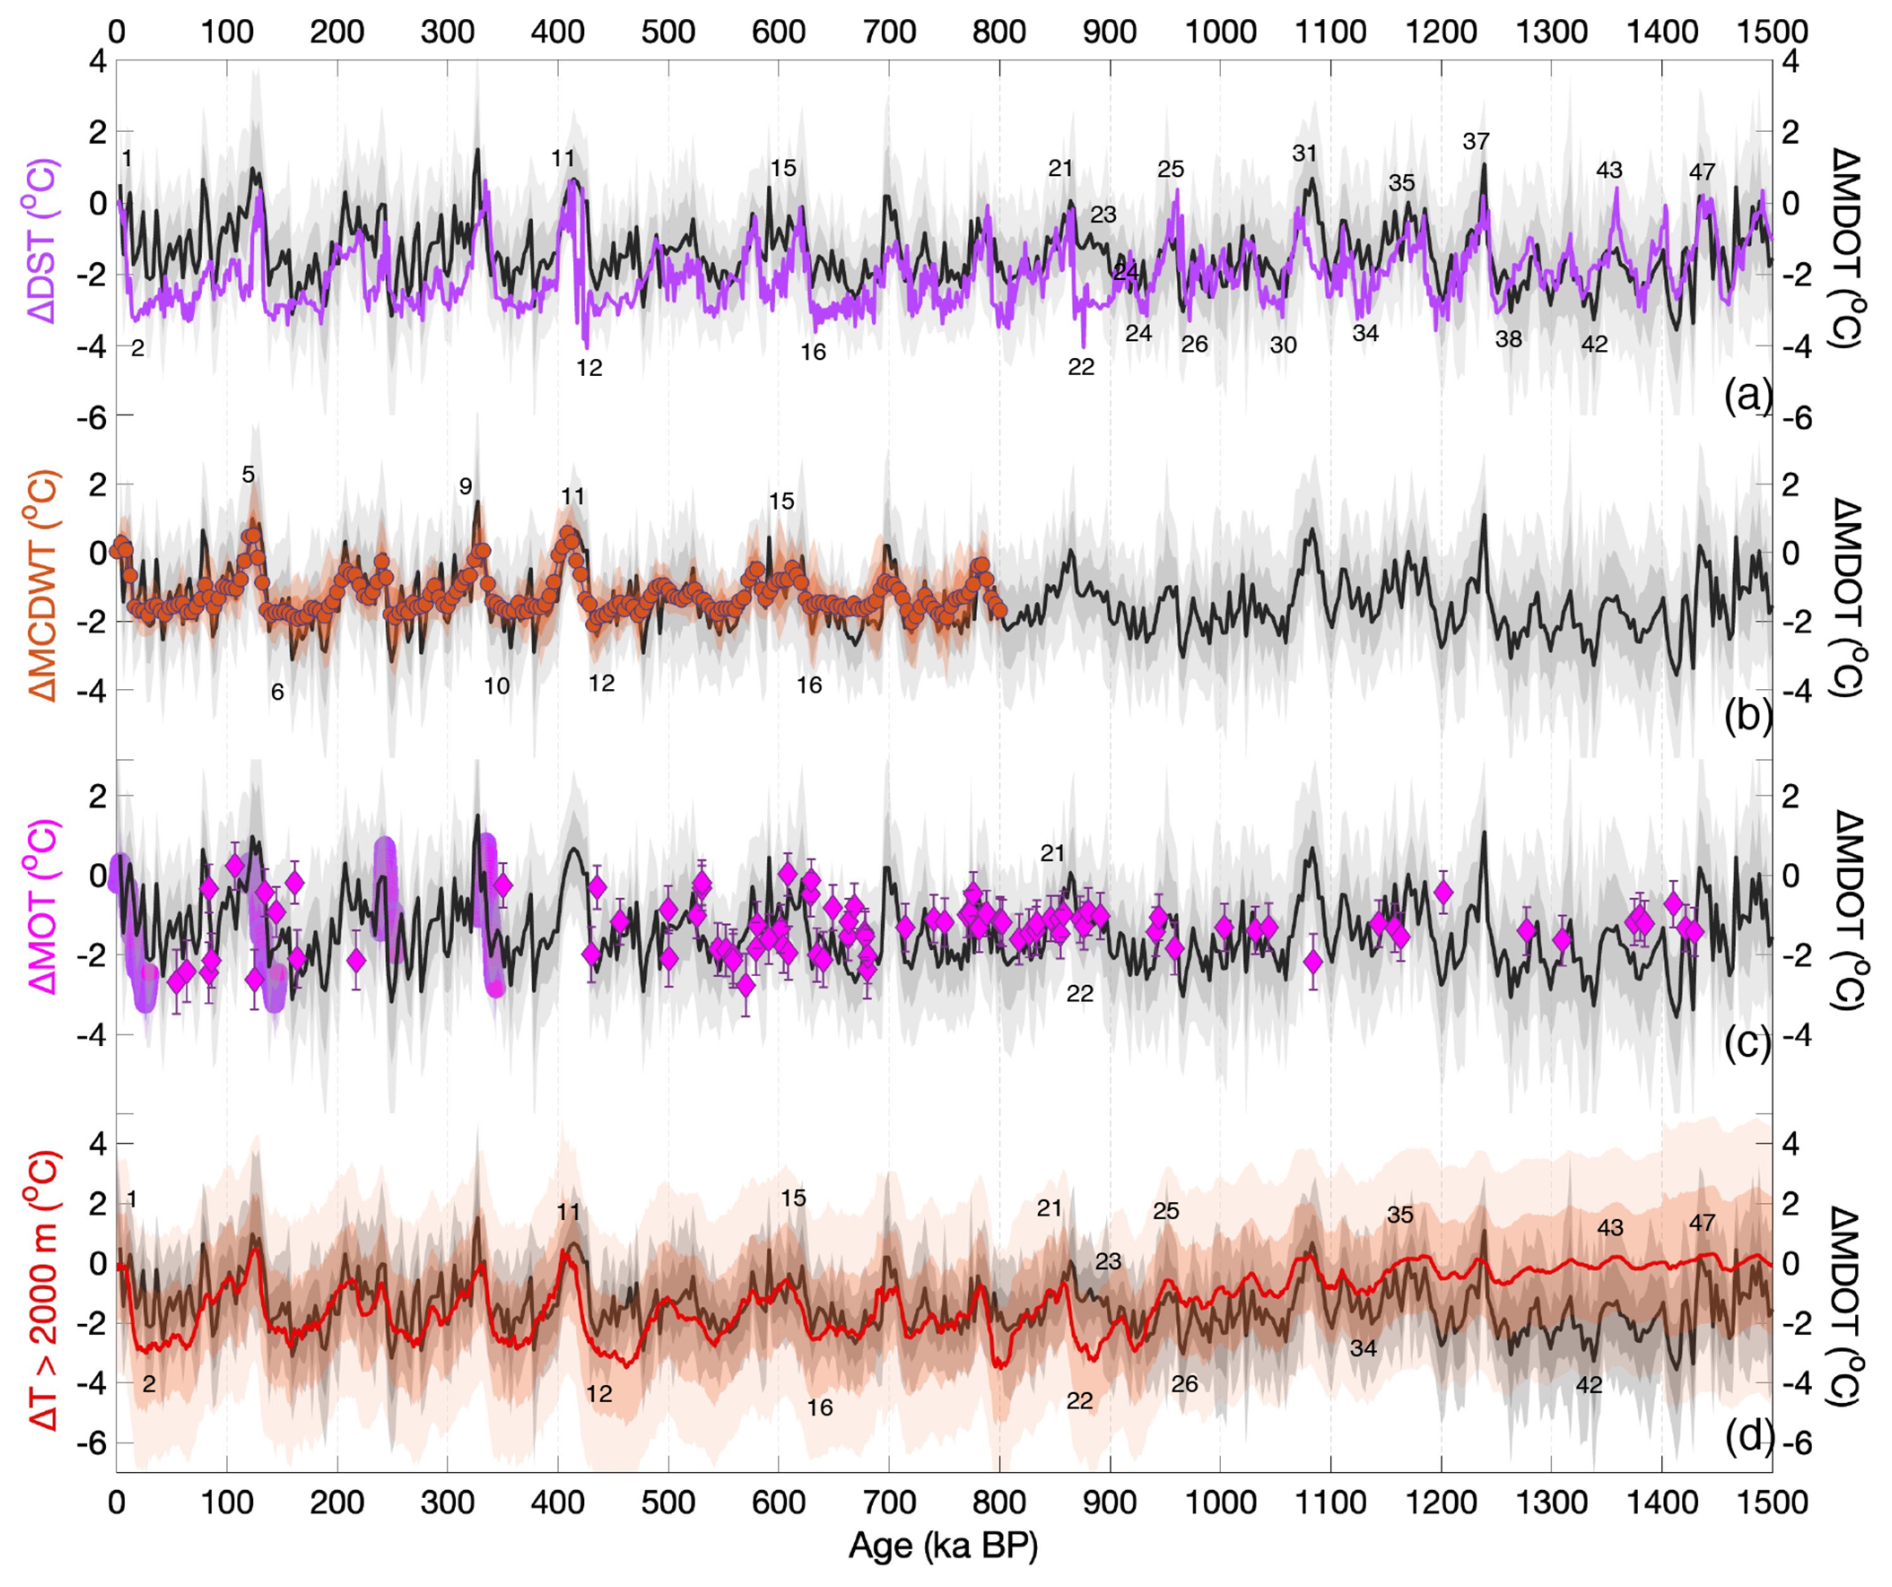
Figure 10Comparison of MDOT with similar mean ocean and deep-water temperature reconstructions. All panels show the change in volume-weighted MDOT (ΔMDOT) (this study; black line) relative to an average present day value (1.73 °C) versus: (a) the change in deep-sea temperature (ΔDST) estimated relative to the present (Rohling et al., 2021) (purple line); (b) the change in mean CDW temperature (ΔMCDWT) relative to present (Chandler and Langebroek, 2024) (dark orange circles); (c) the change in MOT (ΔMOT) derived from noble gas measurements in ice cores (Grimmer et al., 2025) (purple and pink circles) and, in Allan Hills blue ice (pink diamonds) (Shackleton et al., 2026), error bars on individual MOT estimates represent absolute uncertainties; and, (d) ΔMOT inferred from ΔGMSST and proxy-based deep-water temperature (Clark et al., 2025a) (red), with both records referenced to the Early Holocene (0 °C at 10 ka) and offset by −1.73 °C following (Clark et al., 2025a). Dark and light shading of the same colour represent 1σ and 2σ uncertainty envelopes, respectively. Uncertainties associated with ΔMOT are taken directly from the published datasets of Clark et al. (2025a). MIS numbers mark many of the glacial (even) and interglacial (odd) stages.
The central estimates of both our MDOT and noble-gas MOT reconstructions (Shackleton et al., 2026) differ from the ΔGMSST-derived deep ocean temperature reconstruction of Clark et al. (2025a) prior to and across the MPT, particularly through MIS 22 (Fig. 10d). Although the uncertainty envelopes of these independent reconstructions overlap, they differ in the pattern of reconstructed deep-ocean temperature variability, including its amplitude and evolution through time. In particular, the Clark et al. (2025a) ΔGMSST-derived reconstruction exhibits relatively little glacial-interglacial variability in the earlier part of the record prior to MIS 26 (∼ 960 ka), reflecting differences in the approaches used to estimate MOT. The ΔGMSST estimates are converted to ΔMOT using a non-constant ratio of ΔMOT ΔGMSST over the MPT. For the period from 1.5 to ∼ 0.9 Ma, these estimates give warmer deep-water temperatures relative to our study, followed by a marked cooling in deep ocean temperature (> 2000 m) at ∼ 900 ka (Fig. 10d). The Clark et al. (2025a) compilation is strongly biased towards the deep North Atlantic (predominantly Site 607) with comparatively sparse Pacific deep ocean temperature (> 2000 m) data over this interval (Clark et al., 2025a; Lear et al., 2003). Site U1385 does not show cooling between 1.5 to ∼ 0.9 Ma, but the records from Site 607 show a ∼ 1.2 °C long term cooling trend, which is unlikely to represent a global mean change in deep-ocean temperature (Figs. 2b, 3b, c, 5b, S4a, and S8b, c; Sect. 3.1). Instead, our findings support previous interpretations for near-freezing glacial bottom water temperatures in the Pacific and the South Atlantic Southern Ocean throughout the period from 1.5 to ∼ 0.9 Ma, with no substantial change across the MPT (Elderfield et al., 2012; Ford and Raymo, 2020; Hasenfratz et al., 2019; Siddall et al., 2010) (Figs. 8c, S10c and S13c). These results appear to be consistent with recent ice core noble gas-based reconstructions of MOT (Shackleton et al., 2026) (Fig. 10c), but higher resolution MOT data are needed to capture the full amplitude of glacial-interglacial variations.
4.4 Mean δ18Oseawater and Ice Volume
Both weighted and unweighted mean ocean δ18Oseawater stacks were compiled and show a step-like increase across the MPT at 930 ka (Figs. 8b and S12b), supporting previous interpretations of increased continental ice volume during most glacial periods after ∼ 900 ka (Elderfield et al., 2012; Ford and Raymo, 2020). Our volume-weighted mean δ18Oseawater stack is consistent with process-based estimates of δ18Oseawater over the past 1.5 Myr (Rohling et al., 2021) (Fig. 11a) and with reconstructions of relative sea level (RSL) change for the past ∼ 500 ka (Grant et al., 2012, 2014) (Fig. 11b). However, our value for MIS 22 is considerably greater than R21. This is the result of a warming trend of MDOT from MIS 24 through MIS 22 that yields greater δ18Oseawater values when the signal is deconvolved from the benthic δ18O of calcite. While all records exhibit warming to varying degrees over this interval, the more prolonged warming in the Pacific records, particularly at Site 1208, has a greater influence on the basin-volume-weighted MDOT stack and therefore contributes to the discrepancy with R21.
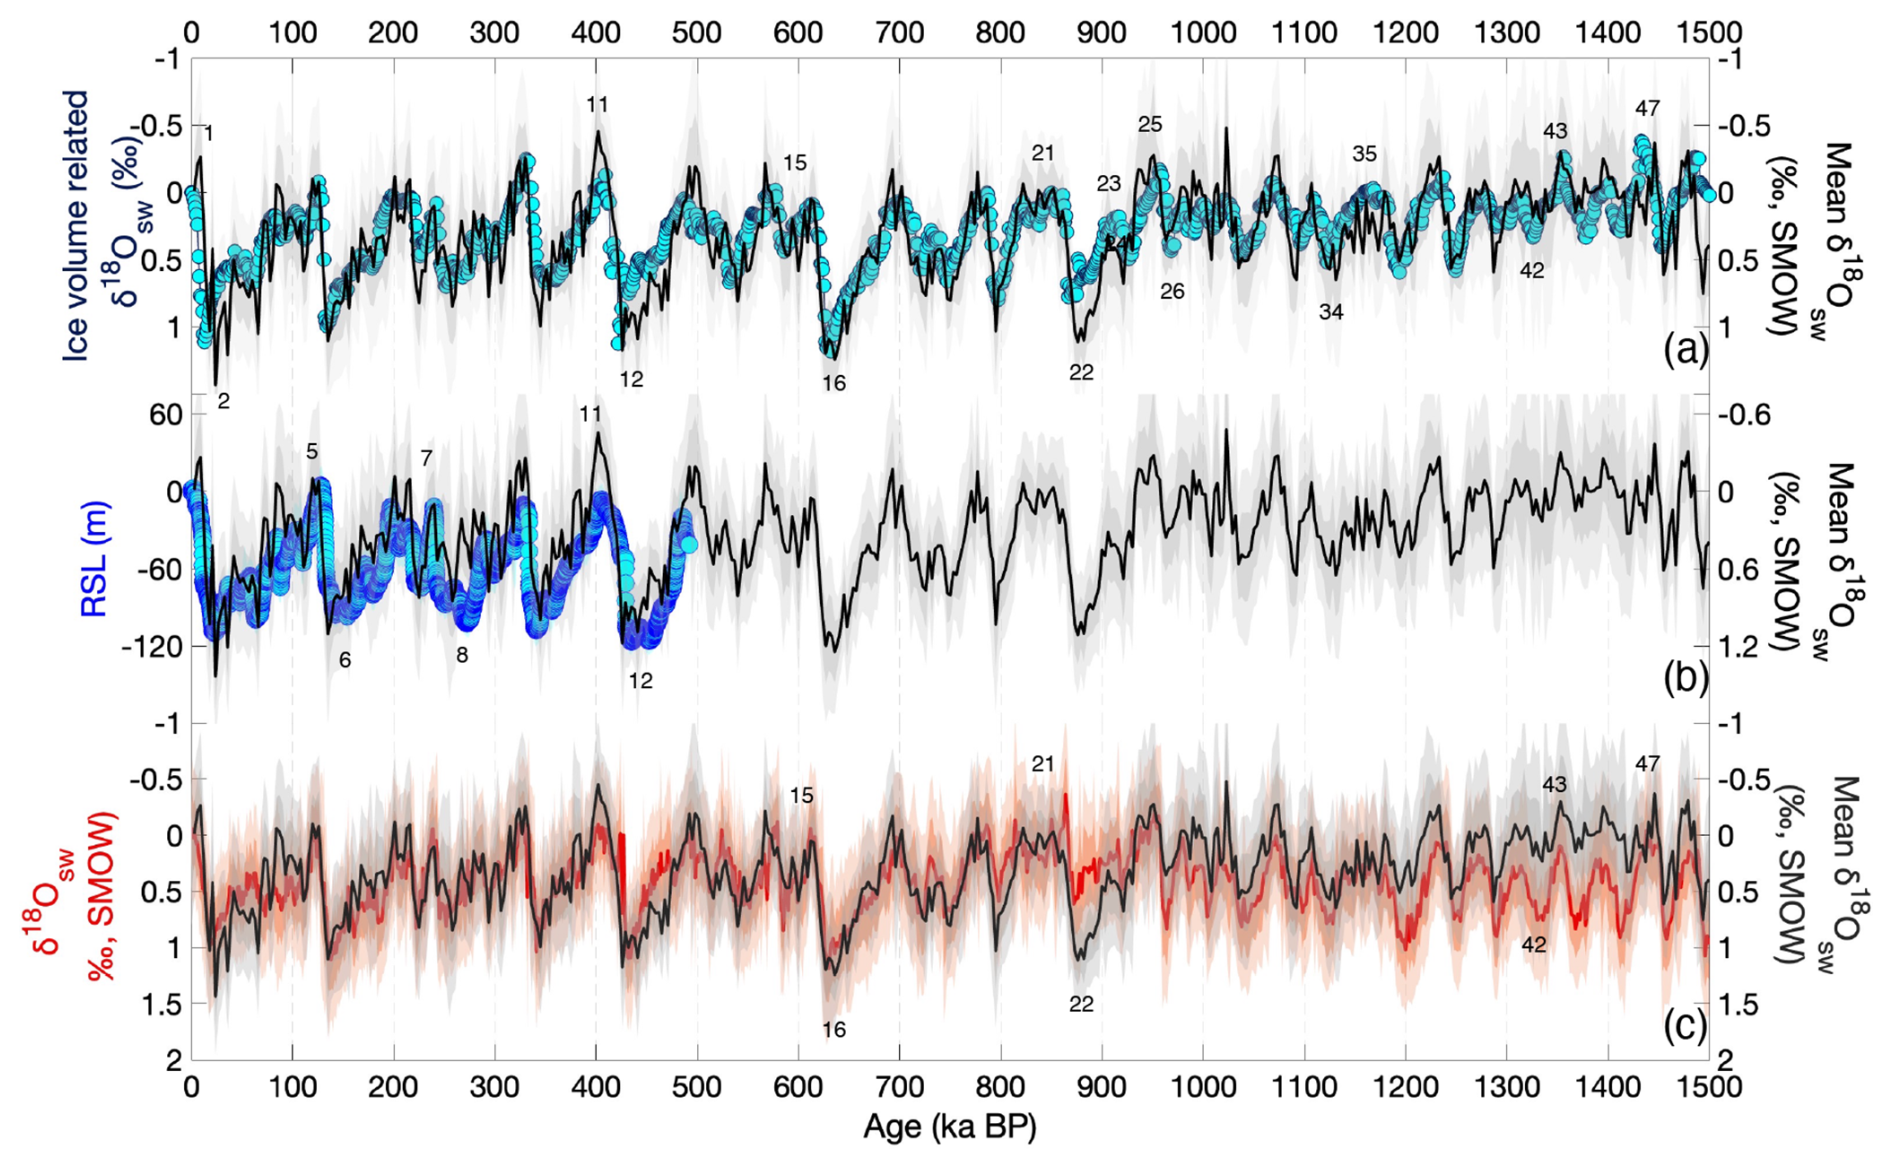
Figure 11Comparison of mean δ18Oseawater with similar process-based and relative sea level reconstructions. Volume-weighted mean δ18Oseawater stack shown in each panel (this study; black) is compared against: (a) process-based estimated ice-volume related deep-sea δ18Oseawater (Rohling et al., 2021) (light blue circles); (b) Red Sea relative sea level (RSL) reconstructions (Grant et al., 2012, 2014) (dark and light blue circles) scaled so that δ18Oseawater of 1.0 ‰ is equivalent to 10 m relative sea level; and, (c) δ18Oseawater derived from the deconvolution of the benthic δ18O Prob-stack using inferred changes in MOT (Clark et al., 2025a) (red). MIS numbers denote glacial (below) and interglacial (above) stages. Dark and light shading of the same colour represent 1σ and 2σ uncertainty envelopes, respectively. Uncertainties associated with δ18Oseawater are taken directly from the published datasets of Clark et al. (2025a).
Our results diverge from Clark et al. (2025a) in that our δ18Oseawater values are lower prior to the MPT, particularly in the interval older than 1200 kyr, suggesting less glacial ice volume before the MPT (Fig. 11c). Clark et al. (2025a) infer surprisingly large ice sheets before the MPT and relatively little change at ∼ 900 ka, which is contrary to our results and most previous studies (Bintanja and Van De Wal, 2008; Clark et al., 2006; Elderfield et al., 2012; Ford and Raymo, 2020; Rohling et al., 2021). The δ18Oseawater reconstruction of Clark et al. (2025a) incorporates the long-term benthic δ18O correction as originally proposed by Raymo et al. (2018) (0.083 ‰ Myr−1), but our reconstruction does not. This correction amounts to a maximum adjustment of ∼ 0.12 ‰ at 1.5 Ma, which is small relative to the propagated uncertainties of the two δ18Oseawater reconstructions and would increase divergence between them. The method of reconstruction used by Clark et al. (2025a) also discounts the temperature and δ18Oseawater records from Pacific Sites 1123 and 1208 (Elderfield et al., 2012; Ford and Raymo, 2020) claiming they are unrepresentative of global values and reflect regional hydrographic changes. While we agree there is a hydrographic (salinity) component to the increase in the glacial deep Pacific δ18Oseawater signal that exceeds the Atlantic signal, there is also a global increase in δ18Oseawater reflecting greater ice volume across the MPT.
4.5 Limitations and Future Opportunities
The small number of long, continuous benthic –δ18O records available across the MPT leads to questions about how well they represent basin-wide or global averages. Low abundance of preferred benthic foraminiferal taxa in some of the records results in time gaps where fewer than 5 sites are available for stacking. The water depths of the studied sites are all below 2500 m b.s.l. and a greater depth range would provide a better comparison with noble gas-based MOT estimates across the MPT (Shackleton et al., 2026). The temporal resolution is relatively low (3 kyr) and may not reflect the full amplitude of changes and certainly do not capture millennial-scale variability. Direct assessment of test preservation (e.g. using the Foraminiferal Preservation Index; Poirier et al., 2021), together with complementary measurements on the same samples, would help evaluate the extent to which dissolution may have influenced palaeotemperature reconstructions from different benthic foraminiferal species. The propagation of error when using paired benthic –δ18O to calculate the δ18Oseawater is fairly large (±0.24 ‰ for U. peregrina and ±0.16 ‰ for G. affinis (1σ), with the dominant contribution arising from temperature uncertainty). Using benthic foraminifera taxa with a greater sensitivity of to temperature could potentially reduce the errors (Yang et al., 2025).
The recent recognition that the time rate of change of benthic δ18O is a proxy for Earth's Energy Imbalance (EEI) offers the opportunity to investigate the processes that modify the global energy budget on long timescales (Shackleton et al., 2023). With more records, the derivative of the deconvolved stacks would permit separation of the sensible and latent heat components and provide valuable insight into how the Earth's energy balance changed during the MPT.
All of the points discussed above underscore the importance of acquiring additional paired benthic –δ18O records to improve the records presented herein. Furthermore, the proposed causes for the changes in deep-ocean stratification and their impact on deep-ocean carbon storage should be tested with numerical models.
The causes of the MPT have been sought since it was first recognized in oxygen isotope records over 50 years ago (Pisias and Moore, 1981; Shackleton and Opdyke, 1976). Our results are consistent with the view that the MPT involved a fundamental change in the interactions among deep-ocean circulation, atmospheric pCO2, and the cryosphere that permitted continental ice sheets to grow large enough to survive modest rises in summer insolation that would have resulted in deglaciation prior to the MPT (Ganopolski, 2024; Raymo et al., 1997; Willeit et al., 2019). Here we suggest that the MPT involved changes in the physical properties of the abyssal ocean, including a cooling of the deep North Atlantic and salinification of the deep water in the Pacific. This resulted in increased density stratification of the deep ocean in glacial periods after ∼ 900 ka.
Global ocean density stratification in much of the deep ocean (> 2000 m) is controlled by surface freshwater forcing in the Southern Ocean (Sun et al., 2016). We suggest that across the MPT, meltwater input to the marginal seas around Antarctica decreased and sea ice increased during glacial periods, resulting in formation of cold (near freezing), salty deep water. Increased deep ocean stratification provides a physical mechanism by which sinking organic carbon from the surface can accumulate in the deep sea, especially if accompanied by increased export production and surface stratification in the Southern Ocean. Many complementary studies support increased carbon storage in the deep Atlantic (e.g. Fig. 9e; Farmer et al., 2019; Lear et al., 2016; Lisiecki, 2014; Thomas et al., 2022) and Pacific (Diz et al., 2020; Peng et al., 2026; Qin et al., 2022) across the MPT, and some atmospheric pCO2 proxy records show a moderate decline in glacial atmospheric concentrations (Chalk et al., 2017; Higgins et al., 2015; Hönisch et al., 2009; Yan et al., 2019). Forthcoming analyses of the newly recovered continuous Antarctic ice core spanning the MPT (Wolff et al., 2022) will provide critical information on changes in greenhouse gases and MOT, which are needed to test many of the inferences made herein.
All data, not previously reported, have been deposited at the World Data Center PANGAEA repository and are available at https://doi.org/10.1594/PANGAEA.980075 (Thomas et al., 2026). Previously reported benthic δ18O for IODP Site U1385 (Hodell et al., 2023b) are archived at https://doi.org/10.1594/PANGAEA.951401.
The supplement related to this article is available online at https://doi.org/10.5194/cp-22-1559-2026-supplement.
Conceptualization: DAH conceived the study, led its design, and collected the samples; NCT co-designed the study: NCT and MG processed and prepared the new dataset; NCT organised the complete dataset and associated metadata for analysis and archiving. Formal analysis: NCT and HLF applied statistical and computational methods to analyse the data and develop the stacked reconstructions. Funding acquisition: DAH. Investigation: NCT and MG, collected new trace element data from Site U1385; NCT and DAH generated the stable isotope data; all authors contributed to data analysis. Methodology: DAH and NCT. Project administration: NCT and DAH coordinated the research activities and workflow. Resources: DAH and MG provided laboratory facilities, materials and analytical support. Software: HLF and NCT implemented and executed the PSU Solver code. Visualization: NCT and DAH. Writing – original draft: NCT and DAH. Writing – review and editing: NCT, MG, HLF, and DAH.
At least one of the (co-)authors is a member of the editorial board of Climate of the Past. The peer-review process was guided by an independent editor, and the authors also have no other competing interests to declare.
Publisher's note: Copernicus Publications remains neutral with regard to jurisdictional claims made in the text, published maps, institutional affiliations, or any other geographical representation in this paper. The authors bear the ultimate responsibility for providing appropriate place names. Views expressed in the text are those of the authors and do not necessarily reflect the views of the publisher.
We thank all members of the Godwin laboratory for Palaeoclimate Research in the Department of Earth Sciences, University of Cambridge, UK for technical assistance, particularly: J. Booth and M. Mleneck-Vautravers for selection and preparation of samples for stable isotope analysis; J. Rolfe and J. Nicolson for performing stable isotope analyses; and J. Nicolson and M. Mleneck-Vautravers for also conducting much of the sample preparation and ICP-OES analyses for trace elements. We thank the International Ocean Discovery Program (IODP) for providing samples used in this research, and the crew and scientific and technical staff of the JOIDES Resolution during IODP Expedition 339 for making core recovery from Site U1385 possible. We also thank three anonymous reviewers for their insightful and constructive comments, which improved the clarity of our manuscript.
The Natural Environment Research Council (NERC) provided funding to DAH to collect IODP and JC089 samples and for all laboratory and analytical costs (NERC grant nos. NE/R000204/1 and NE/K005804/1) (to DAH). The U.S. National Science Foundation (grant no. OCE-1436014) (to HLF). NCT has been privately funded by R. M. Thomas.
This paper was edited by Lorraine Lisiecki and reviewed by three anonymous referees.
Adkins, J. F.: The role of deep ocean circulation in setting glacial climates, Paleoceanography, 28, 539–561, https://doi.org/10.1002/palo.20046, 2013.
Adkins, J. F., McIntyre, K. and Schrag, D. P.: The salinity, temperature, and δ18O of the glacial deep ocean. Science, 298, 1769–1773, https://doi.org/10.1126/science.1076252, 2002.
Ahn, S., Khider, D., Lisiecki, L. E., and Lawrence, C. E.: A probabilistic Pliocene–Pleistocene stack of benthic δ18O using a profile hidden Markov model, Dyn. Stat. Clim. Syst., 2, 1–16, https://doi.org/10.1093/climsys/dzx002, 2017.
An, Z., Zhou, W., Zhang, Z., Zhang, X., Liu, Z., Sun, Y., Clemens, S. C., Wu, L., Zhao, J., Shi, Z., Ma, X., Yan, H., Li, G., Cai, Y., Yu, J., Sun, Y., Li, S., Zhang, Y., Stepanek, C., Lohmann, G., Dong, G., Cheng, H., Liu, Y., Jin, Z., Li, T., Hao, Y., Lei, J., and Cai, W.: Mid-Pleistocene climate transition triggered by Antarctic Ice Sheet growth, Science, 385, 560–565, https://doi.org/10.1126/science.abn4861, 2024.
Barker, S., Greaves, M., and Elderfield, H.: A study of cleaning procedures used for foraminiferal paleothermometry, Geochem. Geophys. Geosyst., 4, 1–20, https://doi.org/10.1029/2003GC000559, 2003.
Barrientos, N., Lear, C. H., Jakobsson, M., Stranne, C., O'Regan, M., Cronin, T. M., Gukov, A. Y., and Coxall, H. K.: Arctic Ocean benthic foraminifera Mg/Ca ratios and global Mg/Ca-temperature calibrations: New constraints at low temperatures, Geochim. Cosmochim. Ac., 236, 240–259, https://doi.org/10.1016/j.gca.2018.02.036, 2018.
Basak, C., Kapuge, A. K. I. U., Farmer, J. R., Symes, E., Middleton, J. L., Gottschalk, J., Arz, H. W., Lamy, F., Winckler, G., and Cruz, A. P. S.: Southern Hemisphere initiation of the mid-Pleistocene transition, Sci. Adv., 12, https://doi.org/10.1126/sciadv.aea6811, 2026.
Bereiter, B., Eggleston, S., Schmitt, J., Nehrbass-Ahles, C., Stocker, T. F., Fischer, H., Kipfstuhl, S., and Chappellaz, J.: Revision of the EPICA Dome C CO2 record from 800 to 600 kyr before present, Geophys. Res. Lett., 42, 542–549, https://doi.org/10.1002/2014GL061957, 2015.
Berends, C. J., Köhler, P., Lourens, L. J., and van de Wal, R. S. W.: On the cause of the mid-Pleistocene transition, Rev. Geophys., 59, 1–20, https://doi.org/10.1029/2020RG000727, 2021a.
Berends, C. J., de Boer, B., and van de Wal, R. S. W.: Reconstructing the evolution of ice sheets, sea level, and atmospheric CO2 during the past 3.6 million years, Clim. Past, 17, 361–377, https://doi.org/10.5194/cp-17-361-2021, 2021b.
Berger, A., Li, X. S., and Loutre, M. F.: Modelling Northern Hemisphere ice volume over the last 3 Ma, Quat. Sci. Rev., 18, 1–11, https://doi.org/10.1016/S0277-3791(98)00033-X, 1999.
Billups, K., York, K., and Bradtmiller, L. I.: Water column stratification in the Antarctic Zone of the Southern Ocean during the Mid-Pleistocene Climate Transition, Paleoceanogr. Paleoclimatol., 33, 432–442, https://doi.org/10.1029/2018PA003327, 2018.
Bintanja, R. and van de Wal, R. S. W.: North American ice-sheet dynamics and the onset of 100 000-year glacial cycles, Nature, 454, 869–872, https://doi.org/10.1038/nature07158, 2008.
Birner, B., Hodell, D. A., Tzedakis, P. C., and Skinner, L. C.: Similar millennial climate variability on the Iberian Margin during two early Pleistocene glacials and MIS 3, Paleoceanography, 31, 203–217, https://doi.org/10.1002/2015PA002868, 2016.
Boiteau, R., Greaves, M., and Elderfield, H.: Authigenic uranium in foraminiferal coatings: A proxy for ocean redox chemistry, Paleoceanography, 27, 1–8, https://doi.org/10.1029/2012PA002335, 2012.
Broecker, W. S. and Peng, T. H.: Tracers in the sea, Eldigio Press, Palisades, N.Y., https://search.worldcat.org/title/Tracers-in-the-sea/oclc/803229079 (last access: 13 August 2026), 1982.
Broecker, W. S. and Peng, T.-H. (Eds): Greenhouse Puzzles: Keeling's world, Martin's world, Walker's world, 2nd edn., Eldigio Press, Palisades, N.Y., https://search.worldcat.org/title/43531254?oclcNum=43531254 (last access: 13 August 2026), 1998.
Butcher, S., King, T., and Zalewski, L., Apocrita – High Performance Computing Cluster for Queen Mary University of London: London, Queen Mary University of London Technical Report, 2 pp., https://doi.org/10.5281/zenodo.438045, 2017.
Chalk, T. B., Hain, M. P., Foster, G. L., Rohling, E. J., Sexton, P. F., Badger, M. P. S., Cherry, S. G., Hasenfratz, A. P., Haug, G. H., Jaccard, S. L., Martínez-García, A., Pälike, H., Pancost, R. D., and Wilson, P. A.: Causes of ice age intensification across the Mid-Pleistocene Transition, Proc. Natl. Acad. Sci., 114, 13114–13119, https://doi.org/10.1073/pnas.1702143114, 2017.
Chalk, T. B., Foster, G. L., and Wilson, P. A.: Dynamic storage of glacial CO2 in the Atlantic Ocean revealed by boron [CO] and pH records, Earth Planet. Sci. Lett., 510, 1–11, https://doi.org/10.1016/j.epsl.2018.12.022, 2019.
Chandler, D. M. and Langebroek, P. M.: Glacial-interglacial Circumpolar Deep Water temperatures during the last 800 000 years: estimates from a synthesis of bottom water temperature reconstructions, Clim. Past, 20, 2055–2080, https://doi.org/10.5194/cp-20-2055-2024, 2024.
Chandler, M., Zilberman, N. V, and Sprintall, J.: The Deep Western Boundary Current of the Southwest Pacific Basin: insights from DeepArgo, J. Geophys. Res.-Ocean., 129, https://doi.org/10.1029/2024JC021098, 2024.
Clark, P. U. and Pollard, D.: Origin of the Middle Pleistocene Transition by ice sheet erosion of regolith, Paleoceanography, 13, 1–9, https://doi.org/10.1029/97PA02660, 1998.
Clark, P. U., Archer, D., Pollard, D., Blum, J. D., Rial, J. A., Brovkin, V., Mix, A. C., Pisias, N. G., and Roy, M.: The Middle Pleistocene Transition: characteristics, mechanisms, and implications for long-term changes in atmospheric pCO2, Quat. Sci. Rev., 25, 3150–3184, https://doi.org/10.1016/j.quascirev.2006.07.008, 2006.
Clark, P. U., Shakun, J. D., Rosenthal, Y., Köhler, P., and Bartlein, P. J.: Global and regional temperature change over the past 4.5 million years, Science, 383, 884–890, https://doi.org/10.1126/science.adi1908, 2024.
Clark, P. U., Shakun, J. D., Rosenthal, Y., Zhu, C., Bartlein, P. J., Gregory, J. M., Köhler, P., Liu, Z., and Schrag, D. P.: Mean ocean temperature change and decomposition of the benthic δ18O record over the past 4.5 million years, Clim. Past, 21, 973–1000, https://doi.org/10.5194/cp-21-973-2025, 2025a.
Clark, P. U., Shakun, J. D., Rosenthal, Y., Pollard, D., Hostetler, S. W., Köhler, P., Bartlein, P. J., Gregory, J. M., Zhu, C., Schrag, D. P., Liu, Z., and Pisias, N. G.: Global mean sea level over the past 4.5 million years, Science, 390, 260–271, https://doi.org/10.1126/science.adv8389, 2025b.
de Lange, G. J., van Os, B., and Poorter, R.: Geochemical composition and inferred accretion rates of sediments and managanese nodules from a submarine hill in the Madeira Abyssal Plain, eastern North Atlantic, Mar. Geol., 109, 171–194, https://doi.org/10.1016/0025-3227(92)90227-9, 1992.
de Villiers, S., Greaves, M., and Elderfield, H.: An intensity ratio calibration method for the accurate determination of and of marine carbonates by ICP-AES, Geochem. Geophys. Geosyst., 3, https://doi.org/10.1029/2001GC000169, 2002.
Diz, P., Cobelo-García, A., Hernández-Almeida, I., Corbí, H., and Bernasconi, S. M.: Persistent East Equatorial Pacific carbon storage at the Middle Pleistocene Transition, Paleoceanogr. Paleoclimatol., 35, https://doi.org/10.1029/2019PA003789, 2020.
Dyez, K. A., Hönisch, B., and Schmidt, G. A.: Early Pleistocene obliquity-scale pCO2 variability at ∼ 1.5 million years ago, Paleoceanogr. Paleoclimatol., 33, 1270–1291, https://doi.org/10.1029/2018PA003349, 2018.
Elderfield, H., Yu, J., Anand, P., Kiefer, T., and Nyland, B.: Calibrations for benthic foraminiferal paleothermometry and the carbonate ion hypothesis, Earth Planet. Sci. Lett., 250, 633–649, https://doi.org/10.1016/j.epsl.2006.07.041, 2006.
Elderfield, H., Greaves, M., Barker, S., Hall, I. R., Tripati, A., Ferretti, P., Crowhurst, S., Booth, L., and Daunt, C.: A record of bottom water temperature and seawater δ18O for the Southern Ocean over the past 440 kyr based on of benthic foraminiferal Uvigerina spp., Quat. Sci. Rev., 29, 160–169, https://doi.org/10.1016/j.quascirev.2009.07.013, 2010.
Elderfield, H., Ferretti, P., Greaves, M., Crowhurst, S. J., McCave, I. N., Hodell, D., and Piotrowski, A. M.: Evolution of ocean temperature and ice volume through the Mid-Pleistocene Climate Transition, Science, 337, 704–709, https://doi.org/10.1126/science.1221294, 2012.
Farmer, J. R., Hönisch, B., Haynes, L. L., Kroon, D., Jung, S., Ford, H. L., Raymo, M. E., Jaume-Seguí, M., Bell, D. B., Goldstein, S. L., Pena, L. D., Yehudai, M., and Kim, J.: Deep Atlantic Ocean carbon storage and the rise of 100 000-year glacial cycles, Nat. Geosci., 12, 350–360, https://doi.org/10.1038/s41561-019-0334-6, 2019.
Ferrari, R., Jansen, M. F., Adkins, J. F., Burke, A., Stewart, A. L., and Thompson, A. F.: Antarctic sea ice control on ocean circulation in present and glacial climates, Proc. Natl. Acad. Sci. USA, 111, 8753–8758, https://doi.org/10.1073/pnas.1323922111, 2014.
Ford, H. L. and Raymo, M. E.: Regional and global signals in seawater δ18O records across the Mid-Pleistocene Transition, Geology, 48, 113–117, https://doi.org/10.1130/G46546.1, 2020.
Ford, H. L., Sosdian, S. M., Rosenthal, Y., and Raymo, M. E.: Gradual and abrupt changes during the Mid-Pleistocene Transition, Quat. Sci. Rev., 148, 222–233, https://doi.org/10.1016/j.quascirev.2016.07.005, 2016.
Frew, R. D., Dennis, P. F., Heywood, K. J., Meredith, M. P., and Boswell, S. M.: The oxygen isotope composition of water masses in the northern North Atlantic, Deep-Sea Res. Oceanogr. Res. Pap., 47, 2265–2286, https://doi.org/10.1016/S0967-0637(00)00023-6, 2000.
Ganopolski, A.: Toward generalized Milankovitch theory (GMT), Clim. Past, 20, 151–185, https://doi.org/10.5194/cp-20-151-2024, 2024.
Gildor, H. and Tziperman, E.: Physical mechanisms behind biogeochemical glacial-interglacial CO2 variations, Geophys. Res. Lett., 28, 2421–2424, https://doi.org/10.1029/2000GL012571, 2001.
Grant, K. M., Rohling, E. J., Bar-Matthews, M., Ayalon, A., Medina-Elizalde, M., Ramsey, C. B., Satow, C., and Roberts, A. P.: Rapid coupling between ice volume and polar temperature over the past 150 000 years, Nature, 491, 744–747, https://doi.org/10.1038/nature11593, 2012.
Grant, K. M., Rohling, E. J., Bronk Ramsey, C., Cheng, H., Edwards, R. L., Florindo, F., Heslop, D., Marra, F., Roberts, A. P., Tamisiea, M. E., and Williams, F.: Sea-level variability over five glacial cycles, Nat. Commun., 5, https://doi.org/10.1038/ncomms6076, 2014.
Greaves, M., Caillon, N., Rebaubier, H., Bartoli, G., Bohaty, S., Cacho, I., Clarke, L., Cooper, M., Daunt, C., Delaney, M., DeMenocal, P., Dutton, A., Eggins, S., Elderfield, H., Garbe-Schoenberg, D., Goddard, E., Green, D., Groeneveld, J., Hastings, D., Hathorne, E., Kimoto, K., Klinkhammer, G., Labeyrie, L., Lea, D. W., Marchitto, T., Martínez-Botí, M. A., Mortyn, P. G., Ni, Y., Nuernberg, D., Paradis, G., Pena, L., Quinn, T., Rosenthal, Y., Russel, A., Sagawa, T., Sosdian, S., Stott, L., Tachikawa, K., Tappa, E., Thunell, R., and Wilson, P. A.: Interlaboratory comparison study of calibration standards for foraminiferal thermometry, Geochem. Geophys. Geosyst., 9, 1–27, https://doi.org/10.1029/2008GC001974, 2008.
Greaves, M. J.: Trace Elements in Marine Biogenic Carbonates: Analysis and Application to Past Ocean Chemistry, PhD thesis, University of Southampton 194 pp., https://eprints.soton.ac.uk/63291/ (last access: 13 August 2026), 2008.
Grimmer, M., Baggenstos, D., Schmitt, J., Krauss, F., Shackleton, S., Severinghaus, J. P., and Fischer, H.: AMOC modulates ocean heat content during deglaciations, Geophys. Res. Lett., 52, 1–12, https://doi.org/10.1029/2024GL114415, 2025.
Hall, I. R., McCave, I. N., Shackleton, N. J., Weedon, G. P., and Harris, S. E.: Intensified deep Pacific inflow and ventilation in Pleistocene glacial times, Nature, 412, 809–812, https://doi.org/10.1038/35090552, 2001.
Hasenfratz, A. P., Martínez-García, A., Jaccard, S. L., Vance, D., Wälle, M., Greaves, M., and Haug, G. H.: Determination of the ratio in foraminiferal coatings: An approach to correct temperatures for Mn-rich contaminant phases, Earth Planet. Sci. Lett., 457, 335–347, https://doi.org/10.1016/j.epsl.2016.10.004, 2017.
Hasenfratz, A. P., Jaccard, S. L., Martínez-García, A., Sigman, D. M., Hodell, D. A., Vance, D., Bernasconi, S. M., Kleiven, H. (Kikki) F., Haumann, F. A., and Haug, G. H.: The residence time of Southern Ocean surface waters and the 100 000-year ice age cycle, Science, 363, 1080–1084, https://doi.org/10.1126/science.aat7067, 2019.
Herbert, T. D.: The Mid-Pleistocene Climate Transition, Annu. Rev. Earth Planet. Sci., 51, 389–418, https://doi.org/10.1146/annurev-earth-032320-104209, 2023.
Higgins, J. A., Kurbatov, A. V., Spaulding, N. E., Brook, E., Introne, D. S., Chimiak, L. M., Yan, Y., Mayewski, P. A., and Bender, M. L.: Atmospheric composition 1 million years ago from blue ice in the Allan Hills, Antarctica, Proc. Natl. Acad. Sci., 112, 6887–6891, https://doi.org/10.1073/pnas.1420232112, 2015.
Hines, S. K. V., Charles, C. D., Starr, A., Goldstein, S. L., Hemming, S. R., Hall, I. R., Lathika, N., Passacantando, M., and Bolge, L.: Revisiting the mid-Pleistocene transition ocean circulation crisis, Science, 386, 681–686, https://doi.org/10.1126/science.adn4154, 2024.
Hodell, D. A., Venz, K. A., Charles, C. D., and Ninnemann, U. S.: Pleistocene vertical carbon isotope and carbonate gradients in the South Atlantic sector of the Southern Ocean, Geochem. Geophys. Geosyst., 4, 1–19, https://doi.org/10.1029/2002GC000367, 2003.
Hodell, D. A., Elderfield, H., Greaves, M., McCave, I. N., Skinner, L., Thomas, A., and White, N.: The JC089 scientific party, JC089 cruise report – IODP site survey of the Shackleton sites, SW Iberian Margin, British Oceanographic Data Centre, https://www.bodc.ac.uk/resources/inventories/cruise_inventory/report/13392/ (last access: 13 August 2026), 2014.
Hodell, D., Lourens, L., Crowhurst, S., Konijnendijk, T., Tjallingii, R., Jimenez-Espejo, F., Skinner, L., Tzedakis, P. C., Abrantes, F., Acton, G. D., Alvarez Zarikian, C. A., Bahr, A., Balestra, B., Barranco, E. L., Carrara, G., Ducassou, E., Flood, R. D., Flores, J.-A., Furota, S., Grimalt, J., Grunert, P., Hernandez- Molina, J., Kim, J. K., Krissek, L. A., Kuroda, J., Li, B., Lofi, J., Margari, V., Martrat, B., Miller, M. D., Nanayama, F., Nishida, N., Richter, C., Rodrigues, T., Rodríguez-Tovar, F. J., Roque, A. C. F., Sanchez Goni, M. F., Sierro Sanchez, F. J., Singh, A. D., Sloss, C. R., Stow, D. A., Takashimizu, Y., Tzanova, A., Voelker, A., Xuan, C., and Williams, T.: A reference time scale for Site U1385 (Shackleton Site) on the SW Iberian Margin, Glob. Planet. Change, 133, 49–64, https://doi.org/10.1016/j.gloplacha.2015.07.002, 2015.
Hodell, D. A., Crowhurst, S. J., Lourens, L., Margari, V., Nicolson, J., Rolfe, J. E., Skinner, L. C., Thomas, N. C., Tzedakis, P. C., Mleneck-Vautravers, M. J., and Wolff, E. W.: A 1.5-million-year record of orbital and millennial climate variability in the North Atlantic, Clim. Past, 19, 607–636, https://doi.org/10.5194/cp-19-607-2023, 2023a.
Hodell, D. A., Crowhurst, S. J., Lourens, L. J., Margari, V., Nicolson, J., Rolfe, J. E., Skinner, L. C., Thomas, N. C., Tzedakis, P. C., Mleneck-Vautravers, M. J., and Wolff, E. W.: Benthic and planktonic oxygen and carbon isotopes and XRF data at IODP Site U1385 and core MD01-2444 from 0 to 1.5 Ma, PANGAEA [data set], https://doi.org/10.1594/PANGAEA.951401, 2023b.
Hodell, D. A., Abrantes, F., Alvarez Zarikian, C. A., Herbert, T. D., Du, M., Crowhurst, S. J., Mleneck-Vautravers, M., Rolfe, J. E., Chen, X., Brooks, H. L., Clark, W. B., Dauchy-Tric, L. F. B., Dos Santos Rocha, V., Flores, J. A., Hines, S. K. V., Huang, H. H. M., Ikeda, H., Kaboth-Bahr, S., Kuroda, J., Link, J. M., McManus, J. F., Mitsunaga, B. A., Yobo, L. N., Pallone, C. T., Pang, X., Péral, M. Y., Salgueiro, E., Sanchez, S., Verma, K., Wu, J., Xuan, C., Yu, J., Haygood, L. A., Liebrand, D., Magalhães, V., Alonso-Garcia, M., Duque-Castaño, M., Ferreira, F., Freitas, M., Cordeiro, L. G., Gil, I., González-Martín, M., Lopes, A., Lopes, C., Margari, V., Martín-García, L., Matos, L., Mega, A., Molina, G., Naughton, F., Oliveira, D., Rebotim, A., Rodrigues, T., Santana, A., Trejos-Tamayo, R., and Tzedakis, P. C.: Onset of millennial climate variability with the intensification of Northern Hemisphere glaciation, Science, 392, 57–62, https://doi.org/10.1126/science.ady7970, 2026.
Hoogakker, B., Elderfield, H., Oliver, K., and Crowhurst, S.: Benthic foraminiferal oxygen isotope offsets over the last glacial-interglacial cycle, Paleoceanography, 25, 1–11, https://doi.org/10.1029/2009PA001870, 2010.
Hönisch, B., Hemming, N. G., Archer, D., Siddall, M., and McManus, J. F.: Atmospheric carbon dioxide concentration across the Mid-Pleistocene Transition, Science, 324, 1551–1554, https://doi.org/10.1126/science.1171477, 2009.
Imbrie, J., Hays, J. D., Martinson, D. G., McIntyre, A., Mix, A. C., Morley, J. J., Pisias, N. G., Prell, W. L., and Shackleton, N. J.: The orbital theory of Pleistocene climate: support from a revised chronology of the marine δ18O record, in: Milankovitch and climate, Part 1, edited by: Berger, A. L., Imbrie, J., Hays, J., Kukla, G., Saltzman, B., D. Reidel Publishing Company, Dordrecht, 269–305, https://doi.org/10.1007/978-94-017-4841-4_11, 1984.
Insua, T. L., Spivach, A. J., Graham, D., D'Hondt, S., and Moran, K.: Reconstruction of Pacific Ocean bottom water salinity during the Last Glacial Maximum, Geophys. Res. Lett., 41, 2914–2920, https://doi.org/10.1002/2014GL059575, 2014.
Jaccard, S. L., Hayes, C. T., Martínez-García, A., Hodell, D. A., Anderson, R. F., Sigman, D. M., and Haug, G. H.: Two modes of change in Southern Ocean productivity over the past million years, Science, 339, 1419–1423, https://doi.org/10.1126/science.1227545, 2013.
Jansen, M. F.: Glacial ocean circulation and stratification explained by reduced atmospheric temperature, Proc. Natl. Acad. Sci. USA, 114, 45–50, https://doi.org/10.1073/pnas.1610438113, 2017.
Kim, H. and Timmermann, A.: Seawater oxygen isotopes as a tool for monitoring future meltwater from the Antarctic ice-sheet, Commun. Earth Environ., 5, 1–11, https://doi.org/10.1038/s43247-024-01514-4, 2024.
Kim, J., Goldstein, S. L., Pena, L. D., Jaume-Seguí, M., Knudson, K. P., Yehudai, M., and Bolge, L.: North Atlantic Deep Water during Pleistocene interglacials and glacials, Quat. Sci. Rev., 269, 1–19, https://doi.org/10.1016/j.quascirev.2021.107146, 2021.
Knorr, G., Barker, S., Zhang, X., Lohmann, G., Gong, X., Gierz, P., Stepanek, C., and Stap, L. B.: A salty deep ocean as a prerequisite for glacial termination, Nat. Geosci., 14, 930–936, https://doi.org/10.1038/s41561-021-00857-3, 2021.
Lamy, F., Winckler, G., Arz, H. W., Farmer, J. R., Gottschalk, J., Lembke-Jene, L., Middleton, J. L., van der Does, M., Tiedemann, R., Alvarez Zarikian, C., Basak, C., Brombacher, A., Dumm, L., Esper, O. M., Herbert, L. C., Iwasaki, S., Kreps, G., Lawson, V. J., Lo, L., Malinverno, E., Martinez-Garcia, A., Michel, E., Moretti, S., Moy, C. M., Ravelo, A. C., Riesselman, C. R., Saavedra-Pellitero, M., Sadatzki, H., Seo, I., Singh, R. K., Smith, R. A., Souza, A. L., Stoner, J. S., Toyos, M., de Oliveira, I. M. V. P., Wan, S., Wu, S., and Zhao, X.: Five million years of Antarctic Circumpolar Current strength variability, Nature, 627, 789–796, https://doi.org/10.1038/s41586-024-07143-3, 2024.
Lang, D. C., Bailey, I., Wilson, P. A., Chalk, T. B., Foster, G. L., and Gutjahr, M.: Incursions of southern-sourced water into the deep North Atlantic during late Pliocene glacial intensification, Nat. Geosci., 9, 375–379, https://doi.org/10.1038/ngeo2688, 2016.
Larsson, V. and Jung, S.: Persistent contamination in benthic-foraminifera-based thermometry using standard cleaning methods, Clim. Past, 21, 1871–1894, https://doi.org/10.5194/cp-21-1871-2025, 2025.
Lawrence, K. T., Herbert, T. D., Brown, C. M., Raymo, M. E., and Haywood, A. M.: High-amplitude variations in North Atlantic sea surface temperature during the early Pliocene warm period, Paleoceanography, 24, 1–15, https://doi.org/10.1029/2008PA001669, 2009.
Lear, C. H., Rosenthal, Y., and Wright, J. D.: The closing of a seaway: Ocean water masses and global climate change, Earth Planet. Sci. Lett., 210, 425–436, https://doi.org/10.1016/S0012-821X(03)00164-X, 2003.
Lear, C. H., Billups, K., Rickaby, R. E. M., Diester-Haass, L., Mawbey, E. M., and Sosdian, S. M.: Breathing more deeply: Deep ocean carbon storage during the mid-Pleistocene climate transition, Geology, 44, 1035–1038, https://doi.org/10.1130/G38636.1, 2016.
Legrain, E., Parrenin, F., and Capron, E.: A gradual change is more likely to have caused the Mid-Pleistocene Transition than an abrupt event, Commun. Earth Environ., 4, 1–10, 2023.
LeGrande, A. N. and Schmidt, G. A.: Global gridded data set of the oxygen isotopic composition in seawater, Geophys. Res. Lett., 33, L12604, https://doi.org/10.1029/2006GL026011, 2006.
Li, K., Tian, J., Zhao, N., Du, J., Liu, Z., Du, J., and Huang, E.: Stable Pacific deep circulation punctuated by episodic intensification during the Mid-Pleistocene Transition, Glob. Planet. Change, 257, https://doi.org/10.1016/j.gloplacha.2025.105229, 2026.
Liautaud, P.: Causes, evolution, and dynamics of ice ages in the last 3 million years, PhD thesis, Harvard University Graduate School of Arts and Sciences, https://nrs.harvard.edu/URN-3:HUL.INSTREPOS:37371116 (last access: 13 August 2026), 2021.
Liautaud, P. R., Hodell, D. A., and Huybers, P. J.: Detection of significant climatic precession variability in early Pleistocene glacial cycles, Earth Planet. Sci. Lett., 536, https://doi.org/10.17863/CAM.49020, 2020.
Lin, L., Khider, D., Lisiecki, L. E., and Lawrence, C. E.: Probabilistic sequence alignment of stratigraphic records, Paleoceanography, 29, 976–989, https://doi.org/10.1002/2014PA002713, 2014.
Lisiecki, L. E.: Atlantic overturning responses to obliquity and precession over the last 3 Myr, Paleoceanography, 29, 71–86, https://doi.org/10.1002/2013PA002505, 2014.
Lisiecki, L. E. and Raymo, M. E.: A Pliocene-Pleistocene stack of 57 globally distributed benthic δ18O records, Paleoceanography, 20, PA1003, https://doi.org/10.1029/2004PA001071, 2005.
Lisiecki, L. E. and Stern, J. V.: Regional and global benthic δ18O stacks for the last glacial cycle, Paleoceanography, 31, 1368–1394, https://doi.org/10.1002/2016PA003002, 2016.
Liu, M. and Tanhua, T.: Water masses in the Atlantic Ocean: characteristics and distributions, Ocean Sci., 17, 463–486, https://doi.org/10.5194/os-17-463-2021, 2021.
Marinov, I., Gnanadesikan, A., Toggweiler, J. R., and Sarmiento, J. L.: The Southern Ocean biogeochemical divide, Nature, 441, 964–967, https://doi.org/10.1038/nature04883, 2006.
Marinov, I., Gnanadesikan, A., Sarmiento, J. L., Toggweiler, J. R., Follows, M., and Mignone, B. K.: Impact of oceanic circulation on biological carbon storage in the ocean and atmospheric pCO2, Global Biogeochem. Cycles, 22, 1–15, https://doi.org/10.1029/2007GB002958, 2008.
Marks-Peterson, J., Shackleton, S., Higgins, J., Severinghaus, J., Yan, Y., Buizert, C., Kalk, M., Beaudette, R., Hishamunda, V., Eves, D., Carter, A., Kurbatov, A., Epifanio, J., Morgan, J., Nesbitt, I., Bender, M., and Brook, E.: Broadly stable atmospheric CO2 and CH4 levels over the past 3 million years, Nature, 651, 647–651, https://doi.org/10.1038/s41586-025-10032-y, 2026.
Martínez-Garcia, A., Rosell-Melé, A., McClymont, E. L., Gersonde, R., and Haug, G. H.: Subpolar link to the emergence of the modern equatorial pacific cold tongue, Science, 328, 1550–1553, https://doi.org/10.1126/science.1184480, 2010.
Martínez-Garcia, A., Rosell-Melé, A., Jaccard, S. L., Geibert, W., Sigman, D. M., and Haug, G. H.: Southern Ocean dust-climate coupling over the past four million years, Nature, 476, 312–315, https://doi.org/10.1038/nature10310, 2011.
McClymont, E. L., Rosell-Melé, A., Haug, G. H., and Lloyd, J. M.: Expansion of subarctic water masses in the North Atlantic and Pacific oceans and implications for mid-Pleistocene ice sheet growth, Paleoceanography, 23, 1–12, https://doi.org/10.1029/2008PA001622, 2008.
McClymont, E. L., Sosdian, S. M., Rosell-Melé, A., and Rosenthal, Y.: Pleistocene sea-surface temperature evolution: Early cooling, delayed glacial intensification, and implications for the mid-Pleistocene climate transition, Earth-Sci. Rev., 123, 173–193, https://doi.org/10.1016/j.earscirev.2013.04.006, 2013.
McKay, R., Naish, T., Powell, R., Barrett, P., Scherer, R., Talarico, F., Kyle, P., Monien, D., Kuhn, G., Jackolski, C., and Williams, T.: Pleistocene variability of Antarctic Ice Sheet extent in the Ross Embayment, Quat. Sci. Rev., 34, 93–112, https://doi.org/10.1016/j.quascirev.2011.12.012, 2012.
Pena, L. D. and Goldstein, S. L.: Thermohaline circulation crisis and impacts during the mid-Pleistocene transition, Science, 345, 318–322, https://doi.org/10.1126/science.1249770, 2014.
Peng, Z., Wang, R., Xiao, W., Jin, X., Dang, H., Ye, S., Wu, L., Wang, X., Liu, F., and Dang, S.: Sustained increase in Southwest Pacific Antarctic Intermediate Water carbon storage across the Mid-Pleistocene Transition, Glob. Planet. Change, 262, https://doi.org/10.1016/j.gloplacha.2026.105470, 2026.
Pérez-Montero, S., Alvarez-Solas, J., Swierczek-Jereczek, J., Moreno-Parada, D., Robinson, A., and Montoya, M.: Exploring the Mid-Pleistocene transition with a simple physical model, Clim. Past, 22, 625–646, https://doi.org/10.5194/cp-22-625-2026, 2026.
Pisias, N. G. and Moore, T. C.: The evolution of Pleistocene climate: A timeseries approach, Earth Planet. Sci. Lett., 52, 450–458, https://doi.org/10.1016/0012-821X(81)90197-7, 1981.
Poirier, R. K., Gaetano, M. Q., Acevedo, K., Schaller, M. F., Raymo, M. E., and Kozdon, R.: Quantifying diagenesis, contributing factors, and resulting isotopic bias in benthic foraminifera using the Foraminiferal Preservation Index: Implications for geochemical proxy records, Paleoceanogr. Paleoclimatol., 36, https://doi.org/10.1029/2020PA004110, 2021.
Pöppelmeier, F., Blaser, P., Gutjahr, M., Jaccard, S. L., Frank, M., Max, L., and Lippold, J.: Northern-sourced water dominated the Atlantic Ocean during the Last Glacial Maximum, Geology, 48, 826–829, https://doi.org/10.1130/g47628.1, 2020.
Pöppelmeier, F., Lippold, J., Blaser, P., Gutjahr, M., Frank, M., and Stocker, T. F.: Neodymium isotopes as a paleo-water mass tracer: A model-data reassessment, Quat. Sci. Rev., 279, https://doi.org/10.1016/j.quascirev.2022.107404, 2022.
Qin, B., Jia, Q., Xiong, Z., Li, T., Algeo, T. J., and Dang, H.: Sustained deep Pacific carbon storage after the Mid-Pleistocene Transition linked to enhanced Southern Ocean stratification, Geophys. Res. Lett., 49, https://doi.org/10.1029/2021GL097121, 2022.
Raymo, M. E., Oppo, D. W., and Curry, W.: The mid-Pleistocene climate transition: A deep sea carbon isotopic perspective, Paleoceanography, 12, 546–559, https://doi.org/10.1029/97PA01019, 1997.
Raymo, M. E., Lisiecki, L. E., and Nisancioglu, K. H.: Plio-Pleistocene ice volume, Antarctic climate, and the global δ18O record, Science, 313, 492–495, https://doi.org/10.1126/science.1123296, 2006.
Raymo, M. E., Kozdon, R., Evans, D., Lisiecki, L., and Ford, H. L.: The accuracy of Mid-Pliocene δ18O-based ice volume and sea level reconstructions, Earth-Sci. Rev., 177, 291–302, https://doi.org/10.1016/j.earscirev.2017.11.022, 2018.
Rohling, E. J., Yu, J., Heslop, D., Foster, G. L., Opdyke, B., and Roberts, A. P.: Sea level and deep-sea temperature reconstructions suggest quasi-stable states and critical transitions over the past 40 million years, Sci. Adv., 7, 1–7, https://doi.org/10.1126/sciadv.abf5326, 2021.
Schlitzer, R.: Ocean Data View, http://odv.awi.de (last access: 7 July 2026), 2026.
Shackleton, N.: Oxygen Isotope Analyses and Pleistocene Temperatures Re-assessed, Nature, 215, 15–17, https://doi.org/10.1038/215015a0, 1967.
Shackleton, N. J.: The 100 000-year ice-age cycle identified and found to lag temperature, carbon dioxide, and orbital eccentricity, Science, 289, 1897–1902, https://doi.org/10.1126/science.289.5486.1897, 2000.
Shackleton, N. J. and Opdyke, N. D.: Oxygen isotope and palaeomagnetic stratigraphy of Equatorial Pacific core V28-238: Oxygen isotope temperatures and ice volumes on a 105 year and 106 year scale, Quat. Res., 3, 39–55, https://doi.org/10.1016/0033-5894(73)90052-5, 1973.
Shackleton, N. J. and Opdyke, N. D.: Oxygen-isotope and paleomagnetic stratigraphy of Pacific core V28-239 late Pliocene to latest Pleistocene, Mem. Geol. Soc. Am., 145, 449–464, https://doi.org/10.1130/MEM145-p449, 1976.
Shackleton, S., Seltzer, A., Baggenstos, D., and Lisiecki, L. E.: Benthic δ18O records Earth's energy imbalance, Nat. Geosci., 16, 797–802, https://doi.org/10.1038/s41561-023-01250-y, 2023.
Shackleton, S., Hishamunda, V., Yan, Y., Carter, A., Morgan, J., Severinghaus, J., Aarons, S., Marks-Peterson, J., Epifanio, J., Buizert, C., Brook, E., Kurbatov, A. V., Bender, M. L., and Higgins, J.: Global ocean heat content over the past 3 million years, Nature, 651, 653–657, https://doi.org/10.1038/s41586-026-10116-3, 2026.
Siddall, M., Hönisch, B., Waelbroeck, C., and Huybers, P.: Changes in deep Pacific temperature during the mid-Pleistocene transition and Quaternary, Quat. Sci. Rev., 29, 170–181, https://doi.org/10.1016/j.quascirev.2009.05.011, 2010.
Sigman, D. M., Hain, M. P., and Haug, G. H.: The polar ocean and glacial cycles in atmospheric CO2 concentration, Nature, 466, 47–55, https://doi.org/10.1038/nature09149, 2010.
Sigman, D. M., Fripiat, F., Studer, A. S., Kemeny, P. C., Martínez-García, A., Hain, M. P., Ai, X., Wang, X., Ren, H., and Haug, G. H.: The Southern Ocean during the ice ages: A review of the Antarctic surface isolation hypothesis, with comparison to the North Pacific, Quat. Sci. Rev., 254, 106732, https://doi.org/10.1016/j.quascirev.2020.106732, 2021.
Skinner, L. C. and Elderfield, H.: Rapid fluctuations in the deep North Atlantic heat budget during the last glacial period, Paleoceanography, 22, PA1205, https://doi.org/10.1029/2006PA001338, 2007.
Skinner, L. C., Shackleton, N. J., and Elderfield, H.: Millennial-scale variability of deep-water temperature and δ18Odw indicating deep-water source variations in the Northeast Atlantic, 0–34 cal. ka BP, Geochem. Geophys. Geosyst., 4, 1098, https://doi.org/10.1029/2003GC000585, 2003.
Skinner, L. C., Elderfield, H., and Hall, M.: Phasing of millennial climate events and Northeast Atlantic Deep-Water temperature change since 50 ka BP, in: Ocean Circulation: Mechanisms and Impacts – Past and Future Changes of Meridional Overturning, edited by: Schmittner, A., Chiang, J. C. H., and Hemming, S. R., American Geophysical Union, 197–208, https://doi.org/10.1029/173GM14, 2007.
Song, Z., Latif, M., Park, W., and Zhang, Y.: Southern Ocean influence on Atlantic Meridional Overturning Circulation across climate states, Nat. Commun., 16, https://doi.org/10.1038/s41467-025-64268-3, 2025.
Sosdian, S. and Rosenthal, Y.: Deep-sea temperature and ice volume changes across the Pliocene-Pleistocene climate transitions, Science, 325, 306–310, https://doi.org/10.1126/science.1169938, 2009.
Sosdian, S. and Rosenthal, Y.: Response to Comment on “Deep-sea temperature and ice volume changes across the Pliocene-Pleistocene climate transitions”, Science, 328, https://doi.org/10.1126/science.1186768, 2010.
Starr, A., Hall, I., Barker, S., Rackow, T., Zhang, X., Hemming, S., van der Lubbe, H., Knorr, G., Berke, M., Bigg, G. R., Cartagena-Sierra, A., Jiménez-Espejo, F. J., Gong, X., Gruetzner, J., Lathika, N., LeVay, L. J., Robinson, R. S., and Ziegler, M.: Antarctic icebergs reorganise ocean circulation during Pleistocene glacials, Nature, 589, 236–241, https://doi.org/10.1038/s41586-020-03094-7, 2021.
Sun, S., Eisenman, I., and Stewart, A. L.: The influence of Southern Ocean surface buoyancy forcing on glacial-interglacial changes in the global deep ocean stratification, Geophys. Res. Lett., 43, 8124–8132, https://doi.org/10.1002/2016GL070058, 2016.
Talley, L. D.: Closure of the global overturning circulation through the Indian, Pacific, and Southern Oceans: Schematics and transports., Oceanography, 26, 80–97, https://doi.org/10.5670/oceanog.2013.07, 2013.
Thirumalai, K., Quinn, T. M., and Marino, G.: Constraining past seawater δ18O and temperature records developed from foraminiferal geochemistry, Paleoceanography, 31, 1409–1422, https://doi.org/10.1002/2016PA002970, 2016.
Thomas, N. C., Bradbury, H. J., and Hodell, D. A.: Changes in North Atlantic deep-water oxygenation across the Middle Pleistocene Transition, Science, 377, 654–659, https://doi.org/10.1126/science.abj7761, 2022.
Thomas, N. C., Ford, H. L., Greaves, M., and Hodell, D. A.: IODP Site U1385 paired benthic δ18O and ratios for the past 1.5 Myr, and compiled North Atlantic, Pacific and Mean Deep Ocean stacks of reconstructed deep-water temperature and δ18Oseawater, PANGAEA [data set], https://doi.org/10.1594/PANGAEA.980075, 2026.
Toyota, T., Smith, I. J., Gough, A. J., Langhorne, P. J., Leonard, G. H., Van Hale, R. J., Mahoney, A. R., and Haskell, T. G.: Oxygen isotope fractionation during the freezing of sea water, J. Glaciol., 59, 697–710, https://doi.org/10.3189/2013JoG12J163, 2013.
van Dijk, I., Mouret, A., Oron, S., Evans, D., Boer, W., and Barras, C.: Species-specific offsets in manganese incorporation in hyaline foraminiferal calcite across a gradient of seawater [Mn], Geochem. Geophys. Geosyst., 26, 1–22, https://doi.org/10.1029/2025GC012363, 2025.
Waelbroeck, C., Labeyrie, L., Michel, E., Duplessy, J. C., McManus, J. F., Lambeck, K., Balbon, E., and Labracherie, M.: Sea-level and deep water temperature changes derived from benthic foraminifera isotopic records, Quat. Sci. Rev., 21, 295–305, https://doi.org/10.1016/S0277-3791(01)00101-9, 2002.
Weldeab, S., Arce, A., and Kasten, S.: -ΔCO-temperature calibration for Globobulimina spp.: A sensitive paleothermometer for deep-sea temperature reconstruction, Earth Planet. Sci. Lett., 438, 95–102, https://doi.org/10.1016/j.epsl.2016.01.009, 2016.
Willeit, M., Ganopolski, A., Calov, R., and Brovkin, V.: Mid-Pleistocene transition in glacial cycles explained by declining CO2 and regolith removal, Sci. Adv., 5, 1–9, https://doi.org/10.1126/sciadv.aav7337, 2019.
Williams, T. J., Piotrowski, A. M., Howe, J. N. W., Hillenbrand, C-D., Allen, C. S., and Clegg, J. A.: The role of ocean circulation and regolith removal in triggering the Mid-Pleistocene Transition: Insights from authigenic Nd isotopes, Quat. Sci. Rev., 345, 109055, https://doi.org/10.1016/j.quascirev.2024.109055, 2024.
Wirths, C., Hermant, A., Stepanek, C., Stocker, T. F., and Sutter, J. C. R.: Sequence of abrupt transitions in Antarctic drainage basins before and during the Mid-Pleistocene Transition, Nat. Commun., 16, 10391, https://doi.org/10.1038/s41467-025-65375-x, 2025.
Wolff, E. W., Fischer, H., van Ommen, T., and Hodell, D. A.: Stratigraphic templates for ice core records of the past 1.5 Myr, Clim. Past, 18, 1563–1577, https://doi.org/10.5194/cp-18-1563-2022, 2022.
Yan, Y., Bender, M. L., Brook, E. J., Clifford, H. M., Kemeny, P. C., Kurbatov, A. V., Mackay, S., Mayewski, P. A., Ng, J., Severinghaus, J. P., and Higgins, J. A.: Two-million-year-old snapshots of atmospheric gases from Antarctic ice, Nature, 574, 663–666, https://doi.org/10.1038/s41586-019-1692-3, 2019.
Yang, Z., Lear, C. H., Barker, S., Elsey, J., Gasson, E., Rosenthal, Y., Slater, S. M., and Thomas-Sparkes, A.: Major sea level fall during the Pliocene M2 glaciation, Nat. Commun., 16, 7641, https://doi.org/10.1038/s41467-025-62446-x, 2025.
Yehudai, M., Kim, J., Pena, L. D., Jaume-Segui, M., Knudson, K. P., Bolge, L., Malinverno, A., Bickert, T., and Goldstein, S. L.: Evidence for a Northern Hemispheric trigger of the 100 000-y glacial cyclicity, Proc. Natl. Acad. Sci. USA, 118, https://doi.org/10.1073/pnas.2020260118, 2021.
Yu, J. and Broecker, W. S.: Comment on “Deep-sea temperature and ice volume changes across the Pliocene-Pleistocene Climate Transitions”, Science, 328, 1480, https://doi.org/10.1126/science.1186544, 2010.
Yun, K. and Timmermann, A.: Increased sensitivity of the Antarctic Ice Sheet to decreasing CO2 across the Mid-Pleistocene Transition, Nat. Geosci., 19, 683–690, https://doi.org/10.1038/s41561-026-01979-2, 2026.
Zhao, N., Oppo, D. W., Huang, K. F., Howe, J. N. W., Blusztajn, J., and Keigwin, L. D.: Glacial–interglacial Nd isotope variability of North Atlantic Deep Water modulated by North American ice sheet, Nat. Commun., 10, 5773, https://doi.org/10.1038/s41467-019-13707-z, 2019.