
the Creative Commons Attribution 4.0 License.
the Creative Commons Attribution 4.0 License.
 | 08 Jul 2026
Correcting a systematic bias in an ocean drilling project site 882 alkenone sea surface temperature record
Rocío P. Caballero-Gill
Timothy D. Herbert
Harry J. Dowsett
Alfredo Martínez-García
Reconstructions of sea surface temperature (SST) in the geologic record are fundamental to our understanding of Earth's climate history and the evaluation of Earth's climate sensitivity to greenhouse gas forcing. SSTs are reconstructed with a variety of methods, including alkenone biomarker lipids produced by certain coccolithophore algae. One such alkenone SST reconstruction from the subpolar northwest Pacific Ocean Drilling Program (ODP) Site 882 (50.21° N, 167.35° E, 3244 m water depth) has played a large role in shaping the paleoclimate science community's view of global climate warmth during the Late Pliocene (3.6–2.6 million years ago) and the subsequent cooling that characterized the intensification of Northern Hemisphere Glaciation (Haug, 1995; Haug et al., 2005; Martínez-Garcia et al., 2010). First, we have found that the values reported in the PANGAEA archive for this ODP Site 882 alkenone dataset were inaccurately reported as values when they are instead (https://doi.org/10.1594/PANGAEA.315092, Haug and Sarnthein, 2005). This error in the archived data table resulted in the incorporation of inaccurate absolute SST estimates by several studies that applied calibrations to this ODP Site 882 dataset (e.g., Brennan et al., 2022; Clark et al., 2024, 2025; Tierney et al., 2019, 2025b). Second, using other published data from ODP Site 882 (Studer et al., 2012) and nearby Site 883 (51.11° N, 167.46° E, 2384 m water depth; Herbert et al., 2016; Novak et al., 2024), we show that the original Haug (1995) alkenone SST record at ODP Site 882 systematically reports an amplified range of absolute SST values compared to the more recently generated data. This observation is consistent with the known concentration-dependent biases of the gas chromatography chemical ionization mass spectrometry (GC-CI-MS) analytical method used by the original ODP Site 882 study (Chaler et al., 2000, 2003; Haug, 1995; Hefter, 2008; Rosell-Mele et al., 1995). These concentration-dependent analytical biases complicate applying a uniform correction to the entire Haug (1995) dataset. However, we are able to leverage the published datasets to propose a correction and quantification of uncertainty for a subset of the Haug (1995) dataset measured at similar on-column analyte abundance. For these samples, we find an average analytical uncertainty equivalent to ±2.05 °C, which is greater than and in addition to the typical ±1.4 °C 1σ prediction uncertainty of the sea surface temperature proxy. We then discuss the implications of the corrected dataset for our understanding of late Neogene and Quaternary climate in the Kuroshio Extension region.
- Article
(5080 KB) - Full-text XML
-
Supplement
(894 KB) - BibTeX
- EndNote


Paleoclimate data are the only means of evaluating the ability of Earth System Models to simulate warm climates under boundary conditions drastically different than those captured by the recent historical record (Tierney et al., 2020). Typically, this evaluation comes in the form of direct comparisons between model-simulated fields of sea surface temperature (SST) and geological proxy observations of SST (Haywood et al., 2016, 2020). These studies have identified shortcomings in climate model simulations, particularly the tendency of climate models to emulate a steeper latitudinal temperature gradient than is indicated by the geological data across several intervals of past warm climate (Burls et al., 2021; Haywood et al., 2016; Huber and Caballero, 2011).
Fundamentally, these data-model comparison efforts rely upon accurate geologic proxy SST estimates. One such proxy is alkenones – algal biomarkers made by certain coccolithophore algae that are sensitive to seawater temperature (Brassell et al., 1986; Marlowe et al., 1984, 1990). The alkenone paleothermometer is based upon the relative abundance of tri-unsaturated 37-carbon methyl alkenones (C37:3Me) and di-unsaturated 37-carbon methyl alkenones (C37:2Me), which form the ratio (Brassell et al., 1986; Prahl and Wakeham, 1987).
The relationship between the ratio and SST has been calibrated by longstanding efforts to analyse alkenones in marine surface sediments (Conte et al., 2006; Müller et al., 1998; Novak et al., 2022; Prahl et al., 2010; Rosell-Melé et al., 1995; Sikes et al., 1991; Tierney and Tingley, 2018). Alkenones are commonly measured by gas chromatograph flame ionization detector (GC-FID) (Longo et al., 2013; Villanueva et al., 1997; Villanueva and Grimalt, 1997; Zheng et al., 2017). A more sensitive gas chromatograph positive chemical ionization mass spectrometry technique has been used to determine the ratio in sediments with very low alkenone concentrations (Bendle and Rosell-Melé, 2004; Durham et al., 2001; Madureira et al., 1997; Martínez-Garcia et al., 2010; McClymont et al., 2008; McClymont and Rosell-Melé, 2005; Roberts et al., 2017; Rosell-Mele et al., 1995; Sánchez-Montes et al., 2020; Weaver et al., 1999). However, subsequent studies showed that this method and others based upon mass spectrometry can be hindered by complex concentration-dependent nonlinear effects on the ionization of alkenones that impact the C37:3Me and C37:2Me ketones differently (Chaler et al., 2000, 2003; Hefter, 2008), leading to systematic offsets in , and therefore reconstructed SSTs, from the two techniques. Resolving these method-dependent nonlinear differences between the GC-FID and GC-CI-MS methods requires instrument-specific calibration of GC-CI-MS values to those determined on GC-FID (Chaler et al., 2000, 2003; Hefter, 2008).
Intercomparison of paleo SST reconstructions can be further complicated by the history of the alkenone sea surface temperature proxy's development. While determinations of the index by GC-FID have long been the predominant method of alkenone-based SST reconstructions (van Dommelen et al., 2026; Harada et al., 2014; Herbert, 2003; Rostek et al., 1993), some have argued that the index, which incorporates the abundance of the tetra-unsaturated 37-carbon methyl alkenone (C37:4Me; Brassell et al., 1986), is more appropriate for estimating sea surface temperatures in high latitude regions (Ho et al., 2012; Rosell-Melé, 1998).
More recently, it has been shown that the C37:4Me alkenone can also be derived from haptophyte algae with a life habit dependent upon the presence of sea ice (Liao and Huang, 2022; Wang et al., 2021, 2024). These sea-ice-dependent algae, called the Group 2i Isochrysidales, are part of the sea-ice algal bloom that occurs during the cold season and have a markedly different and weaker relationship between alkenone unsaturation and algal growth temperature than the other Isochrysidales that bloom in open waters during warm seasons (Liao and Huang, 2022; Wang et al., 2021). The multiple potentiual sources of the C37:4Me alkenone complicate its interpretation in sedimentary records (Liao et al., 2023). Consequently, subsequent paleoclimate syntheses have elected to exclude alkenone SST records where the C37:4Me alkenone has been reported altogether to mitigate biases in inferred regional SST patterns due to the potential of multiple algal communities with different –temperature relationships contributing to sedimentary alkenone content (Judd et al., 2022; Osman et al., 2021).
Here, we revisit the 5.7-million-year (Ma) alkenone SST record from the subpolar northwest Pacific Ocean Drilling Program (ODP) Site 882 (Figs. 1 and 2), which was determined by the GC-CI-MS method (Haug, 1995). We demonstrate two interlinked and previously unquantified sources of error in the ODP Site 882 GC-CI-MS sea surface temperature record that have resulted in both inaccurate sea surface temperature estimates and a systematic underrepresentation of the uncertainties associated with the reported alkenone unsaturation index values in this record.
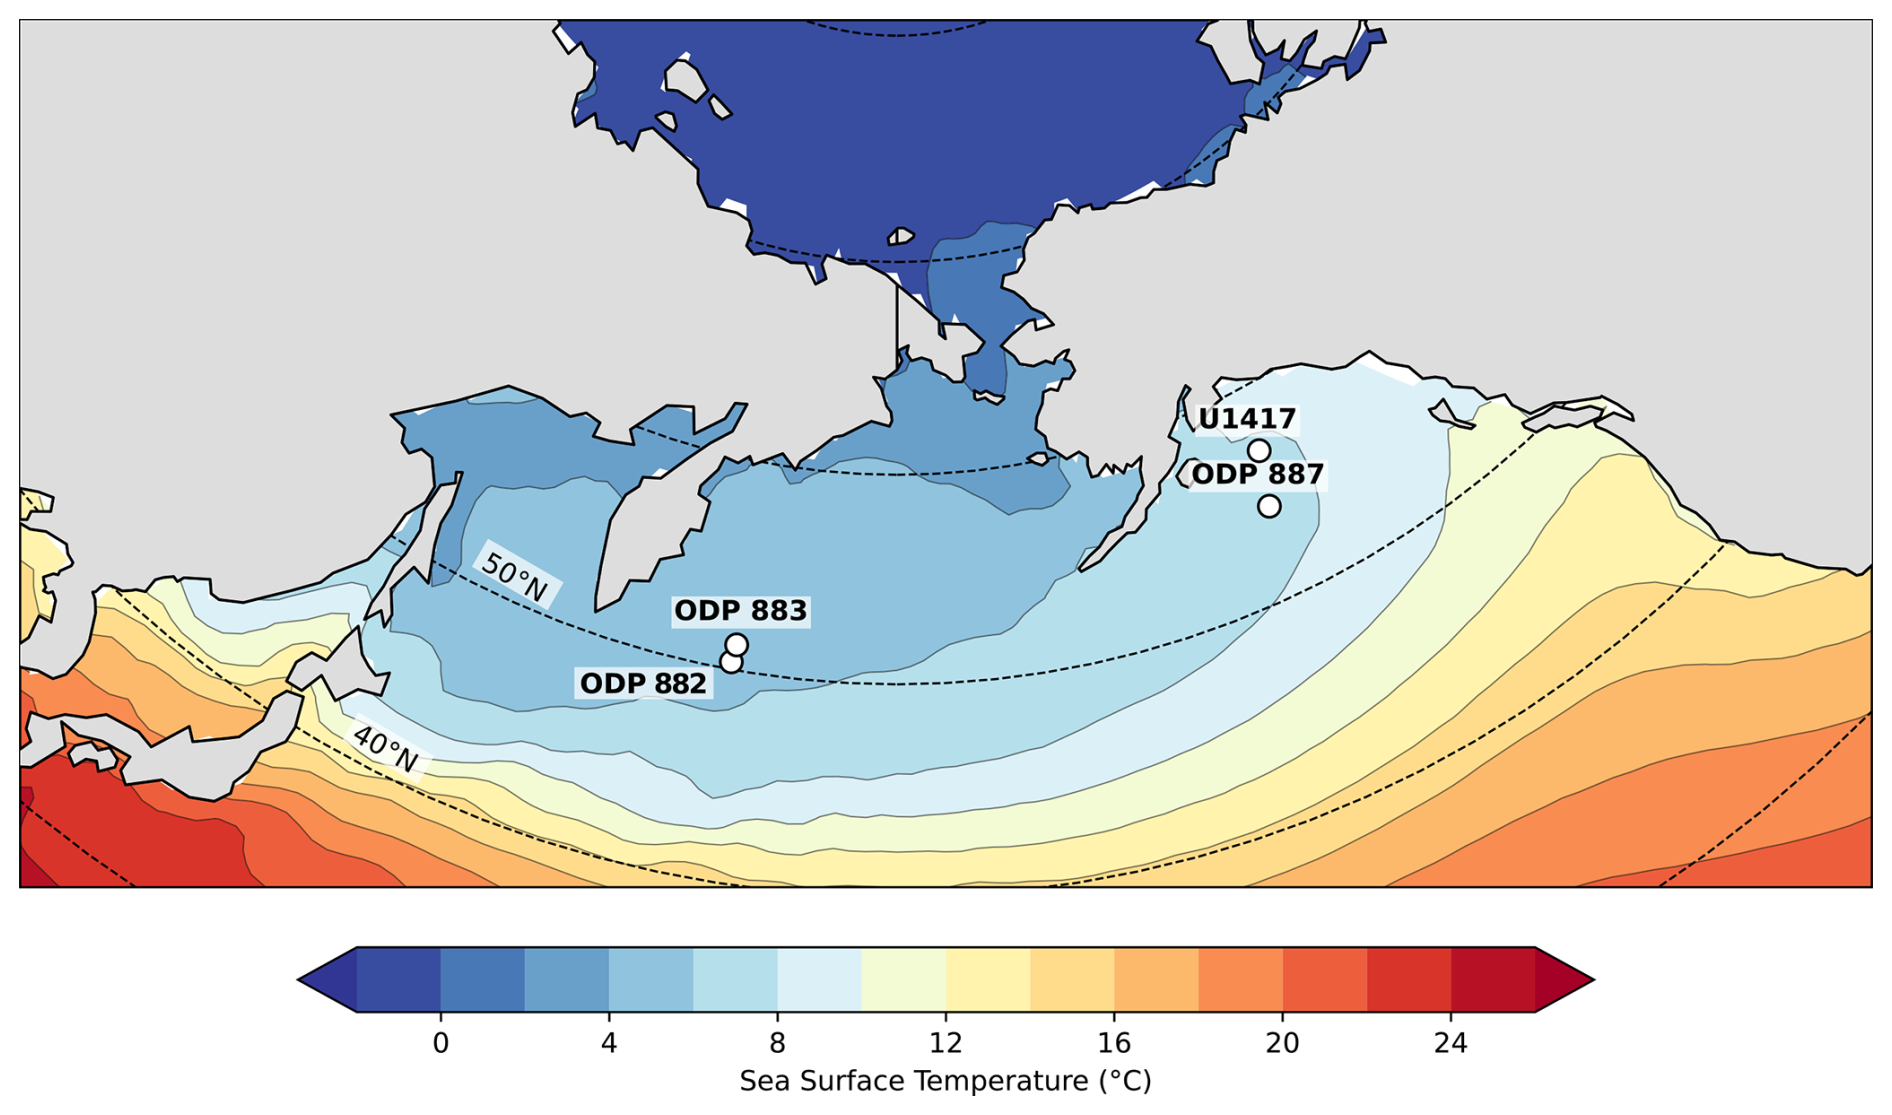
Figure 1Locations of subpolar North Pacific drill sites. Contours show mean annual sea surface temperature from the National Oceanic and Atmospheric Administration (NOAA) Optimum Interpolation Sea Surface Temperature (OISST) 0.25° gridded product (Banzon et al., 2016).
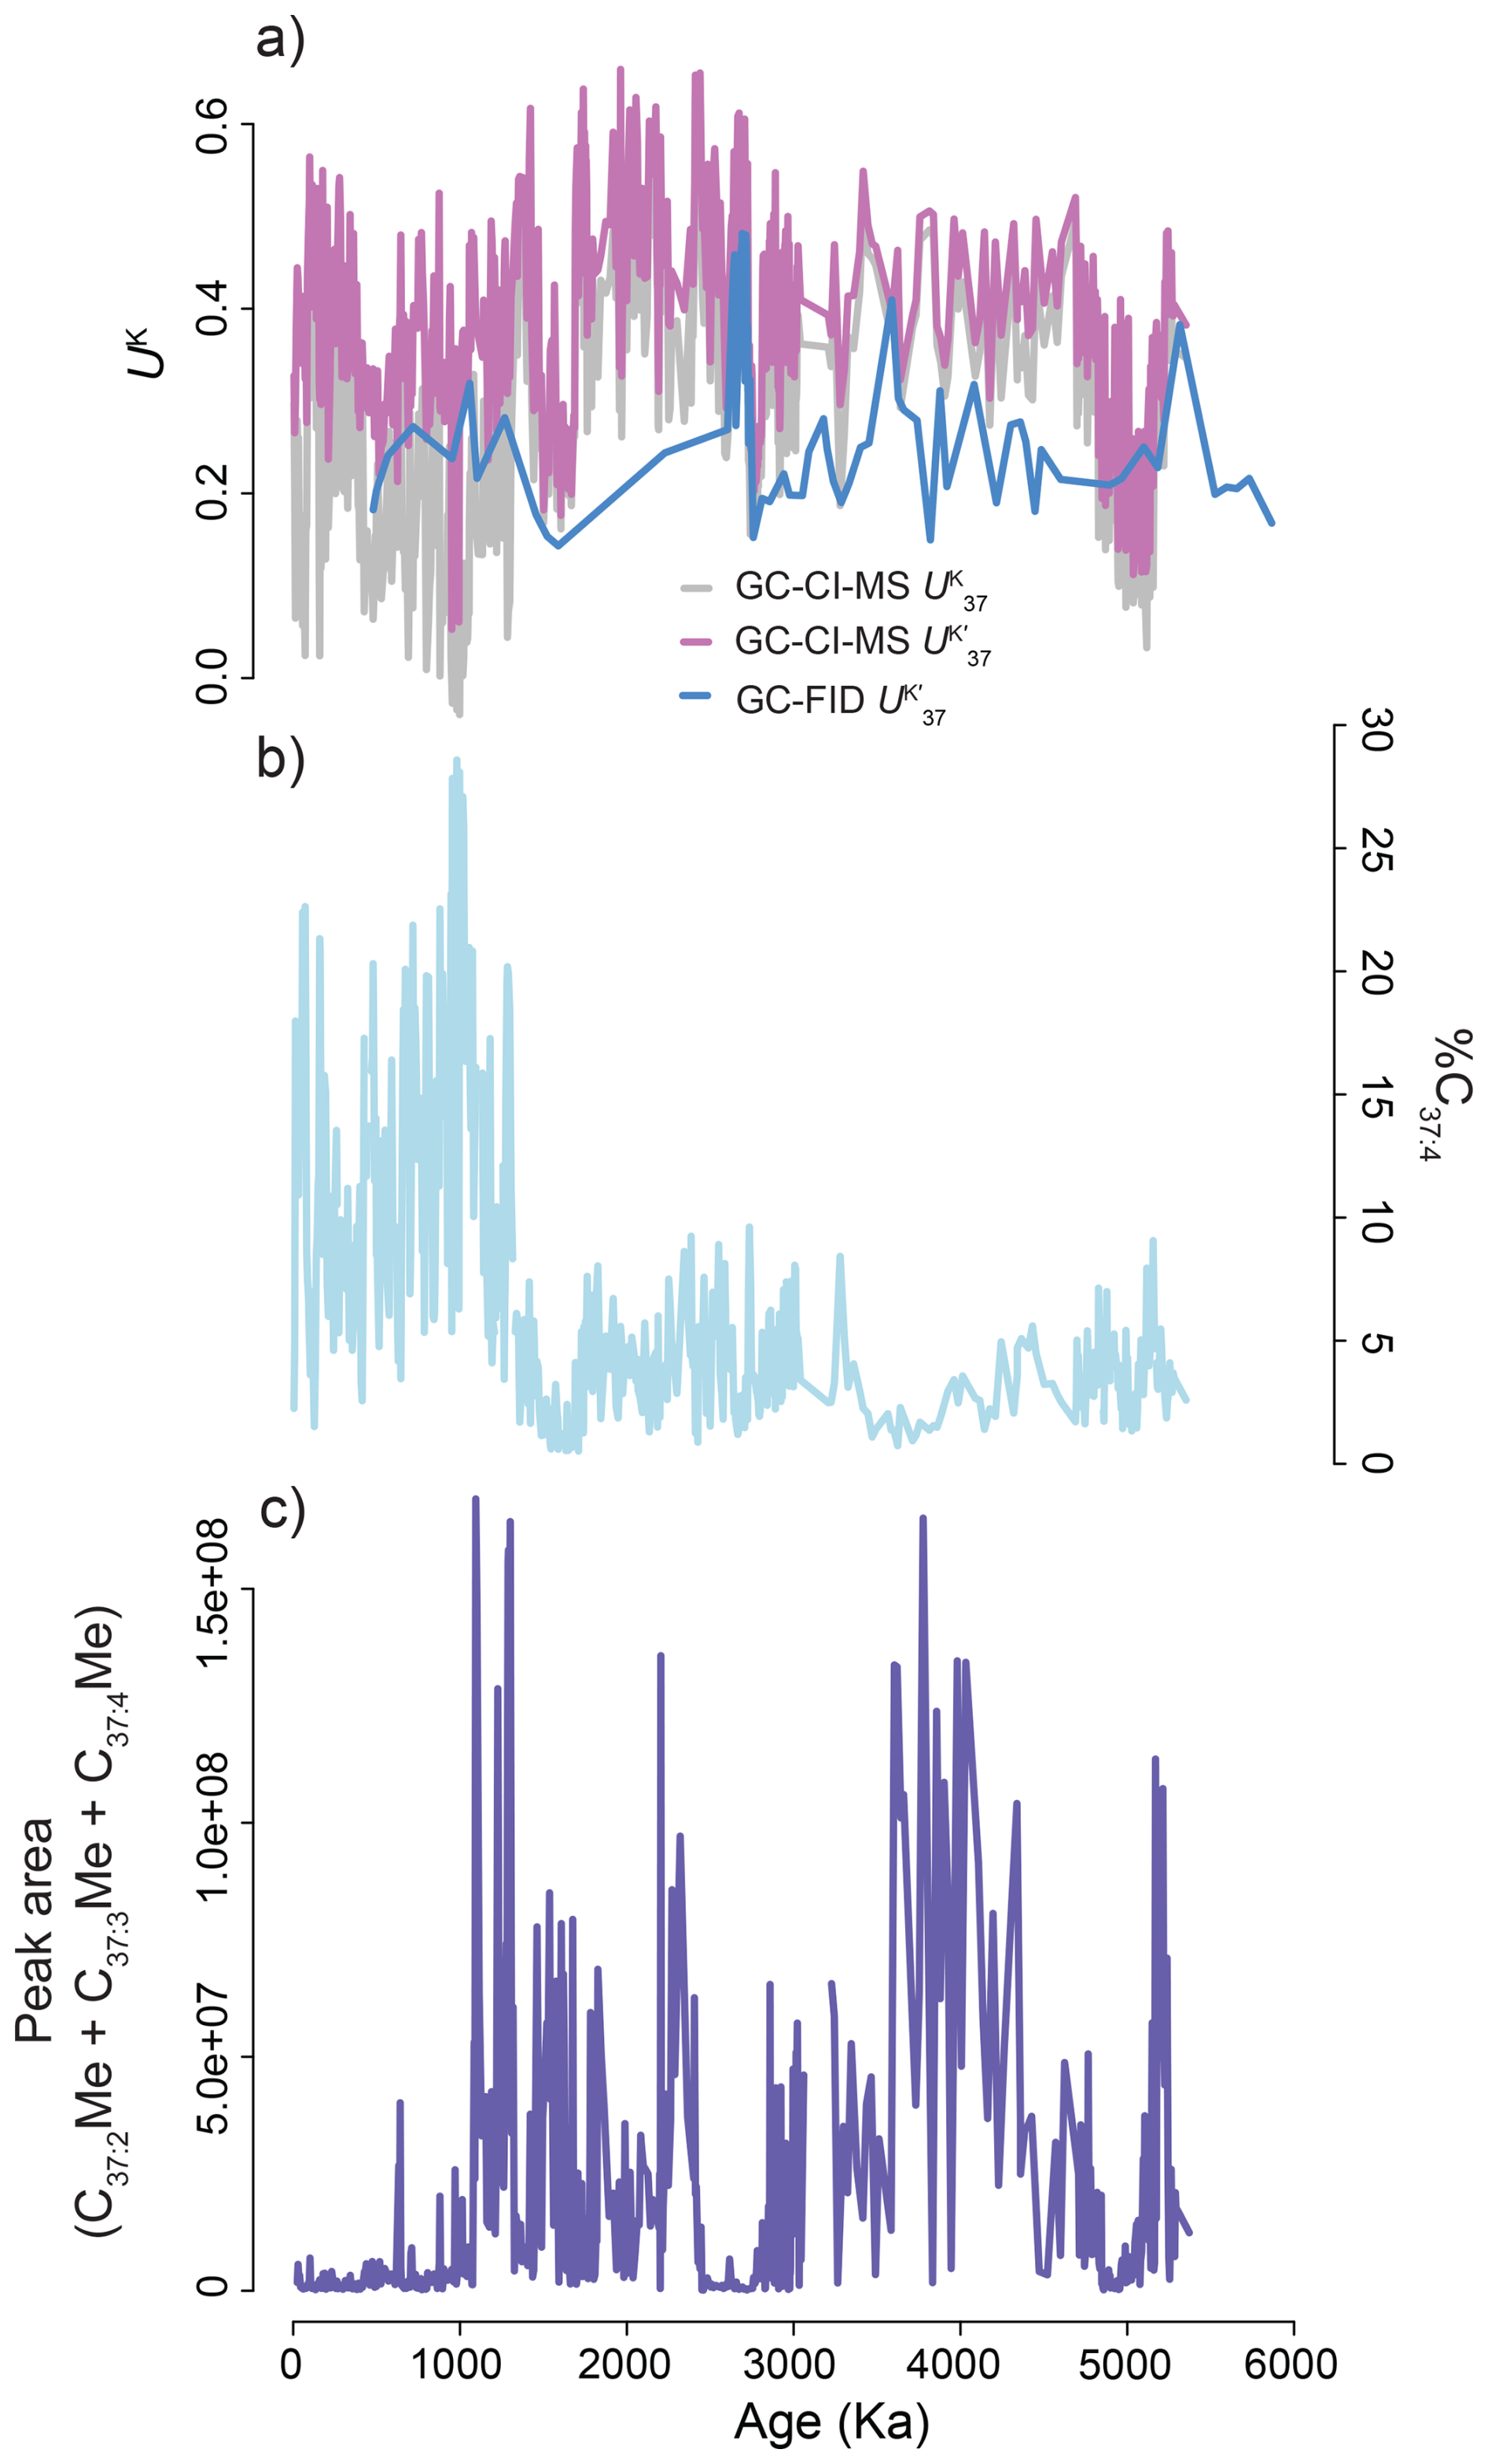
Figure 2Differences in alkenone indices at ODP Site 882 due to the misreporting of the original data. (a) Timeseries of and values. (b) %C37:4 alkenone abundances. (c) Sum of the C37:2Me, C37:3Me, and C37:4Me peak areas measured for each sample by GC-CI-MS by Haug (1995). These values are the output from each measurement; note that the dataset lacks information necessary to quantitfy alkenone concentration from these values.
First, we document that the underlying proxy values reported in the electronically archived ODP Site 882 GC-CI-MS dataset were inaccurately reported as values when they are instead (https://doi.org/10.1594/PANGAEA.315092, Haug and Sarnthein, 2005; Fig. 2). Here, we report the accurate original dataset measured by Haug (1995) and published by Haug et al. (2005) and Martínez-Garcia et al. (2010).
Second, we show that, as expected, the inferred ODP Site 882 GC-CI-MS record is systematically offset from values in samples of the same age from ODP Site 882 and nearby ODP Site 883 determined by GC-FID (Herbert et al., 2016; Novak et al., 2024; Studer et al., 2012; Yamamoto and Kobayashi, 2016). This systematic offset is consistent with the concentration-dependent effects on the chemical ionization of alkenones for the range of trace alkenone concentrations reported at ODP Site 882 (Chaler et al., 2000, 2003; Haug et al., 2005; Hefter, 2008; Studer et al., 2012).
Finally, we propose a corrected version of the original ODP Site 882 alkenone record that accounts for the additional uncertainties in reconstructed SSTs based on propagating the errors in the relationship between the ODP Site 882 GC-CI-MS and GC-FID alkenone data. The resulting SST record has larger uncertainties than a typical alkenone dataset within the range of values observed in ODP Site 882 sediments (±2.5 vs. ±1.4 °C, 1σ). We then discuss the implications of the corrected ODP Site 882 alkenone record for our understanding of late Neogene cooling and zonal patterns of warmth in the mid-Piacenzian warm period.
2.1 Study Sites and Published Alkenone SSTs
Here we analyzed published alkenone SST datasets from ODP Site 882 and ODP Site 883, located 49 nautical miles to the north of Site 882 (Rea et al., 1993a, b; Fig. 1). Modern sea surface temperatures at the two sites are essentially identical (5.82 °C at ODP Site 882, 5.75 °C at ODP Site 883, Fig. 1).The original ODP Site 882 alkenone SST record was determined by GC-CI-MS (Haug, 1995; Rosell-Mele et al., 1995), and was subsequently published by Haug et al. (2005) and Martínez-Garcia et al. (2010). The potential concentration-dependent nonlinear differences between GC-FID and GC-CI-MS determinations identified by Chaler et al. (2000, 2003) and their impacts on absolute SST values were not discussed in these publications, which focused mainly on the analysis of reconstructed SST trends. More recently, alkenone records from Site 882 itself and the nearby Site 883 were determined by GC-FID (Herbert et al., 2016; Novak et al., 2024; Studer et al., 2012; Yamamoto and Kobayashi, 2016), allowing the assessment of potential biases in the original dataset from ODP Site 882 (Haug, 1995). From here on, we base all of our calculations on and values calculated from the original dataset measured by Haug (1995).
2.2 Concentration-dependent differences in GC-CI-MS and GC-FID Determinations
Chaler et al. (2003) derived a mathematical expression of as measured on GC-FID as a function of GC-CI-MS measurements of alkenone concentration:
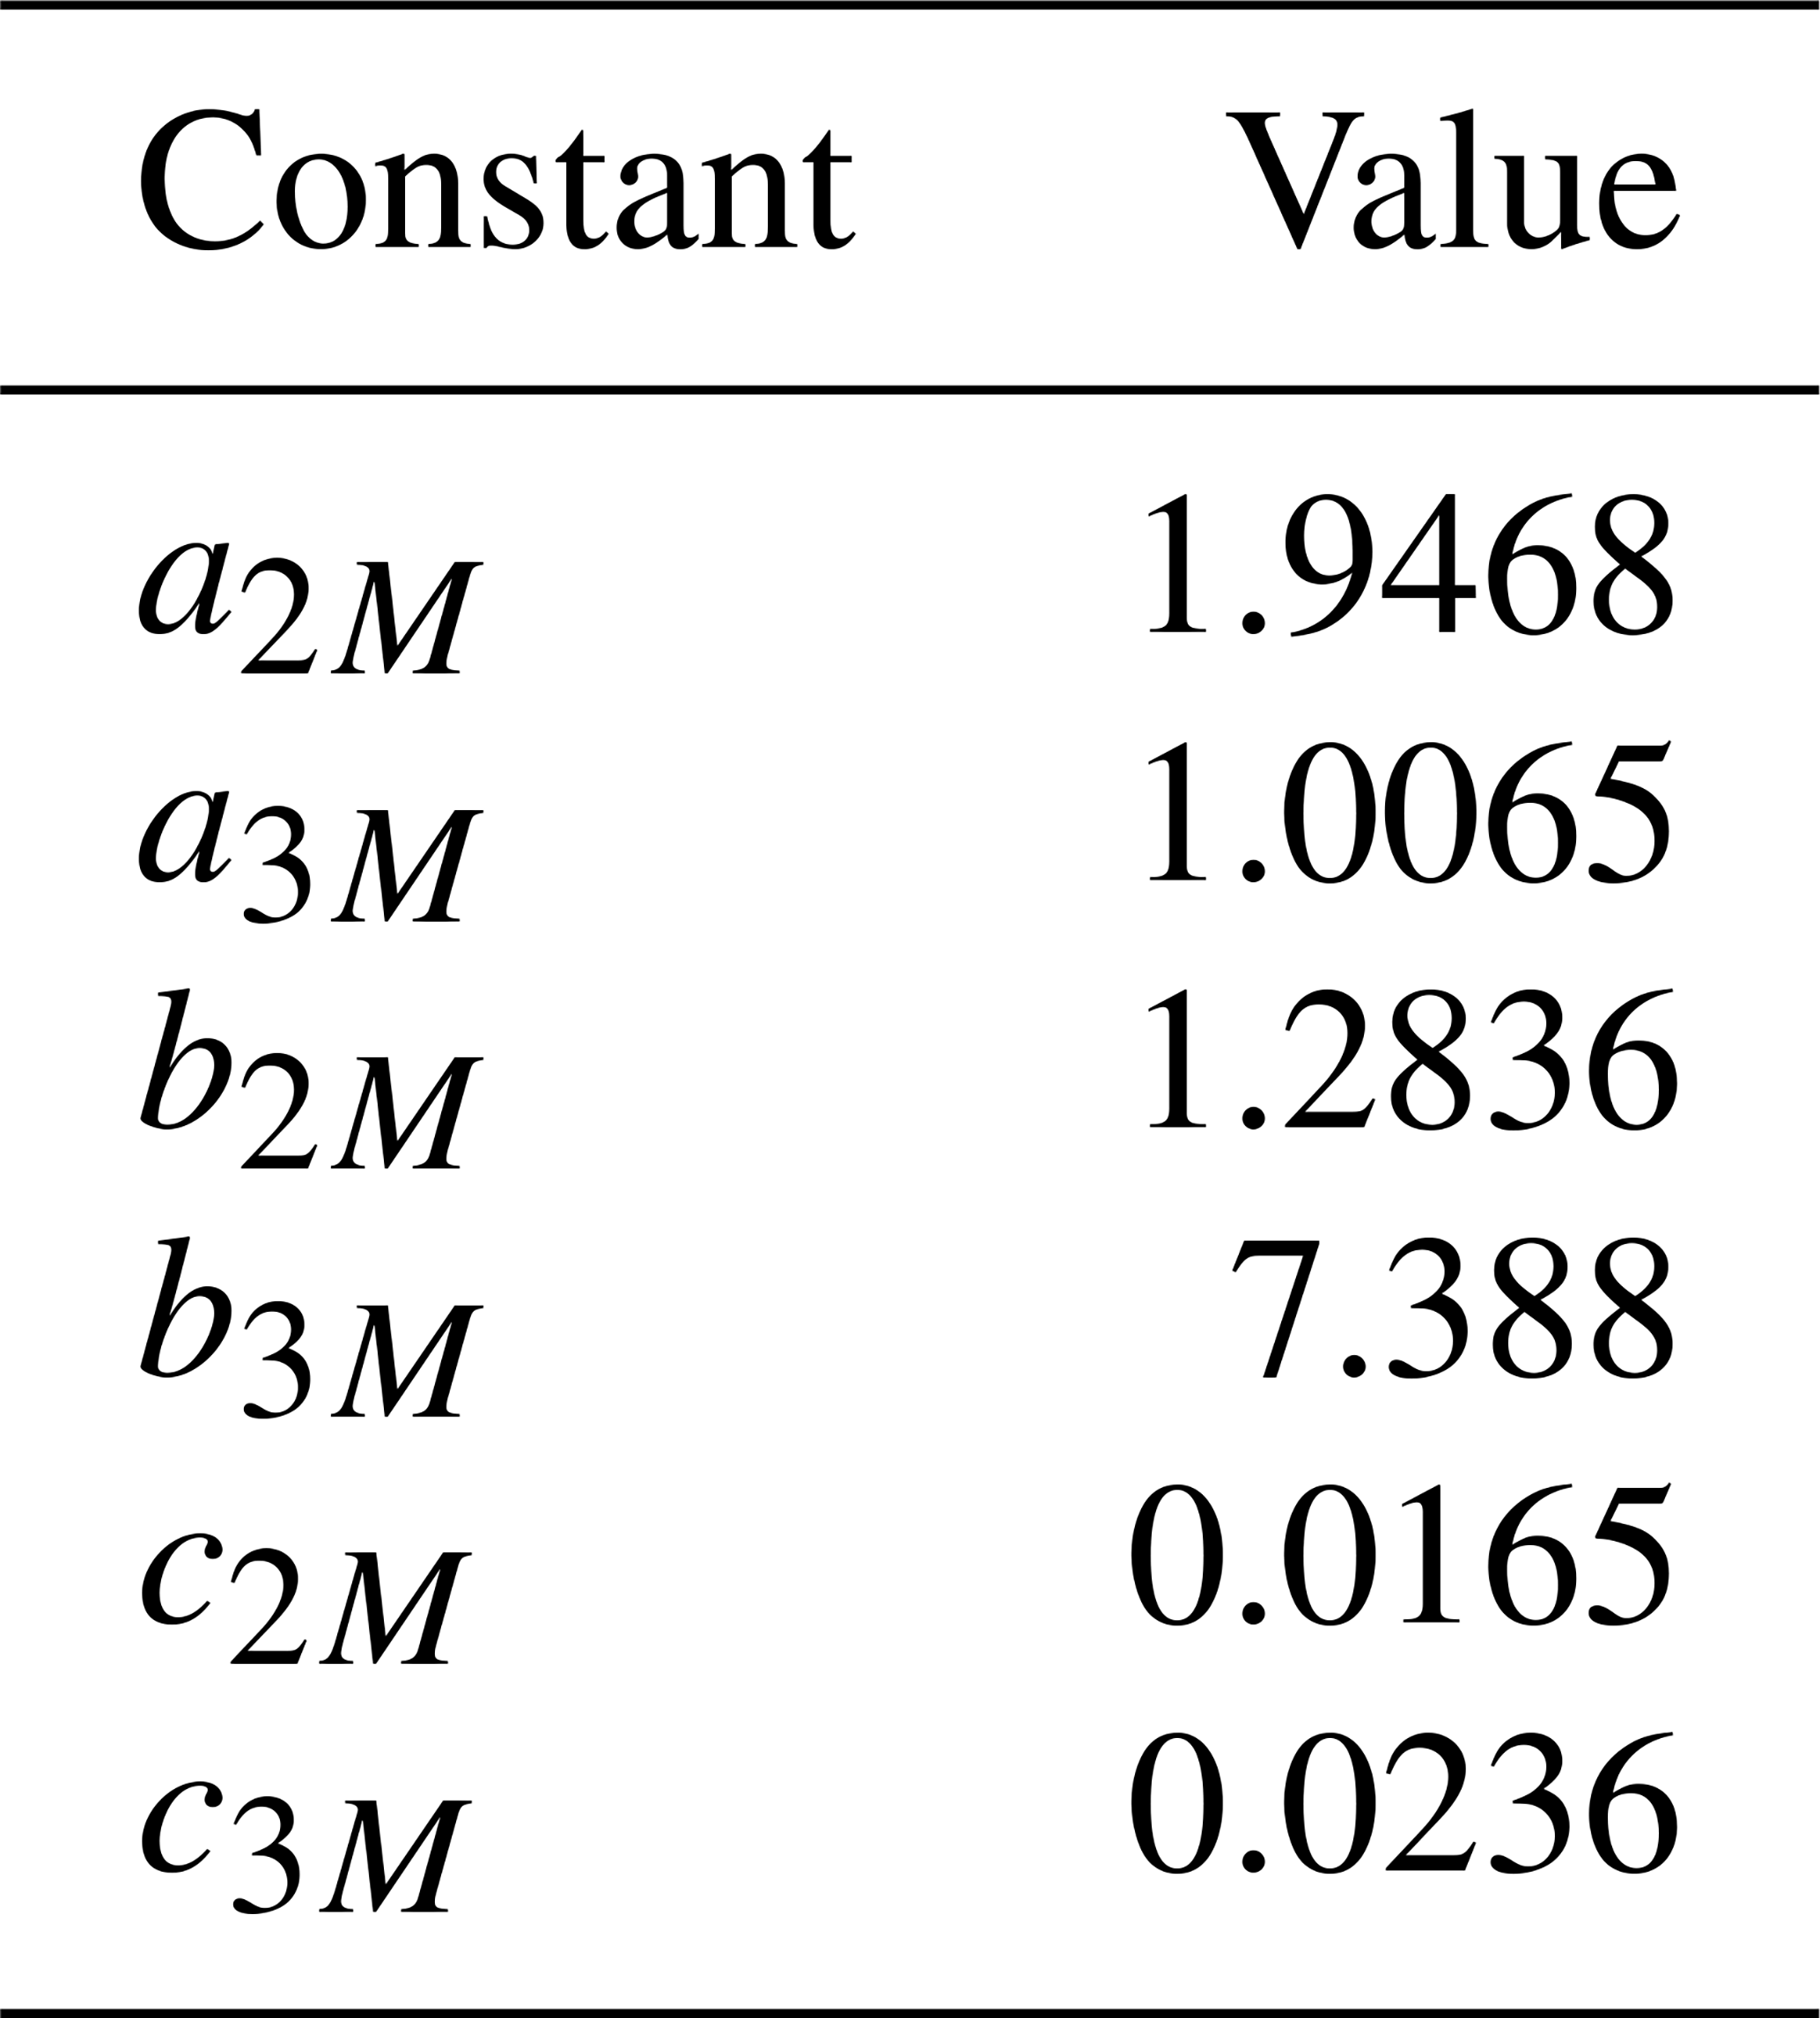
here, a2M, a3M, b2M, b3M, c2M, and c3M are curve fitted constants reported by Chaler et al. (2003). These constants are instrument-specific (Chaler et al., 2003). We utilized the constanst from GC-CI-MS “Instrument A” of Chaler et al. (2003) to calculate theoretical GC-FID-equivalent values to facilitate comparison between the GC-FID and GC-CI-MS alkenone SST datasets from ODP Sites 882 and 883 (Table 1). These theoretical GC-FID-equivalent values were calculated over the range of values in the alkenone SST records from ODP Sites 882 and 883 to understand the expected sign and magnitude of any potential analytical bias in the GC-CI-MS method (Novak et al., 2024; Studer et al., 2012; Yamamoto and Kobayashi, 2016). We varied the mass of each theoretical alkenone analyte between 5 and 30 ng on column to mimic the “trace” quantities of alkenones reported by Haug et al. (2005) because no specific alkenone concentrations were reported alongside their SST determinations; the raw data files generously shared with us from their work report molecule abundances as peak areas rather than concentration. For example, a low value was represented as 5 ng of the C37:2Me alkenone and 30 ng of the C37:3Me alkenone. These analyte masses are slightly below to slightly above the lower bound of the range of acceptable analyte mass for determinations by GC-FID as documented by Villanueva and Grimalt (1996).
Table 1Constants used to calculate GC-FID-equivalent values from theoretical GC-CI-MS alkenone measurements (Chaler et al., 2003).
2.3 Reassessing uncertainties in the GC-CI-MS ODP Site 882 Alkenone Record
Because we lack instrument-specific information about the mass-dependent ionization efficiency of the C37:3Me and C37:2Me alkenones on the GC-CI-MS used by Haug (1995) to generate their data from ODP Site 882, we cannot use the equations of Chaler et al. (2003) or Hefter (2008) to correct their record. Instead, we propose to quantify the uncertainties in the Site 882 alkenone SST record introduced by the GC-CI-MS method based on the correlation between values of adjacent samples at ODP Site 882 generated by GC-CI-MS and GC-FID (Haug, 1995; Studer et al., 2012; Yamamoto and Kobayashi, 2016). GC-FID and inferred GC-CI-MS values were paired by interpolating the more densely sampled GC-CI-MS record onto the more sparesly sampled GC-FID records.
We explored both linear and quadratic fits of the ODP 882 GC-CI-MS and GC-FID values in addition to multiple linear regression models that incorporated the absolute peak areas measured by Haug (1995) with GC-CI-MS (Figs. S1 and S2 in the Supplement). Ultimately, a linear model was selected to transform the inferred GC-CI-MS values to GC-FID equivalents as it provided the optimal fit while ensuring the model terms remained statistically significant (p<0.001, adj. r2=0.56, df=68, Eq. 4). This equation was derived after screening samples based on the absolute peak areas measured by GC-CI-MS (see Sect. 3.2; note that we lack the necessary information about the laboratory standards used by Haug (1995) to calculate concentrations from peak area).
The substantial standard error of this relationship, ±0.07 U units, is equivalent to an analytical uncertainty of 2.05 °C SST in addition to the calibration uncertainties inherent to estimating SSTs from values. We note that this estimate of the analytical uncertainty of the ODP Site 882 GC-CI-MS dataset is inherently imperfect because we lack the instrument-and-analysis-specific information required to more precisely quantify drift in the concentration-dependent ionization efficiencies of the C37:2Me and C37:3Me alkenones. Therefore, our quantification of the analytical uncertainty serves as an estimate of the mean analytical uncertainty for the portion of the ODP Site 882 GC-CI-MS alkenone dataset with measured peak areas and may underestimate or overestimate the uncertainties associated with specific samples (see Sect. 3.1).
The SST equivalent of the analytical uncertainty of the Site 882 inferred GC-CI-MS values was calculated from the slope of the widely-applied BAYSPLINE SST core top calibration (Tierney and Tingley, 2018).
This additional analytical uncertainty is greater than the prediction uncertainty of the proxy when estimating SST (Conte et al., 2006; Müller et al., 1998; Prahl and Wakeham, 1987; Tierney and Tingley, 2018). We applied Eq. (7) to generate GC-FID equivalent values from the values measured by GC-CI-MS (Haug, 1995). We then propagated the additional uncertainty to calculate a 95 % confidence interval for the resulting median SST estimates by adding in quadrature the analytical uncertainty sea surface temperature equivalent (2.05 °C) multiplied by 1.96 to the upper and lower range of the 95 % SST confidence interval returned by BAYSPLINE.
Because BAYSPLINE generates a unique 95 % confidence interval for each sample, this calculation was applied to the BAYSPLINE output for each sample individually.
We compared the various alkenone datasets from ODP Sites 882 and 883 with two-sided t-tests to assess the differences in mean values between the records. Because there are substantial differences in the timescale and sampling resolution, the datasets were first resampled to avoid the consideration of data from intervals where one record may have data while another does not. In all cases, the more highly resolved record was resampled onto the less resolved record.
2.4 Calculations of seawater density and salinity
We examined the implications of the corrected ODP Site 882 temperature in part by calculating the implied changes in the density of surface water from the thermodynamical equation of seawater (TEOS-10) as implemented in the Givvs SeaWater Oceanographic Toolbox (Feistel, 2018; McDougall and Barker, 2011).
3.1 Analytical Uncertainties in the GC-CI-MS ODP Site 882 Alkenone Record
The differences between values measured by GC-CI-MS and GC-FID are both nonlinear and concentration dependent (Chaler et al., 2000, 2003; Hefter, 2008). While we do not have the necessary information to calculate alkenone concentrations from the Haug (1995) alkenone measurements, the relative intensity of the instrument response (i.e., the peak areas of the molecular ion ammonium adducts) provides qualitative information about the amount of analyte introduced into the detector (Fig. 2c). Peak areas of the alkenones quantifed in ODP Site 882 sediments by Haug (1995) varied by several orders of magnitude (105−108; Fig. 2c), implying substantial sample-to-sample differences in the concentration of analyte measured, which is consistent with absolute alkenone concentrations reported by others (Novak et al., 2024; Studer et al., 2012; Yamamoto and Kobayashi, 2016) and the differences we observe between the GC-CI-MS and GC-FID values at ODP Site 882 (Fig. 3a).
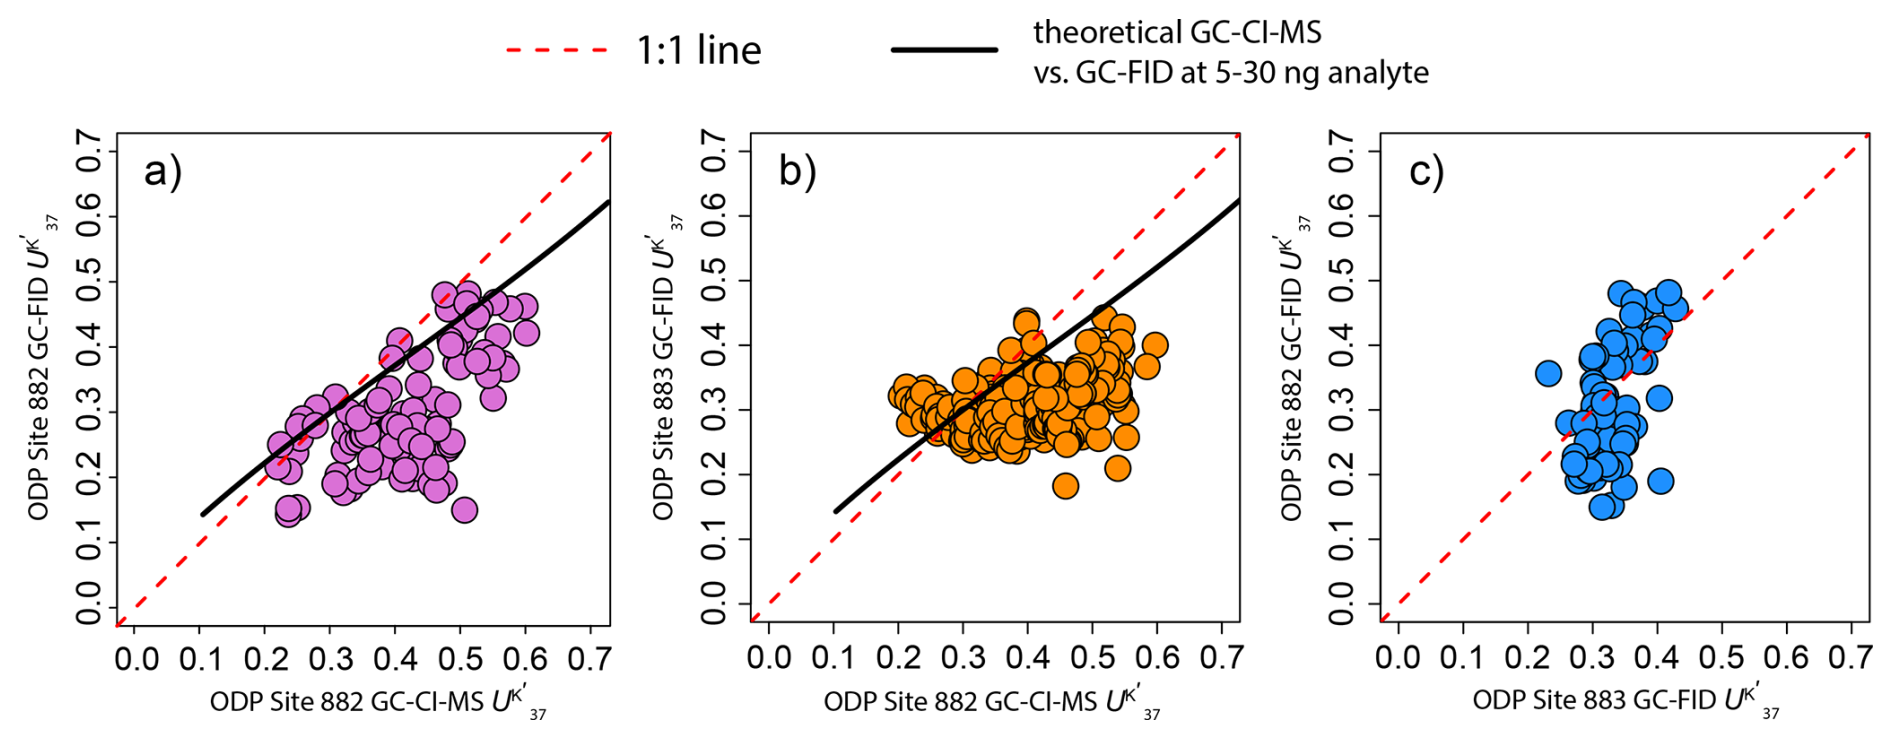
Figure 3 values from ODP Sites 882 and 883 interpolated to show differences in samples of similar age (Haug et al., 2005; Novak et al., 2024; Studer et al., 2012; Yamamoto and Kobayashi, 2016). (a) ODP Site 882 inferred GC-CI-MS vs. GC-FID . (b) ODP Site 882 inferred GC-CI-MS vs. ODP Site 883 GC-FID . (c) ODP Site 882 GC-FID vs. ODP Site 883 GC-FID . The black lines were calculated from values derived from the equations reported for GC-CI-MS “instrument A” in Chaler et al. (2003; see Sect. 2.2). In all cases, the more highly time resolved record was interpolated onto the lower resolution record to facilitate intercomparison of the datasets.
The GC-CI-MS values from ODP Site 882 are systematically larger (warmer) than the values determined by GC-FID (Fig. 3a). The mean difference between the inferred GC-CI-MS and GC-FID values is 0.113 units (p<0.001, two-sided t-test, GC-CI-MS values are larger), which is equivalent to 3.32 °C SST (Eq. 5). This finding is consistent when comparing the inferred GC-CI-MS values with measurements from the nearby ODP Site 883 (Fig. 3b), which have a mean difference of 0.09 units equivalent to 2.65 °C from the ODP Site 882 inferred GC-CI-MS values (p<0.001, two-sided t-test, GC-CI-MS values are larger). This is greater than the typical interlaboratory differences in alkenone measurements (±1.3–2.6 °C; Rosell-Melé et al., 2001). By comparison, the values determined by GC-FID at ODP Sites 882 and 883 are not systematically offset as a function of increasing (Fig. 3c); the mean difference in ODP Site 882 and ODP Site 883 is 0.023 units or 0.68 °C SST (p=0.06, two-sided t-test, ODP 882 values are larger).
The systematically larger (warmer) inferred GC-CI-MS values compared to those determined by GC-FID at ODP Site 882 are consistent with the known concentration-dependent nonlinear differences in the chemical ionization of C37:2Me and C37:3Me alkenones (Chaler et al., 2000, 2003). We explored whether the GC-CI-MS peak area data might improve predictions of GC-FID equivalent values from the GC-CI-MS values (Fig. S2). We found that 80.6 % of the variance in the ODP Site 882 GC-CI-MS alkenone dataset can be described by two principal components (Fig. S2a). The GC-FID values are more strongly correlated with PC1 (Fig. S2b), while the GC-CI-MS values are more strongly correlated with PC2 (Fig. S2b). The GC-CI-MS peak areas, whether the sum of peak areas for all molecules or the peak areas of individual molecules, are negatively correlated with PC1 and the GC-FID values but positively correlated with PC2 and the GC-CI-MS values (Fig. S2b). These statistical relationships lead us to experiment with multiple linear regression models, one of which moderately improved the accuracy of GC-FID equivalent values predicted from the GC-CI-MS data (Fig. S2c vs. d). However, application of this model to the GC-CI-MS dataset in an effort to produce GC-FID equivalent values resulted in nonsensical (negative) estimates. Therefore, we do not think it is possible to use a single model to correct for the complex offsets between the GC-CI-MS and GC-FID alkenone datasets at ODP Site 882, at least with the information available to us.
We then experimented with cutoffs based on the GC-CI-MS instrument response (peak area) in an effort to distinguish between different populations of samples that might have different relationships between GC-CI-MS and GC-FID values (Fig. 4). We found that the strength of the regression between GC-CI-MS and GC-FID values is related to the magnitude of the GC-CI-MS instrument response (peak area) for a given sample (Fig. 4b). The differences between the ODP Site 882 GC-CI-MS and GC-FID values become larger in samples with larger GC-CI-MS peak areas versus those with smaller peak areas (Fig. 4a). While these differences should be systematic (Chaler et al., 2000, 2003), the lack of GC-FID data from intervals with higher alkeneone abundances does not permit us to robustly characterize the correlation between GC-CI-MS and GC-FID values in samples with GC-CI-MS-measured peak areas (Fig. 4a). These observations lead us to propose a correction to the ODP Site 882 alkenone dataset based upon a linear relationship between GC-CI-MS and GC-FID values in samples with measured peak aras (Fig. 4a blue line, Eq. (7), p<0.001, adj. r2=0.56, df=68). All samples with measured peak area were excluded from further consideration since we lack the necessary information to propose a correction to those data.
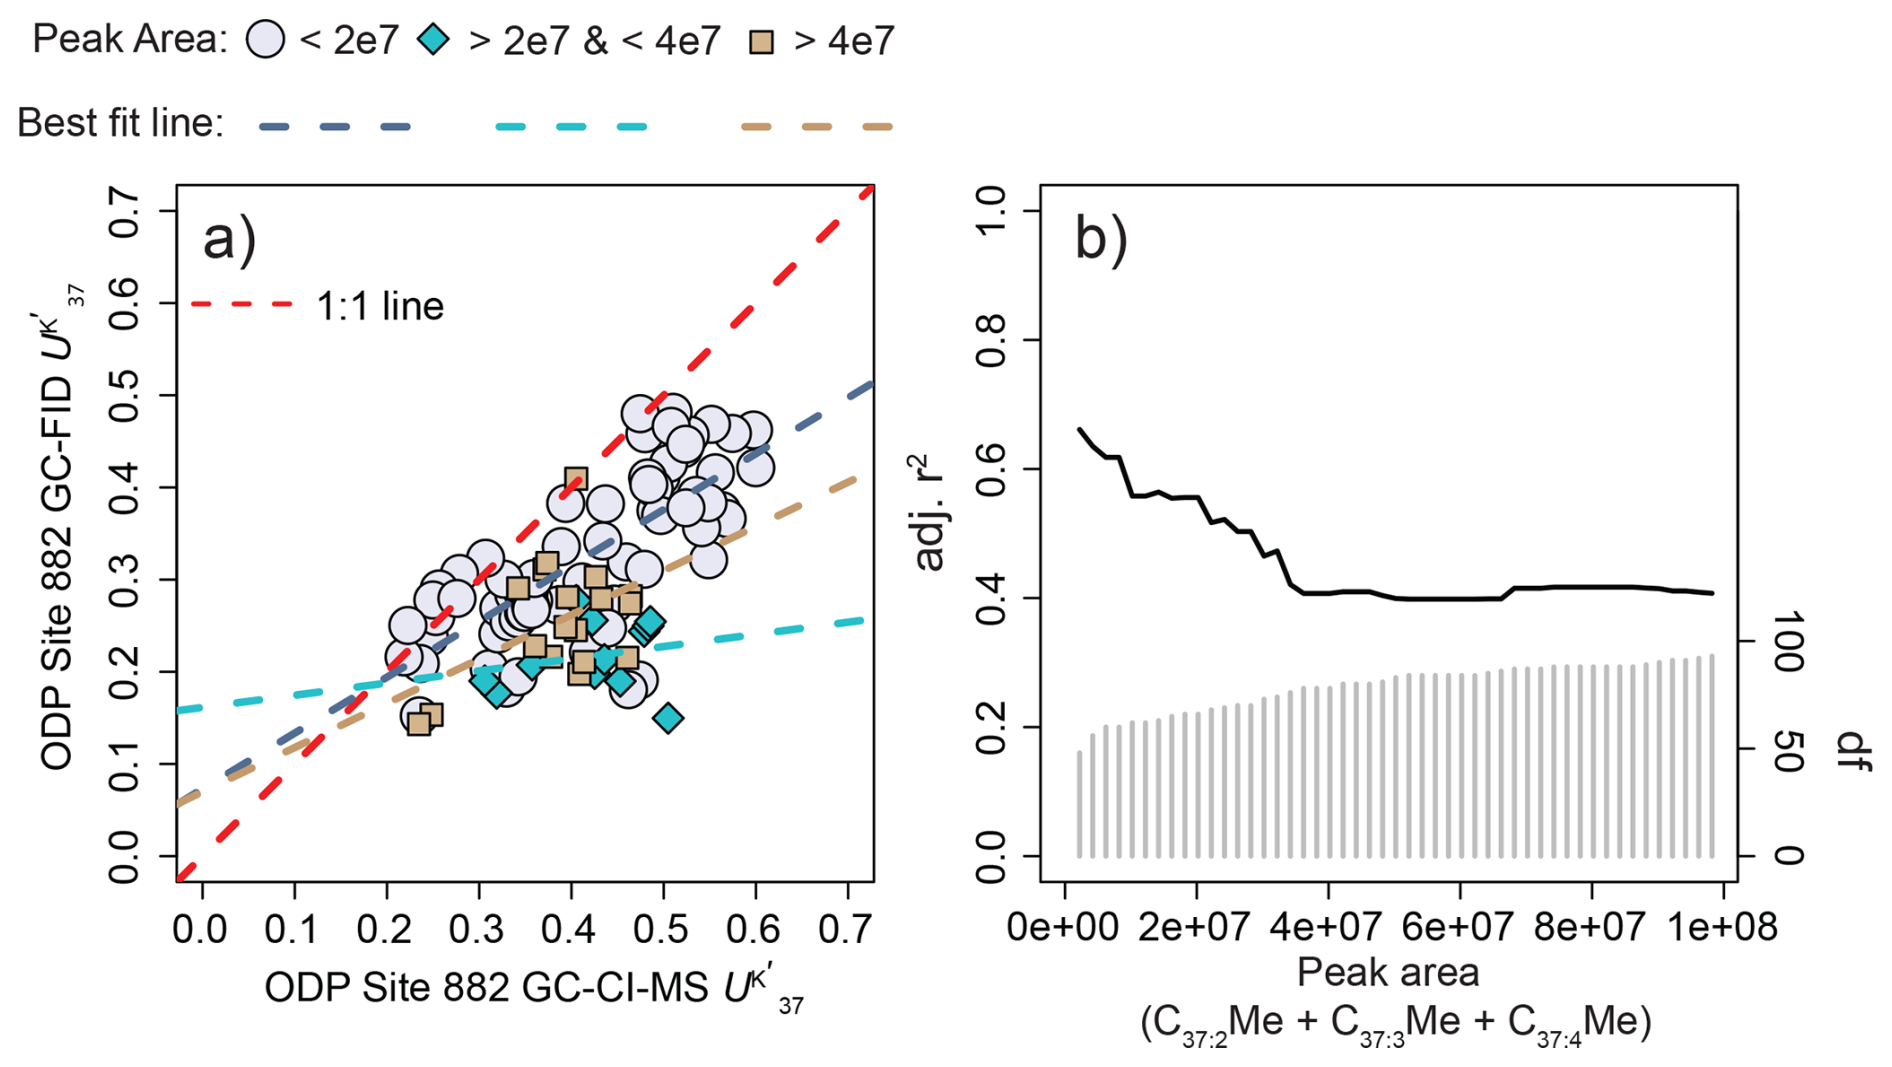
Figure 4Change in relationship between GC-CI-MS and GC-FID values at ODP Site 882 with peak area. (a) Change in regression slope with peak area. (b) Change in regression strength with peak area.
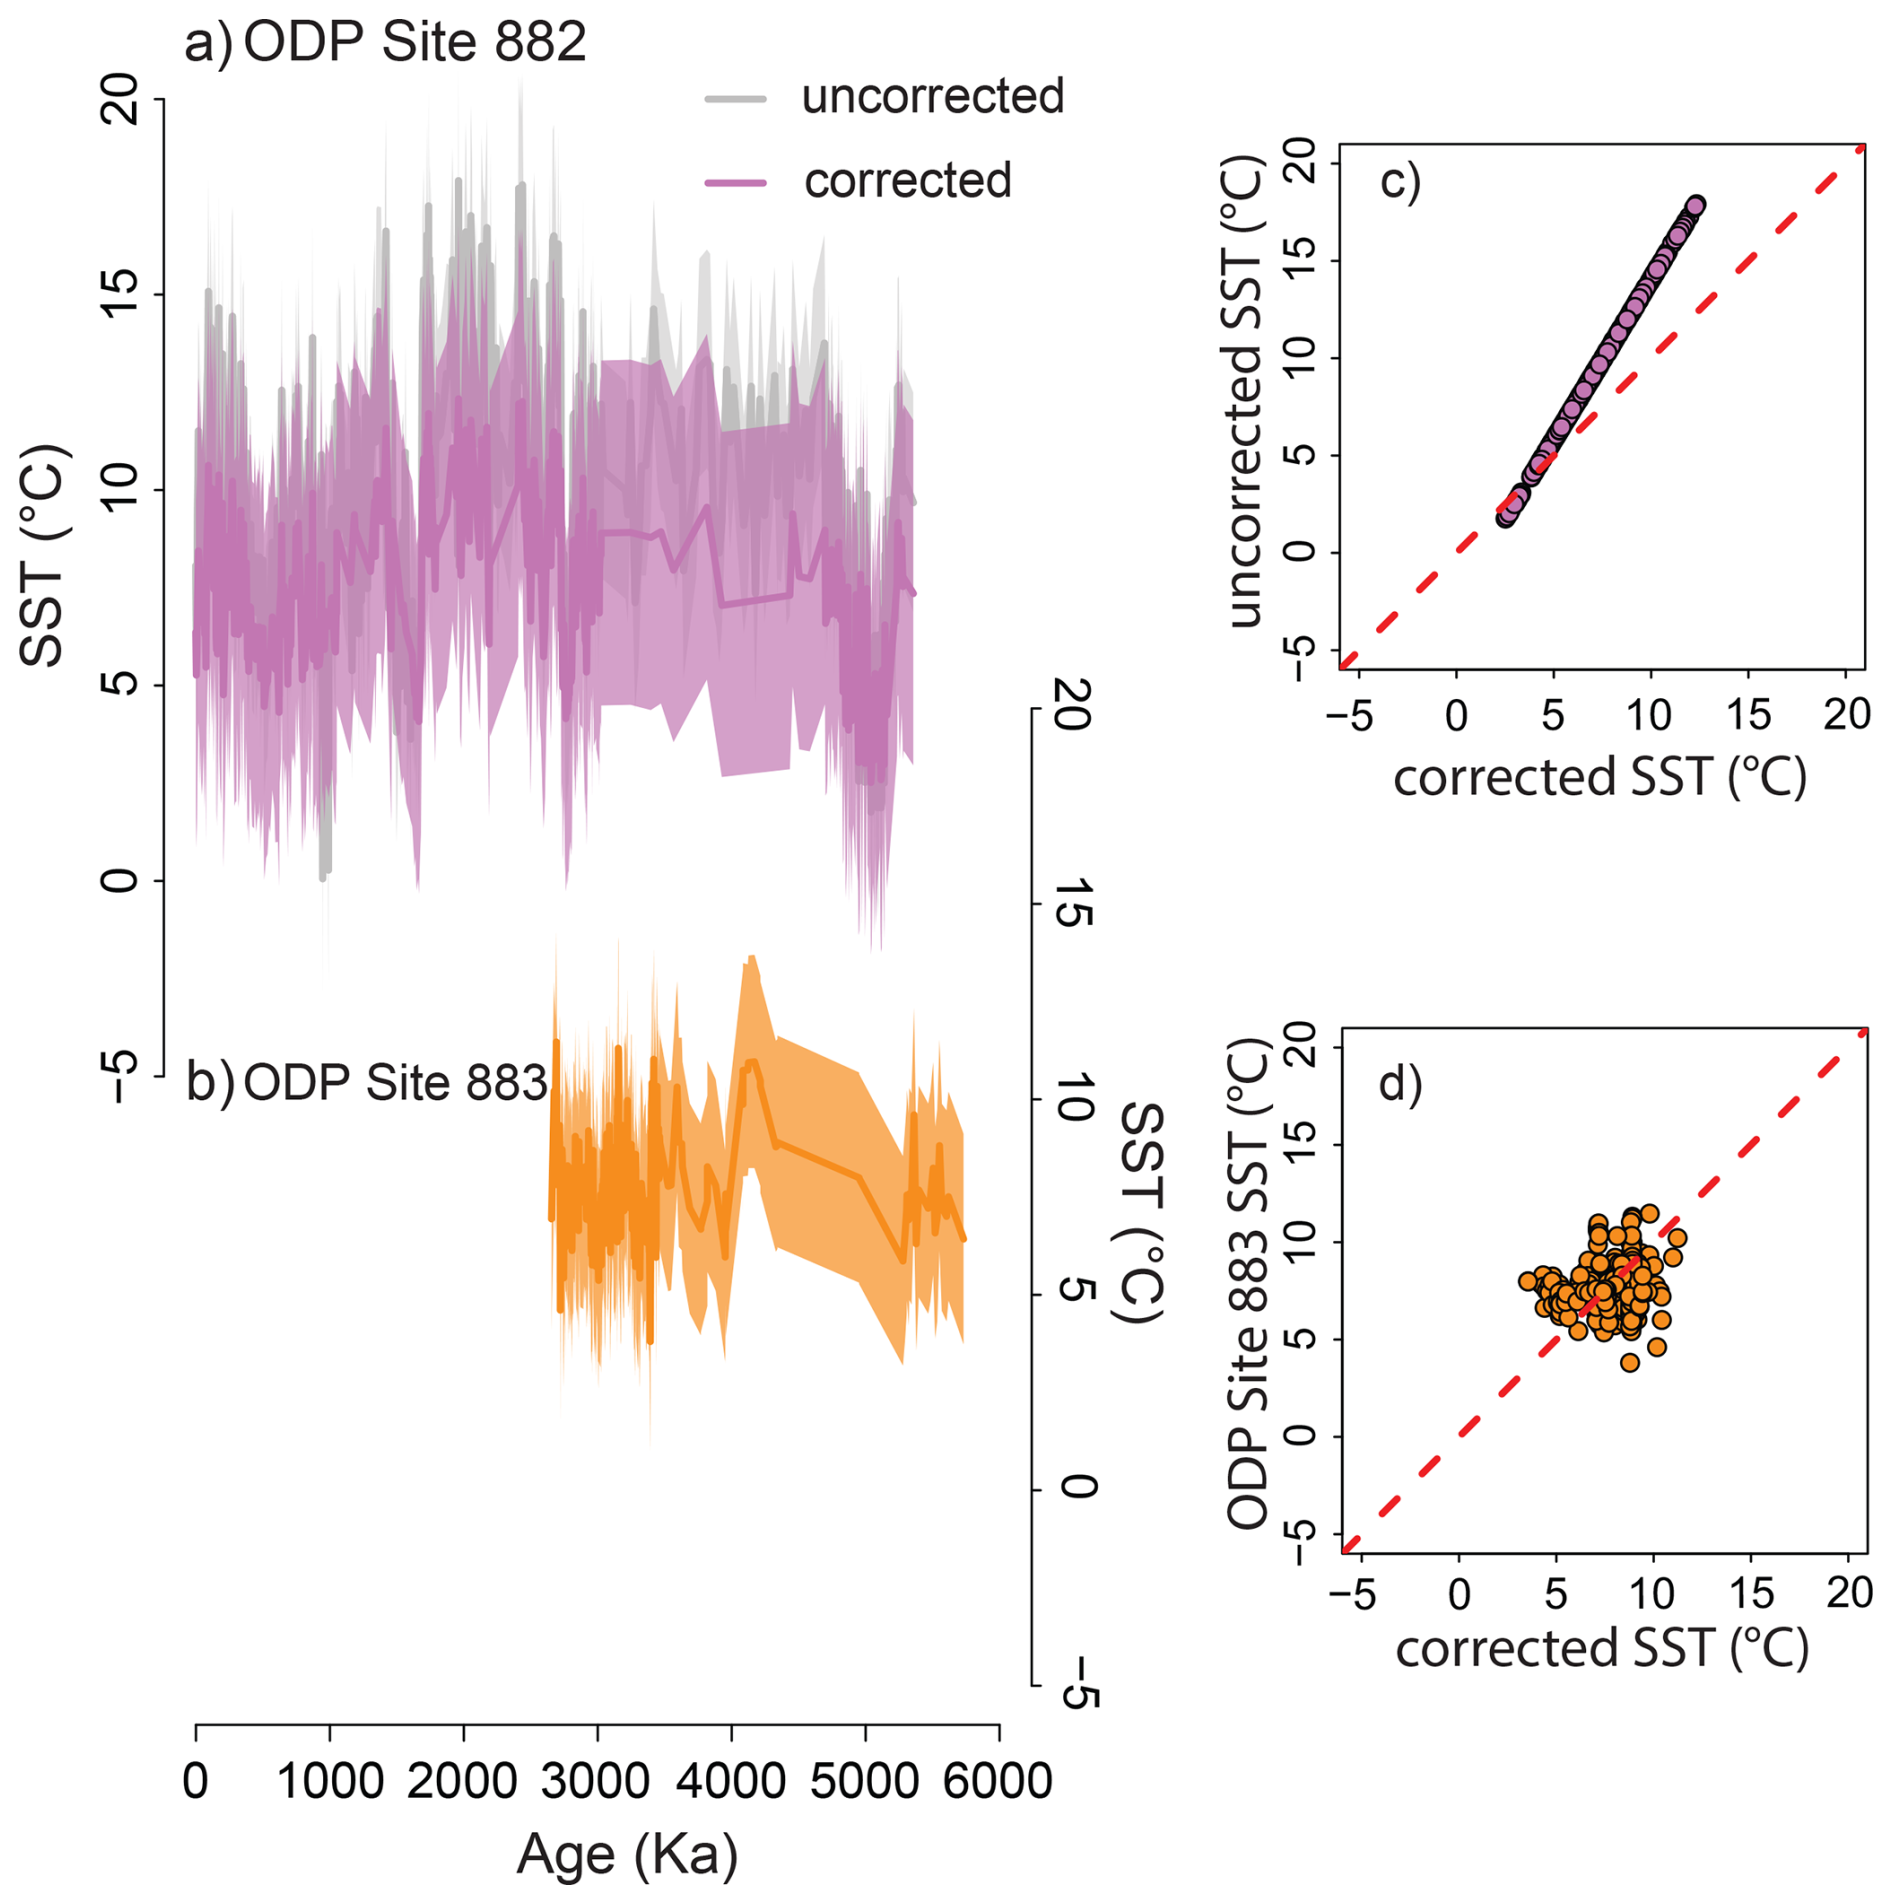
Figure 5Comparison of the proposed correction to the GC-CI-MS ODP Site 882 alkenone SST record to the GC-FID alkenone record from ODP Site 883. (a) Corrected sea surface temperatures from the GC-CI-MS ODP Site 882 alkenone record vs. the original record. Both are SSTs generated by BAYSPLINE (Tierney and Tingley, 2018). (b) ODP Site 883 alkenone SST record (Herbert et al., 2016; Novak et al., 2024). Shading in (a) and (b) signfy the 95 % confidence interval of the SST estimates. (c) corrected vs. original GC-CI-MS SSTs at ODP Site 882. (d) ODP Site 883 vs. corrected ODP Site 882 alkenone SSTs. Both (c) and (d) show the median of the SST estimates.
3.2 A Corrected ODP Site 882 Alkenone SST Record
The proposed corrections to the ODP Site 882 GC-CI-MS alkenone record result in sea surface temperature estimates that are consistent with the nearby alkenone SST record from ODP Site 883 (Fig. 5). The mean of the SST calculated from the corrected GC-CI-MS dataset is significantly smaller than the original GC-CI-MS ODP Site 882 record (p<0.001, df=806.5, two-sided t-test). The magnitude of the correction is larger at higher values (i.e., warmer SSTs; Fig. 5c). The mean difference between the corrected ODP Site 882 GC-CI-MS dataset and the GC-FID record from ODP Site 883 is 0.59 °C (p<0.001, df=903.5, two-sided t-test), which is consistent with the difference between the GC-FID records from Sites 882 and 883 (0.68 °C, Fig. 5d, see also Sect. 3.1). These observations suggest that our proposed correction successfully removes the systematic “warm” analytical bias in the original ODP 882 GC-CI-MS dataset while maintaining the potentially real differences in SST indicated by the GC-FID data (i.e., the slightly more northward Site 883 is somewhat cooler; Fig. 1).
3.3 GC-CI-MS vs. GC-FID alkenone data from the subpolar northeast Pacific
The same methodological differences (GC-FID vs. GC-CI-MS) exist between the late Neogene and Quaternary alkenone SST datasets from ODP Site 887 and IODP Site U1417 in the subpolar northeast Pacific, but we are unable to determine whether these methodological differences lead to the same systematic biases between the datasets because there are very few proximal samples measured by both methods. The alkenone record from IODP Site U1417 was analyzed by GC-CI-MS (Sánchez-Montes et al., 2020), while the record from the nearby ODP Site 887 was analyzed by GC-FID (Dowsett et al., 2017; Herbert et al., 2016). The selectivity of the GC-CI-MS method permits quantification of alkenones in complex mixtures that cannot be resolved by sample preparation (Rosell-Mele et al., 1995). At IODP Site U1417, the GC-CI-MS method enabled the isolation of alkenones from a complex mixture that resulted from the introduction of petrogenic carbon from the nearby St. Elias mountains (Sánchez-Montes et al., 2020), which was not an issue at the more pelagic ODP Site 887 (Dowsett et al., 2017; Herbert et al., 2016). There are only 11 samples from these two records that overlap in time (Fig. 6a). Although the mean values from mid-Piacenzian subsets of these data are statistically indistinguishable (Fig. 6b, 0.008 or 0.24 °C, p=0.66), the systematic differences between the GC-CI-MS and GC-FID values from ODP Site 882 and the well-documented systematic offset between the GC-CI-MS and GC-FID methods give us reason to suspect that the IODP Site U1417 and ODP Site 887 alkenone datasets may not be strictly intercomparable. For this reason, we exclude the IODP Site U1417 alkenone dataset from our discussion of the implications of the proposed correction to the ODP Site 882 GC-CI-MS alkenone record for the paleoceanographic history and paleoclimate data-model evaluation in the subarctic North Pacific.
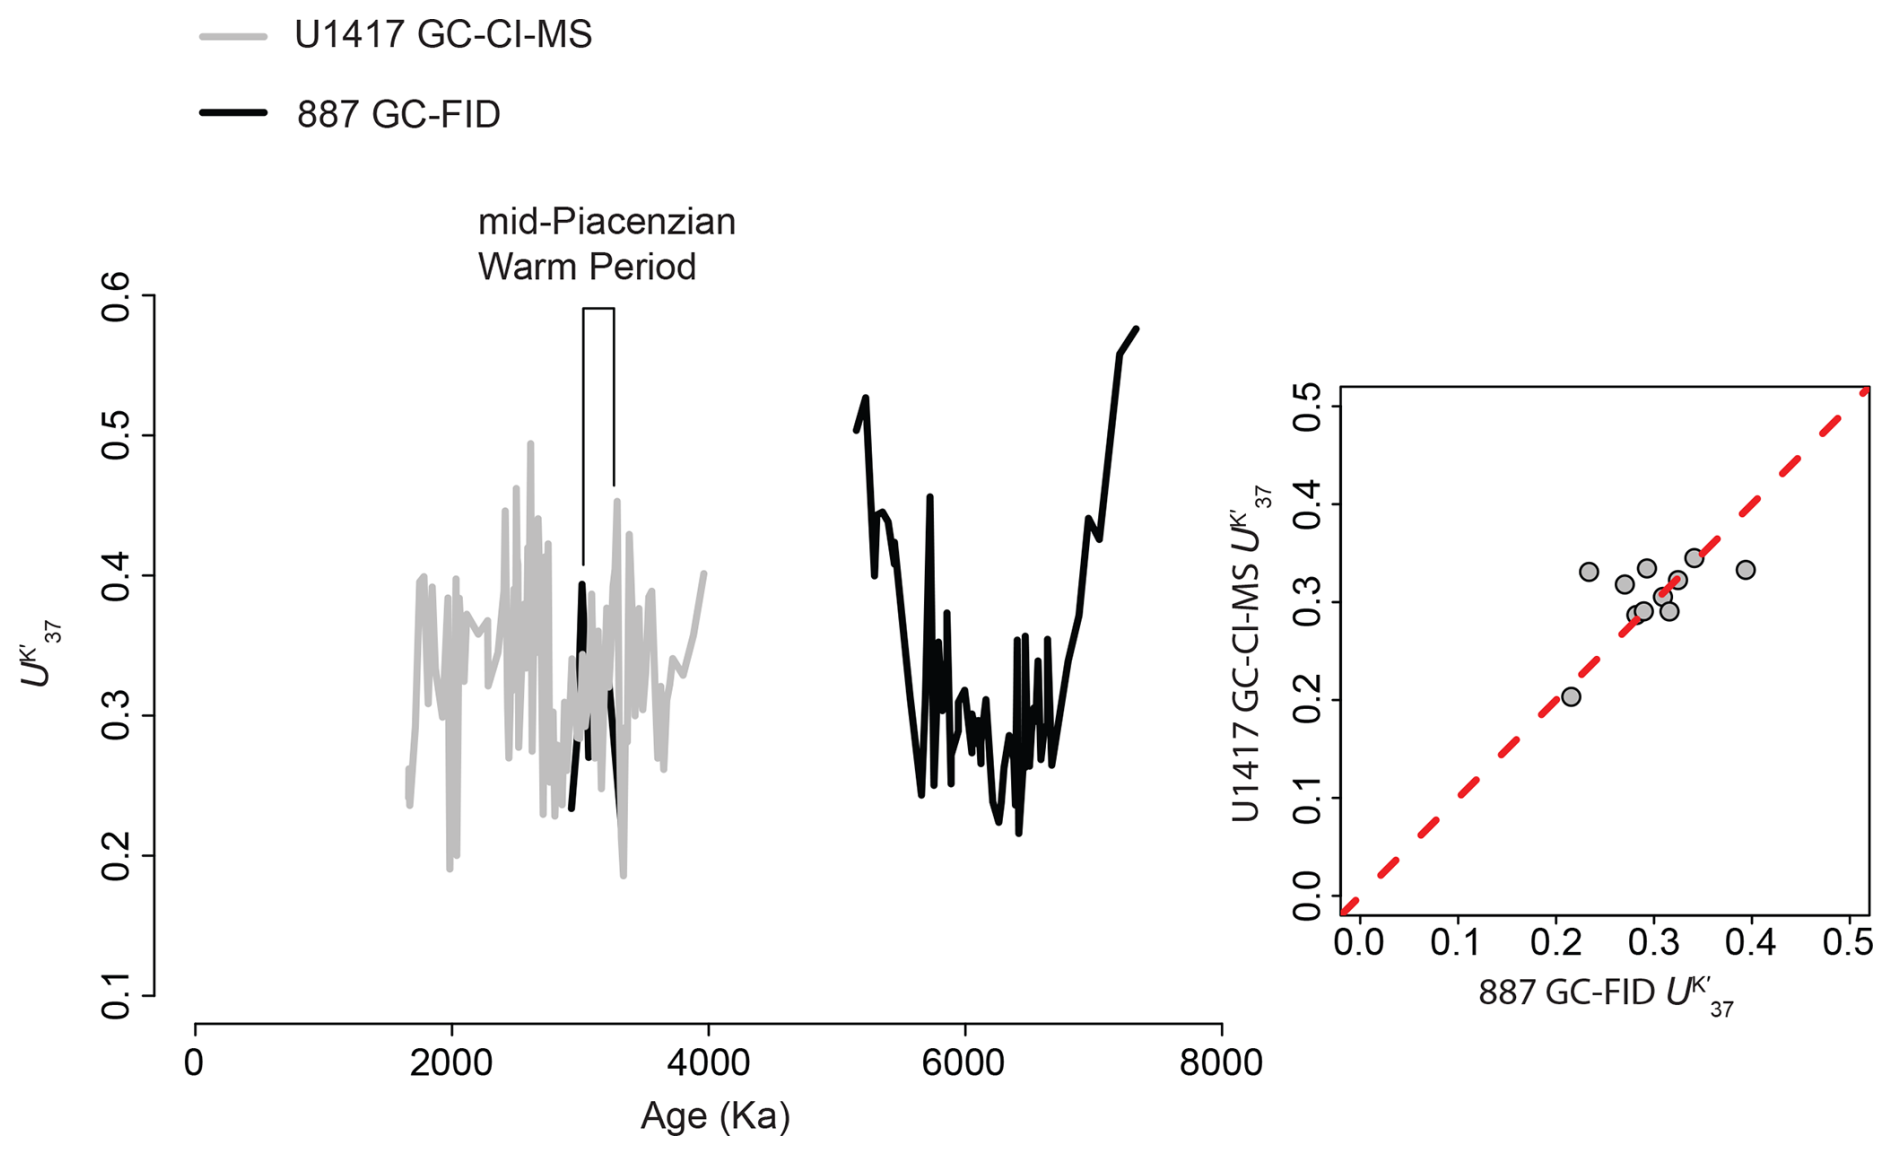
Figure 6GC-CI-MS vs. GC-FID alkenone unsaturation rations from the subpolar northeast Pacific (Dowsett et al., 2017; Herbert et al., 2016; Sánchez-Montes et al., 2020).
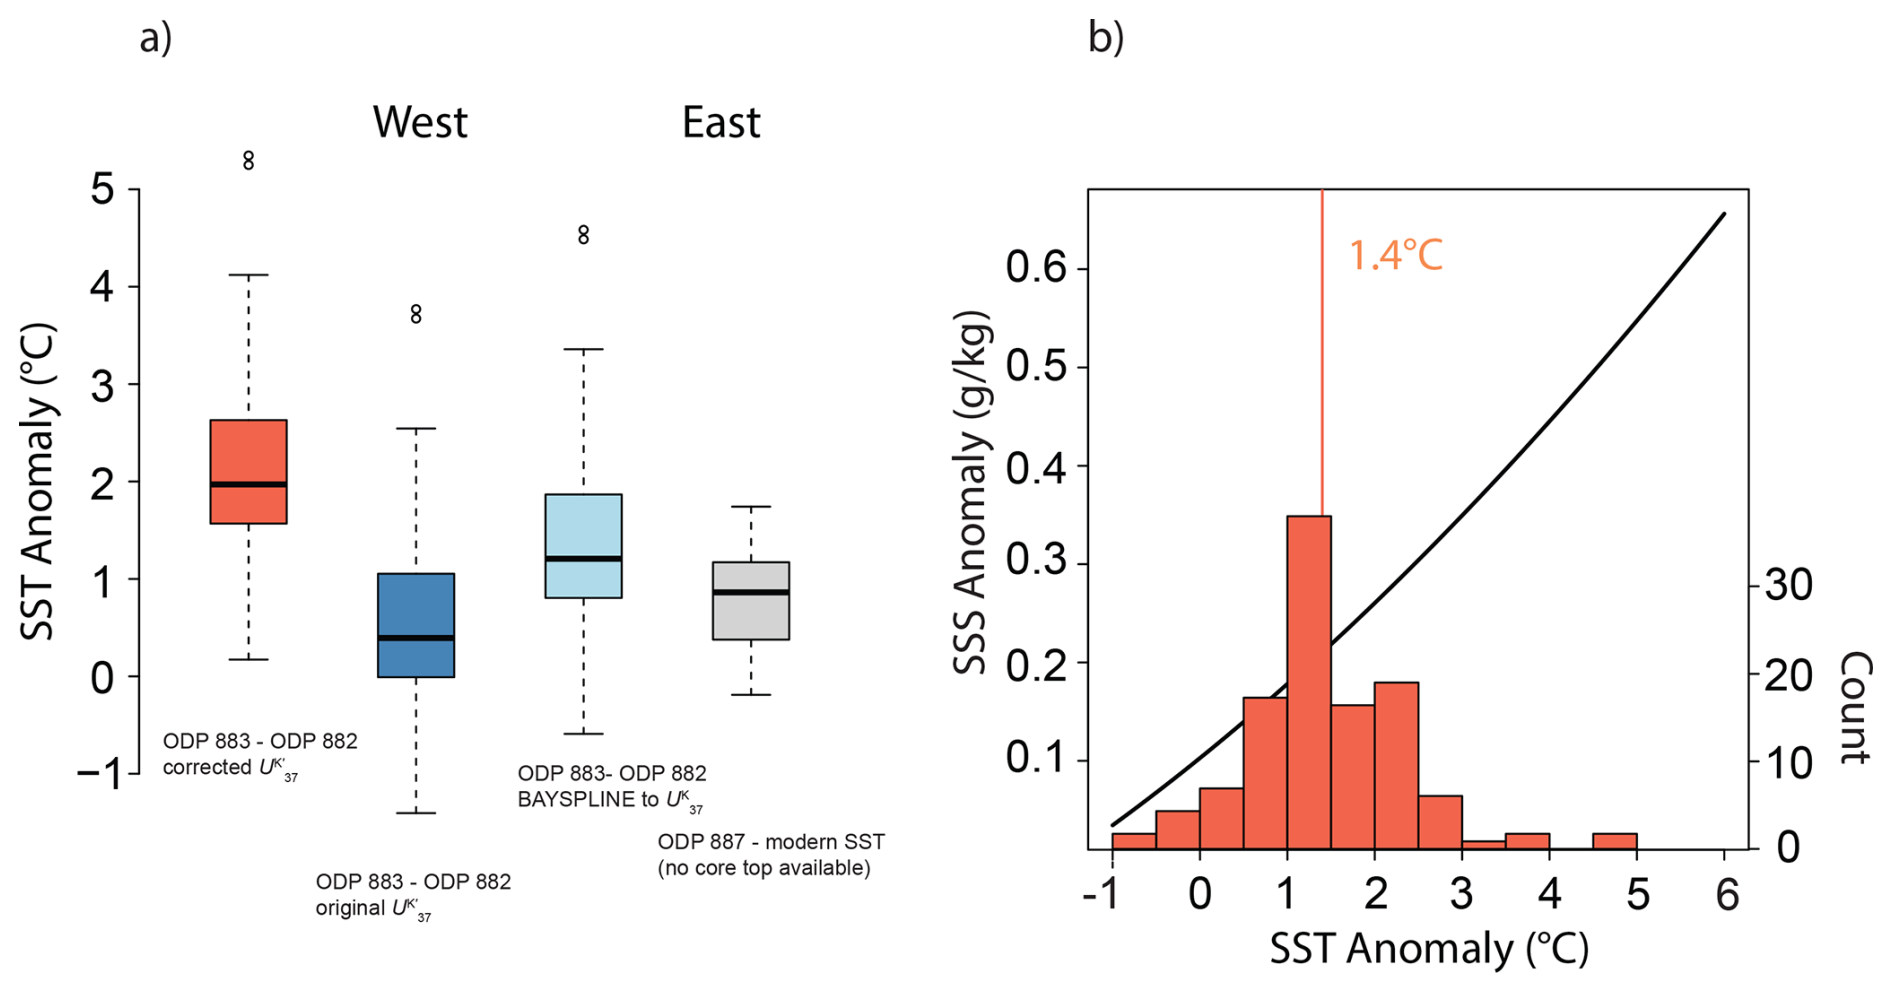
Figure 7Effect of the proposed correction to the ODP Site 882 GC-CI-MS alkenone dataset on the inferred changes in the east-to-west SST gradient in the subarctic North Pacific during the mid-Piacenzian Warm Period. (a) Effect of the proposed temperature correction on the reconstructed zonal warming in the subarctic North Pacific. (b) Relationship between sea surface salinity (SSS) and SST anomalies when holding surface water density constant calculated from TEOS-10 (Feistel, 2018; McDougall and Barker, 2011). Histogram shows the distribution of median mid-Piacenzian SST anomalies from ODP Site 883.
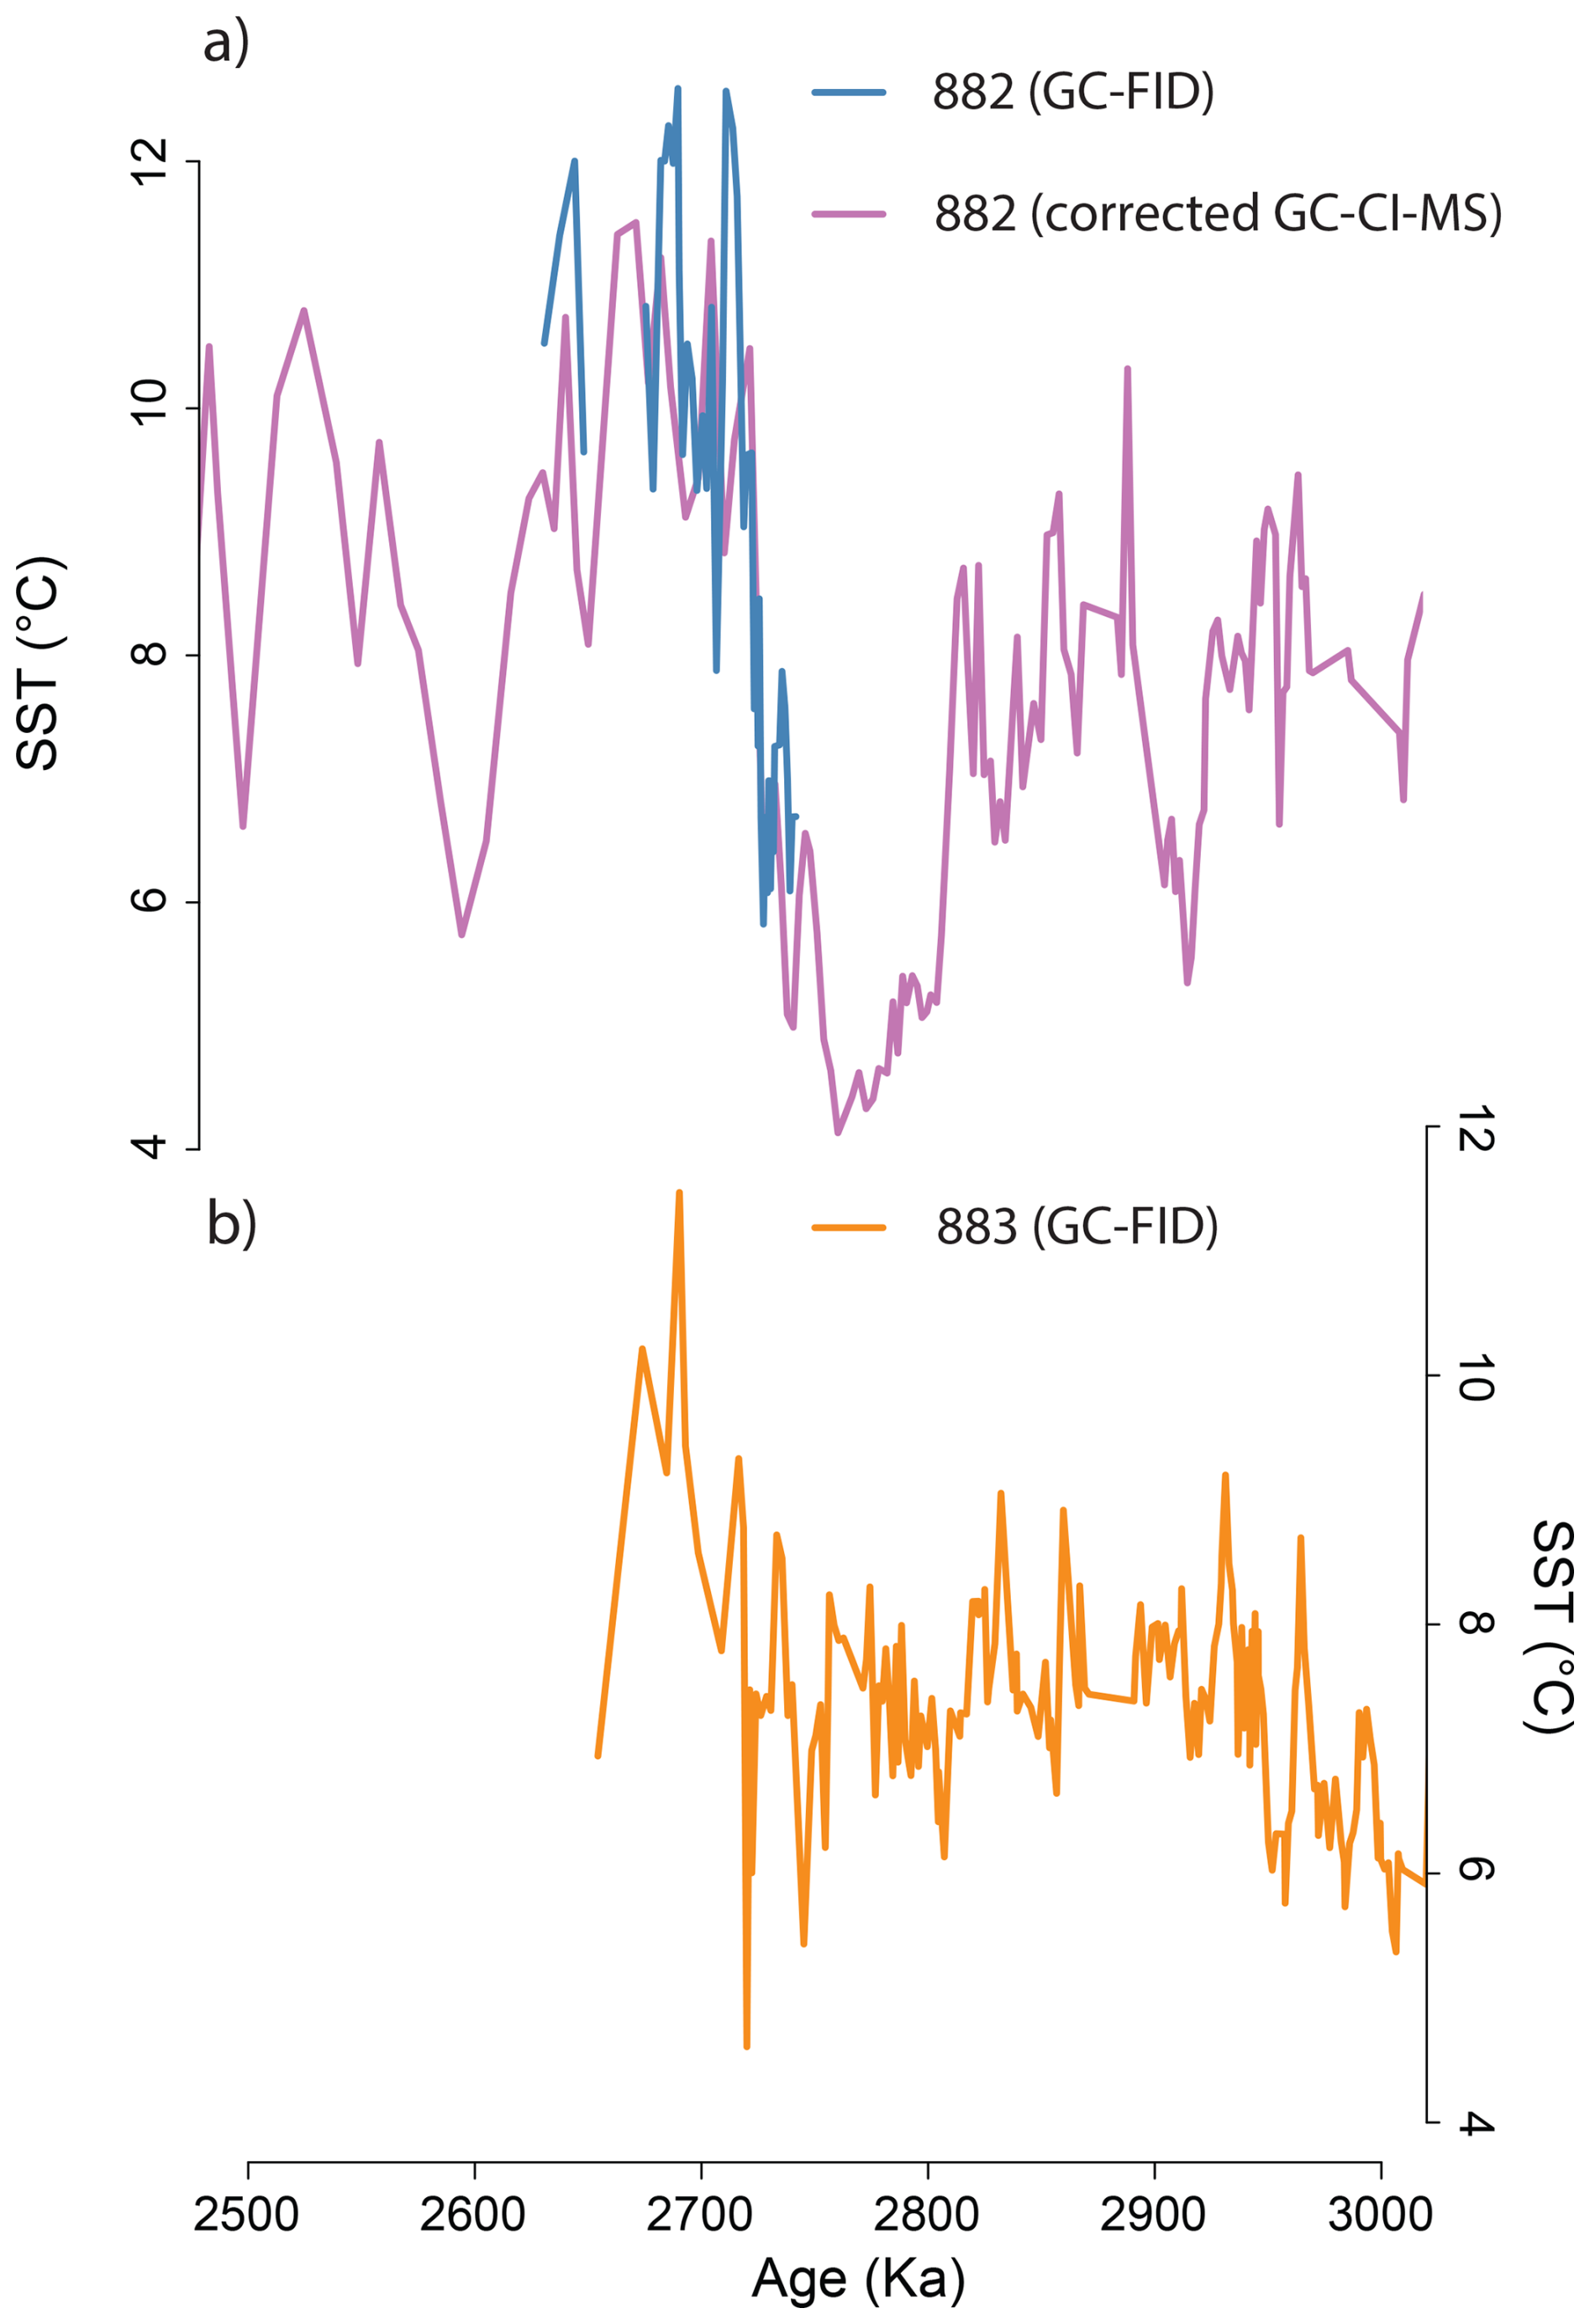
Figure 8Alkenone-derived SSTs around the 2.7 Ma interval at ODP Sites 882 and 883. (a) SSTs at ODP Site 882. (b) SSTs at ODP Site 883.
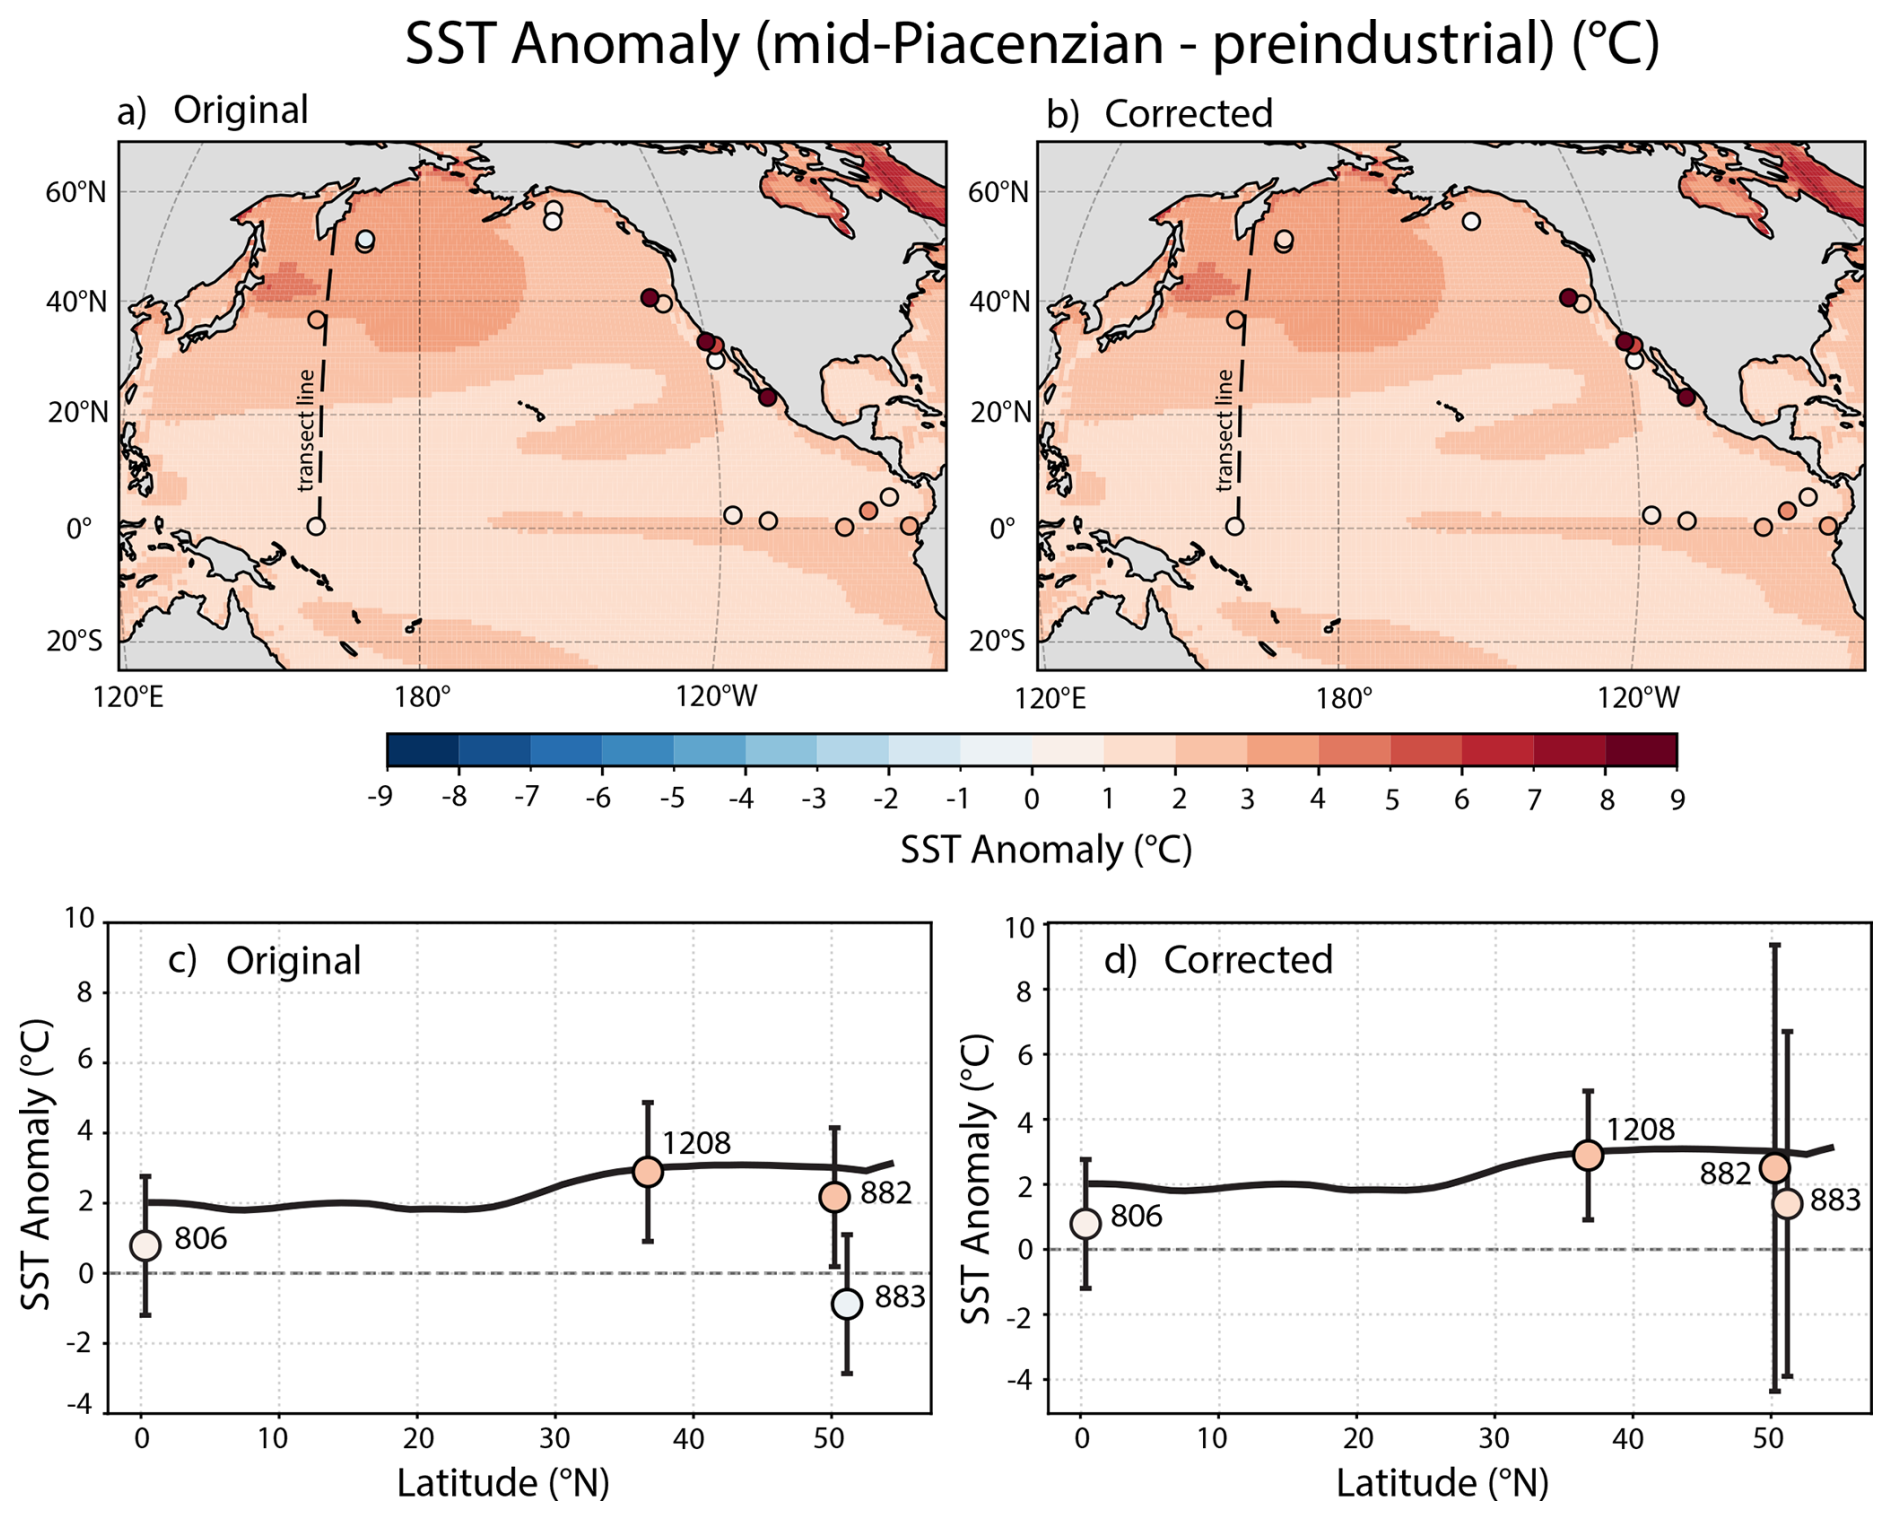
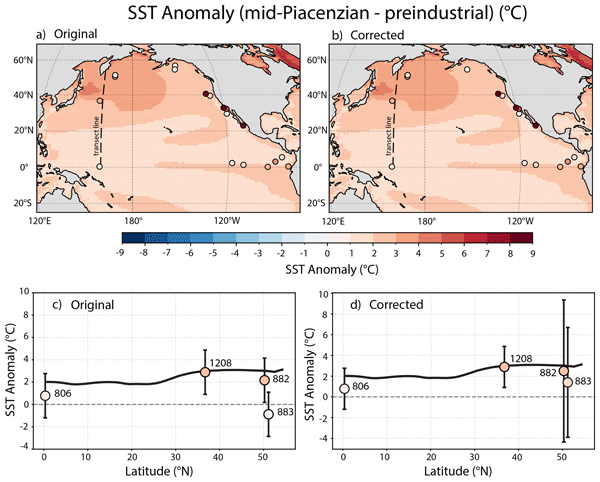
Figure 9Comparison between mid-Piacenzian subpolar North Pacific alkenone SST anomalies and mean annual SST anomalies from the PlioMIP2 multi-model ensemble (Haywood et al., 2020). (a) Data-model comparison (cf., Brennan et al., 2022; Tierney et al., 2019). (b) Data-model comparison with the corrected record. (c) Mean and uncertainty of the SST anomalies along 160° E in the North Pacific. (d) Mean and uncertainty of the SST anomalies along 160° E in the North Pacific, accounting for the additional analytical uncertainties in the ODP Site 882 record. Note the increase in ODP Site 883 uncertainty also due to using the Site 882 core top in the anomaly calculation. In both (c) and (d), the black line is the multi-model ensemble mean along the transect line in (a) and (b).
3.4 Implications for reconstructing regional paleoceanographic history
Correction of the ODP Site 882 alkenone SST record has notable implications for our understanding of long-term patterns of climate change in the subarctic North Pacific and for inferences of regional patterns of warming in the late Pliocene. To date, the GC-CI-MS alkenone dataset from ODP Site 882 is the only continuous subarctic North Pacific SST record that spans the entirety of the Quaternary. Consequently, this dataset is crucial for calculating SST anomalies – that is, the difference between ancient SST estimates and the SST estimate of the core top sample, which is assumed to represent the preindustrial SST – that are often used for testing the ability of Earth System Models to simulate warmth in this oceanographic region (see Sect. 3.5).
The reporting error in the Pangaea data table and the analytical artifacts we address with our proposed correction are of the opposite sign: (1) values are systematically lower than and (2) GC-CI-MS values are larger than GC-FID values (Figs. 2a and 3). Here, we discuss the implications of these corrections for reconstructing regional SST patterns in the subarctic North Pacific during the mid-Piacenzian Warm Period since several studies have unknowingly used mislabelled values to characterise regional SSTs with a SST calibration (e.g., Brennan et al., 2022; Tierney et al., 2019, 2025b).
The proposed correction results in a median alkenone core top SST value of 6.4±2.5 °C (±1σ) from ODP Site 882. This is cooler than both the core top SST estimate when BAYSPLINE is applied to the mislabelled values (7.2±1.4 °C) or to the original dataset (8.1±1.4 °C). The mid-Piacenzian Warm Period SST anomaly of the corrected dataset is 2.5±3.5 °C compared to 1.8±2.0 °C when BAYSPLINE is applied to the mislabelled values or 2.8±2.0 °C in the case of the original dataset. The differences in median SST values are small, but the uncertainties associated with the corrected dataset are substantially larger than previously recognized and are important for the relative weighting of the ODP Site 882 GC-CI-MS dataset in paleoclimate data-model comparisons and data assimilation exercises (Haywood et al., 2016; Tierney et al., 2025a). It should be noted that the mid-Piacenzian Warm Period SST estimates in the corrected dataset are sparse (n=2), so these mean temperature values will likely change as new data are generated.
The proposed correction also impacts calculated SST anomalies from the nearby ODP Site 883 since the core top value from ODP Site 882 can reasonably be used for this calculation. The ODP Site 883 mid-Piacenzian Warm Period SST anomaly shifts to 1.4±2.7 °C from 0.6±2.0 °C (BAYSPLINE to ODP 882 core top value) or °C (BAYSPLINE to original ODP 882 core top value). The proposed correction to the ODP Site 882 dataset therefore contributes towards resolving uncertainties regarding the zonal pattern of SST change in the subarctic North Pacific during the mid-Piacenzian Warm Period (Fig. 7a). The mean SST anomalies at ODP Sites 883 and 887 were not significantly different prior to the correction (0.6 or −0.3 vs. 0.05 °C, p=0.08 or p=0.3, two-sided t-test), but are significantly different after the correction (1.4 vs. 0.05 °C, p=0.0014, Fig. 7a). The temperature difference between the east and west subarctic North Pacific is tightly linked to the strength and position of the Aleutian Low and its interaction with regional ocean currents (Zhou, 2019), a pattern which is reflected by the distribution of core top values in the subarctic North Pacific (Max et al., 2020). The reduced mid-Piacenzian zonal subarctic North Pacific SST gradient suggests a northwards shift of the Aleutian Low and a concomitant northwards shift of the Kuroshio Extension (Sugimoto and Hanawa, 2010; Wang and Wu, 2019). Consequently, the subpolar gyre was possibly contracted during the mid-Piacenzian relative to the preindustrial period (Park et al., 2012). These inferences are consistent with a growing body of marine and terrestrial paleoclimate data suggestive of a northwards-shifted midlatitude westerly jet during the mid-Piacenzian warm period relative to the preindustrial (Abell et al., 2021; Li et al., 2015; Novak et al., 2026).
The pattern of deep ocean circulation in the mid-Piacenzian warm period is disputed, with controversy surrounding the existence, or lack thereof, of deep water formation in the subarctic northwest Pacific (Burls et al., 2017; Ford et al., 2022; Novak et al., 2024; Tierney et al., 2025b). The corrected ODP Site 882 alkenone SST record clarifies that the source waters of North Pacific Intermediate Water and any potential North Pacific Deep Water were likely warmer in the mid-Piacenzian than during the preindustrial era (cf., Talley, 1993), which informs the sea surface salinity dynamics required for any intermediate, or potentially deep, waters to form in this region (Burls et al., 2017). Warmer SSTs on the order of ∼1.4 °C correspond to a decerase in the density of surface waters by 0.31 kg m−3 (see Sect. 2.5). An increase in sea surface salinity of 0.24 g kg−1 would be required to compensate for the temperature-driven decrease in surface water density (Fig. 7b), which exceeds the current seasonal variability of sea surface salinity in the Kuroshio Extension region (Wakita et al., 2010). The warmth reconstructed in the subarctic northwest Pacific by the corrected ODP Site 882 alkenone record therefore indicates that any density-driven overturning in this region, either intermediate or deep, would have required even greater changes to regional patterns of sea surface salinity to counterbalance weakened temperature-driven buoyancy forcing than previously recognized (cf., Burls et al., 2017).
A major feature of the ODP Site 882 GC-CI-MS alkenone SST record is the warming signal across the 2.7 Ma interval (Fig. 8), which has been interpreted as a signal of the onset of regional surface ocean stratification and enhanced seasonal SST contrast (Haug et al., 2005). This signal persists in the corrected ODP Site 882 GC-CI-MS dataset and is further corroborated by the GC-FID datasets (Fig. 8). While the different datasets disagree on the amplitude of SST change across this interval (Fig. 8), all three alkenone records indicate statistically significant warming of SSTs across the 2.7 Ma interval (ODP Site 883 GC-FID: 1.9±1.4 °C, p=0.01; ODP Site 882 GC-FID: 3.0±1.4 °C, p<0.001; corrected ODP Site 882 GC-CI-MS: 2.7±2.3 °C, p<0.001). This unusual alkenone-based SST observation has also been corroborated by TEX86 measurements (Studer et al., 2012). The agreement on the sign of SST change and the overlapping 95 % confidence intervals of these four independent estimates confirms that the SSTs recorded by alkenones warmed across the 2.7 Ma interval.
3.5 Implications for regional paleoclimate data-model comparisons
The zonally asymmetric warming that we observe in subarctic North Pacific alkenone SST records is reproduced by the PlioMIP2 mutli-model mean (Haywood et al., 2020; Fig. 9). Notably, the warming pattern observed in the PlioMIP2 multi-model mean is consistent with a northwards expansion of the Kurishiro Extension (Sugimoto and Hanawa, 2010; Wang and Wu, 2019). This contrasts with the removal of this zonally asymmetric warming feature from some, but not all, data assimilation and reduced space reconstructions of late Pliocene SST patterns (cf., Annan et al., 2024; Tierney et al., 2019, 2025b). We suspect that this difference is due to the previously unrecognized reporting errors and uncertainties in the ODP Site 882 GC-CI-MS alkenone dataset and hypothesize that zonally asymmetric warming in the subarctic North Pacific will be a feature of future mid-Piacenzian data assimilation products that incorporate the corrected dataset proposed here (uncertainties shown in Fig. 9c vs. d).
Here, we identified two previously unrecognized sources of uncertainty in the alkenone SST record measured by GC-CI-MS from ODP Site 882 (Haug, 1995): (1) the misreporting of values in the electronic data archive as (https://doi.org/10.1594/PANGAEA.315092, Haug and Sarnthein, 2005) and (2) analytical uncertainties inherent to the different relationships between analyte concentration and instrument response on GC-CI-MS vs. GC-FID (Chaler et al., 2000, 2003; Hefter, 2008). As an alternative to the original data, we offer a corrected dataset that accounts for the additional uncertainties in the GC-CI-MS ODP Site 882 SST estimates. The corrected ODP Site 882 alkenone SST record has qualitatively similar trends to the data reported in the original studies (Haug, 1995; Haug et al., 2005; Martínez-Garcia et al., 2010). Therefore, the correction does not affect the main conclusions of those studies. However, the absolute SSTs and their uncertainties show a substantial offset. The corrected record clarifies both the magnitude and, particularly for the mid-Piacenzian Warm Period, the zonal pattern of warming in the subarctic North Pacific in the late Neogene. The data suggest greater warming in the western subarctic North Pacific compared to the east, which is consistent with a northwards shifted Aleutian Low and Kuroshio Extension. Importantly, these geologic observations are consistent with SSTs simulated by PlioMIP2, which underscores the need for the careful evaluation of paleo SST estimates when assessing climate model simulations with geologic data. We recommend that future studies aiming to assess the accuracy of Earth System Model simulations of Pliocene climate be cognizant of the complex offset and uncertainties in the absolute SST estimates and magnitude of SST change reported at ODP Site 882.
Our findings underscore the need for careful evaluation of the datasets incorporated into paleoclimate data-model comparison exercises (Fig. 9). The advantages of the GC-CI-MS technique in both sensitivity and selectivity can be particularly useful in samples with trace alkenone abundances or complex chromatographic backgrounds. In these cases, we emphasize the need for instrument-specific calibrations to calculate GC-FID-equivalent values from GC-CI-MS measurements so that the data produced in these instances can be used in future paleoclimate data-model comparisons. Limiting data-model comparisons to alkenone datasets produced by GC-FID, or with GC-FID-equivalent values, will ensure that the proxy data under consideration are intercomparable.
The corrected ODP Site 882 alkenone sea surface temperature record is available on Zenodo: https://doi.org/10.5281/zenodo.18883167 (Novak et al., 2026).
The supplement related to this article is available online at https://doi.org/10.5194/cp-22-1277-2026-supplement.
JBN designed and carried out the data analysis. RPCG measured alkenones at ODP Site 883. AMG measured alkenones by GC-FID at ODP Site 882. TDH and HJD obtained funding support. JBN wrote the original manuscript draft. JBN, RPCG, TDH, HJD, and AMG edited the final manuscript.
The contact author has declared that none of the authors has any competing interests.
Publisher's note: Copernicus Publications remains neutral with regard to jurisdictional claims made in the text, published maps, institutional affiliations, or any other geographical representation in this paper. The authors bear the ultimate responsibility for providing appropriate place names. Views expressed in the text are those of the authors and do not necessarily reflect the views of the publisher.
This research used data generated from samples provided by the International Ocean Discovery Program (IODP). We thank Gerald H. Haug for fruitful discussions that improved the manuscript. Any use of trade, firm, or product names is for descriptive purposes only and does not imply endorsement by the U.S. Government.
This work was funded by the National Science Foundation through grant nos. 1545859 (TDH), 1459280 (TDH), and 1602331 (TDH) and the U.S. Geological Survey Ecosystems Land Change Science Program (HJD). AMG acknowledges funding from the Max Planck Society.
This paper was edited by Erin McClymont and reviewed by Ronnakrit Rattanasriampaipong, David Naafs, and one anonymous referee.
Abell, J. T., Winckler, G., Anderson, R. F., and Herbert, T. D.: Poleward and weakened westerlies during Pliocene warmth, Nature, 589, 70–75, https://doi.org/10.1038/s41586-020-03062-1, 2021.
Annan, J. D., Hargreaves, J. C., Mauritsen, T., McClymont, E., and Ho, S. L.: Can we reliably reconstruct the mid-Pliocene Warm Period with sparse data and uncertain models?, Clim. Past, 20, 1989–1999, https://doi.org/10.5194/cp-20-1989-2024, 2024.
Banzon, V., Smith, T. M., Liu, C., and Hankins, W.: A long-term record of blended satellite and in situ sea-surface temperature for climate monitoring, modeling and environmental studies, Earth Syst. Sci. Data, 8, 165–176, https://doi.org/10.5194/essd-8-165-2016, 2016.
Bendle, J. and Rosell-Melé, A.: Distributions of and in the surface waters and sediments of the Nordic Seas: Implications for paleoceanography, Geochem. Geophy. Geosy., 5, 1–19, https://doi.org/10.1029/2004GC000741, 2004.
Brassell, S. C., Eglinton, G., Marlowe, I. T., Pflaumann, U., and Sarnthein, M.: Molecular stratigraphy: A new tool for climatic assessment, Nature, 320, 129–133, https://doi.org/10.1038/320129a0, 1986.
Brennan, P. R., Bhattacharya, T., Feng, R., Tierney, J. E., and Jorgensen, E. M.: Patterns and Mechanisms of Northeast Pacific Temperature Response to Pliocene Boundary Conditions, Paleoceanogr. Paleoclimatol., 37, https://doi.org/10.1029/2021PA004370, 2022.
Burls, N. J., Fedorov, A. V., Sigman, D. M., Jaccard, S. L., Tiedemann, R., and Haug, G. H.: Active Pacific meridional overturning circulation (PMOC) during the warm Pliocene, Sci. Adv., 3, 1–13, https://doi.org/10.1126/sciadv.1700156, 2017.
Burls, N. J., Bradshaw, C. D., De Boer, A. M., Herold, N., Huber, M., Pound, M., Donnadieu, Y., Farnsworth, A., Frigola, A., Gasson, E., von der Heydt, A. S., Hutchinson, D. K., Knorr, G., Lawrence, K. T., Lear, C. H., Li, X., Lohmann, G., Lunt, D. J., Marzocchi, A., Prange, M., Riihimaki, C. A., Sarr, A. C., Siler, N., and Zhang, Z.: Simulating Miocene Warmth: Insights From an Opportunistic Multi-Model Ensemble (MioMIP1), Paleoceanogr. Paleoclimatol., 36, 1–40, https://doi.org/10.1029/2020PA004054, 2021.
Chaler, R., Grimalt, J. O., Pelejero, C., and Calvo, E.: Sensitivity Effects in Paleotemperature Estimation by Chemical Ionization Mass Spectrometry, Anal. Chem., 72, 5892–5897, https://doi.org/10.1021/ac001014q, 2000.
Chaler, R., Villanueva, J., and Grimalt, J. O.: Non-linear effects in the determination of paleotemperature alkenone ratios by chemical ionization mass spectrometry, J. Chromatogr. A, 1012, 87–93, https://doi.org/10.1016/S0021-9673(03)01188-9, 2003.
Clark, P. U., Shakun, J. D., Rosenthal, Y., Köhler, P., and Bartlein, P. J.: Global and regional temperature change over the past 4.5 million years, Science, 383, 884–890, https://doi.org/10.1126/science.adi1908, 2024.
Clark, P. U., Shakun, J. D., Rosenthal, Y., Pollard, D., Hostetler, S. W., Köhler, P., Bartlein, P. J., Gregory, J. M., Zhu, C., Schrag, D. P., Liu, Z., and Pisias, N. G.: Global mean sea level over the past 4.5 million years, Science, 390, https://doi.org/10.1126/science.adv8389, 2025.
Conte, M. H., Sicre, M. A., Rühlemann, C., Weber, J. C., Schulte, S., Schulz-Bull, D., and Blanz, T.: Global temperature calibration of the alkenone unsaturation index () in surface waters and comparison with surface sediments, Geochem. Geophy. Geosy., 7, https://doi.org/10.1029/2005GC001054, 2006.
Dowsett, H. J., Robinson, M. M., Foley, K. M., and Herbert, T. D.: PRISM late Pliocene (Piacenzian) alkenone-derived SST data, US Geological Survey (USGS) Data Release, 378, https://doi.org/10.5066/F7959G1S, 2017.
Durham, E., Maslin, M., Platzman, E., Rosell-Melé, A., Marlow, J., Leng, M., Lowry, D., and Burns, S.: Reconstructingt he climatic history of the western coast of Africa over the past 1.5 : a comparison of proxy records from the Congo Basin and the Walvis Ridge and the search for evidence of the mid-Pleistocene revolution, in: Proceedings of the Ocean Drilling Program, Scientific Results, vol. 175, edited by: Wefer, G., Berger, W. H., and Richter, C., 1–46, https://doi.org/10.2973/odp.proc.sr.175.229.2001, 2001.
Feistel, R.: Thermodynamic properties of seawater, ice and humid air: TEOS-10, before and beyond, Ocean Sci., 14, 471–502, https://doi.org/10.5194/os-14-471-2018, 2018.
Ford, H. L., Burls, N. J., Jacobs, P., Jahn, A., Caballero-Gill, R. P., Hodell, D. A., and Fedorov, A. V: Sustained mid-Pliocene warmth led to deep water formation in the North Pacific, Nat. Geosci., 15, 658–663, https://doi.org/10.1038/s41561-022-00978-3, 2022.
Harada, N., Katsuki, K., Nakagawa, M., Matsumoto, A., Seki, O., Addison, J. A., Finney, B. P., and Sato, M.: Holocene sea surface temperature and sea ice extent in the Okhotsk and Bering Seas, Prog. Oceanogr., 126, 242–253, https://doi.org/10.1016/j.pocean.2014.04.017, 2014.
Haug, G. H.: Zur Paläo-Ozeanographie und Sedimentationsgeschichte im Nordwest-Pazifik während der letzten 6 Millionen Jahre (ODP-Site 882), PhD, Christian-Albrechts-Universität zu Kiel, Kiel, 1995.
Haug, G. H. and Sarnthein, M.: Uk37, Sea surface temperature and pigment data of ODP Site 145-882, PANGAEA [data set], https://doi.org/10.1594/PANGAEA.315092, 2005.
Haug, G. H., Ganopolski, A., Sigman, D. M., Rosell-Mele, A., Swann, G. E. A., Tiedemann, R., Jaccard, S. L., Bollmann, J., Maslin, M. A., Leng, M. J., and Eglinton, G.: North Pacific seasonality and the glaciation of North America 2.7 million years ago, Nature, 433, 821–825, https://doi.org/10.1038/nature03332, 2005.
Haywood, A. M., Dowsett, H. J., and Dolan, A. M.: Integrating geological archives and climate models for the mid-Pliocene warm period, Nat. Commun., 7, https://doi.org/10.1038/ncomms10646, 2016.
Haywood, A. M., Tindall, J. C., Dowsett, H. J., Dolan, A. M., Foley, K. M., Hunter, S. J., Hill, D. J., Chan, W.-L., Abe-Ouchi, A., Stepanek, C., Lohmann, G., Chandan, D., Peltier, W. R., Tan, N., Contoux, C., Ramstein, G., Li, X., Zhang, Z., Guo, C., Nisancioglu, K. H., Zhang, Q., Li, Q., Kamae, Y., Chandler, M. A., Sohl, L. E., Otto-Bliesner, B. L., Feng, R., Brady, E. C., von der Heydt, A. S., Baatsen, M. L. J., and Lunt, D. J.: The Pliocene Model Intercomparison Project Phase 2: large-scale climate features and climate sensitivity, Clim. Past, 16, 2095–2123, https://doi.org/10.5194/cp-16-2095-2020, 2020.
Hefter, J.: Analysis of Alkenone Unsaturation Indices with Fast Gas Chromatography/Time-of-Flight Mass Spectrometry, Anal. Chem., 80, 2161–2170, https://doi.org/10.1021/ac702194m, 2008.
Herbert, T. D.: Alkenone Paleotemperature Determinations, Treatise on Geochemistry, 6, 391–432, https://doi.org/10.1016/B0-08-043751-6/06115-6, 2003.
Herbert, T. D., Lawrence, K. T., Tzanova, A., Peterson, L. C., Caballero-Gill, R., and Kelly, C. S.: Late Miocene global cooling and the rise of modern ecosystems, Nat. Geosci., 9, 843–847, https://doi.org/10.1038/ngeo2813, 2016.
Ho, S. L., Mollenhauer, G., Lamy, F., Martínez-garcia, A., Mohtadi, M., Gersonde, R., Hebbeln, D., Nunez-ricardo, S., Rosell-melé, A., and Tiedemann, R.: Sea surface temperature variability in the Pacific sector of the Southern Ocean over the past 700 kyr, Paleoceanography, 27, 1–16, https://doi.org/10.1029/2012PA002317, 2012.
Huber, M. and Caballero, R.: The early Eocene equable climate problem revisited, Clim. Past, 7, 603–633, https://doi.org/10.5194/cp-7-603-2011, 2011.
Judd, E. J., Tierney, J. E., Huber, B. T., Wing, S. L., Lunt, D. J., Ford, H. L., Inglis, G. N., McClymont, E. L., O'Brien, C. L., Rattanasriampaipong, R., Si, W., Staitis, M. L., Thirumalai, K., Anagnostou, E., Cramwinckel, M. J., Dawson, R. R., Evans, D., Gray, W. R., Grossman, E. L., Henehan, M. J., Hupp, B. N., MacLeod, K. G., O'Connor, L. K., Sánchez Montes, M. L., Song, H., and Zhang, Y. G.: The PhanSST global database of Phanerozoic sea surface temperature proxy data, Sci. Data, 9, 753, https://doi.org/10.1038/s41597-022-01826-0, 2022.
Li, X., Jiang, D., Zhang, Z., Zhang, R., Tian, Z., and Yan, Q.: Mid-Pliocene westerlies from PlioMIP simulations, Adv. Atmos. Sci., 32, 909–923, https://doi.org/10.1007/s00376-014-4171-7, 2015.
Liao, S. and Huang, Y.: Group 2i Isochrysidales flourishes at exceedingly low growth temperatures (0 to 6 °C), Org. Geochem., 174, 104512, https://doi.org/10.1016/j.orggeochem.2022.104512, 2022.
Liao, S., Wang, K. J., and Huang, Y.: Unusually high production of C37:4 alkenone by an Arctic Gephyrocapsa huxleyi strain grown under nutrient-replete conditions, Org. Geochem., 177, 104539, https://doi.org/10.1016/j.orggeochem.2022.104539, 2023.
Longo, W. M., Dillon, J. T., Tarozo, R., Salacup, J. M., and Huang, Y.: Unprecedented separation of long chain alkenones from gas chromatography with a poly(trifluoropropylmethylsiloxane) stationary phase, Org. Geochem., 65, 94–102, https://doi.org/10.1016/j.orggeochem.2013.10.011, 2013.
Madureira, L. A. S., van Kreveld, S. A., Eglinton, G., Conte, M. H., Ganssen, G., van Hinte, J. E., and Ottens, J. J.: Late Quaternary high-resolution biomarker and other sedimentary climate proxies in a Northeast Atlantic Core, Paleoceanography, 12, 255–269, https://doi.org/10.1029/96PA03120, 1997.
Marlowe, I. T., Brassell, S. C., Eglinton, G., and Green, J. C.: Long chain unsaturated ketones and esters in living algae and marine sediments, Org. Geochem., 6, 135–141, 1984.
Marlowe, I. T., Brassell, S. C., Eglinton, G., and Green, J. C.: Long-chain alkenones and alkyl alkenoates and the fossil coccolith record of marine sediments, Chem. Geol., 88, 349–375, https://doi.org/10.1016/0009-2541(90)90098-R, 1990.
Martínez-Garcia, A., Rosell-Melé, A., McClymont, E. L., Gersonde, R., and Haug, G. H.: Subpolar Link to the Emergence of the Modern Equatorial Pacific Cold Tongue, Science, 328, 1550–1553, https://doi.org/10.1126/science.1184480, 2010.
Max, L., Lembke-Jene, L., Zou, J., Shi, X., and Tiedemann, R.: Evaluation of reconstructed sea surface temperatures based on from sediment surface samples of the North Pacific, Quaternary Sci. Rev., 243, 106496, https://doi.org/10.1016/j.quascirev.2020.106496, 2020.
McClymont, E. L. and Rosell-Melé, A.: Links between the onset of modern Walker circulation and the mid-Pleistocene climate transition, Geology, 33, 389, https://doi.org/10.1130/G21292.1, 2005.
McClymont, E. L., Rosell-Melé, A., Haug, G. H., and Lloyd, J. M.: Expansion of subarctic water masses in the North Atlantic and Pacific oceans and implications for mid-Pleistocene ice sheet growth, Paleoceanography, 23, https://doi.org/10.1029/2008PA001622, 2008.
McDougall, T. J. and Barker, P. M.: Getting started with TEOS-10 and the Gibbs Seawater (GSW) oceanographic toolbox, Scor/iapso WG, 127, 1–28, ISBN 978-0-646-55621-5, 2011.
Müller, P. J., Kirst, G., Ruhland, G., Von Storch, I., and Rosell-Melé, A.: Calibration of the alkenone paleotemperature index based on core-tops from the eastern South Atlantic and the global ocean (60° N–60° S), Geochim. Cosmochim. Ac., 62, 1757–1772, https://doi.org/10.1016/S0016-7037(98)00097-0, 1998.
Novak, J., Caballero-Gill, R., Herbert, T., Dowsett, H., andMartínez-García, A.: Supporting data for “Correcting a Systematic Bias in an Ocean Drilling Project Site 882 Alkenone Sea Surface Temperature Record”, Zenodo [data set], https://doi.org/10.5281/zenodo.18883167, 2026.
Novak, J., Mcgrath, S. M., Wang, K. J., Liao, S., Steven, C., Kuhnt, W., and Huang, Y.: ME Expands the Linear Dynamic Range of the Alkenone Sea Surface Temperature Proxy, Geochim. Cosmochim. Ac., https://doi.org/10.1016/j.gca.2022.04.021, 2022.
Novak, J. B., Caballero-Gill, R. P., Rose, R. M., Herbert, T. D., and Dowsett, H. J.: Isotopic evidence against North Pacific Deep Water formation during late Pliocene warmth, Nat. Geosci., 17, 795–802, https://doi.org/10.1038/s41561-024-01500-7, 2024.
Novak, J. B., Prokopenko, A. A., Tarasov, P. E., Russell, J. M., Lindemuth, E. R., Shichi, K., Kashiwaya, K., Peck, J., Vachula, R. S., Swann, G. E. A., and Polissar, P. J.: Early Pleistocene ecosystem turnover in South Siberia linked to abrupt regional cooling, Nat. Geosci., 19, 331–338, https://doi.org/10.1038/s41561-025-01914-x, 2026.
Osman, M. B., Tierney, J. E., Zhu, J., Tardif, R., Hakim, G. J., King, J., and Poulsen, C. J.: Globally resolved surface temperatures since the Last Glacial Maximum, Nature, 599, 239–244, https://doi.org/10.1038/s41586-021-03984-4, 2021.
Park, Y.-H., Yoon, J.-H., Youn, Y.-H., and Vivier, F.: Recent Warming in the Western North Pacific in Relation to Rapid Changes in the Atmospheric Circulation of the Siberian High and Aleutian Low Systems*, J. Climate, 25, 3476–3493, https://doi.org/10.1175/2011JCLI4142.1, 2012.
Prahl, F. G. and Wakeham, S. G.: Calibration of unsaturation patterns in long-chain ketone compositions for palaeotemperature assessment, Nature, 330, 367–369, 1987.
Prahl, F. G., Rontani, J. F., Zabeti, N., Walinsky, S. E., and Sparrow, M. A.: Systematic pattern in – Temperature residuals for surface sediments from high latitude and other oceanographic settings, Geochim. Cosmochim. Ac., 74, 131–143, https://doi.org/10.1016/j.gca.2009.09.027, 2010.
Rea, D. K., Basov, I. A., Janecek, T. R., Palmer-Julson, A., and Shipboard Scientific, P.: Initial report: Site 882, in: Proceedings of the Ocean Drilling Program| 145 Initial Reports, Ocean Drilling Program, https://doi.org/10.2973/odp.proc.ir.145.106.1993, 1993a.
Rea, D. K., Basov, I. A., Janecek, T. R., Palmer-Julson, A., and Party, S. S.: Initial report: Site 883, Proceedings of the Ocean Drilling Program, Initial Reports, 145, https://doi.org/10.2973/odp.proc.ir.145.107.1993, 1993b.
Roberts, J., McCave, I. N., McClymont, E. L., Kender, S., Hillenbrand, C.-D., Matano, R., Hodell, D. A., and Peck, V. L.: Deglacial changes in flow and frontal structure through the Drake Passage, Earth Planet. Sc. Lett., 474, 397–408, https://doi.org/10.1016/j.epsl.2017.07.004, 2017.
Rosell-Mele, A., Carter, J. F., Parry, A. T., and Eglintont, G.: Determination of the Index in Geological Samples, Anal. Chem., 1283–1289, https://doi.org/10.1021/ac00103a021, 1995.
Rosell-Melé, A.: Interhemispheric appraisal of the value of alkenone indices as temperature and salinity proxies in high-latitude locations, Paleoceanography, 13, 694–703, https://doi.org/10.1029/98PA02355, 1998.
Rosell-Melé, A., Eglinton, G., Pflaumann, U., and Sarnthein, M.: Atlantic core-top calibration of the index as a sea-surface palaeotemperature indicator, Geochim. Cosmochim. Ac., 59, 3099–3107, https://doi.org/10.1016/0016-7037(95)00199-A, 1995.
Rosell-Melé, A., Bard, E., Emeis, K.-C., Grimalt, J. O., Müller, P., Schneider, R., Bouloubassi, I., Epstein, B., Fahl, K., Fluegge, A., Freeman, K., Goñi, M., Güntner, U., Hartz, D., Hellebust, S., Herbert, T., Ikehara, M., Ishiwatari, R., Kawamura, K., Kenig, F., de Leeuw, J., Lehman, S., Mejanelle, L., Ohkouchi, N., Pancost, R. D., Pelejero, C., Prahl, F., Quinn, J., Rontani, J.-F., Rostek, F., Rullkötter, J., Sachs, J., Blanz, T., Sawada, K., Schulz-Bull, D., Sikes, E., Sonzogni, C., Ternois, Y., Versteegh, G., Volkman, J. K., and Wakeham, S.: Precision of the current methods to measure the alkenone proxy and absolute alkenone abundance in sediments: Results of an interlaboratory comparison study, Geochem. Geophy. Geosy., 2, https://doi.org/10.1029/2000GC000141, 2001.
Rostek, F., Ruhlandt, G., Bassinot, F. C., Muller, P. J., Labeyrie, L. D., Lancelot, Y., and Bard, E.: Reconstructing sea surface temperature and salinity using δ18O and alkenone records, Nature, 364, 319–321, https://doi.org/10.1038/364319a0, 1993.
Sánchez-Montes, M. L., McClymont, E. L., Lloyd, J. M., Müller, J., Cowan, E. A., and Zorzi, C.: Late Pliocene Cordilleran Ice Sheet development with warm northeast Pacific sea surface temperatures, Clim. Past, 16, 299–313, https://doi.org/10.5194/cp-16-299-2020, 2020.
Sikes, E. L., Farrington, J. W., and Keigwin, L. D.: Use of the alkenone unsaturation ratio to determine past sea surface temperatures: core-top SST calibrations and methodology considerations, Earth Planet. Sc. Lett., 104, 36–47, https://doi.org/10.1016/0012-821X(91)90235-A, 1991.
Studer, A. S., Martínez-Garcia, A., Jaccard, S. L., Girault, F. E., Sigman, D. M., and Haug, G. H.: Enhanced stratification and seasonality in the Subarctic Pacific upon Northern Hemisphere Glaciation-New evidence from diatom-bound nitrogen isotopes, alkenones and archaeal tetraethers, Earth Planet. Sc. Lett., 351–352, 84–94, https://doi.org/10.1016/j.epsl.2012.07.029, 2012.
Sugimoto, S. and Hanawa, K.: Impact of Aleutian Low activity on the STMW formation in the Kuroshio recirculation gyre region, Geophys. Res. Lett., 37, https://doi.org/10.1029/2009GL041795, 2010.
Talley, L. D.: Distribution and Formation of North Pacific Intermediate Water, American Meteorological Society, 23, 517–537, 1993.
Tierney, J. E. and Tingley, M. P.: BAYSPLINE: A New Calibration for the Alkenone Paleothermometer, Paleoceanogr. Paleoclimatol., 33, 281–301, https://doi.org/10.1002/2017PA003201, 2018.
Tierney, J. E., Haywood, A. M., Feng, R., Bhattacharya, T., and Otto-Bliesner, B. L.: Pliocene Warmth Consistent With Greenhouse Gas Forcing, Geophys. Res. Lett., 46, 9136–9144, https://doi.org/10.1029/2019GL083802, 2019.
Tierney, J. E., Poulsen, C. J., Montañez, I. P., Bhattacharya, T., Feng, R., Ford, H. L., Hönisch, B., Inglis, G. N., Petersen, S. V., Sagoo, N., Tabor, C. R., Thirumalai, K., Zhu, J., Burls, N. J., Foster, G. L., Goddéris, Y., Huber, B. T., Ivany, L. C., Kirtland Turner, S., Lunt, D. J., McElwain, J. C., Mills, B. J. W., Otto-Bliesner, B. L., Ridgwell, A., and Zhang, Y. G.: Past climates inform our future, Science, 370, https://doi.org/10.1126/science.aay3701, 2020.
Tierney, J. E., Judd, E. J., Osman, M. B., King, J. M., Truax, O. J., Steiger, N. J., Amrhein, D. E., and Anchukaitis, K. J.: Advances in Paleoclimate Data Assimilation, Annu. Rev. Earth Pl. Sc., 53, 625–650, https://doi.org/10.1146/annurev-earth-032320-064209, 2025a.
Tierney, J. E., King, J., Osman, M. B., Abell, J. T., Burls, N. J., Erfani, E., Cooper, V. T., and Feng, R.: Pliocene Warmth and Patterns of Climate Change Inferred From Paleoclimate Data Assimilation, AGU Advances, 6, https://doi.org/10.1029/2024AV001356, 2025b.
van Dommelen, N., McNally, C., and Herbert, T. D.: Plio–Pleistocene Evolution of the Benguela and Agulhas Currents, Paleoceanogr. Paleoclimatol., 41, https://doi.org/10.1029/2024PA004960, 2026.
Villanueva, J. and Grimalt, J. O.: Pitfalls in the chromatographic determination of the alkenone index for paleotemperature estimation, J. Chromatogr. A, 723, 285–291, https://doi.org/10.1016/0021-9673(95)00471-8, 1996.
Villanueva, J. and Grimalt, J. O.: Gas Chromatographic Tuning of the Paleothermometer, Anal. Chem., 69, 3329–3332, https://doi.org/10.1021/ac9700383, 1997.
Villanueva, J., Pelejero, C., and Grimalt, J. O.: Clean-up procedures for the unbiased estimation of C37 alkenone sea surface temperatures and terrigenous n-alkane inputs in paleoceanography, J. Chromatogr. A, 757, 145–151, https://doi.org/10.1016/S0021-9673(96)00669-3, 1997.
Wakita, M., Watanabe, S., Murata, A., Tsurushima, N., and Honda, M.: Decadal change of dissolved inorganic carbon in the subarctic western North Pacific Ocean, Tellus B, 62, 608, https://doi.org/10.1111/j.1600-0889.2010.00476.x, 2010.
Wang, K. J., Huang, Y., Majaneva, M., Belt, S. T., Liao, S., Novak, J., Kartzinel, T. R., Herbert, T. D., Richter, N., and Cabedo-sanz, P.: Group 2i Isochysidales produce characteristic alkenones reflecting sea ice distribution, Nat. Commun., 1–10, https://doi.org/10.1038/s41467-020-20187-z, 2021.
Wang, K. J., Huang, Y., Kartzinel, T., Majaneva, M., Richter, N., Liao, S., Andresen, C. S., and Vermassen, F.: Group 2i Isochrysidales thrive in marine and lacustrine systems with ice cover, Sci. Rep., 14, 11449, https://doi.org/10.1038/s41598-024-62162-4, 2024.
Wang, Y.-L. and Wu, C.-R.: Enhanced Warming and Intensification of the Kuroshio Extension, 1999–2013, Remote Sens.-Basel, 11, 101, https://doi.org/10.3390/rs11010101, 2019.
Weaver, P. P. E., Chapman, M. R., Eglinton, G., Zhao, M., Rutledge, D., and Read, G.: Combined coccolith, foraminiferal, and biomarker reconstruction of paleoceanographic conditions over the past 120 kyr in the northern North Atlantic (59° N, 23° W), Paleoceanography, 14, 336–349, https://doi.org/10.1029/1999PA900009, 1999.
Yamamoto, M. and Kobayashi, D.: Surface ocean cooling in the subarctic North Pacific during the late Pliocene suggests an atmospheric reorganization prior to extensive Northern Hemisphere glaciation, Deep-Sea Res. Pt. II, 125–126, 177–183, https://doi.org/10.1016/j.dsr2.2015.03.005, 2016.
Zheng, Y., Tarozo, R., and Huang, Y.: Optimizing chromatographic resolution for simultaneous quantification of long chain alkenones, alkenoates and their double bond positional isomers, Org. Geochem., 111, 136–143, https://doi.org/10.1016/j.orggeochem.2017.06.013, 2017.
Zhou, G.: Atmospheric Response to Sea Surface Temperature Anomalies in the Mid-latitude Oceans: A Brief Review, Atmos. Ocean, 57, 319–328, https://doi.org/10.1080/07055900.2019.1702499, 2019.