the Creative Commons Attribution 4.0 License.
the Creative Commons Attribution 4.0 License.
 | 27 Jan 2025
Last-millennium volcanic forcing and climate response using SO2 emissions
Lauren R. Marshall
Anja Schmidt
Andrew P. Schurer
Nathan Luke Abraham
Lucie J. Lücke
Rob Wilson
Kevin J. Anchukaitis
Gabriele C. Hegerl
Ben Johnson
Bette L. Otto-Bliesner
Esther C. Brady
Myriam Khodri
Kohei Yoshida
Climate variability in the last millennium (past 1000 years) is dominated by the effects of large-magnitude volcanic eruptions; however, a long-standing mismatch exists between model-simulated and tree-ring-derived surface cooling. Accounting for the self-limiting effects of large sulfur dioxide (SO2) injections and the limitations in tree-ring records, such as lagged responses due to biological memory, reconciles some of the discrepancy, but uncertainties remain, particularly for the largest tropical eruptions. The representation of volcanic forcing in the latest generation of climate models has improved significantly, but most models prescribe the aerosol optical properties rather than using SO2 emissions directly and including interactions between the aerosol, chemistry, and dynamics. Here, we use the UK Earth System Model (UKESM) to simulate the climate of the last millennium (1250–1850 CE) using volcanic SO2 emissions. Averaged across all large-magnitude eruptions, we find similar Northern Hemisphere (NH) summer cooling compared with other last-millennium climate simulations from the Paleoclimate Modelling Intercomparison Project Phase 4 (PMIP4), run with both SO2 emissions and prescribed forcing, and a continued overestimation of surface cooling compared with tree-ring reconstructions. However, for the largest-magnitude tropical eruptions in 1257 (Mt. Samalas) and 1815 (Mt. Tambora), some models, including UKESM1, suggest a smaller NH summer cooling that is in better agreement with tree-ring records. In UKESM1, we find that the simulated volcanic forcing differs considerably from the PMIP4 dataset used in models without interactive aerosol schemes, with marked differences in the hemispheric spread of the aerosol, resulting in lower forcing in the NH when SO2 emissions are used. Our results suggest that, for the largest tropical eruptions, the spatial distribution of aerosol can account for some of the discrepancies between model-simulated and tree-ring-derived cooling. Further work should therefore focus on better resolving the spatial distribution of aerosol forcing for past eruptions.
- Article
(8008 KB) - Full-text XML
-
Supplement
(3072 KB) - BibTeX
- EndNote


Large-magnitude stratospheric sulfur dioxide (SO2)-injecting volcanic eruptions are the dominant cause of surface temperature variations over the last millennium prior to the rise of anthropogenic greenhouse gases (Jungclaus et al., 2017; Schurer et al., 2013, 2014), but the magnitude, duration, and spatial structure of the radiative forcing from volcanic sulfate aerosol and of the surface cooling are subject to large uncertainties. Our understanding of the climate of the last millennium is based on proxy reconstructions and climate model simulations, yet climate model simulations have tended to overestimate the surface cooling following volcanic eruptions compared with tree-ring reconstructions (Wilson et al., 2016a; Timmreck et al., 2021; Schneider et al., 2017; Hartl-Meier et al., 2017; Masson-Delmotte et al., 2013) and instrumental observations (e.g. Marotzke and Forster, 2015), although internal climate variability, including the El Niño–Southern Oscillation (ENSO), can account for some of the differences over the instrumental period (Lehner et al., 2016; Schurer et al., 2023).
There are several possible non-exclusive explanations that could account for the last-millennium mismatch, including that the calculated volcanic forcing is too strong, that there are errors in dating eruptions (given uncertainties in the eruption year and season), that the models are too sensitive to the forcing, and that the proxy reconstructions are biased. Past volcanic emissions and volcanic forcing are derived from sulfate in ice cores. The ice core records are composited to produce an average of the sulfate deposited over the ice sheet, which is then converted to estimates of volcanic sulfur dioxide (SO2) emissions and further converted to aerosol optical properties, such as aerosol extinction, single-scattering albedo, and the asymmetry factor, using simple scalings and/or simple transport models (e.g. Gao et al., 2008; Crowley and Unterman, 2013; Toohey and Sigl, 2017). This output is then used to prescribe the aerosol optical properties and forcing for eruptions in climate model simulations without interactive sulfur chemistry and aerosol microphysical schemes (Jungclaus et al., 2017). The volcanic forcing could be too strong if the estimated SO2 emission was too large or due to uncertainties in the conversion of the emission into the optical properties, which is largely based on the relationship observed and simulated in models following the 1991 eruption of Mt. Pinatubo (Crowley and Unterman, 2013; Gao et al., 2008; Toohey and Sigl, 2017). These relationships between ice-sheet-deposited sulfate, emissions, and optical properties are unlikely to hold for all eruptions (Marshall et al., 2021), and consequently there is a large uncertainty associated with past forcing estimates. Volcanic eruptions with large injections of SO2 lead to larger sulfate aerosol particles (through condensation and coagulation) that limit the magnitude of the climatic response due to a reduced scattering efficiency and a higher aerosol removal rate (e.g. Pinto et al., 1989). Climate models with aerosol microphysical schemes that simulate an eruption using an initial emission of SO2 and account for aerosol growth and removal have demonstrated this limiting effect, with a smaller simulated surface cooling for large eruptions (e.g. Timmreck, 2012). For the largest tropical eruptions during the last millennium – the 1257 Mt. Samalas and the 1815 Mt. Tambora eruptions – Stoffel et al. (2015) found a smaller surface cooling in simulations using a 2D aerosol microphysical model that better agreed with tree-ring reconstructions, compared with simulations run with older volcanic forcing reconstructions where aerosol growth and subsequent self-limiting effects were either not accounted for (Gao et al., 2008) or based on a simple scaling (Crowley and Unterman, 2013). This study also found a slightly stronger cooling in their tree-ring reconstruction. The most recent volcanic forcing estimate for the last millennium, the Easy Volcanic Aerosol forcing generator run with the eVolv2k dataset for SO2 emissions (EVA(eVolv2k); Toohey and Sigl, 2017; Toohey et al., 2016), which is the recommended dataset for last-millennium simulations conducted as part of the Paleoclimate Modelling Intercomparison Project (PMIP4; Jungclaus et al., 2017), does account for the reduced forcing efficiency of sulfate aerosol for larger SO2 emissions also by applying a scaling (an idealised power law for eruptions greater than 1815 Mt. Tambora, ∼ 60 Tg SO2) and has updated eruption dates and improved spatial coverage. Although it provides a consistent reconstruction to be used across models without aerosol microphysics schemes, this forcing reconstruction does not explicitly include many chemical (e.g. the depletion of hydroxyl radicals) or dynamical (e.g. aerosol lofting and dispersion) and microphysical processes (e.g. the growth and removal of a population of aerosols that is not reflected in a single power law relationship) that may change the spatial aerosol distribution and the volcanic forcing.
Most eruptions in the last millennium are not attributed to specific volcanoes (of 127 identified eruptions between 800 and 1890 CE, only 30 have been confidently assigned to the volcano of origin); hence the eruption location, eruption season, and emission altitude are unknown. Assumptions must therefore be made (see Sect. 2.1.1) when creating the reconstructions for assigning the date and eruption source parameters, which affects the magnitude and spatial pattern of the volcanic forcing (e.g. Marshall et al., 2019; Toohey et al., 2011, 2019). By accounting for some of the uncertainties in the eruption year and season and in the magnitude of the SO2 emissions, Lücke et al. (2023), using a simple response model, demonstrated better model–tree-ring matches for some eruptions. It is also possible that the volcanic forcing could be overestimated for some eruptions due to our lack of knowledge of co-emissions of other volcanic gases, such as halogens and water vapour, that can affect the forcing (Staunton-Sykes et al., 2021; Legrande et al., 2016). In particular, the warming effect of water vapour has recently been demonstrated following the 2022 eruption of Hunga Tonga–Hunga Ha'apai (Sellitto et al., 2022) such that the volcanic forcing may be incorrect for past eruptions even if the SO2 emission is correct. Lastly, even if the volcanic forcing used in climate models was correct, models may still overestimate the climate response depending on the sensitivity of the model due to its radiation scheme and climate feedbacks (e.g. Chylek et al., 2020).
There are further uncertainties associated with the tree-ring proxy records themselves (Anchukaitis et al., 2012; Büntgen et al., 2021; D'arrigo et al., 2013; Mann et al., 2012; Anchukaitis and Smerdon, 2022). In particular, differences in the proxy response are found depending on whether the tree-ring reconstruction is based on tree-ring width (TRW) data, maximum latewood density (MXD) measurements, or both, with MXD showing a stronger cooling that aligns more closely with model simulations (Frank et al., 2007; D'arrigo et al., 2013; Esper et al., 2015; Anchukaitis and Smerdon, 2022). Zhu et al. (2020) demonstrated that the discrepancy between model-simulated surface cooling and tree-ring records could be partly resolved when accounting for factors related to the proxy reconstructions, such as the spatial coverage (e.g. Anchukaitis et al., 2012; Guillet et al., 2017a; Büntgen et al., 2022), biological memory in TRW vs. MXD (e.g. Esper et al., 2015; Lücke et al., 2019), the season that the proxy reconstructions represent (Anchukaitis et al., 2012), and proxy noise (Neukom et al., 2018). However, differences were still found for the largest tropical eruptions in the last millennium (1257 Mt. Samalas and 1815 Mt. Tambora).
Several climate models now simulate volcanic eruptions using complex 3D aerosol and sulfur chemistry schemes (e.g. Timmreck et al., 2018; Quaglia et al., 2023), but, prior to CMIP6, no models had conducted long transient simulations of the last millennium using this approach. Studies have instead focused on the satellite era and have demonstrated good skill compared to observations (e.g. Mills et al., 2017, 2016; Schmidt et al., 2018; Dhomse et al., 2020). In this study, we use version 1 of the UK Earth System Model (UKESM1) to run three ensemble-member simulations of most of the last millennium (between 1250–1850) using SO2 emissions directly to represent volcanic eruptions. Our simulations provide a substantial improvement compared to earlier models for realistically simulating volcanic eruptions over the last millennium. They are, however, computationally expensive, with each simulation taking over 1 physical year to run. Here we focus on the simulated Northern Hemisphere (NH) (40–75° N) summer (May–August; MJJA) land surface cooling and compare our UKESM1 output with tree-ring reconstructions and with other models that have simulated the same period. Our study aims to answer the following questions:
-
How does the simulated volcanic forcing in models with interactive aerosol capabilities compare with the EVA(eVolv2k) dataset, which is widely used in PMIP4 models without these capabilities?
-
How does the simulated NH summer cooling in PMIP4 models that prescribe the aerosol properties using EVA(eVolv2k) compare to those simulating the aerosol interactively using SO2 emissions?
-
Does using interactive aerosol modelling with the latest generation of complex aerosol climate models help to reconcile discrepancies between simulated and reconstructed cooling for the largest tropical eruptions?
-
Using the same model framework (UKESM1), how does simulated NH summer cooling differ between the two methods of volcanic forcing implementation (SO2 emissions vs. prescribing the optical properties from EVA(eVolv2k)) for the largest tropical eruptions?
2.1 Climate models
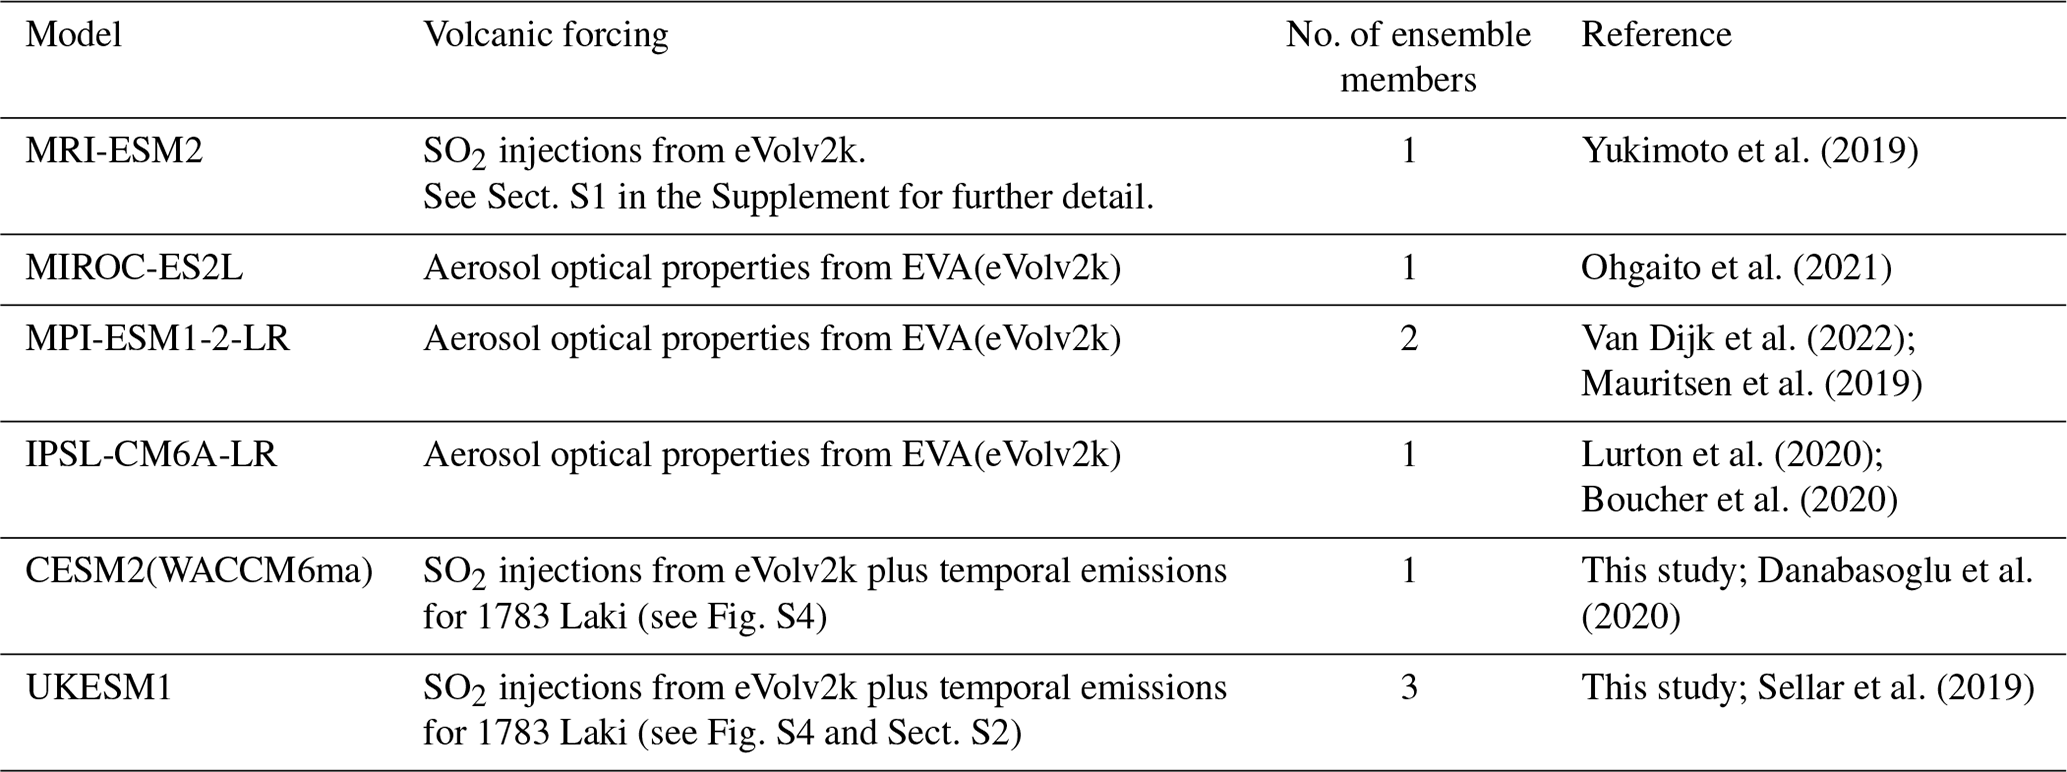
An overview of the climate models used in this study is presented in Table 1. Five models that ran the PMIP4 last-millennium simulation were available: MRI-ESM2, MIROC-ES2L, MPI-ESM1-2-LR, IPSL-CM6A-LR, and CESM2(WACCM6ma), all of which are complex Earth system models. Of these, two also used SO2 emissions (CESM2(WACCM6ma) and MRI-ESM2), and the remaining ones (MIROC-ES2L, MPI-ESM1-2-LR, and IPSL-CM6A-LR) prescribed the volcanic aerosol optical properties using EVA(eVolv2k). The SO2 dataset used in both UKESM1 and CESM2(WACCM6ma) is described below. Further detail on how the SO2 emissions were implemented in MRI-ESM2 is included in Sect. S1 in the Supplement. To minimise computational cost, our UKESM1 simulations start in 1250, and we therefore focus on the period 1250–1849 across all models (standard last-millennium PMIP4 simulations start in 850). Our analysis focuses on the surface air temperature and stratospheric aerosol optical depth. Model data are analysed on their native grids. The following sections describe our UKESM1 simulations.
2.1.1 UKESM1 overview
We used version 1 of the UK Earth System Model (UKESM1), a state-of-the-art model that includes an atmosphere–land–ocean–sea ice model, terrestrial and ocean biogeochemistry, and a comprehensive aerosol and chemistry scheme (Archibald et al., 2020; Mulcahy et al., 2020; Sellar et al., 2019). Two modifications from the original UKESM CMIP6 preindustrial release job were made: the first was to simulate stratospheric volcanic eruptions interactively using the GloMAP-mode aerosol microphysical scheme (Mann et al., 2010), removing the average background aerosol forcing file. The second was to correct a bug in the aerosol scheme that changes the sulfuric acid vapour as applied in version 1.1 of UKESM (Mulcahy et al., 2023; Ranjithkumar et al., 2021). The GloMAP-mode aerosol microphysical scheme has been used in many studies of volcanic eruptions in various configurations (Wade et al., 2020; Dhomse et al., 2014; Dhomse et al., 2020; Marshall et al., 2021). Here we used the version of GloMAP as included in the release version of UKESM1, which is the same as that applied in Aubry et al. (2021), Visioni et al. (2022), and Chim et al. (2023) but is slightly different to that used in Dhomse et al. (2020), in which three large volcanic eruptions were recently evaluated. The main differences include a dependency of the H2SO4 condensation on the vapour pressure deficit (Dhomse et al., 2014) and the evaporation of sulfate aerosol at high altitudes that is not included in the release version of UKESM1, and we do not simulate sulfuric meteoric smoke particles (Brooke et al., 2017; Marshall et al., 2018). In our version, mode-merging between the accumulation and course soluble models is also deactivated above 100 hPa rather than being turned off entirely (e.g. Dhomse et al., 2014; Marshall et al., 2019). Overall, the aerosol schemes remain similar, and simulations of 1991 Mt. Pinatubo using our setup show a very similar global mean stratospheric aerosol optical depth to Dhomse et al. (2020) (this study also used an older version of the climate model and a slightly lower injection altitude), which also compares well to observations (Fig. S1 in the Supplement).
2.1.2 Transient simulations
For simulating the last millennium, forcing files were made following the PMIP4 protocol (Jungclaus et al., 2017). Our simulations are aligned with the PMIP4 last-millennium experiment but deviate slightly due to computational restrictions. Instead of 850, our simulations start in 1250. We ran a 50-year spin-up from 1200 with the atmosphere and ocean fields initialised from the CMIP6 preindustrial control (1850 conditions). Because the sudden removal of agriculture will create empty land which the dynamic vegetation takes time to fill, it is better to start from initial conditions with less agriculture (so non-agricultural land is filled rather than suddenly created). Thus, the vegetation fractions for this spin-up were initialised from an 80-year-long UKESM spin-up run with constant forcing from the year 850 run using a slightly different model version with no interactive atmospheric chemistry (UKESM-CN). During these initial 50 years (1200–1250), the transient forcing (including emissions from the volcanic eruptions over this period) is applied. Further technical details and how the forcing was implemented in UKESM1 are included in Sect. S2. We ran three ensemble members, starting from the years 1249, 1250, and 1251 from the spin-up simulation. We also ran three historical simulations initialised from the end of each of these ensemble members. Output of basic climate states over the spin-up and the transient simulations (including surface temperature, top-of-the-atmosphere net downward radiative flux, precipitation, sea ice, sea surface temperature, and the Atlantic meridional overturning circulation) are included in the Supplement (Figs. S2 and S3). The global mean temperature is slightly higher compared to the UKESM1 CMIP6 preindustrial control simulation in line with the increase seen in UKESM1.1 (Mulcahy et al., 2023), likely a result of the update to the aerosol scheme and the change in how volcanic eruptions are simulated.
For the volcanic forcing, we use the SO2 emissions and eruption latitudes provided in v2 of the eVolv2k dataset (Toohey and Sigl, 2017). For eruptions that are unattributed to specific volcanoes, the longitude of the emission was set to 140° E (0° E is used in MRI-ESM2). In eVolv2k, the unattributed eruptions are assigned an eruption month of January. Because most eruptions are unattributed in the last millennium, this could introduce a potential bias when analysing the average response to volcanic eruptions (cf. Stevenson et al., 2017). We therefore chose to randomise the eruption month, assigning a month of either January, April, July, or October to those eruptions (Table S2). In MRI-ESM2, unknown eruptions are simulated on 1 January following the eVolv2k dataset. For the 1783–1784 eruption of Laki, we also deviate from the eVolv2k dataset in the UKESM1 and CESM2(WACCM6ma) simulations by including daily emissions that reflect the different eruption phases with vent emissions injected between 0 and 2 km and explosive emissions between 9 and 13 km (Schmidt et al., 2010). For all other eruptions, the SO2 emissions were injected between 18 and 20 km. Figure S4 and Table S2 show the resulting dataset used by both UKESM1 and CESM2(WACCM6ma). Further detail is included in Sect. S2.
2.1.3 Case study simulations
Further case study simulations of the three largest eruptions (1257 Mt. Samalas, 1458 unidentified, and 1815 Mt. Tambora) were also conducted using UKESM1, in which the model is used in its preindustrial configuration (background conditions representative of 1850) but with the above changes to the aerosol scheme. The 1458 eruption has recently been re-attributed to Kuwae in the latest eVolv2k dataset (v4), but, given sufficient uncertainty, we retain the unidentified classification in this work. For each eruption, we ran simulations using the SO2 emissions from Toohey and Sigl (2017) and simulations with aerosol optical properties prescribed from the EVA(eVolv2k) idealised forcing generator (Toohey et al., 2016). EVA(eVolv2k) includes zonal mean monthly mean datasets of the aerosol scattering, absorption, and asymmetry parameter as a function of wavelength through the solar and terrestrial spectrum, which were interpolated onto the UKESM1 grid and averaged across the spectral bands of the radiation scheme. Running with both direct SO2 emissions and prescribed aerosol optical properties enables a direct comparison between these two common approaches within the same modelling framework. Because the EVA(eVolv2k) dataset includes all eruptions, additional eruptions in 1260 (2 Tg SO2), 1463 (1 Tg SO2), 1821 (1 Tg SO2), and 1822 (4 Tg SO2) are included in the UKESM1 prescribed simulations but not in the emissions-driven ones. However, these additional eruptions are much smaller in magnitude and occur following the majority, if not all, of the volcanic forcing from the first eruption and consequently do not affect our main comparisons. For each eruption scenario, we ran nine ensemble members initialised during different ENSO and Quasi-Biennial Oscillation (QBO) phases chosen from the UKESM1 CMIP6 preindustrial control simulation (both ensembles start from the same conditions). We also ran nine equivalent control simulations with no stratospheric volcanic SO2 emission for the interactive runs and with average historical stratospheric aerosol optical depth (SAOD; 1850–2014) (as used in the UKESM preindustrial control simulation) in the prescribed runs because the EVA(eVolv2k) forcing dataset includes an additional background SAOD. Anomalies are calculated relative to the average of the nine control simulations for each ensemble. The background SAOD values in EVA(eVolv2k) (∼ 0.003) and the historical climatology (∼ 0.01) are not identical, but, as the volcanic perturbations to SAOD are orders of magnitude higher than the background, any differences due to the different backgrounds are negligible. All runs also include a very small background (∼ 0.001) due to aerosols from non-volcanic sources that the interactive aerosol scheme simulates in the stratosphere. The emissions-driven runs also have interactive aerosol surface area density, but climatological values are used in the prescribed simulations. The simulations were run for 10 years.
2.2 Tree-ring reconstructions
Our analysis focuses on four recent NH tree-ring reconstructions that represent the state of the art with respect to understanding past summer temperatures of the Common Era: NTREND2015 (Wilson et al., 2016a), Büntgen2021 (Büntgen et al., 2021a), Schneider2015 (Schneider et al., 2015a), and Guillet2017 (Guillet et al., 2017a). All records are high-resolution growing season temperature reconstructions but use different proxy networks and reflect different methodological approaches. NTREND2015 uses a network of 54 published tree-ring reconstructions across the Northern Hemisphere, 18 of which are based entirely on maximum latewood density (MXD) and 11 of which use only ring-width (TRW) measurements. A further 25 records are composed of some combination of TRW, MXD, and latewood blue intensity (BI; a proxy of latewood relative density). The NTREND reconstruction uses a temporally iterative “composite plus scale” method and extends back to 750 CE. It is calibrated to MJJA mean land-only data from CRUTEM, averaged over the latitudes 40 to 75° N. In contrast, Büntgen2021 uses a small network of nine long TRW with an array of methodologies to yield a 15-member ensemble of June–August (JJA) mean temperatures that extends back throughout the Common Era. Here, we use the median of the ensemble. The Schneider2015 record utilised 15 MXD chronologies from around the NH extratropics and is again calibrated to JJA temperatures. MXD expresses much lower autocorrelative persistence structure than TRW and has been shown to express a much clearer and less smeared response to past volcanic forcing (Anchukaitis et al., 2012). Guillet et al. (2017a) is an update of Stoffel et al. (2015) and uses a set of 25 tree-ring-width and density chronologies that extend back to the 13th century in a principal components regression approach to reconstructing June through August Northern Hemisphere (40–90° N over land) temperature anomalies. Guillet et al. (2017a) also include ice core oxygen isotope records from Greenland in their dataset. As in NTREND2015, Schneider2015 and Guillet2017 both contain wood density data and are therefore expected to express a stronger interannual temperature signal than the TRW-based Büntgen2021, but all four records have identified the signal of post-volcanic eruption cooling in their reconstructions. Because of the use of TRW data in NTREND2015, Büntgen2021, and Guillet2017, however, the temperature recovery following the peak cooling can last up to 1 decade, especially in NTREND2015, whereas MXD-only reconstructions (e.g. Schneider et al., 2015a) reflect a shorter period of post-eruption recovery (Anchukaitis and Smerdon 2022).
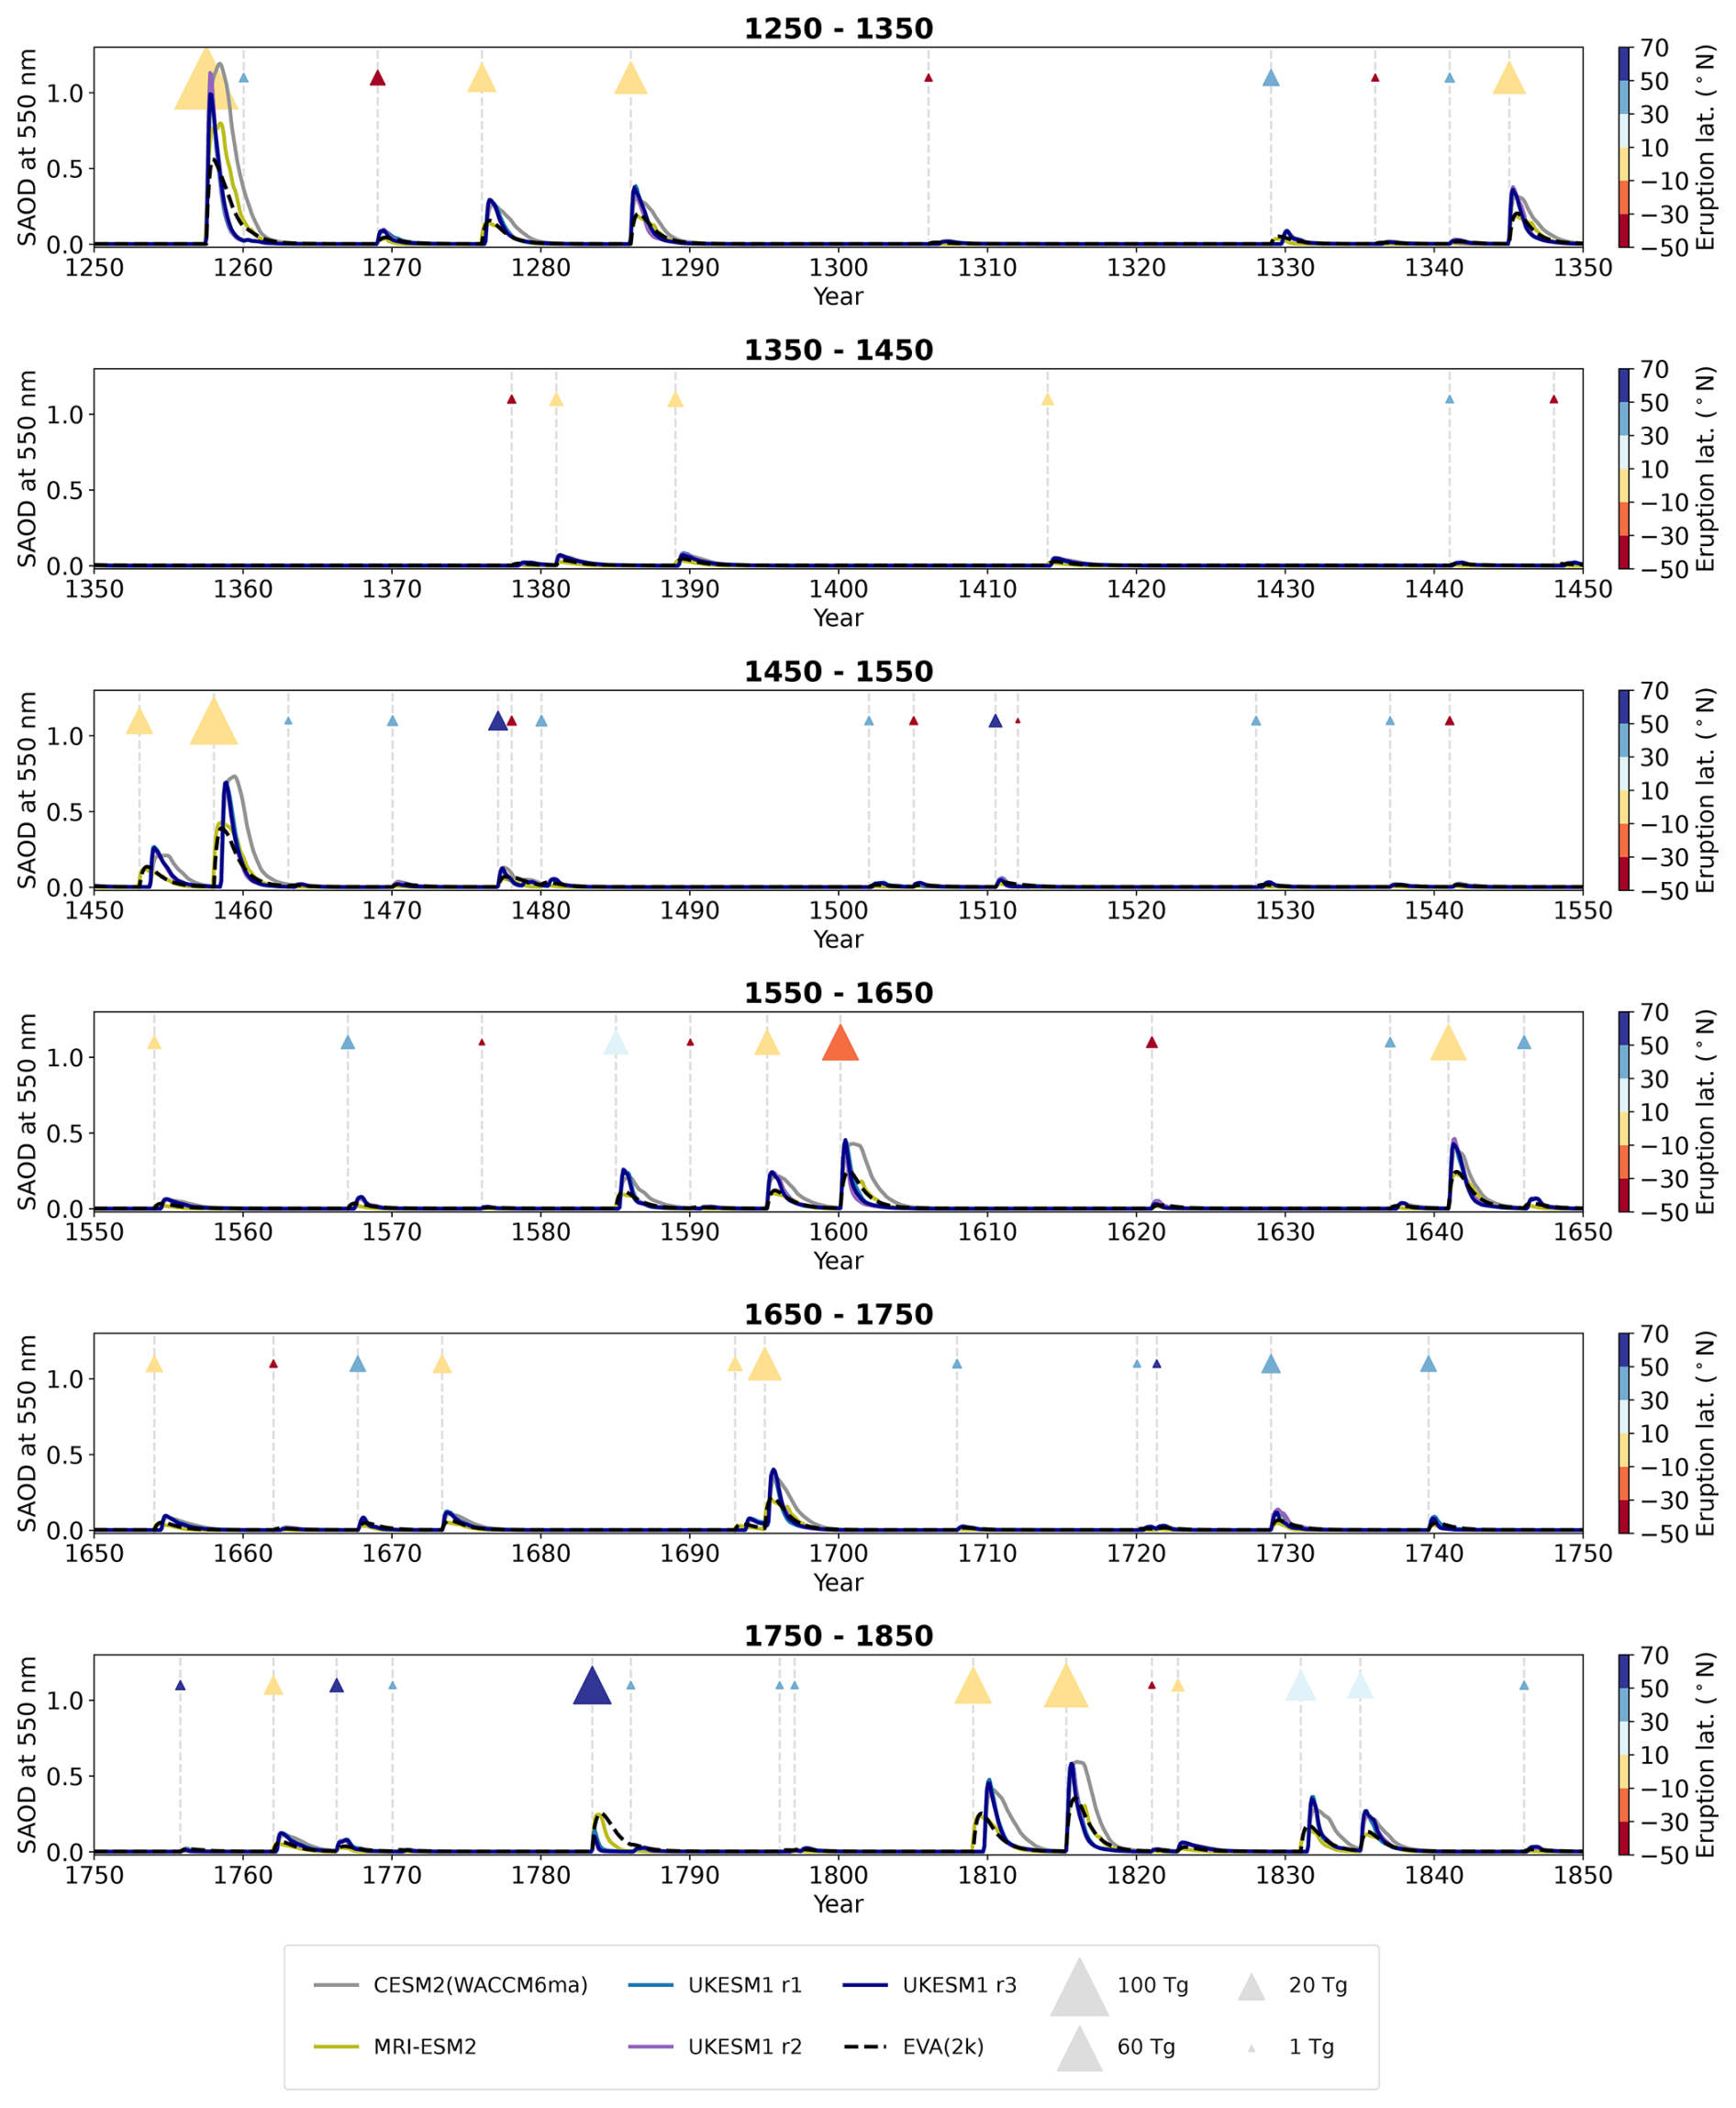
Figure 11250–1849 global mean monthly mean stratospheric aerosol optical depth (SAOD) at 550 nm simulated by UKESM1 (blues, purple), CESM2(WACCM6ma) (grey), and MRI-ESM2 (olive) and from the PMIP4 dataset, EVA(2k) (black). The time series is split into 100-year chunks. Eruptions are marked by the vertical dashed lines and triangles. The colour of each triangle shows the eruption latitude, and the size indicates the magnitude of the SO2 emission, ranging from 0.4 Tg (for the 1512 unidentified eruption) to 118 Tg (for the 1257 eruption of Samalas). The NH average SAOD is shown in Fig. S5.
3.1 Stratospheric aerosol optical depth 1250–1849
The global monthly mean SAOD time series from the EVA(eVolv2k) dataset (hereafter abbreviated to EVA(2k)) and as simulated by UKESM1, CESM2(WACCM6ma), and MRI-ESM2 are shown in Fig. 1, and NH averages are shown in Fig. S5. Zonal means are shown in Figs. S6–S9. There are several overall differences, although subtleties exist for individual eruptions. In general, these are as follows:
-
Peak global mean SAOD is similar between UKESM1 and CESM2(WACCM6ma) but higher than EVA(2k) (compare blue, purple, grey, and black lines).
-
Global mean SAOD in MRI-ESM2 (olive) (both peak and duration) is similar to EVA(2k) for most eruptions, except for 1257 Mt. Samalas, 1458 unidentified, and 1783 Laki, differing also to UKESM1 and CESM2(WACCM6ma) for these eruptions.
-
Global mean SAOD in UKESM1 decays more quickly compared to EVA(2k) for the largest tropical eruptions (see, for example, 1257 Mt. Samalas, 1458 unidentified, 1815 Mt. Tambora, 1600 Huaynaputina, 1640 Parker, and 1345 unidentified, which all have SO2 emissions greater than 30 Tg SO2). In contrast, CESM2(WACCM6ma) simulates a much longer decay in SAOD than both UKESM1 and EVA(2k) for the larger eruptions. MRI-ESM2, although similar to EVA(2k) for most eruptions, simulates a longer-lived SAOD signal than UKESM1 for Samalas but not as long as CESM2(WACCM6ma).
-
For small-magnitude eruptions (≲ 10 Tg of SO2), UKESM1 and CESM2(WACCM6ma) simulate similar global mean SAOD in both peak values and decay timescales, which is also closer to EVA(2k).
-
Hemispheric asymmetry is different between the models and EVA(2k) for the tropical eruptions. UKESM1 simulates a much stronger and confined tropical peak, whereas the SAOD is more spread in CESM2 and EVA(2k) (Figs. S7–S10). In MRI-ESM2, there is much greater SAOD in the Southern Hemisphere (SH) polar regions than in any other model.
-
Zonal mean SAOD is more similar between UKESM1 and CESM2(WACCM6ma) for the extratropical eruptions, with higher peak values compared to EVA(2k) and MRI-ESM2.
-
Global mean SAOD in volcanically quiescent years (i.e. background SAOD) is slightly smaller in UKESM1 and MRI-ESM2 (∼ 0.001) compared to CESM2(WACCM6ma) and EVA(2k) (∼ 0.003).
CESM2(WACCM6ma) simulates a much higher NH SAOD than UKESM1 for 1257 Mt. Samalas, 1458 unidentified, 1600 Huaynaputina, and 1815 Mt. Tambora despite similar peak values in the global mean, which results from differences in the spatial distribution of the sulfate aerosol following these tropical and large-magnitude (> 10 Tg SO2) eruptions (see Fig. S5). The three UKESM1 ensemble members also display greater spread in the NH for some tropical eruptions because of differences in the hemispheric dispersion of aerosol due to internal variability; see, for example, 1286 unidentified, 1345 unidentified, and 1640 Parker (Fig. S5). Some differences in the SAOD are also a result of the different season of eruption for unidentified eruptions in the EVA(2k) dataset and MRI-ESM2 vs. UKESM1 and CESM2(WACCM6ma) (Sect. 2.1.1), which leads to offsets in the SAOD; see, for example, 1329, 1453, 1458, 1654, 1693, 1809, and 1831. All eruptions that are simulated in different seasons between the models are highlighted in grey in Table S2.
The 1783–1784 eruption of Laki is the only eruption where the SAOD in EVA(2k) and MRI-ESM2 is higher and longer-lived than that simulated by UKESM1 and CESM2(WACCM6ma). In EVA(2k) and MRI-ESM2, the eruption is represented by a single emission of 42 Tg SO2 in June 1783. In UKESM1 and CESM2(WACCM6ma), Laki is represented by several smaller injections into the stratosphere and by tropospheric emissions spanning 1783–1784 (see inset in Fig. S4).
3.2 Surface air temperature 1250–1849
The differences in SAOD simulated among the three models using SO2 emissions and in the EVA(2k) dataset will result in differences in the simulated radiative forcing following the eruptions and consequently in the temperature response. Here we explore the response in UKESM1, CESM2(WACCM6ma), and MRI-ESM2 and from the three other models that have conducted last-millennium simulations using EVA(2k) for the volcanic forcing (Sect. 2.1). We examine the response across the transient time series in superposed epoch analyses of the average response to eruptions and that following the three largest tropical eruptions compared to tree-ring reconstructions.
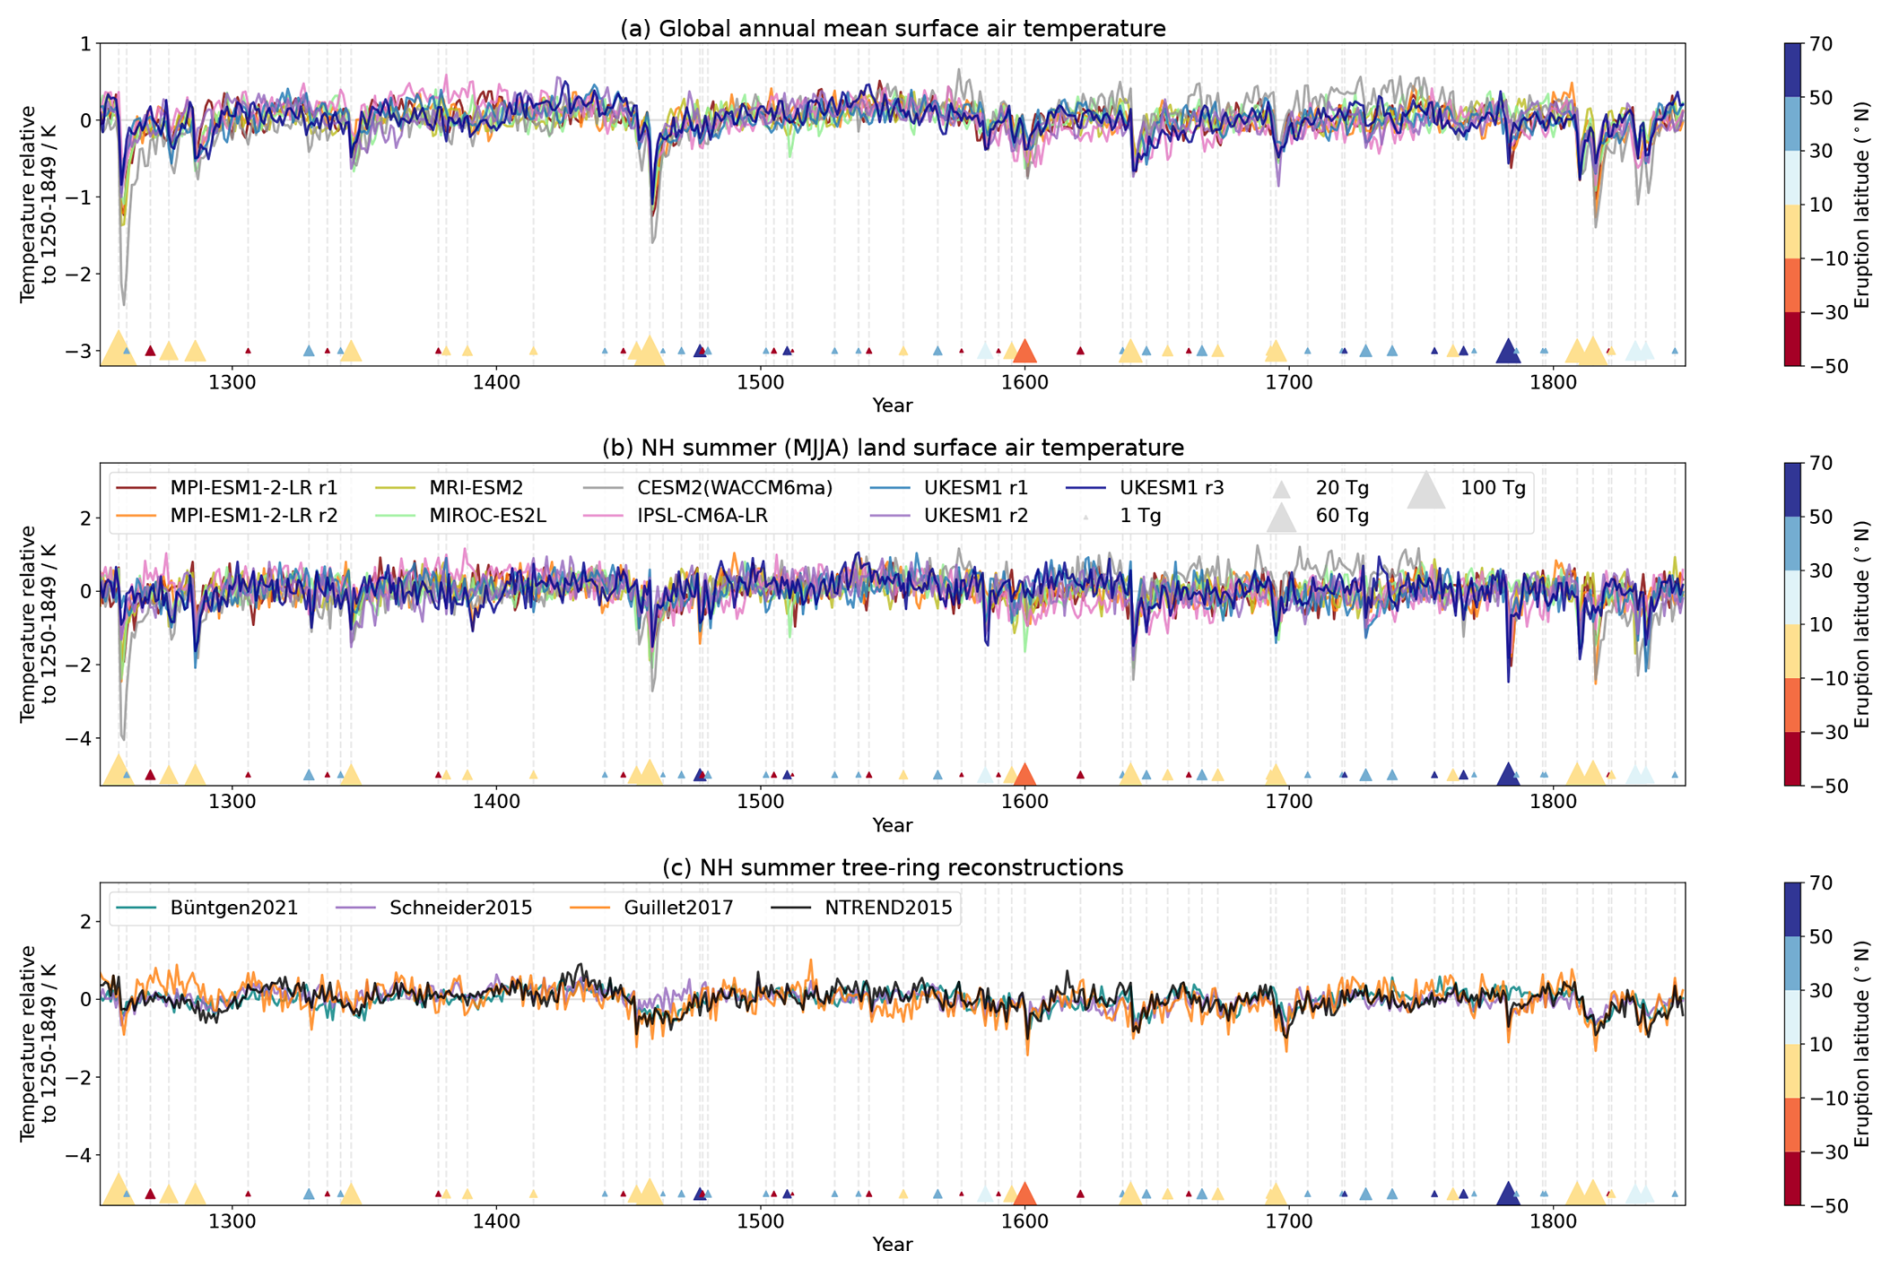
Figure 21250–1849 global annual mean surface air temperature (a) and NH (40–75° N) summer (MJJA) land surface air temperature (b) anomalies relative to the 1250–1849 average for each model. (c) Four NH summer tree-ring reconstructions: NTREND2015 (Wilson et al., 2016a), Büntgen2021 (Büntgen et al., 2021), Schneider2015 (Schneider et al., 2015a), and Guillet2017 (Guillet et al., 2017a). Eruptions are marked as in Fig. 1.
3.2.1 Transient temperature
Global annual mean and NH summer land surface air temperature anomalies are shown in Fig. 2. All models show distinct cooling after large-magnitude eruptions, with CESM2(WACCM6ma) having the strongest anomalies with a peak global annual mean cooling of −2.4 °K and a peak NH summer cooling of −4.0 °K following 1257 Mt. Samalas. CESM2(WACCM6ma) also shows a warming between 1650 and 1750 relative to the long-term average that is not present in the other models and which could be related to internal variability or the model's climate sensitivity. In the UKESM1 ensemble mean, the three strongest anomalies in NH summer land temperature follow the 1783–84 eruption of Laki, the 1640 eruption, and the 1286 eruption, none of which have the largest SO2 emissions (Table S2). The NH summer temperature from the four tree-ring reconstructions (Fig. 2c) shows that the amplitude of cooling in the proxy records, compared to the models, is substantially less, although a cooling can be found in response to most major eruptions, especially for tropical eruptions. Consistent with prior analyses, reconstructions show greater disagreements prior to 1400 (Esper et al., 2018). Guillet2017, for instance, shows a period of warming in the late 13th century and maintains more year-to-year variance compared to other reconstructions.
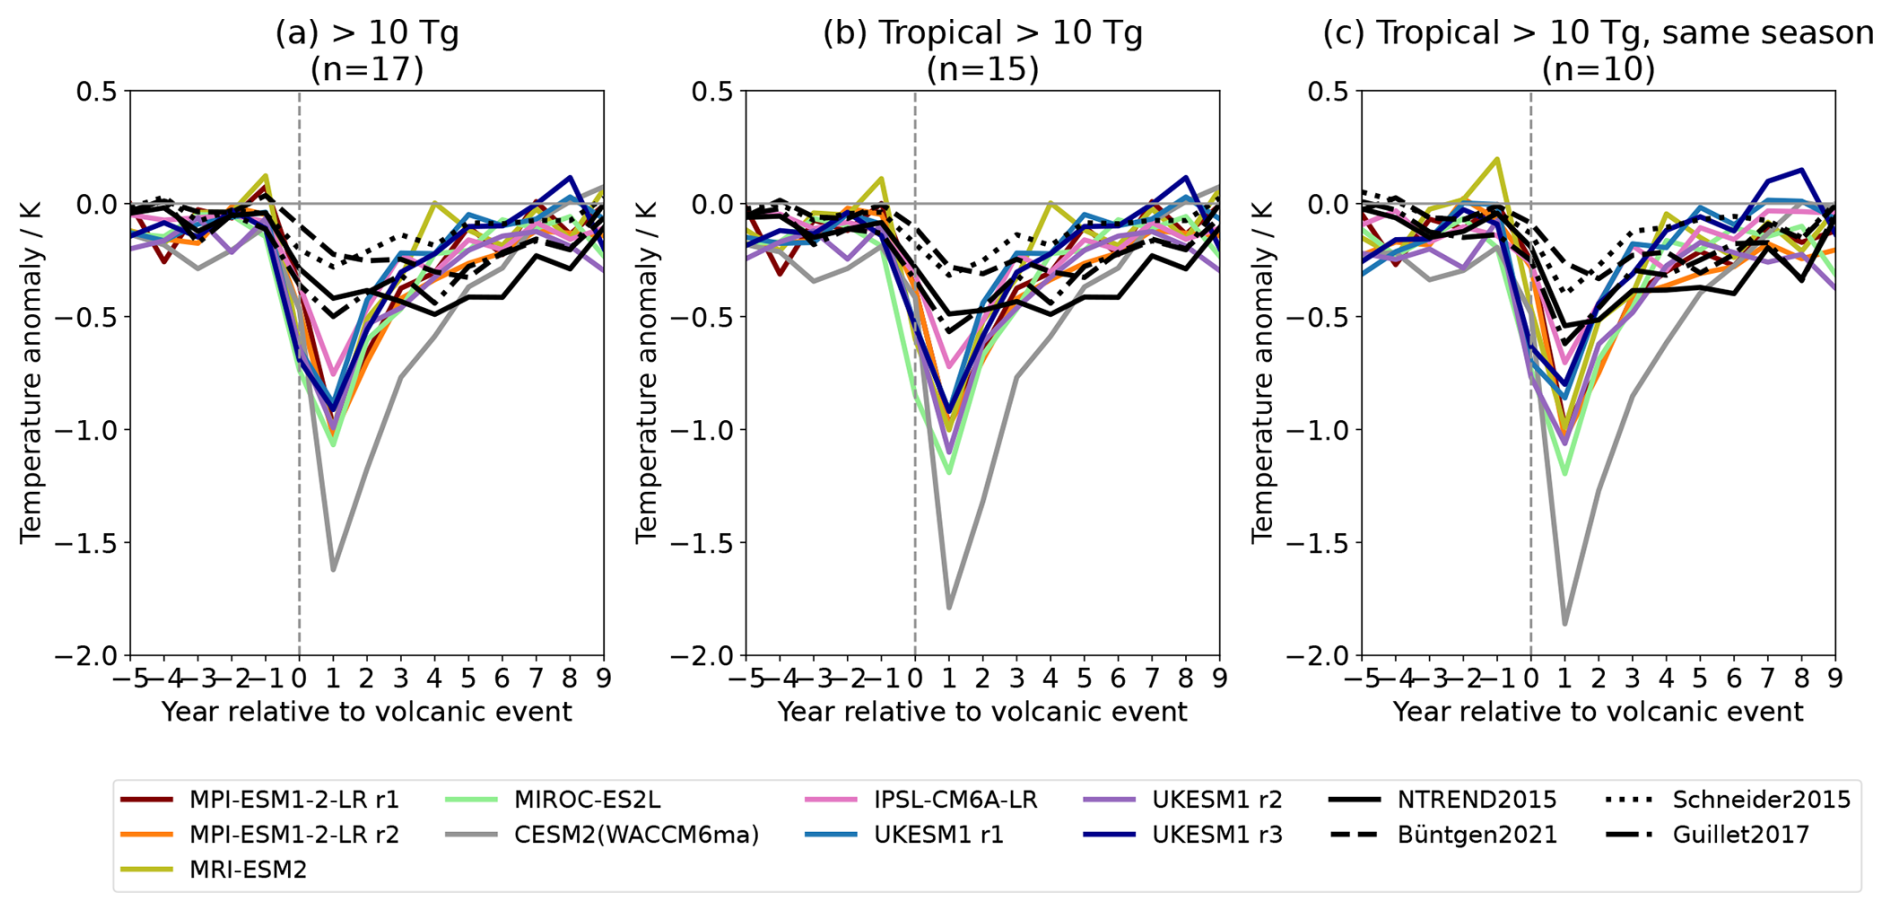
Figure 3Superposed epoch analysis (SEA) of NH summer surface temperature for large-magnitude eruptions (> 10 Tg SO2). Temperature anomalies for each eruption are taken with respect to the average across the 5 years preceding the eruption (see text for further detail), and the resulting time series are averaged across all eruptions. Panel (a) includes 17 eruptions, which are 1257, 1276, 1286, 1345, 1453, 1458, 1477, 1585, 1595, 1600, 1640, 1695, 1783, 1809, 1815, 1831, and 1835. In panel (b), only the tropical eruptions are included, which removes 1477 and 1783. In panel (c), only eruptions simulated in the same season are included, which removes 1276, 1453, 1458, 1695, and 1809.
3.2.2 Superposed epoch analysis
As is common practice in many studies seeking to understand the role of volcanic eruptions on climate by increasing the signal-to-noise ratio, we conduct a superposed epoch analysis (SEA) (e.g. Fischer et al., 2007; Wilson et al., 2016a; Schneider et al., 2017; Zhu et al., 2020; Zuo et al., 2023) to examine the average NH summer surface cooling response to the large-magnitude volcanic eruptions (defined here as having SO2 emissions greater than 10 Tg) in each model and in the four tree-ring reconstructions (Fig. 3). To composite the different eruptions, anomalies are calculated with respect to the 5 years prior to each eruption, unless another eruption has occurred within this period, in which case the closest 5 years prior to this is taken (see Table S3) and we take year 0 as the year of the eruption (other studies have also considered the year of peak aerosol load or year of peak forcing, e.g. Liu et al., 2022). In the case of volcanic double events, in which two eruptions are closely spaced, the data following the second eruption (if it is a NH or tropical eruption) are removed prior to the averaging (Table S3). For the resulting 17 eruptions (Fig. 3a), we find that all models except CESM2(WACCM6ma) simulate a similar NH summer cooling of between −0.8 and −1.0 K in the first year following the eruption, with CESM2(WACCM6ma) displaying a stronger peak cooling > 1.5 K. This consistency between the models (except CESM2(WACCM6ma)) suggests that, on average, it does not matter how the eruptions are simulated in each model, as the average response is similar between the prescribed and SO2 emission approaches, although there may be compensating effects due to other model differences. However, there are still differences on closer inspection. For example, IPSL-CM6A-LR has the smallest peak NH summer anomalies, and the length of the recovery from the cooling varies between the models. The average simulated peak cooling also remains stronger than the tree-ring reconstructions, suggesting that a discrepancy still exists between model-simulated and reconstructed cooling despite the updated aerosol emissions/forcing dataset (Toohey and Sigl, 2017). The NTREND2015 reconstruction (solid line) has a stronger average cooling signal than the Büntgen2021 reconstruction (dashed line), but both express a prolonged recovery response. Guillet2017 (dashed–dotted line), while also expressing a long recovery, has the strongest cooling response. It is likely that the longer recovery time for these three records reflects the inclusion of TRW chronologies in these composites (e.g. Esper et al., 2015; Zhu et al., 2020; Anchukaitis and Smerdon 2022), whereas Schneider2015 (dotted line), derived exclusively from MXD data, shows a marginally stronger T+1 cooling than Büntgen2021 but a much quicker recovery period.
This epoch analysis, however, obscures several subtleties (the individual time series for the 17 eruptions are shown in Fig. S10). It is highly dependent on the combination of eruption dates included (see Rao et al., 2019, Zhu et al., 2022) and on the anomaly reference period (i.e. anomalies in the SEA are different to the long time series presented in Fig. 2), and, although the eruption dates are known exactly in the model simulations, the timing of the real eruptions and their climatic consequences that were experienced by the trees may be different. This means that the models may have larger average peak anomalies due to the precisely “known” eruption years, whereas, for the reconstructions, even small offsets in the eruption date and timing of maximum negative forcing will smooth the response in the average. The timing of the peak cooling is also further dependent on whether the eruption was tropical or extratropical (the latter more likely leading to peak cooling in the year of eruption rather than the first year after) and on the eruption season. Consequently, Fig. 3b and c show further subsets of eruptions focusing on the tropical eruptions only. For all large-magnitude tropical eruptions (which excludes just two eruptions: 1477 Bardarbunga and 1783 Laki), there is a slight shift towards a closer match between some models and reconstructions (e.g. IPSL-CM6A-LR) (Fig. 3b). A further complication is that of these large events: five were simulated in different seasons in the UKESM1 and CESM2(WACCM6ma) simulations compared with the eVolv2k dataset (Sect. 2.1.1). Figure 3c shows only the eruptions simulated in the same season, reflecting the fairest comparison between the models. For these eruptions (which excludes 1276, 1453, 1458, 1695, and 1809), the models are more separated with IPSL-CM6A-LR and UKESM1 r1 and r3 closer to the reconstructions, with IPSL-CM6A-LR comparing very well with the stronger Guillet2017 record.
Furthermore, the anomalies are also hard to determine given a lack of a true reference period and the effect of close eruptions either prior (affecting the anomaly reference period) or post (affecting the post-eruption recovery). For comparison, Fig. S11 shows the SEA with all eruption anomalies calculated with reference to the 5 years prior and with no double events removed, resulting in slightly reduced peak cooling.
For the selected eruptions shown in Fig. 3, the tree-ring anomalies do not always show a traditional peak cooling response in the first post-eruption year as indicated by the models, and NTREND2015 in particular shows a longer, smoother tail. To demonstrate how date uncertainty could influence these anomalies, Fig. S12 shows an epoch analysis for eruption dates optimised to the cooling signals seen in the tree-ring reconstructions, which results in a stronger first year post-eruption cooling (but does not remove the prolonged recovery). Lücke et al. (2023) also demonstrated the importance of eruption dating uncertainty, which can make a significant difference to the amplitude of the average response shown in the SEA.
3.2.3 Temperature response following the three largest tropical eruptions
The SEA also masks differences between the models for individual events and with the comparison to tree-ring records. There are several eruptions that stand out in which the volcanic cooling (both peak and duration) is different among the models (Fig. 2). Examples include the three largest eruptions, which we subsequently focus on in the remainder of this study, but also other eruptions, for example, in 1600 (Huaynaputina; see e.g. MIROC-ES2L and IPSL-CM6A-LR) and 1783–84 (Laki; see all models) (Fig. S10). These differences demonstrate differences not only between volcanic forcing implementation but also between the different models and their ensemble members.
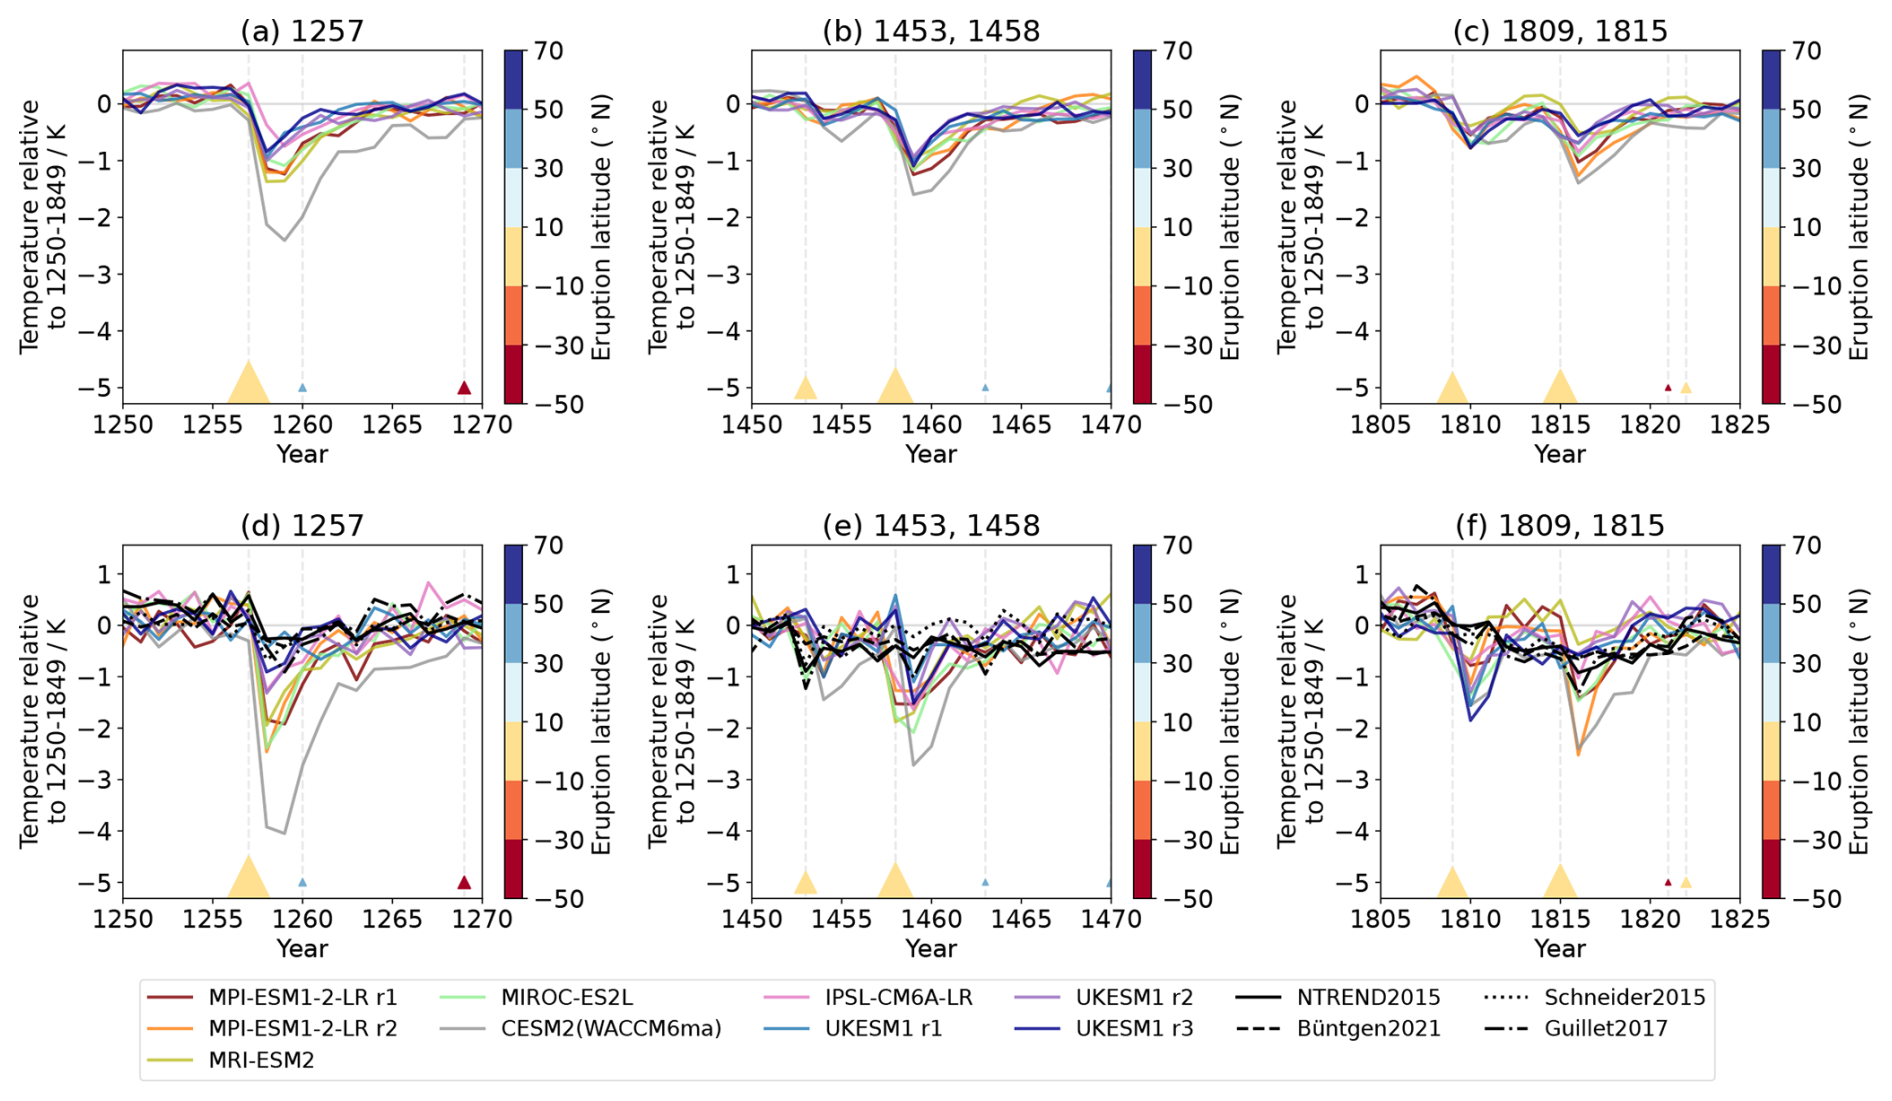
Figure 4Global annual mean surface air temperature (a–c) and NH summer land surface air temperature (d–f) anomalies (as in Fig. 2; relative to the 1250–1849 average) for the three largest eruptions as simulated by the six models and in the tree-ring reconstructions.
The global annual mean and NH summer anomalies for 1257 Samalas, the 1450s eruptions, and the 1809 and 1815 eruptions are shown in Fig. 4 (anomalies with reference to 1250–1849). In the global mean, IPSL-CM6A-LR (pink; prescribed forcing) has the smallest initial cooling after 1257 Samalas. UKESM1 (blues, purple; SO2 emissions) simulates slightly less cooling for 1257 than the remaining models and recovers more quickly, also for 1458 (Fig. 4a and b). In general, this is also the case for 1815, except the anomalies are comparable to the cooling from MRI-ESM2 (olive; SO2 emissions). For NH summer cooling following Samalas, both UKESM1 and IPSL-CM6A-LR simulate cooling that compares well with the range of tree-ring responses (less than −1 °C) compared with the other models that simulate peak cooling in excess of −1.8 °C. If, however, the anomalies are calculated with respect to the preceding 5 years (as in the SEA), the simulated cooling in IPSL-CM6A-LR is slightly stronger than UKESM1. The peak cooling in the Guillet2017 and Büntgen2021 records also appears in the second year following the eruption, as is also the case in the first MPI-ESM1-2-LR ensemble member. In the tree-ring reconstructions, this difference likely reflects the inclusion and location of specific proxy datasets relative to the spatiotemporal pattern of climate anomalies (Anchukaitis et al., 2012, 2017) and the implicit weighting given to the proxy data by the reconstruction methods.
For the 1458 eruption, peak NH summer anomalies in UKESM1 are similar to the other models, with ensemble member 1 having the smallest peak cooling. There is a temporal offset in the anomalies between UKESM1 and CESM2(WACCM6ma) and the other models, as this eruption was simulated in July in UKESM1 and CESM2(WACCM6ma) rather than in January (the 1453 eruption is also simulated in October rather than January). Except for Guillet2017, which includes ice core oxygen isotope data from Greenland, the reconstructions for this period also show a sustained cooling following the 1453 eruption but not an additional cooling spike following 1458 as suggested by the models (cf. Esper et al., 2017).
All models show a strong immediate NH summer cooling following the 1809 eruption, which is not reflected in the hemispheric-mean tree-ring reconstructions, also reported by Timmreck et al. (2021) for MPI-ESM1-2-LR, and which could be due to an overestimated SO2 emission for this eruption. The identity, location, and exact timing of this eruption also remain unknown, which could further account for some of the differences between model simulations and data. Tree-ring reconstructions record spatially and temporally variable temperature responses following the eruption (e.g. Anchukaitis et al., 2017; King et al., 2021; Leland et al., 2023), perhaps as a result of internal ocean–atmosphere variability, which could dampen the cooling signal in the large-scale mean. For all models except UKESM1 and MRI-ESM2, there is a second stronger cooling following 1815 Mt. Tambora. UKESM1 indicates a sustained cooling over this period but not an additional cooling anomaly following Tambora. The 1809 eruption was also simulated in October in UKESM1 and CESM2(WACCM6ma) rather than in January.
Overall, although there are differences in the peak cooling and longevity of the volcanic cooling among all models (which are further dependent on the anomaly reference period), there do not appear to be consistent differences between the models that prescribed the optical properties vs. those that used SO2 emissions. For example, the comparison between the model-simulated cooling and the tree-ring records shows a closer match for UKESM1 for 1257 Mt. Samalas, but this is not the case for the two other interactive models (MRI-ESM2 and CESM2(WACCM6ma)), and a smaller cooling is found in IPSL-CM6A-LR, which prescribed the optical properties. This reduced cooling does demonstrate, however, that there is reconciliation between tree-ring records and model-simulated cooling in this latest generation of climate models regardless of how the volcanic forcing is implemented but that this is also dependent on internal variability. For example, the spread among UKESM1 and MPI-ESM1-2-LR ensemble members is comparable to differences between the models. For 1815 Mt. Tambora, UKESM1 and MRI-ESM2 (both using SO2 emissions) have the smallest simulated cooling, but all models except the second MPI-ESM1-2-LR ensemble member and CESM(WACCM6ma) show a cooling that is comparable to the range of tree-ring reconstructions. For the 1458 eruption, the results are also complicated by the different season for this eruption in the two volcanic forcing implementations.
Differences are therefore due not only to the way that volcanic eruptions are implemented in the models (SO2 emissions vs. prescribed) but also to other model specifics, for example, in how the optical properties are initially applied in each model for those that prescribe them; how the SAOD is translated into radiative forcing by the model, dependent on the model's radiation scheme and on other factors such as cloud coverage and insolation; and how the forcing translates into the temperature response, dependent on the model's climate sensitivity and on internal variability. Consequently, to explore the role of the two different ways of simulating eruptions independently from differences due to different models, we have run additional simulations of the three largest eruptions in UKESM1 using both approaches. These results are presented in the following section.
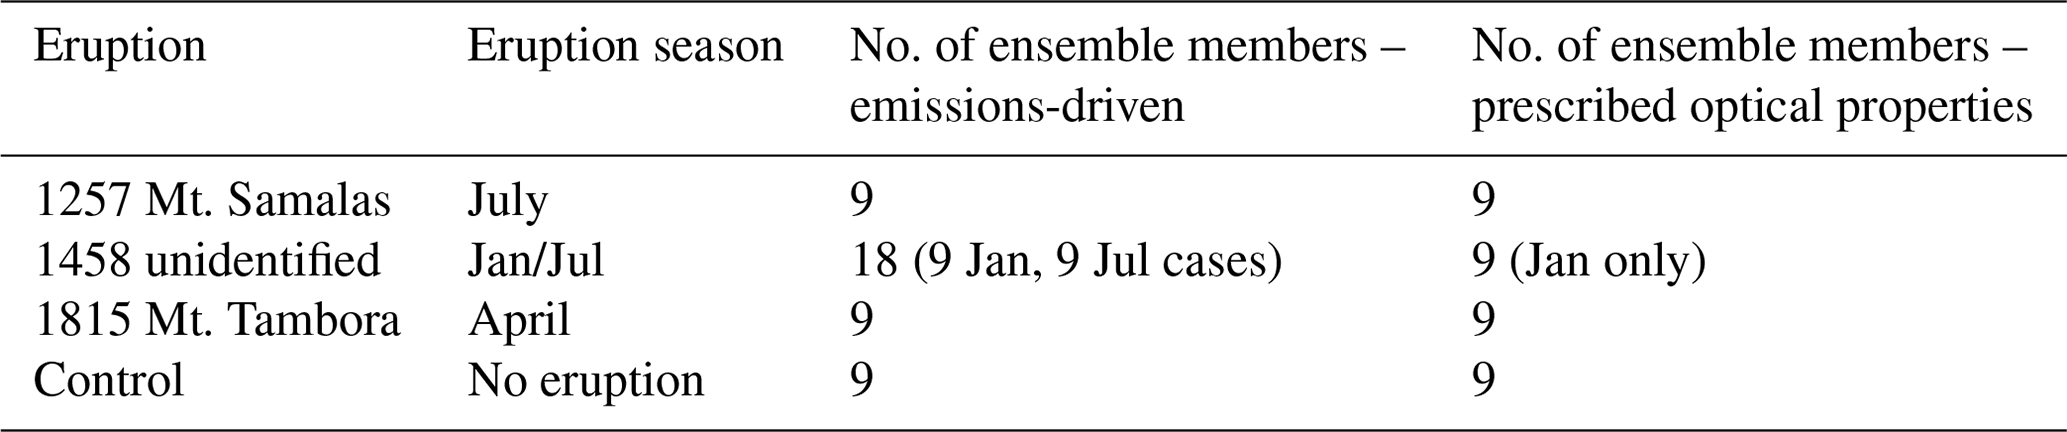
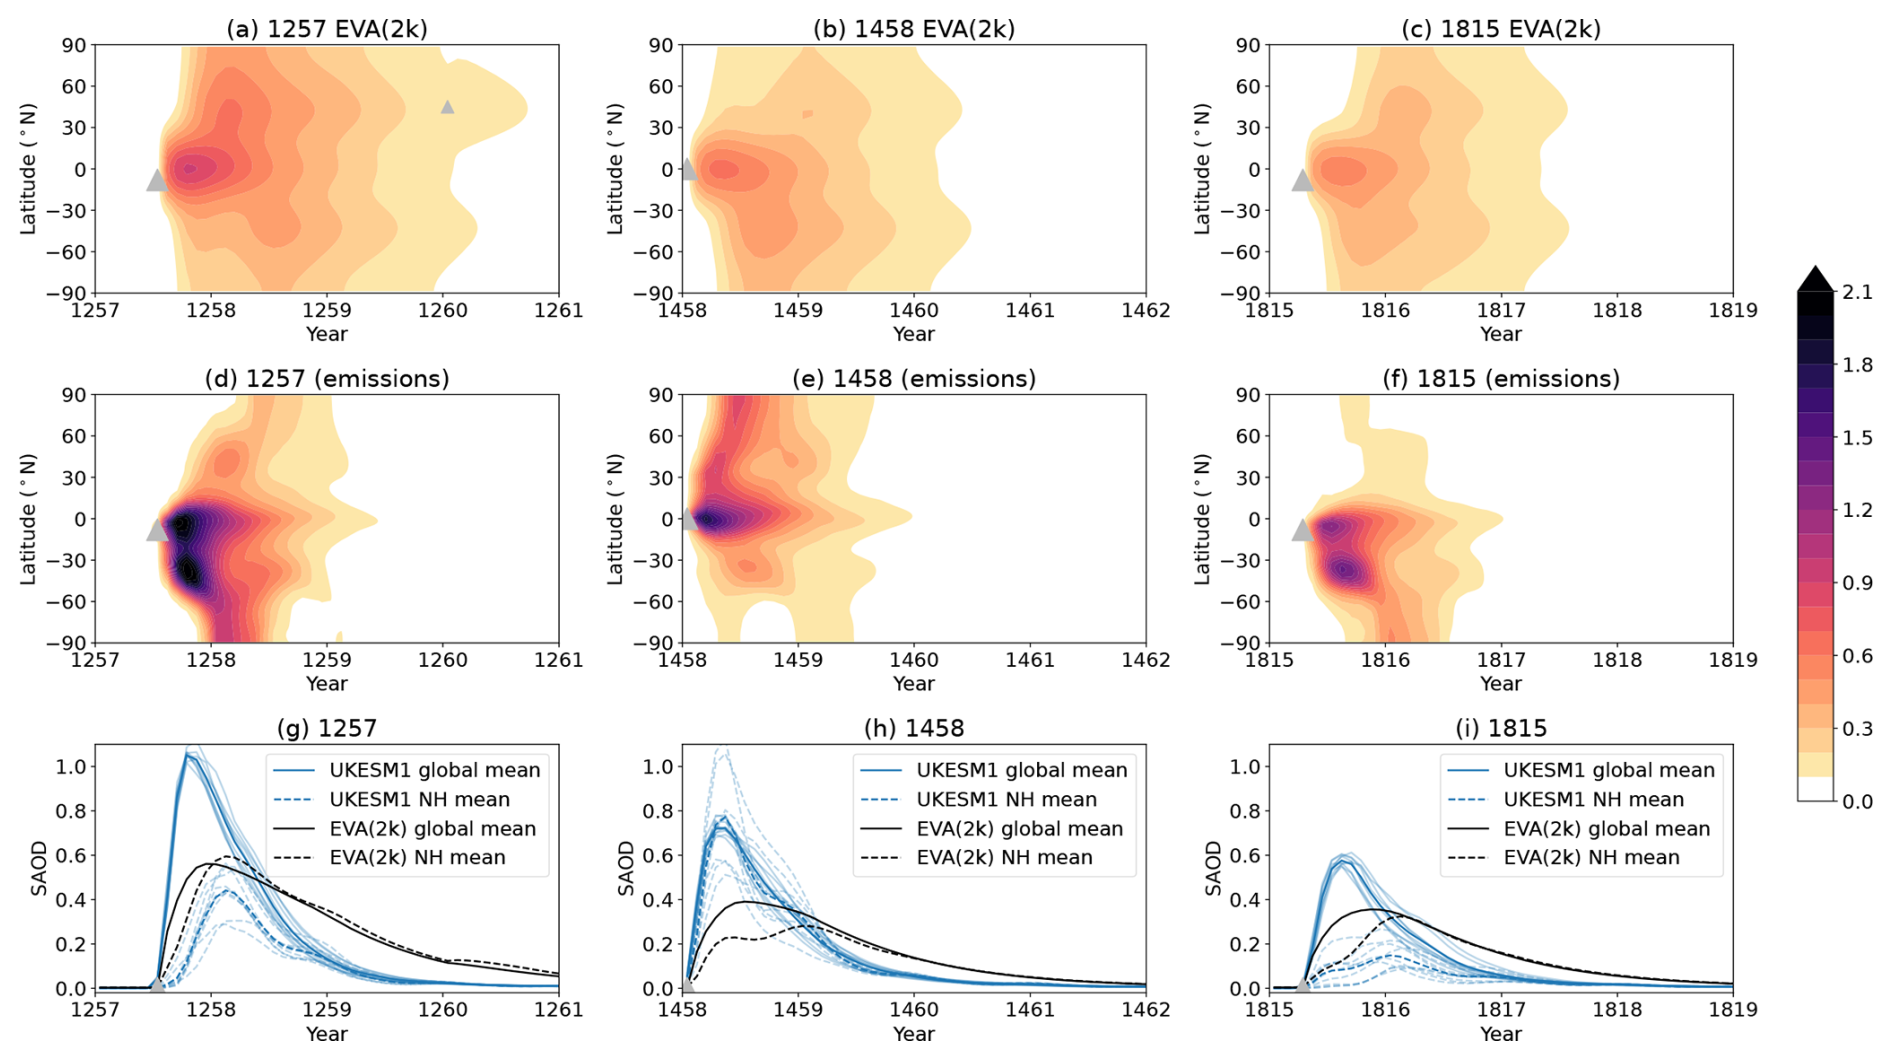
Figure 5Zonal mean SAOD in EVA(2k) for the three largest eruptions (a–c) and in the UKESM1 SO2-emissions-driven simulations (d–f) (ensemble mean) and the global mean (solid lines) and NH (20–90° N; dashed lines) SAOD (g–i). The bolder lines mark the UKESM1 ensemble mean, and the lighter lines mark the nine ensemble members. In panel (e), the ensemble mean is shown for the January simulations for direct comparison with EVA(2K). Grey triangles mark the eruption date and latitude.
3.3 1257 Mt. Samalas, 1458 unidentified, and 1815 Mt. Tambora UKESM1 case studies
Using UKESM1 in its preindustrial configuration, we ran two sets of ensemble simulations for each eruption (Sect. 2.1.1): one using SO2 emissions as in our transient simulations and the other using the aerosol optical properties derived from EVA(2k) (Table 2). For 1458, we conducted eruption scenarios for both January (to match the season used in EVA(2k)) and July (matching how the eruption is simulated in the UKESM1 transient runs). Because the eruptions are simulated in isolation and are therefore not impacted by previous events and because it is also cleaner to derive the volcanic anomaly (compared with proxy reconstructions) due to having simulations with and without the eruptions, here we do not focus on a dedicated comparison to the tree-ring records but rather focus on the differences between the two sets of model ensembles.
The global mean, NH mean (20–90° N), and zonal mean SAOD for the three eruptions in the SO2 emissions UKESM1 configuration versus those from EVA(2k) are shown in Fig. 5. Most noticeably, the EVA(2k) dataset prescribes a much more even spread of aerosol across both hemispheres, leading to similar values between the global and NH averages, whereas UKESM1 has much stronger SAOD in the Southern Hemisphere (SH) for Samalas and Tambora (both situated at 8° S) and a stronger SAOD in the NH for the January 1458 scenario (simulated at 0° N; global and NH averages are similar due to the concentrated equatorial peak). For the July 1458 scenario (equivalent to how 1458 is simulated in the transient run), the SAOD in UKESM1 is more evenly spread between the hemispheres, still with a strong tropical peak (not shown but equivalent to the transient SAOD in Fig. S7). These features are consistent across all nine ensemble members. As indicated in the transient runs, the SAOD in the UKESM1 simulations has higher peak values (zonal mean values are greater than 2; Fig. 5) but decays more quickly than in EVA(2k). Small differences in the actual SAOD seen by UKESM1 compared to the EVA(2k) values are expected due to the interpolation of the optical properties onto the UKESM1 radiation bands and the additional very small background stratospheric contribution due to non-volcanic sources present in UKESM1 (Sect. 2.1.1). These values reflect the magnitude and distributions presented in Fig. 5 (not shown).
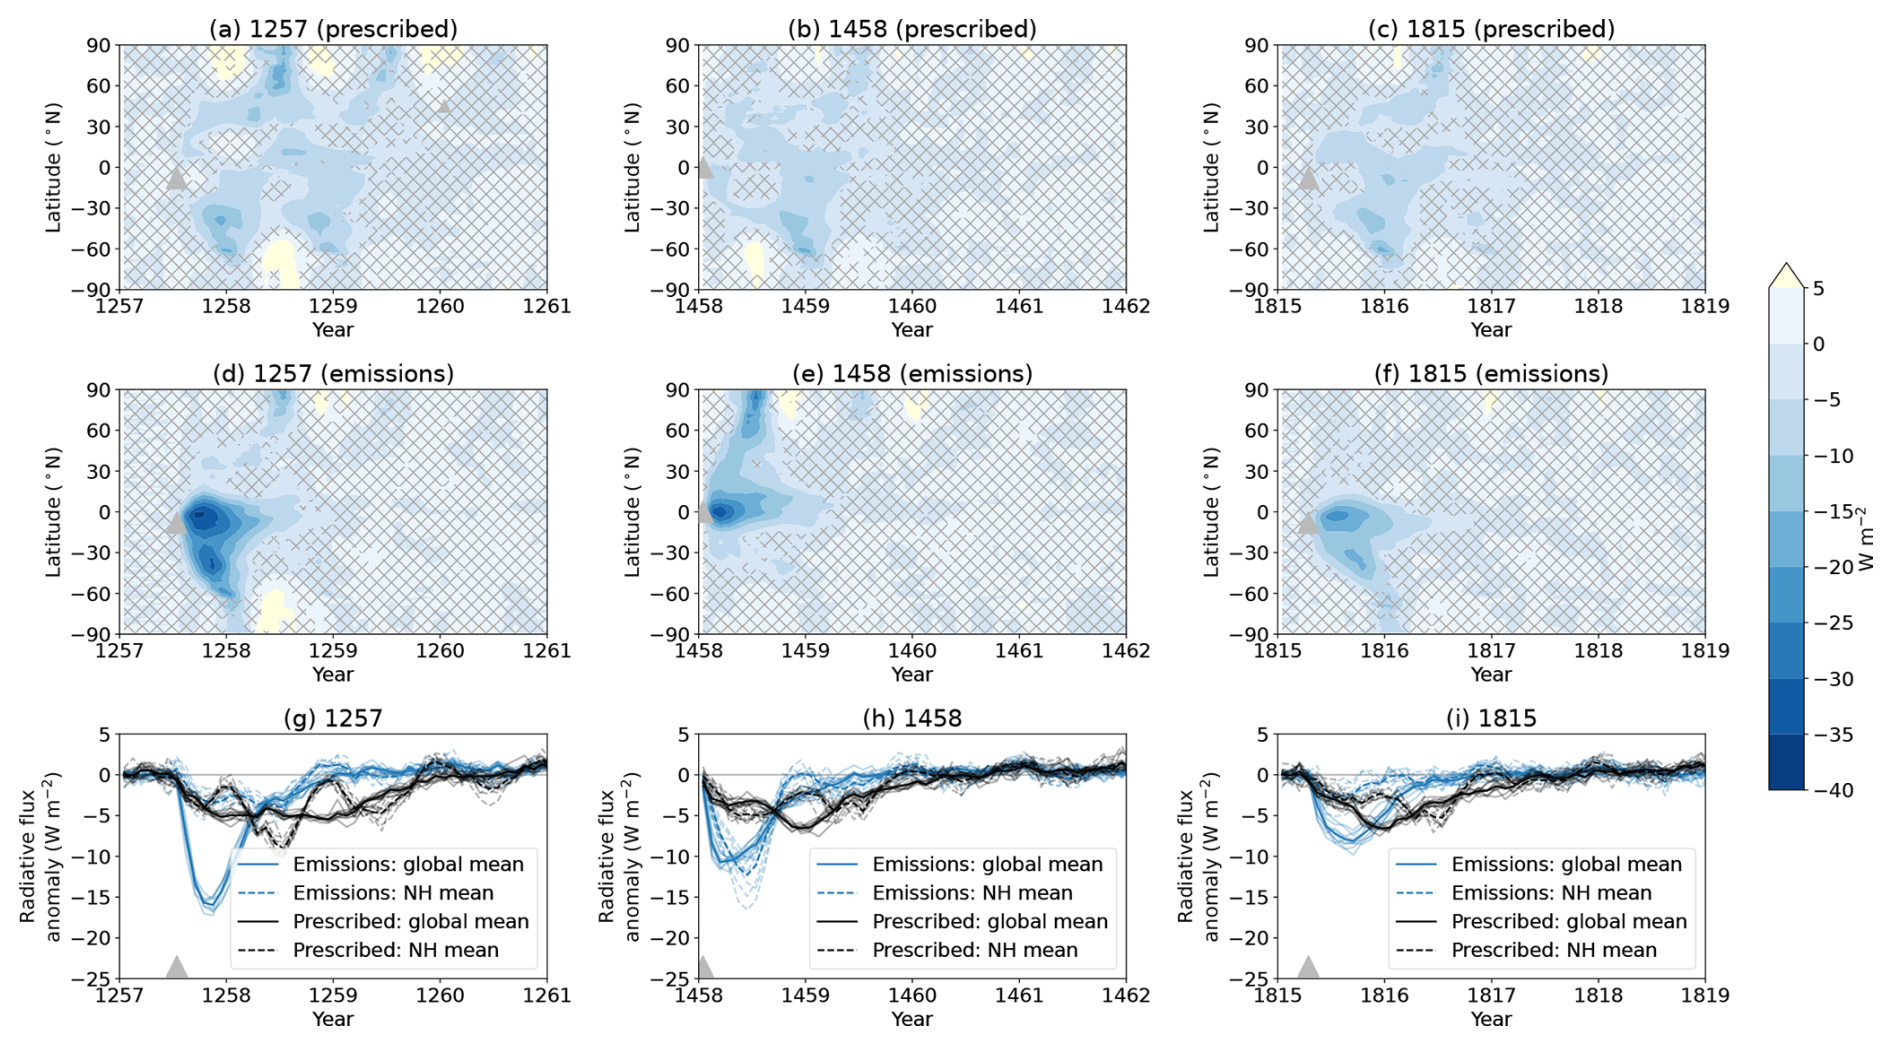
Figure 6Zonal mean all-sky top-of-the-atmosphere total radiative flux anomalies from the prescribed runs (a–c) and from the SO2-emissions-driven runs (d–f) (ensemble mean) and the global mean (solid lines) and NH (20–90° N; dashed lines) anomalies (g–i). The bolder lines mark the UKESM1 ensemble mean, and the lighter lines mark the nine ensemble members. The total flux is calculated from the anomaly in longwave + shortwave outgoing radiation multiplied by −1 to show the downward change (incoming solar radiation cancels between the perturbed and control runs). Zonal mean anomalies that are greater than 2 standard deviations from the nine controls are unhatched. Grey triangles mark the eruption date and latitude.
Top-of-the-atmosphere total radiative flux anomalies (Fig. 6) mirror the different SAOD distributions in the two volcanic implementation approaches, with stronger, more localised radiative forcing in the SO2 emission simulations. The decomposition of the forcing into its longwave and shortwave components (Figs. S13–S15) also reveals further differences between the two approaches, including differences in the balance between longwave and shortwave forcing. For example, in the emission-driven simulations, the negative shortwave forcing is initially stronger than the longwave forcing, but, after about 1 year after an eruption, the two forcings become almost equal and quickly tail off. In contrast, the prescribed simulations have weaker shortwave forcing but slightly higher peak values of positive longwave forcing in the first few months after an eruption, leading to a weaker net forcing (smaller negative values). Several factors may influence the balance between shortwave and longwave forcing, including the size distribution of particles and the altitude and latitude of the aerosol through the seasons. Particle sizes can evolve due to microphysical and chemical processes in the emission-driven simulations, but, in the prescribed simulation, the optical properties were derived from a particle size distribution in which the effective radius was linked to the mass of sulfate via an empirically based relationship based on 1991 Pinatubo (Toohey et al., 2016). For Samalas, both sets of simulations show net positive forcing in the SH polar regions that is outside of the control variability and, for the prescribed simulations, additionally in the NH. The prescribed runs have longer-lived net-negative forcing in the NH compared to the SO2-emissions-driven simulations. Ensemble spread in the SO2-emissions-driven runs is larger than in the prescribed runs because of the interactive aerosol implementation, which allows the aerosol to evolve differently each time depending on the initial conditions.
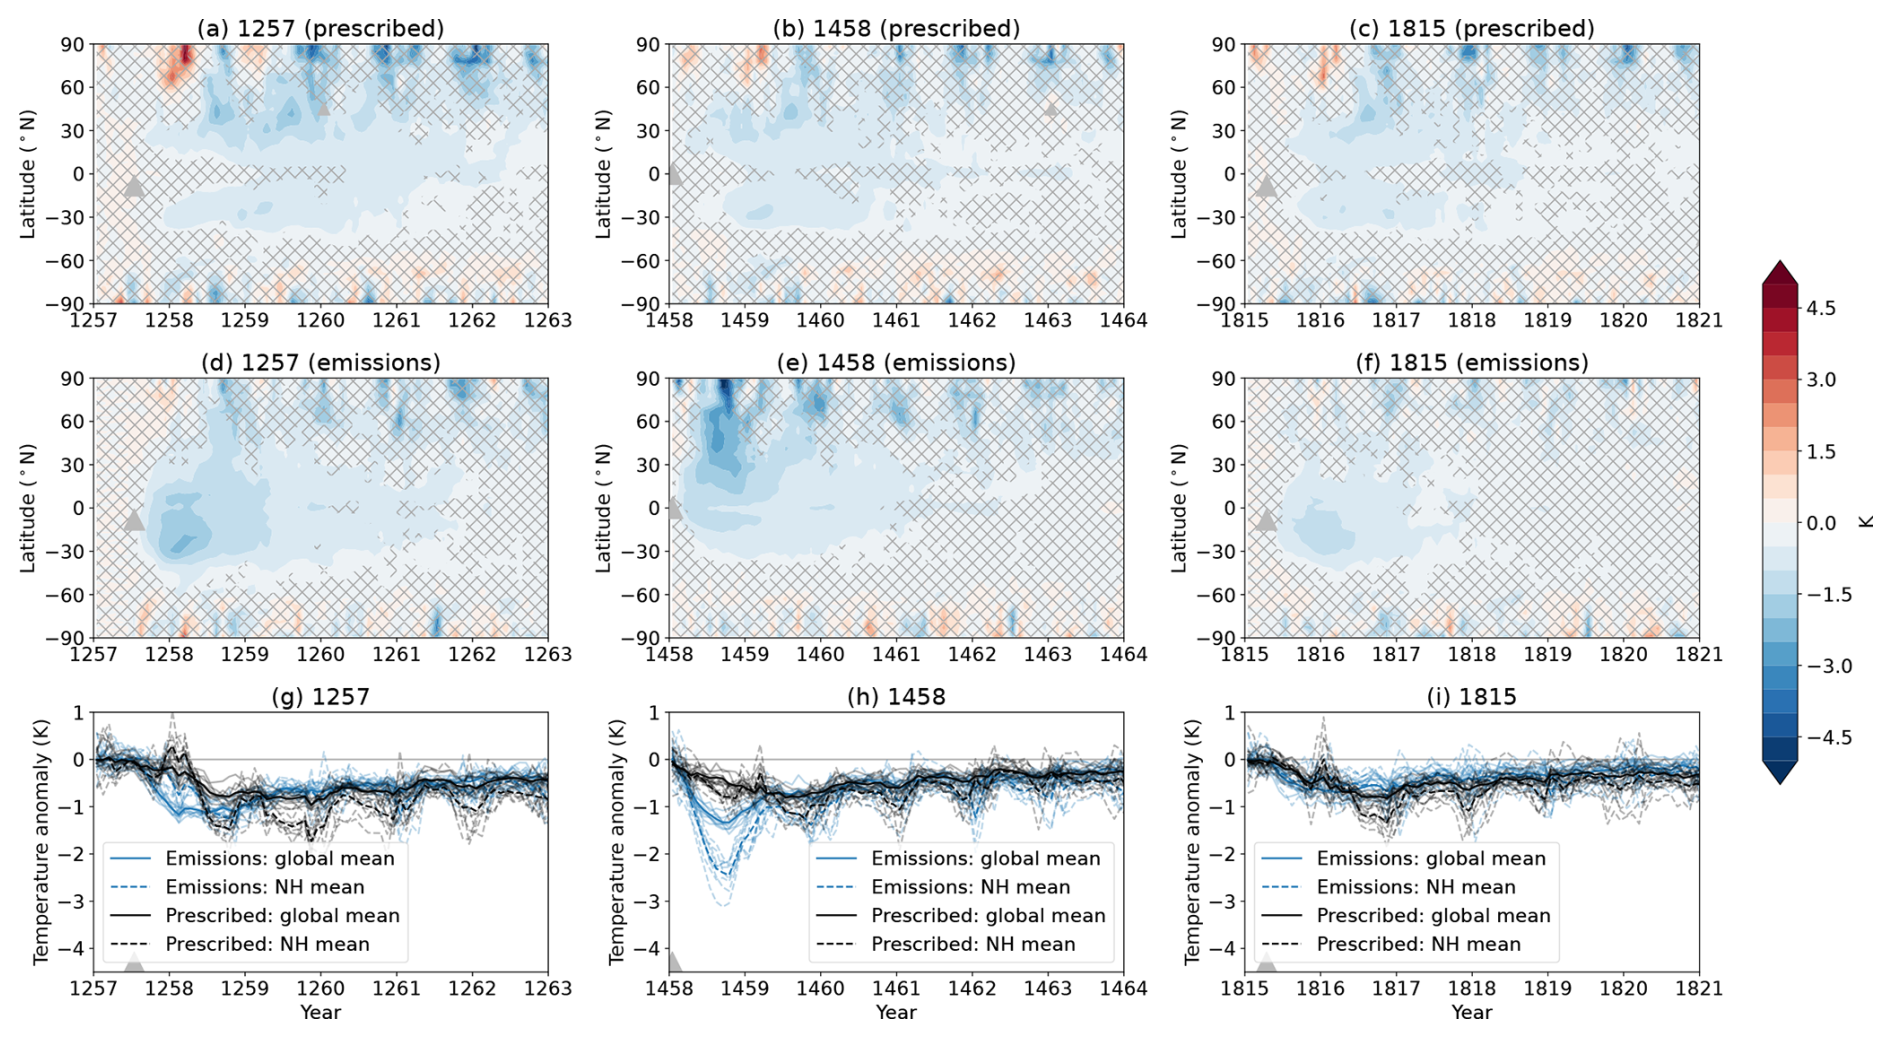
Figure 7Zonal mean surface air temperature anomalies in the prescribed simulations (a–c) and in the SO2-emissions-driven simulations (d, e) and the global mean (solid lines) and NH (20–90° N; dashed lines) anomalies (g–i). The bolder lines mark the UKESM1 ensemble mean, and the lighter lines mark the nine ensemble members. Anomalies that are greater than 2 standard deviations from the nine controls are unhatched. Grey triangles mark the eruption date and latitude.
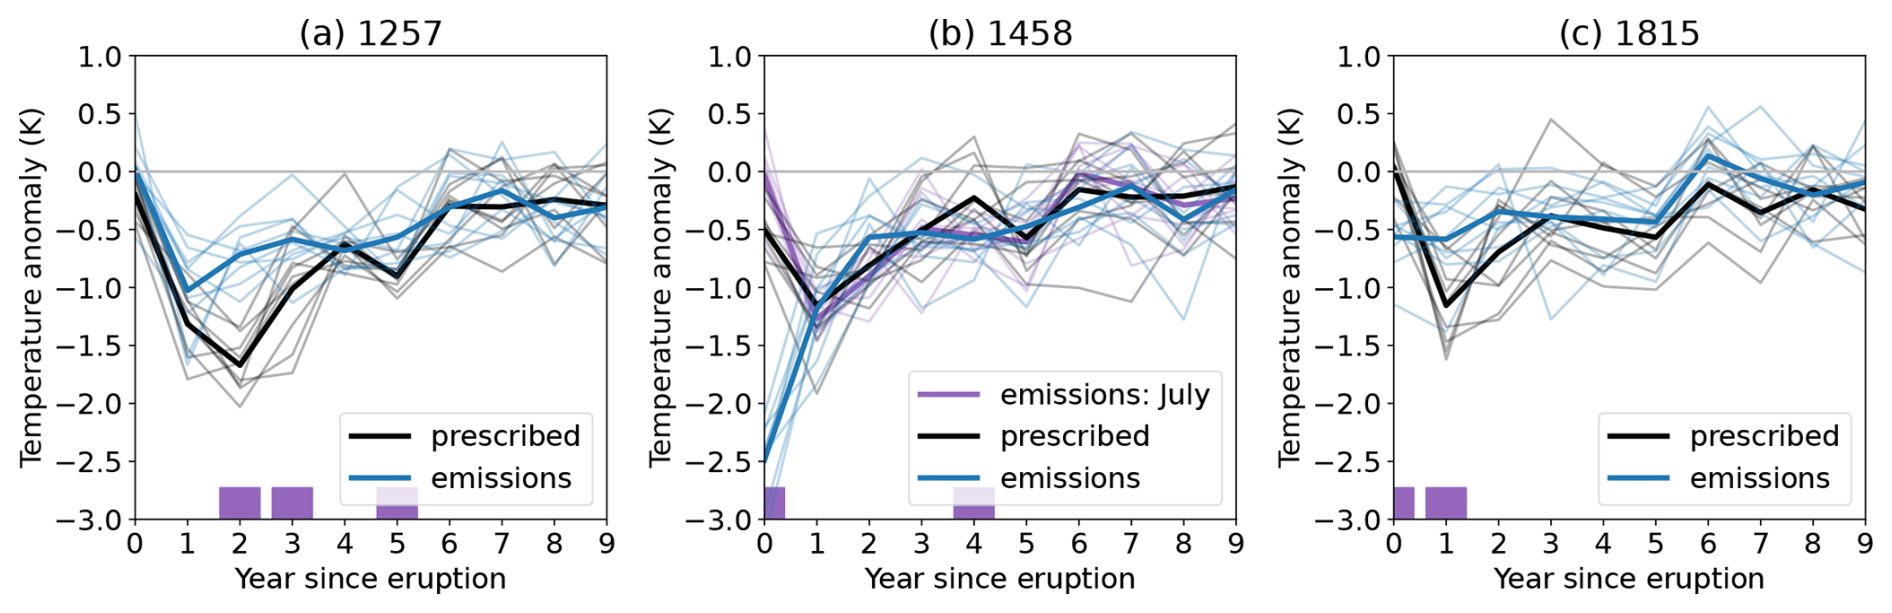
Figure 8NH summer land surface air temperature anomalies in the prescribed (black) and SO2-emissions-driven (blue) simulations. In panel (b), the additional July emissions-driven case studies are shown in purple. The ensemble mean values are shown in the thicker line. Purple squares indicate where the prescribed and emissions-driven ensembles (nine members) are statistically significantly different (p < 0.05) using the two-sided Wilcoxon test (e.g. Zanchettin et al., 2022).
Zonal mean surface air temperature anomalies are shown in Fig. 7 and show distinctive differences between the two volcanic forcing implementations. The prescribed runs show two bands of cooling either side of the Equator, with ensemble mean anomalies of around −0.5 to −1 K but stronger peak anomalies in the NH (> −2 K). The emissions-driven runs, on the other hand, show generally stronger localised cooling, especially for 1257 Samalas and 1458. For both 1257 and 1815, the emissions-driven simulations have smaller NH cooling (both in peak and duration). Consequently, the NH summer land cooling (the tree-ring target) differs between the two ensembles (Fig. 8), with stronger peak cooling in the prescribed simulations for 1257 (which also occurs in the second rather than in the first year following the eruption) than in the emissions-driven simulation (−1.7 vs. −1.0 K; ensemble mean) and for 1815 (−1.2 vs. −0.6 K; ensemble mean). For 1458, the prescribed and July emissions-driven simulations, in which the eruption occurs 6 months later than in EVA(2k), have similar peak cooling (−1.2 and −1.3 K). However, in the January emissions-driven simulations, with the same eruption date as EVA(2k), peak cooling is much stronger, with an ensemble mean peak of −2.5 K in the year of the eruption. These differences are statistically significant (p < 0.05; see purple squares in Fig. 8). There is also spread among ensemble members, with cooling differing by more than 1 K across the nine members for all three eruptions and for each method of simulation. This ensemble range is of the same order of magnitude as the differences between the different models (except for CESM(WACCM6ma)) shown in Fig. 4, further demonstrating that model differences may be a result of internal variability.
4.1 Last-millennium transient simulations
In this study, we explore the impact of simulating eruptions during the last millennium using SO2 emissions instead of directly prescribing the optical properties using the latest dataset, EVA(2k). We examined the NH summer surface cooling following eruptions in six climate models that have run the PMIP4 last-millennium experiment, which includes a mix of the two volcanic forcing implementations (Table 1). Superposed epoch analysis (SEA) of the 17 large-magnitude eruptions simulated between 1250 and 1850 revealed similar average peak cooling across all models (except for CESM2(WACCM6ma)), despite different forcing implementations, and a stronger cooling compared to four tree-ring records. This suggests that the estimated SO2 emissions of these eruptions and volcanic forcing and/or the climate sensitivity to the volcanic forcing in the models remain too high or that the proxy records underestimate the large-scale cooling. Lücke et al. (2023) recently showed that volcanic forcing uncertainty, based on new ensembles of the EVA(2k) reconstruction that account for emission uncertainty and dating uncertainty (eruption year and month), can account for some of the discrepancy between model-simulated and tree-ring-derived cooling for several eruptions, such as 1640, 1695, 1783 Laki, and 1815 Mt. Tambora. Results of the SEA from reconstructions will be sensitive to errors of estimated eruption dates, while the simulated eruption dates are known and removing just one or two events can change the comparison. SEA for only large-magnitude tropical eruptions simulated in the same seasons in the models resulted in a closer match between models and tree rings, especially for IPSL-CM6A-LR and the stronger Guillet2017 reconstruction (Fig. 3c).
For several individual eruptions, there were clear differences between the models that are not associated with the way the eruptions were simulated. For example, both UKESM1 (SO2 emissions) and IPSL-CM6A-LR (prescribed optical properties) simulate a smaller cooling following 1257 Mt. Samalas that compares well to tree rings. This highlights that further model differences are at play, such as how the optical properties are translated into radiative forcing, including how the prescribed extinction is translated onto each model's radiation bands and how the tropopause was accounted for in the models that prescribe the optical properties (see Zanchettin et al., 2022, for further discussion). This was recently demonstrated by Villamayor et al. (2023), who showed that the shortwave radiative anomalies in IPSL-CM6A-LR, MPI-ESM1-2-LR, and MIROC-ES2L following the 1458 eruption varied considerably despite all using the EVA(2k) optical properties, with IPSL-CM6A-LR showing the smallest NH anomalies and MIROC-ES2L showing a different spatial pattern compared with IPSL-CM6A-LR and MPI-ESM1-2-LR (see their Fig. S2). These results are also in line with results from the Volcanic Forcings Model Intercomparison Project (VolMIP), where, for the 1991 eruption of Mt. Pinatubo, in which the same optical properties were prescribed among six models, regional temperature responses still differed (Zanchettin et al., 2022). Overall, there are clear differences in the simulated SAOD across the three models that used interactive aerosol (UKESM1, CESM2(WACCM6ma), and MRI-ESM2) despite the same SO2 emissions, with differences in peak magnitude, hemispheric dispersion, and decay timescales (Figs. 1 and S5–S8). Differences are due to the different model aerosol schemes and to differences in the season and injection altitude of the emissions (Sect. 2.1). CESM2(WACCM6ma) consistently shows an extremely strong forcing and corresponding cooling for the largest eruptions, likely related to the widths of the aerosol modes in this model's aerosol scheme and a higher climate sensitivity (e.g. Chylek et al., 2020). MRI-ESM2 simulates a much stronger cooling following 1257 Mt. Samalas in comparison to MPI-ESM1-2-LR and MIROC-ES2L but a smaller response for 1815 Mt. Tambora due to weaker aerosol forcing in the NH (Fig. S8). MRI-ESM2 also shows high SAOD values in the SH polar vortices, suggesting a strong confinement of aerosol in this region. For Tambora, all models except CESM(WACCM6ma) simulate cooling that matches one of the tree-ring records, although the spread between ensemble members from MPI-ESM1-2-LR (Fig. 4f) further demonstrates the importance of meteorological variability and large-scale variability, such as ENSO, in reconciling models and proxy or instrumental records (e.g. Lehner et al., 2016; Duan et al., 2019; Timmreck et al., 2021). Other model differences likely contributing to the range of temperature responses to these last-millennium eruptions include model resolution and other processes/features that might affect the eventual climate impact (e.g. cloud distribution, overall model climate sensitivity).
4.2 UKESM1 case study simulations
Due to the range in model responses for the large-magnitude eruptions, our attention focused on using UKESM1, allowing a direct comparison between the two volcanic forcing implementations in the same model. Our results show that the spatial pattern of volcanic forcing is very different in UKESM1 between the prescribed setup and that in which SO2 emissions are used (Fig. 6). In UKESM1, we found that the different volcanic forcing implementation strongly affects the resulting NH summer anomalies, with reduced cooling in the emissions-driven scenarios for 1257 Samalas and 1815 Tambora and consequently a better comparison to tree rings because of a reduction in the NH radiative forcing.
For 1257 Mt. Samalas and 1815 Mt. Tambora, UKESM1 simulates a stronger dispersal of aerosol to the SH in contrast to the more evenly distributed hemispheric forcing in the EVA(2k) dataset. This suggests that a different spatial dispersion of the aerosol, and a more asymmetric forcing across the hemispheres from tropical eruptions, could reconcile discrepancies between model-simulated and tree-ring-derived cooling when compared to the more global distributions, as previously suggested (Toohey and Sigl, 2017; Gao et al., 2008; Crowley and Unterman, 2013). Given that there are numerous factors affecting the total sulfate deposition on the ice sheets, such as the large-scale and synoptic circulation and deposition processes, it is possible that the ice sheet averages could be similar but that the stratospheric load had a greater hemispheric asymmetry. Our findings are in line with Timmreck et al. (2021), who suggested that removing the aerosol forcing from the NH extratropics could result in a better match to NH tree-ring records following the 1809 eruption. However, this is not the case for the unidentified eruption in 1458, where our emission-driven simulations led to a stronger cooling than in the prescribed simulations. This is because of a much stronger NH forcing due to the stronger NH branch of the Brewer–Dobson circulation in January, resulting in more aerosol in the NH. In the simulations of this eruption in July (purple line in Fig. 8b), the peak NH cooling is comparable to the prescribed simulations, demonstrating the importance of eruption season, which will also play a role in reconciling discrepancies between models and proxy reconstructions (e.g. Wainman et al., 2024; Stevenson et al., 2017; Stoffel et al., 2015). The first year of summer cooling will be stronger for eruptions that occur before the first growing season in the eruption year because of the time it takes for the peak aerosol burden to occur, which may then coincide with peak summer insolation. Superposed epoch analyses, which average multiple eruptions and consider only yearly values (either an annual mean or the summer average), do not account for the effect of eruption season and can therefore mask differences in the volcanic response.
In UKESM1, the strong hemispheric asymmetry in forcing is strongly affected by the exact eruption latitude within the tropics, with both the 1257 Samalas and 1815 Tambora eruptions simulated at 8° S leading to more aerosol in the SH (the 1458 eruption was simulated at 0° N). In sensitivity tests for Samalas (Fig. S16), simulating the eruption at 0° N rather than at 8° S resulted in weaker hemispheric asymmetry and, for one realisation (out of two), stronger NH SAOD, further demonstrating the role of initial conditions and internal variability. UKESM1 also has a much stronger confinement of aerosol to the tropical region compared with the EVA(2k) dataset in which the SAOD is more quickly spread across the globe, likely a result of an isolated tropical pipe in this model; Bednarz et al. (2023) found that UKESM1 had the strongest tropical confinement of sulfate aerosol compared to two other models (CESM2(WACCM6) and GISS-E2.1-G) in sulfur geoengineering experiments. In favour of the much stronger SH forcing for Samalas and Tambora compared to the EVA(2k) dataset, our results are comparable with simulated AOD presented in Stoffel et al. (2015) (see their Figs. S7–S9) and with MRI-ESM2 (Fig. S9). We also found that the 1286 eruption led to almost double the NH summer cooling in our UKESM1 simulations than 1257 Mt. Samalas (Fig. 2b) despite a much smaller SO2 emission (30 vs. 119 Tg), likely a result of it being simulated at 0° N and in January, leading to a much larger NH aerosol burden and occurring before the first growing season (giving time for the peak aerosol to form by summer). For tropical eruptions in the satellite era (post-1979), asymmetric transport of aerosol has been observed following the 1982 eruption of El Chichón (stronger NH transport, volcano at 17° N) and the 1963 eruption of Agung (stronger SH transport, volcano at 8° S) in contrast to the 1991 Mt. Pinatubo eruption (15° N), which had a more even distribution between the hemispheres (Timmreck et al., 2021; Thomason et al., 2018). This further highlights the importance of eruption latitude, season, and meteorological conditions for the evolution of the aerosol cloud. However, it should also be noted that, to capture the more even distribution of aerosol to both hemispheres following 1991 Pinatubo, previous model simulations, including the UK climate model, have had to spread the emissions between 15° N and the Equator (Dhomse et al., 2014; Mills et al., 2017, 2016; Sheng et al., 2015). This is to account for the initial southward movement of the aerosol that the models do not otherwise capture, suggested to be due to missing factors such as the meteorological conditions at the time and processes related to the volcanic plume or because the initial tropical confinement and then transport in the hemisphere of the eruption is too strong. It is therefore possible that the more restricted SAOD in UKESM1 for the large eruptions presented here is affected by these factors. The models also do not consider the co-emission of ash, volcanic halogens, or water vapour, all of which will likely play a role in the evolution of the sulfate aerosol and climate response (e.g. Wells et al., 2023; Staunton-Sykes et al., 2021; Abdelkader et al., 2023; Stenchikov et al., 2021).
The 1458 case is further complicated by the relatively minor cooling in the tree-ring records following this eruption (see also e.g. Schneider et al., 2017; Esper et al., 2017). Our emissions-driven case study simulations in which the 1458 eruption is simulated in isolation suggest a July date is more likely considering the smaller response, which could perhaps be missed by tree-ring records, although no individual ensemble member lacks the cooling signal. On the other hand, the large cooling simulated following the January simulations seems more unlikely not to have been captured in tree rings. The role of the earlier eruption, also in the case for the 1809 and 1815 double event, is difficult to disentangle. The tree-ring records are not without their own uncertainty, and it is also possible that the cooling following 1458 is underestimated in some reconstructions due to a spatial bias of individual records towards the Arctic. Given uncertainties in the volcanic forcing (i.e. season and emission magnitude), it may be that the forcing implemented in the models is not what happened in the real world, further complicating model–proxy comparisons.
In addition to uncertainties in the emission magnitude, uncertainty in the volcanic forcing also arises from the unknown height at which the emissions were released. In our emissions-driven simulations, all injections occurred between 18 and 20 km, in line with assumptions made in EVA(2k) to be consistent with the emissions height following the 1991 eruption of Mt. Pinatubo. However, the height is also an important driver of the aerosol evolution in determining the initial spread, tropical confinement, and aerosol size, leading to differences in the forcing (Stoffel et al., 2015; Marshall et al., 2019; Toohey et al., 2019). The QBO phase at the time of eruption will also impact the initial spread and tropical confinement of the aerosol, and the aerosol itself will impact the QBO (Brown et al., 2023), all of which may play a role in the further reconciliation of simulated climate impacts and those from proxy reconstructions.
The way the eruptions are simulated will also affect other climate variables with larger differences for regional changes given differences in the spatial forcing (e.g. Yang et al., 2019). Different distributions of the forcing and, in particular, more asymmetric forcing between the hemispheres will have implications on precipitation and modes of variability, such as the position of the Inter-Tropical Convergence Zone (e.g. Haywood et al., 2013; Colose et al., 2016), the response of ENSO (e.g. Predybaylo et al., 2020; Falster et al., 2023), the North Atlantic Oscillation, the Southern Oscillation and Atlantic Multidecadal variability (e.g. Timmreck et al., 2021; Fang et al., 2021), the Atlantic Meridional Overturning Circulation (e.g. Pausata et al., 2015), and tropical cyclone activity (Jones et al., 2017; Yang et al., 2019). Yang et al. (2019) also demonstrated that the transient climate sensitivity was different depending on the spatial distribution of the forcing when comparing the responses of 1902 Santa Maria, 1963 Agung, and 1991 Mt. Pinatubo, likely a result of different forcing over land and sea and differences in ocean heat uptake. Villamayor et al. (2023), using four of the models here, also found distinct differences in the response of Sahel rainfall depending on the symmetry of the forcing in the context of tropical versus extratropical eruptions. Our more asymmetric forcing following the tropical eruptions in UKESM1 would likely lead to further differences in the response of Sahel precipitation to tropical eruptions.
4.3 Reconciling model-simulated and tree-ring-reconstructed NH summer surface cooling
Overall, our results demonstrate that some of the latest generation of climate models do compare well with tree-ring reconstructions for the largest eruptions, regardless of how the volcanic forcing is implemented. The latest aerosol forcing dataset (Toohey and Sigl, 2017) does account for self-limiting aerosol microphysical effects that reduce the forcing, although not in as much detail or realism as interactive aerosol models, and chemical and dynamical interactions which can affect the aerosol distribution are also not included. Our case study simulations instead show the importance of the spatial pattern of the aerosol for the NH forcing. Stoffel et al. (2015) suggested that nonlinear aerosol microphysical effects and the eruption season could largely reconcile discrepancies, and the AOD in their study is also much stronger in the SH. In UKESM1, the spatial pattern of aerosol forcing is very different when prescribing optical properties vs. using SO2 emissions, and this leads to a better agreement with proxy reconstructions for Samalas and Tambora when using emissions. However, the story is not so simple when comparing with other models that have run last-millennium simulations. For example, IPSL-CM6A-LR has very similar cooling and prescribed optical properties using the more symmetrical EVA(2k) dataset, demonstrating that the resulting forcing is highly model-dependent. For the comparison for Samalas, it should also be noted that, for this period, the number of MXD tree-ring data that are available is substantially less than for the 1450s and early 1800s (Esper et al., 2018), which will affect the fidelity of the reconstructed values in these records.
Furthermore, both the comparisons between models and to the proxy reconstructions are complicated by the choice of season in our simulations. Although the season was randomised in the UKESM1 and CESM2(WACCM6ma) simulations to avoid potential biases for future analyses, differences in season will contribute to model differences and to the proxy–model comparisons. Some of the randomised seasons (e.g. October for 1809) are also inconsistent with the timescales of measured sulfate deposition to the ice sheets (i.e. that deposition is measured before the eruption date). Although these eruptions are not a focus of this analysis, this should be considered in any future comparisons along with uncertainties in the dating from ice cores. Further work investigating the timescales between eruption and deposition, particularly on how this is dependent on the eruption location, season, and emission altitude, is warranted (e.g. Wainman et al., 2024).
We have investigated the impact of volcanic eruptions on the climate of the past millennium, focusing on the period 1250–1850 and the difference between representing eruptions using SO2 emissions versus prescribing the optical properties. We find that the stratospheric aerosol optical depth (SAOD) from models that use SO2 emissions and simulate aerosol interactively is different from the latest dataset, EVA(eVolv2k) (Toohey and Sigl, 2017) (Figs. 1, 5, and S5), which is the recommended forcing for models that do not have or do not use interactive stratospheric aerosol schemes. The interactive aerosol models tend to simulate more asymmetric aerosol forcing following several large tropical eruptions, compared with EVA(eVolv2k), which has a more even hemispheric and simplistic distribution, with differences also in the peak SAOD and its longevity (Figs. 1 and S6–S9).
Across six climate models, which used a mix of the two methods of volcanic forcing implementation, the average NH summer surface cooling response to 17 large-magnitude eruptions is, however, similar and remains larger than the tree-ring-reconstructed cooling (Fig. 3). However, for several individual eruptions, the models do show different responses, and a good comparison with tree-ring records is found for 1257 Mt. Samalas for UKESM1 and IPSL-CM6A-LR and for 1815 Mt. Tambora for all models except CESM2(WACCM6ma) (Fig. 4). Consequently, no clear dependency of the magnitude of cooling on the way volcanic eruptions were included was identified, although other model differences may be at play.
However, using the same model (UKESM1), we find that using SO2 emissions versus prescribing the optical properties leads to a smaller NH summer cooling that aligns better with tree-ring records for 1257 Mt. Samalas and 1815 Mt. Tambora (Fig. 8). Overall, our results suggest that there can be some reconciliation between model-simulated and tree-ring-derived cooling for the largest tropical eruptions, which in UKESM1 results from the more asymmetric aerosol forcing following the eruptions compared with the EVA(eVolv2k) dataset. For eruptions in the historical period (post-1850), the EVA model continues to produce more symmetric aerosol forcing across the hemispheres compared with the CMIP6 aerosol forcing dataset (Thomason et al., 2018). It is therefore important to further consider what is the most realistic spatial distribution of forcing following tropical eruptions in future simulations of last-millennium eruptions.
Future work should focus on further understanding some of the model differences presented here that are not necessarily a function of how the eruptions are simulated and on better understanding the relationship between the stratospheric sulfate aerosol load and the amount deposited onto the ice sheets. This work has highlighted the importance of internal variability which could be addressed by further ensemble member simulations and by investigating the role of ENSO at the time of the eruptions. We also do not explore the role of emissions and dating uncertainty of eruptions, which, in addition to uncertainties in the spatial patterns of the forcing and the climate response, will also likely aid in the further reconciliation of model-simulated climate variables and those derived from proxy reconstructions (e.g. Lücke et al., 2023; Timmreck et al., 2021). The eruption season is also shown here to play a key role in the NH summer temperature anomalies yet for most eruptions in the last millennium remains unknown. Resolving the season will be crucial in understanding many climate responses to these past eruptions. Furthermore, this work also highlights the need for developing SH tree-ring reconstructions that may be used to better constrain the magnitude and timing of cooling in the SH and consequently spatial forcing for these eruptions. Differences found in surface temperature response between our SO2-emissions-driven and prescribed simulations illustrate the importance of the exact magnitude and spatial structure of the volcanic forcing, and we encourage further studies that explore other climate impacts, for example, on ENSO, summer monsoon precipitation, and winter warming, that may depend more strongly on the spatial evolution of the aerosol.
Summary model data for the transient runs and UKESM1 case study data are available at https://doi.org/10.5285/756571adbea845f3a78e75e2aef9d968 (Marshall et al., 2025). EVA(eVolv2k) is available from the World Data Center for Climate at https://doi.org/10.1594/WDCC/eVolv2k_v2 (Toohey and Sigl, 2017b). The four tree-ring reconstructions are available at the NOAA National Centers for Environmental Information (NCEI), under the World Data Service (WDS) for Paleoclimatology as follows:
-
NTREND2015 at https://doi.org/10.25921/KZTR-JD59 (Wilson et al., 2016b);
-
Büntgen2021 at https://doi.org/10.25921/9986-r929 (Büntgen, 2021);
-
Guillet2017 at https://doi.org/10.25921/42GH-Z167 (Guillet et al., 2017b);
-
Schneider2015 at https://doi.org/10.25921/6MDT-5246 (Schneider et al., 2015b).
The supplement related to this article is available online at: https://doi.org/10.5194/cp-21-161-2025-supplement.
Conceptualisation: LRM and AS. Data curation: LRM. Formal analysis: LRM, APS, and LJL. Funding acquisition: AS, NLA, RW, KJA, and GCH. Investigation: LRM, AS, APS, NLA, and LJL. Methodology: LRM, AS, APS, NLA, RW, KJA, GCH, BJ, BLOB, ECB, MK, and KY. Supervision: AS. Visualisation: LRM. Writing (original draft preparation): LRM. Writing (review and editing): all.
The contact author has declared that none of the authors has any competing interests.
Publisher's note: Copernicus Publications remains neutral with regard to jurisdictional claims made in the text, published maps, institutional affiliations, or any other geographical representation in this paper. While Copernicus Publications makes every effort to include appropriate place names, the final responsibility lies with the authors.
We thank all those involved in the generation of PMIP4 data used in this study; Johann Jungclaus and Jiang Zhu for the provision of model data; Rolando Garcia for insightful discussion; Ken Carslaw and Piers Forster for involvement in the initial proposal for this project and for useful comments on this article; and Till Kuhlbrodt, Alistair Seller, Eddy Robertson, and Doug Kelley for UKESM1 modelling support. This work used the ARCHER UK National Supercomputing Service (2013 to 2021); the NEXCS high-performance computing facility funded by the Natural Environment Research Council and delivered by the Met Office between 2017 and 2021; Monsoon2, a collaborative high-performance computing facility funded by the Met Office and the Natural Environment Research Council; and JASMIN, the UK collaborative data analysis facility. For CESM2(WACCM6ma) simulations, computing and data storage resources, including the Cheyenne supercomputer (https://doi.org/10.5065/D6RX99HX), were provided by the Computational and Information Systems Laboratory (CISL) at NCAR. NCAR is sponsored by the National Science Foundation.
Lauren R. Marshall, Anja Schmidt, Nathan Luke Abraham, Andrew P. Schurer, Lucie J. Lücke, Gabriele C. Hegerl, and Rob Wilson were funded by the Natural Environment Research Council project Vol-Clim (NE/S000887/1). Kevin J. Anchukaitis was funded by grants from the U.S. National Oceanographic and Atmospheric Administration (NOAA; NA18OAR4310420) and the U.S. National Science Foundation (NSF; AGS-1803946 and AGS-2102993). Myriam Khodri acknowledges support from the IPSL Climate Graduate School EUR and from the HPC resources of TGCC under grant no. A0150113826 provided by GENCI (Grand Equipment National de Calcul Intensif). Bette L. Otto-Bliesner and Esther C. Brady received support from the National Center for Atmospheric Research (NCAR), which is a major facility sponsored by the National Science Foundation under grant no. 1852977.
The article processing charges for this open-access publication were covered by the German Aerospace Center (DLR).
This paper was edited by Laurie Menviel and reviewed by Alan Robock and one anonymous referee.
Abdelkader, M., Stenchikov, G., Pozzer, A., Tost, H., and Lelieveld, J.: The effect of ash, water vapor, and heterogeneous chemistry on the evolution of a Pinatubo-size volcanic cloud, Atmos. Chem. Phys., 23, 471–500, https://doi.org/10.5194/acp-23-471-2023, 2023.
Anchukaitis, K. J. and Smerdon, J. E.: Progress and uncertainties in global and hemispheric temperature reconstructions of the Common Era, Quaternary Sci. Rev., 286, 107537, https://doi.org/10.1016/j.quascirev.2022.107537, 2022.
Anchukaitis, K. J., Breitenmoser, P., Briffa, K. R., Buchwal, A., Büntgen, U., Cook, E. R., D'Arrigo, R. D., Esper, J., Evans, M. N., Frank, D., Grudd, H., Gunnarson, B. E., Hughes, M. K., Kirdyanov, A. V., Körner, C., Krusic, P. J., Luckman, B., Melvin, T. M., Salzer, M. W., Shashkin, A. V., Timmreck, C., Vaganov, E. A., and Wilson, R. J. S.: Tree rings and volcanic cooling, Nat. Geosci., 5, 836–837, https://doi.org/10.1038/ngeo1645, 2012.
Anchukaitis, K. J., Wilson, R., Briffa, K. R., Büntgen, U., Cook, E. R., D'Arrigo, R., Davi, N., Esper, J., Frank, D., Gunnarson, B. E., Hegerl, G., Helama, S., Klesse, S., Krusic, P. J., Linderholm, H. W., Myglan, V., Osborn, T. J., Zhang, P., Rydval, M., Schneider, L., Schurer, A., Wiles, G., and Zorita, E.: Last millennium Northern Hemisphere summer temperatures from tree rings: Part II, spatially resolved reconstructions, Quaternary Sci. Rev., 163, 1–22, https://doi.org/10.1016/j.quascirev.2017.02.020, 2017.
Archibald, A. T., O'Connor, F. M., Abraham, N. L., Archer-Nicholls, S., Chipperfield, M. P., Dalvi, M., Folberth, G. A., Dennison, F., Dhomse, S. S., Griffiths, P. T., Hardacre, C., Hewitt, A. J., Hill, R. S., Johnson, C. E., Keeble, J., Köhler, M. O., Morgenstern, O., Mulcahy, J. P., Ordóñez, C., Pope, R. J., Rumbold, S. T., Russo, M. R., Savage, N. H., Sellar, A., Stringer, M., Turnock, S. T., Wild, O., and Zeng, G.: Description and evaluation of the UKCA stratosphere–troposphere chemistry scheme (StratTrop vn 1.0) implemented in UKESM1, Geosci. Model Dev., 13, 1223–1266, https://doi.org/10.5194/gmd-13-1223-2020, 2020.
Aubry, T. J., Staunton-Sykes, J., Marshall, L. R., Haywood, J., Abraham, N. L., and Schmidt, A.: Climate change modulates the stratospheric volcanic sulfate aerosol lifecycle and radiative forcing from tropical eruptions, Nat. Commun., 12, 4708, https://doi.org/10.1038/s41467-021-24943-7, 2021.
Bednarz, E. M., Visioni, D., Kravitz, B., Jones, A., Haywood, J. M., Richter, J., MacMartin, D. G., and Braesicke, P.: Climate response to off-equatorial stratospheric sulfur injections in three Earth system models – Part 2: Stratospheric and free-tropospheric response, Atmos. Chem. Phys., 23, 687–709, https://doi.org/10.5194/acp-23-687-2023, 2023.
Boucher, O., Servonnat, J., Albright, A. L., Aumont, O., Balkanski, Y., Bastrikov, V., Bekki, S., Bonnet, R., Bony, S., Bopp, L., Braconnot, P., Brockmann, P., Cadule, P., Caubel, A., Cheruy, F., Codron, F., Cozic, A., Cugnet, D., D'Andrea, F., Davini, P., de Lavergne, C., Denvil, S., Deshayes, J., Devilliers, M., Ducharne, A., Dufresne, J.-L., Dupont, E., Éthé, C., Fairhead, L., Falletti, L., Flavoni, S., Foujols, M.-A., Gardoll, S., Gastineau, G., Ghattas, J., Grandpeix, J.-Y., Guenet, B., Guez, L., E., Guilyardi, E., Guimberteau, M., Hauglustaine, D., Hourdin, F., Idelkadi, A., Joussaume, S., Kageyama, M., Khodri, M., Krinner, G., Lebas, N., Levavasseur, G., Lévy, C., Li, L., Lott, F., Lurton, T., Luyssaert, S., Madec, G., Madeleine, J.-B., Maignan, F., Marchand, M., Marti, O., Mellul, L., Meurdesoif, Y., Mignot, J., Musat, I., Ottlé, C., Peylin, P., Planton, Y., Polcher, J., Rio, C., Rochetin, N., Rousset, C., Sepulchre, P., Sima, A., Swingedouw, D., Thiéblemont, R., Traore, A. K., Vancoppenolle, M., Vial, J., Vialard, J., Viovy, N., and Vuichard, N.: Presentation and Evaluation of the IPSL-CM6A-LR Climate Model, J. Adv. Model. Earth Sy., 12, e2019MS002010, https://doi.org/10.1029/2019MS002010, 2020.
Brooke, J. S. A., Feng, W., Carrillo-Sánchez, J. D., Mann, G. W., James, A. D., Bardeen, C. G., Marshall, L., Dhomse, S. S., and Plane, J. M. C.: Meteoric Smoke Deposition in the Polar Regions: A Comparison of Measurements With Global Atmospheric Models, J. Geophys. Res.-Atmos., 122, 11112–11130, https://doi.org/10.1002/2017JD027143, 2017.
Brown, F., Marshall, L., Haynes, P. H., Garcia, R. R., Birner, T., and Schmidt, A.: On the magnitude and sensitivity of the quasi-biennial oscillation response to a tropical volcanic eruption, Atmos. Chem. Phys., 23, 5335–5353, https://doi.org/10.5194/acp-23-5335-2023, 2023.
Büntgen, U.: NOAA/WDS Paleoclimatology – Northern Hemisphere 2,000 Year Tree-Ring Ensemble Temperature Reconstructions, NOAA National Centers for Environmental Information [data set], https://doi.org/10.25921/9986-r929, 2021.
Büntgen, U., Allen, K., Anchukaitis, K. J., Arseneault, D., Boucher, É., Bräuning, A., Chatterjee, S., Cherubini, P., Churakova, O. V., Corona, C., Gennaretti, F., Grießinger, J., Guillet, S., Guiot, J., Gunnarson, B., Helama, S., Hochreuther, P., Hughes, M. K., Huybers, P., Kirdyanov, A. V., Krusic, P. J., Ludescher, J., Meier, W. J. H., Myglan, V. S., Nicolussi, K., Oppenheimer, C., Reinig, F., Salzer, M. W., Seftigen, K., Stine, A. R., Stoffel, M., St. George, S., Tejedor, E., Trevino, A., Trouet, V., Wang, J., Wilson, R., Yang, B., Xu, G., and Esper, J.: The influence of decision-making in tree ring-based climate reconstructions, Nat. Commun., 12, 3411, https://doi.org/10.1038/s41467-021-23627-6, 2021.
Büntgen, U., Smith, S. H., Wagner, S., Krusic, P., Esper, J., Piermattei, A., Crivellaro, A., Reinig, F., Tegel, W., Kirdyanov, A., Trnka, M., and Oppenheimer, C.: Global tree-ring response and inferred climate variation following the mid-thirteenth century Samalas eruption, Clim. Dynam., 59, 531–546, https://doi.org/10.1007/s00382-022-06141-3, 2022.
Chim, M. M., Aubry, T. J., Abraham, N. L., Marshall, L., Mulcahy, J., Walton, J., and Schmidt, A.: Climate Projections Very Likely Underestimate Future Volcanic Forcing and Its Climatic Effects, Geophys. Res. Lett., 50, e2023GL103743, https://doi.org/10.1029/2023GL103743, 2023.
Chylek, P., Folland, C., Klett, J. D., and Dubey, M. K.: CMIP5 Climate Models Overestimate Cooling by Volcanic Aerosols, Geophys. Res. Lett., 47, e2020GL087047, https://doi.org/10.1029/2020GL087047, 2020.
Colose, C. M., LeGrande, A. N., and Vuille, M.: Hemispherically asymmetric volcanic forcing of tropical hydroclimate during the last millennium, Earth Syst. Dynam., 7, 681–696, https://doi.org/10.5194/esd-7-681-2016, 2016.
Crowley, T. J. and Unterman, M. B.: Technical details concerning development of a 1200 yr proxy index for global volcanism, Earth Syst. Sci. Data, 5, 187–197, https://doi.org/10.5194/essd-5-187-2013, 2013.
Danabasoglu, G., Lamarque, J.-F., Bacmeister, J., Bailey, D. A., DuVivier, A. K., Edwards, J., Emmons, L. K., Fasullo, J., Garcia, R., Gettelman, A., Hannay, C., Holland, M. M., Large, W. G., Lauritzen, P. H., Lawrence, D. M., Lenaerts, J. T. M., Lindsay, K., Lipscomb, W. H., Mills, M. J., Neale, R., Oleson, K. W., Otto-Bliesner, B., Phillips, A. S., Sacks, W., Tilmes, S., van Kampenhout, L., Vertenstein, M., Bertini, A., Dennis, J., Deser, C., Fischer, C., Fox-Kemper, B., Kay, J. E., Kinnison, D., Kushner, P. J., Larson, V. E., Long, M. C., Mickelson, S., Moore, J. K., Nienhouse, E., Polvani, L., Rasch, P. J., and Strand, W. G.: The Community Earth System Model Version 2 (CESM2), J. Adv. Model. Earth Sy., 12, e2019MS001916, https://doi.org/10.1029/2019MS001916, 2020.
D'Arrigo, R., Wilson, R., and Anchukaitis, K. J.: Volcanic cooling signal in tree ring temperature records for the past millennium, J. Geophys. Res.-Atmos., 118, 9000–9010, https://doi.org/10.1002/jgrd.50692, 2013.
Dhomse, S. S., Emmerson, K. M., Mann, G. W., Bellouin, N., Carslaw, K. S., Chipperfield, M. P., Hommel, R., Abraham, N. L., Telford, P., Braesicke, P., Dalvi, M., Johnson, C. E., O'Connor, F., Morgenstern, O., Pyle, J. A., Deshler, T., Zawodny, J. M., and Thomason, L. W.: Aerosol microphysics simulations of the Mt. Pinatubo eruption with the UM-UKCA composition-climate model, Atmos. Chem. Phys., 14, 11221–11246, https://doi.org/10.5194/acp-14-11221-2014, 2014.
Dhomse, S. S., Mann, G. W., Antuña Marrero, J. C., Shallcross, S. E., Chipperfield, M. P., Carslaw, K. S., Marshall, L., Abraham, N. L., and Johnson, C. E.: Evaluating the simulated radiative forcings, aerosol properties, and stratospheric warmings from the 1963 Mt Agung, 1982 El Chichón, and 1991 Mt Pinatubo volcanic aerosol clouds, Atmos. Chem. Phys., 20, 13627–13654, https://doi.org/10.5194/acp-20-13627-2020, 2020.
Duan, J., Wu, P., and Ma, Z.: Reconciling the Discrepancy of Post-Volcanic Cooling Estimated from Tree-Ring Reconstructions and Model Simulations over the Tibetan Plateau, Atmosphere, 10, 738, https://doi.org/10.3390/atmos10120738, 2019.
Esper, J., Schneider, L., Smerdon, J. E., Schöne, B. R., and Büntgen, U.: Signals and memory in tree-ring width and density data, Dendrochronologia, 35, 62–70, https://doi.org/10.1016/j.dendro.2015.07.001, 2015.
Esper, J., Büntgen, U., Hartl-Meier, C., Oppenheimer, C., and Schneider, L.: Northern Hemisphere temperature anomalies during the 1450s period of ambiguous volcanic forcing, B. Volcanol., 79, 41, https://doi.org/10.1007/s00445-017-1125-9, 2017.
Esper, J., St. George, S., Anchukaitis, K., D'Arrigo, R., Ljungqvist, F. C., Luterbacher, J., Schneider, L., Stoffel, M., Wilson, R., and Büntgen, U.: Large-scale, millennial-length temperature reconstructions from tree-rings, Dendrochronologia, 50, 81–90, https://doi.org/10.1016/j.dendro.2018.06.001, 2018.
Falster, G., Konecky, B., Coats, S., and Stevenson, S.: Forced changes in the Pacific Walker circulation over the past millennium, Nature, 622, 93–100, https://doi.org/10.1038/s41586-023-06447-0, 2023.
Fang, S.-W., Khodri, M., Timmreck, C., Zanchettin, D., and Jungclaus, J.: Disentangling Internal and External Contributions to Atlantic Multidecadal Variability Over the Past Millennium, Geophys. Res. Lett., 48, e2021GL095990, https://doi.org/10.1029/2021GL095990, 2021.
Fischer, E. M., Luterbacher, J., Zorita, E., Tett, S. F. B., Casty, C., and Wanner, H.: European climate response to tropical volcanic eruptions over the last half millennium, Geophys. Res. Lett., 34, L05707, https://doi.org/10.1029/2006GL027992, 2007.
Frank, D., Büntgen, U., Böhm, R., Maugeri, M., and Esper, J.: Warmer early instrumental measurements versus colder reconstructed temperatures: shooting at a moving target, Quaternary Sci. Rev., 26, 3298–3310, https://doi.org/10.1016/j.quascirev.2007.08.002, 2007.
Gao, C., Robock, A., and Ammann, C.: Volcanic forcing of climate over the past 1500 years: An improved ice core-based index for climate models, J. Geophys. Res.-Atmos., 113, D23111, https://doi.org/10.1029/2008JD010239, 2008.
Guillet, S., Corona, C., Stoffel, M., Khodri, M., Lavigne, F., Ortega, P., Eckert, N., Sielenou, P. D., Daux, V., Churakova , Olga V., Davi, N., Edouard, J.-L., Zhang, Y., Luckman, Brian H., Myglan, V. S., Guiot, J., Beniston, M., Masson-Delmotte, V., and Oppenheimer, C.: Climate response to the Samalas volcanic eruption in 1257 revealed by proxy records, Nat. Geosci., 10, 123–128, https://doi.org/10.1038/ngeo2875, 2017a.
Guillet, S., Corona, C., Stoffel, M., Khodri, M., Lavigne, F., Ortega, P., Eckert, N., Dkengne Sielenou, P., Daux, V., Churakova (Sidorova), O. V., Davi, N. K., Edouard, J.-L., Zhang, Y., Luckman, B. H., Myglan, V. S., Guiot, J., Beniston, M., Masson-Delmotte, V., and Oppenheimer, C.: NOAA/WDS Paleoclimatology – Northern Hemisphere 1,500 Year Summer Temperature Reconstructions, NOAA National Centers for Environmental Information [data set], https://doi.org/10.25921/42GH-Z167, 2017b.
Hartl-Meier, C. T. M., Büntgen, U., Smerdon, J. E., Zorita, E., Krusic, P. J., Ljungqvist, F. C., Schneider, L., and Esper, J.: Temperature Covariance in Tree Ring Reconstructions and Model Simulations Over the Past Millennium, Geophys. Res. Lett., 44, 9458–9469, https://doi.org/10.1002/2017GL073239, 2017.
Haywood, J. M., Jones, A., Bellouin, N., and Stephenson, D.: Asymmetric forcing from stratospheric aerosols impacts Sahelian rainfall, Nat. Clim. Change, 3, 660–665, https://doi.org/10.1038/nclimate1857, 2013.
Jones, A. C., Haywood, J. M., Dunstone, N., Emanuel, K., Hawcroft, M. K., Hodges, K. I., and Jones, A.: Impacts of hemispheric solar geoengineering on tropical cyclone frequency, Nat. Commun., 8, 1382, https://doi.org/10.1038/s41467-017-01606-0, 2017.
Jungclaus, J. H., Bard, E., Baroni, M., Braconnot, P., Cao, J., Chini, L. P., Egorova, T., Evans, M., González-Rouco, J. F., Goosse, H., Hurtt, G. C., Joos, F., Kaplan, J. O., Khodri, M., Klein Goldewijk, K., Krivova, N., LeGrande, A. N., Lorenz, S. J., Luterbacher, J., Man, W., Maycock, A. C., Meinshausen, M., Moberg, A., Muscheler, R., Nehrbass-Ahles, C., Otto-Bliesner, B. I., Phipps, S. J., Pongratz, J., Rozanov, E., Schmidt, G. A., Schmidt, H., Schmutz, W., Schurer, A., Shapiro, A. I., Sigl, M., Smerdon, J. E., Solanki, S. K., Timmreck, C., Toohey, M., Usoskin, I. G., Wagner, S., Wu, C.-J., Yeo, K. L., Zanchettin, D., Zhang, Q., and Zorita, E.: The PMIP4 contribution to CMIP6 – Part 3: The last millennium, scientific objective, and experimental design for the PMIP4 past1000 simulations, Geosci. Model Dev., 10, 4005–4033, https://doi.org/10.5194/gmd-10-4005-2017, 2017.
King, J. M., Anchukaitis, K. J., Tierney, J. E., Hakim, G. J., Emile-Geay, J., Zhu, F., and Wilson, R.: A Data Assimilation Approach to Last Millennium Temperature Field Reconstruction Using a Limited High-Sensitivity Proxy Network, J. Climate, 34, 7091–7111, https://doi.org/10.1175/JCLI-D-20-0661.1, 2021.
LeGrande, A. N., Tsigaridis, K., and Bauer, S. E.: Role of atmospheric chemistry in the climate impacts of stratospheric volcanic injections, Nat. Geosci., 9, 652–655, https://doi.org/10.1038/ngeo2771, 2016.
Lehner, F., Schurer, A. P., Hegerl, G. C., Deser, C., and Frölicher, T. L.: The importance of ENSO phase during volcanic eruptions for detection and attribution, Geophys. Res. Lett., 43, 2851–2858, https://doi.org/10.1002/2016GL067935, 2016.
Leland, C., D'Arrigo, R., Davi, N., Anchukaitis, K. J., Andreu-Hayles, L., Porter, T. J., Galloway, T., Mant, M., Wiles, G., Wilson, R., Beaulieu, S., Oelkers, R., Gaglioti, B. V., Rao, M. P., Reid, E., and Nixon, T.: A Spatiotemporal Assessment of Extreme Cold in Northwestern North America Following the Unidentified 1809 CE Volcanic Eruption, Paleoceanography and Paleoclimatology, 38, e2022PA004581, https://doi.org/10.1029/2022PA004581, 2023.
Liu, F., Gao, C., Chai, J., Robock, A., Wang, B., Li, J., Zhang, X., Huang, G., and Dong, W.: Tropical volcanism enhanced the East Asian summer monsoon during the last millennium, Nat. Commun., 13, 3429, https://doi.org/10.1038/s41467-022-31108-7, 2022.
Lücke, L. J., Hegerl, G. C., Schurer, A. P., and Wilson, R.: Effects of Memory Biases on Variability of Temperature Reconstructions, J. Climate, 32, 8713–8731, https://doi.org/10.1175/JCLI-D-19-0184.1, 2019.
Lücke, L. J., Schurer, A. P., Toohey, M., Marshall, L. R., and Hegerl, G. C.: The effect of uncertainties in natural forcing records on simulated temperature during the last millennium, Clim. Past, 19, 959–978, https://doi.org/10.5194/cp-19-959-2023, 2023.
Lurton, T., Balkanski, Y., Bastrikov, V., Bekki, S., Bopp, L., Braconnot, P., Brockmann, P., Cadule, P., Contoux, C., Cozic, A., Cugnet, D., Dufresne, J.-L., Éthé, C., Foujols, M.-A., Ghattas, J., Hauglustaine, D., Hu, R.-M., Kageyama, M., Khodri, M., Lebas, N., Levavasseur, G., Marchand, M., Ottlé, C., Peylin, P., Sima, A., Szopa, S., Thiéblemont, R., Vuichard, N., and Boucher, O.: Implementation of the CMIP6 Forcing Data in the IPSL-CM6A-LR Model, J. Adv. Model. Earth Sy., 12, e2019MS001940, https://doi.org/10.1029/2019MS001940, 2020.
Mann, G. W., Carslaw, K. S., Spracklen, D. V., Ridley, D. A., Manktelow, P. T., Chipperfield, M. P., Pickering, S. J., and Johnson, C. E.: Description and evaluation of GLOMAP-mode: a modal global aerosol microphysics model for the UKCA composition-climate model, Geosci. Model Dev., 3, 519–551, https://doi.org/10.5194/gmd-3-519-2010, 2010.
Mann, M. E., Fuentes, J. D., and Rutherford, S.: Underestimation of volcanic cooling in tree-ring-based reconstructions of hemispheric temperatures, Nat. Geosci., 5, 202–205, https://doi.org/10.1038/ngeo1394, 2012.
Marotzke, J. and Forster, P. M.: Forcing, feedback and internal variability in global temperature trends, Nature, 517, 565–570, https://doi.org/10.1038/nature14117, 2015.
Marshall, L., Schmidt, A., Toohey, M., Carslaw, K. S., Mann, G. W., Sigl, M., Khodri, M., Timmreck, C., Zanchettin, D., Ball, W. T., Bekki, S., Brooke, J. S. A., Dhomse, S., Johnson, C., Lamarque, J.-F., LeGrande, A. N., Mills, M. J., Niemeier, U., Pope, J. O., Poulain, V., Robock, A., Rozanov, E., Stenke, A., Sukhodolov, T., Tilmes, S., Tsigaridis, K., and Tummon, F.: Multi-model comparison of the volcanic sulfate deposition from the 1815 eruption of Mt. Tambora, Atmos. Chem. Phys., 18, 2307–2328, https://doi.org/10.5194/acp-18-2307-2018, 2018.
Marshall, L., Johnson, J. S., Mann, G. W., Lee, L., Dhomse, S. S., Regayre, L., Yoshioka, M., Carslaw, K. S., and Schmidt, A.: Exploring How Eruption Source Parameters Affect Volcanic Radiative Forcing Using Statistical Emulation, J. Geophys. Res.-Atmos., 124, 964–985, https://doi.org/10.1029/2018JD028675, 2019.
Marshall, L., Abraham, N. L., Schurer, A., Otto-Bliesner, B., Brady, E., Khodri, M., and Yoshida, K.: Vol-Clim data for Marshall et al. 2024, NERC EDS Centre for Environmental Data Analysis [data set], https://doi.org/10.5285/756571adbea845f3a78e75e2aef9d968, 2025.
Marshall, L. R., Schmidt, A., Johnson, J. S., Mann, G. W., Lee, L. A., Rigby, R., and Carslaw, K. S.: Unknown Eruption Source Parameters Cause Large Uncertainty in Historical Volcanic Radiative Forcing Reconstructions, J. Geophys. Res.-Atmos., 126, e2020JD033578, https://doi.org/10.1029/2020JD033578, 2021.
Masson-Delmotte, V., Schulz, M., Abe-Ouchi, A., Beer, J., Ganopolski, J., González Rouco, J. F., Jansen, E., Lambeck, K., Luterbacher, J., Naish, T., Osborn, T., Otto-Bliesner, B., Quinn, T., Ramesh, R., Rojas, M., Shao, X., and Timmermann, A.: Information from paleoclimate archives, in: Climate Change 2013: The Physical Science Basis. Contribution of Working Group I to the Fifth Assessment Report of the Intergovernmental Panel on Climate Change, edited by: Stocker, T. F., Qin, D., Plattner, G. K., Tignor, M., Allen, S. K., Doschung, J., Nauels, A., Xia, Y., Bex, V., and Midgley, P. M., Cambridge University Press, Cambridge, UK, https://doi.org/10.1017/CBO9781107415324.013, 383–464, 2013.
Mauritsen, T., Bader, J., Becker, T., Behrens, J., Bittner, M., Brokopf, R., Brovkin, V., Claussen, M., Crueger, T., Esch, M., Fast, I., Fiedler, S., Fläschner, D., Gayler, V., Giorgetta, M., Goll, D. S., Haak, H., Hagemann, S., Hedemann, C., Hohenegger, C., Ilyina, T., Jahns, T., Jimenéz-de-la-Cuesta, D., Jungclaus, J., Kleinen, T., Kloster, S., Kracher, D., Kinne, S., Kleberg, D., Lasslop, G., Kornblueh, L., Marotzke, J., Matei, D., Meraner, K., Mikolajewicz, U., Modali, K., Möbis, B., Müller, W. A., Nabel, J. E. M. S., Nam, C. C. W., Notz, D., Nyawira, S.-S., Paulsen, H., Peters, K., Pincus, R., Pohlmann, H., Pongratz, J., Popp, M., Raddatz, T. J., Rast, S., Redler, R., Reick, C. H., Rohrschneider, T., Schemann, V., Schmidt, H., Schnur, R., Schulzweida, U., Six, K. D., Stein, L., Stemmler, I., Stevens, B., von Storch, J.-S., Tian, F., Voigt, A., Vrese, P., Wieners, K.-H., Wilkenskjeld, S., Winkler, A., and Roeckner, E.: Developments in the MPI-M Earth System Model version 1.2 (MPI-ESM1.2) and Its Response to Increasing CO2, J. Adv. Model. Earth Sy., 11, 998–1038, https://doi.org/10.1029/2018MS001400, 2019.
Mills, M. J., Schmidt, A., Easter, R., Solomon, S., Kinnison, D. E., Ghan, S. J., Neely III, R. R., Marsh, D. R., Conley, A., Bardeen, C. G., and Gettelman, A.: Global volcanic aerosol properties derived from emissions, 1990–2014, using CESM1(WACCM), J. Geophys. Res.-Atmos., 121, 2332–2348, https://doi.org/10.1002/2015JD024290, 2016.
Mills, M. J., Richter, J. H., Tilmes, S., Kravitz, B., MacMartin, D. G., Glanville, A. A., Tribbia, J. J., Lamarque, J.-F., Vitt, F., Schmidt, A., Gettelman, A., Hannay, C., Bacmeister, J. T., and Kinnison, D. E.: Radiative and Chemical Response to Interactive Stratospheric Sulfate Aerosols in Fully Coupled CESM1(WACCM), J. Geophys. Res.-Atmos., 122, 13,061-013,078, https://doi.org/10.1002/2017JD027006, 2017.
Mulcahy, J. P., Johnson, C., Jones, C. G., Povey, A. C., Scott, C. E., Sellar, A., Turnock, S. T., Woodhouse, M. T., Abraham, N. L., Andrews, M. B., Bellouin, N., Browse, J., Carslaw, K. S., Dalvi, M., Folberth, G. A., Glover, M., Grosvenor, D. P., Hardacre, C., Hill, R., Johnson, B., Jones, A., Kipling, Z., Mann, G., Mollard, J., O'Connor, F. M., Palmiéri, J., Reddington, C., Rumbold, S. T., Richardson, M., Schutgens, N. A. J., Stier, P., Stringer, M., Tang, Y., Walton, J., Woodward, S., and Yool, A.: Description and evaluation of aerosol in UKESM1 and HadGEM3-GC3.1 CMIP6 historical simulations, Geosci. Model Dev., 13, 6383–6423, https://doi.org/10.5194/gmd-13-6383-2020, 2020.
Mulcahy, J. P., Jones, C. G., Rumbold, S. T., Kuhlbrodt, T., Dittus, A. J., Blockley, E. W., Yool, A., Walton, J., Hardacre, C., Andrews, T., Bodas-Salcedo, A., Stringer, M., de Mora, L., Harris, P., Hill, R., Kelley, D., Robertson, E., and Tang, Y.: UKESM1.1: development and evaluation of an updated configuration of the UK Earth System Model, Geosci. Model Dev., 16, 1569–1600, https://doi.org/10.5194/gmd-16-1569-2023, 2023.
Neukom, R., Schurer, A. P., Steiger, N. J., and Hegerl, G. C.: Possible causes of data model discrepancy in the temperature history of the last Millennium, Sci. Rep., 8, 7572, https://doi.org/10.1038/s41598-018-25862-2, 2018.
Ohgaito, R., Yamamoto, A., Hajima, T., O'ishi, R., Abe, M., Tatebe, H., Abe-Ouchi, A., and Kawamiya, M.: PMIP4 experiments using MIROC-ES2L Earth system model, Geosci. Model Dev., 14, 1195–1217, https://doi.org/10.5194/gmd-14-1195-2021, 2021.
Pausata, F. S. R., Chafik, L., Caballero, R., and Battisti, D. S.: Impacts of high-latitude volcanic eruptions on ENSO and AMOC, P. Natl. Acad. Sci. USA, 112, 13784–13788, https://doi.org/10.1073/pnas.1509153112, 2015.
Pinto, J. P., Turco, R. P., and Toon, O. B.: Self-limiting physical and chemical effects in volcanic eruption clouds, J. Geophys. Res.-Atmos., 94, 11165–11174, https://doi.org/10.1029/JD094iD08p11165, 1989.
Predybaylo, E., Stenchikov, G., Wittenberg, A. T., and Osipov, S.: El Niño/Southern Oscillation response to low-latitude volcanic eruptions depends on ocean pre-conditions and eruption timing, Commun. Earth Environ., 1, 12, https://doi.org/10.1038/s43247-020-0013-y, 2020.
Quaglia, I., Timmreck, C., Niemeier, U., Visioni, D., Pitari, G., Brodowsky, C., Brühl, C., Dhomse, S. S., Franke, H., Laakso, A., Mann, G. W., Rozanov, E., and Sukhodolov, T.: Interactive stratospheric aerosol models' response to different amounts and altitudes of SO2 injection during the 1991 Pinatubo eruption, Atmos. Chem. Phys., 23, 921–948, https://doi.org/10.5194/acp-23-921-2023, 2023.
Ranjithkumar, A., Gordon, H., Williamson, C., Rollins, A., Pringle, K., Kupc, A., Abraham, N. L., Brock, C., and Carslaw, K.: Constraints on global aerosol number concentration, SO2 and condensation sink in UKESM1 using ATom measurements, Atmos. Chem. Phys., 21, 4979–5014, https://doi.org/10.5194/acp-21-4979-2021, 2021.
Rao, M. P., Cook, E. R., Cook, B. I., Anchukaitis, K. J., D'Arrigo, R. D., Krusic, P. J., and LeGrande, A. N.: A double bootstrap approach to Superposed Epoch Analysis to evaluate response uncertainty, Dendrochronologia, 55, 119–124, https://doi.org/10.1016/j.dendro.2019.05.001, 2019.
Schmidt, A., Carslaw, K. S., Mann, G. W., Wilson, M., Breider, T. J., Pickering, S. J., and Thordarson, T.: The impact of the 1783–1784 AD Laki eruption on global aerosol formation processes and cloud condensation nuclei, Atmos. Chem. Phys., 10, 6025–6041, https://doi.org/10.5194/acp-10-6025-2010, 2010.
Schmidt, A., Mills, M. J., Ghan, S., Gregory, J. M., Allan, R. P., Andrews, T., Bardeen, C. G., Conley, A., Forster, P. M., Gettelman, A., Portmann, R. W., Solomon, S., and Toon, O. B.: Volcanic Radiative Forcing From 1979 to 2015, J. Geophys. Res.-Atmos., 123, 12491–12508, https://doi.org/10.1029/2018JD028776, 2018.
Schneider, L., Smerdon, J. E., Büntgen, U., Wilson, R. J. S., Myglan, V. S., Kirdyanov, A. V., and Esper, J.: Revising midlatitude summer temperatures back to A. D. 600 based on a wood density network, Geophys. Res. Lett., 42, 4556–4562, https://doi.org/10.1002/2015GL063956, 2015a.
Schneider, L., Smerdon, J. E., Büntgen, U., Wilson, R. J. S., Myglan, V. S., Kirdyanov, A., and Esper, J.: NOAA/WDS Paleoclimatology – Northern Hemisphere Extratropics 1400 Year MXD Summer Temperature Reconstruction, NOAA National Centers for Environmental Information [data set], https://doi.org/10.25921/6MDT-5246, 2015b.
Schneider, L., Smerdon, J. E., Pretis, F., Hartl-Meier, C., and Esper, J.: A new archive of large volcanic events over the past millennium derived from reconstructed summer temperatures, Environ. Res. Lett., 12, 094005, https://doi.org/10.1088/1748-9326/aa7a1b, 2017.
Schurer, A. P., Hegerl, G. C., Mann, M. E., Tett, S. F. B., and Phipps, S. J.: Separating Forced from Chaotic Climate Variability over the Past Millennium, J. Climate, 26, 6954–6973, https://doi.org/10.1175/JCLI-D-12-00826.1, 2013.
Schurer, A. P., Tett, S. F. B., and Hegerl, G. C.: Small influence of solar variability on climate over the past millennium, Nat. Geosci., 7, 104–108, https://doi.org/10.1038/ngeo2040, 2014.
Schurer, A. P., Hegerl, G. C., Goosse, H., Bollasina, M. A., England, M. H., Mineter, M. J., Smith, D. M., and Tett, S. F. B.: Quantifying the contribution of forcing and three prominent modes of variability to historical climate, Clim. Past, 19, 943–957, https://doi.org/10.5194/cp-19-943-2023, 2023.
Sellar, A. A., Jones, C. G., Mulcahy, J. P., Tang, Y., Yool, A., Wiltshire, A., O'Connor, F. M., Stringer, M., Hill, R., Palmieri, J., Woodward, S., de Mora, L., Kuhlbrodt, T., Rumbold, S. T., Kelley, D. I., Ellis, R., Johnson, C. E., Walton, J., Abraham, N. L., Andrews, M. B., Andrews, T., Archibald, A. T., Berthou, S., Burke, E., Blockley, E., Carslaw, K., Dalvi, M., Edwards, J., Folberth, G. A., Gedney, N., Griffiths, P. T., Harper, A. B., Hendry, M. A., Hewitt, A. J., Johnson, B., Jones, A., Jones, C. D., Keeble, J., Liddicoat, S., Morgenstern, O., Parker, R. J., Predoi, V., Robertson, E., Siahaan, A., Smith, R. S., Swaminathan, R., Woodhouse, M. T., Zeng, G., and Zerroukat, M.: UKESM1: Description and Evaluation of the U. K. Earth System Model, J. Adv. Model. Earth Sy., 11, 4513–4558, https://doi.org/10.1029/2019MS001739, 2019.
Sellitto, P., Podglajen, A., Belhadji, R., Boichu, M., Carboni, E., Cuesta, J., Duchamp, C., Kloss, C., Siddans, R., Bègue, N., Blarel, L., Jegou, F., Khaykin, S., Renard, J. B., and Legras, B.: The unexpected radiative impact of the Hunga Tonga eruption of 15th January 2022, Communications Earth & Environment, 3, 288, https://doi.org/10.1038/s43247-022-00618-z, 2022.
Sheng, J.-X., Weisenstein, D. K., Luo, B.-P., Rozanov, E., Arfeuille, F., and Peter, T.: A perturbed parameter model ensemble to investigate Mt. Pinatubo's 1991 initial sulfur mass emission, Atmos. Chem. Phys., 15, 11501–11512, https://doi.org/10.5194/acp-15-11501-2015, 2015.
Staunton-Sykes, J., Aubry, T. J., Shin, Y. M., Weber, J., Marshall, L. R., Luke Abraham, N., Archibald, A., and Schmidt, A.: Co-emission of volcanic sulfur and halogens amplifies volcanic effective radiative forcing, Atmos. Chem. Phys., 21, 9009–9029, https://doi.org/10.5194/acp-21-9009-2021, 2021.
Stenchikov, G., Ukhov, A., Osipov, S., Ahmadov, R., Grell, G., Cady-Pereira, K., Mlawer, E., and Iacono, M.: How Does a Pinatubo-Size Volcanic Cloud Reach the Middle Stratosphere?, J. Geophys. Res.-Atmos., 126, e2020JD033829, https://doi.org/10.1029/2020JD033829, 2021.
Stevenson, S., Fasullo, J. T., Otto-Bliesner, B. L., Tomas, R. A., and Gao, C.: Role of eruption season in reconciling model and proxy responses to tropical volcanism, P. Natl. Acad. Sci. USA, 114, 1822–1826, https://doi.org/10.1073/pnas.1612505114, 2017.
Stoffel, M., Khodri, M., Corona, C., Guillet, S., Poulain, V., Bekki, S., Guiot, J., Luckman, B. H., Oppenheimer, C., Lebas, N., Beniston, M., and Masson-Delmotte, V.: Estimates of volcanic-induced cooling in the Northern Hemisphere over the past 1,500 years, Nat. Geosci., 8, 784–788, https://doi.org/10.1038/ngeo2526, 2015.
Thomason, L. W., Ernest, N., Millán, L., Rieger, L., Bourassa, A., Vernier, J.-P., Manney, G., Luo, B., Arfeuille, F., and Peter, T.: A global space-based stratospheric aerosol climatology: 1979–2016, Earth Syst. Sci. Data, 10, 469–492, https://doi.org/10.5194/essd-10-469-2018, 2018.
Timmreck, C.: Modeling the climatic effects of large explosive volcanic eruptions, WIREs Clim. Change, 3, 545–564, https://doi.org/10.1002/wcc.192, 2012.
Timmreck, C., Mann, G. W., Aquila, V., Hommel, R., Lee, L. A., Schmidt, A., Brühl, C., Carn, S., Chin, M., Dhomse, S. S., Diehl, T., English, J. M., Mills, M. J., Neely, R., Sheng, J., Toohey, M., and Weisenstein, D.: The Interactive Stratospheric Aerosol Model Intercomparison Project (ISA-MIP): motivation and experimental design, Geosci. Model Dev., 11, 2581–2608, https://doi.org/10.5194/gmd-11-2581-2018, 2018.
Timmreck, C., Toohey, M., Zanchettin, D., Brönnimann, S., Lundstad, E., and Wilson, R.: The unidentified eruption of 1809: a climatic cold case, Clim. Past, 17, 1455–1482, https://doi.org/10.5194/cp-17-1455-2021, 2021.
Toohey, M. and Sigl, M.: Volcanic stratospheric sulfur injections and aerosol optical depth from 500 BCE to 1900 CE, Earth Syst. Sci. Data, 9, 809–831, https://doi.org/10.5194/essd-9-809-2017, 2017a.
Toohey, M. and Sigl, M.: Reconstructed volcanic stratospheric sulfur injections and aerosol optical depth, 500 BCE to 1900 CE, version 2, World Data Center for Climate (WDCC) at DKRZ [data set], https://doi.org/10.1594/WDCC/eVolv2k_v2, 2017b.
Toohey, M., Krüger, K., Niemeier, U., and Timmreck, C.: The influence of eruption season on the global aerosol evolution and radiative impact of tropical volcanic eruptions, Atmos. Chem. Phys., 11, 12351–12367, https://doi.org/10.5194/acp-11-12351-2011, 2011.
Toohey, M., Stevens, B., Schmidt, H., and Timmreck, C.: Easy Volcanic Aerosol (EVA v1.0): an idealized forcing generator for climate simulations, Geosci. Model Dev., 9, 4049–4070, https://doi.org/10.5194/gmd-9-4049-2016, 2016.
Toohey, M., Krüger, K., Schmidt, H., Timmreck, C., Sigl, M., Stoffel, M., and Wilson, R.: Disproportionately strong climate forcing from extratropical explosive volcanic eruptions, Nat. Geosci., 12, 100–107, https://doi.org/10.1038/s41561-018-0286-2, 2019.
van Dijk, E., Jungclaus, J., Lorenz, S., Timmreck, C., and Krüger, K.: Was there a volcanic-induced long-lasting cooling over the Northern Hemisphere in the mid-6th–7th century?, Clim. Past, 18, 1601–1623, https://doi.org/10.5194/cp-18-1601-2022, 2022.
Villamayor, J., Khodri, M., Fang, S.-W., Jungclaus, J. H., Timmreck, C., and Zanchettin, D.: Sahel Droughts Induced by Large Volcanic Eruptions Over the Last Millennium in PMIP4/Past1000 Simulations, Geophys. Res. Lett., 50, e2022GL101478, https://doi.org/10.1029/2022GL101478, 2023.
Visioni, D., Bednarz, E. M., Lee, W. R., Kravitz, B., Jones, A., Haywood, J. M., and MacMartin, D. G.: Climate response to off-equatorial stratospheric sulfur injections in three Earth System Models – Part 1: experimental protocols and surface changes, EGUsphere [preprint], https://doi.org/10.5194/egusphere-2022-401, 2022.
Wade, D. C., Vidal, C. M., Abraham, N. L., Dhomse, S., Griffiths, P. T., Keeble, J., Mann, G., Marshall, L., Schmidt, A., and Archibald, A. T.: Reconciling the climate and ozone response to the 1257 CE Mount Samalas eruption, P. Natl. Acad. Sci. USA, 117, 26651–26659, https://doi.org/10.1073/pnas.1919807117, 2020.
Wainman, L., Marshall, L. R., and Schmidt, A.: Utilising a multi-proxy to model comparison to constrain the season and regionally heterogeneous impacts of the Mt Samalas 257 eruption, Clim. Past, 20, 951–968, https://doi.org/10.5194/cp-20-951-2024, 2024.
Wells, A. F., Jones, A., Osborne, M., Damany-Pearce, L., Partridge, D. G., and Haywood, J. M.: Including ash in UKESM1 model simulations of the Raikoke volcanic eruption reveals improved agreement with observations, Atmos. Chem. Phys., 23, 3985–4007, https://doi.org/10.5194/acp-23-3985-2023, 2023.
Wilson, R., Anchukaitis, K., Briffa, K. R., Büntgen, U., Cook, E., D'Arrigo, R., Davi, N., Esper, J., Frank, D., Gunnarson, B., Hegerl, G., Helama, S., Klesse, S., Krusic, P. J., Linderholm, H. W., Myglan, V., Osborn, T. J., Rydval, M., Schneider, L., Schurer, A., Wiles, G., Zhang, P., and Zorita, E.: Last millennium Northern Hemisphere summer temperatures from tree rings: Part I: The long term context, Quaternary Sci. Rev., 134, 1–18, https://doi.org/10.1016/j.quascirev.2015.12.005, 2016a.
Wilson, R., Anchukaitis, K. J., Briffa, K. R., Büntgen, U., Cook, E. R., D'Arrigo, R. D., Davi, N. K., Esper, J., Frank, D. C., Gunnarson, B. E., Hegerl, G. C., Helama, S., Klesse, S., Krusic, P. J., Linderholm, H. W., Myglan, V. S., Osborn, T. J., Rydval, M., Schneider, L., Schurer, A. P., Wiles, G., Zhang, P., and Zorita, E.: NOAA/WDS Paleoclimatology – Northern Hemisphere 1250 Year N-TREND Summer Temperature Reconstructions, NOAA National Centers for Environmental Information [data set], https://doi.org/10.25921/KZTR-JD59, 2016b.
Yang, W., Vecchi, G. A., Fueglistaler, S., Horowitz, L. W., Luet, D. J., Muñoz, Á. G., Paynter, D., and Underwood, S.: Climate Impacts From Large Volcanic Eruptions in a High-Resolution Climate Model: The Importance of Forcing Structure, Geophys. Res. Lett., 46, 7690–7699, https://doi.org/10.1029/2019GL082367, 2019.
Yukimoto, S., Kawai, H., Koshiro, T., Oshima, N., Yoshida, K., Urakawa, S., Tsujino, H., Deushi, M., Tanaka, T., Hosaka, M., Yabu, S., Yoshimura, H., Shindo, E., Mizuta, R., Obata, A., Adachi, Y., and Ishii, M.: The Meteorological Research Institute Earth System Model Version 2.0, MRI-ESM2.0: Description and Basic Evaluation of the Physical Component, J. Meteorol. Soc. Jpn. Ser. II, 97, 931–965, https://doi.org/10.2151/jmsj.2019-051, 2019.
Zanchettin, D., Timmreck, C., Khodri, M., Schmidt, A., Toohey, M., Abe, M., Bekki, S., Cole, J., Fang, S.-W., Feng, W., Hegerl, G., Johnson, B., Lebas, N., LeGrande, A. N., Mann, G. W., Marshall, L., Rieger, L., Robock, A., Rubinetti, S., Tsigaridis, K., and Weierbach, H.: Effects of forcing differences and initial conditions on inter-model agreement in the VolMIP volc-pinatubo-full experiment, Geosci. Model Dev., 15, 2265–2292, https://doi.org/10.5194/gmd-15-2265-2022, 2022.
Zhu, F., Emile-Geay, J., Hakim, G. J., King, J., and Anchukaitis, K. J.: Resolving the Differences in the Simulated and Reconstructed Temperature Response to Volcanism, Geophys. Res. Lett., 47, e2019GL086908, https://doi.org/10.1029/2019GL086908, 2020.
Zhu, F., Emile-Geay, J., Anchukaitis, K. J., Hakim, G. J., Wittenberg, A. T., Morales, M. S., Toohey, M., and King, J.: A re-appraisal of the ENSO response to volcanism with paleoclimate data assimilation, Nat. Commun., 13, 747, https://doi.org/10.1038/s41467-022-28210-1, 2022.
Zuo, M., Zhou, T., and Man, W.: Response of summer precipitation over the Tibetan Plateau to large tropical volcanic eruptions in the last millennium, Clim. Dynam., 60, 3121–3138, https://doi.org/10.1007/s00382-022-06463-2, 2023.