the Creative Commons Attribution 4.0 License.
the Creative Commons Attribution 4.0 License.
 | 24 May 2022
A multi-ice-core, annual-layer-counted Greenland ice-core chronology for the last 3800 years: GICC21
Mai Winstrup
Tobias Erhardt
Eliza Cook
Camilla Marie Jensen
Anders Svensson
Bo Møllesøe Vinther
Raimund Muscheler
Sune Olander Rasmussen
Ice-core timescales are vital for the understanding of past climate; hence they should be updated whenever significant amounts of new data become available. Here, the Greenland ice-core chronology GICC05 was revised for the last 3835 years by synchronizing six deep ice cores and three shallow ice cores from the central Greenland ice sheet. A new method was applied by combining automated counting of annual layers on multiple parallel proxies and manual fine-tuning. A layer counting bias was found in all ice cores because of site-specific signal disturbances; therefore the manual comparison of all ice cores was deemed necessary to increase timescale accuracy. After examining sources of error and their correlation lengths, the uncertainty rate was quantified to be 1 year per century.
The new timescale is younger than GICC05 by about 13 years at 3835 years ago. The most recent 800 years are largely unaffected by the revision. Between 800 and 2000 years ago, the offset between timescales increases steadily, with the steepest offset occurring between 800 and 1100 years ago. Moreover, offset oscillations of about 5 years around the average are observed between 2500 and 3800 years ago. The non-linear offset behavior is attributed to previous mismatches of volcanic eruptions, to the much more extensive dataset available to this study, and to the finer resolution of the new ice-core ammonium matching. By analysis of the common variations in cosmogenic radionuclides, the new ice-core timescale is found to be in alignment with the IntCal20 curve (Reimer et al., 2020).
Please read the corrigendum first before continuing.
-
Notice on corrigendum
The requested paper has a corresponding corrigendum published. Please read the corrigendum first before downloading the article.
-
Article
(3414 KB)
- Corrigendum
-
Supplement
(4783 KB)
-
The requested paper has a corresponding corrigendum published. Please read the corrigendum first before downloading the article.
- Article
(3414 KB) - Full-text XML
- Corrigendum
-
Supplement
(4783 KB) - BibTeX
- EndNote


Paleoclimatic chronologies allow the comparison of proxy records from different geographic locations, thereby providing a fundamental tool for the understanding of the Earth's climate. In the Late Holocene, from 4200 years ago to today (Walker et al., 2012), the large amount of well-resolved data make it possible to construct very precise and accurate timescales. Late Holocene timescales are constructed by a large variety of methods depending on the typology of the sample, from dendrochronology to radio-isotopic measurements and from tephrochronology to chemical analysis of ice cores. Timescale methods fall into two main categories: absolute methods providing an absolute age of the sample, such as radiocarbon dating (Bronk-Ramsey, 2008), and relative or comparative methods, such as stratigraphic comparison of isochrones in ice cores (Rasmussen et al., 2008). For the case of ice-core dating in Greenland, annual-layer counting is a privileged method for the construction of a relative sequence of events, thanks to well-resolved annual layers recognizable well into the last glacial in the chemical and optical measurements of the ice (Andersen et al., 2006).
Once the independent timescales from different geographic locations are set up and compared, it may be possible to investigate lead–lag dynamics within the broader climate system. In the Holocene, recent studies investigated the comprehensive impact of volcanic eruptions, suggesting for example a 10-year cooling in European summer temperatures (Sigl et al., 2015) or a 5-year positive North Atlantic Oscillation (NAO) (Sjolte et al., 2018), both observed after tropical eruptions. Other examples of such inter-regional comparative studies, dependent on timescale accuracy, are the study of bipolar timing of climate changes in the last glacial (WAIS Divide Project Members, 2015; Pedro et al., 2018; Svensson et al., 2020) or the relative timing of the Holocene onset over Greenland and Asia (Nakagawa et al., 2021).
1.1 Annual layers in Greenlandic ice cores
Ice cores from Greenland contain high-quality climatic information thanks to the steady deposition of snow and impurities and to the inclusion of air bubbles in the ice, processes which have occurred continuously since the formation of the ice sheet. The deposited snow contains a variety of chemical compounds, such as sodium, calcium, or ammonium ions, and water-insoluble particles, like dust and volcanic ashes, which may all be interpreted as proxies for climatic conditions and processes (Fuhrer et al., 1999; Rhodes et al., 2018). Moreover, the isotopic composition of the deposited snow is an important indication for temperature and moisture at the drill sites, although the link between climate and isotopes is intrinsically complex, especially on shorter timescales (Dansgaard, 1964; Johnsen et al., 1989; Laepple et al., 2018).
Some proxies follow a clear annual cycle that can be observed if the layer thickness and the analytical measurement method provide sufficient resolution. The seasonal patterns of ice-core proxies are determined by complex depositional dynamics that control the transport from the sources to the ice sheet (Gfeller et al., 2014; Whitlow et al., 1992; Beer et al., 1991; Fischer et al., 1998; Fuhrer et al., 1996). For example, sodium (Na+) has a strong winter peak because of increased advection of marine air masses (Herron, 1982), which can be used to define the start of the ice-core layer. Relative to sodium, calcium (Ca2+) peaks in the spring because of enhanced transport from terrestrial reservoirs (Whitlow et al., 1992); ammonium () has a maximum in the late spring or the summer because of enhanced biogenic activity in the North American continent (Fischer et al., 2015); nitrate (), which is also related to biogenic processes, peaks in the summer (Herron, 1982; Röthlisberger et al., 2002). Water isotopes (δ18O and δD) show a sinusoidal pattern with winter valleys and summer peaks, mainly representing temperature variations at the drill site (Jouzel et al., 1997).
The quality of the retrieved signals is highest during high-accumulation periods and especially at high-accumulation sites, since, for example, isotopes are heavily affected by diffusion (Johnsen, 1977). To correct for the isotopic diffusion, it may be necessary to apply deconvolution techniques to reconstruct the original annual layers (Vinther et al., 2006). At the Holocene onset, the accumulation rates are about double as high as in the glacial stadial (Rasmussen et al., 2006). Furthermore, the Holocene ice roughly comprises the upper half of the central Greenland ice sheet and is not affected by ice thinning at the same level as the older, much thinner, glacial layers (Vinther et al., 2009; Gkinis et al., 2014; Gerber et al., 2021). In the Late Holocene, the isotopic signal was quite stable, an indication of a relatively constant layer record (Vinther et al., 2009). Overall, the shape and thickness of Late Holocene layers in all ice cores is expected to be stable and well-recognizable. However, the data quality for parts of the Holocene is hampered by the brittle ice zone, which is found at depths at which high-pressure gas bubbles in the ice make the core very fragile (Neff, 2014).
1.2 Annual-layer counting methods
Annual layers in ice cores can be counted manually, a process that has always been a challenging part of ice-core timescale reconstructions (Vinther et al., 2006; Rasmussen et al., 2006; Sigl et al., 2013, 2016). Manual identification of annual layers is a time-consuming and inherently subjective task, and attempts have been made to automate the process (McGwire et al., 2008; Smith et al., 2009). StratiCounter (SC) is a software package that computes the most likely sequence of annual layers in an ice-core multi-proxy dataset (Winstrup, 2011; Winstrup et al., 2012; Winstrup, 2016). Starting from example data provided by the user and applying a hidden semi-Markov model, the algorithm learns to recognize the specific annual pattern. SC provides a layer count and a probability distribution of the recognized layer boundaries. Some initial settings determine if the program should, for example, reduce the resolution of the original data, apply some pre-processing, or give different weight to the different data series in the analysis. These requirements are both ice core and proxy dependent.
1.3 Holocene stratigraphic markers
Short-term events may be used to synchronize ice cores if the corresponding horizons can be unambiguously seen in several ice cores. Volcanic eruptions constitute the most robust base for matching ice cores because they often leave a clear imprint in the ice-core signal. When available, sulfate () measurements are used to identify individual eruptions because of the associated emission of sulfur compounds to the atmosphere that precipitate onto the ice sheet (Lin et al., 2021). Thanks to the acidic nature of sulfate, eruptions are also recorded as prominent peaks in the electrical conductivity measurements (ECMs) and in the dielectric permittivity (DEP) (Hammer, 1980; Clausen et al., 1997; Wilhelms et al., 1998; Mojtabavi et al., 2020a). However, ECM and DEP volcanic peaks might be weakened or eliminated by the opposite effect of alkaline dust; hence sulfate remains the most reliable indicator of volcanic spikes (Rasmussen et al., 2008).
The identity of the volcano can be confirmed when volcanic ash layers (tephra) are found in the ice cores and geochemically and stratigraphically matched to reference deposits from the origin site (Zielinski et al., 1994; Abbott and Davies, 2012; Bourne et al., 2015; Cook et al., 2018a). Otherwise, if the source volcano has not yet been identified, the geochemical similarity of layers found in different ice cores provides evidence of synchronicity (Cook et al., 2018b; Mojtabavi et al., 2020a). However, for the most part, there is no tephra associated with acidity peaks of assumed volcanic origin, and thus, for those tephra-free sections, the matching of the cores relies entirely on the identification of corresponding patterns of acidity peaks.
The volcanic-eruption signal usually spans more than 1 year, so that one can identify the start, the maximum, and the end of the event (Clausen et al., 1997). However, the chemo-stratigraphic response to volcanic eruptions can vary between ice cores due to different depositional dynamics. The recorded shape and delay of the volcanic signal depends, for example, on the distance from the eruption site, on the balance between dry and wet deposition of sulfate, on snow redistribution, and on different noise levels at the ice-core site (Robock and Free, 1995, and references therein; Gautier et al., 2016). Therefore, it can happen that a very strong eruption signal in the GRIP ice core (Greenland Ice Core Project) from, e.g., an Alaskan eruption will only appear as a minor signal in the DYE-3 core because the two drilling sites received snowfall is different meteorological situations (Clausen et al., 1997). Hence the matching cannot rely only on the position of single peaks but must also depend on patterns of closely spaced eruptions. Still, the link between many historical eruptions and the corresponding ice-core acidity spikes is well-established and serves as an exact time reference (Sigl et al., 2015).
Ammonium () is a proxy for biogenic activity (Fuhrer et al., 1996), and ammonium spikes have been directly linked to biomass burning events, i.e., wildfires (Fischer et al., 2015). Wildfires are also recorded in other chemical species, such as black carbon and vanillic acid (Grieman et al., 2018; Zdanowicz et al., 2018). Because of the alkaline nature of , the ECM will record marked dips in correspondence with ammonium spikes (Taylor et al., 1993; Rasmussen et al., 2006). Occasionally, nitrate () peaks are observed to coincide with spikes, but they do not provide a reliable proxy for wildfires on their own (Legrand et al., 2016). The quality of these species as a unique proxy for wildfires is debated since they are not always consistent with each other and they likely reflect different aspects of the source, the event intensity, and the trajectory to Greenland. It is not possible to find the origin of wildfires with the same certainty as for volcanic eruptions because there is no “fingerprinting” technique for wildfires, but patterns of ammonium-rich layers can nonetheless be identified across the Greenlandic ice cores, providing an additional tool for synchronization (Rasmussen et al., 2008; Legrand et al., 2016).
Other events that serve as tie points between ice cores include the variability of cosmogenic radionuclides, which are caused by solar storms or by other forms of solar variability (Muscheler et al., 2014). By measuring the co-registration of two tie points such as the 775 CE and the 994 CE events, Sigl et al. (2015) showed that beryllium-10 enhancements (10Be) provide precise constraints of alignment between tree-ring and ice-core timescales. In the recent work by O'Hare et al. (2019), the signature of an intense solar storm was identified in ice cores, at an age of 660 BCE, which provides an added alignment point between ice cores and tree-ring timescales in the Late Holocene. Lastly, the radioactive fallout from nuclear bomb testing, which peaked in 1963, provides a reliable and very recent chronostratigraphic marker in the form of a tritium or 36Cl peak, which is especially useful for shallow ice cores (Qiao et al., 2021).
1.4 The GICC05 timescale in the Holocene
The Greenland Ice Core Chronology 2005 (GICC05) is the most widely recognized timescale for Greenland ice-core studies (Vinther et al., 2006; Svensson et al., 2008). In the Holocene, GICC05 is based on three ice cores: the DYE-3 ice core from southern Greenland (Johnsen et al., 2001), the GRIP ice core from Summit in central Greenland (Dansgaard et al., 1993), and the NorthGRIP ice core from northwestern Greenland (North Greenland Ice Core Project members, 2004). The ice cores were matched by recognizing common volcanic eruptions in the ECM signal, and the annual layers were manually counted using water isotopes (δ18O and δD are available in overlapping sections and are equally suited for annual-layer identification). In the older part of the Holocene, high-resolution impurity records were also included in the layer counting, but they were not available at the time for reconstructing the timescale for the Late Holocene (Rasmussen et al., 2006).
When the ice-core data quality was not equal between the three cores, a master chronology was produced on the best-resolved record, which was then transferred to the other ice cores. Until 1813 b2k (years before 2000 CE; the same convention applied in the rest of this paper), the count was produced on isotopes from DYE-3 and deconvoluted isotopes from GRIP and NorthGRIP. From 1813 until 3835 b2k, NorthGRIP ages were transferred from DYE-3 and GRIP because of lacking isotope data.
In the construction of GICC05, an acidity spike attributed to the Vesuvius eruption (79 CE, Italy) was considered an exact time marker, carrying no age uncertainty, based on a tephra deposit found in GRIP (Vinther et al., 2006; Barbante et al., 2013). Recent analysis of the NEEM-S1-2011 shallow ice core (North Greenland Eemian Ice Drilling) shows that the tephra associated with the acidity peak in this core is geochemically distinct from the shards found in GRIP (Plunkett et al., 2022) and likely originates from an Alaskan eruption. Furthermore, the analysis of the original GRIP shards by Barbante et al. (2013) was criticized by Plunkett et al. (2022) as not fulfilling sufficient requirements for the attribution to Vesuvius, thus leaving the GICC05 chronology with a significant chronological weakness.
As another discussion point, Hammer (1980) and Vinther et al. (2006) attributed a prominent ECM peak in GICC05 to the massive Hekla eruption (1104 CE, Iceland). Later, Coulter et al. (2012) attempted to find confirmation in the tephra found close to this ECM peak, but neither DYE-3 nor GRIP or NorthGRIP supported the identification with the Hekla eruption. Recently, Guillet et al. (2020) proposed that the signal represents a cluster of eruptions, one of them possibly originating from Mount Asama, Japan. Recent comparisons between Greenlandic ice cores and 14C chronologies have exposed other issues with the layer count in selected sections of the timescale (Baillie, 2008, 2010; Lohne et al., 2013; Torbenson et al., 2015; Muscheler et al., 2014; Sigl et al., 2015; Adolphi and Muscheler, 2016; Adolphi et al., 2018; McAneney and Baillie, 2019). In this work we aim to expand on the causes of the GICC05 mismatches and to investigate other recurring problems to be resolved, such as the uncertainty question of ice-core timescales.
A special mention for the Greenland timescale has to be made for the GISP2 ice core (Greenland Ice Sheet Project), drilled at Summit in the vicinity of the GRIP site. Meese et al. (1997) constructed a timescale for this ice core that remained a widely used standard until GICC05 was released. Annual-layer counting was performed manually using a combination of visual stratigraphy, ECM, dust laser scattering, isotopes, and ion chemistry. A number of tephra samples was collected in the Holocene ice, confirming the identity of, among others, the Laki eruption of 1783 CE (Fiacco et al., 1994), the Samalas eruption of 1257 CE (Palais et al., 1992; Lavigne et al., 2013), and the Eldjá eruption of 939 CE (Zielinski et al., 1995). Of these three eruptions, only the first two have an independent historical estimate of the age, the Samalas eruption being dated by indirect evidence of its occurrence in 1257 CE (Vidal et al., 2016). In addition, authors of GISP2 also used Vesuvius to constrain the timescale. The agreement with GICC05 has been estimated as adequate until 40 kyr b2k (Svensson et al., 2008; Seierstad et al., 2014). However, over the period between 2.5 and 8 kyr b2k, the GISP2 timescale is between 5 and 40 years younger than GICC05, which is outside the maximum counting error (MCE) limit.
Uncertainty estimates of GICC05 in the Holocene
The uncertainty associated with a timescale is essential for correct interpretation of the climatic data. The most important source of uncertainty in GICC05 was considered to be the misinterpretation of annual layers by the observers. By defining uncertain layers to be features in the ice core that could neither be dismissed nor confirmed (Vinther et al., 2006), the GICC05 uncertainty was estimated from the MCE, defined as half the sum of the uncertain layers accumulated until the corresponding age (Rasmussen et al., 2006). Thus, each uncertain layer contributes with years to the age scale, whereas certain layers contribute 1±0 years.
A fundamental choice in uncertainty estimation is whether one assumes uncorrelated errors. If the errors are uncorrelated, they should be summed in quadrature. If, on the other hand, all errors are fully correlated, then the total uncertainty is a linear sum of the individual errors. Acknowledging that for the case of ice cores the errors are likely neither fully correlated nor uncorrelated, the authors of GICC05 opted for a conservative approach and summed the MCE linearly but in turn did not include contributions from other sources than misinterpretation of annual layers. The authors also observed that the count between 1362 CE (Öræfajökull, Iceland) and 79 CE (Vesuvius) was correct within 1 year, corresponding to ∼0.1 % of the interval. As this number was smaller than the MCE it was considered negligible. Hence, the MCE does not consider the bias one can introduce, for example because of misleading assumptions on the tie points or abruptly changing layer shapes.
In summary, GICC05 was considered exact for the part younger than the eruption peak previously assigned to Vesuvius because many well-known historical eruptions tied the chronology together. Therefore, the published uncertainty until about 2.7 kyr b2k is only 2 years, increasing to 5 years at 3.9 kyr b2k.
1.5 The NS1-2011 timescale
A more recent Greenland ice-core timescale for the past 2500 years was based on new bipolar tie points, such as volcanic tephra and solar storm data, and on new high-resolution multi-parameter impurity records (Sigl et al., 2015). This timescale will be referred to as the NS1-2011 chronology, as it was designed on the NEEM-2011-S1 ice core by lifting the Vesuvius and Hekla constraints and replacing them with newer historical evidence about volcanic tie points at 536, 626, and 939 CE and about a solar proton event at 775 CE. StratiCounter was employed to count annual layers on the NEEM-2011-S1 shallow core and on the NEEM deep ice core. These ice cores were matched to NorthGRIP via numerous volcanic tie points to allow for comparison to GICC05. Moreover, a manual count on the NEEM main core was conducted until 500 BCE. For most of the timescale, SC was run in constrained mode using volcanic tie points of a known age. The earliest exact time marker applied for the chronology is the 536 CE eruption, prominent in the acidity and sulfate records. For ice older than 536 CE, the authors analyzed detailed records of historical, literary, and climatic evidence and found that the timescale aligns with most of the validation points, providing statistical tests to evaluate the significance of the result. Moreover, the timescale was compared to the Antarctic timescale WD2014 (Sigl et al., 2016) and to tree ring records to verify the overall good agreement of Greenland with other climatic archives.
The NS1-2011 offset to GICC05 at around 79 CE was quantified to be 8 years and the age of the layer formerly attributed to Vesuvius was changed to 87/88 CE.
The uncertainty estimate of the NS1-2011 timescale was based on the SC probability estimate. The age of volcanic eruptions is reported as a weighted average of the SC counts in NEEM-2011-S1, the NEEM main core, and WDC (West Antarctic Ice Sheet Divide Ice Core). For example, the age of the Indonesian Samalas eruption (Vidal et al., 2016) is given as 1258±2 years CE. Moreover, the comparison between the manual and the automated count in NEEM amounted to a difference of 1 year over the 500-year time interval. The timescale was estimated to have a 5-year uncertainty at 2500 b2k.
1.6 The need for a revised and unified Greenland ice-core chronology in the Holocene
Given the known inconsistencies between existing Greenland Holocene timescales, we find it timely to revise the GICC05 timescale to provide a new unified ice-core chronology that includes most available data from Greenlandic deep ice cores. Our dataset includes, amongst others, the new high-resolution dataset from the recent EastGRIP (East GReenland Ice Core Project) ice core (Mojtabavi et al., 2020a; Erhardt et al., 2022: see the “Data availability section” at the end). Our method relies on parallel dating of multiple cores with well-resolved annual data back to 3835 b2k, a period which ensures data coverage from at least four ice cores until the brittle ice zone starts affecting the data quality.
SC cannot presently be applied to multiple ice cores together. Hence, SC cannot at this time provide a fully automated multi-core timescale. Nevertheless, SC can be applied separately to each ice core, on their own depth scale, after which the resulting counts can be combined between cores. Furthermore, SC cannot be used to assess whether the ice-core signal is affected by disturbances that might have altered its shape, such as snow redistribution, melt layers, and multiple seasonal peaks in the proxies (Mosley-Thompson et al., 2001; Westhoff et al., 2021; Geng et al., 2014). These observations rely on a comparison of records from several ice cores. Hence, an extensive manual effort is still required to identify problematic layers and to bring a multi-ice-core timescale to a final state.
We find the MCE unsuited to apply to our timescale, since by nature it is a single-record uncertainty estimate that does not capture the complexity of the multi-core chronology: an uncertain layer in one core may be certain or absent in another, and thus a comparison of the two can solve many chronological issues. Based on the combination of statistical estimates and empirical observation, we propose a simple formula to provide the new timescale, named GICC21, with a robust, consistent, and user-friendly uncertainty estimation.
Data from six deep and three shallow ice cores provide the basis for GICC21; details about each drilling site are given in Table 1. Resolution and quality of the data reflect not only the local climatic conditions but also the state of the technology at the time of ice-core retrieval and measurement. Moreover, data are only available or of sufficient resolution and quality for layer counting at selected ice-core depth ranges (Fig. 1b).
Table 1Specifications about the ice cores included in this study.
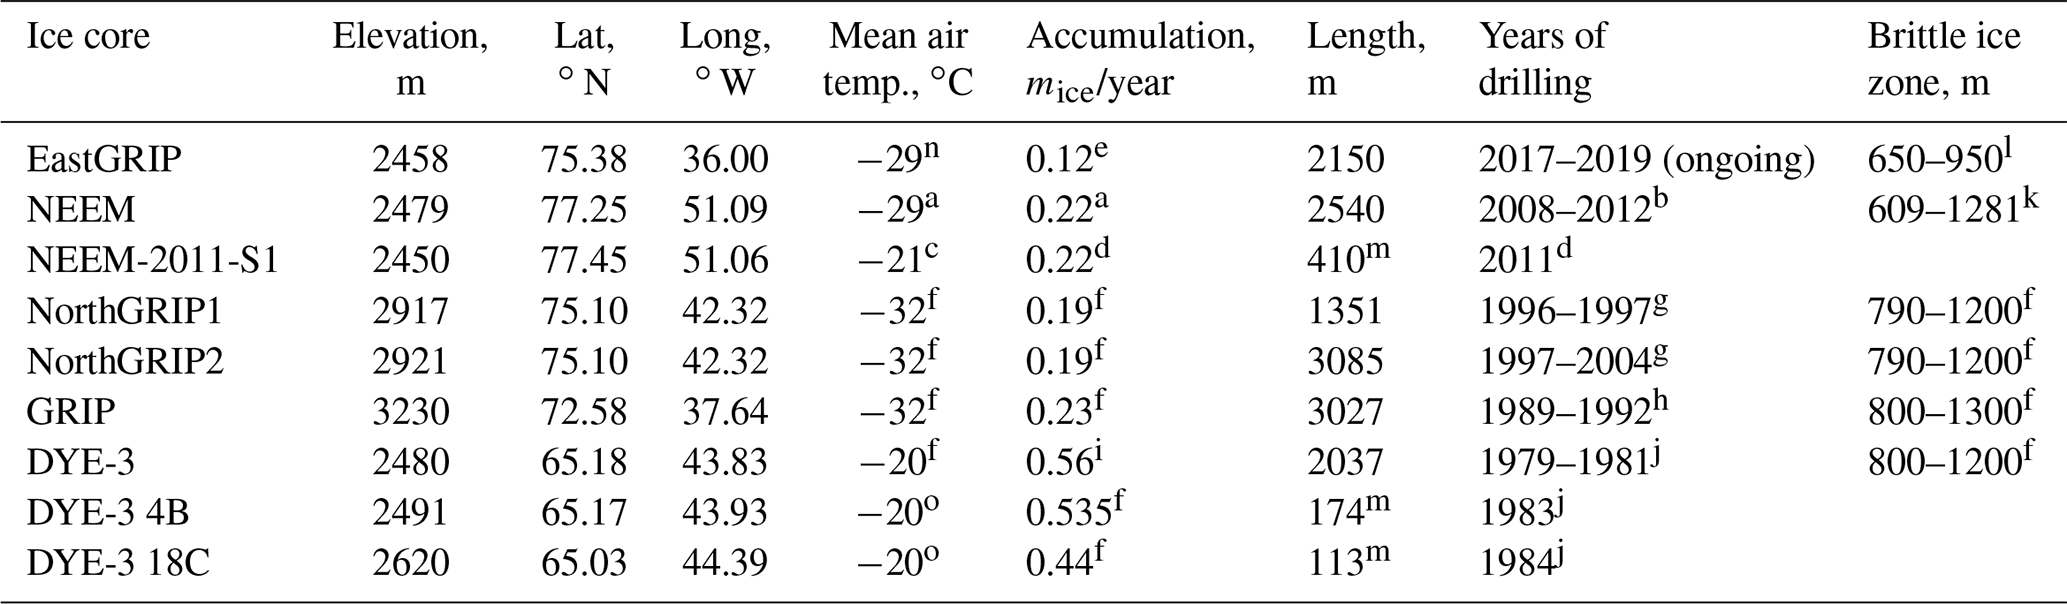
a NEEM community members (2013). b Rasmussen et al. (2013a). c Faïn et al. (2014). d Sigl et al. (2013). e Gerber et al. (2021). f Vinther et al. (2010). g Dahl-Jensen et al. (2002). h Johnsen et al. (1992). i Vinther et al. (2006). j Clausen and Hammer (1988). k Warming et al. (2013). l Westhoff et al. (2021). m Shallow ice cores. n Estimated from PROMICE data (Ahlstrøm and PROMICE project team, 2007). o Assumed same as DYE-3.
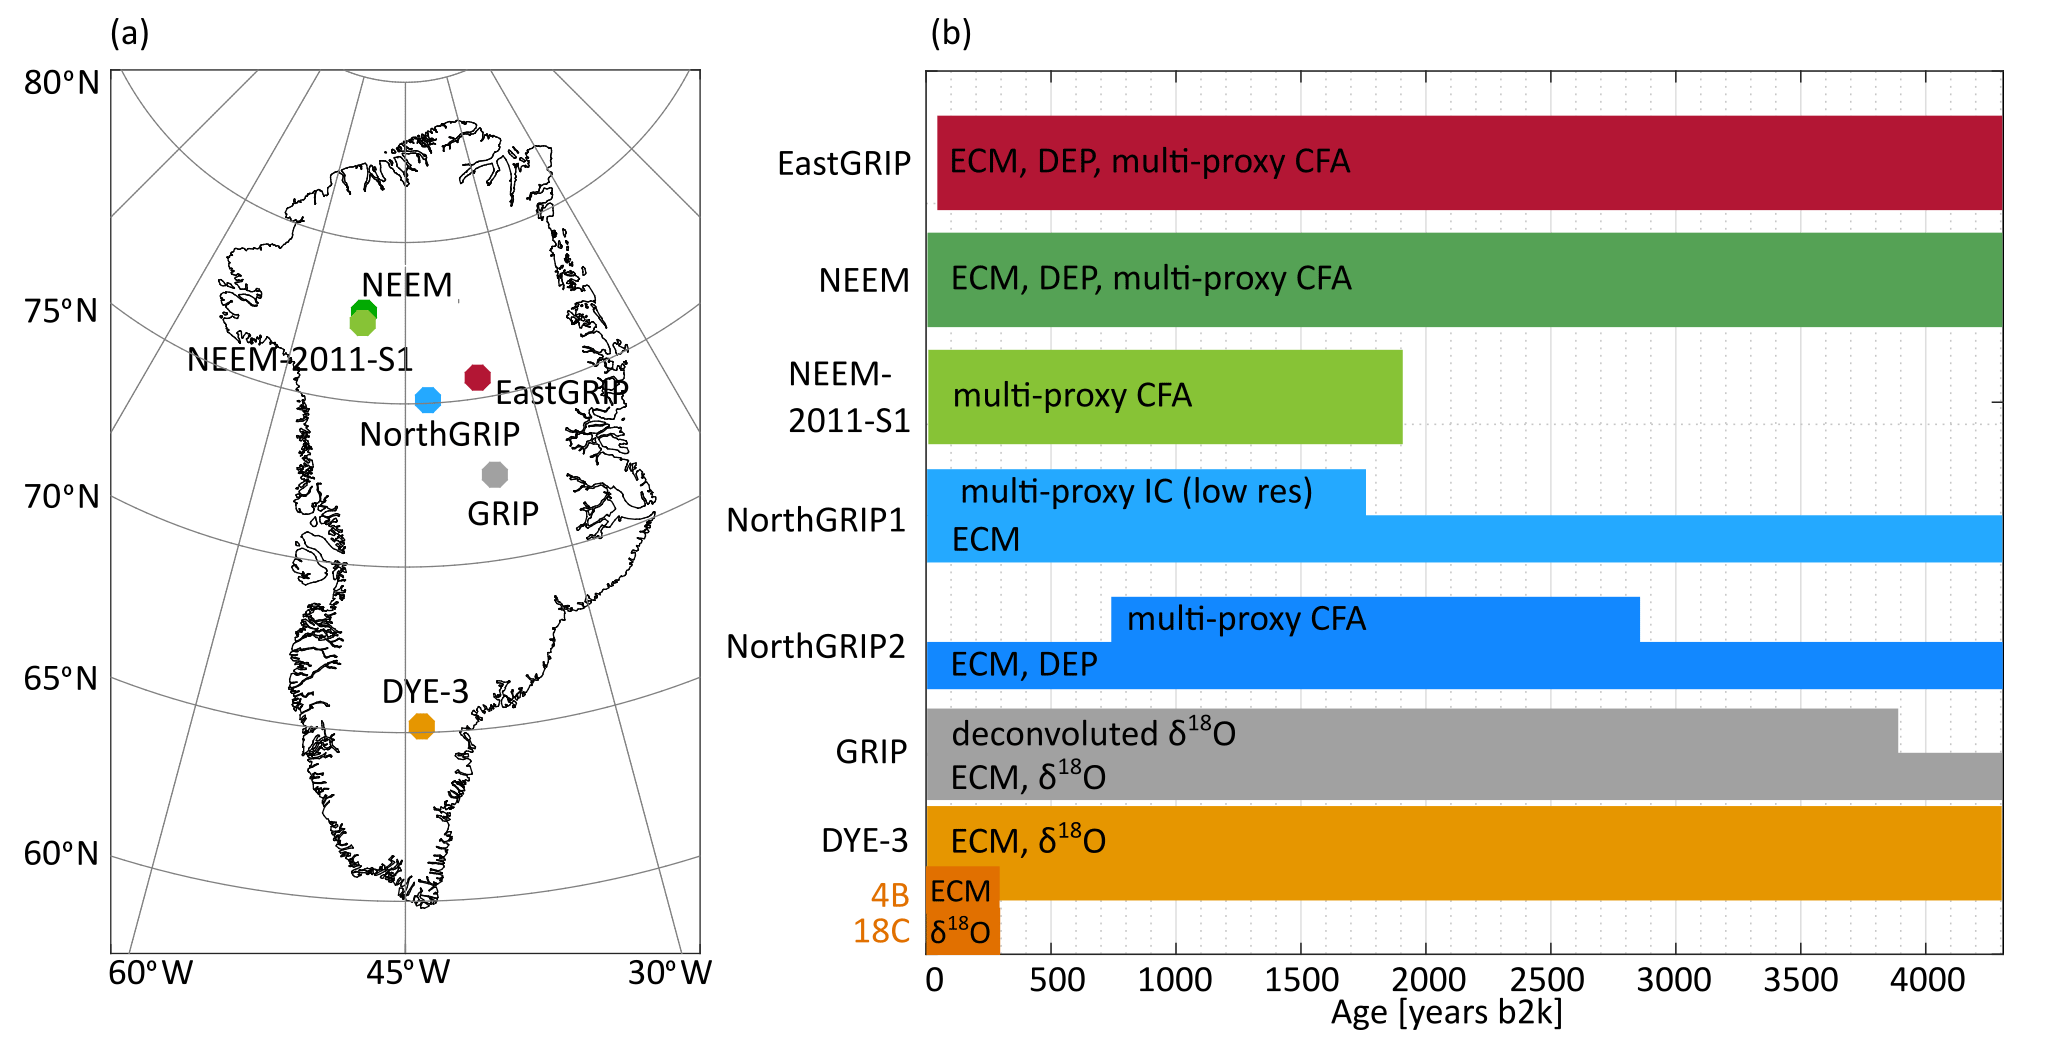
Figure 1Overview of the data used for this study. (a) Geographic locations of the ice cores, for which Table 1 contains the site specifications. (b) The colored patches summarize the available datasets used for annual-layer counting (e.g., continuous flow analysis – CFA) and inter-core matching (e.g., ECM), plotted on their approximate age range.
2.1 EastGRIP
The East GReenland Ice-core Project (EastGRIP) is an ongoing drilling effort which in the latest field season (2019) reached a depth of about 2150 m. The ECM and DEP measurements were made in the field camp on 1.65 m long pieces of ice (Mojtabavi et al., 2020a). Chemistry records of aerosol impurities were measured in Bern using the proven continuous flow analysis (CFA) setup (Kaufmann et al., 2008) paired to an inductively coupled plasma time-of-flight mass spectrometer (ICP-TOFMS; Erhardt et al., 2019). The chemistry data include a vast range of different species measured continuously at a high sampling resolution (1 mm), with a resolving power of about 1 cm, making this dataset among the most detailed available. However, the annual accumulation rate at this site is also the lowest of the records included (Table 1). A detailed description of the CFA setup and the data used in this study can be found in Erhardt et al. (2022; see the “Data availability section”). For counting layers, we used Na, Ca, NH, and concentrations from 13.82 to 460.30 m depth. Water isotope records were also measured continuously, but, due to the low annual accumulation, the annual signal does not survive diffusion in the firn and therefore cannot be used for annual-layer identification.
2.2 NEEM and NEEM-2011-S1
The NEEM ice-core drilling was completed in 2012 (NEEM community members, 2013). ECM and DEP were measured in the field at 1 mm resolution (Rasmussen et al., 2013). Impurity records, measured by an international team coordinated by the University of Bern, were also obtained in the field and have a depth resolution similar to the EastGRIP dataset (Kaufmann et al., 2008) but, due to brittle ice, suffer from increasingly wide data gaps that make annual-layer identification difficult below around 750 m. Hence, we used ECM, Na+, Ca2+, NH, and for layer counting between 7.6 and 727.3 m depth. A detailed description of the NEEM CFA measurements and the dataset can be found in Erhardt et al. (2021). An additional CFA dataset was measured at the Desert Research Institute (DRI) by Sigl et al. (2015) and provides additional data from 399 to 500 m. This dataset was not used for the SC count, but the quality of the layer count was later verified considering this additional data. Moreover, the Sigl et al. (2015) dataset contains black carbon (BC), which we used to consolidate the ammonium match.
The NEEM-2011-S1 ice core is a 410 m shallow core that was drilled about 100 m away from the NEEM main core (Sigl et al., 2013). This core reaches back to the volcanic layer attributed in GICC05 to the Vesuvius eruption (79 CE). Chemistry data were measured at DRI for the entire core length, but the ECM of the shallow core was not measured; hence we relied on non-sea-salt sulfate (nss-S) for volcanic matching (Sigl et al., 2013). The species Na, nss-Ca, nss-Na, NH, , and BC were used for layer counting between 6.1 and 410.8 m, in order to achieve a similar SC output as in Sigl et al. (2015). BC was also used to consolidate the ammonium match.
2.3 NorthGRIP
The NorthGRIP drilling was completed in 2004 and is composed of two ice cores: NorthGRIP1 and NorthGRIP2 (Dahl-Jensen et al., 2002). For NorthGRIP1, ECM data are available until the core ends, at about 1351 m, and discrete chemical measurements (5 cm resolution) are available uninterruptedly until 350 m and in short fragments below this (Vinther et al., 2006). Despite the resolution of only 4–5 samples per year, the annual-layer pattern is clearly recognizable, and we used ECM, Na+, Ca2+, NH, , Cl−, Mg2+, , and δ18O for layer counting between 9.9 and 349.1 m depth.
For the upper part (159–582 m) of NorthGRIP2, a continuous chemistry dataset was later measured at the DRI with a resolution of 1 cm (McConnell et al., 2018). The dataset includes a vast range of species, of which we used Na, Ca, NH, and for layer counting between 159.6 to 582.4 m depth (approximately from 730 to 3200 b2k). For volcanic matching, we mainly used a combination of ECM and DEP signals. This new record constitutes an important addition to the chronology, since it allows coverage of the NorthGRIP site until almost the end of our timescale.
2.4 GRIP
The drilling of the GRIP ice core (or Summit ice core) was completed in 1992 (Johnsen et al., 1992). Only ECM and isotope data are available for counting layers in this core in the Late Holocene. The annual signal in the isotope data (2.5 cm resolution) is moderately affected by diffusion, but deconvolution restores a very strong sinusoidal pattern that can be used for annual counting (Johnsen et al., 2000; Vinther et al., 2003). ECM also shows an annual signal, analogous to GISP2, with a summer peak caused by enhanced acid deposition (Meese et al., 1997). Hence, we used ECM (1 mm resolution), δ18O, and deconvoluted δ18O to count annual layers between 5.3 and 770.1 m depth. The deconvolution is sensitive both to melt layers and to unusually wide layers. The first contain sharp gradients which create artifacts in the data, typically resulting in a series of high-amplitude oscillations that do not correspond to real annual layers, while the second result in spurious low-amplitude oscillations. The width of these perturbations is usually 2–5 years, and they are not difficult to spot for a trained investigator (Fig. S6 in the Supplement).
2.5 DYE-3
The oldest ice core in this chronology is DYE-3 whose drilling was completed in 1981 (Clausen and Hammer, 1988). The data available to our study are mainly ECM (∼7 mm resolution) and water isotopes (1 cm resolution) (Langway et al., 1985). The isotope record resolves the annual layers very well thanks to the high accumulation rate which provides wide layers that are safe from diffusion and is used for counting from 0.9 to 1271.7 m depth. The ECM signal also appears to have an annual pattern (Neftel et al., 1985); hence we also used ECM to count layers from 136 to 1271.7 m. Because of lacking a setup in the first year of drilling, the ECM measurements only start after 136 m. Therefore, to construct the top chronology of DYE-3, we included two shallow cores named 4B and 18C located close to the deep core site, for which ECM and water isotopes were available for counting (Vinther et al., 2010).
The first objective of this study is the construction of a common chronology for several ice cores with data suitable for annual-layer counting.
Our timescale construction method relies on three main steps:
-
automated annual-layer boundary identification using SC;
-
ice-core matching using volcanic and ammonium tie points;
-
multi-core layer comparison by multiple observers (called fine-tuning).
We subsequently perform a study of the uncertainty of the resulting timescale.
3.1 The raw output: counting annual layers on each ice core with StratiCounter
To avoid the lengthy and likely somewhat inconsistent process of manual layer counting, GICC21 was based on a multi-core set of annual layers identified on each ice core by SC, which also returns an uncertainty distribution of the number of layers in each individual ice core. SC has better performances with multiple proxies, but including more than four species did not prove to make a substantial difference for the final result because some species are not independent of each other (e.g., those dominated by minerals with dust as a primary source) and some have similar seasonal patterns. As training data, SC requires a set of annual layers manually placed by the user. We chose to place the annual-layer mark on the annual sodium maximum as the best indicator of the start of a new year, except for ice cores without impurity data, where we chose the isotope annual minimum, since the two methods are roughly equivalent (Fig. S7).
Measurement gaps should be minimized using all available data to obtain an accurate layer count. Since DEP is generally measured on the full ice core and ECM is measured on the first longitudinal cut of the core, they are both less affected by ice-core breaks than the subsequent measurements made on smaller samples or obtained from a continuous stream of melted sample. So, although the yearly pattern in the ECM signal is not always discernible and cannot be the basis of reliable annual-layer identification, it proved useful for ice cores with many small gaps, like NEEM and EastGRIP. In addition, the ECM records of DYE-3 and, to some degree, GRIP exhibit an annual ECM cycle, which helps improve the SC result. When data gaps cannot be avoided, SC makes a probabilistic estimate of the layer count considering the neighboring data.
To facilitate the pattern recognition process by SC, the datasets were pre-processed using the appropriate settings for each ice core (see the Straticounter_preprocessing_supplement.xlsx file in the Supplement). The best pre-processing settings were established after testing if SC was able to accurately estimate the layers between the Laki and Samalas eruptions, within a tolerance of a few years. Elemental and ionic concentrations were treated identically, as the differences should not matter for layer identification. Even though it is possible to constrain SC to historical age markers, we chose to run SC in unconstrained mode to be able to quantify any possible biases of the algorithm. In order to account for changes in layer thickness or data quality in each ice core, a variant of SC was implemented to count on independent stretches of data (more details can be found in the Straticounter_preprocessing_supplement.xlsx file in the Supplement).
We observed that SC tends to undercount over data gaps, especially within longer gaps. This issue was fixed a posteriori by evaluating the average layer thickness around each gap and inserting the missing layers. However, data gaps that are too large make the timescale inaccurate. Around 3.8 kyr b2k, the length of data gaps in NEEM and EastGRIP increases as both ice cores enter the brittle ice zone. Around the same time, the effects of isotopic diffusion in GRIP gradually make recognition of the annual signal difficult, and the high-resolution sampling was discontinued (Vinther et al., 2006). Therefore, we stopped the timescale revision at 3835 b2k in order to abide by the multi-core data requirement.
3.2 Ice-core matching using synchronous events
Ice cores were matched to each other by finding patterns of assumed synchronous events that will be referred to as tie points. Previously published ice-core matches (Rasmussen et al., 2013a; Seierstad et al., 2014; Sigl et al., 2015; Mojtabavi et al., 2020a) were extended to all cores considering the new datasets. The manual match is facilitated using a MATLAB program called Matchmaker that allows for the insertion of visual bars to place stratigraphic markers on top of the data and to align data according to these markers (Rasmussen et al., 2008), an example of which is given in Fig. 2.
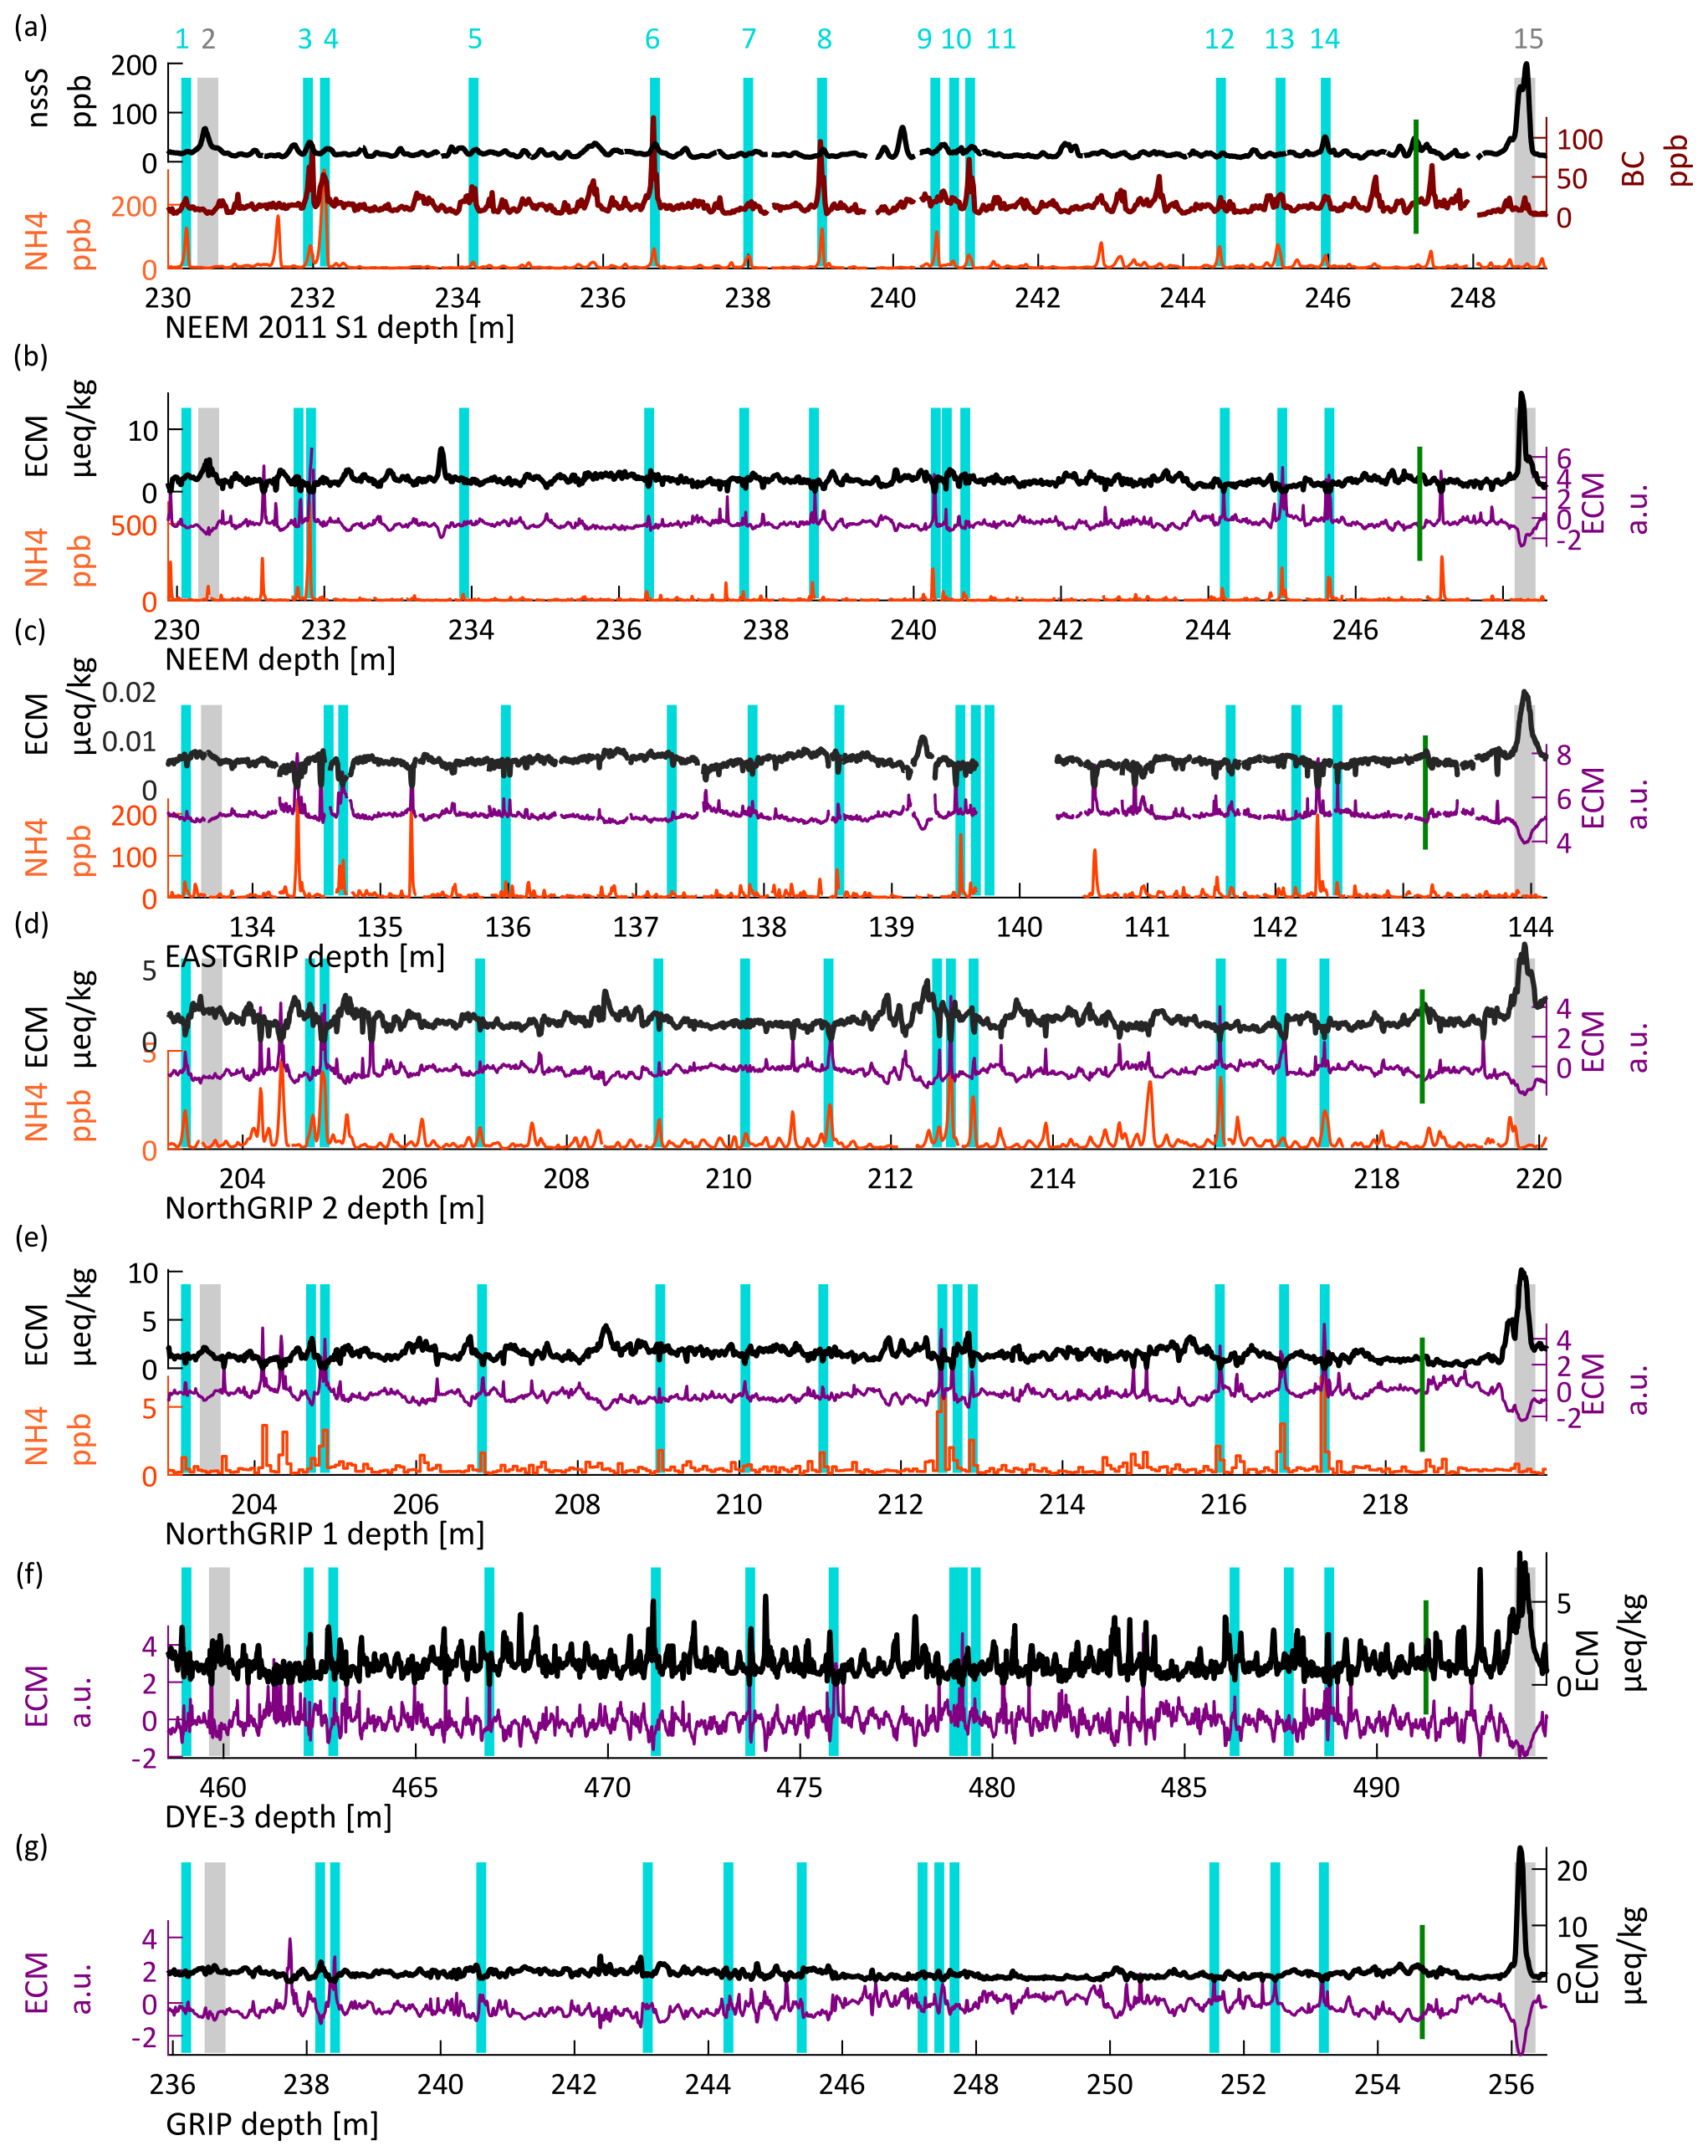
Figure 2Tie points of GICC21 between two eruptions, which are highlighted by the gray vertical bars nos. 2 and 15 (Eldjá, 939 CE). Volcanic proxies are shown in black, and the inverted log-ECM for each ice core is shown in purple. Ammonium (where available) is shown in orange and the turquoise bars highlight the patterns of ammonium that were used as supporting tie points for GICC21. (a) NEEM-2011-S1: the black-carbon peaks (brown) support the choice of this subset of ammonium tie points. (b–e) The co-occurrence of ammonium peaks and peaks in the log-inverted ECM provides another criterion for tie-point selection. (f–g) For DYE-3 and GRIP, lack of ammonium data means that we can only use the log-inverted ECM to provide indication for the tie points, of which nos. 3, 4, 5, 6, 11, 12, and 14 are best recognizable. The green bar between 14 and 15 highlights the very subtle ECM peak associated to the Tianchi tephra (Sun et al., 2014).
The Laki eruption that happened between June 1783 and February 1784 CE is easily detected in all ice cores thanks to a pronounced acidity spike and a corresponding tephra deposit (Clausen and Hammer, 1988; Fiacco et al., 1994). Hence, we use Laki as a reference datum to calculate relative ages for the rest of the timescale. For DYE-3, however, we tie the timescale to the Öræfajökull eruption of 1362 CE because the DYE-3 ECM measurements start below the Laki layer. Although the tephra identification of this eruption is elusive (Coulter et al., 2012), the associated peak is visible in DYE-3 and hence constitutes the most recent available candidate to tie DYE-3 to the other ice cores. Furthermore, the top chronology of DYE-3 was confirmed by comparing to two nearby shallow cores that record Laki in their ECM signal (see also Sect. S1 “Top-chronology and remarks about the DYE-3 ice core” in the Supplement).
When reporting historical events, we find it most convenient to use CE/BCE years (avoiding year 0). When reporting information about the ice-core timescale, we will use years b2k. The conversion between the age units is easily done for rounded years:
More details about the age conversion, similar to the one explained by McConnell et al. (2020), are provided in the Timescale_supplement.xlsx. Since years b2k increase going back in time, we remark that decimal ages correspond to the inverted month order. However, we note that it may not be possible to accurately perform sub-annual dating of events, since accumulation throughout the year is not constant.
Ammonium matching patterns
A chemical species that shows good potential for inter-ice-core matching is ammonium, since it is regarded as a good tracer of North American wildfires. The lifetime of ammonium in the atmosphere is very short, on the order of days, so the origin of the signal is rarely further away than Canada (Legrand et al., 2016). However, the shape of the ammonium peaks might vary across the ice sheet because of different trajectories from the source. Rasmussen et al. (2008) report using a number of ammonium tie points in the transfer of GICC05 from NorthGRIP to GRIP and GISP2 in the glacial. Although Legrand et al. (2016) provided a 200-year-long ammonium match between NEEM and GRIP, they only identify nine possible historical events that could have caused the peaks.
To test the applicability of the ammonium matching, we examined ammonium data between sections of closely spaced volcanic eruptions and found many cases where ammonium, confirmed by black carbon, had a clear correspondence across ice cores (some examples are shown in Fig. 2). We used black carbon data of NEEM and NEEM-2011-S1, reaching back to 2500 kyr b2k to select the ammonium spikes best suited for matching, since this provides an additional criterion for the attribution of a peak to a wildfire event (Sigl et al., 2015; Legrand et al., 2016). In some cases, we observe a strong spatial variability; thus we confirmed that the ammonium matching can only have a supporting role for the volcanic match. Ammonium spikes neutralize the ECM signal, producing minima in the ECM (Robock and Free, 1995; Taylor et al., 1992). Therefore, we inverted and log-transformed the ECM record and used it as an ammonium substitute, whenever was lacking for an ice core.
Beyond 2500 b2k, patterns of spikes were used to supplement the volcanic match, especially when volcanic tie points were widely spaced by many decades (Fig. S10). Here, we only select ammonium tie points that left an imprint in the ECM signal of the corresponding ice core. Overall, ammonium peaks constitute 63 % of our 290 tie points over the last 3835 years, the proportion being higher in the region beyond 2500 b2k (70 %). The reason of the higher number of ammonium tie points is that we use patterns instead of single peaks. The frequency of the ammonium spikes is on the order of one in 20 years, so that, by including ammonium, we have effectively increased the resolution of the multi-core match with respect to a purely volcanic match, this latter having only 35 years average resolution.
3.3 Requirements for the manual fine-tuning procedure
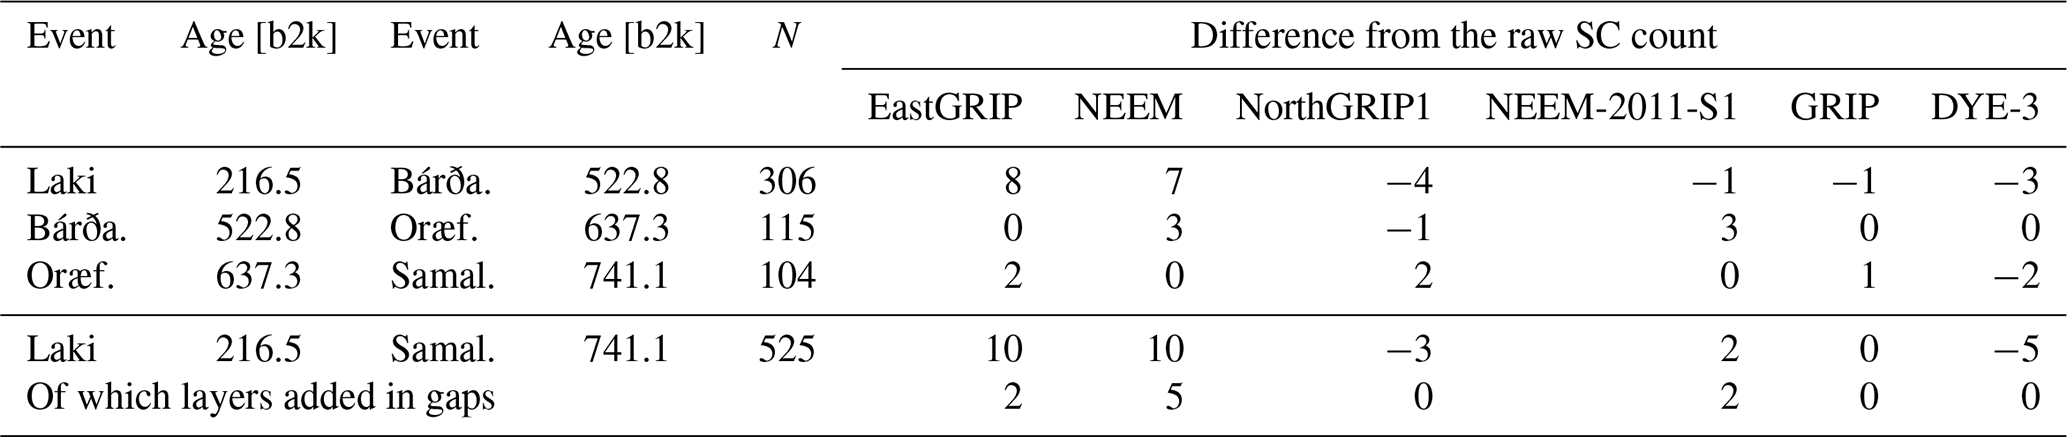
The number of layers between synchronous tie points must be the same across ice cores. Hence, we assessed the quality of the SC output by evaluating the number of layers counted by the algorithm between historically known volcanic eruptions. Even after having chosen the best settings for SC, we observed a general tendency of undercounting in some ice cores and overcounting in others (Table 2). This is a result of the algorithm being run without age constraints, which was considered to be appropriate for using the algorithm in older sections of data, where no age constraints are known. We conclude that, although SC correctly identifies almost all annual layers, it fails to assign a sufficiently high probability to some of the thin or otherwise unusual annual layers in each ice core, which are thereby not counted. Also, it assigns an excessive probability to other layers, which upon closer inspection cannot be confirmed as annual layers but are due to abnormal events that can be manually recognized from a comparison of the chemistry records, especially after a comparison with the age of historically known eruptions. The cause of the undercount may be related not only to data gaps but also to partially wind-eroded layers of snow, to unusual impurity loading, or to other site-specific perturbances. In the case of DYE-3, the high accumulation makes it unlikely to miss layers in the count but, in turn, gives a higher risk of multiple isotope oscillations within 1 year (Fig. S8), leaving more opportunities for an overcount of the layers, which could also result from the relatively high occurrence of melt layers in this ice core. Therefore, we resort to a manual processing of the timescale, which in the following we will refer to as “fine-tuning”.
Table 2Evaluation of the SC bias of each ice core in the timescale sections constrained by historical evidence on eruption ages. The eruptions chosen for the overview were all, except for one, Icelandic: Laki (1783 CE), Bárðarbunga (1477 CE), Oræfajökull (1367 CE), and Samalas (1258 CE, Indonesia, considering a 1-year depositional delay). Within each interval, the number of expected layer boundaries is indicated by N. For each ice core, the difference from the raw SC count indicates the amount and direction of bias. A positive value means that SC layers had to be added in order to reach the expected N, while a negative value means that they had to be removed. The longest interval (Laki–Samalas) shows the total layer-modifications required by each ice core. The values indicate that the “CFA cores” (EastGRIP, NEEM, NEEM-2011-S1) are mostly undercounted, partly because of measurement gaps, while the “GICC05 cores” (NorthGRIP1, GRIP, DYE-3) were mostly in need of removing layers. This evaluation of bias is what eventually justifies the fine-tuning process over a purely statistical combination of SC results.
We remark that our fine-tuning is not in contradiction with SC, since the algorithm attempts to derive the best layers based on the available data of each single ice core. The SC raw layers are accompanied by a probability distribution which represents the likelihood of the placement of each single layer. The fine-tuning was guided by observing where the likelihood of the layer placement is most unsure, since the SC uncertainty increases locally where the annual-layer detection quality is low. Here, the 95th percentiles of the probability distribution register a 1-year “jump” that can be used to detect the layers that SC deemed to be most uncertain. On the other hand, we also identified the placement of “ghost layers” where the SC-assigned probability was just below the threshold required for SC to assign an annual layer and which may be included in the fine-tuned timescale.
The fine-tuning is performed by comparing all ice cores in parallel and using an iterative protocol. To ensure reproducibility, we adopted a rule set to the fine-tuning process: we added layers in gaps according to the local layer thickness; we removed low-probability layers that conflicted between parallel cores; we upgraded ghost layers to full annual layers when indicated by parallel-core comparison. Some examples of how the fine-tuning was done can be found in Fig. S1.
Minor similarities between the records, such as minor ECM or features, δ18O patterns, and in some cases similar peak-shape sequences in Na+ or Ca2+ for geographically close ice cores, were used to support or reject changes in the layer count. As a consequence, some tie points had to be re-examined because of now apparent misalignments, and the fine-tuning was repeated to ensure consistency between the ice cores.
As a further step, two to three observers were engaged in a detailed review of each section of the timescale aiming to reduce the impact of potential confirmation bias by each investigator. Whenever unanimity was lacking, the main observer (Giulia Sinnl) examined the different opinions to propose a final solution, which was then accepted or rejected again. In the end, unanimity was reached in all sections. Moreover, no previous knowledge about age was initially used to fine-tune the timescale, except for Laki and Oræfajökull. Later, the historical part of the timescale (until Samalas) was verified with knowledge about the ages of some eruptions, finding that the fine-tuned layer count had already reached very accurate ages. Finally, we tested the correlation between DYE-3 and GRIP isotopes in the top 400 years and found an improvement of 17 % from GICC05 (see Table S1 in the Supplement), which we take as an indication of the fine-tuning procedure reaching accurate results at the top of the timescale.
3.4 Uncertainty of the GICC21 chronology
An important part of our objectives for this study is to provide a simple yet empirically justified estimation of the uncertainty associated with the GICC21 timescale. Uncertainties in the layer count arise from two main sources: data issues and misinterpretation of layers (Vinther et al., 2006). In our study, data gaps are a prevailing issue because the ends of each ice-core piece are trimmed to prevent contamination during CFA measurements. This, combined with the removal of small pieces around core breaks from the drilling process, causes frequent but brief interruptions in the records. On the other hand, the misinterpretation of layers is largely accounted for by the fine-tuning of multiple parallel ice-core records.
Many factors increase the complexity of the uncertainty estimation for our new ice-core timescale. We find ourselves in a mixed scenario between automated counting by SC, an algorithm that provides its own probability estimates, and our manual intervention by fine-tuning. Moreover, we have to account for possible correlations between errors, at least within a certain correlation length. A data-based error can be caused, as mentioned, by measurement gaps or also by short-term accumulation changes, unsure tie-point placement (i.e., a marker placed differently across ice cores), or a disturbed layer pattern. These errors might influence the local distribution of layers, at least within neighboring tie points, but are very likely unrelated to errors arising elsewhere in the timescale.
Because of transport and deposition dynamics, the volcanic signals in the ice cores are affected by delays, which we quantify to be within 1 year after the event started (Robock and Free, 1995). Furthermore, we estimate that there is an additional contribution to the uncertainty of up to 1 year originating from possible variations in the precise position of annual-layer markers relative to the tie points. We use the linear sum of these contributions as a conservative minimum uncertainty for our timescale: although some tie points are very certain because of tephra and historical references, these represent a minority in the timescale. Moreover, any layer could have been placed too early or too late so that, although the number of layers between tie points is correct, the actual age at any given depth is ±1 year uncertain because of the misplacement, even though the error might be reabsorbed later on.
Until the Samalas eruption (742 b2k), the fine-tuning is constrained by well-established historical evidence on volcanic eruptions. Therefore, for the youngest part of the timescale, the uncertainty is quantified as a constant value of 2 years even though it is likely smaller near good tie points. For the rest of the timescale, we argue that the uncertainty is never below 2 years because of the aforementioned effects and also increases with depth.
For the older part of the timescale, we quantified a time-dependent uncertainty based on the SC uncertainty and on the information from the fine-tuning. SC provides a probability distribution of the likely layer count between age markers for each of the ice cores, which may be averaged by a convolution. Without fine tuning, the convolution's width, which is strongly depth and age dependent because of data quality and coverage, would be a suitable candidate for the uncertainty. As described in Sect. 3.3, the SC probabilities need, in any case, to be calibrated for the gap undercount, in order to reduce the width of the convolution. After correcting for the gap bias, the maximum likelihood layer number derived from the SC convolution is expected to be closer to the fine-tuned layer count; however we observe that SC is misinterpreting some layers. We believe that fine-tuning improves the timescale; hence we regard the discrepancy between the SC result (corrected for the gap bias) and the fine-tuned result to be a conservative estimate of the age uncertainty arising from layer interpretation and data issues.
To estimate the correlation length of the uncertainties, we observed that a tie point is typically found once every 20 years. Because a layer identification error is not likely to affect sections separated by several tie points, we find it reasonable to assume that, beyond 100 layers, errors in the fine-tuning are uncorrelated. Conversely, because the number of years between tie points must match, errors in layer identification are likely correlated over shorter intervals.
We compared the SC output in sections of 100 fine-tuned years, at continuous intervals covering the entire study period older than Samalas. In each section, we performed an SC run for every ice core, acquiring the independent probability distribution of the layer count, for which plots can be found in Fig. S3. We manually added layers in the data gaps, mostly found in EastGRIP, NEEM, and NEEM-2011-S1 (Straticounter .xlsm file in the Supplement). The ice-core distributions were convolved to provide the multi-core average, and a Gaussian curve was fitted to the convolution to obtain a mean and a standard deviation. By subtracting these means from the expected value of 100 years, we obtain the values we call (Fig. 3a), where i indicates the century.
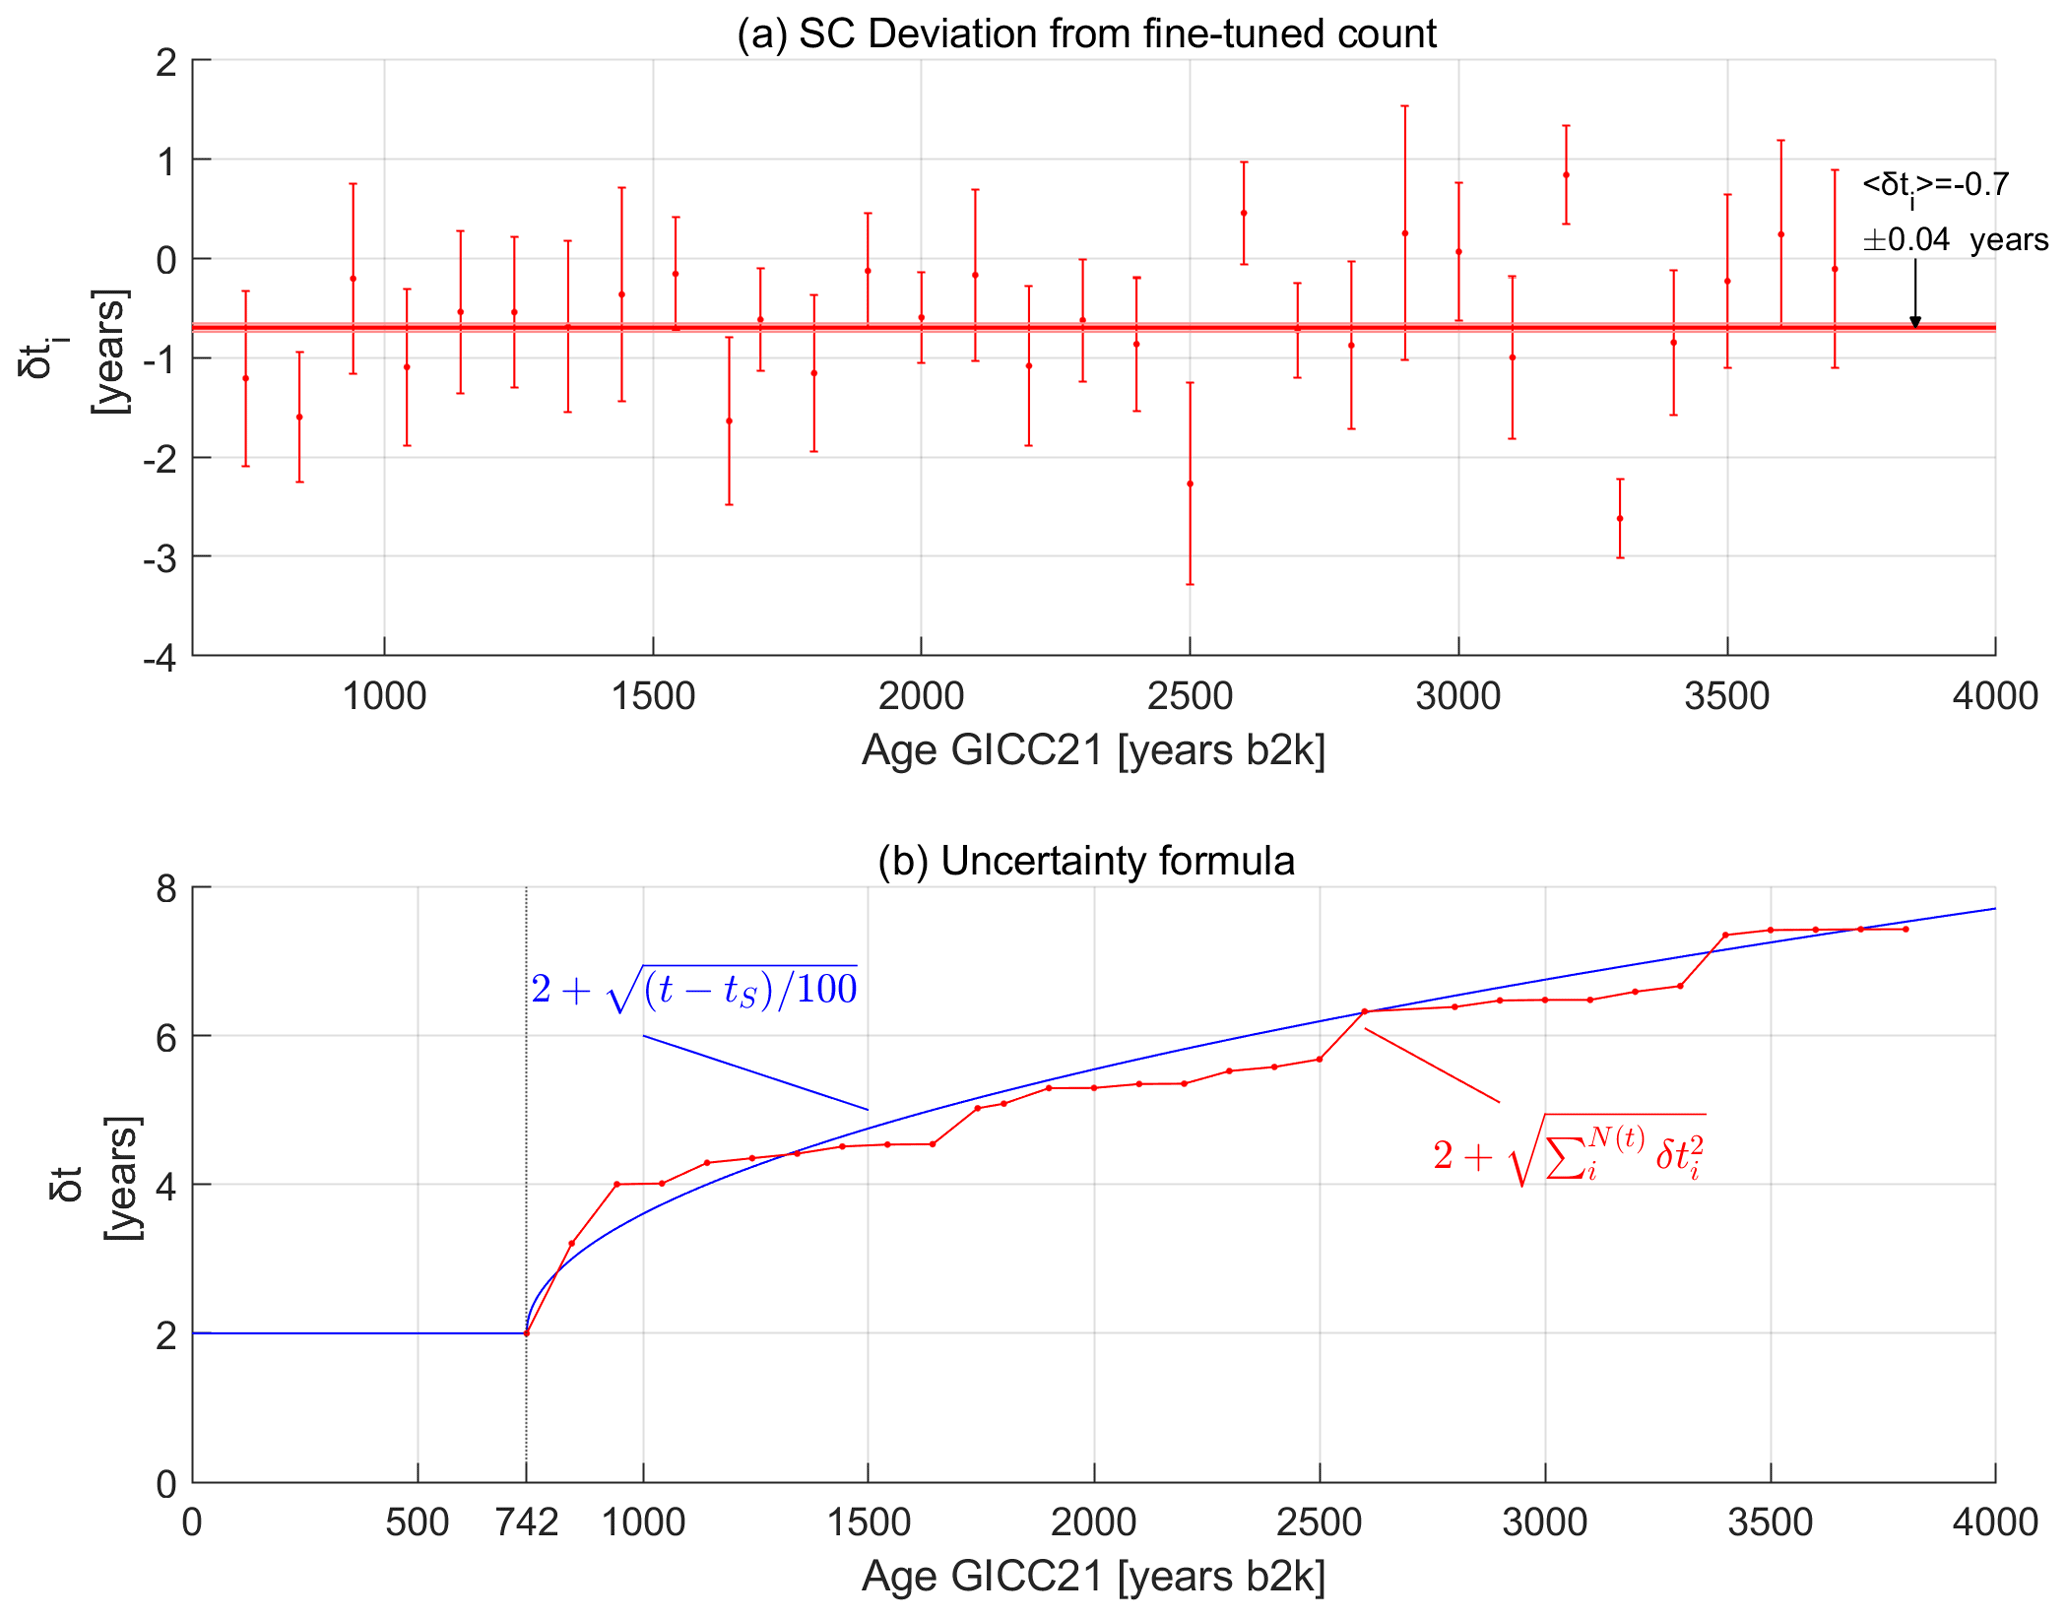
Figure 3Empirical uncertainty estimation. (a) Deviation of the gap-corrected convolutions from the expected value of 100 years. Error bars indicate the ±σ of each convolution. (b) The sum in quadrature of the measured deviations is reproduced well by our uncertainty formula.
The average of all is years per century (average of absolute values: 0.84±0.04 years per century; all values are reported in the Straticounter .xlsm file in the Supplement). The negative average indicates a bias towards undercounting by SC, probably related to disturbances in the layer pattern and leftover gap undercount. However, this bias appears to be reabsorbed after 2500 years, where more balanced values around 0 appear in the dataset of Fig. 3a. This more balanced StratiCounter bias is not related to any particular horizon in the data availability, and hence we exclude this effect to be caused by some lacking data. At least for the part of GICC21 exceeding NS1-2011, we can say that the effects of over- and undercounting by SC balance out, which could be a consequence of our manual gap intervention or our fine-tuning process.
The fine-tuning process leads to an added uncertainty, which is difficult to quantify independently but very likely smaller than , since we believe that the fine-tuning solves problems arising from single-core layer identification and thus brings us closer to the true age. Still, based on the values obtained above, we suggest a conservative empirical uncertainty of 1 year per century.
On the basis of our tests, we hypothesize that our uncertainty can be represented by the following empirical formula, where the uncertainty between Samalas (tS=1258 CE =742 b2k) and any older age t will have an absolute uncertainty of
This formula is composed of a constant term of 2 years, which we have previously set as a conservative, lower boundary to our uncertainty, and a time-dependent term. Since we have argued that the century errors are uncorrelated, we apply a quadrature sum to evaluate the accumulated uncertainty over time: . For convenience, we hypothesize that the formula can be made continuous, obtaining Eq. (1), which compares well to our measured uncertainties and should be interpreted as 1σ of the GICC21 ages (Fig. 3b). In the Supplement, we also provide an alternative demonstration of the correlation length.
We now present a comparison between the new GICC21 timescale and the existing ice-core chronologies GICC05 (Vinther et al., 2006), GISP2 (Meese et al., 1997), DRI_NGRIP2 (McConnell et al., 2018), and NS1-2011 (Sigl et al., 2015), with the aim of investigating any dating offsets (Fig. 4a). To calculate the GICC21 ages at reported GICC05 depths and infer the correct offset, we linearly interpolated the GICC21 ages onto the GICC05 layers of DYE-3, GRIP, and NorthGRIP1 (Vinther et al., 2006). The published volcanic matches of EastGRIP to NorthGRIP (Mojtabavi et al., 2020a) and of NEEM to NorthGRIP (Rasmussen et al., 2013a) allow us to find the GICC21 ages for these two cores at the published tie points. The timescale offset of each individual ice core from GICC05 was averaged to obtain an overall transfer function of GICC21 from GICC05. The transfer function can be used to translate any age previously matched to GICC05 to the new revised GICC21 ages (provided in the Timescale_supplement.xlsx file in the Supplement; see Appendix A for more details on the transfer curve).
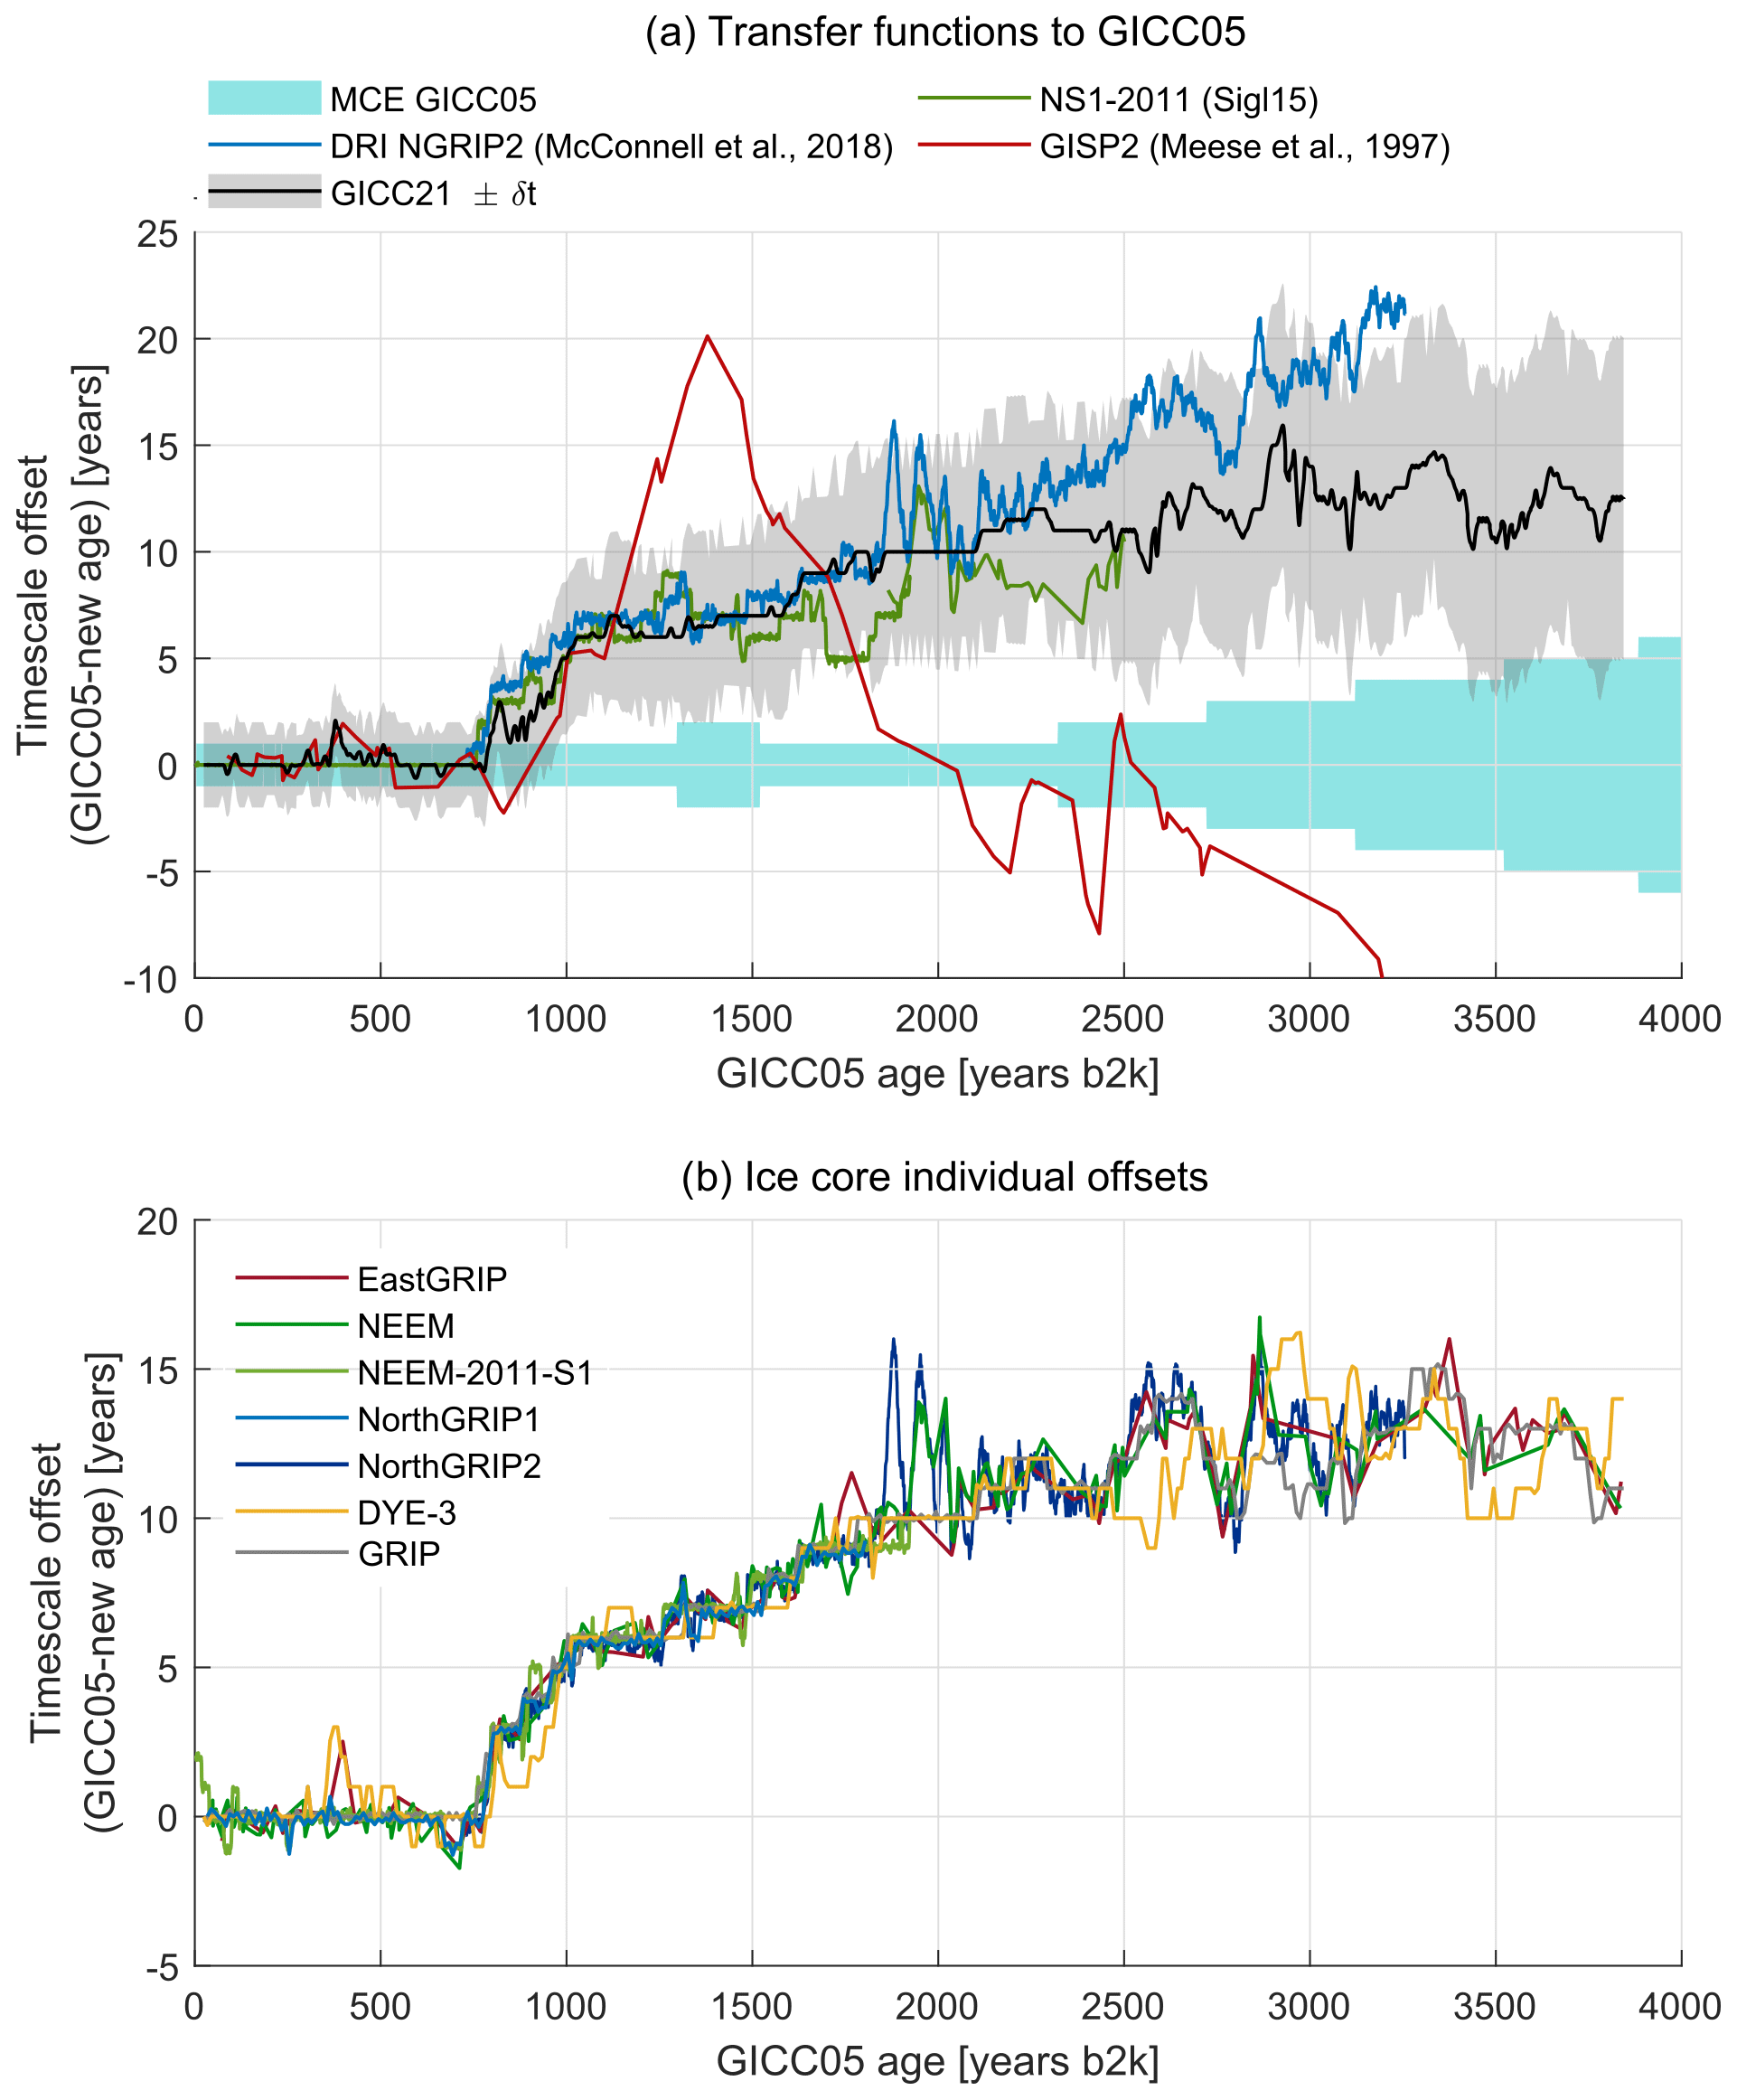
Figure 4Timescale comparison. (a) Published timescales and GICC21 compared to GICC05. The shaded areas highlight the uncertainty of both GICC05 (light blue) and GICC21 (gray). The GISP2 timescale was compared using the published match with GICC05 (Seierstad et al., 2014); it agrees with GICC05 at the former Vesuvius tie point, but we observe how it also agrees with the recent revisions until the 1109 b2k eruption, before it spreads to wider offsets. The NS1-2011 timescale (Sigl et al., 2015) agrees with our revision within uncertainties as well as with the DRI_NGRIP2 timescale (McConnell et al., 2018). (b) The individual ice cores have different offsets from GICC05 depending both on the volcanic match and on the layer counting differences. A direct comparison with GICC05 is possible for the ice cores NorthGRIP, GRIP, and DYE-3, for which both GICC05 and GICC21 are annual-layer-counted. The NorthGRIP1 layer comparison stops at 1813 b2k, corresponding to the end of the IC dataset, but the NorthGRIP2 comparison continues thanks to the DRI CFA dataset. An indirect comparison was possible for EastGRIP and NEEM, for which published match-point ages were used to interpolate to the new layer-counted ages (Rasmussen et al., 2013a; Mojtabavi et al., 2020a). The comparison for NEEM-2011-S1 was possible using the matching of the ice core onto GICC05 using the tie points provided in Sigl et al. (2013).
In Fig. 4b, all ice-core individual offsets from GICC05 tend to stay close to each other, making it possible to identify a common behavior, which illustrates the result of the timescale revision: an increasing offset from GICC05. Therefore, we recommend a timescale-calibration offset toward younger ages when using GICC05 beyond 3835 b2k. The amount of calibration needed is 14 years for DYE-3, 12 years for EastGRIP, 11 years for GRIP, and 12 years for any other ice core based on the average transfer curve (Appendix A).
A drift of one ice core away from the others can mean two things: either the ice-core match is different, or there have been interpolation problems in GICC05, e.g., in the case of NorthGRIP1 beyond 1813 b2k (see Fig. 5 caption). No offsets are observed in the section younger than about 750 b2k, right after the prominent Samalas eruption of 742 b2k, except around 390–490 b2k, where DYE-3 and EastGRIP differ by about 2 years from the other cores. We confirm the observation, made by Vinther et al. (2006), that DYE-3 displays a layer thickness fluctuation at 400–600 b2k (Fig. S2), which makes the layers thicker and possibly perturbed by upstream flow effects. As shown in Fig. 5, this period proved hard to match for DYE-3. Because EastGRIP was matched to one particular broad tie point, a divergence also arises there.
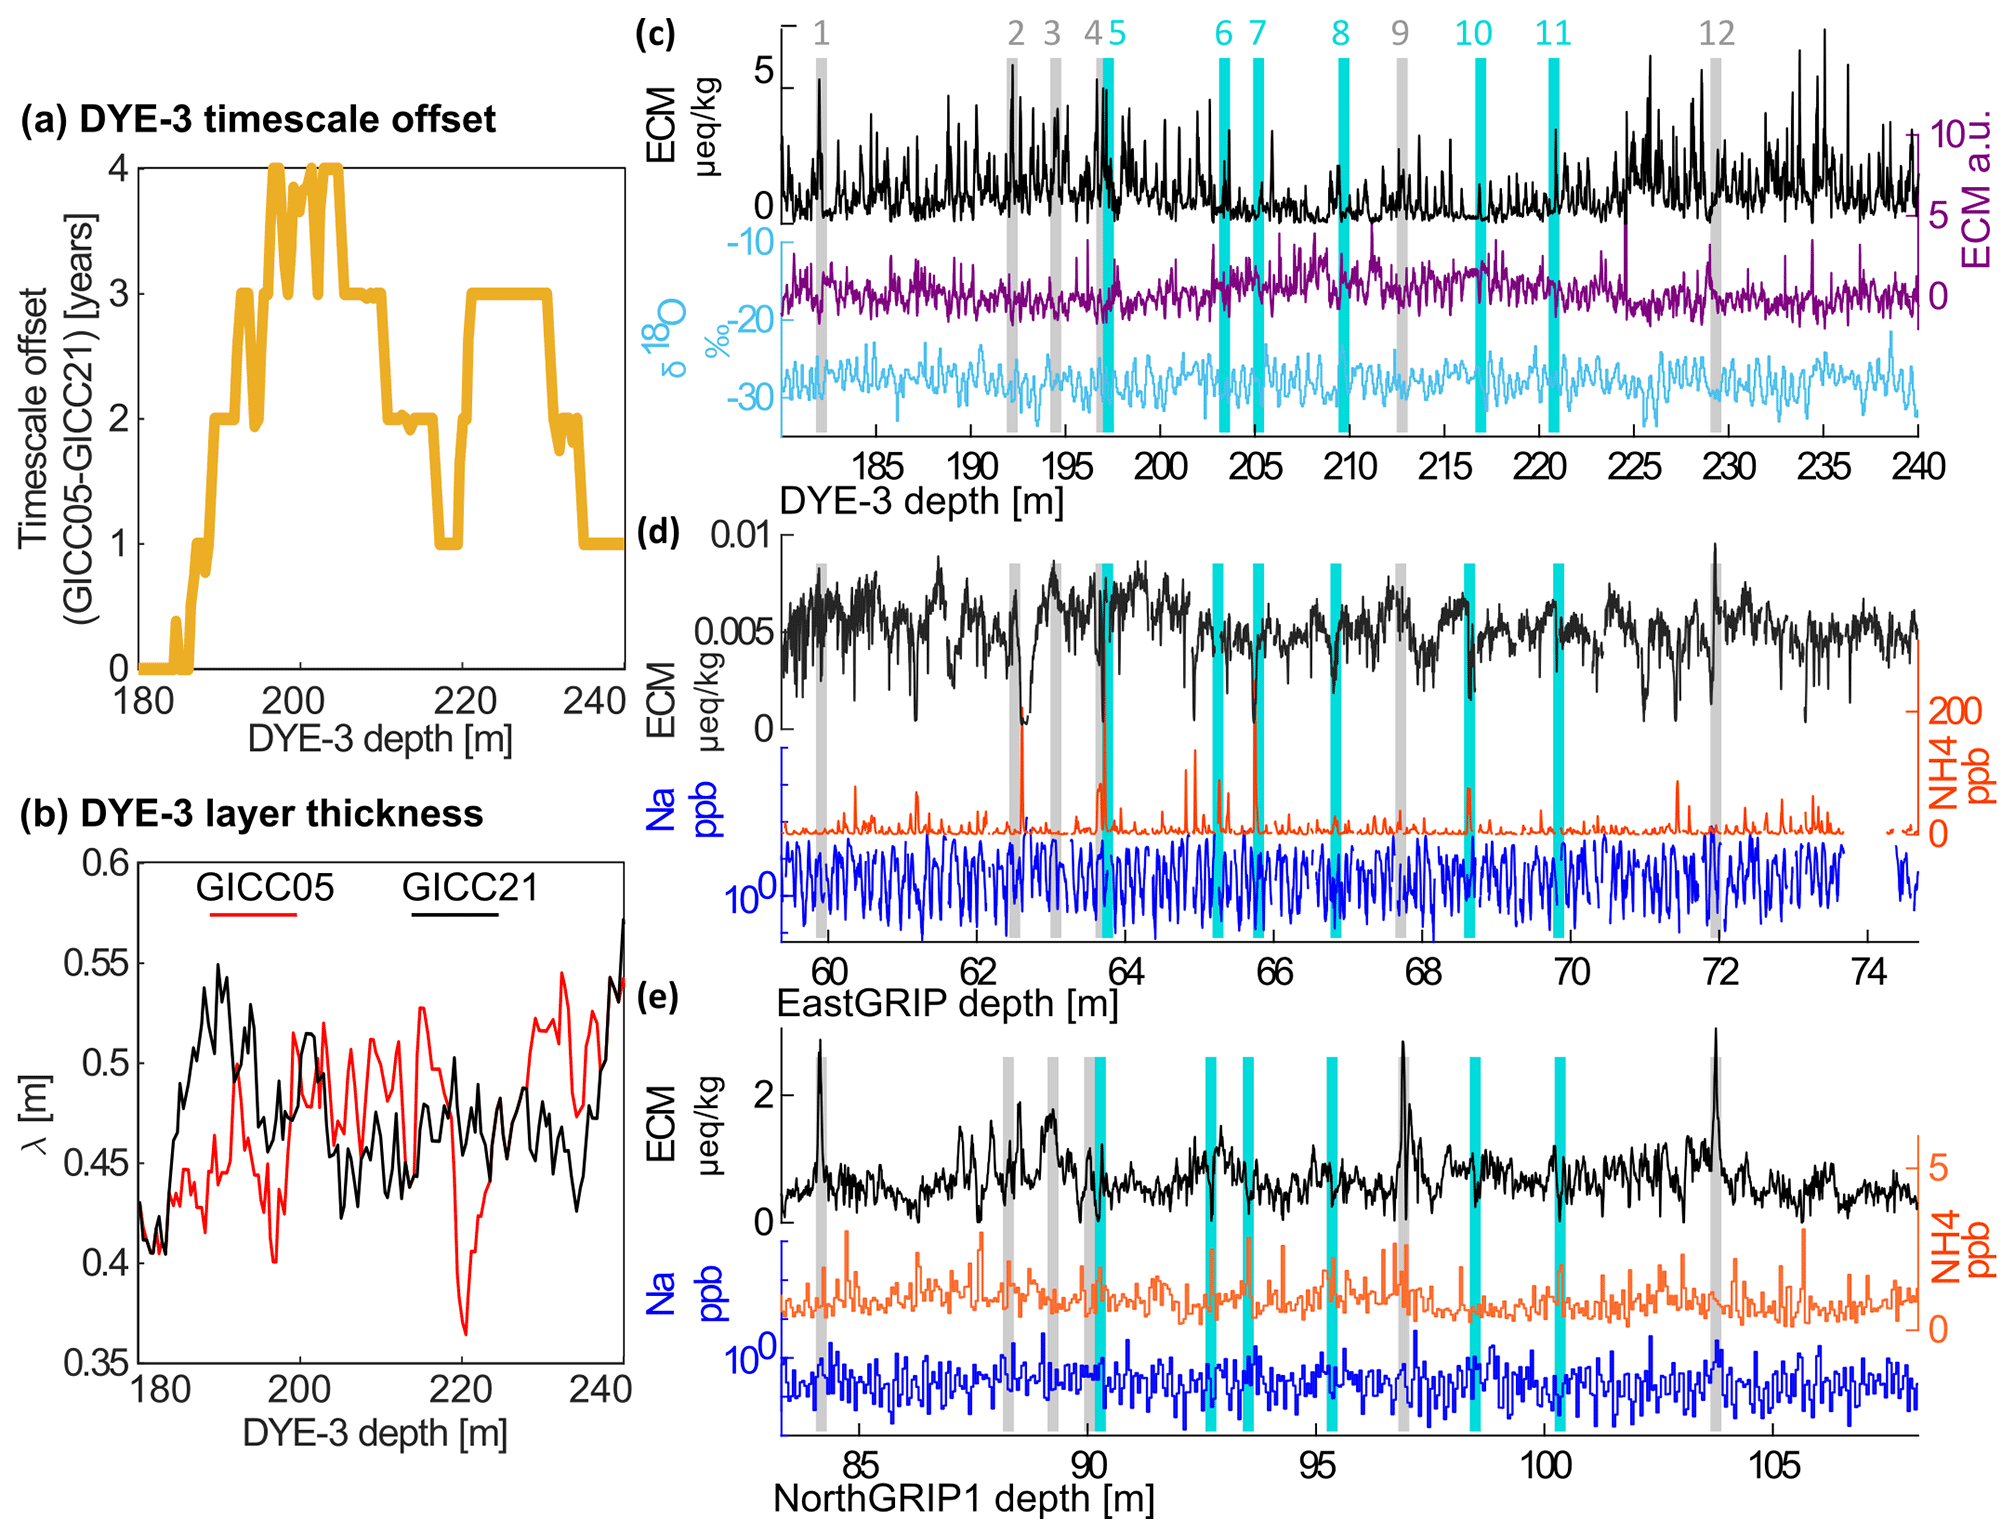
Figure 5(a) The first divergence of the timescale offset, at 390–490 b2k, reported on the DYE-3 depth scale. Four layers were removed between 190 and 200 m, but they were gradually added back in the earlier part of the timescale. (b) The layer thickness in this interval presents a fluctuation towards thicker layers, possibly because of upstream flow effects (Vinther et al., 2006). Between 180 and 240 m, the layer thickness according to GICC05 presents a more gradual increase than according to GICC21 but in turn has a sharp dip at 220 m, which is not present in the GICC21 layer count. (c–e) By looking at the actual data, it becomes clear that DYE-3 is very hard to match in this depth range. The fact that the stratigraphy of DYE-3 has been lightly disturbed could have affected the signals, so that both the ECM dips and peaks become almost unrecognizable. The layers present many irregularities that make the fine-tuning more uncertain than usual. (d) For EastGRIP, we observed that the broad shape of tie point no. 9 caused the match to be revised and placed 2 years later than what was done by Mojtabavi et al. (2020a).
The erroneous attribution of Hekla (1104 CE) explains the steep 4-year offset which was introduced between the Samalas eruption and 1104 CE. In hindsight, the four annual layers appear poorly supported by the DYE-3, GRIP, and NorthGRIP1 data (Fig. 6). After 1100 b2k, a steady increase is observed until about 2000 b2k at the age of the previously assigned Vesuvius layer.
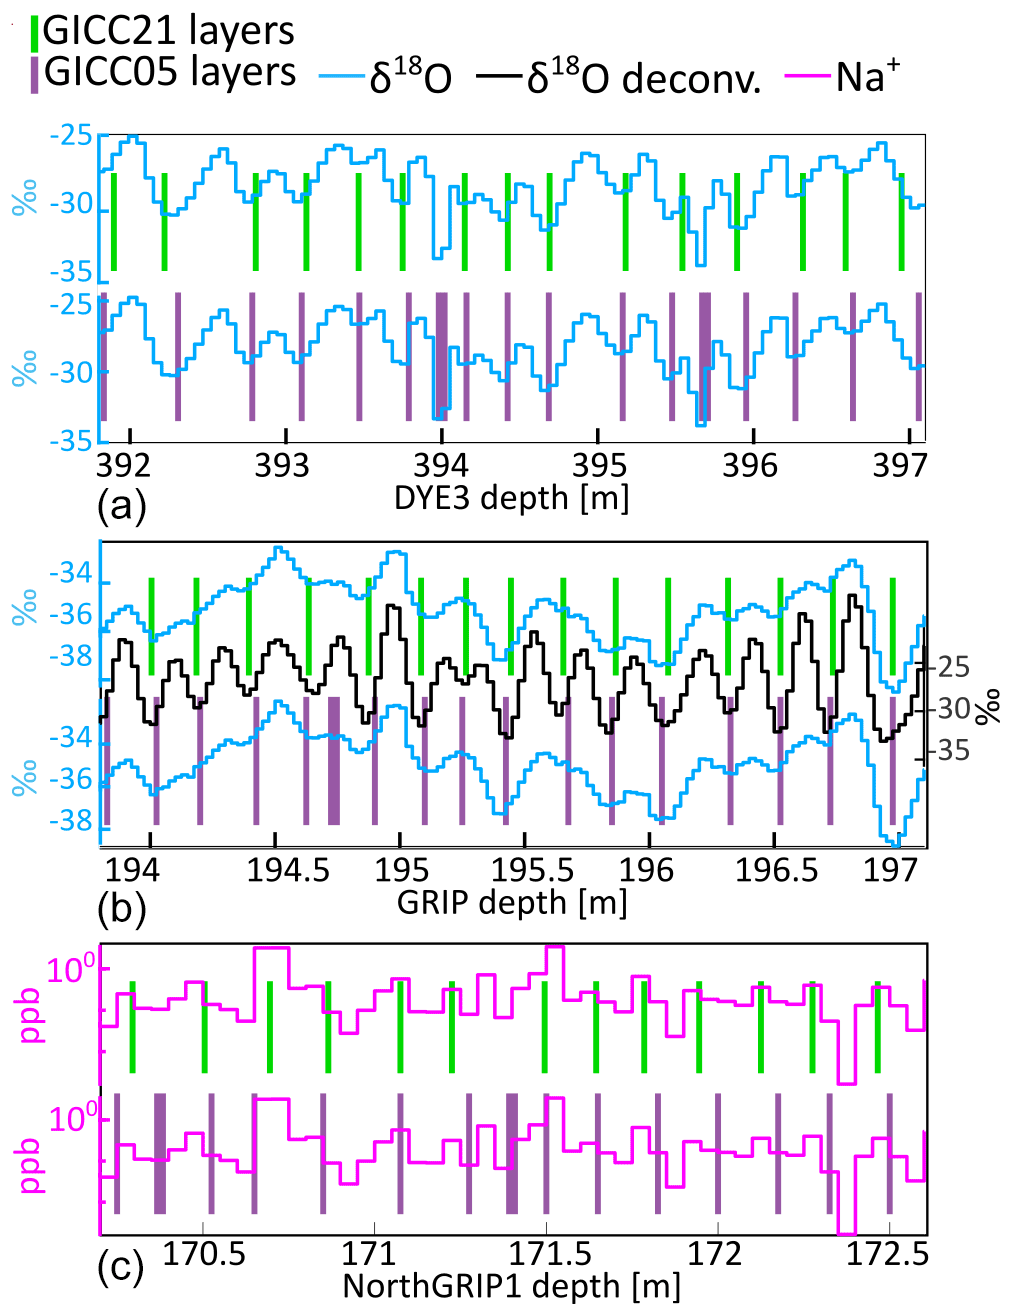
Figure 6Example of GICC05 overcounting between Samalas and 1108 CE in sections of (a) DYE-3, (b) GRIP, and (c) NorthGRIP1. The top, green bars represent the GICC21 layer boundaries. The bottom, purple bars represent GICC05 layers: they include more layers (thicker purple bars) that are not included in GICC21. For DYE-3, the doubtful features of the isotopes, possibly corresponding to melt layers or measurement issues, suggest that these are not annual-layer boundaries. For GRIP, it seems unlikely that a year is found at a local maximum of the isotopes. For NorthGRIP, discrete sodium measurements are not always easy to interpret due to the marginal resolution; however the placement of a layer boundary at a sodium minimum is unlikely.
4.1 The offset behavior between 2000 and 3835 b2k
Beyond 2000 b2k, the offset stays above 10 years, reaching an average of around 13 years in the last centuries of the timescale. We speculate that the reason for the overall increase in offset is related to a confirmation bias in GICC05 after having acquired the initial 10-year offset, meaning that by deciding to include more layers before Vesuvius, the authors possibly continued to lean towards interpreting melt layers or isotopic fluctuations in DYE-3 as annual layers.
Around the previously attributed Vesuvius match, the NEEM ice core exhibits a divergence from the other ice cores, which was also documented in Sigl et al. (2015). NEEM was matched to NorthGRIP1, which in turn was matched to DYE-3 and GRIP, as the section sits just below where the NorthGRIP1 ion chromatography (IC) data stop. We observe that both the DRI_NGRIP2 timescale and our revision of NorthGRIP2 present a similar feature. We thus conclude that the likely reason for the fluctuation is a previously erroneous transfer of GICC05 because the problem must lie in the ages previously assigned to the NorthGRIP1 match points. Since EastGRIP was matched with fewer match points in this section, the divergence does not arise in the EastGRIP curve.
Between 2500 and 3500 b2k, three centennial-scale fluctuations are observed, with two notable offset peaks above 15 years at around 2900 and 3400 b2k. We argue that these large wiggles in the timescale offset are to be attributed to a difference in layer count within widely separated volcanic markers. The spacing of adequate volcanic tie points can be as high as 130 years, a fact that called for a heavier use of markers in our work, which were not used in GICC05 in this section. For the time span 2800–3100 b2k, we analyzed in detail the matching differences between GICC05 and GICC21 (Fig. S4), finding that the offset wiggle is explained by shifts in the tie points, by layer thickness fluctuations of DYE-3, and by interpolated NorthGRIP1 ages being used to date EastGRIP and NEEM.
4.2 The comparison with published ice-core timescales and Holocene chronostratigraphic markers
We found that both GICC21, DRI_NGRIP2, and NS1-2011 have a similar offset to GICC05 within their respective time periods (Fig. 4a). On the other hand, the GISP2 timescale presents a large divergence from our revision. The GISP2 timescale, however, agrees with our revision until 1109 b2k, after which the assumption about the Vesuvius tie point produces a large offset fluctuation, caused by the need to insert and remove layers in order to compensate for the erroneous tie point. The offset of GISP2 from GICC05 after 3000 b2k becomes very large, and we chose not to plot it.
For the DRI_NGRIP2 timescale (McConnell et al., 2020), we notice a very good agreement until 2250 b2k, after which DRI_NGRIP2 displays a linear increasing trend in offset, whereas GICC21 shows a more constant offset. On the other hand, the NS1-2011 timescale shows a lower offset between 2000 and 2500 b2k. Although both are well within the GICC21 uncertainties, the two counteracting offsets between the two timescales might be a sign of widely spaced eruptions and lack of multi-core comparison. Therefore, we conclude that, at least for Greenlandic ice cores, a multi-core comparison is favorable for timescale reconstructions, especially in the case of widely spaced tie points.
We also highlighted the ages proposed by GICC21 of some events detected in ice cores in order to compare them to historical ages (Table 3). The oldest event is the eruption formerly attributed to Thera (Santorini) by the GICC05 authors, who placed the layer in 1645 BCE. Since then, the origin of the tephra was determined to be Alaskan and the dating of the corresponding acidity peak was questioned, also in relation to comparison to tree-ring data (Pearce et al., 2004; McAneney and Baillie, 2019). According to GICC21, we state the age of this acidity peak to be 1629 BCE (3627.5 b2k), and we endorse the future search for cryptotephra in ice cores that might indicate a more accurate age for the Thera eruption, which is going to be vital for the archeological framework of the Late Bronze Age.
Table 3GICC21 ages of chronostratigraphic markers in the Holocene which were important for this study. Tephra from eruptions and 10Be from solar proton events (SPEs) both provide chronological references when the age of the event is known from historical evidence or other accurate timescales, such as dendrochronology.

a Only two of the events are used to anchor
our timescale.
b GICC21 ages are reported at the peak of the signal identifying the event; a delay in deposition might occur.
c Not used as tie point across ice cores.
d Age from NS1-2011 chronology.
e Age from indirect historical evidence and tree rings
(McConnell et al., 2020). f Age from tree rings (Park et al., 2017; Sakurai et al., 2020).
g GICC05 age of acidity layer.
h TUNU13 was not used for this study, but we verified the match with NEEM-2011-S1 and NorthGRIP to be the same as ours.
4.3 Comparison of GICC21 to the tree-ring timescale and the IntCal20 curve
The ice-core timescale can be compared to other timescales and climatic archives to verify their relative consistency and infer leads and lags in the climatic system. The fact that GICC21 was created as independently as possible from other archives makes it possible, for example, to compare it to the tree-ring chronology.
In Sigl et al. (2015), a composite of five Northern Hemispheric tree-ring chronologies, called “N-Tree”, was created to describe tree-growth anomalies over the last 2500 years in the Northern Hemisphere. Another recent reconstruction of temperature changes from tree rings (Büntgen et al., 2021) can also be used as a comparison until 2000 years ago. These chronologies have virtually no uncertainty since the vast availability of old wood makes tree-ring timescales very accurate thanks to many iterations of cross-dating. By looking at the alignment of ECM with the two reconstructions (Fig. S5a and b), we observe that Greenland eruptions align very accurately with some periods of abrupt cooling, providing an indication of the timescale accuracy with respect to tree rings. A comparison to another tree-ring growth reconstruction reaching until 3835 b2k (Helama et al., 2012) did not lead to conclusive evidence for a better alignment of GICC21 to growth minima with respect to GICC05, either because the resolution of the tree ring data was too low or because no clear minima were seen in the vicinity of the ECM peaks.
We furthermore compared the ice-core ECM to the bristlecone record, compiled by Salzer and Hughes (2007). We found very good correspondence between two growth minima of North American trees, at 3626 and 3649 b2k, the first of them corresponding to the Alaskan Aniakchak eruption (Pearce et al., 2004), which again confirms the alignment of the eruptions in ice cores and tree-growth minima (Fig. S5c). Finally, a calcium anomaly was reported in tree rings by Pearson et al. (2020) at 3560 b2k, speculated to be linked to the eruption of Thera, Santorini, which we find to align with a modest ECM peak in some ice cores (e.g., EastGRIP) (Fig. S5c).
Synchronous deposition of cosmogenic radionuclides (10Be and 14C) provides an additional tool for the comparison of ice cores to other archives at lower latitudes. However, the 14C signal is dampened by the carbon cycle and therefore the comparison can only be conducted by backward modeling the 14C to retrieve the original production rates. In this way, GICC05 was compared to the radiocarbon calibration curve IntCal13 (Reimer et al., 2013) by Adolphi and Muscheler (2016), who found that the offset between the timescales increased steadily over the Holocene, reaching about 20 years at 4 kyr b2k. This conclusion is supported by GICC21, at least until 3400 b2k, by observing that the transfer function of GICC21 behaves similarly to the one produced by Adolphi and Muscheler (2016) (Fig. 7a). Furthermore, the solar proton event identified by O'Hare et al. (2019) in NorthGRIP and GRIP, dated through tree-ring evidence, keeps its alignment under the GICC21 timescale and is confirmed at an age of 663±7 b2k (Table 3), providing independent proof for the accuracy of GICC21 for that period.

Figure 7(a) Comparison of the transfer function GICC21–GICC05 with the transfer function modeled by Adolphi and Muscheler (2016), based on 10Be data from the GRIP ice core and converted to Δ14C by modeling and compared to the Δ14C variations in IntCal13. The agreement between GICC21 and IntCal is supported by the closeness of the two transfer curves. We observe two notable differences between the transfer curves: between 500 and 1000 b2k, where the effect of the 1000-year smoothing of the Adolphi and Muscheler approach is evident (used in the 10Be–14C comparison to avoid matching spurious peaks), and possibly between 3400 and 3835 b2k, where some offset (7±6 years) towards older GICC21 ages is still observed. (b) 10Be concentrations measured in the GRIP ice core (Muscheler et al., 2009) are shown in purple for GICC21 and black for the Adolphi and Muscheler timescales, with horizontal bars highlighting the uncertainties in the peak positioning. The data were smoothed with a 20-year running average and detrended to remove the long-term trend. The 14C production rate (green), based on the tree-ring timescale, is obtained from carbon-cycle modeling of the 14C data of IntCal20 (methods outlined in Muscheler et al., 2005). Single realizations of the IntCal20-based production curve show that the position of the peaks underlying IntCal20 can vary slightly, so that the average curve should be handled with care when performing timescale studies (Muscheler et al., 2020). The alignment with IntCal20 is kept within uncertainties throughout the period shown, with possibly GICC21 better aligned in the last century. Any production rate differences between tree-ring data and ice cores that cannot be resolved within realistic dating offsets (e.g., the period 3700–3740 b2k) could be explained by underestimated data uncertainties or by transport and deposition effects on 10Be, since major carbon-cycle changes in this period are unlikely (Muscheler et al., 2004).
The transfer curve to IntCal13 is smoothed as a result of the statistical wiggle-matching approach between 10Be and 14C, designed to match unstretched 1000-year-long windows in order to avoid over-fitting of spurious peaks (Adolphi and Muscheler, 2016). This implies that beyond 3500 b2k, the wiggle-matching algorithm is influenced by data older than 4000 b2k, which could cause the increase in observed offset in the 3500–3800-year window. Since the differences between IntCal13 and IntCal20 are thought to be marginal in the Late Holocene, at least for the purpose of timescale comparisons (Reimer et al., 2020; Muscheler et al., 2020), we refrain from repeating the wiggle matching. Therefore, after 3500 b2k, the IntCal-GICC21 offset can be quantified as 7±6 years, which is almost negligible.
To address the finer structure of the offset in the last 500 years of the GICC21 revision, we directly compare the ice-core 10Be concentration measured in the GRIP ice core (Muscheler et al., 2009) and the 14C production signal of the IntCal20 curve, which is obtained by carbon-cycle modeling (Muscheler et al., 2005). Since the underlying production mechanisms are the same, the two radionuclides show common variability. After detrending the signals, we compare the 14C of IntCal20 and the ice-core 10Be, according to GICC21 and to the transfer function by Adolphi and Muscheler (2016). Upon visual inspection (Fig. 7b), we conclude that there is good agreement between all production signals and that until 3835 b2k, the offset between IntCal20 and GICC21 is resolved within uncertainties. However, we remark that between 3700 and 3800 b2k comparative studies of tree-ring and ice-core data should address the inconsistencies observed in the radionuclide production signal. In conclusion, there is no compelling evidence to suggest an offset of GICC21 versus IntCal20.
Compared to GICC05, the new GICC21 ice-core timescale shows higher potential for climatic studies and comparison to distant records in the Late Holocene, such as radiocarbon-dated evidence proximal to eruption sites. The timescale offset to GICC05 shows a non-linear behavior, as a consequence of local issues with the layer count and the ice-core comparison. Until 742 b2k, the two timescales agree with uncertainties, which is convenient for shallow ice-core studies. However, beyond the Samalas eruption (1258 CE, 742 b2k), the offset increases rapidly because of the mismatch of the Hekla (1104 CE) and the Vesuvius (79 CE) eruptions.
The automated-counting algorithm StratiCounter was applied with success to recognize layers in the ice cores, using the new available proxy data from EastGRIP and NEEM, but nonetheless showed some intrinsic issues, since the algorithm was undercounting layers in some ice cores (EastGRIP, NEEM, and NEEM-S1-2011) and overcounting layers in others (GRIP, NorthGRIP, and especially DYE-3), as demonstrated in the well-constrained age range younger than the Samalas eruption. Hence, we demonstrated the need for a multi-observer manual fine-tuning and applied an empirical statistical approach to show that the rate of the timescale uncertainty envelope can be estimated as about 1 year per century, going back in time from Samalas. A lower bound of 2 years needs to be added to the uncertainty, to account for uncertainties in displacement and delays in the volcanic acidity deposition on the ice sheet. We remark that the existence of a counting bias in each ice core is not a failure of SC, as the task of recognizing layers is challenging regardless of the methodology applied. That is to say that the algorithm cannot overcome the bias, which is as much an intrinsic problem with the annual-layer record as it is an issue with the layer identification method. Since we demonstrated that ice cores do have site-specific disturbances that affect the layer count, it is clear that a multi-core comparison such as the one conducted in this work is favorable to increase the accuracy of the Greenland ice-core timescale.
The offset of the timescale from GICC05 reaches 13 years at 3835 b2k, which is significant considering the small timescale uncertainty at this age. The offset has an oscillating behavior between 2000 and 3835 b2k, with three important excursions from the mean with amplitudes of about 5 years. This fact we attribute to matching issues related to widely spaced volcanic eruptions, a finer ammonium-based match in GICC21, and layer thickness fluctuations in DYE-3.
The revision of the timescale was stopped at 3835 b2k to ensure multi-core comparison. However, since NEEM data improve again for depths larger than 1200 m (corresponding to roughly 8 kyr b2k), there is a possibility for a revised Early Holocene ice-core chronology based on data from EastGRIP, NEEM, and DYE-3, made by a method similar to the one provided here. In contrast, between 3.8 and 8 kyr b2k, i.e., within the typical brittle ice section of the cores where data quality is lower, any timescale revision will have to be constructed by different means or by the acquisition of new data from new and old ice cores. We remark that the record of EastGRIP CFA data was acquired with the goal of covering the brittle ice zone part of the Holocene in Greenland; hence this dataset will be key to improving the ice-core timescale in future studies. In the meantime, a timescale-calibration offset should be added when using GICC05 beyond 3835 b2k (Appendix A).
Comparisons of GICC21 to other timescales provided new insights on some debated issues of ice-core timescales, such as the offset to the IntCal calibration curve. A comparison between several tree-ring growth minima and volcanic acidity spikes supports the conclusion that GICC21 is in good alignment with tree-ring chronologies. Moreover, thanks to the modeling of cosmogenic radionuclides, we were able to compare IntCal20 and GICC21 until 3835 b2k, concluding that the offset between the two timescales is negligible within uncertainties.
In conclusion, thanks to a good geographical coverage of the central Greenlandic ice sheet provided by the dataset, our improved synchronization of Greenlandic ice cores will allow more precise investigations of the relative timing of climatic events, such as the climatic response to Holocene volcanic eruptions as reflected in the ice-core signal.
The transfer function between GICC05 and GICC21 was calculated by, first, acquiring the timescale offsets of each of the ice cores involved in this study. Then, we computed the uncertainty using Eq. (1). For each year between 0 and 3835 b2k, a weighted mean of the offset was calculated with the corresponding weighted uncertainty. The transfer function is reported in the Timescale_supplement.xlsx file in the Supplement. For the ice cores EastGRIP, NEEM, NorthGRIP1, NorthGRIP2, and DYE-3 we advise the direct use of the GICC21 layers and of Eq. (1) for the uncertainty, in order to convert ages from GICC05. For other cores, which were matched to one or a combination of these ice cores (e.g., GISP2, Rasmussen et al., 2008), we recommend the use of the average transfer function to translate ages from GICC05 to GICC21 until 3835 b2k. For sections older than 3835 b2k, we recommend ages of GICC05 to be calibrated by a shift towards younger ages. The amount of calibration needed is 14 years for DYE-3, 12 years for EastGRIP, 11 years for GRIP, and 12 years for any other ice core based on the average transfer curve.
All data underlying GICC21 are available for use. As many of the datasets were also used for GICC05 but not released at that time, we have decided to release all hitherto unpublished data and information related to GICC05 and GICC21 together. The publication plans were split according to the ice-core project and are still ongoing.
The CFA datasets from NorthGRIP and NEEM have been documented in a paper by Erhardt et al. (2022; https://doi.org/10.5194/essd-14-1215-2022). The corresponding data files are available at PANGAEA (https://doi.org/10.1594/PANGAEA.935838; Erhardt et al., 2021). EastGRIP CFA data are in the process of being released in a similar way, and a preliminary data file can be obtained from Tobias Erhardt until the data files are available at PANGAEA.
In addition, the following data files have been documented and are currently in review and undergoing curation at PANGAEA: ECM from DYE-3 (main core, 4B, 18C) and GRIP; yearly resolved isotope data from DYE-3 (main core, 4B, 18C) and GRIP; impurity CFA data from GRIP; impurity IC data from NorthGRIP1; line scan profile from NorthGRIP2; the GICC05 annual-layer markings for all cores. The full metadata and documentation for these files are being compiled as a paper for ESSD, and the data files are available (with the current preliminary metadata) from Sune Olander Rasmussen until they appear at PANGAEA in their final form.
Other data underlying the timescale and where to find them are listed below.
- 1.
NorthGRIP DEP data from the top are available at https://doi.org/10.1594/PANGAEA.922191 (NorthGRIP1; Mojtabavi et al., 2020d) and https://doi.pangaea.de/10.1594/PANGAEA.922306 (NorthGRIP2; Mojtabavi et al., 2020e).
- 2.
NEEM DEP are available at https://doi.org/10.1594/PANGAEA.922193 (Mojtabavi et al., 2020c).
- 3.
EastGRIP ECM is published at: https://doi.org/10.1594/PANGAEA.922139 (Mojtabavi et al., 2020b).
- 4.
NorthGRIP ECM is published at: https://doi.org/10.1594/PANGAEA.831528 (Rasmussen et al., 2013b).
- 5.
NEEM ECM is published at: https://doi.org/10.25921/gab6-fa09 (Rasmussen et al., 2013c).
The supplement related to this article is available online at: https://doi.org/10.5194/cp-18-1125-2022-supplement.
GS drafted the paper with comments and corrections from all co-authors. GS produced the StratiCounter raw counts and led the fine-tuning, which was performed together with MW and SOR, who provided guidance on methodology and on layer recognition. MW provided supervision on the use of StratiCounter. SOR produced the manual gap count for the uncertainty study, supervised the general content of the work, and provided ideas regarding the uncertainty formula.
BMV produced the correlation study for DYE-3, GRIP, and SWG temperatures. AS provided suggestions for the IntCal comparison and the tree-ring minima comparison and guidance about volcanic matching and tephra. TE and CMJ provided information about the EastGRIP data. CMJ helped with research on the ammonium signal in ice cores. TE provided useful insight and ideas about the uncertainty and the statistical framework. EC provided information about tephra evidence in the Holocene. RM produced the single realizations of the IntCal20 14C production rates by carbon modeling, as well as providing guidance for the IntCal comparison.
The contact author has declared that neither they nor their co-authors have any competing interests.
Publisher’s note: Copernicus Publications remains neutral with regard to jurisdictional claims in published maps and institutional affiliations.
Giulia Sinnl and Sune Olander Rasmussen acknowledge support via the ChronoClimate project funded by the Carlsberg Foundation.
Tobias Erhardt and Camilla Marie Jensen acknowledge the long-term support of ice-core research at the University of Bern by the Swiss National Science Foundation (SNSF) (no. 20Fi21_164190) and the Oeschger Center for Climate Change Research.
Giulia Sinnl thanks Hubertus Fischer for his useful comments on the paper. Many thanks to the three anonymous referees and to Michael Sigl who provided essential comments for the improvement of the paper. A special thank you to Joe McConnell for providing the DRI_NGRIP2 timescale and NGRIP2 data and a useful reminder about the importance of b2k/CE age conversions.
This research has been supported by the Carlsberg Foundation (ChronoClimate).
This paper was edited by Eric Wolff and reviewed by three anonymous referees.
Abbott, P. M. and Davies, S. M. Volcanism and the Greenland ice-cores: the tephra record, Earth-Sci. Rev., 115, 173–191, https://doi.org/10.1016/j.earscirev.2012.09.001, 2012.
Abbott, P. M., Jensen, B. J. L., Lowe, D. J., Suzuki, T., and Veres, D.: Crossing new frontiers: extending tephrochronology as a global geoscientific research tool, J. Quaternary Sci., 35, 1–8, https://doi.org/10.1002/jqs.3184, 2020.
Adolphi, F. and Muscheler, R.: Synchronizing the Greenland ice core and radiocarbon timescales over the Holocene – Bayesian wiggle-matching of cosmogenic radionuclide records, Clim. Past, 12, 15–30, https://doi.org/10.5194/cp-12-15-2016, 2016.
Adolphi, F., Bronk Ramsey, C., Erhardt, T., Edwards, R. L., Cheng, H., Turney, C. S. M., Cooper, A., Svensson, A., Rasmussen, S. O., Fischer, H., and Muscheler, R.: Connecting the Greenland ice-core and timescales via cosmogenic radionuclides: testing the synchroneity of Dansgaard–Oeschger events, Clim. Past, 14, 1755–1781, https://doi.org/10.5194/cp-14-1755-2018, 2018.
Ahlstrøm, A. P. and PROMICE project team: A new Programme for Monitoring the Mass Loss of the Greenland Ice Sheet, Geol. Surv. Den. Greenl., 15, 61–64, https://doi.org/10.34194/geusb.v15.5045, 2007.
Andersen, K. K., Svensson, A., Johnsen, S. J., Rasmussen, S. O., Bigler, M., Röthlisberger, R., Ruth, U., Siggaard-Andersen, M.-L., Peder Steffensen, J., Dahl-Jensen, D., Vinther, B. M., and Clausen, H. B.: The Greenland ice core chronology 2005, 15–42 ka. Part 1: constructing the time scale, Quaternary Sci. Rev., 25, 3246–3257, https://doi.org/10.1016/j.quascirev.2006.08.002, 2006.
Baillie, M. G.: Proposed re-dating of the European ice core chronology by seven years prior to the 7th century AD, Geophys. Res. Lett., 35, L15813, https://doi.org/10.1029/2008GL034755, 2008.
Baillie, M. G.: Volcanoes, ice-cores and tree-rings: one story or two?, Antiquity, 84, 202–215, https://doi.org/10.1017/S0003598X00099877, 2010.
Barbante, C., Kehrwald, N. M., Marianelli, P., Vinther, B. M., Steffensen, J. P., Cozzi, G., Hammer, C. U., Clausen, H. B., and Siggaard-Andersen, M.-L.: Greenland ice core evidence of the 79 AD Vesuvius eruption, Clim. Past, 9, 1221–1232, https://doi.org/10.5194/cp-9-1221-2013, 2013.
Beer, J., Finkel, R. C., Bonani, G., Gäggeler, H., Görlach, U., Jacob, P., Klockow, D., Langway, C. C., Neftel, A., Oeschger, H., Schotterer, U., Schwander, J., Siegenthaler, U., Suter, M., Wagenbach, D., and Wölfli, W.: Seasonal variations in the concentration of 10Be, Cl−, NO, SO, H2O2, 210Pb, 3H, mineral dust, and σ18O in Greenland snow, Atmos. Environ. A-Gen., 25, 899–904, https://doi.org/10.1016/0960-1686(91)90131-P, 1991.
Bourne, A. J., Cook, E., Abbott, P. M., Seierstad, I. K., Steffensen, J. P., Svensson, A., Fischer, H., Schüpbach, S., and Davies, S. M.: A tephra lattice for Greenland and a reconstruction of volcanic events spanning 25–45 ka b2k, Quaternary Sci. Rev., 118, 122–141, https://doi.org/10.1016/j.quascirev.2014.07.017, 2015.
Bronk Ramsey, C.: Radiocarbon dating: revolutions in understanding, Archaeometry, 50, 249–275, https://doi.org/10.1111/j.1475-4754.2008.00394.x, 2008.
Büntgen, U., Allen, K., Anchukaitis, K. J., et al.: The influence of decision-making in tree ring-based climate reconstructions, Nat. Commun., 12, 1–10, https://doi.org/10.1038/s41467-021-23627-6, 2021.
Clausen, H. B. and Hammer, C. U.: The Laki and Tambora eruptions as revealed in Greenland ice cores from 11 locations, Ann. Glaciol., 10, 16–22, https://doi.org/10.1017/s0260305500004092, 1988.
Clausen, H. B., Hammer, C. U., Hvidberg, C. S., Dahl-Jensen, D., Steffensen, J. P., Kipfstuhl, J., and Legrand, M.: A comparison of the volcanic records over the past 4000 years from the Greenland Ice Core Project and Dye 3 Greenland ice cores, J. Geophys. Res., 102, 26707–26723, https://doi.org/10.1029/97JC00587, 1997.
Cook, E., Davies, S. M., Guðmundsdóttir, E. R., Abbott, P. M., and Pearce, N. J.: First identification and characterization of Borrobol-type tephra in the Greenland ice cores: new deposits and improved age estimates, J. Quaternary Sci., 33, 212–224, https://doi.org/10.1002/jqs.3016, 2018a.
Cook, E., Portnyagin, M., Ponomareva, V., Bazanova, L., Svensson, A., and Garbe-Schönberg, D.: First identification of cryptotephra from the Kamchatka Peninsula in a Greenland ice core: Implications of a widespread marker deposit that links Greenland to the Pacific northwest, Quaternary Sci. Rev., 181, 200–206, https://doi.org/10.1016/j.quascirev.2017.11.036, 2018b.
Coulter, S. E., Pilcher, J. R., Plunkett, G., Baillie, M., Hall, V. A., Steffensen, J. P., Vinther, B. M., Clausen, H. B., and Johnsen, S. J.: Holocene tephras highlight complexity of volcanic signals in Greenland ice cores, J. Geophys. Res., 117, D21303, https://doi.org/10.1029/2012jd017698, 2012.
Dahl-Jensen, D., Gundestrup, N. S., Miller, H., Watanabe, O., Johnsen, S. J., Steffensen, J. P., Clausen, H. B., Svensson, A., and Larsen, L. B.: The NorthGRIP deep drilling programme, Ann. Glaciol., 35, 1–4, https://doi.org/10.3189/172756402781817275, 2002.
Dansgaard, W.: Stable isotopes in precipitation, Tellus, 16, 436–468, https://doi.org/10.3402/tellusa.v16i4.8993, 1964.
Dansgaard, W., Johnsen, S. J., Clausen, H. B., Dahl-Jensen, D., Gundestrup, N. S., Hammer, C. U., Hvidberg, C. S., Steffensen, J. P., Sveinbjörnsdottir, A. E., Jouzel, J., and Bond, G.: Evidence for general instability of past climate from a 250-kyr ice-core record, Nature, 364, 218–220, https://doi.org/10.1038/364218a0, 1993.
Erhardt, T., Jensen, C. M., Borovinskaya, O., and Fischer, H.: Single particle characterization and total elemental concentration measurements in polar ice using continuous flow analysis-inductively coupled plasma time-of-flight mass spectrometry, Environ. Sci. Technol., 53, 13275–13283, https://doi.org/10.1021/acs.est.9b03886, 2019.
Erhardt, T., Bigler, M., Federer, U., Gfeller, G., Leuenberger, D., Stowasser, O., Röthlisberger, R., Schüpbach, S., Ruth, U., Twarloh, B., Wegner, A., Goto-Azuma, K., Takayuki, K., Kjær, H. A., Vallelonga, P. T., Siggaard-Andersen, M.-L., Hansson, M. E., Benton, A. K., Fleet, L. G., Mulvaney, R., Thomas, E. R., Abram, N. J., Stocker, T. F., and Fischer, H.: High resolution aerosol concentration data from the Greenland NorthGRIP and NEEM deep ice cores, PANGAEA [data set], https://doi.org/10.1594/PANGAEA.935838, 2021.
Erhardt, T., Bigler, M., Federer, U., Gfeller, G., Leuenberger, D., Stowasser, O., Röthlisberger, R., Schüpbach, S., Ruth, U., Twarloh, B., Wegner, A., Goto-Azuma, K., Kuramoto, T., Kjær, H. A., Vallelonga, P. T., Siggaard-Andersen, M.-L., Hansson, M. E., Benton, A. K., Fleet, L. G., Mulvaney, R., Thomas, E. R., Abram, N., Stocker, T. F., and Fischer, H.: High-resolution aerosol concentration data from the Greenland NorthGRIP and NEEM deep ice cores, Earth Syst. Sci. Data, 14, 1215–1231, https://doi.org/10.5194/essd-14-1215-2022, 2022.
Faïn, X., Chappellaz, J., Rhodes, R. H., Stowasser, C., Blunier, T., McConnell, J. R., Brook, E. J., Preunkert, S., Legrand, M., Debois, T., and Romanini, D.: High resolution measurements of carbon monoxide along a late Holocene Greenland ice core: evidence for in situ production, Clim. Past, 10, 987–1000, https://doi.org/10.5194/cp-10-987-2014, 2014.
Fiacco Jr., R. J., Thordarson, T., Germani, M. S., Self, S., Palais, J. M., Whitlow, S., and Grootes, P. M.: Atmospheric aerosol loading and transport due to the 1783–84 Laki eruption in Iceland, interpreted from ash particles and acidity in the GISP2 ice core, Quaternary Res., 42, 231–240, https://doi.org/10.1006/qres.1994.1074, 1994.
Fischer, H., Werner, M., Wagenbach, D., Schwager, M., Thorsteinnson, T., Wilhelms, F., Kipfstuhl, J., and Sommer, S.: Little ice age clearly recorded in northern Greenland ice cores, Geophys. Res. Lett., 25, 1749–1752, https://doi.org/10.1029/98GL01177, 1998.
Fischer, H., Schüpbach, S., Gfeller, G., Bigler, M., Röthlisberger, R., Erhardt, T., Stocker, T. F., Mulvaney, R., and Wolff, E. W.: Millennial changes in North American wildfire and soil activity over the last glacial cycle, Nat. Geosci., 8, 723–727, https://doi.org/10.1038/ngeo2495, 2015.
Fuhrer, K., Neftel, A., Anklin, M., Staffelbach, T., and Legrand, M.: High-resolution ammonium ice core record covering a complete glacial-interglacial cycle, J. Geophys. Res., 101, 4147–4164, https://doi.org/10.1029/95JD02903, 1996.
Fuhrer, K., Wolff, E. W., and Johnsen, S. J.: Timescales for dust variability in the Greenland Ice Core Project (GRIP) ice core in the last 100,000 years, J. Geophys. Res., 104, 31043–31052, https://doi.org/10.1029/1999jd900929, 1999.
Gautier, E., Savarino, J., Erbland, J., Lanciki, A., and Possenti, P.: Variability of sulfate signal in ice core records based on five replicate cores, Clim. Past, 12, 103–113, https://doi.org/10.5194/cp-12-103-2016, 2016.
Geng, L., Alexander, B., Cole-Dai, J., Steig, E. J., Savarino, J., Sofen, E. D., and Schauer, A. J.: Nitrogen isotopes in ice core nitrate linked to anthropogenic atmospheric acidity change, P. Natl. Acad. Sci. USA, 111, 5808–5812, https://doi.org/10.1073/pnas.1319441111, 2014.
Gerber, T. A., Hvidberg, C. S., Rasmussen, S. O., Franke, S., Sinnl, G., Grinsted, A., Jansen, D., and Dahl-Jensen, D.: Upstream flow effects revealed in the EastGRIP ice core using Monte Carlo inversion of a two-dimensional ice-flow model, The Cryosphere, 15, 3655–3679, https://doi.org/10.5194/tc-15-3655-2021, 2021.
Gfeller, G., Fischer, H., Bigler, M., Schüpbach, S., Leuenberger, D., and Mini, O.: Representativeness and seasonality of major ion records derived from NEEM firn cores, The Cryosphere, 8, 1855–1870, https://doi.org/10.5194/tc-8-1855-2014, 2014.
Gkinis, V., Simonsen, S. B., Buchardt, S. L., White, J. W. C., and Vinther, B. M.: Water isotope diffusion rates from the NorthGRIP ice core for the last 16 000 years – Glaciological and paleoclimatic implications, Earth Planet. Sc. Lett., 405, 132–141, https://doi.org/10.1016/j.epsl.2014.08.022, 2014.
Grieman, M. M., Aydin, M., Isaksson, E., Schwikowski, M., and Saltzman, E. S.: Aromatic acids in an Arctic ice core from Svalbard: a proxy record of biomass burning, Clim. Past, 14, 637–651, https://doi.org/10.5194/cp-14-637-2018, 2018.
Grönvold, K., Óskarsson, N., Johnsen, S. J., Clausen, H. B., Hammer, C. U., Bond, G., and Bard, E.: Ash layers from Iceland in the Greenland GRIP ice core correlated with oceanic and land sediments, Earth Planet. Sc. Lett., 135, 149–155, https://doi.org/10.1016/0012-821X(95)00145-3, 1995.
Guillet, S., Corona, C., Ludlow, F., Oppenheimer, C., and Stoffel, M.: Climatic and societal impacts of a “forgotten” cluster of volcanic eruptions in 1108-1110 CE, Scientific reports, 10, 1–10, https://doi.org/10.1038/s41598-020-63339-3, 2020.
Hammer, C. U.: Acidity of polar ice cores in relation to absolute dating, past volcanism, and radio–echoes, J. Glaciol., 25, 359–372, https://doi.org/10.1017/s0022143000015227, 1980.
Helama, S., Seppä, H., Bjune, A. E., and Birks, H. J.: Fusing pollen-stratigraphic and dendroclimatic proxy data to reconstruct summer temperature variability during the past 7.5 ka in subarctic Fennoscandia, J. Paleolimnol., 48, 275–286, https://doi.org/10.1007/s10933-012-9598-1, 2012.
Herron, M. M.: Impurity sources of F−, Cl−, NO and SO in Greenland and Antarctic precipitation, J. Geophys. Res., 87, 3052–3060, https://doi.org/10.1029/JC087iC04p03052, 1982.
Johnsen, S.: Stable isotope homogenization of polar firn and ice, in: Proc. of Symp. on Isotopes and Impurities in Snow and Ice, Int. Ass. of Hydrol. Sci., Commission of Snow and Ice, I.U.G.G. XVI, General Assembly, Grenoble, August–September 1975, IAHS-AISH Publ., 388–392, http://hydrologie.org/redbooks/a118/iahs_118_0210.pdf (last access: 19 April 2022), 1977.
Johnsen, S. J., Dansgaard, W., and White, J. W.: The origin of Arctic precipitation under present and glacial conditions, Tellus B, 41, 452–468, https://doi.org/10.1111/j.1600-0889.1989.tb00321.x, 1989.
Johnsen, S. J., Clausen, H. B., Dansgaard, W., Fuhrer, K., Gundestrup, N., Hammer, C. U., Iversen, P., Jouzel, J., Stauffer, B., and Steffensen, J. P.: Irregular glacial interstadials recorded in a new Greenland ice core, Nature, 359, 311–313, https://doi.org/10.1038/359311a0, 1992.
Johnsen, S. J., Clausen, H. B., Cuffey, K. M., Hoffmann, G., Schwander, J., and Creyts, T. (2000). Diffusion of stable isotopes in polar firn and ice: the isotope effect in firn diffusion, in: Physics of ice core records, edited by: Hondoh, T., Hokkaido University Press, Sapporo, 121–140, https://doi.org/10.7916/D8KW5D4X, 2000.
Johnsen, S. J., Dahl-Jensen, D., Gundestrup, N., Steffensen, J. P., Clausen, H. B., Miller, H., Masson-Delmotte, V., Sveinbjörnsdottir, A. E., and White, J.: Oxygen isotope and palaeotemperature records from six Greenland ice-core stations: Camp Century, Dye-3, GRIP, GISP2, Renland and NorthGRIP, J. Quaternary Sci., 16, 299–307, https://doi.org/10.1002/jqs.622, 2001.
Jouzel, J., Alley, R. B., Cuffey, K. M., Dansgaard, W., Grootes, P., Hoffmann, G., Johnsen, S. J., Koster, R. D., Peel, D., Shuman, C. A., Stievenard, M., Stuiver, M., and White, J.: Validity of the temperature reconstruction from water isotopes in ice cores, J. Geophys. Res., 102, 26471–26487, https://doi.org/10.1029/97JC01283, 1997.
Kaufmann, P. R., Federer, U., Hutterli, M. A., Bigler, M., Schüpbach, S., Ruth, U., Schmitt, J., and Stocker, T. F.: An improved continuous flow analysis system for high-resolution field measurements on ice cores, Environ. Sci. Technol., 42, 8044–8050, https://doi.org/10.1021/es8007722, 2008.
Laepple, T., Münch, T., Casado, M., Hoerhold, M., Landais, A., and Kipfstuhl, S.: On the similarity and apparent cycles of isotopic variations in East Antarctic snow pits, The Cryosphere, 12, 169–187, https://doi.org/10.5194/tc-12-169-2018, 2018.
Langway, C. C., Oeschger, H., and Dansgaard Jr., W.: The Greenland Ice Sheet Program in perspective, American Geophysical Union, Washington D.C., 33, 5–8, https://doi.org/10.1029/GM033p0001, 1985.
Lavigne, F., Degeai, J. P., Komorowski, J. C., Guillet, S., Robert, V., Lahitte, P., Oppenheimer, C., Stoffel, M., Vidal, C. M., Surono, Pratomo, I., Wassmer, P., Hajdas, I., Hadmoko, D. S., and de Belizal, E.: Source of the great AD 1257 mystery eruption unveiled, Samalas volcano, Rinjani Volcanic Complex, Indonesia, P. Natl. Acad. Sci. USA, 110, 16742–16747, https://doi.org/10.1073/pnas.1307520110, 2013.
Legrand, M., McConnell, J., Fischer, H., Wolff, E. W., Preunkert, S., Arienzo, M., Chellman, N., Leuenberger, D., Maselli, O., Place, P., Sigl, M., Schüpbach, S., and Flannigan, M.: Boreal fire records in Northern Hemisphere ice cores: a review, Clim. Past, 12, 2033–2059, https://doi.org/10.5194/cp-12-2033-2016, 2016.
Lin, J., Svensson, A., Hvidberg, C. S., Lohmann, J., Kristiansen, S., Dahl-Jensen, D., Steffensen, J. P., Rasmussen, S. O., Cook, E., Kjær, H. A., Vinther, B. M., Fischer, H., Stocker, T., Sigl, M., Bigler, M., Severi, M., Traversi, R., and Mulvaney, R.: Magnitude, frequency and climate forcing of global volcanism during the last glacial period as seen in Greenland and Antarctic ice cores (60–9 ka), Clim. Past, 18, 485–506, https://doi.org/10.5194/cp-18-485-2022, 2021.
Lohne, Ø. S., Mangerud, J. A. N., and Birks, H. H.: Precise 14C ages of the Vedde and Saksunarvatn ashes and the Younger Dryas boundaries from western Norway and their comparison with the Greenland Ice Core (GICC05) chronology, J. Quaternary Sci., 28, 490–500, https://doi.org/10.1002/jqs.2640, 2013.
McAneney, J. and Baillie, M.: Absolute tree-ring dates for the Late Bronze Age eruptions of Aniakchak and Thera in light of a proposed revision of ice-core chronologies, Antiquity, 93, 99–112, https://doi.org/10.15184/aqy.2018.165, 2019.
McConnell, R. J., Wilson, A. I., Stohl, A., Arienzo, M. M., Chellman, N. J., Eckhardt, S., Thompson, E. M., Pollard, A. M., and Steffensen, J. P.: Lead pollution recorded in Greenland ice indicates European emissions tracked plagues, wars, and imperial expansion during antiquity, P. Natl. Acad. Sci. USA, 115, 5726–5731, https://doi.org/10.1073/pnas.1721818115, 2018.
McConnell, J. R., Sigl, M., Plunkett, G., Burke, A., Kim, W. M., Raible, C. C., Wilson, A. I., Manning, J. G., Ludlow, F., Chellman, N. J., Innes, H. M., Yang, Z., Larsen, Jessica F., Schaefer, J. R., Kipfstuhl, S., Mojtabavi, S., Wilhelms, F., Opel, T., Meyer, H., and Steffensen, J. P.: Extreme climate after massive eruption of Alaska's Okmok volcano in 43 BCE and effects on the late Roman Republic and Ptolemaic Kingdom, P. Natl. Acad. Sci. USA, 117, 15443–15449, https://doi.org/10.1073/pnas.2002722117, 2020.
McGwire, K. C., McConnell, J. R., Alley, R. B., Banta, J. R., Hargreaves, G. M., and Taylor, K. C.: Dating annual layers of a shallow Antarctic ice core with an optical scanner, J. Glaciol., 54, 831–838, https://doi.org/10.3189/002214308787780021, 2008.
Meese, D. A., Gow, A. J., Alley, R. B., Zielinski, G. A., Grootes, P. M., Ram, M., Taylor, K. C., Mayewski, P. A., and Bolzan, J. F.: The Greenland Ice Sheet Project 2 depth-age scale: methods and results, J. Geophys. Res., 102, 26411–26423, https://doi.org/10.1029/97JC00269, 1997.
Mekhaldi, F., Muscheler, R., Adolphi, F., Aldahan, A., Beer, J., McConnell, J. R., Possnert, G., Sigl, M., Svensson, A., Synal, H.-A., Welten, K. C., and Woodruff, T. E.: Multiradionuclide evidence for the solar origin of the cosmic-ray events of AD 774/5 and 993/4, Nat. Commun., 6, 1–8, https://doi.org/10.1038/ncomms9611, 2015.
Mojtabavi, S., Wilhelms, F., Cook, E., Davies, S. M., Sinnl, G., Skov Jensen, M., Dahl-Jensen, D., Svensson, A., Vinther, B. M., Kipfstuhl, S., Jones, G., Karlsson, N. B., Faria, S. H., Gkinis, V., Kjær, H. A., Erhardt, T., Berben, S. M. P., Nisancioglu, K. H., Koldtoft, I., and Rasmussen, S. O.: A first chronology for the East Greenland Ice-core Project (EGRIP) over the Holocene and last glacial termination, Clim. Past, 16, 2359–2380, https://doi.org/10.5194/cp-16-2359-2020, 2020a.
Mojtabavi, S., Wilhelms, F., Cook, E., Davies, S. M., Sinnl, G., Skov Jensen, M., Dahl-Jensen, D., Svensson, A. M., Vinther, B. M., Kipfstuhl, S., Karlsson, N. B., Faria, S. H., Gkinis, V., Kjær, H. A., Erhardt, T., Berben, S. M P, Nisancioglu, K. H., Koldtoft, I., and Rasmussen, S. O.: Chronology for the East GReenland Ice-core Project (EGRIP), PANGAEA, https://doi.org/10.1594/PANGAEA.922139, 2020b.
Mojtabavi, S., Wilhelms, F., Cook, E., Davies, S. M., Sinnl, G., Skov Jensen, M., Dahl-Jensen, D., Svensson, A. M., Vinther, B. M., Kipfstuhl, S., Karlsson, N. B., Faria, S. H., Gkinis, V., Kjær, H. A., Erhardt, T., Berben, S. M. P., Nisancioglu, K. H., Koldtoft, I., and Rasmussen, S. O.: Specific conductivity measured with the dielectric profiling (DEP) technique on the NEEM ice core (down to 1493.295 m depth), PANGAEA [data set], https://doi.org/10.1594/PANGAEA.922193, 2020c.
Mojtabavi, S., Wilhelms, F., Cook, E., Davies, S. M., Sinnl, G., Skov Jensen, M., Dahl-Jensen, D., Svensson, A. M., Vinther, B. M., Kipfstuhl, S., Karlsson, N. B., Faria, S. H., Gkinis, V., Kjær, H. A., Erhardt, T., Berben, S. M. P., Nisancioglu, K. H., Koldtoft, I., and Rasmussen, S. O.: Specific conductivity measured with the dielectric profiling (DEP) technique on the NGRIP1 ice core (down to 1371.69 m depth), PANGAEA [data set], https://doi.org/10.1594/PANGAEA.922191, 2020d.
Mojtabavi, S., Eisen, O., Franke, S., Jansen, D., Steinhage, D., Paden, J. D., Dahl-Jensen, D., Weikusat, I., Eichler, J., and Wilhelms, F.: Specific conductivity measured with the dielectric profiling (DEP) technique on the NGRIP2 ice core (down to 1298.525 m depth), PANGAEA [data set], https://doi.org/10.1594/PANGAEA.922306, 2020e.
Mosley-Thompson, E., McConnell, J. R., Bales, R. C., Li, Z., Lin, P. N., Steffen, K., Thompson, L. G., Edwards, R., and Bathke, D.: Local to regional-scale variability of annual net accumulation on the Greenland ice sheet from PARCA cores, J. Geophys. Res., 106, 33839–33851, https://doi.org/10.1029/2001JD900067, 2001.
Muscheler, R., Beer, J., Wagner, G., Laj, C., Kissel, C., Raisbeck, G. M., Yiou, F., and Kubik, P. W.: Changes in the carbon cycle during the last deglaciation as indicated by the comparison of 10Be and 14C records, Earth Planet. Sc. Lett., 219, 325–340, https://doi.org/10.1016/s0012-821x(03)00722-2, 2004.
Muscheler, R., Beer, J., Kubik, P. W., and Synal, H.-A.: Geomagnetic field intensity during the last 60,000 years based on 10Be and 36Cl from the Summit ice cores and 14C, Quaternary Sci. Rev., 24, 1849–1860, https://doi.org/10.1016/j.quascirev.2005.01.012, 2005.
Muscheler, R.: 14C and 10Be around 1650 cal BC, in: Time’s Up! – Dating the Minoan Eruption of Santorini, Acts of the Minoan Eruption Chronology Workshop, Sandbjerg November 2007, edited by: Heinemeier, J. and Friedrich, W., Monographs of the Danish Institute at Athens, Bd. 10, Aarhus University Press, 275–284, ISBN 978-87-7934-024-4, 2009.
Muscheler, R., Adolphi, F., and Knudsen, M.: Assessing the differences between the IntCal and Greenland ice-core time scales for the last 14,000 years via the common cosmogenic radionuclide variations, Quaternary Sci. Rev., 106, 81–87, https://doi.org/10.1016/j.quascirev.2014.08.017, 2014.
Muscheler, R., Adolphi, F., Heaton, T. J., Ramsey, C. B., Svensson, A., Van Der Plicht, J., and Reimer, P. J.: Testing and improving the IntCal20 calibration curve with independent records, Radiocarbon, 62, 1079–1094, https://doi.org/10.1017/rdc.2020.54, 2020.
Nakagawa, T., Tarasov, P., Staff, R., Ramsey, C. B., Marshall, M., Schlolaut, G., Bryant, C., Brauer, A., Lamb, H., Haraguchi, T., Gotanda, K., Kitaba, I., Kitagawa, H., van der Plicht, J., Yonenobu, H., Omori, T., Yokoyama, Y., Tada, R., and Yasuda, Y.: The spatio-temporal structure of the Lateglacial to early Holocene transition reconstructed from the pollen record of Lake Suigetsu and its precise correlation with other key global archives: Implications for palaeoclimatology and archaeology, Global Planet. Change, 202, 103493. https://doi.org/10.1016/j.gloplacha.2021.103493, 2021.
NEEM community members: Eemian interglacial reconstructed from a Greenland folded ice core, Nature, 493, 489–494, https://doi.org/10.1038/nature11789, 2013.
Neff, P. D.: A review of the brittle ice zone in polar ice cores, Ann. Glaciol., 55, 72–82, https://doi.org/10.3189/2014AoG68A023, 2014.
Neftel, A., Moor, E., Oeschger, H., and Stauffer, B.: Evidence from polar ice cores for the increase in atmospheric CO2 in the past two centuries, Nature, 315, 45–47, https://doi.org/10.1038/315045a0, 1985.
North Greenland Ice Core Project members: High resolution record of Northern Hemisphere climate extending into the last interglacial period, Nature, 431, 147–151, https://doi.org/10.1038/nature02805, 2004.
O'Hare, P., Mekhaldi, F., Adolphi, F., Raisbeck, G., Aldahan, A., Anderberg, E., Beer, J., Christl, M., Fahrni, S., Synal, H.-A., Park, J., Possnert, G., Southon, J., Bard, E., ASTER Team, and Muscheler, R.: Multiradionuclide evidence for an extreme solar proton event around 2,610 B.P. (∼660 BC), P. Natl. Acad. Sci. USA, 116, 5961–5966, https://doi.org/10.1073/pnas.1815725116, 2019.
Palais, J. M., Taylor, K., Mayewski, P. A., and Grootes, P.: Volcanic ash from the 1362 AD Oraefajokull eruption (Iceland) in the Greenland ice sheet, Geophys. Res. Lett., 18, 1241–1244, https://doi.org/10.1029/91GL01557, 1991.
Palais, J. M., Germani, M. S., and Zielinski, G. A.: Inter-hemispheric transport of volcanic ash from a 1259 AD volcanic eruption to the Greenland and Antarctic ice sheets, Geophys. Res. Lett., 19, 801–804, https://doi.org/10.1029/92GL00240, 1992.
Park, J., Southon, J., Fahrni, S., Creasman, P., and Mewaldt, R.: Relationship between solar activity and Δ14C peaks in AD 775, AD 994, and 660 BC, Radiocarbon, 59, 1147–1156, https://doi.org/10.1017/RDC.2017.59, 2017.
Pearce, N. J., Westgate, J. A., Preece, S. J., Eastwood, W. J., and Perkins, W. T.: Identification of Aniakchak (Alaska) tephra in Greenland ice core challenges the 1645 BC date for Minoan eruption of Santorini, Geochem. Geophy. Geosy., 5, Q03005, https://doi.org/10.1029/2003gc000672, 2004.
Pearson, C., Salzer, M., Wacker, L., Brewer, P., Sookdeo, A., and Kuniholm, P.: Securing timelines in the ancient Mediterranean using multiproxy annual tree-ring data, P. Natl. Acad. Sci. USA, 117, 8410–8415, https://doi.org/10.1073/pnas.1917445117, 2020.
Pedro, J. B., Jochum, M., Buizert, C., He, F., Barker, S., and Rasmussen, S. O.: Beyond the bipolar seesaw: Toward a process understanding of interhemispheric coupling, Quaternary Sci. Rev., 192, 27–46, https://doi.org/10.1016/j.quascirev.2018.05.005, 2018.
Plunkett, G., Sigl, M., Schwaiger, H. F., Tomlinson, E. L., Toohey, M., McConnell, J. R., Pilcher, J. R., Hasegawa, T., and Siebe, C.: No evidence for tephra in Greenland from the historic eruption of Vesuvius in 79 CE: implications for geochronology and paleoclimatology, Clim. Past, 18, 45–65, https://doi.org/10.5194/cp-18-45-2022, 2022.
Qiao, J., Colgan, W., Jakobs, G., and Nielsen, S.: High-Resolution Tritium Profile in an Ice Core from Camp Century, Greenland, Environ. Sci. Technol., 55, 13638–13645, https://doi.org/10.1021/acs.est.1c01975, 2021.
Rasmussen, S. O., Andersen, K. K., Svensson, A. M., Steffensen, J. P., Vinther, B. M., Clausen, H. B., Siggaard-Andersen, M.-L., Johnsen, S. J., Larsen, L. B., Dahl-Jensen, D., Bigler, M., Röthlisberger, R., Fischer, H., Goto-Azuma, K., Hansson, M. E., and Ruth, U.: A new Greenland ice core chronology for the last glacial termination, J. Geophys. Res., 111, D06102, https://doi.org/10.1029/2005JD006079, 2006.
Rasmussen, S. O., Seierstad, I. K., Andersen, K. K., Bigler, M., Dahl-Jensen, D., and Johnsen, S. J.: Synchronization of the NGRIP, GRIP, and GISP2 ice cores across MIS 2 and palaeoclimatic implications, Quaternary Sci. Rev., 27, 18–28, https://doi.org/10.1016/j.quascirev.2007.01.016, 2008.
Rasmussen, S. O., Abbott, P. M., Blunier, T., Bourne, A. J., Brook, E., Buchardt, S. L., Buizert, C., Chappellaz, J., Clausen, H. B., Cook, E., Dahl-Jensen, D., Davies, S. M., Guillevic, M., Kipfstuhl, S., Laepple, T., Seierstad, I. K., Severinghaus, J. P., Steffensen, J. P., Stowasser, C., Svensson, A., Vallelonga, P., Vinther, B. M., Wilhelms, F., and Winstrup, M.: A first chronology for the North Greenland Eemian Ice Drilling (NEEM) ice core, Clim. Past, 9, 2713–2730, https://doi.org/10.5194/cp-9-2713-2013, 2013a.
Rasmussen, S. O., Abbott, P. M., Blunier, T., Bourne, M., Brook, E. J., Buchardt, S. L., Buizert, C., Chappellaz, J. A., Clausen, H. B., Cook, E., Dahl-Jensen, D., Davies, S. M., Guillevic, M., Kipfstuhl, S., Laepple, T., Seierstad, I. K., Severinghaus, J. P., Steffensen, J. P., Stowasser, C., Svensson, A. M., Vallelonga, P. T., Vinther, B. M., Wilhelms, F., and Winstrup, M.: Specific conductivity and hydrogen ions measured on two ice core (NEEM and NGRIP), PANGAEA, https://doi.org/10.1594/PANGAEA.831528, 2013b.
Rasmussen, S. O., Abbott, P. M., Blunier, T., Bourne, A. J., Brook, E. J., Buchardt, S. L., Buizert, C., Chappellaz, J. A., Clausen, H. B., Cook, E., Dahl-Jensen, D., Davies, S. M., Guillevic, M., Kipfstuhl, S., Laepple, T., Seierstad, I. K., Severinghaus, J., Steffensen, J. P., Stowasser, C., Svensson, A. M., Vallelonga, P., Vinther, B. M., Wilhelms, F., and Winstrup, M.: NOAA/WDS Paleoclimatology - NEEM Ice Core NEEM-1 Time Scale, NOAA National Centers for Environmental Information [data set], https://doi.org/10.25921/gab6-fa09, 2013c.
Reimer, P. J., Bard, E., Bayliss, A., Beck, J. W., Blackwell, P. G., Ramsey, C. B., Buck, C. E., Cheng, H., Edwards, R. L., Friedrich, M., Grootes, P. M., Guilderson, T. P., Haflidason, H., Hajdas, I., Hatté, C., Heaton, T. J., Hoffmann, D. L., Hogg, A. G., Hughen, Konrad A., Kaiser, K. F., Kromer, B., Manning, S. W., Niu, M., Reimer, R. W., Richards, D. A., Scott, E. M., Southon, J. R., Staff, R. A., Turney, C. S. M., and Van Der Plicht, J.: IntCal13 and Marine13 radiocarbon age calibration curves 0–50,000 years cal BP, Radiocarbon, 55, 1869–1887 https://doi.org/10.2458/azu_js_rc.55.16947, 2013.
Reimer, P. J., Austin, W. E., Bard, E., et al.: The IntCal20 Northern Hemisphere radiocarbon age calibration curve (0–55 cal kBP), Radiocarbon, 62, 725–757, https://doi.org/10.1017/rdc.2020.41, 2020.
Rhodes, R. H., Yang, X., and Wolff, E. W.: Sea ice versus storms: what controls sea salt in arctic ice cores?, Geophys. Res. Let., 45, 5572–5580, https://doi.org/10.1029/2018gl077403, 2018.
Robock, A. and Free, M. P.: Ice cores as an index of global volcanism from 1850 to the present, J. Geophys. Res., 100, 11549–11567, https://doi.org/10.1029/95JD00825, 1995.
Röthlisberger, R., Mulvaney, R., Wolff, E. W., Hutterli, M. A., Bigler, M., Sommer, S., and Jouzel, J.: Dust and sea salt variability in central East Antarctica (Dome C) over the last 45 kyrs and its implications for southern high-latitude climate, Geophys. Res. Lett., 29, 1963, https://doi.org/10.1029/2002GL015186, 2002.
Sakurai, H., Tokanai, F., Miyake, F., Horiuchi, K., Masuda, K., Miyahara, H., Ohyama, M., Sakamoto, M., Mitsutani, T., and Moriya, T.: Prolonged production of 14C during the ∼660 BCE solar proton event from Japanese tree rings, Sci. Rep., 10, 660, https://doi.org/10.1038/s41598-019-57273-2, 2020.
Salzer, M. W. and Hughes, M. K.: Bristlecone pine tree rings and volcanic eruptions over the last 5000 yr, Quaternary Res., 67, 57–68, https://doi.org/10.1016/j.yqres.2006.07.004, 2007.
Seierstad, I. K., Abbott, P. M., Bigler, M., Blunier, T., Bourne, A. J., Brook, E., Buchardt, S. L., Buizert, C., Clausen, Henrik B., Cook, E., Dahl-Jensen, D., Davies, S. M., Guillevic, M., Johnsen, S. J., Pedersen, D. S., Popp, T. J., Rasmussen, S. O., Severinghaus, J. P., Svensson, A., and Vinther, B. M.: Consistently dated records from the Greenland GRIP, GISP2 and NGRIP ice cores for the past 104 ka reveal regional millennial-scale δ18O gradients with possible Heinrich event imprint, Quaternary Sci. Rev., 106, 29–46, https://doi.org/10.1016/j.quascirev.2014.10.032, 2014.
Sigl, M., McConnell, J. R., Layman, L., Maselli, O., McGwire, K., Pasteris, D., Dahl-Jensen, D., Steffensen, J. P., Vinther, B., Edwards, R., Mulvaney, R., and Kipfstuhl, S.: A new bipolar ice core record of volcanism from WAIS Divide and NEEM and implications for climate forcing of the last 2000 years, J. Geophys. Res.-Atmos., 118, 1151–1169, https://doi.org/10.1029/2012jd018603, 2013.
Sigl, M., Winstrup, M., McConnell, J. R., Welten, K. C., Plunkett, G., Ludlow, F., Büntgen, U., Caffee, M., Chellman, N., Dahl-Jensen, D., Fischer, H., Kipfstuhl, S., Kostick, C., Maselli, O. J., Mekhaldi, F., Mulvaney, R., Muscheler, R., Pasteris, D. R., Pilcher, J. R., Salzer, M., Schüpbach, S., Steffensen, J. P., Vinther, B. M., and Woodruff, T. E.: Timing and climate forcing of volcanic eruptions for the past 2,500 years, Nature, 523, 543–549, https://doi.org/10.1038/nature14565, 2015.
Sigl, M., Fudge, T. J., Winstrup, M., Cole-Dai, J., Ferris, D., McConnell, J. R., Taylor, K. C., Welten, K. C., Woodruff, T. E., Adolphi, F., Bisiaux, M., Brook, E. J., Buizert, C., Caffee, M. W., Dunbar, N. W., Edwards, R., Geng, L., Iverson, N., Koffman, B., Layman, L., Maselli, O. J., McGwire, K., Muscheler, R., Nishiizumi, K., Pasteris, D. R., Rhodes, R. H., and Sowers, T. A.: The WAIS Divide deep ice core WD2014 chronology – Part 2: Annual-layer counting (0–31 ka BP), Clim. Past, 12, 769–786, https://doi.org/10.5194/cp-12-769-2016, 2016.
Sjolte, J., Sturm, C., Adolphi, F., Vinther, B. M., Werner, M., Lohmann, G., and Muscheler, R.: Solar and volcanic forcing of North Atlantic climate inferred from a process-based reconstruction, Clim. Past, 14, 1179–1194, https://doi.org/10.5194/cp-14-1179-2018, 2018.
Smith, C. L., Fairchild, I. J., Spötl, C., Frisia, S., Borsato, A., Moreton, S. G., and Wynn, P. M.: Chronology building using objective identification of annual signals in trace element profiles of stalagmites, Quat. Geochronol., 4, 11–21, https://doi.org/10.1016/j.quageo.2008.06.005, 2009.
Sun, C., Plunkett, G., Liu, J., Zhao, H., Sigl, M., McConnell, J. R., Pilcher, J. R., Vinther, B., Steffensen, J. P., and Hall, V.: Ash from Changbaishan Millennium eruption recorded in Greenland ice: implications for determining the eruption's timing and impact, Geophys. Res. Lett., 41, 694–701, https://doi.org/10.1002/2013GL058642, 2014.
Svensson, A., Andersen, K. K., Bigler, M., Clausen, H. B., Dahl-Jensen, D., Davies, S. M., Johnsen, S. J., Muscheler, R., Parrenin, F., Rasmussen, S. O., Röthlisberger, R., Seierstad, I., Steffensen, J. P., and Vinther, B. M.: A 60 000 year Greenland stratigraphic ice core chronology, Clim. Past, 4, 47–57, https://doi.org/10.5194/cp-4-47-2008, 2008.
Svensson, A., Dahl-Jensen, D., Steffensen, J. P., Blunier, T., Rasmussen, S. O., Vinther, B. M., Vallelonga, P., Capron, E., Gkinis, V., Cook, E., Kjær, H. A., Muscheler, R., Kipfstuhl, S., Wilhelms, F., Stocker, T. F., Fischer, H., Adolphi, F., Erhardt, T., Sigl, M., Landais, A., Parrenin, F., Buizert, C., McConnell, J. R., Severi, M., Mulvaney, R., and Bigler, M.: Bipolar volcanic synchronization of abrupt climate change in Greenland and Antarctic ice cores during the last glacial period, Clim. Past, 16, 1565–1580, https://doi.org/10.5194/cp-16-1565-2020, 2020.
Taylor, K., Alley, R., Fiacco, J., Grootes, P., Lamorey, G., Mayewski, P., and Spencer, M.: Ice-core dating and chemistry by direct-current electrical conductivity, J. Glaciol., 38, 325–332, https://doi.org/10.3189/S0022143000002215, 1992.
Taylor, K. C., Lamorey, G. W., Doyle, G. A., Alley, R. B., Grootes, P. M., Mayewski, P. A., White, J. W. C., and Barlow, L. K.: The 'flickering switch' of late Pleistocene climate change, Nature, 361, 432–436, https://doi.org/10.1038/361432a0, 1993.
Torbenson, M. C., Plunkett, G., Brown, D. M., Pilcher, J. R., and Leuschner, H. H.: Asynchrony in key Holocene chronologies: Evidence from Irish bog pines, Geology, 43, 799–802, https://doi.org/10.1130/G36914.1, 2015.
Vidal, C. M., Métrich, N., Komorowski, J.-C., Pratomo, I., Michel, A., Kartadinata, N., Robert, V., and Lavigne, F.: The 1257 Samalas eruption Indonesia): the single greatest stratospheric gas release of the Common Era, Sci. Rep., 6, 34868, https://doi.org/10.1038/srep34868, 2016.
Vinther, B. M., Johnsen, S. J., Andersen, K. K., Clausen, H. B., and Hansen, A. W.: NAO signal recorded in the stable isotopes of Greenland ice cores, Geophys. Res. Lett., 30, 1387, https://doi.org/10.1029/2002GL016193, 2003.
Vinther, B. M., Clausen, H. B., Johnsen, S. J., Rasmussen, S. O., Andersen, K. K., Buchardt, S. L., Dahl-Jensen, D., Seierstad, I. K., Siggaard-Andersen, M.-L., Steffensen, J. P., Svensson, A., Olsen, J., and Heinemeier, J.: A synchronized dating of three Greenland ice cores throughout the Holocene, J. Geophys. Res., 111, D13102, https://doi.org/10.1029/2005jd006921, 2006.
Vinther, B. M., Buchardt, S. L., Clausen, H. B., Dahl-Jensen, D., Johnsen, S. J., Fisher, D. A., Koerner, R. M., Raynaud, D., Lipenkov, V., Andersen, K. K., Blunier, T., Rasmussen, S. O., Steffensen, J. P., and Svensson, A. M.: Holocene thinning of the Greenland ice sheet, Nature, 461, 385–388, https://doi.org/10.1038/nature08355, 2009.
Vinther, B. M., Jones, P. D., Briffa, K. R., Clausen, H. B., Andersen, K. K., Dahl-Jensen, D., and Johnsen, S. J.: Climatic signals in multiple highly resolved stable isotope records from Greenland, Quaternary Sci. Rev., 29, 522–538, https://doi.org/10.1016/j.quascirev.2009.11.002, 2010.
WAIS Divide Project Members: Precise interpolar phasing of abrupt climate change during the last ice age, Nature, 520, 661–665, https://doi.org/10.1038/nature14401, 2015.
Walker, M. J., Berkelhammer, M., Björck, S., Cwynar, L. C., Fisher, D. A., Long, A. J., Lowe, J. J., Newnham, R. M., Rasmussen, S. O., and Weiss, H.: Formal subdivision of the Holocene Series/Epoch: a Discussion Paper by a Working Group of INTIMATE (Integration of ice-core, marine and terrestrial records) and the Subcommission on Quaternary Stratigraphy (International Commission on Stratigraphy), J. Quaternary Sci., 27, 649–659, https://doi.org/10.1002/jqs.2565, 2012.
Warming, E., Svensson, A., Vallelonga, P., and Bigler, M.: A technique for continuous detection of drill liquid in ice cores, J. Glaciol., 59, 503–506, https://doi.org/10.3189/2013JoG12J124, 2013.
Westhoff, J., Sinnl, G., Svensson, A., Freitag, J., Kjær, H. A., Vallelonga, P., Vinther, B., Kipfstuhl, S., Dahl-Jensen, D., and Weikusat, I.: Melt in the Greenland EastGRIP ice core reveals Holocene warming events, Clim. Past Discuss. [preprint], https://doi.org/10.5194/cp-2021-89, in review, 2021.
Whitlow, S., Mayewski, P. A., and Dibb, J. E.: A comparison of major chemical species seasonal concentration and accumulation at the South Pole and Summit, Greenland, Atmos. Environ. A-Gen., 26, 2045–2054, https://doi.org/10.1016/0960-1686(92)90089-4, 1992.
Wilhelms, F., Kipfstuhl, J., Miller, H., Heinloth, K., and Firestone, J.: Precise dielectric profiling of ice cores: a new device with improved guarding and its theory, J. Glaciol., 44, 171–174, https://doi.org/10.3189/S002214300000246X, 1998.
Winstrup, M.: An automated method for annual layer counting in ice cores: and an application to visual stratigraphy data from the ngrip ice core, Doctoral dissertation, Københavns Universitet, Niels Bohr Institutet, 2011.
Winstrup, M.: A Hidden Markov Model Approach to Infer Timescales for High-Resolution Climate Archives, Proceedings of the 30th AAAI Conference on Artificial Intelligence and the 28th Innovative Applications of Artificial Intelligence Conference, Phoenix, Arizona USA, 12–17 February 2016, Vol. VI, 4053, 8 pp., https://ojs.aaai.org/index.php/AAAI/article/view/19084 (last access: 19 April 2022), 2016.
Winstrup, M., Svensson, A. M., Rasmussen, S. O., Winther, O., Steig, E. J., and Axelrod, A. E.: An automated approach for annual layer counting in ice cores, Clim. Past, 8, 1881–1895, https://doi.org/10.5194/cp-8-1881-2012, 2012.
Zdanowicz, C. M., Proemse, B. C., Edwards, R., Feiteng, W., Hogan, C. M., Kinnard, C., and Fisher, D.: Historical black carbon deposition in the Canadian High Arctic: a >250-year long ice-core record from Devon Island, Atmos. Chem. Phys., 18, 12345–12361, https://doi.org/10.5194/acp-18-12345-2018, 2018.
Zielinski, G. A., Mayewski, P. A., Meeker, L. D., Whitlow, S., Twickler, M. S., Morrison, M., Meese, D. A., Gow, A. J., and Alley, R. B.: Record of volcanism since 7000 BC from the GISP2 Greenland ice core and implications for the volcano-climate system, Science, 264, 948–952, https://doi.org/10.1126/science.264.5161.948, 1994.
Zielinski, G. A., Germani, M. S., Larsen, G., Baillie, M. G., Whitlow, S., Twickler, M. S., and Taylor, K.: Evidence of the Eldgjá (Iceland) eruption in the GISP2 Greenland ice core: relationship to eruption processes and climatic conditions in the tenth century, The Holocene, 5, 129–140, https://doi.org/10.1177/095968369500500201, 1995.
Zielinski, G. A., Mayewski, P. A., Meeker, L. D., Grönvold, K., Germani, M. S., Whitlow, S., Twickler, M. S., and Taylor, K.: Volcanic aerosol records and tephrochronology of the Summit, Greenland, ice cores, J. Geophys. Res., 102, 26625–26640, https://doi.org/10.1029/96JC03547, 1997.
The requested paper has a corresponding corrigendum published. Please read the corrigendum first before downloading the article.
- Article
(3414 KB) - Full-text XML
- Corrigendum
-
Supplement
(4783 KB) - BibTeX
- EndNote