the Creative Commons Attribution 4.0 License.
the Creative Commons Attribution 4.0 License.
 | 03 Dec 2020
The SP19 chronology for the South Pole Ice Core – Part 2: gas chronology, Δage, and smoothing of atmospheric records
Jenna A. Epifanio
Edward J. Brook
Christo Buizert
Jon S. Edwards
Todd A. Sowers
Emma C. Kahle
Jeffrey P. Severinghaus
Eric J. Steig
Dominic A. Winski
Erich C. Osterberg
Tyler J. Fudge
Murat Aydin
Ekaterina Hood
Michael Kalk
Karl J. Kreutz
David G. Ferris
Joshua A. Kennedy
A new ice core drilled at the South Pole provides a 54 000-year paleoenvironmental record including the composition of the past atmosphere. This paper describes the SP19 chronology for the South Pole atmospheric gas record and complements a previous paper (Winski et al., 2019) describing the SP19 ice chronology. The gas chronology is based on a discrete methane (CH4) record with 20- to 190-year resolution. To construct the gas timescale, abrupt changes in atmospheric CH4 during the glacial period and centennial CH4 variability during the Holocene were used to synchronize the South Pole gas record with analogous data from the West Antarctic Ice Sheet Divide ice core. Stratigraphic matching based on visual optimization was verified using an automated matching algorithm. The South Pole ice core recovers all expected changes in CH4 based on previous records. Gas transport in the firn results in smoothing of the atmospheric gas record with a smoothing function spectral width that ranges from 30 to 78 years, equal to 3 % of the gas-age–ice-age difference, or Δage. The new gas chronology, in combination with the existing ice age scale from Winski et al. (2019), allows a model-independent reconstruction of the gas-age–ice-age difference through the whole record, which will be useful for testing firn densification models.
- Article
(995 KB) - Full-text XML
- Companion paper
-
Supplement
(2037 KB) - BibTeX
- EndNote


Ice core records provide detailed reconstructions of past climate in the polar regions and unique global records of the past atmosphere. These records are of high resolution and are well-dated, allowing comparisons to events in other ice cores and paleo-archives (Buizert et al., 2015; Elderfield et al., 2012; Hodell et al., 2017; Marcott et al., 2013). The recently collected South Pole ice core (SPC14) expands a spatial array of ice cores drilled across Antarctica that extend into the last glacial period.
SPC14 is an intermediate-depth (1751 m) ice core that was drilled as a part of the South Pole Ice Core (SPICEcore) project and was collected in the 2014/2015 and 2015/2016 field seasons (Casey et al., 2014). The core provides ice and gas data through part of last glacial period to 54 302 years before present (BP, with 0 BP being 1950 CE; Winski et al., 2019). Because drilling stopped almost 1000 m above bedrock, folding and mixing of layers at the bottom of the core are not a concern, resulting in a stratigraphically continuous record for the entire length of the core. The core location is 98.16∘ W, 89.99∘ S, at a surface elevation of 2835 m on the polar plateau of the East Antarctic ice sheet. The current annual accumulation rate is 8 cm a−1 water equivalent, (Lilien et al., 2018; Mosley-Thompson et al., 1999) with an annual-mean temperature of −51 ∘C as measured in the firn (Severinghaus et al., 2001). Due to its geographic location, ice accumulating at the site has low levels of trace impurities such as black carbon (BC), major ions, dust, and trace elements (Casey et al., 2017). These characteristics are an advantage for the measurements of ultra-trace gases such as ethane, methyl chloride, and methyl bromide (Aydin et al., 2004; Lee et al., 2020b; Nicewonger et al., 2018; Saltzman et al., 2004), one of the primary goals of the SPICEcore project.
Air permeates through the porous firn layer and is trapped at depth between 50 and 120 m, depending on local climate. As a result, air is younger than ice at the same depth (Schwander and Stauffer, 1984). This gas-age–ice-age difference (Δage) can range from tens to thousands of years, depending on the site ice accumulation rate and temperature. Gas chronologies for previously collected ice cores have been created either through calculating gas ages using an existing ice chronology coupled with models of Δage or by stratigraphically matching features in gas records with previously dated records in other cores (Blunier et al., 2007; Buizert et al., 2015; Schwander and Stauffer, 1984; Petit et al., 1999; Schwander et al., 1997; Sowers et al., 1992). Later Antarctic chronologies introduced constraints on gas age scales using δ15N, δ18Oatm, and firn models (Bazin et al., 2013; Veres et al., 2013). In cold, relatively low-accumulation rate sites similar to the South Pole, Δage model uncertainty can be a major contributor to the overall uncertainty in the gas age timescale. At the South Pole site today, Δage at the bubble close-off depth is about 1000 years, large enough that the classical approach to calculating Δage using a firn densification model, typically having an uncertainty of about 20 %, is insufficient for dating the gas at the precision needed to compare leads and lags between abrupt climate signals recorded in the ice core.
This paper focuses on the creation of a CH4-based gas chronology for SPC14 using a stratigraphic matching approach and is a companion to a paper describing the first ice chronology for the core (Winski et al., 2019). The gas and ice chronologies are collectively referred to as the SP19 chronology. CH4 is a well-mixed atmospheric trace gas exhibiting globally synchronous abrupt variations on decadal to millennial scales (Blunier and Brook, 2001; Brook et al., 1996; Lee et al., 2020a; Rhodes et al., 2015), making it an ideal choice for stratigraphic matching to existing ice core records. The chronology presented here relies on correlating CH4 variations between the SPC14 and the West Antarctic Ice Sheet Divide (WD) ice cores, using millennial-scale abrupt variations during the last ice age and glacial–interglacial transition and centennial-scale variations during the Holocene. The WD2014 ice core chronology was created in two parts: from 0 to 31.2 ka it is based on annual layer counting; from 31.2 to 67.8 ka it is based on stratigraphic matching of WD CH4 to NGRIP (North Greenland Ice core Project) δ18O, using a linear correction of the NGRIP age scale to improve the fit to the Hulu speleothem record (Buizert et al., 2015; Sigl et al., 2016). For both segments the WD2014 Δage estimate is based on an δ15N-constrained firn densification model simulation.
We first describe relevant attributes of the SPC14 core and acquisition of the SPC14 CH4 record, and then we discuss synchronization and optimization of the gas chronology. We also discuss key observations from our results, including implications for the Δage, smoothing of atmospheric gas records by gas transport in the South Pole firn, and short-term variability in atmospheric CH4.
2.1 CH4 measurements
High-resolution CH4 concentration measurements were made along the entire length of SPC14, jointly at Oregon State University (OSU) and Pennsylvania State University (PSU). Samples from the 139–1077 m interval were measured at PSU and samples in the 1078–1751 m interval were measured at OSU. Both labs measured samples in the 330–840 m and 1130–1150 m intervals for intercalibration. A correction of 6 parts per billion (ppb) was added to PSU CH4 concentrations to correct for an offset that was revealed by the intercalibration measurements. A total of 2318 measurements (733 at PSU and 1598 at OSU) were made on samples at 1067 individual depths resulting in 1 to 2 m depth resolution throughout the entire core. Samples were measured in duplicate (832 depths), triplicate (46 depths), or in quadruplicate for the purpose of laboratory intercalibration (109 depths). Overall, 80 sample depths were measured without replication due to limited sample size or samples that had been broken during shipment.
CH4 concentrations measured at OSU were made using a wet-extraction technique as described in Grachev et al. (2009), with updates by Mitchell et al. (2011) and Lee et al. (2020a). Briefly, subsamples of the main core measuring 10 cm × 6 cm × 2.5 cm (with the 10 cm dimension oriented parallel to the vertical axis of the core) were split into replicate samples by cutting along the vertical axis. Each individual sample was then placed in a glass vacuum flask and attached to an automated analytical setup. The samples were kept frozen by immersing the flasks in an ethanol bath at −68 ∘C. After evacuating atmospheric air from the flasks with a vacuum pump, the flasks were submerged in a warm water bath for 30 min, melting the ice samples and releasing the trapped air. The water was then refrozen, equilibrating to the temperature of the ethanol bath, over a period of 1 h. Once the temperature of the flasks stabilized to −68 ∘C, air in the head space of each flask was expanded four times into a gas chromatograph (GC) for CH4 analysis. Concentrations were quantified by comparison to a calibrated air standard at the beginning and end of each day (500.22 ppb for samples measured in 2016 and 481.25 ppb for any samples measured after 2016) on the NOAA04 CH4 concentration scale (Dlugokencky et al., 2005).
Several corrections were made to the raw CH4 concentration value measured at OSU including adjustments for a small quantity of CH4 that remains dissolved in the melt water (Mitchell et al., 2013; Lee et al., 2020a). Because gases do not reach complete solubility equilibrium during the melt–refreeze process, an empirical solubility correction is employed for this purpose. Mitchell et al. (2013) describes the experimental derivation of the correction. The derivation was repeated for SPC14 samples resulting in a correction factor of 1.7 % (all sample concentrations measured at OSU were corrected for solubility by increasing the measured value by 1.7 %).
A small amount of additional CH4 can also be present in measured samples due to the influence of air leaks or other contaminations. To quantify this blank correction at OSU, air-free ice (AFI) was routinely measured in conjunction with samples. Production of AFI is described by Mitchell et al. (2013). AFI was processed for analysis and measured in the same way as sample ice; however, an amount of standard air with a known mole fraction of CH4 was added to the flask with AFI prior to the melt–refreeze step. Blank corrections derived from these measurements, also corrected for solubility effects, were subtracted from the measured concentration of each sample. Because samples were measured at different times, a blank correction was applied to each group of samples depending on when they were measured. Average blank corrections ranged from 6.6 to 9.8 ppb for all samples measured at OSU. Data and information about corrections are provided in the Supplement.
PSU CH4 measurements (depths 139–1077 m) were also made using an automated melt–refreeze method similar to the OSU system. However, the PSU system uses stainless steel flasks, which introduces an additional blank correction associated with CH4 outgassing. The blank was estimated by analyzing ice of a known CH4 concentration through multiple melt–refreeze cycles. A regression between the excess CH4 and the number of melt–refreeze cycles was completed to arrive at an estimate of 35 ± 19 ppb blank correction. This correction was applied to all PSU samples. Further description of the PSU method can be found in WAIS Divide Project Members (2013).
All CH4 concentrations are slightly affected by fractionation in the firn column due to gravity (Craig et al., 1988; Mitchell et al., 2011; Schwander et al., 1997; Sowers et al., 1992). The amount of gravitational fractionation is controlled by the thickness of the diffusive zone in the firn column and can be estimated using the δ15N of N2. We corrected all measured CH4 concentrations for gravitational fractionation following Mitchell et al. (2011) by interpolating the δ15N of N2 reported in Winski et al. (2019) to the depths of the CH4 samples and then using the following relationship:
where ΔM is 12.92 g mol−1, the difference in molecular weight between air (M=28.96 g mol−1) and the mass of CH4 (M=16.04 g mol−1). δ15N varies from 0.63 ‰ to 0.46 ‰, with a mean value of 0.54 ‰ . The correction ranges from 2.7 to 5.7 ppb (1σ=0.83 ppb).
The SPC14 discrete CH4 record, measured jointly at OSU and PSU, spans the period 130 years to 52 482 years BP. Sample spacing of the CH4 measurements is between 20 and 190 years, increasing with depth. CH4 concentrations vary from 355 to 751 ppb. Pooled standard deviation for the measurements from 130 to 1150 m is 2.9 ppb, which considers samples both from OSU and PSU after correcting for inter-laboratory offsets. The pooled standard deviation of replicates between 1150 and 1751 m is 2.7 ppb. The record resolves CH4 signals observed in previous ice cores (Figs. 1 and 7). The mean difference between the reference CH4 record from WD and the SPC14 CH4 records, determined by interpolating WD CH4 data (a combination of discrete and continuous CH4 measurements) to the ages of SPC14 CH4 samples is 2.9 ± 1.0 ppb (1 standard deviation; n=1067), demonstrating the long-term stability of the measurement systems.
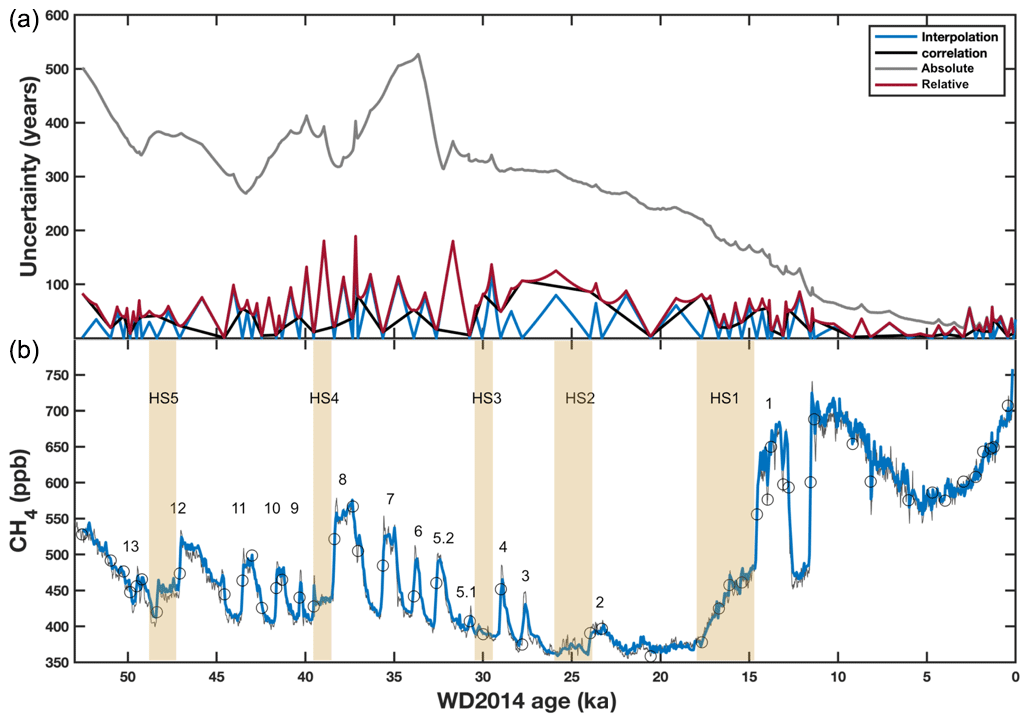
Figure 1(a) SP19 gas chronology uncertainty (±2σ). Black line indicates correlation uncertainty, blue line shows interpolation uncertainty, and red solid line shows total SPC14 uncertainty relative to WD. The red line is a combination in quadrature of the correlation and interpolation uncertainty. The gray line describes total absolute uncertainty, which incorporates the absolute uncertainty in the WD timescale. Maximum uncertainty of ±540 years is found around 35 ka. (b) SPC19 methane record (blue line), plotted on top of WD CH4 record (gray) (Rhodes et al., 2015; WAIS Divide Project Members, 2015). Selected tie points are indicated by circles. The gas chronology extends from 116 years to 52 482 years BP. D-O events are numbered for orientation; yellow bars indicate Heinrich stadials.
2.2 Gas chronology
2.2.1 Summary of synchronization approach
To create a gas chronology for SPC14, CH4 variations were visually matched at equivalent rapid CH4 variations in the WD ice core; subsequently the match was optimized using an automated algorithm. The rapid changes during the last glacial period are coincident with the Northern Hemisphere Dansgaard–Oeschger (D-O) events (Baumgartner et al., 2014; Huber et al., 2006; Rosen et al., 2014; Severinghaus and Brook, 1999; Severinghaus et al., 1998) and are excellent chronostratigraphic tie points between the ice cores. The SPC14 CH4 record also resolves the abrupt CH4 features associated with Heinrich events, as described by Rhodes et al. (2015), and further resolves centennial-scale variations in CH4 previously described in the WD (Mitchell et al., 2013) and Roosevelt Island (RICE) ice cores (Lee et al., 2020a) and in several records by Rhodes et al. (2017). The centennial variations are smaller in magnitude than the D-O events but are clearly present and used as Holocene tie points in the SPC19 gas chronology (Table 1, Fig. 7).
Table 1Tie points used for chronology with Δage and uncertainty. Uncertainties are listed at the tie points as correlation uncertainty and interpolation uncertainty. Interpolation uncertainty is given as the largest estimate for an interval between tie points. Δage is reported in years at each tie point. See Supplement for complete timescale uncertainties. 1950 CE: 0 years.

Synchronization of rapid CH4 excursions between ice core records requires that both records are adequately sampled. WD was chosen as the basis for the SPC14 gas timescale because of (1) its accurate and precise chronology (WD2014) based on annual layer counting and CH4 ties to Greenland ice cores and speleothem chronologies (Buizert et al., 2015; Sigl et al., 2016); (2) its high-resolution continuous (Rhodes et al., 2015) and discrete (Mitchell et al., 2013; WAIS Divide Members, 2015) CH4 record, minimally smoothed by gas transport in the firn (Buizert et al., 2015; Sigl et al., 2016); and (3) volcanic matching between the SPC14 and WD cores, providing a South Pole ice chronology synchronized to WD2014 (Winski, 2019). We used the WD discrete CH4 record for 0–9.8 ka and the continuous CH4 record for 9.8 ka until 54 ka (Rhodes et al., 2015; WAIS Divide Project Members, 2015). The WD2014 chronology has also been used with success for the synchronization of other Antarctic ice cores (Buizert et al., 2018; Lee et al., 2020a). The SPC14 CH4 record has an age resolution of 25 to 150 years, which is sufficient for resolving all of the major abrupt CH4 variations of the last 54 000 years as well as smaller-scale Holocene variations.
2.2.2 Tie point selection and gas age uncertainty
Matching CH4 variations between the WD and SPC14 records establishes the WD2014 gas age at the depth of the SPC14 CH4 feature being matched. Because the SP19 ice chronology has been volcanically synchronized to WD2014, this also allows us to empirically establish Δage at the depth of the CH4 feature. The full gas chronology is then constructed by interpolating Δage between these tie points using a cubic spline and subtracting this Δage spline from the ice chronology.
Tie point selection was done in two stages, first by visual matching, followed by fine-tuning of the visual match using an automated optimization algorithm. We first visually selected either the midpoint, maximum, or minimum of abrupt changes in CH4, depending on the shape of the event, as tie points. The midpoints of D-O and Heinrich CH4 events were determined by averaging CH4 before and after each abrupt change and then determining the midpoint between these averages, using the same techniques for averaging and defining the midpoint as described in Buizert et al. (2015). Smaller CH4 variations, particularly throughout the Holocene, were visually identified based on their magnitude and shape. We then optimized the tie points using a best-fit algorithm that randomly perturbs the age of each visually selected point within a 200-year window centered around the visual tie point. The tie points were perturbed individually (i.e., one at a time). Each tie point age was randomly perturbed 1000 times, and for each perturbation the goodness of fit was calculated by finding the minimum misfit, using Eq. (2):
where Sm is the misfit, gm is the SPC14 CH4 data (in ppb) after perturbing a SPC14 chronostratigraphic tie point, and go is the WD CH4 concentration (in ppb) we match to (i.e., the methane record of WD on the WD2014 chronology). We apply a linear interpolation to find the go at the exact same ages as the gm. We sum the squared difference at each depth (1067 total points) to calculate the misfit on each iteration of the algorithm. Once the best tie point for that event is found, the iteration is performed on the next older tie point. The automated optimization was done on high-pass filtered versions of the CH4 records (first-order Butterworth with 500-year cut-off), thereby eliminating any bias created by low-frequency measurement offsets. Because the methane record of the last glacial period is dominated by the low to high change during the deglaciation, removing this low-frequency oscillation forces the optimization algorithm to ignore this trend and only match higher-frequency oscillations.
The procedure resulted in a final tie point selection where the adjustment ranged from 0.3 years to 64 years (with a mean change of 14.8 years) from the visually selected tie point, giving confidence that the matching is robust. A correlation of the WD and SPC14 high-pass-filtered records increased from r=0.9599 (visual matching) to r=0.9634 (automated matching). The final tie points are listed in Table 1. In the Supplement gas ages are listed for all depths provided in the SPC14 ice age timescale data file (Winski et al., 2019) to provide unified SP19 ice age and gas age timescales for future use. Both timescales are plotted in Fig. 2. Due to the small change in tie points, the increase in correlation between the records, and the smoothly varying reconstructed Δage, we are confident that the matching is accurate.
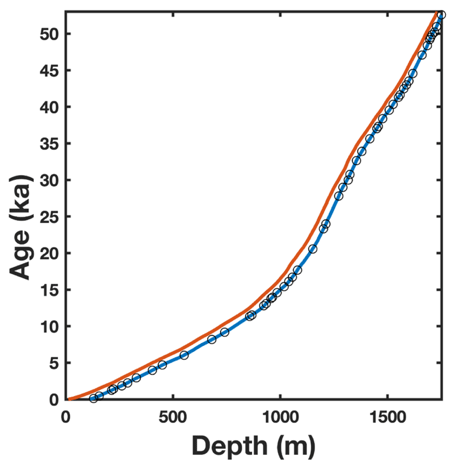
Figure 2Ice age (orange) and gas age (blue) as a function of depth for the SP19 chronology. Gas tie points are indicated by black circles.
Three factors impact the uncertainty of the resulting gas chronology. The first is correlation uncertainty, i.e., how accurately the age of the tie point is transferred from WD to SPC14. This uncertainty is primarily controlled by the sample spacing around each tie point. The second factor is uncertainty that arises from the cubic-spline interpolation between tie points, which is more difficult to quantify. The cubic-spline interpolation used here eliminates discontinuities at tie points but is not representative of the physical processes of firn densification and layer thinning. To estimate interpolation uncertainty, we examined the agreement of small-scale methane variations between the tie points that were not explicitly matched in the procedure. Based on this evaluation the interpolation uncertainty is up to 106 years in the Holocene and up to 190 years in the glacial period. A continuous estimate of the interpolation uncertainty requires that we account for the increase in the uncertainty with distance from a tie point. Based on Fudge et al. (2014) we allow the interpolation uncertainty to increase by 10 % of the age difference to the closest tie point. The third factor to consider is the absolute uncertainty of the reference WD gas chronology (Buizert et al., 2015), which incorporates uncertainties in the WD ice age timescale and WD Δage model. The WD chronology uncertainty changes through time based on how the chronology was created (Buizert et al., 2015). To find the estimated 2σ uncertainty along the length of the core, we used the root sum square of all three uncertainties. The uncertainties are provided in the Supplement and shown in Fig. 1a.
3.1 An empirical record of Δage for SPC14
Accurately constraining the Δage is critical for interpreting ice core records. Traditionally, for low-accumulation Antarctic ice cores, Δage is calculated using firn densification models, as opposed to using direct gas age and ice age constraints (Arnaud et al., 2000; Barnola et al., 1991; Goujon et al., 2003; Loulergue et al., 2007; Lundin et al., 2017; Schwander et al., 1997), though some direct constraints on Δage do exist for Greenland ice cores (Severinghaus et al., 1998). These models simulate the physical process of firn densification over time to determine the depth and age (relative to the surface) of trapped air. Input parameters for the models (temperature, accumulation rate, surface snow density, close-off density, and in some cases dust and wind scouring) as well as the physical processes involved in densification are not known well enough in many cases, leading to substantial uncertainties in Δage when estimated through a model (Bréant et al., 2017; Freitag et al., 2013; Keenan et al., 2020). This is particularly a problem in locations or past time periods where Δage is relatively large. The difficulty in simulating past firn densification has led to uncertainties of the relative phasing of greenhouse forcing and Antarctic climate (Brook and Buizert, 2018).
SPC14 has independent ice and gas chronologies, allowing us to compute an empirically derived Δage history for SPC14 with a very low relative uncertainty due to the fact that WD has a small Δage (and therefore also a small absolute Δage uncertainty). The SPC14 ice chronology was created by combining annual layer counting with stratigraphic matching of volcanic events and is annually resolved through the Holocene (Winski et al., 2019). The uncertainty of the Δage record is impacted by three factors, including (1) the WD Δage uncertainty, (2) correlation uncertainty between chosen CH4 tie points in the record, and (3) uncertainty in the ice age interpolation between volcanic tie points. These terms were added in quadrature to estimate a 2σ uncertainty for the empirical SPC14 Δage record, which we find increases with age (Fig. 3).
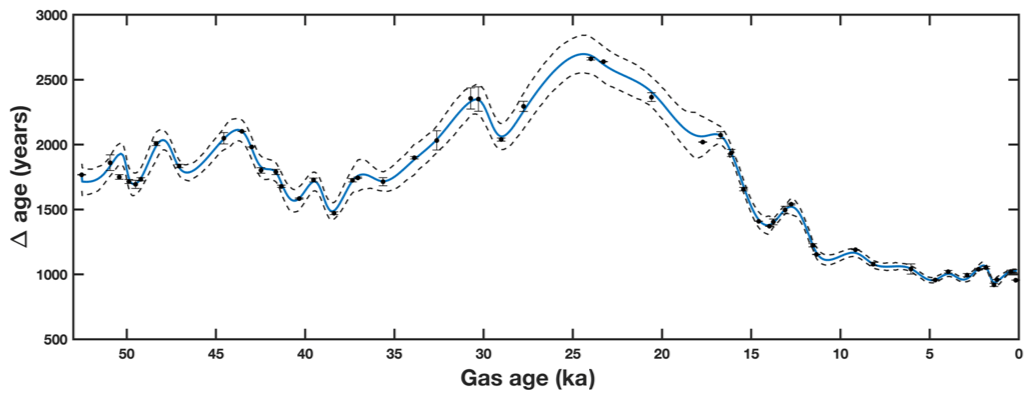
Figure 3Empirically derived Δage history for the SPC14 ice core, derived as described in the text. Blue line is a spline fit to the Δage points. Δage error bounds (2σ), dashed lines, reflect uncertainties with Δage based on WD Δage uncertainty and relative SP19 uncertainties; black dots indicate individual Δage constraints (see text).
The Δage record (Fig. 3) is the first of its kind for Antarctica. It shows the expected larger Δage during the glacial period than the Holocene (due to both lower temperatures and lower accumulation rates) and an overall increase from 55 to 25 ka associated with the cooling from Marine Isotope Stage (MIS) 3 to MIS2. To assess the origin of the Holocene Δage variations, we compare our empirical Δage to firn densification model simulation results presented previously in Winski et al. (2019). We confine this comparison to the Holocene because this section has a detailed ice chronology based on annual layer counting. Briefly, we perform three experiments using a dynamical description of the Herron–Langway densification model (Herron and Langway, 1980). In a first simulation, we force the model with realistic past accumulation variations reconstructed using the annual layer count and realistic past temperature variations based on the δ18O of ice (isotopic slope of 0.8 ‰ K−1). A second simulation uses a constant accumulation rate (0.078 m a−1 ice equivalent) and realistic temperature variations. A third experiment uses a realistic accumulation rate and a constant temperature (−51.5 ∘C). We find that both simulations using realistic past accumulation rates skillfully reproduce the observed variability in both δ15N and Δage. By contrast, when using constant accumulation rates, the model fails to simulate the observed variations in either parameter. This is clear evidence that Holocene variations observed in our empirical Δage reconstruction are driven primarily by changes in past site accumulation rate, not site temperature. The data–model comparison of Fig. 4 suggests that the Holocene section of the SPC14 ice core, owing to its high-resolution δ15N data, empirical Δage record, and annual layer count, is an ideal target for benchmarking the performance of firn densification models. The comparison shown here suggests that the dynamical version of the Herron–Langway firn model has skill in simulating past variations in firn properties on multi-centennial timescales; whether this is true for other densification models remains to be explored (Lundin et al., 2017).

Figure 4(a) Comparison of modeled Δage (red, yellow, and blue lines) and empirical Δage (purple line). Gray dashed lines represent Δage uncertainty. (b) Modeled and actual δ15N data (Winski et al., 2019).
The ability of the firn model simulations to fit the δ15N and Δage variations is lower in the early Holocene section than for later times. We attribute this to the fact that the model forcing is less well known as we go further back in time. Reconstructing past accumulation requires estimates of the thinning function, which become increasingly uncertain with depth – in particular in a flank-flow configuration like SP where the deposition site moves over bedrock topography. Likewise, the temperature reconstruction becomes less certain back in time owing to corrections related to upstream elevation and isotope effects.
3.2 Smoothing of the SPC14 atmospheric gas record
Due to the slow firn densification process, gas diffusion and gradual bubble formation in the firn column act as a low-pass smoothing filter on the atmospheric signal (Buizert et al., 2013; Fourteau et al., 2017; Gregory et al., 2014; Schwander et al., 1993). As the firn densifies, pores remain largely open to the atmosphere, allowing the atmospheric gases to diffuse freely. At the lock-in depth (LID), the firn begins to close off and diffusion of air stops (Battle et al., 1996, 2011; Kawamura et al., 2006; Mitchell et al., 2015). Once pore close-off occurs, no more mixing with the air above can occur. Although the impact of smoothing in the firn on gas records has long been recognized, it is not well quantified because it depends on physical processes near the firn–ice transition that are difficult and time-consuming to study (Fourteau et al., 2019).
The degree to which the atmospheric signal as recorded in the ice has been filtered is of interest for understanding the speed of past environmental changes and the fidelity of the ice core gas record, and it also impacts gas-to-gas correlation like the technique employed here. For example, in a situation where an abrupt CH4 increase was heavily smoothed, the damping of the concentration change (Spahni et al., 2003) would impact a tie point location. At the South Pole this issue could be a concern because this site has an unusually deep LID, currently ∼110 m (Battle et al., 1996; Severinghaus and Battle, 2006).
To quantify the preservation of the SPC14 CH4 signal at specific abrupt events, we compared prominent CH4 features between the SPC14 and WD cores. A comparison of event duration in the WD core and the percent change in amplitude between the event in WD and SPC14 is presented in Table 2 and Fig. 5. Event duration was determined by the number of years between the onset of rapid increases in CH4 and when CH4 returned to pre-event levels. As expected, our results indicate that the amplitude of shorter-lived events is reduced more than that of longer-lived events (amplitude reduction varies from 0 to 31 ppb), consistent with the findings of Spahni et al. (2003), who examined the smoothing of the 8.2 ka methane event in the EPICA Dome C ice core. However, even at values of Δage approaching 2400 years (Fig. 3), which are reached during the last glacial period, previously identified fast CH4 variations are still preserved faithfully in SPC14 (Fig. 5). This level of preservation gives us confidence not only in the accuracy of the tie points, but also in how well other atmospheric gas records will be preserved in SPC14.
Table 2Quantification of smoothing of the methane record in SPC14. Table shows comparison of event duration to the amplitude difference of events in the SPC14 and WD core (see Fig. 5). Spacing (in years) of SPC14 samples over the duration of the event.


Figure 5(a) Correlation of duration of event and amplitude difference between WD and SPC14 events shows a clear negative trend (, p=0.006). Black markers correspond to events listed in Table 2. (b) Example of smoothing from MIS3 showing smoothing of small-scale features in SPC14 (blue) relative to WD (gray). D-O events are numbered; Heinrich Stadial 4 is shaded in orange.
We apply a simple model approach to further examine how much smoothing has affected the SPC14 record. We start with the WD methane record as input, apply various smoothing filters (gas age distributions) based on a firn model, and compare the results to the SPC14 record. In doing so we assume that the WD record is a reasonable substitute for the true atmospheric history; this assumption is justified by the high accumulation rate in WD and narrow age distribution (Battle et al., 2011; Mitchell et al., 2015; WAIS Divide Project Members, 2015).
Site smoothing is fully described by the gas age distribution in the closed bubbles. The gas age distribution employed here was created using a firn air transport model tuned to modern-day Dome C firn air sampling data and site conditions that incorporates advection, diffusion, near-surface convective mixing, deep firn dispersion, and gradual bubble trapping (Buizert et al., 2012; Buizert and Severinghaus, 2016; Mitchell et al., 2015).
The firn air transport model was calibrated to the EDC (EPICA Dome C) site because it is the closest modern-day analogue to South Pole glacial conditions, with accumulation rates of around 3 cm a−1 and a Δage of around 2300 years. Calibration of the firn air transport model used FIRETRACC (Firn Record of Trace Gases Relevant to Atmospheric Chemical Change over 100 yr, http://badc.nerc.ac.uk/data/firetracc, last access: 31 October 2012) firn air sampling data of seven atmospheric trace gases of well-known atmospheric history (CO2, CH4, SF6, CFC-11, CFC-12, CFC-113, CH3CCl3), using established methods (Buizert et al., 2012). Bubble trapping is simulated using the Mitchell et al. (2015) parameterization. Following Eq. (1) in Köhler et al. (2011), we fit a log-normal distribution to the simulated EDC age distribution; the fit is optimized using µ=4.9 and σ=0.6. In the remainder of the analysis we shall use this log-normal distribution, as it follows precedent in the field and can be more easily replicated.
The spectral width Δ of the gas age distribution is defined as (Trudinger et al., 2002)
with G the gas age distribution per year and Γ the mean of the distribution. The spectral width of the simulated EDC present-day closed-bubble gas age distribution equals 78 years (corresponding to around 3.5 % of present-day EDC Δage).
In our analysis we assume that the spectral width of the gas age distribution scales linearly with Δage, or age, where α is unitless scaling factor. This is a reasonable assumption one can make about the system, given that Δage represents the timescale of the snow-to-ice transformation; the gradual bubble trapping that dominates the broadening of the age distribution likely scales with this process to a large degree.
We seek to quantify smoothing in the SPC14 CH4 record by estimating the optimal scaling parameter α. We filter the WD CH4 record (assumed to reflect the true atmospheric variations) by a gas age distribution that is a linearly scaled version of the simulated EDC distribution, scaled such that its spectral width reflects α×Δage at that given time in the core. We repeat this exercise for a wide range of α values from 1 × 10⁻² to 1 in 100 equally spaced steps. The newly filtered WD CH4 record is then compared to the SP CH4 record to determine the optimal value of α that best represents the observed degree of smoothing by minimizing a misfit function. This is illustrated in Fig. 6 (where α is expressed as a percentage rather than a fraction).
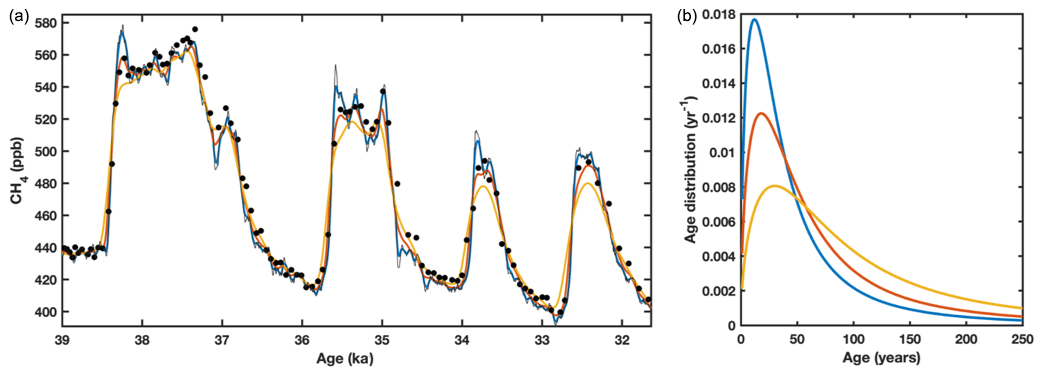
Figure 6(a) SPC14 data (black dots) compared with smoothed WD CH4 record. Colored lines show the result of smoothing the WD record with progressively wider age distributions. Original signal (gray) is plotted against three example smoothed histories: α=0.01 (blue), α=0.03 (red), α=0.05 (yellow) of Δage. The best fit between the smoothed WD record and SPC14 data occurs for α=0.03 (or 3.0 % of Δage). (b) Width of the smoothing filter is defined by the spectral width, which is proportional to a percentage of Δage; in panel (b), 2000-year Δage is demonstrated. Colors of the age distributions correspond with the smoothed signals in (a).
The best fit to the SPC14 record uses a smoothing function history with a spectral width of 3 % of Δage (or α=0.03). This finding is of note because this amount of smoothing is much less than could be expected. In ice core science, an informal rule of thumb has been that smoothing will be 10 % of Δage (Mitchell et al., 2015). This informal rule is based on the observation that the depth range of the bubble close-off at many locations is about 10 % of the total firn thickness. The mechanism for this small amount of smoothing requires further investigation. However, the data and our analysis show clearly that despite the large values of Δage, significant short-term variability, including 20–30 ppb centennial-scale features, will be preserved at ice core sites like the South Pole.
3.3 Centennial CH4 variations
The SPC14 record validates previous observations of persistent centennial-scale CH4 variability through the Holocene and glacial period (Mitchell et al., 2013; Rhodes et al., 2017; Lee et al., 2020a) including variations matched with the WD CH4 record back to 16 150 ka, just after the onset of the glacial termination (Fig. 7). Prior to 16 150 ka, similar features are not resolved in SPC14 due to inadequate sampling resolution, though they have been documented in other Antarctic ice cores (Rhodes et al., 2017). The centennial-scale features observed during the Holocene are important for understanding pre-anthropogenic CH4 variations. Atmospheric CH4 variations in the last 2000 years have sometimes been attributed to anthropogenic forcing mechanisms (Ferretti, 2005; Mischler et al., 2009; Sapart et al., 2012). However, recent work on the Roosevelt Island ice core (RICE) and WD ice cores and now the new SPC14 record (Fig. 7) validate the existence of similar CH4 variations beginning as early as the last glacial period, well before the influence of anthropogenic forcing (Lee et al., 2020a; Rhodes et al., 2017). The observation of centennial-scale variations throughout the Holocene implies that these small but consistent CH4 variations occur naturally rather than that they are caused exclusively by human activity (Lee et al., 2020a), though their origin remains unclear. Rhodes et al. (2017) hypothesized that they represent small changes in the low-latitude hydrological cycle, which lead to small changes in methane production. Whether such variations are forced or arise as a consequence of internal variability is an open question. Further work on this topic and its implication for natural CH4 cycling should include further documentation of this type of variability, investigation of source and sink variability using CH4 emission and atmospheric models, and further comparison to well-dated proxies for hydroclimate at low and high latitudes. Given the large role of tropical wetlands in the modern CH4 budget, exploration of centennial-scale variations in tropical hydrology may be particularly useful.
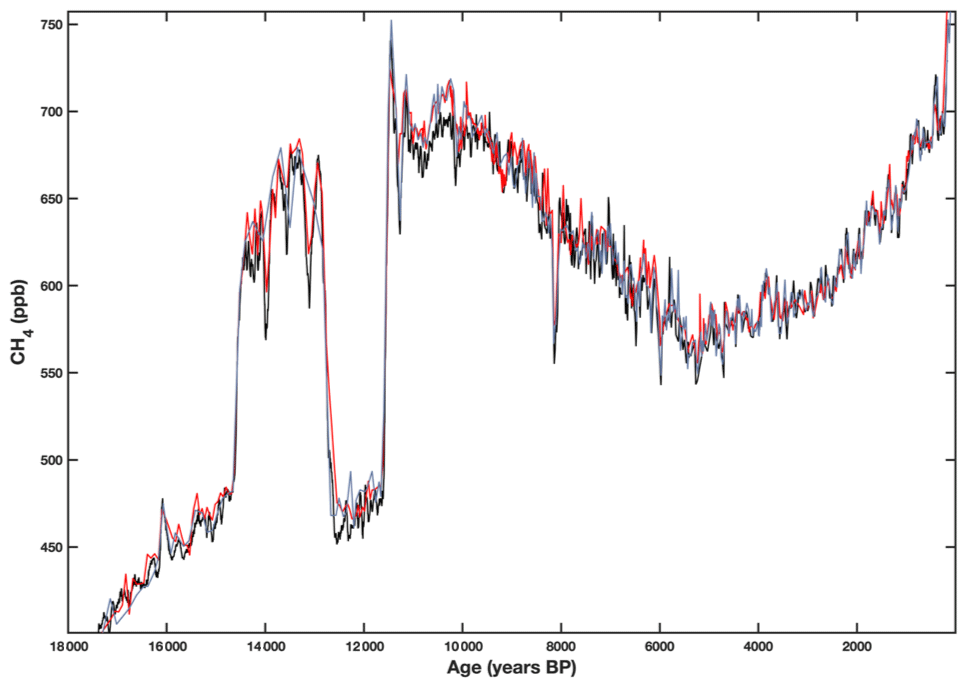
Figure 7SPC14 (blue), WD (black), and RICE (red) all exhibit resolved centennial-scale variation in CH4 in the Holocene and during the deglaciation. RICE data from Lee et al. (2020a); WD data from Rhodes et al. (2015).
The SP19 gas chronology for the SPC14 ice core covers the last 52 586 years, complementing the ice chronology presented in Winski et al. (2019). The gas chronology was created using over 2000 high-resolution, discrete CH4 measurements completed at Oregon State University and Pennsylvania State University. The resulting CH4 record was tied to the high-resolution CH4 record of the WAIS Divide ice core using the WD14 chronology. Abrupt changes in CH4 at D-O events as well as distinct variations of 20–30 ppb during the Holocene are used as tie points. The absolute uncertainty of the gas chronology changes through time to a maximum of ±540 years at 35 ka and an uncertainty of ±502 years at the bottom of the core. Key outcomes of this study include a gas age timescale for the SPC14 ice core, the observation of minimal smoothing of the gas record despite the exceptionally deep firn column at the South Pole, an empirical Δage record that can be used to test firn densification models, and the confirmation of centennial variability in atmospheric CH4.
The data are available in the Supplement and the timescale and data are fully available at the NOAA National Center for Environmental Information Paleoclimate Database (https://www.ncdc.noaa.gov/paleo/study/31532, J. A. Epifanio et al., 2020) and the USAP Antarctic Glaciological Data Center (https://doi.org/10.15784/601380, Epifanio, 2020; https://doi.org/10.15784/601381, J. Epifanio et al., 2020).
The supplement related to this article is available online at: https://doi.org/10.5194/cp-16-2431-2020-supplement.
All authors contributed data to this study. JAE, EJB, CB, JSE, TAS, JPS, EH, and MK measured ice core gases. ECK and EJS made isotope measurements. DAW, ECO, TJF, KJK, DGF, and JAK measured ice core chemistry and contributed to the ice chronology which was used to calculate delta age. JAE, EJB, and CB created gas chronology. DAW, TJF, DGF, ECK, and MA oversaw the ice core collection. JAE, EJB, and CB wrote the paper with input from all authors.
The authors declare that they have no conflict of interest.
This work was funded through grants from the US National Science Foundation (Todd Sowers (1443464 and 1804145), Edward Brook (1643722), Christo Buizert (1443472), Erich Osterberg (1443336), Eric Steig (1143105 and 1141839), Jeffrey Severinghaus (1443710), Murat Aydin (1142517 and 1443470), and Karl Kreutz (1443397)). We would like to thank Mark Twickler and Joe Souney with the SPC14 Science Coordination Office for their work administering the project; the U.S Ice Drilling Program for collecting the SPC14; the 109th New York Air National Guard for the airlift to and from Antarctica; the field team who collected the ice core; the members of South Pole and McMurdo stations who facilitated field operations; the National Ice Core Facility for ice core processing and storage; Ross Beaudette for his work lab work on gas datasets; and the many student researchers who produced data for the SP19 chronologies and helped to process the core.
This research has been supported by the National Science Foundation, Office of Polar Programs (grant nos. 1443464, 1804145, 1643722, 1443472, 1443336, 1143105, 1141839, 1443710, 1142517, 1443470, and 1443397).
This paper was edited by Amaelle Landais and reviewed by two anonymous referees.
Arnaud, L., Barnola, J. M., and Duval, P.: Physical modeling of the densification of snow/firn and ice in the upper part of polar ice sheets, Physics of Ice Core Records, 25, 285–305, 2000.
Aydin, M., Saltzman, E. S., Bruyn, W. J. D., Montzka, S. A., Butler, J. H., and Battle, M.: Atmospheric variability of methyl chloride during the last 300 years from an Antarctic ice core and firn air, Geophys. Res. Lett., 31, L02109, https://doi.org/10.1029/2003GL018750, 2004.
Barnola, J.-M., Pimienta, P., Raynaud, D., and Korotkevich, Y. S.: CO2-climate relationship as deduced from the Vostok ice core: a re-examination based on new measurements and on a re-evaluation of the air dating, Tellus B, 43, 83–90, https://doi.org/10.1034/j.1600-0889.1991.t01-1-00002.x, 1991.
Battle, M., Bender, M., Sowers, T., Tans, P. P., Butler, J. H., Elkins, J. W., Ellis, J. T., Conway, T., Zhang, N., Lang, P., and Clarket, A. D.: Atmospheric gas concentrations over the past century measured in air from firn at the South Pole, Nature, 383, 231–235, https://doi.org/10.1038/383231a0, 1996.
Battle, M. O., Severinghaus, J. P., Sofen, E. D., Plotkin, D., Orsi, A. J., Aydin, M., Montzka, S. A., Sowers, T., and Tans, P. P.: Controls on the movement and composition of firn air at the West Antarctic Ice Sheet Divide, Atmos. Chem. Phys., 11, 11007–11021, https://doi.org/10.5194/acp-11-11007-2011, 2011.
Baumgartner, M., Kindler, P., Eicher, O., Floch, G., Schilt, A., Schwander, J., Spahni, R., Capron, E., Chappellaz, J., Leuenberger, M., Fischer, H., and Stocker, T. F.: NGRIP CH4 concentration from 120 to 10 kyr before present and its relation to a δ15N temperature reconstruction from the same ice core, Clim. Past, 10, 903–920, https://doi.org/10.5194/cp-10-903-2014, 2014.
Bazin, L., Landais, A., Lemieux-Dudon, B., Toyé Mahamadou Kele, H., Veres, D., Parrenin, F., Martinerie, P., Ritz, C., Capron, E., Lipenkov, V., Loutre, M.-F., Raynaud, D., Vinther, B., Svensson, A., Rasmussen, S. O., Severi, M., Blunier, T., Leuenberger, M., Fischer, H., Masson-Delmotte, V., Chappellaz, J., and Wolff, E.: An optimized multi-proxy, multi-site Antarctic ice and gas orbital chronology (AICC2012): 120–800 ka, Clim. Past, 9, 1715–1731, https://doi.org/10.5194/cp-9-1715-2013, 2013.
Blunier, T. and Brook, E. J.: Timing of millennial-scale climate change in Antarctica and Greenland during the last glacial period, Science, 291, 109–112, 2001.
Blunier, T., Spahni, R., Barnola, J.-M., Chappellaz, J., Loulergue, L., and Schwander, J.: Synchronization of ice core records via atmospheric gases, Clim. Past, 3, 325–330, https://doi.org/10.5194/cp-3-325-2007, 2007.
Bréant, C., Martinerie, P., Orsi, A., Arnaud, L., and Landais, A.: Modelling firn thickness evolution during the last deglaciation: constraints on sensitivity to temperature and impurities, Clim. Past, 13, 833–853, https://doi.org/10.5194/cp-13-833-2017, 2017.
Brook, E. J. and Buizert, C.: Antarctic and global climate history viewed from ice cores, Nature, 558, 200–208, https://doi.org/10.1038/s41586-018-0172-5, 2018.
Brook, E. J., Sowers, T., and Orchardo, J.: Rapid variations in atmospheric methane concentration during the past 110,000 years, Science, 273, 1087–1090, 1996.
Buizert, C. and Severinghaus, J. P.: Dispersion in deep polar firn driven by synoptic-scale surface pressure variability, The Cryosphere, 10, 2099–2111, https://doi.org/10.5194/tc-10-2099-2016, 2016.
Buizert, C., Martinerie, P., Petrenko, V. V., Severinghaus, J. P., Trudinger, C. M., Witrant, E., Rosen, J. L., Orsi, A. J., Rubino, M., Etheridge, D. M., Steele, L. P., Hogan, C., Laube, J. C., Sturges, W. T., Levchenko, V. A., Smith, A. M., Levin, I., Conway, T. J., Dlugokencky, E. J., Lang, P. M., Kawamura, K., Jenk, T. M., White, J. W. C., Sowers, T., Schwander, J., and Blunier, T.: Gas transport in firn: multiple-tracer characterisation and model intercomparison for NEEM, Northern Greenland, Atmos. Chem. Phys., 12, 4259–4277, https://doi.org/10.5194/acp-12-4259-2012, 2012.
Buizert, C., Sowers, T., and Blunier, T.: Assessment of diffusive isotopic fractionation in polar firn, and application to ice core trace gas records, Earth Planet. Sc. Lett., 361, 110–119, https://doi.org/10.1016/j.epsl.2012.11.039, 2013.
Buizert, C., Cuffey, K. M., Severinghaus, J. P., Baggenstos, D., Fudge, T. J., Steig, E. J., Markle, B. R., Winstrup, M., Rhodes, R. H., Brook, E. J., Sowers, T. A., Clow, G. D., Cheng, H., Edwards, R. L., Sigl, M., McConnell, J. R., and Taylor, K. C.: The WAIS Divide deep ice core WD2014 chronology – Part 1: Methane synchronization (68–31 ka BP) and the gas age–ice age difference, Clim. Past, 11, 153–173, https://doi.org/10.5194/cp-11-153-2015, 2015.
Buizert, C., Sigl, M., Severi, M., Markle, B. R., Wettstein, J. J., McConnell, J. R., Pedro, J. B., Sodemann, H., Goto-Azuma, K., Kawamura, K., Fujita, S., Motoyama, H., Hirabayashi, M., Uemura, R., Stenni, B., Parrenin, F., He, F., Fudge, T. J., and Steig, E. J.: Abrupt ice-age shifts in southern westerly winds and Antarctic climate forced from the north, Nature, 563, 681–685, https://doi.org/10.1038/s41586-018-0727-5, 2018.
Casey, K. A., Fudge, T. J., Neumann, T. A., Steig, E. J., Cavitte, M. G. P., and Blankenship, D. D.: The 1500 m South Pole ice core: recovering a 40 ka environmental record, Ann. Glaciol., 55, 137–146, 2014.
Casey, K. A., Kaspari, S. D., Skiles, S. M., Kreutz, K., and Handley, M. J.: The spectral and chemical measurement of pollutants on snow near South Pole, Antarctica, J. Geophys. Res.-Atmos., 122, 6592–6610, https://doi.org/10.1002/2016JD026418, 2017.
Craig, H., Horibe, Y., and Sowers, T.: Gravitational Separation of Gases and Isotopes in Polar Ice Caps, Science, 242, 1675–1678, https://doi.org/10.1126/science.242.4886.1675, 1988.
Dlugokencky, E. J., Myers, R. C., Lang, P. M., Masarie, K. A., Crotwell, A. M., Thoning, K. W., Hall, B. D., Elkins, J. W., and Steele, L. P.: Conversion of NOAA atmospheric dry air CH4 mole fractions to a gravimetrically prepared standard scale, J. Geophys. Res.-Atmos., 110, D18306, https://doi.org/10.1029/2005JD006035, 2005.
Elderfield, H., Ferretti, P., Greaves, M., Crowhurst, S., McCave, I. N., Hodell, D. A., and Piotrowski, A. M.: Evolution of ocean temperature and ice volume through the mid-Pleistocene climate transition, Science, 337, 704–709, 2012.
Epifanio, J.: SP19 Gas Chronology, U.S. Antarctic Program (USAP) Data Center, https://doi.org/10.15784/601380, 2020.
Epifanio, J., Brook, E. J., Buizert, C., Severinghaus, J., Kreutz, K., Aydin, M., Edwards, J. S., Sowers, T. A., Kahle, E., Steig, E. J., Winski, D. A., Osterberg, E., Fudge, T. J., Hood, E., Kalk, M., Ferris, D. G., and Kennedy, J. A.: South Pole ice core (SPC14) discrete methane data, U.S. Antarctic Program (USAP) Data Center, https://doi.org/10.15784/601381, 2020.
Epifanio, J. A., Brook, E. J., Buizert, C., Edwards, J. S., Sowers, T. A., Kahle, E. C., Severinghaus, J. P., Steig, E. J., Winski, D. A., Osterberg, E. C., Fudge, T. J., Aydin, M., Hood, E., Kalk, M., Kreutz, K. J., Ferris, D. G., and Kennedy, J. A.: South Pole Ice Core 52,000 Year SP19 Gas Age Chronology and Methane Data, available at: https://www.ncdc.noaa.gov/paleo-search/study/31532 (last access: 1 December 2020), National Centers for Environmental Information, 2020.
Ferretti, D. F.: Unexpected Changes to the Global Methane Budget over the Past 2000 Years, Science, 309, 1714–1717, https://doi.org/10.1126/science.1115193, 2005.
Fourteau, K., Faïn, X., Martinerie, P., Landais, A., Ekaykin, A. A., Lipenkov, V. Ya., and Chappellaz, J.: Analytical constraints on layered gas trapping and smoothing of atmospheric variability in ice under low-accumulation conditions, Clim. Past, 13, 1815–1830, https://doi.org/10.5194/cp-13-1815-2017, 2017.
Fourteau, K., Martinerie, P., Faïn, X., Schaller, C. F., Tuckwell, R. J., Löwe, H., Arnaud, L., Magand, O., Thomas, E. R., Freitag, J., Mulvaney, R., Schneebeli, M., and Lipenkov, V. Ya.: Multi-tracer study of gas trapping in an East Antarctic ice core, The Cryosphere, 13, 3383–3403, https://doi.org/10.5194/tc-13-3383-2019, 2019.
Freitag, J., Kipfstuhl, S., Laepple, T., and Wilhelms, F.: Impurity-controlled densification: a new model for stratified polar firn, J. Glaciol., 59, 1163–1169, https://doi.org/10.3189/2013JoG13J042, 2013.
Fudge, T. J., Waddington, E. D., Conway, H., Lundin, J. M. D., and Taylor, K.: Interpolation methods for Antarctic ice-core timescales: application to Byrd, Siple Dome and Law Dome ice cores, Clim. Past, 10, 1195–1209, https://doi.org/10.5194/cp-10-1195-2014, 2014.
Goujon, C., Barnola, J.-M., and Ritz, C.: Modeling the densification of polar firn including heat diffusion: Application to close-off characteristics and gas isotopic fractionation for Antarctica and Greenland sites, J. Geophys. Res.-Atmos., 108, https://doi.org/10.1029/2002JD003319, 2003.
Grachev, A. M., Brook, E. J., Severinghaus, J. P., and Pisias, N. G.: Relative timing and variability of atmospheric methane and GISP2 oxygen isotopes between 68 and 86 ka, Global Biogeochem. Cy., 23, GB2009, https://doi.org/10.1029/2008GB003330, 2009.
Gregory, S. A., Albert, M. R., and Baker, I.: Impact of physical properties and accumulation rate on pore close-off in layered firn, The Cryosphere, 8, 91–105, https://doi.org/10.5194/tc-8-91-2014, 2014.
Herron, M. M. and Langway, C. C.: Firn densification: an empirical model, J. Glaciol., 25, 373–385, 1980.
Hodell, D. A., Nicholl, J. A., Bontognali, T. R., Danino, S., Dorador, J., Dowdeswell, J. A., Einsle, J., Kuhlmann, H., Martrat, B., and Mleneck-Vautravers, M. J.: Anatomy of Heinrich Layer 1 and its role in the last deglaciation, Paleoceanography, 32, 284–303, 2017.
Huber, C., Leuenberger, M., Spahni, R., Flückiger, J., Schwander, J., Stocker, T. F., Johnsen, S., Landais, A., and Jouzel, J.: Isotope calibrated Greenland temperature record over Marine Isotope Stage 3 and its relation to CH4, Earth Planet. Sci. Lett., 243, 504–519, https://doi.org/10.1016/j.epsl.2006.01.002, 2006.
Kawamura, K., Severinghaus, J. P., Ishidoya, S., Sugawara, S., Hashida, G., Motoyama, H., Fujii, Y., Aoki, S., and Nakazawa, T.: Convective mixing of air in firn at four polar sites, Earth Planet. Sci. Lett., 244, 672–682, https://doi.org/10.1016/j.epsl.2006.02.017, 2006.
Keenan, E., Wever, N., Dattler, M., Lenaerts, J. T. M., Medley, B., Kuipers Munneke, P., and Reijmer, C.: Physics-based modeling of Antarctic snow and firn density, The Cryosphere Discuss., https://doi.org/10.5194/tc-2020-175, in review, 2020.
Köhler, P., Knorr, G., Buiron, D., Lourantou, A., and Chappellaz, J.: Abrupt rise in atmospheric CO2 at the onset of the Bølling/Allerød: in-situ ice core data versus true atmospheric signals, Clim. Past, 7, 473–486, https://doi.org/10.5194/cp-7-473-2011, 2011.
Lee, J. E., Brook, E. J., Bertler, N. A. N., Buizert, C., Baisden, T., Blunier, T., Ciobanu, V. G., Conway, H., Dahl-Jensen, D., Fudge, T. J., Hindmarsh, R., Keller, E. D., Parrenin, F., Severinghaus, J. P., Vallelonga, P., Waddington, E. D., and Winstrup, M.: An 83 000-year-old ice core from Roosevelt Island, Ross Sea, Antarctica, Clim. Past, 16, 1691–1713, https://doi.org/10.5194/cp-16-1691-2020, 2020a.
Lee, J. E., Edwards, J. S., Schmitt, J., Fischer, H., Bock, M., and Brook, E. J.: Excess methane in Greenland ice cores associated with high dust concentrations, Geochim. Cosmochim. Ac., 270, 409–430, https://doi.org/10.1016/j.gca.2019.11.020, 2020b.
Lilien, D. A., Fudge, T. J., Koutnik, M. R., Conway, H., Osterberg, E. C., Ferris, D. G., Waddington, E. D., and Stevens, C. M.: Holocene Ice-Flow Speedup in the Vicinity of the South Pole, Geophys. Res. Lett., 45, 6557–6565, https://doi.org/10.1029/2018GL078253, 2018.
Loulergue, L., Parrenin, F., Blunier, T., Barnola, J.-M., Spahni, R., Schilt, A., Raisbeck, G., and Chappellaz, J.: New constraints on the gas age-ice age difference along the EPICA ice cores, 0–50 kyr, Clim. Past, 3, 527–540, https://doi.org/10.5194/cp-3-527-2007, 2007.
Lundin, J. M. D., Stevens, C. M., Arthern, R., Buizert, C., Orsi, A., Ligtenberg, S. R. M., Simonsen, S. B., Cummings, E., Essery, R., Leahy, W., Harris, P., Helsen, M. M., and Waddington, E. D.: Firn Model Intercomparison Experiment (FirnMICE), J. Glaciol., 63, 401–422, https://doi.org/10.1017/jog.2016.114, 2017.
Marcott, S. A., Shakun, J. D., Clark, P. U., and Mix, A. C.: A Reconstruction of Regional and Global Temperature for the Past 11,300 Years, Science, 339, 1198–1201, https://doi.org/10.1126/science.1228026, 2013.
Mischler, J. A., Sowers, T. A., Alley, R. B., Battle, M., McConnell, J. R., Mitchell, L., Popp, T., Sofen, E., and Spencer, M. K.: Carbon and hydrogen isotopic composition of methane over the last 1000 years, Global Biogeochem. Cy., 23, GB4024, https://doi.org/10.1029/2009GB003460, 2009.
Mitchell, L., Brook, E., Lee, J. E., Buizert, C., and Sowers, T.: Constraints on the late Holocene anthropogenic contribution to the atmospheric methane budget, Science, 342, 964–966, 2013.
Mitchell, L. E., Brook, E. J., Sowers, T., McConnell, J. R., and Taylor, K.: Multidecadal variability of atmospheric methane, 1000–1800 CE, J. Geophys. Res.-Biogeo., 116, G02007, https://doi.org/10.1029/2010JG001441, 2011.
Mitchell, L. E., Buizert, C., Brook, E. J., Breton, D. J., Fegyveresi, J., Baggenstos, D., Orsi, A., Severinghaus, J., Alley, R. B., Albert, M., Rhodes, R. H., McConnell, J. R., Sigl, M., Maselli, O., Gregory, S., and Ahn, J.: Observing and modeling the influence of layering on bubble trapping in polar firn, J. Geophys. Res.-Atmos., 120, 2558–2574, https://doi.org/10.1002/2014jd022766, 2015.
Mosley-Thompson, E., Paskievitch, J. F., Gow, A. J., and Thompson, L. G.: Late 20th Century increase in South Pole snow accumulation, J. Geophys. Res.-Atmos., 104, 3877–3886, https://doi.org/10.1029/1998JD200092, 1999.
Nicewonger, M. R., Aydin, M., Prather, M. J., and Saltzman, E. S.: Large changes in biomass burning over the last millennium inferred from paleoatmospheric ethane in polar ice cores, P. Natl. Acad. Sci. USA, 115, 12413–12418, https://doi.org/10.1073/pnas.1807172115, 2018.
Petit, J. R., Jouzel, J., Raynaud, D., Barkov, N. I., Barnola, J.-M., Basile, I., Bender, M., Chappellaz, J., Davis, M., Delaygue, G., Delmotte, M., Kotlyakov, V. M., Legrand, M., Lipenkov, V. Y., Lorius, C., PÉpin, L., Ritz, C., Saltzman, E., and Stievenard, M.: Climate and atmospheric history of the past 420,000 years from the Vostok ice core, Antarctica, Nature, 399, 429–436, https://doi.org/10.1038/20859, 1999.
Rhodes, R. H., Brook, E. J., Chiang, J. C. H., Blunier, T., Maselli, O. J., McConnell, J. R., Romanini, D., and Severinghaus, J. P.: Enhanced tropical methane production in response to iceberg discharge in the North Atlantic, Science, 348, 1016–1019, https://doi.org/10.1126/science.1262005, 2015.
Rhodes, R. H., Brook, E. J., McConnell, J. R., Blunier, T., Sime, L. C., Faïn, X., and Mulvaney, R.: Atmospheric methane variability: Centennial-scale signals in the Last Glacial Period: Centennial-Scale Methane Variability, Global Biogeochem. Cy., 31, 575–590, https://doi.org/10.1002/2016GB005570, 2017.
Rosen, J. L., Brook, E. J., Severinghaus, J. P., Blunier, T., Mitchell, L. E., Lee, J. E., Edwards, J. S., and Gkinis, V.: An ice core record of near-synchronous global climate changes at the Bølling transition, Nat. Geosci., 7, 459–463, https://doi.org/10.1038/ngeo2147, 2014.
Saltzman, E. S., Aydin, M., Bruyn, W. J. D., King, D. B., and Yvon-Lewis, S. A.: Methyl bromide in preindustrial air: Measurements from an Antarctic ice core, J. Geophys. Res.-Atmos., 109, D05302, https://doi.org/10.1029/2003JD004157, 2004.
Sapart, C. J., Monteil, G., Prokopiou, M., van de Wal, R. S. W., Kaplan, J. O., Sperlich, P., Krumhardt, K. M., van der Veen, C., Houweling, S., Krol, M. C., Blunier, T., Sowers, T., Martinerie, P., Witrant, E., Dahl-Jensen, D., and Röckmann, T.: Natural and anthropogenic variations in methane sources during the past two millennia, Nature, 490, 85–88, https://doi.org/10.1038/nature11461, 2012.
Schwander, J. and Stauffer, B.: Age difference between polar ice and the air trapped in its bubbles, Nature, 311, 45–47, 1984.
Schwander, J., Barnola, J.-M., Andrié, C., Leuenberger, M., Ludin, A., Raynaud, D., and Stauffer, B.: The age of the air in the firn and the ice at Summit, Greenland, J. Geophys. Res.-Atmos., 98, 2831–2838, https://doi.org/10.1029/92JD02383, 1993.
Schwander, J., Sowers, T., Barnola, J.-M., Blunier, T., Fuchs, A., and Malaizé, B.: Age scale of the air in the summit ice: Implication for glacial-interglacial temperature change, J. Geophys. Res.-Atmos., 102, 19483–19493, 1997.
Severinghaus, J. P. and Battle, M. O.: Fractionation of gases in polar ice during bubble close-off: New constraints from firn air Ne, Kr and Xe observations, Earth Planet. Sc. Lett., 244, 474–500, https://doi.org/10.1016/j.epsl.2006.01.032, 2006.
Severinghaus, J. P. and Brook, E. J.: Abrupt Climate Change at the End of the Last 40 Glacial Period Inferred from Trapped Air in Polar Ice, Science, 286, 930–934, https://doi.org/10.1126/science.286.5441.930, 1999.
Severinghaus, J. P., Sowers, T., Brook, E. J., Alley, R. B., and Bender, M. L.: Timing of abrupt climate change at the end of the Younger Dryas interval from thermally fractionated gases in polar ice, Nature, 391, 141–146, 1998.
Severinghaus, J. P., Grachev, A., and Battle, M.: Thermal fractionation of air in polar firn by seasonal temperature gradients: Thermal Fractionation of Air, Geochem. Geophy. Geosy., 2, n/a–n/a, https://doi.org/10.1029/2000GC000146, 2001.
Sigl, M., Fudge, T. J., Winstrup, M., Cole-Dai, J., Ferris, D., McConnell, J. R., Taylor, K. C., Welten, K. C., Woodruff, T. E., Adolphi, F., Bisiaux, M., Brook, E. J., Buizert, C., Caffee, M. W., Dunbar, N. W., Edwards, R., Geng, L., Iverson, N., Koffman, B., Layman, L., Maselli, O. J., McGwire, K., Muscheler, R., Nishiizumi, K., Pasteris, D. R., Rhodes, R. H., and Sowers, T. A.: The WAIS Divide deep ice core WD2014 chronology – Part 2: Annual-layer counting (0–31 ka BP), Clim. Past, 12, 769–786, https://doi.org/10.5194/cp-12-769-2016, 2016.
Sowers, T., Bender, M., Raynaud, D., and Korotkevich, Y. S.: δ15N of N2 in air trapped in polar ice: A tracer of gas transport in the firn and a possible constraint on ice age-gas age differences, J. Geophys. Res.-Atmos., 97, 15683–15697, https://doi.org/10.1029/92JD01297, 1992.
Spahni, R., Schwander, J., Flückiger, J., Stauffer, B., Chappellaz, J., and Raynaud, D.: The attenuation of fast atmospheric CH4 variations recorded in polar ice cores, Geophys. Res. Lett., 30, 1571, https://doi.org/10.1029/2003GL017093, 2003.
Trudinger, C. M., Etheridge, D. M., Rayner, P. J., Enting, I. G., Sturrock, G. A., and Langenfelds, R. L.: Reconstructing atmospheric histories from measurements of air composition in firn, J. Geophys. Res.-Atmos., 107, ACH 15-1–ACH 15-13, https://doi.org/10.1029/2002JD002545, 2002.
Veres, D., Bazin, L., Landais, A., Toyé Mahamadou Kele, H., Lemieux-Dudon, B., Parrenin, F., Martinerie, P., Blayo, E., Blunier, T., Capron, E., Chappellaz, J., Rasmussen, S. O., Severi, M., Svensson, A., Vinther, B., and Wolff, E. W.: The Antarctic ice core chronology (AICC2012): an optimized multi-parameter and multi-site dating approach for the last 120 thousand years, Clim. Past, 9, 1733–1748, https://doi.org/10.5194/cp-9-1733-2013, 2013.
WAIS Divide Project Members (Fudge, T. J., Steig, E. J., Markle, B. R., Schoenemann, S. W., Ding, Q., Taylor, K. C., McConnell, J. R., Brook, E. J., Sowers, T., White, J. W. C., Alley, R. B., Cheng, H., Clow, G. D., Cole-Dai, J., Conway, H., Cuffey, K. M., Edwards, J. S., Lawrence Edwards, R., Edwards, R., Fegyveresi, J. M., Ferris, D., Fitzpatrick, J. J., Johnson, J., Hargreaves, G., Lee, J. E., Maselli, O. J., Mason, W., McGwire, K. C., Mitchell, L. E., Mortensen, N., Neff, P., Orsi, A. J., Popp, T. J., Schauer, A. J., Severinghaus, J. P., Sigl, M., Spencer, M. K., Vaughn, B. H., Voigt, D. E., Waddington, E. D., Wang, X., and Wong, G. J.): Onset of deglacial warming in West Antarctica driven by local orbital forcing, Nature, 500, 440–444, https://doi.org/10.1038/nature12376, 2013.
WAIS Divide Project Members: Precise Interpolar Phasing of Abrupt Climate Change during the Last Ice Age, Nature, 520, 661–65, https://doi.org/10.1038/nature14401, 2015.
Winski, D. A., Fudge, T. J., Ferris, D. G., Osterberg, E. C., Fegyveresi, J. M., Cole-Dai, J., Thundercloud, Z., Cox, T. S., Kreutz, K. J., Ortman, N., Buizert, C., Epifanio, J., Brook, E. J., Beaudette, R., Severinghaus, J., Sowers, T., Steig, E. J., Kahle, E. C., Jones, T. R., Morris, V., Aydin, M., Nicewonger, M. R., Casey, K. A., Alley, R. B., Waddington, E. D., Iverson, N. A., Dunbar, N. W., Bay, R. C., Souney, J. M., Sigl, M., and McConnell, J. R.: The SP19 chronology for the South Pole Ice Core – Part 1: volcanic matching and annual layer counting, Clim. Past, 15, 1793–1808, https://doi.org/10.5194/cp-15-1793-2019, 2019.