the Creative Commons Attribution 4.0 License.
the Creative Commons Attribution 4.0 License.
 | 26 Apr 2018
Timescale dependence of the relationship between the East Asian summer monsoon strength and precipitation over eastern China in the last millennium
Jian Shi
Huijun Wang
Precipitation/humidity proxies are widely used to reconstruct the historical East Asian summer monsoon (EASM) variations based on the assumption that summer precipitation over eastern China is closely and stably linked to the strength of EASM. However, whether the observed EASM–precipitation relationship (e.g., increased precipitation with a stronger EASM) was stable throughout the past remains unclear. In this study, we used model outputs from the Paleoclimate Modelling Intercomparison Project Phase III and Community Earth System Model to investigate the stability of the EASM–precipitation relationship over the last millennium on different timescales. The model results indicate that the EASM strength (defined as the regionally averaged meridional wind) was enhanced in the Medieval Climate Anomaly (MCA; ∼ 950–1250 AD), during which there was increased precipitation over eastern China, and weakened during the Little Ice Age (LIA; ∼ 1500–1800 AD), during which there was decreased precipitation, consistent with precipitation/humidity proxies. However, the simulated EASM–precipitation relationship is only stable on a centennial and longer timescale and is unstable on a shorter timescale. The nonstationary short-timescale EASM–precipitation relationship broadly exhibits a multi-decadal periodicity, which may be attributed to the internal variability of the climate system and has no significant correlation to external forcings. Our results have implications for understanding the discrepancy among various EASM proxies on a multi-decadal timescale and highlight the need to rethink reconstructed decadal EASM variations based on precipitation/humidity proxies.
- Article
(6527 KB) - Full-text XML
-
Supplement
(724 KB) - BibTeX
- EndNote


The East Asian summer monsoon (EASM) is a crucial component of Asian monsoons, consisting of tropical and subtropical components (Tao and Chen, 1987; Wang et al., 2008). The main characteristic of EASM is the prevailing southerlies in the lower troposphere over the East Asia region (Fig. 1a) induced by the pressure contrast between the East Asia continent and western North Pacific (Li et al., 1996; Shi et al., 1996). As the EASM strengthens (weakens), summer precipitation over eastern China generally increases (decreases) due to sufficient (deficient) water vapor being transported from tropical and subtropical oceans (e.g., Lau et al., 1988; Ding et al., 2008). The assumption that the observed relationship between the EASM strength and summer precipitation over eastern China (i.e., EASM–precipitation relationship) was stable throughout the past is the presupposition for paleo-EASM reconstruction using precipitation-/humidity-relevant proxies, considering the difficulties in directly reconstructing winds and atmospheric circulations. However, previous studies indicate that the aforementioned EASM–precipitation relationship is possibly not stable over recent decades (e.g., Shi and Zhu, 1996; Li et al., 2010; Zhang, 2010) and in the future warming world (e.g., Xin et al., 2013; Ren et al., 2016). Thus, it is necessary to investigate the stability of the EASM–precipitation relationship during the past, which may shed light on the reliability of paleo-EASM reconstructions.

Figure 1(a) Climatological (1948–2000 AD) summer 850 hPa winds (unit: m∕s) derived from NCEP/NCAR reanalysis (Kalnay et al., 1996); (b) Taylor diagram displaying the pattern statistics of climatological summer 850 hPa meridional winds over East Asia (20–45∘ N, 105–135∘ E) between PMIP3 historical experiments (1901–2000 AD) and observations. The radial coordinate is the standard deviation normalized by observations, and the angular coordinate is the spatial correlation with observations. The normalized centered root mean square error between a model and observation (marked as REF) is the distance between them. Note that the CSIRO-Mk3L-1-2 simulation has a negative spatial correlation with the observation and hence is not shown in panel (b).
The last millennium, in which large amounts of historical documents and proxies are available to reconstruct the EASM, provides an opportunity to explore variations in the EASM on different timescales. According to the temperature reconstructions (e.g., Crowley et al., 2000; Mann et al., 2008; Cook et al., 2013), there were two typical climate anomalous periods over the last millennium: the Medieval Climate Anomaly (MCA; approximately 950–1250 AD) and Little Ice Age (LIA; approximately 1450–1850 AD). The MCA/LIA allows us to study the EASM response in a warmer/colder climate background. On a centennial timescale, Wang et al. (1987) found that floods occurred frequently in north (south) China in the MCA (LIA) based on historical documents, indicating a stronger (weaker) EASM at that time. Using oxygen isotope records from stalagmites in central China, Zhang et al. (2008) also showed that the EASM was enhanced (decreased) in the MCA (LIA), as confirmed by other stalagmite records in central and north China (e.g., Tan et al., 2009, 2011; Zhao et al., 2015) as well as several pollen and lake sediments records (e.g., Meng et al., 2009; Liu et al., 2011b). Additionally, by combining multiple proxy records, Chen et al. (2015) indicated that north China was wetter during the MCA and drier during the LIA, implying a stronger and weaker EASM, respectively (Shi et al., 2016b). Nevertheless, on a shorter timescale, there are obvious discrepancies among various EASM records (e.g., Paulsen et al., 2003; Zheng et al., 2006; Zhang et al., 2008; Tan et al., 2009; Wan et al., 2011). For example, the stalagmite record described in Zhang et al. (2008) showed a weaker EASM and drier period over the 860–940 AD period, while Zheng et al. (2006) suggested that eastern China was generally wetter based on historical documents. Moreover, Zhang et al. (2010) implied that several EASM stalagmite records do not match well with the observed EASM variation over the past 150 years on an interdecadal timescale.
These proxies generally indicate a stronger (weaker) EASM in the MCA (LIA) with enhanced (reduced) precipitation over eastern China on a multi-centennial timescale but exhibit large discrepancies on a shorter timescale. Given the sporadically dispersed proxies and limited environmental variables derived from them, the inconsistency among various EASM records is not yet fully understood. Differences in the local climate between each proxy site and uncertainty in the interpretation of proxies may contribute to the aforementioned data discrepancy (Tan et al., 2007; Chen et al., 2015). However, the evolution of the EASM in the last millennium has been broadly reconstructed using precipitation-/humidity-relevant proxies (e.g., Zheng et al., 2006, 2008). Therefore, the research question is whether the inconsistency (consistency) can be partially attributed to the decoupling (coupling) of East Asian summer winds and precipitation over eastern China on different timescales.
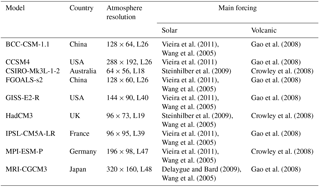
Table 1PMIP3 model simulation information and their main forcing.
Numerical simulations offer a useful tool to examine climate change and the associated dynamic mechanisms in the past. Based on the ECHO-G simulation, Liu et al. (2011a) indicated that the EASM was strengthened and summer precipitation increased over eastern China during the MCA, which were attributed to the increased total solar irradiation. Man et al. (2012) indicated that the EASM became stronger during the MCA, but precipitation increased (decreased) in north (south) China in the Max Planck Institute Earth system model (MPI-ESM) simulations. Peng et al. (2014) also implied that several severe droughts that occurred over eastern China during the last millennium were associated with weakened EASM variations. Shi et al. (2016a) analyzed the Asian circulation and precipitation changes using Paleoclimate Modelling Intercomparison Project Phase III (PMIP3) last millennium simulations. They concluded that the anomalous EASM precipitation pattern between the MCA and LIA varied largely among PMIP3 models, and the influence of external forcings can be detected in the temperature rather than the precipitation. Nevertheless, existing modeling studies have paid little attention to the stability of the EASM–precipitation relationship during the last millennium – which is of vital importance for reconstructing EASM evolution with precipitation-relevant proxies and is the focus of this study.
Here, we use the last millennium experiments of the PMIP3 models and Community Earth System Model (CESM) to study changes in the EASM and precipitation over eastern China over the last millennium (∼ 850–1850 AD). We focus on the spatial–temporal stability of the EASM–precipitation relationship on different timescales. Understanding these issues will improve our cognition of the rationality of applying precipitation-/humidity-relevant proxies as indicators for EASM changes. The remainder of this study is organized as follows. In Sect. 2, we introduce the model data and methods used in our analysis. In Sect. 3, we discuss the variation of the EASM strength and summer precipitation over eastern China over the last millennium. In Sect. 4, we investigate the stability of the EASM–precipitation relationship and possible drivers. In Sect. 5, we summarize the main results and uncertainties.
We use the model outputs of the PMIP3 last millennium simulations from nine climate models (Table 1), excluding MIROC-ESM because of its climate drift in long-term simulations (Gupta et al., 2013). These simulations cover a time span of 850–1850 AD and are mainly forced by total solar irradiance, volcanic eruptions, land use/cover and greenhouse gases. The PMIP3 simulations have been widely used in exploring the climate variations in the last millennium from interannual to multi-centennial timescales (Bothe et al., 2013; Coats et al., 2015; Brown et al., 2015; Yang and Jiang, 2017). In addition, we use the CESM last millennium ensemble (CESM-LME) simulations (Otto-Bliesner et al., 2016) to examine the roles of different forcings in the EASM–precipitation relationship. The CESM-LME uses CESM 1.1 with the Community Atmosphere Model version 5 (CAM5) as its atmosphere component (Hurrell et al., 2013), which features a ∼ 2∘ horizontal resolution. The external forcings applied in the CESM-LME simulations follow those of the CCSM4 in the PMIP3 last millennium experiment. In particular, we analyze nine CESM-LME full-forcing experiments, one control experiment and several sensitivity experiments with individual forcings (four solar activity experiments, five volcanic eruption experiments, three greenhouse gases, land use and Earth's orbit experiments).
Modern observations show that the summer (June–July–August) prevailing winds over East Asia (i.e., the EASM) feature southerlies blowing from tropical oceans and the North Pacific (Fig. 1a). Thus, we define the EASM strength as the regionally averaged 850 hPa meridional winds over East Asia (20–45∘ N, 105–135∘ E) in summer (Jiang et al., 2013). The running pattern correlation (RPC) is applied to reveal the spatial stability of the EASM–precipitation relationship throughout the last millennium. Specifically, we calculate the spatial distributions of the correlation between the EASM strength and summer precipitation over East Asia (10–50∘ N, 100–130∘ E) over an α-year window period (α is the running window size) and the full period (∼ 850–1850 AD), and define their pattern correlation as the RPC. In the following spectrum and correlation analysis, to avoid the possible spurious sign caused by filtered time series, the Monte Carlo simulation is executed. First, we generate random arrays with the same length as the original data and then calculate their spectra or correlation coefficients after filtering the arrays with the same running method. We then repeat the previous steps 10 000 times and get 10 000 spectra or correlation coefficients, and the fifth (tenth) percentile is set as threshold for 95 % (90 %) significance level. We select the MCA as 950–1250 AD and LIA as 1500–1800 AD with an identical time span.
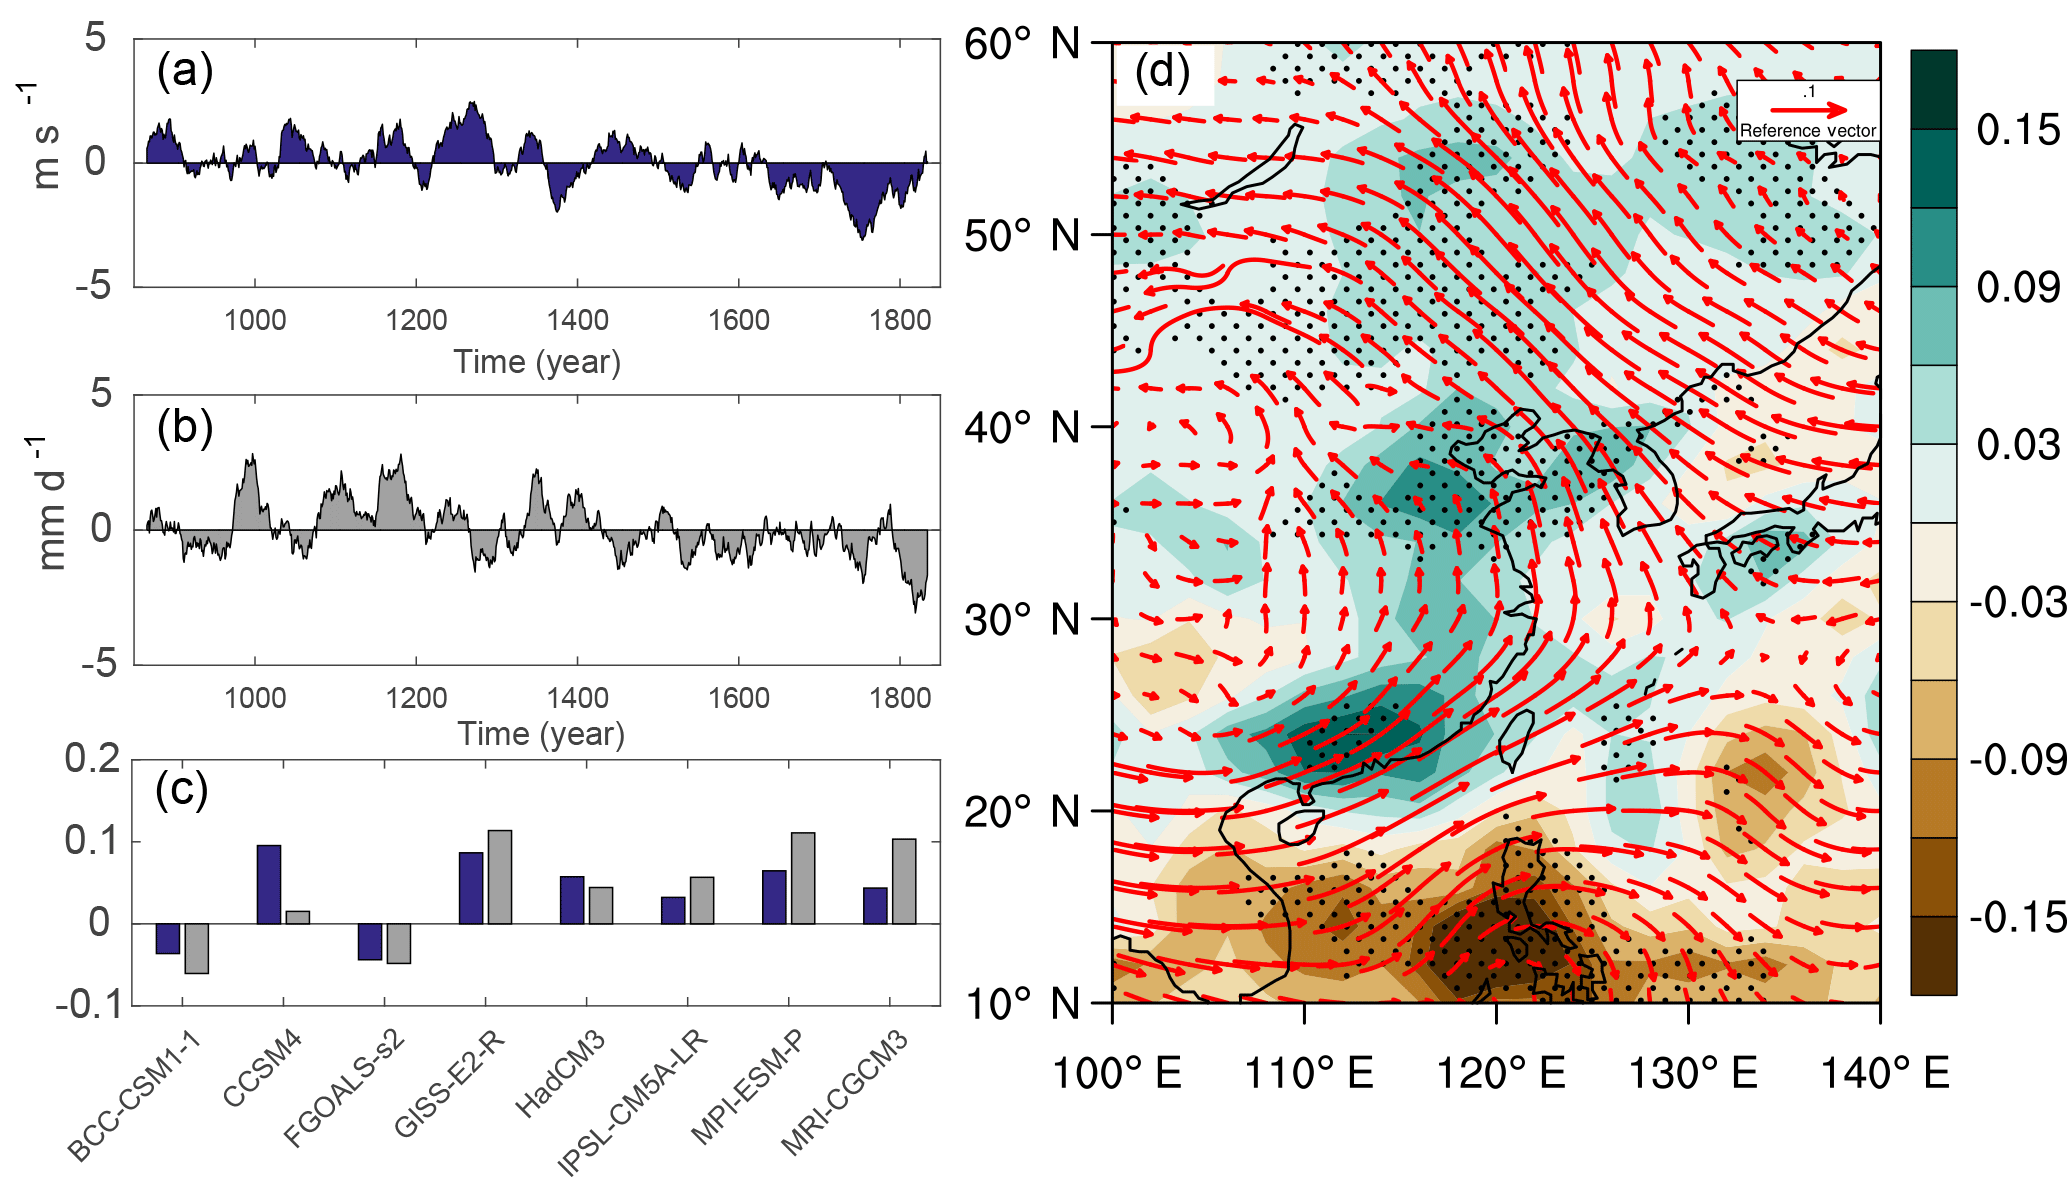
Figure 2(a) Multi-model ensemble mean (MEM) of EASM strength anomalies relative to the long-term average (850–1850 AD); panel (b) is the same as (a) but for regionally averaged summer precipitation anomalies over eastern China (20–45∘ N, 105–120∘ E); (c) difference in the EASM strength (blue) and regionally averaged summer precipitation over eastern China (gray) between the MCA and LIA; (d) MEM of spatial changes in winds (vectors, in m s−1) and summer precipitation (shading, in mm d−1) between MCA and LIA. Dotted areas show that at least six of eight models have the same sign as for MEM.
We first evaluated the performance of PMIP3 models in reproducing modern summer 850 hPa meridional winds over East Asia using the Taylor diagram (Taylor, 2001). As shown in Fig. 1b, most PMIP3 models can simulate the observed summer southerly winds over East Asia, except for the CSIRO-Mk3L-1-2, which has a negative spatial correlation to observations and hence is excluded. The pattern correlations between the remaining eight models and observations vary from 0.21 (MRI-CGCM3) to 0.7 (GISS-E2-R), all passing the 95 % significance test. The normalized centered root mean square errors range from 0.98 (MPI-ESM-P) to 1.55 (HadCM3), indicating that the PMIP3 models generally produce a slightly stronger EASM than observations. Thus, we use the eight models shown in Fig. 1b in our further analyses.

Figure 3(a) MEM of differences in the summer surface air temperature (contours, in ∘C) and sea level pressure (shading, in Pa) between the MCA and LIA; (b) MEM of differences in the summer 200 hPa zonal winds (shading, m s−1) between the MCA and LIA. Red contours are the climatological (850–1850 AD) 200 hPa zonal winds (≥ 15 m s−1, contour interval is 5 m s−1). Areas passing the 95 % significance test are dotted.
The multi-model ensemble mean (MEM) shows that EASMs are generally stronger during the MCA and weaker during the LIA (Fig. 2a). The majority of the PMIP3 models (six of eight models) support the MEM result, while the BCC-CSM1-1 and FGOALS-s2 simulate a weaker (stronger) EASM during the MCA (LIA) (Fig. 2c). Correspondingly, summer precipitation over eastern China increases in the MCA and decreases in the LIA based on the MEM result. The spatial pattern of summer winds and precipitation anomalies between the MCA and LIA (Fig. 2d) further indicate that when southerlies over East Asia reinforce, precipitation over almost all of eastern China increases, consistent with the findings of Liu et al. (2011a). In addition, the in-phase changes of the EASM strength and precipitation over eastern China are shown in both the MEM and individual PMIP3 models' results (Fig. 2c), implying a robust positive EASM–precipitation relationship on a multi-centennial timescale.
Moreover, the MEM result, which shows an enhanced EASM and associated increased summer precipitation during the MCA relative to the LIA, is broadly consistent with the reconstructed EASM derived from precipitation/humidity records in the East Asian monsoon region (e.g., Zhang et al., 2008; Tan et al., 2011). The possible mechanisms for EASM and precipitation changes are as follows. The PMIP3 models simulate a significant warming (cooling) in the Asia continent and weaker warming (cooling) in adjacent oceans during the MCA (LIA) in summer (Fig. 3a); this results in an enhanced (decreased) land–sea pressure contrast and thus a stronger (weaker) EASM. Meanwhile, the meridional temperature gradient reduces (increased) in the middle to high latitudes and leads to an overall weakening (strengthening) in the upper westerlies (Fig. 3b), which is favorable for a stronger (weaker) EASM (Zhou and Yu, 2005). These results are similar to previous findings of single model studies (e.g., Liu et al., 2011a; Man et al., 2012; Shi et al., 2016b).
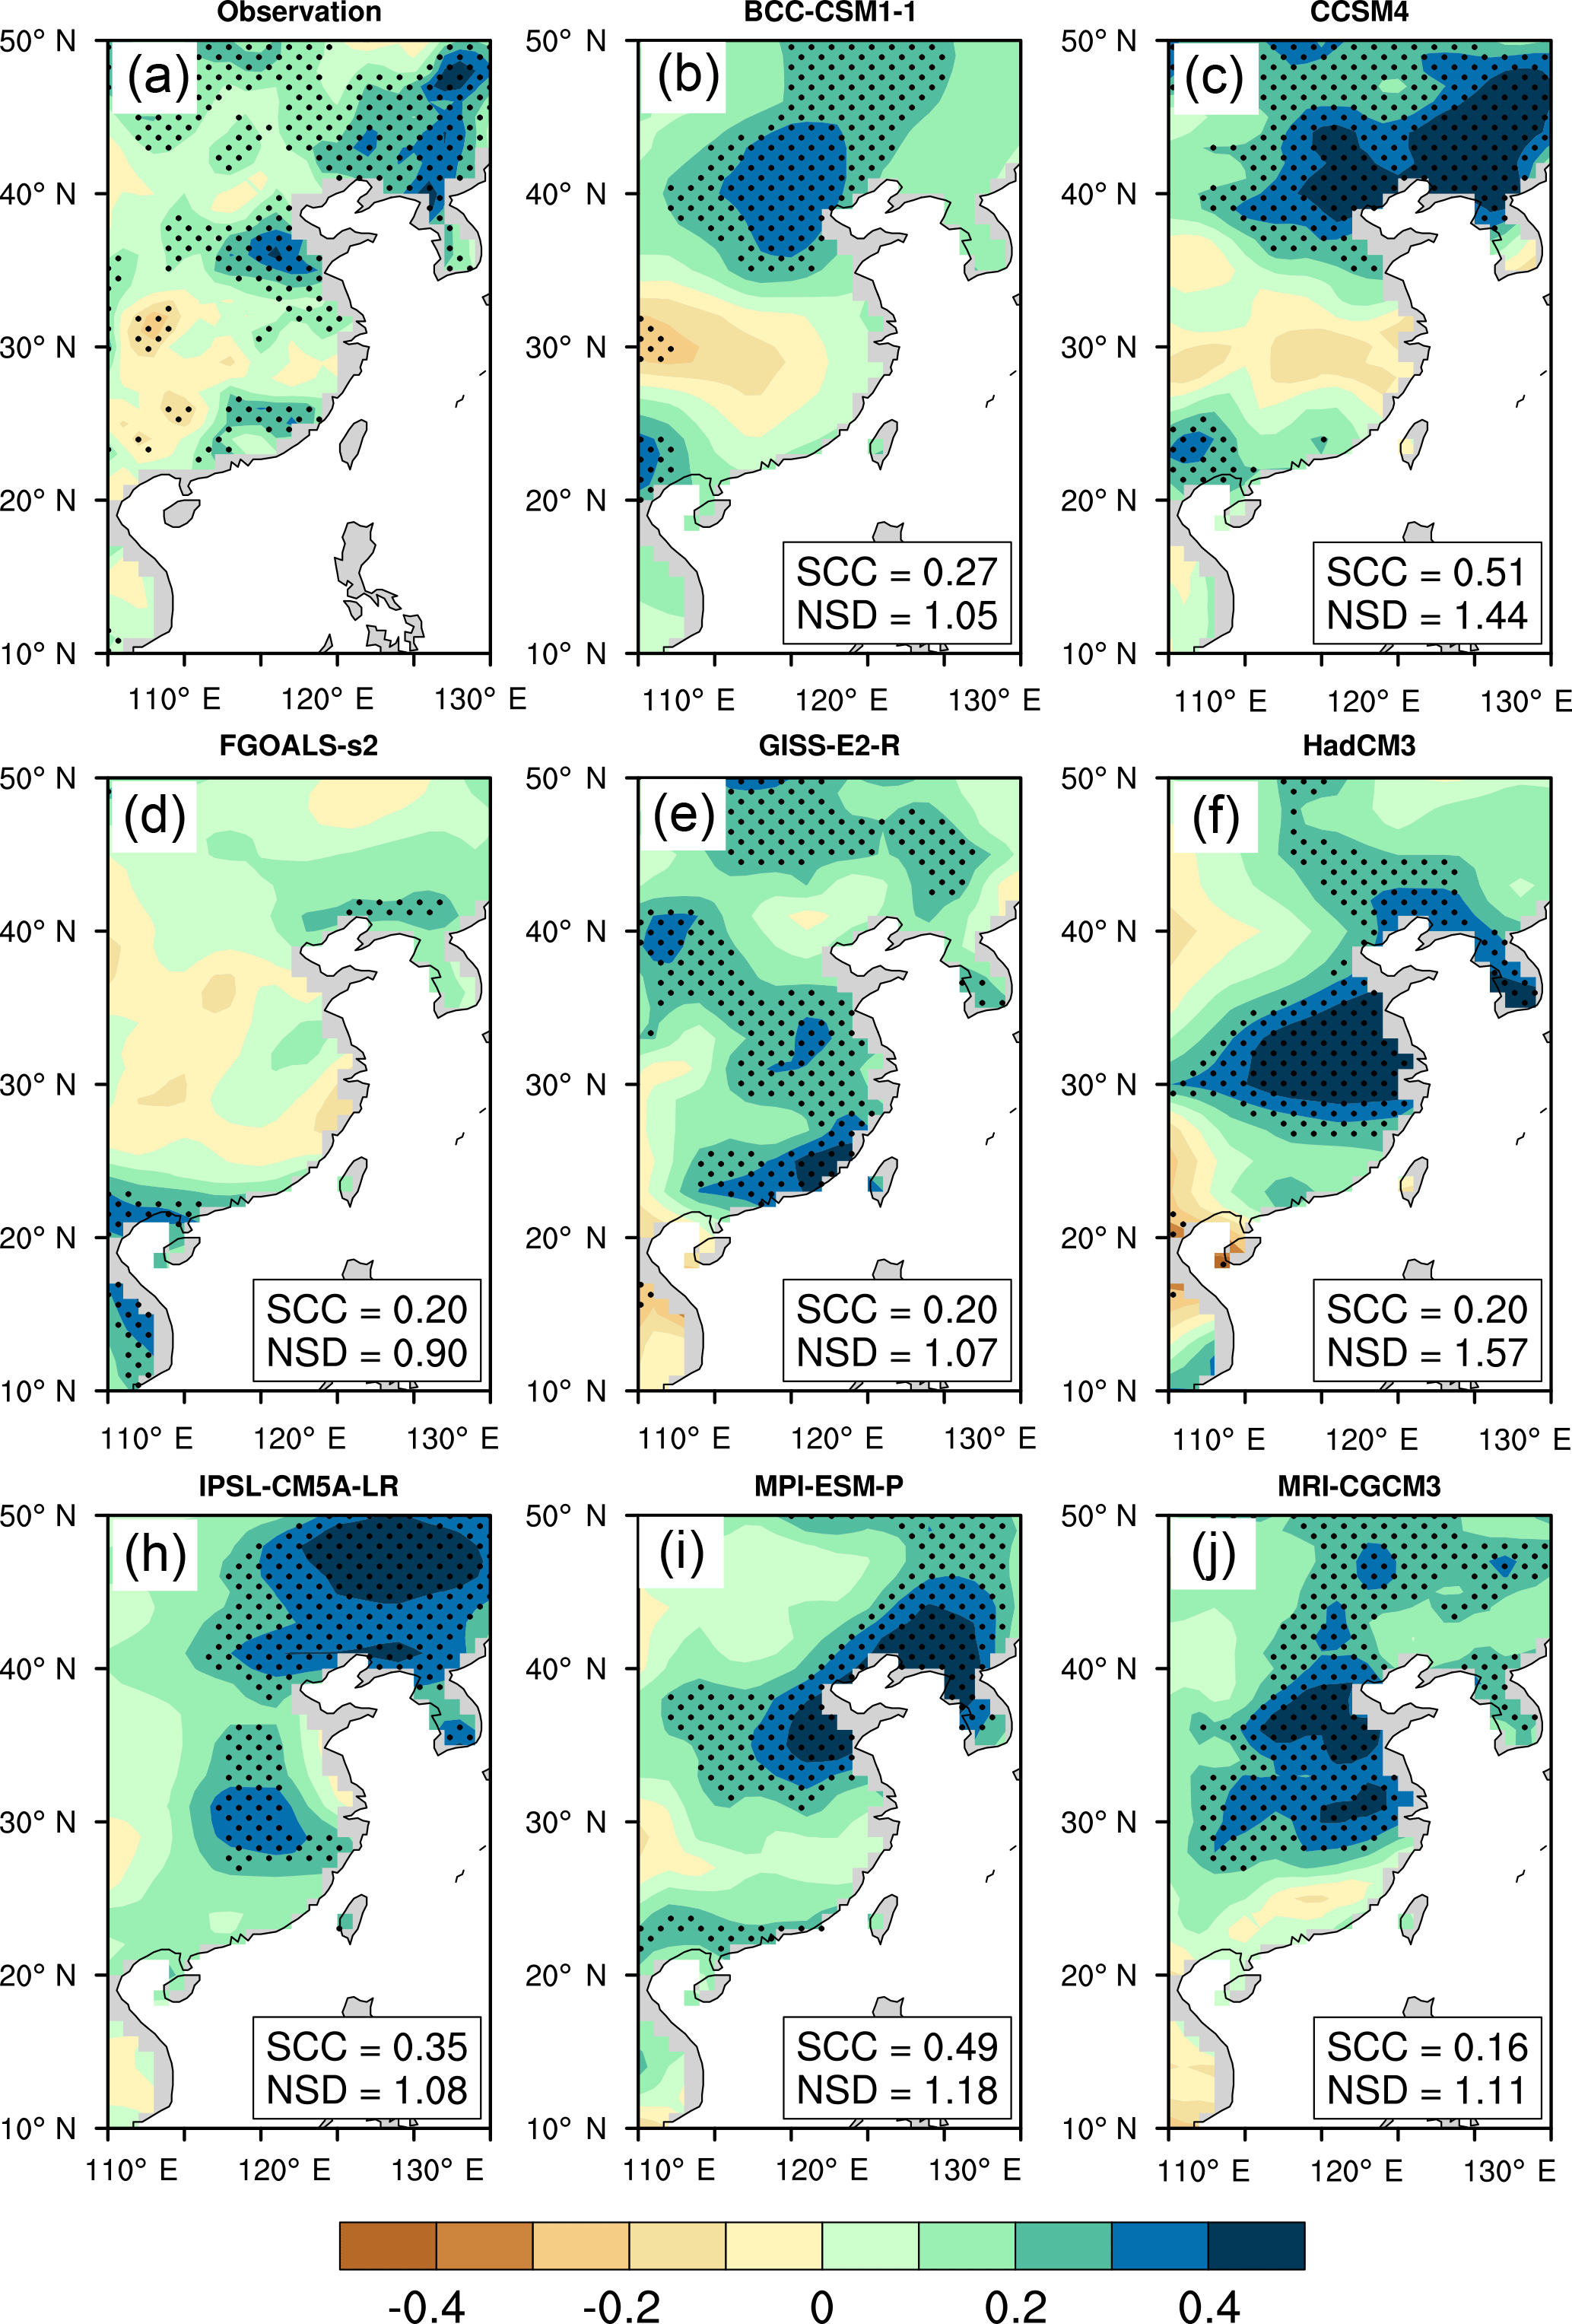
Figure 4Distribution of the correlation coefficients between the EASM strength and summer precipitation over East Asia in (a) observations (1948–2000 AD) and (b–j) PMIP3 historical experiments (1901–2000 AD), with spatial correlation coefficients (SCCs) and normalized standard deviations (NSDs) between models and observations shown in bottom right corner. The observed EASM–precipitation relationship is calculated with NCEP/NCAR reanalysis (Kalnay et al., 1996) and the Climate Research Unit TS3.22 monthly dataset (Harris et al., 2014). Areas passing the 95 % significance test are dotted.
To summarize, although amplitude and spatial changes in the EASM and precipitation vary largely among the PMIP3 models in the last millennium, the majority of these models indicate a strengthened EASM and enhanced summer precipitation over eastern China during the MCA relative to the LIA. Hence, from the perspective of PMIP3 simulations, using the precipitation-/humidity-relevant proxies is convincing to indicate the EASM changes between the MCA and LIA.
In this section, we discuss whether the EASM–precipitation relationship (i.e., enhanced summer precipitation over eastern China with a stronger EASM) maintained throughout the last millennium; that is, we discuss the stability of the EASM–precipitation relationship. After evaluating the EASM strength in the PMIP3 models, we further assessed their performance in reproducing the modern EASM–precipitation relationship (Fig. 4). The observations show that a strengthened EASM brings sufficient moisture from adjacent oceans and forms abundant summer precipitation over eastern China, especially in the middle to high latitude regions (Fig. 4a). The spatial distribution of the correlation between the EASM strength and summer precipitation simulated by the PMIP3 models (with the exception of the FGOALS-s2) is roughly similar to the observed distribution, with spatial correlation coefficients ranging from 0.16 to 0.51 (all passing the 95 % significance test). FGOALS-s2 simulates no significant precipitation changes over eastern China in response to EASM strength changes and hence is eliminated from the following discussions. Eventually, we selected the remaining seven PMIP3 models to study the EASM–precipitation relationship over the last millennium.
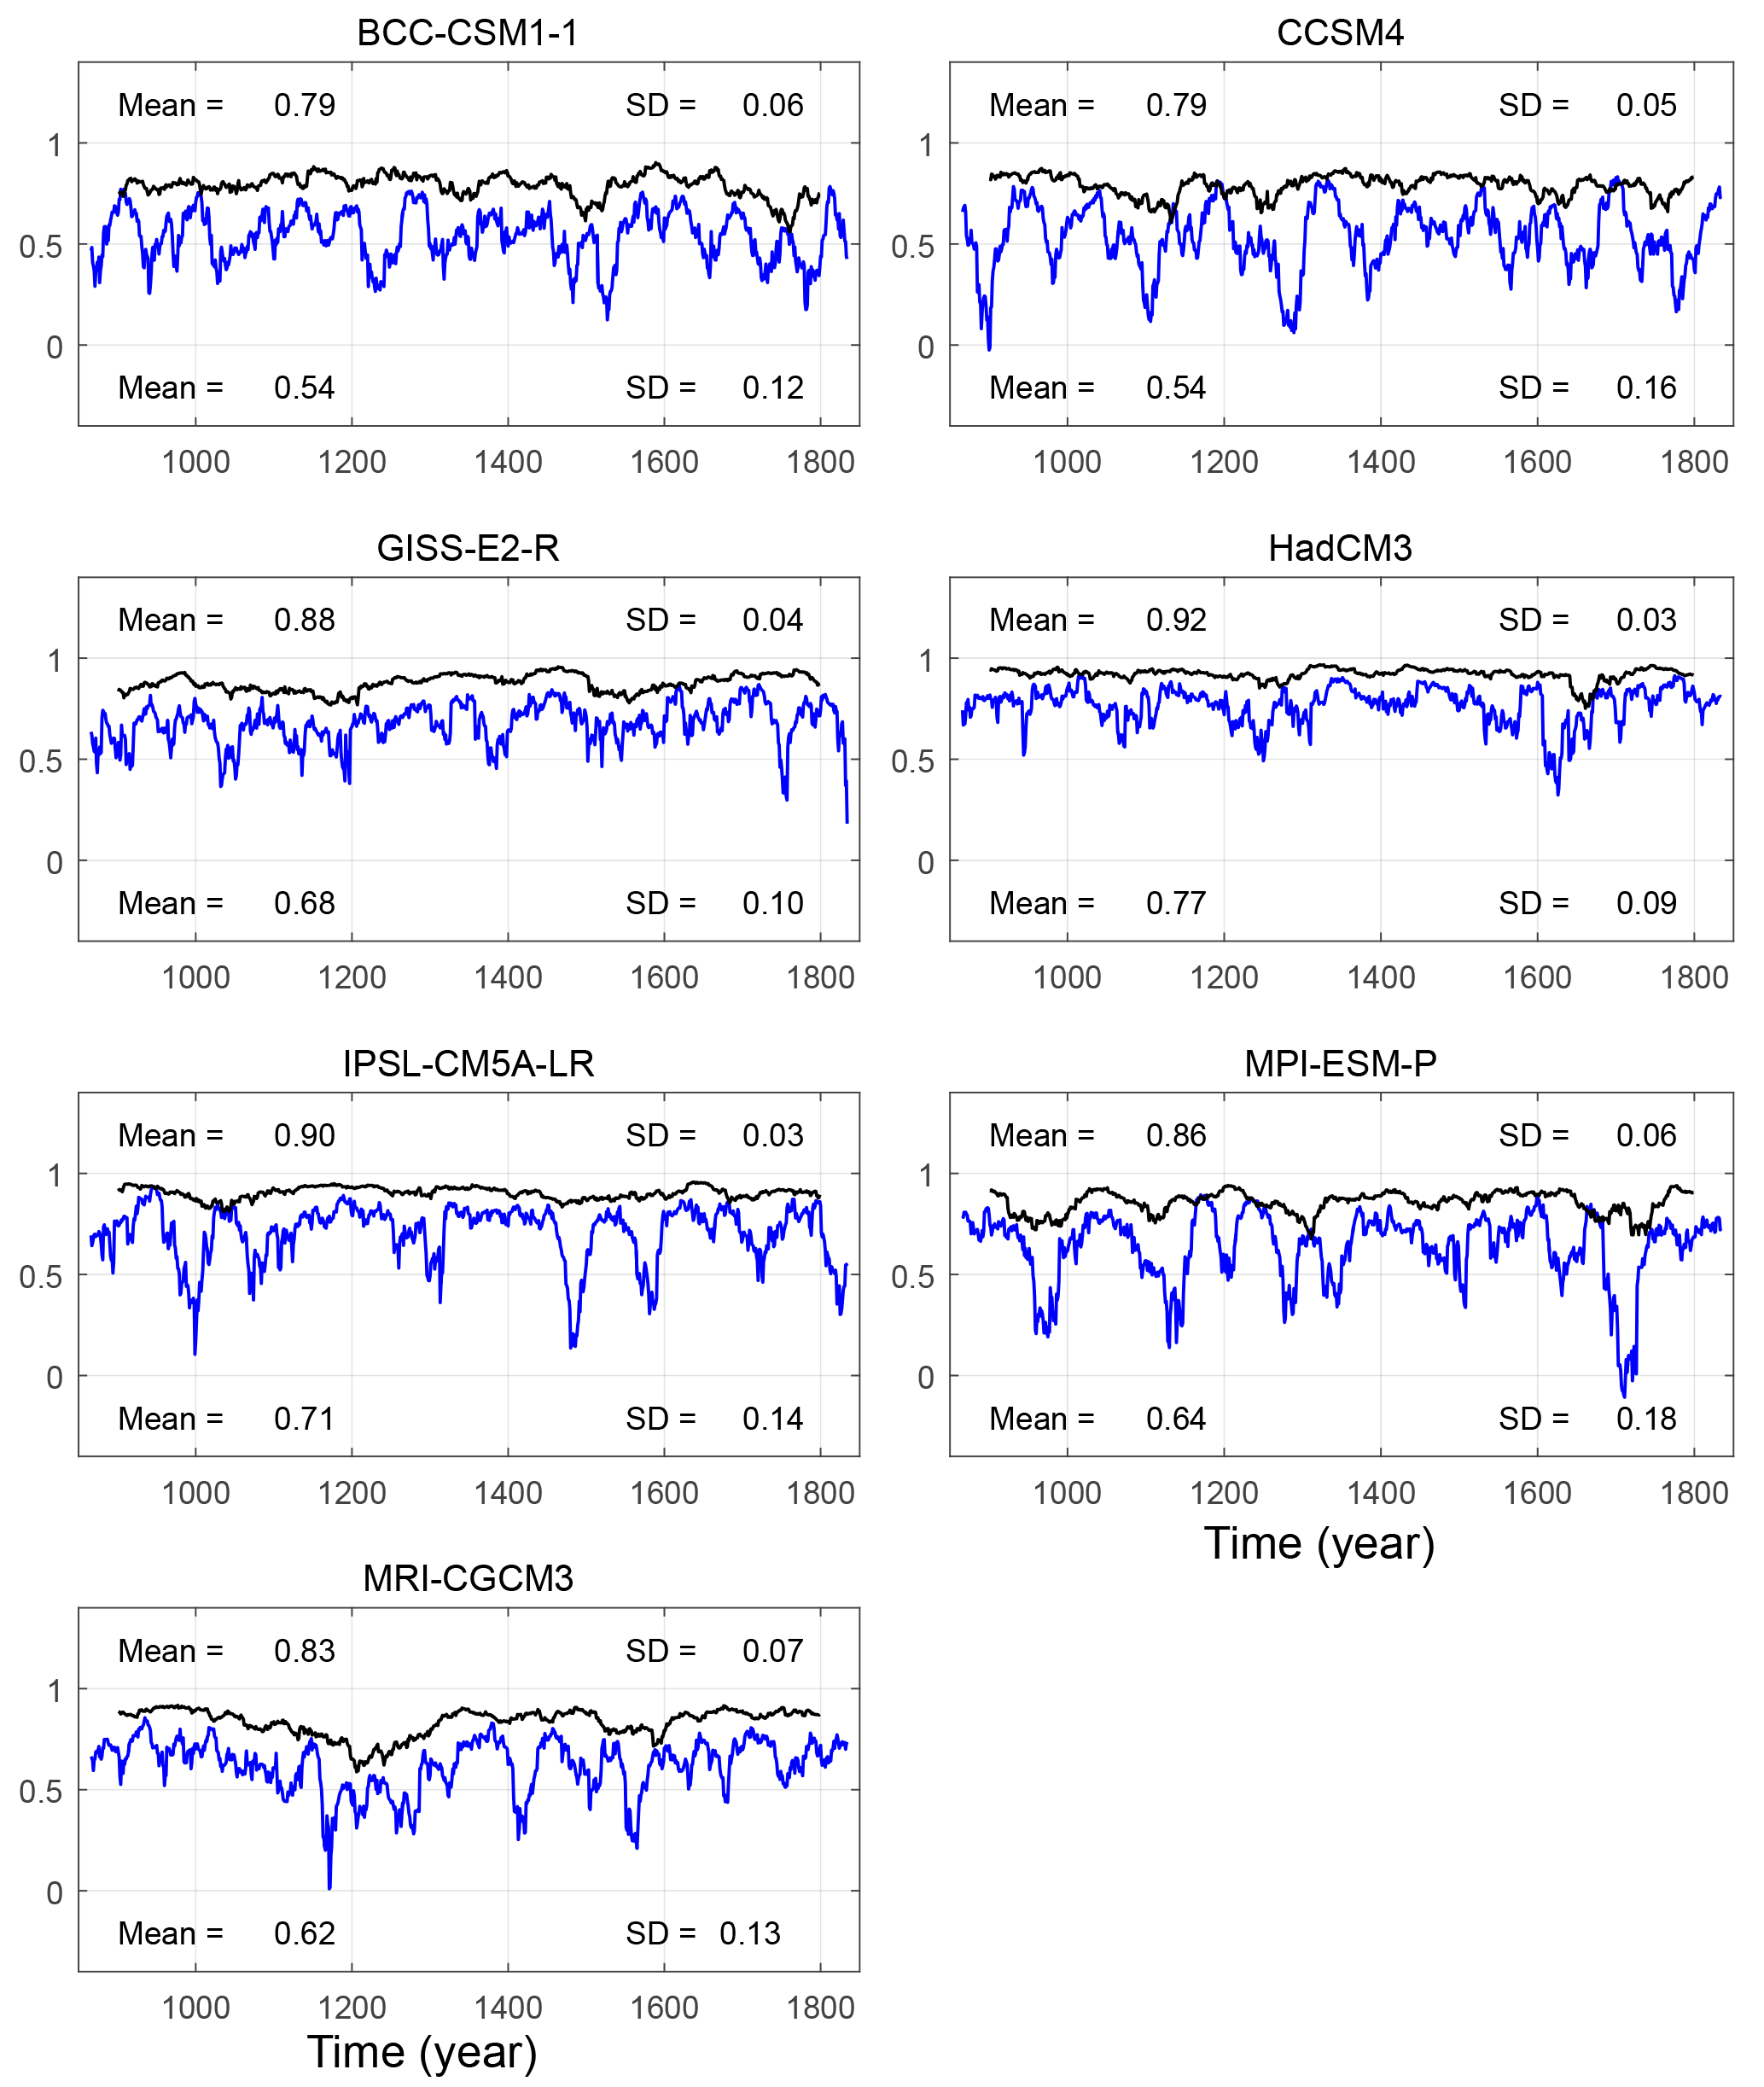
Figure 5RPCs of the EASM strength and summer precipitation over East Asia (10–50∘ N, 100–130∘ E) in the PMIP3 models. Blue (black) lines represent 31-year (101-year) RPCs, with averages and standard deviations shown below (above).
4.1 Stability of the EASM–precipitation relationship over the last millennium
We apply a 31-year and a 101-year running correlation to represent the EASM–precipitation relationship on a short timescale (i.e., multi-decadal) and long timescale (i.e., centennial timescale), respectively. On each timescale, we consider two aspects: (1) the stability of the spatial pattern of the correlation between the EASM strength and eastern China summer precipitation and (2) the stability of the relationship between the EASM strength and regionally averaged summer precipitation over the middle latitudes of eastern China (25–45∘ N, 105–120∘ E), where precipitation changes are more positively related to the EASM variation in the observation and PMIP3 models (Fig. 4).
First, we calculate the RPCs on different running window sizes to represent the spatial stability of the EASM–precipitation relationship on each timescale. As shown in Fig. 5, on a multi-decadal timescale, time-averaged RPCs vary from 0.54 (BCC-CSM1-1 and CCSM4) and 0.77 (HadCM3) and pass the 95 % significance test in the PMIP3 simulations. However, the RPCs show large fluctuations in almost all of the PMIP3 models and even fall to near zero, with standard deviations ranging from 0.09 (HadCM3) to 0.18 (MPI-ESM-P) over the last millennium. The RPCs in the GISS-E2-R and HadCM3 simulations are relatively more stable than in other models. This result indicates that the EASM–precipitation relationship may change over time on a multi-decadal timescale (e.g., Fig. S1 in the Supplement), which potentially reduces the reliability of precipitation-relevant proxies located in eastern China in representing the EASM strength on a short timescale. Moreover, there are no coherent time intervals for high and low RPCs among the PMIP3 models, suggesting that the variability of the EASM–precipitation relationship may be not induced by external forcings. Nevertheless, on a centennial timescale, RPCs are more stable than those on a multi-decadal timescale in all cases, with averages larger than 0.79 and standard deviations smaller than 0.07 among individual PMIP3 models. Such a stable EASM–precipitation relationship gives us confidence in reconstructing the centennial EASM records with precipitation-relevant proxies.
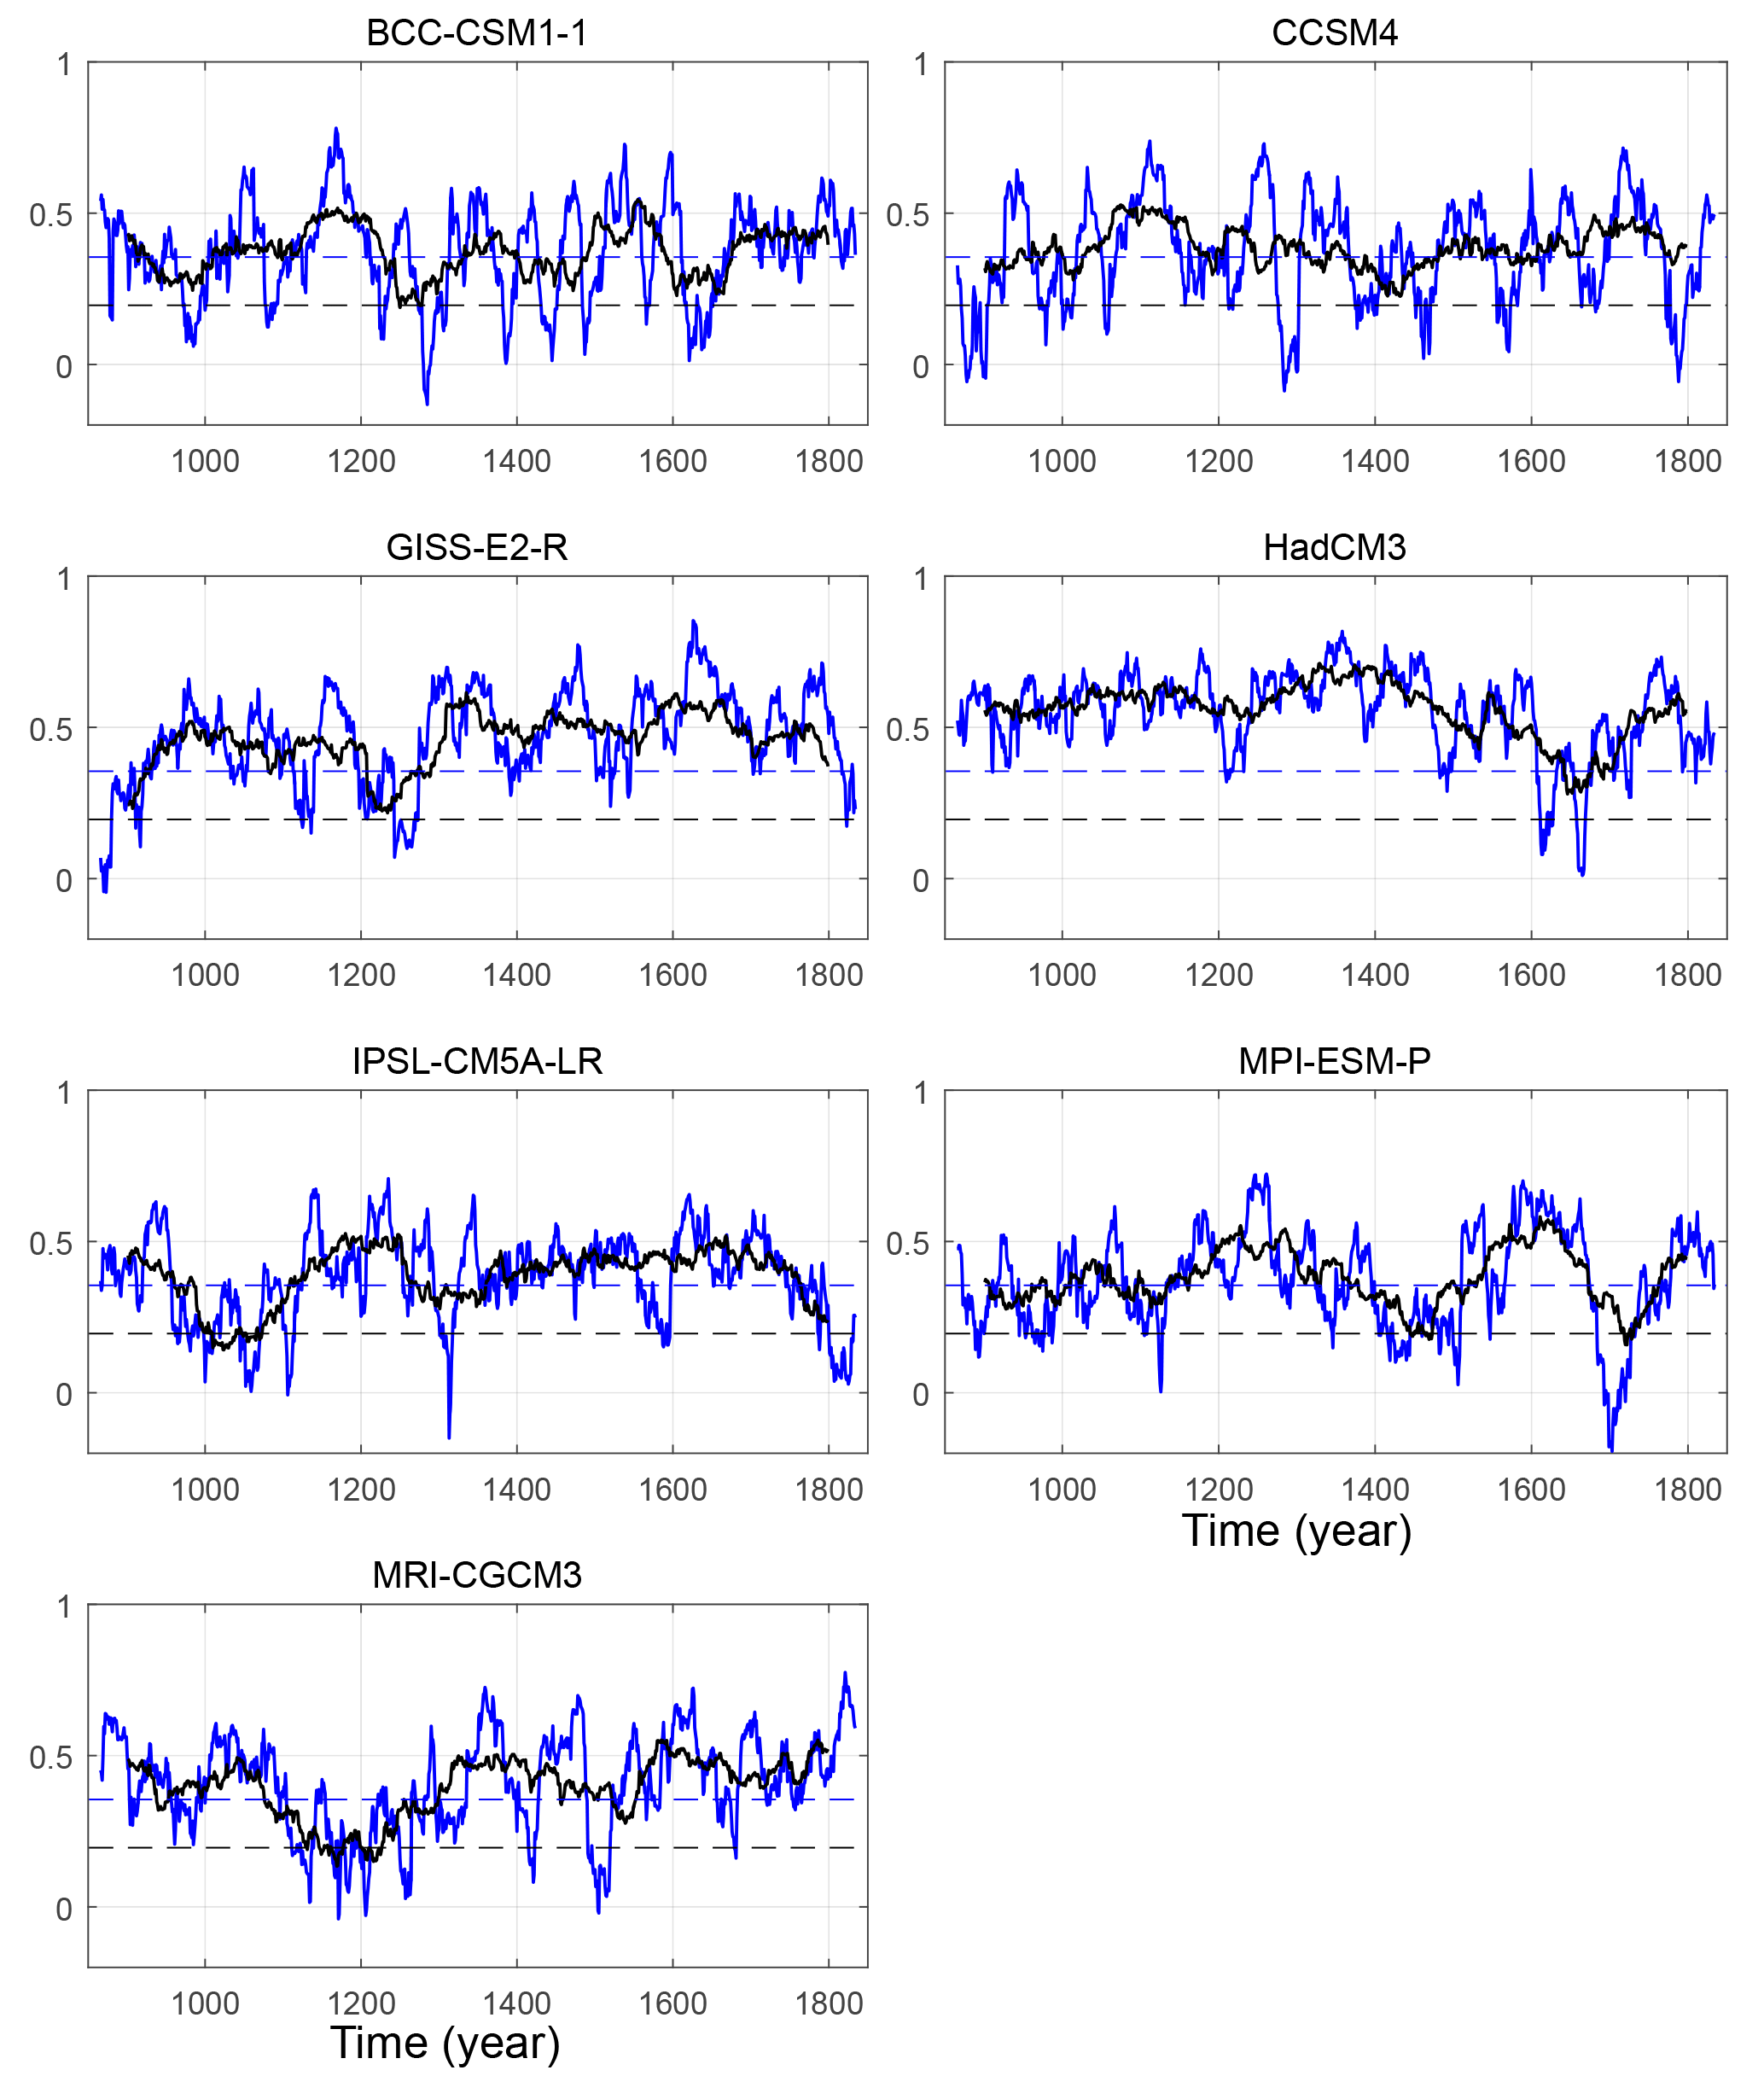
Figure 6Running correlations (RCs) between the EASM strength and regionally averaged summer precipitation over eastern China (25–45∘ N, 105–120∘ E). Blue (black) solid lines represent the 31-year (101-year) RCs, with upper blue (lower black) dashed lines shown as 95 % significance test values.
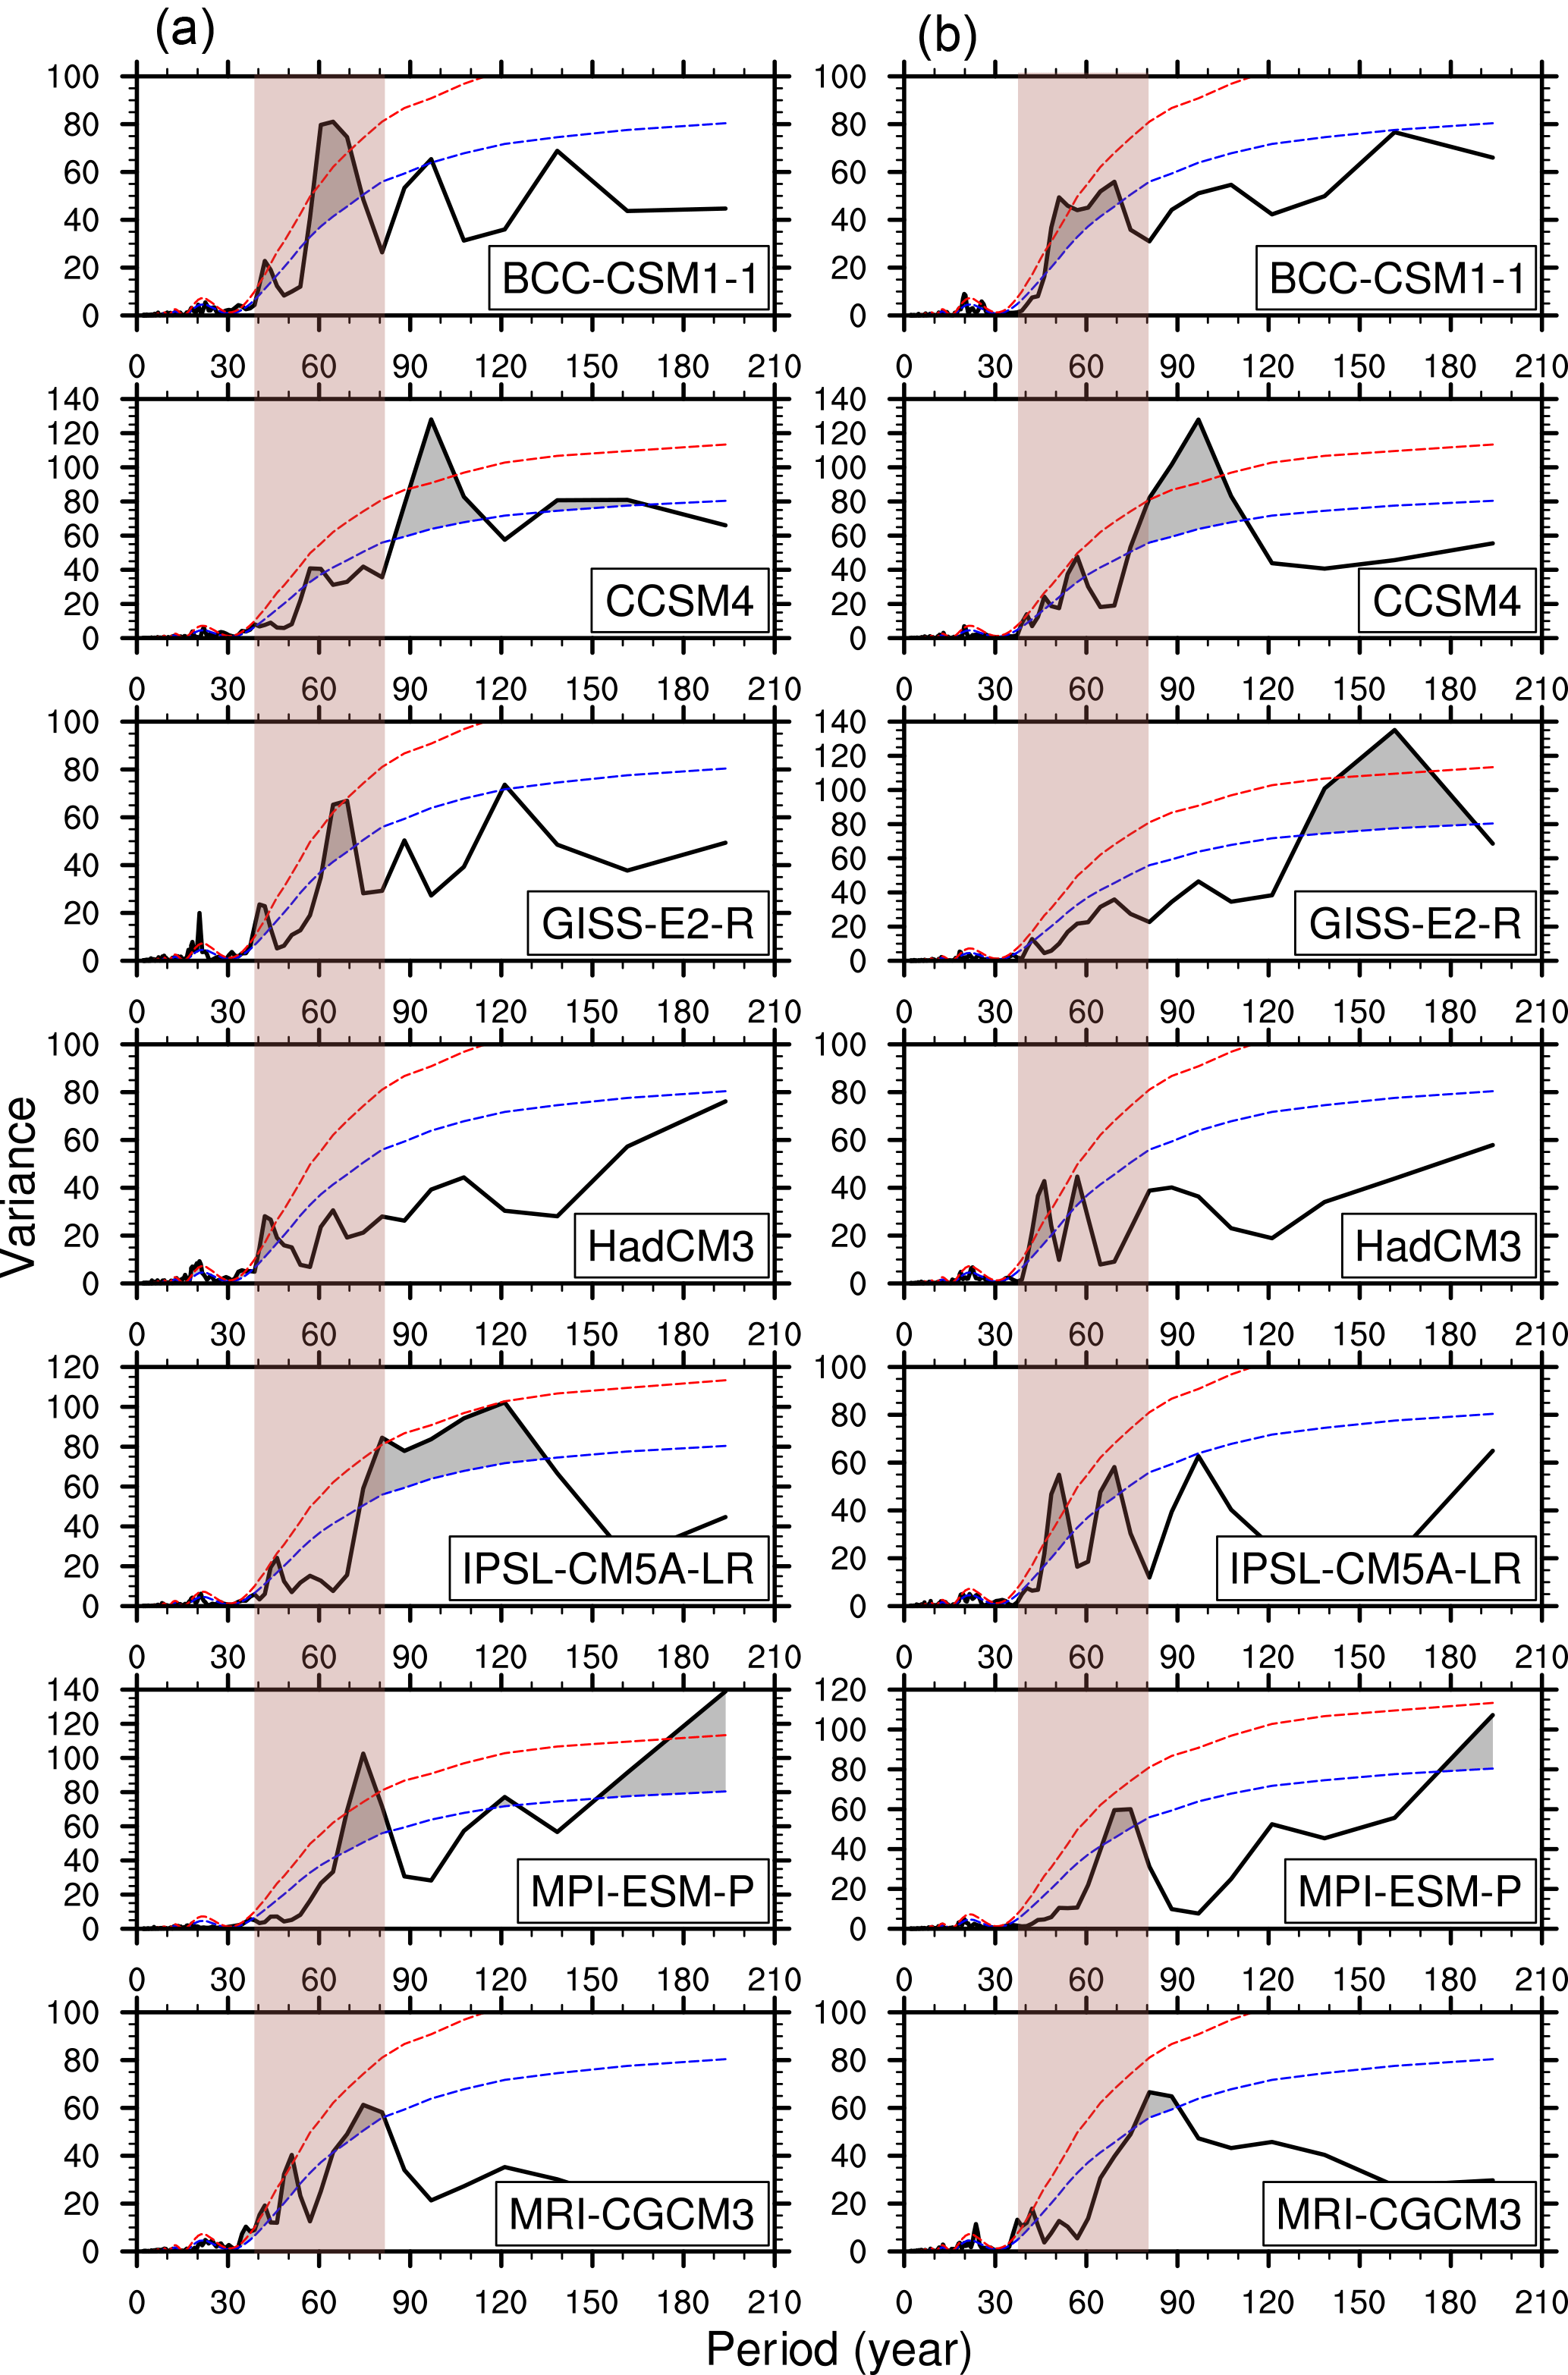
Figure 7Power spectrum of 31-year RPCs (a) and RCs (b) in the PMIP3 models. Red (blue) dashed lines represent the 95 % (90 %) significance level estimated from 10 000 Monte Carlo simulations. Spectra passing the 90 % significance test are shaded in gray. The periodicity from the 40- to 80-year period is marked with the brown vertical panels.
The aforementioned results are further confirmed by running correlations (RCs) between the EASM strength and regionally averaged summer precipitation over the middle latitudes of eastern China (Fig. 6). On a multi-decadal timescale, the RCs are highly time dependent. Although the time-averaged RCs pass the 95 % significance test, they are insignificant and even negative for many time intervals over the last millennium in the majority of the PMIP3 models. The results of the GISS-E2-R and HadCM3 simulations show relatively more stable RCs, similar to those revealed by the RPCs. On a centennial timescale, the RCs pass the significance test for almost the entire period, indicating a more stable and closer EASM–precipitation relationship.
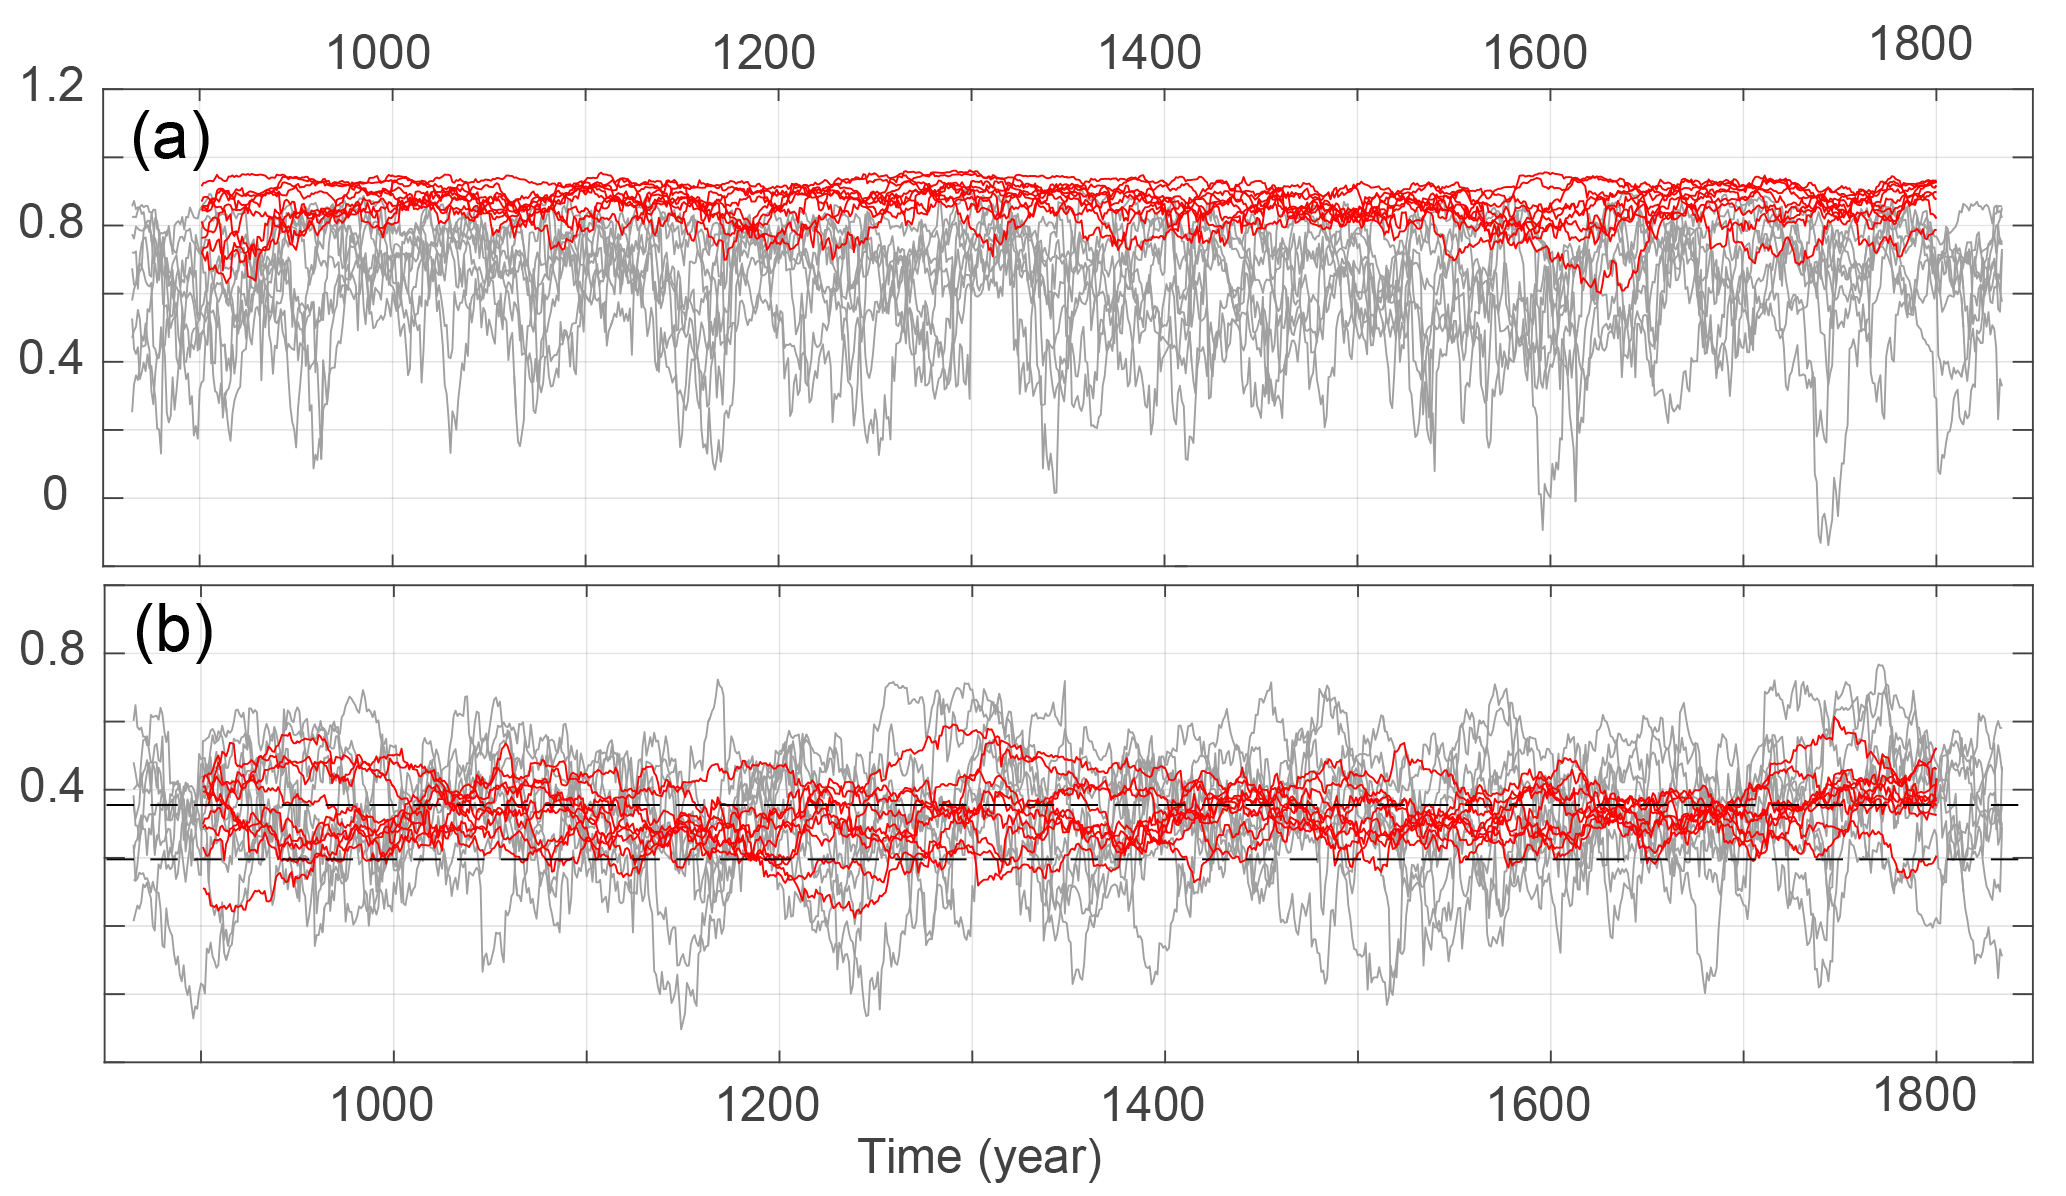
Figure 8(a) RPCs and (b) RCs in nine CESM-LME full-forcing experiments. Gray (red) lines represent 31-year (101-year) RPCs/RCs. Dashed lines in panel (b) represent the 95 % significance test for 31-year (upper) and 101-year (lower) RCs. Note that the RCs in panel (b) are calculated between the EASM strength and regionally averaged (35–45∘ N, 105–120∘ E) summer precipitation.
4.2 Reasons for fluctuations in the multi-decadal EASM–precipitation relationship
We found that the unstable short-timescale EASM–precipitation relationship has obvious periodicity. The power spectrum results (Fig. 7) indicate that both the 31-year RPCs and RCs show a multi-decadal periodicity (∼ 40–80 years) in the majority of the PMIP3 last millennium simulations. This periodicity might be attributed, to a certain extent, to the multi-decadal variability in summer precipitation over eastern China, which exhibits an intense multi-decadal periodicity in the PMIP3 models (Shi et al., 2016a). Multi-decadal variability is also notable in precipitation/humidity records located over eastern China (e.g., Zhu et al., 2002; Zheng et al., 2006; Li et al., 2011), which supports our inferences from the PMIP3 simulations.
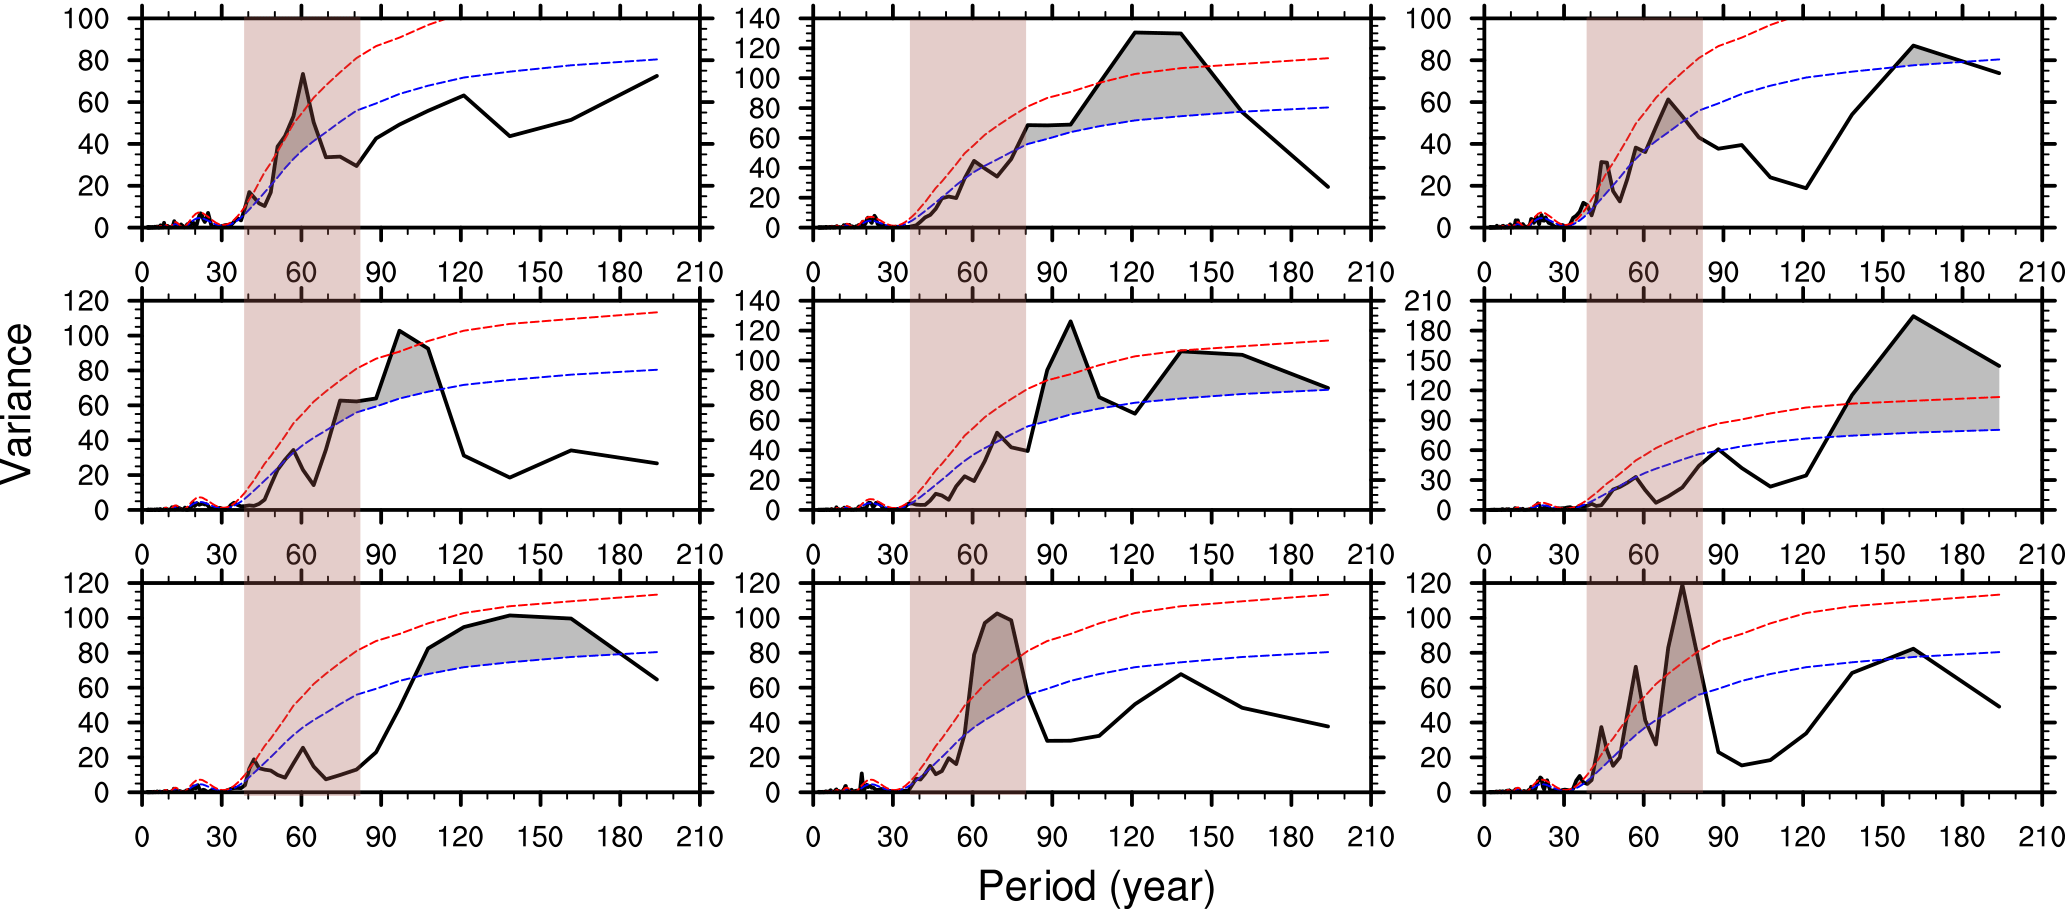
We further use the CESM-LME experiments to explore potential drivers for fluctuations in the multi-decadal EASM–precipitation relationship. Similar to most PMIP3 models, CESM broadly reproduces the observed EASM and EASM–precipitation relationship, especially over north China (Fig. S2). Most CESM-LME simulations, as well as their ensemble mean, show in-phase EASM and precipitation changes between the MCA and LIA (Fig. S3), supporting the positive EASM–precipitation relationship on a multi-centennial timescale. The CESM-LME full-forcing experiments indicate that the EASM–precipitation relationship (expressed by the RCs between the EASM strength and summer precipitation over the middle latitudes of eastern China) is stable on the 101-year running correlation width and unstable on the 31-year running correlation window (Fig. 8), which has a multi-decadal periodicity in most ensemble members and a 120–150-year cycle in several members (Fig. 9). However, these two main periodicities are greatly weakened in the MEM result (Fig. S4), which indicates that the internal variability of climate system, rather than the external forcings, may be responsible for the oscillation of short-timescale EASM–precipitation relationship.
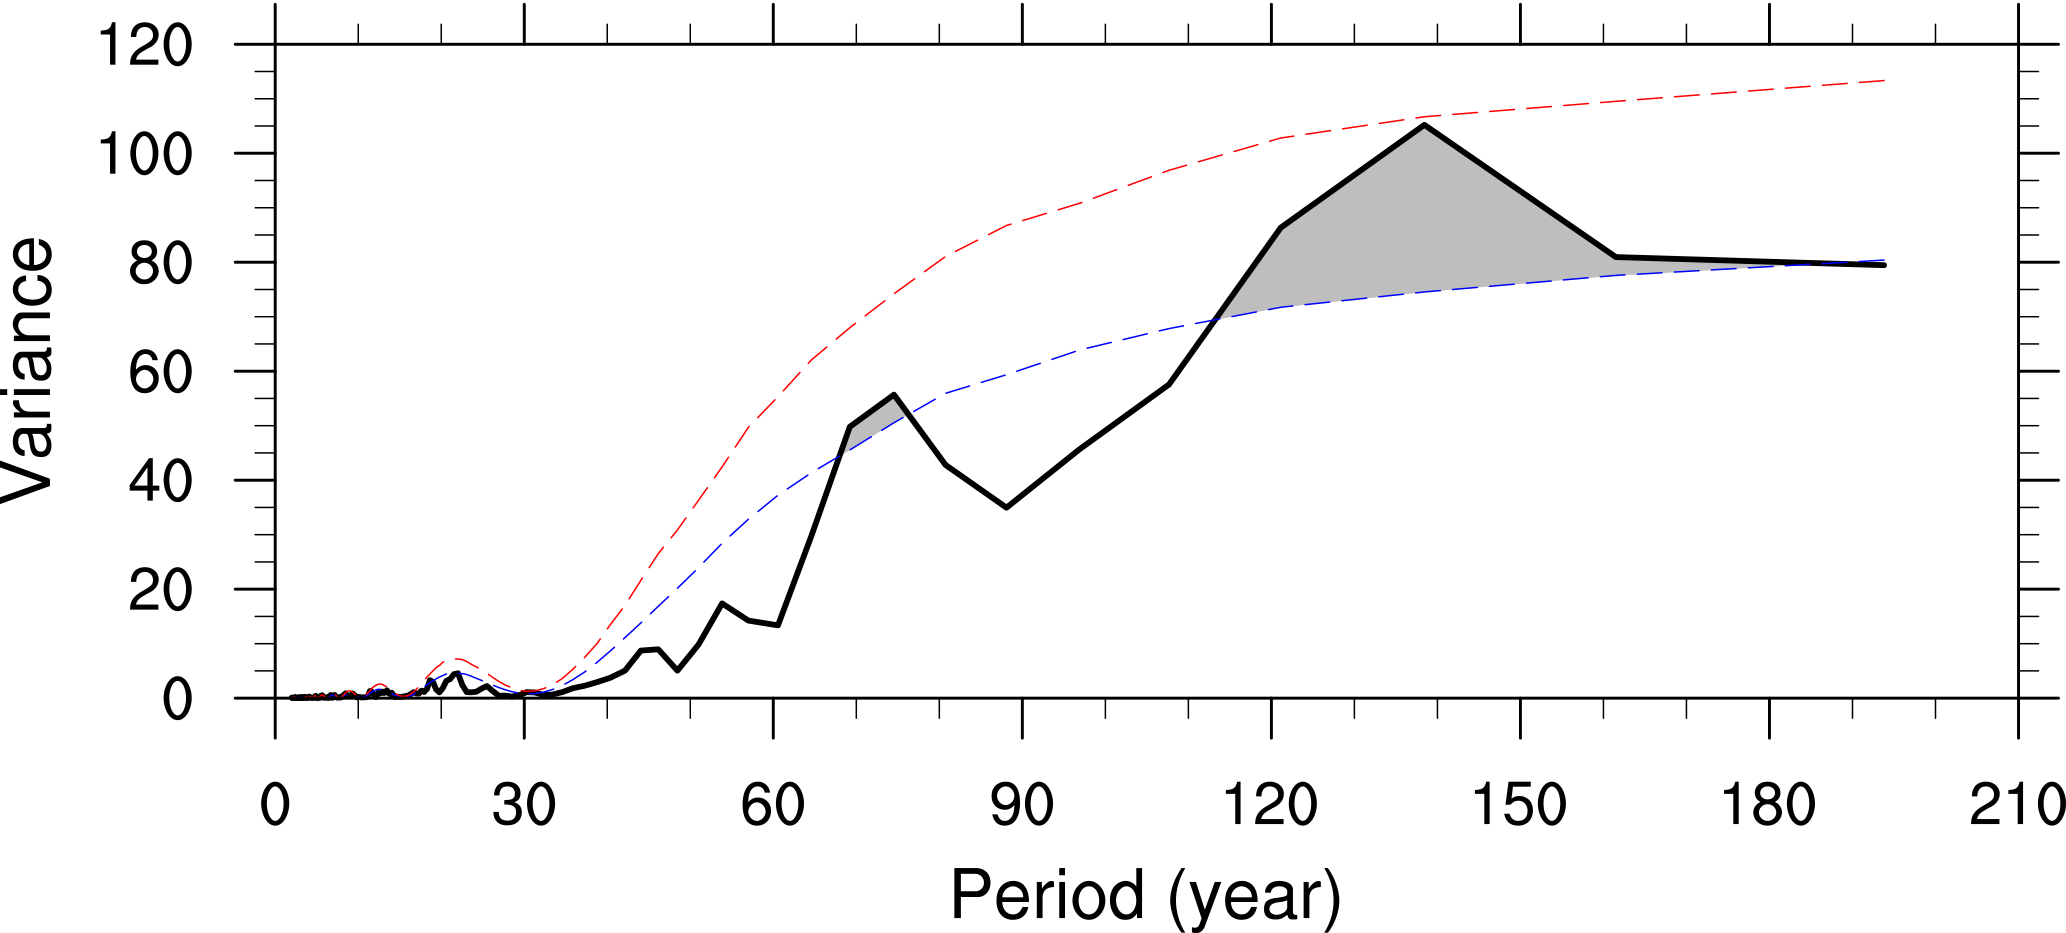
Figure 10Same as Fig. 9 but for 31-year RCs in the CESM-LME control experiments. The dashed line represents 90 % significance test values.
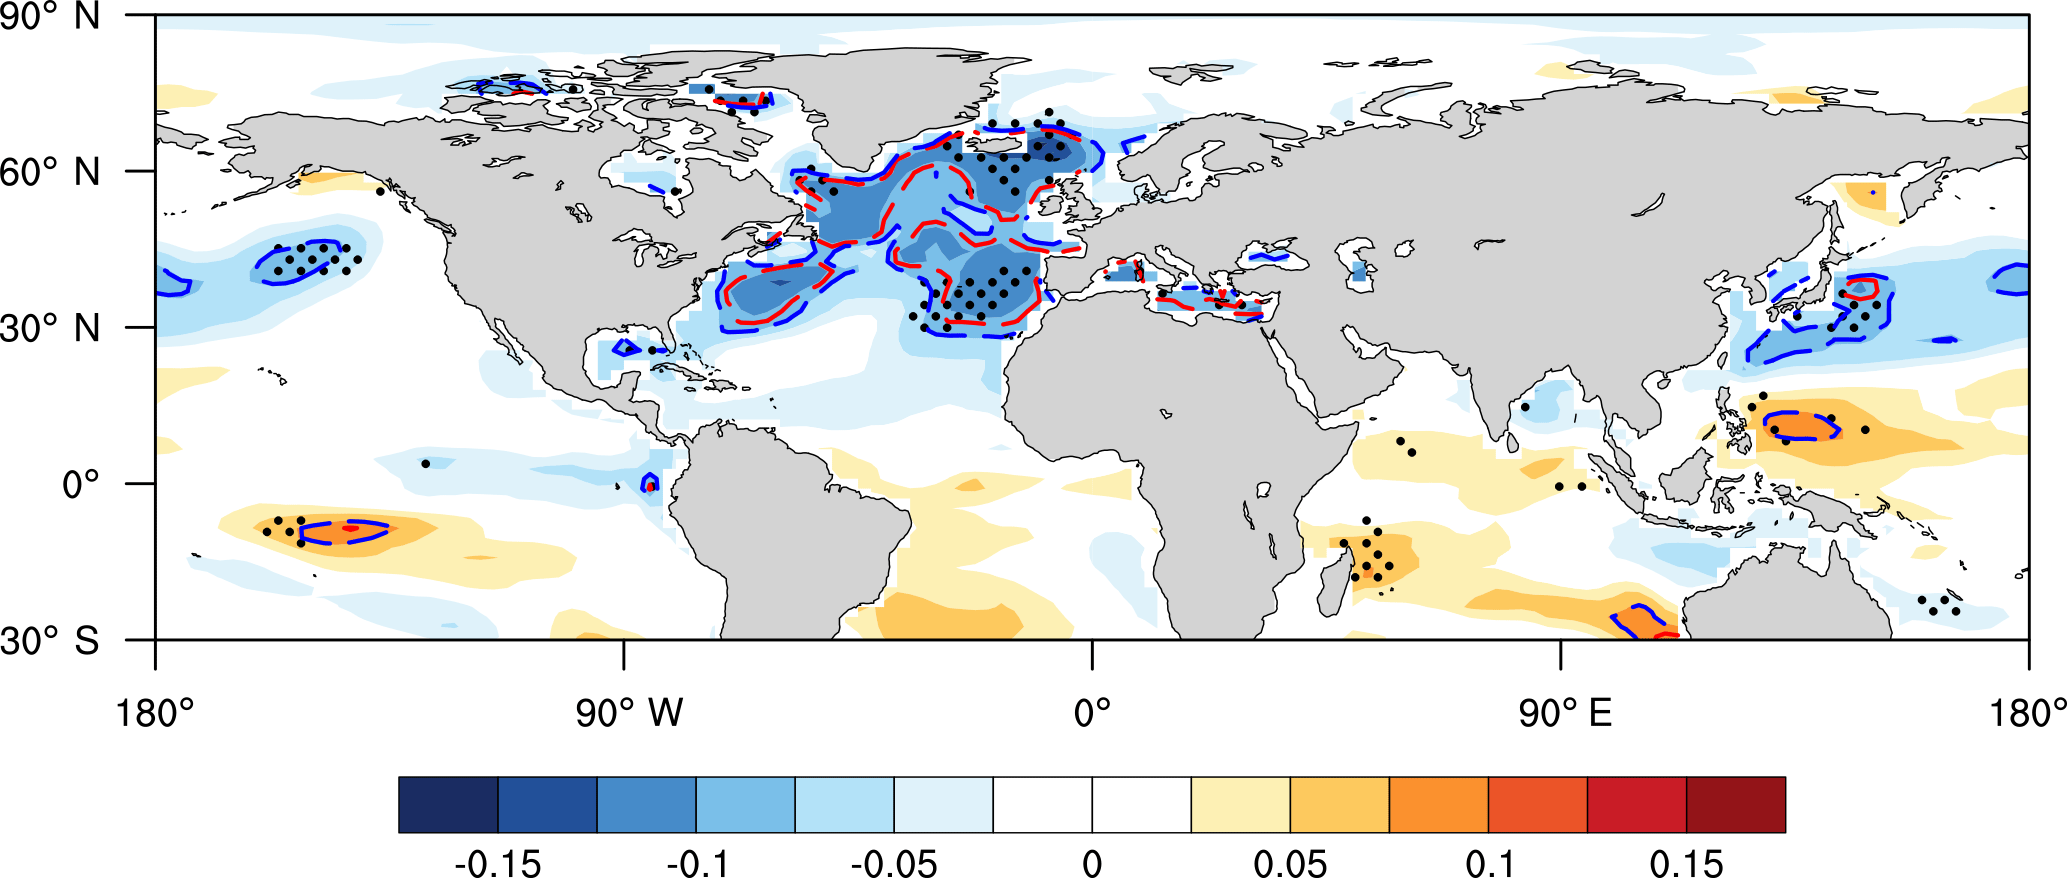
Figure 11MEM of correlation coefficients between 31-year RCs and 31-year running averaged summer sea surface temperature (SST) anomalies among CESM-LME full-forcing experiments. The red (blue) dashed lines represent the 95 % (90 %) significance level estimated from 10 000 Monte Carlo simulations. Dotted areas show that at least seven of nine ensemble members have the same sign with MEM result.
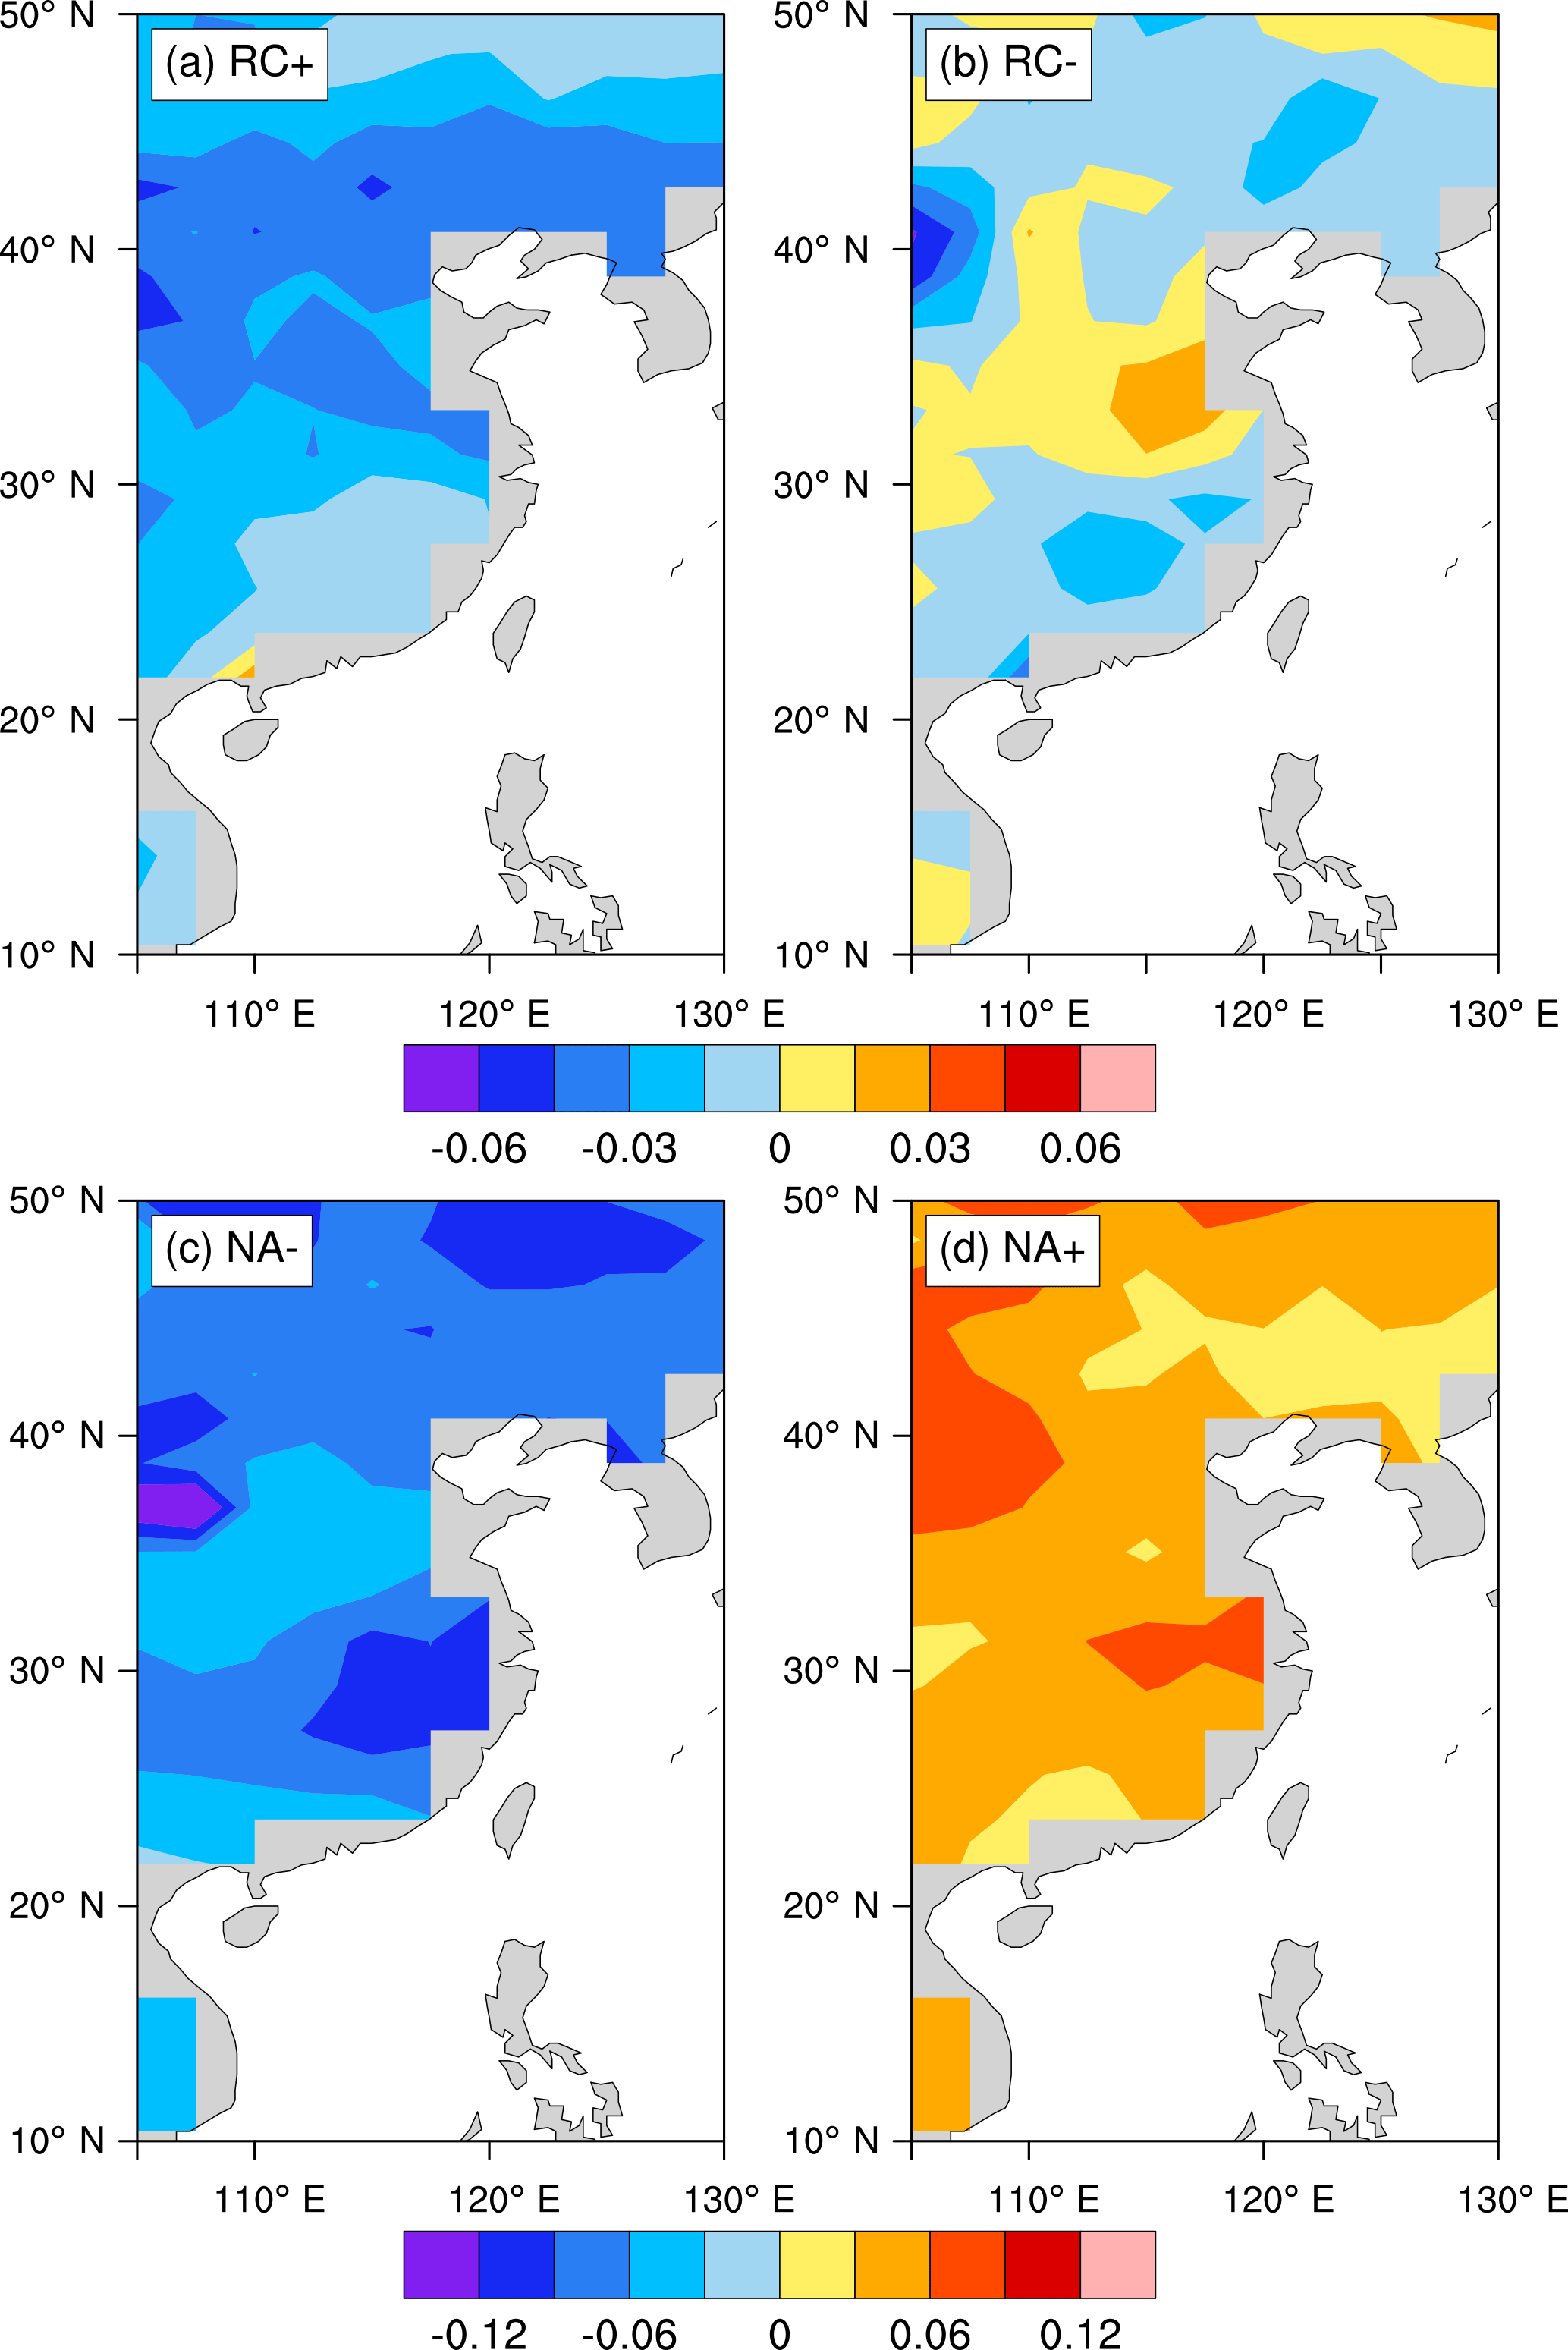
Figure 12The summer surface temperature anomalies during the (a) high (RC+) and (b) low (RC-) EASM–precipitation relationship intervals in the CESM-LME full-forcing experiments; panels (c) and (d) are the same as (a) and (b) but for the cold (NA-) and warm (NA+) phases of summer SSTs over the North Atlantic, respectively. The RC+ (NA+) and RC− (NA−) are selected for the periods that the EASM–precipitation relationship (summer SSTs over the North Atlantic) exceeds its 1.2 and −1.2 standard deviations, respectively (units: ∘C).
The CESM sensitivity experiments results further demonstrate the speculation. The CESM-LME control experiment, in which no external forcing is applied, shows an approximately 70-year periodicity along with a 120- to 150-year periodicity in the EASM–precipitation relationship (Fig. 10), which corresponds to two main cycles of EASM–precipitation relationship in the full-forcing experiments. Meanwhile, the multi-decadal periodicity appears in most CESM-LME single-forcing experiments (Fig. S5), further emphasizing the crucial role of internal variability in forming this periodicity. More importantly, among the same single-forcing experiments, there are no common periods corresponding to the applied external forcing. For example, the EASM–precipitation relationships do not consistently exhibit the solar periods, such as quasi-88 or quasi-120 years, in four solar-forcing experiments (Fig. S5a–d). This result suggests that the external forcings are unimportant for the unstable short-timescale EASM–precipitation relationship based on CESM-LME simulations. Meanwhile, the lack of the 120- to 150-year periodicity in several full-forcing and single-forcing runs possibly implicates that this periodicity is sensitive to the initial condition.
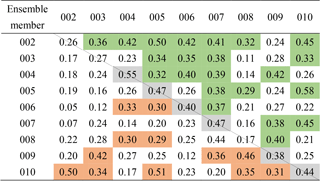
Table 2Pairwise correlation coefficients between the 31-year running averaged summer SSTs over the North Atlantic (NASST) among CESM-LME full-forcing experiments (upper right portion). The lower left portion is the same but for the SSTs over the North Pacific (NPSST). The numbers along the diagonal are the correlation coefficients between the NASST and NPSST in individual members. The North Atlantic and North Pacific regions are selected for 30–70∘ N, 80∘ W–0∘ and 30–65∘ N, 160∘ E–140∘ W, respectively. Colored grids represent the values that passed the 95 % significance level.
We propose a possible driver for the unstable EASM–precipitation relationship according to the CESM-LME simulations. Figure 11 shows that in majority of the CESM-LME full-forcing experiments, the EASM–precipitation relationship tends to be closer when the sea surface temperature (SST) over the North Atlantic is colder on a multi-decadal timescale, resembling a negative Atlantic Multi-decadal Oscillation (AMO) pattern. This implies that the alternation of the weak–strong EASM–precipitation relationship may be partially related to the phase changes of AMO. It is noted that the formation of precipitation over eastern China is not only dependent on water vapor transported by the EASM but also related to the local thermal condition. When the temperature gets lower, the moist air gets easier to saturate if the moisture is constant (Fig. 12a). Previous studies have shown that the AMO could influence the temperature over East Asia positively (Lu et al., 2006; Wang et al., 2013). During the cold phase of the SST anomalies over the North Atlantic, the temperature over East Asia tends to be colder (Fig. 12d). As the EASM strengthens, the moisture transported to monsoon region increases, which is propitious to improve precipitation. Meanwhile, the lower-than-normal temperature condition over East Asia is helpful to the saturation of the air and thus promotes the formation of precipitation, leading to a more robust EASM–precipitation relationship. However, temperature anomalies during periods of a weak EASM–precipitation relationship (Fig. 12b) are not exactly opposite of those when the EASM–precipitation relationship is closer (Fig. 12a), suggesting an asymmetry effect of the local thermal condition on the formation of precipitation. By contrast, the SSTs over the North Atlantic have a nearly linear influence on the East Asian temperature (Fig. 12c–d), further demonstrating its complicated roles played in the EASM–precipitation relationship.
Although it is not apparent in the CESM-LME simulations, another noteworthy basin-scale SST forcing is the Pacific Decadal Oscillation (PDO), which has a similar multi-decadal periodicity to that of the AMO. The PDO, as well as its combination with AMO, also plays important roles in modulating summer circulation and temperature over eastern China on a multi-decadal timescale (e.g., Lu et al., 2006; Yu et al., 2015; Lin et al., 2016; Shi et al., 2016b; Yang et al., 2017). We notice that the SST variations over the North Atlantic are more consistent among individual ensemble members (Table 2), conformed with a recently reconstruction of the AMO (Wang et al., 2017). Nevertheless, the SST variations over the North Pacific vary largely, implying that the SSTs over the North Pacific are more sensitive to the initial conditions than those over the North Atlantic in the CESM-LME simulations. It results in the complex phase combinations of the AMO and PDO among the ensemble members (Table 2). Despite AMO being a common reason for the unstable EASM–precipitation relationship, the PDO could enhance or reduce their connection in varying ways and degrees among different ensemble members, which could explain the wide-ranged multi-decadal cycles of the RCs (extending from ∼ 40 to 80 years). Nevertheless, given the short time span of the observations and weak ability of existing climate models to simulate the internal variability of the climate system, recognitions of the physical processes remain insufficient.
Overall, simulations of the last millennium generally reveal that the stability of the EASM–precipitation relationship depends on the timescale. On a shorter timescale (at most the multi-decadal timescale), precipitation over eastern China is not always significantly influenced by the EASM strength, which may be due to the internal variability of the climate system. In contrast, on a longer timescale, the EASM–precipitation relationship is much more stable.
In this study, the EASM–precipitation relationship is examined in simulations of PMIP3 and CESM-LME over the last millennium (∼ 850–1850 AD). CSIRO-Mk3L-1-2 fails to capture the climatological EASM, and FGOALS-s2 shows a weak performance in reproducing the observed EASM–precipitation relationship. After ruling out these two models, the ensemble of the remaining “better-performance” models shows that EASM strengthened during the MCA and weakened during the LIA, consistent with evidence from proxy data. The enhanced land–sea thermal contrast and weakened upper westerlies are the main causes for the EASM strength variation during the MCA relative to the LIA. Moreover, changes in summer precipitation over eastern China are positively related to EASM strength changes between the MCA and LIA.
However, we suggest that the EASM–precipitation relationship is timescale dependent based on the climate models. On a centennial timescale, eastern China summer precipitation is significantly and stably influenced by the EASM strength, in agreement with simulated EASM and precipitation changes between the MCA and LIA. By contrast, on a multi-decadal timescale, the EASM–precipitation relationship is non-stationary over the last millennium. Further investigations using CESM-LME control and single-forcing experiments suggest that the oscillation of multi-decadal EASM–precipitation relationship is an internally forced result but is not externally forced.
The uncertainties of our results likely arise from the following aspects. Foremost, the modern EASM–precipitation relationship is actually very complex, as there are many EASM indices and different patterns of the summer rain belt over eastern China. In this study, we mainly focus on the overall strength of EASM and its relationship to the entire amount of precipitation over eastern China. Another inevitable reason is the limited ability of models to reproduce the modern East Asian climate. We make use of as many climate models or ensembles as possible to minimize the potential deviation of individual models. In addition, PMIP3 simulations have robust signs in the climate anomalies between the MCA and LIA (Fig. 2), while the CESM-LME results vary largely (Fig. S3). The CESM simulations are driven by the same forcings and are only different in initial conditions, which means that the roles of external forcings are sensitive to initial conditions at least in the CESM-LME. It further implies that the conclusion based on the PMIP3 remains speculative, but it is difficult to validate in the present study. Therefore, more single model runs with different initial conditions should be analyzed to confirm the hypothesis in the future work.
Though uncertainties exist, this study investigates the timescale-dependent stability of the EASM–precipitation relationship, which may be meaningful for interpreting climatic information derived from humidity/precipitation proxies. It could be inferred from our analysis that the multi-decadal variability of EASM, which cannot be ignored in the last millennium, is hard to reconstruct with humidity/precipitation proxies, at least during periods with a weak EASM–precipitation relationship. In other words, no matter how high temporal resolution the proxies have, it is likely that they can only derive EASM variations on a centennial or longer timescale. The multi-decadal or shorter timescale components of proxy records may reflect local humidity changes, which provides a possible explanation for the discrepancies among proxies representing EASM variation on short timescales.
The PMIP3 last millennium simulation data can be obtained in the Program for Climate Model Diagnosis and Intercomparison (PCMDI; http://pcmdi9.llnl.gov) archives, and the CESM-LME data are available at http://www.cesm.ucar.edu/projects/community-projects/LME/data-sets.html.
The supplement related to this article is available online at: https://doi.org/10.5194/cp-14-577-2018-supplement.
The authors declare that they have no conflict of interest.
We acknowledge the climate modeling groups of the PMIP project and the
CESM-LME project for sharing their model output. We also thank the two
anonymous reviewers for their constructive suggestions, which improved this
paper substantially. This research was supported by the National Science
Foundation of China (grant nos. 41421004 and 41772179), the National Key
Research and Development Program of China (grant no. 2016YFA0600703) and the
Startup Foundation for Introducing Talent of NUIST (grant no. 2017r105), as
well as the External Cooperation Program of BIC, Chinese Academy of Sciences
(grant no. 134111KYSB20150016), Chinese Academy of Sciences-Peking University
(CAS-PKU) partnership program, and the funding of Jiangsu innovation and
entrepreneurship team, the Priority Academic Program Development (PAPD) of
Jiangsu Higher Education Institutions.
Edited
by: Martin Claussen
Reviewed by: two anonymous referees
Bothe, O., Jungclaus, J. H., and Zanchettin, D.: Consistency of the multi-model CMIP5/PMIP3-past1000 ensemble, Clim. Past, 9, 2471–2487, https://doi.org/10.5194/cp-9-2471-2013, 2013.
Brown, J. R., Hope, P., Gergis, J., and Henley, B. J.: ENSO teleconnections with Australian rainfall in coupled model simulations of the last millennium, Clim. Dynam., 47, 79–93, 2015.
Chen, J., Chen, F., Feng, S., Huang, W., Liu, J., and Zhou, A.: Hydroclimatic changes in China and surroundings during the Medieval Climate Anomaly and Little Ice Age: spatial patterns and possible mechanisms, Quaternary Sci. Rev., 107, 98–111, https://doi.org/10.1016/j.quascirev.2014.10.012, 2015.
Coats, S., Cook, B. I., Smerdon, J. E., and Seager, R.: North American pancontinental droughts in model simulations of the last millennium, J. Clim., 28, 2025–2043, 2015.
Cook, E. R., Krusic, P. J., Anchukaitis, K. J., Buckley, B. M., Nakatsuka, T., and Sano, M.: Tree-ring reconstructed summer temperature anomalies for temperate East Asia since 800 CE, Clim. Dynam., 41, 2957–2972, 2013.
Crowley, T. J. and Lowery, T. S.: How Warm Was the Medieval Warm Period?, AMBIO, 29, 51–54, https://doi.org/10.1579/0044-7447-29.1.51, 2000.
Crowley, T. J., Zielinski, G., Vinther, B., Udisti, R., Kreutz, K., Cole-Dai, J., and Castellano, J.: Volcanism and the Little Ice Age, PAGES News, 16, 22–23, 2008.
Delaygue, G. and Bard, E.: Solar forcing based on 10Be in Antarctica ice over the past millennium and beyond, EGU General Assembly Conference Abstracts, EGU2009-6943, 2009.
Ding, Y., Wang, Z., and Sun, Y.: Inter-decadal variation of the summer precipitation in East China and its association with decreasing Asian summer monsoon, Part I: Observed evidences, Int. J. Climatol., 28, 1139–1161, 2008.
Gao, C. C., Robock, A., and Ammann, C.: Volcanic forcing of climate over the past 1500 years: an improved ice corebased index for climate models, J. Geophys. Res., 113, D23111, https://doi.org/10.1029/2008jd010239, 2008.
Gupta, A. S., Jourdain, N. C., Brown, J. N., and Monselesan, D.: Climate Drift in the CMIP5 Models, J. Clim., 26, 8597–8615, https://doi.org/10.1175/jcli-d-12-00521.1, 2013.
Harris, I., Jones, P. D., Osborn, T. J., and Lister, D. H.: Updated high-resolution grids of monthly climatic observations – the CRU TS3.10 Dataset, Int. J. Climatol., 34, 623–642, https://doi.org/10.1002/joc.3711, 2014.
Hurrell, J. W., Holland, M. M., Gent, P. R., Ghan, S., Kay, J. E., Kushner, P. J., Lamarque, J. F., Large, W. G., Lawrence, D., and Lindsay, K.: The community earth system model: a framework for collaborative research, B. Am. Meteorol. Soc., 94, 1339–1360, 2013.
Jiang, D., Lang, X., Tian, Z., and Ju, L.: Mid-Holocene East Asian summer monsoon strengthening: Insights from Paleoclimate Modeling Intercomparison Project (PMIP) simulations, Palaeogeogr. Palaeocl., 369, 422–429, https://doi.org/10.1016/j.palaeo.2012.11.007, 2013.
Kalnay, E., Kanamitsu, M., Kistler, R., Collins, W., Deaven, D., Gandin, L., Iredell, M., Saha, S., White, G., and Woollen, J.: The NCEP/NCAR 40-year reanalysis project, B. Am. Meteorol. Soc., 77, 437–471, 1996.
Lau, K., Yang, G., and Shen, S.: Seasonal and intraseasonal climatology of summer monsoon rainfall over East Asia, Mon. Weather Rev., 116, 18–37, 1988.
Li, C. and Yanai, M.: The onset and interannual variability of the Asian summer monsoon in relation to land–sea thermal contrast, J. Clim., 9, 358–375, 1996.
Li, H. C., Lee, Z. H., Wan, N. J., Shen, C. C., Li, T. Y., Yuan, D. X., and Chen, Y. H.: The δ18O and δ13C records in an aragonite stalagmite from Furong Cave, Chongqing, China: A-2000-year record of monsoonal climate, J. Asian Earth Sci., 40, 1121–1130, 2011.
Li, J., Wu, Z., Jiang, Z., and He, J.: Can Global Warming Strengthen the East Asian Summer Monsoon?, J. Clim., 23, 6696–6705, https://doi.org/10.1175/2010jcli3434.1, 2010.
Lin, R., Zhu, J., and Zheng, F.: Decadal shifts of East Asian summer monsoon in a climate model free of explicit GHGs and aerosols, Sci. Rep., 6, 38546, https://doi.org/10.1038/srep38546, 2016.
Liu, J., Wang, B., Wang, H., Kuang, X., and Ti, R.: Forced response of the East Asian summer rainfall over the past millennium: results from a coupled model simulation, Clim. Dynam., 36, 323–336, https://doi.org/10.1007/s00382-009-0693-6, 2011a.
Liu, J., Chen, F., Chen, J., Xia, D., Xu, Q., Wang, Z., and Li, Y.: Humid medieval warm period recorded by magnetic characteristics of sediments from Gonghai Lake, Shanxi, North China, Chinese Sci. Bull., 56, 2464–2474, 2011b.
Lu, R., Dong, B., and Ding, H.: Impact of the Atlantic Multidecadal Oscillation on the Asian summer monsoon, Geophys. Res. Lett., 33, L24701, https://doi.org/10.1029/2006GL027655, 2006.
Man, W., Zhou, T., and Jungclaus, J. H.: Simulation of the East Asian Summer Monsoon during the Last Millennium with the MPI Earth System Model, J. Clim., 25, 7852–7866, https://doi.org/10.1175/jcli-d-11-00462.1, 2012.
Mann, M. E., Zhang, Z., Hughes, M. K., Bradley, R. S., Miller, S. K., Rutherford, S., and Ni, F.: Proxy-based reconstructions of hemispheric and global surface temperature variations over the past two millennia, P. Natl. Acad. Sci. USA, 105, 13252–13257, https://doi.org/10.1073/pnas.0805721105, 2008.
Meng, H. W., Ma, Y. Z., Wang, W., and Sang, Y. L.: Vegetation and environment change based on the high resolution pollen records of the last 2400 years in Dingbian, Shaanxi Province, China, Quaternary Sci. , 29, 931–942, 2009 (in Chinese).
Otto-Bliesner, B. L., Brady, E. C., Fasullo, J., Jahn, A., Landrum, L., Stevenson, S., Rosenbloom, N., Mai, A., and Strand, G.: Climate variability and change since 850 CE: An ensemble approach with the community earth system model, B. Am. Meteorol. Soc., 97, 735–754, 2016.
Paulsen, D. E., Li, H. C., and Ku, T. L.: Climate variability in central China over the last 1270 years revealed by high-resolution stalagmite records, Quaternary Sci. Rev., 22, 691–701, https://doi.org/10.1016/s0277-3791(02)00240-8, 2003.
Peng, Y., Shen, C., Cheng, H., and Xu, Y.: Modeling of severe persistent droughts over eastern China during the last millennium, Clim. Past, 10, 1079–1091, https://doi.org/10.5194/cp-10-1079-2014, 2014.
Ren, Y., Zhou, B., Song, L., and Xiao, Y.: Interannual variability of western North Pacific subtropical high, East Asian jet and East Asian summer precipitation: CMIP5 simulation and projection, Quatern. Int., 440, 64–70, 2017.
Shi, Z., Xu, T., and Wang, H.: Sensitivity of Asian climate change to radiative forcing during the last millennium in a multi-model analysis, Glob. Planet Change, 139, 195–210, 2016a.
Shi, J., Yan, Q., Jiang, D., Min, J., and Jiang, Y.: Precipitation variation over eastern China and arid central Asia during the past millennium and its possible mechanism: Perspectives from PMIP3 experiments, J. Geophys. Res.-Atmos., 121, 11989–12004, https://doi.org/10.1002/2016JD025126, 2016b.
Shi, N. and Zhu, Q.: An abrupt change in the intensity of the East Asian summer monsoon index and its relationship with temperature and precipitation over East China, Int. J. Climatol., 16, 757–764, 1996.
Steinhilber, F., Beer, J., and Fröhlich, C.: Total solar irradiance during the Holocene, Geophys. Res. Lett., 36, L19704, https://doi.org/10.1029/2009gl040142, 2009.
Tan, L., Cai, Y., Cheng, H., An, Z., and Edwards, R. L.: Summer monsoon precipitation variations in central China over the past 750 years derived from a high-resolution absolute-dated stalagmite, Palaeogeogr. Palaeocl., 280, 432–439, https://doi.org/10.1016/j.palaeo.2009.06.030, 2009.
Tan, L., Cai, Y., An, Z., Edwards, R. L., Cheng, H., Shen, C. C., and Zhang, H.: Centennial- to decadal-scale monsoon precipitation variability in the semi-humid region, northern China during the last 1860 years: Records from stalagmites in Huangye Cave, Holocene, 21, 287–296, 2011
Tan, M.: Climatic differences and similarities between Indian and East Asian Monsoon regions of China over the last millennium: a perspective based mainly on stalagmite records, Int. J. Speleol., 36, 75–81, 2007.
Tao, S. Y. and Chen, L. X.: A review of recent research on the East Asian summer monsoon in China. Monsoon Meteorology, Oxford University Press, UK, 60–92, 1987.
Taylor, K. E.: Summarizing multiple aspects of model performance in a single diagram, J. Geophys. Res.-Atmos., 106, 7183–7192, https://doi.org/10.1029/2000jd900719, 2001.
Vieira, L. E. A., Solanki, S. K., Krivova, N. A., and Usoskin, I.: Evolution of the solar irradiance during the Holocene, Astron. Astrophys., 531, A6, https://doi.org/10.1051/0004-6361/201015843, 2011.
Wan, N. J., Li, H. C., Liu, Z. Q., Yang, H. Y., Yuan, D. X., and Chen, Y. H.: Spatial variations of monsoonal rain in eastern China: Instrumental, historic and speleothem records, J. Asian Earth Sci., 40, 1139–1150, https://doi.org/10.1016/j.jseaes.2010.10.003, 2011.
Wang, B. and Ding, Q.: Global monsoon: Dominant mode of annual variation in the tropics, Dynam. Atmos. Oceans, 44, 165–183, https://doi.org/10.1016/j.dynatmoce.2007.05.002, 2008.
Wang, J., Yang, B., Ljungqvist, F. C., and Zhao, Y.: The relationship between the Atlantic Multidecadal Oscillation and temperature variability in China during the last millennium, J. Quaternary Sci., 28, 653–658, 2013.
Wang, J., Yang, B., Ljungqvist, F. C., Luterbacher, J., Osborn, T. J., Briffa, K. R., and Zorita, E.: Internal and external forcing of multidecadal Atlantic climate variability over the past 1,200 years, Nat. Geosci., 10, 512–517, 2017.
Wang, S., Zhao, Z., Chen, Z., and Tang, Z.: Drought/flood variations for the last two thousand years in China and comparison with global climatic change, in: The climate of China and global climate, China Ocean Press, Springer Berlin Heidelberg, New York, 20–29, 1987.
Wang, Y. M., Lean, J., and Sheeley Jr, N.: Modeling the Sun's magnetic field and irradiance since 1713, Astrophys. J., 625, 522–538, 2005.
Xin, X., Zhang, L., Zhang, J., Wu, T., and Fang, Y.: Climate change projections over East Asia with BCC_CSM1. 1 climate model under RCP scenarios, J. Meteorol. Soc. JPN., 91, 413–429, 2013.
Yang, K. and Jiang, D.: Interannual climate variability change during the Medieval Climate Anomaly and Little Ice Age in PMIP3 last millennium simulations, Adv. Atmos. Sci., 34, 497–508, 2017.
Yang, Q., Ma, Z., Fan, X., Yang, Z. L., Xu, Z., and Wu, P.: Decadal modulation of precipitation patterns over eastern China by sea surface temperature anomalies, J. Clim., 30, 7017–7033, 2017.
Yu, L., Furevik, T., Otterå, O. H., and Gao, Y.: Modulation of the Pacific Decadal Oscillation on the summer precipitation over East China: a comparison of observations to 600-years control run of Bergen Climate Model, Clim. Dynam., 44, 475–494, https://doi.org/10.1007/s00382-014-2141-5, 2014.
Zhang, D., Li, H. C., Ku, T. L., and Lu, L.: On linking climate to Chinese dynastic change: Spatial and temporal variations of monsoonal rain, Chinese Sci. Bull., 55, 77–83, 2010.
Zhang, P., Cheng, H., Edwards, R. L., Chen, F., Wang, Y., Yang, X., Liu, J., Tan, M., Wang, X., Liu, J., An, C., Dai, Z., Zhou, J., Zhang, D., Jia, J., Jin, L., and Johnson, K. R.: A test of climate, sun, and culture relationships from an 1810-year Chinese cave record, Science, 322, 940–942, https://doi.org/10.1126/science.1163965, 2008.
Zhao, K., Wang, Y., Edwards, R. L., Cheng, H., Liu, D., and Kong, X.: A high-resolved record of the Asian Summer Monsoon from Dongge Cave, China for the past 1200 years, Quaternary Sci. Rev., 122, 250–257, https://doi.org/10.1016/j.quascirev.2015.05.030, 2015.
Zheng, J. Y., Wang, W. C., Ge, Q. S., Man, Z. M., and Zhang, P. Y.: Precipitation variability and extreme events in eastern China during the past 1500 years, Terr. Atmos. Ocean. Sci., 17, 579–592, 2006.
Zhou, T. J.: Atmospheric water vapor transport associated with typical anomalous summer rainfall patterns in China, J. Geophys. Res.-Atmos., 110, D08104, https://doi.org/10.1029/2004jd005413, 2005.
Zhu, J. and Wang, S.: 80 yr oscillation of summer rainfall over North China and East Asian Summer Monsoon, Geophys. Res. Lett., 29, 1672, https://doi.org/10.1029/2001GL013997, 2002.