the Creative Commons Attribution 4.0 License.
the Creative Commons Attribution 4.0 License.
 | 12 Mar 2026
New isoprenoid GDGT index as a water mass and temperature proxy in the Southern Ocean
Osamu Seki
Masanobu Yamamoto
Bella Duncan
The Southern Ocean plays a crucial role in the global carbon cycle, ocean heat transport, and Antarctic ice dynamics. Investigating past variability in the Southern Ocean, including temperature and water mass distribution, can improve understanding of how this system may respond to current climate change. Isoprenoid glycerol dialkyl glycerol tetraethers (isoGDGTs) can be used as an ocean temperature proxy and have been applied to sediments in the Southern Ocean to reconstruct past temperature variability. However, applications of current isoGDGT-based temperature indices are subject to substantial uncertainty in the Antarctic Zone. In this study, we propose a new isoGDGT-based index, the Antarctic IsoGDGT Zonal (AIZ) index, composed of GDGT-0, GDGT-1 and GDGT-2, developed through statistical reanalysis of Southern Ocean core-top data. We interpret that the AIZ index captures shifts in archaeal community composition across the Polar Front (PF). South of the PF, cold-adapted archaea, which are characterized by high relative abundances of GDGT-0, dominate, whereas more diverse archaeal communities occur north of the PF. Because these community shifts are tied to water mass boundaries, the AIZ index serves as an effective tracer for reconstructing past PF movements. Furthermore, the AIZ index exhibits a significant correlation with subsurface temperature (subST) south of the PF, suggesting that it can be used as a temperature proxy in the Antarctic Zone ( (R2 = 0.81, n = 134, p < 0.0001)). Applying the AIZ index to late Pleistocene sediment cores collected around the ACC confirms its reliability as a water mass tracer and temperature proxy in the Antarctic Zone. Our study highlights the high potential of isoGDGTs for reconstructing palaeoceanographic conditions in the Southern Ocean.
- Article
(22906 KB) - Full-text XML
-
Supplement
(2925 KB) - BibTeX
- EndNote


The Southern Ocean contains the world's largest ocean current, the Antarctic Circumpolar Current (ACC), which plays a critical role in regulating global ocean circulation, the carbon cycle, and the stability of the Antarctic ice sheet, and thereby significantly influencing the global climate (Carter et al., 2008; Chapman et al., 2020). Within this system, the Polar Front (PF; Fig. 1) marks the transition between cold, fresh Antarctic water and warmer, saltier sub-Antarctic waters, as well as the boundary between nutrient-rich and nutrient-poor waters (Carter et al., 2022; Pollard et al., 2002). South of the PF, also known as the Antarctic Zone, is characterized by cold Antarctic Surface Water overlying relatively warm Circumpolar Deep Water (CDW) (Carter et al., 2022). Intrusion of this warm deep water onto the continental shelf drives basal melting of ice shelves, a key process in Antarctic ice mass loss (DeConto and Pollard, 2016). The region south of the PF therefore represents a critical interface where ocean heat and circulation directly influence Antarctic ice sheet stability. Response times of the oceans and ice sheets to climate change are found to vary over a range of timescales from short-term (sub-daily to decadal) to long-term (multi-millennial) (Hanna et al., 2024; Yang and Zhu, 2011). Therefore, understanding the role of the Southern Ocean in Earth's climate system requires the study of long-term climate variability in the geological past. This, in turn, necessitates reliable proxy-based palaeoclimate records from the Southern Ocean, particularly from high latitude regions such as the Antarctic Zone.
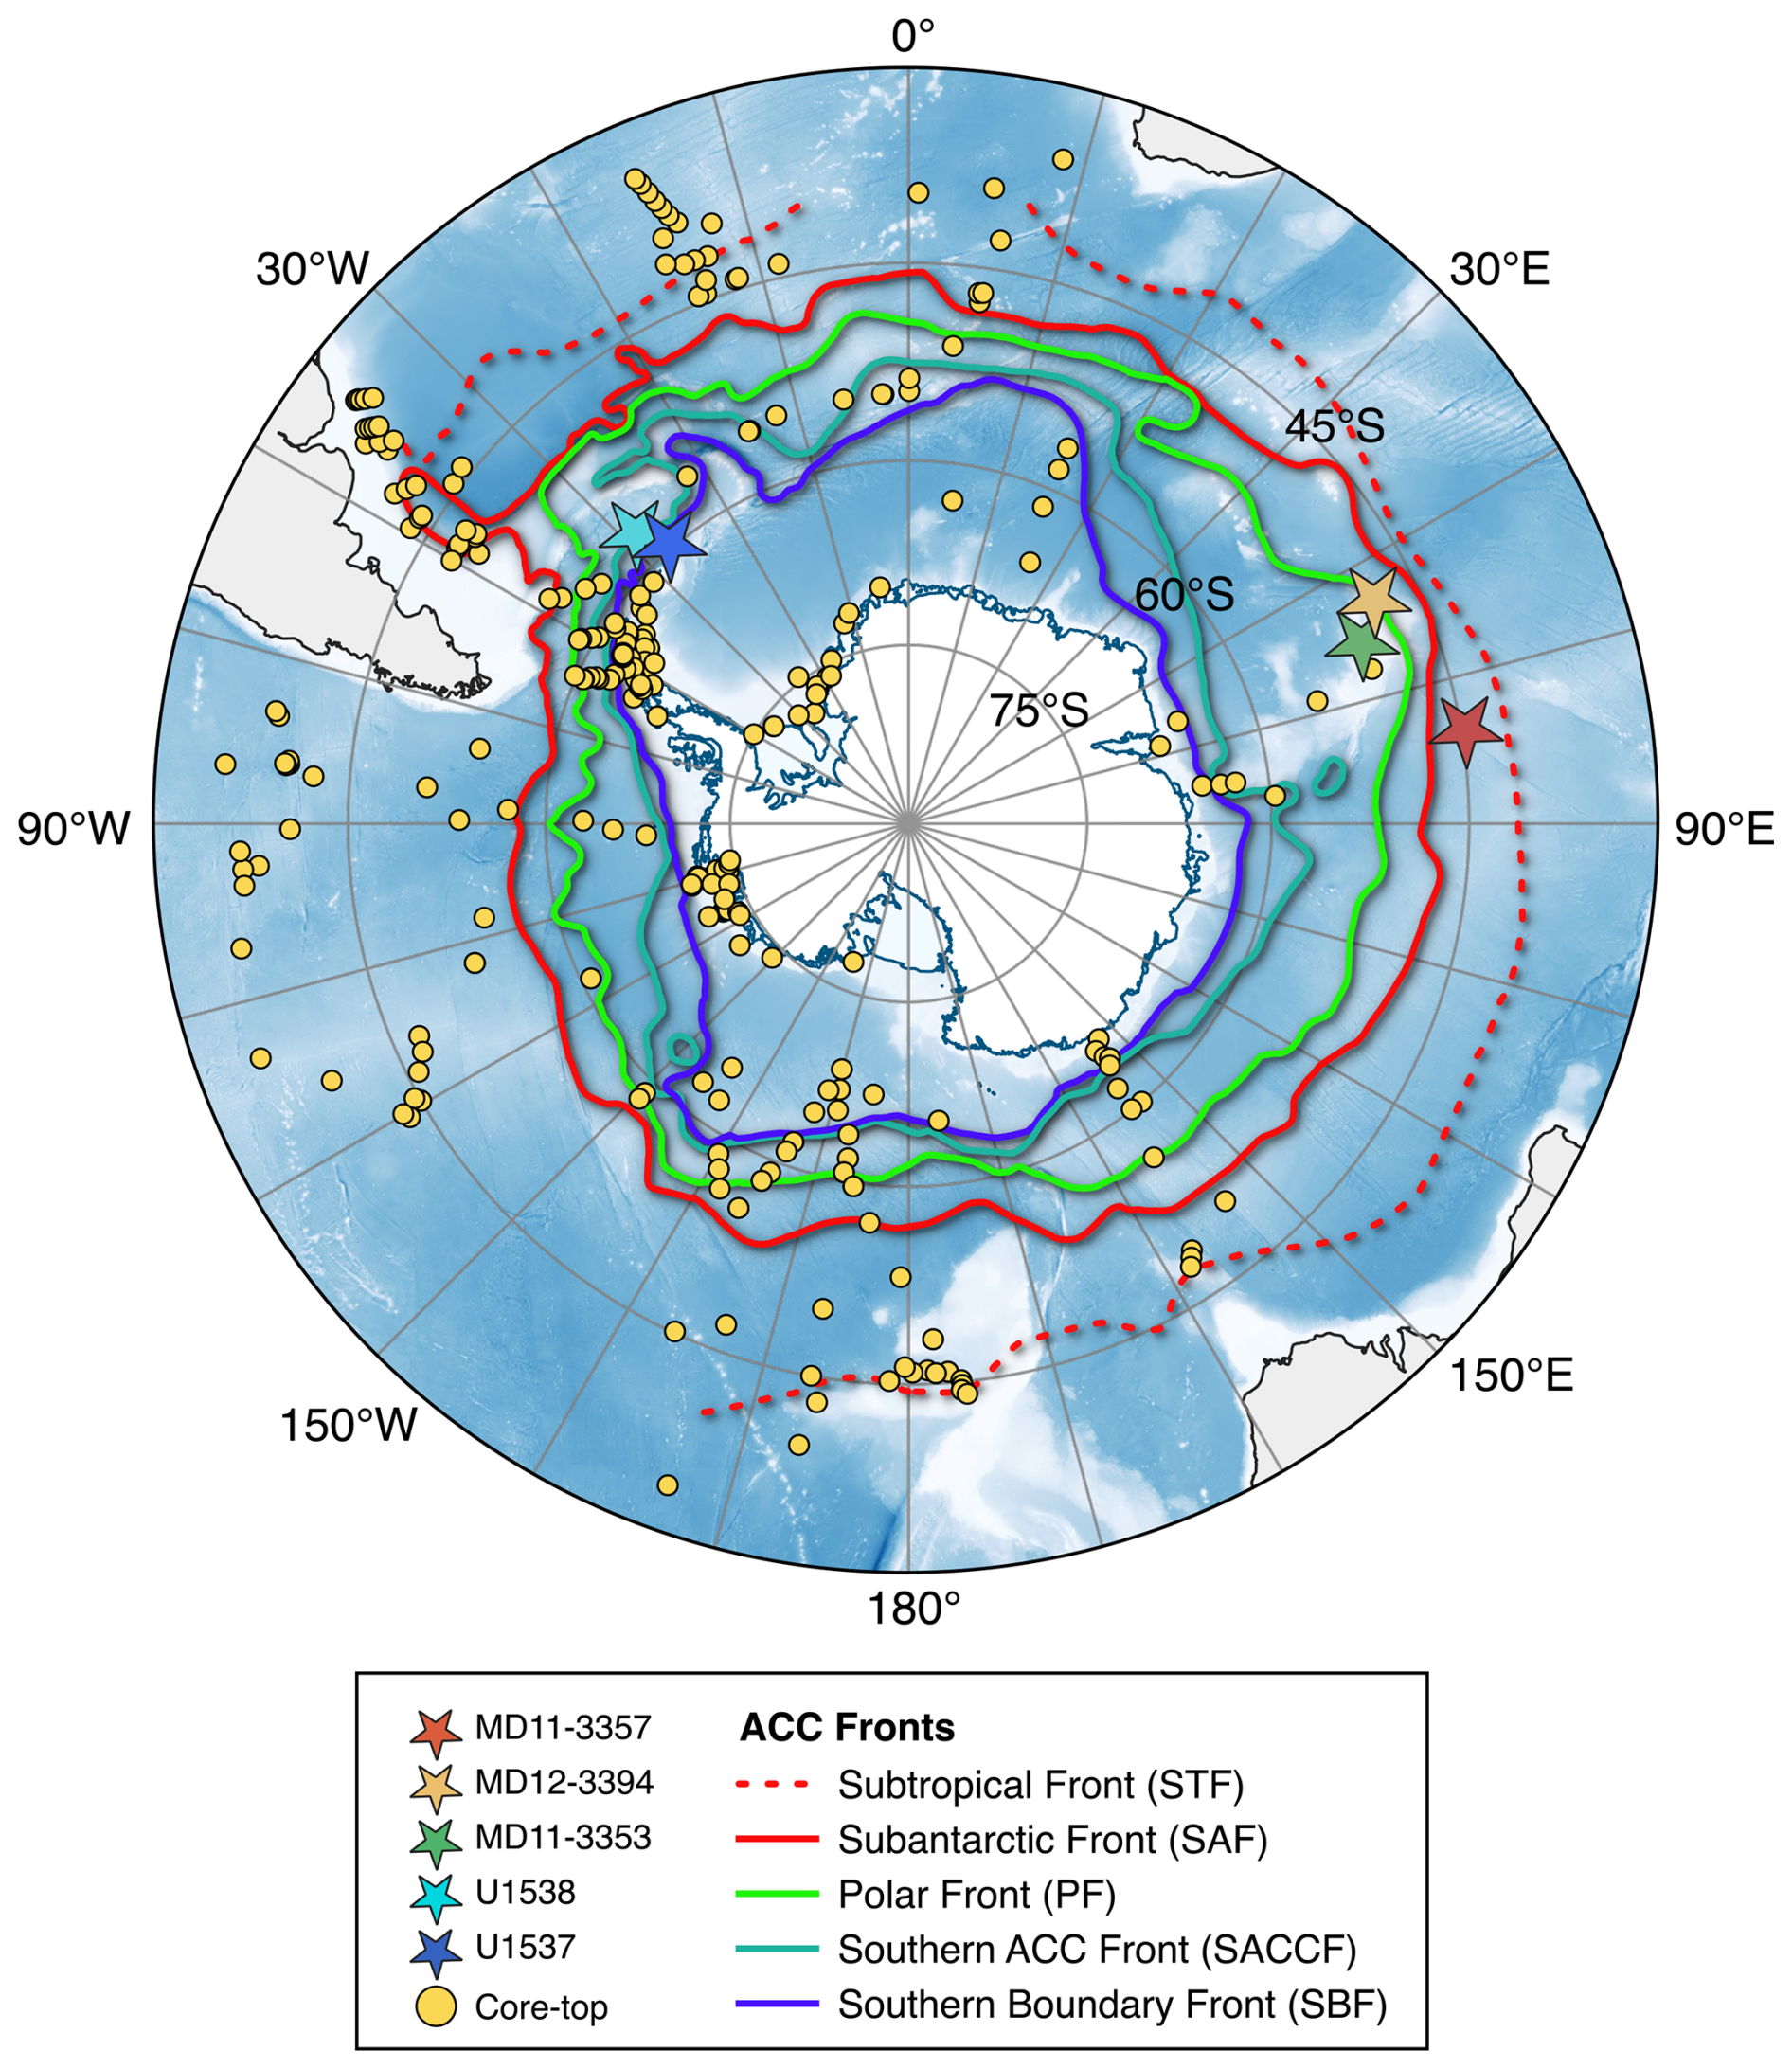
Figure 1Bathymetric map with the sediment core locations and oceanic fronts analysed in this study. Core-top samples (yellow circles, n = 289) are from Tierney and Tingley (2014), Jaeschke et al. (2017) and Lamping et al. (2021). Sediment cores are shown as stars: dark red (MD11-3357; Ai et al., 2024), dark yellow (MD12-3394; Ai et al., 2020), green (MD11-3353; Ai et al., 2020), light blue (U1538; this study), blue (U1537; this study). The oceanographic fronts and bathymetric model are adapted from Orsi et al. (1995) and the GEBCO Bathymetric Compilation Group (2023), respectively. The map was created using Quantarctica (Matsuoka et al., 2018).
Isoprenoid glycerol dialkyl glycerol tetraethers (isoGDGTs) are membrane lipids produced primarily by ammonia-oxidizing marine Nitrososphaera (formerly called Thaumarchaeota and Crearchaeota, Group I; Bijl et al., 2025; Brochier-Armanet et al., 2008). These compounds are ubiquitous across the global ocean, including polar regions (Ho et al., 2014; Schouten et al., 2002; 2013) and are well-preserved in marine sediments (de Bar et al., 2019). IsoGDGTs have different structures with different numbers of cyclopentane rings (isoGDGTs-0 to -8) and cyclohexane moiety (Crenarchaeol (Cren) and its stereoisomer (Cren′)) (Fig. S1 in the Supplement). The degree of cyclisation of isoGDGTs is strongly correlated with ocean temperature in global core-top datasets (Schouten et al., 2002), attributed to adaptive changes in archaeal membrane ring structures that maintain optimal fluidity under varying ambient temperatures (Fietz et al., 2020; Gabriel and Chong, 2000). In low temperature environments, archaea reduce the number of cyclopentane rings in their membrane structures to prevent membrane rigidity. Based on this relationship, Schouten et al. (2002) proposed the first isoGDGT index (TEX86), which uses a ratio of GDGT-1, GDGT-2, GDGT-3 and Cren′.
However, subsequent research on TEX86 palaeothermometry has raised concerns about applying the TEX86 index in cold regions. This stems from its insensitivity to temperature changes in cold environments and large variability in core-top data (Kim et al., 2008; 2010; Fig. S2 in the Supplement). This scatter likely reflects multiple complicating factors specific to polar environments. In the Antarctic Zone, isoGDGTs are thought to predominantly reflect subsurface rather than surface ocean temperatures (e.g., Fietz et al., 2016; Hagemann et al., 2023; Ho and Laepple, 2016; Jaeschke et al., 2017; Kim et al., 2012; Lamping et al., 2021; Park et al., 2019), consistent with observations of elevated archaeal abundances in CDW (Alonso-Sáez et al., 2011; Church et al., 2003; Kalanetra et al., 2009; Sow et al., 2022; Spencer-Jones et al., 2021). Genomic studies have revealed differences in archaeal communities and archaeal diversity across water masses (Kolody et al., 2025; Raes et al., 2018), suggesting that polar archaeal-community specific GDGT–temperature relationships may differ from those in lower latitudes (Pearson and Ingalls, 2013). Additionally, the seasonality of isoGDGT production (Chandler and Langebroek, 2021; Church et al., 2003; Park et al., 2019) and polar-related biases such as seasonal change in sea ice (Xu et al., 2020) have been thought to contribute to GDGT variability. Moreover, a lack of constraint on core-top ages, which could result in older GDGTs being mixed into modern material may also contribute to the observed scatter (Bijl et al., 2025). These factors collectively weaken the temperature signal and reduce TEX86 sensitivity to sea surface temperature (SST) variations in cold polar waters (< 5 °C).
Various approaches have tried to better constrain GDGT-based temperatures at high latitudes, for example by using additional high latitude core-top data, spatially varying calibrations, or alternative indices such as (Shevenell et al., 2011, Kim et al., 2010, 2012; Tierney and Tingley, 2014). However, in the case of , the lack of a physiological basis for the index has seen it not recommended for continued use (Bijl et al., 2025), and while increased core-top data has created a better spatial network of information, the significant scatter and insensitivity to temperature in TEX86 values throughout cold regions (< 5 °C) has not been better constrained. In addition to isoGDGTs, recent studies have suggested that hydroxylated-isoGDGTs (OH-isoGDGTs) also produced by marine archaea have high potential as a palaeotemperature proxy applicable in high latitudes (Fietz et al., 2020; Liu et al., 2020; Park et al., 2019; Varma et al., 2023). Specifically, the addition of OH-isoGDGT-0 to the denominator of TEX86 leads to an improved temperature sensitivity at the cold end (i.e., < 15 °C) of the modern temperature range (Varma et al., 2024). However, while OH-isoGDGTs have significant promise for high latitude temperature reconstructions going forward, many legacy datasets only record isoGDGTs, making it worthwhile to fully explore their utility. In the absence as yet of a more mechanistic understanding of how and why isoGDGT–temperature relationships vary through different temperature zones and Nitrososphaera communities, we take a statistical approach to determine an alternative index for a circum-Antarctic GDGT–temperature relationship.
In this study, we reanalyzed isoGDGTs in core-top datasets from south of 35° S to develop a new isoGDGT-based proxy. Based on statistical reanalysis, we propose the Antarctic IsoGDGT Zonal (AIZ) index, designed to estimate zonal water mass changes in the Southern Ocean and reconstruct temperatures south of the PF. The robustness of this index as a water mass tracer and temperature proxy is evaluated by comparison to previously published and newly generated sedimentary isoGDGT records covering the past 160 kyr in the Southern Ocean.
The Southern Ocean encompasses the broad oceanic regions surrounding Antarctica, generally south of approximately 35° S (Chapman et al., 2020). At a large scale, the Southern Ocean circulation is dominated by the strong eastward-flowing ACC, which connects all three major ocean basins. The ACC, driven by westerly winds and buoyancy forcing, plays a critical role in the global distribution of heat, salt, carbon, nutrients, and dissolved gases (Carter et al., 2008; Rintoul, 2018). It comprises several oceanic fronts characterized by dynamic and complex features influenced by multiple factors such as atmospheric processes, changes in wind strength and belts, and bathymetry (Chapman et al., 2020). In the upper water column, water properties such as temperature, salinity, oxygen, and nutrients show distinct transitions across these fronts (Chapman et al., 2020). These fronts include the Subtropical Front (STF), Subantarctic Front (SAF), Polar Front (PF), Southern ACC Front (SACCF), and Southern Boundary Front (SBF) from north to south (Fig. 1; Carter et al., 2008; Orsi et al., 1995). The Southern Ocean is meridionally divided into four major zones delimited by these oceanic fronts: the Subantarctic Zone, the Polar Frontal Zone, the Antarctic Zone, and the Zone south of the ACC (Pollard et al., 2002). Beneath the upper water column, the ACC also transports CDW, the most voluminous water mass in the region. CDW is divided into upper CDW, characterized by low oxygen and high nutrient concentrations, and lower CDW, characterized by high salinities (Carter et al., 2008).
The Subantarctic Zone, north of the SAF, features relatively warm (7–4 °C) and saline (salinity ∼ 34.0) surface waters enriched in nutrients, which promote high primary productivity (Carter et al., 2022). This zone is the northernmost zone of the Southern Ocean where temperature stratification dominates over salinity stratification (Pollard et al., 2002). Antarctic Intermediate Water forms in this zone through the subduction of cold, fresh Subantarctic Surface Water and spreads northward at depths of approximately 500–1200 m, characterized by a salinity minimum and high oxygen content (Carter et al., 2008). The Polar Frontal Zone, located between the SAF and PF, serves as a transition area where Subantarctic Surface Water cools and freshens as it moves southward (∼ 4 °C and salinity 34.0–33.8) (Carter et al., 2022). In this zone, salinity is as important as temperature in contributing to stratification (Pollard et al., 2002). The Antarctic Zone, extending from the PF to the SACCF, is characterized by a thin (∼ 100 m thick) Antarctic Surface Water layer. In this zone, SST drops below 4 °C with salinity ∼ 34.0, making salinity more important than temperature in controlling the stratification of the upper ocean (Carter et al., 2022). South of the PF, upper CDW upwells to a depth centred at ∼ 500 m and reaches the ocean surface near the continental shelf (Carter et al., 2008; Holland et al., 2020). This is driven by wind-induced upwelling where westerly winds transition to polar easterly winds in the Antarctic Zone (Carter et al., 2022). These upwelling events bring deep, nutrient-rich waters to the surface, creating shallower nitraclines with enhanced surface productivity south of the PF (Carter et al., 2022). The Zone south of the ACC, near the Antarctic continental margin, is characterized by continued cooling of Antarctic Surface Water, reaching near-freezing temperatures at a continuous salinity of ∼ 34.0 (Carter et al., 2022). These water mass properties, however, exhibit considerable regional variability across the Southern Ocean (Carter et al., 2022).
3.1 Core-top samples and environmental parameters used in this study
In this study, we reanalysed a global (n = 916) and south of 35° S (n = 289) core-top isoGDGT datasets, by adding data from Jaeschke et al. (2017) and Lamping et al. (2021) to the calibration dataset presented in Tierney and Tingley (2014) (Fig. 1). SST data for each core-top site were derived from the World Ocean Atlas 2009 (WOA09) 1° × 1° gridded product (Locarnini et al., 2010). Additional environmental parameters that potentially influence isoGDGT composition – including annual mean and seasonal seawater temperatures (0–1400 m depths), salinity (0–1400 m depths), and oxygen saturation (0–1400 m depths) – were derived from the World Ocean Atlas 2018 (WOA18) 0.25° × 0.25° gridded product (Boyer et al., 2018).
3.2 Sediment cores used in this study
Previously reported and newly generated sedimentary isoGDGT records from multiple sites around the ACC were used to evaluate the applicability of isoGDGTs as a palaeoceanographic proxy in the Southern Ocean (Fig. 1). New isoGDGT records were obtained from sediment cores U1538 (57.43° S, 43.35° W, 3131 m water depth) and U1537 (59.11° S, 40.91° W, 3713 m water depth) collected in the northern and southern Scotia Sea near the SBF during the International Ocean Drilling Program Expedition 382 (Weber et al., 2019). The sites are located in the Dove Basin in the southern Scotia Sea, where sedimentation is influenced by the transport of eastward-flowing ACC and northward-flowing Weddell Sea Deep Water (Weber et al., 2019). Additionally, we analysed previously reported isoGDGT records in sediment cores MD11-3357 (44.68° S, 80.43° E, 3349 m water depth), MD12-3394 (48.38° S, 64.58° E, 2320 m water depth) and MD11-3353 (50.57° S, 68.39° E, 1568 m water depth) collected from the southeastern Indian Ocean (Ai et al., 2020; 2024).
3.3 GDGT analysis
Organic compounds were extracted from approximately 2 g of freeze-dried sediment using a DIONEX Accelerated Solvent Extractor 200 with (9:1) at a temperature of 100 °C and a pressure of 1000 psi. The extracts were initially separated into neutral and acidic fractions by aminopropyl silica gel column chromatography with mixture (2:1). The neutral fraction was further separated into two fractions (N1-3 and N4) by silica gel column chromatography. The N4 fraction, which contains GDGTs, was dissolved in (99:1) and filtered through 0.45 µm filters.
GDGTs in U1537 and U1538 samples were identified and quantified using high-performance liquid chromatography-mass spectrometry (HPLC-MS) with an Agilent 1260 HPLC system coupled to 6130 quadrupole mass spectrometers. Separation was achieved with a Prevail Cyano column (2.1 × 150 mm, 3 µm; Grace Discovery Science, USA) maintained at 30 °C following the method of Hopmans et al. (2000) and Schouten et al. (2007). The analytical conditions were as follows: flow rate 0.2 mL min−1, isocratic with 99 % hexane and 1 % 2-propanol for the first 5 min followed by a linear gradient to 1.8 % 2-propanol over 45 min. Detection was achieved with an atmospheric pressure chemical ionization-MS (APCI-MS). The spectrometer was run in two different selected ion monitoring modes ( 743.8, 1018, 1020, 1022, 1032, 1034, 1036, 1046, 1048, 1050, 1292.3, 1296.3, 1298.3, 1300.3, and 1302.3). Following the literature of Hopmans et al. (2004), compounds were identified by comparison of mass spectra and retention times. GDGTs were detected and quantified by integrating the peak area in the chromatogram with a comparison to the peak area of an internal standard (C46 GTGT) in the chromatogram, according to the method of Huguet et al. (2006). By comparing the peak areas of isolated Cren, GDGT-0, and C46 GTGT in known amounts, the correction value of ionization efficiency between GDGTs and the internal standard was determined (Schouten et al., 2007). To monitor the changes in the ionization efficiency, a mixture of C46 GTGT as the working standard and the GDGTs extracted and purified from an East China Sea sediment was inserted in the routine analysis every 20 samples. The standard deviations of Cren, GDGT-1, GDGT-2, and GDGT-3 in replicate LC/MS analysis were 1 %, 1 %, 3 %, and 2 % in sediment samples, respectively.
3.4 GDGT-based indices used in this study
A number of indices and calibrations have been proposed to reconstruct ocean temperature and assess non-thermal effects based on isoGDGT composition. The isoGDGT-based indices and methods used in this study are described below. The TEX86 index was first proposed by Schouten et al. (2002) and is defined as the following Eq. (1), where the bracketed GDGTs represent the relative abundance of each compound.
The conversion of the TEX86 index to temperature was initially achieved using a linear relationship (Schouten et al., 2002). A range of calibrations have subsequently been developed (Kim et al., 2010; Liu et al., 2009; Schouten et al., 2002). This includes a spatially varying calibration model for TEX86 based on a Bayesian approach, BAYSPAR (Tierney and Tingley, 2014). The index, was also proposed as more suitable for reconstructing temperatures below 15 °C and is defined as the following Eq. (2) (Kim et al., 2010).
The OPTiMAL calibration, a machine learning approach, uses all six isoGDGTs in global core-top data as training data to estimate SST (Dunkley Jones et al., 2020). The training dataset (n = 914) used in this study consists of the global “Op1” dataset (Dunkley Jones et al., 2020) and additional core-top data from the Southern Ocean (Jaeschke et al., 2017; Lamping et al., 2021).
IsoGDGTs are biosynthesized not only by Nitrososphaera but can also be derived from other sources including methanogenic, methanotrophic and terrigenous archaea. A number of isoGDGT-based indices have been proposed to assess the non-thermal effects caused by exogenous isoGDGT inputs (Blaga et al., 2009; Sinninghe Damsté et al., 2012; Taylor et al., 2013; Pearson and Ingalls, 2013). The methane index (MI) has been proposed as an indicator of post-depositional methanotrophic archaeal GDGT input if the value exceeds 0.3 and is defined as follows (Zhang et al., 2011):
The relative abundance of Cren′ to Cren, expressed as fcren (Eq. 4) is interpreted as reflecting non-temperature-related influences, particularly community changes in Nitrososphaera that produce differing amounts of Cren′ (O'Brien et al., 2014; Pitcher et al., 2010). This is relevant when fcren exceeds 0.25 (O'Brien et al., 2014):
Additionally, the ratio of GDGT-2 and GDGT-3 () has been suggested to reflect a contribution from archaea living deeper in the water column, especially when the values exceed 5 (Taylor et al., 2013).
% GDGT-0 has been proposed as an indicator of the contribution of methanogenic archaea when the value exceeds 67 %, defined as follows (Sinninghe Damsté et al., 2012):
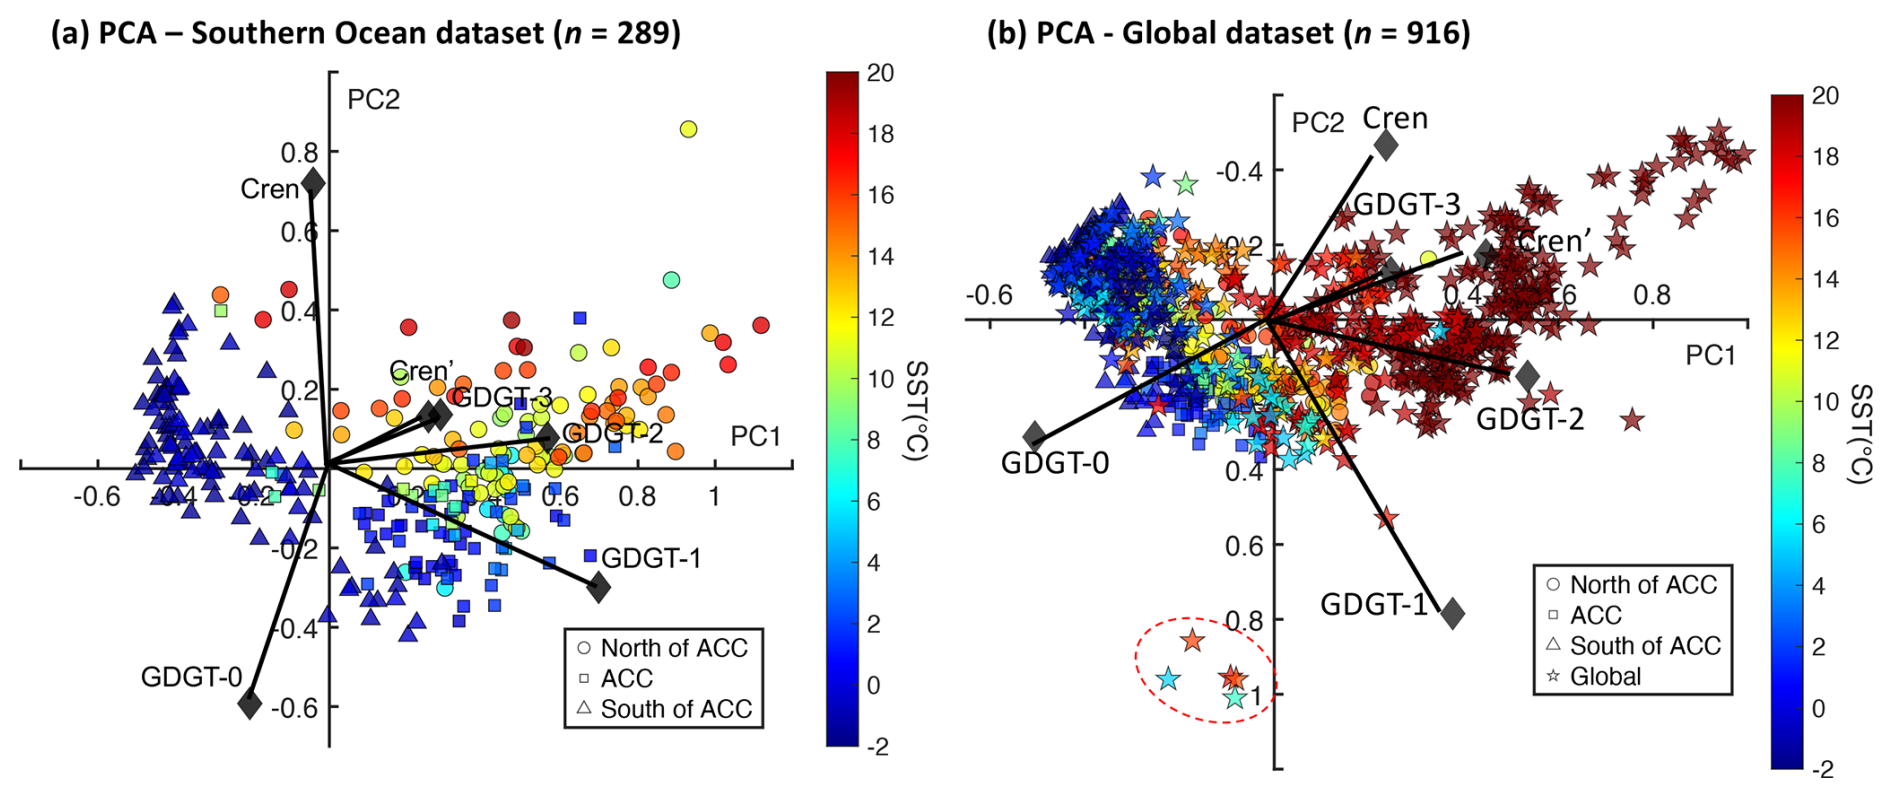
Figure 2PCA biplots for core-top isoGDGT data from (a) the Southern Ocean (n = 289) and (b) the global (n = 916) datasets. The colour bar shows the Sea Surface Temperature (SST) range. The Southern Ocean samples are classified into three groups: north of the ACC (circles), centre of the ACC (squares) and south of the ACC (triangles), separated by the Subantarctic Front and the Southern Boundary of ACC. The global samples are shown as stars. Five sites forming separate clusters (red dotted circles) represent samples that failed quality screening. Core-top samples are from Tierney and Tingley (2014), Jaeschke et al. (2017) and Lamping et al. (2021). SSTs are derived from the WOA09 gridded product (Locarnini et al., 2010).
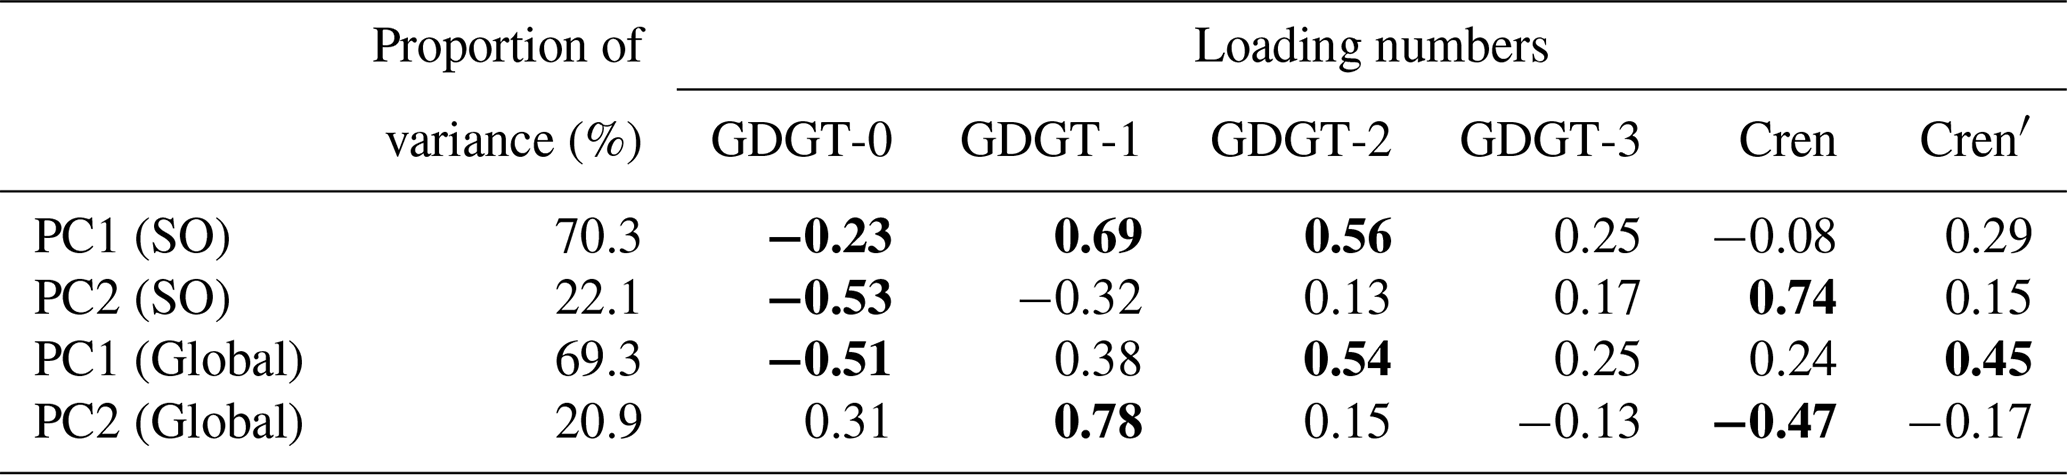
Table 1Proportion of variance and loading values for each isoGDGT component from PCA using the Southern Ocean (SO) (n = 289) and Global (n = 916) datasets. The loading numbers with the higher values are shown in bold.
PCA conducted on core-top isoGDGT data from Tierney and Tingley (2014), Jaeschke et al. (2017) and Lamping et al. (2021).
4.1 Regional features of isoGDGT distributions in the Southern Ocean
As shown in Fig. S2, correlations between the conventional isoGDGT indices (TEX86 and ) and WOA-derived in situ SST are weak in the low temperature range (< 5 °C), calling into question the applicability of the conventional indices as SST proxies in the polar region. Therefore, we conducted principal component analysis (PCA) on the fractional abundances of six isoGDGTs from sites located south of 35° S (n = 289; Fig. 2a) to evaluate the factors specific to the production of isoGDGTs in the Southern Ocean. For comparison, PCA was also performed on a global core-top dataset (n = 916; Fig. 2b). In both the Southern Ocean and global datasets, the first two principal components explain over 90 % of the total variance, with PC1 accounting for approximately 70 % (Table 1).
In the Southern Ocean dataset, PC1 exhibits strong positive loadings for GDGT-1 (0.69) and GDGT-2 (0.56), suggesting that these two compounds are the primary contributors to this component (Table 1, Fig. 2a). In contrast, GDGT-0 displays a negative loading (−0.23) on PC1, which is also observed in the global PCA. However, the primary contributors to PC1 in the global dataset differ, with GDGT-2 and Cren′ showing the highest loadings in contrast to the Southern Ocean dataset (Table 1, Fig. 2b).
For PC2, the Southern Ocean dataset is primarily influenced by GDGT-0 and Cren, which exhibit opposing loadings: GDGT-0 loads negatively, while Cren loads positively. In contrast, global PC2 is mainly driven by GDGT-1 and Cren, which also load in opposite directions. These differences highlight that the distribution of isoGDGTs in the Southern Ocean is not entirely consistent with that observed in the global dataset.
Table 2Correlation coefficients (R) between principal components (PC1, PC2) and environmental parameters/GDGT indices for the Southern Ocean (SO) (n = 289) and Global (n = 911) datasets. Values showing stronger correlations are shown in bold.
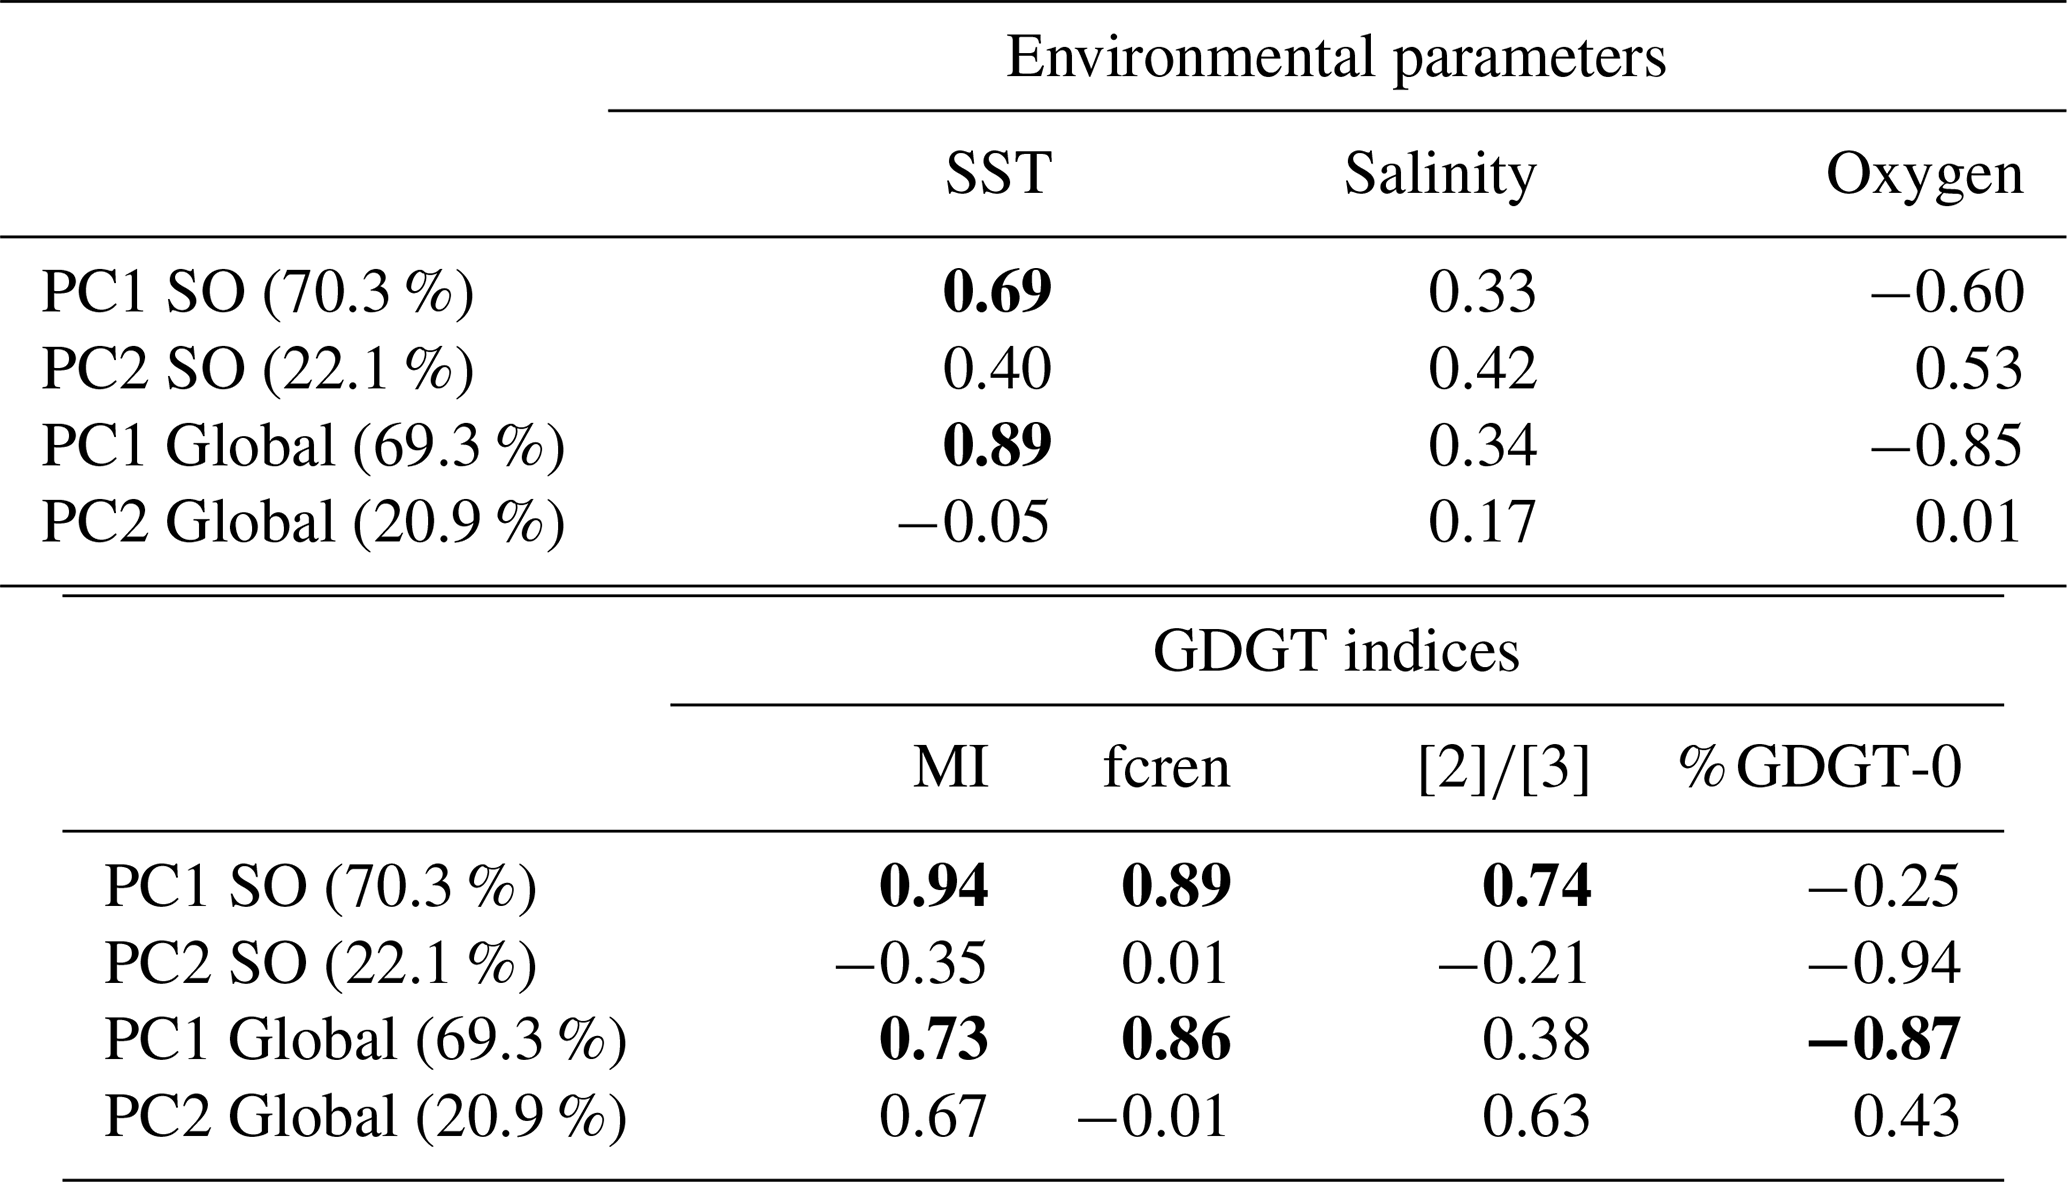
Principal components and GDGT indices are derived from core-top isoGDGT data from Tierney and Tingley (2014), Jaeschke et al. (2017) and Lamping et al. (2021). The environmental parameters are derived from the WOA18 gridded product (Boyer et al., 2018).
4.2 Environment controls on isoGDGT variability: Insights from PCA of core-top isoGDGTs
To determine what PC1 represents in both global and Southern Ocean datasets, we compared it with the environmental parameters that potentially influence isoGDGT composition, including SST, salinity, and oxygen saturation at surface (0 m) depth (Qin et al., 2015; Schouten et al., 2013). Five sites in the North Pacific were excluded from the global core-top dataset, as they formed distinct clusters in the PCA and exceeded the thresholds of the screening methods (MI and % GDGT-0) (Fig. 2b). In the global dataset, PC1 exhibits the strongest correlation with SST (Table 2: R = 0.89), supporting the use of isoGDGT distributions as a palaeotemperature proxy. In the Southern Ocean dataset, PC1 also shows the highest correlation with SST among the environmental variables; however, the correlation is considerably weaker than in the global dataset (Table 2; R = 0.69). This suggests that, in contrast to the global dataset, isoGDGT distributions in the Southern Ocean may be substantially influenced not only by temperature but also by other environmental factors.
We further examined relationship of PC1 with non-thermal GDGT indices such as MI (Zhang et al., 2011), fcren (O'Brien et al., 2014), (Taylor et al., 2013), and % GDGT-0 (Sinninghe Damsté et al., 2012). Both the Southern Ocean and global PC1 show strong positive correlations with MI and fcren (Table 2), with values remaining below the critical thresholds of 0.3 and 0.25, respectively. This indicates that anomalous isoGDGT distributions are not apparent, suggesting the contribution of post-depositional methanotrophic archaea is negligible.
One of the notable distinctions between the global and Southern Ocean datasets lies in the relation between PC1 and . The ratio is used to differentiate between contributions from “shallow” (0–200 m depth) and “deep” (> ∼ 1000 m depth) clades of archaea, with higher values reflecting increased contributions from archaeal communities residing at deeper water depths (Rattanasriampaipong et al., 2022). Specifically, values above 5 indicate a significant contribution from deeper-dwelling archaea (Taylor et al., 2013). While global PC1 shows only a weak correlation with (Table 2; R = 0.38), Southern Ocean PC1 exhibits a much stronger correlation (Table 2; R = 0.74), with a steeper slope, including several values exceeding this threshold (Figs. S3a and S4a in the Supplement). This association implies that isoGDGTs in sediment samples in the Southern Ocean are more strongly influenced by archaea living in the deeper ocean. The spatial distribution of exhibits a latitudinal pattern: lower values occur south of the ACC, whereas northern sites frequently have higher values exceeding the threshold (> 5). If isoGDGT distributions were controlled solely by temperature, archaea at lower-latitude sites would produce isoGDGTs with more rings, leading to lower values. However, the pattern we observe here appears counterintuitive, with northern sites clustering at higher values.
Several mechanisms may explain the observed spatial variability in values. First, basin bathymetry provides control on distributions. Our finding that ratios correlate with site water depth (R = 0.74) suggests that in deeper basins, the relative contribution from deep-dwelling archaea is increased. This bathymetric effect is particularly pronounced at northern Southern Ocean sites, where core-top samples predominantly come from deep basin locations (mean depth ∼ 3400 m). Conversely, sites on the shallower Antarctic continental shelf and slope maintain lower ratios, likely due to shallow archaeal clades dominating the water column.
Additionally, the relationship between export depth and the depth of maximum isoGDGT production differs within the water column. Previous study has shown that peak isoGDGT production occurs at the base of the photic zone and/or below the nitracline (Hernández-Sánchez et al., 2014; Spencer-Jones et al., 2021; Wuchter et al., 2005). Nitracline depths in the Southern Ocean vary with latitude, with northern sites, particularly in the South Pacific subtropical gyre region, exhibiting deeper nitraclines (several hundred meters to 1000 m) due to strong permanent stratification and Ekman downwelling at gyre centres (Dai et al., 2023; Feucher et al., 2019). These deeper nitraclines could increase contributions from deeper archaeal clades to seafloor sediments. In addition, the oligotrophic conditions at northern subtropical sites result in low surface particle flux (Dai et al., 2023). Since export of isoGDGTs depends on sinking particles (e.g., marine snow, fecal pellets, phytoplankton aggregates) that incorporate lipids (Huguet et al., 2006; Wuchter et al., 2005), weak surface productivity reduces the contribution of surface-dwelling archaeal signals, allowing GDGTs from deeper archaeal communities to contribute proportionally more to the sedimentary record, thereby elevating values. In contrast, southern sites are characterized by upwelling of CDW, which brings nutrients to the upper water column and creates shallower nitraclines with enhanced surface productivity (Carter et al., 2008), leading to lower values. These mechanisms can potentially explain the stronger correlation between PC1 and observed in the Southern Ocean compared to the global dataset, introducing a significant non-thermal influence on sedimentary isoGDGT distributions across the Southern Ocean.
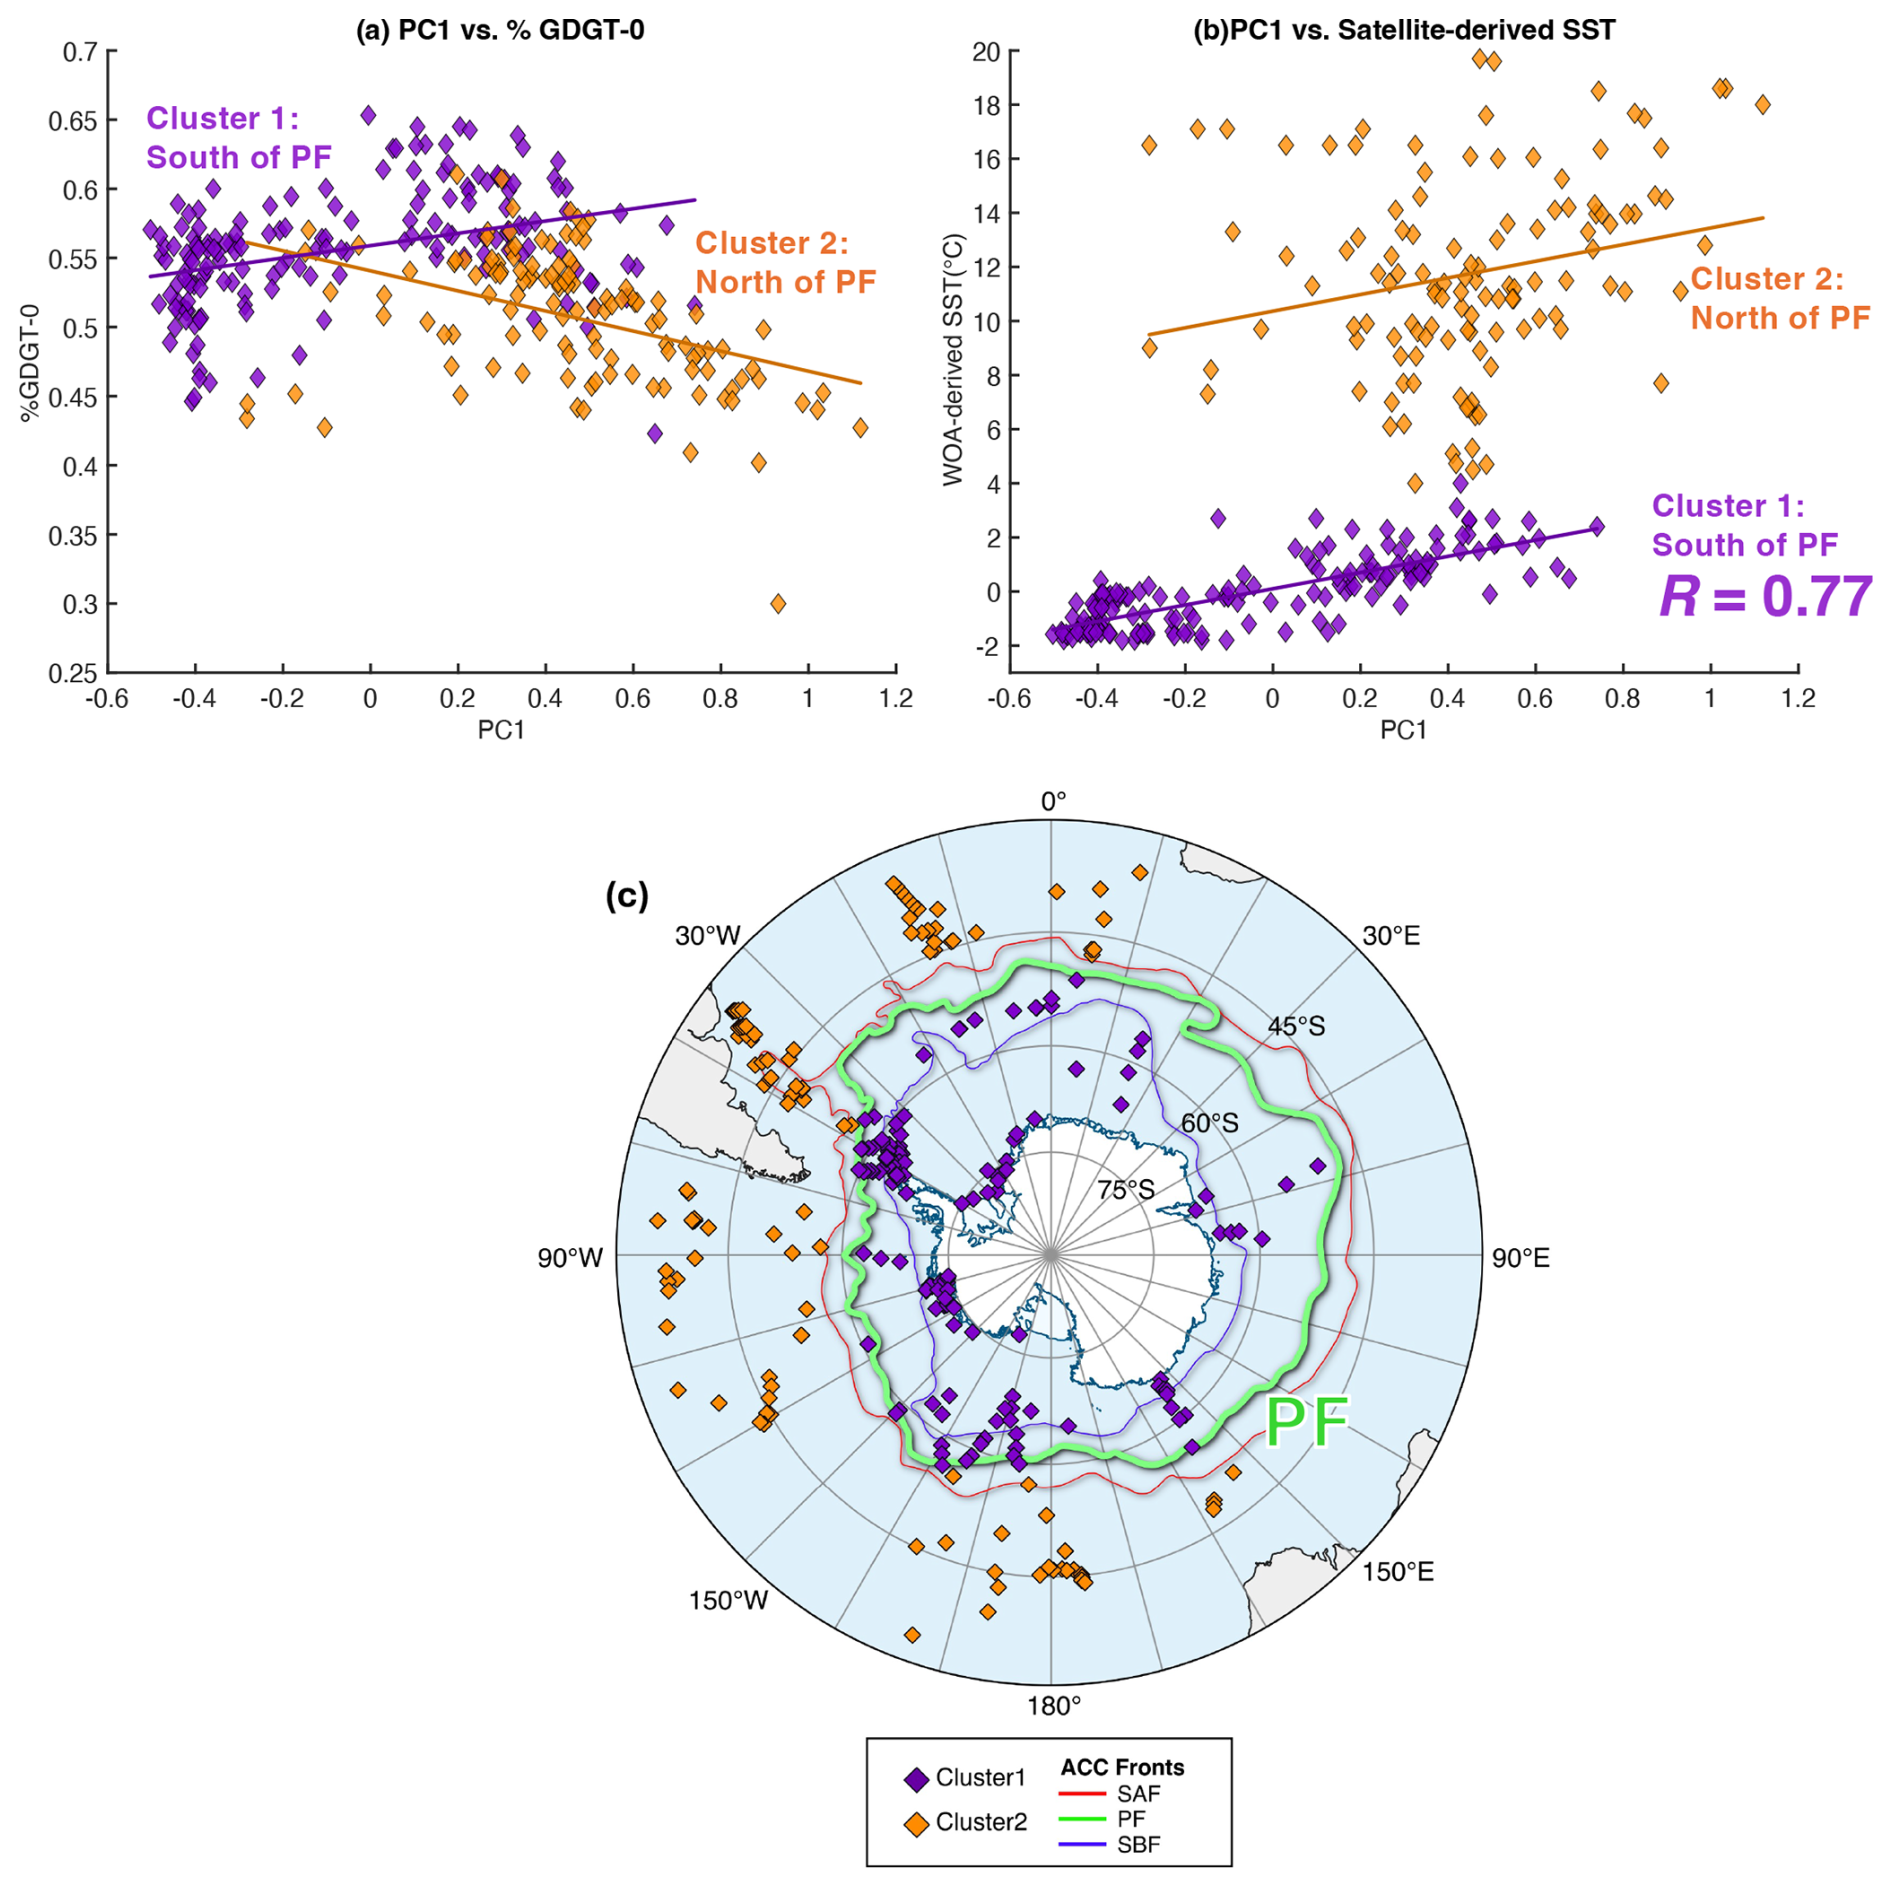
Figure 3Two clusters separated by the PF (n = 289). Correlation of Southern Ocean PC1 and (a) % GDGT-0; (b) WOA-derived in situ SST for the core-top data. (c) Map showing the locations of the Southern Ocean core-top samples south of 35° S. Orange diamonds represent the sites north of the PF, while purple diamonds represent the sites south of the PF. Core-top samples are from Tierney and Tingley (2014), Jaeschke et al. (2017), and Lamping et al. (2021). The oceanographic fronts are adapted from Orsi et al. (1995), and the map was created using Quantarctica (Matsuoka et al., 2018).
The relationship between PC1 and % GDGT-0 is also markedly different between the global and Southern Ocean datasets. In the global dataset, % GDGT-0 exhibits a strong negative correlation with PC1 (Table 2; R = −0.87), whereas in the Southern Ocean, this correlation is much weaker (Table 2; R = −0.25). Interestingly, the slope of the relationship changes across the PF: sites south of the PF exhibit a positive slope, while those to the north follow the negative trend observed globally (Fig. 3a; see also Fig. S4a). A similar divide is evident in the relationship between PC1 and SST in the Southern Ocean (Fig. 3b), where the data form two distinct clusters corresponding to locations north and south of the PF. In Cluster 1, which primarily represents sites in the Antarctic Zone (south of the PF), the correlation between PC1 and SST is stronger (R = 0.77) than that observed for the full Southern Ocean dataset (R = 0.69). These findings indicate that the distribution of isoGDGTs in the Southern Ocean differs between the regions north and south of the PF, with SST exerting a stronger influence on isoGDGT distributions in the Antarctic Zone.
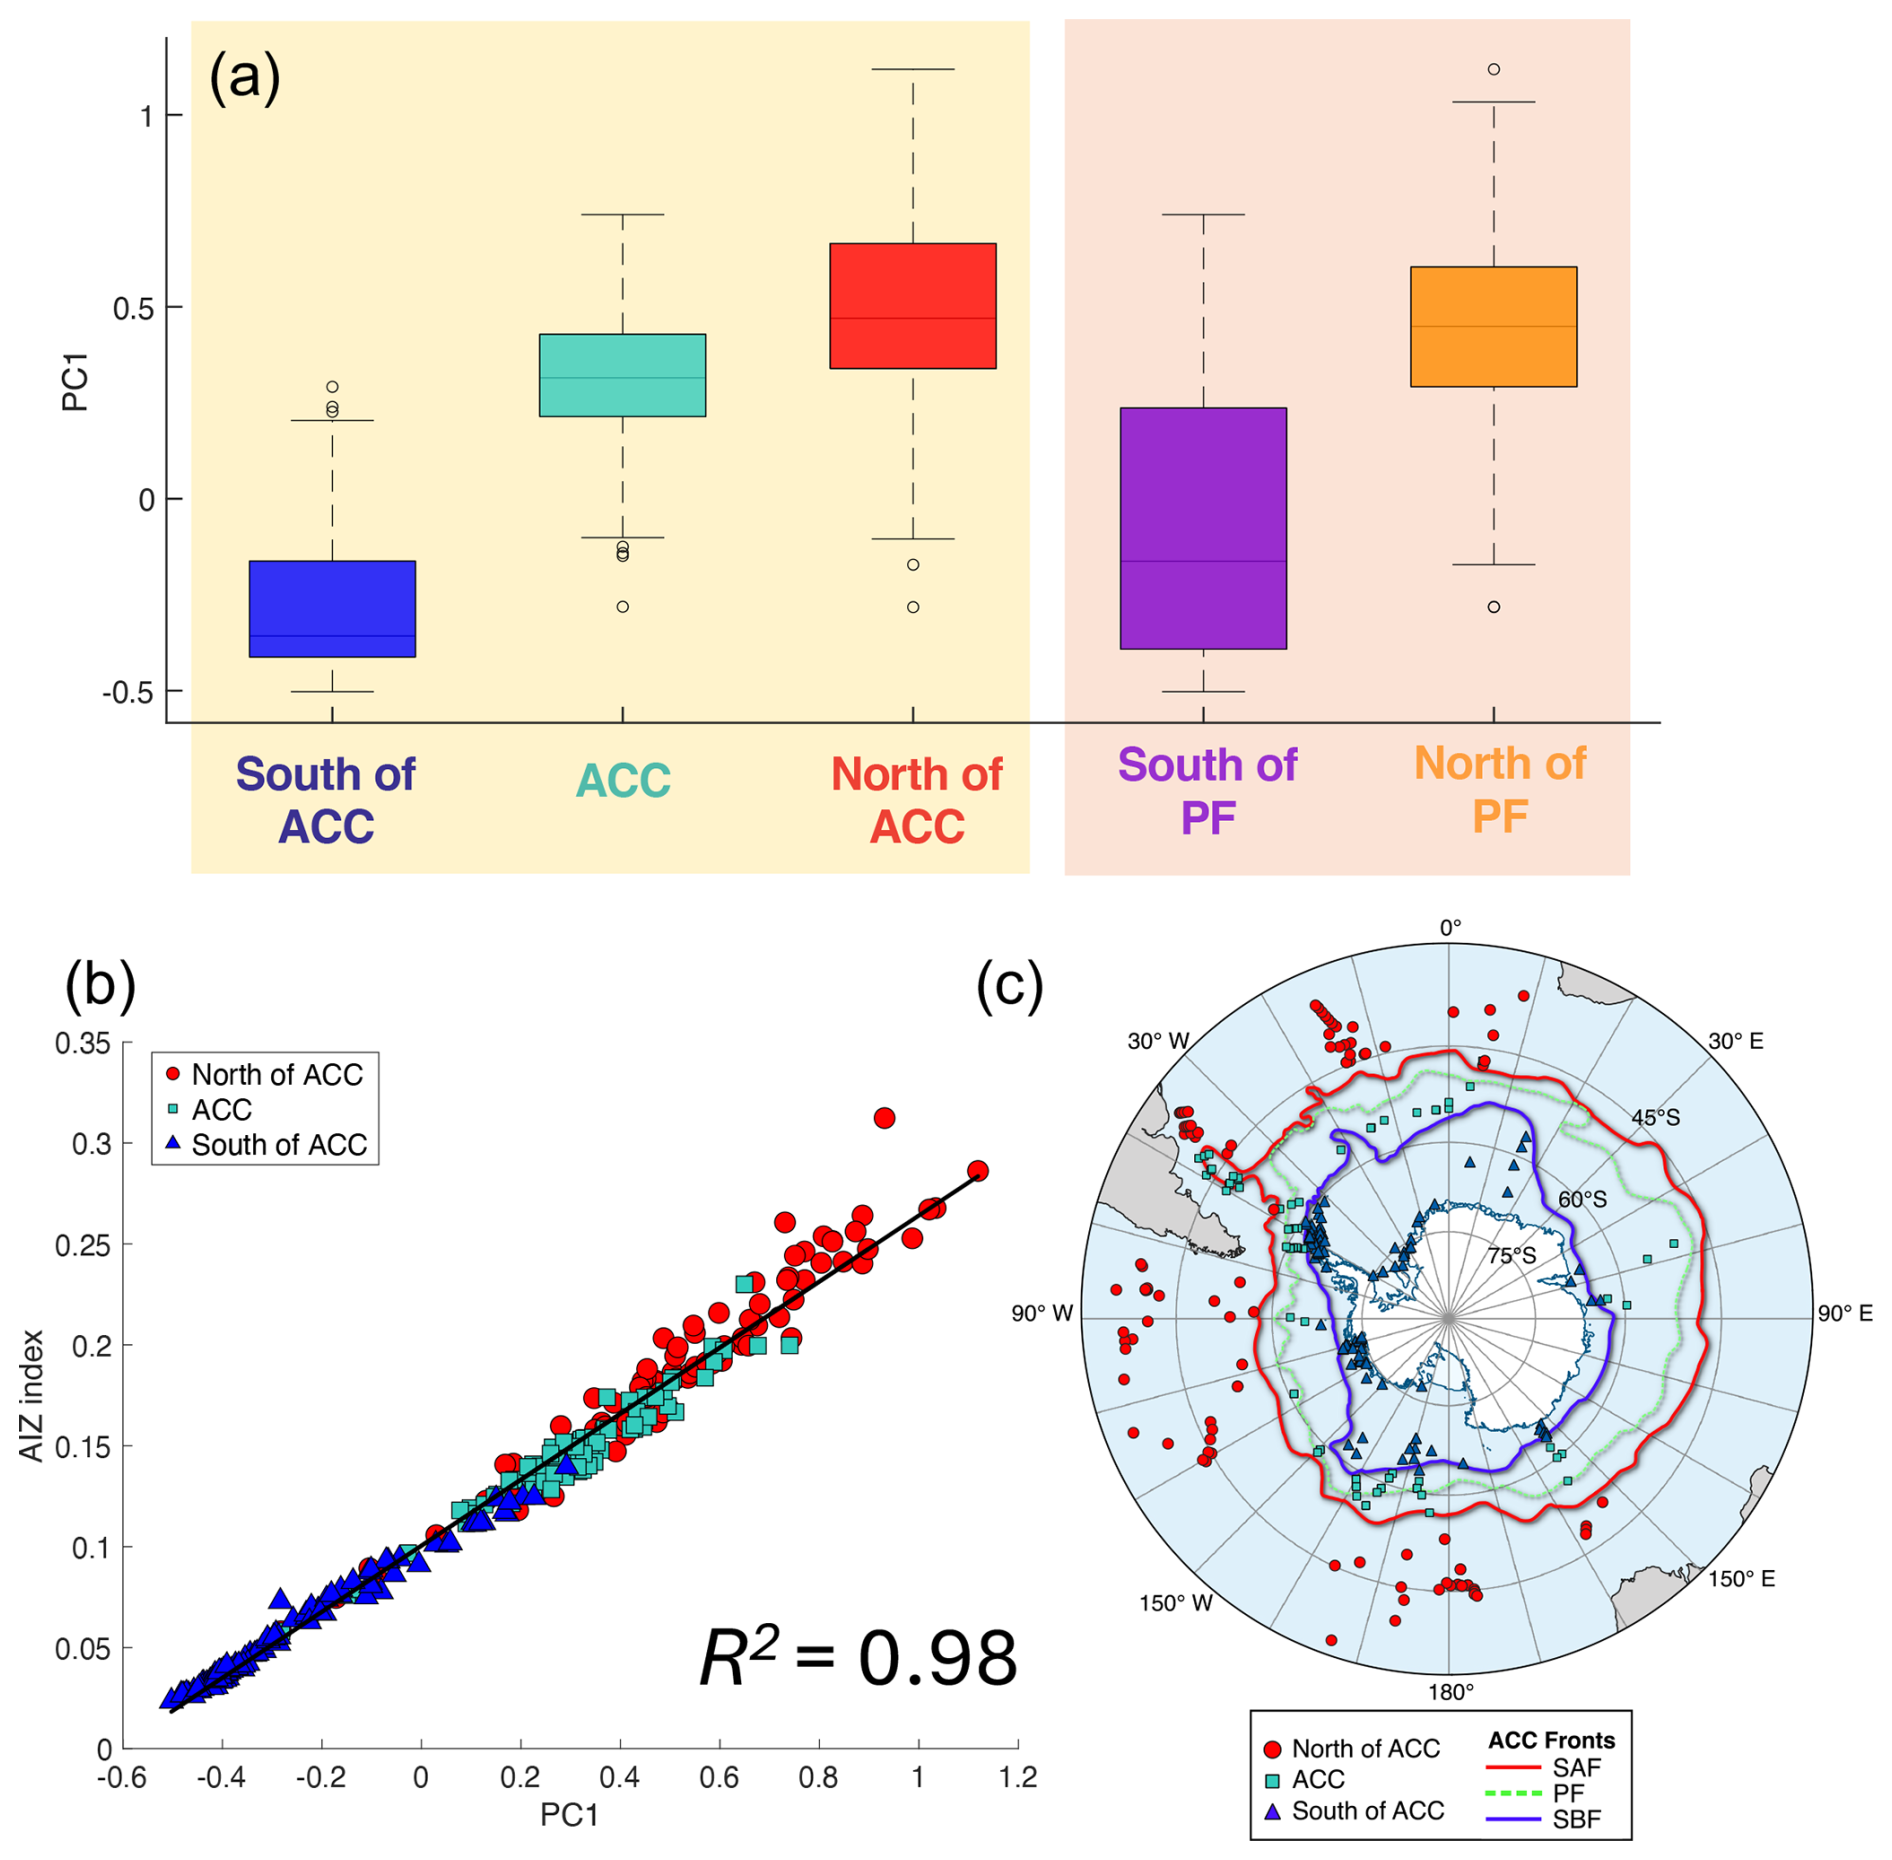
Figure 4PC1 values from the Southern Ocean, separated by frontal zones. (a) Box plot of PC1 in core-top sediments from the Southern Ocean (n = 289), grouped by ACC position. The light-yellow background highlights the modern water mass boundary defined by the SBF and SAF (Fig. 4c); the light orange background highlights the boundary defined by the PF (Fig. 3c). (b) Scatter plot of PC1 versus AIZ index. (c) Map showing the locations of Southern Ocean core-top samples south of 35° S. Red circle: north of the ACC (north of the SAF); teal square: centre of the ACC (between the SAF and SBF); blue triangle: south of the ACC (south of the SBF). Core-top samples are from Tierney and Tingley (2014), Jaeschke et al. (2017) and Lamping et al. (2021). The oceanographic fronts are adapted from Orsi et al. (1995), and the map was created using Quantarctica (Matsuoka et al., 2018).
4.3 Oceanographic controls on isoGDGT variability in the Southern Ocean
In the Southern Ocean, water column structure and associated processes such as vertical mixing and upwelling of CDW vary in the different zones delimited by the oceanic fronts, with a particularly pronounced transition at the PF (Carter et al., 2022). To explore how these oceanographic features relate to isoGDGT distributions, PC1 values from the Southern Ocean were compared across different water masses using two classification schemes: one dividing the ACC into south of the ACC (south of the SBF), centre of the ACC (between the SAF and SBF), and north of the ACC (north of the SAF) (Fig. 4c), and another based on position relative to the PF (north and south of the PF) (Fig. 3c). A boxplot of PC1 values separated by the three frontal zones (Fig. 4a) highlight distinct distributions for each zone, suggesting significant differences associated with zonal water mass structure. However, the most pronounced separation occurs between sites south and north of the PF. Furthermore, the scatter plot of PC1 vs. isoGDGT-based indices shows significant linear correlations, with data points transitioning from south of the ACC (lower left) to north of the ACC (upper right), with centre of the ACC forming an intermediate cluster (Fig. S3a). These results suggest that the spatial variability in isoGDGTs in the Southern Ocean is primarily caused by zonal water mass transitions across the ACC, with the PF representing a particularly sharp boundary. This is consistent with a previous study which shows a shift in composition of intact polar lipid GDGTs in the Scotia Sea across well-defined fronts (Spencer-Jones et al., 2021).
4.4 IsoGDGT-based water mass tracer
The PCA of isoGDGTs in the Southern Ocean core-top samples showed that PC1 (70.3 % of the variance) primarily reflects temperature and export depth associated with the zonal water mass properties along the north-south transect across the PF. Thus, the isoGDGTs which strongly correlate with PC1 could serve as a valid indicator of the zonal water masses in the ACC region. Based on the PCA analysis, we propose a novel isoGDGT-based index as a water mass tracer, composed of GDGT-0, GDGT-1, and GDGT-2, which exhibit significant correlation with PC1. We term this the Antarctic IsoGDGT Zonal (AIZ) index, defined as:
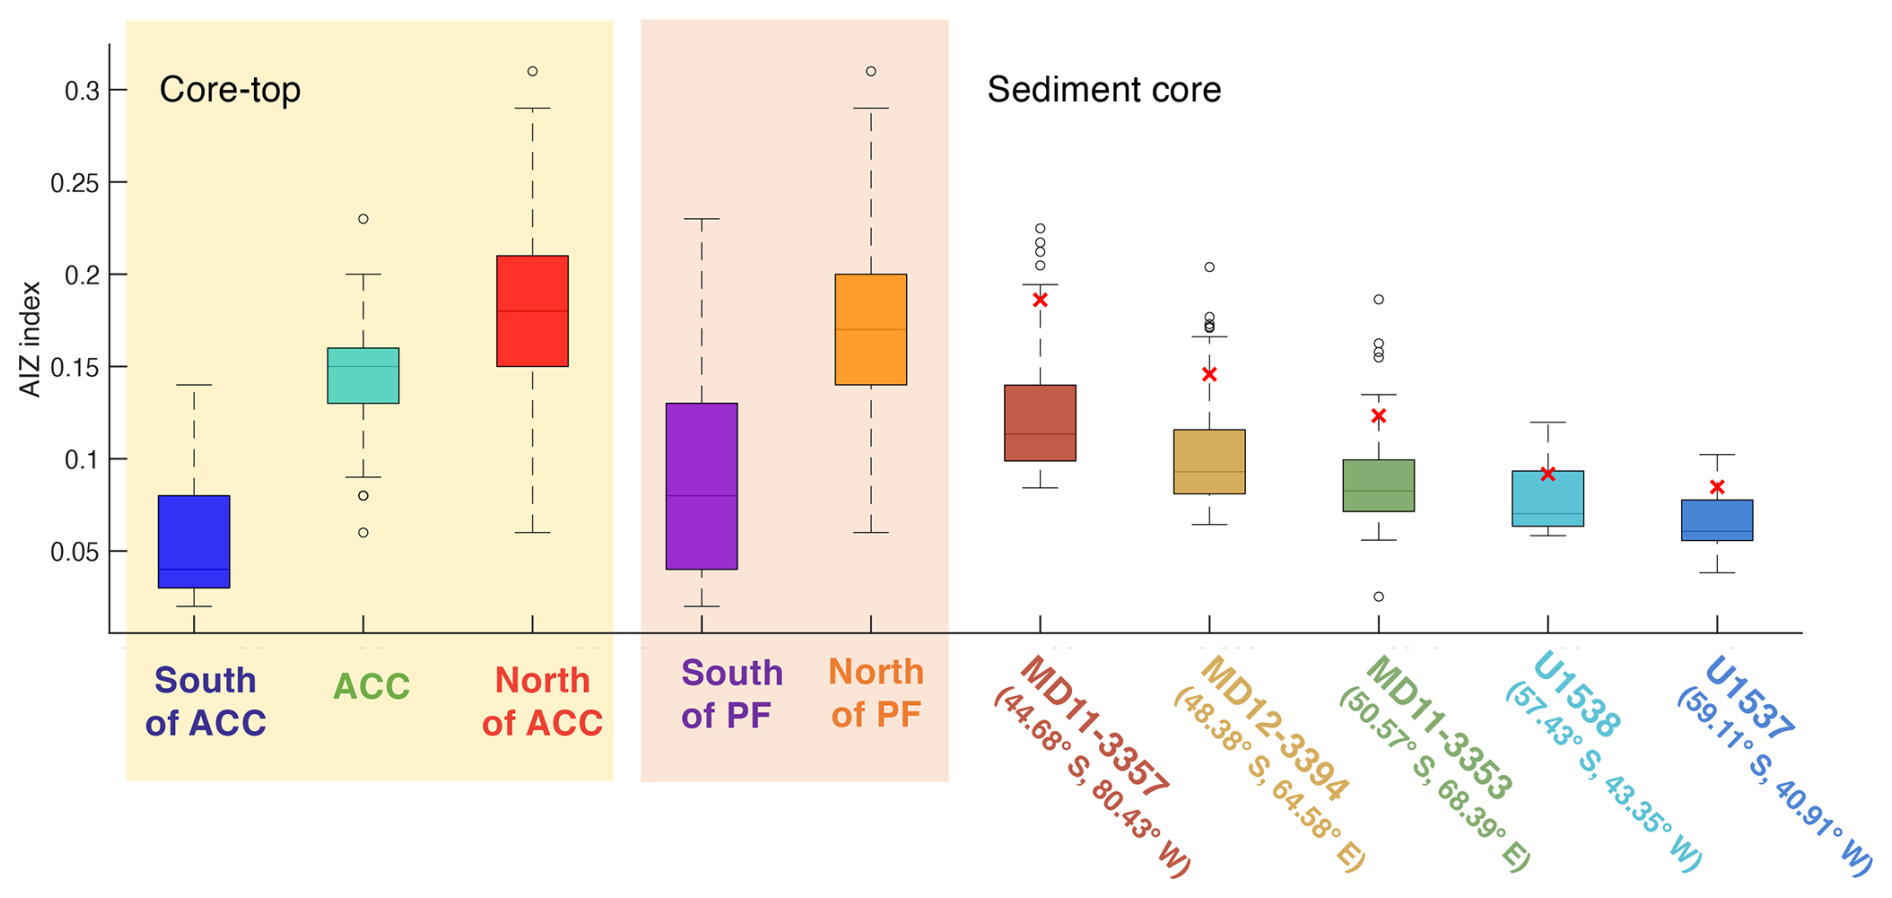
Figure 5Box plot of the AIZ index values in core-top sediments from the Southern Ocean (n=289) and sediment cores (MD11-3357, MD12-3394, MD11-3353, U1538, and U1537). Box elements represent maximum, upper quartile, median, lower quartile, and minimum values. Outliers are shown as open circles; red “x” marks indicate core-top values from each sediment core. The light-yellow background highlights the modern water mass boundary defined by the SBF and SAF (Fig. 4c); the light orange background highlights the boundary defined by the PF (Fig. 3c). Core-top samples are from Tierney and Tingley (2014), Jaeschke et al. (2017) and Lamping et al. (2021). Sediment core data: MD11-3357 (Ai et al., 2024), MD12-3394 and MD11-3353 (Ai et al., 2020), U1538 and U1537 (this study).
This new index has a strong linear relationship with PC1 (R2 = 0.98, n=289), with higher values from samples north of the PF (Fig. 4b). The index values display a clear gradient across the PF, with a threshold of 0.14 (± 0.03 standard deviation, SD) determined from the interquartile range of sites at the present-day PF position (Fig. 5).
We propose that the AIZ index responds to changes in archaeal community composition delineated by water mass changes across the PF. Genomic studies in the South Pacific have identified that oceanographic features, such as wind-driven circulation at the surface, are the primary drivers of prokaryotic richness and community diversity patterns (Kolody et al., 2025; Raes et al., 2018). North of the PF, archaeal richness increases northward and peaks at the STF border, which also acts as an ecological boundary (Raes et al., 2018). South of the PF, the diversity of the archaeal community is low, possibly due to the extremely cold and harsh conditions that may have acted as a habitat bottleneck (Alonso-Sáez et al., 2011). Genomic analysis in waters south of the PF shows “Candidatus Nitrosopumilus maritimus” dominates the Nitrososphaera phylum (Hernández et al., 2015; Kim et al., 2014; Sow et al., 2022). Moreover, Spencer-Jones et al. (2021) conducted a PCA of intact polar lipid GDGT compositions in the Amundsen and Scotia Seas, along with previously published clusters of Nitrososphaera (Bale et al., 2019) and found clustering within the Nitrosopumilales group in both regions due to the high relative abundances of GDGT-0. We suspect that the AIZ index captures these changes in archaeal community composition, specifically reflecting the dominance of cold-adapted Nitrosopumilales south of the PF in contrast to more diverse communities northward. Because these community shifts are tied to water mass boundaries, the AIZ index can serve as a good indicator for reconstructing past PF movements.
The difference between the traditional isoGDGT-based and AIZ-based approaches is likely attributed to the exclusion or inclusion of GDGT-0. GDGT-0 has traditionally been excluded from temperature indices. The fractional abundances of GDGT-0 are generally much higher than those of other GDGTs, which would otherwise overpower the index calculations (Schouten et al., 2002; Kim et al., 2010). Thus, one of the reasons for this exclusion is based on mathematical rather than ecological considerations. However, previous studies suggest that GDGT-0 does hold temperature information (Dunkley Jones et al., 2020; Kim et al., 2010; Zhao et al., 2025). The fractional abundance of GDGT-0 shows a strong correlation with SST in the global core-top dataset (R2 = 0.72,n = 894), indicating that GDGT-0 is intrinsically associated with growth temperature across a wide temperature range. In fact, the production of GDGT-0 increases with decreasing water temperature (Kim et al., 2010). This is explained by the physiological necessity to reduce the number of cyclopentane rings in the archaeal membrane lipids to maintain membrane fluidity at low temperatures (Fietz et al., 2020; Gabriel and Chong, 2000; Schouten et al., 2002). Moreover, Dunkley Jones et al. (2020) found GDGT-0, along with GDGT-3 to be the most informative GDGTs for predicting temperature using Gaussian process regression. Therefore, the inclusion of GDGT-0 becomes particularly important at high latitudes, where the relative abundance of GDGT-3 is substantially reduced. Another reason that GDGT-0 has traditionally been excluded from TEX86 is the potential influence of factors other than temperature on its abundance in sediments. There are alternative sources of GDGT-0, such as methanogenic and methanotrophic archaea living in anoxic sedimentary environments (Pancost et al., 2001; Zhang et al., 2011). However, methanotrophic archaea produce not only GDGT-0 but also GDGTs-1, -2, and -3 (Pancost et al., 2001; Schouten et al., 2013). We acknowledge the potential impact of non-Nitrososphaera sources when using GDGT-0. Nevertheless, by combining screening tests (% GDGT-0 and MI), these non-thermal influences can be minimized. We note that the Southern Ocean dataset we used here to establish the AIZ index was all screened by using % GDGT-0 and MI.
4.5 Regional core-top calibration for AIZ index
The weak correlation between temperature and conventional isoGDGT-based indices (TEX86 and ) in the polar region questions their applicability as reliable temperature proxies in the region (Fietz et al., 2016; Kim et al., 2008). On the other hand, the AIZ index exhibits a relatively strong correlation (R = 0.77) with SSTs in the Antarctic Zone, specifically south of the PF (Fig. 3b) where the source of GDGTs is predominantly the Nitrosopumilales group. This finding suggests that AIZ has a potential as a reliable proxy for reconstructing ocean temperature in the Antarctic Zone.
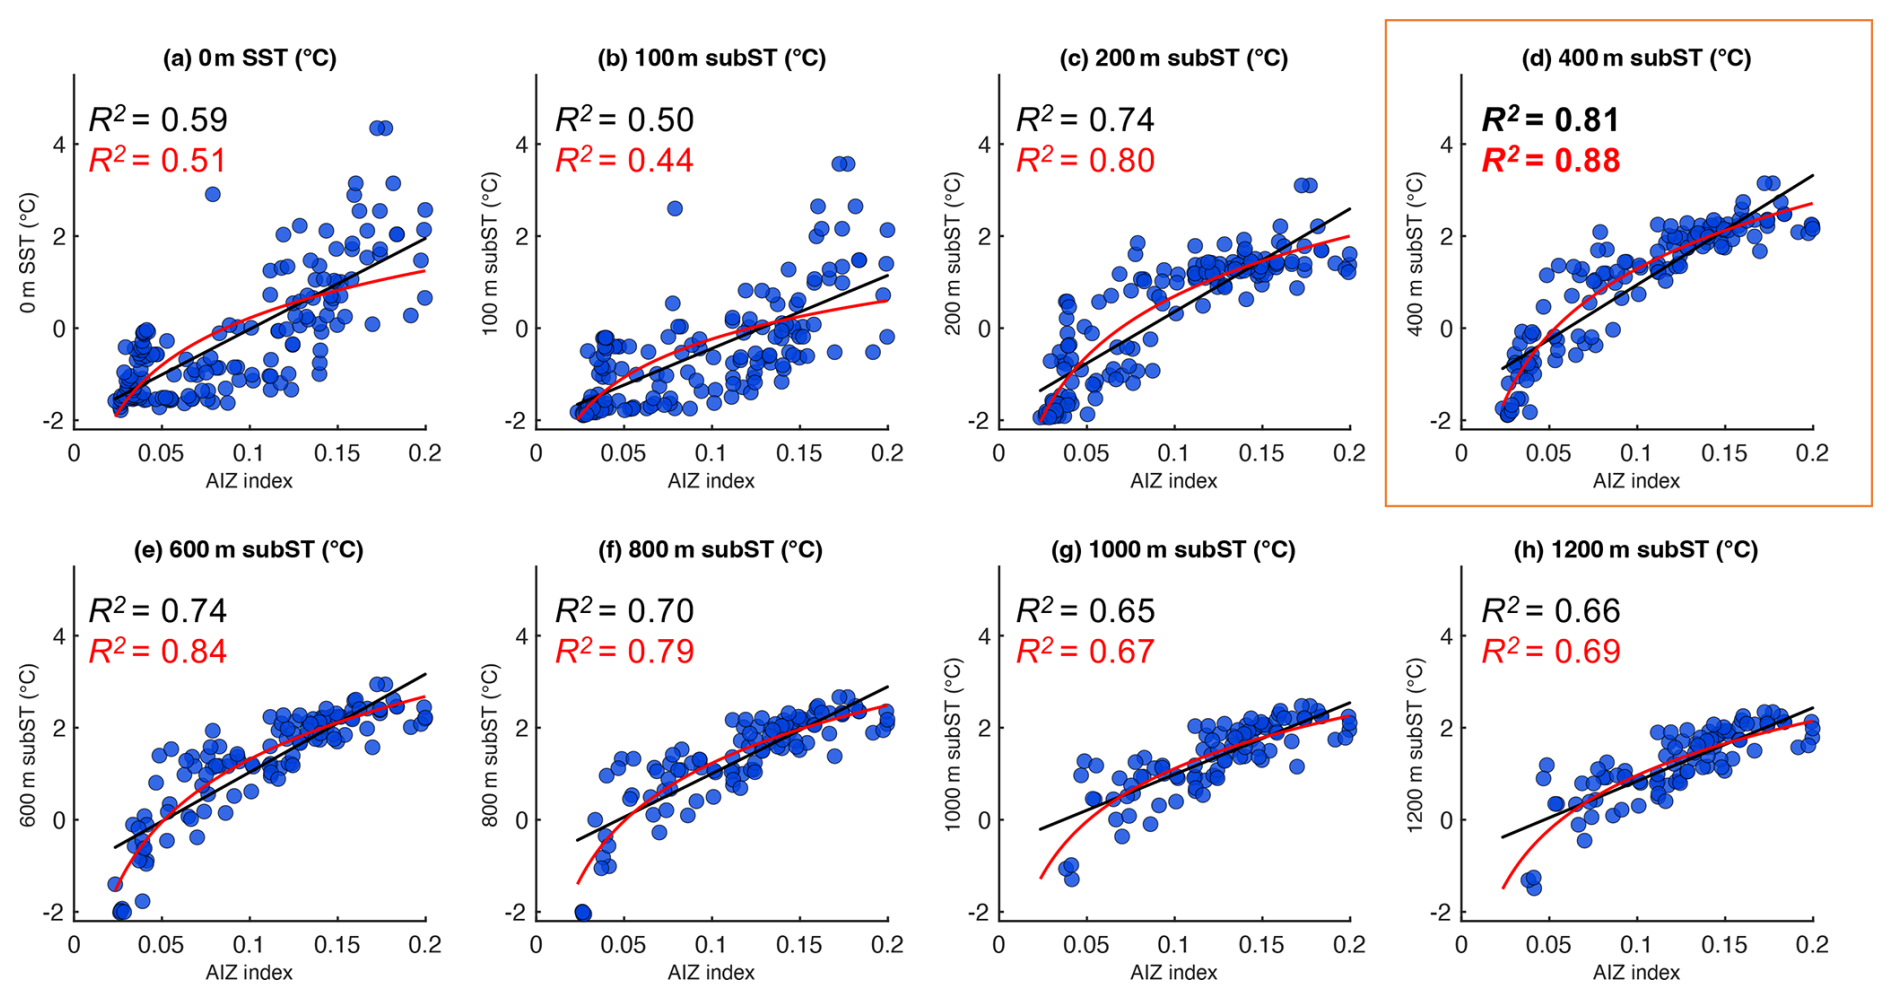
Figure 6Scatter plot of core-top AIZ values versus WOA-derived in situ mean annual ocean temperatures at various depths (0–1200 m) south of the PF (n = 96–168). Linear calibration lines and their R2 values are shown in black, and non-linear calibration curves and their R2 values are shown in red. Core-top samples are from Tierney and Tingley (2014), Jaeschke et al. (2017) and Lamping et al. (2021). Ocean temperatures are derived from the WOA18 0.25° × 0.25° gridded product (Boyer et al., 2018).
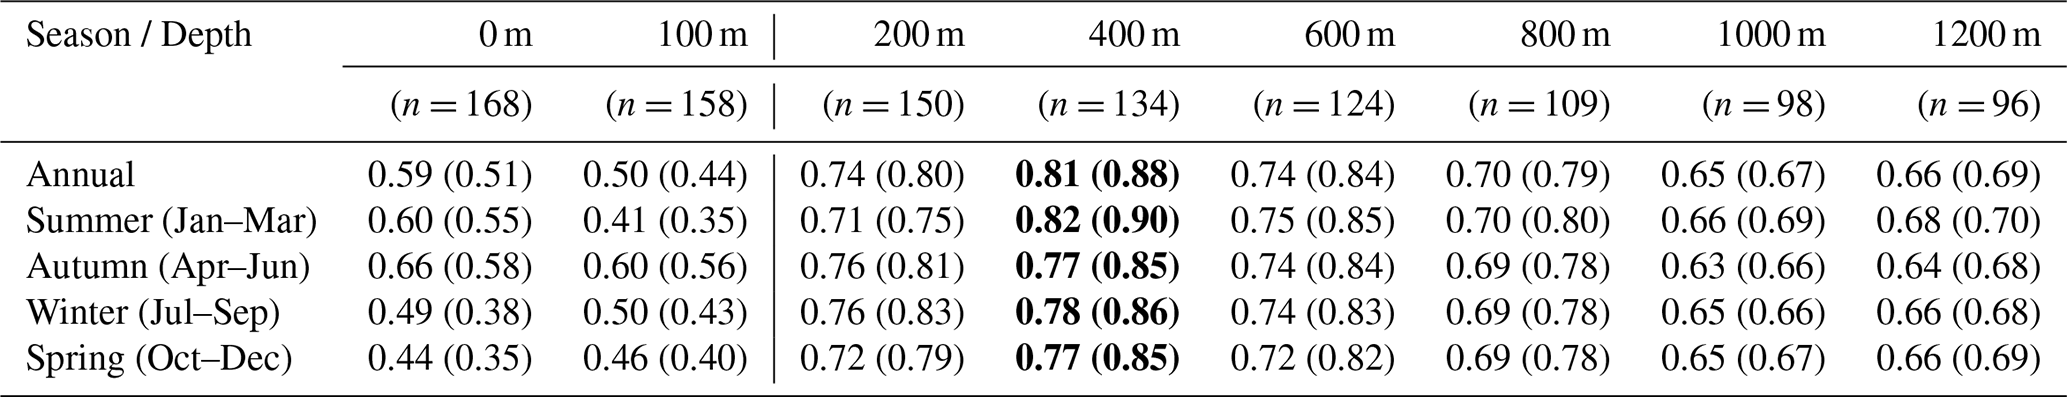
Table 3Coefficients of determination (R2) between AIZ values and water temperatures at different depths in different seasons at sites south of the PF. R2 values for the regression lines and logarithmic curves are shown with and without brackets, respectively. The highest R2 values in every season are shown in bold.
AIZ values are calculated from core-top isoGDGT data from Tierney and Tingley (2014), Jaeschke et al. (2017) and Lamping et al. (2021). Ocean temperature data are derived from the WOA18 0.25° × 0.25° gridded product (Boyer et al., 2018).
It has been reported that the seasonality and depth of isoGDGT production is regionally dependent in the Southern Ocean (Church et al., 2003; Park et al., 2019; Sow et al., 2022; Spencer-Jones et al., 2021). To evaluate the potential of AIZ as a temperature proxy, we examined correlations between AIZ values and ocean temperatures at different depths (0–1200 m) across different seasons (summer, autumn, winter, spring, and annual mean) derived from the WOA18 0.25° × 0.25° gridded product (Boyer et al., 2018). The results show that the correlation varies considerably with depth but is less affected by seasonal changes. Significant correlations (R2 = 0.63–0.82) were observed at depths below 200 m in all seasons, peaking at 400 m depth (R2 = 0.77–0.82) (Table 3, Fig. 6). Notably, the correlation of the logarithmic calibration (R2 = 0.66–0.90) is higher than that of the linear calibration at depths below 200 m (Table 3, Fig. 6). This pattern of improved correlation with non-linear calibrations has been recognised previously for conventional isoGDGT indices in Southern Ocean core-top datasets (Park et al., 2019). Correlations between AIZ values and both salinity and oxygen concentration at subsurface depths across seasons were also evaluated, but these correlations were much weaker than that between AIZ and ocean temperature (R2 = 0.0001–0.45).
Our results, which show the highest correlation of the AIZ index with subsurface temperatures, suggest that isoGDGTs in the Southern Ocean are primarily produced at subsurface depths, potentially associated with the archaea inhabiting CDW. CDW is pervasive throughout the water column but centred at approximately 500 m depth south of the PF (Holland et al., 2020), consistent with the 400 m depth where the strongest correlation is observed. Subsurface production of isoGDGTs from Nitrososphaera in the Southern Ocean has also been suggested by previous work, including 16S rRNA gene (Church et al., 2003; Kalanetra et al., 2009; Sow et al., 2022), living archaea (Spencer-Jones et al., 2021), sediment trap studies (Park et al., 2019) and sedimentary records (Etourneau et al., 2019; Ho and Laepple, 2016; Kim et al., 2012; Lamping et al., 2021; Liu et al., 2020). Furthermore, it has been reported that there are significant reductions in Nitrososphaera abundance above 100 m depth in the Southern Ocean (Signori et al., 2014) possibly due to light inhibition (Merbt et al., 2012), which is consistent with the decline in correlation above 200 m depth. These lines of evidence indicate that the AIZ index most likely reflects mesopelagic (200–1000 m depth) water temperature. The calibration equations based on annual mean temperature at 400 m depth (subsurface temperature: subST) where the strongest correlations (both linear and logarithmic) were obtained, are as follows:
It is important to note that AIZ index-based palaeothermometry is only applicable within the Antarctic Zone. We suggest a threshold value of 0.14 (± 0.03 SD) based on the present PF position. Below this threshold, deposition occurs south of the PF, where isoGDGTs are predominantly produced by Nitrosopumilales group, and isoGDGT composition shows a strong correlation with temperature. In contrast, above 0.14, deposition occurs north of the PF, where different archaeal communities result in a distinct temperature-AIZ relationship, and the calibration cannot be reliably applied. If a sediment core reconstruction contains intervals where AIZ values fluctuate above and below 0.14, temperatures should only be reconstructed for intervals below this threshold.
To further test the validity of the AIZ index as a water temperature proxy in the Antarctic Zone, we compared it with the OH-isoGDGT derived indices (, RI-OH, RI-OH′, OHc, and % OH; Table S1 in the Supplement). While OH-isoGDGTs are not available for all datasets, we used dataset from Lamping et al. (2021), which contains both isoGDGTs and OH-isoGDGTs (n = 66), to compare different temperature proxies. We compared SST (0 and 0–200 m) derived from OH-isoGDGT-based indices with subST (400 m) derived from the AIZ index. The AIZ index shows the strongest correlations with (R2 = 0.94) and OHc (R2 = 0.94), while other OH-isoGDGT-based indices also demonstrate good correlations listed as follows: RI-OH (R2 = 0.79), RI-OH′ (R2 = 0.68), and % OH (R2 = 0.64) (Fig. S5a–e in the Supplement). These strong correlations between the AIZ index and OH-isoGDGT-based indices, particularly with the recently developed , suggest that both proxies capture similar temperature patterns. However, when comparing calibration performance, the AIZ-derived subST400 m shows better agreement with WOA-derived and modelled annual mean subST at 410 m (provided by Lamping et al., 2021) than -derived SST0–200 m (Fig. S5f–g), highlighting the importance of regionally-specific calibrations in polar regions. We agree with Bijl et al. (2025) and Varma et al. (2024) that OH-isoGDGTs are valuable for temperature reconstruction, particularly in regions with temperatures < 15 °C, and recommend measuring OH-isoGDGTs in future studies. Nevertheless, the AIZ index and its calibration offer a valuable tool for the many instances where isoGDGT data are already published or measured, but OH-isoGDGTs are not available.
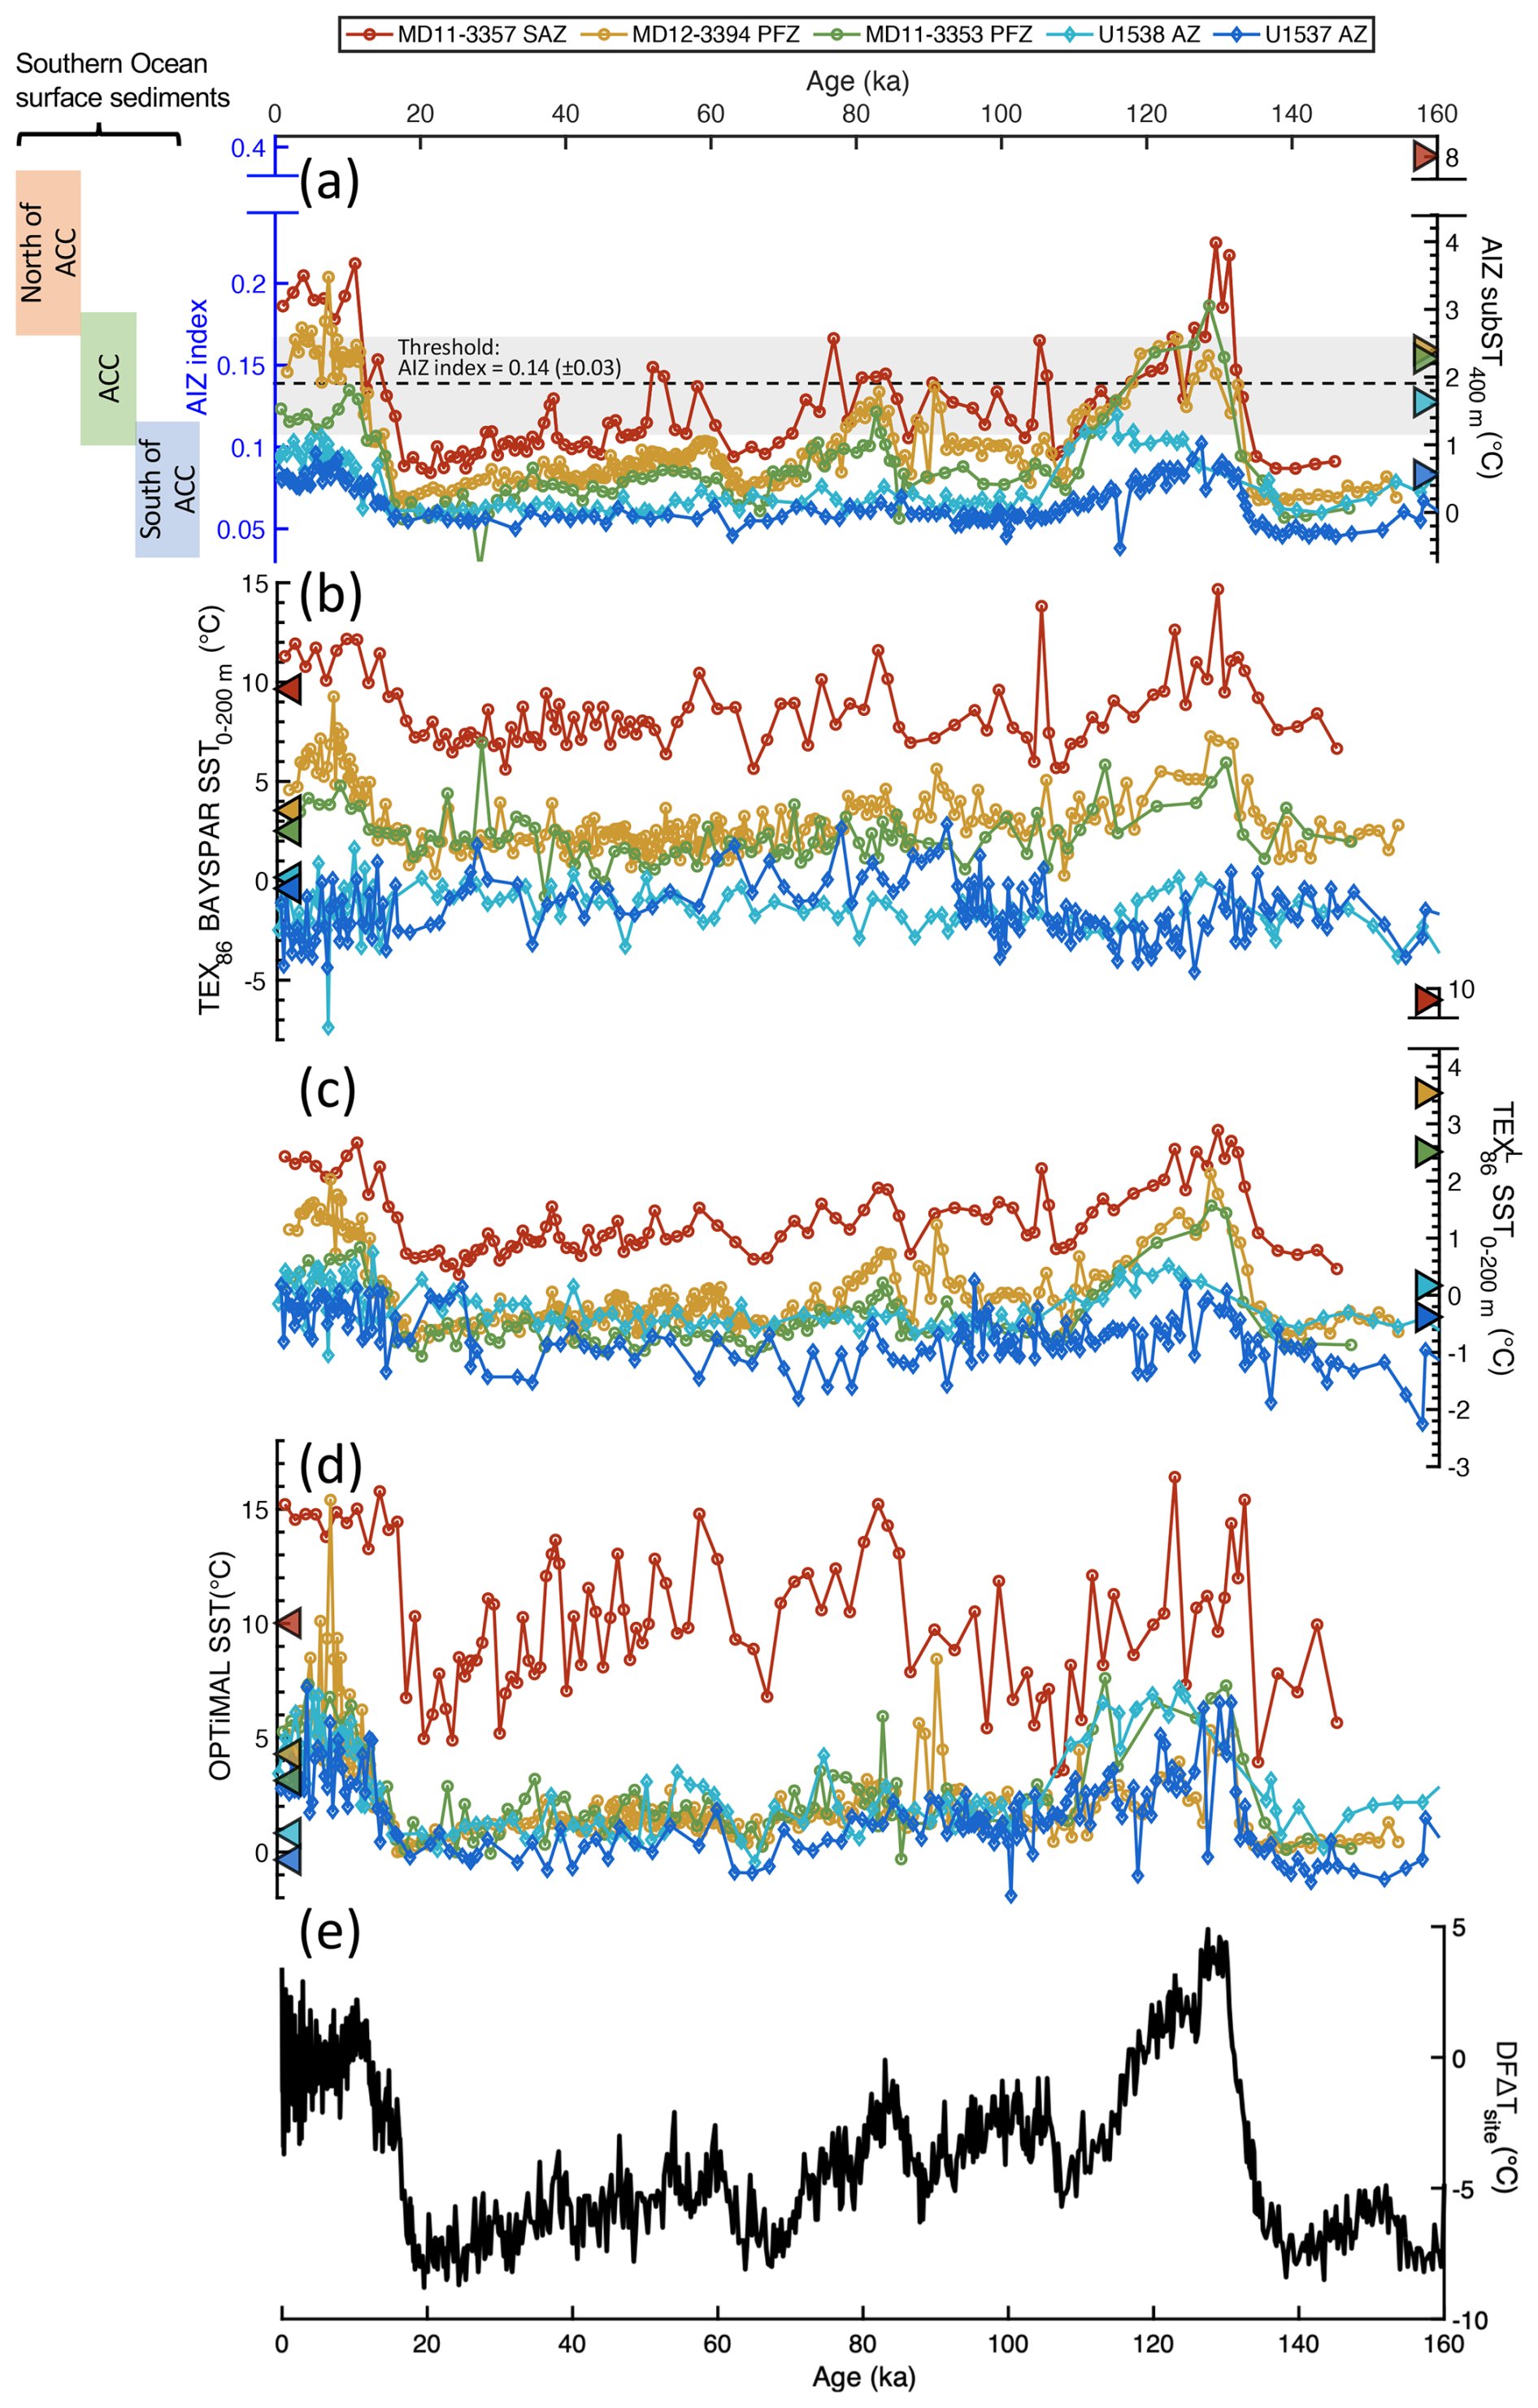
Figure 7IsoGDGT-based SST and records in five sediment cores and temperature anomalies in the Dome Fuji ice core (DF ΔTsite) over the past 160 kyr. (a) AIZ index values and modern reference values for each frontal zone (left axis), and AIZ-based subST400 m (right axis), (b) TEX86 BAYSPAR SST0–200 m, (c) SST0–200 m, (d) OPTiMAL SST, and (e) temperature anomalies in Dome Fuji ice core (Uemura et al., 2018). Sediment cores are shown as: dark red circles MD11-3357 (Ai et al., 2024), dark yellow circles MD12-3394 (Ai et al., 2020), green circles MD11-3353 (Ai et al., 2020), light blue diamonds U1538 (this study), and blue diamonds U1537 (this study). Modern SST/subST values from WOA18 are shown as triangles (Boyer et al., 2018). Left panel (a) represents the range of the AIZ index values in Southern Ocean surface sediments for each modern oceanic front (south of ACC: 0.04–0.08 (± 0.03), ACC: 0.13–0.16 (± 0.03), north of ACC: 0.15–0.22 (± 0.04), derived from Fig. 5). Gray shaded area shows the AIZ threshold of 0.14 (± 0.03), where values below this threshold indicate positions south of the PF. Note that AIZ index should not be used as a temperature proxy when its value exceeds 0.14.
4.6 Applying the AIZ index to Southern Ocean sediment cores
4.6.1 Evaluation of the AIZ index as a water mass tracer across the ACC zone
To further evaluate the applicability of the AIZ index as a proxy for water mass and temperature in the Southern Ocean, we applied it to the three previously reported sedimentary isoGDGT records collected from the southern Indian Ocean, and the two newly generated records from the Scotia Sea (Fig. 1). Figure S6 in the Supplement shows a scatter plot of PC1 and AIZ records in the five sediment cores together with that of the Southern Ocean core-top samples. The PC1 and AIZ indices in the five sediment cores are strongly correlated (R2 = 0.96–0.98), similar to the Southern Ocean core-top dataset. This demonstrates the high potential of the AIZ index as a robust tracer for zonal water masses in the ACC zone. Figure 7a shows sedimentary records of the AIZ index at the five sites over the past 160 kyr. Core-top AIZ values in the sediment cores decrease with increasing latitude and fall within the range of AIZ values for each zonal water mass derived from modern core-top data, which are consistent with the modern positions of the oceanic fronts.
Table 4Comparison of isoGDGT indices with reconstructed core-top SST/subST and Glacial-Interglacial (G-IG) cycles. The core-top values from each sediment cores which are within 1.0 °C of the WOA-derived SST/subST are shown in bold.
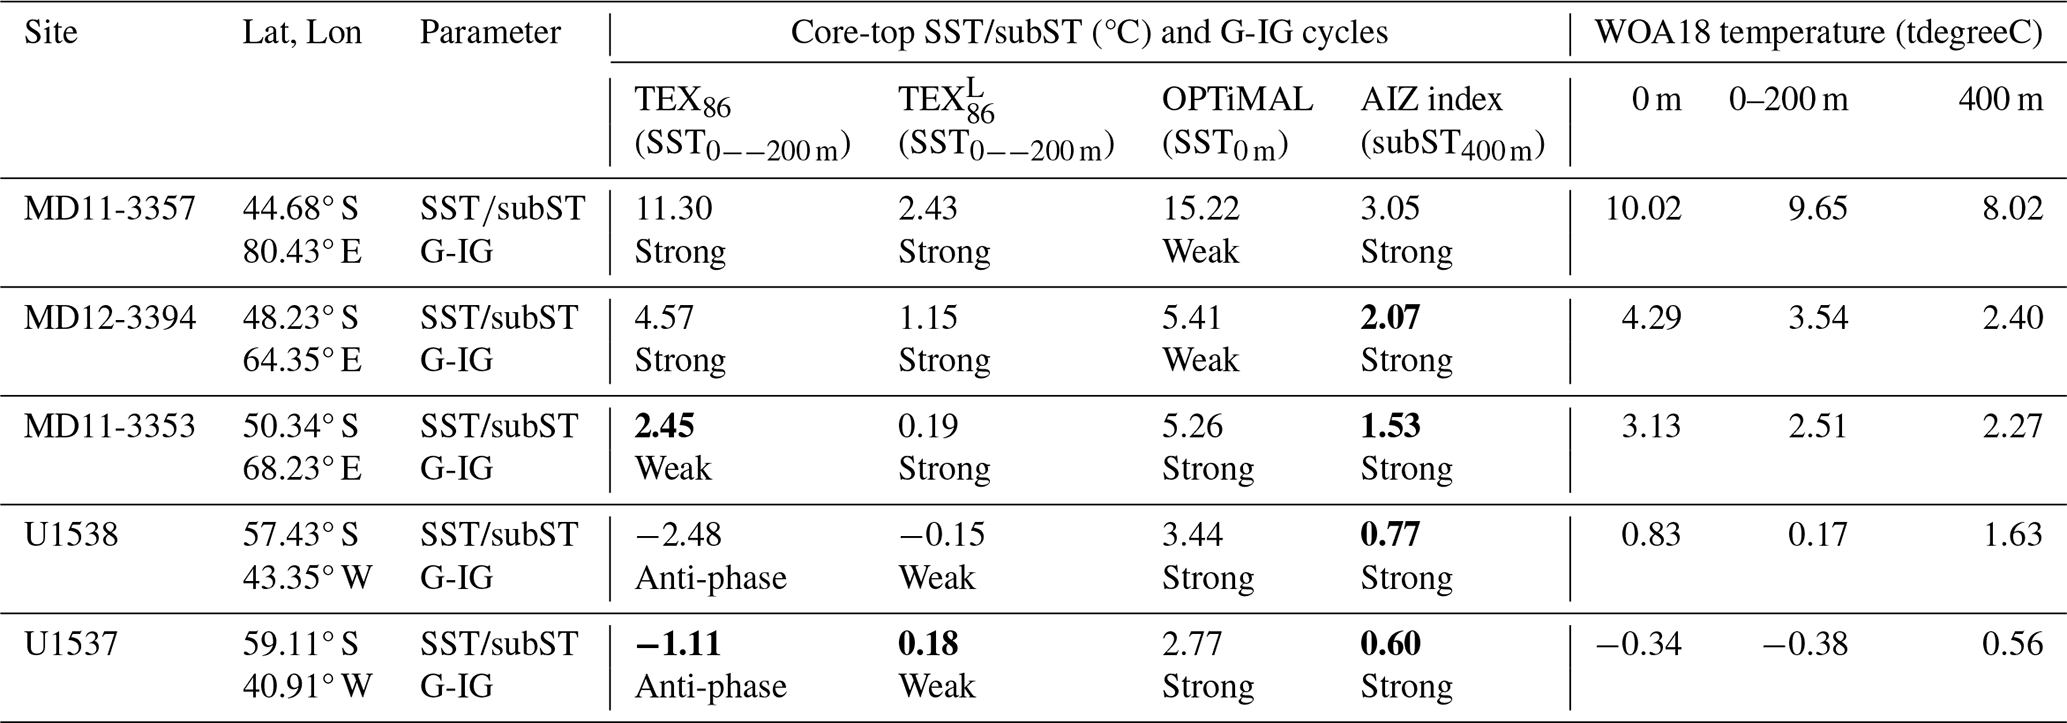
TEX86 and are calibrated to SST at 0–200 m (Hagemann et al., 2023; Tierney and Tingley, 2014), whereas OPTiMAL is calibrated to SST at 0 m (Dunkley Jones et al., 2020), and AIZ index is calibrated to subST at 400 m. The G-IG shows the strength of the similarity to the ice core ΔT in orbital-scale variation. Temperature data are from the WOA18 gridded product (Boyer et al., 2018). Sediment core data: MD11-3357 (Ai et al., 2024), MD12-3394 and MD11-3353 (Ai et al., 2020), U1538 and U1537 (this study).
The AIZ records from all five sediment cores reflect glacial.-interglacial (G-IG) cycles over the past 160 kyrs, with lower and higher values in glacial and interglacial periods, respectively (Fig. 7a). This variation is coherent with the temperature anomaly (ΔT) in the Dome Fuji ice core (Uemura et al., 2018) (Fig. 7e), suggesting a coupling of Antarctic temperature and ACC dynamics with north-south migration of the ACC position during the G-IG cycle. During the Last Interglacial, the AIZ values in cores MD11-3357, MD12-3394 and MD11-3353 correspond to modern values north of ACC, while those in U1538 and U1537 fall within the range of centre of the ACC. This suggests that the ACC migrated ∼ 5° southward during the Last Interglacial compared to its present position. On the other hand, during the Last Glacial Maximum AIZ values in all five sites align with values south of the ACC, suggesting a maximum northward shift of ∼ 10° latitude during the Last Glacial Maximum. These results are consistent with previous studies that also indicate the south-north migration of the ACC during G-IG cycles (Abelmann et al., 2015; Bianchi and Gersonde, 2002; Chadwick et al., 2020; Civel-Mazens et al., 2021; Gersonde et al., 2005). These results highlight that the AIZ index can be a powerful proxy for tracing oceanic front migration around the ACC.
4.6.2 Comparing isoGDGT-based temperature records in the Southern Ocean during the last 160 kyr
To assess the potential of the AIZ index as a temperature proxy in the Antarctic Zone, the 400 m depth linear calibration equation (Eq. 8) was applied to the five sediment cores in the ACC zone. AIZ index-based temperature estimates were then compared with temperatures reconstructed using conventional approaches, including TEX86 BAYSPAR SST0–200 m, SST0–200 m, and OPTiMAL SST approaches (Dunkley Jones et al., 2020; Hagemann et al., 2023; Tierney and Tingley, 2014).
Comparison of temperature records derived from each approach revealed that the performance of these methods varied with latitudes (Fig. 7a–d). All isoGDGT-derived temperature showed clear latitudinal trends, with temperature decreasing towards the high latitude sites, consistent with modern meridional temperature gradient in the region. Comparison of modern and core-top temperature revealed that TEX86 BAYSPAR SST0–200 m significantly underestimated modern SST0–200 m by approximately 2 °C at the southern sites (i.e. U1538 and U1537) and slightly overestimated at the northern sites (i.e. MD11-3357 and MD12-3394) (Table 4 and Fig. 7b). On the other hand, the core-top -derived SST0–200 m (using the local calibration of Hagemann et al., 2023) exhibited substantial underestimation at most sites (Fig. 7c), while OPTiMAL SSTs estimates in the core-top samples showed little latitudinal variation for four of the sites and were overestimated at most sites (Fig. 7d). In contrast to these approaches, AIZ-based subST400 m in the core-top samples closely match modern subsurface temperatures except for MD11-3357, which is located north of the PF and has an AIZ value exceeding the threshold 0.14 (± 0.03). The underestimation at the northernmost site arises because the AIZ calibration is designed specifically for the region south of the PF, highlighting the application of AIZ index palaeothermometry is limited to south of the PF.
AIZ-derived subST400 m records at all sites and OPTiMAL-derived SST records at most sites (except MD11-3357) represent a typical G-IG cycle with lower and higher values during glacial and interglacial periods, respectively, consistent with the temperature anomaly (ΔT) record in the Dome Fuji ice core (Uemura et al., 2018). On the other hand, orbital-scale SST variations reconstructed using conventional isoGDGT indices (TEX86 and ) differ significantly among sites, and the typical G-IG variation pattern becomes unclear closer to the poles. For instance, TEX86 BAYSPAR SST records show weaker and even anti-phase G-IG variations at the southern sites (MD11-3353, U1538 and U1537). Similarly, -based SSTs at the southern sites (U1538 and U1537) fail to show distinct G-IG cycles. These results show that the AIZ index seems to provide a more reliable estimate of temperature compared to other approaches in the Antarctic Zone.
The difference in variation patterns observed in G-IG cycles between the traditional isoGDGT-based and AIZ/OPTiMAL-based approaches is likely attributed to the exclusion or inclusion of GDGT-0. Traditional indices that exclude GDGT-0, especially TEX86, lose their thermal sensitivity as temperatures decline and as the sites approach the poles (Fig. S7 in the Supplement), reducing their suitability for high-latitude paleotemperature reconstruction. In contrast, both the AIZ index and OPTiMAL include GDGT-0 in their calculation and show clear G-IG cycles, suggesting that GDGT-0 is a critical component in reconstructing temperature at southern high latitudes. These results show that AIZ index, through its incorporation of GDGT-0, is suitable for estimating temperatures in the Antarctic Zone.
- 1.
Reanalysis of core-top isoGDGT data for the global ocean and the Southern Ocean (south of 35° S) reveals that isoGDGT distributions in the Southern Ocean differ from global patterns.
- 2.
IsoGDGT distributions in the Southern Ocean are primarily influenced by temperature and export depth, both shaped by zonal water mass properties across the ACC. The relative abundances of GDGT-0, GDGT-1, and GDGT-2 reflect these water mass-dependent influences. Based on this finding, we propose the AIZ index, a novel isoGDGT-based proxy, which can serve as a water mass tracer within the ACC zone.
- 3.
The AIZ index captures changes in archaeal community composition across water mass boundaries, reflecting the dominance of cold-adapted Nitrosopumilales (characterized by high GDGT-0 abundances) south of the PF versus more diverse assemblages northward. A threshold value of 0.14 ( ± 0.03 SD) effectively delineates this boundary, enabling the AIZ index to serve as a tracer for PF position.
- 4.
South of the PF (AIZ < 0.14), the AIZ index in core-top samples correlates significantly with ocean temperature at 400 m water depth (R2 = 0.81), suggesting its potential for reconstructing past temperatures in the Antarctic Zone.
- 5.
Application of the AIZ index to late Pleistocene sediment cores collected from the Southern Ocean confirms its reliability as a tracer of ocean front movement within the ACC zone and temperature proxy in the Antarctic Zone.
- 6.
These findings highlight the potential of isoGDGTs in enhancing our understanding of palaeoceanographic conditions in the Southern Ocean, providing a valuable tool for future palaeoceanographic and climate studies.
All data used in this study are publicly available at https://doi.org/10.5281/zenodo.17060619 (Ishii, 2025). Any further requests for data may be directed to the corresponding author.
The supplement related to this article is available online at https://doi.org/10.5194/cp-22-585-2026-supplement.
HI and OS designed the project. HI, OS and MY measured and analysed the data. HI drafted the manuscript with support from all authors. All authors discussed the results, commented on the manuscript and approved the final version.
The contact author has declared that none of the authors has any competing interests.
Publisher's note: Copernicus Publications remains neutral with regard to jurisdictional claims made in the text, published maps, institutional affiliations, or any other geographical representation in this paper. The authors bear the ultimate responsibility for providing appropriate place names. Views expressed in the text are those of the authors and do not necessarily reflect the views of the publisher.
Samples and data were provided by the International Ocean Discovery Program (IODP). We thank the captain, crew and IODP staff that made IODP Expedition 382 and subsequent research successful. We offer our special thanks to the lab technicians Kaori Ono and Yuka Nakamura.
This research is supported by the Japan Society for the Promotion of Science (grant nos. 17H01166, 20H00626, 24H00074, 24K21555) grant awarded to OS funded by the Ministry of Education, Culture, Sports, Science and Technology, Japan.
This paper was edited by Erin McClymont and reviewed by Julia Rieke Hagemann and one anonymous referee.
Abelmann, A., Gersonde, R., Knorr, G., Zhang, X., Chapligin, B., Maier, E., Esper, O., Friedrichsen, H., Lohmann, G., Meyer, H., and Tiedemann, R.: The seasonal sea-ice zone in the glacial Southern Ocean as a carbon sink, Nat. Commun., 6, 8136, https://doi.org/10.1038/ncomms9136, 2015.
Ai, X. E., Studer, A. S., Sigman, D. M., Martínez-García, A., Fripiat, F., Thöle, L. M., Michel, E., Gottschalk, J., Arnold, L., Moretti, S., Schmitt, M., Oleynik, S., Jaccard, S. L., and Haug, G. H.: Southern Ocean upwelling, Earth's obliquity, and glacial-interglacial atmospheric CO2 change, Science, 370, 1348–1352, https://doi.org/10.1126/science.abd2115, 2020.
Ai, X. E., Thöle, L. M., Auderset, A., Schmitt, M., Moretti, S., Studer, A. S., Michel, E., Wegmann, M., Mazaud, A., Bijl, P. K., Sigman, D. M., Martínez-García, A., and Jaccard, S. L.: The southward migration of the Antarctic Circumpolar Current enhanced oceanic degassing of carbon dioxide during the last two deglaciations, Commun. Earth Environ., 5, 58, https://doi.org/10.1038/s43247-024-01216-x, 2024.
Alonso-Sáez, L., Andersson, A., Heinrich, F., and Bertilsson, S.: High archaeal diversity in Antarctic circumpolar deep waters, Env. Microbiol. Rep., 3, 689–697, https://doi.org/10.1111/j.1758-2229.2011.00282.x, 2011.
Bale, N. J., Palatinszky, M., Irene, W., Rijpstra, C., Herbold, C. W., Wagner, M., Sinninghe Damsté, J. S., and Atomi, H.: Membrane lipid composition of the moderately thermophilic ammonia-oxidizing archaeon “Candidatus Nitrosotenuis uzonensis” at Different Growth Temperatures, Appl. Environ. Microbiol., 85, e01332-19, https://doi.org/10.1128/AEM.01332-19, 2019.
Bianchi, C. and Gersonde, R.: The Southern Ocean surface between Marine Isotope Stages 6 and 5d: Shape and timing of climate changes, Palaeogeogr. Palaeoclimatol. Palaeoecol., 187, 151–177, https://doi.org/10.1016/S0031-0182(02)00516-3, 2002.
Bijl, P. K., Śliwińska, K. K., Duncan, B., Huguet, A., Naeher, S., Rattanasriampaipong, R., Sosa-Montes de Oca, C., Auderset, A., Berke, M. A., Kim, B. S., Davtian, N., Dunkley Jones, T., Eefting, D. D., Elling, F. J., Fenies, P., Inglis, G. N., O'Connor, L., Pancost, R. D., Peterse, F., Rice, A., Sluijs, A., Varma, D., Xiao, W., and Zhang, Y. G.: Reviews and syntheses: Best practices for the application of marine GDGTs as proxy for paleotemperatures: sampling, processing, analyses, interpretation, and archiving protocols, Biogeosciences, 22, 6465–6508, https://doi.org/10.5194/bg-22-6465-2025, 2025.
Blaga, C. I., Reichart, GJ., Heiri, O., and Sinninghe Damsté, J. S.: Tetraether membrane lipid distributions in water-column particulate matter and sediments: a study of 47 European lakes along a north–south transect, J. Paleolimnol., 41, 523–540, https://doi.org/10.1007/s10933-008-9242-2, 2009.
Boyer, T. P., García, H. E., Locarnini, R. A., Zweng, M. M., Mishonov, A. V., Reagan, J. R., Weathers, K. A., Baranova, O. K., Paver, C. R., Seidov, D., and Smolyar, I. V.: World Ocean Atlas: Temperature, salinity, and oxygen, NOAA National Centers for Environmental Information [data set], https://repository.library.noaa.gov/view/noaa/49137 (last access: 28 January 2026), 2018.
Brochier-Armanet, C., Boussau, B., Gribaldo, S., and Forterre, P.: Mesophilic Crenarchaeota: proposal for a third archaeal phylum, the Thaumarchaeota, Nat. Rev. Microbiol., 6, 245–252, https://doi.org/10.1038/nrmicro1852, 2008.
Carter, L., McCave, I. N., and Williams, M. J. M.: Circulation and Water Masses of the Southern Ocean: A Review, in: Developments in Earth and Environmental Sciences, Vol. 8, edited by: Florindo, F. and Siegert, M., Elsevier, 85–114, https://doi.org/10.1016/S1571-9197(08)00004-9, 2008.
Carter, L., Bostock-Lyman, H., and Bowen, M.: Water masses, circulation and change in the modern Southern Ocean, in: Antarctic Climate Evolution, 2nd edn., edited by: Florindo, F., Siegert, M., De Santis, L., and Naish, T., Elsevier, 165–197, https://doi.org/10.1016/B978-0-12-819109-5.00003-7, 2022.
Chadwick, M., Allen, C. S., Sime, L. C., and Hillenbrand, C. D.: Analysing the timing of peak warming and minimum winter sea-ice extent in the Southern Ocean during MIS 5e, Quat. Sci. Rev., 229, 106134, https://doi.org/10.1016/j.quascirev.2019.106134, 2020.
Chandler, D. and Langebroek, P.: Southern Ocean sea surface temperature synthesis: Part 1. Evaluation of temperature proxies at glacial-interglacial time scales, Quat. Sci. Rev., 271, 107191, https://doi.org/10.1016/j.quascirev.2021.107191, 2021.
Chapman, C. C., Lea, M.-A., Meyer, A., Sallée, J.-B., and Hindell, M.: Defining Southern Ocean fronts and their influence on biological and physical processes in a changing climate, Nat. Clim. Chang., 10, 209–219, https://doi.org/10.1038/s41558-020-0705-4, 2020.
Church, M. J., DeLong, E. F., Ducklow, H. W., Karner, M. B., Preston, C. M., and Karl, D. M.: Abundance and distribution of planktonic Archaea and Bacteria in the waters west of the Antarctic Peninsula, Limnol. Oceanogr., 48, 1893–1902, https://doi.org/10.4319/lo.2003.48.5.1893, 2003.
Civel-Mazens, M., Crosta, X., Cortese, G., Michel, E., Mazaud, A., Ther, O., Ikehara, M., and Itaki, T.: Antarctic Polar Front migrations in the Kerguelen Plateau region, Southern Ocean, over the past 360 kyrs, Glob. Planet. Chang., 202, 103526, https://doi.org/10.1016/j.gloplacha.2021.103526, 2021.
Dai, M., Luo, Y., Achterberg, E. P., Browning, T. J., Cai, Y., Cao, Z., Chai, F., Chen, B., Church, M. J., Ci, D., Du, C., Gao, K., Guo, X., Hu, Z., Kao, S., Laws, E. A., Lee, Z., Lin, H., Liu, Q., Liu, X., Luo, W., Meng, F., Shang, S., Shi, D., Saito, H., Song, L., Wan, X. S., Wang, Y., Wang, W., Wen, Z., Xiu, P., Zhang, J., Zhang, R., and Zhou, K.: Upper ocean biogeochemistry of the oligotrophic North Pacific Subtropical Gyre: from nutrient sources to carbon export, Reviews of Geophysics, 61, e2022RG000800, https://doi.org/10.1029/2022RG000800, 2023.
de Bar, M. W., Rampen, S. W., Hopmans, E. C., Sinninghe Damsté, J. S., and Schouten, S.: Constraining the applicability of organic paleotemperature proxies for the last 90 Myrs, Org. Geochem., 128, 122–136, https://doi.org/10.1016/j.orggeochem.2018.12.005, 2019.
DeConto, R. M. and Pollard, D.: Contribution of Antarctica to past and future sea-level rise, Nature, 531, 591–597, https://doi.org/10.1038/nature17145, 2016.
Dunkley Jones, T., Eley, Y. L., Thomson, W., Greene, S. E., Mandel, I., Edgar, K., and Bendle, J. A.: OPTiMAL: a new machine learning approach for GDGT-based palaeothermometry, Clim. Past, 16, 2599–2617, https://doi.org/10.5194/cp-16-2599-2020, 2020.
Etourneau, J., Sgubin, G., Crosta, X., Swingedouw, D., Willmott, V., Barbara, L., Houssais, M. N., Schouten, S., Sinninghe Damsté, J. S., Goosse, H., Escutia, C., Crespin, J., Massé, G., and Kim, J. H.: Ocean temperature impact on ice shelf extent in the eastern Antarctic Peninsula, Nat. Commun., 10, 304, https://doi.org/10.1038/s41467-018-08195-6, 2019.
Feucher, C., Maze, G., and Mercier, H.: Subtropical mode water and permanent pycnocline properties in the world ocean, J. Geophys. Res.-Oceans, 124, 1139–1154, https://doi.org/10.1029/2018JC014526, 2019.
Fietz, S., Ho, S. L., Huguet, C., Rosell-Melé, A., and Martínez-García, A.: Appraising GDGT-based seawater temperature indices in the Southern Ocean, Org. Geochem., 102, 93–105, https://doi.org/10.1016/j.orggeochem.2016.10.003, 2016.
Fietz, S., Ho, S. L., and Huguet, C.: Archaeal membrane lipid-based paleothermometry for applications in polar oceans, Oceanography, 33, 104–114, https://doi.org/10.5670/oceanog.2020.207, 2020.
Gabriel, J. L. and Chong, P. L. G.: Molecular modeling of archaebacterial bipolar tetraether lipid membranes, Chem. Phys. Lipids, 105, 193–200, https://doi.org/10.1016/S0009-3084(00)00126-2, 2000.
GEBCO Bathymetric Compilation Group: GEBCO 2023_Grid, British Oceanographic Data Centre [data set], https://doi.org/10.5285/f98b053b-0cbc-6c23-e053-6c86abc0af7b, 2023.
Gersonde, R., Crosta, X., Abelmann, A., and Armand, L.: Sea-surface temperature and sea ice distribution of the Southern Ocean at the EPILOG Last Glacial Maximum – A circum-Antarctic view based on siliceous microfossil records, Quat. Sci. Rev., 24, 869–896, https://doi.org/10.1016/j.quascirev.2004.07.015, 2005.
Hagemann, J. R., Lembke-Jene, L., Lamy, F., Vorrath, M.-E., Kaiser, J., Müller, J., Arz, H. W., Hefter, J., Jaeschke, A., Ruggieri, N., and Tiedemann, R.: Upper-ocean temperature characteristics in the subantarctic southeastern Pacific based on biomarker reconstructions, Clim. Past, 19, 1825–1845, https://doi.org/10.5194/cp-19-1825-2023, 2023.
Hanna, E., Topál, D., Box, J. E., Buzzard, S., Christie, F. D. W., Hvidberg, C., Morlighem, M., De Santis, L., Silvano, A., Colleoni, F., Sasgen, I., Banwell, A. F., van den Broeke, M. R., DeConto, R., De Rydt, J., Goelzer, H., Gossart, A., Gudmundsson, G. H., Lindbäck, K., Miles, B., Mottram, R., Pattyn, F., Reese, R., Rignot, E., Srivastava, A., Sun, S., Toller, J., Tuckett, P. A., and Ultee, L.: Short- and long-term variability of the Antarctic and Greenland ice sheets, Nat. Rev. Earth Environ., 5, 193–210, https://doi.org/10.1038/s43017-023-00509-7, 2024.
Hernández, E. A., Piquet, A. M.-T., Lopez, J. L., Buma, A. G. J., and Mac Cormack, W. P.: Marine archaeal community structure from Potter Cove, Antarctica: high temporal and spatial dominance of the phylum Thaumarchaeota, Polar Biol., 38, 117–130, https://doi.org/10.1007/s00300-014-1569-8, 2015.
Hernández-Sánchez, M. T., Woodward, E. M. S., Taylor, K. W. R., Henderson, G. M., and Pancost, R. D.: Variations in GDGT distributions through the water column in the South East Atlantic Ocean, Geochim. Cosmochim. Acta, 132, 337–348, https://doi.org/10.1016/j.gca.2014.02.009, 2014.
Ho, S. L. and Laepple, T.: Flat meridional temperature gradient in the early Eocene in the subsurface rather than surface ocean, Nat. Geosci., 9, 606–610, https://doi.org/10.1038/ngeo2763, 2016.
Ho, S. L., Mollenhauer, G., Fietz, S., Martínez-Garcia, A., Lamy, F., Rueda, G., Schipper, K., Méheust, M., Rosell-Melé, A., Stein, R., and Tiedemann, R.: Appraisal of TEX86 and thermometries in subpolar and polar regions, Geochim. Cosmochim. Acta, 131, 213–226, https://doi.org/10.1016/J.GCA.2014.01.001, 2014.
Holland, D. M., Nicholls, K. W., and Basinski, A.: The Southern Ocean and its interaction with the Antarctic Ice Sheet, Science, 367, 1326–1330, https://doi.org/10.1126/science.aaz5491, 2020.
Hopmans, E. C., Schouten, S., Pancost, R. D., Van Der Meer, M. T. J., and Sinninghe Damsté, J. S.: Analysis of intact tetraether lipids in archaeal cell material and sediments by high performance liquid chromatography/atmospheric pressure chemical ionization mass spectrometry, Rapid Commun. Mass Spectrom., 14, 585–589, https://doi.org/10.1002/(SICI)1097-0231(20000415)14:7<585::AID-RCM913>3.0.CO;2-N, 2000.
Hopmans, E. C., Weijers, J. W. H., Schefuß, E., Herfort, L., Sinninghe Damsté, J. S., and Schouten, S.: A novel proxy for terrestrial organic matter in sediments based on branched and isoprenoid tetraether lipids, Earth Planet. Sci. Lett., 224, 107–116, https://doi.org/10.1016/j.epsl.2004.05.012, 2004.
Huguet, C., Hopmans, E. C., Febo-Ayala, W., Thompson, D. H., Sinninghe Damsté, J. S., and Schouten, S.: An improved method to determine the absolute abundance of glycerol dibiphytanyl glycerol tetraether lipids, Org. Geochem., 37, 1036–1041, https://doi.org/10.1016/j.orggeochem.2006.05.008, 2006.
Ishii, H.: HanaIshii-ANT/Southern-Ocean-isoGDGT-dataset-for-new-AIZ-index: Initial dataset release for Ishii et al., Zenodo [data set], https://doi.org/10.5281/zenodo.17060619, 2025.
Jaeschke, A., Wengler, M., Hefter, J., Ronge, T. A., Geibert, W., Mollenhauer, G., Gersonde, R., and Lamy, F.: A biomarker perspective on dust, productivity, and sea surface temperature in the Pacific sector of the Southern Ocean, Geochim. Cosmochim. Acta, 204, 120–139, https://doi.org/10.1016/j.gca.2017.01.045, 2017.
Kalanetra, K. M., Bano, N., and Hollibaugh, J. T.: Ammonia-oxidizing Archaea in the Arctic Ocean and Antarctic coastal waters, Environ. Microbiol., 11, 2434–2445, https://doi.org/10.1111/j.1462-2920.2009.01974.x, 2009.
Kim, J. G., Park, S.-J., Quan, Z.-X., Jung, M.-Y., Cha, I.-T., Kim, S.-J., Kim, K.-H., Yang, E.-J., Kim, Y.-N., Lee, S.-H., and Rhee, S.-K.: Unveiling abundance and distribution of planktonic Bacteria and Archaea in a polynya in Amundsen Sea, Antarctica, Environ. Microbiol., 16, 1566–1578, https://doi.org/10.1111/1462-2920.12287, 2014.
Kim, J. H., Schouten, S., Hopmans, E. C., Donner, B., and Sinninghe Damsté, J. S.: Global sediment core-top calibration of the TEX86 paleothermometer in the ocean, Geochim. Cosmochim. Acta, 72, 1154–1173, https://doi.org/10.1016/j.gca.2007.12.010, 2008.
Kim, J. H., van der Meer, J., Schouten, S., Helmke, P., Willmott, V., Sangiorgi, F., Koç, N., Hopmans, E. C., and Damsté, J. S. S.: New indices and calibrations derived from the distribution of crenarchaeal isoprenoid tetraether lipids: Implications for past sea surface temperature reconstructions, Geochim. Cosmochim. Acta, 74, 4639–4654, https://doi.org/10.1016/j.gca.2010.05.027, 2010.
Kim, J. H., Crosta, X., Willmott, V., Renssen, H., Bonnin, J., Helmke, P., Schouten, S., and Sinninghe Damsté, J. S.: Holocene subsurface temperature variability in the eastern Antarctic continental margin, Geophys. Res. Lett., 39, L06705, https://doi.org/10.1029/2012GL051157, 2012.
Kolody, B. C., Sachdeva, R., Zheng, H., Füssy, Z., Tsang, E., Sonnerup, R. E., Purkey, S. G., Allen, E. E., Banfield, J. F., and Allen, A. E.: Overturning circulation structures the microbial functional seascape of the South Pacific, Science, 389, 176–182, https://doi.org/10.1126/science.adv6903, 2025.
Lamping, N., Müller, J., Hefter, J., Mollenhauer, G., Haas, C., Shi, X., Vorrath, M.-E., Lohmann, G., and Hillenbrand, C.-D.: Evaluation of lipid biomarkers as proxies for sea ice and ocean temperatures along the Antarctic continental margin, Clim. Past, 17, 2305–2326, https://doi.org/10.5194/cp-17-2305-2021, 2021.
Liu, R., Han, Z., Zhao, J., Zhang, H., Li, D., Ren, J., Pan, J., and Zhang, H.: Distribution and source of glycerol dialkyl glycerol tetraethers (GDGTs) and the applicability of gdgt-based temperature proxies in surface sediments of Prydz Bay, East Antarctica, Polar Res., 39, https://doi.org/10.33265/polar.v39.3557, 2020.
Liu, Z., Pagani, M., Zinniker, D., DeConto, R., Huber, M., Brinkhuis, H., Shah, S. R., Leckie, R. M., and Pearson, A.: Global cooling during the Eocene-Oligocene climate transition, Science, 323, 1187–1190, https://doi.org/10.1126/science.1166368, 2009.
Locarnini, R. A., Mishonov, A. V., Antonov, J. I., Boyer, T. P., Garcia, H. E., Baranova, O. K., Zweng, M. M., and Johnson, D. R.: World Ocean Atlas 2009, Volume 1: Temperature, U. S. Government Printing Office [data set], http://www.nodc.noaa.gov/OC5/indprod.html (last access: 28 January 2026), 2010.
Matsuoka, K., Skoglund, A., Roth, G., de Pomereu, J., Griffiths, H., Headland, R., Herried, B., Katsumata, K., Le Brocq, A., Licht, K., Morgan, F., Neff, P., Ritz, C., Scheinert, M., Tamura, T., Van de Putte, A., van den Broeke, M., von Deschwanden, A., Deschamps-Berger, C., and Melvær, Y.: Quantarctica, Norwegian Polar Institute [data set], https://doi.org/10.21334/NPOLAR.2018.8516E961, 2018.
Merbt, S. N., Stahl, D. A., Casamayor, E. O., Martí, E., Nicol, G. W., and Prosser, J. I.: Differential photoinhibition of bacterial and archaeal ammonia oxidation, FEMS Microbiol. Lett., 327, 41–46, https://doi.org/10.1111/j.1574-6968.2011.02457.x, 2012.
O'Brien, C. L., Foster, G. L., Martínez-Botí, M. A., Abell, R., Rae, J. W. B., and Pancost, R. D.: High sea surface temperatures in tropical warm pools during the Pliocene, Nat. Geosci., 7, 606–611, https://doi.org/10.1038/ngeo2194, 2014.
Orsi, A. H., Whitworth, T., and Nowlin, W. D.: On the meridional extent and fronts of the Antarctic Circumpolar Current, Deep Sea Res. Part I, 42, 641–673, https://doi.org/10.1016/0967-0637(95)00021-W, 1995.
Pancost, R. D., Hopmans, E. C., and Sinninghe Damsté, J. S.: Archaeal lipids in Mediterranean cold seeps: molecular proxies for anaerobic methane oxidation, Geochim. Cosmochim. Acta, 65, 1611–1627, https://doi.org/10.1016/S0016-7037(00)00562-7, 2001.
Park, E., Hefter, J., Fischer, G., Iversen, M. H., Ramondenc, S., Nöthig, E.-M., and Mollenhauer, G.: Seasonality of archaeal lipid flux and GDGT-based thermometry in sinking particles of high-latitude oceans: Fram Strait (79° N) and Antarctic Polar Front (50° S), Biogeosciences, 16, 2247–2268, https://doi.org/10.5194/bg-16-2247-2019, 2019.
Pearson, A. and Ingalls, A. E.: Assessing the use of archaeal lipids as marine environmental proxies, Annu. Rev. Earth Planet. Sci., 41, 359–384, https://doi.org/10.1146/annurev-earth-050212-123947, 2013.
Pitcher, A., Rychlik, N., Hopmans, E. C., Spieck, E., Rijpstra, W. I. C., Ossebaar, J., Schouten, S., Wagner, M., and Sinninghe Damsté, J. S.: Crenarchaeol dominates the membrane lipids of Candidatus Nitrososphaera gargensis, a thermophilic Group I.1b Archaeon, ISME J., 4, 542–552, https://doi.org/10.1038/ismej.2009.138, 2010.
Pollard, R. T., Lucas, M. I., and Read, J. F.: Physical controls on biogeochemical zonation in the Southern Ocean, Deep Sea Res. Part II, 49, 3289–3305, https://doi.org/10.1016/S0967-0645(02)00084-X, 2002.
Qin, W., Carlson, L. T., Armbrust, E. V., Devol, A. H., Moffett, J. W., Stahl, D. A., and Ingalls, A. E.: Confounding effects of oxygen and temperature on the TEX86 signature of marine Thaumarchaeota, Proc. Natl. Acad. Sci. USA, 112, 10979–10984, https://doi.org/10.1073/pnas.1501568112, 2015.
Raes, E. J., Bodrossy, L., Van De Kamp, J., Bissett, A., Ostrowski, M., Brown, M. V., Sow, S. L. S., Sloyan, B., and Waite, A. M.: Oceanographic boundaries constrain microbial diversity gradients in the South Pacific Ocean, Proc. Natl. Acad. Sci. USA, 115, https://doi.org/10.1073/pnas.1719335115, 2018.
Rattanasriampaipong, R., Zhang, Y. G., Pearson, A., Hedlund, B. P., and Zhang, S.: Archaeal lipids trace ecology and evolution of marine ammonia-oxidizing archaea, Proc. Natl. Acad. Sci. USA, 119, e2123193119, https://doi.org/10.1073/pnas.2123193119, 2022.
Rintoul, S. R.: The global influence of localized dynamics in the Southern Ocean, Nature, 558, 209–218, https://doi.org/10.1038/s41586-018-0182-3, 2018.
Schouten, S., Hopmans, E. C., Schefuß, E., and Sinninghe Damsté, J. S.: Distributional variations in marine crenarchaeotal membrane lipids: a new tool for reconstructing ancient sea water temperatures?, Earth Planet. Sci. Lett., 204, 205–206, https://doi.org/10.1016/s0012-821x(03)00193-6, 2002.
Schouten, S., Huguet, C., Hopmans, E. C., Kienhuis, M. V. M., and Sinninghe Damsté, J. S.: Analytical Methodology for TEX86 Paleothermometry by High-Performance Liquid Chromatography/Atmospheric Pressure Chemical Ionization-Mass Spectrometry, Anal. Chem., 79, 2940–2944, https://doi.org/10.1021/ac062339v, 2007.
Schouten, S., Hopmans, E. C., and Sinninghe Damsté, J. S.: The organic geochemistry of glycerol dialkyl glycerol tetraether lipids: A review, Org. Geochem., 54, 19–61, https://doi.org/10.1016/j.orggeochem.2012.09.006, 2013.
Shevenell, A. E., Ingalls, A. E., Domack, E. W., and Kelly, and C.: Holocene Southern Ocean surface temperature variability west of the Antarctic Peninsula, Nature, 470, 250–254, https://doi.org/10.1038/nature09751, 2011.
Signori, C. N., Thomas, F., Enrich-Prast, A., Pollery, R. C. G., and Sievert, S. M.: Microbial diversity and community structure across environmental gradients in Bransfield Strait, Western Antarctic Peninsula, Front. Microbiol., 5, https://doi.org/10.3389/fmicb.2014.00647, 2014.
Sinninghe Damsté, J. S., Ossebaar, J., Schouten, S., and Verschuren, D.: Distribution of tetraether lipids in the 25-ka sedimentary record of Lake Challa: Extracting reliable TEX86 and MBT/CBT palaeotemperatures from an equatorial African lake, Quat. Sci. Rev., 50, 43–54, https://doi.org/10.1016/j.quascirev.2012.07.001, 2012.
Sow, S. L. S., Brown, M. V., Clarke, L. J., Bissett, A., van de Kamp, J., Trull, T. W., Raes, E. J., Seymour, J. R., Bramucci, A. R., Ostrowski, M., Boyd, P. W., Deagle, B. E., Pardo, P. C., Sloyan, B. M., and Bodrossy, L.: Biogeography of Southern Ocean prokaryotes: a comparison of the Indian and Pacific sectors, Environ. Microbiol., 24, 2449–2466, https://doi.org/10.1111/1462-2920.15906, 2022.
Spencer-Jones, C. L., McClymont, E. L., Bale, N. J., Hopmans, E. C., Schouten, S., Müller, J., Abrahamsen, E. P., Allen, C., Bickert, T., Hillenbrand, C.-D., Mawbey, E., Peck, V., Svalova, A., and Smith, J. A.: Archaeal intact polar lipids in polar waters: a comparison between the Amundsen and Scotia seas, Biogeosciences, 18, 3485–3504, https://doi.org/10.5194/bg-18-3485-2021, 2021.
Taylor, K. W. R., Huber, M., Hollis, C. J., Hernandez-Sanchez, M. T., and Pancost, R. D.: Re-evaluating modern and Palaeogene GDGT distributions: Implications for SST reconstructions, Glob. Planet. Chang., 108, 158–174, https://doi.org/10.1016/j.gloplacha.2013.06.011, 2013.
Tierney, J. E. and Tingley, M. P.: A Bayesian, spatially-varying calibration model for the TEX86 proxy, Geochim. Cosmochim. Acta 127, 83–106, https://doi.org/10.1016/j.gca.2013.11.026, 2014.
Uemura, R., Motoyama, H., Masson-Delmotte, V., Jouzel, J., Kawamura, K., Goto-Azuma, K., Fujita, S., Kuramoto, T., Hirabayashi, M., Miyake, T., Ohno, H., Fujita, K., Abe-Ouchi, A., Iizuka, Y., Horikawa, S., Igarashi, M., Suzuki, K., Suzuki, T., and Fujii, Y.: Asynchrony between Antarctic temperature and CO2 associated with obliquity over the past 720,000 years, Nat. Commun., 9, 961, https://doi.org/10.1038/s41467-018-03328-3, 2018.
Varma, D., Hättig, K., van der Meer, M. T. J., Reichart, G. J., and Schouten, S.: Constraining water depth influence on organic paleotemperature proxies using sedimentary archives, Paleoceanogr. Paleoclimatol., 38, e2022PA004533, https://doi.org/10.1029/2022PA004533, 2023.
Varma, D., Hopmans, E. C., Van Kemenade, Z. R., Kusch, S., Berg, S., Bale, N. J., Sangiorgi, F., Reichart, G.-J., Sinninghe Damsté, J. S., and Schouten, S.: Evaluating isoprenoidal hydroxylated GDGT-based temperature proxies in surface sediments from the global ocean, Geochim. Cosmochim. Acta, 370, 113–127, https://doi.org/10.1016/j.gca.2023.12.019, 2024.
Weber, M. E., Raymo, M. E., Peck, V. L., and Williams, T.: Expedition 382 preliminary report: iceberg alley and subantarctic ice and ocean dynamics, International Ocean Discovery Program, https://doi.org/10.14379/iodp.pr.382.2019, 2019.
Wuchter, C., Schouten, S., Coolen, M. J. L., and Sinninghe Damsté, J. S.: Temporal and spatial variation in tetraether membrane lipids of marine Crenarchaeota in particulate organic matter: Implications for TEX86 paleothermometry, Paleoceanogr. Paleoclimatol, 20, PA3013, https://doi.org/10.1029/2004PA001110, 2005.
Xu, Y., Wu, W., Xiao, W., Ge, H., Wei, Y., Yin, X., Yao, H., Lipp, J. S., Pan, B., and Hinrichs, K.: Intact ether lipids in trench sediments related to archaeal community and environmental conditions in the deepest ocean, J. Geophys. Res.-Biogeosciences, 125, e2019JG005431, https://doi.org/10.1029/2019JG005431, 2020.
Yang, H. and Zhu, J.: Equilibrium thermal response timescale of global oceans, Geophys. Res. Lett., 38, L14711, https://doi.org/10.1029/2011GL048076, 2011.
Zhang, Y. G., Zhang, C. L., Liu, X. L., Li, L., Hinrichs, K. U., and Noakes, J. E.: Methane Index: A tetraether archaeal lipid biomarker indicator for detecting the instability of marine gas hydrates, Earth Planet. Sci. Lett., 307, 525–534, https://doi.org/10.1016/j.epsl.2011.05.031, 2011.
Zhao, S., Bao, R., Zhou, L., Liu, M., Sun, X., Gao, Z., Zhou, Y., Wang, N., Wang, Y., Chen, J., Xing, L., and Zhang, C.: Temperature-dependent spatial and temporal trends in archaeal lipid distributions, Commun. Earth Environ., 6, 619, https://doi.org/10.1038/s43247-025-02450-7, 2025.