the Creative Commons Attribution 4.0 License.
the Creative Commons Attribution 4.0 License.
 | 06 Mar 2026
Wine must yields as indicators of May to July climate in Central Europe, 1416–1988
Christian Pfister
Stefan Brönnimann
Laurent Litzenburger
Peter Thejll
Andres Altwegg
Rudolf Brázdil
Andrea Kiss
Erich Landsteiner
Fredrik Charpentier Ljungqvist
Thomas Pliemon
The paper explores to which extent narrative documentary records on wine production in Central Europe can be used as a proxy for summer temperatures. Here, we compiled 11 regional series spanning from the early 15th century to 1988. We detrended the data to adjust for long-term biases such as warfare-related population decline. The homogenised regional series were subsequently merged into three supra-regional series: (1) the Mosel series, starting in 1416 and consisting of data from the former city-republic of Metz (France) and the Grand Duchy of Luxembourg; (2) the series for Germany, starting in 1511 and mainly originating from the former city-state of Heilbronn; and (3) the third series, starting in 1529 and representing production on the Swiss Plateau. The residuals of the supra-regional yield series were averaged, divided into seven classes, and multiplied by five quality classes. Yield quality indices (YQI) varying between 35 (large and excellent) and 1 (small and undrinkable) significantly correlated with temperatures between May and July. Regression analysis of the composite series revealed that yield and quality primarily depend on the climate conditions from May to July as well as on those in June of the previous year. Crops with a YQI > 28 (rated “good” by traditional winegrowers) were related to above-average May–July temperatures, early grape harvest dates and high tree-ring maximum latewood density values resulting from frequent anticyclonic weather situations. Crops with YQI > 10 could not be uncritically assigned to cold summers since severe winter conditions, and spring frosts sometimes substantially reduced yields without affecting quality, particularly during the Little Ice Age in the marginal Mosel and German areas. Extreme yield fluctuations challenged winegrowing communities. Overproduction induced wastefulness, while crop failures sometimes triggered witch hunts.
- Article
(7578 KB) - Full-text XML
- BibTeX
- EndNote


In chronicles and other sources dealing with the living conditions in pre-industrial Central Europa, wine is almost always on par with the staple food grain (Pfister and Wanner, 2021). It was simultaneously a religious symbol, an everyday drink and a luxury commodity. During the celebration of the Lord's Supper, red wine was used to symbolize the blood of Christ. Light table wine served as an everyday drink, since clean water was not available in sufficient quantities prior to the 19th century (Toma, 2017). Quality wine aged for several years was a luxury commodity sold at a high price and traded over long distances (Landsteiner, 2004). Up until the time of the viticultural crisis in the late 19th century, production was predominantly yield-orientated. According to vintage ratings, a “good harvest” was synonymous with a rich one. Up until the late 19th century, production was predominantly yield orientated (Altwegg, 2018; Pfister, 1981).
There is now evidence of viticulture in Central Europe since Roman times (Matheus, 2025). It was mostly practised monoculturally in small vine gardens. In fact, viticulture required tilling the soil with hand tools and tending individual plants by skilled workers (both men and women). Though viticulture occupied only a small acreage, it produced a higher monetary value per unit area compared to arable products such as grain, albeit at the cost of unpaid family labour or high wage bills (Landsteiner, 2004). As late as 1930, about 3300 h were required annually to cultivate a mere one hectare of vines in Switzerland (Brázdil et al., 2019; Altwegg and Pfister, 2025). The vine varieties remained stable until the phylloxera crisis, which started in the late 19th century and led to the replanting of vineyards with grafted vines on American rootstocks resistant to phylloxera. On this occasion, new, more productive varieties were introduced, resulting in higher yields and better quality (Ollat et al., 2025).
Historical climatology aims to combine the narrative approach of the historical sciences with the quantitative approach of the natural sciences (Pfister and Wanner, 2021). Wine must constitutes an unusually rich climatic source. Records relating to vine provide three climatic proxies, namely information on the start date of the grape harvest, the harvest quantity and the sweetness of the crushed grapes. Quality is least affected by human intervention before the harvest date, when the yield becomes most dependent on human activity. Gregory V. Jones and environmental scientist Robert E. Davis demonstrated that much of the annual variation in harvest date, yield and sugar content is controlled by a few large-scale weather conditions: cyclonic weather patterns with strong winds and cold fronts reduce the quantity and quality of the must and delay the ripening of the grapes, while warm, high-pressure conditions allow early, extensive, high-sugar crops to ripen (Jones and Davis, 2000). Brázdil et al. (2008) suggested that narrative vintage ratings on wine must quality and quantity can provide a high-resolution summer temperature proxy for the period preceding the availability of grape harvest dates (GHD). For example, when grapes did not ripen in 1258 (a cold “year without summer”) after the explosion of the Indonesian volcano Samalas (1257), grapes were collected in sacks and baskets (Hertzog, 1906). In the hot summer of 1293, in contrast, “excellent wine grew in abundance” (Bassermann-Jordan, 1907). So far, harvest date and vine must quality have been studied in the literature from a historical perspective (Labbé et al., 2019; Pfister et al., 2024).
This study explores to which extent narrative and accounting data on both crop size and sugar content may provide a proxy for spring and summer temperatures before the period for which GHDs are available. This study aims to examine the extent to which narrative and accounting data on both crop size and sugar content may provide a proxy for spring and summer temperatures before the period for which GHDs are available. The paper ends with the transition to the more rapid anthropogenic warming after 1988. As the world has warmed, the growing season has lengthened and phenological events have occurred earlier. Furthermore, mean quality has increased considerably (Altwegg, 2023; Altwegg and Pfister, 2024) and yields would have risen steadily were it not for market-based control measures. Additionally, grape varieties better suited to the new climate are being cultivated (Neumann and Matzarakis, 2011; Holzkämper et al., 2013). Therefore, conditions before 1989 are no longer comparable to those since then.
German physician and natural scientist Gustav Schübler (1787–1834) can be considered the father of oenological climatology (Loose, 2022). In 1831, he compiled GHDs, fiscal series of wine must yields, wine prices and data on must quality for previous centuries to investigate “whether the climate of Germany has changed or remained the same for centuries, about which more detailed observations with physical instruments are still lacking [...]”. To this end, he came to relevant results (Schübler, 1831). However, his research fell into oblivion. Subsequently, grape harvest data and wine quantity and quality were analysed separately until recently.
The focus of nascent historical climate research was initially on GHD. Swiss physicist Louis Dufour (1832–1892) standardized four GHD series according to the Gregorian calendar and combined them into 30-year periods. In connection with results from the Ice Age research available at the time, he presented a comprehensive study of climate history (Dufour, 1870). Thus, he probably initiated a nationwide survey of GHD in French archives (Angot, 1885). On this basis, French historian Le Roy Ladurie (1971) reconstructed summer temperatures during the Little Ice Age (LIA) in connection with the fluctuation of the Alpine glaciers. Labbé et al. (2019) presented the first source-critically verified long time series from 1354 to 2018 for Beaune (France).
Wine must yields and wine quality were studied according to climatic aspects. After the forgotten pioneering work of Gustav Schübler, further wine chronologies were compiled; however, this was done without the critical evaluation of sources. Historian August Hertzog (1905) published in 1905 a comprehensive catalogue for the Alsace and Mosel region. After a decade of warm summers (1943–1952), botanist and oenologist Karl Müller (1881–1955) followed with a catalogue for southern Germany compiled from chronicles (Müller, 1953). Rima (1963) went one step further in his statistical search for periodicities in the time series of wine must yields and must quality at Johannisberg castle (Table 1, source 7).
Table 1List of sources.
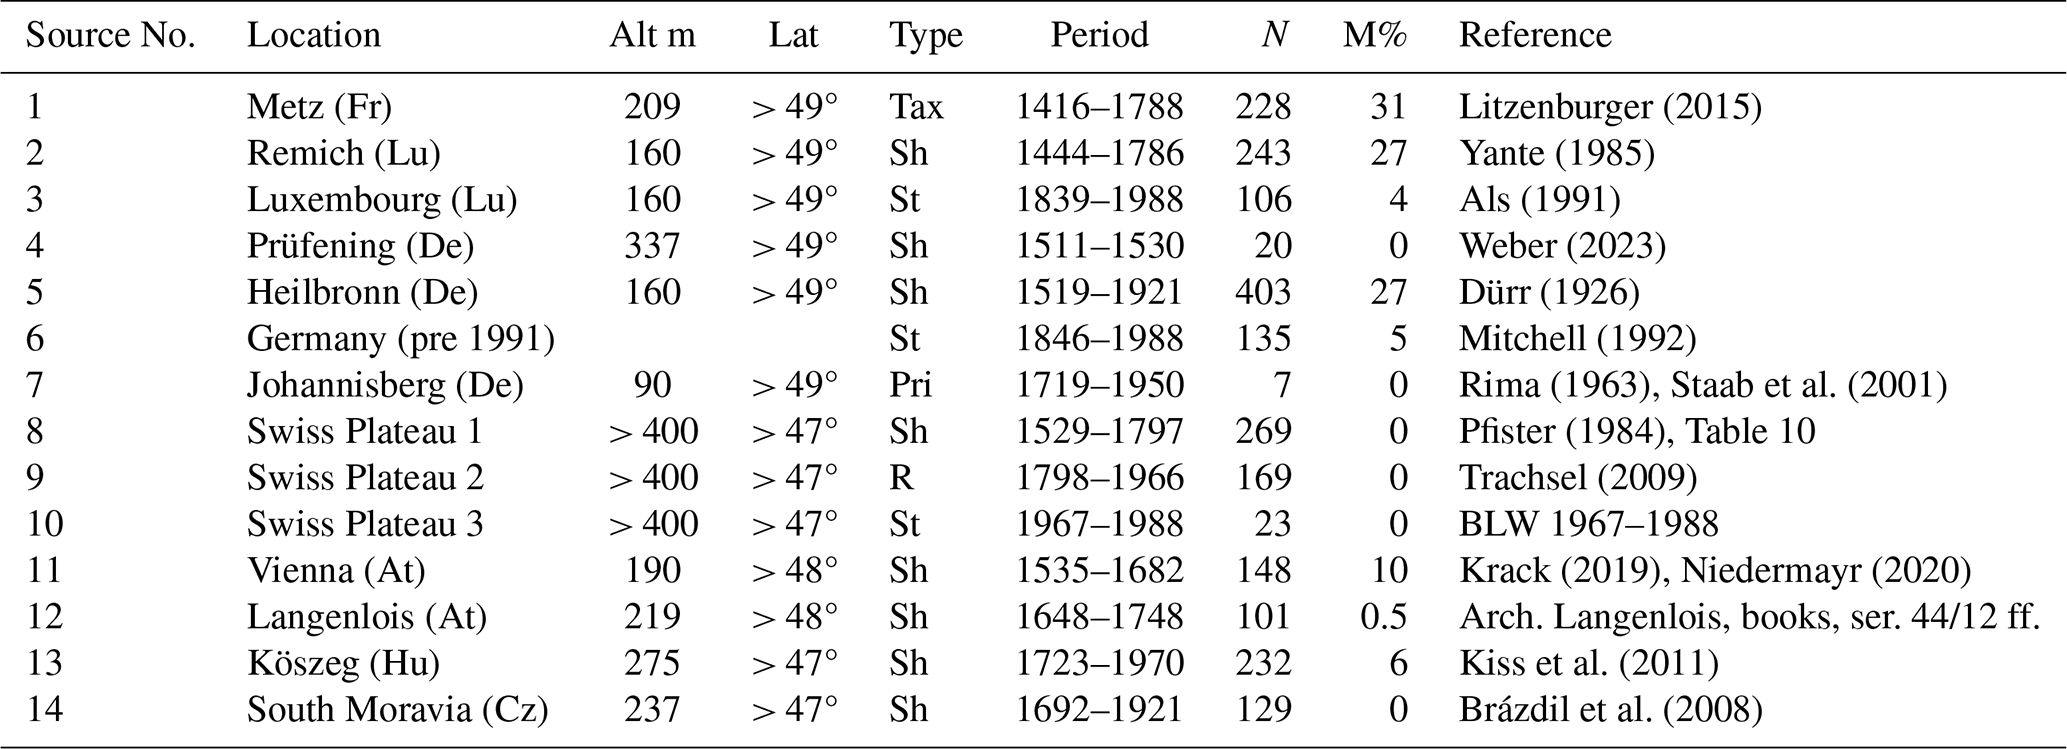
Legend: Alt = Altitude; Lat = Latitude; M = missing; Pri = Private; R = Residuals %; Sh= Share of production; St = National statistics.
Pfister (1981) and Trachsel (2009) examined the long yield series from the Swiss Plateau covering the period between 1529 and 1966, according to the best practice of historical climatology, using multiple regression based on instrumental measurements. They found that almost two-thirds of the variation in wine must yields can be explained by temperature conditions in early and mid-summer (June to July), where the June and July temperatures of the previous year account for almost a quarter of the total.
Lauer and Frankenberg (1986) investigated the relationship between wine must yield and quality in the Johannisberg castle vineyard series (Table 1, source 7) using multiple regression in conjunction with principal components analysis. They used this model to interpret source-critical narrative data from the 17th to 19th centuries. In summary, their study concludes that large wine must yields are indicative of warm and sunny weather with less drought in the early to mid-summer phase of the harvest year.
Molitor et al. (2016) interpreted a Luxembourg wine chronicle from 809 to 1904 that contained uncritical narrative information on the quality and quantity of annual crops (Anonymous, 1937). The authors calculated the Heliothermal Index, i.e. the sum of daily temperature maxima from April to September for the period between 1854 and 1885, which they related to narrative reports on the quantity and quality of the grape harvests in the above-mentioned calibration period. From this, they calculated the April–September temperatures for the period since the middle of the 15th century. This revealed significant relationships between the narrative data on quality and the Heliothermal Index, while the information on quantity did not improve the result.
Lorusso (2013) used 26 time series from France, Germany and Switzerland to show that top-quality wine musts are associated with early harvests, while acidic wines are associated with late harvests. Landsteiner (2004) dealt with the socio-economic dimension of past wine must production in Austria.
Ljungqvist et al. (2025) examined the long vine yield series from Remich and Grevenmacher in Luxembourg (Yante, 1985) to investigate the impact of volcanic eruptions on vine must production. They found a highly significant volcanic forcing signature that was stronger than the signal found in tree-ring-based temperature reconstructions from Central Europe. The authors encouraged further compilation and analysis of additional wine production series, given that such series contain unique historical, biological and climatic information not found in other proxy types.
Mainly white grape varieties particularly resistant to adverse weather conditions were cultivated in our study area according to Volk's (2009) comprehensive bibliography. Accounts of ecclesiastical and secular institutions contain annual revenues of wine must paid in the form of tithes and rents. Much of them were spent in the form of wages in kind and pensions. The owners of the vineyards – the clergy, the bourgeoisie and institutions such as monasteries and hospitals were situated in the cities – where most of the wine was consumed.
Here, we shed new light on long series set up in the wine-growing city-state towns of Metz and Heilbronn. Moreover, an early short series referred to the Bavarian monastery of Prüfening (today within the city of Regensburg). Yields from wine tithes are documented in the accounts of the Swiss city-republics of Bern, Zurich, Schaffhausen and St. Gallen (vineyards in the upper Rhine valley) (Pfister, 1984). Krack (2019) and Niedermayr (2020) extracted time series of area yields from the Vienna city hospital accounts between 1535 and 1682. A series of area yields from Langelois in Lower Austria was provided by Erich Landsteiner. In connection with the French Revolution (1789), many institutions were dissolved, and their data dried up. It was not until the late 19th century that the emerging nation states began to record wine production as part of official agricultural statistics (Mitchell, 1992; Als, 1991; Ritzmann-Blickenstorfer, 1996).
Leased vineyards also act as a reliable source of information. Usually, the yields were shared between landowners and their tenants. Since most of them had neither vine presses nor cellars to process and store their share of the harvest, they sold it at institutionally prescribed prices (Pfister et al., 2024) so that they could buy grain and other products on the market for themselves (Volk, 2009). The most reliable information is provided by long-term accounts of private estates. The 250-year-long timeseries of the Johannisberg castle vineyard in the German state of Hesse is unique in this respect (Table 1, source 7).
From 1416 to 1988, 11 regional wine must yield series were compiled from the French-Luxembourg Mosel region, parts of Germany and the Swiss Plateau. The cities of Metz, Remich and Heilbronn are located above 49° N, while Vienna is situated at 48° N; the Swiss Plateau is located slightly farther south (Table 1).
The Metz regional series (Table 1, source 1) meticulously documents the extent of wine must production between 1416 and 1788 on the territory of the former city-republic, which is now part of France (Litzenburger, 2015). A tax of 23 deniers (approximately 1.4 g of silver) per cuve (4.8 hL) was levied at the conclusion of the grape harvest after St. Martin's Day (11 November), following an inspection of the new must stored in the cellars (Metz Archives). The vineyards were owned by members of the city's patriciate, ecclesiastical institutions and numerous small producers. Most of the wine was consumed locally in and around the city.
A comparison of the yields from 1473 to 1475 with those of the small town of Remich (Fig. 1, Table 1, source 2) reveals a significant disparity, likely attributable to the siege laid on the city by Duc Nicolas I de Lorraine-Anjou in 1473. Consequently, the percentage values of Remich were employed for the corresponding years in the nearby Metz series (Fig. 1). Likewise, the values for the period between 1538 and 1561 were absent from the archives after Metz was conquered by the French (Klipffel, 1867). They were supplemented by the respective percentages of the Remich series, as well as further gaps in the years 1500 to 1502, 1521, 1530, and 1574. The conquest of the city by French troops in 1646 during the Thirty Years' War (1618–1648) decimated the population (Trapp et al., 2021). From then on, there was a shortage of skilled labour. Starting in 1671, crops were only sporadically recorded. In 1678, the records stopped altogether. Fifteen years later, the records resumed, but yields were at a lower level, which persisted until the end of the ancien régime in 1788.
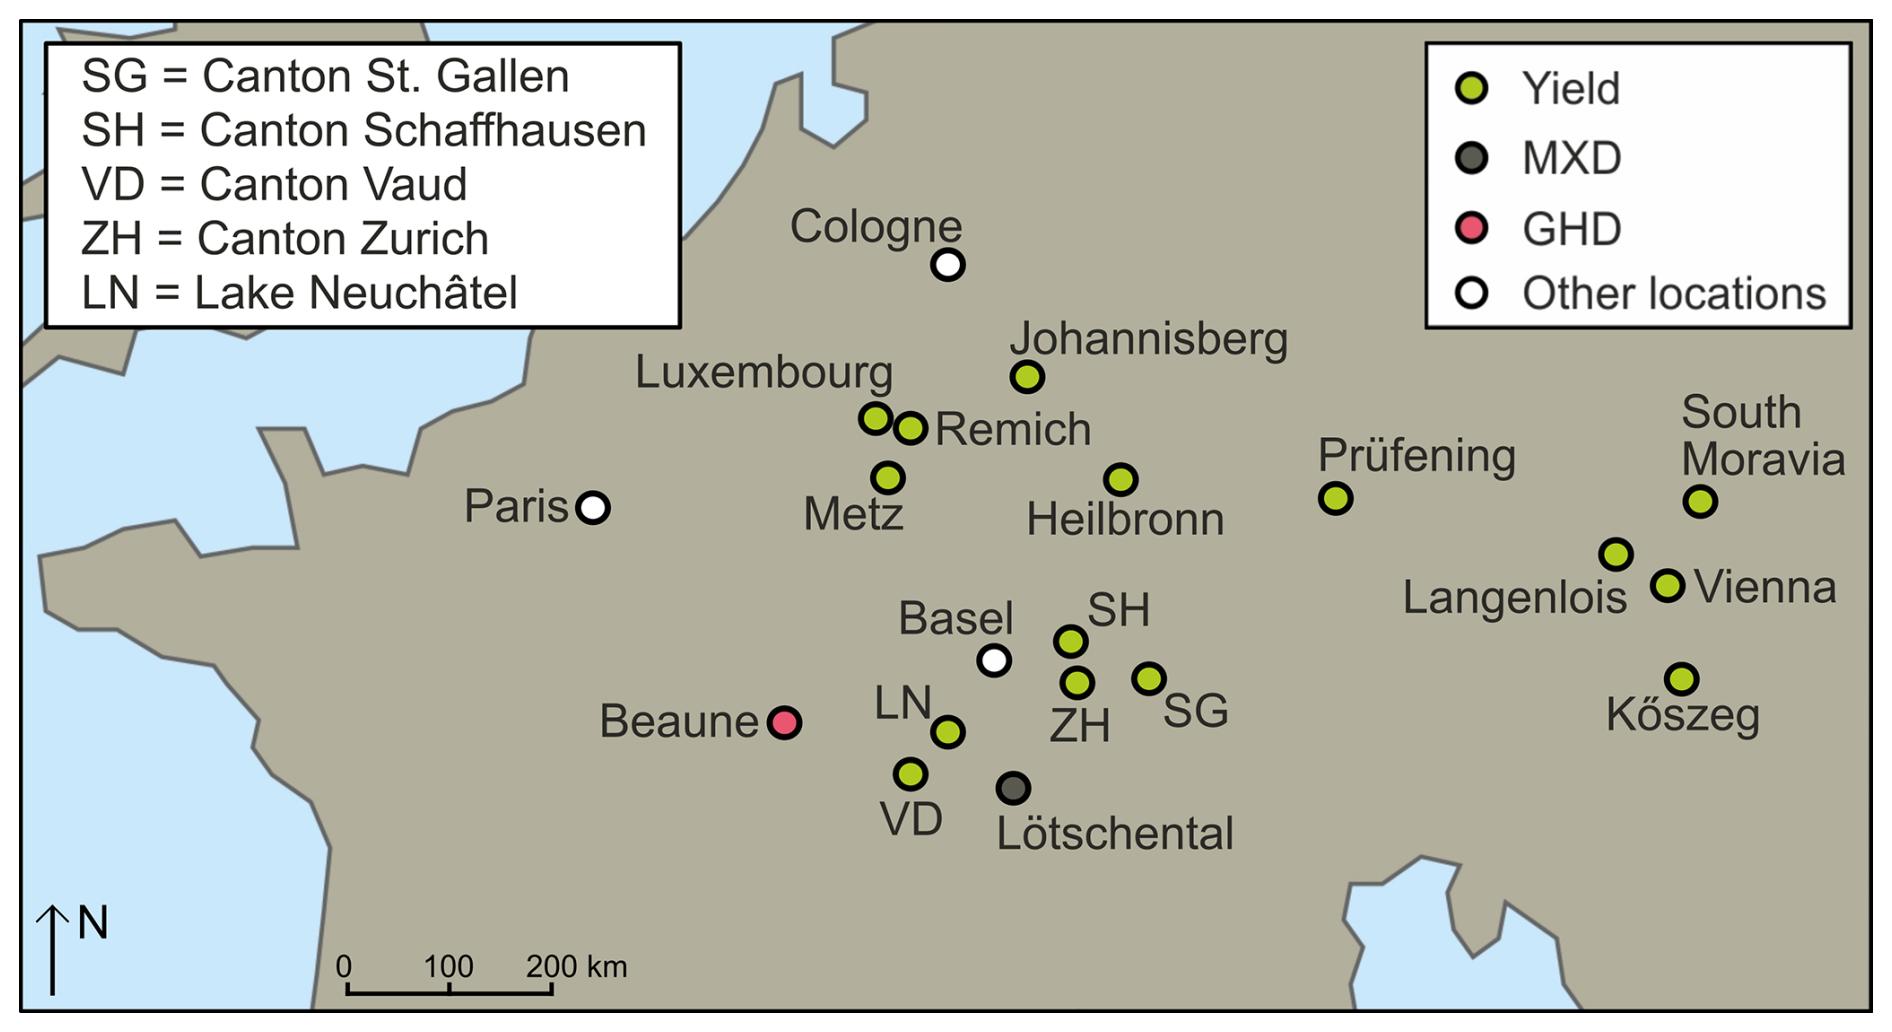
Figure 1Spatial layout of locations. Abbreviations are as follows: Yield – location of yield series; MXD – tree-ring maximum latewood density series; GHD – series of grape harvest dates; Swiss Cantons: LB – , LN – , SG – , SH – , SP – , VD – , VS – , TG – , ZH –. Geographic coordinates of series are as follows:
Basel Ch: 47°3′ N/35°2′ E; Beaune Fr: 47°1′ N/4°5 ′ E;
Cologne De: 50°0′ N/6°6′ E; Heilbronn De: 49°8′ N/9°1′ E;
Johannisberg De: 49°6′ N/7°6′ E; Köszeg Hu: 47°2′ N/16°3′ E;
Langelois At: 48°3′ N/15°4′ E; Lötschental C: 46°2′ N/7°5′ E;
Metz Fr: 49°7′ N/6°1′ E; Paris Fr: 48°0′ N/2° E;
Prüfening De: 49°1′ N/12.6° E; Remich Lu: 49°5′ N/6.4° E;
S Moravia Cz: 49°1′ N/16.7° E; Vienna At: 48°1′ N/16.2° E.
The locations Bordeaux, Grevenmacher (situated close to Remich), Swiss Plateau, Lake Biel, Canton Aargau, Canton Thurgau and Swiss Canton Valais are not shown for clarity. Abbreviations are explained within the figure.
The regional series from Remich (1444 to 1786) (Table 1, source 2) covers wine must production in the small town of the same name in the district of Luxembourg. The corresponding measure of capacity – called Aimes – contains 158 L. The Counts of Luxembourg received the ninth part of the harvested wine must from their estates there. After the harvest, inspectors went from cellar to cellar, as in Metz, to register the newly stored must. The vine was delivered in the castle to the counts (Yante, 1985).
Since the independence of the Grand Duchy of Luxembourg in 1839, the annual yields of this country situated near Metz (Fig. 1) were systematically recorded, with the quality measured in Oechsle degrees (Table 1, source 3). For the missing war year, 1944, the value of the Johannisberg castle series (Tables 1–7) was used. Until 1918, the Grand Duchy was part of a customs union with the German Empire, which meant that wine was in high demand. Vineyards were tripled in size without regard for quality. From 1907, phylloxera spread almost unchecked. After the dissolution of the customs union in 1918, phylloxera-resistant and more productive vines were introduced in the 1920s and 1930s, which enabled a transition to quality production (Massard, 2007).
The Prüfening regional series (Table 1, source 4) derives its nomenclature from the former Bavarian Benedictine monastery, now located in a suburb of the city of Regensburg. In the villages of Matting and Oberndorf, south of the city, the monastery was involved in the export-oriented wine industry. The produce from these vineyards was shared between the monastery and the tenants. Weber (2023) published the corresponding values for the years 1454 to 1457 and 1511 to 1530.
The Heilbronn regional series (Table 1, source 5) covers the years 1519 to 1803 and 1826 to 1921. After the expulsion of their sovereign, Duke Ulrich von Württemberg, the fathers of the current Free Imperial City of Heilbronn, levied a tax on the wine must yield beginning in 1519. Following the grape harvest, the number of “supply trips” was registered at the three city gates. A supply trip was equal to 3 hL of crushed, unpressed grapes (Schübler, 1831). The three-volume chronicle of Heilbronn lists the number of “supply trips” registered at all city gates. The document also contains information on quality and prices, as well as references to weather extremes. The chronicler Friedrich Dürr based his information mainly on contemporary observations of schoolmasters (Heuss, 2009; Dürr, 1926). The above sources were destroyed in the bombing of Heilbronn on 4 December 1944. These documents were preserved for future generations largely due to the efforts of Dürr. However, with the incorporation of Heilbronn into the Electorate and, later, the Kingdom of Württemberg in 1803, the records were complemented by the Johannisberg series (Table 1, source 7). From 1827 to 1921, Dürr quotes production data from Heilbronn based on the statistics of area yields in Württemberg. In 1881, the vineyards covered an area of 476 ha (Pfaff, 1865). The Heilbronn wine statistics, covering a total of 380 years, represent the longest oenological time series known to date. They include information on quantity and quality as well as references to meteorological and other exogenous factors.
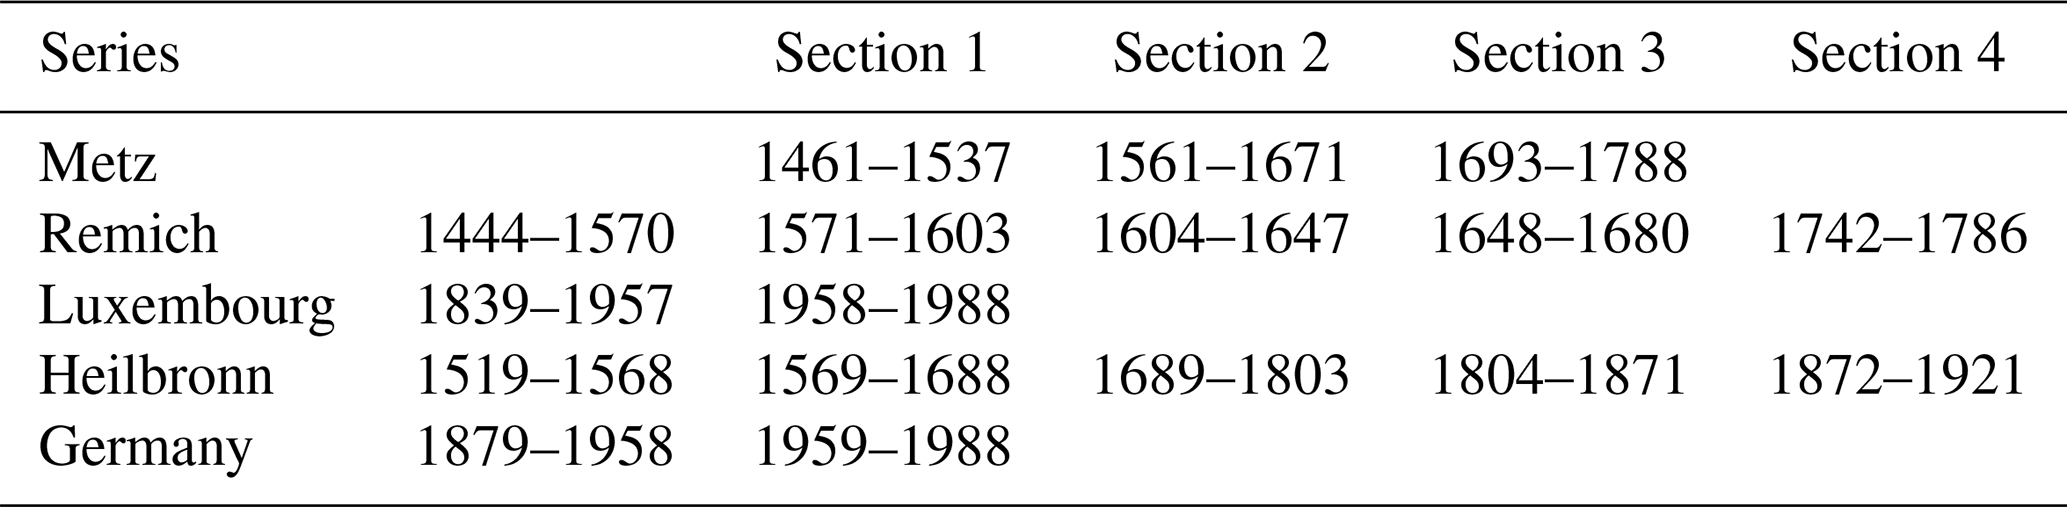
The regional series for “Germany” is indicated in Table 1, source 6). From 1846 to 1988, vineyard area and wine must yields are displayed in Mitchell (1992), from which average area yields (hL ha−1) were calculated. The absence of yield values for the war and post-war years (1941 to 1947) was compensated for by the area yield series of the Johannisberg castle estate (Rima, 1963), which is the longest known so far. Given the considerably longer-term differences in average yields, linear trends were calculated on a section-by-section basis for some regional series under the assumption that the annual residuals mainly represent short-term, primarily meteorological influences (Table 2).
The regional series Swiss Plateau 1 (Table 1, source 8) is based on an estimation of wine must production between 1529 and 1797, using the vine tithe, the second most important feudal tax after the grain tithe (Pfister, 1984, Annex). The grape varieties largely coincided with the linguistic and cultural boundaries. The white Chasselas grape was widespread in French-speaking western Switzerland, while traditional white varieties such as Elbling and Räuschling were common in the German-speaking cantons further east. Following the Reformation, the ecclesiastical estates in the Protestant cantons, along with their vineyards, became the property of the secular authorities. During the grape harvest, either the tithe payers poured the harvested grapes into an official wine press or a sworn overseer ensured that the 10th bucket was always emptied into an official tithe barrel (Pfister, 1981). After the dissolution of the ancien régime in 1798, tithes were abolished by canton in the following decades (Dubler, 2015). The Swiss Central Plateau regional series is divided into 10 sub-periods according to their different regional composition (see Table 2). A separate linear trend with residuals has been calculated for each canton.
A jump in the composition occurred in 1645 with the introduction of the Schaffhausen wine tax. From 1738 to 1770, data on the later Canton Vaud are missing from the compilation. The tithes documented in the six cantons of the Swiss Plateau (excluding Schaffhausen) come from a catchment area of approximately 5000 km2, corresponding to a volume of 80 760 hL between 1770 and 1797. Repeated war-like events caused significant damage in Metz and Heilbronn, while Switzerland – apart from the rapid conquest by French armies in 1798 – was only involved in four short civil wars (1531, 1656, 1712 and 1847), which meant that grapes could be harvested and stored without interruption year by year.
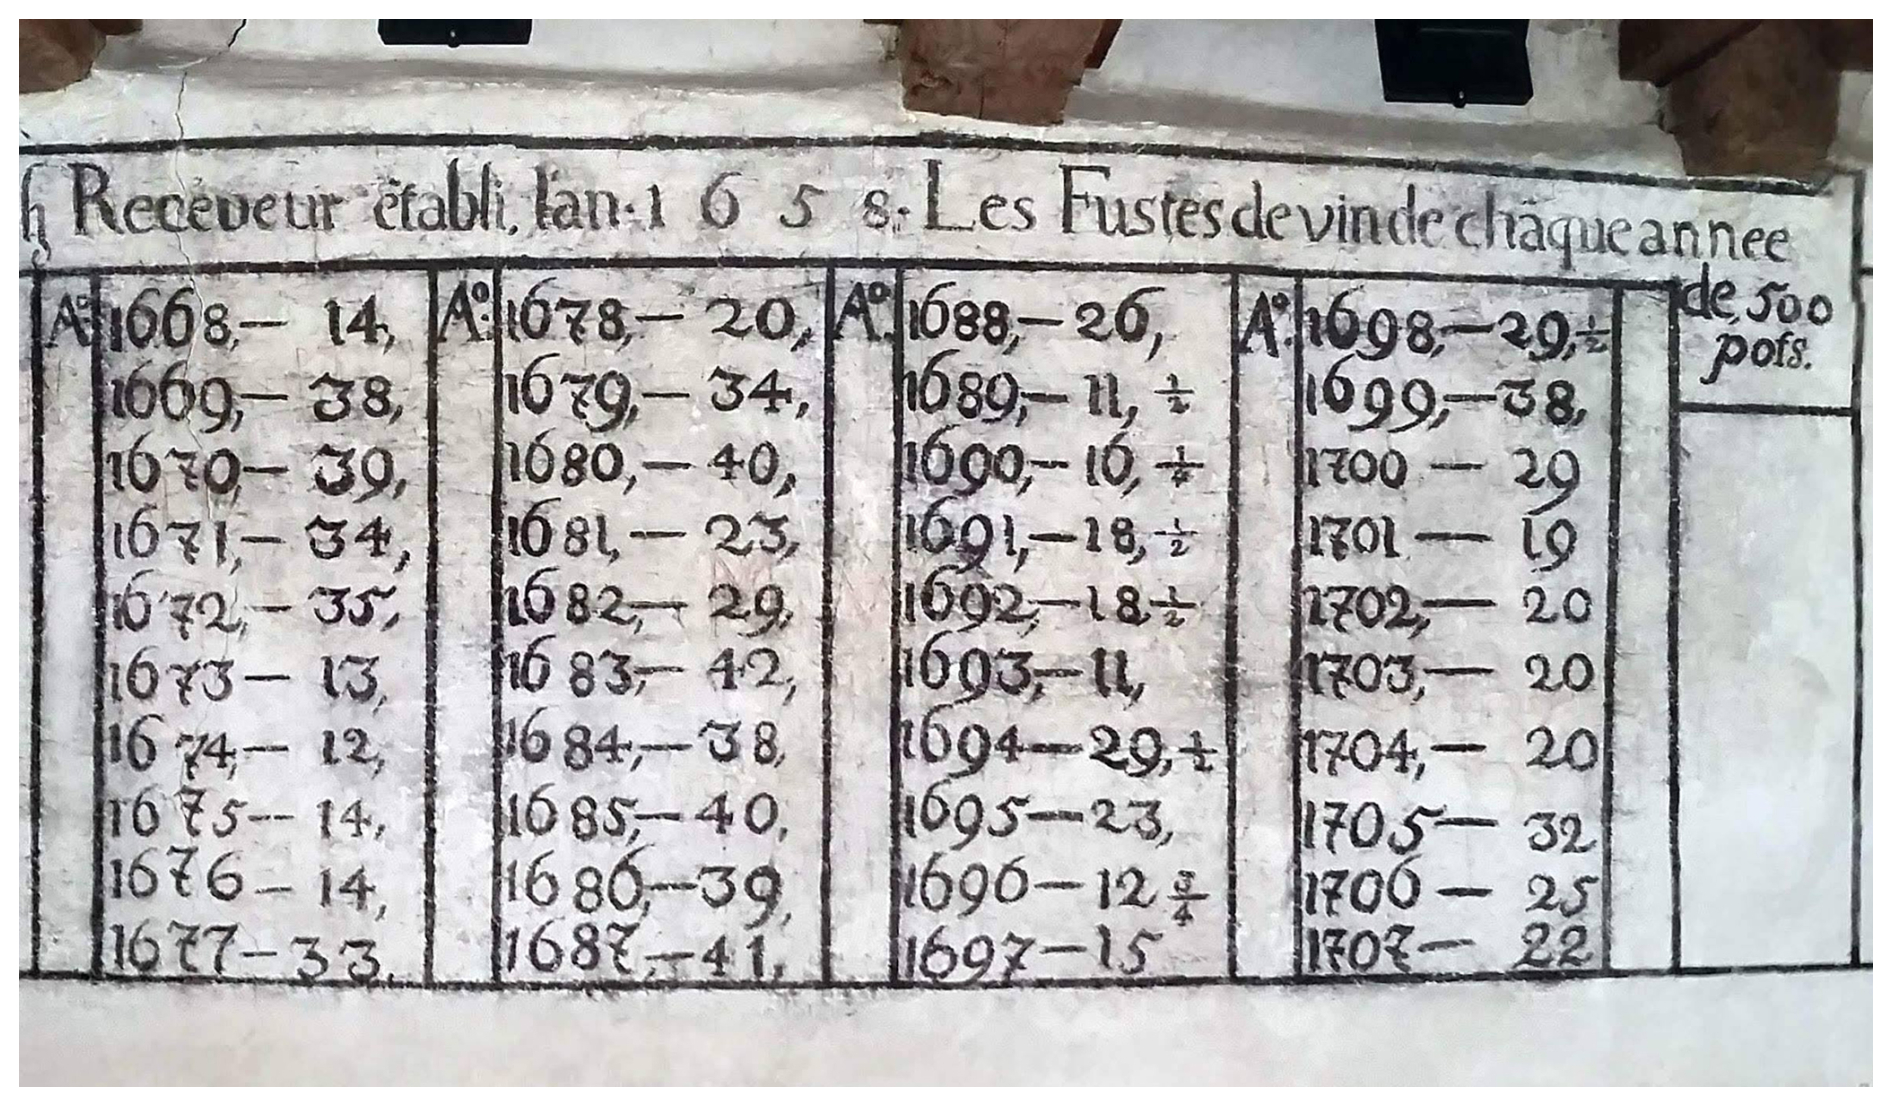
Figure 2A display of the annual wine must crop collected for a private owner between 1658 and 1757. This visual monument was painted at a wall in the basement of today's Viticultural Museum in Ligerz (Canton Bern) by order of the receveur (supervisor). Data in barrels of 845 L. Photo: Heidi Lüdi Pfister, Copyright Viticultural Museum Ligerz (Canton Bern).
Table 3Composition of the regional series Swiss Plateau by canton.
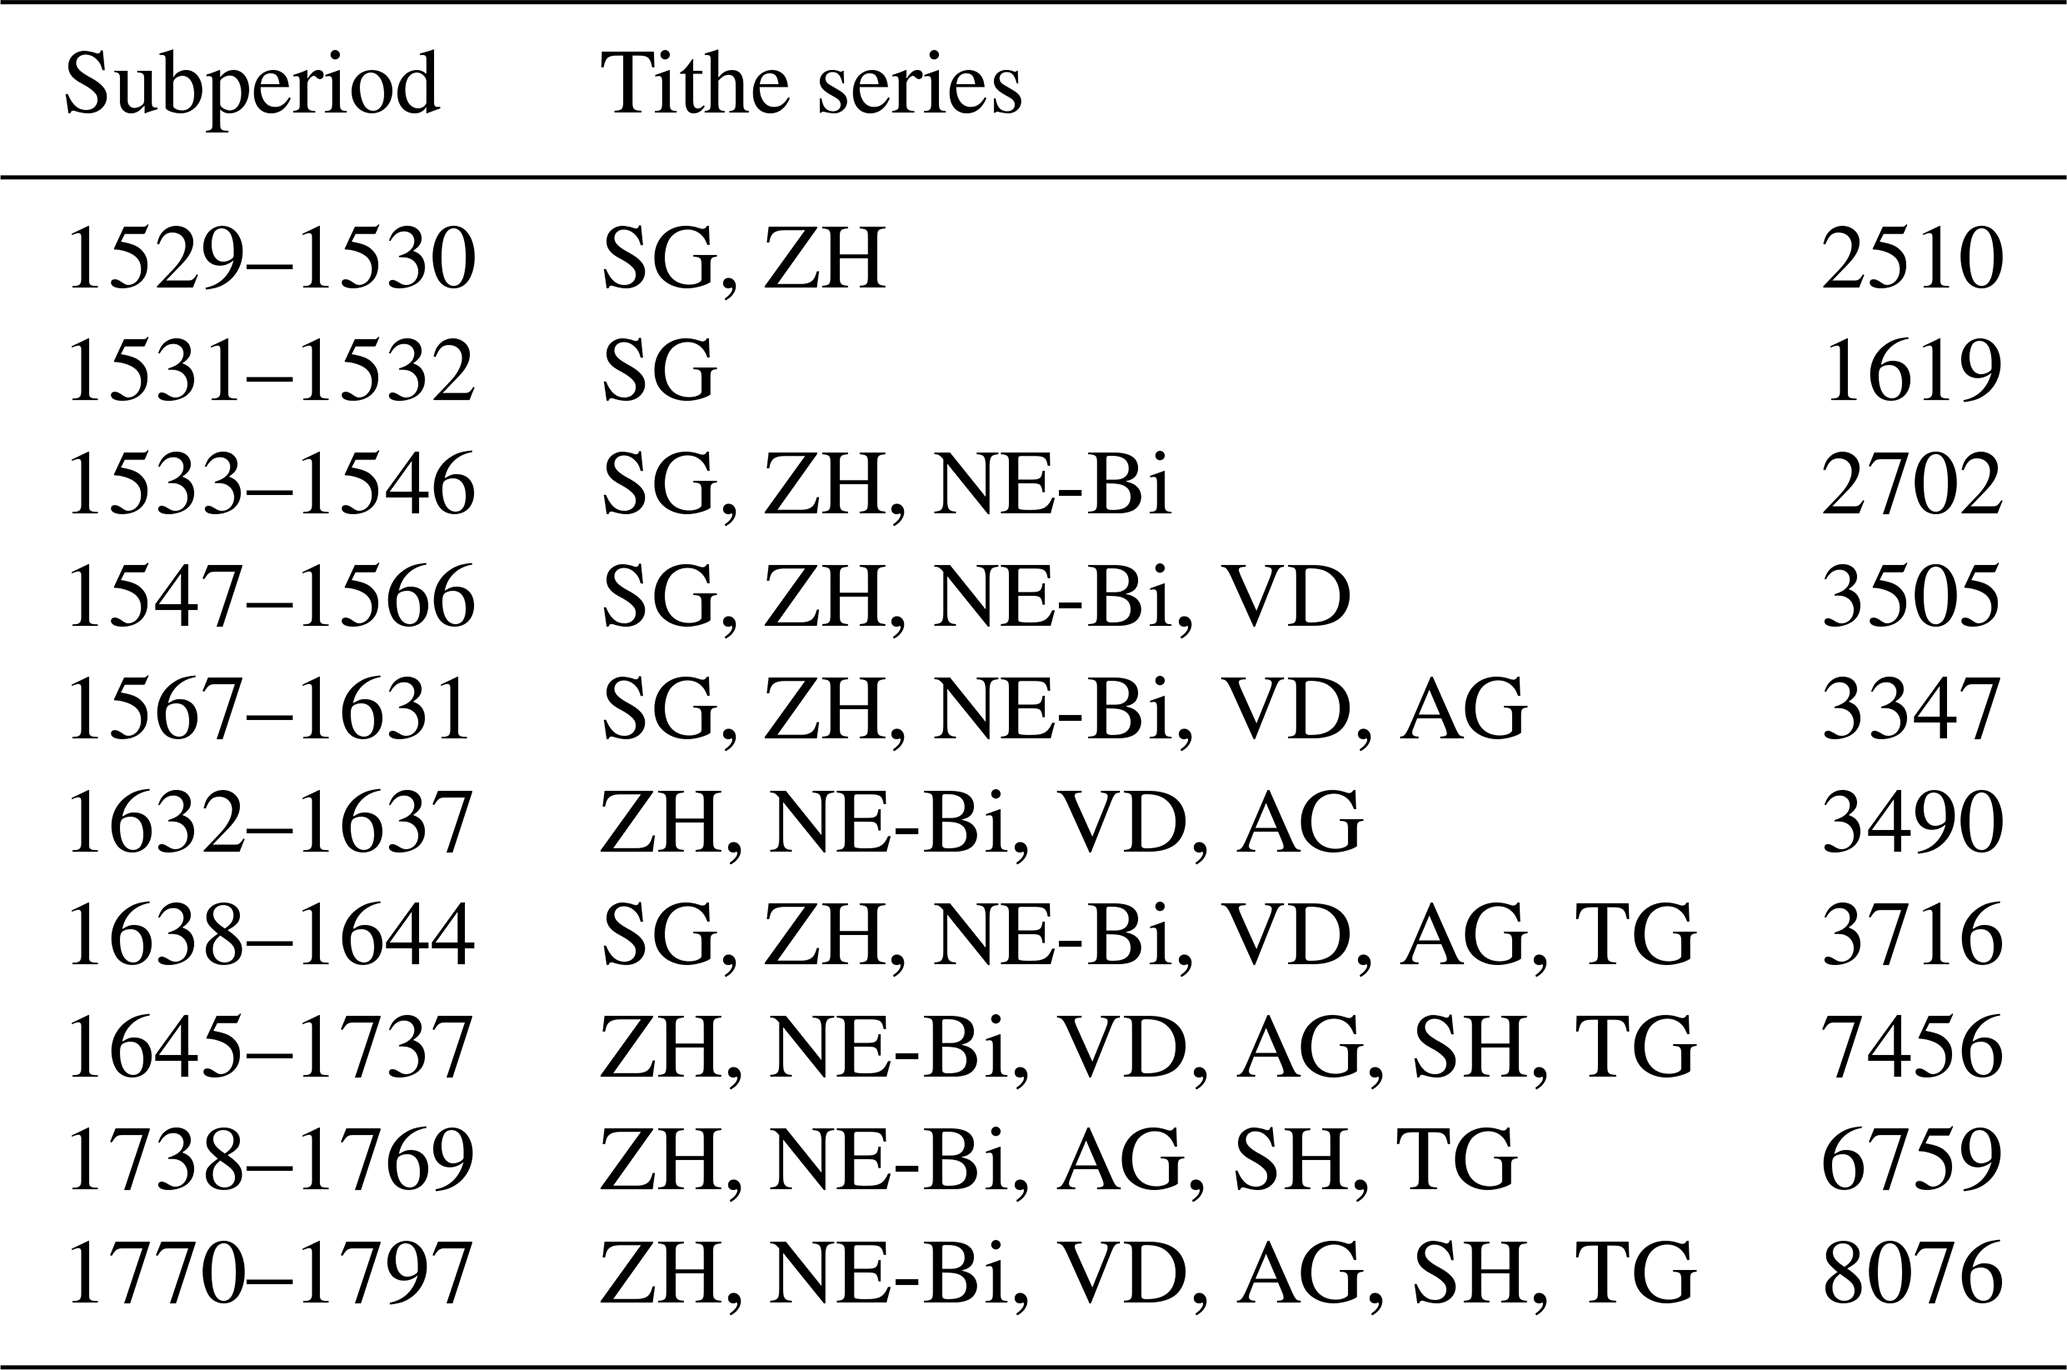
Legend: AG, later Canton Aargau; NE-Bi, Region Lakes Biel and Neuchâtel; SG, Upper Rhine valley (Altstätten, Canton St. Gallen); SH, Total production Canton Schaffhausen; TG, later Canton Thurgau; VD, later Canton Vaud; ZH, Canton Zurich (Pfister, 1984: Table 10 Anhang).
In contrast to the tithe series, a total of 16 series of area yields were compiled for the Swiss Plateau. They were derived from the financial records of leased vineyards owned by private individuals and official institutions (Pfister, 1984; Table 3). In most cases, the yield was shared between the leaseholder and the owner. Some records specify in detail the costs of cultivation, the frequency of fertilizing and the periodic rejuvenation of the vines. From 1533 to 1839, the name of the tenant, the surface of the plot and the yield were annually recorded in the accounts of the city of Zurich. These records occasionally include comments on the condition of the vines, when those were affected by adverse weather. The total amount of tithes agrees largely (72 %) with those of yields per area between 1533 and 1797 (Pfister, 1981). The regional series Swiss Plateau 2 from 1798–1966 (Table 1, source 9) builds on the regional series Tithe Swiss Plateau 1 (Table 1, source 10), employing data from the same cantons as well as from Swiss Plateau 3 (Table 1, source 10), extending from 1967 to 1988.
Figure 2 shows the display of the annual wine must crop collected for a private owner between 1658 and 1757 in Ligerz (Canton Bern, Switzerland).
The supplementary evidence allows for assessment of the spatial range of the yield data. The series for Vienna (Tables 1–11) is based on the accounts of the city hospital, which was a municipal institution responsible for the accommodation and care of the poor, the elderly, orphans, the sick and pilgrims. It managed a wine estate with an area of 90 to 100 ha using paid labour (Niedermayr, 2020). However, the estate was seriously affected during the Ottomans' siege of Vienna in 1683 (Krack, 2019). The supplementary evidence from the lower Austrian town of Langenlois between 1648 and 1748 is based on the accounts of the city hospital (Table 1, source 12). The supplementary evidence for the town of Kőszeg situated in Western Hungary (Table 1, source 13) presents further information from the Book of Vinesprouts starting in 1740. This unique document details the measured annual size of vine sprouts on 24 April as a phenological proxy for the onset of spring, together with information on quantity and quality (Kiss et al., 2011) (Table 1, source 13). The data on quantity (Table 1, source 13) are listed in terms of an index from 5 (outstanding quantity) to 1 (complete crop failure). The supplementary evidence for the Czech historical region of Southern Moravia (Fig. 1) presents annual yields in five classes for the period between 1692 and 1921 (Table 1, source 14), compiled from different places (Brázdil et al., 2008).
The 11 regional series were combined into three supra-regional series: Mosel, Germany and Swiss Plateau (Fig. 3).
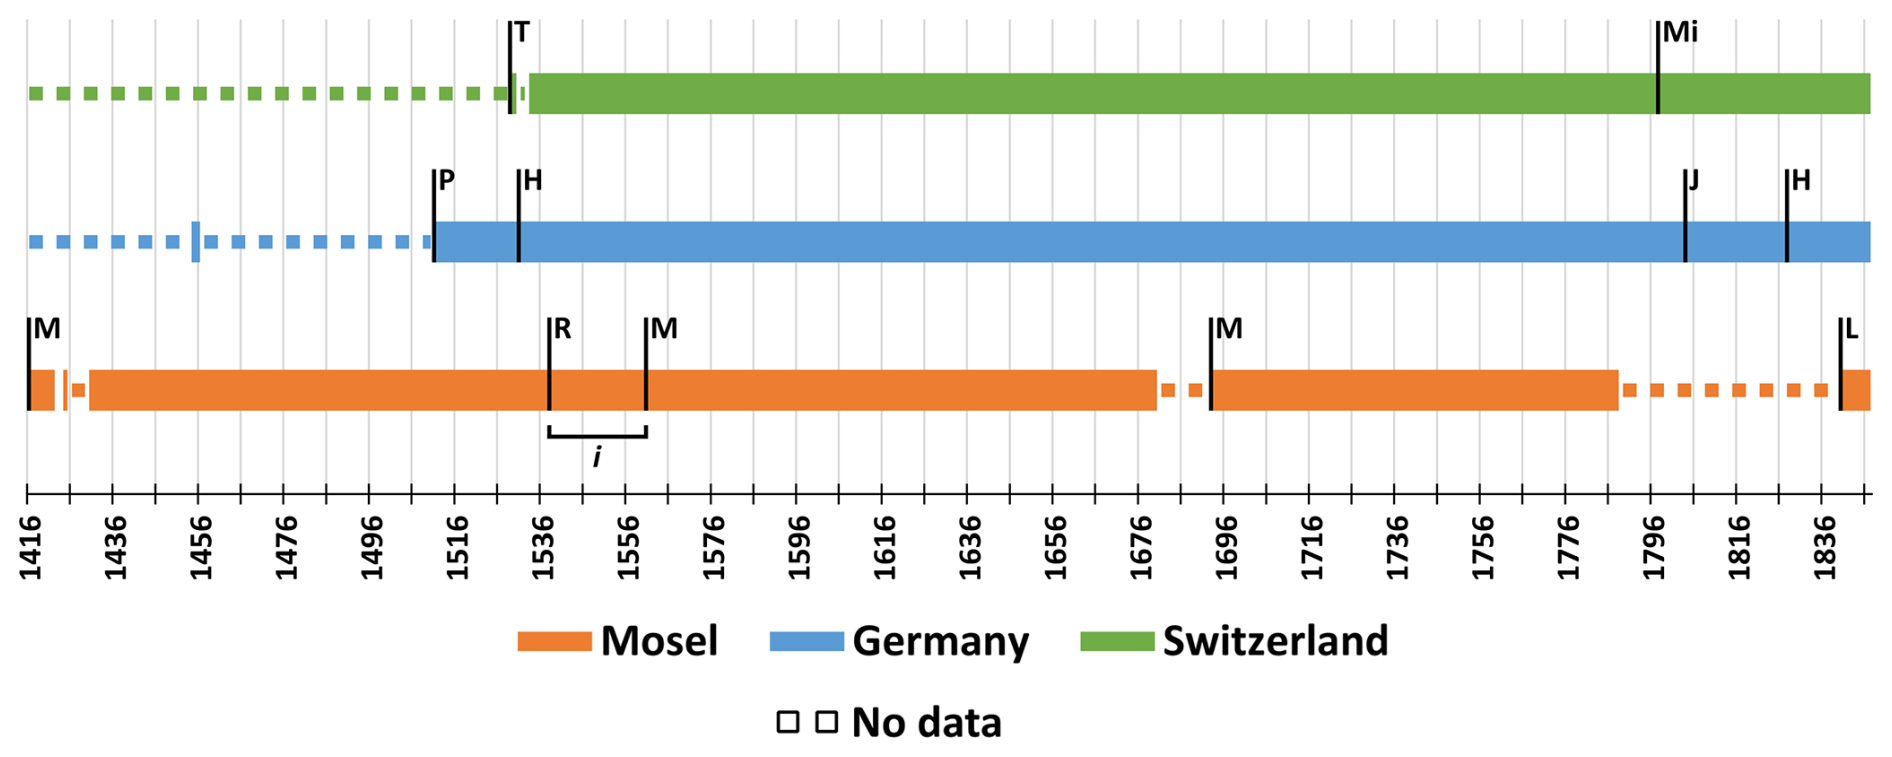
Figure 3The composition of the three supra-regional series. Legend: T = Tithe yields; Mi = Swiss Plateau; P = Prüfening; H = Heilbronn; J = Johannisberg; M = Metz; M = Metz interpolated; R = Remich; L = Luxembourg.
The supra-regional series Mosel comprises the two regional series Metz (Table 1, source 1), supplemented by Remich and Luxembourg (Table 1, source 3). The supra-regional series Germany comprises the regional series Prüfening (Table 1, source 4), Heilbronn (Table 1, source 5), Germany (Table 1, source 6) and Johannisberg (Table 1, source 7). The supra-regional series Swiss Plateau comprises the three regional series Swiss Plateau 1 to 3 (Table 1, source 8.10).
As shown in Table 4, the Pearson correlation coefficients decreased with growing distance between the series. In fact, the coefficients between the series Mosel, Germany and the Swiss Plateau are still significant with the supplementary series Vienna, Langenlois, Köszeg and Southern Moravia at about 1000 km. The correlations between wine yields thus had a large-scale representativity. In contrast, the values between the Heilbronn and Swiss Plateau yield series were surprisingly low. This may be partly due to the dangerous fungus Downy Mildew introduced from the United States (Fontaine et al., 2021).
Table 4The correlation coefficients between yield series.
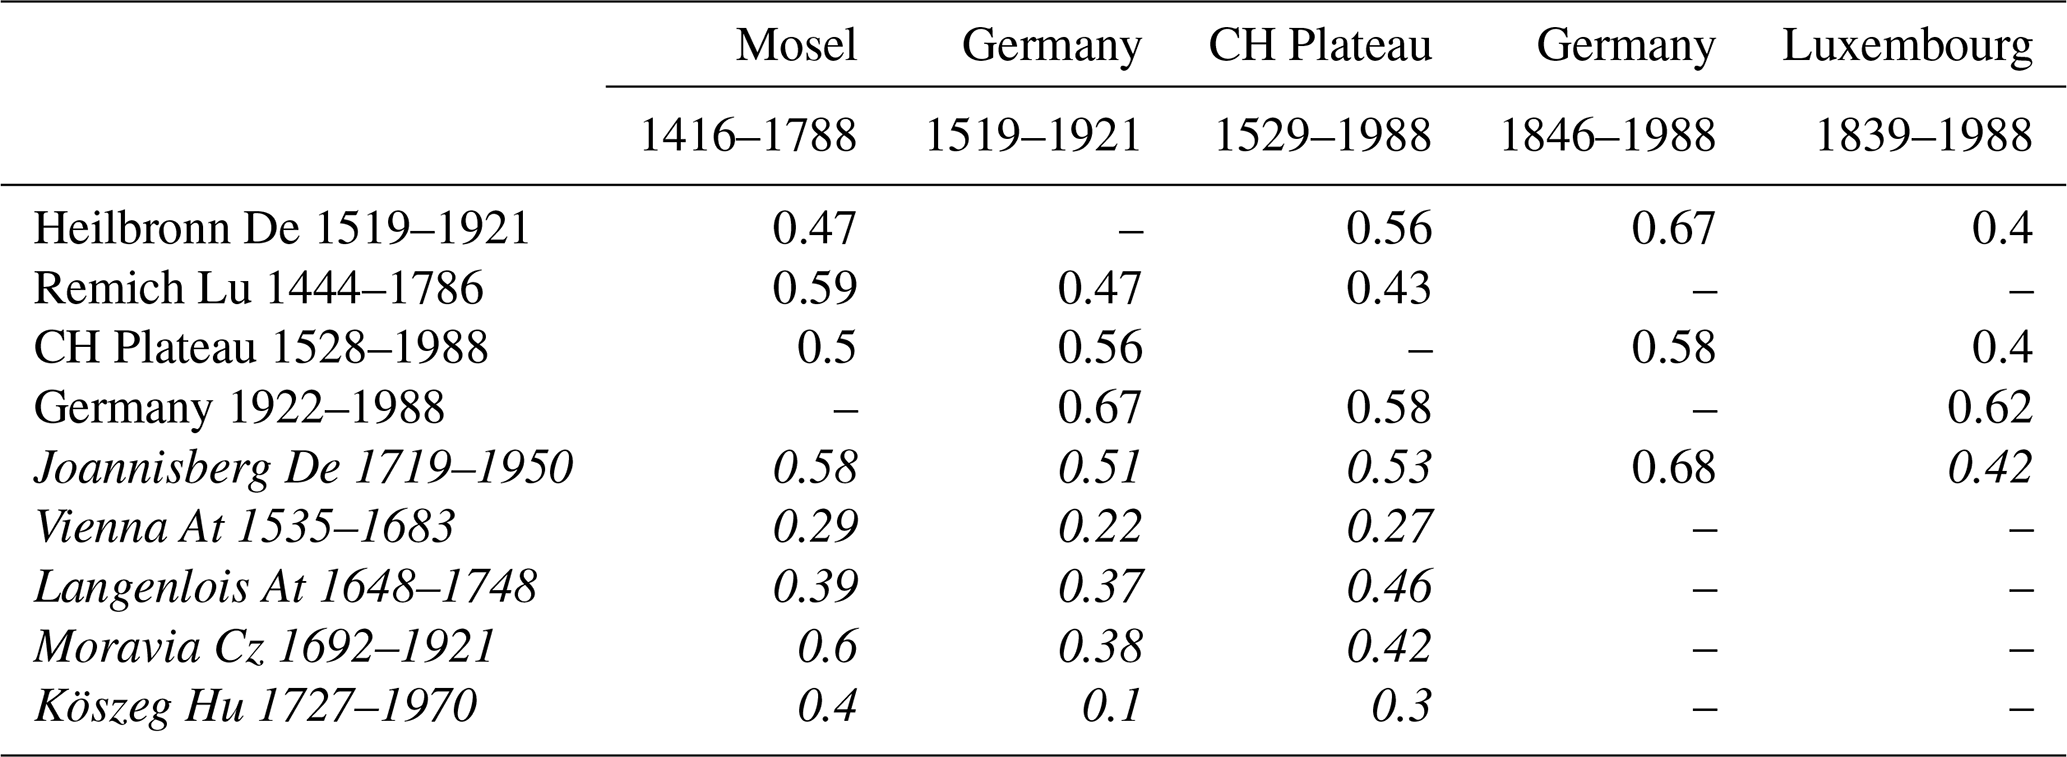
Legend: At = Austria; Cz = Czech Republic; CH = Switzerland; De = Germany; Lu = Luxembourg; Hu = Hungary. Data: Southern Moravia: Brázdil et al. (2008). Italics: supplementary evidence.
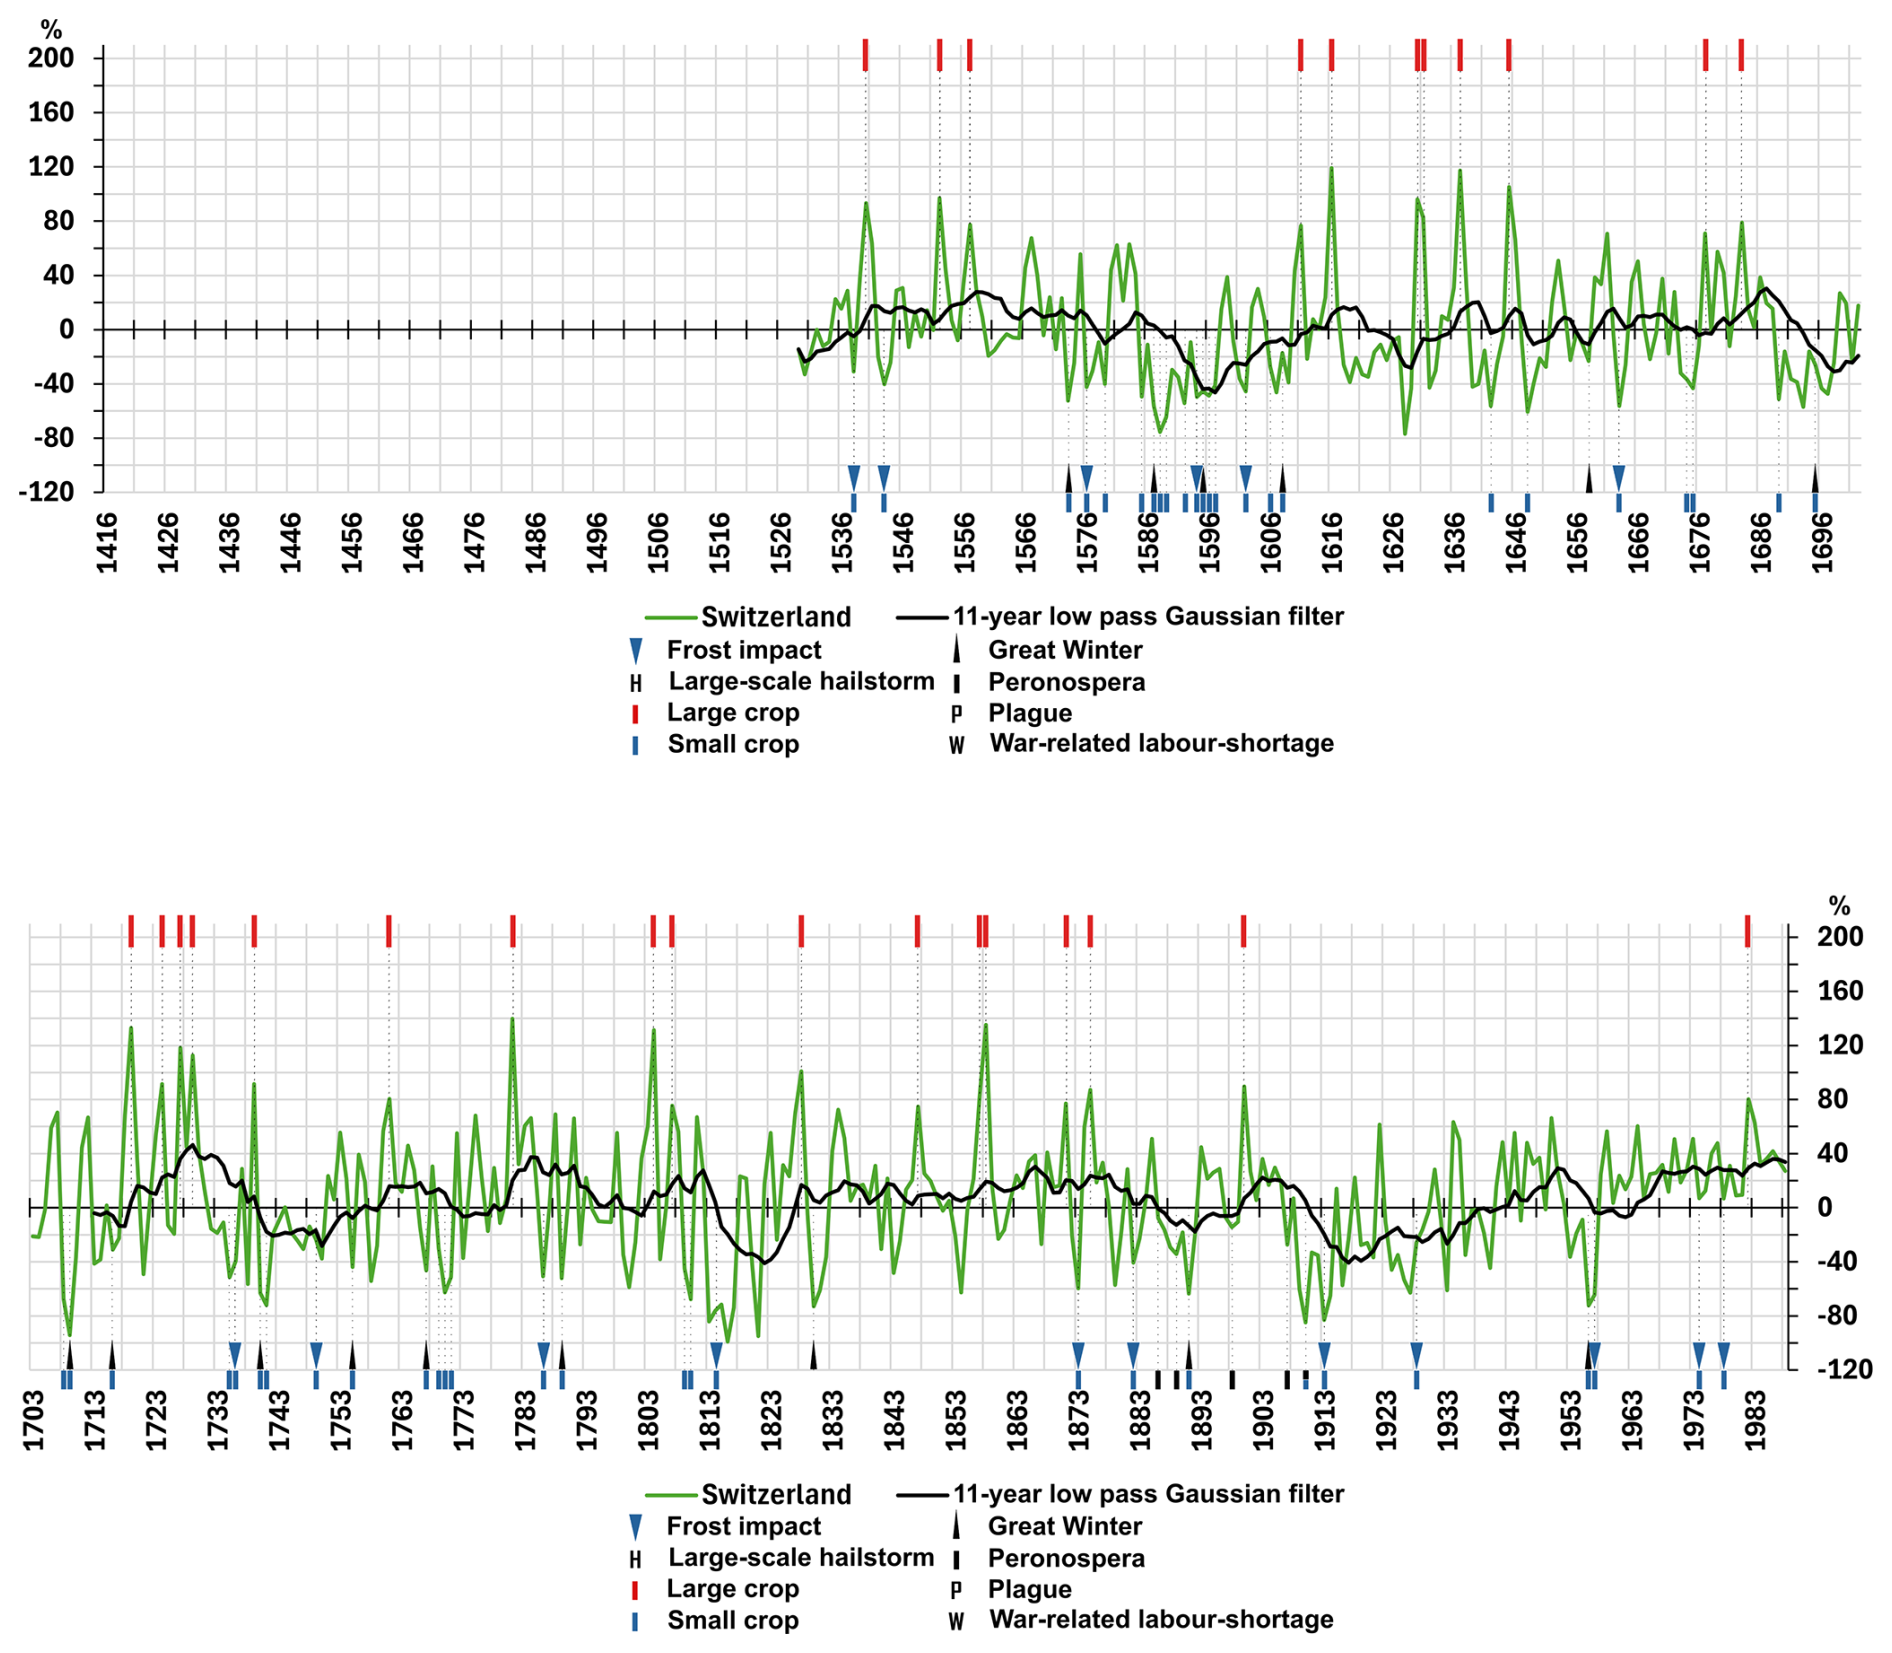
Figures 4 to 6 present the three super regional series. Visual indications of severe frost in winter and spring are displayed in the lower part of the figures, while large harvests (> 30 %) above the mean are displayed in the upper part.
Figure 4 shows the supra regional Mosel series as a percentage of the mean. The first segment shows the wine tax yield within the geographical boundaries of the City Republic of Metz (see Table 1, source 1). After a period of predominantly good harvests from 1416 to 1425, yields declined until 1446 due to recurrent severe winter and spring frosts (Camenisch et al., 2016). After two substantial harvests in 1447 and 1448, yields remained below average until 1470, largely due to repeated cold summers caused by volcanic eruptions in the 1450s (Sigl et al., 2015). During the warm years (1472 to 1474), three large yields were recorded; meanwhile, yields between 1481 and 1495 fluctuated widely due to erratic weather patterns. A decline until around 1530 was followed by a long period of stagnation that turned into a decade of frequent crop failures in 1586. Yields fluctuated above average between 1603 and 1636. Then they fell sharply, possibly because of the plague and the Thirty Years' War (1618–1648). In 1646, Metz was occupied by French troops, which might have caused a further slump in yields. From 1672 to 1693, records on yields are missing altogether. Disregarding a large crop yield in 1706, yields were mainly below average until 1717. A sequence of warm summers shaped the period from 1718 to 1728, with the yield in 1718 achieving 400 % of the average. A shorter run of large harvests was registered from 1779 to 1781. Spring frosts were frequent in the 1430s and the periods from 1561 to 1576, 1586 to 1602 and 1651 to 1671. Remarkably, few frost events were recorded from 1531 to 1560, 1606 to 1625 and 1718 to 1739.
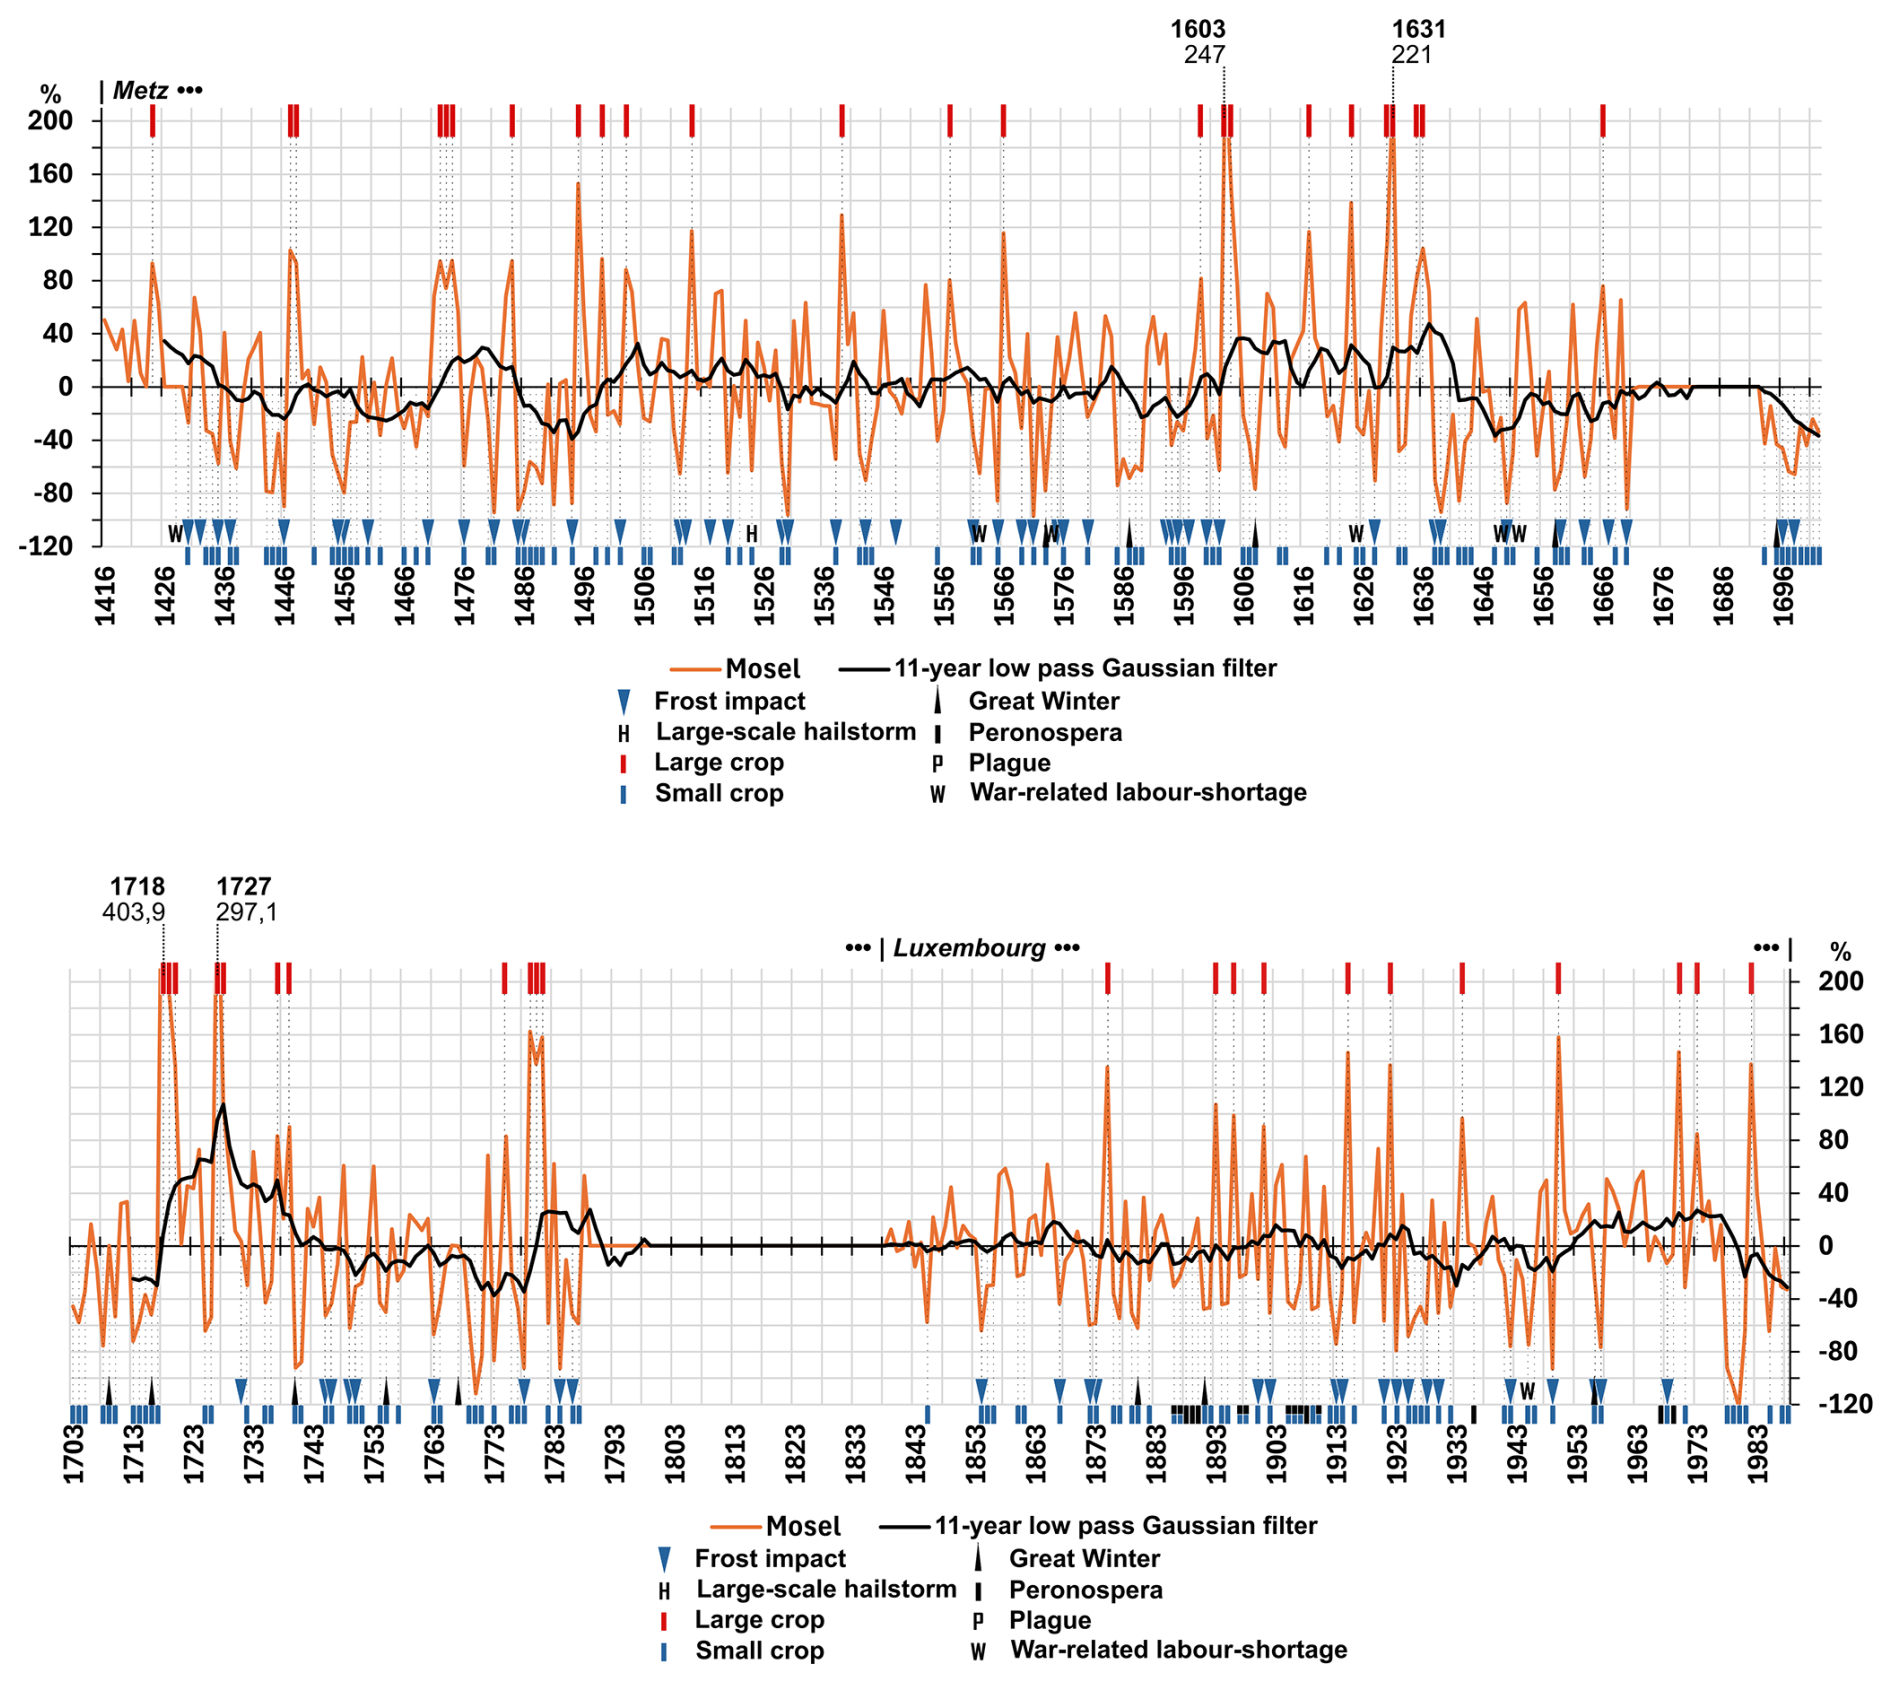
The second part of the supra-regional Mosel series showed deviations from the mean yields in the Grand Duchy of Luxembourg from 1839 to 1988 (see Table 1, source 3). Excluding a record harvest in 1875, yields fluctuated around the average until 1893 and then fell to a low point in 1913, partly due to infections with the downy mildew fungus (Fontaine et al., 2021). Spring frosts were frequent between 1913 and 1928. The switch to phylloxera-safe vines in the 1930s, supported by the state, led to an increase in yields and quality (Massard, 2007). In the post-war period, the extreme conditions experienced in 1949 and 1950, as well as the poor harvest of 1956, which was caused by winter frost and a cold summer, are noteworthy. A bumper harvest was registered in 1982.
Figure 5 shows the supra regional Germany series as a percentage of the mean. The first part until 1518 refers to the rent paid to the Prüfening monastery (Table 1, source 4). From 1519 to 1803 and from 1826 to 1921, it applies to the Heilbronn regional series (Table 1, source 5). The period from 1804 to 1825 is covered by the Johannisberg castle series (Table 1, source 7). The subsequent dataset presents the calculated average area yield data for the former Federal Republic of Germany from 1922 to 1988 (Table 1, source 6).
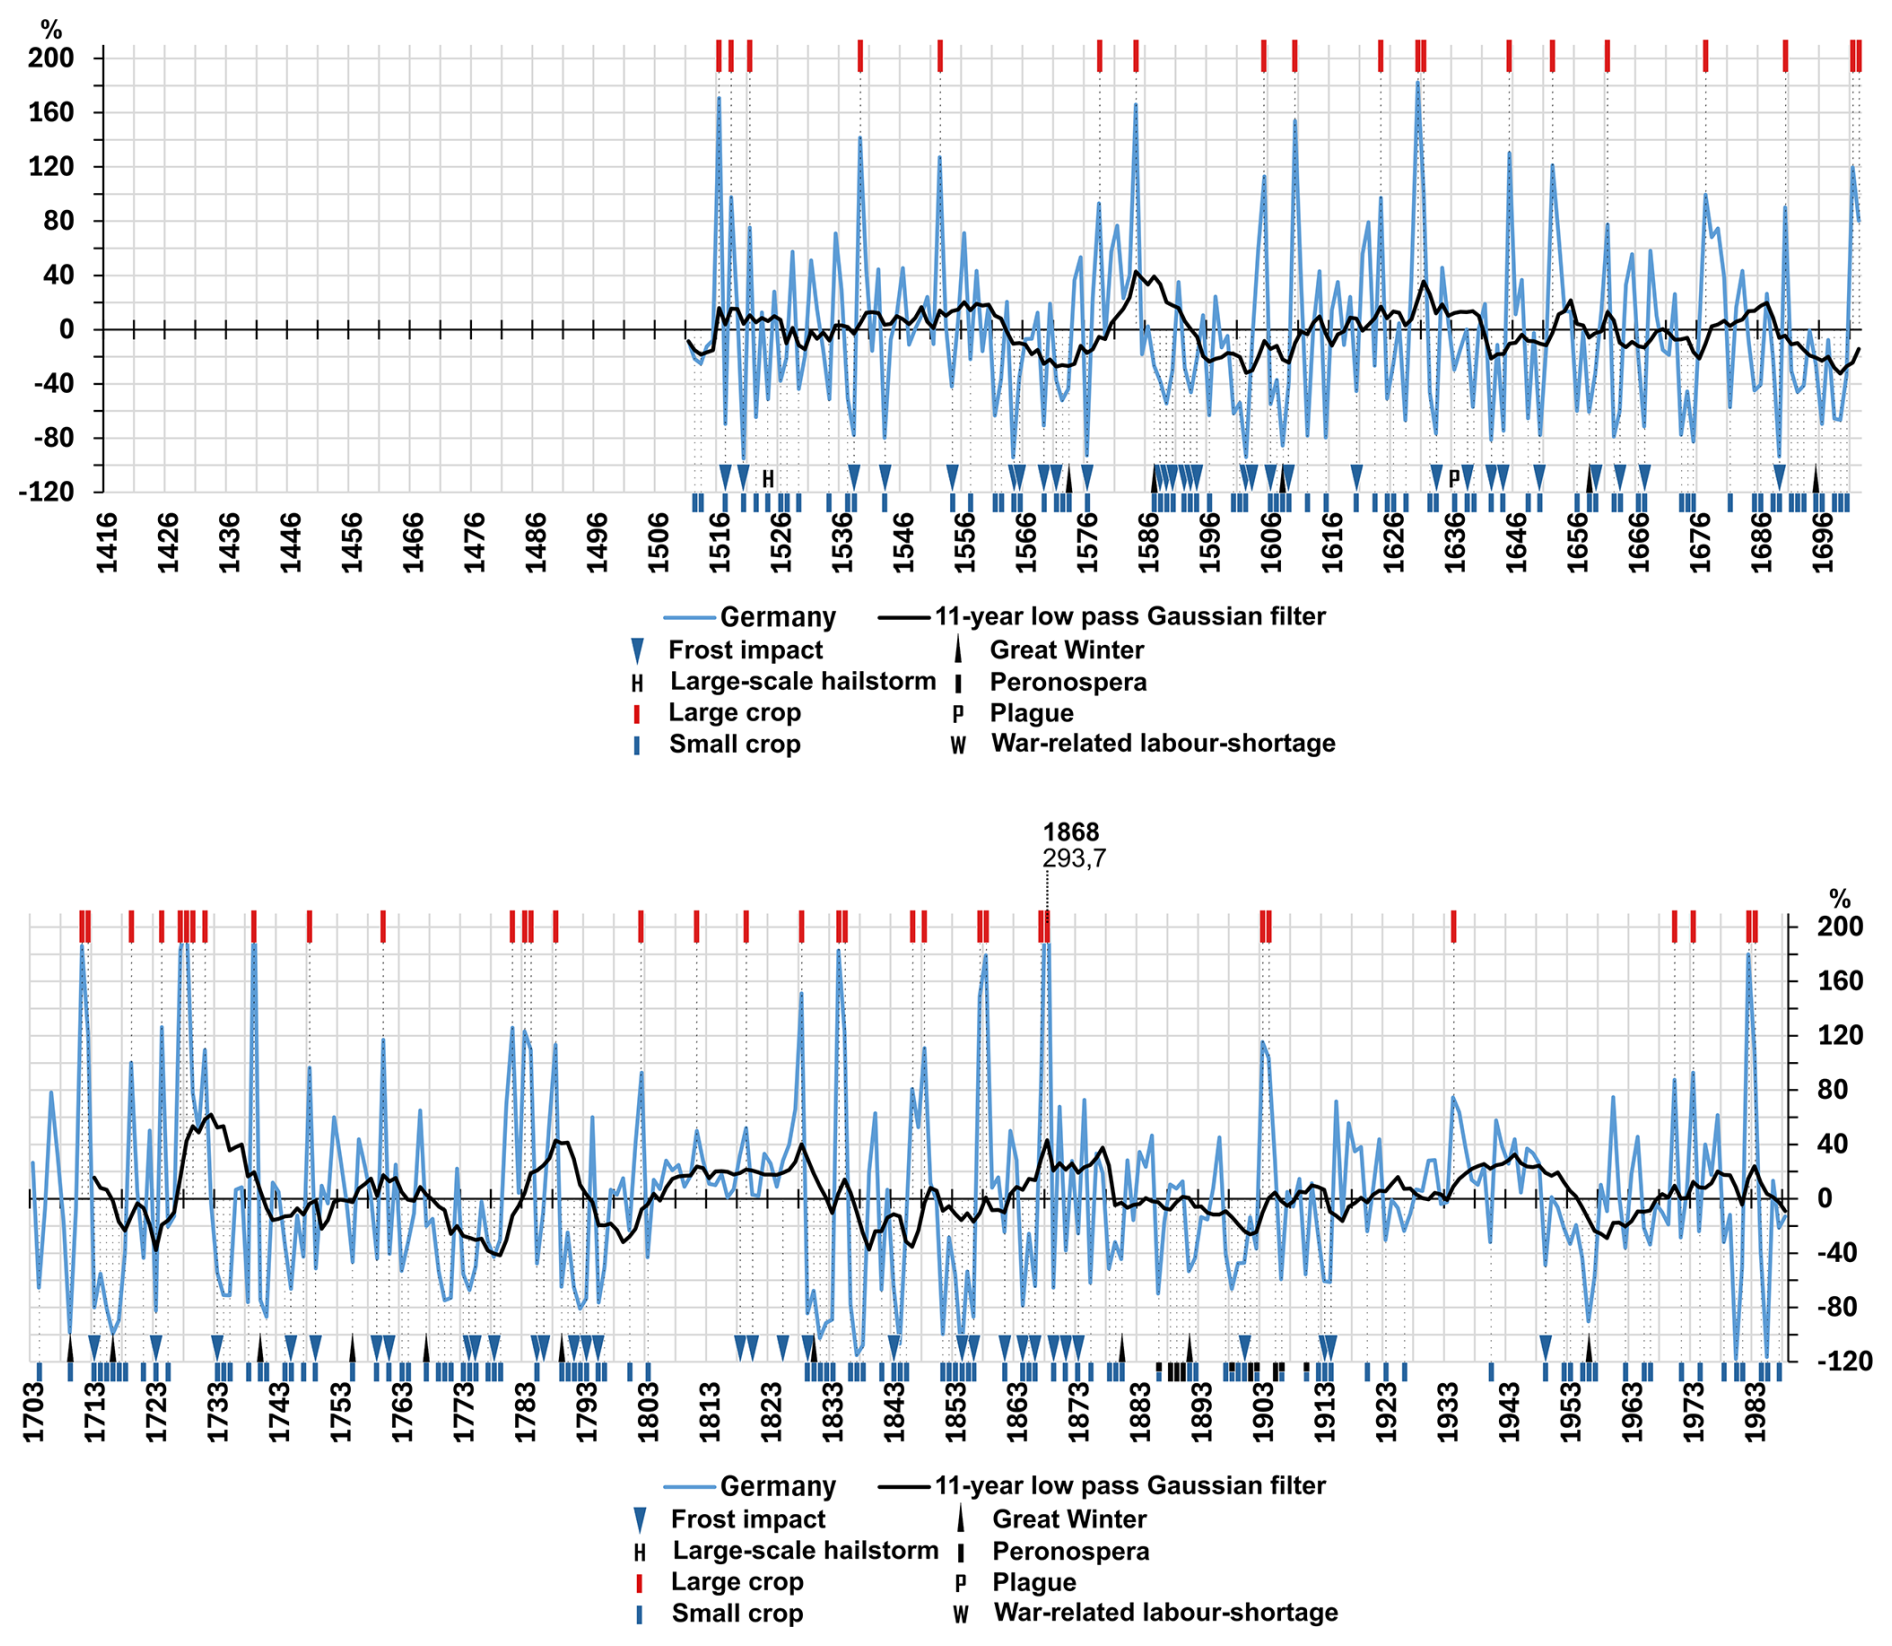
Disregarding the initial dip in harvest around 1520, harvests were mostly favourable up until 1552. This upswing was driven by moderate grain prices, relatively high wine prices and a growing workforce. About 10 000 ha of new vineyards were planted in the Duchy of Württemberg between 1514 and 1566 (Alber and Vogt, 2016). Sharecropping offered the land-poor lower classes the opportunity to get a living from a small plot of land, subject to favourable weather conditions. After 1552, yields fell to a low in the cold early 1570s, only to rise to a short peak in 1584. A succession of late frosts, harsh winters and cold summers for the next two decades resulted in poor harvests. Grain prices rose relative to wine prices in the context of recurrent crop failures. Consequently, many tenants were unable to meet their families' needs through the sale of wine (Landsteiner, 1999). A substantial harvest in 1605 initiated a third upward trend, which culminated in the double bumper harvests of 1630 and 1631. Yields fluctuated around average until 1687. Cold seasons were frequent over the next two decades. However, yields somewhat recovered until 1708, when they turned low again until 1716. The 12 years between 1718 and 1729 stand out for their unique sequence of bumper harvests. The mostly low yields of 1740 and 1747 were followed by small to average harvests until 1779 and by large harvests in 1781, 1783 and 1784. The town was repeatedly occupied by French troops, first in 1688 during the Nine Years' War (1688–1697), then from 1734 to 1736 during the War of the Polish Succession (1733–1738) and finally in 1794 and 1799 during the First and Second Coalition Wars, respectively (1792–1797; 1798–1802) (Dürr, 1926). The Johannisberg castle series from 1803 to 1825 includes a series of poor crops during the cold phase from 1812 to 1817. The years from 1826 to 1868 are characterized by high yield variability. Despite nine bumper harvests, only a small amount of wine could be stored in 7 years. Following this period, the range of yield fluctuations decreased, although the losses in the years between 1886 and 1910 might have been due to the downy mildew disease (Plasmopara viticola) (Fontaine et al., 2021). In the post-war period, there were poor harvests in 1956 and during the wet summer of 1980. Two bumper harvests in 1982 and 1983 led to overproduction. Spring frosts were frequent from 1586 to 1611, 1773 to 1784 and 1828 to 1878. Further records are missing for the remaining period.
Figure 6 presents the supra-regional Swiss Plateau series covering the period from 1529 to 1988 as a percentage of the mean. After a poor crop yield in 1529, yields rose to a bumper harvest in 1540 and then alternated above average until 1557. A longer-term decline in yields began in 1558, accelerating in the early 1570s. After a brief warm spell from 1580 to 1584, winter and spring frosts, superposed by cold summers, affected the vines until 1602. From 1603 to 1617, yields increased, culminating in a bumper harvest in 1616. Over the subsequent 13 years, yields mostly remained below average. Bumper harvests in the 1630s ushered in a period of great variability that lasted until 1688. The following decade was marked by severe frosts and cold summers with poor harvests. The period from 1718 to 1731 stands out with four bumper harvests and three above-average yield years. Between 1740 and 1811, above- and below-average harvests alternated, especially during a cold spell from 1769 to 1773. The early 19th century was characterised by a series of poor harvests between 1812 and 1817 and again between 1830 and 1833. Apart from a dip between 1888 and 1891, yields moved around average until 1908. Only three harvests were satisfactory between 1909 and 1928 due to the weather and downy mildew (Plasmopara viticola) disease (Altwegg, 2023). Apart from a severe crop failure due to winter frost in 1956 and a severe spring frost the following year, yields fluctuated above average until 1988, including two large harvests in 1982 and 1983. No further records of spring frost are available.
The supra-regional series share some common features, including a tendency for above-average harvests in the first half of the 16th century. In fact, summer temperatures in Central Europe from 1531 to 1540 were 0.25 °C (±0.49 °C) above the mean for the reference period between 1961 and 1990 according to the documentary-based temperature reconstruction by Dobrovolný et al. (2010). Second, an accumulation of low and poor harvests from 1585 to 1602 is evident in all three series, when estimated annual temperatures in Central Europe were 1.2 °C (±0.37 °C) below the mean for the reference period between 1961 and 1990 according to Dobrovolný et al. (2010). Third, the period from 1689 to 1705 was characterised by a comparable accumulation of poor and failed harvests. The annual mean temperature according to early instrumental data from Paris was 0.7 °C below the 1901–2000 mean. Fourth, record harvests were observed between 1718 and 1729, when summers in Paris were 0.3 °C above the average for the period between 1901 and 2000 (Rousseau, 2015). Fifth, yields remained consistently low during the frosty summers of 1813 to 1817. Sixth, in all three regions, yields generally declined between the 1890s and 1913, partly due to climate and partly due to the downy mildew (Peronospora viticola) disease (Altwegg, 2023). Finally, large yields were registered in 1982 and 1983. Concluding on the magnitude of yield losses, severe frosts tended to cause more damage in the Mosel and Heilbronn regions located further north than in the Swiss Plateau.
In Metz and Heilbronn, warfare repeatedly caused considerable damage, while Switzerland – apart from its rapid conquest by French armies in 1798 – was only involved in four brief civil wars. Moreover, total yields came from a much larger catchment area than those in Metz or Heilbronn, which might have somewhat balanced out fluctuations. Finally, average yields ranging from 30 to 50 hL ha−1 on the Swiss Plateau (Pfister, 1981) were considerably higher than those in Johannisberg castle (23 hL ha−1) (Table 1, source 7), Vienna and Langenlois (17.5 ha hL−1) (Table 1, sources 11 and 12). This difference may reflect a better supply of fertiliser to the Swiss vineyards due to nearby cattle grazing areas.
To produce homogenised time series of wine must production, expressed as deviation in percentage from the long-term mean, we applied the following methods. In each interval i, we calculated the mean value of the must-series and called it mi. In each interval, straight line or nth order polynomium to the data using ordinary least squares (Draper and Smith, 1998). We used orthogonal polynomia since it increases numerical stability (Draper and Smith, 1998). We subtracted the fit from the data, resulting in residuals rij, where i is the interval and j is the year.
We calculated the ratio of the residuals to the interval's mean value and expressed it as a percentage:
We obtained wine must production data in an already contiguous series for the Swiss Plateau. For these series, a linear fit was used to remove the trend. We also obtained a set of series for southern Germany, where the former was detrended linearly and the latter with a fifth-order polynomial. A single series of wine must data from the Swiss Plateau covering just 1967–1990 was also processed using fifth-order detrending. Data from Germany for 1847–1988 showed a gap during the Second World War, but we made up for that using data from Johannisberg (covering 1933–1947) for the overlapping years 1933–1939. A linear transformation for the overlapping years was calculated, and the Johannisberg data for years 1940–1947 were transformed with it. Then, the filled-in data were tested for statistical similarity in the periods from 1920–1957 and 1958–1988 using the Kolmogorov–Smirnov test (Conover, 1999). In detail, the null hypothesis that both datasets are drawn from the same population was tested. The result showed that the null hypothesis could be strongly rejected, implying that the data from the two periods were not drawn from the same population – that is, they were very different. We next detrended and converted the interval-mean to percentages using break years at 1879 and 1988. It seemed the resulting 46 series was not variance stationary, with a suggested break near 1950, and a similar procedure was followed for data from Switzerland (1837–1989), except there were no gaps to fill. Also, here, break years were specified as 1879 and 1958.
The calibration method commonly used in palaeoclimatology is not appropriate for the climatic interpretation of wine must yields because large harvests are not always of good quality, and high-quality harvests are not always large. To some extent, this bias is due to legacy effects (Liu et al., 2025) connected to the formation of flowering buds in the summer before the harvest year. However, severe winter and spring frosts could also significantly reduce grape yields without affecting the quality.
The yield quality index (YQI) allows narrative vintage ratings, such as “much and good” and “little and sour”, to be used as a proxy. For this study, the mean residuals of the three supra-regional yield series were averaged. The result was divided into seven classes according to size. The yield classes were then multiplied by the five quality classes established by Pfister et al. (2024) whereby the order was reversed from 5 (very good) to 1 (poor). YQI could thus take values from 35 to 1. Due to the larger number of yield classes, the crop data were given a higher weight in the multiplication than the quality data corresponding to the practice of historical vintage ratings. The GHDs available for the entire period were used for validation.
Figure 7 presents a visual agreement between YQI and GHD. The red columns show “good harvests” with YQI > 70. The blue columns show “small harvests” with YQI < 10. “Good harvests” were frequent between 1416 and 1425, 1471 and 1473, 1539 and 1540, 1677 and 1681, as well as 1857 and 1858. This relationship is broken down in more detail in Table 5.
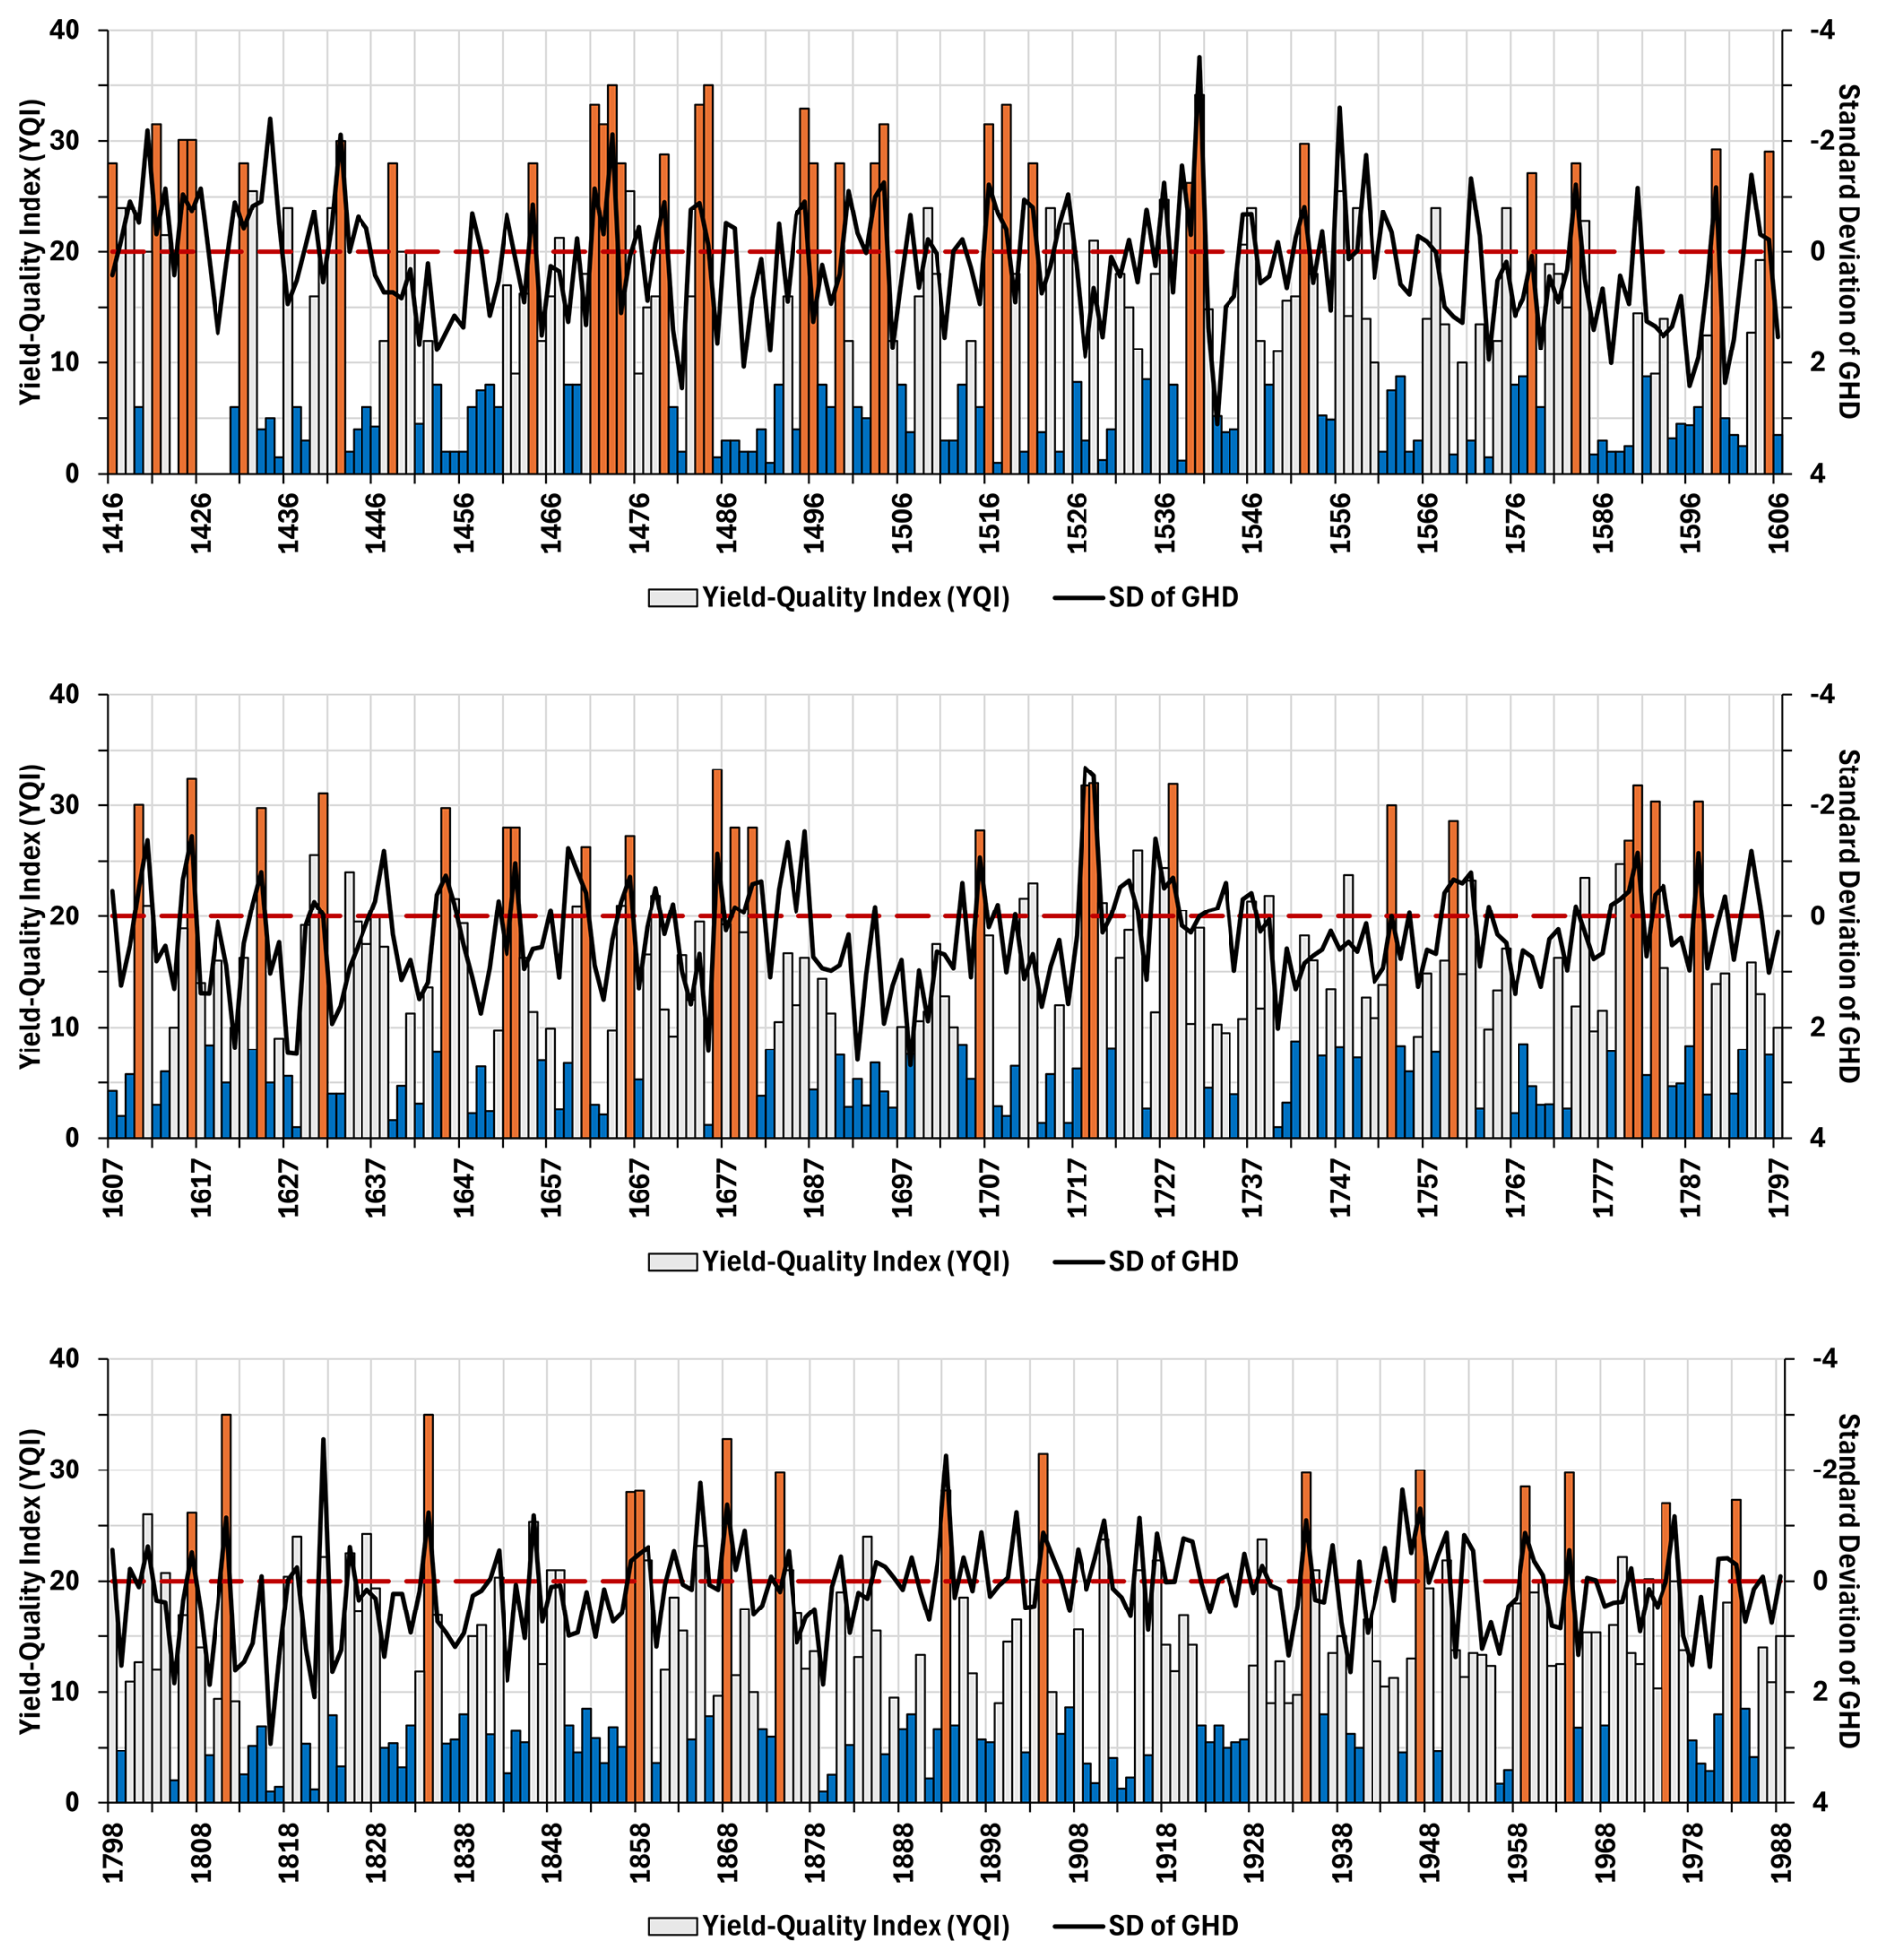
Figure 7Yield-Quality Index YQI and Grape Harvest Dates GHD from 1416 to 1988. Legend: YQI = The Yield-Quality Index comprises values between 0 and 35; Red columns = YQI > 20; Blue columns = YQI < 10; GHD = Average of standardized grape harvest date series for Beaune (France) from 1354 (Labbé et al., 2019) and Switzerland from 1461 (Pfister et al., 2024).
Table 5Frequency of grape harvests according to YQI for 1416–1988.
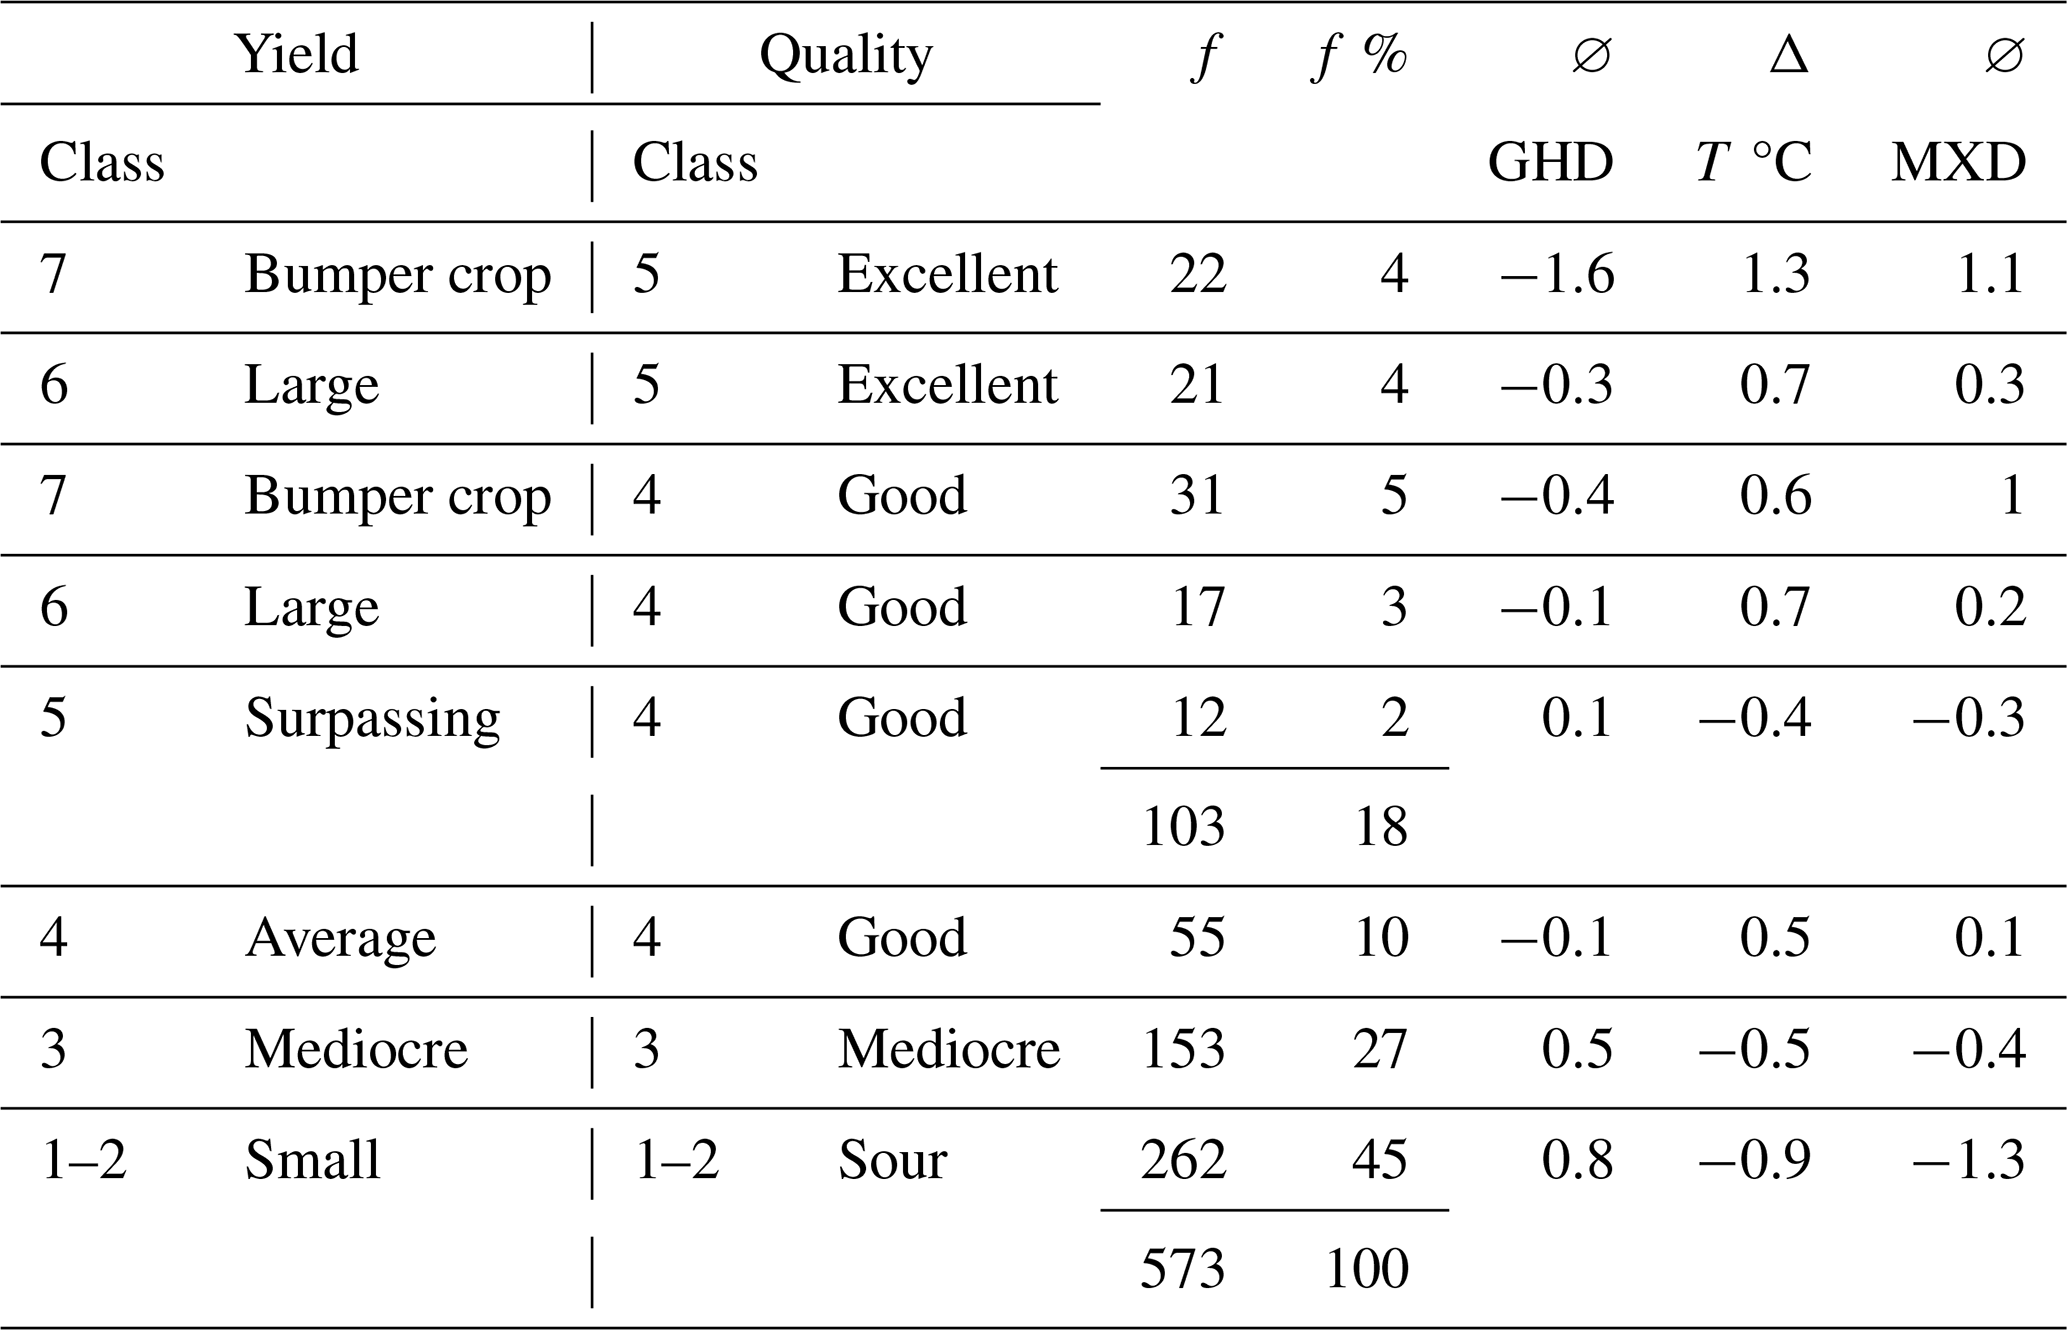
Legend: YQI = Yield quality index; f = frequency; f% = relative frequency; GHD = average of standardized GHD for Beaune (France) from 1354 (Labbé et al., 2019); Measured tree-ring maximum latewood density (MXD) in Lötschental (Switzerland) (Büntgen et al., 2006, Fig. 1); T°C = Deviation of May to July temperatures from the 1961–1990 average in Paris (1659 to 1988) (Rousseau, 2015).
GHD presents the number of positive and negative standard deviations.
Table 5 shows that 18 % of the grape harvests can be qualified as “excellent” or “good” and 10 % as quantitatively above average and of good quality; 27 % were mediocre, and 45 % “poor” and “sour” or “undrinkable”. Qualitatively and quantitatively “good” harvests went hand-in-hand with above-average summer temperatures, above-average to early GHD and above-average tree-ring maximum latewood density (MXD). However, this connection needs to be broken down in more detail (Table 6).
Table 6Range of YQI related to proxy data and May to July temperatures.
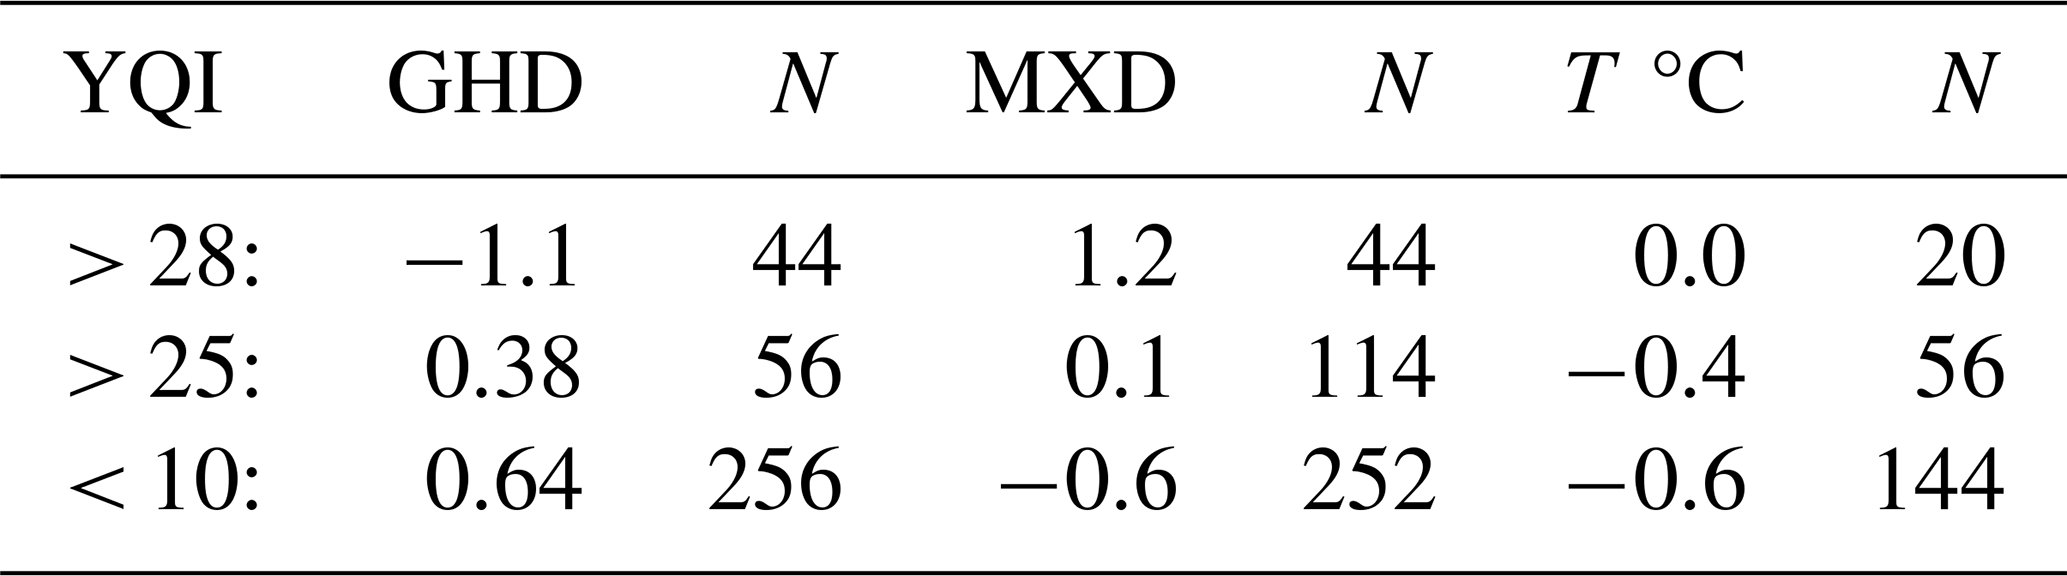
Legend: YQI = Yield quality index; GHD = Grape harvest dates for Beaune (Fr) (Labbé et al., 2019); MXD: tree-ring maximum latewood density from Lötschental (Switzerland) (Büntgen et al., 2006); N = number of cases; T°C = Deviation of May to July temperatures in Paris from 1961 to 1990.
It can be concluded from Table 6 that years with YQI > 28 are, on average, related to early GHD, high MDX values and above the 20th century's average May to July temperatures. This result may be interpreted in terms of large-scale weather conditions according to the findings of Jones and Davis (2000) regarding the Bordeaux region during the 20th century. This relationship vanishes with YQI values below 28. Likewise, YQI values < 10 are on average connected to May to July temperatures below the 1961–1990 average, late GHD and low MDX values.
Quantity, quality, and YQI can be very well modelled from climate data. We used temperature and precipitation data from the grid point 48.4° N, 6° E from the monthly Modern Era Reanalysis (ModE-RA) palaeo-reanalysis product (Valler et al., 2024) that is independent (i.e. it does not include the two-time series) and calibrated a model in the period 1781–1880 consistent with previous work (Pfister et al., 2024).
A backwards variable selection approach was used, initially comprising all monthly temperature and precipitation values from April in the preceding year to August in the current year. However, only variables statistically significant at p < 0.05 for one of the three series were kept. The resulting model (Table 6) shows that quantity depends on the previous years' temperature (note the negative sign for April's temperature), while quality does not. Conversely, quality depends slightly negatively on precipitation, while quantity does not. Overall, we find high explained variances, reaching 66 % for quantity, 74 % for quality and 75 % for YQI. This confirms that all three series can serve as climate indicators.
Table 7 shows that the size of the harvest depended primarily on temperatures between May and July of the harvest year, and to a lesser extent on temperatures in June and July of the previous year. Vine must quality, on the other hand, depended on temperatures between May and August, particularly on those in May and June (Pfister et al., 2024). According to the coefficient of determination R2, the oenological parameters correspond to temperatures by around 70 %. Historically, YQI was more important for winegrowers' incomes.
Table 7Coefficients (units per °C for temperature, units per 105 mm per month for precipitation), explained variances and adjusted explained variances of regression models for quantity, quality, and the YQI calibrated in the 1781 to 1880 period (bold: p < 0.05).
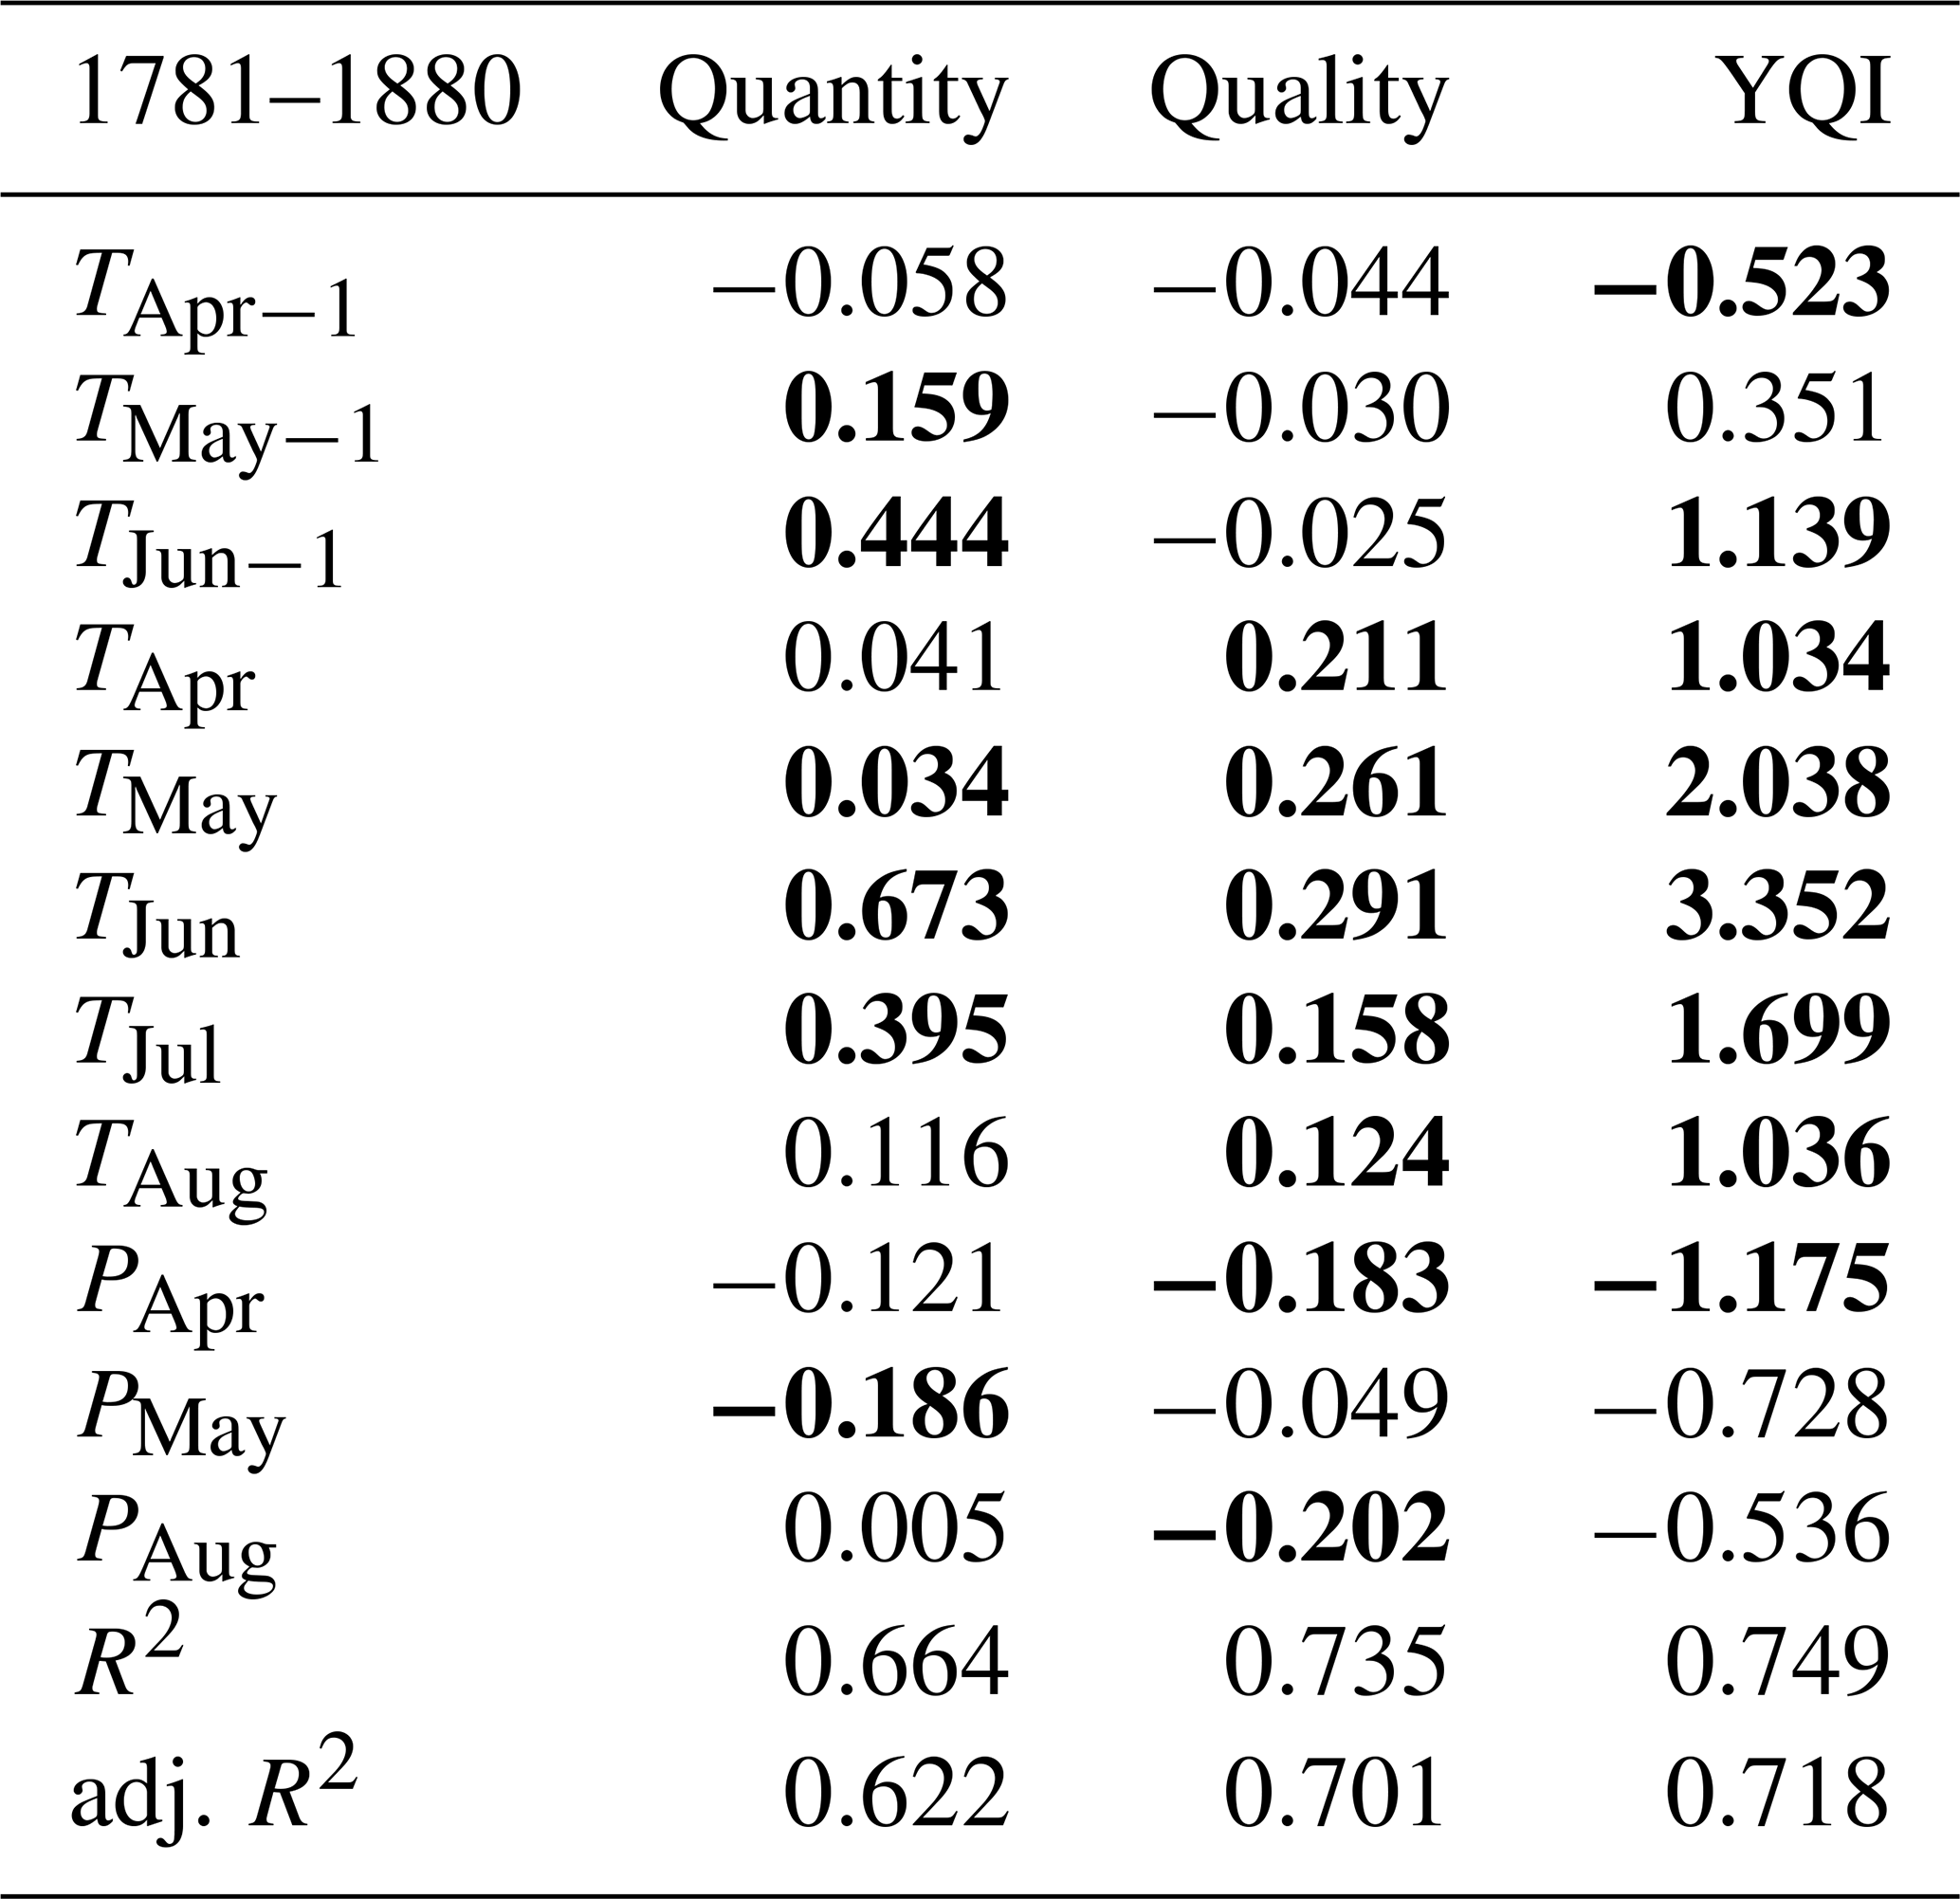
Figure 8 shows the modelled and observed YQI series from 1421 to 2008. For this figure, the modelled series was cut at the minimum and maximum values, i.e. at 1 and 35. The figure confirms the excellent agreement, with correlations of 0.87 in the calibration period and 0.60 over the entire period back to 1421. The YQI could be constructed further back in time and then used for climate reconstruction.
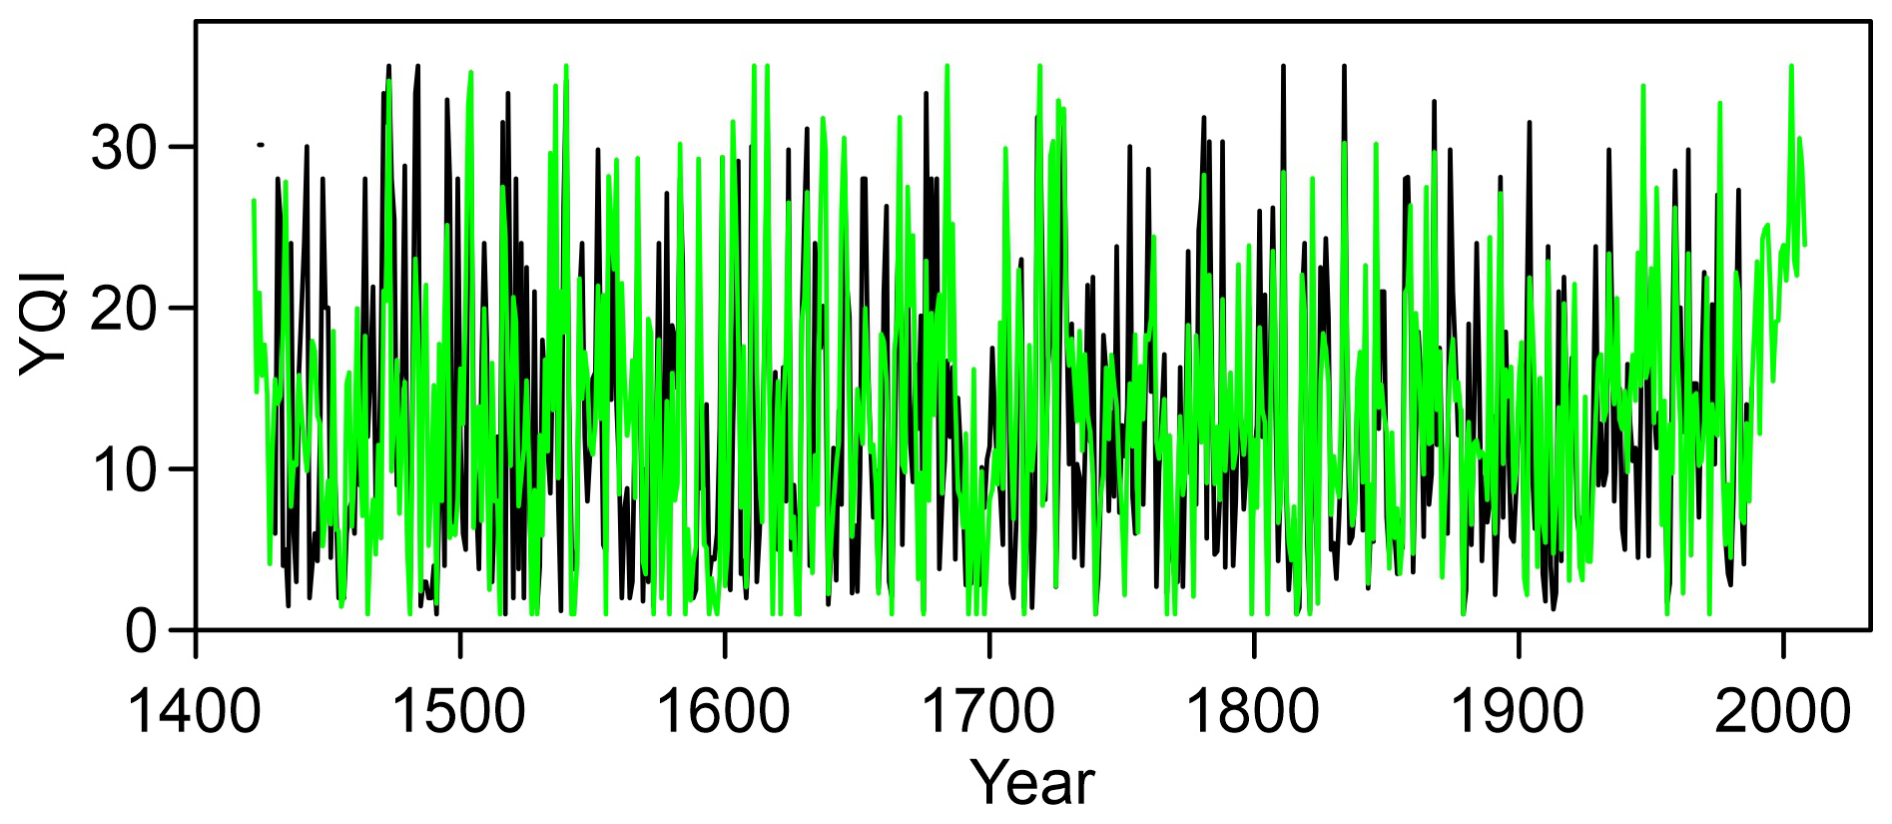
Figure 9 details the results of Table 6 regarding YQI > 28. It corresponds to a “good crop”, according to the practice of vintage ratings in the historical past. The linear regression of YQI > 28 with May to July temperatures shows a curve rising significantly according to y = 0.1326x = 2.9516 and r = 0.41 (N = 22).
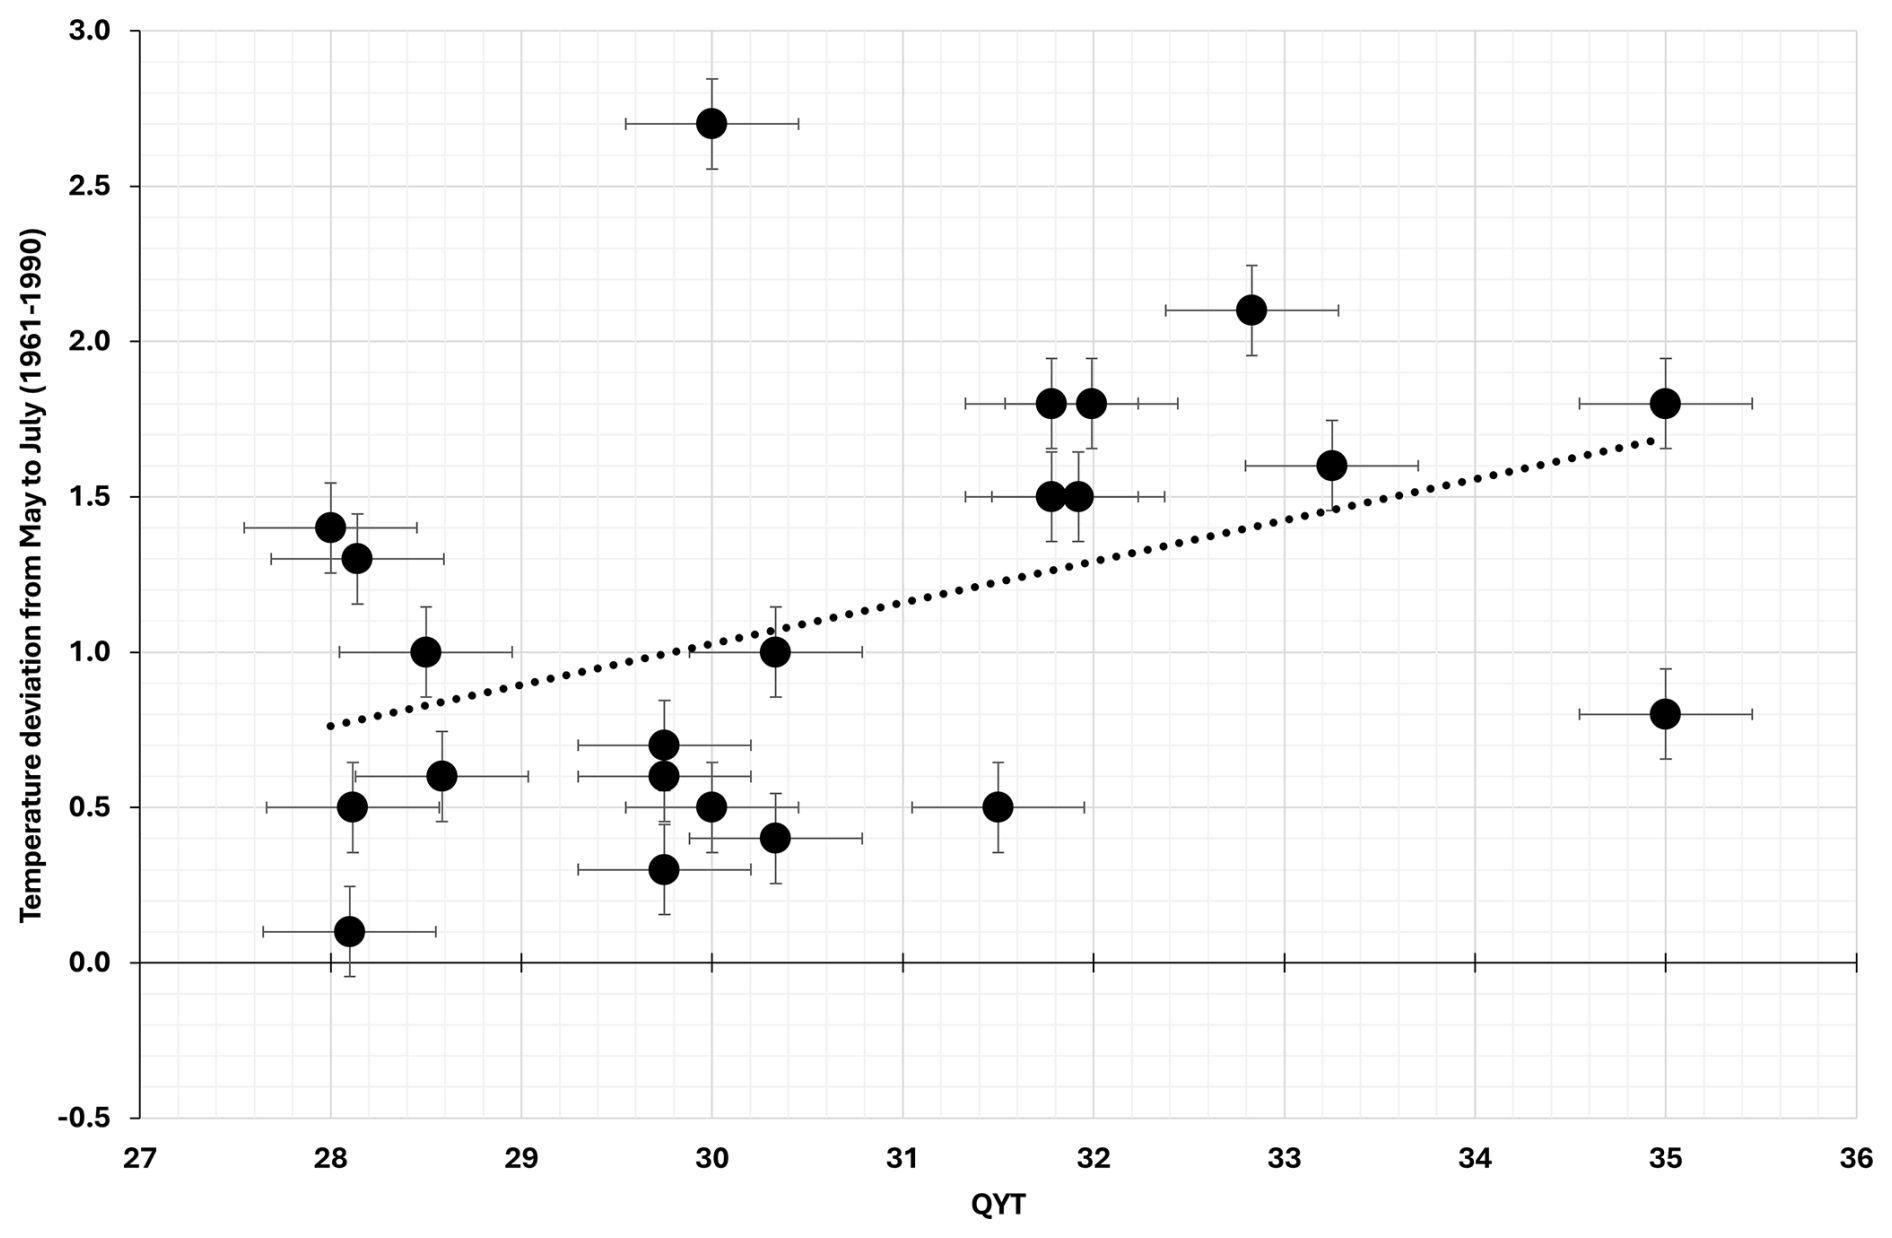
Figure 9Linear regression of YQI > 28 with May to July temperatures in Paris from 1658 to 1988.
Moreover, YQI values < 10 are significantly correlated with r = 0.28 (N = 144), but low values might also be due to severe winter or spring frosts in contrast to cold summers. Frosts in spring due to the advection of (sub)polar air can cause significant damage, particularly in years with advanced phenophases. For example, the highest economic loss of EUR 3.3 billion caused by late spring frosts (particularly to fruit and wine) occurred in Europe in 2017, with Italy, France, Germany, Poland, Spain and Switzerland being the most affected (Faust and Herbold, 2018). During the LIA, such calamities particularly affected marginal areas like Metz, Luxembourg and Heilbronn (Figs. 4 and 5). One of the worst calamities in the historical past occurred on 5 May 1517 (Gregorian calendar). In the morning, it was “hard frozen” in Metz with “deep snow”. The leaves of the vines appeared “burnt”. Based on reports from Alsace (Hertzog, 1906), this calamity affected regions from the upper Rhine Valley (Fig. 10) to the Regensburg area (Table 1, source 4). It was a large-scale event. Moreover, when winter temperatures dropped below −15 to −20 °C vine buds were destroyed during dormancy. A cold snap was particularly devastating after a mild period, drawing from the example of the well-known “millennium winter” of 1709. Warm and rainy weather with south-westerly winds prevailed until 5 January, when temperatures during the following night plummeted far below freezing (Pfister and Wanner, 2021). Daily temperatures of −15 °C were recorded over the next 2 weeks in Paris (Rousseau, 2023). The vines in Metz recovered, even after two hard frosts in late spring, but they did not bear fruit (LePage, 1854). The situation in February 1956 was similar (Pfister and Wanner, 2021), resulting in the destruction of 45 % of the vines in the Bordeaux region (Pérès, 2007).
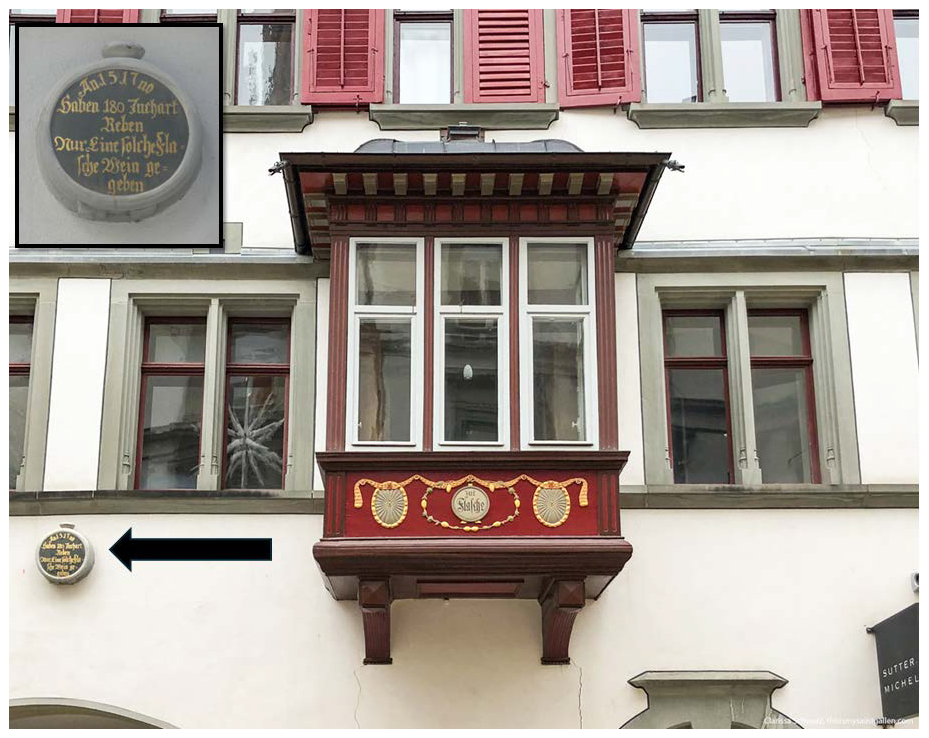
Figure 10Composite photograph of a memorial epigraph displayed at the “House of the Bottle” Spisergasse 11 in St. Gallen (Switzerland). Copyright: Hans Fässler, St. Gallen.
From this perspective, vintage ratings of “good” crops by contemporary chroniclers may have been interpreted in terms of proxy data for “warm” or “cold” summers. But before the availability of GHD, such reconstructions would need to be checked against tree-ring evidence.
Vineyards were a worthwhile investment before the establishment of savings banks in the 19th century (Bartlome, 2024). On Lake Biel, they yielded a 5 % interest during the 18th century (Pfister, 1981). Above-average grain and wine harvests provided good conditions for both tenants and the owners of vineyards. Fetching a good price, wine was in sufficient demand due to moderate grain prices. However, repeated bad grain harvests caused grain prices to rise faster than wine prices, which means tenants bought less grain on the market with their share of the harvest (Landsteiner, 2004). In case of overproduction, there were insufficient barrels to store the abundant vine and consumers to cope with the surplus of wine despite low prices.
8.1 Crop failures
Wine prices tended to be negatively correlated with yields. However, a long-term increase in the price of wine encouraged a switch to substitutes. Beer was not suitable as a substitute for a long time. In the Middle Ages, it was made with herbal mixtures, resulting in a cloudy, sweet, hard-to-store drink with a low alcohol content (Smith, 2014). By the end of the 13th century, the addition of hops in northern German cities made beer tastier, longer lasting and exportable. Thus, hop beer became the standard (Landsteiner, 2004).
Harvest failures were hotbeds of cultural history (Collet, 2019). A hard frost in spring announcing impending disaster set vine-growing communities under tremendous stress. Storm bells were rung in churches, and processions were held in supplication (Litzenburger, 2015). From the middle of the 15th century, such calamities became hotspots for witch hunts. Litzenburger (2015) cites an account by the chronicler Philippe de Vigneulles: “At 4 o'clock in the morning on May 1, 1456, the vines in Metz froze. People were totally distressed. A 16-year-old boy was arrested because he was seen in the company of witches and devils who allegedly belonged to a diabolical sect. They were said to have thrown the devil's tears into a well to cause frost.” Under pressure, the young man denounced a group of people who under torture named other `co-conspirators'. Thirteen victims ended up at the stake. This example shows that the classical model of witch-hunting developed in the 15th century in viticultural areas. According to Litzenburger (2015), each crisis led to a conflict among members of the community. By getting together against isolated victims, the community tried to regain its unity. It was up to the legal institutions to “cleanse” the social body of the threat.
The culture of remembrance (Assmann, 2009) serves to maintain risk awareness. In the historical past, this objective was achieved through reports and illustrations in chronicles, or visual monuments such as flood markers (Pfister and Wanner, 2021). Likewise, a visual monument of risk awareness situated at the wall of the “House of the Bottle” in St. Gallen reminds the spring frost disaster in 1517 (Fig. 10).
The German inscription in Fig. 10 reminds of the failed grape harvest in 1517. Its translation reads: “In 1517, 180 Juchart of vines [7.2 ha], yielded only one bottle of wine” [in the St. Gallen Rhine Valley].
8.2 Overproduction crises
After two successive plentiful harvests, prices plummeted and barrels to store the bounty became short. In 1483 and 1484, many grapes were left hanging, and wine was given away “for God's sake” (Hertzog, 1906) (Fig. 11).
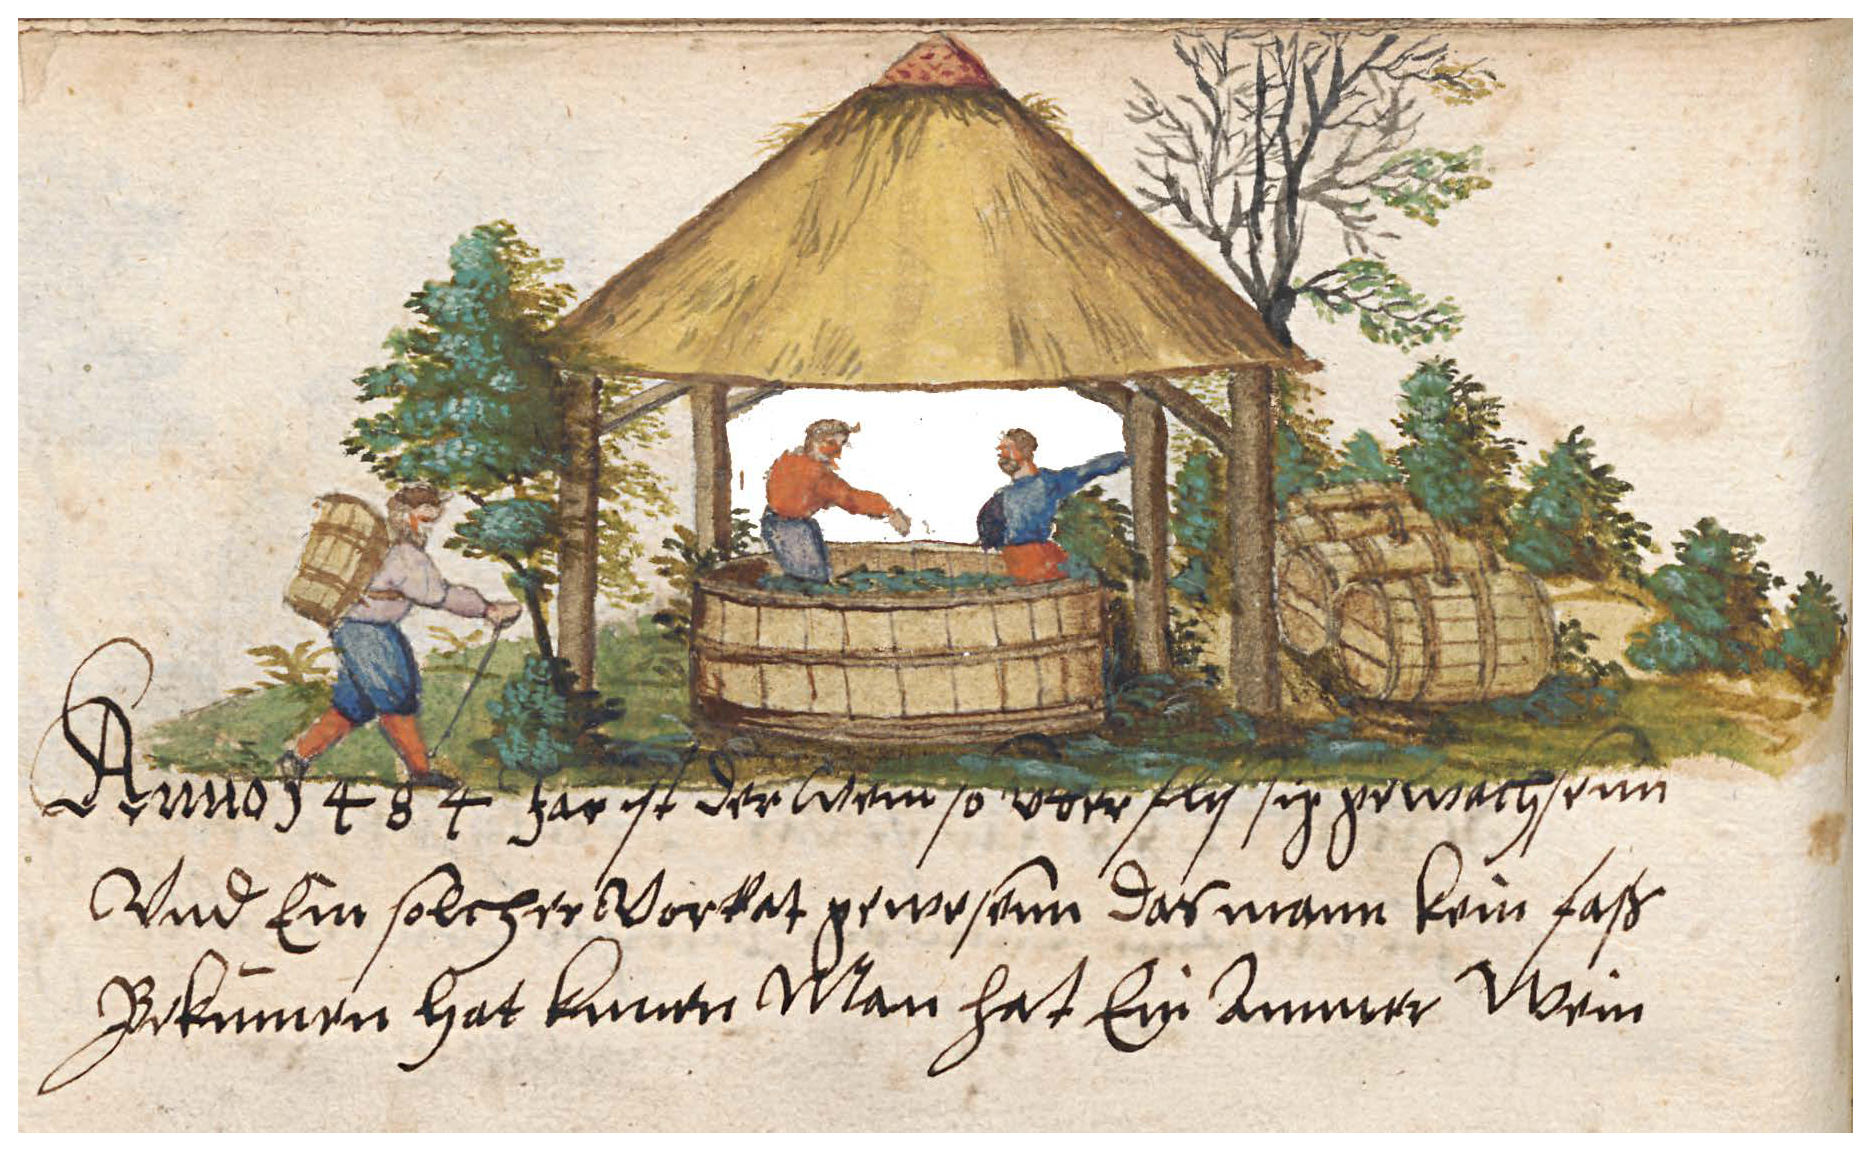
Figure 11The plentiful vine must harvest of 1484 in Nuremberg (Germany). Source: Stadtarchiv Stadt Nürnberg, Neubauersche Chronik (1601), code F 1 Nr. 42 S. 19. Copyright: Common domain.
The illustration (Fig. 11) is taken from a chronicle. It reminds a bumper crop in 1484. The man coming from the left drags freshly picked grapes along. The man in the red coat crushes the ripe grapes with his feet due to the lack of a press. The man in the blue coat points to the full barrels to the right, visualising the record harvest.
Likewise, the overabundant average quality wine obtained in 1539 was thrown into gutters in 1540 when a new, cheap, honey-sweet and highly alcoholic wine became available after the hot summer of that year. In Cologne, many people were found “lying in the streets and behind hedges like pigs”, according to the chronicler Hermann von Weinsberg (Pfister, 2017). Women in Heilbronn were forbidden from drinking wine, except during a period at the end of Lent. Husbands then had to drag their wive home in the evening (Weingärtner, 1962) During the warm summers between 1718 and 1727, the wine glut in Central Europe peaked, with seven large and above-average harvests. Chronicler Abraham Pagan disapproved of the fact that owners of vineyards in Lake Biel offered their wine for sale on the streets, even to children (Pfister, 1981). In France, the planting of new vineyards was prohibited after the abundant wine harvests of the 1720's (Lachiver, 1988). Likewise, the double bumper harvests of 1982 and 1983 in Central Europe ended up in a glut. In the Swiss Canton Valais, wine was stored in private swimming pools and railroad tankers. Many large producers went bankrupt (Laessle, 2018). Disposing of the surplus cost the Swiss taxpayers millions of France and led the Federal Government to enact quality regulations and quantity restrictions (Altwegg, 2023).
Narrative ratings of wine must quantity, along with quality information, provide a highly resolved summer temperature proxy for the period before the availability of GHD. This result was obtained from annual tax receipts on the Swiss Plateau as well as in the German city-states of Heilbronn and Metz (modern-day France) in connection with data from the Grand Duchy of Luxembourg. The evidence was merged into a summary series. Due to the substantial effects of winter and spring frosts and the legacy effects of summer temperatures, the yield data could not be directly related to temperatures in the summer half-year. Evidence regarding the size of the grape harvests was instead merged with data on quality into a a yield-quality index YQI. This index reflects the practice of vintage ratings in the historical past, which prioritised quantity somewhat more than quality. The YQI is 70 % correlated with the monthly temperatures between May and August, with a focus on May to July. In contrast, low YQIs are correlated with low May to July temperatures, but this result may also include the effects of summer temperature legacy effects and winter and spring frosts. In a follow-up study a reconstruction of summer temperatures based on narrative sources will be attempted for the period prior to the early fifteenth century. The YQI will have to pass the acid test in comparison to high resolution evidence from the archives of nature.
The basic data of this study are available at https://doi.org/10.48620/91251 (Pfister, 2026).
The daily instrumental temperature data for Paris are available on line as an Annex to Rousseau (2023) at https://doi.org/10.37053/lameteorologie-2024-0083.
CP was responsible for conceptualisation, data curation, formal analysis, investigation, methodology, resources, validation and writing, and original draft preparation, as well as for review and editing. SB was responsible for climatical analysis, modelling, validation, visualisation, writing, and review. LL took care of the graphics, supplied data and reviewed the draft. PT was responsible for the homogenization and statistical analysis. AA provided a critical review of the oenological arguments. RB provided supplementary data, critical review of the draft and technical assistance. AK provided supplementary data. EL provided supplementary data and a critical review. FCL and TP provided a critical review of the draft.
The contact author has declared that none of the authors has any competing interests.
Publisher's note: Copernicus Publications remains neutral with regard to jurisdictional claims made in the text, published maps, institutional affiliations, or any other geographical representation in this paper. The authors bear the ultimate responsibility for providing appropriate place names. Views expressed in the text are those of the authors and do not necessarily reflect the views of the publisher.
Dr. Hans Fässler St. Gallen took special photographs for this paper and provided the permission.
Stadtarchiv Nürnberg (Germany), http://www.stadtarchiv.nuernberg.de (last access: 9 May 2024) provided information on permissions.
Dr. Saskia David-Gaubatz and Sabine Graham, Stadtarchiv, Heilbronn (Germany) https://stadtarchiv.heilbronn.de (last access: 17 April 2024) assisted in the search for archival material.
Dr. Heidi Lüdi Pfister, Curator of the Viticultural Museum Ligerz (Canton Bern), took special photographs for this paper and provided the permission.
This work was supported by the Swiss National Science Foundation (grant no. 219746). Fredrik Charpentier Ljungqvist was supported by the Marianne and Marcus Wallenberg Foundation (grant no. MMW 2022-0114) and the Swedish Research Council (Vetenskapsrådet, grant no. 2023-00605).
This paper was edited by Linden Ashcroft and reviewed by Carla Mateus and Olivier Planchon.
Alber, W. and Vogt, A.: Württemberger Weingeschichten, Klöpfer & Meyer, Tübingen, ISBN 978-3863514181, 2016.
Als, G.: Histoire quantitative du Luxembourg. Service central de la statistique et des études économiques, Luxembourg, https://search.worldcat.org/de/title/Histoire-quantitative (last access: 13 September 2024), 1991
Altwegg, A.: Vom Weinbau am Zürichsee, Th. Gut & Co, Stäfa, 1980.
Altwegg, A.: Weinlandschaft Zürichsee – Geschichte und Gesichter, Th. Gut Verlag, Zürich, ISBN, 978-3-85717-233-5, 216 pp., 2018.
Altwegg, A.: Der Falsche Mehltau – die Geissel des Weinbaus, Schweizer Zeitschrift für Obst- und Weinbau (SZOW), 1, 17–20, https://obstundwein.ch/der-falsche-mehltau-die-geissel-des-weinbaus/ (last access: 5 January 2026), 2023.
Altwegg, A. and Pfister C.: Der Schweizer Weinbau in Bedrängnis, Schweiz, Zeitschrift für Obst- und Weinbau, 10/11 2025, 52, https://obstundwein.ch/der-schweizer-weinbau-in-bedraengnis (last access: 12 July 2025), 2025.
Angot, A.: Études sur les vendanges en France, Annales du Bureau Central Météorologique de France, Paris, année 1883, B29–B120, 1885.
Anonymous: Luxemburger Weinchronik 809–1904, 25e Anniversaire de la Fédération Viticole du Grand-Duché de Luxembourg, Imprimerie Saint-Paul, Luxembourg, 122–128, 1937.
Assmann, A.: Erinnerungsräume: Formen und Wandlungen des kulturellen Gedächtnisses, C.H.Beck, ISBN: 9783406509612, 2009.
Bartlome, N.: Wettstreit um den Weinbau, Spätmittelalterlicher Reben- und Weinzinsbesitz am Nordufer des Bielersees, Berner Zeitschriftfür Geschichte, Band 86, Heft 4, 3–44, https://www.e-periodica.ch/digbib/vollist?UID=zgh-002 (last access: 27 May 2025), 2024.
Bassermann-Jordan, F.: Geschichte des Weinbaus, Keller, Frankfurt/M., 1907.
Brázdil, R., Zahradníček, P., Dobrovolný, P., Kotyza, O., and Valášek, H.: Historical and recent viticulture as a source of climatological knowledge in the Czech Republic, Geografie, 113, 351–371, https://doi.org/10.37040/geografie2008113040351, 2008.
Brázdil, R., Možný, M., Klír, T., Řezníčková, L., Trnka. M., Dobrovolný P., and Kotyza, O.: Climate variability and changes in the agricultural cycle in the Czech Lands from the sixteenth century to the present, Theor. Appl. Climatol., 136, 553–573, https://doi.org/10.1007/s00704-018-2508-3, 2019.
Büntgen, U., Frank, D., and Nievergelt, C.: Summer temperature variations in the European Alps, A.D. 755–2004, J. Climate, 19, 5606–5623, https://doi.org/10.1175/JCLI3917.1, 2006.
Camenisch, C., Keller, K. M., Salvisberg, M., Amann, B., Bauch, M., Blumer, S., Brázdil, R., Brönnimann, S., Büntgen, U., Campbell, B. M. S., Fernández-Donado, L., Fleitmann, D., Glaser, R., González-Rouco, F., Grosjean, M., Hoffmann, R. C., Huhtamaa, H., Joos, F., Kiss, A., Kotyza, O., Lehner, F., Luterbacher, J., Maughan, N., Neukom, R., Novy, T., Pribyl, K., Raible, C. C., Riemann, D., Schuh, M., Slavin, P., Werner, J. P., and Wetter, O.: The 1430s: a cold period of extraordinary internal climate variability during the early Spörer Minimum with social and economic impacts in north-western and central Europe, Clim. Past, 12, 2107–2126, https://doi.org/10.5194/cp-12-2107-2016, 2016.
Collet, D.: Die doppelte Katastrophe: Klima und Kultur in der europäischen Hungerkrise 1770–1772, Vandenhoeck & Ruprecht, ISBN 9783525355923, 2019.
Connover, W. J.: Practical Nonparametric Statistics (New York: John Wiley & Sons, 1999), ISBN 9780471160687, 1999.
Dobrovolný, P., Moberg, A., Brázdil, R., Pfister, C., Glaser, R., Wilson, R., van Engelen, A., Limanówka, D., Kiss, A., Halíčková, M., Macková, J., Riemann, D., Luterbacher, J., and Böhm, R.: Monthly, seasonal and annual temperature reconstructions for central Europe derived from documentary evidence and instrumental records since AD 1500, Clim. Change., 101, 69–107, https://doi.org/10.1007/s10584-009-9724-x, 2010.
Draper, N. R. and Smith, H.: Applied Regression Analysis, 3rd edn., Wiley, New York, 742 pp., https://onlinelibrary.wiley.com/doi/book/10.1002/9781118625590 (last access: 21 September 2024), 1998.
Dubler, A. M.: Feudallasten [feudal charges], in: Historisches Lexikon der Schweiz (HLS), https://hls-dhs-dss.ch/de/articles/008980/2015-03-05 (last access: 5 January 2026), 2015.
Dufour, M. L.: Notes sur le problème de la variation de climat, Bulletin de la Société Vaudoise des Sciences Naturelles, 10, 359–556, https://books.google.ch/books?id=yLtDAAAAcAAJ&pg=PA357&hl=de&source=gbs_toc_r&cad=3#v=onepage&q&f=false (last access: 5 January 2026), 1870.
Dürr, F.: Heilbronner Chronik, Carl Rembold, Heilbronn, 1926.
Faust, E. and Herbold, J.: Spring frost losses and climate change – not a contradiction in terms, Munich RE, Munich, 2018.
Fontaine, M. C., Labbé, F., Dussert, Y., Dussert, J., Delière, L., Richart-Cervera, S., Giraud, T., and Delmotte, F.: Europe as a bridgehead in the worldwide invasion history of grapevine downy mildew, Plasmopara viticola, Curr. Biol., 31, 2155–2166, https://doi.org/10.1016/j.cub.2021.03.009, 2021.
Hertzog, A.: Die Weinjahre von Elsass-Lothringen [...] die Weinjahre des lothringischen Moseltales [in der Vergangenheit], Bulletin de la Société Naturelle de Colmar, N.S. VIII, Colmar, Decker, 1–86, 1906.
Heuss, T.: Weinbau und Weingärtnerstand in Heilbronn am Neckar, Reprint of the 1950 edition, Heilbronn, 129 pp., ISBN 9783928990912, 2009.
Holzkämper, A., Fuhrer, J., and Frei, C.: Temperaturtrends und Rebbau in der Schweiz, Schweizer Zeitschrift für Obst- und Weinbau (SZOW), 149, 6–9, 2013.
Jones, G. V. and Davis, R. E.: Using a synoptic climatological approach to understand climate–viticulture relationships, Int. J. Climatol., 20, 813–837, https://doi.org/10.1002/1097-0088(20000630)20:8<813::AID-JOC495>3.0.CO;2-W, 2000.
Kiss, A., Wilson, R., and Bariska, I.: An experimental 392-year documentary-based multi-proxy (vine and grain) reconstruction of May–July temperatures for Kőszeg, West-Hungary, Int. J. Biometeorol., 55, 595–611, https://doi.org/10.1007/s00484-010-0367-4, 2011.
Klipffel, H.: Metz, cité épiscopale et impériale, Hayez, 1867.
Krack, P.: Der Weinbaubetrieb des Wiener Bürgerspitals (1523–1618), MA thesis, Universität Wien, 2019.
Labbé, T., Pfister, C., Brönnimann, S., Rousseau, D., Franke, J., and Bois, B.: The longest homogeneous series of grape harvest dates, Beaune 1354–2018, and its significance for the understanding of past and present climate, Clim. Past, 15, 1485–1501, https://doi.org/10.5194/cp-15-1485-2019, 2019.
Laessle, M. N.: Le goût du vin, Alphil, Neuchâtel, ISBN 978-2-88930-192-8, 572 pp., 2018.
Lachiver, M.: Vins, vignes et vignerons. Histoire du vignoble francais, Fayard, Paris, ISBN 9782213612553, 715 pp., 1988.
Landsteiner, E.: The crisis of wine production in late sixteenth century Central Europe: Climatic causes and economic consequences, Clim. Change, 43, 323–334, https://doi.org/10.1023/A:1005590115970, 1999.
Landsteiner, E.: Weinbau und Alkoholproduktion im südöstlichen Mitteleuropa, Eine langfristige Perspektive (16.–19. Jahrhundert), Österreich in Geschichte und Literatur, 48/5, 266–284, 2004.
Lauer, W. and Frankenberg, P.: Zur Rekonstruktion des Klimas im Bereich der Rheinpfalz seit Mitte des 16. Jahrhunderts mit Hilfe von Zeitreihen der Weinquantität und Weinqualität, Gustav Fischer, Stuttgart, 54 pp., ISBN 3437305344, 1986.
LePage, H.: Annuaire Statistique, Historique [...] de la Meurthe, Grimbolt et Veuve Raybois, Nancy, 1854.
Ljungqvist, F. C., Christiansen, B., Schneider, L., and Thejll, P.: Strong volcanic-induced climatic shocks on historical Moselle wine production, Clim. Past, 21, 327–342, https://doi.org/10.5194/cp-21-327-2025, 2025.
Lorusso, D.: Il clima del Vino. Metodi di Riconstruzione e impatti economici delle fluttuazioni climatiche nelle regioni vitivinicole (Secoli XVII–XX), PhD thesis, Università di Milano, https://air.unimi.it/retrieve/dfa8b991-0f57-748b-e053-3a05fe0a3a96/phd_unimi_R09333.pdf (last access: 5 January 2026), 2013.
Le Roy Ladurie, E.: Times of feast, times of famine: a history of climate since the year 1000, Allen & Unwin, London, ISBN 978-0374521226, 1971.
Litzenburger, L.: Une ville face au climat, Metz à la fin du Moyen Âge, 1400–1530, Presses Universitaires de Nancy, Nancy, https://doi.org/10.4000/13obk, 2015.
Liu, Y., Zhang, Y., and Peñuelas J.: Drought legacies delay spring green-up in northern ecosystems, Nat. Clim. Change, 15, 444–451, https://doi.org/10.1038/s41558-025-02273-6, 2025.
Loose, R.: Gustav Schübler (1787–1834): Professor für Naturgeschichte und Botanik in Tübingen, Franz Steiner, Stuttgart, ISBN 978-3-515-13254-1, 2022.
Massard, J. A.: Vor hundert Jahren: Die Reblaus ist da!, Lëtzebuerger Journal, 143, 19–21, https://download.data.public.lu/resources/history-of-the-luxemburger-vineyardregion/20230119-163456/die-reblaus-massard.pdf (last access: 27 February 2025), 2007.
Matheus, M.: Römischer Weinkelterfund an Nahe/Glan, Neue Perspektiven zu den Anfängen der deutschen Weinbaugeschichte, Gesellschaft für die Geschichte des Weines, https://www.geschichte-des-weines.de/schriften-buecher/neu-schriften-digital.html (last access: 11 February 2026), 2025.
Metz Archives: CC 1 (1408–1413) to CC 409, 1789.
Mitchell, B. R.: International Historical Statistics, Europe 1750–1988, 3rd edn., Stockton Press, New York, ISBN 978-1349127931, 1992.
Molitor, D., Udelhoven, T., Ney, S., Hoffmann, I., and Pfister, L.: Historical vintage descriptions from Luxembourg – an indicator for the climatic conditions in the past?, Vitis, 55, 23–30, https://doi.org/10.5073/vitis.2016.55.23-30, 2016.
Müller, K.: Geschichte des Badischen Weinbaus, Lahr, Schauenburg, 1953.
Neumann, N. and Matzarakis, A.: Viticulture in southwest Germany under climate change conditions, Clim. Res., 47, 161–169, https://doi.org/10.3354/CR01000, 2011.
Niedermayr, M.: Der Weinbaubetrieb des Wiener Bürgerspitals im 17. Jahrhundert, MA thesis, Universität Wien, https://doi.org/10.25365/thesis.60945, 2020.
Ollat, N., Yobregat, O., Lacombe, T., and Rienth, M.: Grafting, the most sustainable way to control phylloxera over 150 years, IVES Technical Reviews vine and wine, https://doi.org/10.58233/RgZguHaB, 2025.
Pérès, S.: La vigne et la ville: forme urbaine et usage des sols, Economies et finances, Université Montesquieu Bordeaux IV, PhD thesis, https://theses.hal.science/tel-00448670/file/THESE.pdf (last access: 26 April 2024), 2007.
Pfaff, K.: Württembergische Wein-Chronik: ein Bericht über die Quantität und Qualität des Weins und die darauf einwirkenden Witterungsverhältnisse der einzelnen Jahrgänge, von den ältesten Zeiten bis aufs Jahr 1865, Konrad Meychardt, Esslingen, 1865.
Pfister, C.: Die Fluktuationen der Weinmosterträge im schweizerischen Weinland vom 16. bis ins frühe 19. Jahrhundert: klimatische Ursachen und sozioökonomische Bedeutung, Schweiz. Z. Gesch., 31, 445–491, 1981.
Pfister, C.: Das Klima der Schweiz von 1525 bis 1860 und seine Bedeutung in der Geschichte von Bevölkerung und Landwirtschaft, Haupt, Bern, ISBN 978-3258033198, 1984.
Pfister, C.: When Europe was burning, The multi-season mega-drought of 1540 and Arsonist Paranoia, in: Historical disaster experiences: Towards a Comparative and Transcultural History of Disasters Across Asia and Europe, edited by: Schenk, G. J., Springer Publishing, Cham, 155–185, https://doi.org/10.1007/978-3-319-49163-9_8, 2017.
Pfister, C.: Wine must quantity Europe 1416 to 1988, University of Bern, BORIS Portal [data set], https://doi.org/10.48620/91251, 2026.
Pfister, C. and Wanner, H.: Climate and society in Europe, The last thousand years, Haupt, Bern, ISBN 978-3-258-08234-9, 2021.
Pfister, C., Brönnimann, S., Altwegg, A., Brázdil, R., Litzenburger, L., Lorusso, D., and Pliemon, T.: 600 years of wine must quality and April to August temperatures in western Europe 1420–2019, Clim. Past, 20, 1387–1399, https://doi.org/10.5194/cp-20-1387-2024, 2024.
Rima, A.: Considerazioni su una serie agraria biseculare: la produzione di vino nel Rheingau (1791–1950), Geofis. Meteorol., 12, 1–11, 1963.
Ritzmann-Blickenstorfer, H.: Historische Statistik der Schweiz, Chronos, Zürich, 1221 pp., ISBN 978-3-905311-30-3, 1996.
Rousseau, D.: Fluctuations des dates de vendanges bourguignonnes et fluctuations des températures d'avril à septembre de 1378 à 2010, XXVIIe Colloque de l'Association Internationale de Climatologie, 2014 – Dijon (France), 757–763, 2015.
Rousseau, D.: La série des températures journalières à Paris de 1658 à 2023, La Météorologie, 127, 33–42, https://doi.org/10.37053/lameteorologie-2024-0083, 2023.
Schübler, G.: Nachrichten über die Verhältnisse des Weinbaues in Würtemberg [sic!] vom Jahr 1236–1830 [...], Cottasche Buchhandlung, Stuttgart, https://books.google.it/books?id=S2E7AAAAcAAJ&ots=M6aYiW3HBj&lr&hl=it&pg=PA1#v=onepage&q&f=false (last access: 9 May 2024), 1831.
Sigl, M., Winstrup, M., McConnell, J. R., Welten, K. C., Plunkett, G., Ludlow, F., and Büntgen, U.: Timing and climate forcing of volcanic eruptions for the past 2,500 years, Nature, 523, 543–549, https://doi.org/10.1038/nature14565, 2015.
Smith, G. D.: Beer: a global history, Reaktion Books, ISBN: 1780232608, 2014.
Staab, J., Seeliger, H. R., and Schleicher, W.: Schloss Johannisberg – Neun Jahrhunderte Weinkultur am Rhein, Gütersloh, Woschek, 144 pp., ISBN 3-924744-35-1, 2001.
Toma, F.: Wasser, Europäische Geschichte Online (EGO), https://ieg-ego.eu/de/threads/hintergruende/natur-und-umwelt/franziska-torma-wasser (last access: 5 January 2026), 2017.
Trachsel, S.: Climate, wine and crisis. Assessment of Grape Harvest Fluctuations in Swiss Viticulture in the 19th Century and Alpine Summer Temperature Reconstruction back to 1529, MA thesis, unpublished, University of Bern, https://infoclio.ch/sites/default/files/licdiss/l-trachsel-ma-climatewine-09_0.pdf (last access: 12 June 2025), 2009.
Trapp, J. L., Wagner, P. E., and Chastillon, C.: Représenter Metz au XVIIe siècle. Le travail de Claude Chastillon. Partie 1: une ville empreinte de son passé antique, Les cahiers lorrains : organe des sociétés littéraires et scientifiques de Metz et de la Moselle, 1, 70–79, https://hal.univ-lorraine.fr/hal-03288755v1/document (last access: 27 August 2024), 2021.
Valler, V., Franke, J., Brugnara, Y., Samakinwa, E., Hand, R., Lundstad, E., Burgdorf, A. M., Lipfert, L., Friedman, A. R., and Brönnimann, S.: ModE-RA – a global monthly paleo-reanalysis of the modern era (1421–2008), Sci. Data, 11, 36, https://doi.org/10.1038/s41597-023-02733-8, 2024.
Volk, O.: Weinbau und Weinabsatz im späten Mittelalter, Forschungsstand und Forschungsprobleme, https://www.regionalgeschichte.net/bibliothek/aufsaetze/volk- weinbau-weinabsatz-spaetmittelalter.htm (last access: 15 January 2026), 2009.
Weber, A. O.: Klösterlicher Weinbau im mittelalterlichen Herzogtum Bayern, in: Schriften zur Weingeschichte, Nr. 205, Gesellschaft für Geschichte des Weines, Wiesbaden, https://www.geschichte-des-weines.de/schriften-buecher/neu-schriften-digital.html (last access: 11 February 2026), 2023.
Weingärtner, K. H.: Studien zur Geschichtsschreibung der Reichsstadt Heilbronn a.N., Stadtarchiv Heilbronn, 1962.
Yante, J. M.: Grains et vins des terroirs mosellans de Remich et Grevenmacher (Xve–XVIIIe siècles), Revue belge de Philologie et d'Histoire, 63, 273–309, https://www.persee.fr/doc/rbph_0035-0818_1985_num_63_2_3504 (last access: 30 August 2024), 1985.
- Abstract
- Introduction
- State of current research
- Sources
- The formation of the supra-regional yield series
- Statistical methods
- The formation of the yield quality index
- The climatic model
- Socio-economic and cultural-historical aspects
- Conclusion
- Data availability
- Author contributions
- Competing interests
- Disclaimer
- Acknowledgements
- Financial support
- Review statement
- References