
the Creative Commons Attribution 4.0 License.
the Creative Commons Attribution 4.0 License.
 | 04 Aug 2026
Multidecadal behavior of the North Atlantic Oscillation during the last millennium
Bronwen L. Konecky
Sloan Coats
The North Atlantic Oscillation (NAO) is a major source of atmospheric variability in the Northern Hemisphere, affecting temperature, precipitation, and storm tracks across North America and Eurasia. Understanding NAO variability on multidecadal to centennial timescales requires paleo-reconstructions, but previously published reconstructions disagree on the magnitude of low-frequency NAO variability over the last millennium. Paleoclimate proxies for the oxygen and hydrogen isotope composition of meteoric waters have thus far been under-utilized in published NAO reconstructions. Here, we investigate multidecadal variability in the reconstructed NAO over the last millennium using 94 high-resolution NAO-sensitive records from the Iso2k database, a collection of globally distributed water isotope-based paleoclimate proxies. We find significant multidecadal to centennial scale variability, which we also highlight in other independent reconstructions of the NAO. Critically, however, the strength of the low-frequency signal has not been consistent throughout the last millennium. Isotope-enabled model simulations did not reproduce the low-frequency signal in the NAO reconstructions and thus it may be necessary to account for low-frequency variability when projecting the impacts of the NAO on temperature and precipitation under future climate scenarios.
- Article
(7643 KB) - Full-text XML
-
Supplement
(1849 KB) - BibTeX
- EndNote


Weather and climate in Europe, Greenland, and eastern North America are heavily influenced by the North Atlantic Oscillation (NAO), which is associated with the dominant pattern of sea level pressure variability in the North Atlantic. The NAO is responsible for variability and extremes in both temperature and hydroclimate across the region (Casanueva et al., 2014; Hurrell, 1995; Hurrell and Deser, 2009; Trigo et al., 2002; Villarini et al., 2011; Zanardo et al., 2019), so better understanding the NAO and its connections to temperature and precipitation is critical for contextualizing past and future climate changes.
The NAO index is typically defined as the difference between the normalized winter sea-level pressures in Stykkishólmur, Iceland, and Gibraltar (Jones et al., 1997; Vinther et al., 2003a). The index is a proxy for coherent large-scale patterns of atmospheric circulation. For instance, during positive NAO conditions the North Atlantic Jet is deflected northwards, driving warm and wet winters over northern Europe and eastern North America contrasted by cool and dry winters in the Mediterranean. The opposite patterns are observed during negative NAO conditions (Hurrell, 1995; Hurrell and Deser, 2009; Woollings et al., 2010, 2018; Woollings and Blackburn, 2012).
Europe is home to some of the longest continuous instrumental records of sea level pressure, extending back through 1823 CE (Jones et al., 1997; Vinther et al., 2003a). However, even these long records provide only a limited perspective on the low frequency (multidecadal to centennial timescale) variability of the NAO, timescales that are critical for contextualizing and understanding its response to anthropogenic emissions (Cook et al., 2019; Woollings et al., 2015). Additionally, the instrumental records underlying indices for the NAO are focused on Europe and the eastern North Atlantic, and thus are more limited in capturing NAO impacts further up- (e.g., North America and Greenland) and down-stream (e.g., Eurasia) (e.g. Felis et al., 2000; Liu et al., 2018; Xiaoge et al., 2010). Instrumental data for the NAO outside of the North Atlantic region is especially limited in duration and coverage, so paleoclimate proxy-based reconstructions are a valuable tool for characterizing the NAO and its impacts on timescales that extend beyond the instrumental record, and outside the regions with long instrumental records of sea level pressure.
Substantial disagreements still exist between published reconstructions of the NAO, especially on the nature of multidecadal to centennial scale variability during the last millennium (Cook et al., 2019; Schmutz et al., 2000). Geologic archives such as tree-ring width chronologies, speleothems, glacier ice, and lake sediments have been employed to investigate paleo-signals of the NAO (Baldini et al., 2008; Brittingham et al., 2019; Cook et al., 2002; Hernández et al., 2020; Kozachek et al., 2017; Kuhnert et al., 2005; Lehner et al., 2012; Michel et al., 2020; Ortega et al., 2015; Sánchez-López et al., 2016; Sorrel et al., 2007; Trouet et al., 2009; Vinther et al., 2003b). However, these published reconstructions suggest a wide range of NAO variability across timescales from higher relative variance at low frequencies (e.g., Ortega et al., 2015) to nearly equal variance at all frequencies (e.g., Cook et al., 2019). Properly constraining low-frequency variability in the NAO is critical not only for future projections, but also for establishing the mechanisms and drivers of the NAO across timescales.
Understanding discrepancies in the published reconstructions is complicated by the different proxy types used as predictors, which may bring their own inherent spectral biases. Ice cores, tree rings, and speleothems, for instance, have each been shown to exhibit unique spectral biases (Dee et al., 2017; Franke et al., 2013). Drought-sensitive tree-rings, which have been used extensively in reconstructions of the NAO, can exhibit substantial autocorrelation (Alley, 1984; Ault et al., 2013). Only a small fraction of the proxy records included in published NAO reconstructions are based on the stable oxygen or hydrogen isotopic compositions of environmental waters like precipitation, seawater, lake water, or soil and groundwater (hereafter called water isotopes). Water isotopes provide information about the NAO on broader spatial and temporal scales than other proxies because they integrate information on basin-wide to hemispheric scales that is otherwise overprinted by regional or site-specific noise (Moerman et al., 2013). Water isotope-based proxies therefore offer a valuable new perspective on the NAO during the last millennium.
Water isotopes have long been used as integrative tracers of the modern water cycle because they are modified by fractionation processes in which the rare heavy isotopologues of water (e.g., 1HO, 1H2H16O) fractionate from their lighter, more common counterpart (1HO) during evaporation, condensation, and other phase changes (Bowen et al., 2019; Dansgaard, 1964; Galewsky et al., 2016; Rozanski et al., 1993). The ratios of the heavy to light isotopes, relative to Standard Mean Ocean Water, are represented by δ18O for oxygen and δD for hydrogen. We focus on δ18O because the records in our analysis are predominantly based on oxygen isotope measurements. These water isotope ratios can be used to track phase changes as the water moves through and among oceans, the atmosphere, and land (e.g., Bowen et al., 2019; Galewsky et al., 2016; Rozanski et al., 1993). Water isotopes are more closely correlated with major modes of variability than precipitation amount, for example, because the majority of diurnal to interannual rainfall δ18O (δ18Oprecip) variability originates from regional scale hydrological processes like convective intensity, moisture transport history, and moisture source changes (Moerman et al., 2013). Isotope values at a particular location are often linked to teleconnections far afield from the measurement site, highlighting the value of water isotope proxy records for evaluating regional to continental scale phenomena (Puntsag et al., 2016; Vachon et al., 2010; Vuille and Werner, 2005). Therefore, water isotope observations and proxy data may provide useful information about the NAO, even outside the immediate centers of action in the North Atlantic.
Within Europe, previous studies demonstrate that the NAO is responsible for changes in δ18Oprecip by comparing the NAO index with instrumental δ18Oprecip measurements (Baldini et al., 2008; Comas-Bru et al., 2016; Deininger et al., 2016; Langebroek et al., 2011). For example, the continental effect, or the “distance from the coast” effect, is the gradient in amount-weighted δ18Oprecip across the continent, where δ18Oprecip becomes more negative further inland (Dansgaard, 1964). The slope of this continental effect depends on the winter NAO as a function of atmospheric temperature and precipitation (Comas-Bru et al., 2016; Deininger et al., 2016; Hurrell, 1995). Specifically, steeper air temperature gradients across the continent, in combination with decreased atmospheric water content in the continental interior relative to the coasts, drive steeper observed δ18O west-east gradients across northern Europe during negative winter NAO phases (Deininger et al., 2016; Trigo et al., 2002).
Changes in the moisture source or transport pathway may also influence δ18Oprecip by altering patterns of rainout. In Greenland, for example, past studies apply moisture source and transport models to diagnose the effects that changes in atmospheric circulation and moisture source locations have on δ18Oprecip during different phases of the NAO (Sodemann et al., 2008). Simulated water isotope ratios of Greenland precipitation have higher (lower) δ18O values during a positive (negative) NAO, as moisture is primarily drawn from the seas north of Iceland (the southwestern North Atlantic). Ice core tops collected from the central region of the ice sheet support these results, although the moisture source and transport models suggest spatial heterogeneity that may not be captured by the relatively limited distribution of ice cores (Sodemann et al., 2008). These initial studies demonstrate mechanistic links between the NAO and water isotopes. Since then, ice-core water isotope records from Greenland have been incorporated into a range of NAO reconstructions and dynamical interpretations (e.g., Sjolte et al., 2018, 2020). However, important uncertainties remain regarding the spatial heterogeneity and stationarity of NAO–δ18O relationships. Further work is needed to better quantify and reconcile NAO–isotope relationships across sites and proxy archives.
Here we investigate multidecadal variability in the reconstructed NAO over the last millennium (1000–2000 CE) using δ18O and δD proxies from the PAGES Iso2k database, a global compilation of water isotope-based records spanning the Common Era (Konecky et al., 2020). The global coverage of this database allows us to identify water isotope relationships with the NAO in its centers of action (Greenland and western Europe) and further afield (e.g., the Himalayas and Tibetan Plateau). We evaluate the reconstruction with the instrumental NAO index (Vinther et al., 2003a), observed δ18Oprecip in the Global Network of Isotopes in Precipitation database (GNIP; IAEA/WMO, 2023), and climate model output from the isotope-enabled Community Earth System Model Last Millennium Ensemble (iCESM iLME; Brady et al., 2019). In particular, the isotope-enabled simulations allow us to infer how NAO-induced changes in temperature, precipitation, and moisture transport pathways translate to δ18Oprecip, and therefore how GNIP stations and water isotope proxies in the Iso2k database record the NAO.
2.1 Datasets
We used the following four datasets: the Vinther et al. (2003a) instrumental NAO index (NAOVinther), the PAGES Iso2k database (Konecky et al., 2020), the GNIP database containing modern isotope measurements in rainfall (IAEA/WMO, 2023), and the iCESM iLME (Brady et al., 2019).
The Iso2k database is a collection of previously published proxy δ18O and δD records including ice cores, speleothems, and wood cellulose, that span the Common Era (0–2000 CE). Although the database contains proxies for oceanic conditions, we used only terrestrial Northern Hemisphere records as the NAO is predominantly an atmospheric mode of variability. This approach allowed the most direct comparison with modeled atmospheric variables associated with the NAO. Furthermore, we included only records that had at least annual resolution and 33 % data coverage in the calibration interval between 1823 and 2000 CE. We used the 33 % data coverage threshold based on extensive experiments using different time intervals and data coverage thresholds in attempts to balance the inclusion of records in the analysis while minimizing the influence of missing data. Increasing the data coverage requirement above 33 % dramatically cut the number of included records and limited the spatial coverage of the analysis, while lower thresholds permitted inclusion of records with large sections of missing data. Adjusting the bounds of the time interval also changed the records included in the analysis. Specifically, few Iso2k records have data extending into years more recent than 2000 CE (Konecky et al., 2020), and the NAOVinther index is less constrained by observational data before 1823 CE.
The GNIP database contains measurements of both δ18O and δD in precipitation. We only used δ18O for our analyses as δD data from stations was less commonly available or discontinuous. Additionally, we only used sites with at least 10 winters of data (not necessarily consecutive), based on the general statistical principle that no fewer than 10 data points should be used to establish a linear relationship (Pearson, 1901). We converted any sub-monthly data to monthly means following Putman and Bowen (2019), and averaged the monthly δ18O boreal winter (December–January–February – DJF) seasonal means after amount-weighting using the precipitation amount data from each site.
We used three fully forced (i.e., with all transient external forcings) iCESM iLME simulations, each spanning 850–2005 CE, to evaluate the spatial relationships across timescales of δ18Oprecip, temperature, and precipitation with the NAO. The iLME used a ∼2° atmosphere and land and ∼1° ocean and sea ice version of the respective model components. We analyzed monthly mean values for sea level pressure, surface air temperature, total precipitation, wind vectors, specific humidity, and δ18Oprecip. We calculated vertically integrated water vapor transport (IVT) by weighting the monthly mean wind vectors by monthly specific humidity and summing over the full atmospheric column. We defined the winter (DJF) NAO index in the iLME as the difference between the averaged sea level pressure in grid cells containing Reykjavik, Iceland (65° N, 22° W) and Ponta Delgada, Spain (38° N, 25° W). We then regressed this index (NAOiLME) against DJF sea level pressure, surface air temperature, total precipitation, and δ18Oprecip in the iLME to produce spatial correlation maps of these variables with the NAO. We defined years with positive and negative NAO events as those with winter NAOiLME index values greater and less than one standard deviation from the mean, respectively.
Finally, we used two published NAO reconstructions for comparison with the Iso2k reconstruction. The first was the calibration-constrained NAO reconstruction from Ortega et al. (2015), based on a network of annually resolved proxy records including ice cores, tree rings, and speleothems. The second was the NAO reconstruction ensemble median from Cook et al. (2019), derived from a tree-ring network. Both reconstructions spanned the last millennium and provided independent estimates of past NAO variability against which the Iso2k reconstruction was evaluated.
2.2 NAO signals in Iso2k
We first annualized the Iso2k records by averaging any sub-annual data into a standard January–December year. We standardized each record to anomaly units by subtracting the mean and dividing by the standard deviation of the full series. This allowed comparisons between oxygen and hydrogen isotope records, as well as between records collected from archive types with differing climate sensitivities.
Age uncertainty was an important consideration when integrating diverse annually resolved proxy records into a large-scale reconstruction. Even within layer-counted archives such as many Greenland ice cores, cumulative counting errors can accrue with depth, and known issues in the Greenland Ice Core Chronology 2005 (GICC05) timescale prior to ∼1200 CE introduce age deviations on the order of several years (Adolphi and Muscheler, 2016; Sinnl et al., 2023). Other ice core chronologies, such as those from Svalbard and some alpine sites, rely on ice flow modeling anchored by age markers (e.g. Isaksson et al., 2005), which increases the age model uncertainty envelope. Speleothem chronologies also include uncertainties associated with uranium-thorium dating precision and age model construction. Because these uncertainties differ in both magnitude and structure across proxy types, their potential to influence reconstructed variability arises not only through absolute age offsets but also through spectral biases.
We restricted the Iso2k dataset to annually resolved, well-dated records to avoid the larger uncertainties associated with radiocarbon-based chronologies. However, we also included a small number of speleothem and flow modeled ice core records, consistent with common practice in other multiproxy reconstructions (e.g., Mann, 2007; PAGES 2k 2013; PAGES 2k 2019; Falster et al., 2023; Table S1 in the Supplement).
We applied a composite-plus-scale (CPS) reconstruction approach to extract the signal of the NAO from the Iso2k records. We produced the CPS ensemble using methods mirroring those applied by previous studies with similar goals (Mann et al., 2008; Neukom et al., 2014). We treated all proxy records uniformly with respect to temporal resolution and seasonal sensitivity. Only three of the 94 Iso2k records possessed subannual resolution, so we used annually averaged values for all proxies to ensure consistent treatment across the network. This procedure followed established precedent in comparable reconstruction studies (e.g., Konecky et al., 2023; Ortega et al., 2015; PAGES 2k Consortium, 2019). Although we incorporated the proxies at an annual timescale, our approach accounted for the seasonal character of the NAO by correlating each proxy series with the instrumental DJF NAO index when weighting the proxy contributions during calibration. This process captured the extent to which each annual proxy series reflected winter NAO variability, resulting in a reconstruction that represented the aggregated isotopic response to the seasonal NAO signal. For each member of the 1000-member ensemble, we randomly removed 15 % of the Northern Hemisphere Iso2k records (Sect. 2.1). We then performed the CPS reconstruction by normalizing and scaling the remaining records according to their correlation with the NAOVinther index in the calibration interval from 1873–2000 CE and computing the mean of the records at each timestep. We then normalized mean and variance of the composite to match that of the NAOVinther index. The resulting reconstructions should not be interpreted strictly as that of the NAO atmospheric pressure index itself, but rather a reconstruction of the integrated, long-range, and persistent impacts of NAO variability on atmospheric circulation and regional climate as recorded by the isotopic proxy network. We validated this relationship by testing the correlation of the reconstruction ensemble members against the first 50 years of the NAOVinther index in the validation interval from 1823–1873 CE.
Note that the choice of calibration and validation windows inherently influenced the number of proxy records available for reconstruction because not all Iso2k records had complete coverage through the 20th century. Using alternative calibration/validation configurations shifted these windows and altered the reconstruction performance by changing proxy availability during the calibration interval. For example, calibrating on an earlier segment of the industrial period (e.g. 1823–1923 CE) and validating on the later period (1924–1999 CE) resulted in the exclusion of substantial portions of shorter records. Because proxy availability varied through time, these tests underscored that the calibration interval must balance record length, data quality, and coverage to ensure a stable and interpretable set of validation statistics. We estimated the impact of changing record coverage throughout the millennium by repeating the CPS validation method after restricting included records according to their temporal coverage. To accomplish this, we performed the reconstruction using only records with start years no later than 1500 CE, and again using only records starting no later than 1000 CE.
We developed a null hypothesis by constructing an ensemble of first-order autoregressive (AR(1)) noise records corresponding to the Iso2k records above and then composited and scaled using the same CPS methods. We then tested the correlation of the resulting composite against the NAOVinther index. We repeated this process one hundred times to produce a range of correlations that might be expected from one hundred “reconstructions” of the NAO using autocorrelated noise.
To test the relative influence of records outside of the NAO centers of action on our reconstruction, we performed the same CPS procedures on only records from Greenland and Europe and separately on records from the Indo-Asian monsoon region (Fig. 1, blacked dashed regions). We compared the results with the full reconstruction, and, to ensure the high skill of the full reconstruction was not simply the result of having more records, performed the CPS procedure using records from the regional subsets after adding autocorrelated noise records to bring the total number of records equal to the full reconstruction (“noise-padded”).
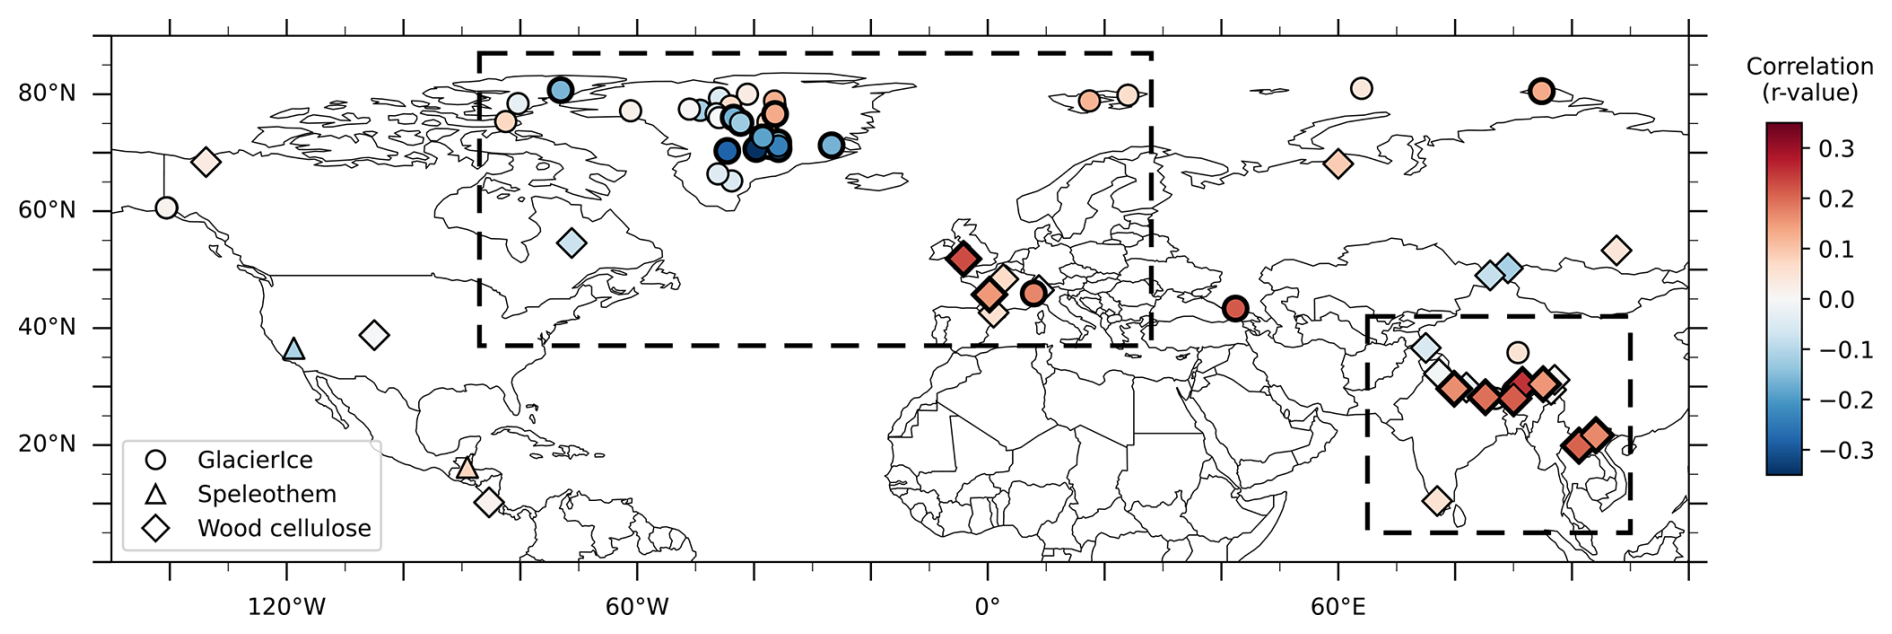
Figure 1Map of Iso2k records included in the analysis. Shapes correspond to archive type and colors denote the Pearson's r-value of each record with NAOVinther (1823–2000 CE). Bold outlines signify significant correlation (p<0.1). Regional subsets used for validation are indicated by dashed boxes over Greenland and southeast Asia.
In addition to the spatial correlation analysis, we calculated a model-based “pseudo-reconstruction” of the NAO using the iLME δ18Oprecip field. To mimic the proxy reconstruction framework, we extracted the modeled δ18Oprecip time series from each grid cell corresponding to the terrestrial Iso2k proxy locations. We then weighted each modeled δ18Oprecip series by its correlation with the modeled NAO SLP index over the last millennium (1000–2000 CE). We composited the weighted series to yield a single δ18O-based pseudo-reconstruction of the NAO. We repeated this process repeated for 1000 ensemble members, each time removing 15 % of the modeled δ18Oprecip grid cells corresponding to Iso2k proxy locations to mimic the data sensitivity experiments in the Iso2k NAO reconstruction. This method provided a process-based test of how the spatial sampling and covariance structure of the proxy network can recover NAO variability in the simulations. It also provided a more direct comparison between the proxy-based reconstruction of the impacts of the NAO with the modeled impacts of the NAO on δ18Oprecip.
We performed spectral decomposition on the NAOVinther index, Iso2k NAO reconstruction, NAOiLME, as well as the NAO reconstructions from Cook et al. (2019) and Ortega et al. (2015) using the multi-taper method (MTM; Thomson, 1982) through the R package geoChronR, which in turn leveraged the astrochron R package (Mckay et al., 2020; Meyers, 2012). We chose to focus on the calibration-constrained reconstruction from Ortega et al. (2015) because the reconstruction methodology most closely matched the methods we used for the Iso2k reconstruction. We performed the spectral analysis of the Iso2k NAO reconstruction and NAOiLME across the reconstruction ensemble to produce a range of possible MTM results. We compared the resulting decompositions against an AR(1) null hypothesis (e.g., Zhu et al., 2019). We performed wavelet analysis on the NAO reconstructions using the R package “WaveletComp” (Roesch and Schmidbaur, 2018). This method allowed for an investigation of changes in the frequency of signals through time. We also performed wavelet analysis on reconstructions that included only a single proxy type to investigate the impact that record availability and proxy type had on the spectral characteristics of the reconstructions.
We used cross-wavelet power and wavelet coherence to assess the consistency of time domain features between NAO reconstructions. Cross-wavelet power identified regions of shared variance in time-frequency space, while wavelet coherence quantified the strength of the spectral relationship between reconstructions. We evaluated statistical significance against a red-noise (AR(1)) background spectrum, estimating 95 % confidence levels following the implementation in the WaveletComp package. We also compared between reconstructions using an 11-year running mean to investigate decadal-scale variability. We assessed the statistical significance of correlations between the decadally smoothed NAO reconstructions using the Ebisuzaki (1997) phase-randomization approach, which accounted for serial autocorrelation by comparing the observed correlation against a distribution of time series with identical spectral properties (Ebisuzaki, 1997).
3.1 NAO-correlated Iso2k records and CPS reconstructions
We extracted a total of 94 records from Iso2k from the Northern Hemisphere with at least annual resolution and 33 % coverage between 1823 and 2000 CE. This included 2 speleothems, 37 wood cellulose, and 55 glacier ice records, with all records based on δ18O except three glacier ice records of δD. Pearson correlation r-values of these records with the NAOVinther index ranged from −0.37 to 0.29. Thirty-seven of the original 94 proxy records were significantly correlated (p-value < 0.1) with NAOVinther in the calibration interval including 15 wood cellulose, and 22 glacier ice records. Records with significant correlations spanned the full spatial distribution of the original 94 records, including glacier ice records in Greenland, the Alps, and the Himalayas, and wood cellulose in Europe, northern India, and the Tibetan Plateau (Fig. 1, bold symbols). A total of 20 records spanned the full last millennium including 15 glacier ice, 3 wood cellulose, and 2 speleothem records (Fig. 2b), of which only 7 glacier ice records were significantly correlated with the NAOVinther index (Fig. S1a).
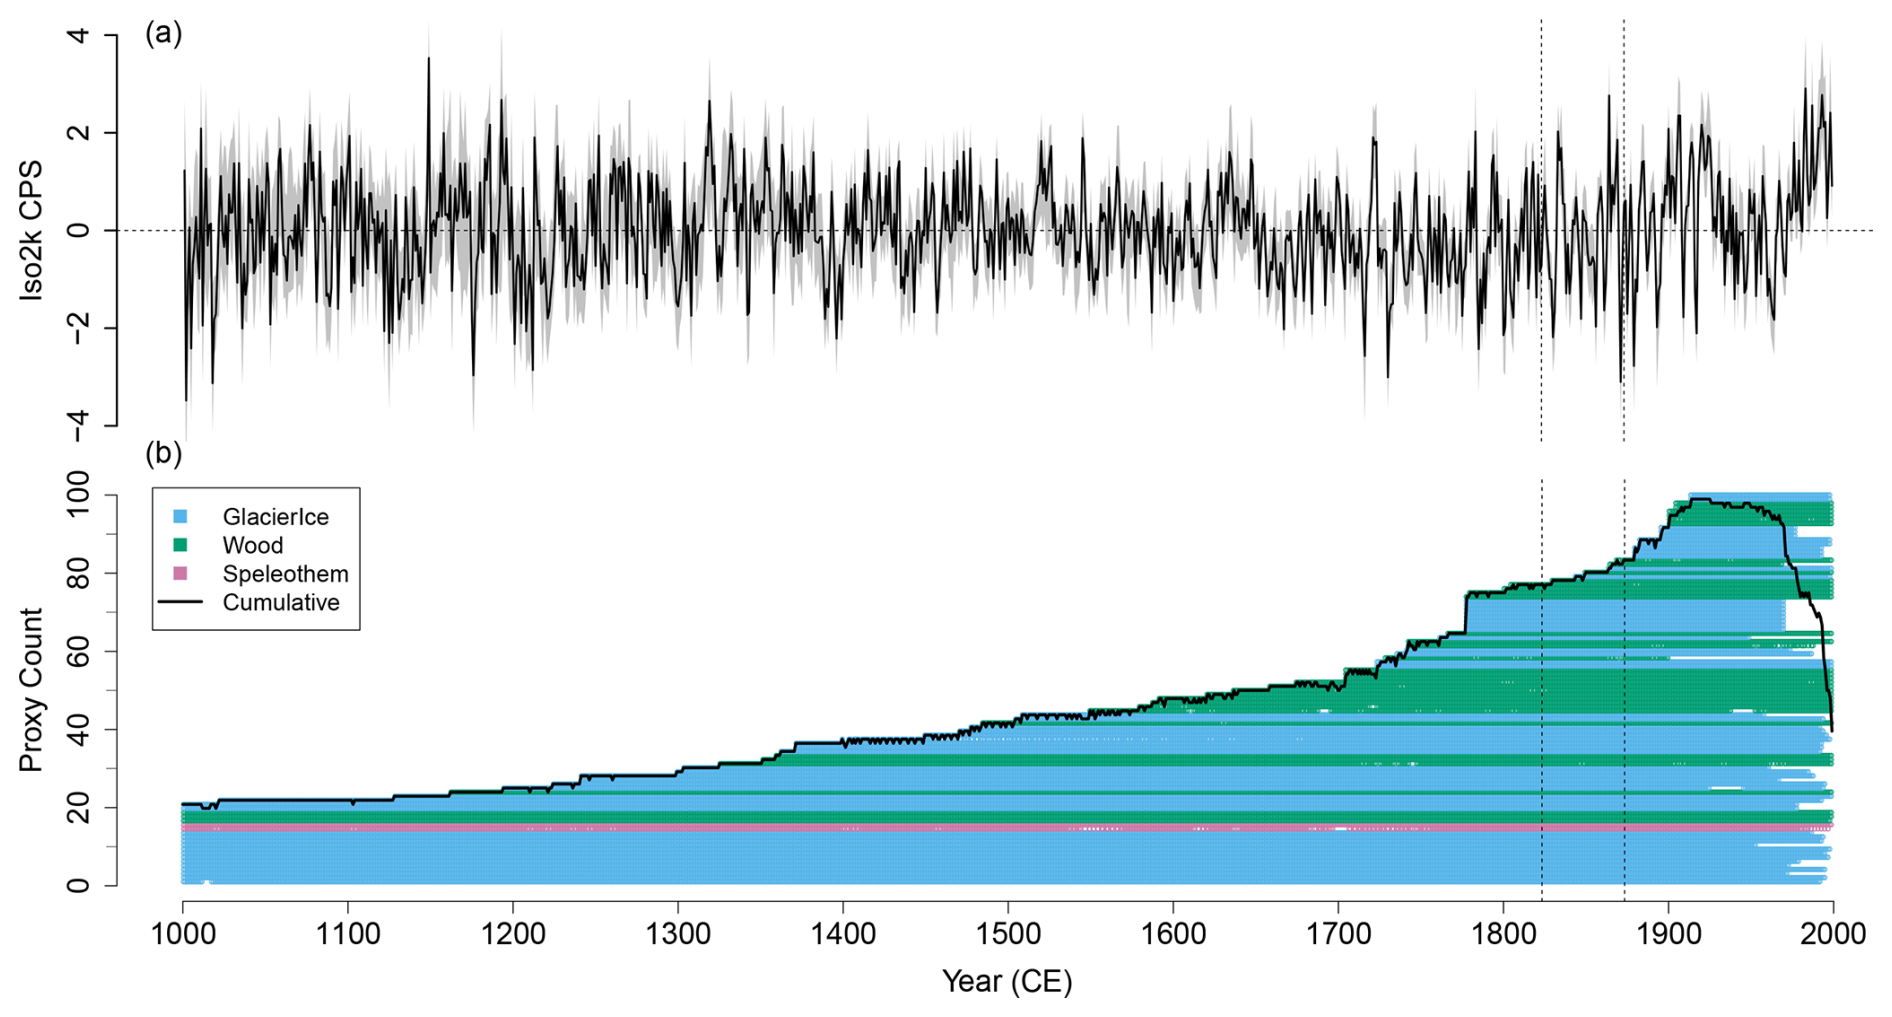
Figure 2(a) NAO reconstruction ensemble members (grey shading) and ensemble median (black line). Horizontal dashed line shows zero. Vertical dashed lines indicate calibration and validation cutoff years at 1823 and 1873 CE. (b) Record coverage through time for the full Northern Hemisphere Iso2k dataset including glacier ice (blue), wood cellulose (green), and speleothem (red) records. Solid black line indicates the total number of available records in each year.
The median of the ensemble of reconstructions ranged from approximately −3.5 to 3.4, while the full ensemble spanned from −4.2 to 4.1 (Fig. 2a). The ensemble members were all significantly (p<0.001) positively correlated with the NAOVinther index during the validation interval from 1823–1873 CE, with correlation values ranging from 0.38 to 0.57 and a median of 0.48 (Fig. 3, red).
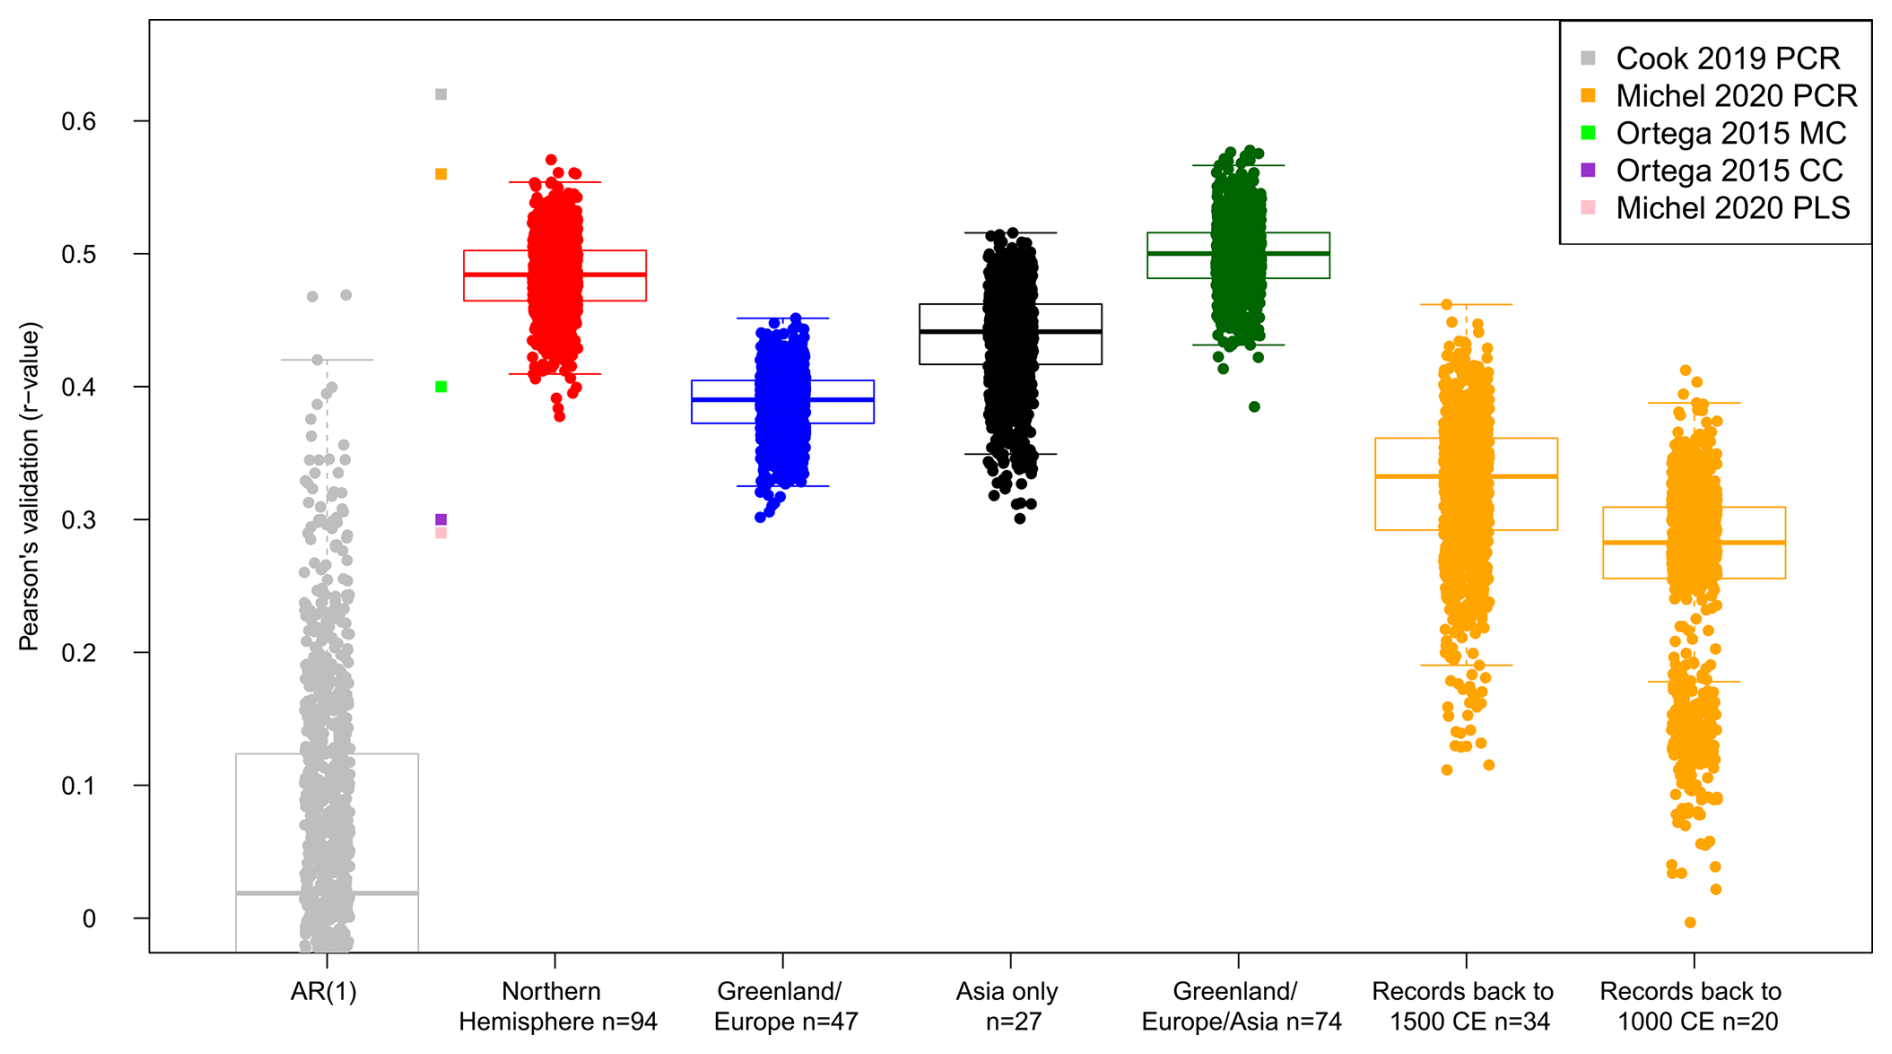
Figure 3Box and whisker plots of validation (1823–1873 CE) metrics for the reconstructions using first-order autocorrelated noise (grey), the Northern Hemisphere Iso2k dataset seen in Fig. 1 (red, n=94), only records from Greenland and Europe (blue, n=47), only records from southeast Asia and the Tibetan Plateau (black, n=27), and the combination of Greenland, Europe, southeast Asia, and the Tibetan plateau (green, n=74). Regional subsets correspond with dashed boxes in Fig. 1. Yellow distributions show validation scores when restricting the reconstruction to only records that extend back to 1500 CE or earlier (n=34), and 1000 CE or earlier (n=20). Individual colored squares indicate validation scores for other published NAO reconstructions.
Restricting the spatial extent of records included in the reconstruction to only Greenland and Europe produced a substantial decrease in correlations with the NAOVinther index during the validation interval, with correlation values between 0.3 to 0.45, and a median of 0.39. (Fig. 3, blue). Using only records from northern India and the Tibetan plateau in the reconstructions produced a median validation correlation value of 0.44 (with values ranging from 0.27 to 0.51) that exceeded the Greenland and Europe-only reconstructions (Fig. 3, black). Using the two regions together produced the reconstructions with the highest median correlation at 0.5, with individual ensemble values ranging from 0.39 to 0.58 (Fig. 3, green), slightly higher than even reconstructions using all 94 records (Fig. 3, red). Padding the regional reconstructions with autocorrelated noise did not improve their validation correlations, suggesting the skill of the full Northern Hemisphere reconstruction was not simply a function of the large number of records (Fig. S2). The high skill of the two regions combined highlights the importance of including records outside the center of action of the NAO index when reconstructing the NAO.
Reconstruction skill was also dependent on temporal data availability as shown by reconstructions that were restricted to only records extending back to 1500 or 1000 CE (Fig. 3, yellow). Restricting to only records extending to 1500 CE produced validation correlations ranging from 0.06 to 0.47, with a median of 0.32, while records extending to 1000 CE produced reconstruction validations ranging from 0 to 0.4 with a median of 0.28. These validation scores highlight a limitation common to paleoclimate reconstructions, that validation skill during observational intervals with good proxy coverage may not be representative of reconstruction fidelity further back in time when data availability is reduced. Note, however, that because the number of records spanning the full last millennium was lower, the reconstruction validation scores were more sensitive to the random removal of some records. This was reflected in the larger range of validation scores in the distribution, resulting in some subsets of the available data producing validation scores nearing the range of the full reconstruction.
3.2 NAO fingerprints in GNIP isotope stations
Of the 1005 stations extracted from the GNIP database, 146 stations met conditions of at least 10 non-consecutive winter (DJF) seasons of data (Fig. 4 symbols) and of those, 50 had a significant (p<0.1) correlation with the NAOVinther index (Fig. 4, symbols with bold outlines). Of those 50 stations, 47 were positively correlated with the NAO, with Pearson's R values ranging from 0.29 to 0.86, while 3 were negatively correlated, ranging from −0.34 to −0.53. The positively correlated stations were concentrated in central Europe, although stations in Finland, the Azores, Barbados, and Greece were also positively correlated.
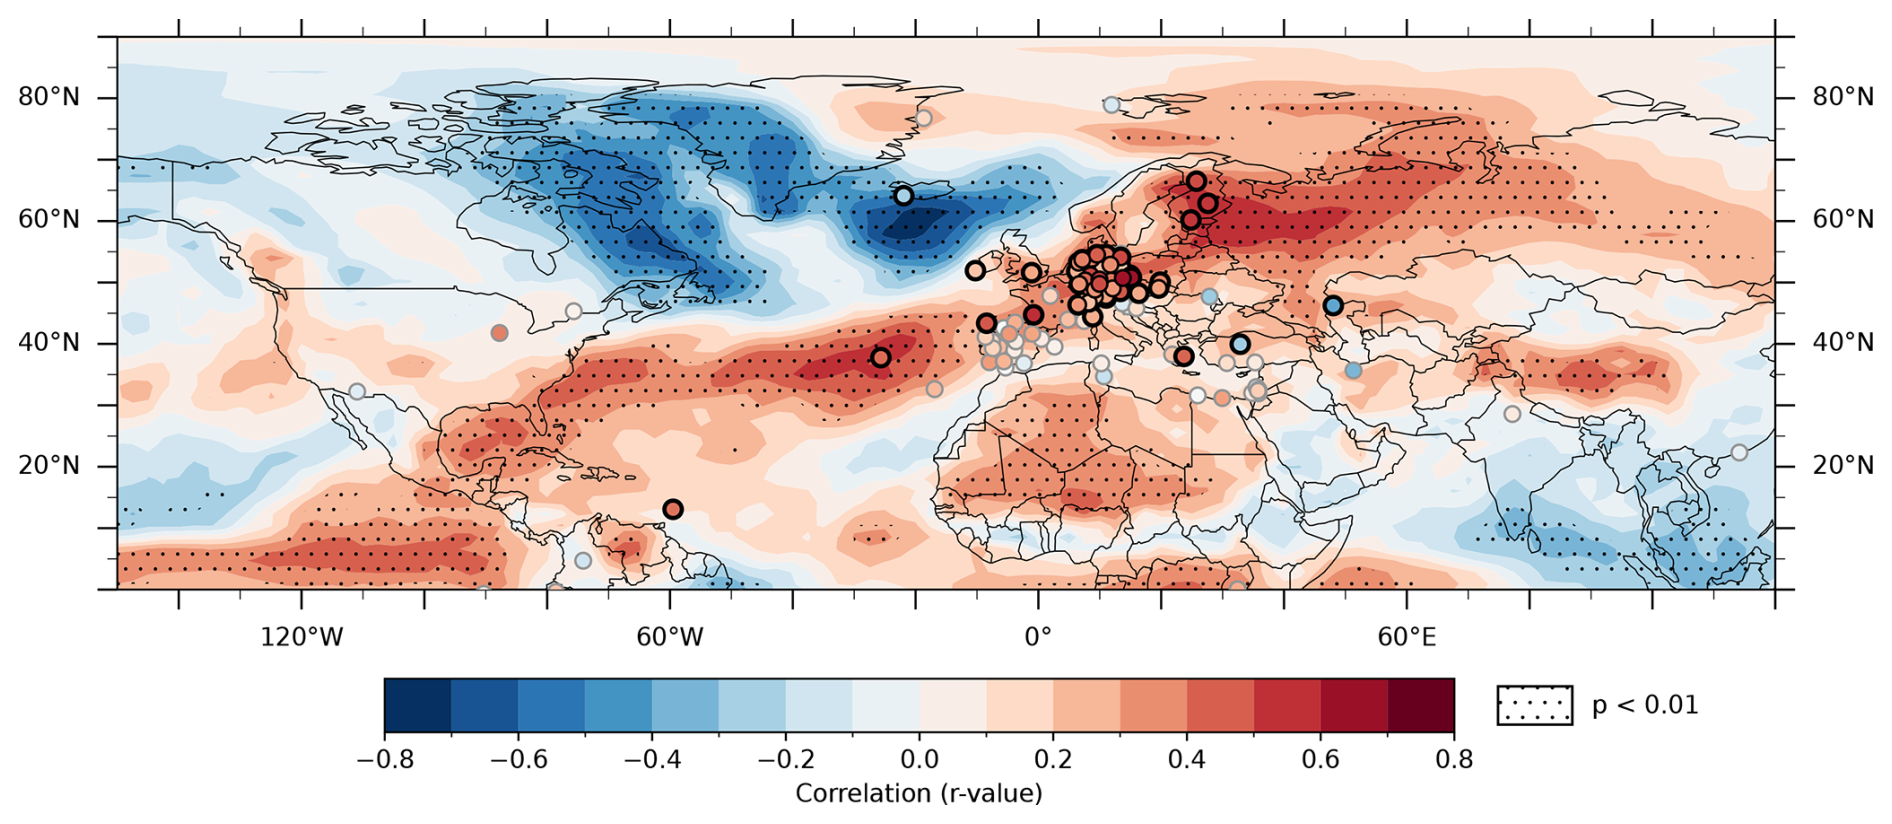
Figure 4Winter NAOiLME correlations (color contours) with iLME winter δ18Oprecip from 1823–2000 CE. Stippling denotes p < 0.01. Symbols show GNIP stations with ≥10 winters colored by δ18Oprecip correlations with NAOVinther, bold symbols show significant (p < 0.1) correlations.
The negatively correlated stations were in Iceland, southwest Russia, and Turkey. The correlation dipole between the Iceland station and the stations in Europe was broadly consistent with the sea level pressure (SLP) dipole characteristic of the NAO, in which the NAO was negatively correlated with SLP over Iceland and positively correlated over Europe (Fig. S3). This pattern was also consistent with past studies of δ18O correlations with the NAO (Deininger et al., 2016).
3.3 NAO fingerprints in the iLME
The winter (DJF) NAOiLME index values ranged from −5.29 to 3.15 with a standard deviation of 1.79 through the period 1823–2000 CE (Fig. S4a). As with the NAOVinther index, the winter NAOiLME was slightly positively skewed, but with more extreme values during negative years (Fig. S4b–c). The NAOiLME captured the main spatial features of observed NAO impacts in the North Atlantic region, with similar correlations to SLP, temperature, and precipitation (Compo et al., 2011; Hernández et al., 2020). Correlations between NAOiLME and winter precipitation amount were less spatially extensive than with temperature (Fig. 5a–b). However, the precipitation correlations with the NAOiLME showed an east/west contrast over Greenland, with positive correlations in the east and negative correlations spanning western Greenland and the northeastern Canadian Arctic. This differed notably from 20th Century Reanalysis correlations which showed no significant NAO-precipitation correlations over Greenland (Hernández et al., 2020). Positive winter NAOiLME years were characterized by greater IVT from the North Atlantic and stronger anticyclonic flow in the subtropical Atlantic, which increased moisture transport from the North Atlantic into Northern Europe and Scandinavia relative to negative winter NAOiLME years, consistent with a stronger and more northern jet (Fig. 5c).
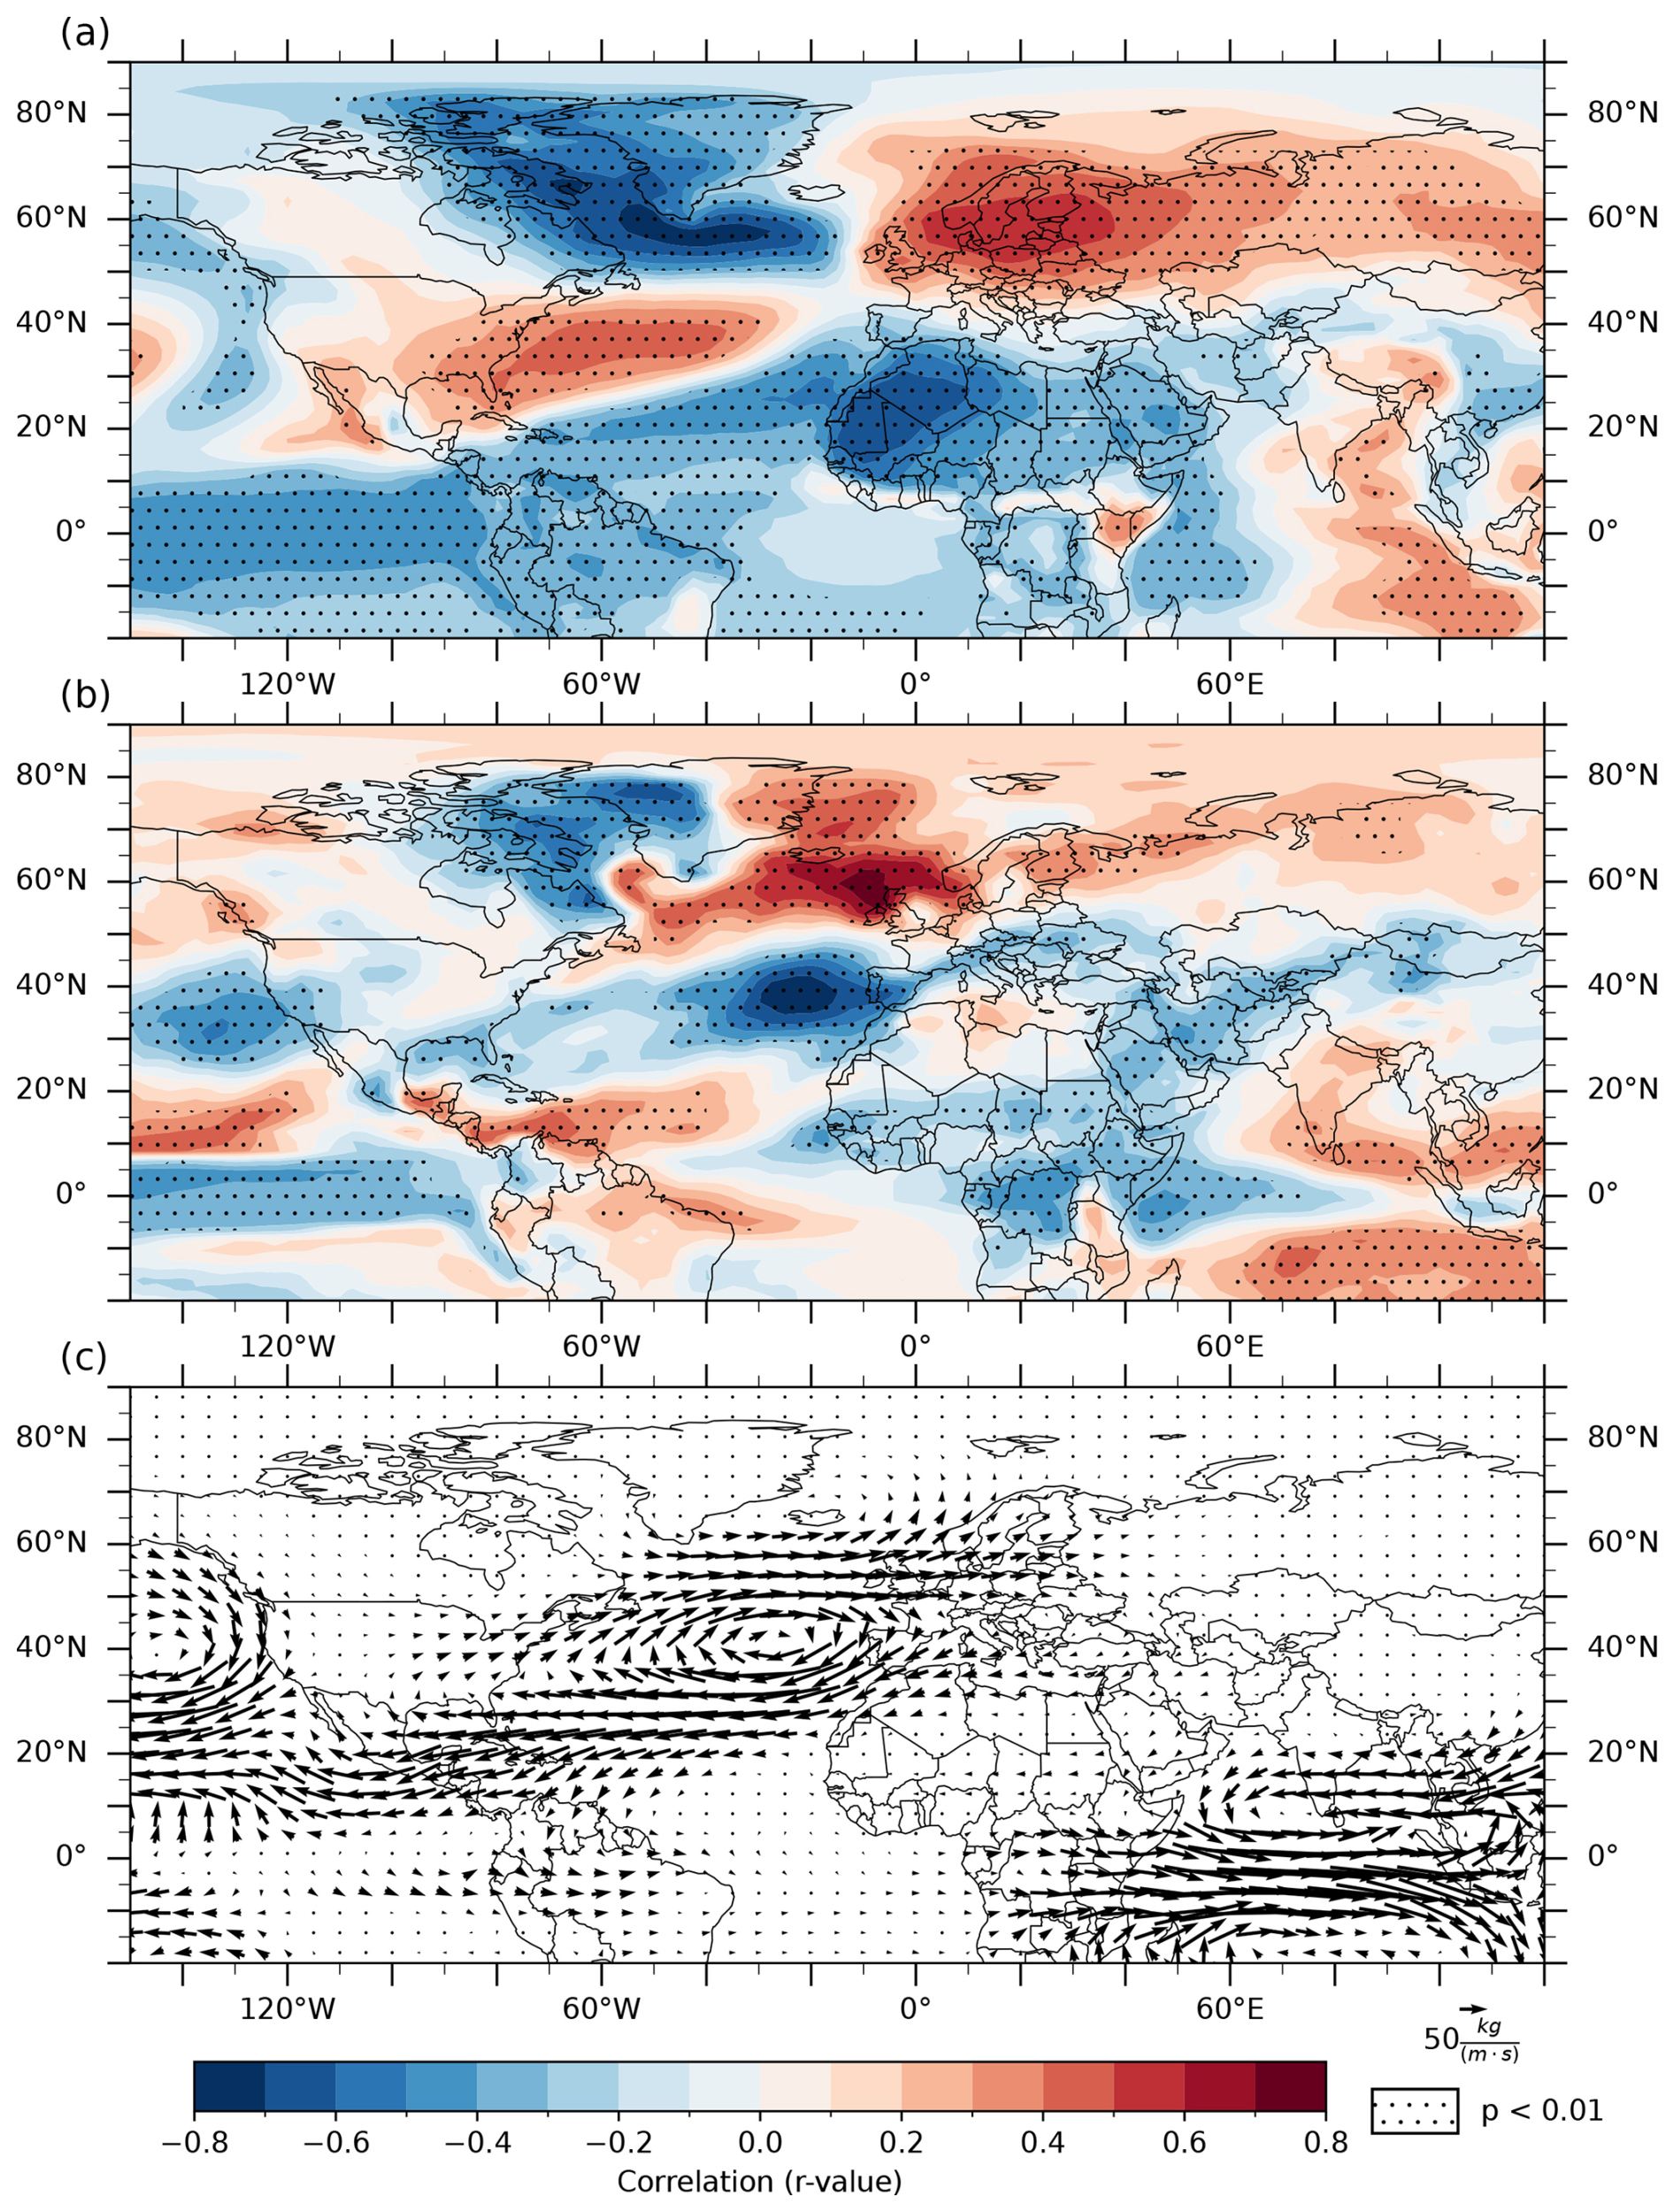
Figure 5Winter NAOiLME correlations (color contours) with iLME winter surface air temperature, precipitation amount, and composite IVT from 1823–2000 CE. Stippling denotes p < 0.01. (a) NAOiLME correlation with winter surface air temperature. (b) NAOiLME correlation with winter precipitation amount. (c) Difference between winter IVT during positive and negative winter NAOiLME years, defined as NAOiLME greater or less than one standard deviation from the mean, respectively, over the period 1823–2000 CE.
Winter NAOiLME correlations with amount-weighted δ18O of winter precipitation (δ18Oprecip) were negative over western Greenland and Iceland, and positive over Europe, Scandinavia, and the mid-latitude North Atlantic (Fig. 4, shading). The NAOiLME index was also positively correlated with winter δ18Oprecip over the tropical Pacific, west Africa, and the Tibetan plateau. Although GNIP δ18Oprecip observations are limited, and nonexistent over the oceans, the correlations were consistent with the available GNIP δ18Oprecip data (Fig. 4, symbols).
3.4 Spectral analysis of the NAO reconstruction and the NAO in the iLME
Wavelet decomposition of the NAO reconstruction found significant (p<0.05) power in four main “bands” throughout the last millennium, which here we refer to as interannual (1–10 years), decadal (10–30 years), multidecadal (30–100 years), and centennial (100+ years; Fig. 6a). The multi-taper method spectral decomposition of the full reconstruction over the last millennium showed higher power at longer periods (Fig. 6b). Peaks that rose above the 95 % confidence level occurred in the interannual band (2–6 years), as well as at decadal, multidecadal, and centennial scales (11, 23, 94, and 300+ years). The wavelet analysis of the NAO reconstruction showed significant power in the interannual and decadal bands from the early 1700s through present (Fig. 6a). Power in the interannual band was weaker prior to 1550 CE. Significant decadal and multidecadal power also persisted from ca. 1000–1300 CE, despite being mostly absent by the mid-millennium. Significant multidecadal to centennial power extended throughout the full reconstruction, although with lower power than the higher frequency bands.
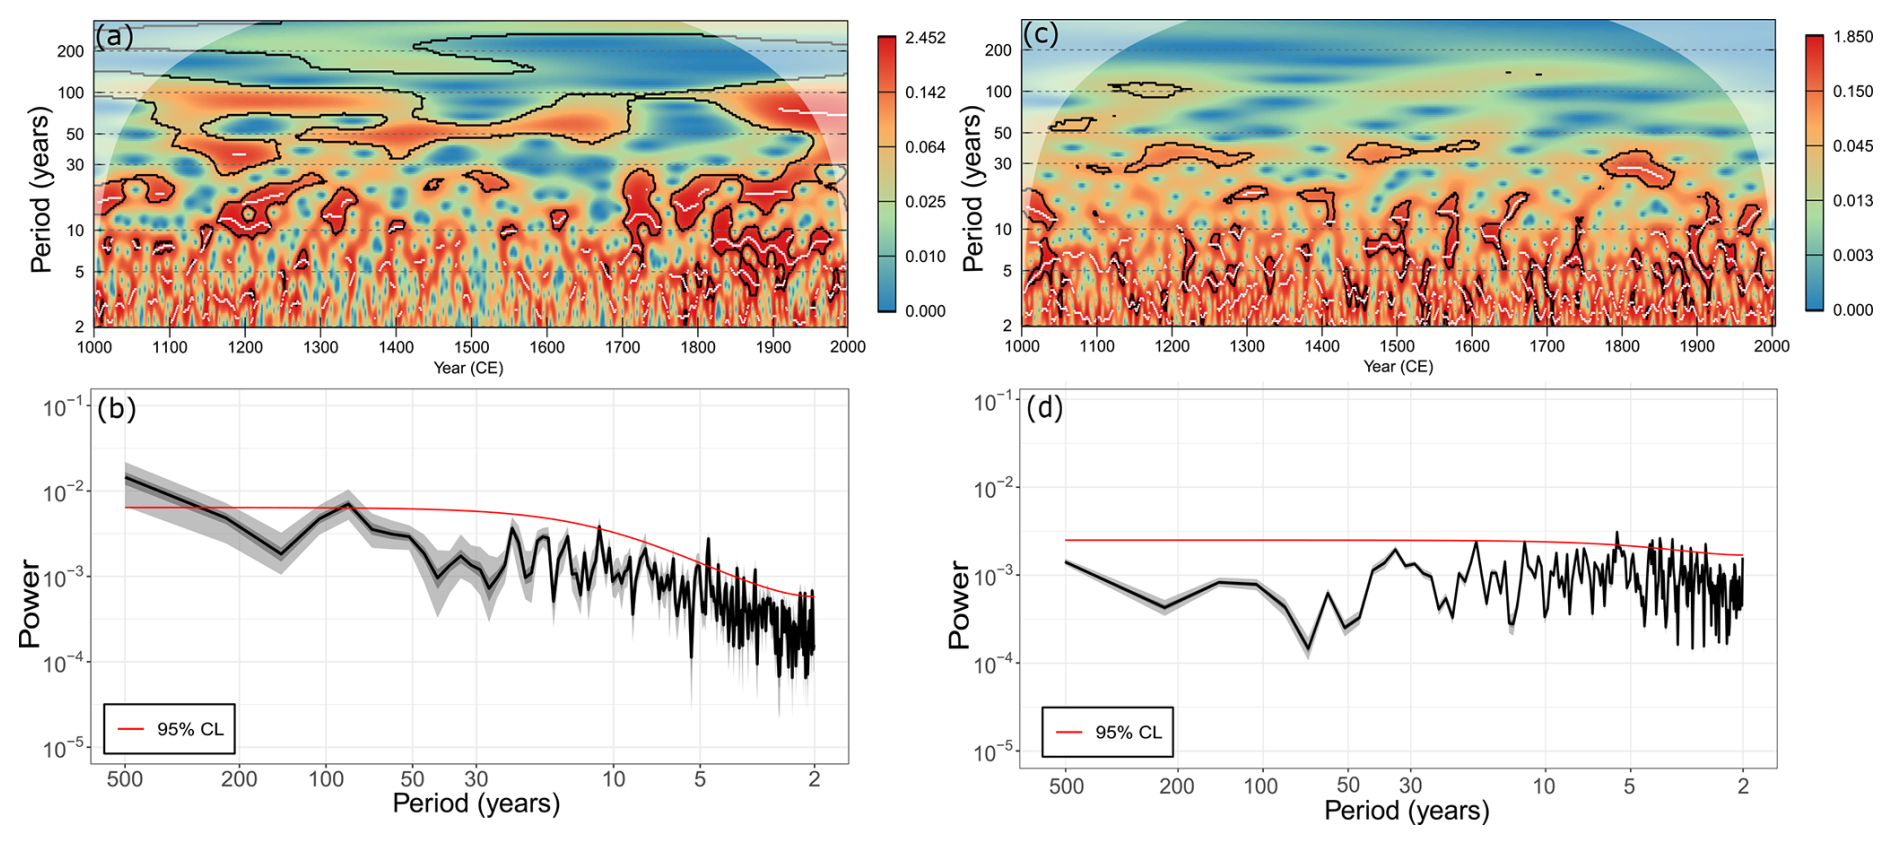
Figure 6(a) Wavelet decomposition of the NAO reconstruction from 1000–2000 CE. Color contours are scaled by power quantiles. Black contours bound statistically significant power (p<0.05) and white curves show ridges (power maxima). White envelope shows the region where padding may influence estimates. (b) The multi-taper method spectral decomposition for the NAO reconstruction. Red line shows 95 % confidence level based on an AR(1) null. Grey shading shows ensemble range. (c) and (d) are as in (a) and (b) but for the NAO pseudo-reconstruction from the iLME δ18Oprecip field.
We repeated the wavelet and multi-taper analysis twice to investigate the impacts of proxy type on the spectral character of the reconstruction: First using a reconstruction based only on glacier ice records, and again with a reconstruction using only wood cellulose records (Fig. S5). Like the full reconstruction, both proxy-specific reconstructions exhibited significant interannual to decadal power, but glacier ice records had higher multidecadal to centennial power than wood cellulose records.
The reconstruction using glacier ice records had consistent significant power across scales from the late 1700's through present and from 1000 to about 1250 CE (Fig. S5a). Nevertheless, the mid-millennium had only intermittent significant power on interannual to decadal scales. By contrast, power on multidecadal and centennial scales was notably weaker in the later part of the millennium in the reconstructions using wood cellulose records. While these reconstructions had significant power in the interannual to decadal band from about 1600–2000 CE (Fig. S5b), limited availability of wood cellulose records prior to 1600 CE means the wavelet decomposition was based only on a small number of records and likely not reliable (Fig. 2b).
Ensemble-based MTM analyses showed that variability in record selection (15 % removed per realization) could cause some ensemble members to fall below the AR(1) 95 % confidence threshold in the multidecadal band, suggesting that the magnitude of multidecadal variability is partially sensitive to network size and composition (Fig. 6b). However, the wide diversity of the network reduced the influence of any single record, and the shared climate signal could still be robustly identified despite heterogeneity in age uncertainty (Ortega et al., 2015). Sensitivity analyses confirmed this, as removing the non-layer-counted records either individually or collectively produced only minor changes in the reconstruction, with the most notable being a slight reduction in the multidecadal spectral peak when all were excluded (Fig. S6b). The low frequency variability in the wavelet remained consistent with the full reconstruction (Fig. S6a). Given the small age uncertainty introduced by the updated Greenland chronology ( years between 1000–1200 CE), and the limited leverage of the relatively few non-layer-counted records, we conclude that age-model uncertainty is unlikely to be a dominant contributor to the reconstructed low-frequency variability. Nonetheless, we highlight it as an important dimension of proxy heterogeneity that influences data synthesis efforts.
The wavelet decomposition of iLME pseudo-reconstruction of the NAO exhibited characteristics that were largely distinct from any of the reconstructions. Specifically, interannual variability dominated the pseudo-reconstruction over the last millennium, with the only significant (and still relatively weak) decadal power early in the millennium (Fig. 6c). The multi-taper method decomposition of the pseudo-reconstruction confirmed the lack of multidecadal and centennial scale power (Fig. 6d) and the generally “white noise” character of pseudo-reconstruction with several significant inter-annual peaks (2–8 years), one decadal peak (∼11 years), but overall low power at lower frequencies.
3.5 Spectral comparisons with other NAO reconstructions
We assessed low-frequency agreement between the Iso2k reconstruction and the NAOVinther index through decadal smoothing, cross-wavelet power, and wavelet coherence on the portions of the reconstructions that covered the instrumental interval. The 11-year centered running means showed broadly coherent decadal variability between the Iso2k reconstruction and the NAOVinther index (r=0.59, Ebisuzaki p=0.004, Fig. 7a). In the NAOVinther index, low frequency variability was present throughout, including a prolonged positive phase during the early- to mid-twentieth century as well as a shift toward positive values in the final ∼2 decades. The Iso2k reconstruction generally captured these decadal variations. Decadally smoothed reconstructions from Ortega et al. (2015) and Cook et al (2019) also showed moderate positive correlations with NAOVinther (Fig. 7b, r=0.45 and Fig. 7c, r=0.46, respectively), although the Cook et al. (2019) correlation was significant (Ebisuzaki p=0.024), while the Ortega et al. (2015) correlation was not (Ebisuzaki p=0.11). Cross-wavelet power analysis between the Iso2k reconstruction and the NAOVinther index identified statistically significant shared variance at interannual to decadal periodicities (∼5–10 years), with some significance at longer periods (∼20 years) during the late nineteenth and early twentieth centuries (Fig. S7a). Wavelet coherence also showed high coherence at (∼10–20-year periodicities across much of the record (Fig. S7b).
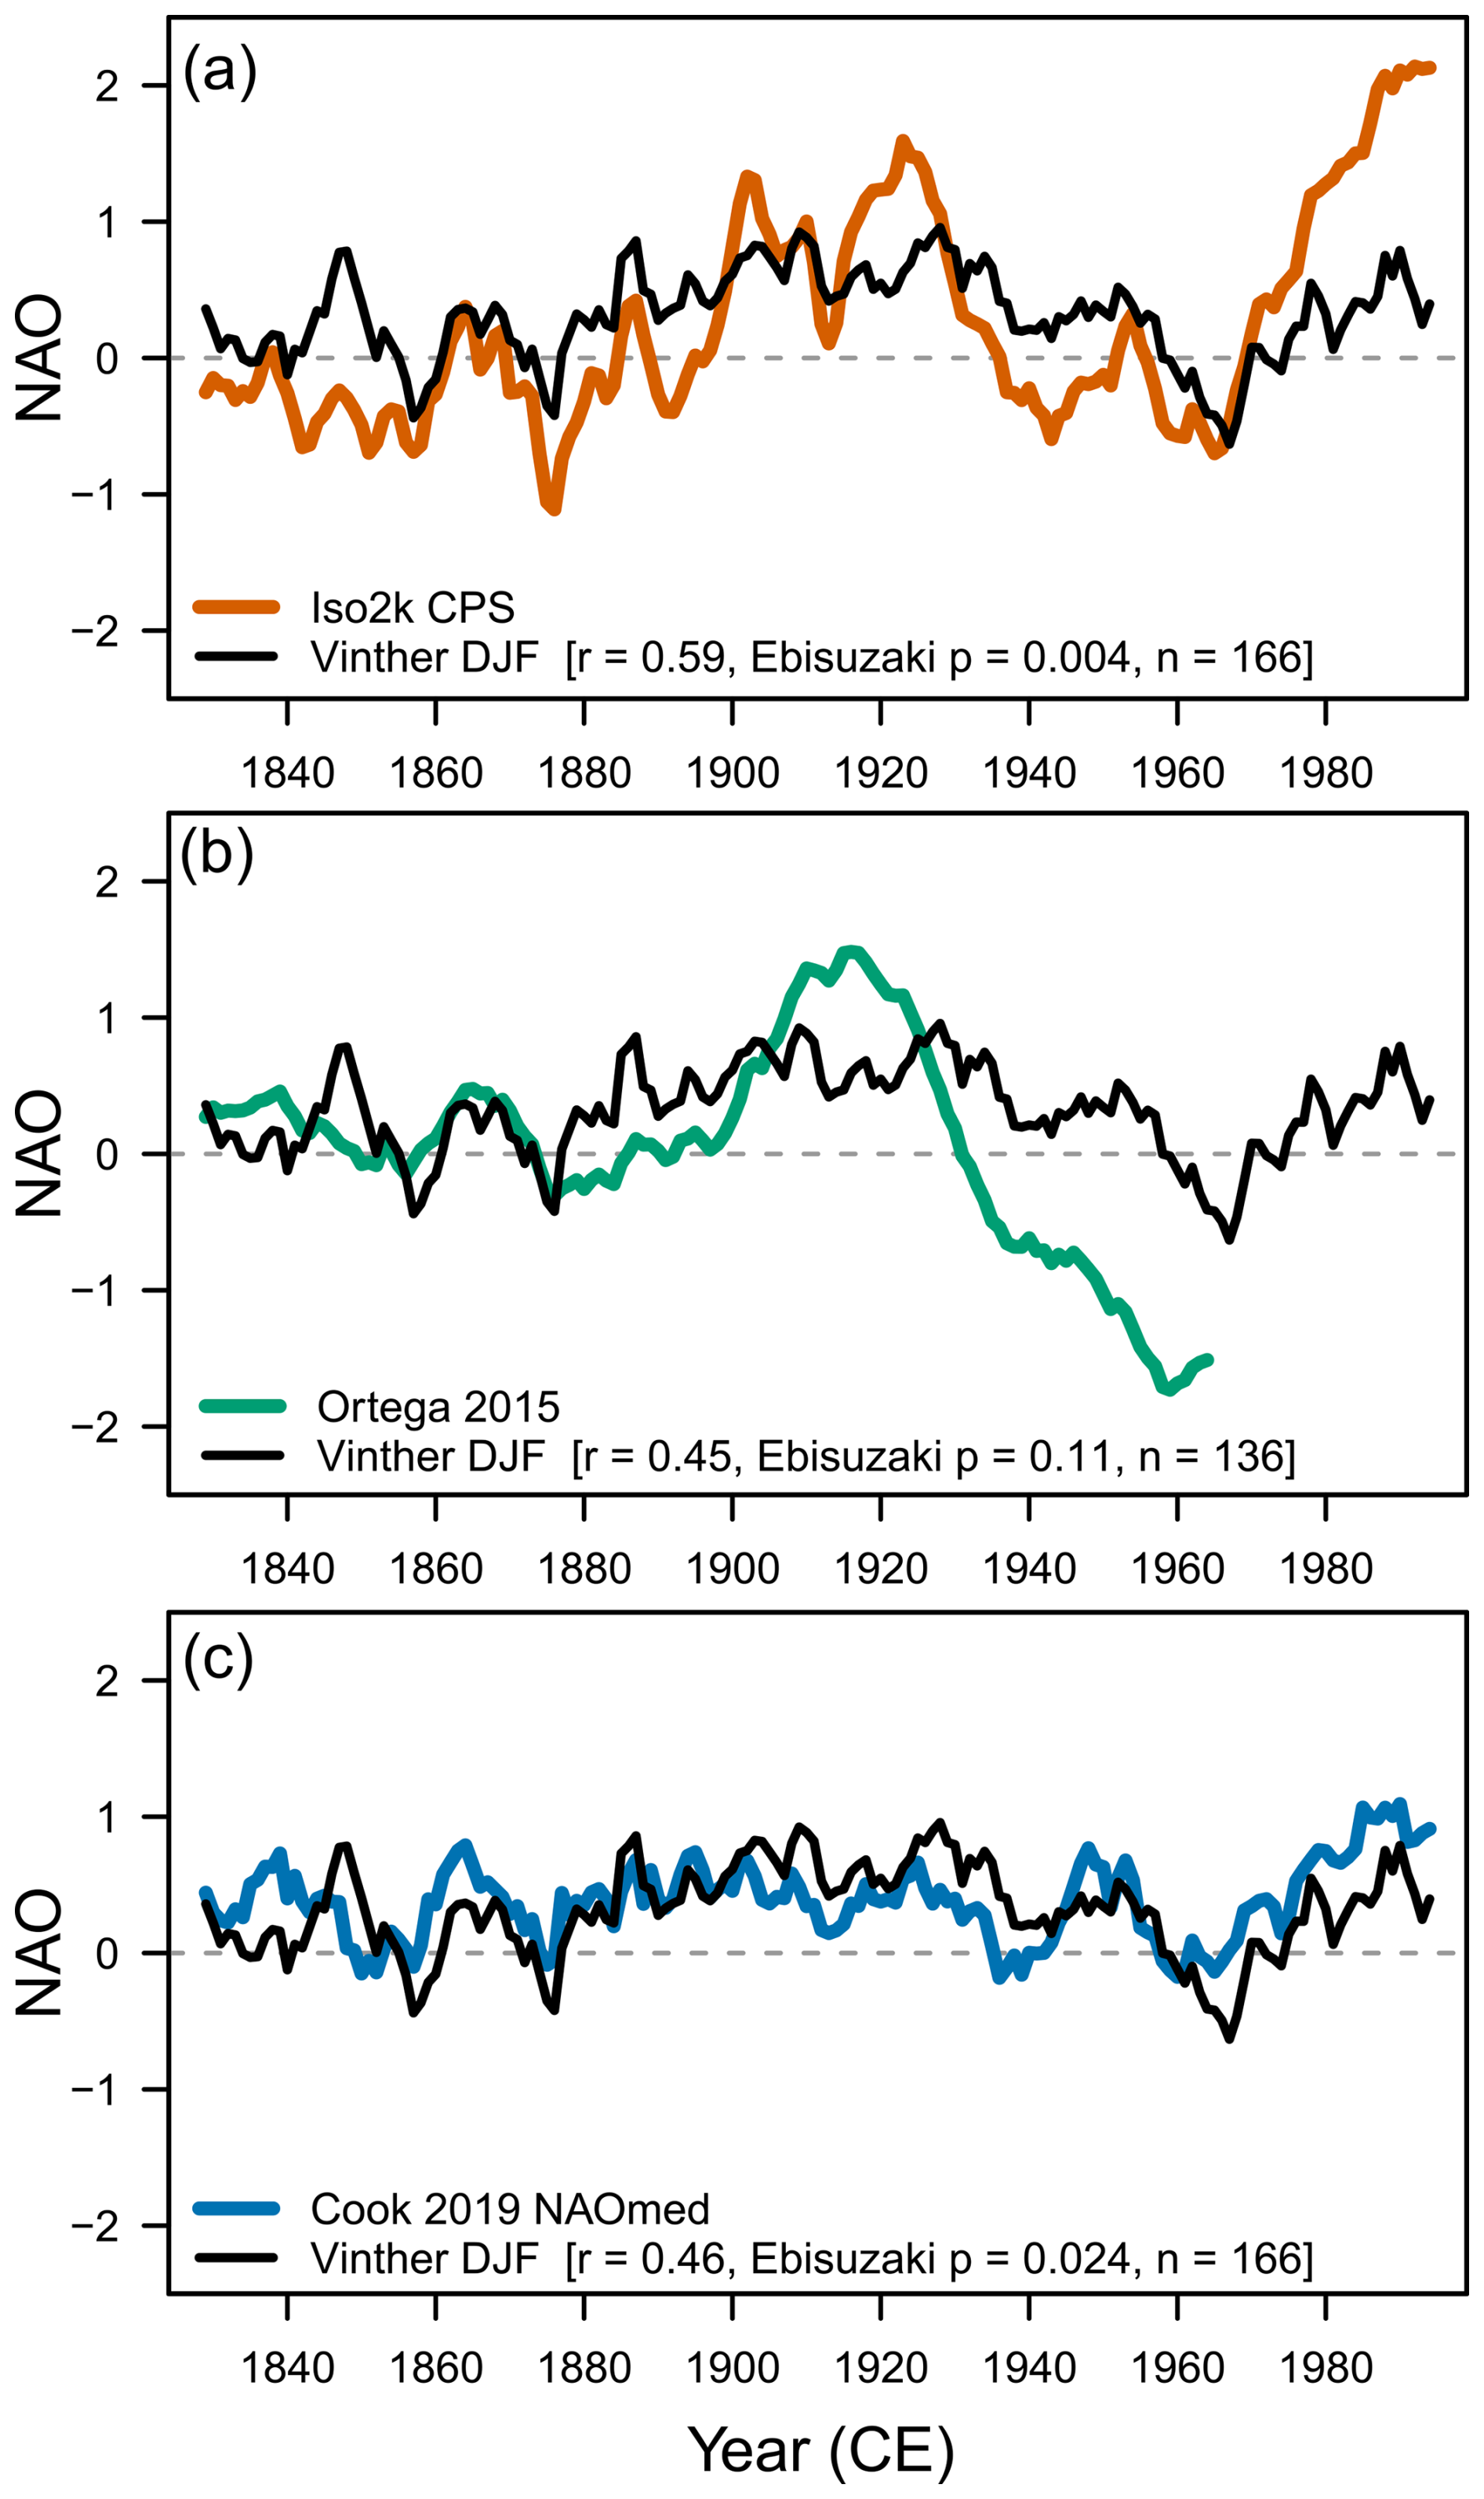
Figure 7Decadally smoothed NAO reconstructions during the observational period compared with the decadally smoothed NAOVinther index (black lines). Series are smoothed using an 11-year centered running mean. (a) Iso2k CPS reconstruction (this study; orange) vs. NAOVinther. (b) Ortega et al. (2015) calibration constrained median (teal) vs. NAOVinther. (c) Cook et al. (2019) NAOmed (blue) vs. NAOVinther.
The spectral characteristics of the Ortega et al. (2015) and Cook et al. (2019) reconstructions generally resembled those of the Iso2k NAO reconstruction (Fig. 8). The wavelet decomposition of the Ortega et al. (2015) reconstruction showed significant power in the multidecadal to centennial band (30–200 years), particularly during ca. 1100–1600 CE, with weaker interannual to decadal power (Fig. 8a). The MTM power rose above the 95% confidence level at multidecadal to centennial periods, as well as on interannual timescales (2–5 years; Fig. 8b). The Cook et al. (2019) reconstruction showed significant multidecadal variability from ca. 1000–1400 CE (Fig. 8c), which was consistent with the variability identified in the Ortega et al. (2015) reconstruction and the Iso2k reconstruction during this period. The Cook et al. (2019) MTM showed elevated power at low frequencies but did not rise above the 95 % confidence level (Fig. 8d), suggesting that low-frequency variability was present but not as extensive throughout the last millennium as in the Iso2k or Ortega et al. (2015) reconstructions.
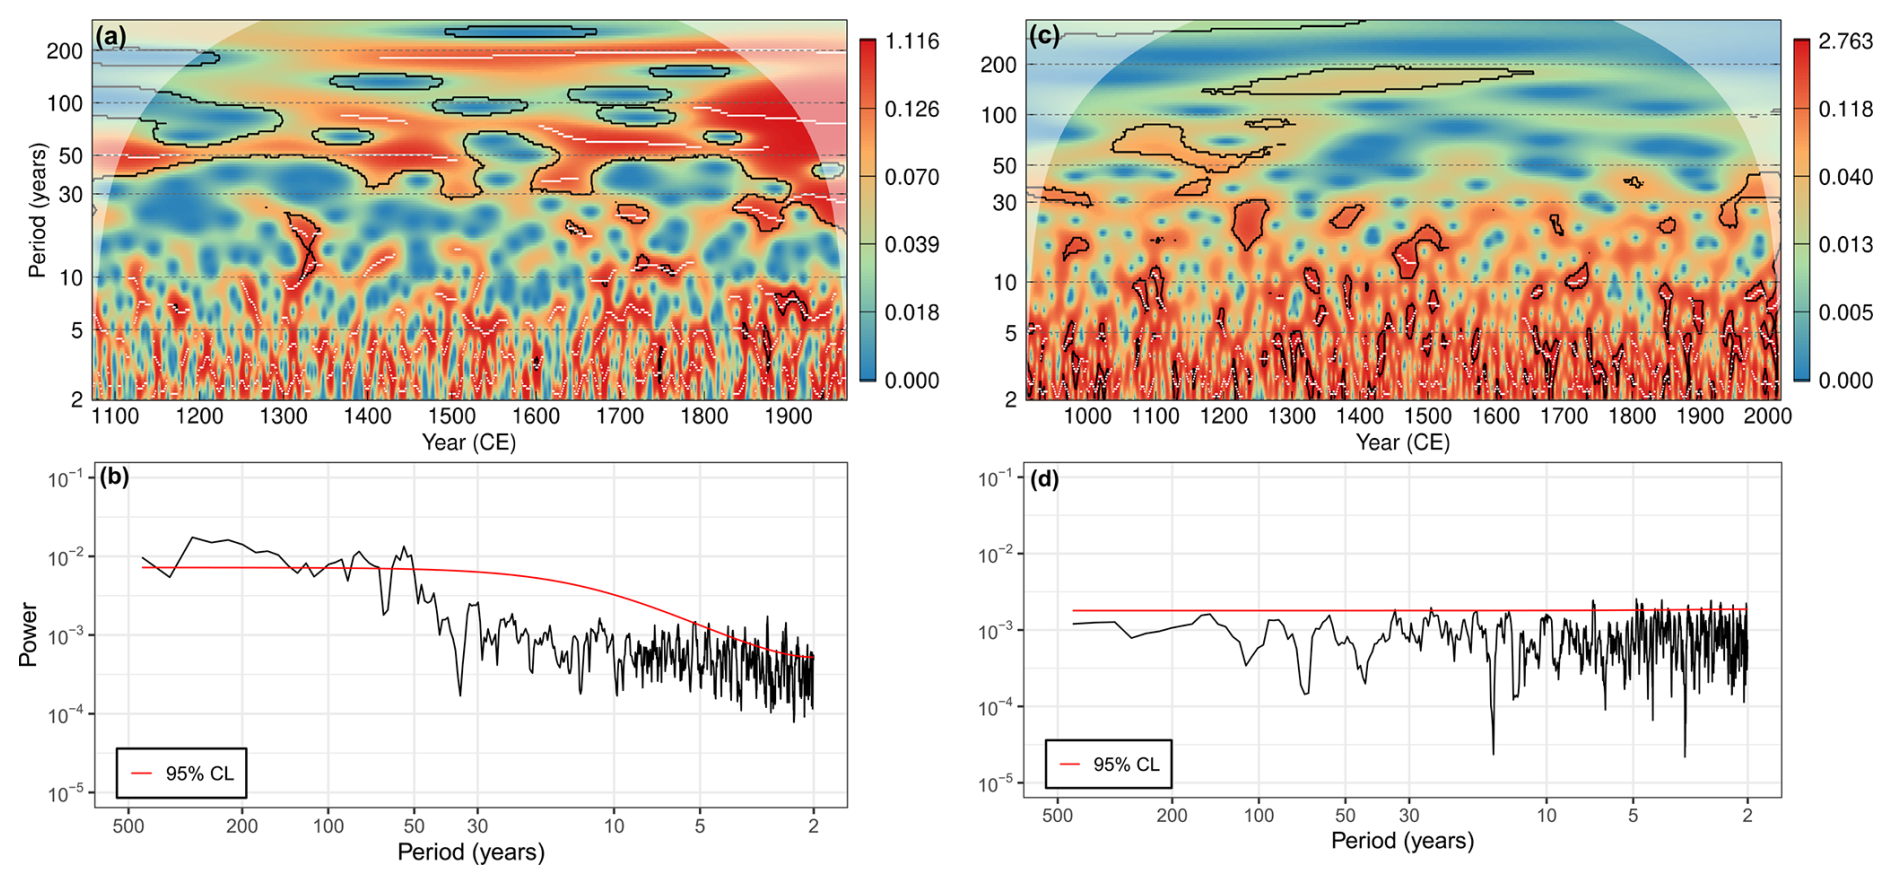
Figure 8As in Fig. 6 but for the NAO reconstruction ensemble means from Ortega et al. (2015) (a, b) and Cook et al. (2019) (c, d).
Over the last millennium the decadally smoothed Iso2k NAO reconstruction was positively correlated with decadally smoothed medians from the Ortega et al. (2015) reconstruction (r=0.33, Ebisuzaki p<0.001, Fig. S8a) and the Cook et al. (2019) reconstruction (r=0.29, Ebisuzaki p<0.01, Fig. S8d). Cross-wavelet comparisons showed non-stationary variability in the multidecadal to centennial band (Fig. S8b, e), and wavelet coherence showed enhanced variance at periods of ∼30–100 years, particularly during ca. 1200–1500 CE and post-1800 CE portions of the reconstructions (Fig. S8c, f). These intervals overlapped with periods of elevated multidecadal power in the single-series wavelet decompositions (Figs. 6, 8).
4.1 Regionally variable drivers of NAO-δ18Oprecip relationships in Europe
There is a clear imprint of the NAO on records in the Iso2k database. Opposing positive and negative correlations in northern Europe and southern Greenland, respectively, are consistent with the observed contrast in temperature and precipitation associated with the winter NAO (Fig. 1; Hernández et al., 2020). Correlations between the NAO and observed and modeled δ18Oprecip suggest that the temperature effect is a major control on these relationships, especially at high latitudes in western Greenland, northern Europe, and Scandinavia (Figs. 4, 5a). Specifically, warm air temperatures over northern Europe during a positive NAO cause weaker temperature-dependent Rayleigh fractionation during condensation and decreased rainout along the westerly path of distillation, while cool air temperatures during negative NAO cause stronger Rayleigh fractionation and increased rainout (Dansgaard, 1964), all of which should produce a positive δ18Oprecip/NAO relationship. However, temperature is clearly not the only mechanism by which the NAO influences δ18Oprecip. Globally, in locations where a precipitation “amount effect” is observed (particularly, though not exclusively, at low latitudes), the amount of precipitation is inversely correlated with δ18Oprecip (Nusbaumer et al., 2017). The NAO impacts precipitation amounts in both Europe and Greenland by redirecting storm tracks in the Atlantic (Hurrell, 1995; Hurrell and Deser, 2009; Woollings et al., 2010, 2018; Woollings and Blackburn, 2012). Unlike temperature, precipitation amount-driven impacts of the NAO would therefore yield a negative correlation with δ18Oprecip, with more negative δ18Oprecip in areas experiencing increased precipitation and vice versa; in this way, the precipitation amount effect opposes the temperature effect. In observations and in the iLME, negative NAO-precipitation amount correlations corresponded with positive NAO-δ18Oprecip correlations over the Azores, the subtropical Atlantic, and the tropical Pacific, consistent with an amount effect (Figs. 4, 5b). Changes in local precipitation amount as well as upstream fractionation during anomalous transport (Fig. 5c) can therefore explain the far reach of the NAO in these lower-latitude regions.
Interestingly, the NAO-δ18Oprecip correlation over Europe is uniformly positive, despite the canonical north-south contrast in the NAO's influence on temperature and precipitation (Fig. 5a–b). This likely reflects a latitudinal difference in the primary controls on δ18Oprecip, and thus the NAO-δ18Oprecip relationship, across the continent. A positive, direct relationship with temperature can explain NAO-driven δ18Oprecip in northern Europe and Scandinavia: Positive NAO phases bring warm conditions to this region, which translates to higher δ18Oprecip (Figs. 4, 5a). Conversely, the negative relationship with precipitation amount can explain NAO-driven δ18Oprecip in southern Europe. There, positive NAO phases reduce precipitation, resulting in higher δ18Oprecip values (Figs. 4, 5b). In both regions, therefore, positive (negative) NAO conditions produce higher (lower) δ18Oprecip values, resulting in a positive correlation between the NAO and δ18Oprecip across the continent. Previous studies have relied on north-south gradients in European precipitation to reconstruct the NAO (e.g., Trouet et al., 2009). While this is valid for precipitation-driven proxies, our results indicate that studies utilizing δ18Oprecip-based proxies must be careful to not presume a north-south gradient in δ18Oprecip, because the drivers of NAO-δ18Oprecip relationships are spatially variable across Europe.
4.2 NAO teleconnections with South and Central Asia
The positive correlations between the NAOVinther index and wood cellulose records from the Himalayas and Tibetan Plateau are strong enough that our NAO reconstructions perform best when they are included. We suggest that the winter NAO-δ18Owood relationship arises from the combined influence of temperature, precipitation, and changes in moisture source and transport as they are integrated across seasons in the wood cellulose. During winter, the westerlies intensify and flow south of the Tibetan Plateau, bringing moisture to the region from the eastern Mediterranean and western Central Asia (Liu et al., 2017; Schiemann et al., 2009). However, because the eastern Mediterranean and western Central Asia are less humid during positive NAO years, upstream winter IVT is weaker, bringing less winter moisture to the Himalayas and Tibetan Plateau from these distal, westerly moisture sources (Fig. S9). Compared with local sources, moisture imported from distal sources should have lower δ18O from rainout along the transport path. We speculate that the reduction in imported moisture during positive NAO years would result in higher δ18O of winter precipitation, contributing to positive correlations between the winter NAO and the δ18O in wood cellulose records over long timescales.
The Tibetan plateau generally lacks observational δ18Oprecip data that is long and continuous enough to rigorously evaluate the regional NAO-δ18Oprecip relationships, but one station from Lhasa with discontinuous coverage between 1994–2006 CE shows the NAO is significantly negatively correlated with winter temperature and significantly positively correlated with winter precipitation amount (Yao et al., 2013; Table S2). At Lhasa, colder winter temperatures are associated with more negative δ18Oprecip, whereas increased winter precipitation is associated with more positive δ18Oprecip (opposite to the traditional “amount effect”; Dansgaard, 1964) (Table S2). Thus, during the colder and wetter winters of positive NAO years, the competing influences on δ18Oprecip result in a weakly positive, though not significant, correlation between the winter NAO and δ18Oprecip. While additional, continuous station data would be required to better evaluate NAO-δ18Oprecip relationships in the Tibetan Plateau, multiple studies from central Asia have observed NAO correlations with δ18Owood (Liu et al., 2009, 2015; Xu et al., 2021, 2019), supporting the connection which we believe is best explained through moisture source and transport changes.
Like observations, the iLME also shows significant negative correlations between the NAO and precipitation to the northwest (upstream) of the Tibetan Plateau, suggesting drier upstream conditions during positive NAO years, as well as significant positive correlations with δ18Oprecip (Figs. 4, 5c). However, the relationship between the winter NAOiLME and surface air temperature over the Tibetan Plateau is opposite that of observations (Fig. 5a). The Himalayas and the Tibetan Plateau are notoriously challenging to resolve in lower-resolution climate models such as that used for the iLME, and contribute to large local biases in precipitation amount, seasonality, moisture source (Li et al., 2022; Lin et al., 2018), and winter δ18Oprecip (Gao et al., 2011). We must therefore use caution in interpreting the iLME results local to the Tibetan Plateau and ultimately suggest that reduced influx of depleted moisture from distal sources leads to overall higher δ18O values across the Tibetan Plateau during positive NAO years, contributing to the relationship observed in the wood cellulose δ18O records. Longer, continuous station data (>10 years) paired with higher-resolution simulations and proxy system models are needed to further test these mechanisms.
We note that these mechanisms are distinct from previous interpretations that the NAO-δ18Owood relationship arises from teleconnections between the summer NAO and the Indian Summer Monsoon (ISM) (Sano et al., 2013; Wernicke et al., 2017; Xu et al., 2018). The positive NAO-ISM teleconnection produces a negative NAO-δ18Owood relationship largely via the amount effect (Bamzai and Shukla, 1999; Rajeevan, 2002; Raman and Maliekal, 1985; Robock et al., 2003), which cannot explain the positive correlation that we observe. The positive winter NAOVinther-δ18Owood correlation that we observe, and the Lhasa station data suggest that central Asian δ18Oprecip increases following positive winter NAO (Figs. 1, 4). We therefore conclude that while the NAO-ISM teleconnection is important for summer δ18Oprecip, the winter NAO's influence on winter δ18Oprecip strongly influences δ18Owood in locations where snowmelt plays a substantial role during the growing season.
4.3 Low frequency variability in the NAO reconstructions
In our reconstruction, we see strong evidence for multidecadal variability of the NAO (Fig. 6a), which has previously been debated, but also that there is nonstationarity in its strength over the last millennium. Significant decadal and multidecadal variability persists during the Medieval Climate Anomaly (MCA) from ca. 1000–1250 CE and then weakens during the early Little Ice Age (LIA), especially between ca. 1300–1700 CE, before increasing again in the final 300 years of the millennium. We argue that water isotope-based proxy records used in our reconstruction integrate climate processes on broad spatiotemporal scales, and therefore are well-poised to capture decadal or longer scale signals that can be missed by proxy systems like tree ring width and density, which are more sensitive to local high frequency variability (Ault et al., 2013; Dee et al., 2017; Moerman et al., 2013).
The nonstationary multidecadal variability in our reconstruction is not simply an artifact of changing proxy types and locations through the last millennium. Changes in proxy types could in theory be particularly important after 1600 CE, when many wood cellulose records become available; wood cellulose records have been suggested as biased towards high-frequencies (Dee et al., 2017). However, multidecadal variability is also evident in the wavelet decompositions performed on proxy-specific NAO reconstructions (Fig. S5). Furthermore, the wood cellulose records that do have coverage between ca. 1150–1300 CE (Fig. S5b) also share the increased multidecadal variability reflected in the ice core-based (Fig. S5a) and full NAO reconstruction (Fig. 6a). Moreover, NAO variability is strong across scales during the MCA when changes in record availability are gradual, and, more generally, the timing of nonstationarity does not coincide with changes in record availability (Figs. 2b, 6a). Nevertheless, accumulating chronological uncertainty in layer-counted ice core records may contribute to the spectral characteristics of the reconstruction. As dating errors grow back in time, high-frequency variability may be slightly dampened and redistributed toward lower frequencies, potentially contributing to the reduced interannual power prior to ∼1700 CE (Fig. S5a).
Nonstationarity in the variability of the NAO across scales through the last millennium is also evident in other NAO reconstructions, but the robustness of low frequency variability has been debated. Landmark reconstructions including Ortega et al. (2015) and Trouet et al. (2009) showed extensive low frequency variability throughout the last millennium (e.g. Fig. 8a, b), while Cook et al. (2002, 2019) argued that NAO variability during the last millennium is more consistent with “white noise”. That said, closer inspection of the power spectrum presented in Cook et al. (2019) also shows similar nonstationarity to our NAO reconstruction, with high spectral power in multidecadal bands during the MCA (ca. 950–1300 CE), which then decreases during the mid-millennium and LIA (Fig. 8c).
Significant decadal variability is present in both the instrumental NAOVinther index and the NAO reconstructions, especially for Iso2k and Cook et al. (2019) (Fig. 7a, c). The weaker, non-significant correlation with Ortega et al. (2015) likely results from the shorter overlap and pronounced divergence from the instrumental record after ca. 1960 CE (Fig. 7b). Over the last millennium the decadally smoothed series and individual wavelet analyses show moderate correspondence at decadal to centennial timescales, particularly during intervals of enhanced variance such as the MCA, indicating that the Iso2k NAO as well as the Ortega et al. (2015) and Cook et al. (2019) reconstructions capture similar low-frequency behavior (Figs. 6, 8). Notably, the cross-wavelet power and wavelet coherence analyses share strong signals in the multidecadal to centennial bands during the early millennium and the MCA, highlighting the shared signal across reconstructions at that time (Fig. S8b–f). However, this relationship is nonstationary, with significant coherence occurring only intermittently in time and across limited frequency bands. This highlights variability in the phase and amplitude relationships between reconstructions and through time, which is unsurprising given the differences in proxy networks, reconstruction methods, and chronological uncertainties. In this context, the wavelet coherence results should be interpreted as evidence for a temporally evolving relationship between reconstructions.
All of the reconstructions included here agree that the low-frequency variability in the NAO may be inherently nonstationary. We hypothesize that it arises from the NAO's interactions with changing latitudinal gradients in Northern Hemisphere temperature, and specifically in the state of the Atlantic Ocean. Latitudinal gradients in sea surface temperature between the tropical and high latitude North Atlantic determine the strength and position of the Azores High and Icelandic Low. Warmer Northern Hemisphere temperatures during the MCA, for example, corresponded with a weakened latitudinal temperature gradient (Li et al., 2013), which may have enhanced decadal to multidecadal variability in the NAO (e.g., Wang et al., 2017). More broadly, it is difficult to reconcile climate shifts across Europe and North America between the MCA and LIA (Edwards et al., 2017; Goosse et al., 2012), and explanations often invoke minor changes in solar and volcanic forcing that were then amplified by internal variability (Goosse et al., 2005; Graham et al., 2011). Better understanding the role for these forcings in multidecadal variability of the NAO, and its nonstationarity from the MCA to LIA, should be a priority (Birkel et al., 2018; Fernandez et al., 2025; Otterå et al., 2010).
It should be noted that the mechanisms underlying climate variability during the majority of the last millennium are quite different from those responsible for modern anthropogenic climate change (Goosse et al., 2012), as the magnitude of anthropogenic greenhouse gas forcing far outweighs the magnitude of natural forcings (Kuzmina et al., 2005; Stephenson et al., 2006). The positive trend and increase in significant spectral power across interannual, decadal, multidecadal, and centennial timescales in the industrial era of our reconstruction are suggestive of amplification of variability in Northern Hemisphere atmospheric circulation as a response to anthropogenic climate change (Gillett et al., 2002, 2003; Moore et al., 2017).
The multidecadal variability in the proxy reconstruction is not reproduced in the pseudo-reconstruction of the NAO derived from the iCESM iLME simulations. This discrepancy aligns with previously documented mismatches between the spectral characteristics of model simulations and those of proxies (Ault et al., 2013; Dee et al., 2017; Franke et al., 2013). Recent work does find multidecadal variability in a spectral analysis of the North Atlantic region in the Last Millennium Ensemble, though high power at multidecadal timescales was limited to periods with major volcanic eruptions and absent from purely internal variability (Fernandez et al., 2025). The fundamental cause of this discrepancy between reconstructions and models – whether due to inherent biases in the models, limitations of the proxies themselves, or a combination of both – remains unresolved.
Water isotope-based proxies capture the broad range of spatial and temporal impacts of the NAO because they integrate temperature responses across Greenland and Northern Europe, local precipitation amount responses over the Iberian Peninsula and Southern Europe, and moisture source and transport responses in teleconnected regions like South Asia. These relationships explain the skill of our water isotope-based NAO reconstruction, especially when leveraging proxy data from teleconnected regions outside the North Atlantic such as Asia. Our NAO reconstruction reveals strong but nonstationary multidecadal variability across much of the last millennium, which is also present in other independent reconstructions of the NAO, and future work should evaluate the mechanisms by which external and internal mechanisms affect the timescales of variability in the NAO. Importantly, iCESM (like other models) underestimates the NAO variability on multidecadal timescales in the reconstruction, suggesting that multidecadal variability could also be underestimated in projections of future climate change. Accounting for low-frequency variability in the NAO as illustrated here will be critical for assessing the risk of NAO impacts to temperature and precipitation across the North Atlantic region in the future.
Data used in this study are publicly available. The Iso2k database is available in R, Matlab, and Python serializations at https://lipdverse.org/iso2k/current_version/ (last access: February 2023). The GNIP data are available at https://www.iaea.org/services/networks/gnip (last access: February 2023). The iCESM Last Millennium Ensemble members are available at https://gdex.ucar.edu/ (last access: February 2023).
The supplement related to this article is available online at https://doi.org/10.5194/cp-22-1423-2026-supplement.
AAF, BLK, and SC conceptualized the research. AAF performed technical analysis, visualization, and original draft writing. BLK and SC provided supervision, conceptualization, methodology, writing review and editing. BLK contributed the funding sources.
The contact author has declared that none of the authors has any competing interests.
Publisher's note: Copernicus Publications remains neutral with regard to jurisdictional claims made in the text, published maps, institutional affiliations, or any other geographical representation in this paper. The authors bear the ultimate responsibility for providing appropriate place names. Views expressed in the text are those of the authors and do not necessarily reflect the views of the publisher.
We acknowledge the CESM1 (CAM5) Last Millennium Ensemble Community Project and supercomputing resources provided by NSF/CISL/Yellowstone. We also thank Georgy Falster (Australian National University, Australia) and Alex Thompson (Washington University in St. Louis, USA) for help with data acquisition and analysis.
This research has been supported by the David and Lucile Packard Foundation (Fellowship in Science and Engineering to B. Konecky grant) and the National Science Foundation (grant no. NSF-AGS1805141).
This paper was edited by Francesco Muschitiello and reviewed by Jesper Sjolte and one anonymous referee.
Adolphi, F. and Muscheler, R.: Synchronizing the Greenland ice core and radiocarbon timescales over the Holocene – Bayesian wiggle-matching of cosmogenic radionuclide records, Clim. Past, 12, 15–30, https://doi.org/10.5194/cp-12-15-2016, 2016.
Alley, W. M.: The Palmer Drought Severity Index: Limitations and Assumptions, J. Climate Appl. Meteor., 23, 1100–1109, https://doi.org/10.1175/1520-0450(1984)023<1100:TPDSIL>2.0.CO;2, 1984.
Ault, T. R., Cole, J. E., Overpeck, J. T., Pederson, G. T., St. George, S., Otto-Bliesner, B., Woodhouse, C. A., and Deser, C.: The Continuum of Hydroclimate Variability in Western North America during the Last Millennium, J. Climate, 26, 5863–5878, https://doi.org/10.1175/JCLI-D-11-00732.1, 2013.
Baldini, L. M., McDermott, F., Foley, A. M., and Baldani, J. U. L.: Spatial variability in the European winter precipitation δ 18O-NAO relationship: Implications for reconstructing NAO-mode climate variability in the Holocene, Geophys. Res. Lett., 35, https://doi.org/10.1029/2007GL032027, 2008.
Bamzai, A. S. and Shukla, J.: Relation between Eurasian snow cover, snow depth, and the Indian summer monsoon: An observational study, J. Climate, 12, 3117–3132, https://doi.org/10.1175/1520-0442(1999)012<3117:RBESCS>2.0.CO;2, 1999.
Birkel, S. D., Mayewski, P. A., Maasch, K. A., Kurbatov, A. V., and Lyon, B.: Evidence for a volcanic underpinning of the Atlantic multidecadal oscillation, npj Clim. Atmos. Sci., 1, 24, https://doi.org/10.1038/s41612-018-0036-6, 2018.
Bowen, G. J., Cai, Z., Fiorella, R. P., and Putman, A. L.: Isotopes in the Water Cycle: Regional- to Global-Scale Patterns and Applications, Annu. Rev. Earth Planet. Sci., 47, 453–479, https://doi.org/10.1146/annurev-earth-053018-060220, 2019.
Brady, E., Stevenson, S., Bailey, D., Liu, Z., Noone, D., Nusbaumer, J., Otto-Bliesner, B. L., Tabor, C., Tomas, R., Wong, T., Zhang, J., and Zhu, J.: The Connected Isotopic Water Cycle in the Community Earth System Model Version 1, J. Adv. Model. Earth Syst., 11, 2547–2566, https://doi.org/10.1029/2019MS001663, 2019.
Brittingham, A., Petrosyan, Z., Hepburn, J. C., Richards, M. P., Hren, M. T., and Hartman, G.: Influence of the North Atlantic Oscillation on δD and δ18O in meteoric water in the Armenian Highland, J. Hydrol., 575, 513–522, https://doi.org/10.1016/j.jhydrol.2019.05.064, 2019.
Casanueva, A., Rodríguez-Puebla, C., Frías, M. D., and González-Reviriego, N.: Variability of extreme precipitation over Europe and its relationships with teleconnection patterns, Hydrol. Earth Syst. Sci., 18, 709–725, https://doi.org/10.5194/hess-18-709-2014, 2014.
Comas-Bru, L., McDermott, F., and Werner, M.: The effect of the East Atlantic pattern on the precipitation δ18O-NAO relationship in Europe, Clim. Dynam., 47, 2059–2069, https://doi.org/10.1007/s00382-015-2950-1, 2016.
Compo, G. P., Whitaker, J. S., Sardeshmukh, P. D., Matsui, N., Allan, R. J., Yin, X., Gleason, B. E., Vose, R. S., Rutledge, G., Bessemoulin, P., Brönnimann, S., Brunet, M., Crouthamel, R. I., Grant, A. N., Groisman, P. Y., Jones, P. D., Kruk, M. C., Kruger, A. C., Marshall, G. J., Maugeri, M., Mok, H. Y., Nordli, Ø., Ross, T. F., Trigo, R. M., Wang, X. L., Woodruff, S. D., and Worley, S. J.: The Twentieth Century Reanalysis Project, Quart. J. Royal Meteoro. Soc., 137, 1–28, https://doi.org/10.1002/qj.776, 2011.
Cook, E. R., D'Arrigo, R. D., and Mann, M. E.: A well-verified, multiproxy reconstruction of the winter North Atlantic Oscillation index since A.D. 1400, J. Climate, 15, 1754–1764, https://doi.org/10.1175/1520-0442(2002)015<1754:AWVMRO>2.0.CO;2, 2002.
Cook, E. R., Kushnir, Y., Smerdon, J. E., Williams, A. P., Anchukaitis, K. J., and Wahl, E. R.: A Euro-Mediterranean tree-ring reconstruction of the winter NAO index since 910 C.E., Clim. Dynam., 53, 1567–1580, https://doi.org/10.1007/s00382-019-04696-2, 2019.
Dansgaard, W.: Stable isotopes in precipitation, Tellus, 16, 436–468, https://doi.org/10.3402/tellusa.v16i4.8993, 1964.
Dee, S. G., Parsons, L. A., Loope, G. R., Overpeck, J. T., Ault, T. R., and Emile-Geay, J.: Improved spectral comparisons of paleoclimate models and observations via proxy system modeling: Implications for multi-decadal variability, Earth Planet. Sci. Lett., 476, 34–46, https://doi.org/10.1016/j.epsl.2017.07.036, 2017.
Deininger, M., Werner, M., and McDermott, F.: North Atlantic Oscillation controls on oxygen and hydrogen isotope gradients in winter precipitation across Europe; implications for palaeoclimate studies, Clim. Past, 12, 2127–2143, https://doi.org/10.5194/cp-12-2127-2016, 2016.
Ebisuzaki, W.: A Method to Estimate the Statistical Significance of a Correlation When the Data Are Serially Correlated, J. Climate, 10, 2147–2153, https://doi.org/10.1175/1520-0442(1997)010<2147:AMTETS>2.0.CO;2, 1997.
Edwards, T. W. D., Hammarlund, D., Newton, B. W., Sjolte, J., Linderson, H., Sturm, C., St. Amour, N. A., Bailey, J. N.-L., and Nilsson, A. L.: Seasonal variability in Northern Hemisphere atmospheric circulation during the Medieval Climate Anomaly and the Little Ice Age, Quaternary Sci. Rev., 165, 102–110, https://doi.org/10.1016/j.quascirev.2017.04.018, 2017.
Falster, G., Konecky, B., Coats, S., and Stevenson, S.: Forced changes in the Pacific Walker circulation over the past millennium, Nature, 622, 93–100, https://doi.org/10.1038/s41586-023-06447-0, 2023.
Felis, T., Pätzold, J., Loya, Y., Fine, M., Nawar, A. H., and Wefer, G.: A coral oxygen isotope record from the northern Red Sea documenting NAO, ENSO, and North Pacific teleconnections on Middle East climate variability since the year 1750, Paleoceanography, 15, 679–694, https://doi.org/10.1029/1999PA000477, 2000.
Fernandez, A., Steinman, B. A., Mann, M. E., and Christiansen, S. A.: Multidecadal Temperature Variability in the Community Earth System Model Last Millennium Ensemble, Geophys. Res. Lett., 52, e2024GL113393, https://doi.org/10.1029/2024GL113393, 2025.
Franke, J., Frank, D., Raible, C. C., Esper, J., and Brönnimann, S.: Spectral biases in tree-ring climate proxies, Nat. Clim. Change, 3, 360–364, https://doi.org/10.1038/nclimate1816, 2013.
Galewsky, J., Steen-Larsen, H. C., Field, R. D., Worden, J., Risi, C., and Schneider, M.: Stable isotopes in atmospheric water vapor and applications to the hydrologic cycle, Rev. Geophys., 54, 809–865, https://doi.org/10.1002/2015RG000512, 2016.
Gao, J., Masson-Delmotte, V., Yao, T., Tian, L., Risi, C., and Hoffmann, G.: Precipitation Water Stable Isotopes in the South Tibetan Plateau: Observations and Modeling*, J. Climate, 24, 3161–3178, https://doi.org/10.1175/2010JCLI3736.1, 2011.
Gillett, N. P., Allen, M. R., McDonald, R. E., Senior, C. A., Shindell, D. T., and Schmidt, G. A.: How linear is the Arctic Oscillation response to greenhouse gases?, J. Geophys. Res., 107, https://doi.org/10.1029/2001JD000589, 2002.
Gillett, N. P., Graf, H. F., and Osborn, T. J.: Climate change and the North Atlantic Oscillation, in: Geophysical Monograph Series, vol. 134, edited by: Hurrell, J. W., Kushnir, Y., Ottersen, G., and Visbeck, M., American Geophysical Union, Washington, D. C., 193–209, https://doi.org/10.1029/134GM09, 2003.
Goosse, H., Renssen, H., Timmermann, A., and Bradley, R. S.: Internal and forced climate variability during the last millennium: a model-data comparison using ensemble simulations, Quaternary Sci. Rev., 24, 1345–1360, https://doi.org/10.1016/j.quascirev.2004.12.009, 2005.
Goosse, H., Crespin, E., Dubinkina, S., Loutre, M.-F., Mann, M. E., Renssen, H., Sallaz-Damaz, Y., and Shindell, D.: The role of forcing and internal dynamics in explaining the “Medieval Climate Anomaly,”, Clim. Dyn., 39, 2847–2866, https://doi.org/10.1007/s00382-012-1297-0, 2012.
Graham, N. E., Ammann, C. M., Fleitmann, D., Cobb, K. M., and Luterbacher, J.: Support for global climate reorganization during the “Medieval Climate Anomaly”, Clim. Dyn., 37, 1217–1245, https://doi.org/10.1007/s00382-010-0914-z, 2011.
Hernández, A., Sánchez-López, G., Pla-Rabes, S., Comas-Bru, L., Parnell, A., Cahill, N., Geyer, A., Trigo, R. M., and Giralt, S.: A 2,000-year Bayesian NAO reconstruction from the Iberian Peninsula, Sci. Rep., 10, 1–15, https://doi.org/10.1038/s41598-020-71372-5, 2020.
Hurrell, J. W.: Decadal Trends in the North Atlantic Oscillation: Regional Temperatures and Precipitation, Science, 269, 676–679, 1995.
Hurrell, J. W. and Deser, C.: North Atlantic climate variability: The role of the North Atlantic Oscillation, J. Mar. Syst., 78, 28–41, https://doi.org/10.1016/j.jmarsys.2008.11.026, 2009.
IAEA/WMO: Global network of isotopes in precipitation (GNIP), https://nucleus.iaea.org/wiser, last accessed: February 2023.
Isaksson, E., Divine, D., Kohler, J., Martma, T., Pohjola, V., Motoyama, H., and Watanabe, O.: Climate oscillations as recorded in svalbard ice core ω18o records between ad 1200 and 1997, Geogr. Ann. A, 87, 203–214, https://doi.org/10.1111/j.0435-3676.2005.00253.x, 2005.
Jones, P. D., Jonsson, T., and Wheeler, D.: Extension to the North Atlantic Oscillation using early instrumental pressure observations from gibraltar and south-west Iceland, Int. J. Climatol., 17, 1433–1450, https://doi.org/10.1002/(sici)1097-0088(19971115)17:13<1433::aid-joc203>3.3.co;2-g, 1997.
Konecky, B. L., McKay, N. P., Churakova (Sidorova), O. V., Comas-Bru, L., Dassié, E. P., DeLong, K. L., Falster, G. M., Fischer, M. J., Jones, M. D., Jonkers, L., Kaufman, D. S., Leduc, G., Managave, S. R., Martrat, B., Opel, T., Orsi, A. J., Partin, J. W., Sayani, H. R., Thomas, E. K., Thompson, D. M., Tyler, J. J., Abram, N. J., Atwood, A. R., Cartapanis, O., Conroy, J. L., Curran, M. A., Dee, S. G., Deininger, M., Divine, D. V., Kern, Z., Porter, T. J., Stevenson, S. L., von Gunten, L., and Iso2k Project Members: The Iso2k database: a global compilation of paleo-δ18O and δ2H records to aid understanding of Common Era climate, Earth Syst. Sci. Data, 12, 2261–2288, https://doi.org/10.5194/essd-12-2261-2020, 2020.
Konecky, B. L., McKay, N. P., Falster, G. M., Stevenson, S. L., Fischer, M. J., Atwood, A. R., Thompson, D. M., Jones, M. D., Tyler, J. J., DeLong, K. L., Martrat, B., Thomas, E. K., Conroy, J. L., Dee, S. G., Jonkers, L., Churakova, O. V., Kern, Z., Opel, T., Porter, T. J., Sayani, H. R., Skrzypek, G., Iso2k Project Members, Abram, N. J., Braun, K., Carré, M., Cartapanis, O., Comas-Bru, L., Curran, M. A., Dassié, E. P., Deininger, M., Divine, D. V., Incarbona, A., Kaufman, D. S., Kaushal, N., Klaebe, R. M., Kolus, H. R., Leduc, G., Managave, S. R., Mortyn, P. G., Moy, A. D., Orsi, A. J., Partin, J. W., Roop, H. A., Sicre, M.-A., Von Gunten, L., and Yoshimura, K.: Globally coherent water cycle response to temperature change during the past two millennia, Nat. Geosci., 16, 997–1004, https://doi.org/10.1038/s41561-023-01291-3, 2023.
Kozachek, A., Mikhalenko, V., Masson-Delmotte, V., Ekaykin, A., Ginot, P., Kutuzov, S., Legrand, M., Lipenkov, V., and Preunkert, S.: Large-scale drivers of Caucasus climate variability in meteorological records and Mt El'brus ice cores, Clim. Past, 13, 473–489, https://doi.org/10.5194/cp-13-473-2017, 2017.
Kuhnert, H., Crüger, T., and Pätzold, J.: NAO signature in a Bermuda coral Sr/Ca record, Geochem. Geophys. Geosyst., 6, https://doi.org/10.1029/2004GC000786, 2005.
Kuzmina, S. I., Bengtsson, L., Johannessen, O. M., Drange, H., Bobylev, L. P., and Miles, M. W.: The North Atlantic Oscillation and greenhouse-gas forcing, Geophys. Res. Lett., 32, 2004GL021064, https://doi.org/10.1029/2004GL021064, 2005.
Langebroek, P. M., Werner, M., and Lohmann, G.: Climate information imprinted in oxygen-isotopic composition of precipitation in Europe, Earth Planet. Sci. Lett., 311, 144–154, https://doi.org/10.1016/j.epsl.2011.08.049, 2011.
Lehner, F., Raible, C. C., and Stocker, T. F.: Testing the robustness of a precipitation proxy-based North Atlantic Oscillation reconstruction, Quaternary Sci. Rev., 45, 85–94, https://doi.org/10.1016/j.quascirev.2012.04.025, 2012.
Li, G., Chen, H., Xu, M., Zhao, C., Zhong, L., Li, R., Fu, Y., and Gao, Y.: Impacts of Topographic Complexity on Modeling Moisture Transport and Precipitation over the Tibetan Plateau in Summer, Adv. Atmos. Sci., 39, 1151–1166, https://doi.org/10.1007/s00376-022-1409-7, 2022.
Li, J., Sun, C., and Jin, F. F.: NAO implicated as a predictor of Northern Hemisphere mean temperature multidecadal variability, Geophys. Res. Lett., 40, 5497–5502, https://doi.org/10.1002/2013GL057877, 2013.
Lin, C., Chen, D., Yang, K., and Ou, T.: Impact of model resolution on simulating the water vapor transport through the central Himalayas: implication for models' wet bias over the Tibetan Plateau, Clim. Dyn., 51, 3195–3207, https://doi.org/10.1007/s00382-018-4074-x, 2018.
Liu, H., Liu, X., and Dong, B.: Intraseasonal variability of winter precipitation over central asia and the western tibetan plateau from 1979 to 2013 and its relationship with the North Atlantic Oscillation, Dyn. Atmos. Oceans, 79, 31–42, https://doi.org/10.1016/j.dynatmoce.2017.07.001, 2017.
Liu, X., Shao, X., Liang, E., Chen, T., Qin, D., An, W., Xu, G., Sun, W., and Wang, Y.: Climatic significance of tree-ring δ18O in the Qilian Mountains, northwestern China and its relationship to atmospheric circulation patterns, Chem. Geol., 268, 147–154, https://doi.org/10.1016/j.chemgeo.2009.08.005, 2009.
Liu, X., An, W., Treydte, K., Wang, W., Xu, G., Zeng, X., Wu, G., Wang, B., and Zhang, X.: Pooled versus separate tree-ring δD measurements, and implications for reconstruction of the Arctic Oscillation in northwestern China, Sci. Total Environ., 511, 584–594, https://doi.org/10.1016/j.scitotenv.2015.01.002, 2015.
Liu, Y., Chen, H., Wang, H., and Qiu, Y.: The Impact of the NAO on the Delayed Break-Up Date of Lake Ice over the Southern Tibetan Plateau, J. Climate, 31, 9073–9086, https://doi.org/10.1175/JCLI-D-18-0197.1, 2018.
Mann, M. E.: Climate Over the Past Two Millennia, Annu. Rev. Earth Planet. Sci., 35, 111–136, https://doi.org/10.1146/annurev.earth.35.031306.140042, 2007.
Mann, M. E., Zhang, Z., Hughes, M. K., Bradley, R. S., Miller, S. K., Rutherford, S., and Ni, F.: Proxy-based reconstructions of hemispheric and global surface temperature variations over the past two millennia, P. Natl. Acad. Sci. USA, 105, 13252–13257, https://doi.org/10.1073/pnas.0805721105, 2008.
Mckay, N., Emile-geay, J., and Khider, D.: GeoChronR – an R package to model , analyze and visualize age-uncertain paleoscientific data, Geochronol. Discussions, 1–33, 2020.
Meyers, S. R.: Seeing red in cyclic stratigraphy: Spectral noise estimation for astrochronology, Paleoceanography, 27, 1–12, https://doi.org/10.1029/2012PA002307, 2012.
Michel, S., Swingedouw, D., Chavent, M., Ortega, P., Mignot, J., and Khodri, M.: Reconstructing climatic modes of variability from proxy records using ClimIndRec version 1.0, Geosci. Model Dev., 13, 841–858, https://doi.org/10.5194/gmd-13-841-2020, 2020.
Moerman, J. W., Cobb, K. M., Adkins, J. F., Sodemann, H., Clark, B., and Tuen, A. A.: Diurnal to interannual rainfall δ18O variations in northern Borneo driven by regional hydrology, Earth Planet. Sci. Lett., 369–370, 108–119, https://doi.org/10.1016/j.epsl.2013.03.014, 2013.
Moore, G. W. K., Halfar, J., Majeed, H., Adey, W., and Kronz, A.: Amplification of the Atlantic Multidecadal Oscillation associated with the onset of the industrial-era warming, Sci. Rep., 7, 40861, https://doi.org/10.1038/srep40861, 2017.
Neukom, R., Gergis, J., Karoly, D. J., Wanner, H., Curran, M., Elbert, J., González-Rouco, F., Linsley, B. K., Moy, A. D., Mundo, I., Raible, C. C., Steig, E. J., Van Ommen, T., Vance, T., Villalba, R., Zinke, J., and Frank, D.: Inter-hemispheric temperature variability over the past millennium, Nat. Clim. Change, 4, 362–367, https://doi.org/10.1038/nclimate2174, 2014.
Nusbaumer, J., Wong, T. E., Bardeen, C., and Noone, D.: Evaluating hydrological processes in the Community Atmosphere Model Version 5 (CAM5) using stable isotope ratios of water, J. Adv. Model Earth Syst., 9, 949–977, https://doi.org/10.1002/2016MS000839, 2017.
Ortega, P., Lehner, F., Swingedouw, D., Masson-Delmotte, V., Raible, C. C., Casado, M., and Yiou, P.: A model-tested North Atlantic Oscillation reconstruction for the past millennium, Nature, 523, 71–74, https://doi.org/10.1038/nature14518, 2015.
Otterå, O. H., Bentsen, M., Drange, H., and Suo, L.: External forcing as a metronome for Atlantic multidecadal variability, Nat. Geosci., 3, 688–694, https://doi.org/10.1038/ngeo955, 2010.
PAGES 2k Consortium: Consistent multidecadal variability in global temperature reconstructions and simulations over the Common Era, Nat. Geosci., 12, 643–649, https://doi.org/10.1038/s41561-019-0400-0, 2019.
Pearson, K.: On lines and planes of closest fit to systems of points in space, The London, Edinburgh, and Dublin Philosophical Magazine and Journal of Science, 2, 559–572, https://doi.org/10.1080/14786440109462720, 1901.
Puntsag, T., Mitchell, M. J., Campbell, J. L., Klein, E. S., Likens, G. E., and Welker, J. M.: Arctic Vortex changes alter the sources and isotopic values of precipitation in northeastern US, Sci. Rep., 6, 1–9, https://doi.org/10.1038/srep22647, 2016.
Putman, A. L. and Bowen, G. J.: Technical Note: A global database of the stable isotopic ratios of meteoric and terrestrial waters, Hydrol. Earth Syst. Sci., 23, 4389–4396, https://doi.org/10.5194/hess-23-4389-2019, 2019.
Rajeevan, M.: Winter surface pressure anomalies over Eurasia and Indian summer monsoon, Geophys. Res. Lett., 29, 941–944, https://doi.org/10.1029/2001GL014363, 2002.
Raman, C. R. V. and Maliekal, J. A.: A “northern oscillation” relating northern hemispheric pressure anomalies and the Indian summer monsoon?, Nature, 314, 430–432, https://doi.org/10.1038/314430a0, 1985.
Robock, A., Mu, M., Vinnikov, K., and Robinson, D.: Land surface conditions over Eurasia and Indian summer monsoon rainfall, J. Geophys. Res.-Atmos., 108, https://doi.org/10.1029/2002jd002286, 2003.
Roesch, A. and Schmidbaur, H.: WaveletComp: Computational Wavelet Analysis. R package version 1.1, CRAN [code], https://doi.org/10.32614/CRAN.package.WaveletComp, 2018.
Rozanski, K., Araguás-Araguás, L., and Gonfiantini, R.: Isotopic Patterns in Modern Global Precipitation, Geophys. Monogr., 78, 1–37, https://doi.org/10.1029/GM078p0001, 1993.
Sánchez-López, G., Hernández, A., Pla-Rabes, S., Trigo, R. M., Toro, M., Granados, I., Sáez, A., Masqué, P., Pueyo, J. J., Rubio-Inglés, M. J., and Giralt, S.: Climate reconstruction for the last two millennia in central Iberia: The role of East Atlantic (EA), North Atlantic Oscillation (NAO) and their interplay over the Iberian Peninsula, Quaternary Sci. Rev., 149, 135–150, https://doi.org/10.1016/j.quascirev.2016.07.021, 2016.
Sano, M., Tshering, P., Komori, J., Fujita, K., Xu, C., and Nakatsuka, T.: May–September precipitation in the Bhutan Himalaya since 1743 as reconstructed from tree ring cellulose δ18 O, J. Geophys. Res.-Atmos., 118, 8399–8410, https://doi.org/10.1002/jgrd.50664, 2013.
Schiemann, R., Lüthi, D., and Schär, C.: Seasonality and interannual variability of the westerley jet in the Tibetan Plateau region, J. Climate, 22, 2940–2957, https://doi.org/10.1175/2008JCLI2625.1, 2009.
Schmutz, C., Luterbacher, J., Gyalistras, D., Xoplaki, E., and Wanner, H.: Can we trust proxy-based NAO index reconstructions?, Geophys. Res. Lett., 27, 1135–1138, https://doi.org/10.1029/1999GL011045, 2000.
Sinnl, G., Adolphi, F., Christl, M., Welten, K. C., Woodruff, T., Caffee, M., Svensson, A., Muscheler, R., and Rasmussen, S. O.: Synchronizing ice-core and timescales in the Last Glacial Maximum using Hulu Cave 14C and new 10Be measurements from Greenland and Antarctica, Clim. Past, 19, 1153–1175, https://doi.org/10.5194/cp-19-1153-2023, 2023.
Sjolte, J., Sturm, C., Adolphi, F., Vinther, B. M., Werner, M., Lohmann, G., and Muscheler, R.: Solar and volcanic forcing of North Atlantic climate inferred from a process-based reconstruction, Clim. Past, 14, 1179–1194, https://doi.org/10.5194/cp-14-1179-2018, 2018.
Sjolte, J., Adolphi, F., Vinther, B. M., Muscheler, R., Sturm, C., Werner, M., and Lohmann, G.: Seasonal reconstructions coupling ice core data and an isotope-enabled climate model – methodological implications of seasonality, climate modes and selection of proxy data, Clim. Past, 16, 1737–1758, https://doi.org/10.5194/cp-16-1737-2020, 2020.
Sodemann, H., Schwierz, C., and Wernli, H.: Interannual variability of Greenland winter precipitation sources: Lagrangian moisture diagnostic and North Atlantic Oscillation influence, J. Geophys. Res.-Atmos., 113, 1–17, https://doi.org/10.1029/2007JD008503, 2008.
Sorrel, P., Popescu, S. M., Klotz, S., Suc, J. P., and Oberhänsli, H.: Climate variability in the Aral Sea basin (Central Asia) during the late Holocene based on vegetation changes, Quaternary Res., 67, 357–370, https://doi.org/10.1016/j.yqres.2006.11.006, 2007.
Stephenson, D. B., Pavan, V., Collins, M., Junge, M. M., Quadrelli, R., and Participating CMIP2 Modelling Groups: North Atlantic Oscillation response to transient greenhouse gas forcing and the impact on European winter climate: a CMIP2 multi-model assessment, Clim. Dyn., 27, 401–420, https://doi.org/10.1007/s00382-006-0140-x, 2006.
Thomson, D. J.: Spectrum Estimation and Harmonic Analysis, Proceedings of the IEEE, 70, 1055–1096, https://doi.org/10.1109/PROC.1982.12433, 1982.
Trigo, R., Osborn, T., and Corte-Real, J.: The North Atlantic Oscillation influence on Europe: climate impacts and associated physical mechanisms, Clim. Res., 20, 9–17, https://doi.org/10.3354/cr020009, 2002.
Trouet, V., Esper, J., Graham, N. E., Baker, A., Scourse, J. D., and Frank, D. C.: Persistent Positive North Atlantic Oscillation Mode Dominated the Medieval Climate Anomaly, Science, 324, 78–80, https://doi.org/10.1126/science.1166349, 2009.
Vachon, R. W., Welker, J. M., White, J. W. C., and Vaughn, B. H.: Moisture source temperatures and precipitation δ18O- temperature relationships across the United States, Water Resour. Res., 46, 1–14, https://doi.org/10.1029/2009WR008558, 2010.
Villarini, G., Smith, J. A., Ntelekos, A. A., and Schwarz, U.: Annual maximum and peaks-over-threshold analyses of daily rainfall accumulations for Austria, J. Geophys. Res.-Atmos., 116, 1–15, https://doi.org/10.1029/2010JD015038, 2011.
Vinther, B. M., Andersen, K. K., Hansen, A. W., Schmith, T., and Jones, P. D.: Improving the Gibraltar/Reykjavik NAO index, Geophys. Res. Lett., 30, 1–4, https://doi.org/10.1029/2003GL018220, 2003a.
Vinther, B. M., Johnsen, S. J., Andersen, K. K., Clausen, H. B., and Hansen, A. W.: NAO signal recorded in the stable isotopes of Greenland ice cores, Geophys. Res. Lett., 30, 2002GL016193, https://doi.org/10.1029/2002GL016193, 2003b.
Vuille, M. and Werner, M.: Stable isotopes in precipitation recording South American summer monsoon and ENSO variability: Observations and model results, Clim. Dynam., 25, 401–413, https://doi.org/10.1007/s00382-005-0049-9, 2005.
Wang, Z., Duan, A., Yang, S., and Ullah, K.: Atmospheric moisture budget and its regulation on the variability of summer precipitation over the tibetan plateau, J. Geophys. Res., 122, 614–630, https://doi.org/10.1002/2016JD025515, 2017.
Wernicke, J., Hochreuther, P., Grießinger, J., Zhu, H., Wang, L., and Bräuning, A.: Multi-century humidity reconstructions from the southeastern Tibetan Plateau inferred from tree-ring δ18O, Global Planet. Change, 149, 26–35, https://doi.org/10.1016/j.gloplacha.2016.12.013, 2017.
Woollings, T. and Blackburn, M.: The north Atlantic jet stream under climate change and its relation to the NAO and EA patterns, J. Climate, 25, 886–902, https://doi.org/10.1175/JCLI-D-11-00087.1, 2012.
Woollings, T., Hannachi, A., and Hoskins, B.: Variability of the North Atlantic eddy-driven jet stream, Q. J. Roy. Meteorol. Soc., 136, 856–868, https://doi.org/10.1002/qj.625, 2010.
Woollings, T., Franzke, C., Hodson, D. L. R., Dong, B., Barnes, E. A., Raible, C. C., and Pinto, J. G.: Contrasting interannual and multidecadal NAO variability, Clim. Dynam., 45, 539–556, https://doi.org/10.1007/s00382-014-2237-y, 2015.
Woollings, T., Barnes, E., Hoskins, B., Kwon, Y. O., Lee, R. W., Li, C., Madonna, E., McGraw, M., Parker, T., Rodrigues, R., Spensberger, C., and Williams, K.: Daily to decadal modulation of jet variability, J. Climate, 31, 1297–1314, https://doi.org/10.1175/JCLI-D-17-0286.1, 2018.
Xiaoge, X., Zhou, T., and Yu, R.: Increased Tibetan Plateau snow depth: An indicator of the connection between enhanced winter NAO and late-spring tropospheric cooling over East Asia, Adv. Atmos. Sci., 27, 788–794, https://doi.org/10.1007/s00376-009-9071-x, 2010.
Xu, C., Sano, M., Dimri, A. P., Ramesh, R., Nakatsuka, T., Shi, F., and Guo, Z.: Decreasing Indian summer monsoon on the northern Indian sub-continent during the last 180 years: evidence from five tree-ring cellulose oxygen isotope chronologies, Clim. Past, 14, 653–664, https://doi.org/10.5194/cp-14-653-2018, 2018.
Xu, C., Zhao, Q., An, W., Wang, S., Tan, N., Sano, M., Nakatsuka, T., Borhara, K., and Guo, Z.: Tree-ring oxygen isotope across monsoon Asia: Common signal and local influence, Quaternary Sci. Rev., 269, 107156, https://doi.org/10.1016/j.quascirev.2021.107156, 2021.
Xu, G., Liu, X., Trouet, V., Treydte, K., Wu, G., Chen, T., Sun, W., An, W., Wang, W., Zeng, X., and Qin, D.: Regional drought shifts (1710–2010) in East Central Asia and linkages with atmospheric circulation recorded in tree-ring δ18O, Clim. Dyn., 52, 713–727, https://doi.org/10.1007/s00382-018-4215-2, 2019.
Yao, T., Masson-Delmotte, V., Gao, J., Yu, W., Yang, X., Risi, C., Sturm, C., Werner, M., Zhao, H., He, Y., Ren, W., Tian, L., Shi, C., and Hou, S.: A review of climatic controls on δ18O in precipitation over the Tibetan Plateau: Observations and simulations, Rev. Geophys., 51, 525–548, https://doi.org/10.1002/rog.20023, 2013.
Zanardo, S., Nicotina, L., Hilberts, A. G. J., and Jewson, S. P.: Modulation of Economic Losses From European Floods by the North Atlantic Oscillation, Geophys. Res. Lett., 46, 2563–2572, https://doi.org/10.1029/2019GL081956, 2019.
Zhu, F., Emile-Geay, J., McKay, N. P., Hakim, G. J., Khider, D., Ault, T. R., Steig, E. J., Dee, S., and Kirchner, J. W.: Climate models can correctly simulate the continuum of global-average temperature variability, P. Natl. Acad. Sci. USA, 116, 8728–8733, https://doi.org/10.1073/pnas.1809959116, 2019.