the Creative Commons Attribution 4.0 License.
the Creative Commons Attribution 4.0 License.
 | 03 Feb 2025
Strong volcanic-induced climatic shocks on historical Moselle wine production
Fredrik Charpentier Ljungqvist
Bo Christiansen
Lea Schneider
Peter Thejll
In central and southern Europe, grapevine is a climate-sensitive agricultural product of great economic importance, both in historical times and today. We systematically investigated the climatic impact, focusing on volcanic-forced abrupt cooling, on two long annual records of wine production quantity (spanning 1444–1786) from the Moselle Valley in present-day Luxembourg, close to the northern limit of viticulture in Europe. We present a consistent picture of the impact of volcanic eruptions on wine production through climate. To this end, we applied superposed epoch analysis – an appropriate method for detecting episodic signals in non-stationary time series – in combination with a bootstrap procedure to estimate the statistical significance. We also assessed the long-term relationship between different annual and seasonal climate parameters and wine production in the Moselle Valley. Robust and highly significant wine production declines occurred in the years immediately following major volcanic events. Warmer and, to a lesser extent, drier climate conditions had a moderately strong, but persistent, positive effect on wine production. We also find a volcanic cooling signature in spring and summer in temperature reconstructions. However, the detected volcanic signature in the Moselle Valley wine production is considerably stronger than the one found for central Europe in tree-ring-based reconstructions and is instead more akin to the strong volcanic signature present in Fennoscandian tree-ring series. On the basis of our findings, we encourage further compilation, publication, and analyses of additional wine production series containing unique biological and climatic information.
- Article
(2173 KB) - Full-text XML
- BibTeX
- EndNote


The climatic response to volcanic forcing during the past few millennia has been studied intensively from local to global scales, typically using tree-ring data from strongly temperature-limited growth environments. The impacts on agricultural productivity, including on viticulture, in less extreme climatic settings remain far less well understood. The study of long time series of agricultural productivity, like grapevine harvest quantities, offers insights into the effects of such abrupt cooling on biological records with properties possibly differing from those of tree-ring series. This, in turn, may shed new light on still-unresolved questions about the effects volcanic-induced cooling has on tree growth, in addition to gaining a better understanding of the role of major volcanic events for past agriculture.
Grapevine (henceforth “vine”) is a highly climate-sensitive crop whose phenology is comparatively well understood (Jones et al., 2005; Bock et al., 2013; de Cortázar Atauri et al., 2017; Drappier et al., 2019; Morales-Castilla et al., 2020; Droulia and Charalampopoulos, 2022). The biological requirements of both modern and historical European viticulture have been documented in detail (Lachiver, 1988; Mullins et al., 1992; Guerreau, 1995). An increasingly warmer climate, with longer growing seasons, benefits viticulture (vine-growing) near its latitudinal and altitudinal limits (Malheiro et al., 2010; Guiot et al., 2023), whereas climatic warming at the same time can have adverse effects on viticulture in regions with a hot and dry Mediterranean climate (Cook and Wolkovich, 2016; Venios et al., 2020; Andrade et al., 2024; van Leeuwen et al., 2024). Grapes were the most important cash crop, of an economic importance only second to grain, in much of Europe during the medieval and early modern periods, and vine is and was more climate-sensitive than grain (Pfister and Wanner, 2021). Relationships between different parameters associated with wine production and summer temperature in late medieval and early modern Europe have previously been described in the literature (Ladurie Le Roy and Baulant, 1980; Le Roy Ladurie et al., 2006; Labbé et al., 2019; Pfister et al., 2024). In central Europe, the quantity of the grape harvest was positively correlated to June–July temperature, the quality to July–September (and especially August) temperature, and the harvest dates to April–July/August temperature (Pfister, 1981; Pfister et al., 2024). Viticulture in central Europe is, and was, especially sensitive to the effect of spring frost (Meier et al., 2018). The strong cooling during the climax of the Little Ice Age ca. 1570–1710 (Wanner et al., 2022) made viticulture non-viable in parts of central Europe – with considerable economic and social consequences (Landsteiner, 1999).
Large, but more short-lived, reductions in vine harvests – and thus wine production declines – could be triggered by sharp volcanic-induced cooling. Major volcanic eruptions have a significant impact on climate (Robock, 2000; Oppenheimer, 2011) through a negative radiative forcing related to an increased atmospheric loading of aerosols and dust, and they can induce significant global- to hemispheric-scale cooling for 1 to several years (Stoffel et al., 2015; Sigl et al., 2015; Burke et al., 2023). The climate effect of an eruption does not only depend on its magnitude but also on factors such as the geographical position of the volcano and the season of the eruption (Guillet et al., 2017). Quantitative estimates of volcanic-induced cooling during pre-industrial times have mostly been derived from large-scale temperature reconstructions based on tree-ring data (Schneider et al., 2015; Stoffel et al., 2015; Wilson et al., 2016; Anchukaitis et al., 2017; Büntgen et al., 2021). In altitudinal and latitudinal tree-line ecotones, tree growth is particularly sensitive to summer temperature (Körner, 2021), and short-term climatic perturbations are archived in anomalies of annual ring width or wood density (Esper et al., 2016; Hartl-Meier et al., 2017). The precise annual dating of tree-ring chronologies allows a clear attribution of temperature deviations to volcanic eruptions (Anchukaitis et al., 2012; D'Arrigo et al., 2013; Esper et al., 2013a; Schneider et al., 2017).
The adverse impacts on agricultural productivity and hence on human society of volcanic-induced cooling in pre-industrial times have been well documented in recent scholarship (D'Arrigo et al., 2020; Guillet et al., 2020; Huhtamaa et al., 2022; Stoffel et al., 2022; White et al., 2022; Martin et al., 2023). This is, in particular, the case at the northern edge of grain agriculture in Europe (Ljungqvist et al., 2021, 2024). The effects of volcanic-induced cooling on viticulture in pre-industrial Europe remain less well understood. However, it has been demonstrated that larger, especially tropical, volcanic eruptions resulted in significantly later grape harvest dates for 1–2 years after the volcanic event (Meier et al., 2007; Guillet et al., 2017; Pfister and Wanner, 2021). The effects of individual major volcanic forcing events on wine production have also been studied. For example, Brönnimann and Krämer (2016) studied the effects of the 1815 Tambora volcano eruption, followed by the cold summer of 1816 in central Europe. The extent to which the cooling was due to volcanic forcing was evaluated along with its biophysical effects (e.g. low harvest yields) and subsequent societal consequences.
Numerous records, not least from France and Switzerland, exist of grape harvest dates (Yiou et al., 2012). They have been proven to be strongly related to spring and summer temperatures and have been utilised in numerous documentary-based temperature reconstructions (e.g. Chuine et al., 2004; Kiss et al., 2011; Možný et al., 2016a; Labbé et al., 2019) and also drought reconstructions (Možný et al., 2016b), despite possible biases in the long-term trends (Garcia de Cortazar-Atauri et al., 2010; Garnier et al., 2011). Grape harvest dates have been proven to be particularly skilful in capturing extremely cold years (Maurer et al., 2011), such as those frequently following volcanic forcing events (Sigl et al., 2015), although the skill of capturing extremely warm years is less good (Keenan, 2007). Likewise, a number of long wine price series exist from different portions of Europe (Allen and Unger, 2019), but the possible climate signal embedded in the wine price series remains relatively unexplored. In contrast to grape harvest dates and wine price series, long and continuous series of wine production (or grapevine harvest quantity or quality) are rare for medieval and early modern Europe (see, though, the recently published ones by Pfister et al., 2024). However, two long annual wine production quantity records, covering 1444–1786 with gaps, were already published by Yante (1985). They derive from Grevenmacher and Remich in the Moselle Valley, in present-day Luxembourg, close to the latitudinal limit of European viticulture (Fig. 1a and b).
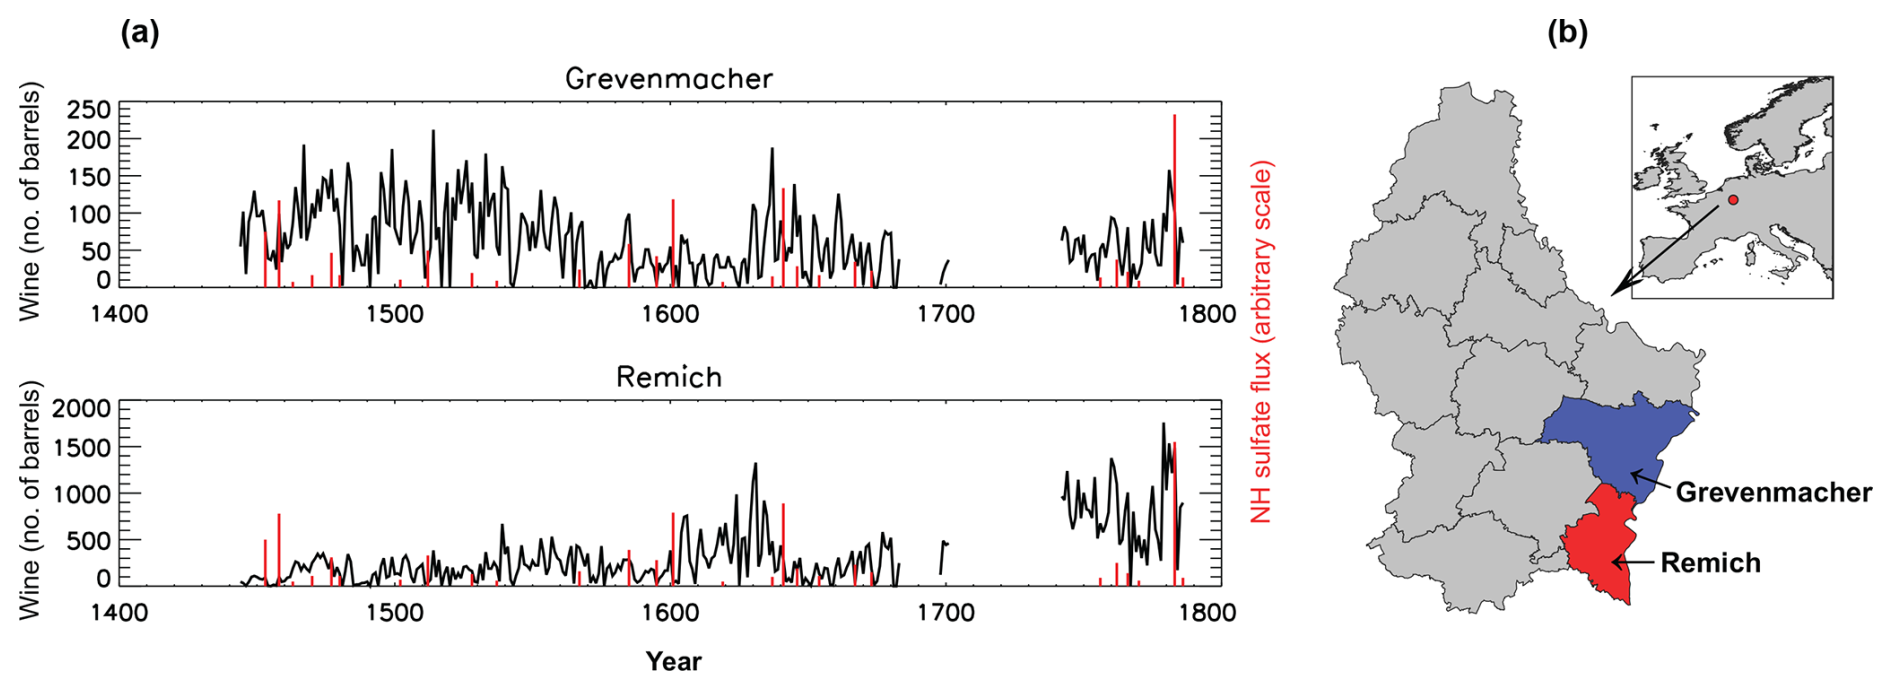
Figure 1(a) Annual wine production in number of barrels for each series (in black) and volcanic sulfate flux derived from Greenland sulfate deposition (in red). (b) Location of the two sites with wine data from 1444–1786 (with gaps) in the Moselle Valley of Luxembourg.
In this article, we systematically investigate the impact of climate, with particular focus on the influence of volcanic forcing, on the two abovementioned long wine production quantity series. We will first assess the effects of volcanic forced cooling on wine production using superposed epoch analysis (SEA) appropriate for studying episodic events in non-stationary time series. Then, we will evaluate the effects of volcanic forcing on Moselle Valley pre-industrial climate and explore whether the wine production series contribute information useful for understanding volcanic-induced cooling in the region between the Alps and Scandinavia in comparison to temperature-sensitive tree-ring data. Finally, we will investigate both the short- and long-term relationship between different annual and seasonal climate parameters and wine production quantities in order to understand and constrain the effects of climate on wine production variability. Through utilising bootstrap and phase-scrambling-based techniques to estimate significance, we intend to pay particular attention to issues related to statistical significance.
We emphasise that this article is of a statistical nature. Our aim is to investigate the statistical relationships between volcanic forcing, climate, and wine production in the Moselle Valley region. The rest of article is organised as follows: after presenting our data and methods (Sect. 2), we start with investigating the influence of volcanic eruptions on wine production (Sect. 3.1), followed by the influence of volcanic eruptions on climate (Sect. 3.2), and end with the influence of climate extremes on the wine production (Sect. 3.3). In Sect. 4 we discuss the interpretations and implications of the results and their associated uncertainties, starting with the volcanic and climatic signals embedded in the wine production series (Sect. 4.1) followed by a comparative discussion about the volcanic forcing effects on wine production in relation to tree-ring growth (Sect. 4.2). We conclude the article with a short conclusion and outlook (Sect. 5).
In this section we start with describing the wine production data (Sect. 2.1), followed by the volcanic forcing dataset (Sect. 2.2) and then the (palaeo)climate series (Sect. 2.3). All the datasets are summarised in Table 2. We end the section with describing the various statistical methods applied (Sect. 2.4).
2.1 The Moselle Valley wine production series
The two annual wine production quantity series from Grevenmacher and Remich in the Moselle Valley (49.5° N, 6.35° E) of present-day Luxembourg are based on official records of a tax of one-ninth levied on the wine production. They cover the 1444–1786 period, though with a gap between 1684–1741 (except for the years 1698–1701) in connection with the French occupation of Luxembourg (Yante, 1985). It is unfortunate that much of the cold period coinciding with the Maunder Minimum of solar activity (ca. 1645–1715; Eddy, 1976; Steinhilber et al., 2009) is missing in the Moselle Valley wine production data. However, the last 3 decades of the 16th century were at least as cold as any part of the Maunder Minimum (Pfister and Wanner, 2021; Wanner et al., 2022). Thus, we still capture the full range of temperature variability.
While the tax was originally levied, when introduced in the 13th and 14th centuries, on every ninth basket of grapevines harvested, it soon instead became levied on every ninth barrel of wine produced. However, the number of barrels of wine produced closely followed the number of baskets of grapevines harvested. Thus, the number of barrels of wine produced mimics the quantity of the vine harvest. It is uncertain to what extent changes over time in tax exemptions affected the wine quantity at inter-annual and longer timescales. Furthermore, at times, the tax appears in fact to have been both higher and lower than one-ninth of the wine production. The degree of fraud and resistance to taxation might also have varied over time (see also Pfister, 1984). Sufficient to say is that the long-term trend in the Grevenmacher and Remich series is not reliable. The source-critical problems associated with tithe records to estimate actual agricultural productivity variations have been extensively treated in the agrarian history literature (e.g. Kain, 1979; Le Roy Ladurie and Goy, 1982; Leijonhufvud, 2001; Skoglund, 2023). This research on tithes as a historical source for agricultural productivity has shown that long-term trends contain larger biases than short-term variability. Grevenmacher shows a long-term rather stable, or slightly decreasing, production trend, whereas Remich shows a long-term production increase (Fig. 1a). Nevertheless, the correlation coefficients between the Grevenmacher and Remich series for linearly detrended and 11-year high-pass filtered data, respectively, are r=0.55 and r=0.62. Both correlations are significant at a p=0.01 level (two-tailed test).
Modern observations show that temperature is the single most important climatic factor for viticulture in the Moselle region (Urhausen et al., 2011). The soil in Grevenmacher is limestone, and the soil in Remich is alluvial. Grain is the main crop, but terraces of vines are widespread too (Yante, 1985). The annual mean temperature during the 20th century was around 10 °C with around 650 mm annual precipitation and slightly over 1400 hours of sunshine. Years with less than 500 mm precipitation tend to produce the best wine. Spring frost is a known problem for viticulture in the region (Meier et al., 2018). The Moselle Valley during the early modern period was a rather marginal viticulture area (about 90 % of the wine was white) with often relatively low wine quality, with the wine of Remich considered superior to that of Grevenmacher. Consequently, the vine was grown to a much larger extent in Remich than in Grevenmacher (Yante, 1985).
2.2 Volcanic forcing data
We employ the volcanic stratospheric sulfur injection data from Toohey and Sigl (2017) (lists provided by Michael Sigl, University of Bern, personal communication, 2022), an updated version of Sigl et al. (2015) that is utilised for the recommended forcing in state-of-the-art PMIP4 “past1000” climate model simulations (Jungclaus et al., 2017). This dataset provides the forcing year, not the eruption year (which is sometimes unknown), and, depending on the seasonality of the eruption, the peak forcing year can be the same year as the eruption year or the following year. Toohey and Sigl (2017) used composite ice-core data from Greenland and Antarctica, separately, to generate a robust list of dates of volcanic eruptions. We only use the dates for forcing events with aerosol loading in the Northern Hemisphere (NH) (flux is provided as the deposited sulfate found in the ice cores given in kg km−2). We restrict our list to those eruptions, since it is likely that even strong Southern Hemisphere (SH) extra-tropical eruptions do not contribute much to an aerosol loading in the NH.
For use in the superposed epoch analysis, we identify key years with NH volcanic forcing of various strengths. In the Toohey and Sigl (2017) NH flux series, for the period we use in the analysis, there are 34 (27) eruptions listed with strengths above 0 kg km−2 (the smallest eruption in the series is near 3.2 kg km−2), 28 (22) eruptions stronger than 5 kg km−2, 16 (12) eruptions stronger than 10 kg km−2, 11 (7) eruptions stronger than 15 kg km−2, and 9 (6) eruptions stronger than 20 kg km−2. Here, the numbers in parentheses give the count of eruptions that also cover complete wine data, in the sense that we only include eruptions not less than 5 years from a wine data gap. In our analyses, we use all the eruptions, as recent results suggest that weak eruptions can have significant climate effects (Chim et al., 2023). However, we also tested the effects of using only eruptions larger than the thresholds mentioned above. The eruption years included are listed in Table 1. In addition, we tested the sensitivity of the SEA by progressively excluding the strongest volcanic eruptions.
Table 1Year and flux (in kg km−2) of the volcanic forcing events 1444–1786 based on Toohey and Sigl (2017). We include the volcanic events occurring in 1684–1741 when we have a gap in the wine production series because the events are used for the SEA based on climate extremes.
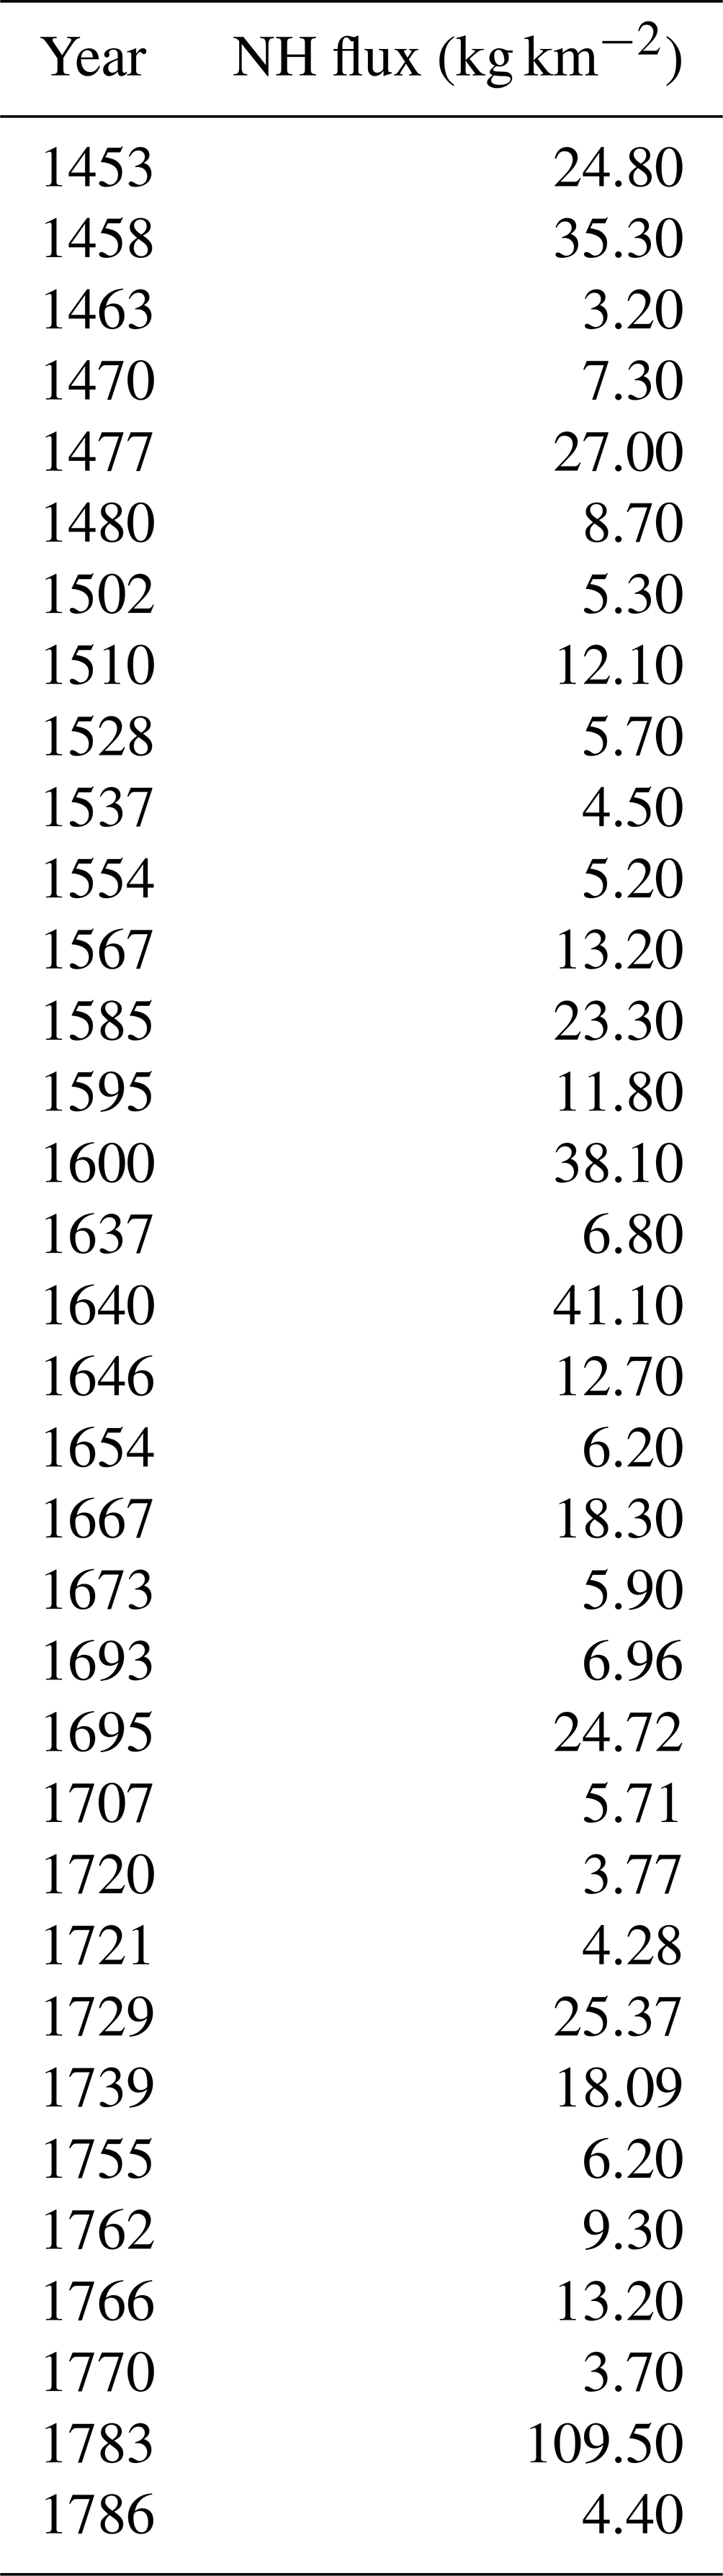
Table 2Wine production data and (palaeo)climate and volcanic forcing data series used in this study, with information on parameters, period covered, grid cell (centre coordinates), season, data type, AR1 (autoregressive coefficient at lag 1), and data source.
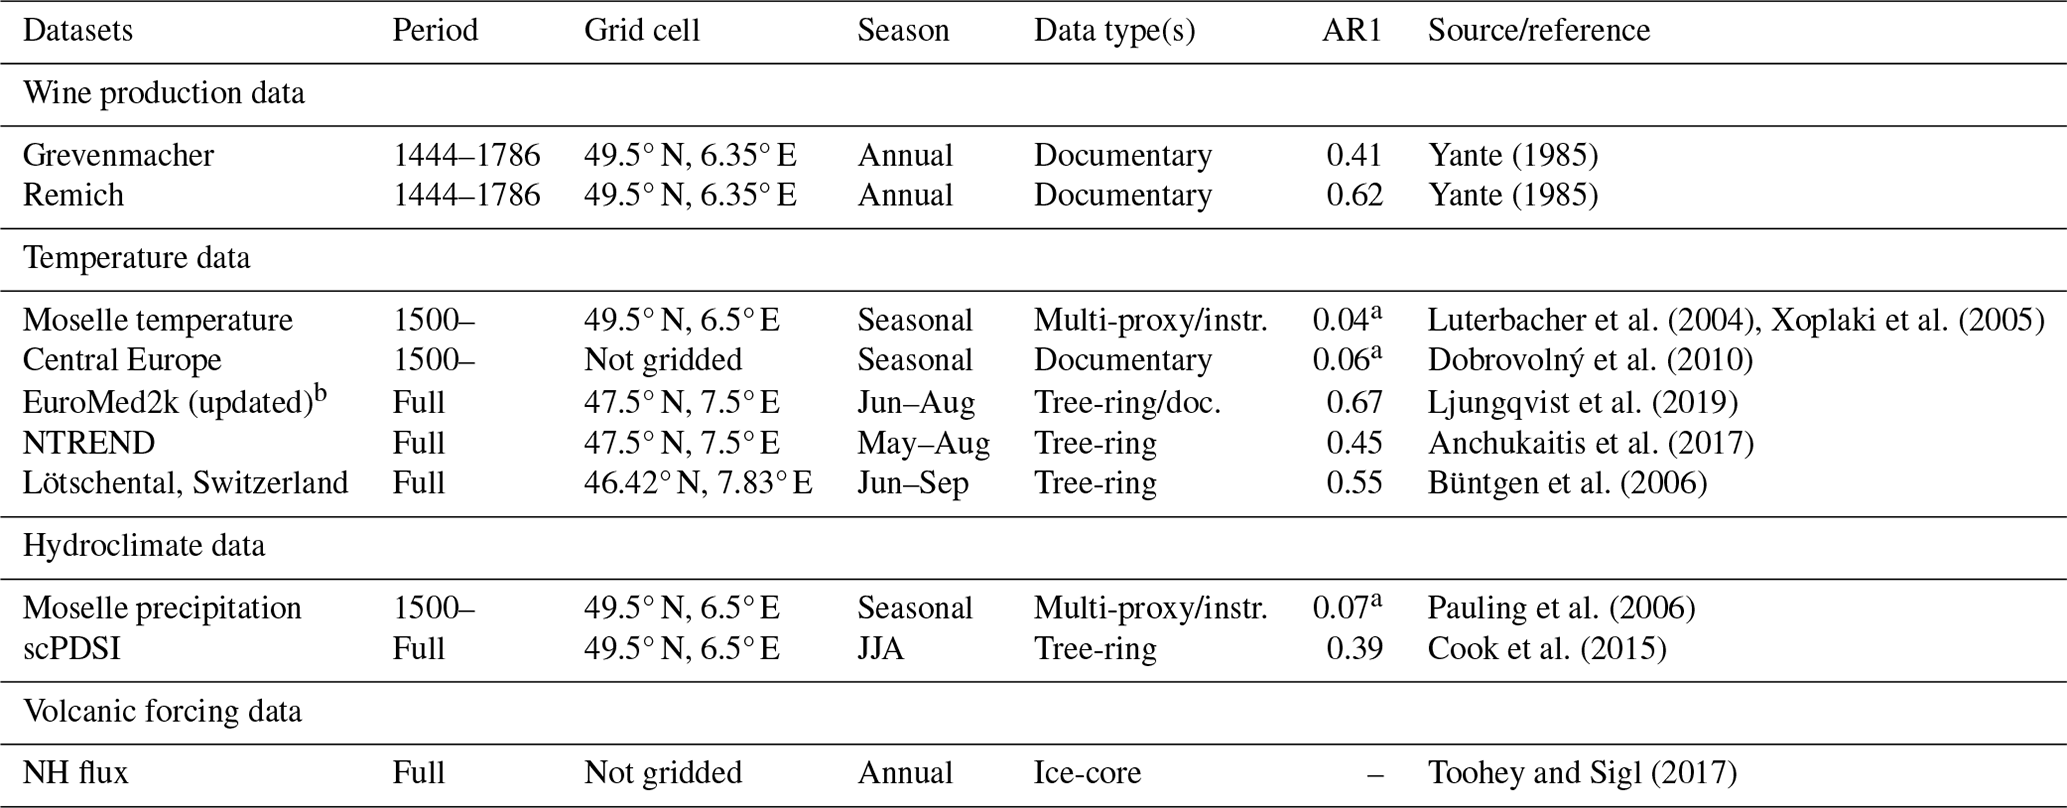
a Mean AR1 of the four different seasonal windows (December–February, March–May, June–August, and September–November). b Updated by Ljungqvist et al. (2019) from the first EuroMed2k reconstruction version published by Luterbacher et al. (2016).
2.3 Climate data
Instrumental climate data have only a short period of overlap with the Grevenmacher and Remich wine production series. The closest instrumental temperature station to Luxembourg in the homogenised European Climate Assessment (ECA) temperature dataset (Squintu et al., 2019) is the monthly averaged data for De Bilt in the Netherlands (van Engelen and Geurts, 1985) at a distance of about 300 km. Data from De Bilt overlap with the wine production series from 1742 to 1786, covering a period of only 45 years. The short overlap with the De Bilt instrumental record limits the reliability and confidence in results derived from it.
We therefore employ reconstructed series of temperature and precipitation, as summarised in Table 2. We use seasonally resolved gridded reconstructed temperature data from Luterbacher et al. (2004) and Xoplaki et al. (2005) (henceforth only cited as Luterbacher et al., 2004) and seasonally resolved gridded reconstructed precipitation from Pauling et al. (2006) back to 1500 (Table 2). Both the Luterbacher et al. (2004) and the Pauling et al. (2006) reconstructions include instrumental data during the 18th century. Data are extracted from the local grid cell(s) covering Luxembourg. In addition, we use the seasonal resolved reconstructed temperature data from Dobrovolný et al. (2010), which are available as a central European average for the same period. For the full period since 1444, we use the June–August temperature reconstruction by Luterbacher et al. (2016), as updated by Ljungqvist et al. (2019), based mainly on tree-ring data but also containing the documentary-based June–August season data from the abovementioned Dobrovolný et al. (2010) reconstruction. Furthermore, we employ for the full period the solely tree-ring-based NTREND gridded field reconstruction (Anchukaitis et al., 2017) of May–August temperature. For comparisons against volcanic-induced cooling in the Alpine region, we use the June–September temperature reconstruction from Lötschental, Switzerland, which is derived from a strong temperature signal in maximum latewood density tree-ring series (Büntgen et al., 2006). June–August soil moisture (drought) conditions for the entire period are obtained from the tree-ring-width-based gridded Old World Drought Atlas (Cook et al., 2015) providing self-calibrated Palmer Drought Severity Index (scPDSI) values (van der Schrier et al., 2011).
2.4 Statistical methods
The episodic nature of the volcanic eruptions is an advantage when analysing their effects on variables with unknown, or even dubious, low-frequency variations and trends, such as wine production quantities. We simply compare the strength of the mean superposed standardised signal of the considered time series (wine production or climate conditions) in the years immediately following the eruptions with the mean superposed standardised signal in the years before (5 years). Using superposed epoch analysis (SEA; Chree, 1913, 1914; von Storch and Zwiers, 1999; Rao et al., 2019), we calculate the average of this difference across K eruptions, which are covered by the considered time series – so the number of eruptions might vary slightly for different time series – and are stronger than the chosen threshold. We standardised the time series to zero mean and unit variance before conducting the SEA. The significance is estimated by a bootstrap procedure, assuming only that the eruptions are independent. If we have K eruptions, we pick K random years in the whole period under consideration and calculate the superposed epochs from these years. Note that the years with actual volcanic eruptions should be selected with the same probability as any other year. Otherwise, a bias would be introduced. We do this 3000 times to get a distribution of the SEA under the null hypothesis that volcanic eruptions have no impact on the considered time series (e.g. wine production). Comparing the original SEA with this distribution, we can calculate the p-value as the probability of having a lower SEA than the observed. We report significance in the SEA at both the p=0.05 and p=0.01 significance levels. Furthermore, our results are robust to changes in the details of the analysis, such as in the length of the epochs or whether the average is calculated over the whole epoch and not just the half preceding the eruptions. The SEA results are based on time series standardised to unit variance over the whole period. However, similar results are obtained when the standardisation is performed individually over running windows (corresponding to variance equalisation).
To further investigate the relationship between climate and wine production quantities, we calculated the Pearson correlation coefficient (r) between the wine production series and the various (palaeo)climate reconstructions. The significance of correlations was calculated using p=0.05 with a phase-scrambling test, which is more conservative than the common Student's t-test (for details, see Ljungqvist et al., 2022, 2023). To emphasise inter-annual variability, we employed 11-year high-pass filtering of the data. For studying low-frequency variability, we likewise employed an 11-year low-pass filter. This emphasises variability at decadal scales, while inter-annual fluctuations and noise are suppressed. The choice of 11 years as the filter cut-off length is chosen to match the timescale of the SEA. Although we have used a simple 11-year smoothing filter, other more complicated filters (e.g. Gaussian filters) provided almost identical results. During an exploratory data analysis phase, we also compared the use of the parametric Pearson correlation coefficient with the non-parametric Kendall and Spearman correlation coefficients, finding that they resulted in similar correlation patterns.
In this section we study the influence of volcanic eruptions on wine production (Sect. 3.1), the influence of volcanic eruptions on climate (Sect. 3.2), and the influence of climate extremes on wine production (Sect. 3.3). We will mainly focus on the episodic connection using SEA, while we will additionally use correlation analysis in Sect. 3.3. Together, this will provide evidence for a volcanic and climatic influence on the wine production quantity, mainly through spring and summer temperatures.
3.1 Effects of volcanic forcing on Moselle Valley wine production
A main focus of this study is the effects of volcanic-forced abrupt cooling on the Moselle Valley wine production. Superposed epoch analysis (SEA) reveals a strong decrease in wine production the year following volcanic forcing events for both Grevenmacher and Remich. The SEA signal itself is shown in Fig. 2 with the blue curves, while the dark- and light-shaded bands indicate the p=0.01 and p=0.05 significance levels, respectively. This volcanic-related production decrease pattern is similar regardless of whether all volcanic events are included or only those exceeding certain thresholds for NH forcing flux (as demonstrated in the different panels in Fig. 2). In addition, progressively excluding the strongest volcanic eruptions one by one had only a minor impact on the results (not shown). Conclusions were unchanged.
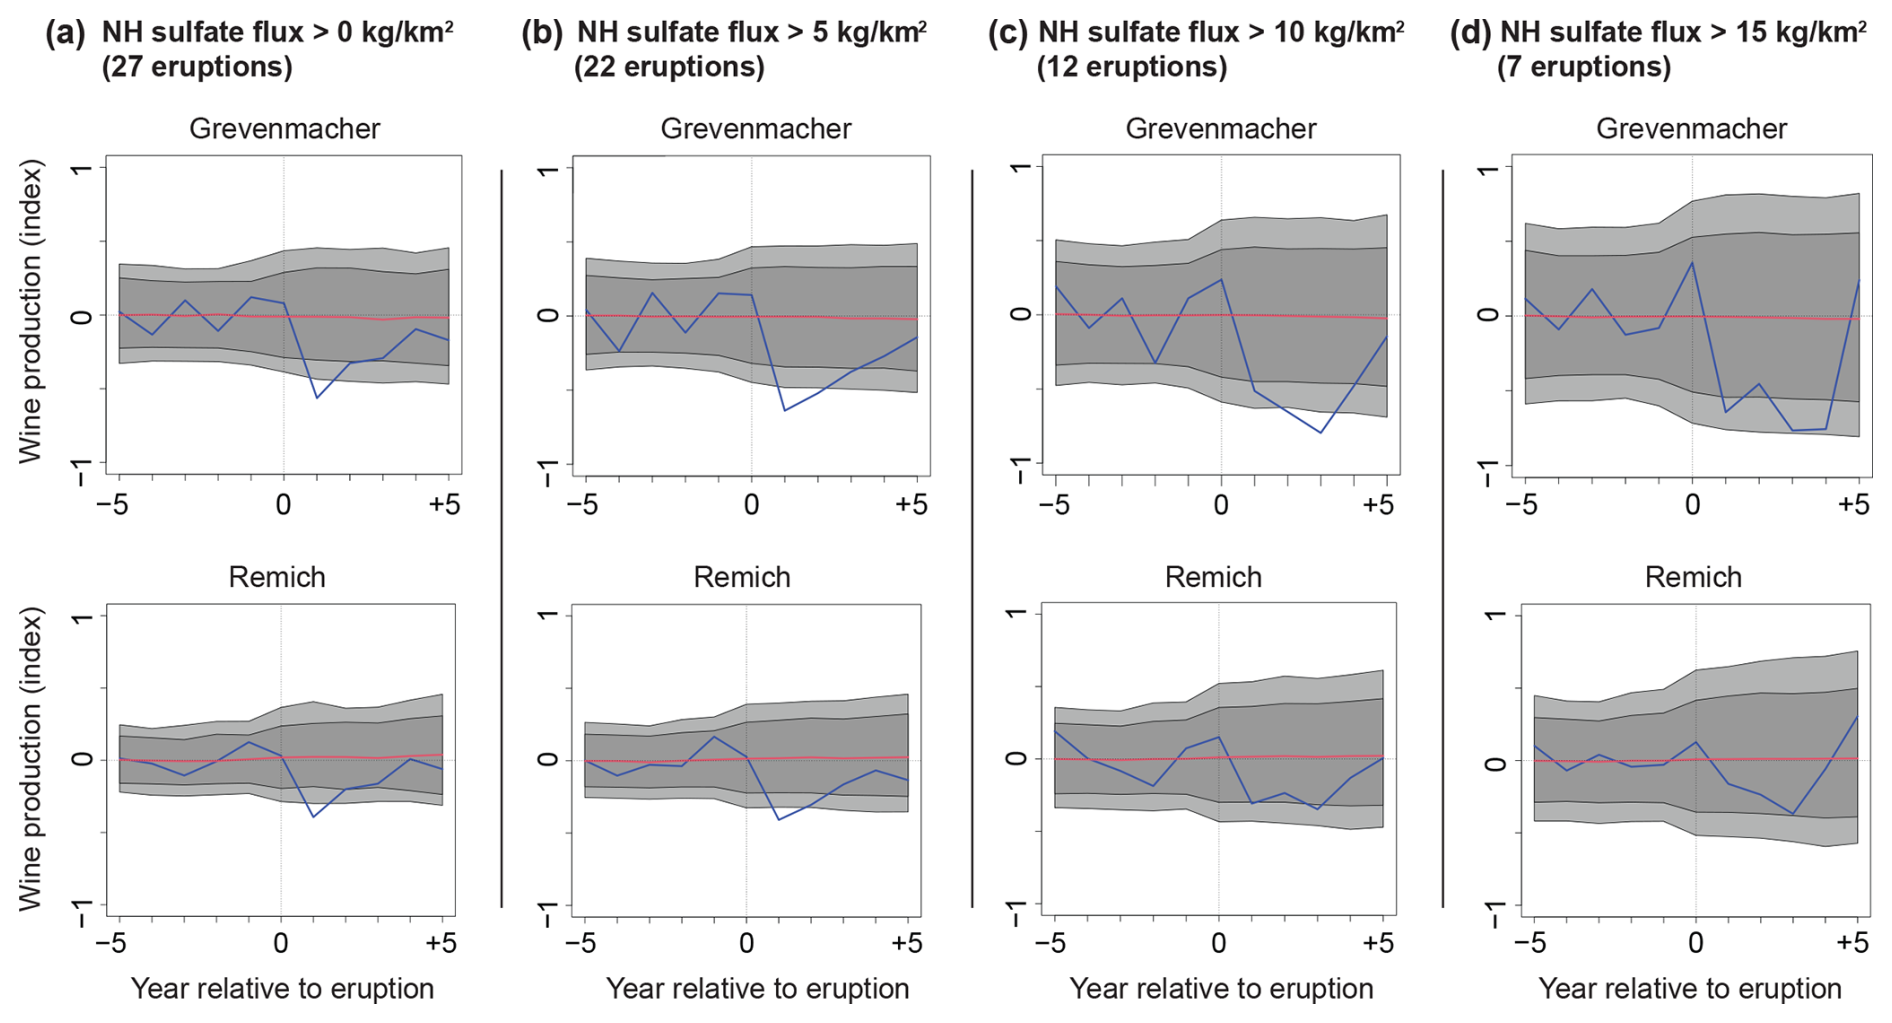
Figure 2Superposed epoch analysis (SEA) of volcanic forcing, after NH sulfate flux kg km−2 size, on standardised wine production quantity for Grevenmacher and Remich. The grey bands indicate p=0.05 (light grey) and p=0.01 (dark grey) significance levels, calculated by a bootstrap method (randomly selected key years).
In general, we find a strong, significant, and consistent decrease in wine production in the years following volcanic forcing events for both the Grevenmacher and Remich series. For all thresholds, the signal (blue curve in Fig. 2) is about 0.5 standard deviations and the p-value is below 0.05 and often below 0.01 (shaded regions in Fig. 2). Slightly smaller signals are found for Remich compared to Grevenmacher. Including all eruptions, we find the largest signal in the first year after the eruptions. The (taxed) wine production was even zero, or close to it, in the first year following certain major volcanic events: 1481, 1601, 1674, 1767, and 1784. However, when increasing the threshold and only including stronger (and fewer) eruptions, we see a tendency for the strongest wine production decrease to be delayed. For the largest eruptions, the strongest signals appear 3–4 years after the eruptions.
The bands indicating the significance levels expand with increasing threshold due to the fewer eruptions included (Fig. 2). When only including larger volcanic events, exceeding an estimated NH forcing flux of >10, a wine production decrease that is significant at the p=0.01 level is only found the third year after the volcanic event – and only for Grevenmacher. Weaker, less significant decreases are also detected the first and second years after the volcanic event, with the Remich series showing a broad decrease for years 1–3 after such strong eruptions.
3.2 Effects of volcanic forcing on Moselle Valley pre-industrial climate
We have performed SEA from volcanic forcing events on temperature and precipitation series (local grid cells when applicable) from the Moselle Valley (see Table 2). Figure 3 summarises the strengths of the connection by reporting the smallest p-values (two-tailed test) taken over years 0–5, i.e. from the year of the eruptions and the following 5 years. These p-values basically reflect the strength of the SEA signals.
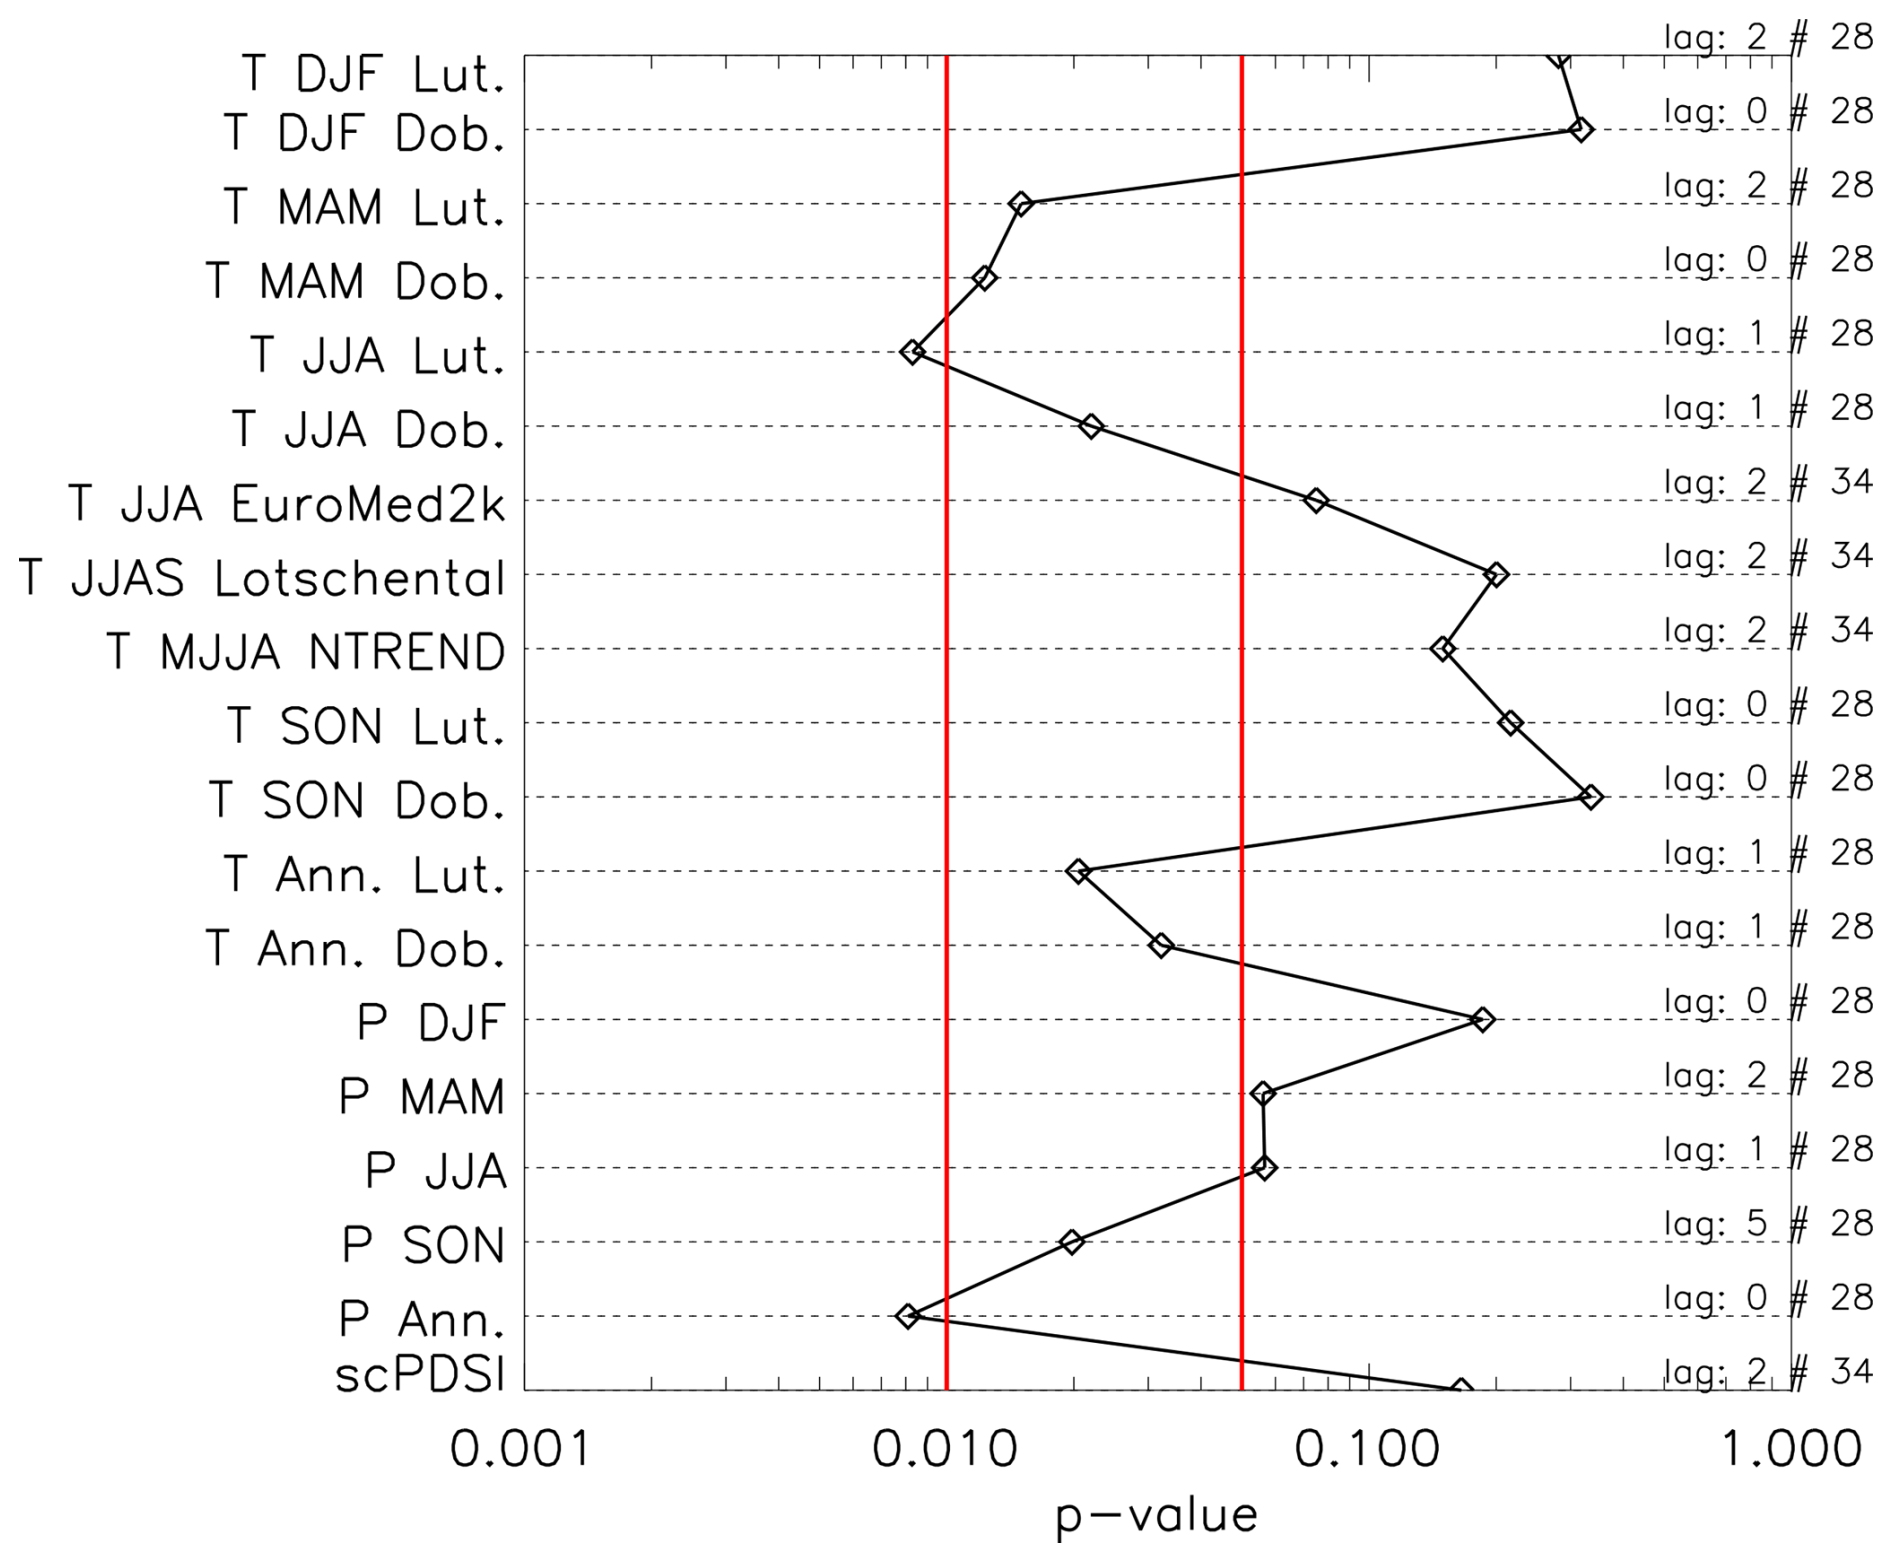
Figure 3For each climate series in Table 2, an SEA based on the years of the volcanic forcing event has been performed. The lowest p-value (two-tailed test) in the year of the volcanic forcing event and the following 5 years are shown. The x axis is logarithmic, and p-values of 0.01 and 0.05 are shown with the vertical red lines. The p-values are calculated using the bootstrap method. The significant signals in the temperature/precipitation series all correspond to colder/wetter conditions. To the right is the lag where the lowest p-value is found. Volcanic forcing events of all strengths are included; the exact number is dependent on data availability and is also shown.
We find significant connections for the temperature series mainly in spring and summer. For example, p-values below 0.02 are found for the temperature series by Dobrovolný et al. (2010) and Luterbacher et al. (2004) only for the March–May and June–August seasons. For temperature in spring and summer, the lowest p-values are found for lag 0 or 1 year (numbers shown to the right in Fig. 3). The significant signals in the temperature series all correspond to coolings. Similar results are obtained using only eruptions larger than 5 kg km−2, while the situation for higher thresholds (and correspondingly fewer eruptions) is more muddled. For precipitation, significant signals corresponding to wetter conditions are found in annual and September–November reconstructions.
We emphasise the weak and insignificant volcanic signatures in the tree-ring-based temperature reconstructions (EuroMed2k, NTREND, and Lötschental) for the central Europe region. This less distinct volcanic signature stands in sharp contrast to the strong and clear wine production quantity reduction after volcanic forcing events that reaches significance well below the p=0.01 level for several years even when including minor forcing events (Fig. 2).
3.3 Effects of climate on Moselle Valley wine production
We have identified the 20 most extreme years (for each of the four seasons) for a selection of the climate series in Table 2. Thus, for temperature series we find the 20 warmest and coldest years, and for precipitation we find the 20 wettest and driest years. These extremes are identified from the raw series without detrending. We then conducted SEA to identify the responses in the two wine production series to these four kinds of extremes for each season. The results are shown in Table 3, which reports the p-values and the signs of the significant responses.
Luterbacher et al. (2004)Luterbacher et al. (2004)Pauling et al. (2006)Pauling et al. (2006)Luterbacher et al. (2004)Luterbacher et al. (2004)Pauling et al. (2006)Pauling et al. (2006)Luterbacher et al. (2004)Luterbacher et al. (2004)Pauling et al. (2006)Pauling et al. (2006)Luterbacher et al. (2004)Luterbacher et al. (2004)Pauling et al. (2006)Pauling et al. (2006)Luterbacher et al. (2004)Luterbacher et al. (2004)Pauling et al. (2006)Pauling et al. (2006)Luterbacher et al. (2004)Luterbacher et al. (2004)Pauling et al. (2006)Pauling et al. (2006)Luterbacher et al. (2004)Luterbacher et al. (2004)Pauling et al. (2006)Pauling et al. (2006)Luterbacher et al. (2004)Luterbacher et al. (2004)Pauling et al. (2006)Pauling et al. (2006)Table 3The p-values for the SEA performed using as key years the 20 warmest/coldest/wettest/driest years, respectively, in the seasonal series of the Luterbacher et al. (2004) temperature reconstruction and the Pauling et al. (2006) precipitation reconstruction on the Remich and Grevenmacher wine production series. The p-values (two-tailed test) were calculated using repeated scrambling of years (bootstrap; see text for details), and p-values below 0.05 are typeset in bold. The lowest p-values (two-tailed test) in the year of the eruptions and in the following 5 years are shown in the table. (+) and (−) designate the direction of the effect on the wine series, where the strongest excursion on the SEA curve inside the 0 to +5 years is used (which is often year 0 or +1).
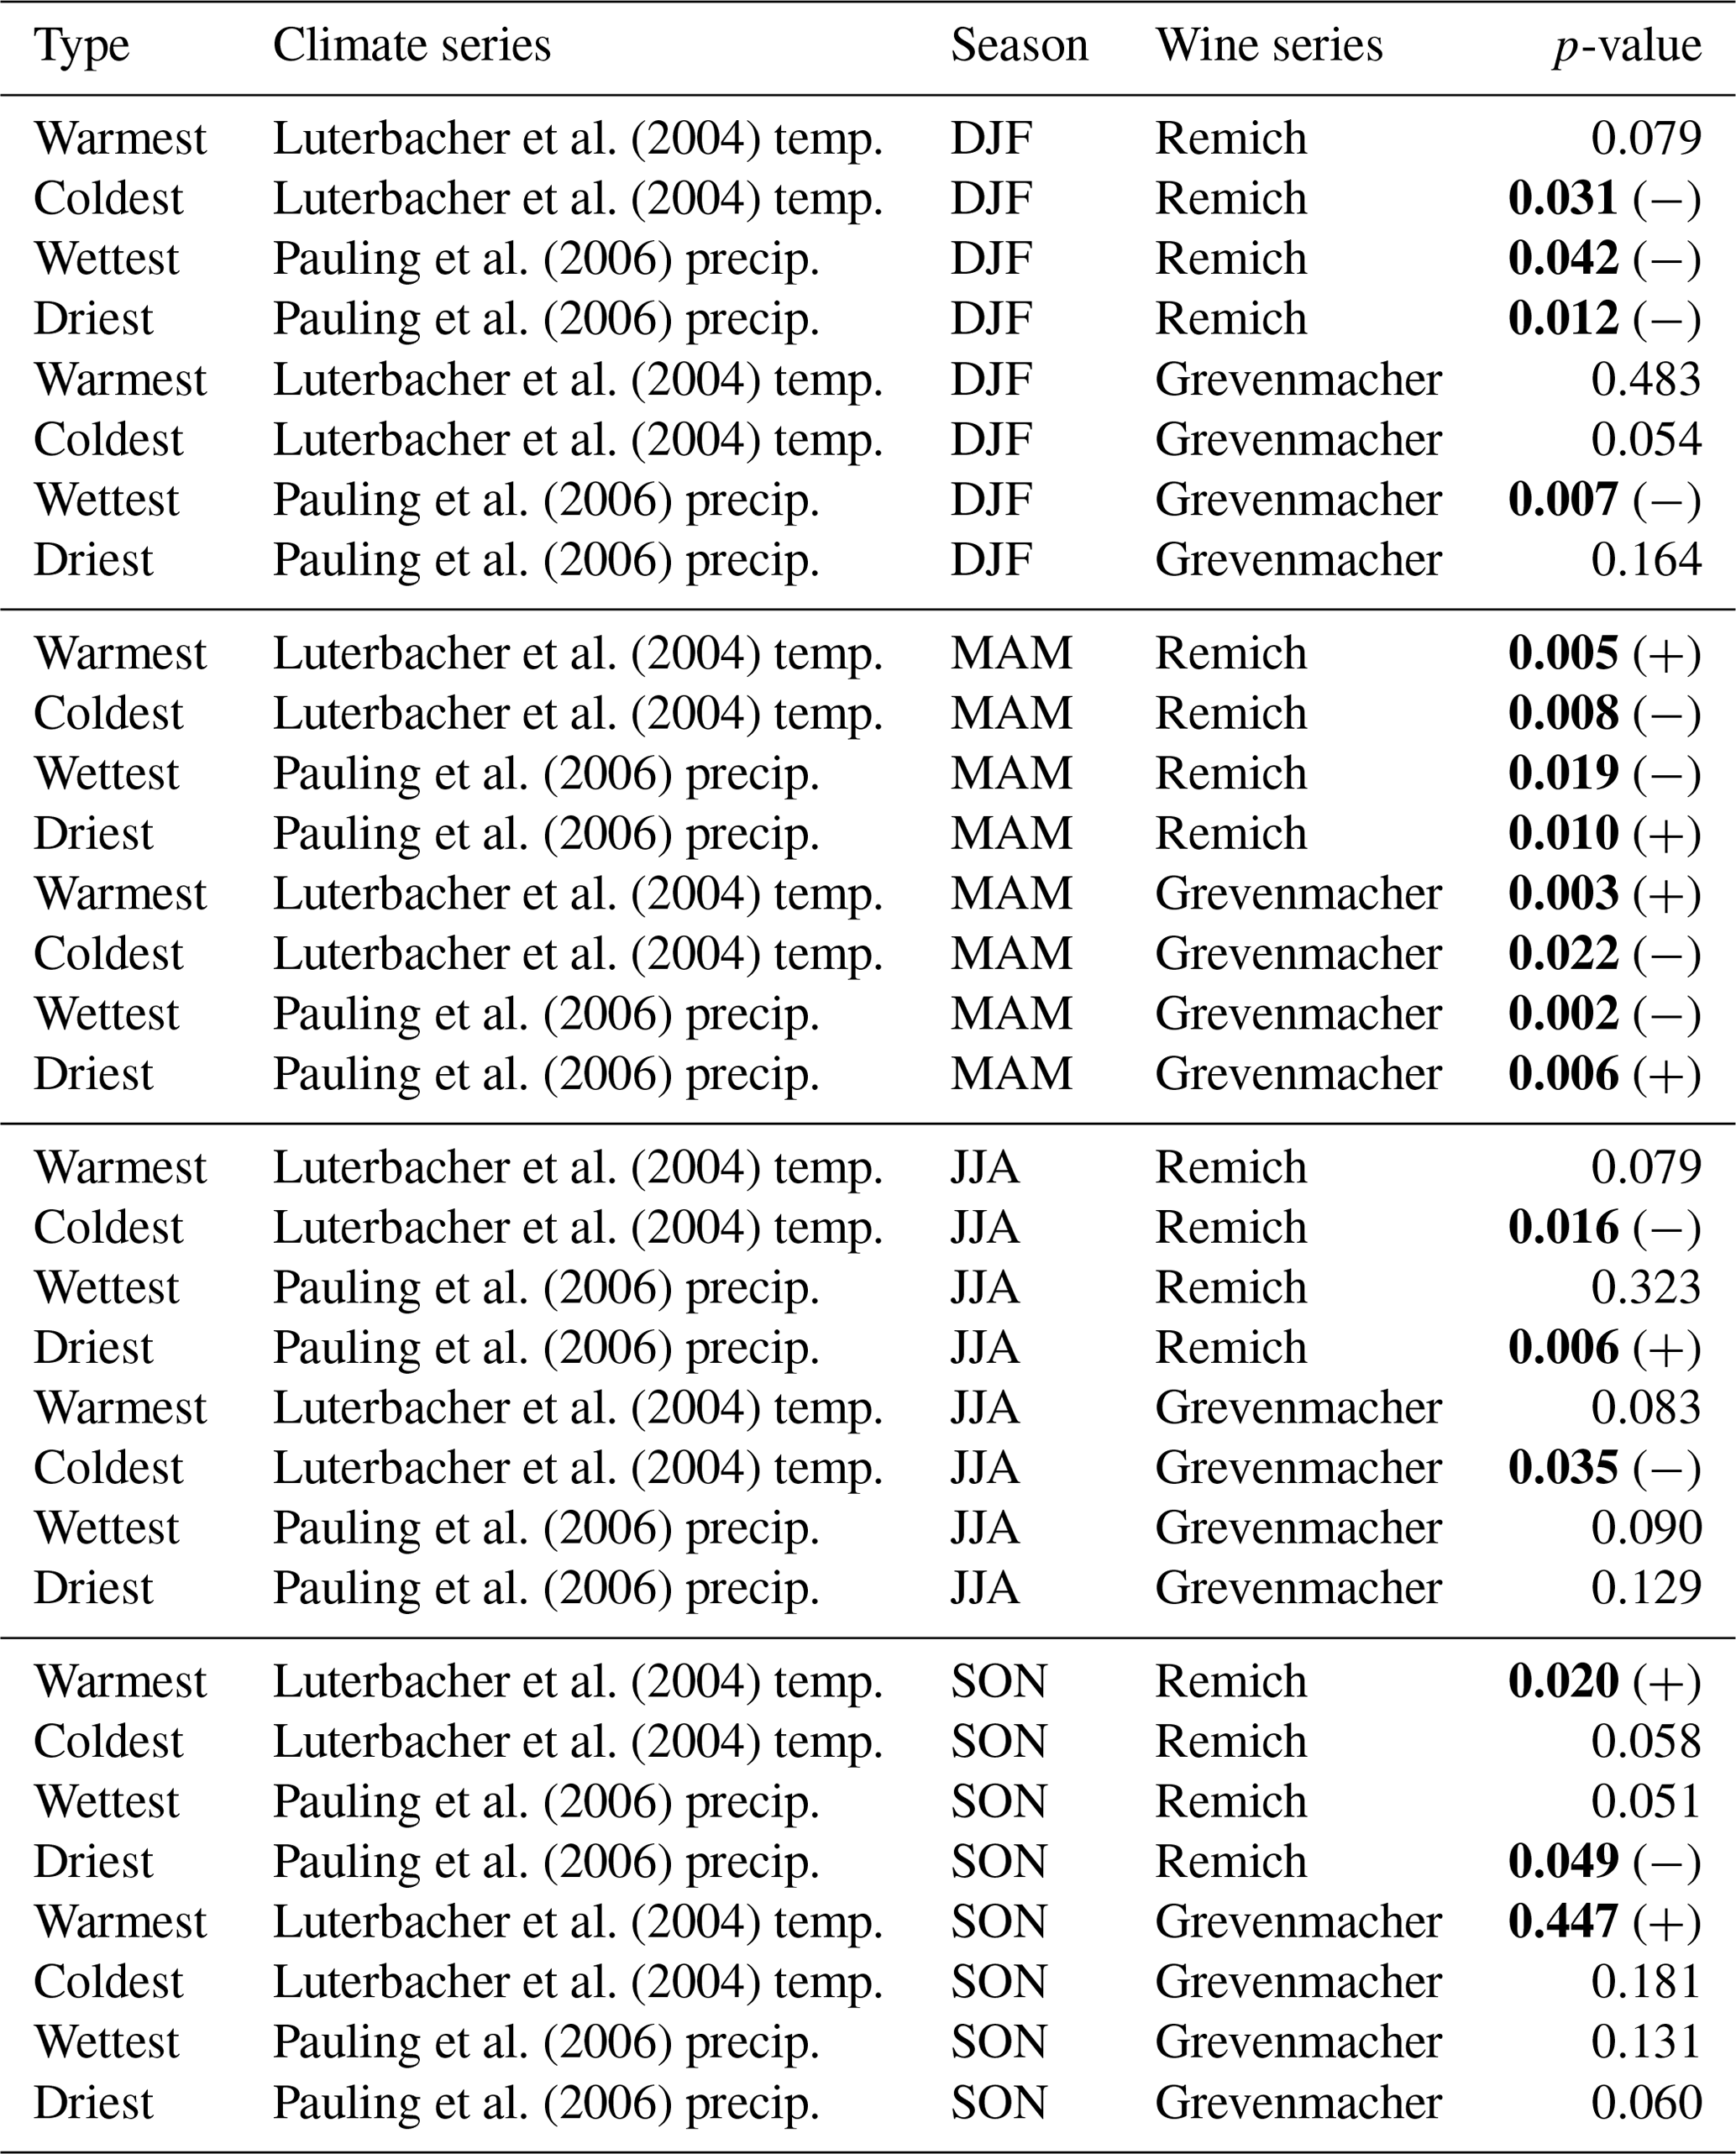
We find that the spring (MAM) stands out from the other seasons with significant responses for all four kinds of extremes. We also note that consistent directions of the responses are found, increasing wine production for warm/dry conditions and decreasing production for cold/wet conditions. The climate series from Luterbacher et al. (2004) and Pauling et al. (2006) show consistent results. Furthermore, we find almost identical results for the Remich and Grevenmacher wine series. For the other seasons, fewer significant and less consistent responses are found, indicating that the significance in these seasons might be partly due to chance.
Through correlation analyses we explored the long-term relationships between wine production and seasonal and annual temperature, precipitation, and soil moisture. We started the analyses with De Bilt instrumental series. The correlation between the De Bilt instrumental series and the Grevenmacher series, over their 45-year period of overlap, 1742–1786, is r=0.46 using 11-year high-pass filtered data for JJA temperature for both. For Remich, the result is r=0.29 (just below significance). Furthermore, the annual mean temperature for De Bilt shows significant positive correlations with Grevenmacher and Remich of r=0.46 and r=0.42, respectively, using 11-year high-pass filtered data. No other seasons, neither for linearly detrended data nor for high-pass filtered data, reveal any significant correlation between wine production and the De Bilt instrumental temperature series.
Using reconstructed temperature data covering the entirety, or the majority, of the length of the Grevenmacher and Remich wine production series shows similar, but more significant, correlation patterns as found using the short De Bilt instrumental series. Mostly significant correlations are found between temperature and wine production quantities between both 11-year high-pass filtered and linearly detrended data (Fig. 4). These correlations are, in general, slightly stronger for Grevenmacher than for Remich. The most significant association is the positive relationship between spring, summer, and autumn temperature and between the annual mean and wine production (i.e. warm corresponds to high wine production and vice versa). Correlations are weak for winter temperatures, being entirely outside the growing season (Fig. 4). Significant positive correlations are also found between (palaeo)climate series and the Grevenmacher series using 11-year low-pass filtered data. While some of the correlations are slightly stronger than those for high-pass filtered or linearly detrended data, the fewer degrees of freedom render a lower number of them significant. Notably, for Remich, not a single correlation using 11-year low-pass filtered data is significant, although most of the correlations are positive and of comparable strength to those for high-pass filtered and linearly detrended data.
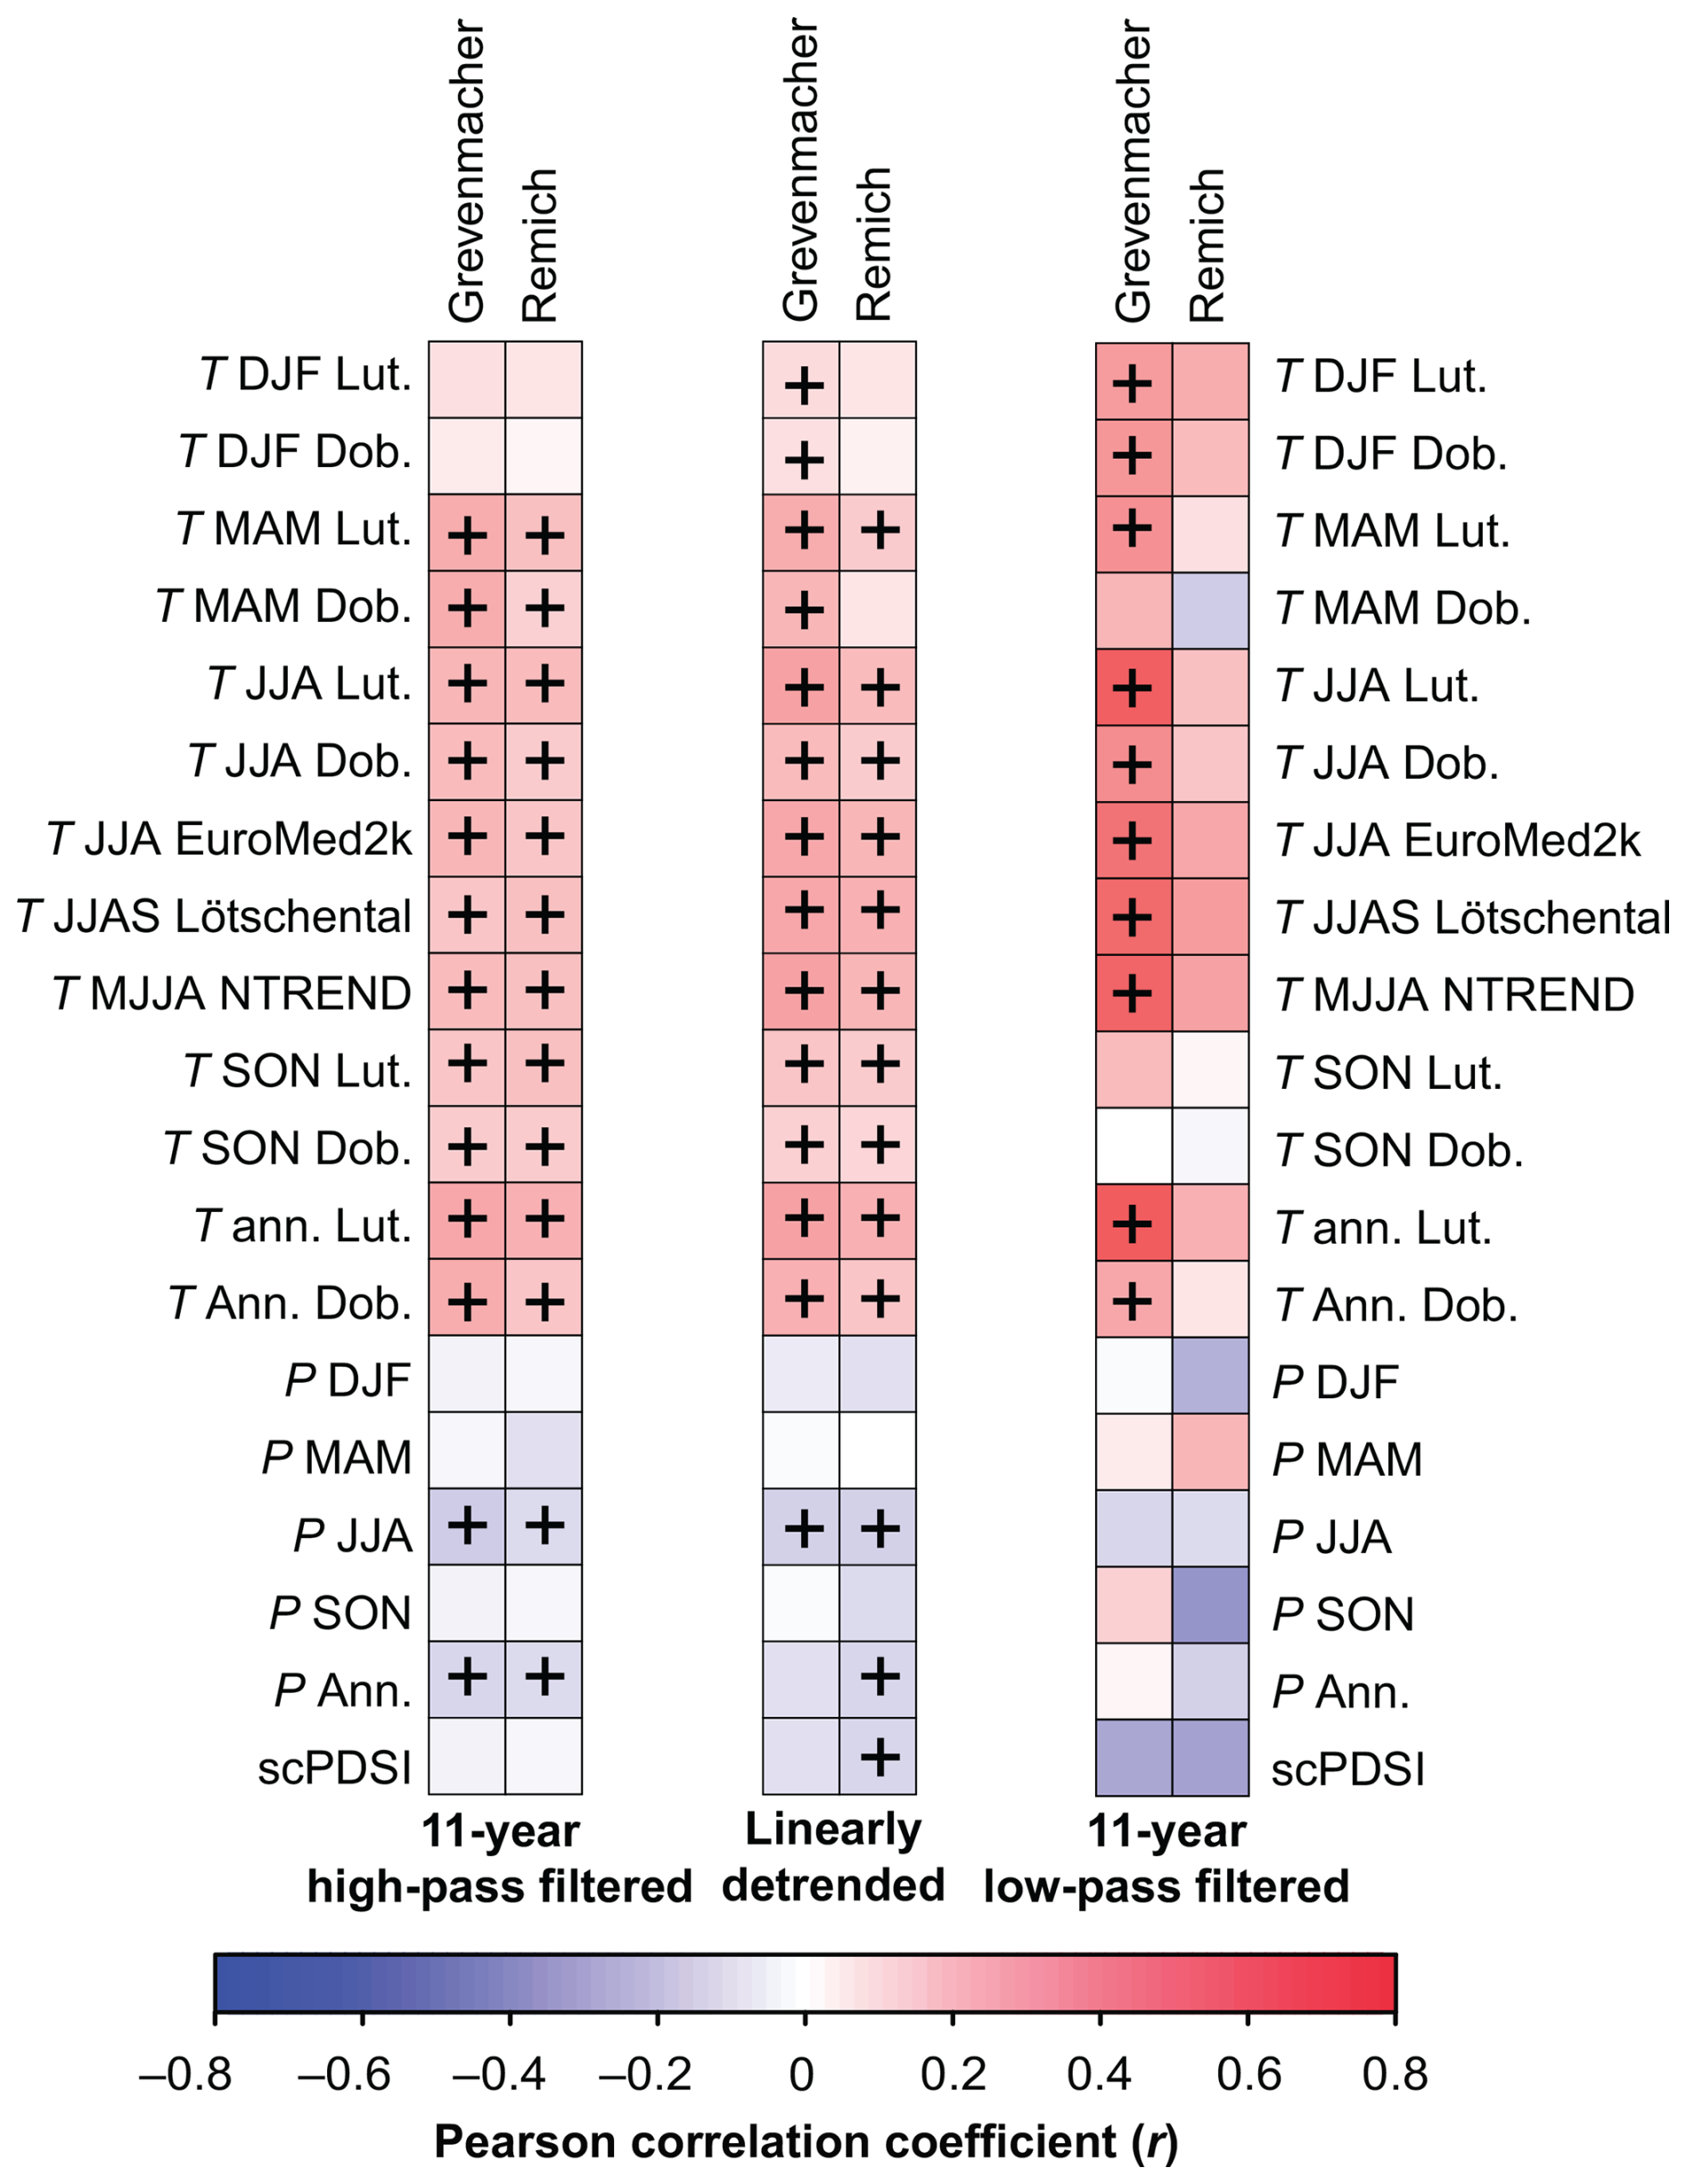
Figure 4Correlations between the (palaeo)climate series listed in Table 2 (shown vertically) and wine production quantity data from Grevenmacher and Remich (shown horizontally). The three panels are for different temporal filtering. From left to right: 11-year high-pass filtered data, linearly detrended data, and 11-year low-pass filtered data (after linearly detrending). Correlations significant at p=0.05 with the phase-scrambling test are marked with a plus sign (+).
Negative relationships, in general less significant than those with temperature, are found in the hydroclimate between precipitation and soil moisture and wine production (i.e. wetter corresponds to lower wine production and vice versa) for both 11-year high-pass filtered data and linearly detrended data. Significant relationships with hydroclimate are mostly restricted to the summer season and to the annual mean. We note that, while the correlation-based results provide the strongest signal for summer, the SEA-based results using extreme years instead show the strongest signal in spring. Nevertheless, both analyses reinforce the finding that warm and dry years and growing seasons benefited the wine production, while cold and wet years had an adverse effect. For hydroclimate, no significant correlations are found with either the Grevenmacher or the Remich series using 11-year low-pass filtered (palaeo)data.
4.1 The volcanic and climatic signals embedded in the wine production series
Our results are robust to choices regarding the exclusion of weaker volcanic forcing events and to the exclusion of individual particularly strong volcanic forcing events. Although wine tithe data amount to zero, or close to it, in the first year following certain major volcanic events (1481, 1601, 1674, 1767 and 1784), this does not necessarily mean that the vine harvest was zero or close to zero. From grain tithes, for example, in the early modern Swedish Realm (Leijonhufvud, 2001; Huhtamaa et al., 2022), we know that sometimes no tithes were collected during years with extremely low harvests. Thus, zero wine tithe indicates very low vine harvests rather than necessarily no harvest at all. Furthermore, we cannot rule out the possibility that the respective error term is skewed towards a higher resistance to taxation in years of bad harvests. Such non-linearities are very difficult to assess and can similarly affect other types of records. Nevertheless, the long-term trend in the wine tithe data is more uncertain than the short-term (inter-annual to inter-decadal) variability. Since the SEA method focuses on a 5-year period before and after each event, it is not sensitive to potential long-term trends in the data. The compositing in SEA constitutes an averaging process that serves as a filter enhancing the high-frequency response signal of interest while minimising noise and also accounts for long-term drifts (see e.g. Rao et al., 2019). We have also ensured that the response statistics to volcanic forcing are not driven by just a few major eruptions by investigating the effects of including all volcanic forcing events and of including only those exceeding different threshold values. The results are also robust to using forcings less than a threshold. We have also tested the effects of excluding only the 1783 Laki eruption (not shown) and found that this volcanic forcing event does not dominate the results, although the forcing of Laki in the Northern Hemisphere is multiple times stronger than that of any other eruption.
Regarding the climate–wine production relationships, we can emphasise that we have tested both linear and non-linear correlation methods (that is, Pearson correlation coefficient versus rank correlation methods such as Kendall and Spearman), although we only report the results of the first, as they all give similar results. The similar results imply that the non-linearity that is indeed present in the wine data (which cannot go below zero) and the various non-linearities present in palaeoclimate reconstructions have not prevented the linear Pearson correlation from rendering an accurate picture of how the series are correlated. The varying correlation strength between wine production and the different temperature reconstructions, even for the same season, is not surprising considering that the reconstructions have employed diverse input proxy data and different methods to combine the data and “calibrate” the reconstructions against instrumental temperature measurements (see, for example, Christiansen and Ljungqvist, 2017; Anchukaitis and Smerdon, 2022).
Reduced wine production for up to several years following larger volcanic forcing events can, in part, be attributed to the fact that strong eruptions cause aerosols to linger for a longer period in the atmosphere and induces feedback mechanisms in the climate system that prolong cooling (e.g. sea-ice feedbacks; Miller et al., 2012; Toohey et al., 2016). In part, it can also be attributed to a biological memory effect, and cold and frost damage, of the vine stocks during years with very poor growth conditions (Meier et al., 2018; Pfister and Wanner, 2021). Note that, while we do observe an immediate signal following larger volcanic events, the SEA results suggest that the maximum response is delayed. Biological memory effects are very well documented for tree growth (Esper et al., 2015; Hartl-Meier et al., 2017). In particular, tree-ring width depends to some degree on growth conditions in the previous year, and resulting climate reconstructions often show more auto-correlation than the instrumental target (Ljungqvist et al., 2020). As expected, auto-correlation values (AR1) reported for the time series used in this study are higher if biological archives are involved compared to documentary-based records (see Table 2). However, while a limited immediate response to abrupt volcanic cooling has been reported for many tree-ring width records (Esper et al., 2015), as opposed to maximum latewood density (MXD) records (Hartl-Meier et al., 2017), this seems not to be the case for the wine production series. Thus, in this respect, wine production shows a similar behaviour to MXD, potentially indicating that other physiological processes control fruit production than stem increment.
4.2 Further comparison between the volcanic effect on wine production and tree-ring growth
The wine production decline in Grevenmacher and Remich following volcanic forcing events contrasts to the weak volcanic response for central Europe in the state-of-the-art gridded NTREND tree-ring-based temperature reconstruction (Anchukaitis et al., 2017), the mainly tree-ring-based updated EuroMed2k temperature reconstruction (Ljungqvist et al., 2019), and the MXD-based Lötschental temperature reconstruction (Büntgen et al., 2006). The NTREND reconstruction for Europe is primarily composed of MXD data from tree rings, a temperature proxy commonly assumed to be minimally affected by biological memory (Anchukaitis et al., 2012; Esper et al., 2015). Despite remaining discussions regarding the precise quantification of volcanic signals in MXD-based reconstructions (Tingley et al., 2014; Edwards et al., 2022), there has been repeated evidence for significant cooling in MXD-based reconstructions following single events (Guillet et al., 2017; Hartl-Meier et al., 2017) and groups of eruptions at local (Rydval et al., 2017), regional (Esper et al., 2013b), and hemispheric (Wilson et al., 2016; Schneider et al., 2017) scales.
In contrast to a moderate volcanic cooling impact over central Europe, NTREND and EuroMed2k reveal strong and widespread cooling in response to tropical eruptions over Scandinavia, with a distinct transition between these two regions over the southern Baltic Sea region at around 55∘N. However, NTREND and EuroMed2k do not contain tree-ring data in Europe between 50 and 60° N, making it difficult to determine the exact location of this transition. The gridded seasonal temperature reconstruction for Europe by Luterbacher et al. (2004), using predominantly documentary data, suggests significant summer cooling that extends as far south as the northern fringe of the Alpine Arc (Fischer et al., 2007), which is in better agreement with the volcanic impact found here in wine production series from the Moselle Valley. The lack of climate-sensitive tree-ring records from central Europe (north of the Alpine Arc) is also expressed in reduced values for explained variance at the Moselle grid cell compared to the explained variance for e.g. northern Fennoscandia.
Comparison between wine production declines and tree-ring growth declines is complicated by the limited number of major volcanic forcing events during the comparatively short period covered by the two wine production series. Numerous studies of temperature-sensitive tree-ring data, from northern Europe and elsewhere, have shown a maximum growth decline (growing season cooling) during the summer in the year following the volcanic forcing event (Esper et al., 2017). Such a distinct cooling 1 year post-eruption is most evident in MXD data, compared to TRW data, owing to the typically stronger correlation with temperature and the larger biological memory in TRW (Hartl-Meier et al., 2017). Thus, the post-volcanic decrease detected in this study in wine production quantities is very similar to the post-volcanic growth decline in MXD. Nevertheless, the most noteworthy feature in the wine production data is the strong and consistent response 1 year following the volcanic forcing event, even for a low NH flux threshold (>0 and >5), that is absent in tree-ring-based temperature reconstructions for central Europe. At the mid-latitudes, where the wine production data diverge from the tree-ring-based temperature reconstructions, no reconstructions show a significant summer temperature reduction in response to a low NH forcing flux threshold.
The Moselle Valley region is situated at the northern limit of viable viticulture areas in the same way as northern Scandinavia is situated close to the Arctic tree line. Hence, both the Moselle Valley grapevines and the Scots pine trees in northern Scandinavia are thus very sensitive to temperature drops and presumably also to reduced sunlight after volcanic forcing events. The high climate sensitivity in both data types is clearly related to the marginality of the respective locations for grapevines and conifer trees. The higher climate sensitivity of the grapevines of Grevenmacher compared to Remich may also be due to different soil conditions rather than merely to the small difference in latitude. We also suggest that the explanation for the stronger, and more persistent, climate response in the wine production data than in the tree-ring data is due to physiological differences. In addition to the consistent signal 1 year following the volcanic forcing event, there is a “late response” in the wine production data after big flux events (thresholds >15 and >20). This late signal is also present in the entirely tree-ring-based NTREND (Anchukaitis et al., 2017) and (weakly) in the Lötschental (Büntgen et al., 2006) temperature reconstructions (not shown). It is more difficult to come to a conclusion about this part of the signal because there are only few events falling into this category. While it would be interesting to study the climate (and volcanic) response to tree growth and wine production from the same locations, it would be challenging because temperature-sensitive and/or precipitation-sensitive tree-ring series are rarely available from vine growing regions, with the exception of regions close to the Alps. Nevertheless, such studies could provide insights into the decorrelation length of climate versus differences in the climate sensitivity of the vine growth and tree-ring growth.
We have systematically investigated the impacts of volcanic forcing events and climate variability on two of the longest wine production quantity records (spanning 1444–1786 with gaps) in Europe deriving from the Moselle Valley close to the northern limit of viticulture. We primarily used SEA, which is particularly appropriate for episodic events. The statistical significance of the SEA was estimated with a bootstrap method. We also assessed the long-term relationship between climate and wine production using correlation analyses and calculating the significance with a conservative phase-scrambling test.
A strong negative impact of volcanic eruptions on wine production quantity was found in the year, and years, following a volcanic forcing event (Sect. 3.1). This finding is robust under removal of weaker volcanic eruptions. SEA results based on climate extremes as well as correlation analysis (11-year high- and low-pass filtered and linearly detrended) consistently show that cold and wet conditions are detrimental for wine production (Sect. 3.3). Furthermore, following volcanic eruptions, we see anomalously cold and wet conditions in the Moselle Valley region (Sect. 3.2), which, in light of the results from Sect. 3.3, indicates negative impacts on wine production. This is exactly what we find in Sect. 3.1. For both the volcanic impact on climate (Sect. 3.2) and the impact of climate extremes on wine production (Sect. 3.3), the largest effect is found in spring and summer. Thus, taken together, these findings present a consistent picture of the effect of volcanic eruptions on wine production and how it is mediated through climate.
We furthermore note that the detected volcanic signature in the Moselle Valley wine production is distinct and statistically significant (Sect. 3.1), while that of tree-ring-based temperature reconstructions for central Europe is neither (Sect. 3.2). Based on our findings, we conclude that long series of annual wine production quantity contain very valuable biological and climatic information; thus we encourage further archival research to compile and publish additional wine production quantity series from across the viticulture regions of Europe.
We have used IDL and R (R Core Team, 2022) version 3.6.3 to program the analysis codes used in this work. In R we used the package “corrplot” (Wei and Simko, 2021) to generate the correlation matrices. Data were read from mixed files using “base” libraries for text files and “openxlsx” (Schauberger and Walker, 2021) for Excel spreadsheet files. The superposed epoch analysis was performed with R code, available upon reasonable request.
The wine production data can be obtained from Appendix 1 in the article by Yante (1985, pp. 301–307). All (palaeo)climate data used are digitally available from the NOAA NCEI/World Data Center for Paleoclimatology: https://www.ncei.noaa.gov/products/paleoclimatology (NOAA, 2025). The monthly De Bilt temperature series (van Engelen and Geurts, 1985) are available from the KNMI Climate Explorer (Trouet and Van Oldenborgh, 2013): https://climexp.knmi.nl/getindices.cgi?WMO=KNMIData/labrijn&STATION=Tdebilt&TYPE=i (WMO, 2025).
FCL designed the study together with BC and PT. FCL, BC, and PT performed data analyses. BC and PT conducted the SEA and the phase-scrambling significance tests. LS especially contributed with comparisons between the volcanic signature in wine production data and tree-ring data. All authors interpreted the results and wrote the article together.
The contact author has declared that none of the authors has any competing interests.
Publisher's note: Copernicus Publications remains neutral with regard to jurisdictional claims made in the text, published maps, institutional affiliations, or any other geographical representation in this paper. While Copernicus Publications makes every effort to include appropriate place names, the final responsibility lies with the authors.
Fredrik Charpentier Ljungqvist acknowledges Visiting Researcher stays at the Institute of History, University of Bern, and at the Freiburg Institute for Advanced Studies (FRIAS) that allowed him time to work on this article. We express our appreciation to Michael Sigl, University of Bern, for lending us assistance regarding volcanic forcing datasets and to Christian Pfister, University of Bern, for stimulating and insightful discussions about wine production data and grapevine phenology. The authors thank the four reviewers whose useful comments helped improve this article.
Fredrik Charpentier Ljungqvist was supported by the Marianne and Marcus Wallenberg Foundation (grant no. MMW 2022-0114) and the Swedish Research Council (Vetenskapsrådet, grant nos. 2018-01272 and 2023-00605). He conducted the work on this article as a Pro Futura Scientia XIII Fellow funded by the Swedish Collegium for Advanced Study through Riksbankens Jubileumsfond. Bo Christiansen and Peter Thejll were supported by the National Centre for Climate Research at the Danish Meteorological Institute. Lea Schneider was supported by the German Research Foundation (SCHN 1645/1-1).
The publication of this article was funded by the Swedish Research Council, Forte, Formas, and Vinnova.
This paper was edited by Denis-Didier Rousseau and reviewed by Anders Svensson and three anonymous referees.
Allen, R. C. and Unger, R. W.: The Allen-Unger Global Commodity Prices Database, Res. Data J. Human. Social Sci., 4, 81–90, https://doi.org/10.1163/24523666-00401006, 2019. a
Anchukaitis, K. J. and Smerdon, J. E.: Progress and uncertainties in global and hemispheric temperature reconstructions of the Common Era, Quaternary Sci. Rev., 286, 107537, https://doi.org/10.1016/j.quascirev.2022.107537, 2022. a
Anchukaitis, K. J., Breitenmoser, P., Briffa, K. R., Buchwal, A., Büntgen, U., Cook, E. R., D'Arrigo, R. D., Esper, J., Evans, M. N., Frank, D., Grudd, H., Gunnarson, B., Hughes, M., Kirdyanov, A., Körner, C., Krusic, P., Luckman, B., Melvin, T. M., Salzer, M., Shashkin, A., Timmreck, C., Vaganov, E., and Wilson, R. J. S.: Tree rings and volcanic cooling, Nat. Geosci., 5, 836–837, https://doi.org/10.1038/ngeo1645, 2012. a, b
Anchukaitis, K. J., Wilson, R., Briffa, K. R., Büntgen, U., Cook, E. R., D'Arrigo, R., Davi, N., Esper, J., Frank, D., Gunnarson, B. E., Hegerl, G., Helama, S., Klesse, S., Krusic, P., Linderholm, H. W., Myglan, V., Osborn, T. J., Zhang, P., Rydval, M., Schneider, L. Z., and Zorita, E.: Last millennium Northern Hemisphere summer temperatures from tree rings: Part II, spatially resolved reconstructions, Quaternary Sci. Rev., 163, 1–22, https://doi.org/10.1016/j.quascirev.2017.02.020, 2017. a, b, c, d, e
Andrade, C., Fonseca, A., Santos, J. A., Bois, B., and Jones, G. V.: Historic changes and future projections in Köppen–Geiger climate classifications in major wine regions worldwide, Climate, 12, 94, https://doi.org/10.3390/cli12070094, 2024. a
Bock, A., Sparks, T. H., Estrella, N., and Menzel, A.: Climate-induced changes in grapevine yield and must sugar content in Franconia (Germany) between 1805 and 2010, PloS One, 8, e69015, https://doi.org/10.1371/journal.pone.0069015, 2013. a
Brönnimann, S. and Krämer, D.: Tambora and the “Year Without a Summer” of 1816: A Perspective on Earth and Human Systems Science, Oeschger Centre for Climate Change Research, University of Bern, Bern, 48 pp., https://doi.org/10.4480/GB2016.G90.01, 2016. a
Büntgen, U., Frank, D. C., Nievergelt, D., and Esper, J.: Summer temperature variations in the European Alps, AD 755–2004, J. Climate, 19, 5606–5623, https://doi.org/10.1175/JCLI3917.1, 2006. a, b, c, d
Büntgen, U., Allen, K., Anchukaitis, K. J., Arseneault, D., Boucher, É., Bräuning, A., Chatterjee, S., Cherubini, P., Churakova, O. V., Corona, C., Gennaretti, F., Griessinger, J., Guillet, S., Guiot, J., Gunnarson, B., Helama, S., Hochreuther, P., Hughes, M. K., Huybers, P., Kirdyanov, A. V., Krusic, P. J., Ludescher, J., Meier, W. J.-H., Myglan, V. S., Nicolussi, K., Oppenheimer, C., Reinig, F., Salzer, M. W., Seftigen, K., Stine, A. R., Stoffel, M., St. George, S., Tejedor, E., Trevino, A., Trouet, V., Wang, J., Wilson, R., Yang, B., Xu, G., and Esper, J.: The influence of decision-making in tree ring-based climate reconstructions, Nat. Commun., 12, 3411, https://doi.org/10.1038/s41467-021-23627-6, 2021. a
Burke, A., Innes, H. M., Crick, L., Anchukaitis, K. J., Byrne, M. P., Hutchison, W., McConnell, J. R., Moore, K. A., Rae, J. W., Sigl, M., and Wilson, R.: High sensitivity of summer temperatures to stratospheric sulfur loading from volcanoes in the Northern Hemisphere, P. Natl. Acad. Sci. USA, 120, e2221810120, https://doi.org/10.1073/pnas.2221810120, 2023. a
Chim, M. M., Aubry, T. J., Abraham, N. L., Marshall, L., Mulcahy, J., Walton, J., and Schmidt, A.: Climate projections very likely underestimate future volcanic forcing and its climatic effects, Geophys. Res. Lett., 50, e2023GL103743, https://doi.org/10.1029/2023GL103743, 2023. a
Chree, C.: Some Phenomena of Sunspots and of Terrestrial Magnetism at Kew Observatory, Philos. T. Roy. Soc. Lond., 212, 75–116, https://doi.org/10.1098/rsta.1913.0003, 1913. a
Chree, C.: Some phenomena of sunspots and of terrestrial magnetism. Part II, Philos. T. Roy. Soc. Lond., 213, 245–277, https://doi.org/10.1098/rsta.1914.0006, 1914. a
Christiansen, B. and Ljungqvist, F. C.: Challenges and perspectives for large-scale temperature reconstructions of the past two millennia, Rev. Geophys., 55, 40–96, https://doi.org/10.1002/2016RG000521, 2017. a
Chuine, I., Yiou, P., Viovy, N., Seguin, B., Daux, V., and Ladurie Le Roy, E.: Grape ripening as a past climate indicator, Nature, 432, 289–290, https://doi.org/10.1038/432289a, 2004. a
Cook, B. I. and Wolkovich, E. M.: Climate change decouples drought from early wine grape harvests in France, Nat. Clim. Change, 6, 715–719, https://doi.org/10.1038/nclimate2960, 2016. a
Cook, E. R., Seager, R., Kushnir, Y., Briffa, K. R., Büntgen, U., Frank, D., Krusic, P. J., Tegel, W., van der Schrier, G., Andreu-Hayles, L., Baillie, M., Baittinger, C., Bleicher, N., Bonde, N., Brown, D., Carrer, M., Cooper, R., Čufar, K., Dittmar, C., Esper, J., Griggs, C., Gunnarson, B., Günther, B., Gutierrez, E., Haneca, K., Helama, S., Herzig, F., Heussner, K.-U., Hofmann, J., Janda, P., Kontic, R., Köse, N., Kyncl, T., Levanič, T., Linderholm, H., Manning, S., Melvin, T. M., Miles, D., Neuwirth, B., Nicolussi, K., Nola, P., Panayotov, M., Popa, I., Rothe, A., Seftigen, K., Seim, A., Svarva, H., Svoboda, M., Thun, T., Timonen, M., Touchan, R., Trotsiuk, V., Trouet, V., Walder, F., Wa·ny, T., Wilson, R., and Zang, C.: Old World megadroughts and pluvials during the Common Era, Sci. Adv., 1, e1500561, https://doi.org/10.1126/sciadv.1500561, 2015. a, b
D'Arrigo, R., Wilson, R., and Anchukaitis, K. J.: Volcanic cooling signal in tree ring temperature records for the past millennium, J. Geophys. Res.-Atmos., 118, 9000–9010, https://doi.org/10.1002/jgrd.50692, 2013. a
D'Arrigo, R., Klinger, P., Newfield, T., Rydval, M., and Wilson, R.: Complexity in crisis: The volcanic cold pulse of the 1690s and the consequences of Scotland's failure to copes, J. Volcanol. Geoth. Res., 389, 106746, https://doi.org/10.1016/j.jvolgeores.2019.106746, 2020. a
de Cortaázar Atauri, I. G., Duchêne, E., Destrac, A., Barbeau, G., De Rességuier, L., Lacombe, T., Parker, A. K., Saurin, N., and Van Leeuwen, C.: Grapevine phenology in France: from past observations to future evolutions in the context of climate change, OENO One, 51, 115–126, https://doi.org/10.20870/oeno-one.2017.51.2.1622, 2017. a
Dobrovolný, P., Moberg, A., Brázdil, R., Pfister, C., Glaser, R., Wilson, R., van Engelen, A., Limanówka, D., Kiss, A., Halíčková, M., Macková, J., Riemann, D., Luterbacher, J., and Böhm, R.: Monthly, seasonal and annual temperature reconstructions for Central Europe derived from documentary evidence and instrumental records since AD 1500, Climatic Change, 101, 69–107, https://doi.org/10.1007/s10584-009-9724-x, 2010. a, b, c, d
Drappier, J., Thibon, C., Rabot, A., and Geny-Denis, L.: Relationship between wine composition and temperature: Impact on Bordeaux wine typicity in the context of global warming, Crit. Rev. Food Sci. Nutr., 59, 14–30, https://doi.org/10.1080/10408398.2017.1355776, 2019. a
Droulia, F. and Charalampopoulos, I.: A review on the observed climate change in Europe and its impacts on viticulture, Atmosphere, 13, 837, https://doi.org/10.3390/atmos13050837, 2022. a
Eddy, J. A.: The Maunder Minimum, Science, 192, 1189–1202, https://doi.org/10.1126/science.192.4245.1189, 1976. a
Edwards, J., Anchukaitis, K. J., Gunnarson, B. E., Pearson, C., Seftigen, K., von Arx, G., and Linderholm, H. W.: The origin of tree-ring reconstructed summer cooling in northern Europe during the 18th century eruption of Laki, Paleoceanogr. Paleoclimatol., 37, e2021PA004386, https://doi.org/10.1029/2021PA004386, 2022. a
Esper, J., Büntgen, U., Luterbacher, J., and Krusic, P. J.: Testing the hypothesis of post-volcanic missing rings in temperature sensitive dendrochronological data, Dendrochronologia, 31, 216–222, https://doi.org/10.1016/j.dendro.2012.11.002, 2013a. a
Esper, J., Schneider, L., Krusic, P. J., Luterbacher, J., Büntgen, U., Timonen, M., Sirocko, F., and Zorita, E.: European summer temperature response to annually dated volcanic eruptions over the past nine centuries, Bull. Volcanol., 75, 1–14, https://doi.org/10.1007/s00445-013-0736-z, 2013b. a
Esper, J., Schneider, L., Smerdon, J. E., Schöne, B. R., and Büntgen, U.: Signals and memory in tree-ring width and density data, Dendrochronologia, 35, 62–70, https://doi.org/10.1016/j.dendro.2015.07.001, 2015. a, b, c
Esper, J., Krusic, P. J., Ljungqvist, F. C., Luterbacher, J., Carrer, M., Cook, E., Davi, N. K., Hartl-Meier, C., Kirdyanov, A., Konter, O., Myglan, V., Timonen, M., Treydte, K., Trouet, V., Villalba, R., Yang, B., and Büntgen, U.: Ranking of tree-ring based temperature reconstructions of the past millennium, Quaternary Sci. Rev., 145, 134–151, https://doi.org/10.1016/j.quascirev.2019.106074, 2016. a
Esper, J., Büntgen, U., Hartl-Meier, C., Oppenheimer, C., and Schneider, L.: Northern Hemisphere temperature anomalies during the 1450s period of ambiguous volcanic forcing, Bull. Volcanol., 79, 41, https://doi.org/10.1007/s00445-017-1125-9, 2017. a
Fischer, E. M., Luterbacher, J., Zorita, E., Tett, S., Casty, C., and Wanner, H.: European climate response to tropical volcanic eruptions over the last half millennium, Geophys. Res. Lett., 34, L05707, https://doi.org/10.1029/2006GL027992, 2007. a
Garcia de Cortazar-Atauri, I., Daux, V., Garnier, E., Yiou, P., Viovy, N., Seguin, B., Boursiquot, J., Parker, A., Van Leeuwen, C., and Chuine, I.: Climate reconstructions from grape harvest dates: Methodology and uncertainties, Holocene, 20, 599–608, https://doi.org/10.1177/0959683609356585, 2010. a
Garnier, E., Daux, V., Yiou, P., and García de Cortázar-Atauri, I.: Grapevine harvest dates in Besançon (France) between 1525 and 1847: Social outcomes or climatic evidence?, Climatic Change, 104, 703–727, https://doi.org/10.1007/s10584-010-9810-0, 2011. a
Guerreau, A.: Climat et vendanges (XIVe–XIXe siècles): révisions et compléments, Histoire & Mesure, 10, 89–147, 1995. a
Guillet, S., Corona, C., Stoffel, M., Khodri, M., Lavigne, F., Ortega, P., Eckert, N., Sielenou, P. D., Daux, V., Churakova (Sidorova), O. V., Davi, N., Edouard, J.-L., Zhang, Y., Luckman, B. H., Myglan, V. S., Guiot, J., Beniston, M., Masson-Delmotte V., and Oppenheimer, C.: Climate response to the Samalas volcanic eruption in 1257 revealed by proxy records, Nat. Geosci., 10, 123–128, https://doi.org/10.1038/ngeo2875, 2017. a, b, c
Guillet, S., Corona, C., Ludlow, F., Oppenheimer, C., and Stoffel, M.: Climatic and societal impacts of a “forgotten” cluster of volcanic eruptions in 1108–1110 CE, Sci. Rep., 10, 1–10, https://doi.org/10.1038/s41598-020-63339-3, 2020. a
Guiot, J., Bernigaud, N., Bondeau, A., Bouby, L., and Cramer, W.: Viticulture extension in response to global climate change drivers – lessons from the past and future projections, Clim. Past, 19, 1219–1244, https://doi.org/10.5194/cp-19-1219-2023, 2023. a
Hartl-Meier, C., Büntgen, U., Smerdon, J. E., Zorita, E., Krusic, P. J., Ljungqvist, F. C., Schneider, L., and Esper, J.: Temperature covariance in tree ring reconstructions and model simulations over the past millennium, Geophys. Res. Lett., 44, 9458–9469, https://doi.org/10.1002/2017GL073239, 2017. a, b, c, d, e
Huhtamaa, H., Stoffel, M., and Corona, C.: Recession or resilience? Long-range socioeconomic consequences of the 17th century volcanic eruptions in northern Fennoscandia, Clim. Past, 18, 2077–2092, https://doi.org/10.5194/cp-18-2077-2022, 2022. a, b
Jones, G. V., White, M. A., Cooper, O. R., and Storchmann, K.: Climate change and global wine quality, Climatic Change, 73, 319–343, https://doi.org/10.1007/s10584-005-4704-2, 2005. a
Jungclaus, J. H., Bard, E., Baroni, M., Braconnot, P., Cao, J., Chini, L. P., Egorova, T., Evans, M., González-Rouco, J. F., Goosse, H., Hurtt, G. C., Joos, F., Kaplan, J. O., Khodri, M., Klein Goldewijk, K., Krivova, N., LeGrande, A. N., Lorenz, S. J., Luterbacher, J., Man, W., Maycock, A. C., Meinshausen, M., Moberg, A., Muscheler, R., Nehrbass-Ahles, C., Otto-Bliesner, B. I., Phipps, S. J., Pongratz, J., Rozanov, E., Schmidt, G. A., Schmidt, H., Schmutz, W., Schurer, A., Shapiro, A. I., Sigl, M., Smerdon, J. E., Solanki, S. K., Timmreck, C., Toohey, M., Usoskin, I. G., Wagner, S., Wu, C.-J., Yeo, K. L., Zanchettin, D., Zhang, Q., and Zorita, E.: The PMIP4 contribution to CMIP6 – Part 3: The last millennium, scientific objective, and experimental design for the PMIP4 past1000 simulations, Geosci. Model Dev., 10, 4005–4033, https://doi.org/10.5194/gmd-10-4005-2017, 2017. a
Kain, R.: Tithe as an index of pre-industrial agricultural production, Agric. Hist. Rev., 27, 73–81, 1979. a
Keenan, D.: Grape harvest dates are poor indicators of summer warmth, Theor. Appl. Climatol., 87, 255–256, https://doi.org/10.1007/s00704-006-0197-9, 2007. a
Kiss, A., Wilson, R., and Bariska, I.: An experimental 392-year-based multi-proxy (vine and grain) reconstruction of May–July temperatures for Kőszeg, West-Hungary, Int. J. Biometeorol., 55, 595–611, https://doi.org/10.1007/s00484-010-0367-4, 2011. a
Körner, C.: The cold range limit of trees, Trends Ecol. Evol., 36, 979–989, https://doi.org/10.1016/j.tree.2021.06.011, 2021. a
Labbé, T., Pfister, C., Brönnimann, S., Rousseau, D., Franke, J., and Bois, B.: The longest homogeneous series of grape harvest dates, Beaune 1354–2018, and its significance for the understanding of past and present climate, Clim. Past, 15, 1485–1501, https://doi.org/10.5194/cp-15-1485-2019, 2019. a, b
Lachiver, M.: Vins, vignes et vignerons. Histoire du vignoble français, Fayard, Paris, 718 pp., ISBN 9782213612553, 1988. a
Ladurie Le Roy, E. and Baulant, M.: Grape harvests from the fifteenth through the nineteenth centuries, J. Interdisciplin. Hist., 10, 839–849, https://doi.org/10.2307/203075, 1980. a
Landsteiner, E.: The crisis of wine production in late sixteenth-century central Europe: Climatic causes and economic consequences, Climatic Change, 43, 323–334, https://doi.org/10.1023/A:1005590115970, 1999. a
Leijonhufvud, L.: Grain Tithes and Manorial Yields in Early Modern Sweden: Trends and Patterns of Production and Productivity c. 1540–1680, PhD thesis, Swedish University of Agricultural Sciences, Ulltuna, 359 pp., ISBN 9157658293, 2001. a, b
Le Roy Ladurie, E. and Goy, J.: Tithe and Agrarian History from the Fourteenth to the Nineteenth Century: An Essay in Comparative History, Cambridge University Press, Cambridge, 217 pp., https://doi.org/10.1017/CBO9780511897412, 1982. a
Le Roy Ladurie, E., Daux, V., and Luterbacher, J.: Le climat de Bourgogne et d'ailleurs XIVe–XXe siècle, Hist. Econ. Soc., 25, 421–436, 2006. a
Ljungqvist, F. C., Seim, A., Krusic, P. J., González-Rouco, J. F., Werner, J. P., Cook, E. R., Zorita, E., Luterbacher, J., Xoplaki, E., Destouni, G., García-Bustamante, E., Aguilar, C. A. M., Seftigen, K., Wang, J., Gagen, M. H., Esper, J., Solomina, O., Fleitmann, D., and Büntgen, U.: European warm-season temperature and hydroclimate since 850 CE, Environ. Res. Lett., 14, 084015, https://doi.org/10.1088/1748-9326/ab2c7e, 2019. a, b, c, d
Ljungqvist, F. C., Thejll, P., Björklund, J., Gunnarson, B. E., Piermattei, A., Rydval, M., Seftigen, K., Støve, B., and Büntgen, U.: Assessing non-linearity in European temperature-sensitive tree-ring data, Dendrochronologia, 59, 125652, https://doi.org/10.1016/j.dendro.2019.125652, 2020. a
Ljungqvist, F. C., Seim, A., and Huhtamaa, H.: Climate and society in European history, Wiley Interdisciplin. Rev.: Clim. Change, 12, e691, https://doi.org/10.1002/wcc.691, 2021. a
Ljungqvist, F. C., Thejll, P., Christiansen, B., Seim, A., Hartl, C., and Esper, J.: The significance of climate variability on early modern European grain prices, Cliometrica, 16, 29–77, https://doi.org/10.1007/s11698-021-00224-7, 2022. a
Ljungqvist, F. C., Christiansen, B., Esper, J., Huhtamaa, H., Leijonhufvud, L., Pfister, C., Seim, A., Skoglund, M. K., and Thejll, P.: Climatic signatures in early modern European grain harvest yields, Clim. Past, 19, 2463–2491, https://doi.org/10.5194/cp-19-2463-2023, 2023. a
Ljungqvist, F. C., Seim, A., and Collet, D.: Famines in medieval and early modern Europe – Connecting climate and society, Wiley Interdisciplin. Rev.: Clim. Change, 15, e859, https://doi.org/10.1002/wcc.859, 2024. a
Luterbacher, J., Dietrich, D., Xoplaki, E., Grosjean, M., and Wanner, H.: European seasonal and annual temperature variability, trends, and extremes since 1500, Science, 303, 1499–1503, https://doi.org/10.1126/science.1093877, 2004. a, b, c, d, e, f, g, h, i, j, k, l, m, n, o, p, q, r, s, t, u, v, w, x
Luterbacher, J., Werner, J. P., Smerdon, J. E., Fernández-Donado, L., González-Rouco, F., Barriopedro, D., Ljungqvist, F. C., Büntgen, U., Zorita, E., Wagner, S., Esper, J., Frank, D., Barriendos, M., Bertolin, C., Bothe, O., Brázdil, R., Camuffo, D., Dobrovolný, P., Gagen, M., García-Bustamante, E., Ge, Q., Gómez-Navarro, J., Guiot, J., Hao, Z., Hegerl, G., Holmgren, K., Jungclaus, J., Klimenko, V., Martín-Chivelet, J., McCarroll, D., Pfister, C., Roberts, N., Schindler, A., Schurer, A., Solomina, O., Toreti, A., von Gunten, L., Wahl, E., Wanner, H., Wetter, O., Xoplaki, E., Yuan, N., Zanchettin, D., Zhang, H., and Zerefos, C.: European summer temperatures since Roman times, Environ. Res. Lett., 11, 024001, https://doi.org/10.1088/1748-9326/11/2/024001, 2016. a, b
Malheiro, A. C., Santos, J. A., Fraga, H., and Pinto, J. G.: Climate change scenarios applied to viticultural zoning in Europe, Clim. Res., 43, 163–177, https://doi.org/10.3354/cr00918, 2010. a
Martin, P., Brown, T. A., George, T. S., Gunnarson, B., Loader, N. J., Ross, P., Wishart, J., and Wilson, R.: Climatic controls on the survival and loss of ancient types of barley on North Atlantic Islands, Climatic Change, 176, 1–20, https://doi.org/10.1007/s10584-022-03474-0, 2023. a
Maurer, C., Hammerl, C., Koch, E., Hammerl, T., and Pokorny, E.: Extreme grape harvest data of Austria, Switzerland and France from AD 1523 to 2007 compared to corresponding instrumental/reconstructed temperature data and various documentary sources, Theor. Appl. Climatol., 106, 55–68, https://doi.org/10.1007/s00704-011-0410-3, 2011. a
Meier, M., Fuhrer, J., and Holzkämper, A.: Changing risk of spring frost damage in grapevines due to climate change? A case study in the Swiss Rhone Valley, Int. J. Biometeorol., 62, 991–1002, https://doi.org/10.1007/s00484-018-1501-y, 2018. a, b, c
Meier, N., Rutishauser, T., Pfister, C., Wanner, H., and Luterbacher, J.: Grape harvest dates as a proxy for Swiss April to August temperature reconstructions back to AD 1480, Geophys. Res. Lett., 34, L20705, https://doi.org/10.1029/2007GL031381, 2007. a
Miller, G. H., Geirsdóttir, Á., Zhong, Y., Larsen, D. J., Otto-Bliesner, B. L., Holland, M. M., Bailey, D. A., Refsnider, K. A., Lehman, S. J., Southon, J. R., Anderson, C., Björnsson, H., and Thordarson, T.: Abrupt onset of the Little Ice Age triggered by volcanism and sustained by sea-ice/ocean feedbacks, Geophys. Res. Lett., 39, L02708, https://doi.org/10.1029/2011GL050168, 2012. a
Morales-Castilla, I., de Cortázar-Atauri, I. G., Cook, B. I., Lacombe, T., Parker, A., van Leeuwen, C., Nicholas, K. A., and Wolkovich, E. M.: Diversity buffers winegrowing regions from climate change losses, P. Natl. Acad. Sci. USA, 117, 2864–2869, https://doi.org/10.1073/pnas.1906731117, 2020. a
Možný, M., Brázdil, R., Dobrovolný, P., and Trnka, M.: April–August temperatures in the Czech Lands, 1499–2015, reconstructed from grape-harvest dates, Clim. Past, 12, 1421–1434, https://doi.org/10.5194/cp-12-1421-2016, 2016a. a
Možný, M., Brázdil, R., Dobrovolný, P., Trnka, M., Potopová, V., Hlavinka, P., Zahradníček, P., Štěpánek, P., and Žalud, Z.: Drought reconstruction based on grape harvest dates for the Czech Lands, 1499–2012, Clim. Res., 70, 119–132, https://doi.org/10.3354/cr01423, 2016b. a
Mullins, M. G., Bouquet, A., and Williams, L. E.: Biology of the Grapevine, Cambridge University Press, Cambridge, 252 pp., ISBN 9780521305075, 1992. a
NOAA – National Oceanic and Atmospheric Administration's: Paleoclimatology Program: Paleoclimatology, NOAA [data set], https://www.ncei.noaa.gov/products/paleoclimatology (last access: 30 January 2025), 2025. a
Oppenheimer, C.: Eruptions that Shook the World, Cambridge University Press, Cambridge, 406 pp., ISBN 978-0-521-64112-8, 2011. a
Pauling, A., Luterbacher, J., Casty, C., and Wanner, H.: Five hundred years of gridded high-resolution precipitation reconstructions over Europe and the connection to large-scale circulation, Clim. Dynam., 26, 387–405, https://doi.org/10.1007/s00382-005-0090-8, 2006. a, b, c, d, e, f, g, h, i, j, k, l, m, n, o, p, q, r, s, t, u
Pfister, C.: Die Fluktuationen der Weinmosterträge im schweizerischen Weinland vom 16. bis ins frühe 19. Jahrhundert: klimatische Ursachen und sozioökonomische Bedeutung, Schweizerische Zeitschrift für Geschichte, 31, 445–491, 1981. a
Pfister, C.: Klimageschichte der Schweiz 1525–1860. Das Klima der Schweiz und seine Bedeutung in der Geschichte von Bevölkerung und Landwirtschaft, in: vol. 2, Verlag Paul Haupt, Bern, 245 and 174 pp., ISBN 9783258039565, 1984. a
Pfister, C. and Wanner, H.: Climate and Society in Europe: The Last Thousand Years, Haupt Verlag, Bern, 397 pp., ISBN 978-3-258-08234-9, 2021. a, b, c, d
Pfister, C., Brönnimann, S., Altwegg, A., Brázdil, R., Litzenburger, L., Lorusso, D., and Pliemon, T.: 600 years of wine must quality and April to August temperatures in western Europe 1420–2019, Clim. Past, 20, 1387–1399, https://doi.org/10.5194/cp-20-1387-2024, 2024. a, b, c
Rao, M. P., Cook, E. R., Cook, B. I., Anchukaitis, K. J., D'Arrigo, R. D., Krusic, P. J., and LeGrande, A. N.: A double bootstrap approach to Superposed Epoch Analysis to evaluate response uncertainty, Dendrochronologia, 55, 119–124, https://doi.org/10.1016/j.dendro.2019.05.001, 2019. a, b
R Core Team: R: A Language and Environment for Statistical Computing, R Foundation for Statistical Computing, Vienna, Austria, https://www.R-project.org/ (last access: 28 January 2025), 2022. a
Robock, A.: Volcanic eruptions and climate, Rev. Geophys., 38, 191–219, https://doi.org/10.1029/1998RG000054, 2000. a
Rydval, M., Loader, N. J., Gunnarson, B. E., Druckenbrod, D. L., Linderholm, H. W., Moreton, S. G., Wood, C. V., and Wilson, R.: Reconstructing 800 years of summer temperatures in Scotland from tree rings, Clim. Dynam., 49, 2951–2974, https://doi.org/10.1007/s00382-016-3478-8, 2017. a
Schauberger, P. and Walker, A.: openxlsx: Read, Write and Edit xlsx Files, r package version 4.2.5, CRAN, https://CRAN.R-project.org/package=openxlsx (last access: 12 January 2025), 2021. a
Schneider, L., Smerdon, J. E., Büntgen, U., Wilson, R. J., Myglan, V. S., Kirdyanov, A. V., and Esper, J.: Revising midlatitude summer temperatures back to AD 600 based on a wood density network, Geophys. Res. Lett., 42, 4556–4562, https://doi.org/10.1002/2015GL063956, 2015. a
Schneider, L., Smerdon, J. E., Pretis, F., Hartl-Meier, C., and Esper, J.: A new archive of large volcanic events over the past millennium derived from reconstructed summer temperatures, Environ. Res. Lett., 12, 094005, https://doi.org/10.1088/1748-9326/aa7a1b, 2017. a, b
Sigl, M., Winstrup, M., McConnell, J. R., Welten, K. C., Plunkett, G., Ludlow, F., Büntgen, U., Caffee, M., Chellman, N., Dahl-Jensen, D., Fischer, H., Kipfstuhl, S., Kostick, C., Maselli, O. J., Mekhaldi, F., Mulvaney, R., Muscheler, R., Pasteris, D. R., Pilcher, J. R., Salzer, M., Schüpbach, S., Steffensen, J. P., Vinther, B. M., and Woodruff, T. E.: Timing and climate forcing of volcanic eruptions for the past 2,500 years, Nature, 523, 543–549, https://doi.org/10.1038/nature14565, 2015. a, b, c
Skoglund, M. K.: Farming at the margin: Climatic impacts on harvest yields and agricultural practices in Central Scandinavia, c. 1560–1920, Agricult. Hist. Rev., 71, 203–233, 2023. a
Squintu, A. A., van der Schrier, G., Brugnara, Y., and Tank, A. K.: Homogenization of daily temperature series in the European Climate Assessment and Dataset, Int. J. Climatol., 39, 1243–1261, https://doi.org/10.1002/joc.5874, 2019. a
Steinhilber, F., Beer, J., and Fröhlich, C.: Total solar irradiance during the Holocene, Geophys. Res. Lett., 36, L19704, https://doi.org/10.1029/2009GL040142, 2009. a
Stoffel, M., Khodri, M., Corona, C., Guillet, S., Poulain, V., Bekki, S., Guiot, J., Luckman, B. H., Oppenheimer, C., Lebas, N., Beniston, M., and Masson-Delmotte, V.: Estimates of volcanic-induced cooling in the Northern Hemisphere over the past 1,500 years, Nat. Geosci., 8, 784–788, 2015. a, b
Stoffel, M., Corona, C., Ludlow, F., Sigl, M., Huhtamaa, H., Garnier, E., Helama, S., Guillet, S., Crampsie, A., Kleemann, K., Camenisch, C., McConnell, J., and Gao, C.: Climatic, weather, and socio-economic conditions corresponding to the mid-17th-century eruption cluster, Clim. Past, 18, 1083–1108, https://doi.org/10.5194/cp-18-1083-2022, 2022. a
Tingley, M. P., Stine, A. R., and Huybers, P.: Temperature reconstructions from tree-ring densities overestimate volcanic cooling, Geophys. Res. Lett., 41, 7838–7845, https://doi.org/10.1002/2014GL061268, 2014. a
Toohey, M. and Sigl, M.: Volcanic stratospheric sulfur injections and aerosol optical depth from 500 BCE to 1900 CE, Earth Syst. Sci. Data, 9, 809–831, https://doi.org/10.5194/essd-9-809-2017, 2017. a, b, c, d, e
Toohey, M., Krüger, K., Sigl, M., Stordal, F., and Svensen, H.: Climatic and societal impacts of a volcanic double event at the dawn of the Middle Ages, Climatic Change, 136, 401–412, https://doi.org/10.1007/s10584-016-1648-7, 2016. a
Trouet, V. and Van Oldenborgh, G. J.: KNMI Climate Explorer: a web-based research tool for high-resolution paleoclimatology, Tree-Ring Res., 69, 3–13, https://doi.org/10.3959/1536-1098-69.1.3, 2013. a
Urhausen, S., Brienen, S., Kapala, A., and Simmer, C.: Climatic conditions and their impact on viticulture in the Upper Moselle region, Climatic Change, 109, 349–373, https://doi.org/10.1007/s10584-011-0059-z, 2011. a
van der Schrier, G., Jones, P., and Briffa, K.: The sensitivity of the PDSI to the Thornthwaite and Penman-Monteith parameterizations for potential evapotranspiration, J. Geophys. Res.-Atmos., 116, D03106, https://doi.org/10.1029/2010JD015001, 2011. a
van Engelen, A. and Geurts, H.: Nicaulaus Cruquius (1678–1754) and his Meteorological Observations, Koninklijk Nederlands Meteorologisch Instituut, https://cdn.knmi.nl/knmi/pdf/bibliotheek/knmipubmetnummer/knmipub165_IV.pdf (last access: 30 January 2025), 1985. a, b
van Leeuwen, C., Sgubin, G., Bois, B., Ollat, N., Swingedouw, D., Zito, S., and Gambetta, G. A.: Climate change impacts and adaptations of wine production, Nat. Rev. Earth Environ., 5, 258–275, https://doi.org/10.1038/s43017-024-00521-5, 2024. a
Venios, X., Korkas, E., Nisiotou, A., and Banilas, G.: Grapevine responses to heat stress and global warming, Plants, 9, 1754, https://doi.org/10.3390/plants9121754, 2020. a
von Storch, H. and Zwiers, F.: Statistical Analysis in Climate Research, Cambridge University Press, Cambridge, 484 pp., ISBN 9780521450713, 1999. a
Wanner, H., Pfister, C., and Neukom, R.: The variable European Little Ice Age, Quaternary Sci. Rev., 287, 107531, https://doi.org/10.1016/j.quascirev.2022.107531, 2022. a, b
Wei, T. and Simko, V.: R package `corrplot': Visualization of a Correlation Matrix (Version 0.92), GitHub [code], https://github.com/taiyun/corrplot (last access: 30 January 2025), 2021. a
White, S., Moreno-Chamarro, E., Zanchettin, D., Huhtamaa, H., Degroot, D., Stoffel, M., and Corona, C.: The 1600 CE Huaynaputina eruption as a possible trigger for persistent cooling in the North Atlantic region, Clim. Past, 18, 739–757, https://doi.org/10.5194/cp-18-739-2022, 2022. a
Wilson, R., Anchukaitis, K., Briffa, K. R., Büntgen, U., Cook, E., D'Arrigo, R., Davi, N. N., Esper, J. H., Frank, D., Gunnarson, B., Hegerl, G., Helama, S., Klesse, S., Krusic, P. J., Linderholm, H. W., Myglan, V., Osborn, T. J., Rydval, M., Schneider, L., Schurer, A., and Zorita, E.: Last millennium Northern Hemisphere summer temperatures from tree rings: Part I: The long term context, Quaternary Sci. Rev., 134, 1–18, https://doi.org/10.1016/j.quascirev.2015.12.005, 2016. a, b
WMO: Time series, WMO [data set], https://climexp.knmi.nl/getindices.cgi?WMO=KNMIData/labrijn&STATION=Tdebilt&TYPE=i (last access: 30 January 2025), 2025. a
Xoplaki, E., Luterbacher, J., Paeth, H., Dietrich, D., Steiner, N., Grosjean, M., and Wanner, H.: European spring and autumn temperature variability and change of extremes over the last half millennium, Geophys. Res. Lett., 32, L15713, https://doi.org/10.1029/2005GL023424, 2005. a, b
Yante, J.-M.: Grains et vins des terroirs mosellans de Remich et Grevenmacher (XVe–XVIIIe siècles), Revue belge de Philologie et d'Histoire, 273–309, https://www.persee.fr/doc/rbph_0035-0818_1985_num_63_2_3504 (last access: 20 January 2025), 1985. a, b, c, d, e, f
Yiou, P., García de Cortázar-Atauri, I., Chuine, I., Daux, V., Garnier, E., Viovy, N., van Leeuwen, C., Parker, A. K., and Boursiquot, J.-M.: Continental atmospheric circulation over Europe during the Little Ice Age inferred from grape harvest dates, Clim. Past, 8, 577–588, https://doi.org/10.5194/cp-8-577-2012, 2012. a