the Creative Commons Attribution 4.0 License.
the Creative Commons Attribution 4.0 License.
 | 04 Sep 2025
Strong wind occurrence in Poland from the 13th to 16th centuries based on documentary evidence
Rajmund Przybylak
Andrzej Araźny
Janusz Filipiak
Piotr Oliński
Przemysław Wyszyński
Artur Szwaba
A comprehensive database of strong winds up until AD 1600 was created based on documentary evidence for the area within the modern-day borders of Poland. Three types of documentary sources were used: handwritten and unpublished, published, and “secondary” literature. The database contains detailed information about occurrences of strong wind (the location/region, time, duration and indexation for intensity, extent and character of damage), along with the exact textual content of the original weather note, the name of the source, and an evaluation of the source's quality. Five categories of strong winds were delimited: 1 – fresh and strong breeze (Beaufort scale 5–7); 2 – gale (8–9); 3 – storm (10–12); 4 – squall (i.e. gusty wind during a thunderstorm); and 5 – tornadoes. The intensity, extent, and character of damage were estimated based on the proposition given by Brázdil et al. (2004), which we slightly modified to include the Baltic Sea and its influence on coastal parts. In the database, 137 thus-defined strong winds were identified. A reliable estimate of some characteristics of the occurrence of strong winds in Poland seems possible from the mid-15th century onwards. The highest number of strong winds occurred in the second half of the 16th century, with a maximum in the 1570s. For each season, the greatest number of strong winds was found for the Baltic Coast and Pomeranian Region, followed by Silesia and Lesser Poland. Storms and gales were most common during the cold half-year (mainly in March, November, and December).
- Article
(5585 KB) - Full-text XML
-
Supplement
(1140 KB) - BibTeX
- EndNote


Strong winds are among the most significant natural disasters, causing great damage around the world and loss of human and animal lives. In Poland, for example, according to Lorenc (2012), they are the second most dangerous natural phenomenon after floods. Results presented recently by the Statista Research Department (https://www.statista.com/statistics/1269886/most-common-natural-disasters-in-europe, last access: 29 April 2024) confirm that the same situation is observed in Europe. From 2001 to 2020, floods were most frequent (41 %), followed by strong winds (27 %). According to estimates by MunichRe (2011, 2020), approximately 60 % of all insured losses during 2000–2018 were due to extreme meteorological events, foremost among which were extreme winds. Cusack (2023; see Figs. 2 and 7) estimated annual windstorm losses in Europe (12 countries) for the period 1950–2022. The results showed that yearly losses usually (∼80 %) ranged between 1 and 5 billion Euros. Although no long-term trend is seen in the study period, the losses were greatest in the 1980s.
Good and reliable knowledge about extreme winds is essential for many economic sectors, e.g. the design and construction of large and high buildings or the wind power sector (Outten and Sobolowski, 2021). However, our knowledge about the different characteristics and impacts of extreme winds is still based mainly on results gathered for the instrumental period (for roughly the last 100–150 years) and most often only for the last few decades. Therefore, such knowledge is still insufficient and needs improving, which can be achieved by using a more extended series of data coming from the early and pre-instrumental period. Many such data are still undiscovered, or they have been discovered and are stored in numerous archives worldwide but have not been digitised and exist only on paper (Hawkins et al., 2023). That is why data rescue activity is vital (for details, see e.g. Brönnimann et al., 2019; Lundstad et al., 2023). It can help improve our understanding of historical climate variations, including in strong winds. For example, Hawkins et al. (2023) demonstrated that the severe windstorm that occurred in February 1903 in England and Wales (which they reconstructed using documentary evidence) was characterised in some places by winds that were stronger than those observed in the modern period (1950–2015). They thus suggest that estimates of risk from severe windstorms based on contemporary data may need to be revised. A longer perspective on changes in intensity and impacts of extreme winds will also be beneficial for simulations projecting future extreme winds but also for more reliable assessment of their associated risks to societies. However, the mechanisms responsible for their changes and risks are often hard to identify because strong winds are highly changeable in terms of when and where they occur and because they are rare and often local in character.
According to Donat et al. (2011), in future climate simulations (investigated using multi-model simulations from global (GCM) and regional (RCM) climate models), increased extreme wind speeds were projected over northern parts of central and western Europe in most simulations and in the ensemble mean (up to 5 %). Consequently, they forecast that the potential losses will be higher in these regions, particularly in central Europe. Conversely, in southern Europe, they expect a decrease in extreme wind speeds that will result in fewer potential losses. More recent work (Outten and Sobolowski, 2021) partly confirms the above findings. Using a 15-member ensemble of high-resolution Euro-CORDEX simulations (∼12 km), they projected more frequent extreme episodes for northern, central, and southern Europe throughout the 21st century. At the same time, however, they underlined that assessments of future changes in extreme wind remain fraught with uncertainty.
According to all the presented scenarios, strong winds will be more common in Poland. Thus, the associated economic and societal consequences may also be greater than at present. Therefore, the investigation of all the characteristics of strong winds and their impacts should be intensified in Poland. Many works describe strong winds in Poland in the contemporary period based on instrumental measurements (e.g. Stopa-Boryczka, 1989; Paszyński and Niedźwiedź 1991; Krawczyk, 1994; Adamczyk, 1996; Lorenc, 1996, 2012; Araźny et al., 2007; Tarnowska, 2011; Ustrnul et al., 2014; Chojnacka-Ożga and Ożga, 2018; Wibig, 2021; and references therein). Nevertheless, they are largely restricted to periods since the 1950s; they are also written mainly in Polish and are therefore unknown to the international scientific community.
Only a few works (e.g. Bartnicki, 1930; Gumiński, 1952; Piasecki, 1952) contain analyses of winds (including strong winds) for an instrumental period before 1950, with the earliest starting in the late 19th century. Notably, however, there is a complete lack of such analyses for historical periods, i.e. before 1800, based on documentary evidence, including data from regular visual observations of winds. Such evidence nevertheless exists. Two examples of regular visual observations with a quantitative estimation of wind force are one using a seven-degree scale (0–6) for Wrocław (formerly Breslau; source: the newspaper Oekonomische Nachrichten der Patriotischen Gesellschaft in Schlesien) and one using a five-degree scale (0–4) for Żagań (formerly Saganenses; source: Ephemerides Societatis Meteorologicae Palatinae, 1783–1795; see also Przybylak et al., 2014, and Pappert et al., 2021). These examples relate to the periods 1773–1781 and 1781–1792, respectively. In addition, similar detailed wind observations that quantitatively report on wind forces exist for Gdańsk. The first regular meteorological observations in the city started in 1655 and were carried out by Büthner, a professor of mathematics, who used to note daily observations of various weather phenomena, including the occurrence of strong winds. Unfortunately, his paper was lost, probably irretrievably. It is only possible to analyse data for selected years within his observations covering the years 1655–1701. The 18th century brought to the coast a boom in interest in observing weather conditions and in their economic impacts. This interest culminated on 1 January 1739 with the beginning of regular instrumental meteorological measurements in Gdańsk by Hanov. Wind observations were made in 1739–1772 using a nine-degree scale (0–8) (see Table 5.1 in Przybylak, 2010).
Knowledge about strong wind occurrences in Europe in the pre-instrumental period is also very limited, though it is significantly better than in other parts of the world. For example, for the period under study (13th–16th centuries), most of the works containing the most detailed climatic analyses regarding strong winds relate mainly to the Czech lands (e.g. Brázdil and Dobrovolný, 2000, 2001; Dobrovolný and Brázdil, 2003; Brázdil et al., 2004; and references therein). The last item cited is particularly valuable for its very detailed analysis of different aspects related to strong winds for the entire last millennium based on documentary evidence. However, even that publication contains only limited information about strong winds for the pre-1500 period, precisely because of the paucity of existing historical sources. For central Europe, information about strong winds is also contained in monographs analysing different kinds of extremes (Pfister, 1999; Glaser, 2001, 2013). For the Low Countries (the coastal areas of the southwestern Netherlands and Flanders), a valuable paper is available, presenting storminess changes in the period 1390–1725 (de Kraker, 2013, and references therein). It is essential to add that de Kraker also graded storm events using an eight-degree scale. Similar work to that mentioned for the Low Countries also exists for the North Sea, the British Isles, and northwestern Europe (Lamb, 1991, and references therein). For a smaller area in this European region (the Thames estuary), there are also works published by Galloway and Potts (2007) and Galloway (2009). Finally, we should also mention the work of Orme (2014), who analysed late Holocene storminess in Europe using various proxies.
This short review shows that, although it is better than for other parts of the world, our knowledge about the occurrence of strong winds in Europe is very limited. That is why there is an urgent need to improve and widen this knowledge. The main aim of the present paper is to partly fill this gap by presenting an analysis of strong wind occurrences in Poland for the period from the late 13th century (the first record of strong wind in Poland found in historical sources) to the end of the 16th century.
2.1 Area
The analysis of strong winds in the studied period is conducted for the area of Poland within its contemporary borders. Poland is a central European country stretching from the Baltic Sea in the north to the Sudetes and Carpathian mountains in the south (Fig. 1). To more precisely estimate the spatial changes in strong wind occurrences, analysis was also performed for six historical–geographical regions: the Baltic Coast and Pomeranian Region, Masuria and Podlasie, Greater Poland, Masovia, Silesia, and Lesser Poland (Fig. 1). Data from the contemporary period representing all the mentioned regions were collected for 12 meteorological stations (2 for each region).
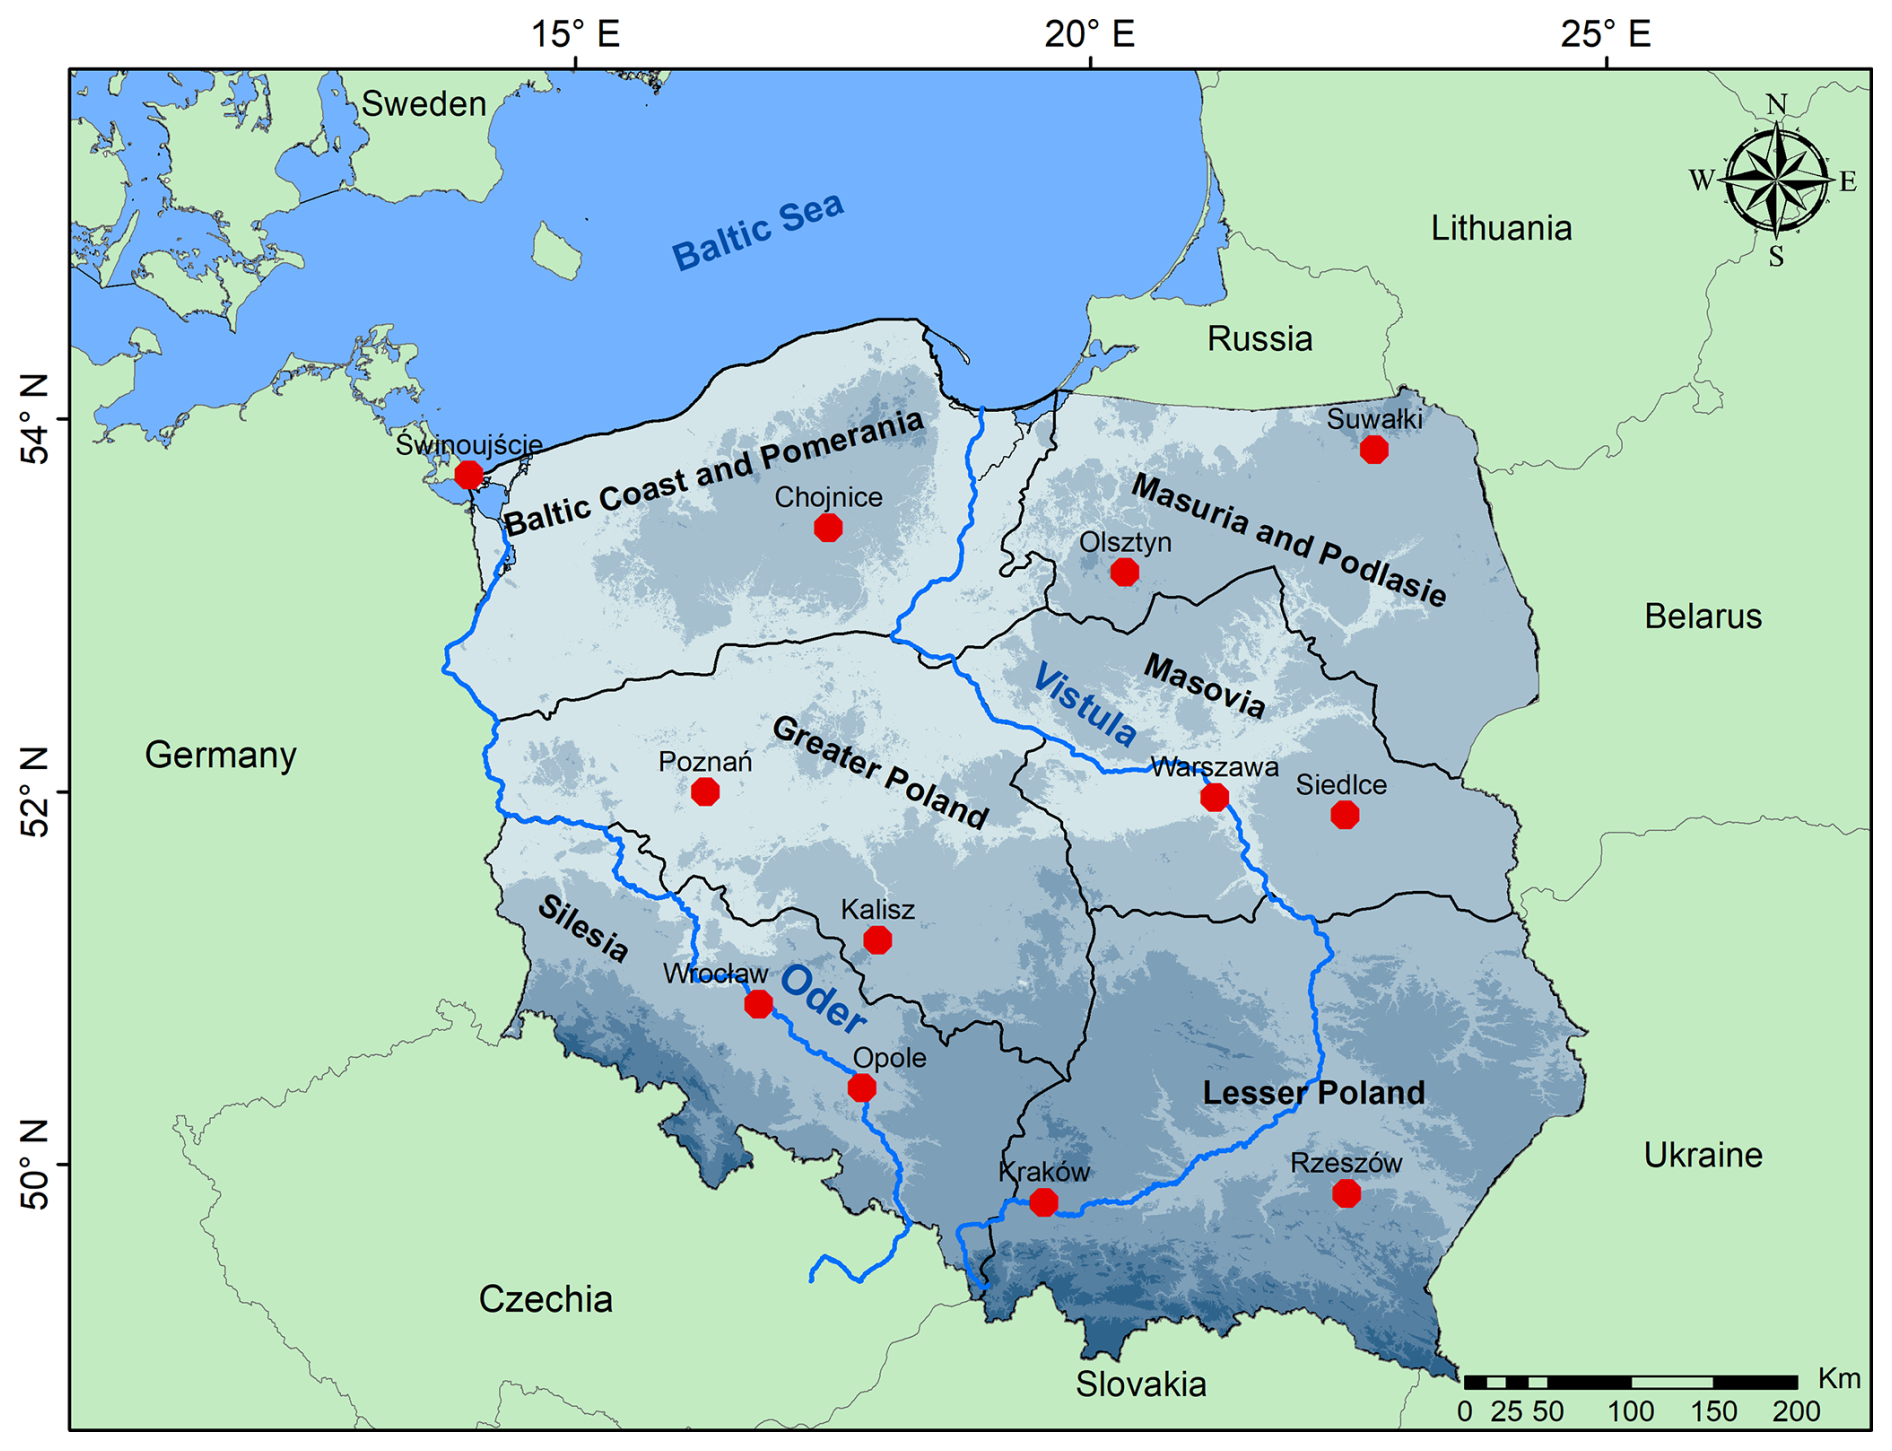
Figure 1Geographical location of Poland, main historical–geographical regions, and contemporary meteorological stations (red dots) (after Ghazi et al., 2024; modified).
At present (1966–2018), the average annual wind speed calculated based on 41 stations is 3.6 m s−1 (Wibig, 2021). Excluding mountainous areas, for which we have no historical data, average wind speeds in Poland are largest in the coastal part of the Baltic Sea (4–5 m s−1) and slightly smaller in the central part, e.g. in Warszawa (Warsaw), at 4.0 m s−1. The weakest winds in Poland are noted in the foothills of the Sudetes and Carpathian mountains (less than 3 m s−1). Extreme winds are slightly differently distributed than average winds. Specifically, the greatest extreme winds occur in southwestern Poland, and the next-greatest occur along the Baltic Sea coast (Wibig, 2021).
2.2 Sources and data
Three types of documentary sources were used to search for weather notes describing the occurrence of strong winds in Poland, namely handwritten and unpublished literature, published literature, and “secondary” literature (e.g. articles, monographs). The number of historical sources for the study period that were used correlates strongly with their availability, which is greatest for the more recent centuries. For example, for the 16th century, we used 85 sources, whereas, for the 13th and 14th centuries, we used 1 and 27 sources, respectively. For every strong wind occurrence in Poland, a detailed reference to the source(s) is given; see https://doi.org/10.18150/W6PMBQ (Przybylak et al., 2025).
Each source used was quality-assessed by historians using the method that the historical sciences call “source criticism”. This method involves examining the authenticity of specific human activities (historical source) and reading their meaning (historical event) in light of the causes and conditions of their creation in the historical process. To support the selection of appropriate sources and weather note(s) describing strong winds, three quality categories were distinguished: 1 – weak; 2 – moderate; and 3 – high. The following rules were used to stratify sources by quality: 1 – weak, if the information was derived from secondary literature rather than from the original source; 2 – moderate, if the information was written centuries after the strong wind occurrence; and 3 – high, if the information was written in a source in the same period in which the strong wind event occurred and provides precise information. For the analysis, we used mainly the last category of sources, which provided the most valuable data.
2.2.1 Database: historical period
This work represents the first time that a comprehensive database of strong winds related to the period before the 19th century has been prepared for Poland based on all documentary evidence. Reflecting the scientific subject matter and the historical nature of the source material, it involved a team combining climatologists and historians. At the time of publication, the database has been completed for the period until the end of the 16th century (see https://doi.org/10.18150/W6PMBQ; Przybylak et al., 2025). It contains detailed information about the occurrence of strong winds (the location/region, time, duration, and indexation for intensity, extent, and character of damage) and the exact textual content of the original weather note, the name of the source, and an evaluation of the source's quality. The source information is not complete for every case of strong wind. For example, sometimes only general information is available that strong winds occurred somewhere in Poland. In such cases, there is no information about the place or region; therefore, to capture this information, we introduced an additional region category called “Poland”. Similarly, the information provided regarding the time of strong wind occurrences varies in detail. For some occurrences, we only have information about the year; for others, we have information about the season and year. However, in most cases, we have information about the year, month, and day(s) (and often about the start and end of the phenomenon). For this reason, it is essential to remember that the statistics presented (e.g. frequency of occurrence of strong winds in months, seasons, and years) are based on different numbers of cases. In Table 1, we show examples of entries to the database that vary in degree of detail.
Table 1Examples of entries in the strong wind database.
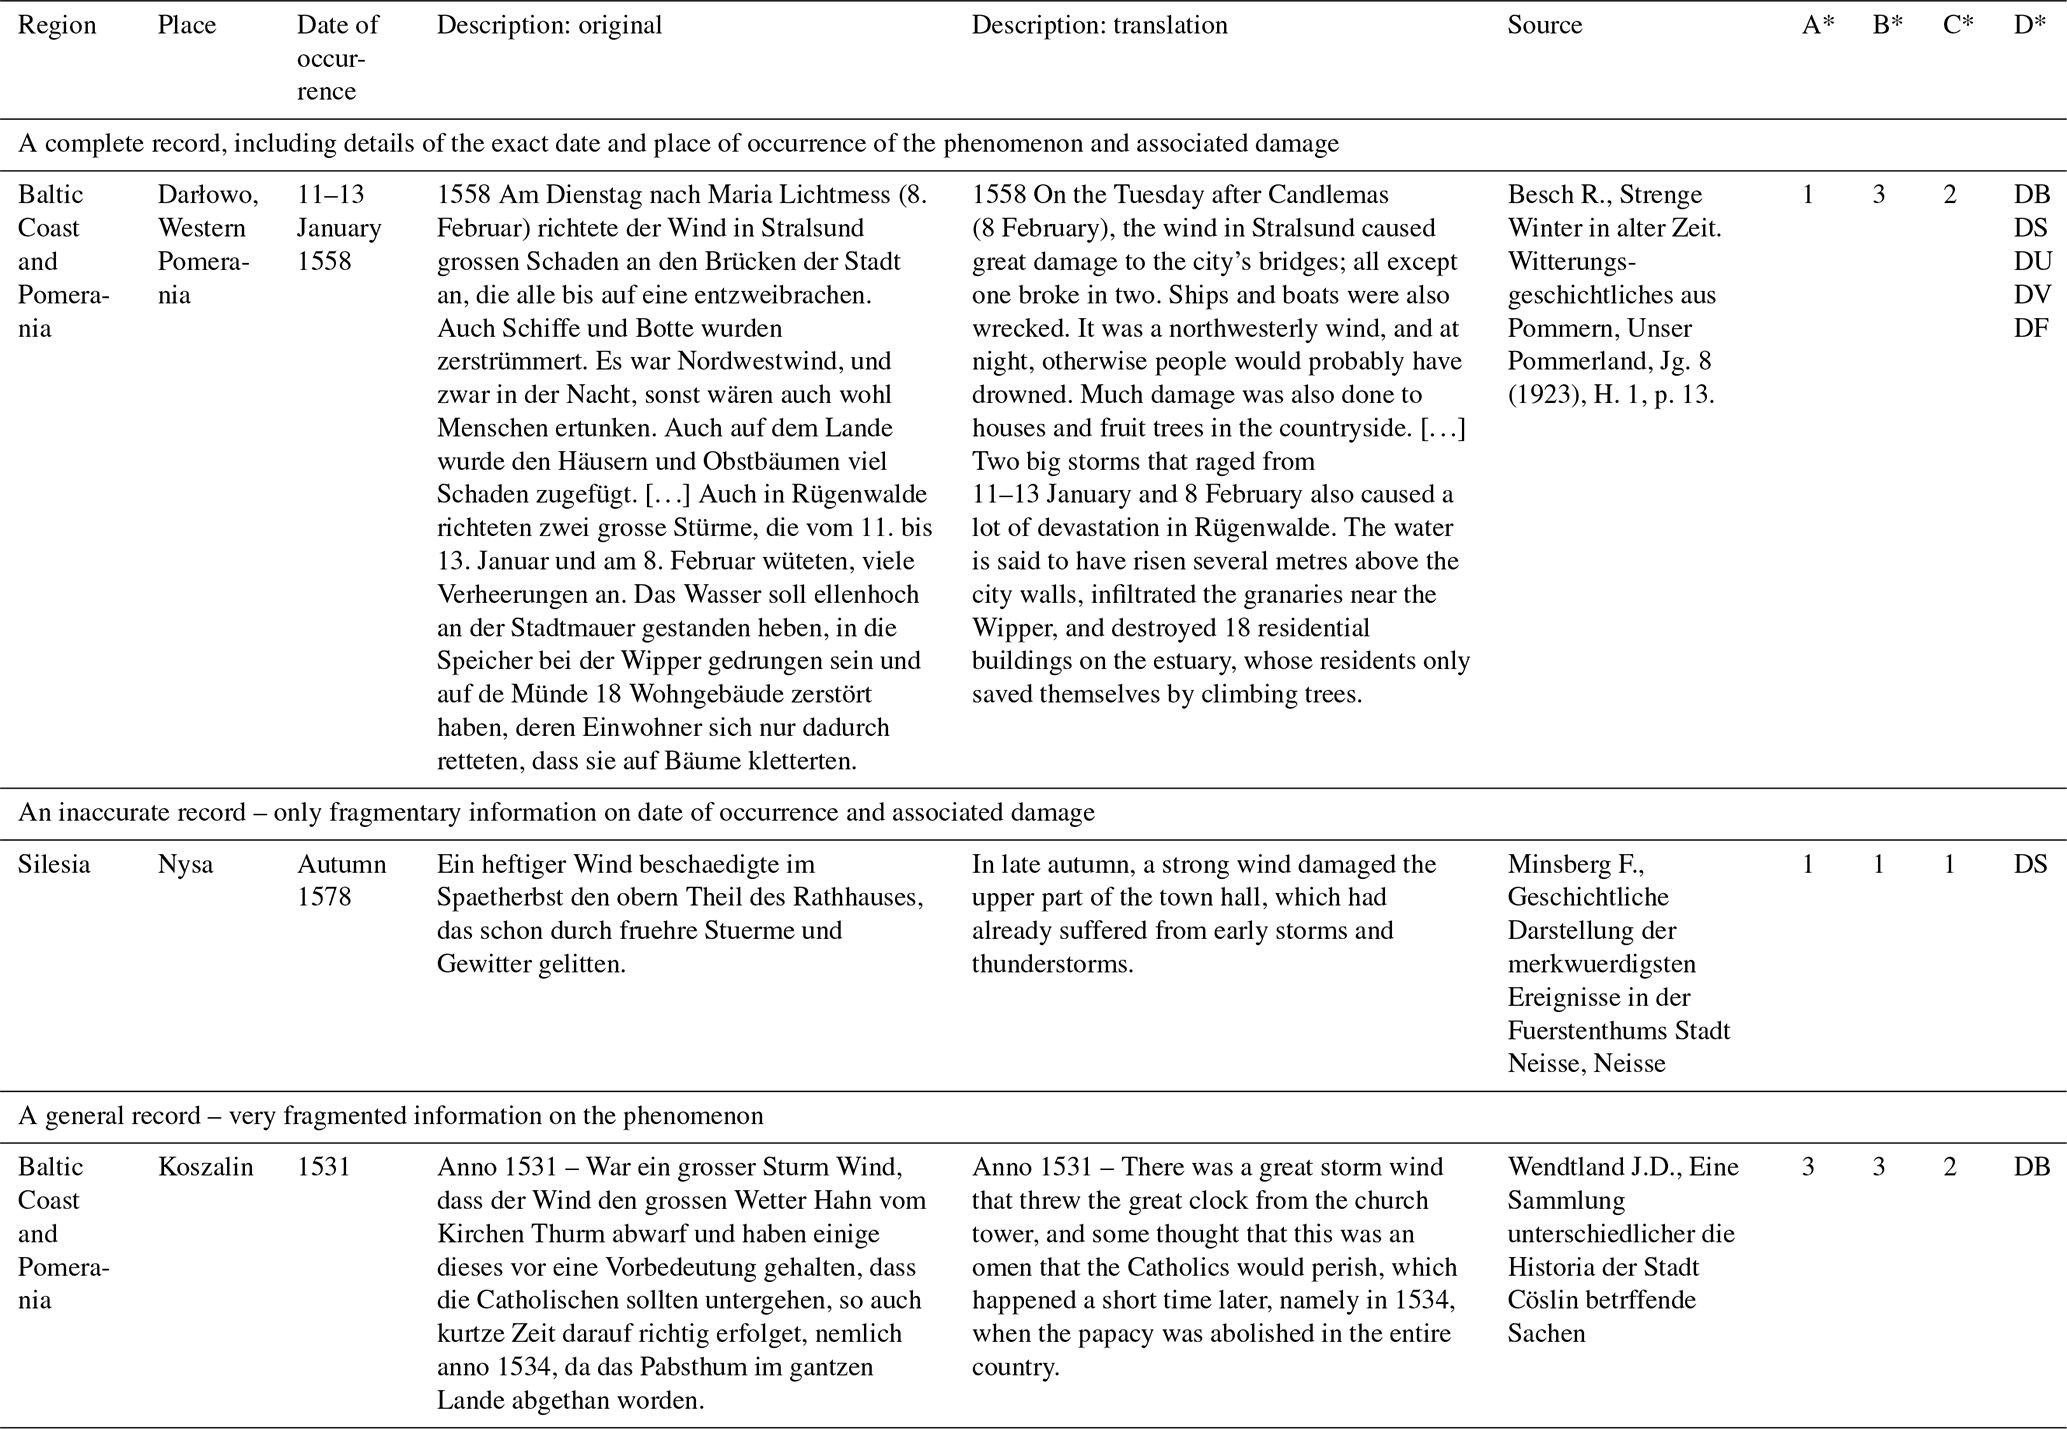
* Explanations: A – source quality; B – type of strong wind; C – extent of damage of strong wind; D – character of damage of strong wind.
Table content (numbers, etc.) is described in full in the database and in Methods.
The entire database contains 137 records documenting the occurrence of strong winds in Poland. The earliest weather note reporting the presence of strong wind was for the year 1283. The number of weather notes (162) is not identical to the number of occurrences of strong wind because sometimes we have more than one weather note describing the same instance of strong wind. The statistics of weather notes documenting the occurrence of strong winds are presented in Fig. 2. Weather notes were most numerous for the 16th (85 cases) and 15th (52) centuries and most scarce for the 13th century (1). The most abundant seasons were autumn (63) and winter (35). The vast majority of weather notes in the documentary evidence are accounted for by just two regions, namely the Baltic Coast and Pomeranian Region (93) and Silesia (39), and the fewest are from the Masuria–Podlasie and Masovia regions, with 1 and 2 notes, respectively (Fig. 2).
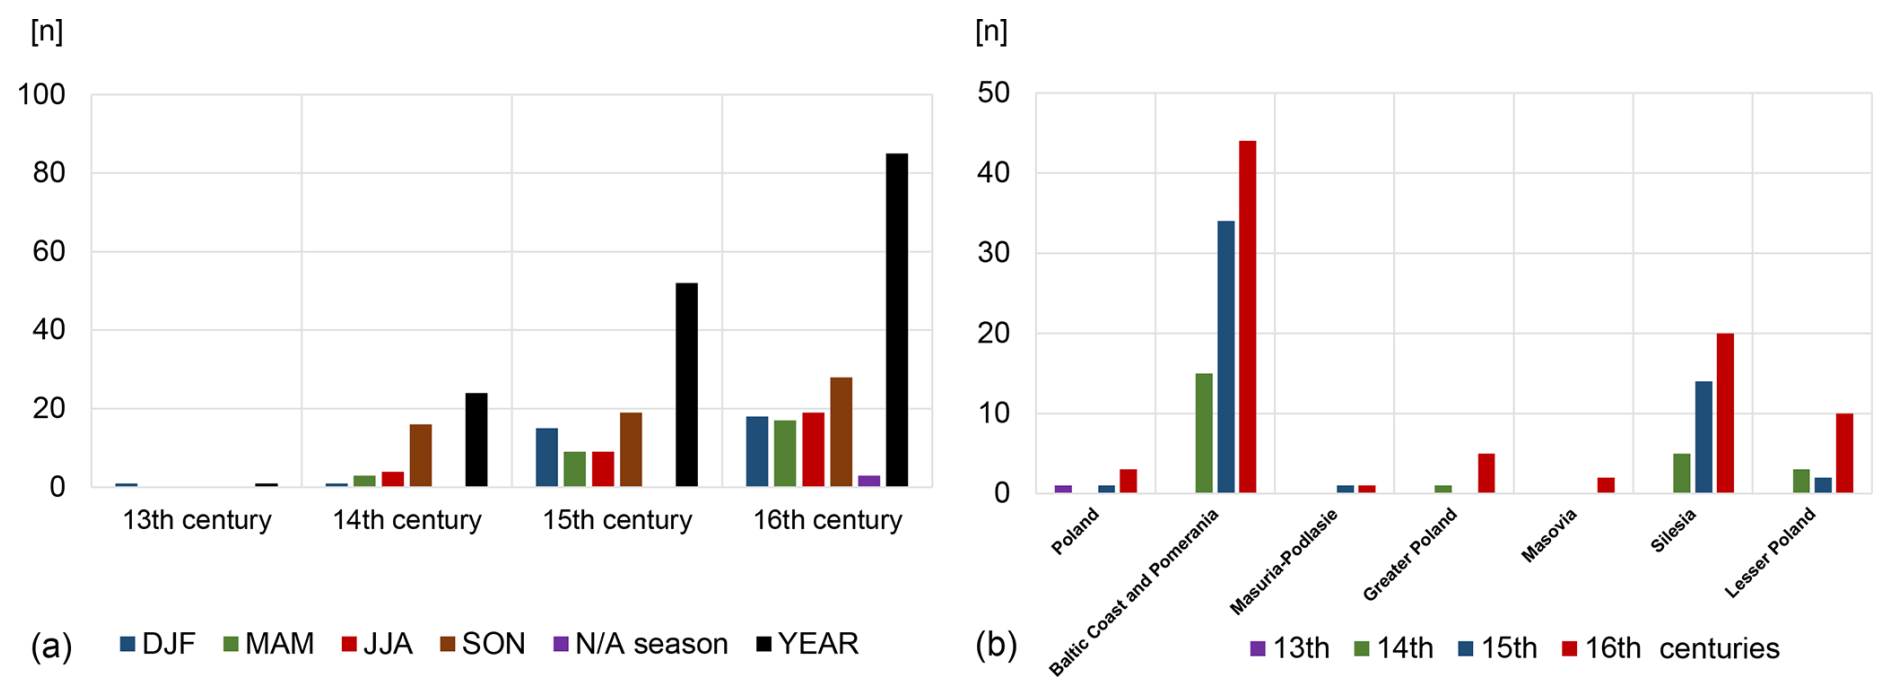
Figure 2Number (n) of weather notes for Poland for seasons (a) and regions (b), 1281–1600. Explanation: “N/A season” – specific season is not available (unknown); the category “Poland” encompasses all notes for which the region is unknown.
The number of available sources and the number of weather notes (i.e. weather notes usually exceed sources in number) correlate strongly with the number of occurrences of strong winds. This pattern is similar to what we observed for flood records (Ghazi et al., 2023a, b, 2024, 2025) and drought records (Przybylak et al., 2020).
2.2.2 Database: contemporary period
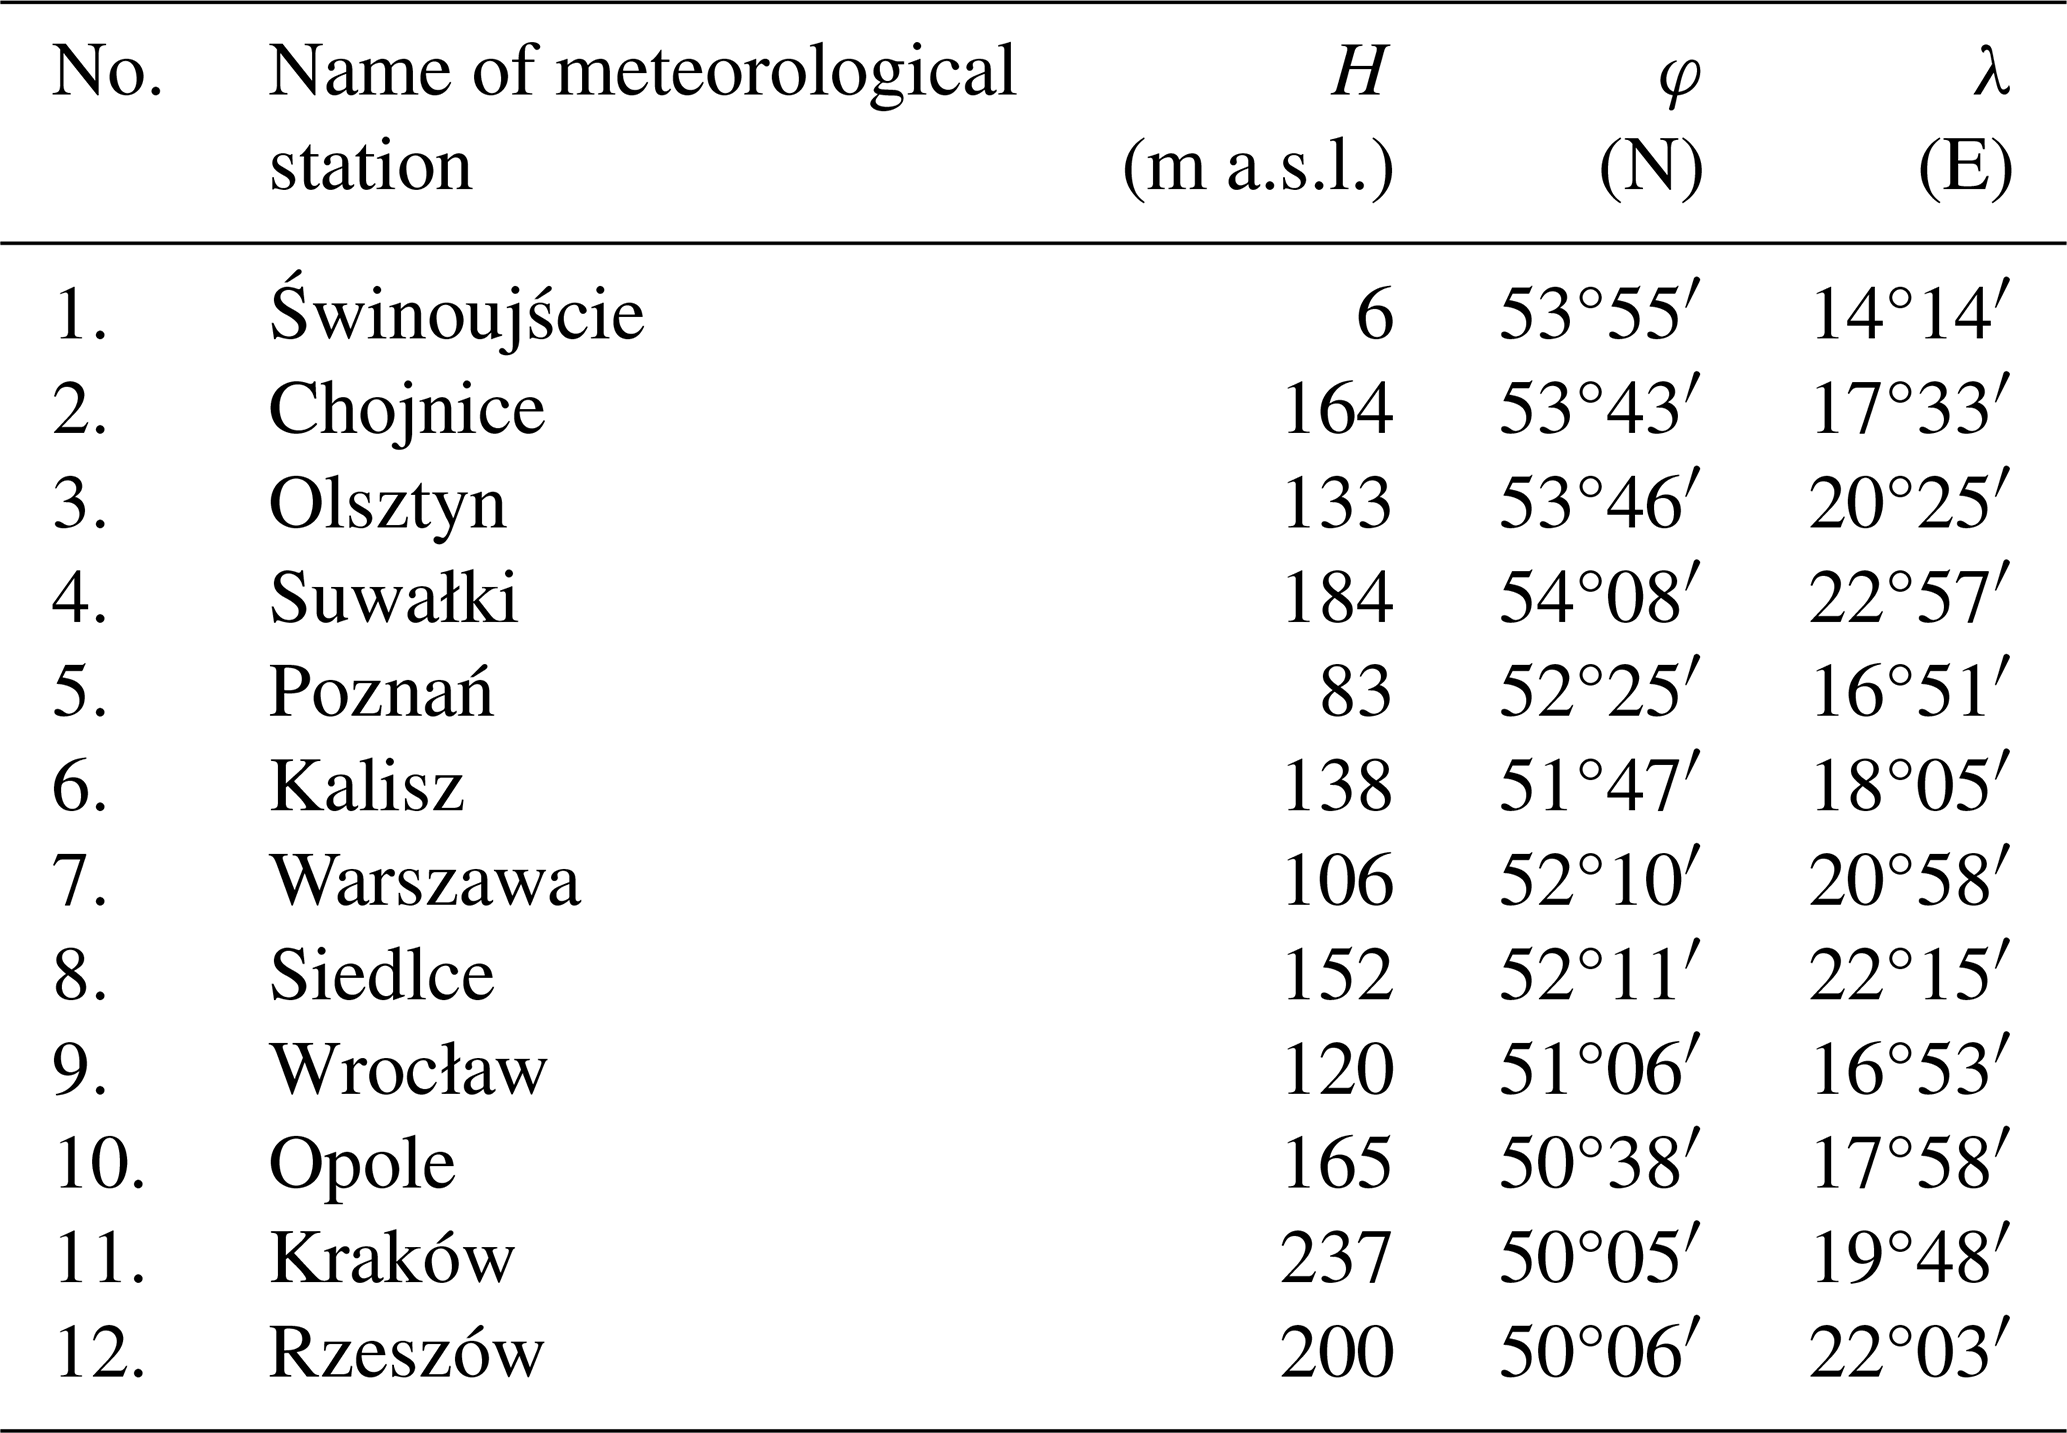
Sub-daily data (every 3 h) of wind speed for the period 1993–2022, for which the most homogeneous and complete series of wind values for Poland are available, were gathered for 12 meteorological stations (see Table 2, Fig. 1). As mentioned earlier, the stations represent all six distinguished historical–geographical regions in the country. The wind data were downloaded from the website of the Institute of Meteorology and Water Management – National Research Institute (IMGW-PIB) (https://danepubliczne.imgw.pl/, last access: 11 February 2025 ). The two data types collected were the average wind speed every 3 h and the highest gust of wind for 3 h intervals.
Table 2Geographical location of meteorological stations used in this work.
2.3 Methods
2.3.1 Historical period
In our analysis, we distinguished four categories of strong winds, which are consistent with the proposition used by Brázdil et al. (2004; their types T1 and T3–T5 in Table 6.1) for the Czech lands. We added one more category (tornadoes), which is treated separately:
- a.
fresh and strong breeze (force according to Beaufort scale (BS) 5–7),
- b.
gale (BS 8–9),
- c.
storm (BS 10 and more),
- d.
squall (i.e. gusty wind during a thunderstorm), and
- e.
tornado.
Using the final version of the database, each case of strong wind was analysed in detail. In the first stage, its intensity was indexed by the author of the record being added into the database. In the second stage, the proposed categories of wind intensities by individual contributors were discussed and finally accepted by the whole team of authors of this paper. To investigate the damage caused by strong winds, three categories of extent of damage were utilised (consistent with types E0–E2 in Brázdil et al., 2004, Table 6.2, modified):
- a.
E0 – no information about damage;
- b.
E1 – small damage, damage of lesser extent;
- c.
E2 – large damage, areally extensive damage.
The last category was slightly modified by us to include damage on the sea (destruction or sinking of ships) and losses caused by storm floods, reflecting the coastal location of Poland. Finally, if weather notes allowed, we also estimated the character of the damage, again using the proposition of Brázdil et al. (2004, Table 3).
Similarly to the case of the extent of damage, we added two more categories to the list of types of character of damage presented for the Czech lands. The proposed new categories precisely describe the influence of the Baltic Sea on coastal parts. The “N/A” designation was used when the weather notes did not contain information about the character of damage. Thus, the following nine categories were distinguished to characterise damage and losses:
- DO
-
casualties (lost lives);
- DL
-
wind damage in forests;
- DP
-
minor damage to buildings;
- DB
-
considerable damage or destruction of buildings;
- DS
-
uprooted fruit trees, damage to hop gardens and vineyards;
- DU
-
damage to field crops, gardens, and orchard harvests;
- DV
-
considerable damage/destruction to vessels, including sunk (newly added);
- DJ
-
other damage (e.g. upturned carriages, vessels, injured persons, minor damage to property);
- DF
-
considerable damage/destruction by storm flood or inland flood (newly added);
- N/A
-
information not available.
2.3.2 Contemporary period
Based on the sub-daily wind data gathered, the following statistics were calculated:
- 1.
average daily, monthly, seasonal, and annual wind speed;
- 2.
highest gust of wind for every day, month, season, and year;
- 3.
frequency of gust winds of calculated for every month and year for each station;
- 4.
frequency of gust winds in the following speed intervals:
- a.
8.0–17.1 m s−1 (BS 5–7) – quite strong, strong, and very strong wind;
- b.
17.2–24.4 m s−1 (BS 8–9) – gale;
- c.
(BS 10–12) – very strong and violent storms and hurricanes.
- a.
These three categories of strong winds listed in point 4 above, but particularly the categories described in points b and c, were used for comparison against the historical data. The analysis, however, is limited mainly to estimating differences and similarities in the study area's annual course and spatial distribution. We need to add that a reliable comparison of absolute values of the frequency of strong wind occurrences in both periods is impossible due to the undetectability of a probably large number of events in the study's historical period, particularly those classified to the first category.
For many years, the IMGW-PIB did not maintain a separate database on squalls, land- and waterspouts and tornadoes, or the damage caused by the occurrence of such extreme events. In fact, this was a typical measure for many European national meteorological services – the duty to monitor damage caused by the aforementioned phenomena belonged to other state services. However, in 2015, the WMO decided to standardise weather, water, and climate hazard information to allow more sophisticated analyses of data on the occurrence of such phenomena and the losses and damage associated with them. Then, many meteorological services, including IMGW-PIB, started to catalogue extreme weather, climate, and water phenomena and develop a dedicated database, but the material collected so far is too sparse for us to make a comprehensive analysis.
3.1 Historical
According to Przybylak et al. (2023), in Poland, the Medieval Warm Period (MWP; recently also called the “Medieval Climate Anomaly”, MCA) started in the late 12th century and finished between the mid-14th and mid-15th centuries. Then, until the mid-16th century, the Transitional Period (TP) was distinguished (Niedźwiedź et al., 2015), followed by the Little Ice Age (LIA). Thus, our study period covers a large part of the MWP, the entire TP, and the early decades of the LIA. According to results from the analysis conducted by Przybylak et al. (2023) and also from the database accompanying this paper, the available number of weather notes allows a reliable estimate of the occurrence of strong winds, mainly from the 1450s onward. Two maxima of greatest storminess can be distinguished in this time: 1451–1520 and 1551–1600 (Fig. 3). The latter, however, reveals a greater number of occurrences of strong winds, especially in the 2 decades 1571–1580 (14 cases) and 1581–1590 (12). In the pre-1450 period, we should underline the clear maximum of strong winds noted in the first half of the 14th century, followed by a less stormy period until the 1450s.
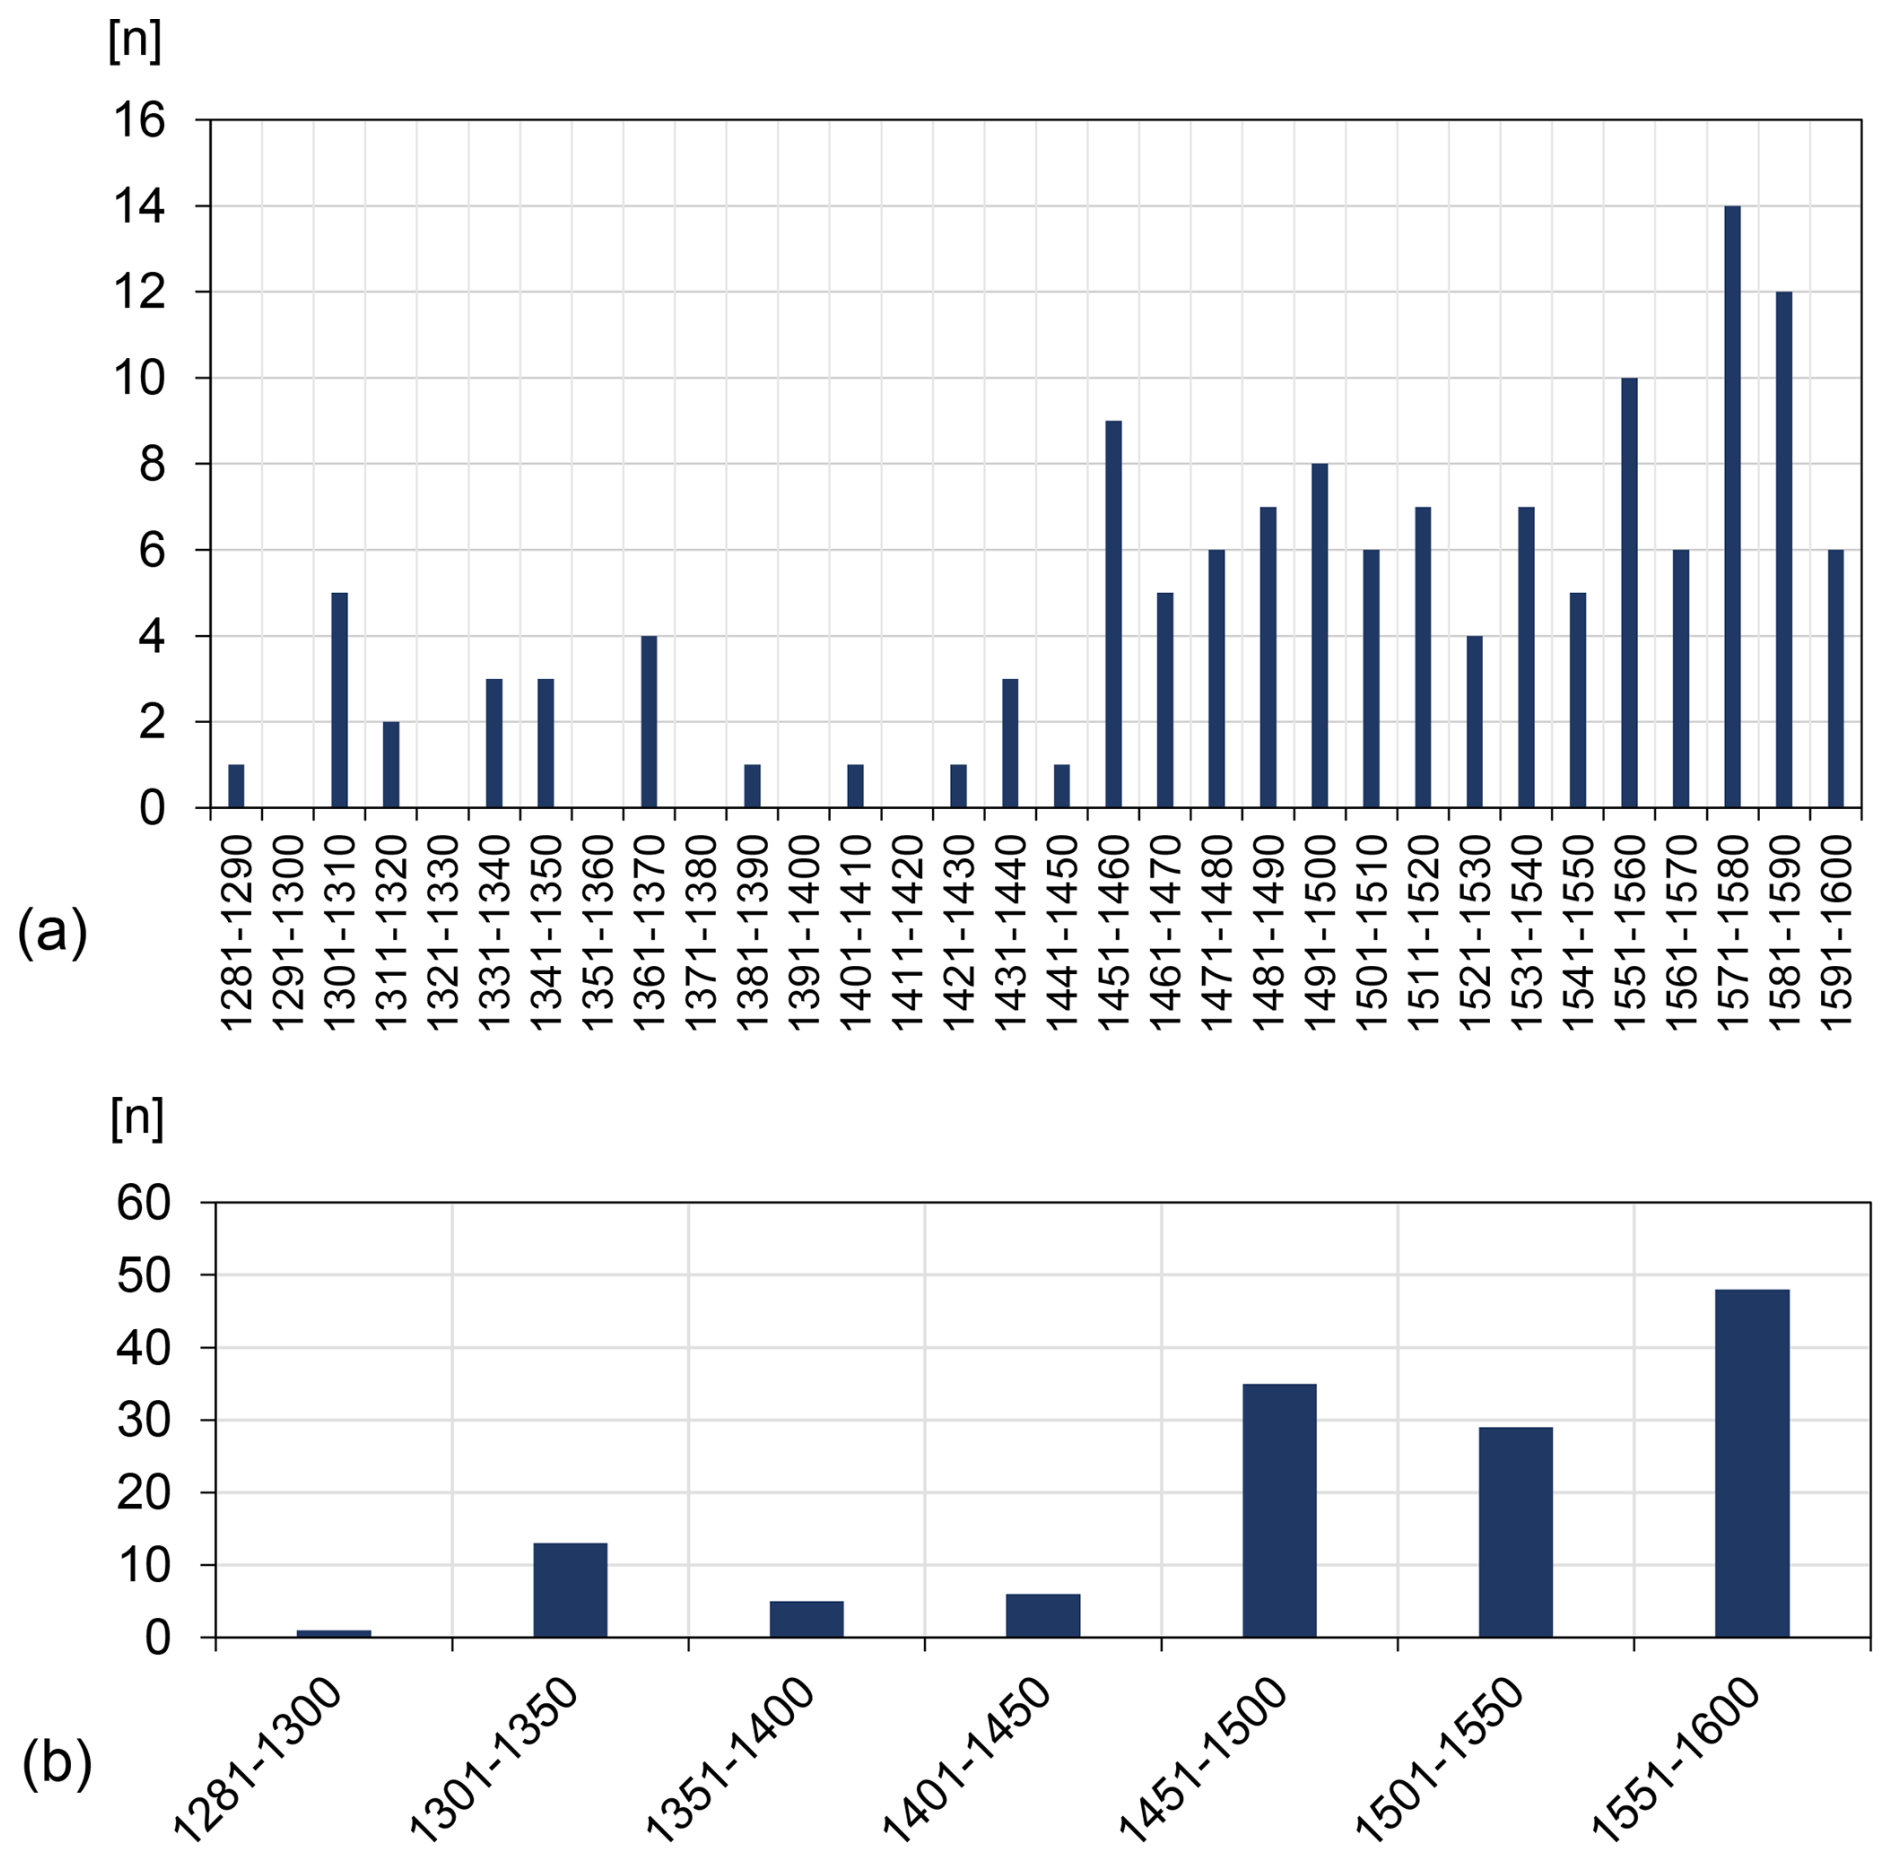
Figure 3Number of occurrences (n) of decadal (a) and 50-year (b) strong winds of all categories in Poland, 1281–1600.
Of the six regions analysed, strong winds were noted most often in the Baltic Coast and Pomeranian Region (74 cases) and then in the Silesia region (34) (Fig. 4a and b). They were also registered at moderate frequency in the Lesser Poland region (15). In other regions, their occurrence was sporadic, ranging from 1–6 cases (Fig. 4b). The annual cycle of strong wind occurrences can be estimated based on regions for which enough information exists. Strong winds were noted most often in autumn and in winter for Silesia and the Baltic Coast and Pomeranian Region and in summer and autumn for the Lesser Poland region (Fig. 4b). August (13 cases) and March (12) were most abundant in strong wind occurrences in Poland, but the stormiest period of the year was from October to March, with at least 10 cases in each month except February (Fig. 4a).
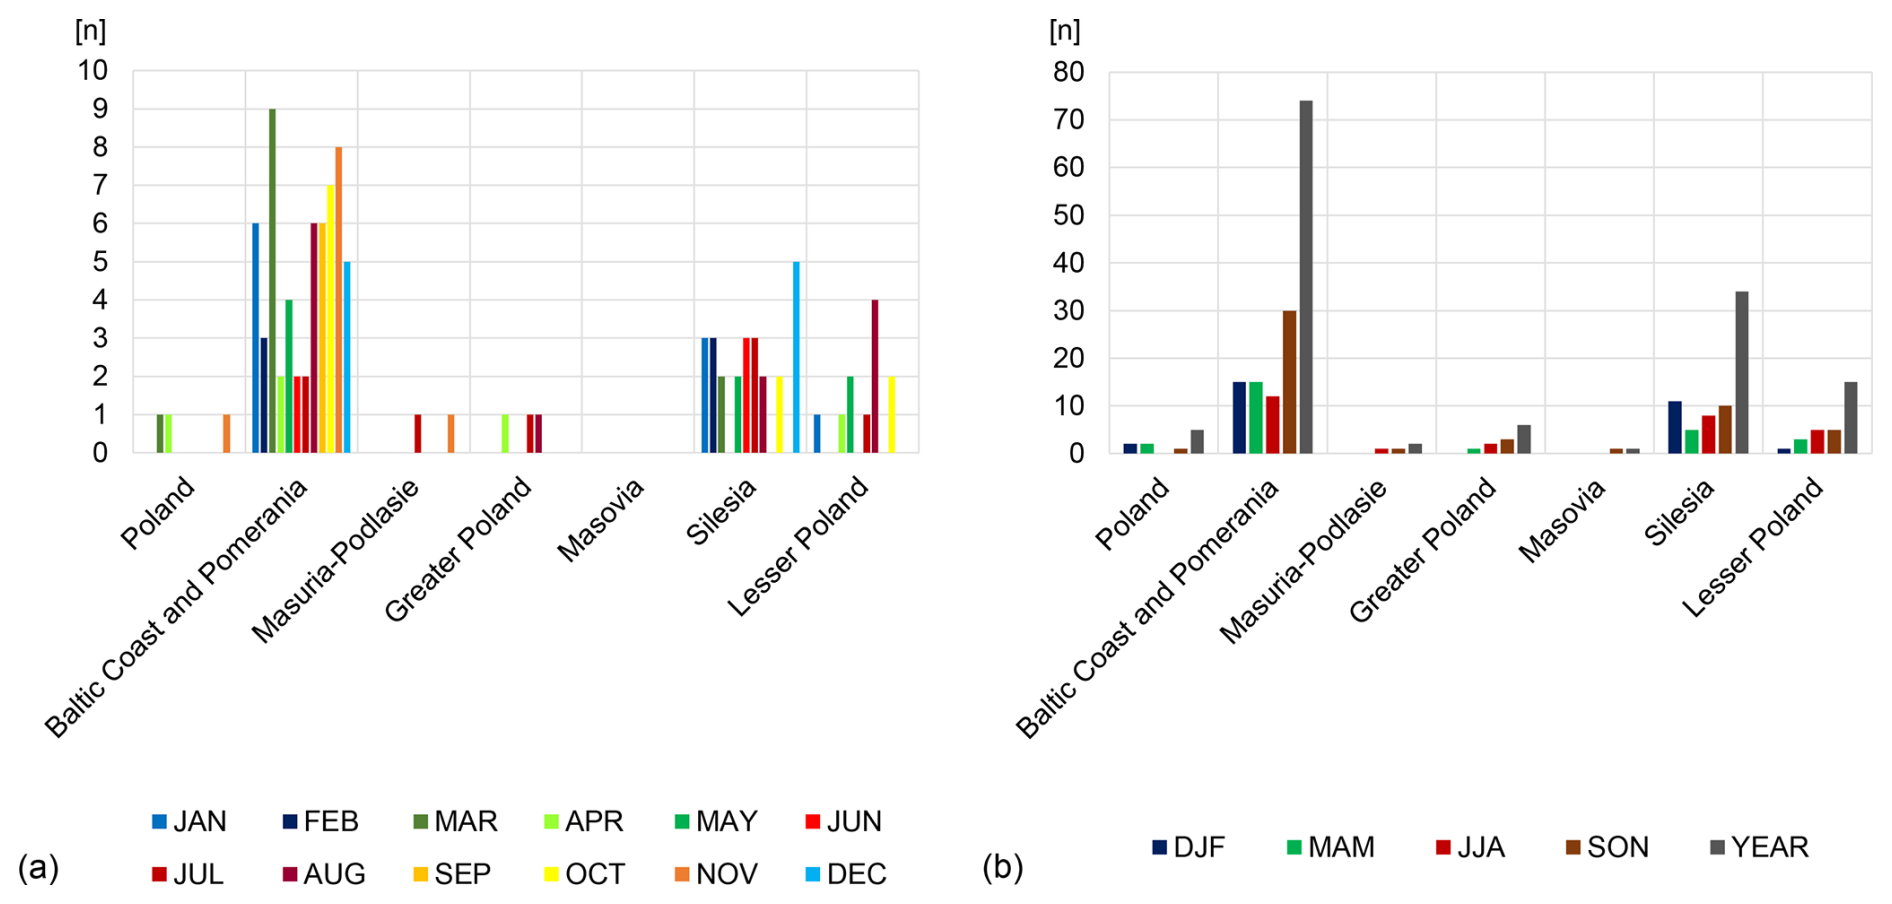
Figure 4Monthly (a) and seasonal (b) number (n) of strong winds of all categories by region, 1281–1600.
The total number of strong winds in seasons/years presented in Fig. 4b is greater than calculated based only on monthly statistics because some weather notes provide information about only the season or even only the year of occurrence (see also text in Sect. 2.2.1 and Table 1).
In the entire study period (1281–1600) (Fig. 5) and also in two sub-periods (1281–1500 and 1501–1600) (Fig. S1 in the Supplement), the most frequent were storms and gales, and the least frequent were fresh and strong breezes and, in particular, tornadoes (only one case). Storms and gales were most common in spring (mainly in March), autumn (particularly in November), and winter (mainly in December) (Fig. 5). It is worth noting a big change between the two studied sub-periods for August. In the period 1281–1500, only storms were registered in this month, whereas, for the 16th century, all categories of strong winds were recorded (except tornadoes) (Fig. S1).
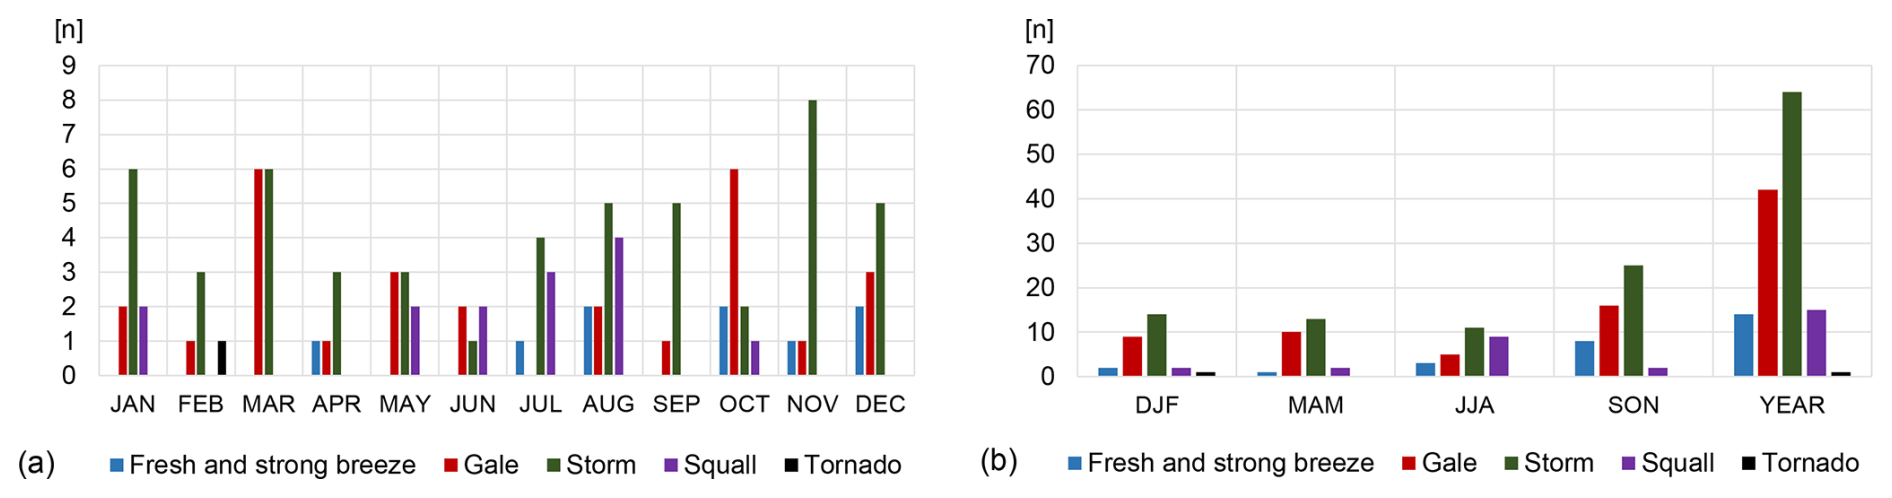
Figure 5Monthly (a) and seasonal (b) number of occurrences (n) of strong winds of different types in Poland, 1281–1600.
The spatial distribution of occurrences of strong wind (except tornadoes) is presented in Fig. 6 for the entire study period and in Fig. S2 in the Supplement for the two sub-periods. The most significant differences in spatial distribution between the two sub-periods are seen for two categories of strong winds, i.e. for fresh and strong breezes and (particularly) for squalls (Fig. S2). In the latter case, the squalls were noted in the historical sources in the period 1281–1500 only for three regions: Silesia, the Baltic Coast and Pomeranian Region, and Lesser Poland. In the 16th century, they were also found in Greater Poland. On average, for the entire study period, all categories of strong winds except squalls were most frequent in the Baltic Coast and Pomeranian Region (about 46 %–69 %). Squalls were noted most often in Silesia (40 %). The region with the second-greatest number of strong winds (except squalls) was Silesia (14 %–27 %) (Fig. 6).
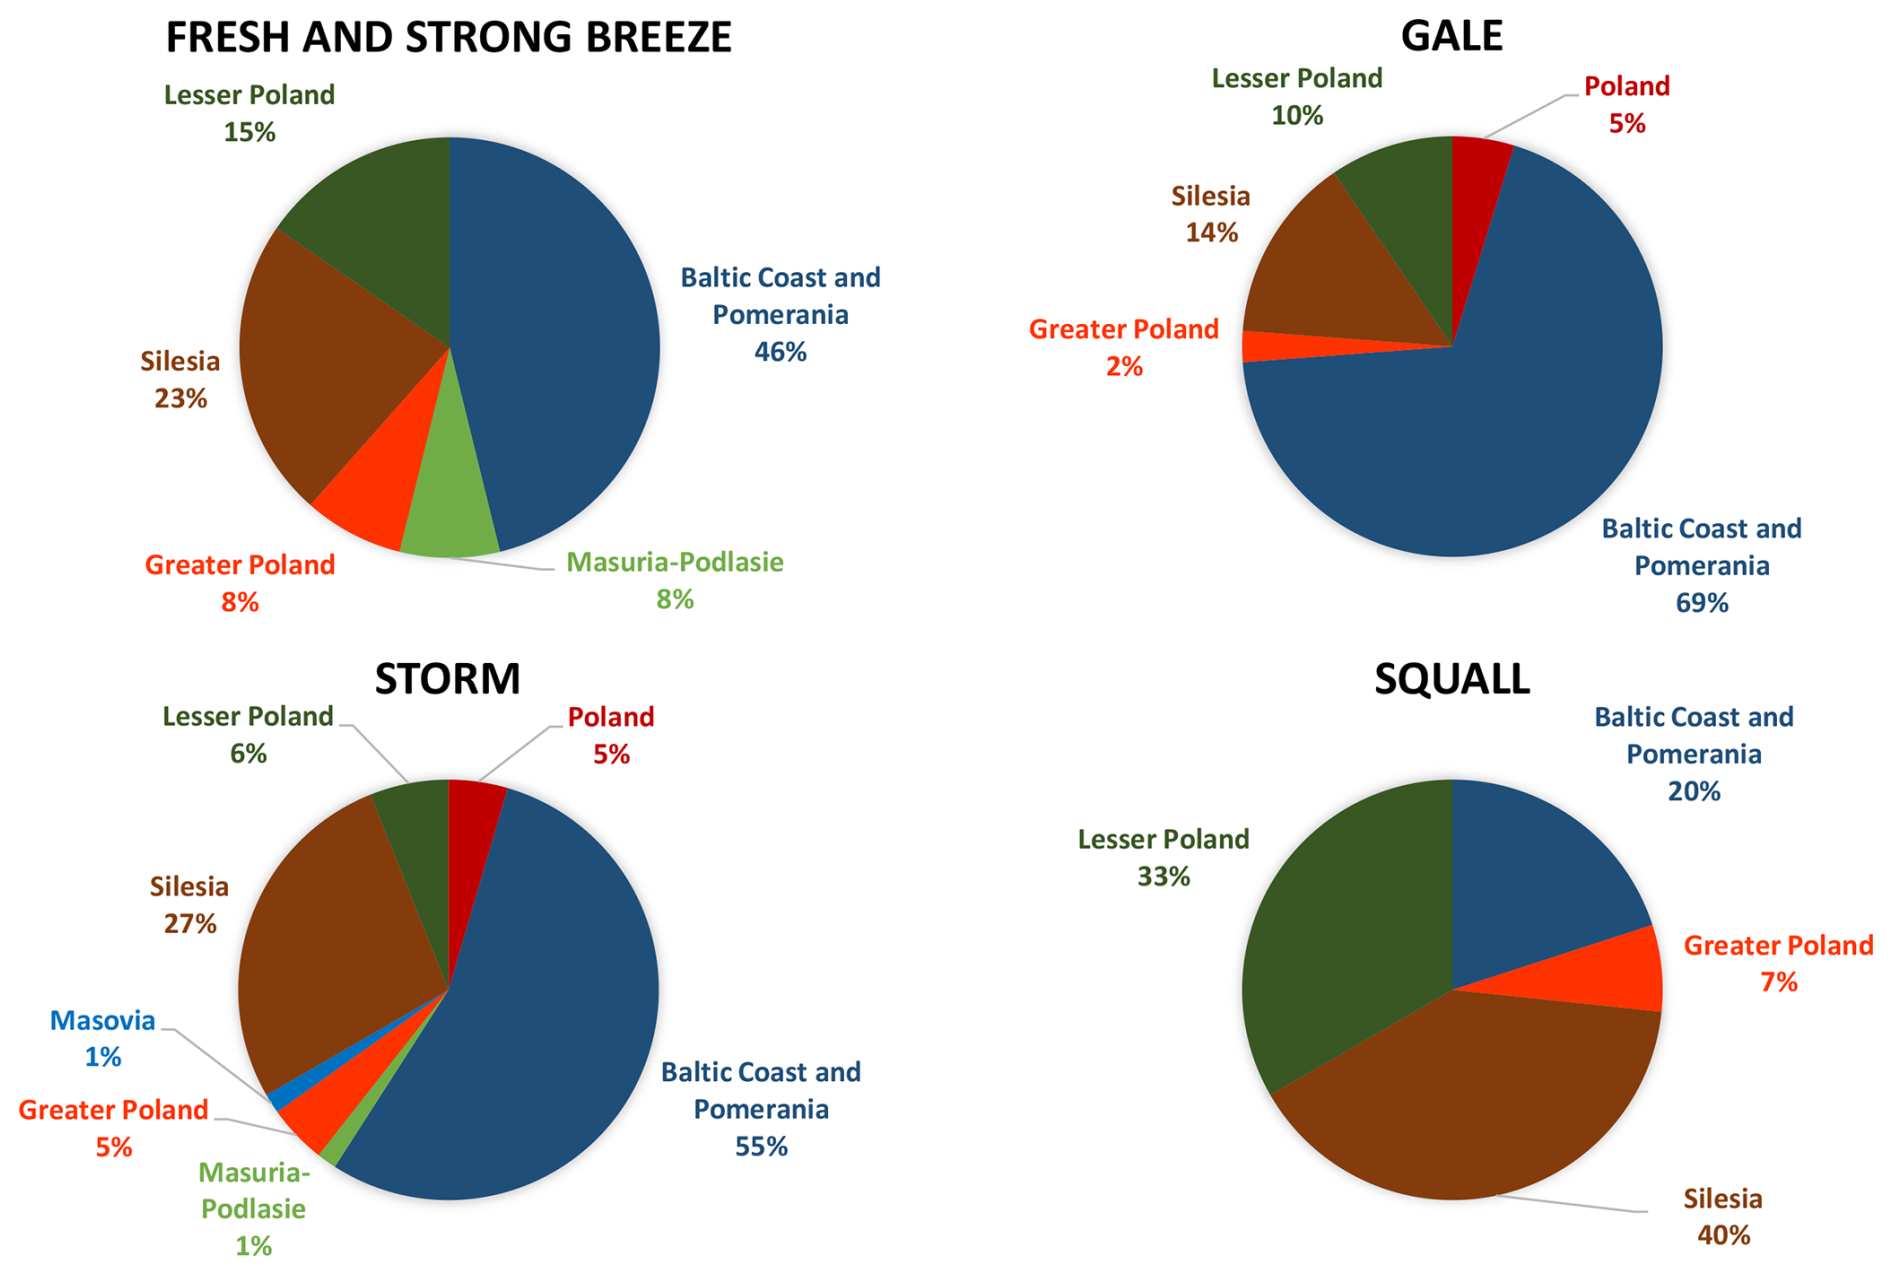
Figure 6Relative frequencies (%) of occurrence of strong winds of different types (tornadoes excluded) in the studied regions of Poland, 1281–1600.
The first category of strong winds (category 1) we proposed does not cause damage. The wind is chaotic in its flow, moving large tree branches and whole trees; it makes the use of umbrellas and walking against the wind difficult and causes snowstorms and blizzards during snowfall. According to Lorenc (2012), a gust wind speed above 17 m s−1 in climate conditions in Poland creates a threat to the population, economy, and environment. This means that all gales and storm winds (categories 2 and 3) classified by us based on documentary evidence have the potential to cause various kinds of damage, which we listed in the Methods section. However, when chroniclers mention these winds in historical materials, they rarely mention the devastating effects of their impact on the environment or humans. The absence of information about destruction probably reflects a lack of damage in the immediate vicinity of people's residences and does not rule out destruction having occurred elsewhere. Squalls, however, differ importantly from gales and storms, being highly localised phenomena rather than the effect of macro-circulation. Accordingly, an absence of information about damage from a reported squall should be treated as strong evidence of a lack of damage. The available weather notes describing the occurrence of strong winds allow us to classify damage according to its scale: small or large (see Figs. 7 and S3 in the Supplement).
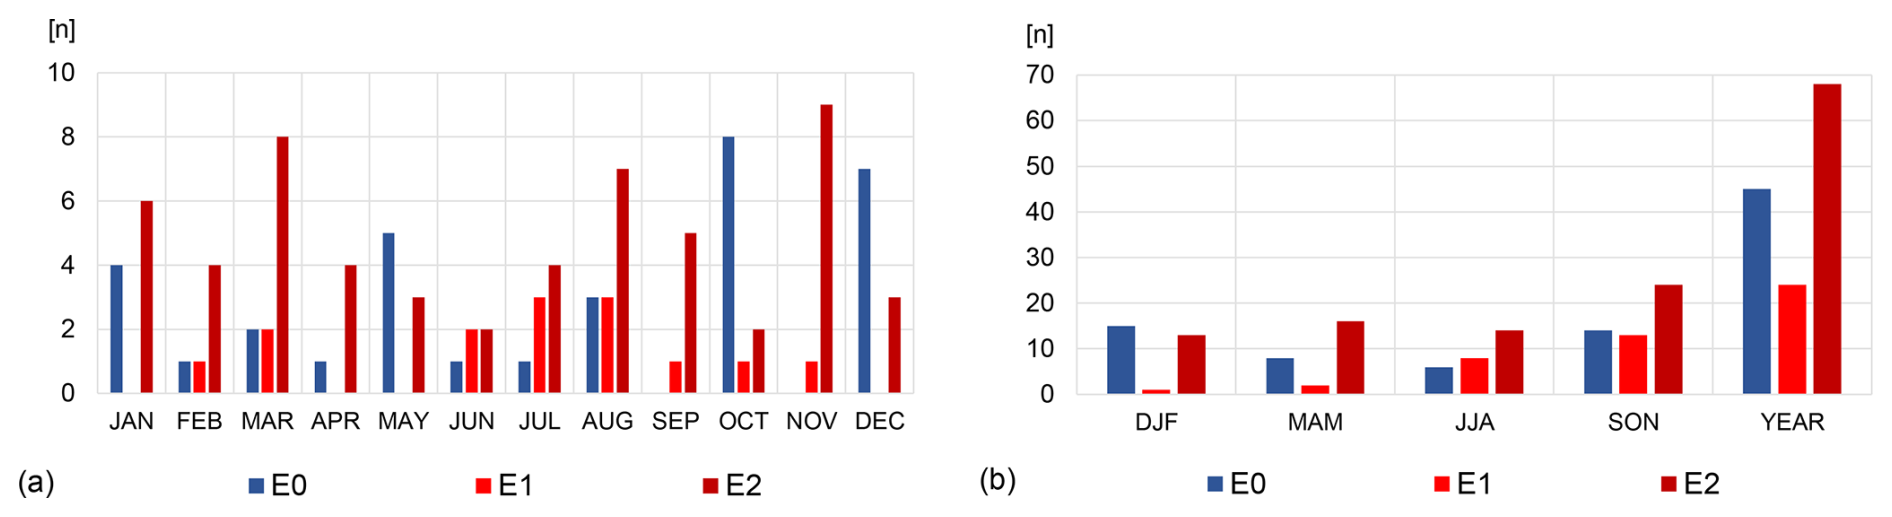
Figure 7Monthly (a) and seasonal (b) number of occurrences (n) of strong winds in Poland, according to extent of damage, 1281–1600.
It is interesting to note that, for the study period, the E2 category of damage is most frequent, followed by category E0, i.e. no information about damage. Category E2 prevails in all seasons (excluding winter) and in most of the months, excluding December, October, June, and May (Fig. 7). It is also worth noting that the frequency of category E0 relative to E2 decreases from medieval times to the 16th century (see Fig. S3). This means that the 16th-century chroniclers were more precise than their predecessors in describing weather events (in this case, strong winds) and their effects.
In the entire dataset, the largest share of reports of strong winds causing damage (categories E1 and E2) but containing no information on damage (category E0) was for the Baltic Coast and Pomeranian Region (39 %–67 %) and Silesia (16 %–35 %). This was in line with expectations, these regions having yielded the most abundant datasets (Fig. 8). A similar situation is noted for both sub-periods, with the only exception being category E1 in the period 1281–1500 (Fig. S4 in the Supplement). This category was a little more frequently reported for Lesser Poland (29 %) and Silesia (29 %) than for the Baltic Coast and Pomeranian Region (28 %).
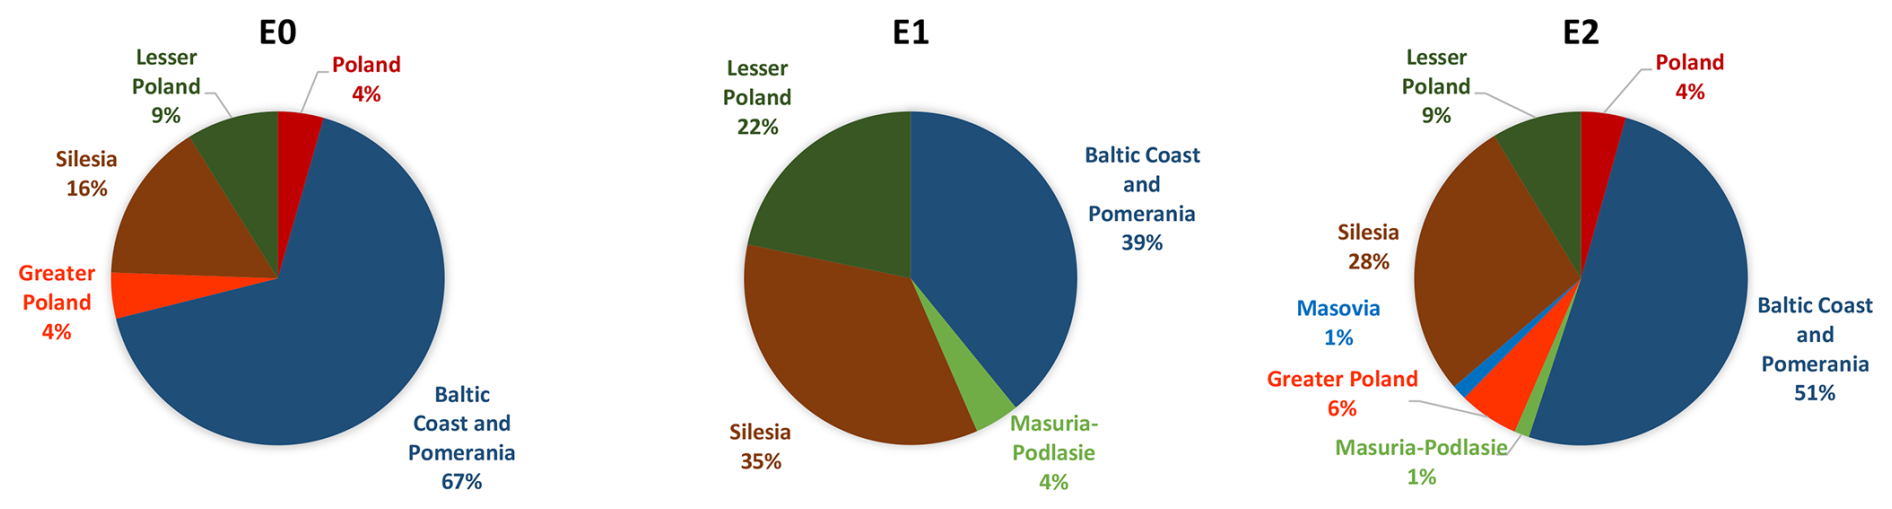
Figure 8Relative frequencies (%) of occurrences of strong wind in studied regions of Poland for different types of damage, 1281–1600. For explanations of abbreviations, see Methods.
The character of damage caused by the strong winds is shown in Fig. 9 for the entire study period and in Fig. S5 in the Supplement for the two analysed sub-periods. The two figures are roughly similar.
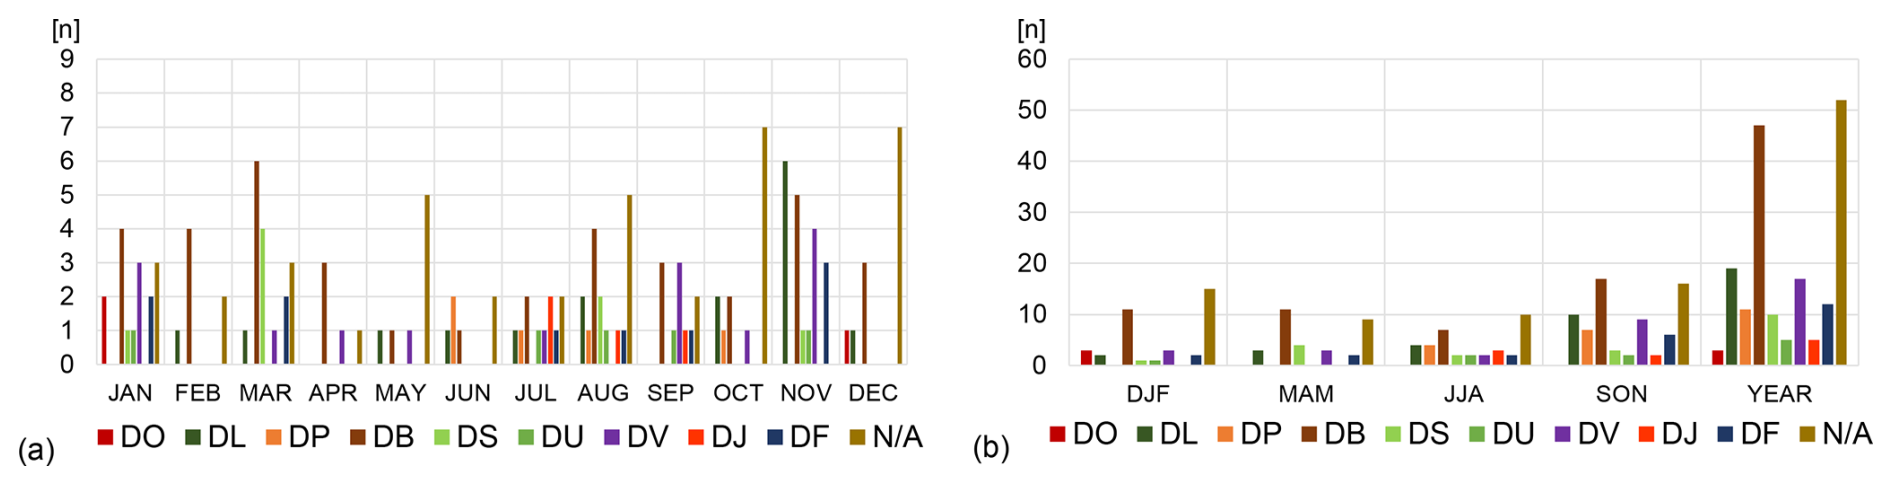
Figure 9Monthly (a) and seasonal and annual (b) number (n) of strong winds in Poland for which information about the character of damage exists (DO, DL, DP, DB, DS, DU, DV, DJ, and DF) or does not exist (N/A), 1281–1600. For explanations of abbreviations, see Methods.
On average, 28.7 % of weather notes did not contain information about the damage caused by the strong winds (Fig. 9). Fewer such cases occurred in the 16th century (24.5 %) than in medieval times (34.2 %) (Fig. S5). Of all distinguished damage categories, DB was the most frequent (26.0 %), with its maximum occurring in the 16th century (28.4 %). The next most frequent categories of damage noted in the study period were DL (10.5 %) and DV (9.4 %), while the least frequent was DO (1.7 %) (Fig. 9). About 60 % of all mentions of damage in the weather notes were found for the cold half-year but particularly for autumn (39.2 %). The smallest number of weather notes about damages was noted for spring (16.6 %). In the annual course, damage caused by strong winds in Poland was reported most often in November (20 cases, 14.0 %), March, and August (17, 11.9 %) and least often in April (5, 3.5 %) (Fig. 9a).
The spatial distribution of distinguished categories of damage caused by strong winds in the analysed regions of Poland is shown in Fig. 10 for 1281–1600 and in Fig. S6 in the Supplement for the two sub-periods 1281–1500 and 1501–1600. The analysis reveals that the most frequently noted categories of damage in Poland (DB, DL) were also present in all analysed regions, with a maximum in the regions of Silesia and the Baltic Coast and Pomeranian Region. These two regions also exhibited the highest numbers of information items about other categories of damages caused by strong winds (except for the DJ category, which was noted most often for the Lesser Poland region) (Fig. 10). The greatest number of weather notes describing strong winds not informing about damages was found for the Baltic Coast and Pomeranian Region (67 %) and then for the Silesia region (17 %). The spatial distribution of reports of damage caused by strong winds presented for the entire study period was more similar to that noted in the 16th century than to that noted in the medieval period (cf. Figs. 10 and S6).
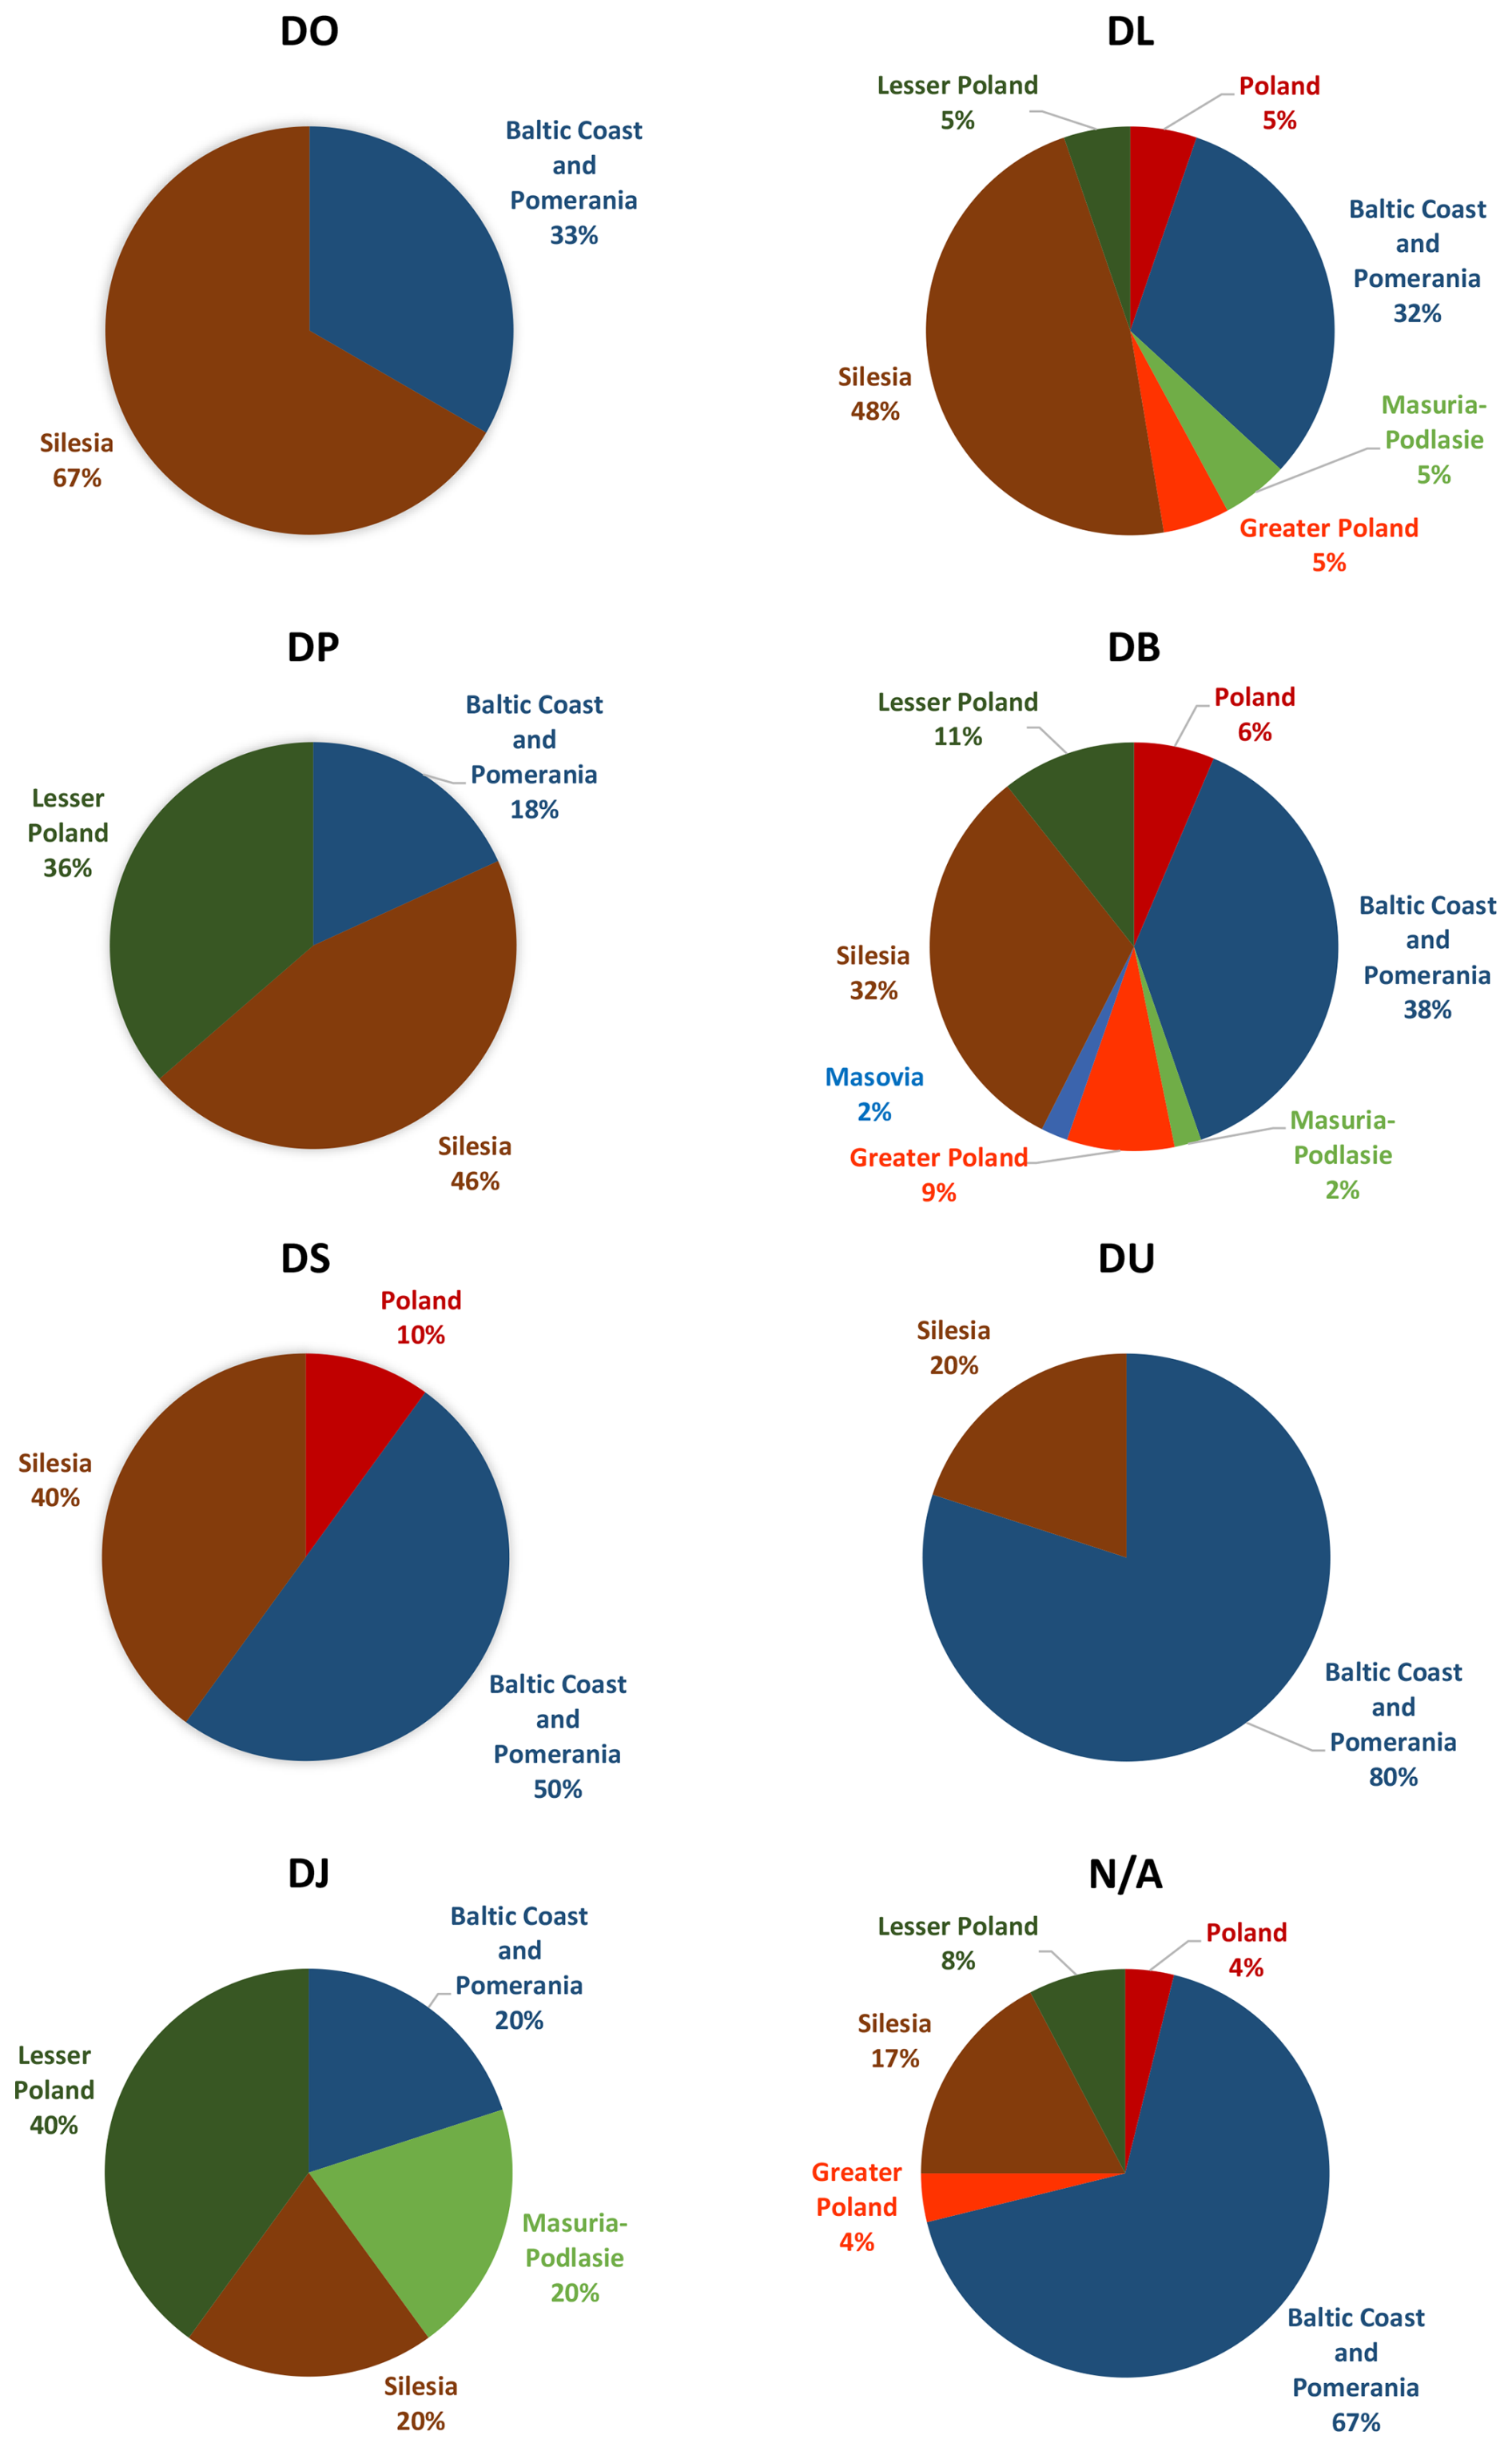
Figure 10Relative frequencies (%) of damage categories estimated for particular regions in Poland, 1281–1600. Two categories (DV and DF) are not shown because they can occur only in the Baltic Coast and Pomeranian Region. For explanations of abbreviations, see Methods.
3.2 Contemporary period
A short analysis of the present occurrence of strong winds in Poland follows. This will support a comparison against the historical results, mainly with regard to the spatial distribution and course of frequencies of strong winds in the annual cycle. It will also be helpful to know about the greatest speeds of strong winds currently being observed in Poland.
The annual number of gust winds () in Poland in 1993–2022 that can potentially cause damage usually does not exceed 20 cases (Fig. 11). However, the 30-year average values are <10 at all stations except Rzeszów. The probability of occurrence of that kind of strong wind was smallest in Masovia and Silesia (fewer than 16 cases). There are significant fluctuations in the annual number of gust winds from year to year, sometimes exceeding 10 cases. Also, the number of thus-defined strong winds has decreased since about 2010, particularly in the Masovia and Silesia regions.
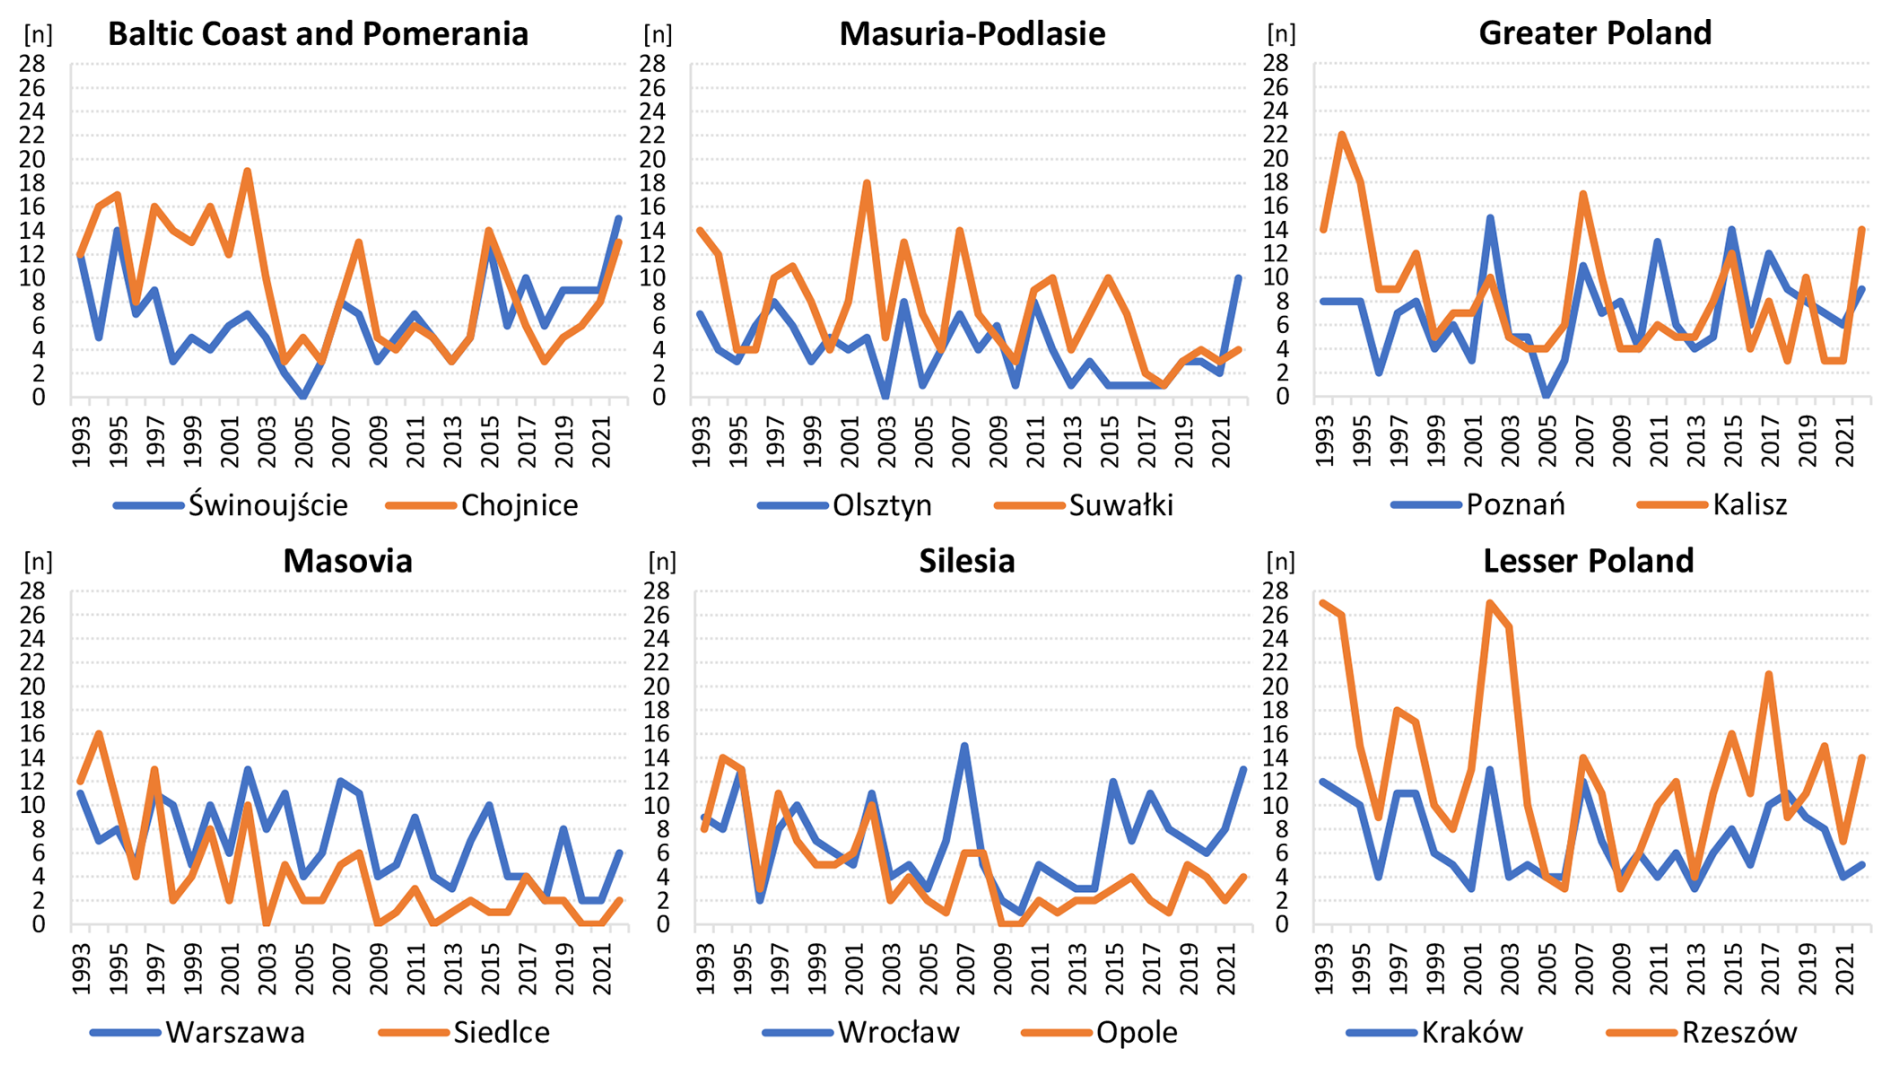
Figure 11Year-to-year course of the annual number (n) of gust winds of at selected stations representing six studied regions in Poland, 1993–2022.
In the annual cycle, the average 30-year (1993–2022) monthly number of strong winds oscillated from below 0.4 in the warm half-year to more than 0.8–1.0 in January–March (Fig. 12). The first half of the cold season (October–December) has significantly fewer gust winds, rarely exceeding 0.8 cases in 1 month, except December at some stations.
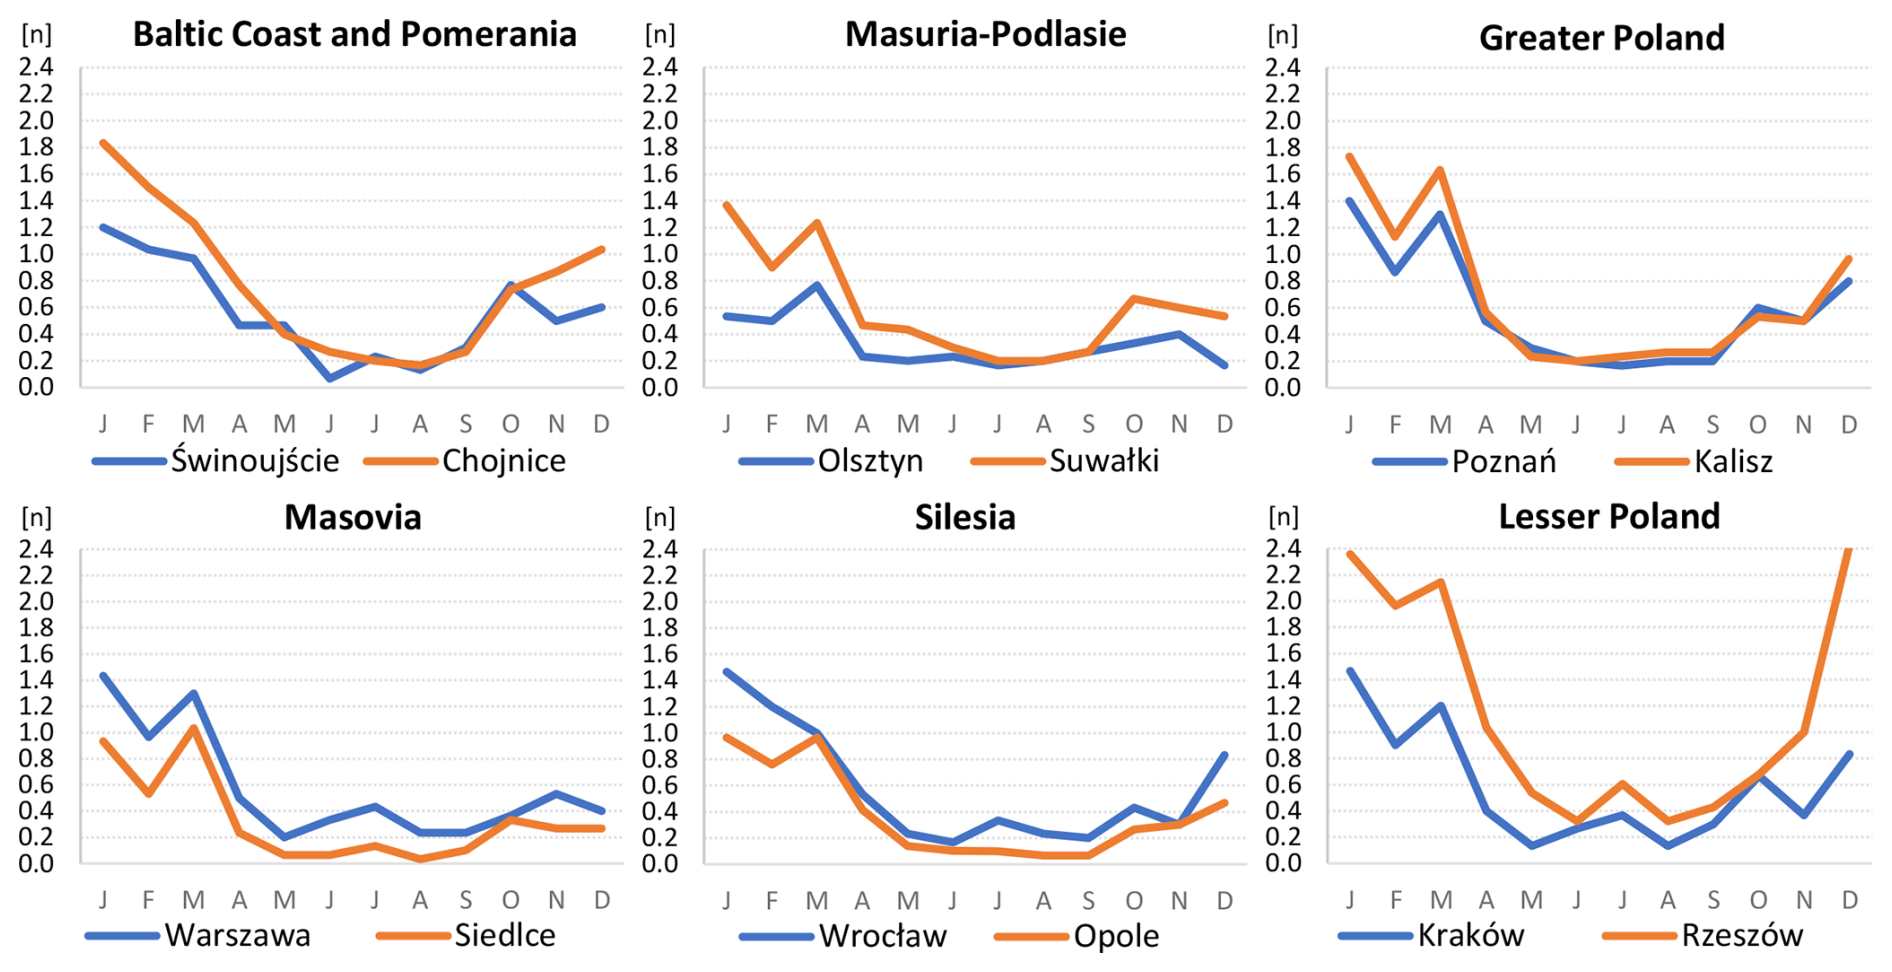
Figure 12Annual course based on the average monthly number (n) of gust winds of at selected stations representing the six studied regions in Poland, 1993–2022.
In the studied period, the highest gust wind speed exceeded 30 m s−1 at the majority of analysed stations. It occurred most often in winter or summer months (Fig. 13). On the other hand, the lowest speeds, oscillating between 16 and 22 m s−1, were measured only in the period from May to September. The highest strong wind speed (35 m s−1) in Poland was measured in Wrocław (SW Poland) on 23 July 2017, while the lowest (18 m s−1) was recorded in a few places (Świnoujście – 18 June 2012 and 28 June 2014; Siedlce – 4 May 1996 and 3 May 1997; Opole – 28 August 1994 and 19 August 2022). Gust winds of stratified into gales (8–9 BS) and storms (10 BS and more) do not show any important changes in the annual courses compared to annual courses based on all cases of strong winds (see Figs. 12 and S7). The main reason for this is the rare occurrence of storms in Poland. In the study period, storms were not observed in most of the years, and the maximum in 1 year reached three cases (not shown).
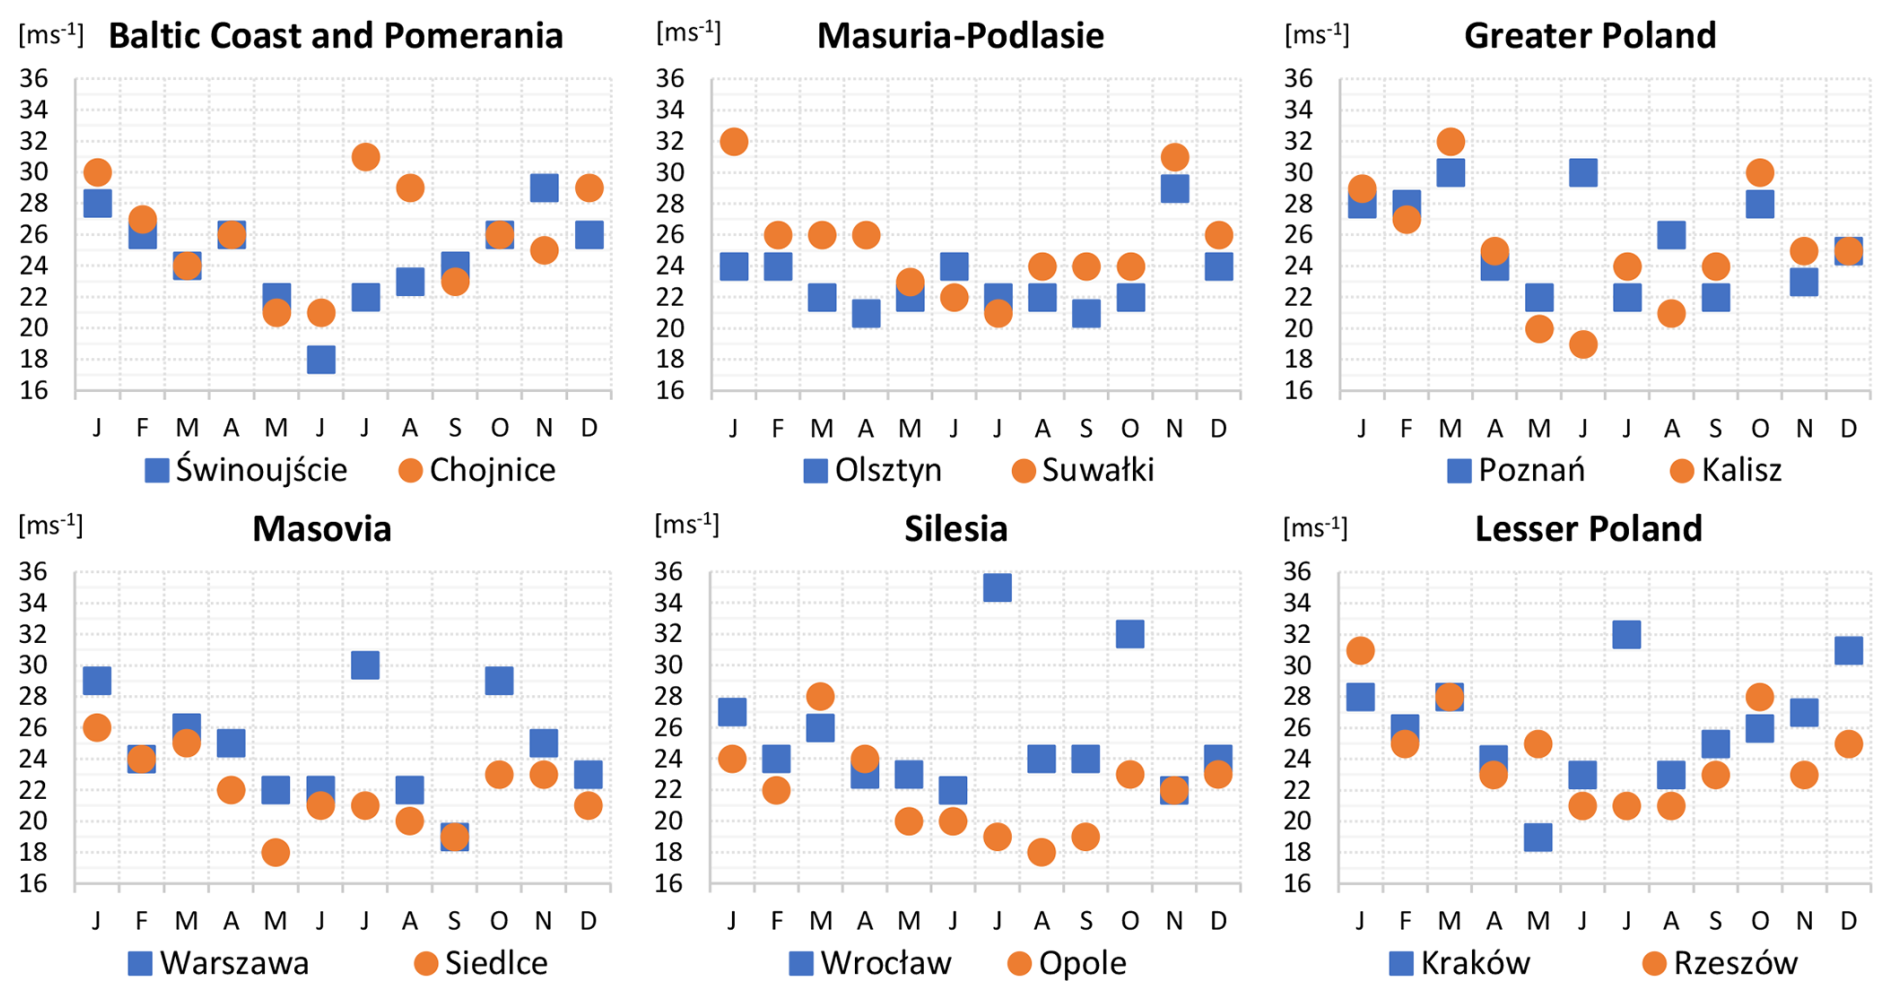
Figure 13Maximum monthly wind gust speeds (m s−1) at selected stations in Poland representing the six studied regions, 1993–2022.
Five categories of strong winds were distinguished in our database (https://doi.org/10.18150/W6PMBQ; Przybylak et al., 2025; see also Methods) and analysed in the present paper. The first three categories of strong winds (fresh and strong breezes, gales, and storms) in central Europe are connected with vigorous moving cyclones born near Iceland, particularly with a passing cold front. Cyclonic activity is at its greatest in the cold half-year (October–March); therefore, these categories of strong winds dominate in this part of the year. On the other hand, the last two categories (squalls and tornadoes) are typical for the warm half-year (April–September) and are related to thunderstorm clouds (cumulonimbus) developing within thermal turbulence occurring either in a single air mass (sometimes called “isolated” or “local” thunderstorms) or within the zone of a passing cold front (multiple-cell storms, squall lines, or a supercell). As a result (especially for category 4 – squalls), the duration of these kinds of strong winds is short, and their spatial coverage is local.
Recognising the types of strong winds based on the available descriptions of this weather element in historical sources is not always easy and unambiguous, due to the scarcity of information. Another difficulty in analysing changes in the frequency of occurrence of the phenomenon is the increasing number of sources as we move closer towards the present day. According to Brázdil et al. (2004), this is the main limiting factor for a climatological analysis of changes in the occurrence of strong wind in historical times. Moreover, in older periods, attention was focused more on describing only extremely strong winds (see Fig. 5) and mostly those that caused serious material or human damage. On the other hand, at present, the occurrence of category 1 strong winds (fresh and strong breezes) in all meteorological stations in Poland is about 10 times more frequent than the sum of categories 2 and 3 (see Fig. S5). For this reason, time analysis of occurrences of most extreme wind categories seems most reliable, not only for the study of historical periods but also when we compare their frequencies in historical and contemporary periods. It is also not possible, based on the documentary evidence, to reconstruct strong winds for individual places in Poland as is normally done for systematic instrumental measurements. Therefore, all series of strong wind frequencies are presented here for the entire area of Poland.
The lower gust wind speed threshold, which was assumed for central Europe to be potentially dangerous for the destruction of buildings, forests, gardens, etc., is 17 m s−1 (Brázdil and Dobrovolny, 2001; Lorenc, 2012). Therefore, it is possible to approximately compare the frequency of strong winds above this threshold obtained from contemporary instrumental observations with the summed frequency of historical winds assigned to categories 2–5. For category 4 (squall), only those cases for which damage was noted (8 cases) were taken. The results of the comparative analyses presented below must, however, be limited only to similarities and differences in the annual cycle and spatial distribution in the study area. A reliable comparison of absolute values of the frequency of strong winds is impossible due to the undetectability of probably numerous events in the study's historical period. This will only be possible for some isolated periods for which daily weather records are available. For Poland, such series exist for selected periods in the 17th and 18th centuries (for details, see Introduction) and will be the subject of our analysis in a separate article.
In Poland, the most frequent winds are from the western sector (from SW to NW), particularly from the NW direction, while the least frequent winds are from the sector from N to ESE (see Fig. 15.4 in Wibig, 2021). According to investigations by Lorenc (2012), about 80 % of strong winds of in Poland in the period 1991–2005 were associated with the occurrence of NWc circulation (i.e. wind blowing from the NW direction within cyclonic pattern) according to Lityński's (1969) classification. Also, hurricane winds () in Poland in the period 1971–2005 were mostly associated with NWc type and then with Wc type. As a result, both the greatest measured winds and the greatest frequency of them are characteristic for northwestern, western, and southwestern Poland, particularly in the cold half-year (Lorenc, 2012; Wibig, 2021; see also Figs. 10–12). Such spatial distribution of strong winds was also found for the study's historical period when the greatest frequencies were noted in the regions of Silesia and the Baltic Coast and Pomeranian Region (see Fig. 4). In the Greater Poland region (central western Poland), this was not found, due to the number of historical sources available being very small (see Fig. 2). It is also worth noting some similarity in annual cycles of strong wind occurrences in the historical and modern periods. In both periods, the greatest frequencies occurred in the cold half-year, and the lowest frequencies occurred in summer. However, in historical times, a greater frequency was observed in autumn than in winter, i.e. opposite to modern times (cf. Figs. 4 and 11). This can probably be interpreted as reflecting the climate having been more continental in medieval times than it is now (see Sadowski, 1991; Przybylak, 2016; Przybylak et al., 2023). The winters were clearly colder than today (see Przybylak et al., 2005, 2023) and were connected with negative values of the NAO (Przybylak et al., 2003). Such a circulation pattern in the Atlantic–European sector allowed more frequent advection of cold air masses to Poland from eastern and northern sectors within anticyclones coming from eastern Asia (Siberia) and the Arctic. On the other hand, positive NAO conditions often bring high storminess in Europe (Orme, 2014, and references therein).
The decadal number of sources (and thus the number of occurrences of strong winds) for the mid-15th century is similar to that for the 16th century (see Fig. 3). Therefore, for this period, it is possible to make a comparison with analogical investigations undertaken for other parts of Europe. Unfortunately, the comparison is limited to only a few existing works presenting results, particularly for the 15th century (see Introduction). For Czech lands, Brázdil et al. (2004) found only 24 cases of strong winds for this century, i.e. 40 % fewer than we found for Poland (40). However, the main difference is that, in the Czech lands, the strong winds were connected with thunderstorms (convective storms), whereas, in Poland, this category was noted only five times. A better and more reliable comparison is possible with the number of storm events occurring in the coastal area of Belgium and the southwestern Netherlands. This number was provided by de Kraker (2013) using town accounts reporting on the repairing of damage to dikes, piers, groynes, and quay walls after storms. In the second half of the 15th century, in both areas (Poland and western Europe), the greatest numbers of strong winds were noted in the first and the last decades (cf. Graph 1 in de Kraker, 2013, and Fig. 3 in this study). Similarly for the 16th century, a good agreement is found. Specifically, both in Poland and in coastal areas of Belgium and the Netherlands, strong winds were more common in the second half of the century than in the first. This finding is further confirmed by results presented for the Czech Republic (Brázdil et al., 2004) and Germany (Glaser, 2013). In terms of differences in decadal totals among countries, the greatest is noted for the second decade of the 16th century, which was exceptionally rich in storm events in Belgium and the Netherlands in comparison to neighbouring decades. In Poland, the maximum is seen in this decade as well, but it is not as great in absolute terms as the maximum in Belgium and the Netherlands. On the other hand, in the Czech Republic, this maximum is not seen. In Germany, there was a steady increase in the number of strong winds until about 1575 and then a decrease by the end of the century. Such a tendency in the occurrence of strong winds in the last 3 decades of the 16th century was also noted in Poland (see Fig. 3). In both countries, the maximum of strong winds in the 16th century occurred in the 1570s.
Comparison of potential periods with strong winds (usually reconstructions of high/low storminess periods) against results obtained using other natural proxies (e.g. sand dune development, windblown sand in peat bogs or marshes) allows only a very rough comparison. For example, reconstructions have found the onset of a period of great storminess in the mid-16th century for Scandinavia (De Jong et al., 2006; Clemmensen et. al. 2009), the northwestern Mediterranean (Sabatier et al., 2012), and Portugal (Costas et al., 2012). Importantly, this stormy period is also seen in the documentary evidence from Poland, the Czech Republic, Germany, and Belgium and the Netherlands.
There are numerous mentions of strong winds in historical periods, but, as the literature review shows, there has only been very limited study of this important element from a long-term perspective. This lack of research is certainly due in large part to the great dynamics over time and spatial variability in the occurrence of strong winds in Europe, including Poland. These dynamics are especially great for convective storms, which are local in nature. Additionally, these dynamics, together with the great diversity in numbers of available historical sources (especially before 1500), significantly hamper the proper recognition of this important element of the climate based on documentary evidence. As a result, reliable examination of changes in the occurrence of strong winds compared to the modern period is extremely difficult and limited, but it is nevertheless possible.
Having stated the preceding reservations, we present the most important research results below:
-
Some characteristics of the occurrence of strong winds in Poland can be reliably estimated for the mid-15th century onwards.
-
The highest numbers of strong winds occurred in the second half of the 15th century and (even more so) in the second half of the 16th century. The decade with the greatest number of strong winds was 1571–1580 (14) (see Fig. 3).
-
For each season, the greatest numbers of strong winds were found for the Baltic Coast and Pomeranian Region, followed by Silesia and then Lesser Poland (Fig. 4).
-
Strong winds were noted most often in autumn and winter in Silesia and in the Baltic Coast and Pomeranian Region (the two regions for which there is enough information to estimate the annual cycle) and in summer in the Lesser Poland region (Fig. 4b). August (13 cases) and March (12) were most abundant in strong wind occurrences in Poland, but the stormiest period of the year was from October to March, with at least 10 cases in each month except February (Fig. 4a).
-
In the entire study period (1281–1600), and also in two sub-periods (1281–1500 and 1501–1600), the most frequent were storms and gales and the least frequent were fresh and strong breezes (Figs. 5 and S1), which were most common in autumn and in winter.
-
All categories of strong winds in the study period occurred with the greatest frequency in the Baltic Coast and Pomeranian Region, except squalls, which were most frequently noted in the Silesia region (Fig. 6). In the 16th century, however, squalls were most common in Lesser Poland (Fig. S2).
-
Damage of category E2 (areally extensive damage) was more than 3 times more frequent than category E1 (less extensive damage). About one-third of the notes mentioned strong wind occurrence but did not contain information about the damage. The greatest and most frequent damage was noted for autumn (37.2 %), and the smallest amount of damage was noted for spring (19.0 %) (Figs. 7 and S3).
-
Of all distinguished categories of damage, DB (26.0 %) and DL (10.5 %) were most frequent, while the least frequent was DO (1.7 %) (Fig. 9). About 60 % of all mentions of damage in the weather notes were found for the cold half-year but particularly for autumn (39.2 %). The analysis reveals that the most frequently noted categories of damage in Poland (DB, DL) were also noted in all analysed regions, with a maximum in the Silesia and Baltic Coast and Pomeranian Regions.
-
Strong winds estimated for the studied historical period based on documentary evidence are similar to those of today in terms of spatial distribution, i.e. the greatest frequencies of strong wind occurrence in the Baltic Coast and Pomeranian Region and Silesia (see Fig. 4) and in terms of distribution within the annual cycle (Fig. 5) (Lorenc, 2012; Wibig, 2021; see also Figs. 10–12). These facts seem to confirm, to some extent, the reliability of the results obtained for the historical period.
-
The time changes in occurrences of strong winds in Poland in the period since the mid-15th century were found, using documentary evidence, to correspond well with those for other European countries (e.g. the Czech Republic, Germany, and the Netherlands and Belgium). Other proxy data used to reconstruct storminess changes in some parts of Europe in historical times (e.g. in Scandinavia, Portugal, and the southwestern Mediterranean) also show a good correspondence with the presented results for central and western Europe.
-
The “fresh and strong breeze” category of strong winds was rarely noted by chroniclers in historical times because winds of this category did not cause any material or human damage. On the other hand, this category of strong winds delimited using measurement data is, at present, about 10 times more frequent than gales and storms taken together. Therefore, the sporadic records of this category of strong winds during the historical period cannot be reliably used as a basis for comparison against current conditions. Such comparison will probably only be possible for isolated periods for which daily weather observations are available.
The creation of databases on extreme phenomena and events in historical periods, as in this case of strong winds, is extremely important in order to be able to recognise the natural range of their temporal changes and to learn about spatial variability and their changes over time. The high variability, both in time and space, of the extreme phenomenon under study requires that significant temporal and spatial coverage be obtained for the correct and reliable identification of its features in Europe from a long-term perspective. The review of the state of knowledge on this subject covered in this article clearly proves that it is very limited and, therefore, urgently requires intensified work, especially using documentary evidence, which is undoubtedly the most accurate source of information for the last millennium.
The same method of processing data on strong winds available in the documentary evidence of individual European and other non-European countries would significantly facilitate the recognition of this extreme phenomenon over a larger area and the comparison of results. For these reasons, in this article, we applied the proposal given in the work of Brázdil et al. (2004), which we only slightly modified to reflect the Baltic Sea's influence on the coastal part of Poland.
Datasets for this research were derived from the following public domain resources:
-
Repository for Open Data (RepOD), Nicolaus Copernicus University Centre for Climate Change Research collection, as cited in Przybylak et al. (2025) (https://doi.org/10.18150/W6PMBQ).
-
The Institute of Meteorology and Water Management (IMGW-PIB) (subdaily resolution: https://danepubliczne.imgw.pl/data/dane_pomiarowo_obserwacyjne/dane_meteorologiczne/terminowe/synop/; daily resolution: https://danepubliczne.imgw.pl/data/dane_pomiarowo_obserwacyjne/dane_meteorologiczne/dobowe/synop/; last access: 11 February 2025).
The supplement related to this article is available online at https://doi.org/10.5194/cp-21-1501-2025-supplement.
RP: conceptualisation, methodology, investigation, data collection and selection, database construction, formal analysis, literature review, interpretation of results, writing (original draft and review and editing), funding acquisition, project administration. AA: conceptualisation, methodology, investigation, data collection and selection, formal analysis, validation, visualisation, interpretation of results. JF: conceptualisation, methodology, investigation, data collection and selection, database construction, validation, interpretation of results, writing (original draft). PO: conceptualisation, investigation, data collection and selection, database construction, visualisation, validation. PW: software, visualisation, validation, formal analysis, data collection, database construction. AS: database construction.
The contact author has declared that none of the authors has any competing interests.
Publisher's note: Copernicus Publications remains neutral with regard to jurisdictional claims made in the text, published maps, institutional affiliations, or any other geographical representation in this paper. While Copernicus Publications makes every effort to include appropriate place names, the final responsibility lies with the authors.
We would like to thank Babak Ghazi for preparing Fig. 1.
The research work of Rajmund Przybylak, Janusz Filipiak, Piotr Oliński, and Przemysław Wyszyński was supported by the National Science Centre, Poland (grant no. 2020/37/B/ST10/00710). The work of Andrzej Araźny was supported by funds from the IDUB Research Group Weather and Climate: Reconstructions and Future Scenarios.
This paper was edited by Francesco Muschitiello and reviewed by two anonymous referees.
Adamczyk, A. B.: Charakterystyka wiatrów silnych i bardzo silnych w Polsce, Zeszyty Instytutu Geografii i Przestrzennego Zagospodarowania PAN, 37, 5–42, 1996.
Araźny, A., Przybylak, R., Vízi, Z., Kejna, M., Maszewski, R., and Uscka-Kowalkowska, J.: Mean and extreme wind velocities in Central Europe 1951–2005 (on the basis of data from NCEP/NCAR reanalysis project), Geographia Polonica, 80, 69–78, 2007.
Bartnicki, L.: Prądy powietrzne dolne w Polsce, Prace Geofiz., 3, 2–98, 1930.
Brázdil, R. and Dobrovolný, P.: Chronology of strong wind events in the Czech Lands during the 16th–19th centuries, Instytut Geograficzny UJ, Prace Geograficzne, 107, 65–70, 2000.
Brázdil, R. and Dobrovolný, P.: History of strong winds in the Czech Lands: causes, fluctuations, impacts, Geographia Polonica, 74, 11–27, 2001.
Brázdil, R., Dobrovolný, P., Štekl, J., Kotyza, O., Valášek, H., and Jež, J.: History of weather and climate in the Czech Lands VI: Strong winds, Masaryk University, Brno, ISBN 80-210-3547-1, 2004.
Brönnimann, S., Allan, R., Ashcroft, L., Baer, S., Barriendos, M., Brázdil, R., Brugnara, Y., Brunet, M., Brunetti, M., Chimani, B., Cornes, R., Domínguez-Castro, F., Filipiak, J., Founda, D., Herrera, R. D., Gergis, J., Grab, S., Hannak, L., Huhtamaa, H., Jacobsen, K. S., Jones, P., Jourdain, S., Kiss, A., Lin, K. E., Lorrey, A., Lundstad, E., Luterbacher, J., Mauelshagen, F., Maugeri, M., Maughan, N., Moberg, A., Neukom, R., Nicholson, S., Noone, S., Nordli, Ø., Ólafsdóttir, K. B., Pearce, P. R., Pfister, L., Pribyl, K., Przybylak, R., Pudmenzky, C., Rasol, D., Reichenbach, D., Řezničková, L., Rodrigo, F. S., Rohr, C., Skrynyk, O., Slonosky, V., Thorne, P., Valente, M. A., Vaquero, J. M., Westcott, N. E., Williamson, F., and Wyszyński, P.: Unlocking Pre-1850 Instrumental Meteorological Records: A Global Inventory, B. Am. Meteorol. Soc., 100, ES389–ES413, https://doi.org/10.1175/BAMS-D-19-0040.1, 2019.
Ephemerides Societatis Meteorologicae Palatinae, 1783–1795, vol. II–XIII, Mannheim.
Chojnacka-Ożga, L. and Ożga, W.: Silne wiatry jako przyczyna zjawisk klęskowych w lasach, Studia i Materiały CEPL w Rogowie, 20, 13–23, 2018.
Clemmensen, L. B., Murray, A., Heinemeier, J., and De Jong, R.: The evolution of Holocene coastal dune fields, Jutland, Denmark: A record of climate change over the past 5000 years, Geomorphology, 105, 303–313, https://doi.org/10.1016/j.geomorph.2008.10.003, 2009.
Costas, S., Jerez, S., Trigo, R. M., Goble, R., and Rebêlo, L.: Sand invasion along the Portuguese coast forced by westerly shifts during cold climate events, Quaternary Sci. Rev., 42, 15–28, https://doi.org/10.1016/j.quascirev.2012.03.008, 2012.
Cusack, S.: A long record of European windstorm losses and its comparison to standard climate indices, Nat. Hazards Earth Syst. Sci., 23, 2841–2856, https://doi.org/10.5194/nhess-23-2841-2023, 2023.
De Jong, R., Björck, S., Björkman, L., and Clemmensen, L. B.: Storminess variation during the last 6500 years as reconstructed from an ombrotrophic peat bog in Halland, southwest Sweden, J. Quaternary Sci., 21, 905–919, https://doi.org/10.1002/jqs.1011, 2006.
De Kraker, A.: Storminess in the Low Countries, 1390–1725, Environ. Hist., 19, 149–171, https://doi.org/10.3197/096734013X13642082568570, 2013.
Dobrovolný, P. and Brázdil, R.: Documentary evidence on strong winds related to convective storms in the Czech Republic since AD 1500, Atmos. Res. 67–68, 95–116, https://doi.org/10.1016/S0169-8095(03)00046-2, 2003.
Donat, M. G., Leckebusch, G. C., Wild, S., and Ulbrich, U.: Future changes in European winter storm losses and extreme wind speeds inferred from GCM and RCM multi-model simulations, Nat. Hazards Earth Syst. Sci., 11, 1351–1370, https://doi.org/10.5194/nhess-11-1351-2011, 2011.
Galloway, J. A.: Storm Flooding, Coastal Defence and Land Use around the Thames Estuary and Tidal River c. 1250–1450, J. Medieval Hist., 35, 171–188, https://doi.org/10.1016/j.jmedhist.2008.12.001, 2009.
Galloway, J. A. and Potts, J.: Marine Flooding in the Thames Estuary and Tidal River c. 1250–1450: Impact and Response, Area, 39, 370–379, 2007.
Ghazi, B., Przybylak, R., Oliński, P., Bogdańska, K., and Pospieszyńska, A.: The frequency, intensity, and origin of floods in Poland in the 11th–15th centuries based on documentary evidence, J. Hydrol., 623, 129778, https://doi.org/10.1016/j.jhydrol.2023.129778, 2023a.
Ghazi, B., Przybylak, R., Oliński P., Chorążyczewski, W., and Pospieszyńska, A.: An assessment of flood occurrences in Poland in the 16th century, J. Hydrol.: Regional Studies, 50, 101597, https://doi.org/10.1016/j.ejrh.2023.101597, 2023b.
Ghazi, B., Przybylak, R., Oliński, P., Targowski, M., Filipiak, J., and Pospieszyńska, A.: A comprehensive study of floods in Poland in the 17th–18th centuries, J. Hydrol.: Regional Studies, 53, 101796, https://doi.org/10.1016/j.ejrh.2024.101796, 2024.
Ghazi, B., Przybylak, R., Oliński, P., and Pospieszyńska, A.: Flood occurrences and characteristics in Poland (Central Europe) in the last millennium, Global Planet. Change, 246, 104706, https://doi.org/10.1016/j.gloplacha.2025.104706, 2025.
Glaser, R.: Klimageschichte Mitteleuropas. 1000 Jahre Wetter, Klima, Katastrophen, Primus Verlag, Darmstadt, 227 pp., ISBN 10 3896784056, 2001.
Glaser, R.: Klimageschichte Mitteleuropas. 1200 Jahre Wetter, Klima, Katastrophen, 3. Auflage, WBG, Darmstadt, 264 pp., ISBN 978-3-86312-350-5, 2013.
Gumiński, R.: Rozkład kierunków i prędkości wiatru na niektórych stacjach meteorologicznych Polski, Wiad. Sł. Hydr. i Met. 3, 45–64, 1952.
Hawkins, E., Brohan, P., Burgess, S. N., Burt, S., Compo, G. P., Gray, S. L., Haigh, I. D., Hersbach, H., Kuijjer, K., Martínez-Alvarado, O., McColl, C., Schurer, A. P., Slivinski, L., and Williams, J.: Rescuing historical weather observations improves quantification of severe windstorm risks, Nat. Hazards Earth Syst. Sci., 23, 1465–1482, https://doi.org/10.5194/nhess-23-1465-2023, 2023.
Krawczyk, B.: Średnia liczba dni z wiatrem o prędkości , in: Atlas zasobów, walorów i zagrożeń środowiska geograficznego Polski, IGiPZ PAN, Warszawa, ISBN 83‑901355‑0‑7, 1994.
Lamb, F.: Historic Storms of the North Sea, British Isles and Northwest Europe, Great Britain, Cambridge University Press, ISBN: 0521375223, 1991.
Lityński, J.: Liczbowa klasyfikacja typów cyrkulacji I typów pogody dla Polski, Prace PIHM, 97, 3–14, 1969.
Lorenc, H.: Struktura i zasoby energetyczne wiatru w Polsce, Materiały Badawcze, s. Meteorologia 25. IMGW, Warszawa, 1996.
Lorenc, H.: Maksymalne prędkości wiatru w Polsce, Monografie, Instytut Meteorologii i Gospodarki Wodnej-Państwowy Instytut Badawczy, Warszawa, ISBN 10 8361102620, 2012.
Lundstad, E., Brugnara, Y., Pappert, D. Kopp, J. Samakinwa, E., Hürzeler, A., Andersson, A., Chimani, B., Cornes, R., Demarée, G., Filipiak, J., Gates, L., Ives, G. L., Jones, J. M., Jourdain, S., Kiss, A., Nicholson, S. E., Przybylak, R., Jones, P., Rousseau, D., Tinz, B., Rodrigo, F. S., Grab, S., Domínguez-Castro, F., Slonosky, V., Cooper, J., Brunet, M., and Brönnimann, S.: The global historical climate database HCLIM, Sci. Data, 10, 44, https://doi.org/10.1038/s41597-022-01919-w, 2023.
MunichRe: Topics GEO, Natural Catastrophes 2011 Analyses Assessments Positions, Munich Reinsurance Company Publications, Munich, 1–49, 2011.
Munich Re: Natural Catastrophe statistics online – the NatCatSERVICE analysis tool, https://www.munichre.com/en/solutions/for-industry-clients/natcatservice.html (last access: 10th February 2025), 2020.
Niedźwiedź, T., Glaser, R., Hansson, D., Helama, S., Klimenko, V., Łupikasza, E., Małarzewski, Ł., Nordli, Ø., Przybylak, R., Riemann, D., and Solomina, O.: The Historical Time Frame (Past 1000 Years), In: The BACC II Author Team (eds), Second Assessment of Climate Change for the Baltic Sea Basin, Regional Climate Studies, Springer, Cham., https://doi.org/10.1007/978-3-319-16006-1_3, 2015.
Orme, L. C.: Reconstructions of Late Holocene storminess in Europe and the role of the North Atlantic Oscillation, PhD work, University of Exeter, 306 pp., https://ore.exeter.ac.uk/repository/bitstream/handle/10871/16128/OrmeL.pdf?sequence, 2014.
Outten, S. and Sobolowski, S.: Extreme wind projections over Europe from the Euro-CORDEX regional climate models, Weather and Climate Extremes, 33, 100363, https://doi.org/10.1016/j.wace.2021.100363, 2021.
Pappert, D., Brugnara, Y., Jourdain, S., Pospieszyńska, A., Przybylak, R., Rohr, C., and Brönnimann, S.: Unlocking weather observations from the Societas Meteorologica Palatina (1781–1792), Clim. Past, 17, 2361–2379, https://doi.org/10.5194/cp-17-2361-2021, 2021.
Paszyński, J. and Niedźwiedź, T.: Klimat, in: Geografia Polski środowisko przyrodnicze, edited by: Starkel, L., PWN, Warszawa, ISBN 10 83-01-09621-7, 1991.
Piasecki, D.: Wiatry o maksymalnych prędkościach na obszarze Polski w latach 1928–1938, Wiad. Sł. Hydr. i Met., 3, 65–101, 1952.
Pfister, C.: Wetternachhersage, 500 Jahre Klimavariationen und Naturkatastrophen (1496–1995), Paul Haupt, Bern, ISBN 3-258-05696-X, 1999.
Przybylak, R.: The Climate of Poland in Recent Centuries: A Synthesis of Current Knowledge: Instrumental observations, in: The Polish Climate in the European Context: An Historical Overview, edited by: Przybylak, R., Majorowicz, J., Brázdil, R., and Kejna, M., Springer, Berlin, Heidelberg, New York, 129–166, https://doi.org/10.1007/978-90-481-3167-9, 2010.
Przybylak, R., Wójcik, G., and Marciniak, K.: Wpływ Oscylacji Północnoatlantyckiej oraz Arktycznej na warunki termiczne chłodnej pory roku w Polsce w XVI–XX wiekach, Przegl. Geof., 1–2, 61–74, 2003.
Przybylak, R., Majorowicz, J., Wójcik, G., Zielski, A., Chorążyczewski, W., Marciniak, K., Nowosad, W., Oliński, P., and Syta, K.: Temperature changes in Poland from the 16th to the 20th centuries, Int. J. Climatol., 25, 773–791, https://doi.org/10.1002/joc.1149, 2005.
Przybylak, R., Pospieszyńska, A., Wyszyński, P., and Nowakowski, M.: Air temperature changes in Żagan (Poland) in the period from 1781 to 1792, Int. J. Climatol., 34, 2408–2426, https://doi.org/10.1002/joc.3847, 2014.
Przybylak, R.: Poland's Climate in the Last Millennium, in: Oxford Research Encyclopedia, Climate Science, Oxford University Press, USA, https://doi.org/10.1093/acrefore/9780190228620.013.2, 2016.
Przybylak, R., Oliński, P., Koprowski, M., Filipiak, J., Pospieszyńska, A., Chora̧życzewski, W., Puchałka, R., and Da̧browski, H. P.: Droughts in the area of Poland in recent centuries in the light of multi-proxy data, Clim. Past, 16, 627–661, https://doi.org/10.5194/cp-16-627-2020, 2020.
Przybylak, R., Oliński, P., Koprowski, M., Szychowska-Kra̧piec, E., Kra̧piec, M., Pospieszyńska, A., and Puchałka, R.: The climate in Poland (central Europe) in the first half of the last millennium, revisited, Clim. Past, 19, 2389–2408, https://doi.org/10.5194/cp-19-2389-2023, 2023.
Przybylak, R., Oliński, P., Wyszyński, P., Szwaba, A., Filipiak, J., and Araźny, A.: Database of strong wind occurrence in Poland from the 13th to 16th centuries based on documentary evidence, RepOD, V1 [data set], https://doi.org/10.18150/W6PMBQ, 2025.
Sadowski, M.: Variability of extreme climatic events in Central Europe since the 13th century, Z. Meteorol., 41, 350–356, 1991.
Sabatier, P., Dezileau, L., Colin, C., Briqueu, L., Bouchette, F. D. R., Martinez, P., Siani, G., Raynal, O., and Von Grafenstein, U.: 7000 years of paleostorm activity in the NW Mediterranean Sea in response to Holocene climate events, Quaternary Research, 77, 1–11, https://doi.org/10.1016/j.yqres.2011.09.002, 2012.
Stopa-Boryczka, M. (Ed.): Atlas współzależności parametrów meteorologicznych i geograficznych w Polsce, 5. Wyd. UW, Warszawa, ISBN: 83-230-0201-0, 1989.
Tarnowska, K.: Wiatry silne na polskim wybrzeżu Morza Bałtyckiego, Prace i Studia Geograficzne, 47, 197–214, 2011.
Ustrnul, Z., Wypych, A., Henek, E., Czekierda, D., Walawender, J., Kubacka, D., Pyrc, R., and Czernecki, B.: Atlas zagrożeń meteorologicznych Polski (Meteorological hazard atlas of Poland), Instytut Meteorologii i Gospodarki Wodnej – Państwowy Instytut Badawczy, Kraków, ISBN 978-83-64979-05-7, 2014.
Wibig, J.: Change of Wind. in: Climate Change in Poland: Past, Present, Future, edited by: Falarz, M., Springer Nature, Switzerland, 391–420, https://doi.org/10.1007/978-3-030-70328-8_15, 2021.