the Creative Commons Attribution 4.0 License.
the Creative Commons Attribution 4.0 License.
 | 03 Feb 2023
Climatic and societal impacts in Scandinavia following the 536 and 540 CE volcanic double event
Evelien van Dijk
Ingar Mørkestøl Gundersen
Anna de Bode
Helge Høeg
Kjetil Loftsgarden
Frode Iversen
Claudia Timmreck
Johann Jungclaus
In the Northern Hemisphere, the mid-6th century was one of the coldest periods of the last 2000 years, which was initiated by volcanic eruptions in 536 and 540 CE. Here, we study the effect of this volcanic double event on the climate and society in Scandinavia with a special focus on southern Norway. Using an ensemble of Max Planck Institute Earth system model transient simulations for 521–680 CE, temperature, precipitation, and atmospheric circulation patterns are analyzed. The simulated cooling magnitude is used as input for a growing degree day (GDD) model setup for three different study areas in southern Norway, representative of typical meteorological and landscape conditions. Pollen from bogs inside these study areas are analyzed at high resolution (1–3 cm sample intervals) to give insights into the validity of the GDD model setup with regard to the volcanic climate impact on the regional scale and to link the different data sets with the archeological records.
We find that after the 536 and 540 CE double event, a maximum surface air cooling of up to 3.5 ∘C during the mean growing season is simulated regionally for southern Norway. With a scenario cooling of 3 ∘C, the GDD model indicates crop failures were likely in our northernmost and western study areas, while crops were more likely to mature in the southeastern study area. These results are in agreement with the pollen records from the respective areas. Archeological excavations show, however, a more complex pattern for the three areas with abandonment of farms and severe social impacts but also a continuation of occupation or a mix of those. Finally, we discuss the likely climatic and societal impacts of the 536 and 540 CE volcanic double event by synthesizing the new and available data sets for the whole Scandinavia.
- Article
(17214 KB) - Full-text XML
- BibTeX
- EndNote


Large volcanic eruptions are the main driver of natural climate variability in the pre-industrial era of the last millennium (Hegerl et al., 2006). Double eruptions or clusters of eruptions that occurred in the last 2000 years frequently coincide with cold periods in the Northern Hemisphere (NH, Briffa et al., 1998; Zhong et al., 2011; Miller et al., 2012; Sigl et al., 2013). One of the coldest decades in Europe and the NH of the last 2000 years occurred during the mid-6th century, which was initiated by the volcanic double event in 536 and 540 CE. This cold period was discovered in tree-ring and ice core records (Baillie, 1994; Larsen et al., 2008; Büntgen et al., 2011; Sigl et al., 2015) and coincided with historical documents reporting a dimming of the sun starting in March 536 CE (Stothers and Rampino 1983; Stothers, 1984; Rampino et al., 1988; Kostick and Ludlow, 2015). Updated ice core chronologies reveal two sulfur peaks that correspond to eruptions in 536 and 540 CE (Baillie, 2008; Sigl et al., 2015). In addition, a third volcanic eruption occurred in 547 CE (Sigl et al., 2015). This event was relatively small compared to the 536 and 540 CE eruptions, but it might have aided in the persistence of the cooling after the volcanic double event (Büntgen et al., 2016; Di Cosmo et al., 2017; van Dijk et al., 2022). Tree-ring records from the Alps and Altai recorded a cooling that lasted up to a century following these eruptions, and this period has therefore been named the Late Antiquity Little Ice Age (LALIA, Büntgen et al., 2016), but the extent and duration of the cold period is debated (Helama et al., 2017). Climate model studies indicate a multidecadal cooling rather than a centennial one for the NH, likely impacting society in Scandinavia (Toohey et al., 2016; van Dijk et al., 2022), but the extent of crisis or adaptation by societies in Norway during this time is unknown.
The centuries preceding the first millennium are characterized by great societal changes, including the ending of Antiquity and the beginning of Early Medieval state formations, a process historians believe to have been reinforced by the multidecadal cooling of the 6th century and the outbreak of the Justinian plague in 541 CE (Little, 2006; Rosen, 2006; McCormick et al., 2012). However, less is known about causal relationships between global cooling, regional climate, and local societal changes in Scandinavia.
The 536 CE eruption has been linked to the “Fimbulwinter myth” (Axboe, 1999, 2005; Gräslund, 2007; Gräslund and Price, 2012), during which no summer occurred for 3 years in a row. Gräslund and Price (2012) interpret the Fimbulwinter myth as a poetic rendition of a profound social crisis during the 6th century cooling event. A prolonged summer cooling could have potentially led to widespread crop failure. This is especially true for areas that are already at the temperature limit for growing certain crops, where the effect could be substantial. Evidence for reforestation in different parts of central and northern Europe has been associated with significant changes in the archeological record and what has been termed the “Migration Period Crisis” (Welinder, 1975; Berglund et al., 1996; Berglund, 2003; Gundersen, 2019). Based on excavations and dating of several sites in central Sweden, Gräslund and Price (2012) even go as far as to assume that the population in present-day Norway and Sweden in the mid-6th century may have declined by half.
Other evidence, however, suggests that there are regional differences in the climatic impact to this cooling (Degroot et al., 2021). Several studies highlight the importance of subsistence strategies when discussing societal variability to the cooling event. Communities heavily dependent on cultivation are more likely to have experienced an outright crisis, while those predominantly based on wildlife and pastoralism may have been able to adapt (TeBrake, 1978; Verhulst, 2002; Gräslund and Price, 2012; Tvauri, 2014; Hines and Ijssenagger, 2017; Oinonen et al., 2020; Hatlestad et al., 2021). These factors are likely to have contributed to considerable regional diversity in disaster impact (Gundersen, 2021).
In Norway, the mid-6th century is associated with profound changes in social organization and material culture, which defines the very transition from the Early Iron Age to the Late Iron Age (500 BCE–550 CE and 550–1050 CE, respectively). Often understood as a turning point in Norwegian prehistory, many archeologists discuss a possible causal relationship with the volcanic double event in 536 and 540 CE (Iversen, 2016; Gundersen, 2019). Bajard et al. (2022) reconstructed agricultural practices from the evidence of lake sediments in southeastern Norway (lake Ljøgottjern) and identified a correlation between temperature change and agricultural practices in this area during the Late Antiquity. This result is supported by the study of ter Schure et al. (2021), where analysis of DNA for the same lake sediment led to the same conclusion. However, the landscape in Norway is very diverse, with coastal areas, mountains, and valleys, leading to differences in regional climate and agricultural practices. Thus, considerable differences in social vulnerability to climate change can be expected throughout the broader study area.
In this study, we follow up on van Dijk et al. (2022) and use the Paleo Model Intercomparison Project phase 4 (PMIP4) past2k and the 6th–7th century Max Planck Institute Earth system model (MPI-ESM) simulations to analyze the atmospheric circulation and surface climate changes in response to the 536 and 540 CE eruptions, with a focus on Scandinavia and southern Norway. Three sites, Fron, Sarpsborg, and Høgsfjorden, are selected for case studies with a growing degree day (GDD) model, representing different weather and climate regimes and landscapes in southern Norway. The GDD model utilizes the maximum cooling simulated by the MPI-ESM ensemble, and the results are then compared to archeological and pollen records to shed more light on the climate, vegetation, and societal impacts for southern Norway. We discuss the likely post-volcanic climatic and societal response over Scandinavia based on the climate model data spread, atmospheric circulation patterns, and the local archeology and pollen records in addition to other available records.
2.1 Climate model simulations
The climate model simulations were run with the MPI-ESM1.2-LR, which is the low-resolution (LR) version used for the Coupled Model Intercomparison Project phase 6 (CMIP6) and the PMIP4. This model version has an atmospheric horizontal resolution of and 47 vertical layers, with the top at 0.01 hPa (80 km altitude). The ensemble consists of 10 total 520–680 CE runs (members 1–10), which were branched off from the past2k (no. 1) in the year 521 CE by perturbing the atmospheric diffusivity, and two “past2k” runs (two members, hereafter nos. 11 and 12), following the protocol of Jungclaus et al. (2017). The past2k simulations and the 520–680 CE ensemble are described in more detail by van Dijk et al. (2022). A more complete description of MPI-ESM1.2-LR in its CMIP6 configurations, including parameter and tuning choices, is given in Mauritsen et al. (2019).
The 2 m air temperature, precipitation, and sea level pressure (SLP) anomalies were calculated by subtracting the multiyear monthly mean of the period 1–1850 CE from the past2k run (no. 1). From these anomalies, the seasonal means for the average growing season in Scandinavia (April to September, hereafter AMJJAS) and the ensemble mean were calculated. For the model runs, only monthly values were archived and are available to this study, and therefore we show the growing season mean for the model simulations. Thus, “2 years after the eruption” means the two growing seasons after the simulated eruption (eruptions are simulated in January). The period 536–560 CE is taken for the long-term mean, as this is the recovery time after the volcanic double event for temperature. The first two growing seasons after each of the 536 and 540 CE eruptions are taken for the short-term response, which is the peak response time. The significance of the anomalies for the time series was calculated by taking the 2σ (1σ for precipitation) of the control run mean (no volcanic forcing) and the significance for the spatial patterns was calculated by bootstrapping. For this, random 2-year and 25-year periods were taken from the control run to make a time series of 1000 time steps, which was used to calculate the standard deviation. The 2σ (1σ) was then subtracted from the model ensemble to calculate the significance of the volcanic signal. For more details on this method, see van Dijk et al. (2022).
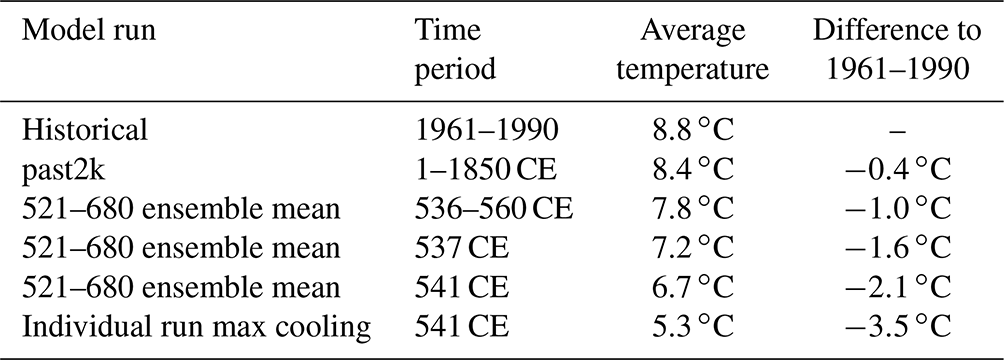
The applied GDD model is based on daily mean meteorological observations in Norway from 1961 to 1990 (Sect. 2.2). To estimate the relative degree of cooling simulated by the 6th century climate model runs as input for the GDD model, we used an extension of the past2k run (no. 2) over the historical period (1850–2014 CE). We compare the simulated 1961–1990 mean temperature in the historical run with the meteorological mean temperature anomalies over the study period to calculate the maximum simulated cooling after the 536 and 540 CE eruptions compared to 1961–1990 period (Sect. 3.1; Table 1).
Table 1Average temperature in Scandinavia for different ensemble members and periods.
Atmospheric circulation analysis
During winter to spring, climate in Scandinavia is influenced by four winter atmospheric circulation modes: a positive North Atlantic oscillation (NAO), a negative NAO, the North Atlantic ridge, and the Scandinavian blocking (Vautard, 1990; Michelangeli et al., 1995; Cassou, 2008). One of the most prominent teleconnection patterns in all seasons is the NAO. The NAO+ is defined as a strengthening of the high-pressure center over the mid-latitudes, generally around Portugal and the Azores, as well as a strengthening of the low-pressure center over Iceland (Hurrell, 1995), which leads to an increased pressure gradient driving a more vigorous westerly jet. The NAO is associated with changes in the location and intensity of the jet stream, as well as the patterns of heat and moisture transport (Hurrell, 1995). These changes affect the temperature and precipitation patterns over Europe and Scandinavia (van Loon and Rogers, 1978). The NAO+ brings higher temperatures and increased precipitation over Scandinavia, and the NAO− brings lower temperatures and decreased precipitation. The North Atlantic ridge is associated with a high pressure over the Atlantic and a low pressure over Scandinavia, leading to colder and wetter conditions over northern Europe. The Scandinavian blocking is represented by a stable high pressure system over Scandinavia, resulting in warm and sunny conditions over this region (Cassou, 2008; Tedesco, 2020).
Atmospheric circulation patterns can be obtained by using empirical orthogonal function calculations and projecting the first four modes onto the SLP fields (Hurrell, 1995). The empirical orthogonal function extracts the most often occurring pattern from a data set over time. In this study, the simulated monthly mean SLP from the past2k run no. 1 is used to calculate the different modes for 1–1850 CE. The SLP anomaly patterns are then compared to the four most commonly identified patterns from this empirical orthogonal function (EOF) analysis.
2.2 Growing degree day modeling
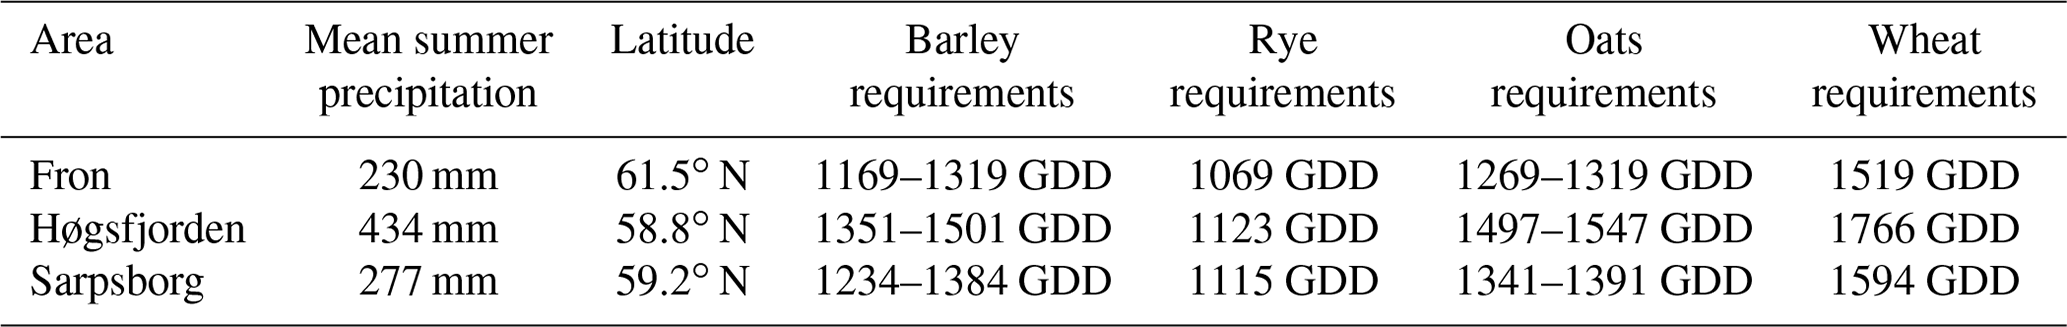
“Growing degree days” is defined as the accumulated daily mean temperature sum during the growing season, where the growing season is the period with daily mean temperatures at or above 5 ∘C (Fig. 1c, Carter, 1998; Hanssen-Bauer et al., 2017). Local GDD values can then be calculated by using local weather data, which is projected on a terrain model in a geographical information system (ArcGIS) by using a lapse rate of −0.6 ∘C for every 100 m a.s.l. (McIlveen, 1986; Stamnes, 2016; Strand, 1984). Mean daily temperature observations from the Norwegian Meteorological Institute for the standard climate period of 1961–90 are used as baseline values (https://www.met.no/en/free-meteorological-data/Download-services, last access: 28 November 2022). Grain species have different GDD requirements for reaching maturity, depending on local climate and topographical conditions (Frøseth, 2004; Strand, 1984). In pre-modern times, barley had a basic requirement of approximately 1200–1350 GDD, oats needed 1300–1350 GDD, rye 1100 GDD, and wheat 1550 GDD (Foss, 1926). Barley and oats could be sown in either early or late spring, resulting in a wider range of GDD requirements than for rye and wheat. These values must be recalculated for each area in question according to the number of solar hours and precipitation during summertime. Due to the greater number of solar hours in northern areas, the required heat budget decreases by approximately 20 GDD per degree of latitude north of 60∘ N (Frøseth, 2004; Strand, 1984; Åssveen and Abrahamsen, 1999). Rainfall exceeding 250 mm from May to August increase the required temperatures with an additional 60–80 GDD per 100 mm rainfall for barley, 90–100 mm for oats, and 100–110 mm for wheat (Frøseth, 2004).
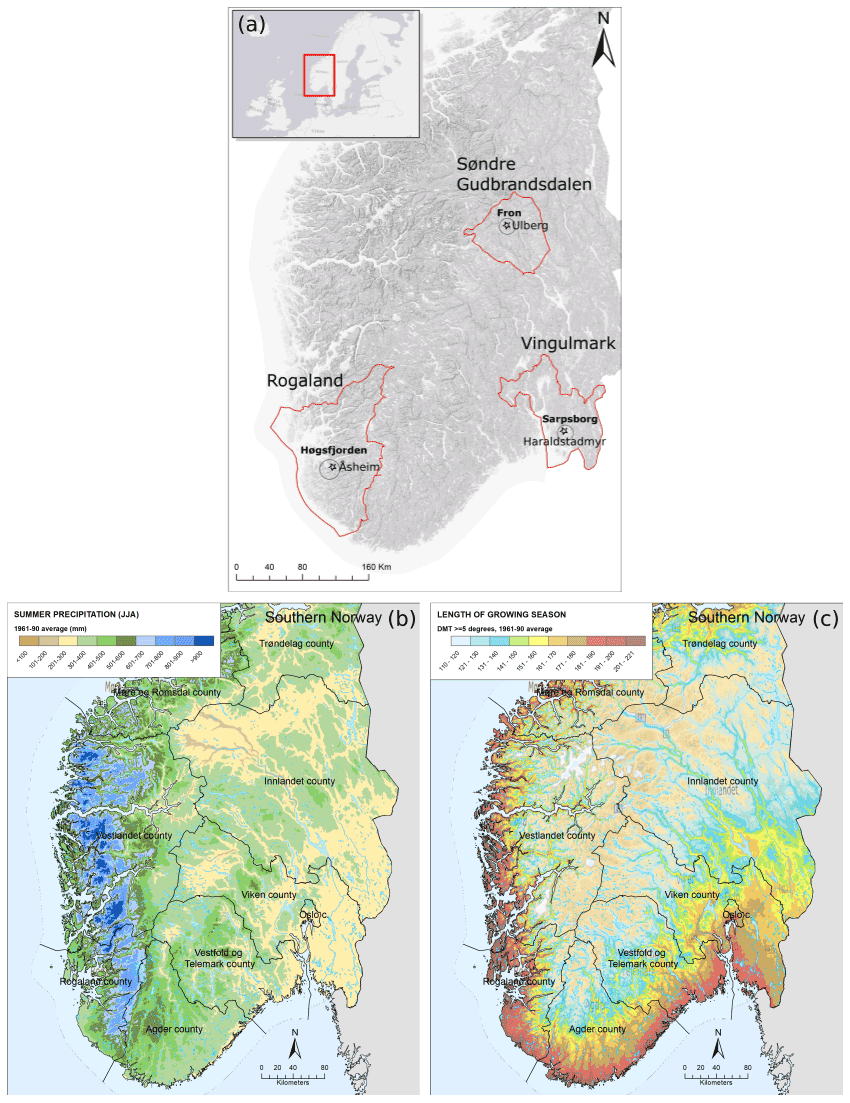
Figure 1(a) The three case study areas and associated sites. The red outline indicates the regions, bold names indicate the areas, and the stars indicate the locations and names of the bogs analyzed for pollen. DEM map from ESRI 2020. (b) The summer precipitation and (c) average length of the growing season (days) for southern Norway during 1961–1990 for days with a daily mean temperature (DMT) at or above 5 ∘C.
The three case study areas are Fron, located in the Gudbrandsdalen valley (eastern inland Norway), Høgsfjorden, located in Rogaland (southwestern Norway), and Sarpsborg, located on the eastern side of the Oslo fjord (southeastern Norway, Fig. 1a). The three areas represent three different weather and climate regimes in southern Norway (Fig. 1b–c). Several archeological excavations and field studies have been carried out in these areas (Sect. 2.3), including pollen analysis from sediment cores with high resolution (Sect. 2.4). This provides a thorough cultural historical context against which to analyze and compare the different GDD model output.
By taking the factors described above into consideration, the local requirements for the three study areas can be defined (Table 2; Gundersen, 2021).
Table 2Information about the three different sites for the growing degree day modeling, based on local growth conditions and 1961–90 meteorological data for each area.
In this study, two definitions for growing season are used. For the MPI-ESM simulations, monthly mean data are available to create a mean growing season, where the months April to September are taken. The definition of the actual growing season, however, is the number of days with a temperature at or above 5 ∘C, which can be different from year to year. This is referred to as the active growing season (Carter, 1998).
2.3 Archeological setting, data, and study areas
The three selected study areas were parts of larger “tribal” areas in the Roman and Migration periods (200–550 CE); 1500 years ago, the Scandza peninsula, which included present-day Sweden and Norway, was home to at least 25 tribal communities. According to the learned Greek author Procopius (1919 [∼ 530–560], Book XIV and XV), there were “thirteen very numerous nations” (nationes) in Thoulē (which equates to Scandza), one of which was probably the people Heiner (heiðnir) of Hedmark that the Fron area probably belonged to (Iversen, 2019). The peoples of Vikverir held land in the historic region Viken, where the lost medieval country Vingulmark contains the Sarpsborg area, while the Høgsfjorden area was located among the people of Rugi in Rogaland. Over the next 500 years, these “numerous nations” united into two larger kingdoms: Norway and Sweden (Brink, 2008b; Andersson, 2009; Iversen, 2019). This political process is intimately associated with the 5th–6th centuries CE, during which time there was a distinct turn towards ideas of kingship and political centralization (Skre, 2019). This development is usually understood as a response to the political and social turmoil of the Migration Period (400–550 CE), in which climate deterioration and social unrest may have been contributing causes (Iversen, 2016; Skre, 2019).
2.3.1 Fron area
Fron is the northernmost of our case study areas, and it is located in the narrow Gudbrandsdalen valley (Fig. 1a). In the Middle Ages, Fron was part of the þriðjung (legal district) of Søndre Gudbrandsdalen (Fig. 1a), which borders the þriðjung Nordre Gudbrandsdalen to the north and þriðjung Hedmark and Østerdalen to the south. These three legal districts had a common popular thing (legal assembly) at Åker, which may reflect the pre-state Iron Age political autonomy of the Heiner tribe (Iversen and Brendalsmo, 2020; Iversen, 2021). Archeological excavations testify to permanently settled farming communities in Fron from around 1000 BCE that based their economy on a combination of outfield exploitation, husbandry, and crops (Gundersen, 2016). Husbandry, including extensive grazing in the lower mountain areas, has traditionally constituted an important part of the farming strategies in the valley (Gundersen, 2021). Although considered fertile, the agricultural lands are restricted by topography and considered marginal in agricultural terms (Puschmann, 2005). This area has a lower accumulated growing degree count for the growing season compared to the other two areas and the lowest summer precipitation of the study areas. The local wind direction is dependent on the valley orientation, which is east–west, leading to a prevailing wind from the west (Fig. A5a). The bog located in this area is Ulbergmyr and is further described in Sect. 2.4 (Fig. 1a).
2.3.2 Høgsfjorden area
The Høgsfjorden is the westernmost of our research areas and is located east in the county of Rogaland. The name Rogaland derives from “Rugi”, meaning the “rye-growers”, which is mentioned as one of the Scandinavian tribal groups in contemporary written sources (Brink, 2008a; Malone, 1962; Neidorf, 2013). Judging from the number of burials, the Rugi may have been one of the most populous tribes in present-day Norway in the Iron Age (Iversen, 2019). Rogaland is a highly diversified landscape, characterized by areas with wide-stretching agricultural landscapes along the coast and cultivated narrow valleys and pastured heaths in the surroundings, but it is situated in an otherwise mountainous, rough, and infertile fjord landscape (Puschmann, 2005). As such, the preconditions for agriculture differ considerably within the region.
This area has a similar length of growing season as the Sarpsborg area but higher summer precipitation, which leads to higher growing degree day requirements for crops (Fig. 1b–c, Table 2). The annual mean wind direction is from the west. Because of the fjords, the local wind direction is directed by the shape and orientation of the valley. For the Forsand valley, where the excavation sites and the bog are, this means the wind comes from the southwest or the northeast. No meteorological station is available for this fjord, so data have been taken from a nearby valley with a similar orientation (Fig. A5b). Forsand is characterized by poor agricultural soils surrounded by steep mountains, but the excavations have nonetheless provided evidence for large continuous farming settlements all the way back to ∼ 1500 BCE (Løken, 2020; Westling et al., 2022). However, long-term overexploitation led to soil deterioration, which ultimately made changes in subsistence strategies necessary (Løken, 2020). Oats, which thrive even with poor soils, became more important, as well as husbandry and grazing. According to Westling et al. (2022), the population at Forsand eventually became larger than what could be sustained by local food production alone. Wool from sheep and goats appears to have become an important part of their economy and used in exchange for food imports. Thus, the community also became vulnerable to trade disruptions and poor harvests – both domestic and among their trading partners. The bog in this area is Åsheimmyr (Fig. 1a, Sect. 2.4)
2.3.3 Sarpsborg area
Sarpsborg is the easternmost of our research areas (Fig. 1a) and is located south in the medieval county of Vingulmark, which included the coastal land from Sweden to Vestfold. To the east, Vingulmark bordered Ranrike (Båhuslen) and Värmland; to the north Romerike, Ringerike, and Numedal; and to the west extended to Vestfold (Munch, 1849). In the Iron Age, the area may have been inhabited by a group referred to as the Lidvikinger (Lidwicingum) (Iversen, 2019). The area is highly fertile and one of the most cultivated landscapes in present-day Norway (Puschmann, 2005). Hence, Sarpsborg and surrounding areas have provided archeological evidence for well-developed farming communities as early as the late Neolithic (∼ 2350–1800 BCE) (Bårdseth, 2008; Damlien et al., 2021). Prehistoric farms, including from the Iron Age, have mostly been found on the fertile terminal moraines that offered excellent conditions for cultivation. Although the outfields and marine resources are considered to have been of some importance for the early farmers, the location of the settlements is mostly understood in terms of farming in general and crop production in particular (cf. Bårdseth, 2008). Thus, the importance of crops for nutrition appears to have been greater than in Fron.
This area has quite high accumulated temperature for the growing season and has the second lowest summer precipitation of all three case studies (Fig. 1b–c). The wind direction is mainly from the south or west, but because this area is flat, it is more variable than for the other two case study areas, as the wind direction is not confined by the topography (Fig. A5c). The bog used for the pollen analysis in this area is Haraldstadmyr (Fig. 1a, Sect. 2.4).
The length of the active growing season (based on 1961–1990 data) for the three different case study areas is shown in Fig. 1c. From this map, we can see that the growing season is the longest at the coast, and shortest in the inland valleys of southern Norway.
2.3.4 C14 data
The collected radiocarbon dates come from different contexts, such as buildings, clearance cairns, agricultural layers, and a variety of other activities. The data also include dates from exploitation of outfield resources. However, iron and charcoal production sites are excluded from the C14 data. Data from these sites may skew the data as most of these production sites are from 900 to 1300 CE and almost exclusively from certain inland regions (Loftsgarden 2020). Likewise, we have omitted dates from cooking pits, as they represent a temporally restricted cultural phenomenon in Norwegian archeology (Gundersen et al., 2020). They are mostly associated with the Early Iron Age (500 BCE–550 CE) and frequently used for dating purposes, thus creating an overrepresentation of Early Iron Age dates in the overall record.
To model the C14 dates, we have used the summed probability distributions (SPD) analysis within the rcarbon package (Crema and Bevan, 2020) in the R statistical programming language (R Core Team, 2022). Dates were calibrated using the Intcal20 calibration curve (Reimer et al., 2020). All dates are presented as calibrated dates BCE or CE.
Well-researched areas and well-dated sites can potentially cause the SPDs to be biased and might generate misleading peaks in the SPD. To mitigate this effect we have implemented artificial bins in rcarbon. We have structured the dates into bins at the site level, with a cut-off value at 50 years, prior to the SPD analysis. This method and data are further described by Loftsgarden and Solheim (2022).
2.4 Pollen analysis
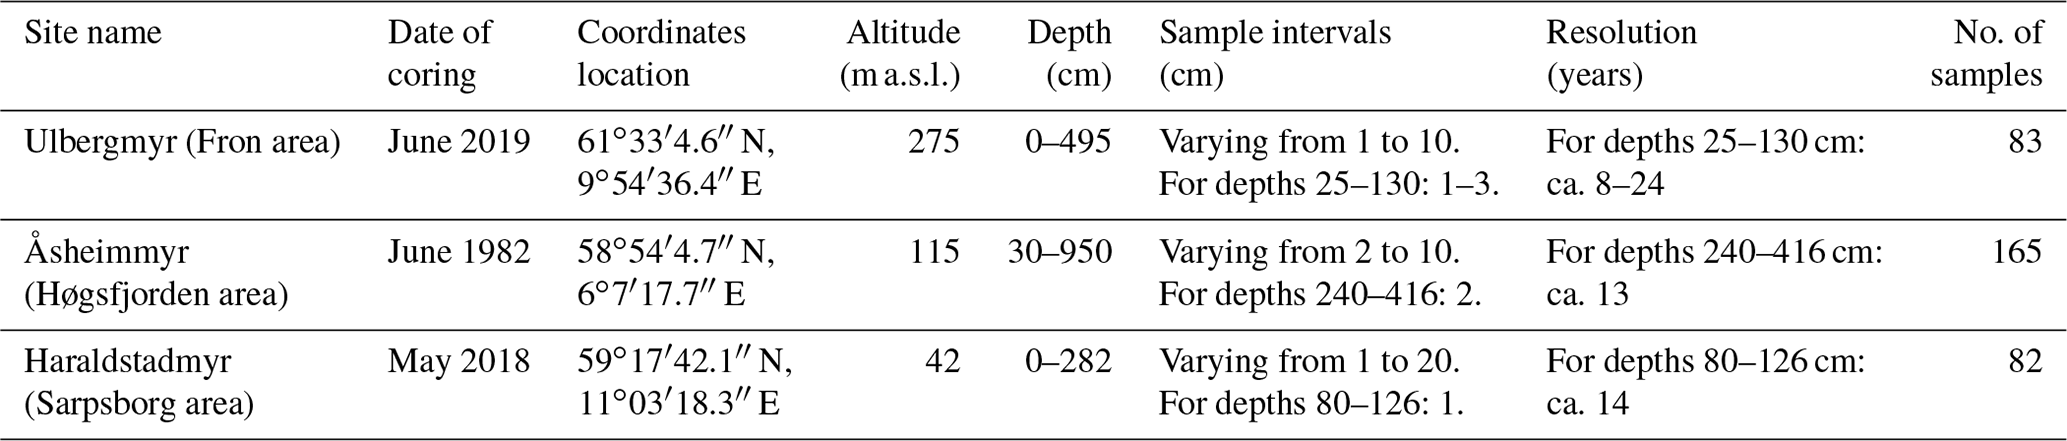
Pollen analyses were carried out on material from three different peat bogs in Haraldstadmyr, Ulbergmyr, and Åsheimmyr (Table 3). The cores were sampled with a Russian corer from the deepest parts of the bogs (Høeg, 1999; de Bode, 2021; Gundersen, 2021).
Table 3Information about the three peat sequences collected for pollen analysis.
Bulk samples for radiocarbon dating were dated by Lund University Radiocarbon Dating Laboratory and Tandem Laboratory at Uppsala University, and calibrated using the IntCal20 calibration curve (Reimer et al., 2020). The age–depth model was generated using R software and the R code package “Bacon” 2.4.3 (Blaauw and Christen, 2011).
Approximately 1 cm3 of peat was collected for each pollen sample, at intervals varying from 1 to 20 cm. For each peat sequence, 1–3 cm intervals (∼ 8–24 years resolution) were used for the depths corresponding to the time period 250–1150 CE in order to obtain a high resolution palynology. Pollen percentages were calculated based on the pollen sum (ΣP), which expresses the total terrestrial pollen taxa. Percentages of the local and aquatic pollen types, as well as most of the spore plants and the number of charcoals, were calculated based on ΣP+X, where X represents the pollen type, spore, or charcoal in question.
Pollen diagrams were plotted using R version 4.0.3 (2020-10-10) with the packages “rioja” version 0.9-26 (Juggins 2020), “ggplot2” version 3.3.3 (Wickham 2016), “tidyverse” version 1.3.0 (Wickham et al., 2019), and “neotoma” version 1.7.4 (Goring et al., 2015). The pollen percentages were plotted against their corresponding mean ages as generated by the age–depth model (Sect. A3).
3.1 The 6th century climate
In this section, the results are given for the simulated 6th century climate response to the volcanic double event of 536 and 540 CE, where the focus is on the mean response for the growing season (AMJJAS) in Scandinavia. To gain insight into the relationship between the volcanic atmospheric impact and the surface climate response, the NH extratropical aerosol optical depth (AOD, Toohey and Sigl, 2017) is shown for the study period. Four large eruptions in 536, 540, 574, and 626 CE are visible as large peaks, indicating a more opaque sky (Fig. 2a). The climate model simulations reveal a widespread cooling for the growing season after the 536 and 540 CE eruptions in the NH extratropics, which results in an ensemble mean cooling of about 2 ∘C (Fig. 2b). This cooling remains significant for 10 years after the 540 CE eruption, with a return to the mean temperature from ∼ 555 CE onwards. Temperatures for Scandinavia show a maximum cooling of ∼ 1.5 ∘C after the 536 and 540 CE eruptions but also a larger internal variability of 1.2 ∘C compared to 0.4 ∘C for the NH extratropical mean. This leads to a less distinct volcanic signal. Only for the first year after the eruptions is the ensemble mean 2 m air temperature outside the range of internal variability, whereas it takes up to 20 years (until 560 CE) for the temperature to return to the mean value (Fig. 2c).
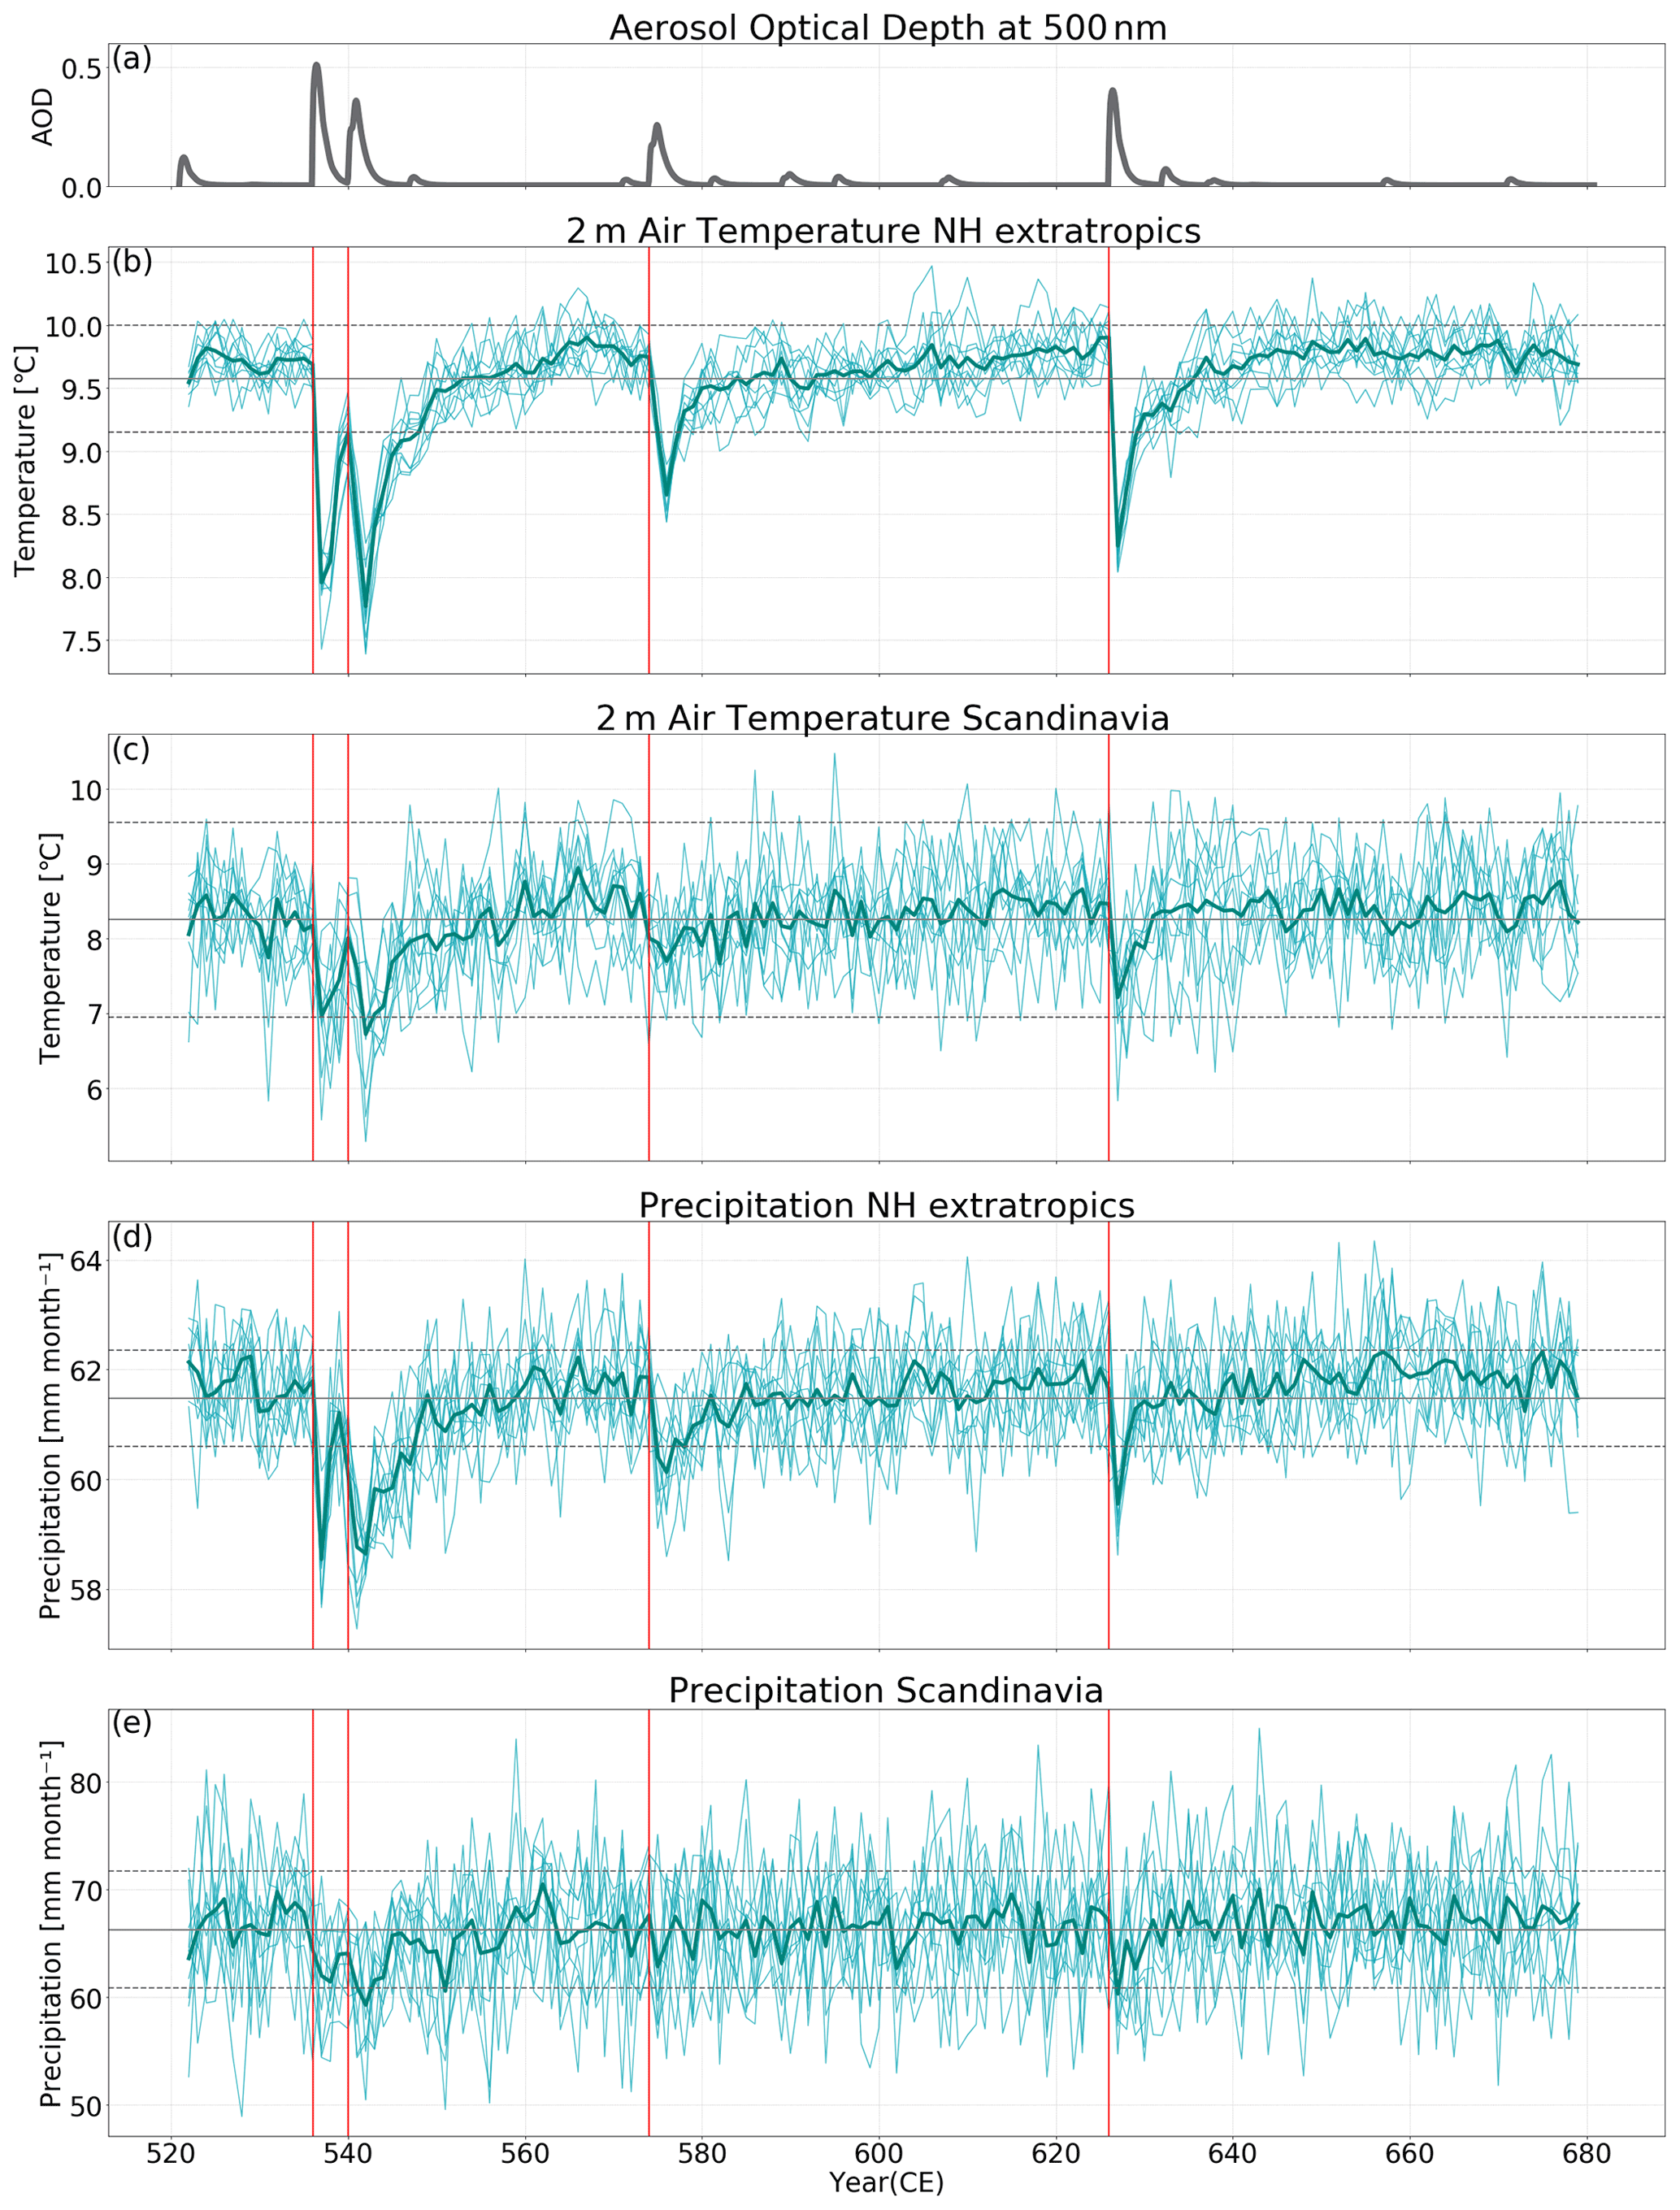
Figure 2Time series of (a) yearly mean NH extratropical (30–90∘ N) AOD (Toohey and Sigl, 2017), growing season (AMJJAS) mean of (b) NH extratropical and (c) Scandinavian (55–73∘ N, 0–20∘ E) 2 m air temperature, and (d) NH extratropical and (e) Scandinavian precipitation. Vertical red lines indicate the four large eruptions in the study period. Grey lines indicate the 1–1850 CE mean, and the dashed lines are the 1σ (2σ) of the control run for precipitation (temperature).
For the NH extratropics, precipitation decreases after the volcanic double event by 3 mm per month (Fig. 2d), which is a significant reduction (on the 1σ level). For Scandinavia, this is up to 7 mm per month. However, just as with temperature, the volcanic signal on precipitation is only significant right after the eruptions due to high internal variability over Scandinavia (Fig. 2e). After the 540 CE eruption, it takes approximately 10 years for the precipitation anomaly to return to 0.
During the maximum volcanically induced cooling over Scandinavia, the ensemble mean growing season temperature decreases to the absolute value of 6.9 ∘C. However, this is the ensemble mean for the whole of Scandinavia. To gain insight into the regional response, we analyze the spatial temperature and precipitation distribution after the volcanic double event for both the long-term and the short-term response.
The simulated temperature anomaly shows a significant cold period for 25 years after the 536 CE eruption for most of Norway (Fig. 3a). A significant cooling of up to 2 ∘C occurs in the first 2 years after the 536 CE eruption (Fig. 3b) and up to 1.5 ∘C after the 540 CE eruption (Fig. 3c). Overall, the 5 ∘C line (referring to the 5 ∘C mean for AMJJAS here) shifts south by ∼ 6∘ in latitude in the first 2 years after the 536 and 540 CE eruptions. The simulated average growing season temperature thus drops below 5 ∘C for the northernmost study area site (Fron).
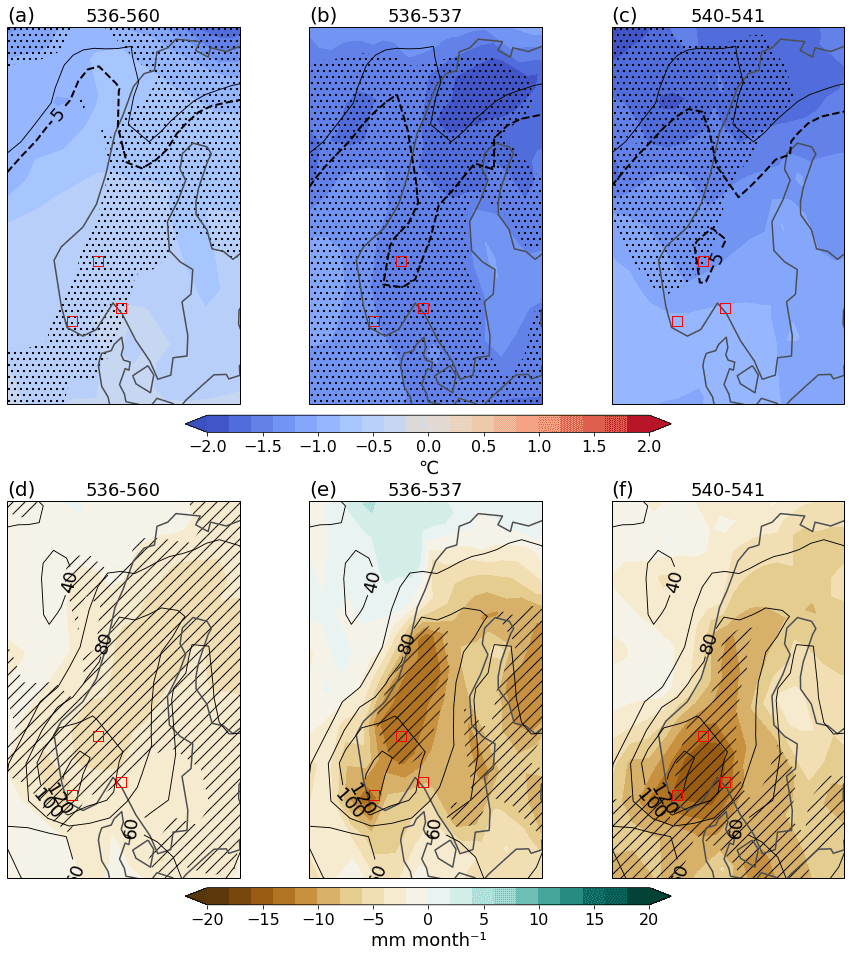
Figure 3Maps of 2 m air temperature (a–c) and precipitation (d–f) anomalies for the mean growing season (AMJJAS) in Scandinavia for 536–560, 536 and 537, and 540 and 541 CE. Anomalies are calculated with respect to 1–1850 CE climatology, which is given in contours. The red squares indicate the locations of the local sites used for the GDD modeling. For temperature, the absolute 5 ∘C line is given by the dashed and solid black contour lines representing the model experiments and climatology, respectively. The 1σ (2σ) significant areas are hashed (stippled) for precipitation (2 m air temperature).
Besides temperature, summer precipitation also impacts the harvest. The ensemble mean indicates a drying during the growing season almost everywhere in Scandinavia. A significant drying of up to 5 mm per month occurs over the entirety of Scandinavia for the 25-year mean after 536 and 540 CE (1σ, Fig. 3d). For the 2-year mean, a significant reduction of up to 15 mm per month (15 %) occurs after the 536 CE eruption (Fig. 3e), and up to 20 mm per month (20 %) after the 540 CE eruption in southeastern Norway (Fig. 3f).
The climate over Scandinavia is influenced by large-scale atmospheric circulation patterns, with the positive NAO circulation pattern occurring most often during NH winter. This has been shown from observations (1949–1992, Michelangeli et al., 1995), reanalysis data (1974–2007, Cassou, 2008), and our past2k climate model simulations (1–1850 CE, Sect. A1 in this study; van Dijk et al., 2022). The NAO+ is also the dominant mode during the growing season (AMJJAS; Fig. A4b). After the 536 and 540 CE eruptions, the overall large-scale atmospheric circulation pattern shifts to a higher pressure over the high latitudes and decreased pressure over the mid-latitudes over the North Atlantic region (Fig. 4). This corresponds to a shift towards a more negative NAO; 25 years after the 536 CE eruption, the SLP significantly increased over Scandinavia (Fig. 4a). In contrast, the SLP change 2 years after the eruptions is not significant over Scandinavia (Fig. 4b–c), which could be due to contrasting signals in the first and second year after the eruptions.

Figure 4Maps of the North Atlantic ensemble mean sea level pressure anomalies and absolute wind for the mean growing season (AMJJAS) for (a) 536–560 CE, (b) 536–537 CE, and (c) 540–541 CE. Anomalies are calculated with respect to 1–1850 CE climatology, which is given in contours (5 hPa interval). The 2σ significant areas are stippled. Wind barbs are shown for 1, 5, and 10 m s−1 intervals.
Each individual ensemble run is a possible realization of the modeled volcanic impact. Therefore, we want to investigate the range exhibited by the individual runs, including the maximum cooling, and hydrological effect after the eruptions. Interestingly, the temperature anomaly for the 25-year mean growing season reveals a significant cooling from 0.8 to ∼ 1.5 ∘C for half of the runs, whereas the other half shows a non-significant cooling or even a slight warming over Scandinavia (Fig. 5a). Even more striking is that the 25-year mean precipitation anomalies reveal three ensemble members (ensemble members nos. 3, 5, and 11) that show significant wetting over parts of Scandinavia, whereas the other members (9 out of 12) show drying over the entirety of Scandinavia (Fig. 5b).
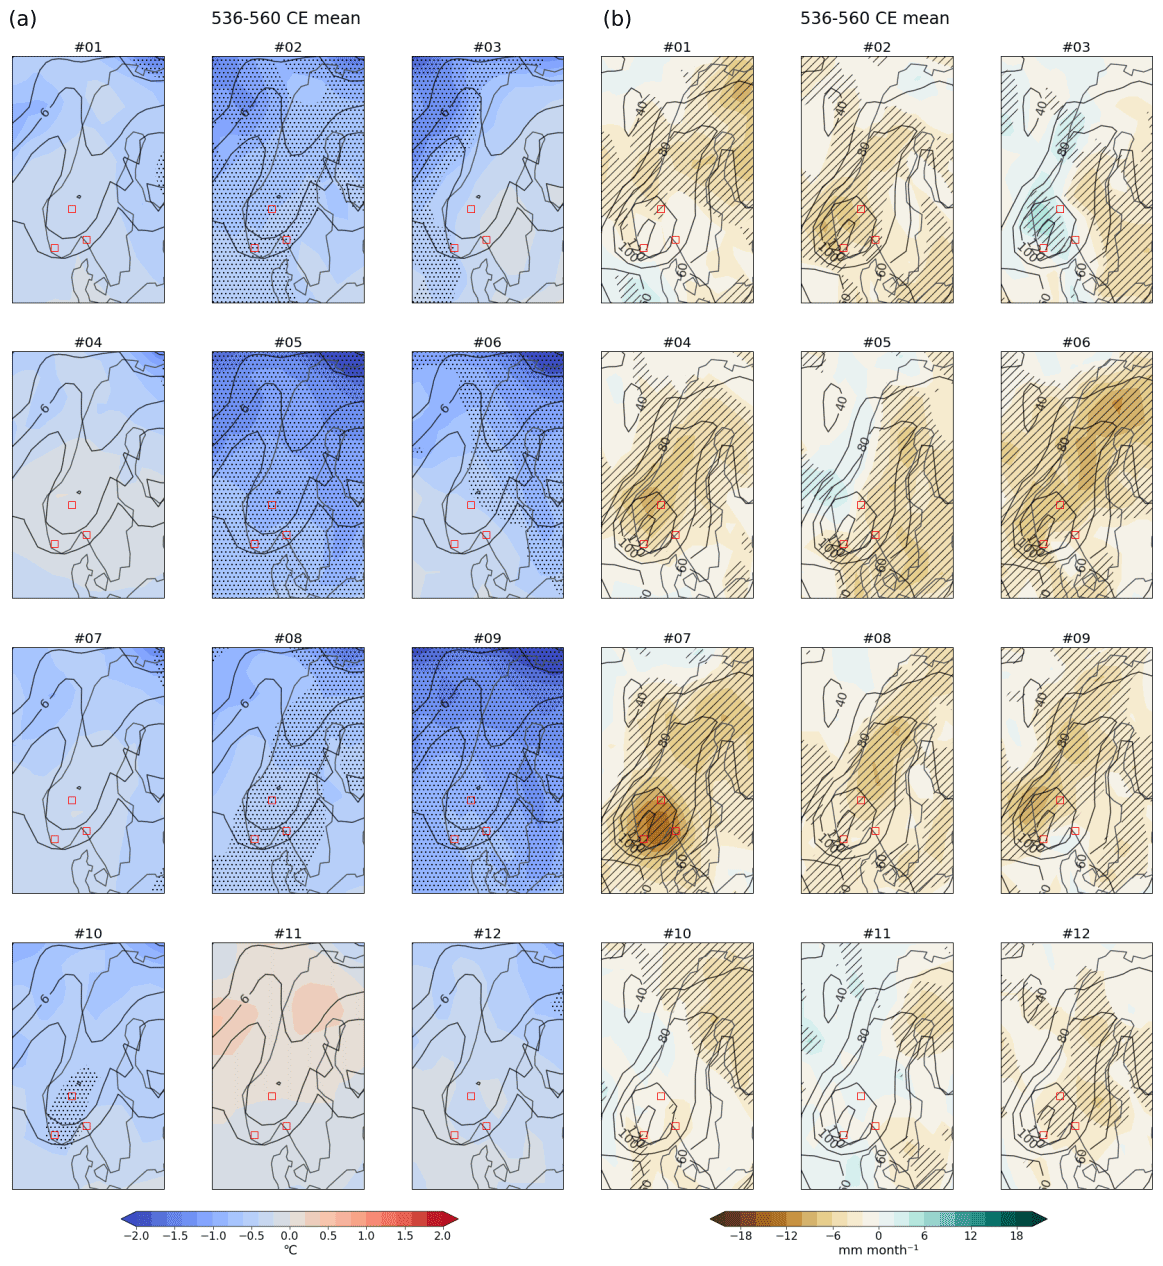
Figure 5(a) Temperature and (b) precipitation anomaly maps for the mean growing season (536–560 CE) for the individual ensemble members. Anomalies are calculated with respect to 1–1850 CE climatology, which is given in contours. The red squares indicate the locations of the local sites used for the GDD modeling. The 1σ (2σ) significant areas are hashed (stippled) for precipitation (2 m air temperature).
Inspecting the first and second growing seasons after the 536 and 540 CE eruptions (Figs. A1 and A2) reveals a maximum cooling of close to 3.6 ∘C for local areas in Norway. There is an even larger spread in the individual simulations for the precipitation anomalies over Scandinavia compared to the 25-year mean anomalies.
The SLP anomaly maps for the 536–560 CE mean (Fig. 6) reveal eight ensemble members with a significant shift towards higher pressure over the North Atlantic (nos. 5, 7–9, and 12) and Scandinavia (nos. 1–2 and 6), reflecting a weakening of the SLP gradient (the low-pressure system over Iceland gets weaker). The remaining four ensemble members hardly show any significant patterns in atmospheric circulation response.
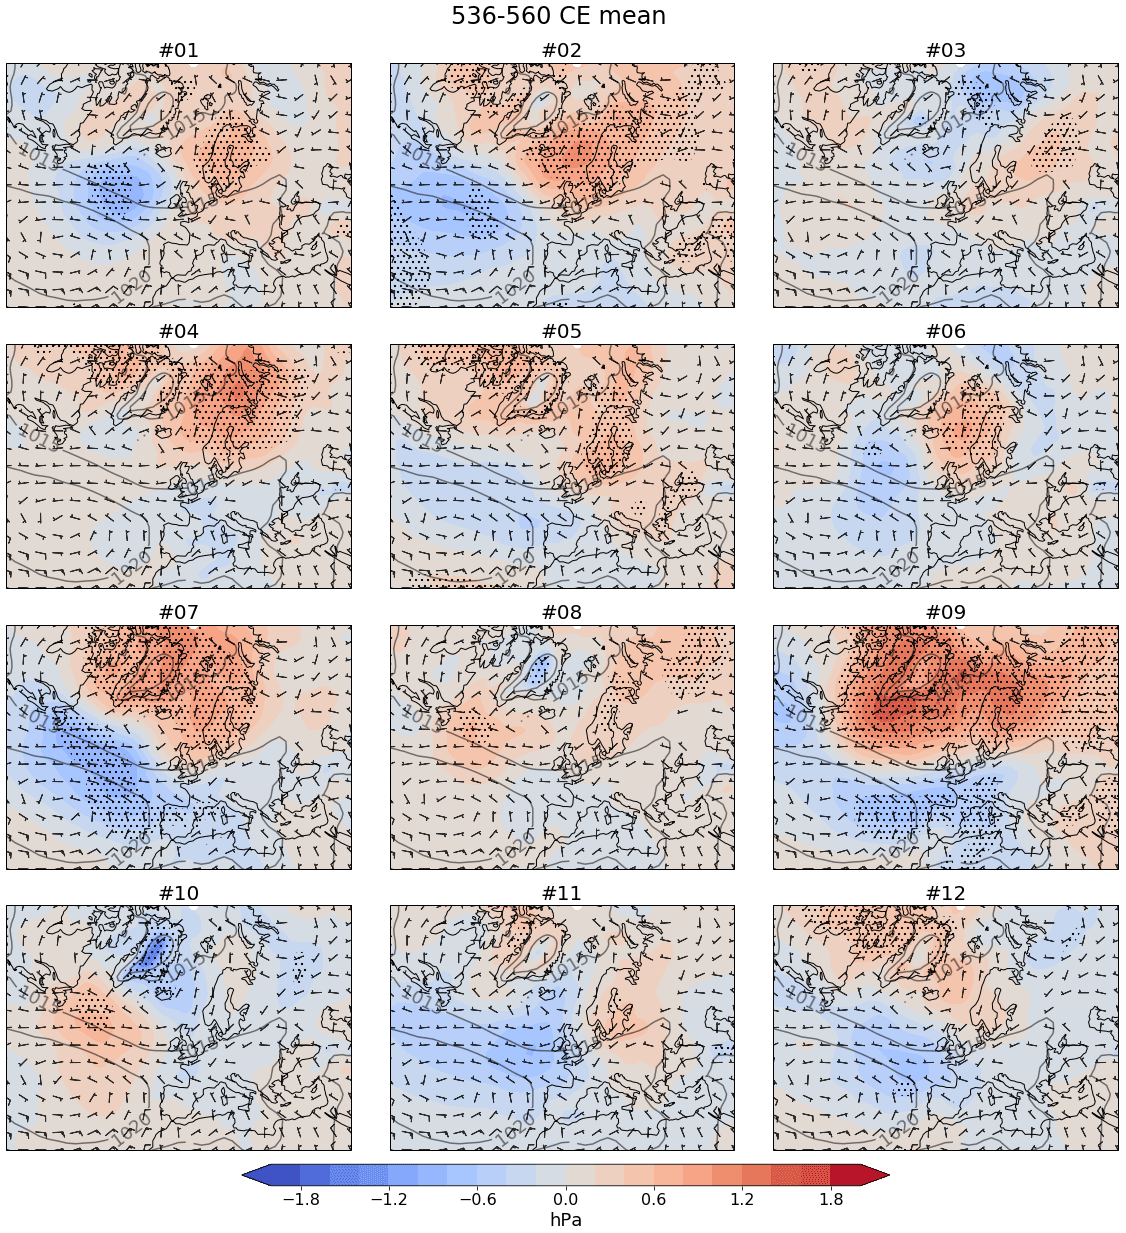
Figure 6SLP anomaly and absolute 10 m wind maps for the mean growing season for 536–560 CE for the individual ensemble members. Anomalies are calculated with respect to 1–1850 CE climatology, which is given in contours. The 2σ significant areas are stippled. Wind barbs are shown for 1, 5, and 10 m s−1 intervals.
3.2 GDD model results
The average ensemble mean peak cooling in the 2 years after the 536 and 540 CE eruptions is 1.6 ∘C with respect to the 1–1850 CE mean of the past2k run. Recalculating for a reference period of 1961–1990 mean of the historical run (Table 1) leads to an overall 2.1 ∘C cooling over Scandinavia. However, individual members reveal a significant maximum cooling after the 536/540 CE up to 3.5 ∘C over Scandinavia, and a maximum cooling of ∼ 3 ∘C for southern Norway (Table 1, Fig. A1). To assess the potential impacts on agriculture for the worst case volcanic climate scenario, we apply a 3 ∘C cooling in the case study areas for the GDD model set up for 1961–1990 climatological conditions (Fig. 7).
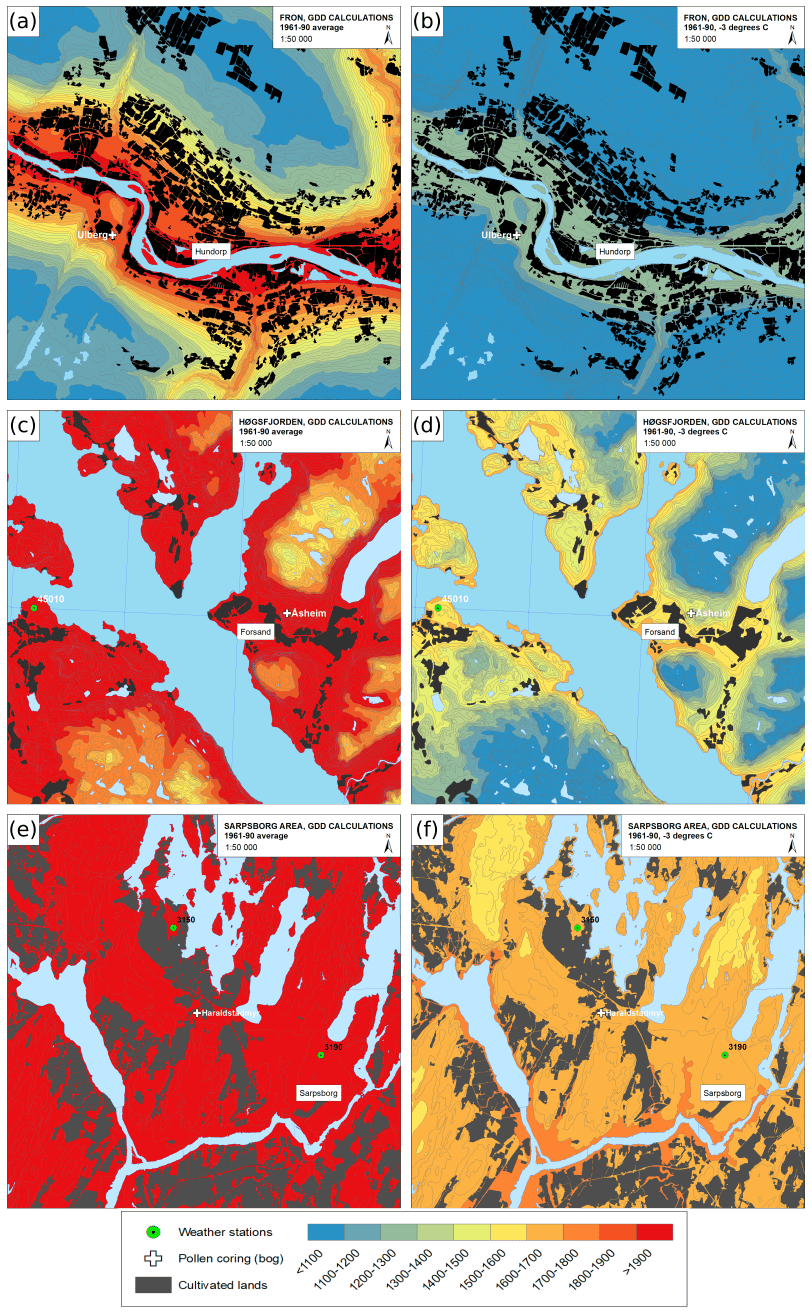
Figure 7Growing degree day maps for 1961–1990 for (a) Fron, (c) Høgsfjorden, and (e) Sarpsborg and with a 3 ∘C cooling compared to the 1961–1990 mean for (b) Fron, (d) Høgsfjorden, and (f) Sarpsborg.
Fron, the northernmost of our case study sites in southern Norway, is situated in a narrow valley. From the map in Fig. 7a and b, it becomes clear that with a 3 ∘C cooling, the accumulated temperature ends up in the 1100–1300 GDD bin for most of the main cultivated area, but with the remaining areas below 1100 GDD. This means that the minimum requirements for crops to grow (Table 2) are only met for rye and barley in the most favorable areas. However, with small margins to allow for climate variations, harvests are likely to fail or be very small even for these species. This area is thus vulnerable to volcanic cooling.
With a 3 ∘C cooling, the accumulated temperature for Høgsfjorden, located at the southwestern coast of Norway, is around 1400–1700 GDD for the cultivated areas (Fig. 7c, d). This indicates that the minimum requirements are met for rye, barley, and oats, but lower yields can nonetheless be expected for barley and oats. In certain areas, oats may not mature and harvests even fail.
Sarpsborg, located on the eastern side of the Oslo fjord in the southeast of Norway, is a bit warmer than the other two areas, with 1600–1700 accumulated degrees in the growing season after a 3 ∘C cooling (Fig. 7e, f). Because of low summer precipitation, this means that none of the cereal types appear directly threatened by a cooling event.
3.3 Pollen results
The pollen diagrams (Fig. 8) show the transitions in the vegetation of the three selected areas through time, from ca. 250 to 1150 CE. The time period from 500 to 600 CE is marked in each diagram. The total number of pollen (ΣP) is depicted on the uppermost axis. The sum fraction of anthropochores is based on the sum of terrestrial pollen of cultivated taxa that are direct indicators of cultivation (Behre, 1981). These include the four cereals Secale (rye), Avena (oats), Triticum (wheat), and Hordeum (barley). The sum fraction of apophytes, plotted on the same axis, is based on the sum of terrestrial pollen of ruderal taxa, which serve as indirect indicators for farming practices, specifically grazing activities (Behre 1981). These include Rumex (docks and sorrels), Rumex longifolius (northern dock), Artemisia (mugwort), Chenopodiaceae (goosefoot), Urtica (common nettle), Plantago major (common plantain), and Plantago lanceolata (ribwort plantain). The fungi of Sordaria are plotted on a separate axis. Fungi of Sordaria can also indicate the presence of animals and thus serve as an indicator for grazing activities (van Geel, 2003; Cugny et al., 2010; Etienne et al., 2013; Bajard et al., 2022). In Figs. A9–A11 extended pollen diagrams are given, outlining the individual taxa of the selected apophytes and trees.

Figure 8Pollen diagrams for (a) Ulberg (Fron area), (b) Åsheim (Høgsfjorden area), and (c) Haraldstadmyr (Sarpsborg area).
The pollen diagram from the Ulberg bog in the Fron area (Fig. 8a) indicates a decrease in both pollen from the anthropochores taxa and pollen from the apophytes taxa during 500–550 CE. Studying the individual species reveals that pollen from Hordeum (barley) and Triticum (wheat) are less abundant around 500–550 CE, coinciding with a decline in charcoal percentages and an increase in tree pollen. Pollen of Avena (oats), in juxtaposition, increase during 500–550 CE. Fungi of Sordaria remains absent during this time interval. This early 6th century decline is followed by a slight increase again towards the end of the century and near halt to agricultural activities in the 7th century.
In the pollen diagram for Åsheim in the Høgsfjorden area (Fig. 8b), a sharp decline in both the anthropochores and apophytes fractions are noticeable slightly before 550 CE, reaching values as low as 0 % around 550 CE. This decline is marked by the coinciding disappearance of pollen from Avena (oats), Secale (rye), and Triticum (wheat), as well as an absence of fungi from Sordaria. Simultaneously, the total number of pollen decreases. After 550 CE, a drop in charcoal and a gradual increase in pollen of trees can be seen. Percentages of Hordeum (barley) vary throughout the 6th century, indicating irregular cultivation of barley during the entire period.
The pollen diagram for the Haraldstadmyr bog in the Sarpsborg area (Fig. 8c) depicts a slight decline in the sum fractions of anthropochores and apophytes coinciding with an increase in pollen from trees, starting just before 500 CE, followed by a slight and steady increase in the 6th century. From 500 to 600 CE, the percentages of anthropochores and apophytes remain more or less the same. The pollen for the individual cereals are sparse between 500 and 600 CE, including a total absence of Triticum (wheat) which, however, is not exclusive for this period. Small amounts of Secale (rye), Hordeum (barley), and Avena (oats) remain present. A decrease in charcoal percentages occurs slightly before 550 CE. Overall, fewer changes in pollen occur between 500 and 600 CE when compared to the Fron and Høgsfjorden areas.
4.1 Volcanic climate model impact
The mean temperature response for both the short-term and the long-term after the 536 and 540 CE volcanic double event over Scandinavia is a significant cooling (Fig. 3a). In addition, we simulate a mean growing season 2 m air temperature below 5 ∘C over parts of Scandinavia, which also includes Fron. This could have implications for agriculture, as it is likely that the accumulated temperature sum fails to reach the GDD requirements for all cereal species. For precipitation, the ensemble mean indicates a drying over the entirety of Scandinavia for the 536–560 CE period as well as for the 2 years after the eruptions (Fig. 3b), which could also have impacted crop production. This drying is not surprising, as in general volcanic-induced cooling leads to reduced precipitation or evaporation, as colder air can hold less humidity. This is also in line with the findings of Büntgen et al. (2011), who studied the climate variability of the past 2500 years in Europe. They found a reduction in summer temperature due to volcanic eruptions coincided with a drying in the 6th century.
Iles and Hegerl (2014) analyzed different types of data sets for the most recent eruptions in the period ∼ 1900–2000 CE and found a drying over Scandinavia in the CMIP5 models. In contrast, reanalysis data from their study as well as data based on satellite and rain gauge observations revealed a drying over southern Scandinavia and wetter conditions over northern Scandinavia. Thus, contrasting results have been found on the precipitation response to volcanic eruptions over Scandinavia in previous studies. This is in line with the findings of Tejedor et al. (2021), who studied the global hydroclimate response to large tropical volcanic eruptions using a paleo-assimilation product (PHYDA), which uses proxy data in a climate model, as well as an ESM on its own. PHYDA reconstructs a weak signal in the 20 years after all the large (larger than Pinatubo) tropical eruptions in the last millennium. Here it seems the west of Scandinavia is getting slightly dryer, while the rest is getting slightly wetter. The Old World Drought Atlas (Cook et al., 2015) shows a more pronounced pattern than PHYDA, with a drying over the southern half of Scandinavia and a wetting in the north, just as the reanalysis and observational data from Iles and Hegerl (2014) suggested. The signal of the drying in southern Scandinavia and the wetting in northern Scandinavia, however, is still not very strong (±1.5 on the PDSI scale). This could be a result of the averaging over 13 eruptions (all of potentially different magnitudes, chemical compositions, and timings during the year), as well as taking the 20-year post-eruption mean. The data from Tejedor et al. (2021) mentioned before represent the soil moisture availability over summer (JJA) and are therefore hard to directly compare to the simulated precipitation response from our climate model simulations. However, together with the precipitation response signal from the studies of Cook et al. (2015) and Iles and Hegerl (2014), they illustrate that the hydroclimate, including precipitation, is hard to simulate or reconstruct, especially when going further back in time (before the last millennium). Comparing the SLP anomalies, precipitation anomalies, and wind directions reveals that the post-volcanic precipitation patterns are connected to the atmospheric circulation (Figs. 6, A3).
The atmospheric circulation response after volcanic eruptions for the growing season in Scandinavia has not been studied in detail before. It encompasses the spring to late summer months, and the model simulations show a positive like NAO pattern similar to the NH winter response in the 1–1850 CE climatology (Fig. A4). After Pinatubo, a positive NAO was observed, which generally leads to warmer and wetter winters in Scandinavia (Robock, 2000). Climate model simulations from the CMIP3 and CMIP4 models, however, do not seem to capture this signal (Stenchikov et al., 2002; Driscoll et al., 2012). Ludlow et al. (2013) found severely cold winters over Ireland after tropical eruptions, implying a NAO pattern following these eruptions. The winter warming pattern continues to be debated and may be confined to the first winter after tropical eruptions (Zambri et al., 2017). The summertime atmospheric circulation over the European sector has also been studied, revealing a correlation between SLP patterns and changes in North Atlantic storm tracks (Hurrell et al., 2003; Folland et al., 2009). The summertime NAO is defined by Hurrell et al. (2003) as a similar mode to the NAO, but with a more confined center in the Arctic and a more northern high-pressure center over northwestern Europe for July–August. Zambri et al. (2019) studied the atmospheric circulation patterns for the individual ensemble members of their CESM 40-member ensemble after the Laki eruption of 1783–1784, which started in June. They found the temperature response over the North Atlantic sector to be dependent on the atmospheric circulation response. With a Scandinavian blocking the temperature response is a warming over northwestern Europe, and without a blocking they find a cooling over all of Europe and Greenland. This is in line with our findings, where the different circulation responses in the individual ensemble members give different temperature and precipitation anomaly patterns.
The SLP anomaly in Fig. 4 shows that the atmospheric circulation response over Scandinavia is significant for the ensemble mean growing season for the 25-year mean (536–560 CE), but not for the 2-year mean after the 536 CE and 540 CE eruptions. The different patterns in the precipitation and SLP anomalies are canceled out in the ensemble mean for both the long-term and the short-term response, resulting in a weak mean volcanic signal. Even though the 536–560 CE mean gives a significant increase in SLP over Scandinavia (Fig. 4a), the individual runs highlight differences in the regional responses as possible model realizations.
In the 2-year mean and the 25-year mean growing season (AMJJAS) after the eruptions, the general pattern shows a shift towards higher pressure over Scandinavia, corresponding to a shift towards a NAO− pattern. Simultaneously, a significant drying occurs over Norway and Sweden, accompanied by a reduction in the southwesterly 10 m winds (not shown). However, not all of the ensemble members simulate this pattern. For example, ensemble member no. 2 simulates a strong cooling in 537 CE, as well as an increased pressure over Greenland and a decreased pressure over the North Atlantic west of Portugal, corresponding to a shift towards a NAO+. This leads to a precipitation pattern with wetter conditions over western Norway and central eastern Sweden. In 541 CE, member no. 2 simulates a significant decrease in pressure over central Europe, corresponding to a shift towards a North Atlantic ridge pattern. This corresponds to dry conditions in western Norway and wet conditions in eastern Sweden. This combination of decreased pressure over Europe and a dipole in precipitation over Scandinavia is visible in other members as well (nos. 1 and 12).
Rising water levels in eastern Swedish lakes and bogs have been reported for our period of interest. In approximately the mid-1st millennium CE, villages in eastern central Sweden were abandoned and resettled at higher locations, possibly due to the higher groundwater table (Gräslund and Price, 2012). Another indicator of rising water levels is the fungus Claviceps purpurea, commonly known as ergot, which thrives in cool areas with poor drainage and damp conditions (Alm and Elvevåg, 2013). In southwestern Norway ergot has been discovered at the Forsand excavation site (Løken, 2020), thus suggesting wet conditions during our study period. A simulation such as ensemble member no. 2, with wetter conditions for both southwestern Norway and central eastern Sweden, might therefore be considered as one of the more realistic volcanic climate scenarios.
4.2 GDD model
The GDD requirement numbers in Table 2 are based on experimental studies with traditional cereals in the early 20th century conducted by Foss (1926, 1927). A multitude of local variants existed up to the introduction of standardized farming techniques in the 20th century, and the exact requirements for prehistoric crops are not known. This causes some uncertainty regarding the impact of climate change on Iron Age (500 BCE–1000 CE) farming. The GDD models should therefore be understood as a likely scenario of how volcanic cooling events could have affected Iron Age farming and as a method for demonstrating differences and similarities for crop cultivation potential in the three areas.
According to Foss (1926), failing to meet the required temperature sum is by no means directly synonymous with crop failure but would result in smaller yields and a higher frequency of unripened grains unsuitable for sowing. Traditional farmers are likely to have secured themselves by long-term storage but would only be able to sustain themselves in this way for a limited amount of time. Surplus exchange between neighboring households and communities may therefore have been an important measure against unforeseen events, thus stimulating the development of specialized craft and stratified societies (Halstead, 1989; O'Shea and Halstead, 1989). However, multiple years with low temperatures and poor harvests, potentially impacting societies on large spatial scales, would nonetheless gradually cause a lack of available sowing grains, thus making it difficult to maintain production. A prolonged volcanic cooling could therefore make changes in subsistence strategies necessary, including a shift towards the selection of more robust species, adaptation in husbandry, and reliance on wildlife (e.g., hunting, foraging). The extent to which this actually occurred in our study areas must be substantiated by paleo-botanical and archeological records.
Another issue that should be considered for the GDD modeling is the effect the volcanic aerosols have on vegetation by impacting the available sunlight. There are several historical accounts in which a prolonged dimming of the sun was described for 536 CE, concentrated in the Mediterranean (Stothers, 1984; Rampino et al., 1988; Kostick and Ludlow, 2015). Less sunlight reaching the surface impacts the cultivation of cereals in a negative way by reducing the primary production over several years after the eruptions (Helama et al., 2018). On the other hand, the light following a volcanic eruption is more diffuse because of the scattering effect of the volcanic aerosols, which is known to have a positive impact on plant growth (Fan et al., 2021). However, the GDD model is a simplified model, and these factors are not included. Here we have focused on temperature, precipitation, altitude, latitude, and growing season length. Still, for this study the GDD model is the appropriate tool to use. If daily output data from the climate model had been available, our modeled present-day temperature and GDD estimates would be influenced by the climate model biases and the limited spatial resolution. Therefore, carrying out a scenario with a prescribed volcanic cooling and using this with the GDD model as we have done here was considered more appropriate.
The pollen record shows a general decrease and low abundance of anthropochores and apophytes, i.e., indicators for human activity, between 500 and 600 CE, contemporary with an increase in tree pollen. These findings suggest a decrease in human activity during the 6th century. This decrease is, however, expressed distinctively and to various extents between the different study areas.
In the Fron area, the anthropochores and apophytes show a distinct decline during the 6th century. The individual cereal taxa, however, display inconsistent signals during this period. Pollen from wheat and barley show a decline, whereas pollen from oats show an increase between 500 and 550 CE. The increase in trees in the Fron area during the 6th century cooling, in combination with the decline in anthropochores and apophytes, is, however, a strong indicator for crisis and abandonment.
The cereals rye, oats, and wheat, as direct indicators of cultivation, show a decline for the Høgsfjorden area in the 6th century, indicating crisis and abandonment. This interpretation is strengthened by the coinciding increase in forest. Barley, however, varies to a great extent during the 6th century, implicating a highly irregular cultivation of the cereal throughout this period.
The pollen record from the Sarpsborg area overall displays few transitions, regardless of pollen type, suggesting relatively stable conditions throughout the entire 6th century. The anthropochores and apophytes are relatively scarce in this period, a situation that continues into the 8th century.
In addition to the volcanic double event, there was an outbreak of the Justinian Plague in 541 CE. This has been proposed to have led to a decline of up to half the population in the Mediterranean area (Wagner et al., 2014) and has been found to have impacted societies as far afield as the modern areas that now make up Germany (Harbeck et al., 2013) or the UK (Keller et al., 2019). If this was the case in Norway, this would have shown up in the pollen. However, even though the plague has been assumed to have reached Scandinavia, no DNA has been found on skeletal remains so far (Gundersen, 2019). In addition, a recent study contests the idea of a dramatic population decline during the 6th to 8th century and downplays the possible importance of the plague for the social developments of the time (Mordechai et al., 2019). We therefore argue that the decline in pollen during this time was not likely a direct effect of the Justinian Plague, but may have been related to volcanically induced cooling. More work is merited on this question.
The above pollen analyses have to be interpreted with caution with regard to the calibrated ages used in this study. We have dated between five and nine C14 samples per peat sequence. The C14 ages have a standard deviation (1σ) varying from 28 to 40 years. In addition, the mean ages in the pollen diagrams are dependent on interpolations made in the age–depth model. The age model could be improved by detecting absolute time markers such as tephra in the bog sediments, which could be part of future work. However, the relative chronology of the transitions in the pollen record with regard to the depth axes remains unaffected by these factors. Other limitations that need to be taken into account include the production, depositional, dispersal and preservation processes of the pollen, which can cause an overrepresentation or underrepresentation of pollen types (Lowe and Walker, 2015).
Various pollen record studies analyzing sediment cores in Scandinavia are available covering this period (Høeg, 1996, 1997; Wieckowska-Lüth et al., 2017). However, they often span the entire Holocene and are sampled at ∼ 10 cm intervals, giving a temporal resolution of ∼ 120 years. The resolution in the pollen analyses in this study is higher, with sampling intervals of 1–3 cm in the period ∼ 250–1150 CE, giving a temporal resolution of ∼ 8–24 years. As a result, the more detailed pollen diagrams allow for a more in-depth analysis of shorter time intervals, such as the mid-6th century time period.
5.1 Case study areas
The results for the three case study areas suggest different levels of agricultural vulnerability to a volcanic cooling event, with Fron being particularly vulnerable and Sarpsborg being seemingly resilient towards colder climate conditions. Høgsfjorden is at risk of experiencing reduced harvests and even crop failure for heat-demanding species. Here, we attempt to connect the GDD modeling, pollen analysis, and archeological records to describe possible volcanic climate hazard scenarios for the different areas.
5.1.1 Fron area
Fron is considered a dry area, and is located further north (north of 60∘ N) than the other two study areas, resulting in a reduction of the GDD requirements. However, Fron is also associated with a significantly shorter growing season and a higher altitude. In addition, the landscape is hilly and rugged, which restricts the amount and extension of possible farmlands (Puschmann, 2005).
Three Iron Age farmsteads have been excavated in Fron in 2011–2012 (Loktu and Gundersen, 2016; Villumsen, 2016). Their farming strategy was built on a combination of barley cultivation and animal husbandry. All of the farmsteads were occupied during the 5th century and subsequently abandoned during the 6th century. It has been suggested that the abandonment of the three farmsteads reflects a general decline in settlement and agriculture in Fron, as similar patterns have been documented on other agricultural sites in the area as well (Gundersen, 2016).
The pollen record from Fron shows a decrease in anthropochores and apophytes and an increase in trees in the mid-6th century, possibly confirming a short period of abandonment. Some crops, however, such as wheat and barley, sporadically continue to appear in the second half of the 6th century, followed by indications of a temporary halt in farming activity in the 7th century.
In addition, the farms were situated in areas exposed to floods and landslides, something that seems to have occurred more frequently around the middle of the first millennium CE (Nesje et al., 2016). Around the late 6th or early 7th century, a major flood event buried one of the farmsteads under colluvial sediments, but the archeological evidence shows that the site was abandoned prior to the flood (Villumsen, 2016). The exact time and character of the site abandonments are somewhat unclear but seem to have been planned and in response to environmental changes (Gundersen, 2021). The pollen record from nearby Ulberg (Sect. 4.3) also testifies to a decline and possible halt in crop cultivation around this time. The combined climate model and GDD simulations clearly suggest that the volcanic cooling event could have critically affected local agriculture in Fron, which may have been further disrupted by an increase in flooding rates. However, the lack of widespread settlement excavations in this area makes the scope and consequences of settlement abandonment unclear.
5.1.2 Høgsfjorden area
Høgsfjorden has similar temperature conditions to the Oslofjord area in 1961–1990 (Fig. 7) but also considerably higher precipitation levels (Table 2, Fig. 1b). The large amount of rainfall during the growing season makes it necessary for higher temperatures for the cereals to mature, meaning that the GDD requirements for cereal cultivation are higher than in the Sarpsborg area. The low temperature margins for cultivation makes the Høgsfjorden area susceptible to climate anomalies, which are a more regular feature in the western part of Norway than in the east.
Large-scale excavations have been conducted in the Høgsfjorden area, including a village complex that was continuously occupied from the Bronze Age and up to the 6th century. The site is one of very few settlements of this kind documented in Norway and consisted of approximately 20 farms in the 5th century (Løken, 2020). However, the 5th-century village is also characterized by increasing farming difficulties. Soil exhaustion due to intensive cattle grazing made crop cultivation difficult, leading the farmers to turn to oat cultivation instead of barley and wheat. Oat is a thrifty species and able to grow in poor and less nutritious soils but is also associated with poor baking qualities and low social status (Bjørnstad, 2012). In addition, it requires a high number of GDD to mature (Table 2). Thus, what may have been a successful adaptation strategy in the 5th century may have increased their vulnerability to the upcoming 6th-century cold period. The GDD model for this area suggests that a volcanic cooling event may have negatively affected oat harvests and potentially caused outright failure. The pollen data confirm this finding, showing a sharp decline in both anthropochores and apophytes in the 6th-century cold period, marked by the disappearance of oats, wheat, rye, and fungi from Sordaria.
The archeological data also include finds of unmatured oat grains and examples of the fungus Claviceps purpurea, commonly known as ergot (Løken, 2020). Ergot thrives in a cold and wet climates and infects all sorts of grasses, including grains. It is also highly infectious and the cause for numerous incidents of epidemic ergotism in historical times (Bondeson and Bondesson, 2014). Thus, the archeological evidence points in the direction of severe social impact from the cooling event, which may have contributed to the final abandonment of the village around 600 CE. However, it should be stressed that continuous settlement occupation has been documented at nearby Forsandneset (Dahl et al., 2017) and that the abandonment of the village complex is not necessarily representative of the whole Høgsfjorden area. A recent study of plant macrofossils and pollen data from Rogaland county suggests that rye may have become important during the 6th and 7th centuries due to colder climates (Westling and Jensen, 2020). Particularly important in this respect is the site of Hove-Sørbø, which was contemporaneous with Forsand but able to maintain settlement and farming during and after the 6th century. Westling et al. (2022) argue that differences in soil qualities and subsistence strategies were decisive for the profoundly different outcomes at the two sites, thus demonstrating the importance of incorporating both human and environmental factors when assessing social vulnerability to changing climates.
5.1.3 Sarpsborg area
The Sarpsborg area is characterized by relatively high temperatures, a long growing season, and low precipitation (Fig. 1b–c and Table 2). These factors, combined with the presence of extensive and fertile agricultural lands (Puschmann, 2005), provide excellent conditions for local agriculture, as well as high resilience against cold summers. The stable conditions for cultivation are reflected in the pollen data from Haraldstadmyr, as relatively few drastic transitions take place in the pollen record from 250 to 650 CE.
The area surrounding the Haraldstadmyr bog is characterized by numerous archeological sites, but only a few of them have been excavated. Important are the recent excavations of a burial site and settlement site at Bjørnstad, situated only 400 m to the north of Haraldstadmyr (Bårdseth et al., 2007; Rødsrud, 2007). The settlement site includes a large three-aisled building from around 800 CE that may have included a hall. Another settlement has been excavated at a nearby site at Tune, of what had probably been a farm building from around 400 to 700 CE (Bårdseth, 2006). The settlement is situated close to a burial site, 600 m east of Haraldstadmyr, which was excavated in several phases during the 1900s. Characteristic for the Bjørnstad-Tune sites in the Sarpsborg area is the high percentage of Viking Age burials, which is somewhat in contrast to the rest of former Østfold county (Rødsrud, 2007). There is nonetheless a suggestive lack of Migration Period (400–550 CE) and Merovingian Period (550–800 CE) burials at the Bjørnstad site, which might be indicative of some kind of societal disruption, but these have an unclear temporal relation to 6th-century circumstances. The pollen data indicate a period of slightly reduced farming activities from the mid-5th century to the mid-7th century, namely in the cultivation of cereals. However, due to its early onset, it is uncertain whether this period of reduced farming activities is related to the 6th-century circumstances under study.
5.2 Archeological radiocarbon dates
Radiocarbon data sets are shaped by numerous source-critical issues due to sampling strategies, research priorities, and investigation bias. Settlement sites from the Late Iron Age (ca. 550–1000 CE) are for instance underrepresented in the Norwegian archeological record, thus affecting the number of available C14 dates from this period. The C14 data can therefore not be used as exact expressions for the range and density of past human activities, but they are a tool for identifying peaks and troughs in the archeological record. Whether such anomalies are more representative of past research priorities or past settlement activities is a matter of interpretation. As we have excluded cooking pits and iron and charcoal production sites and instead focused on comparable C14 data from throughout the Iron Age (500 BCE–1000 CE) (Sect. 2.3.4), the diagram (Fig. 9b) must be carefully scrutinized against historical research biases and how they condition data representativeness (Loftsgarden and Solheim, 2022).
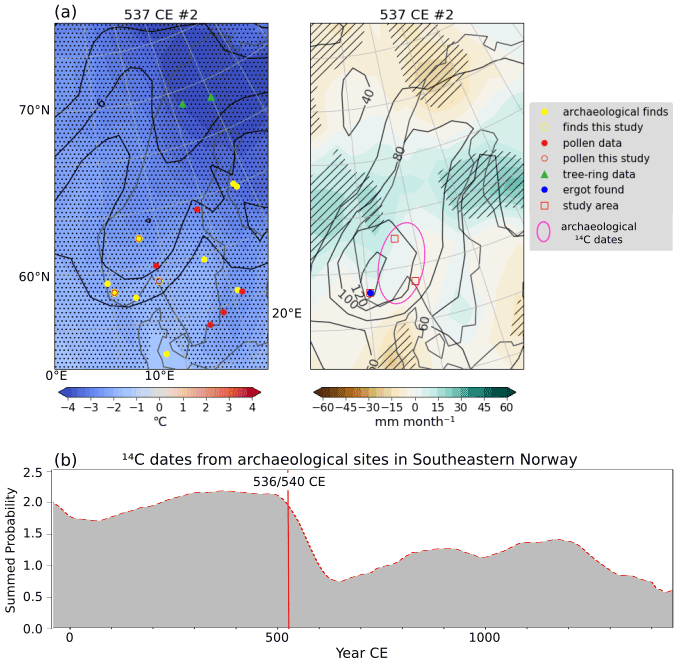
Figure 9Synthesis figure. (a) Temperature and precipitation anomaly maps of Scandinavia from one realization of the MPI-ESM model (ensemble member no. 2), with markers for archeological, historical, and pollen proxy data supporting this model simulation. Pollen data showing reduction in agriculture in the mid-500s, archeological finds indicating abandonment, and tree-ring reconstructions showing a 3.5 ∘C cooling in northern Scandinavia 1–2 years after the 536 CE eruption. The data used for this figure are listed in Table A4. (b) Summed probability distribution of 4012 14C dates (Loftsgarden and Solheim, 2022) from archeological sites in southeastern Norway.
5.3 Synthesis
In this section, we try to bring all the lines of evidence together to sketch a likely scenario of how the volcanic-induced cooling could have impacted the local climate and society in Scandinavia. The challenge of this study is to bring together different types of data with different spatial and temporal resolutions, each with their own uncertainties. To connect the coarse spatial resolution from the climate model to the local pollen and archeological data, we utilized the GDD model. This acts as a connector, enabling us to use the high temporal resolution information the climate model provides without losing the spatial variability between landscapes from the different case study areas.
The relatively good conditions for agriculture in the Sarpsborg area, even with a volcanic cooling, is in contrast to the conditions for Fron and Høgsfjorden, which are associated with a higher degree of vulnerability. However, the factors contributing to disaster risk in the latter two areas are nonetheless of a different nature. Because of the dry climate and hilly and rugged landscape, the farming landscape in Fron can be understood as marginal compared to the Sarpsborg area. This comparison is, to a certain degree, also valid when it comes to Høgsfjorden, where the mountainous fjord landscapes restrain the farming landscape in similar ways to Fron but nonetheless include good climate conditions for farming (Table 4; Puschmann, 2005). The available farmlands in the Høgsfjorden area are heavily cultivated and considered productive. Flooding remains a considerable challenge for agriculture and settlement in the Gudbrandsdalen valley, while Høgsfjorden is prone to rough weather and high precipitation levels. Thus, although farming in both Fron and Høgsfjorden may be vulnerable to colder conditions, the circumstances are different. Consequently, the course of events leading up to possible harvest failures in the two areas would probably not be identical and may even be perceived as unrelated by those affected by them. These factors add to the complexity of the potential disaster impact, as well as how it is experienced in a prehistoric context.
This is also reflected in the pollen data. The apophytes and anthropochores in the Fron and Høgsfjorden areas show a clear decline after ∼ 500 CE, coinciding with an increase of forest, whereas this is less evident in the pollen diagram for the Sarpsborg area. Charcoal, however, shows a slight increase in the Fron area between 500 and 550 CE, the same as for the Sarpsborg area, and a decline for the Høgsfjorden area. In addition, the pollen record from the Sarpsborg area indicates stable conditions during 500–600 CE, as opposed to turbulent conditions in the Fron and Høgsfjorden areas. Pollen data from other studies indicated a reduction in agriculture in the mid-6th century in areas in southern Norway, Sweden, and Estonia (Pedersen and Widgren, 2011; Tvauri, 2014; Bajard et al., 2022). However, this is very area dependent. Other archeological and pollen evidence from southwestern Norway and Sweden shows that not all areas experienced a decline in agriculture (Ranheden, 2007; Pedersen and Widgren, 2011). Similarly, Oinonen et al. (2020) found an increase in burials in southwestern Finland (indicating an increase in population), where the population seemed to have versatile livelihoods and rich natural resources, making them not solely reliant on agricultural practices. In contrast, cultures a few hundred kilometers to the north mainly relied on fishing and sealing. In these areas large settlements were abandoned around 550 CE.
For the Høgsfjorden area there is evidence of ergot, indicating wet conditions (Løken, 2020). In eastern Sweden, wet conditions during the period after the 536 and 540 CE eruptions have also been indicated (Gräslund and Price, 2012). Therefore, climate model ensemble members that simulate wetter conditions rather than a drying together with a pronounced cooling over Scandinavia pique our interest (Figs. A1 and A2). In addition to the evidence for site abandonment from our study areas, archeological evidence for site abandonment in other areas (Solberg, 2000; Löwenborg, 2012) has also been taken into account here. Tree-ring reconstructions from northern Scandinavia (Grudd, 2008; Esper et al., 2012) indicate a cooling of up to 3.5 ∘C after the 536 and 540 CE eruptions, which corresponds to the maximum cooling in the model ensemble members (Fig. A1). In addition, frost rings have been found in northern Finland after the 536 CE eruption (Helama et al., 2019), indicating freezing conditions during the growing season. Figure 9 depicts the above-discussed climate and GDD model results together with archeological evidence and pollen data for a temperature and precipitation regime that shows a strong cooling but also wet conditions over southern Norway and central Sweden. The chosen climate model run and post-volcanic year is based on the temperature and precipitation pattern together. This is by no means the only feasible scenario for how the climate evolved after the 536 and 540 CE volcanic double event but is instead an attempt to visualize several lines of evidence from different types of data and methods together. In particular, precipitation is highly spatially variable, which makes it hard to reconstruct and/or model (Iles and Hegerl, 2014; Cook et al., 2015; Tejedor et al., 2021). Thus, we place higher confidence in the evidence for cooling after the eruptions and the consequences this could have on the cultivation of crops and society.
The overall pattern is one of regional diversity concerning agricultural vulnerability to a large-scale cooling event, which is further conditioned by the spatiotemporal complexity associated with weather and climate change. The social consequences of the 536/540 CE volcanic events should therefore not be treated as uniformly affecting all parts of Scandinavia. Our results suggest that climate change affected parts of southern Norway in diverse ways. Although testifying to considerable social and material change, the Scandinavian archeological record from around the mid-1st millennium CE is also associated with contrasting regional patterns.
In Denmark, many old settlements were abandoned and new ones established (Nielsen, 2005, 2006). At Funen, villages appear to have been reorganized sometime around 600 CE (Hansen, 2016). However, there is also considerable regional variation and little evidence for an overall societal decline. Farming seems to have been reorganized and intensified (Näsman, 2009). Some areas include pollen evidence for reforestation of farmlands between 600 and 1000 CE, whereas others testify to deforestation and an expansion of heaths and pastures (Odgaard and Nielsen, 2009). Nielsen (2005, 2006) states that the development both precedes and succeeds the 6th century, which indicates that the 536 and 540 CE events may have functioned as a catalyst but were probably not the main cause.
In Sweden, large-scale reorganization has been documented in the Uppland area of Middle Sweden in and around the 6th century CE, resulting in larger and clustered settlements (Göthberg, 2007; Göthberg and Sundkvist, 2017). This process is usually understood in light of the emerging Late Iron Age magnate complex at Gamla Uppsala (Ljungkvist and Frölund, 2015) but also as evidence for a social crisis (Gräslund and Price, 2012). Pedersen and Widgren (2011) highlight the ambiguous nature of the archeological and pollen record and argue that the Iron Age societies were unevenly affected by processes, depending on their subsistence and land-use strategies. According to the two authors, areas experiencing major expansions of the farming landscapes in the preceding centuries appear to have been the most vulnerable to the climate downturn.
As stated by Oinonen et al. (2020) in their study of the Levänluhta people of western Finland, a society based more on outfield and marine resources would be less affected by crop failure than agrarian-dependent communities. Similar patterns are present in the Norwegian archeological record.
The Norwegian landscape is highly diverse with spatially restricted but often heavily cultivated agricultural areas and abundant outfields often rich in wildlife and resources. The level of dependency on farming outputs must have differed considerably in prehistoric times, as well as the character of farming strategies. Forsand in the 6th century is usually understood in terms of social crisis because of failing harvests and overgrazing by livestock (Løken, 2020; Westling et al., 2022), while Myhre (2002) emphasized examples of continuous settlement occupation and expansion in parts of eastern and Middle Norway. However, Stamnes' (2016) GDD modeling of northern Trøndelag suggests that Middle Norway may have been vulnerable to a climate cooling as well, thus adding to the overall complexity. The C14 record for southeastern Norway (Fig. 9b) is indicative of an overall reduction in archeological sites during the 6th and 7th centuries. A lacuna in archeological finds around this time was early recognized and much debated in Norwegian archeology, and explanations have ranged from ideas of crisis to a reorganization of society by new and powerful elites (Gundersen, 2019).
However, there is no real contradiction between the two narratives and a new picture is gradually emerging that indicates great diversity in disaster impact and human responses throughout Scandinavia, depending on the character of subsistence strategies, and local and regional variations in landscapes and climates but also possible secondary and additional factors such as pandemics, social unrest, warfare, competition over resources, and trade disruptions (Gundersen, 2021). Our study contributes in this direction by utilizing a wide range of cross-disciplinary data sets and exploring the many facets of volcanic climate change on both regional and local scales. By contextualizing the results, we have provided a diverse picture of the possible consequences of the 536 and 540 CE events for farming societies. However, although the present study demonstrates the potential of combining climate and GDD modeling with paleo-botany and archeology, more issues should be thoroughly explored in order to be able to better understand the role of climate variations for social change, in particular those addressing subsistence strategies in a wider sense than just farming. Important is not just the level of dependency on farming but also how environmental disruptions to the human sphere interact with ongoing social processes, causing possible secondary and long-term effects that are more difficult to directly relate to the climate factor. Thus, more in-depth and broader studies are necessary.
In this study, we have investigated the role of the 536 and 540 CE volcanic double event on the change in climate and society in Scandinavia, specifically in southern Norway. Norway's landscape is diverse, with fjords, mountains, valleys, and coasts. This leads to an array of different climate and circulation regimes impacting cultivation practices. Three areas in southern Norway were selected for a case study, based on different climates and landscapes and the availability of excavation sites and high-resolution chronological pollen records.
The climate model ensemble mean projects a significant cooling over Scandinavia and a drying for both the long-term 536–560 CE mean as well as for the first two growing seasons after the eruptions 536–537 CE and 540–541 CE. However, individual ensemble members exhibited regional differences for the temperature and precipitation anomalies, corresponding to the SLP anomaly patterns. Since the internal climate variability over Scandinavia is high and the model ensemble spread is large, the analyses focused on both the ensemble mean and on the individual members as possible volcanic climate impact realizations. For the period after the 536 and 540 CE volcanic double event, colder and wetter conditions have been indicated by both proxy climate and paleo-botanical evidence for southwestern Norway and central eastern Sweden, leading to the conclusion that realizations of the climate model ensemble that simulates colder and wetter conditions over these regions may be more realistic, although precipitation is highly variable in space and time.
The three selected case study areas reveal in both the GDD model setup as well as the pollen records that the areas on the western coast and the mountainous areas of southern Norway experienced a reduction in productivity and even abandonment of sites in the mid-6th century, whereas the Oslofjord area in southeastern Norway showed less indication of crisis during that time. However, the effect on agriculture and society is a complicated picture, and the overall impression is one of regionality and varying levels of disaster impact on Iron Age societies. Thus, in neither climatic nor societal terms should the 6th century volcanically induced cooling be treated as uniform in its impacts throughout Scandinavia. On the contrary, it seems likely that it may have had different consequences throughout the peninsula, with considerable regional diversity in human responses to this unique volcanic climate hazard event.
A1 Climate model simulations

Figure A1The 2 m air temperature anomaly for the individual ensemble members of (a) 536 CE, (b) 537 CE, (c) 540 CE, and (d) 541 CE. Anomalies are calculated with respect to the 1–1850 CE climatology in contours (1 ∘C intervals). The red squares indicate the areas used for the growing degree day calculations. The 2σ significant level is stippled.
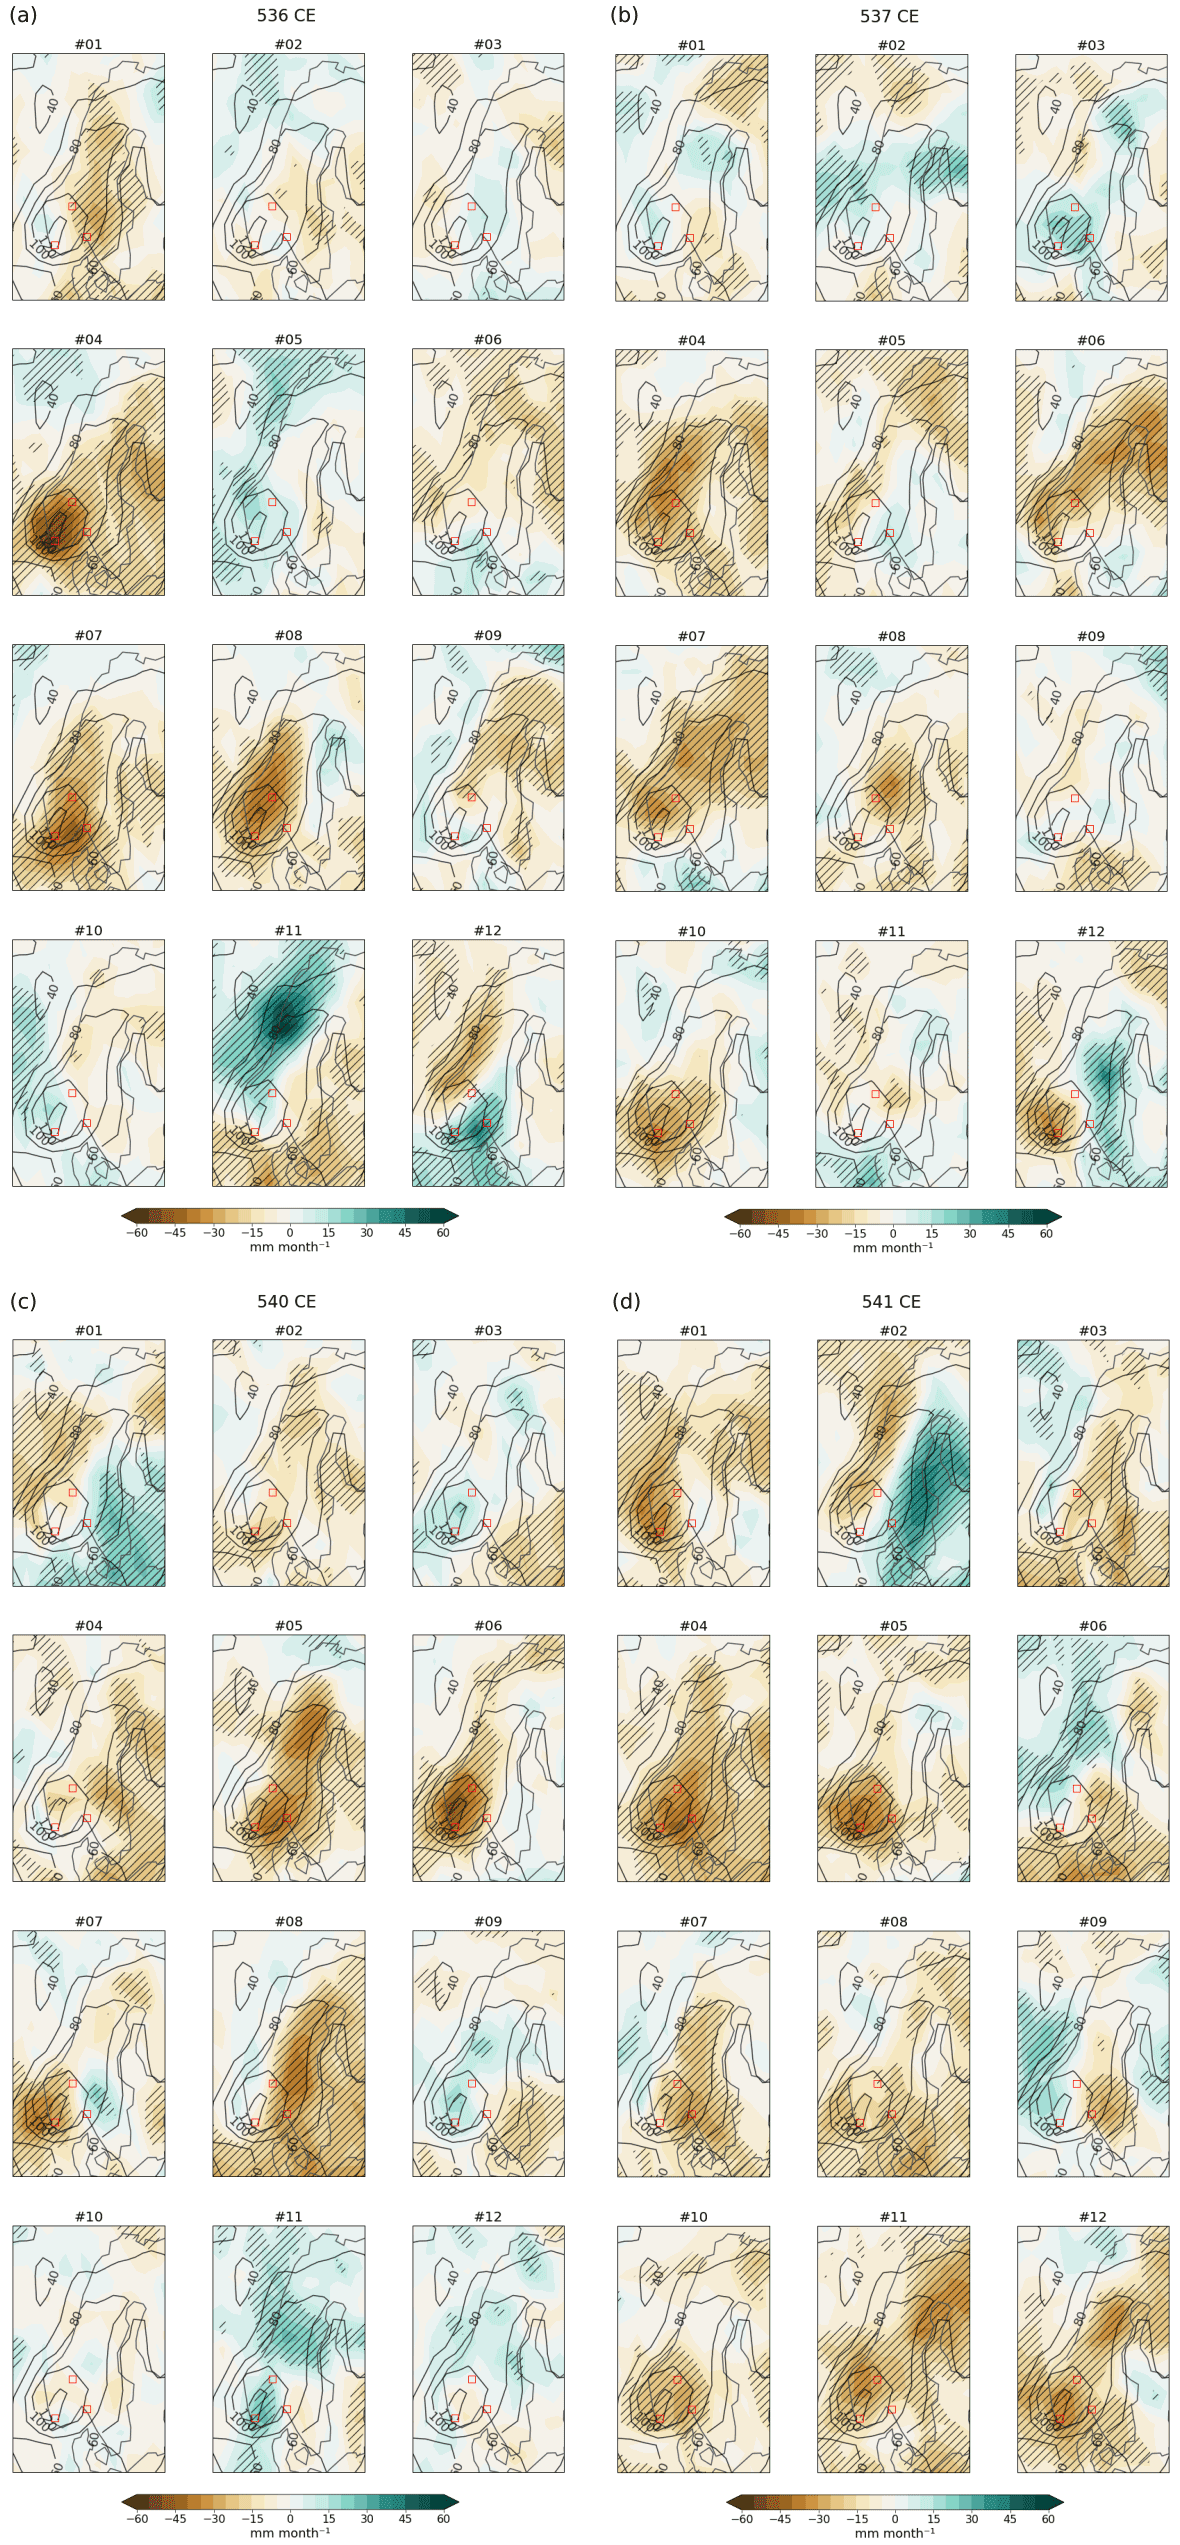
Figure A2The same as Fig. A1 but for the precipitation anomaly. The 1σ significant areas are hatched. Contours are shown for 20 mm per month intervals.
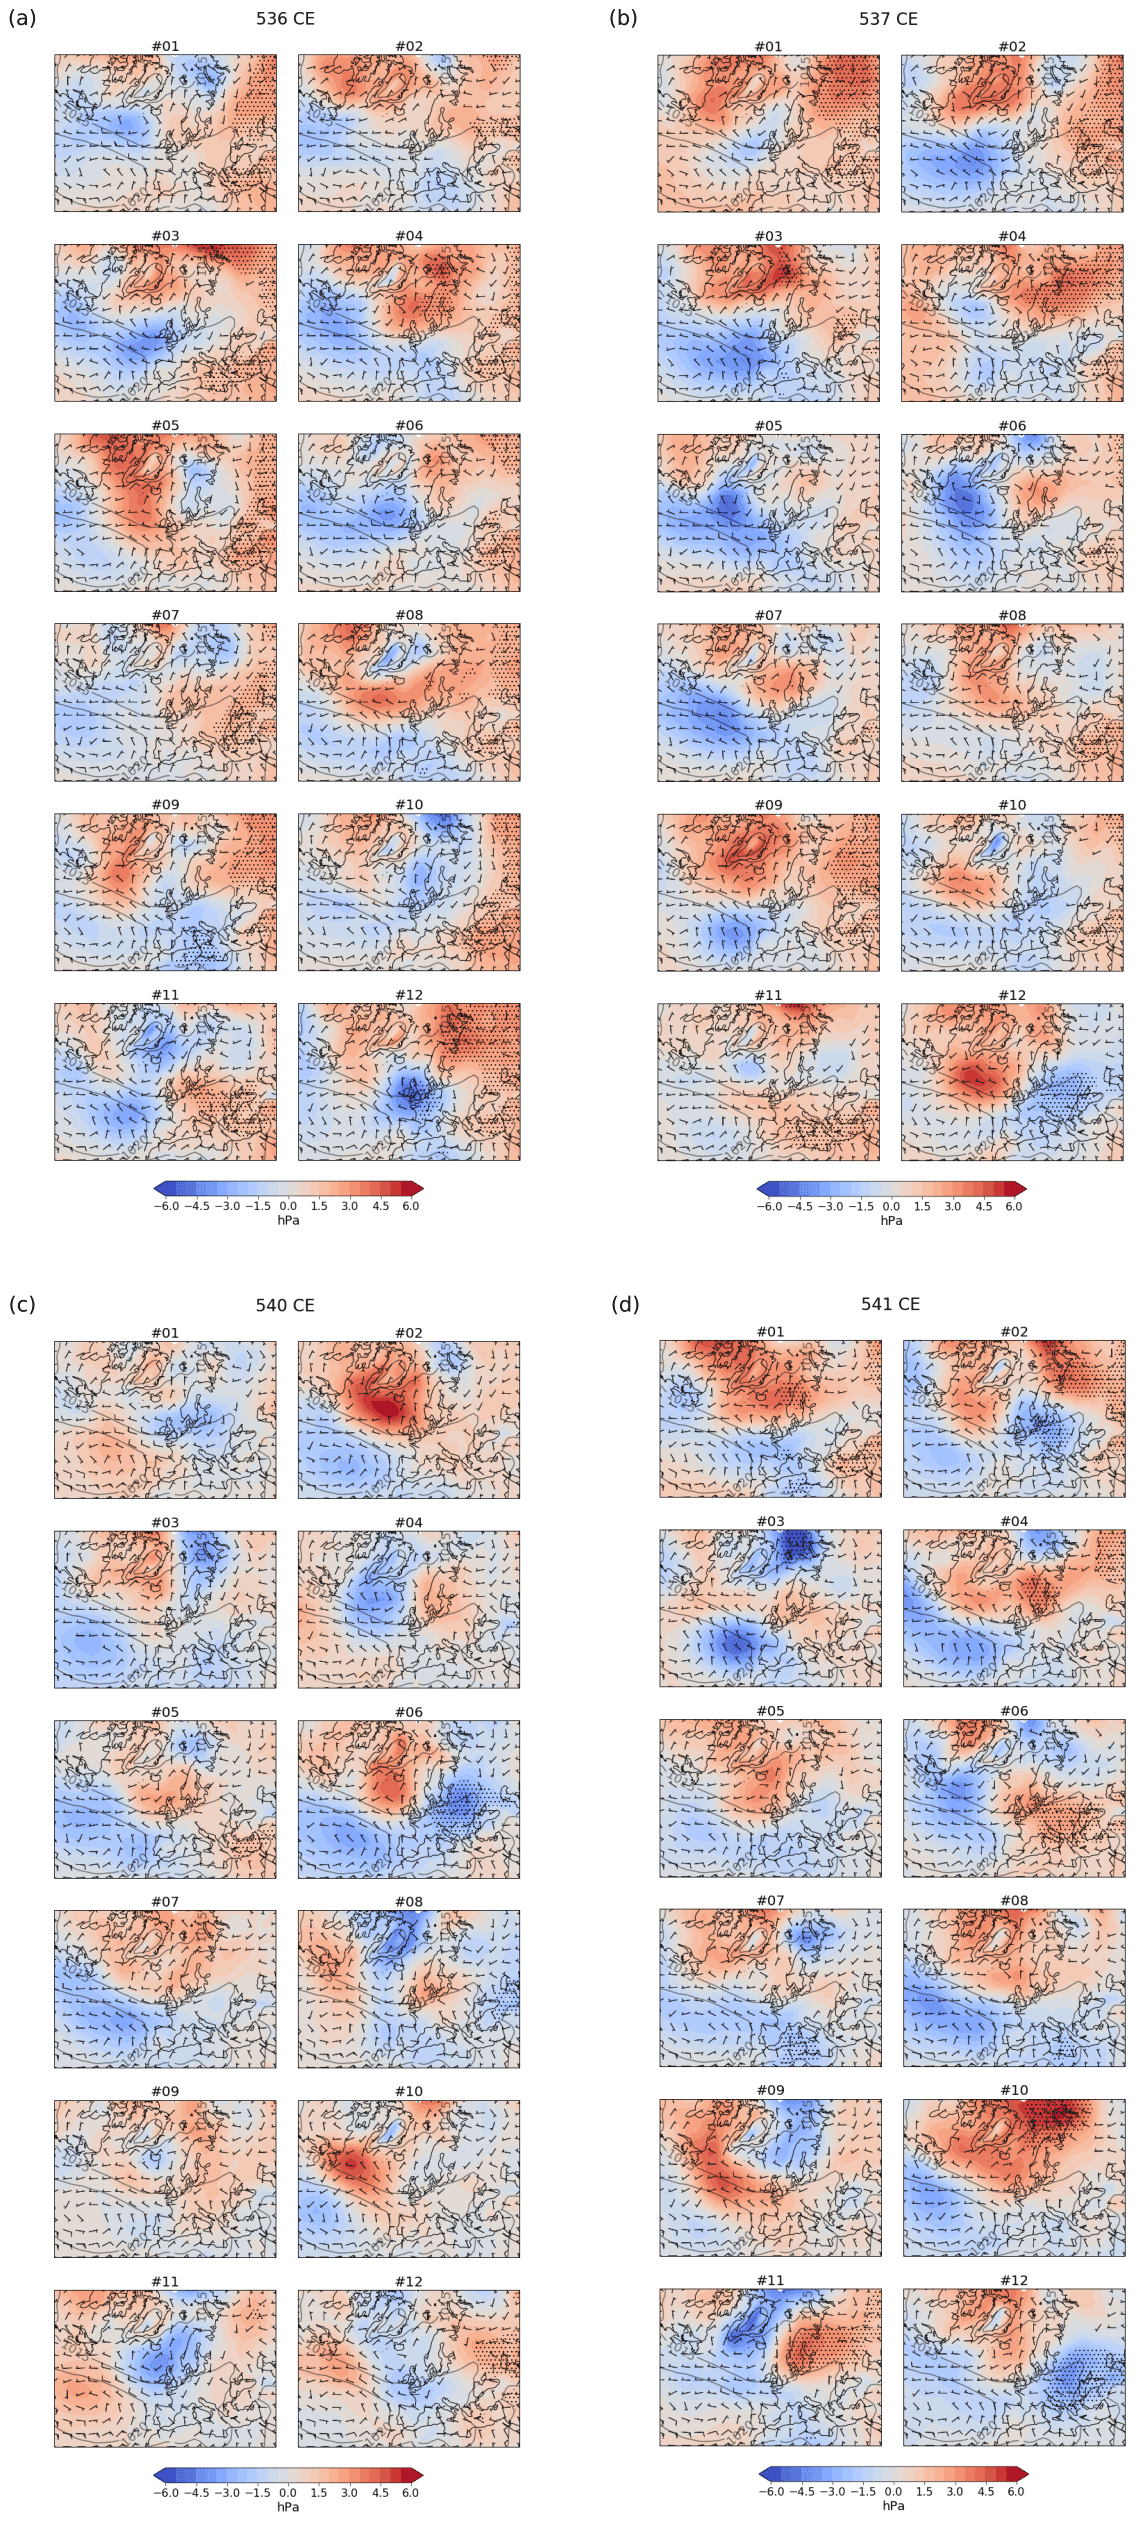
Figure A3The same as Fig. A1 but for sea level pressure (SLP) anomaly and absolute wind. SLP contours and wind barbs are shown for 5 hPa and 1, 5, and 10 m s−1 intervals, respectively.
Atmospheric circulation analyses
Analyzing the general atmospheric circulation patterns by using EOF analysis, for the April–September growing season from the past2k run no. 1 (Fig. A4b), reveals the growing season atmospheric circulation anomaly patterns to be a combination of the winter and summer modes (not shown here), with a similar distribution of high- and low-pressure centers as in winter, albeit not as concentrated. The four leading modes are a NAO+-like pattern with 38 %, a NAO−-like pattern with 8 %, a weaker NAO+-like pattern with 7 %, and a blocking-like pattern with the high pressure over the Kara sea with 6 %.
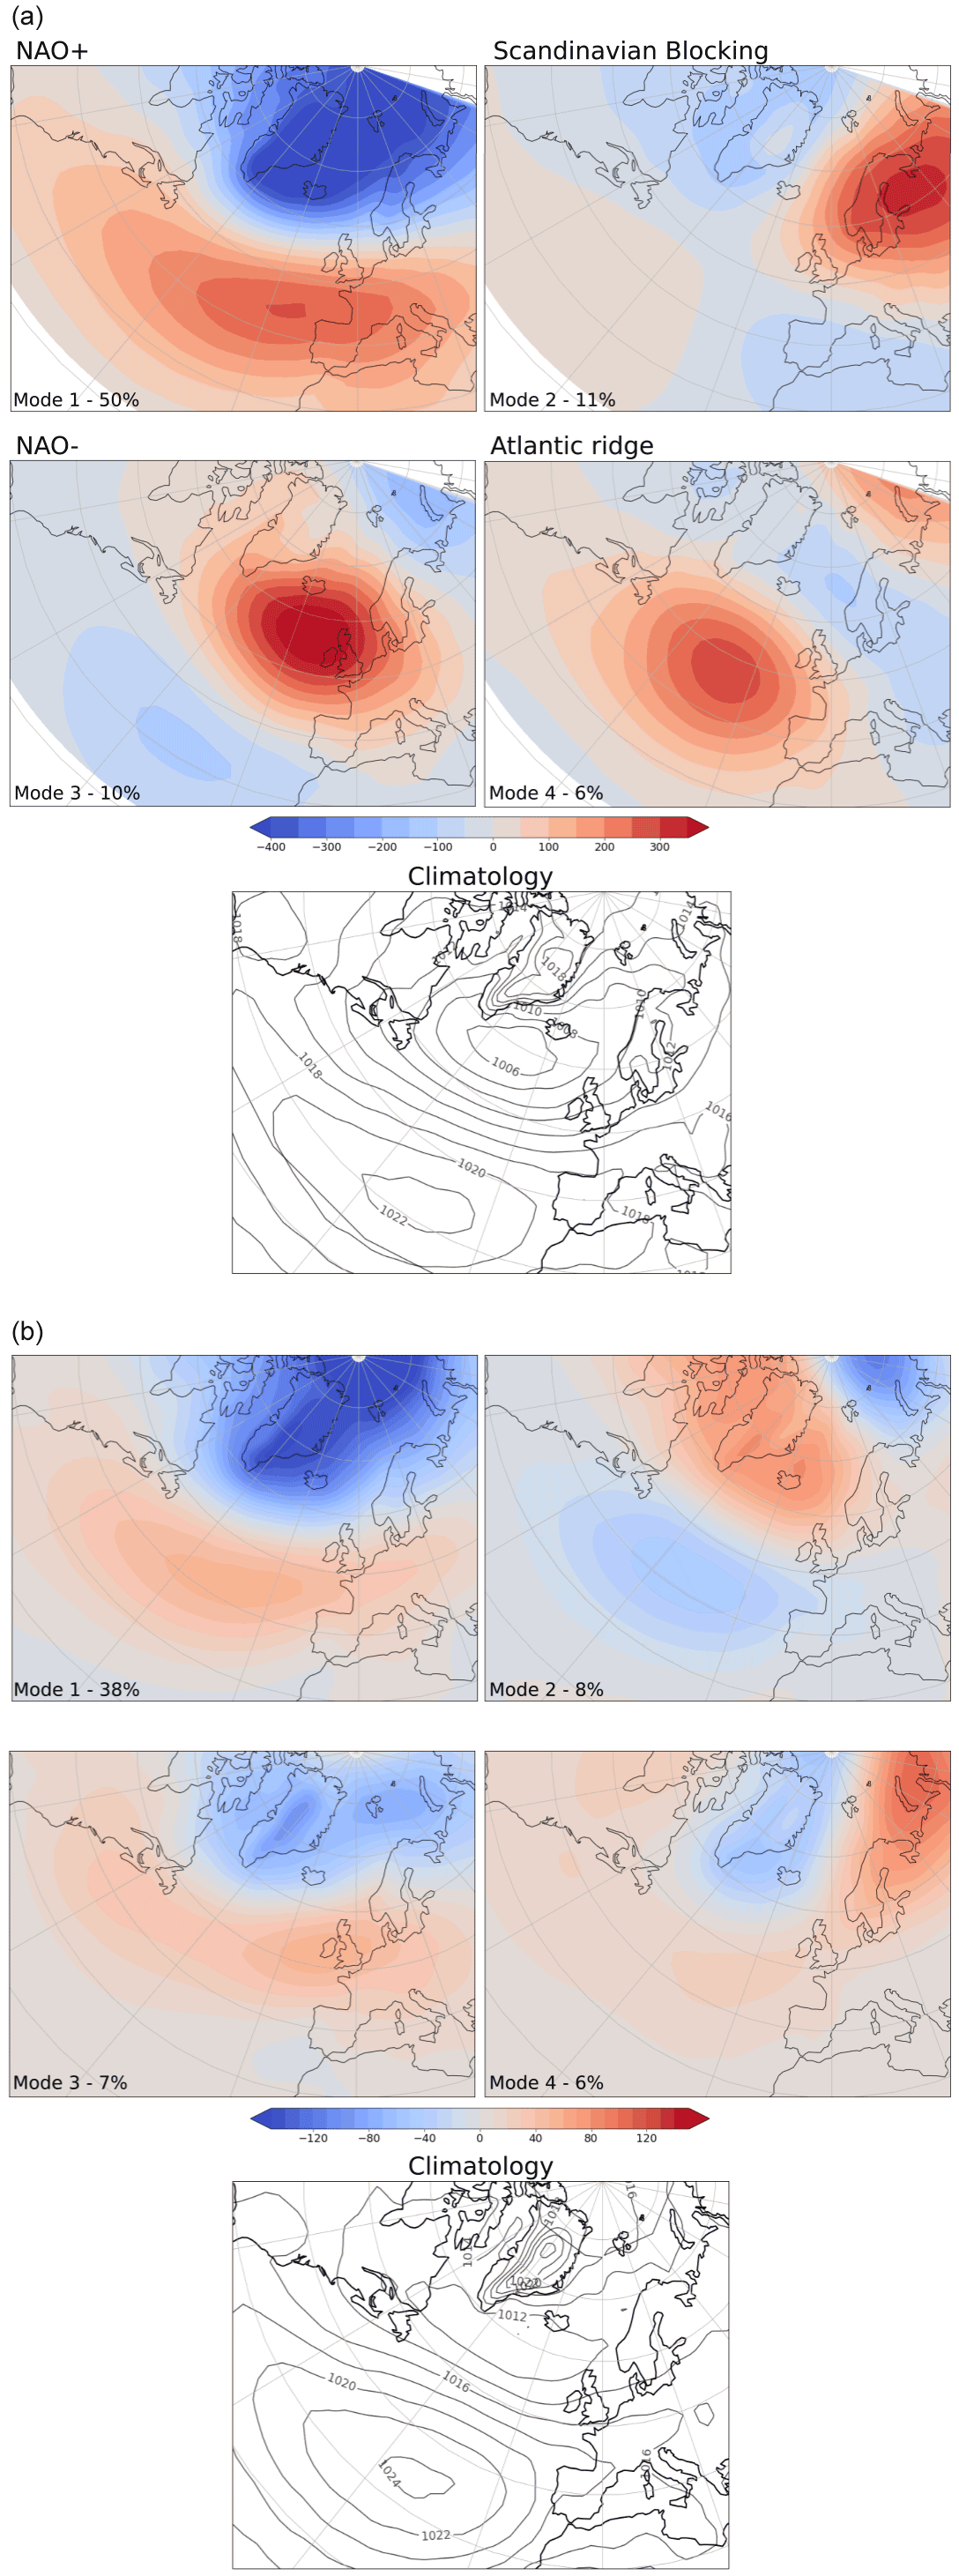
Figure A4The SLP EOF patterns of the first four modes of atmospheric circulation for past2k run no. 1 for (a) DJF (see also van Dijk et al., 2022) and (b) the mean growing season (AMJJAS) during 1–1850 CE. The SLP climatology for 1–1850 CE is given in the lowest panel; contours are given in 2 hPa intervals.
Van Dijk et al. (2022) showed a significant SLP anomaly, with an increase over the high latitudes and a decrease over the mid-latitudes 2 years after the large eruptions that occurred during 520–680 CE for JJA, whereas the DJF signal is not significant due to high internal variability in the winter months. These SLP patterns are similar to what we find in this study for the mean growing season AMJJAS (Fig. 4), with a higher pressure over the high latitudes and land and a decrease in pressure over the mid-latitudes for the NH. In addition, van Dijk et al. (2022) calculated the NAO index for the DJF SLP, resulting in a positive NAO response the first year after the eruption for three out of four eruptions, followed by a more neutral or even a negative NAO response in the year after.
From the SLP anomaly for AMJJAS in Fig. 4, it can be seen that the atmospheric circulation response over Scandinavia is significant for the ensemble mean growing season for 536–560 CE, but not for the 2 years after the 536 and 540 CE eruptions. The different patterns in the precipitation and SLP anomalies are canceled out in the ensemble mean, resulting in a weak volcanic signal. Even though the 536–560 CE mean gives a significant positive anomaly for Scandinavia (Fig. 4a), the individual runs highlight differences in the regional responses as possible realizations.
A2 Study sites
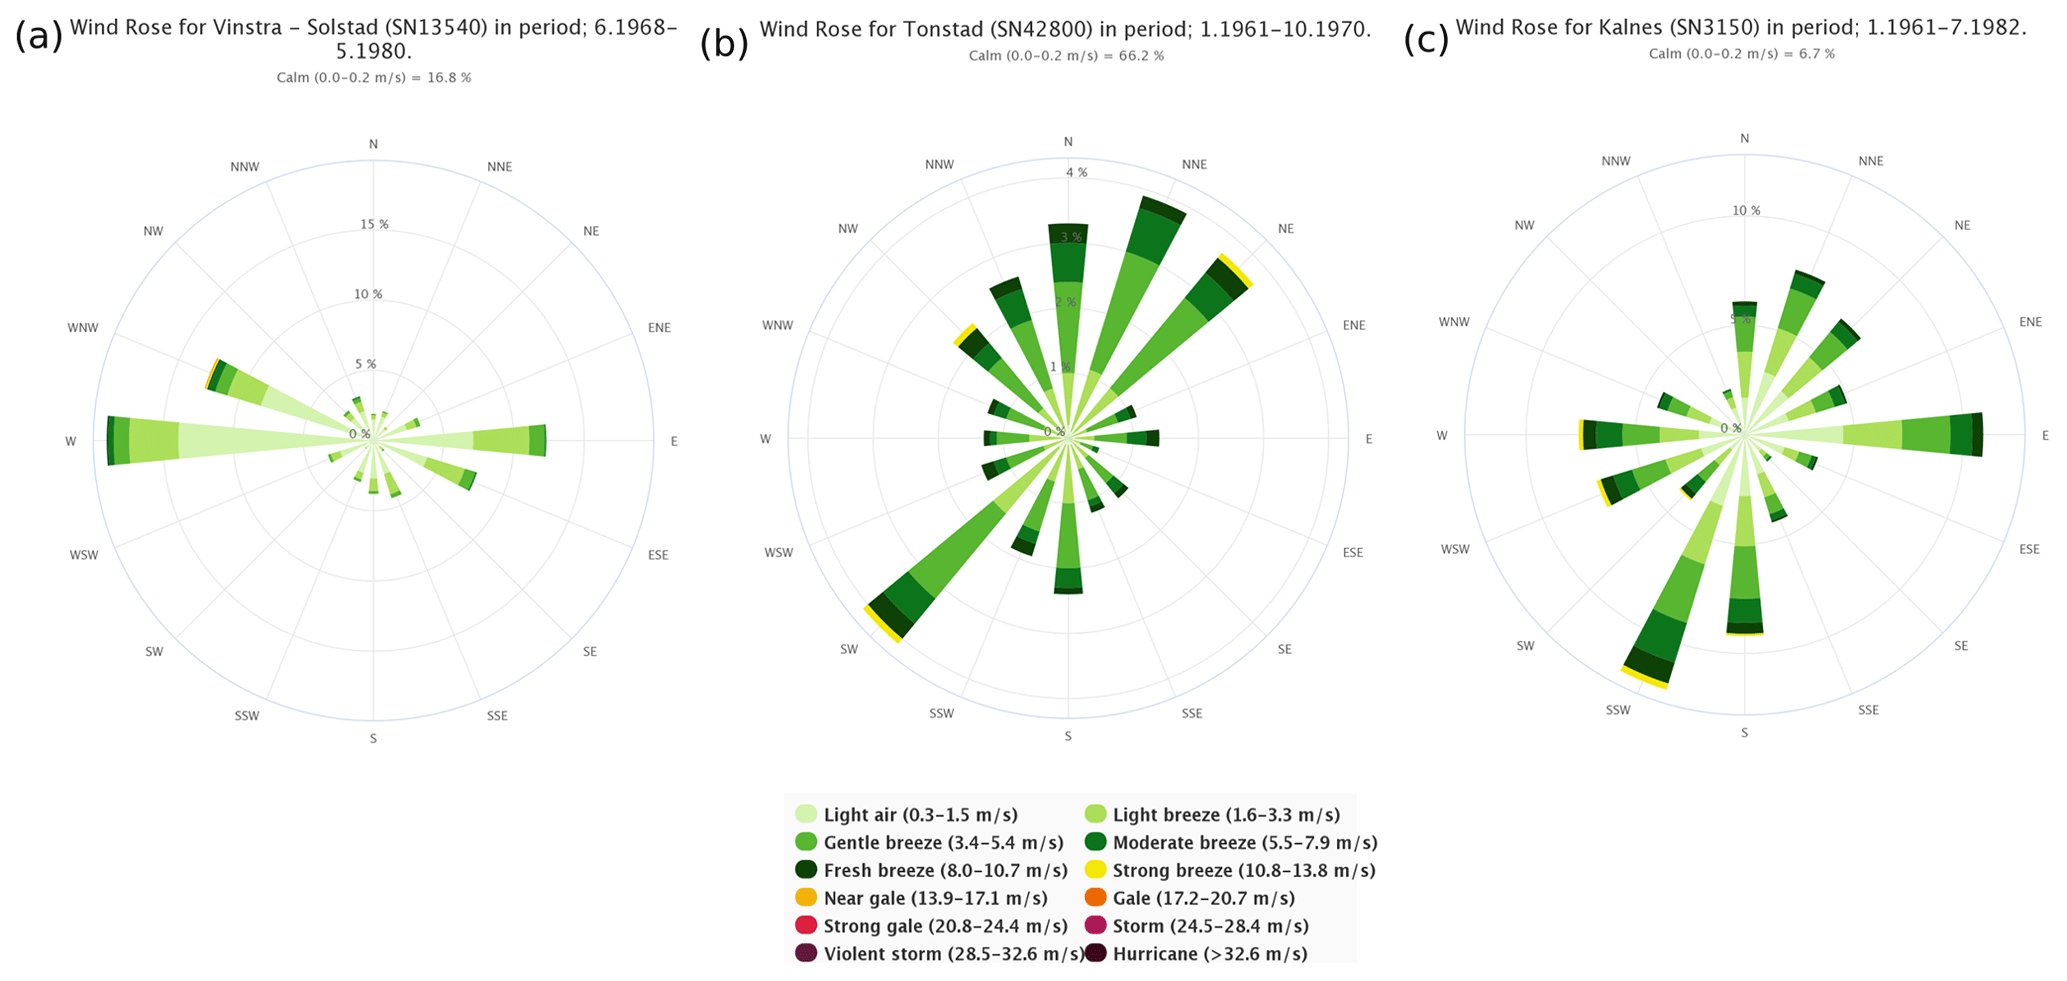
Figure A5Annual mean 10 m wind data for 1961–1990 (https://seklima.met.no/, last access: 28 November 2022) for the (a) Fron, (b) Høgsfjorden, and (c) Sarpsborg areas. Data are taken from the nearest meteorological station with the same valley orientation as the study area.
A3 Pollen data
Chronology
The uncalibrated and calibrated radiocarbon ages of Haraldstadmyr peat sequence are presented in Table A1. An age–depth model was generated based on these nine radiocarbon ages, as presented in Fig. A6. The top of the core, i.e., 0 cm, was incorporated in the construction of the age–depth model as the year of the coring in 2018 CE.
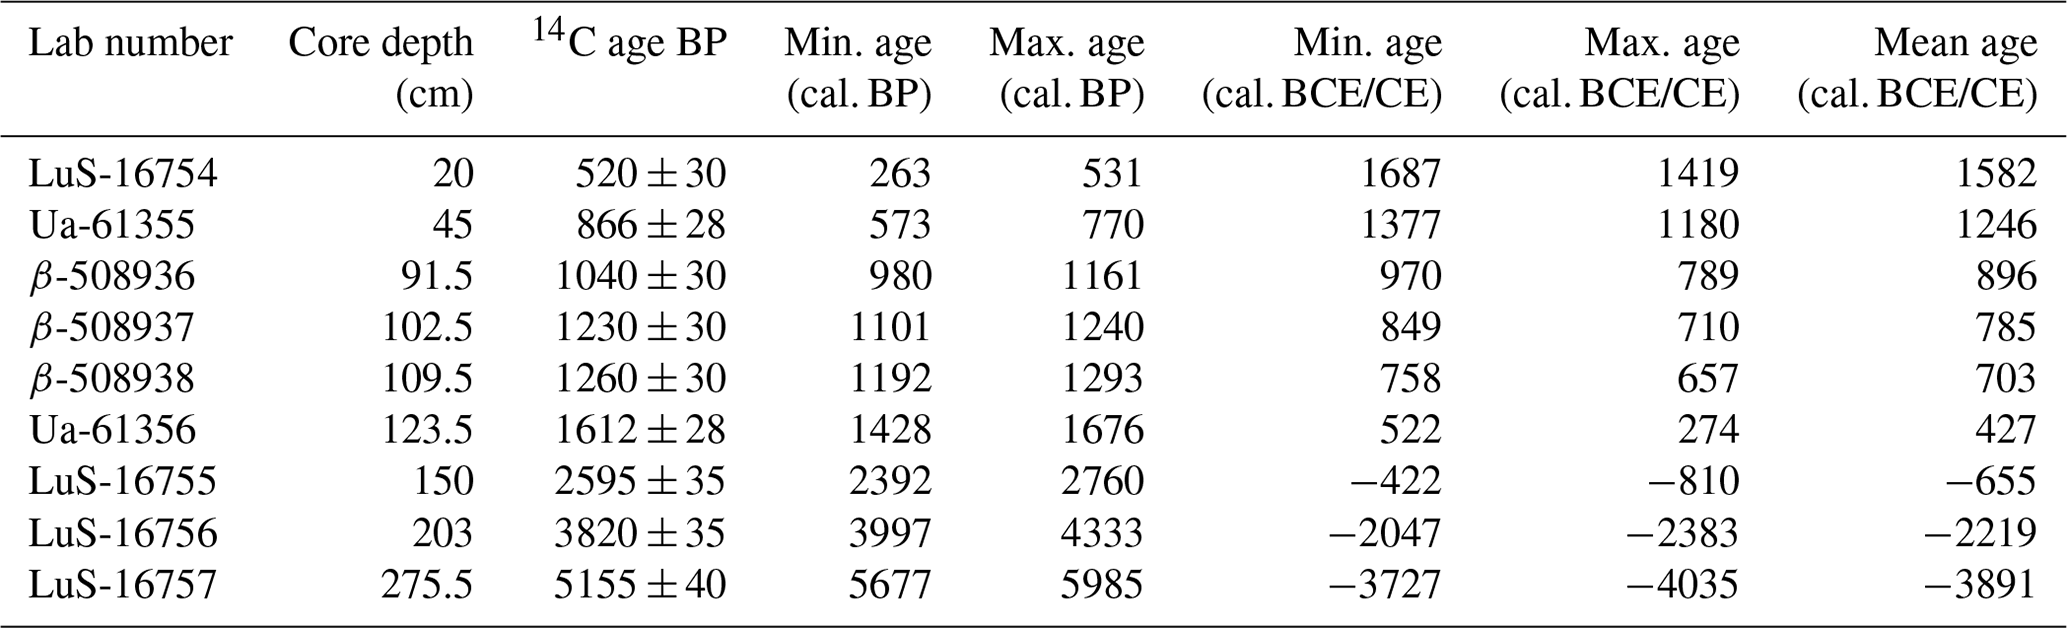
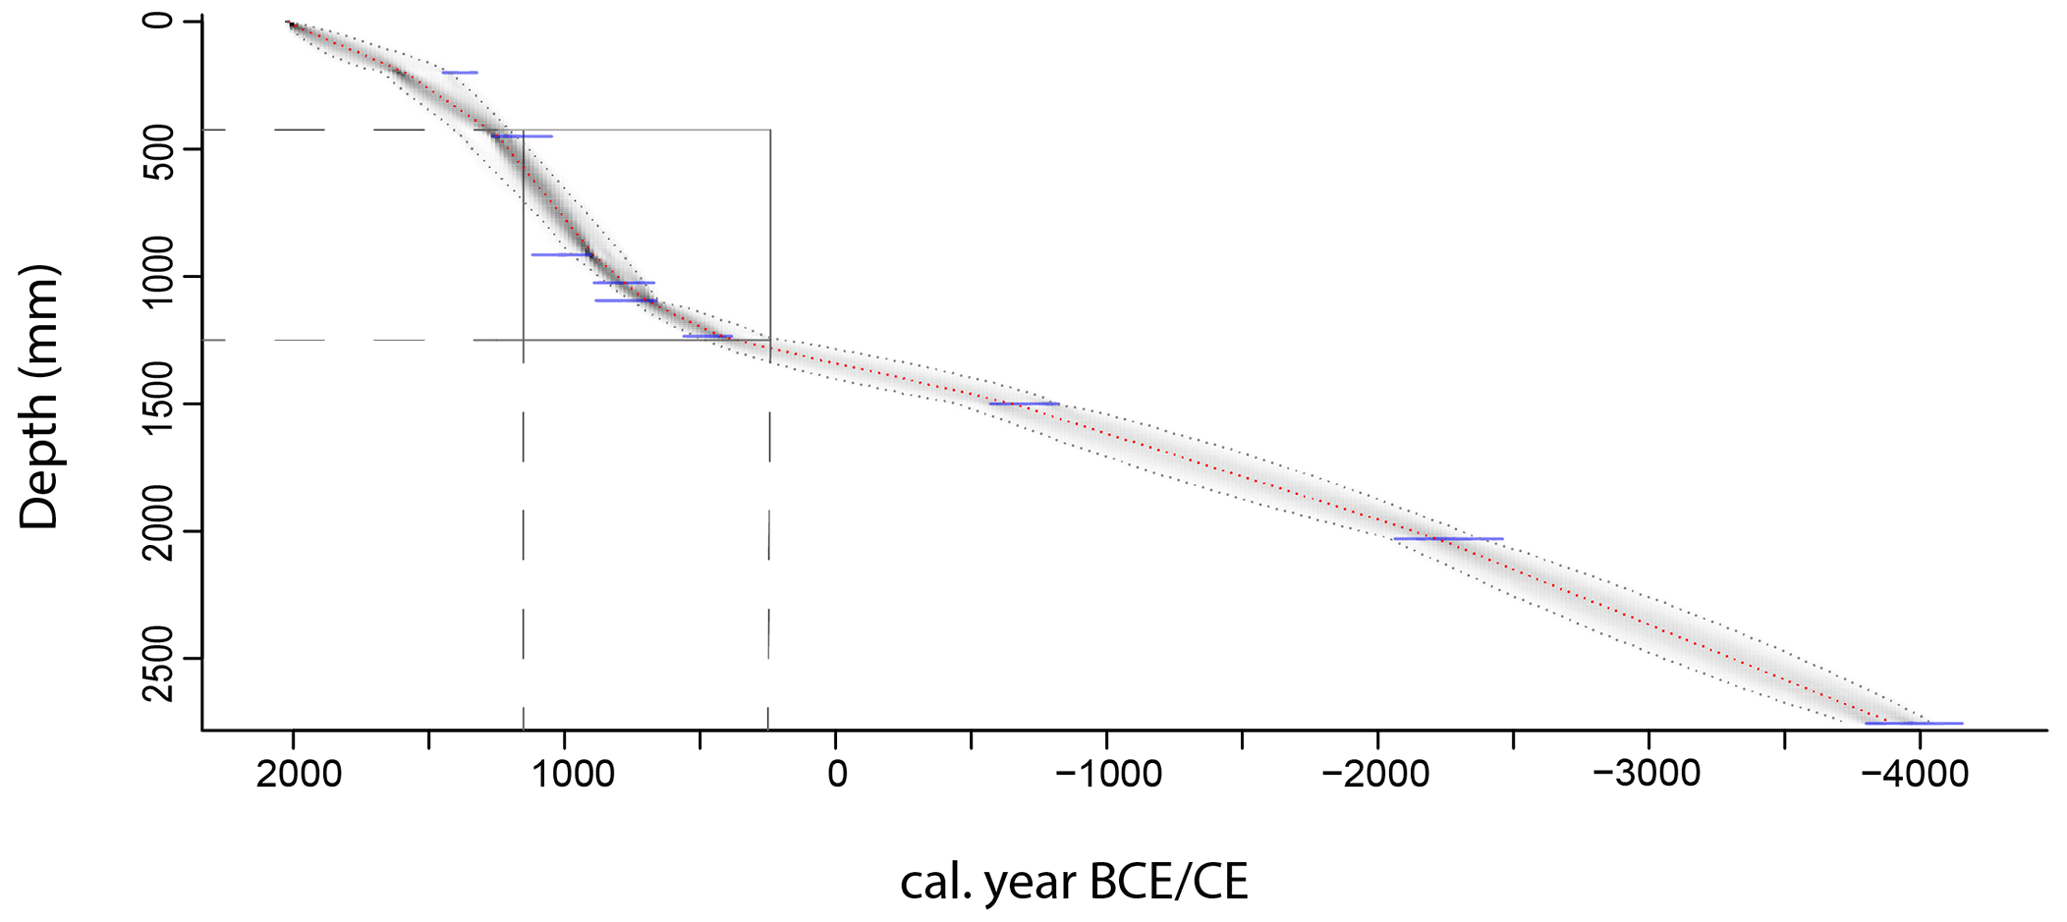
Figure A6Age–depth model of Haraldstadmyr peat sequence, represented with the RBacon package. The section in the rectangle indicates the study period 250–1150 CE.
The age–depth model indicates that the peat sequence approximately covers the last 4000 years. The peat accumulations vary throughout the core. From 0–45 cm, the accumulation rate measures 0.36 mm yr−1. The accumulation rate increases from 45 to 109.5 cm to 1.18 mm yr−1. From 109.5 to 275.5 cm, the mean accumulation rate measures 0.52 mm yr−1.
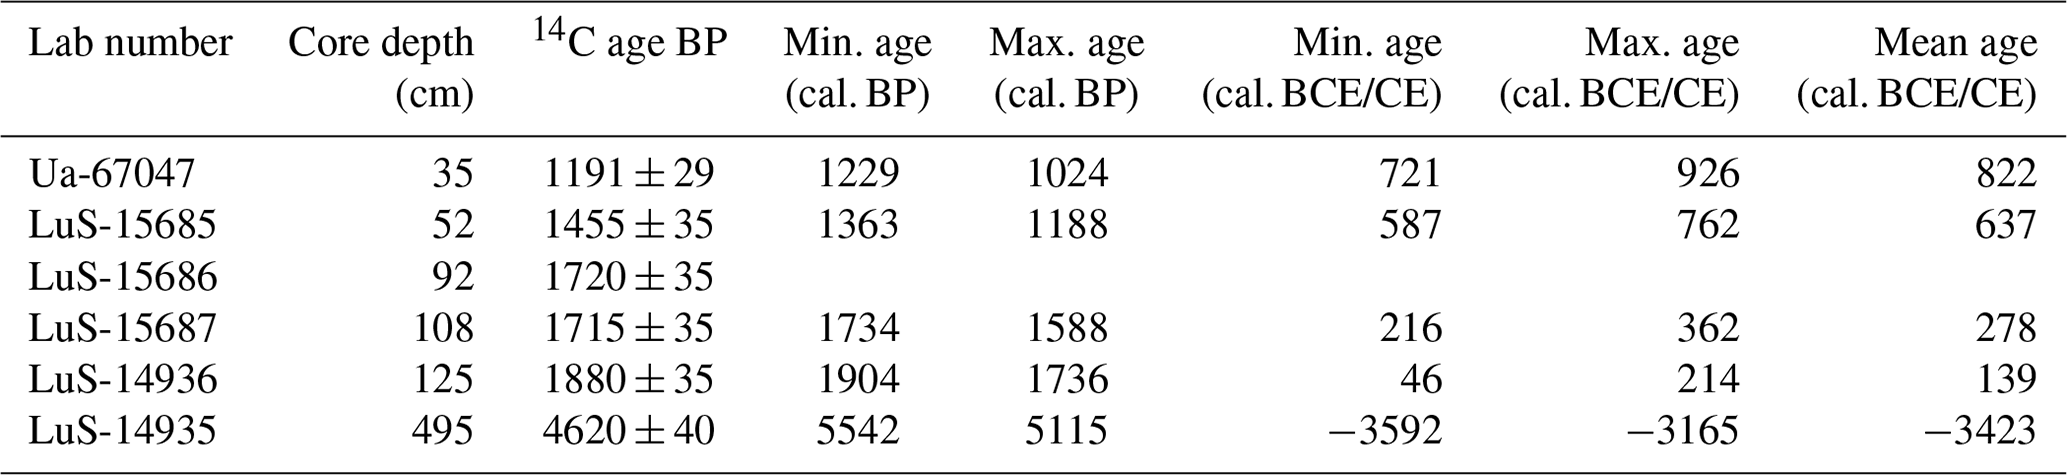
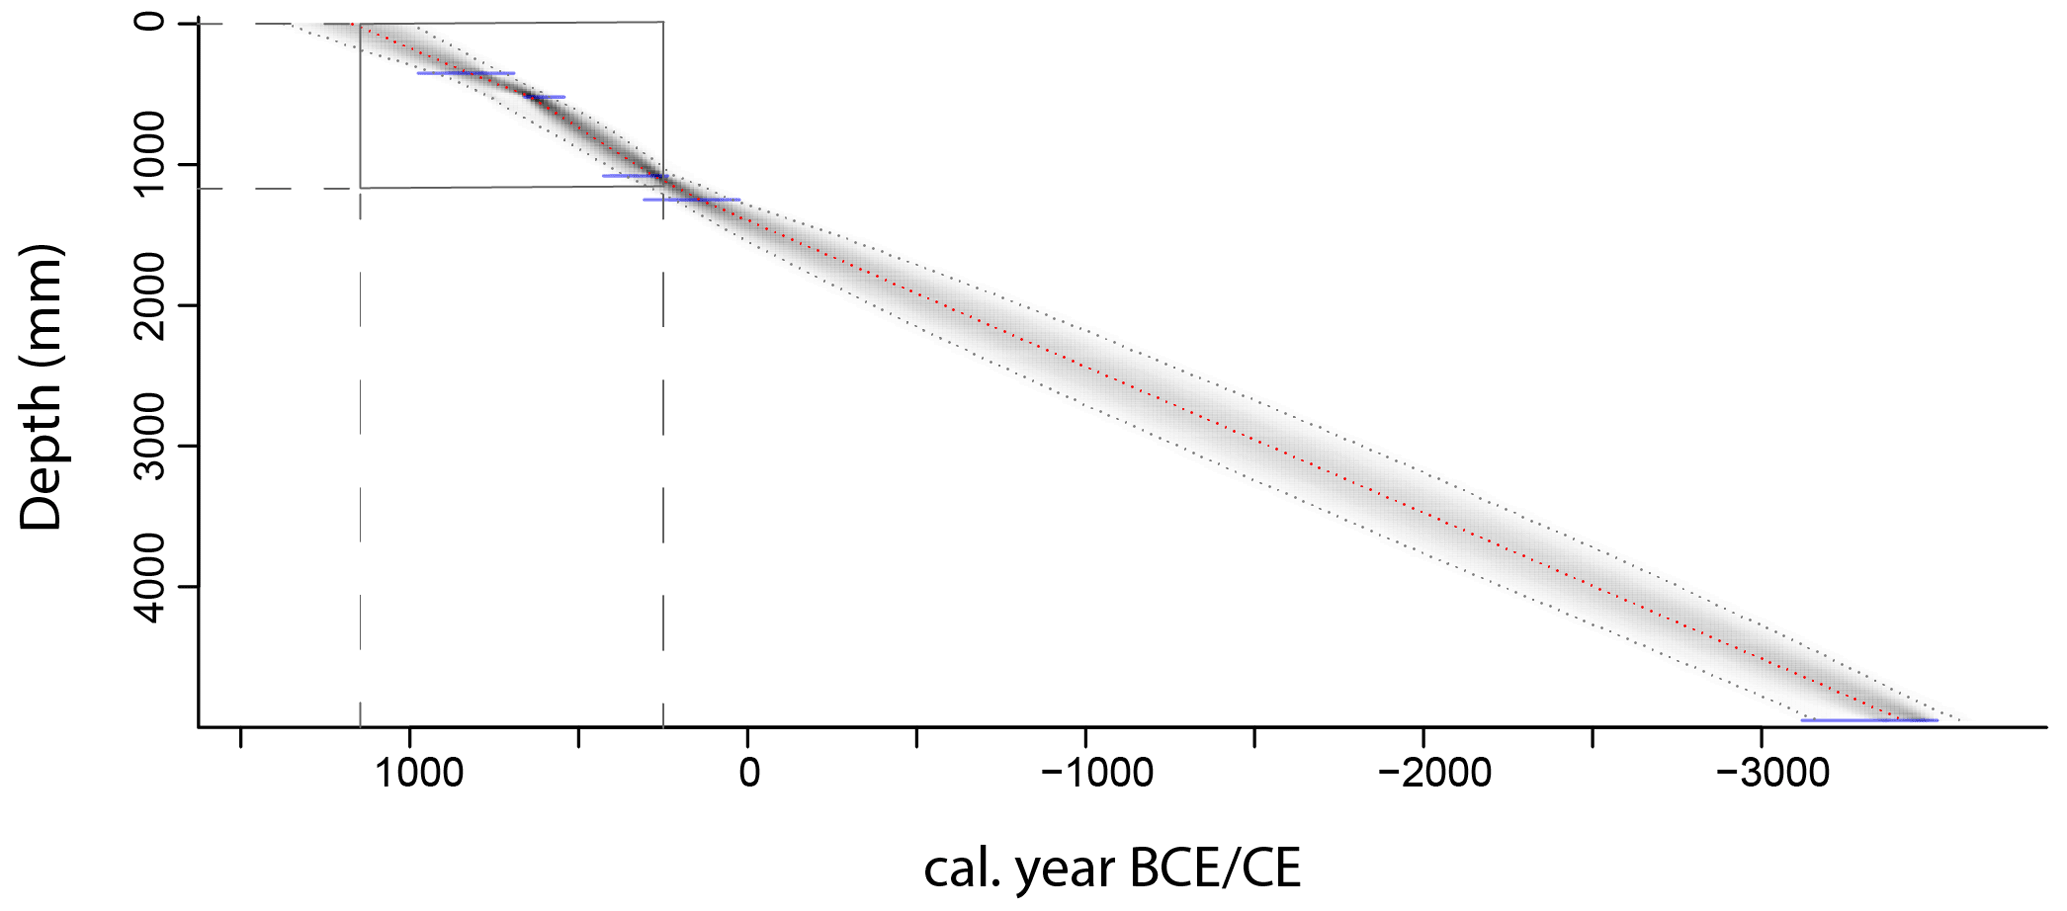
Figure A7Age–depth model Ulbergmyr peat sequence, represented with the RBacon package. The section in the rectangle indicates the study period 250–1150 CE.
The uncalibrated and calibrated radiocarbon ages of Ulbergmyr peat sequence are presented in Table A2. Sample LuS-15686 was discarded, as this sample was found to be older than the sample taken at 108 cm. The year of coring was excluded during the construction of the age–depth model. As a result, the age–depth model (Fig. A7) was generated based on five radiocarbon ages in total.
The chronology of Ulbergmyr peat sequence approximately covers the last 3500 years. However, as the bottom of the bog was not reached during the coring, the complete chronology of the bog most likely dates back even further. From 35 to 52 cm, the mean accumulation measures 0.92 mm yr−1. The mean accumulation rate is relatively higher from 52 to 108 cm in comparison to the rest of the core, namely 1.56 mm yr−1. The age–depth model is linear from 108 to 495 cm, with a mean accumulation rate of 1.05 mm yr−1.
The radiocarbon ages of Åsheimmyr peat sequence are listed in Table A3. Sample Ua-72109 was discarded, as this radiocarbon age was found to be too old (Høeg, 1999). The year of the coring was excluded during the construction of the age–depth model.
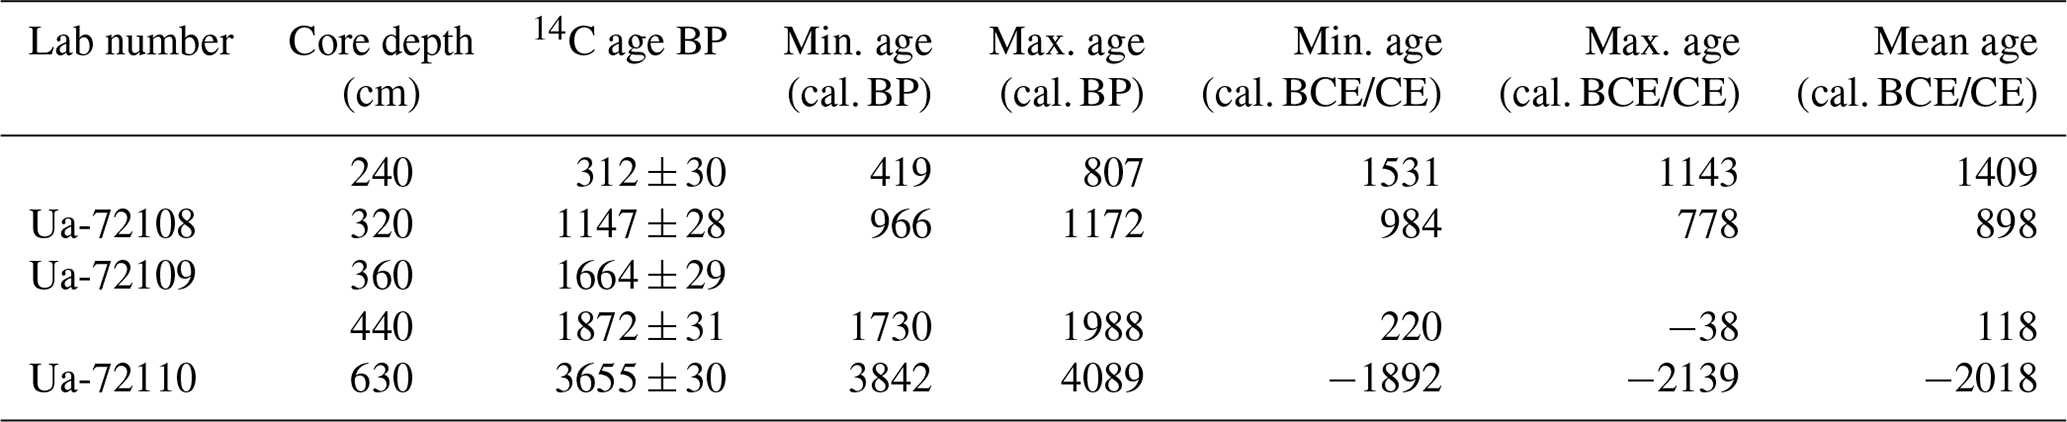
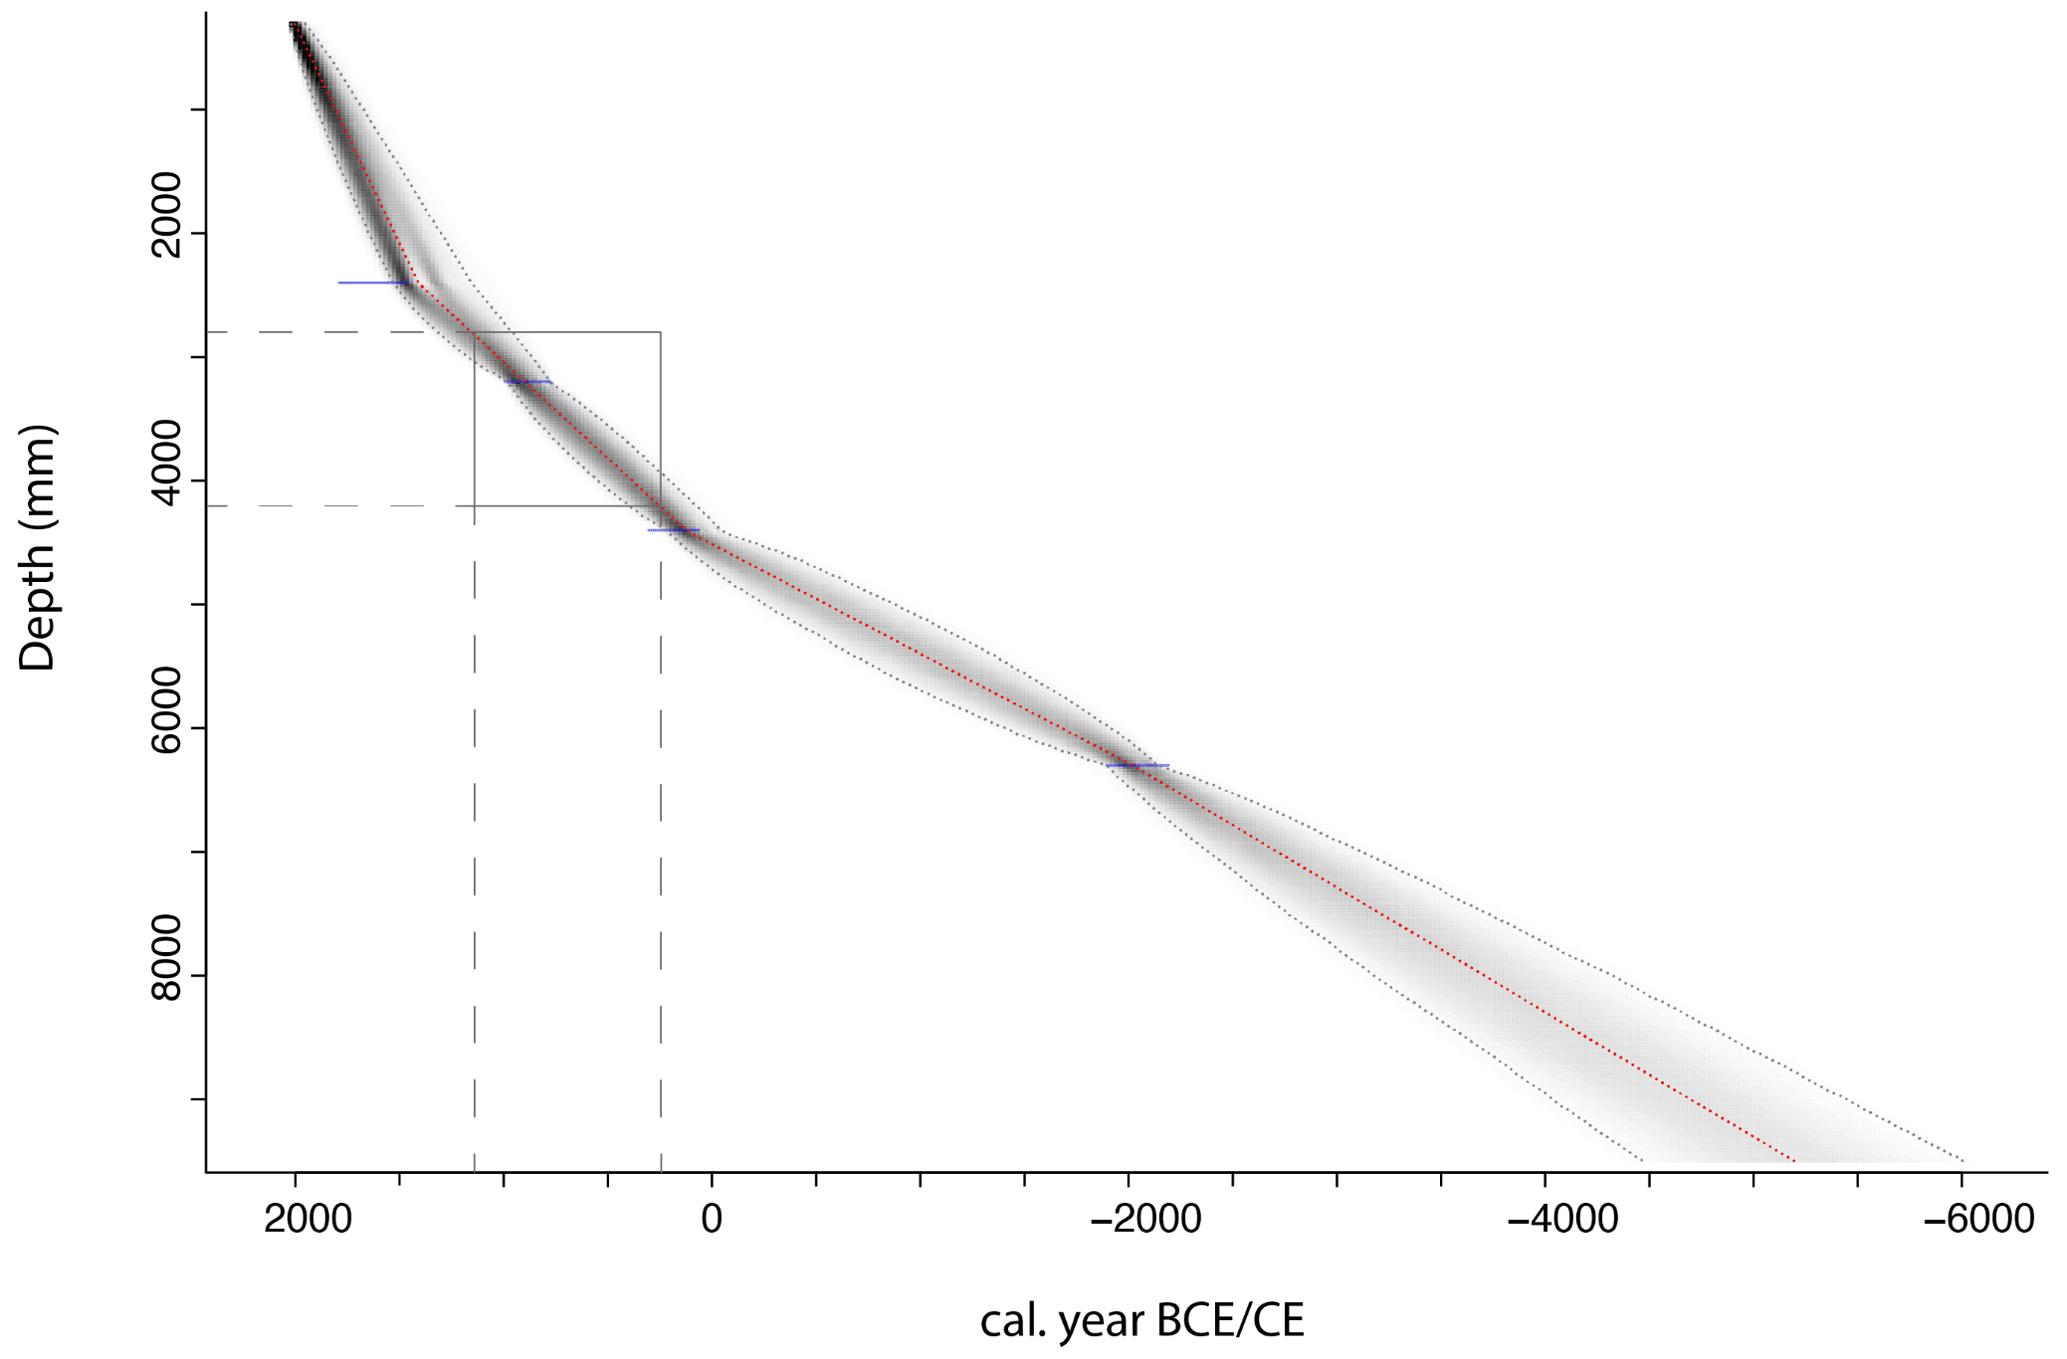
Figure A8Age–depth model for the Åsheimmyr peat sequence represented with the RBacon package. The section in the rectangle indicates the study period 250–1150 CE.
Åsheimmyr peat sequence covers over 5000 years (Fig. A8). The mean accumulation rate is the highest at the top of the bog, from 30 to 240 cm, i.e., 3.54 mm yr−1, after which the accumulation rate decreases to 1.55 mm yr−1 from 240 to 440 cm. The lower part of the peat sequence from 440 to 630 cm has a mean accumulation rate of 0.89 mm yr−1.
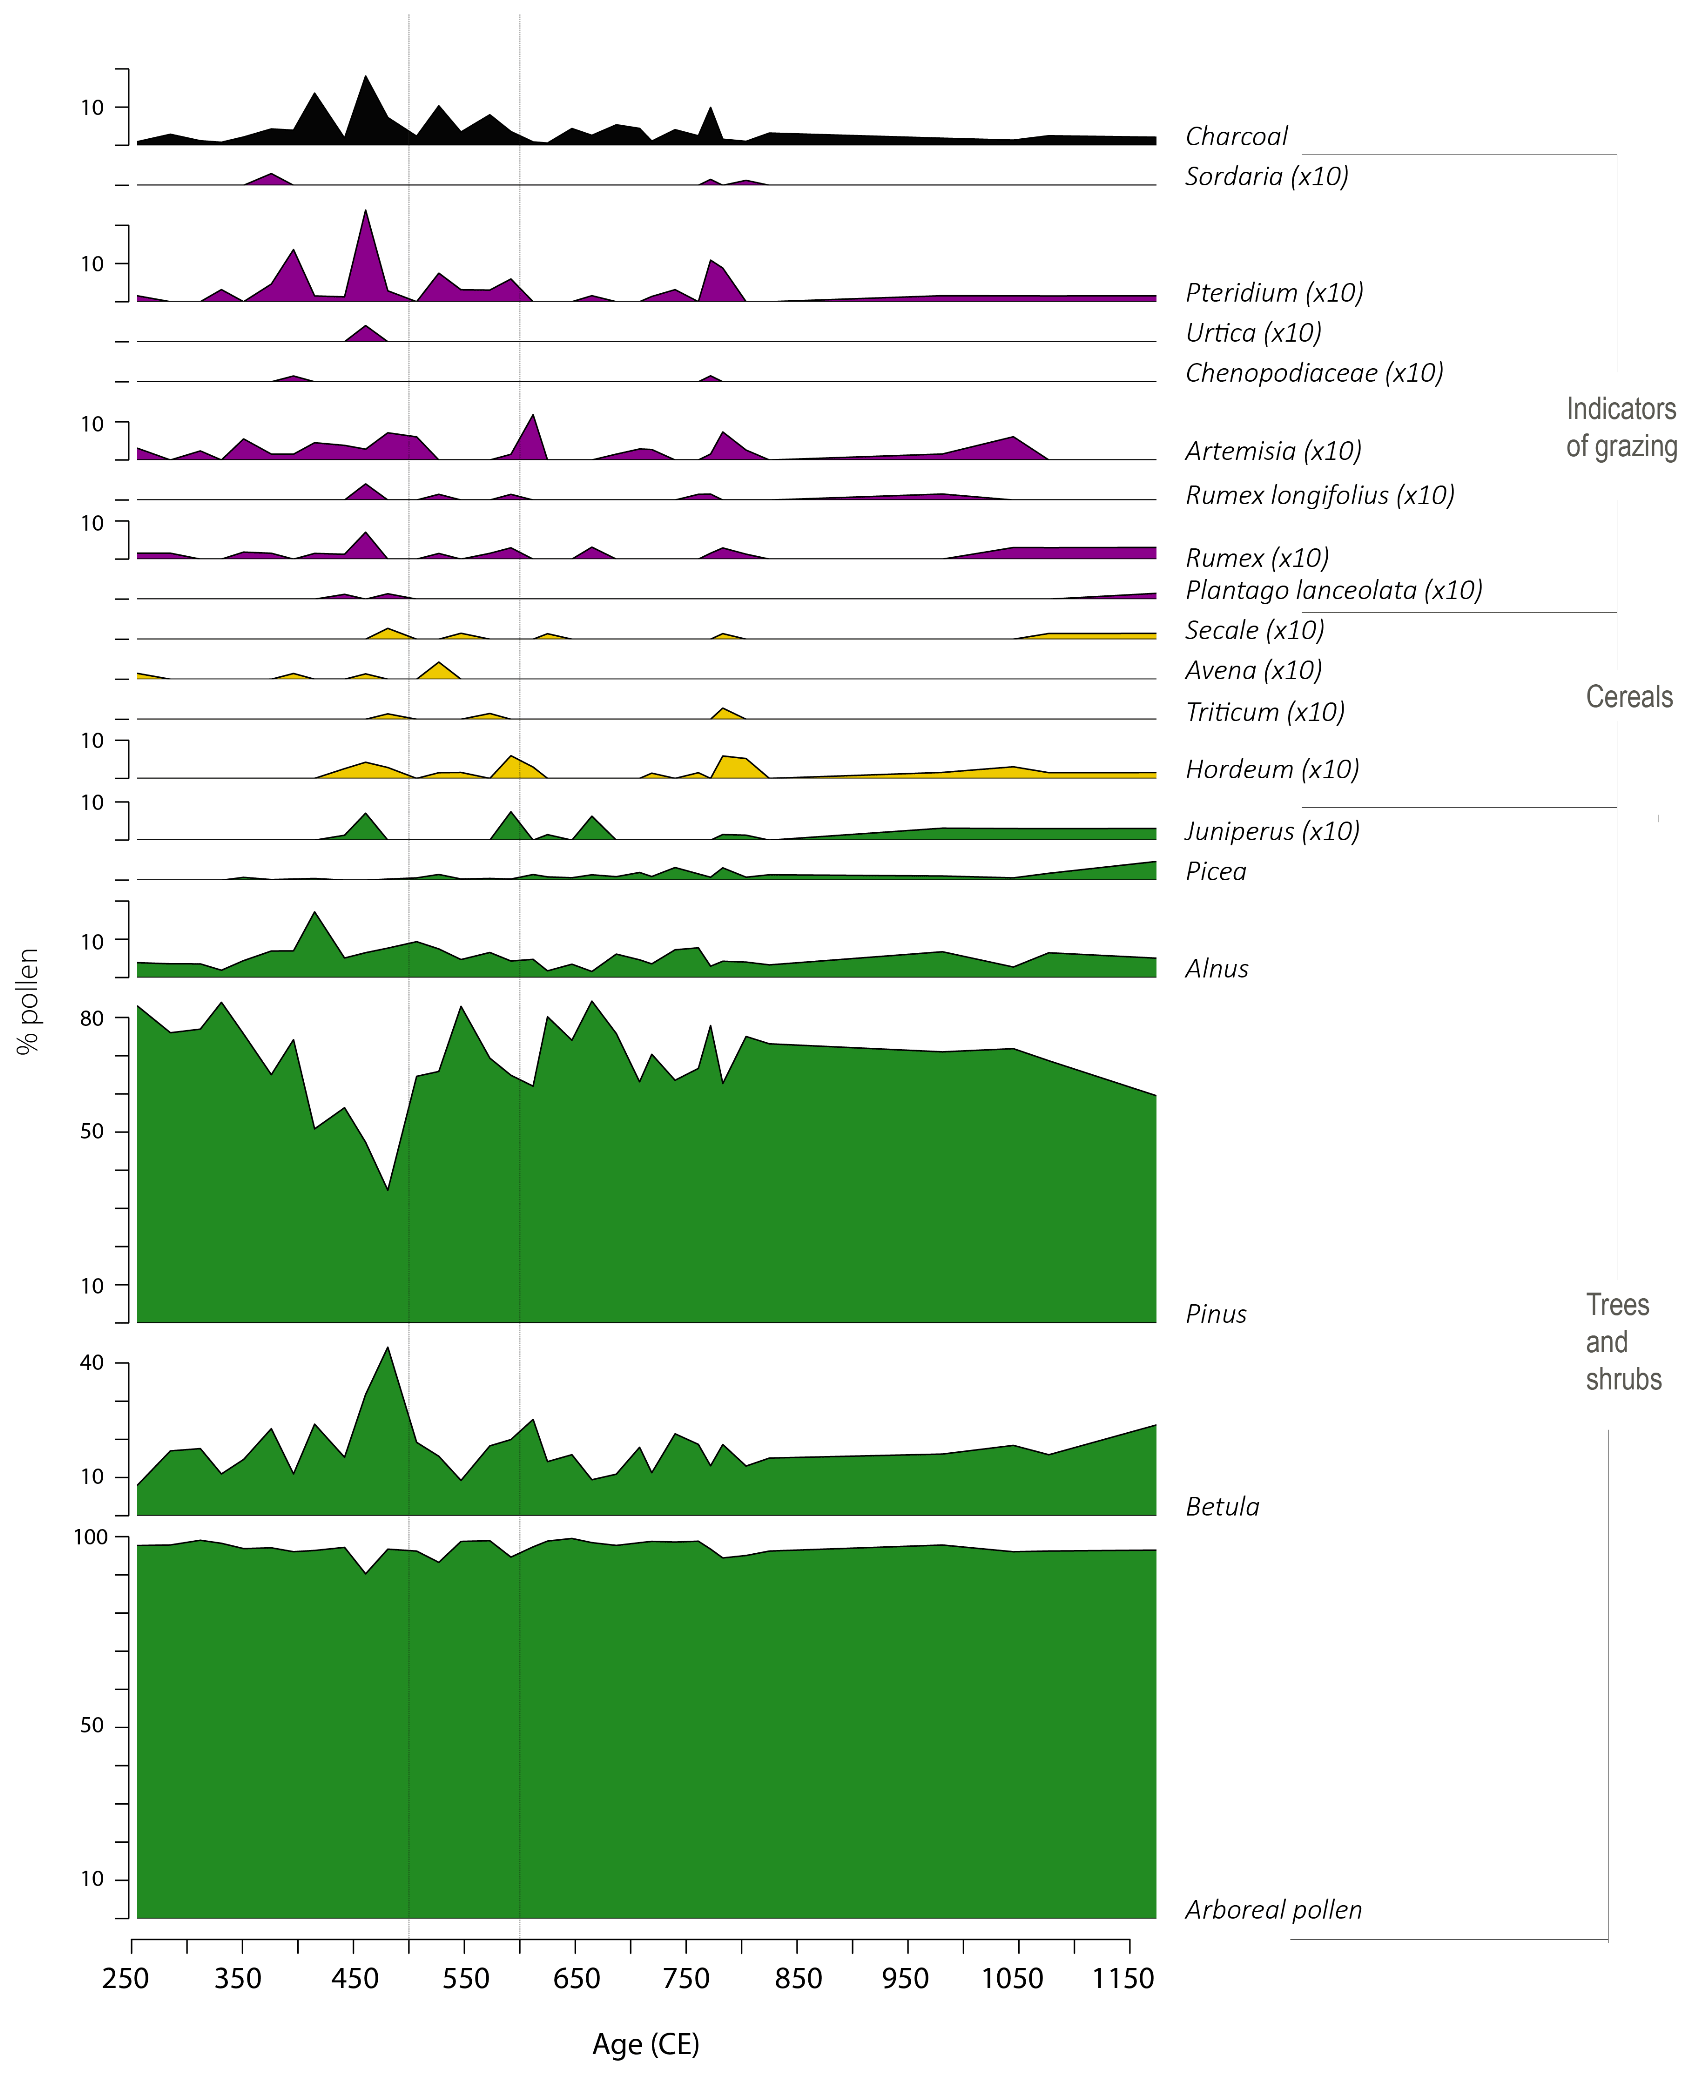
Figure A9Percentage pollen diagram of Ulbergmyr peat sequence (Fron area), showing a selection of trees, cereals, and other anthropogenic indicators according to calibrated age (CE) from 250 BCE to 1150 CE. Pollen types that were multiplied by 10 are indicated with ×10 in the title for each pollen type. Percentages of pollen, spores, and non-pollen palynomorphs outside the pollen sum (X) are based on ΣP+X.
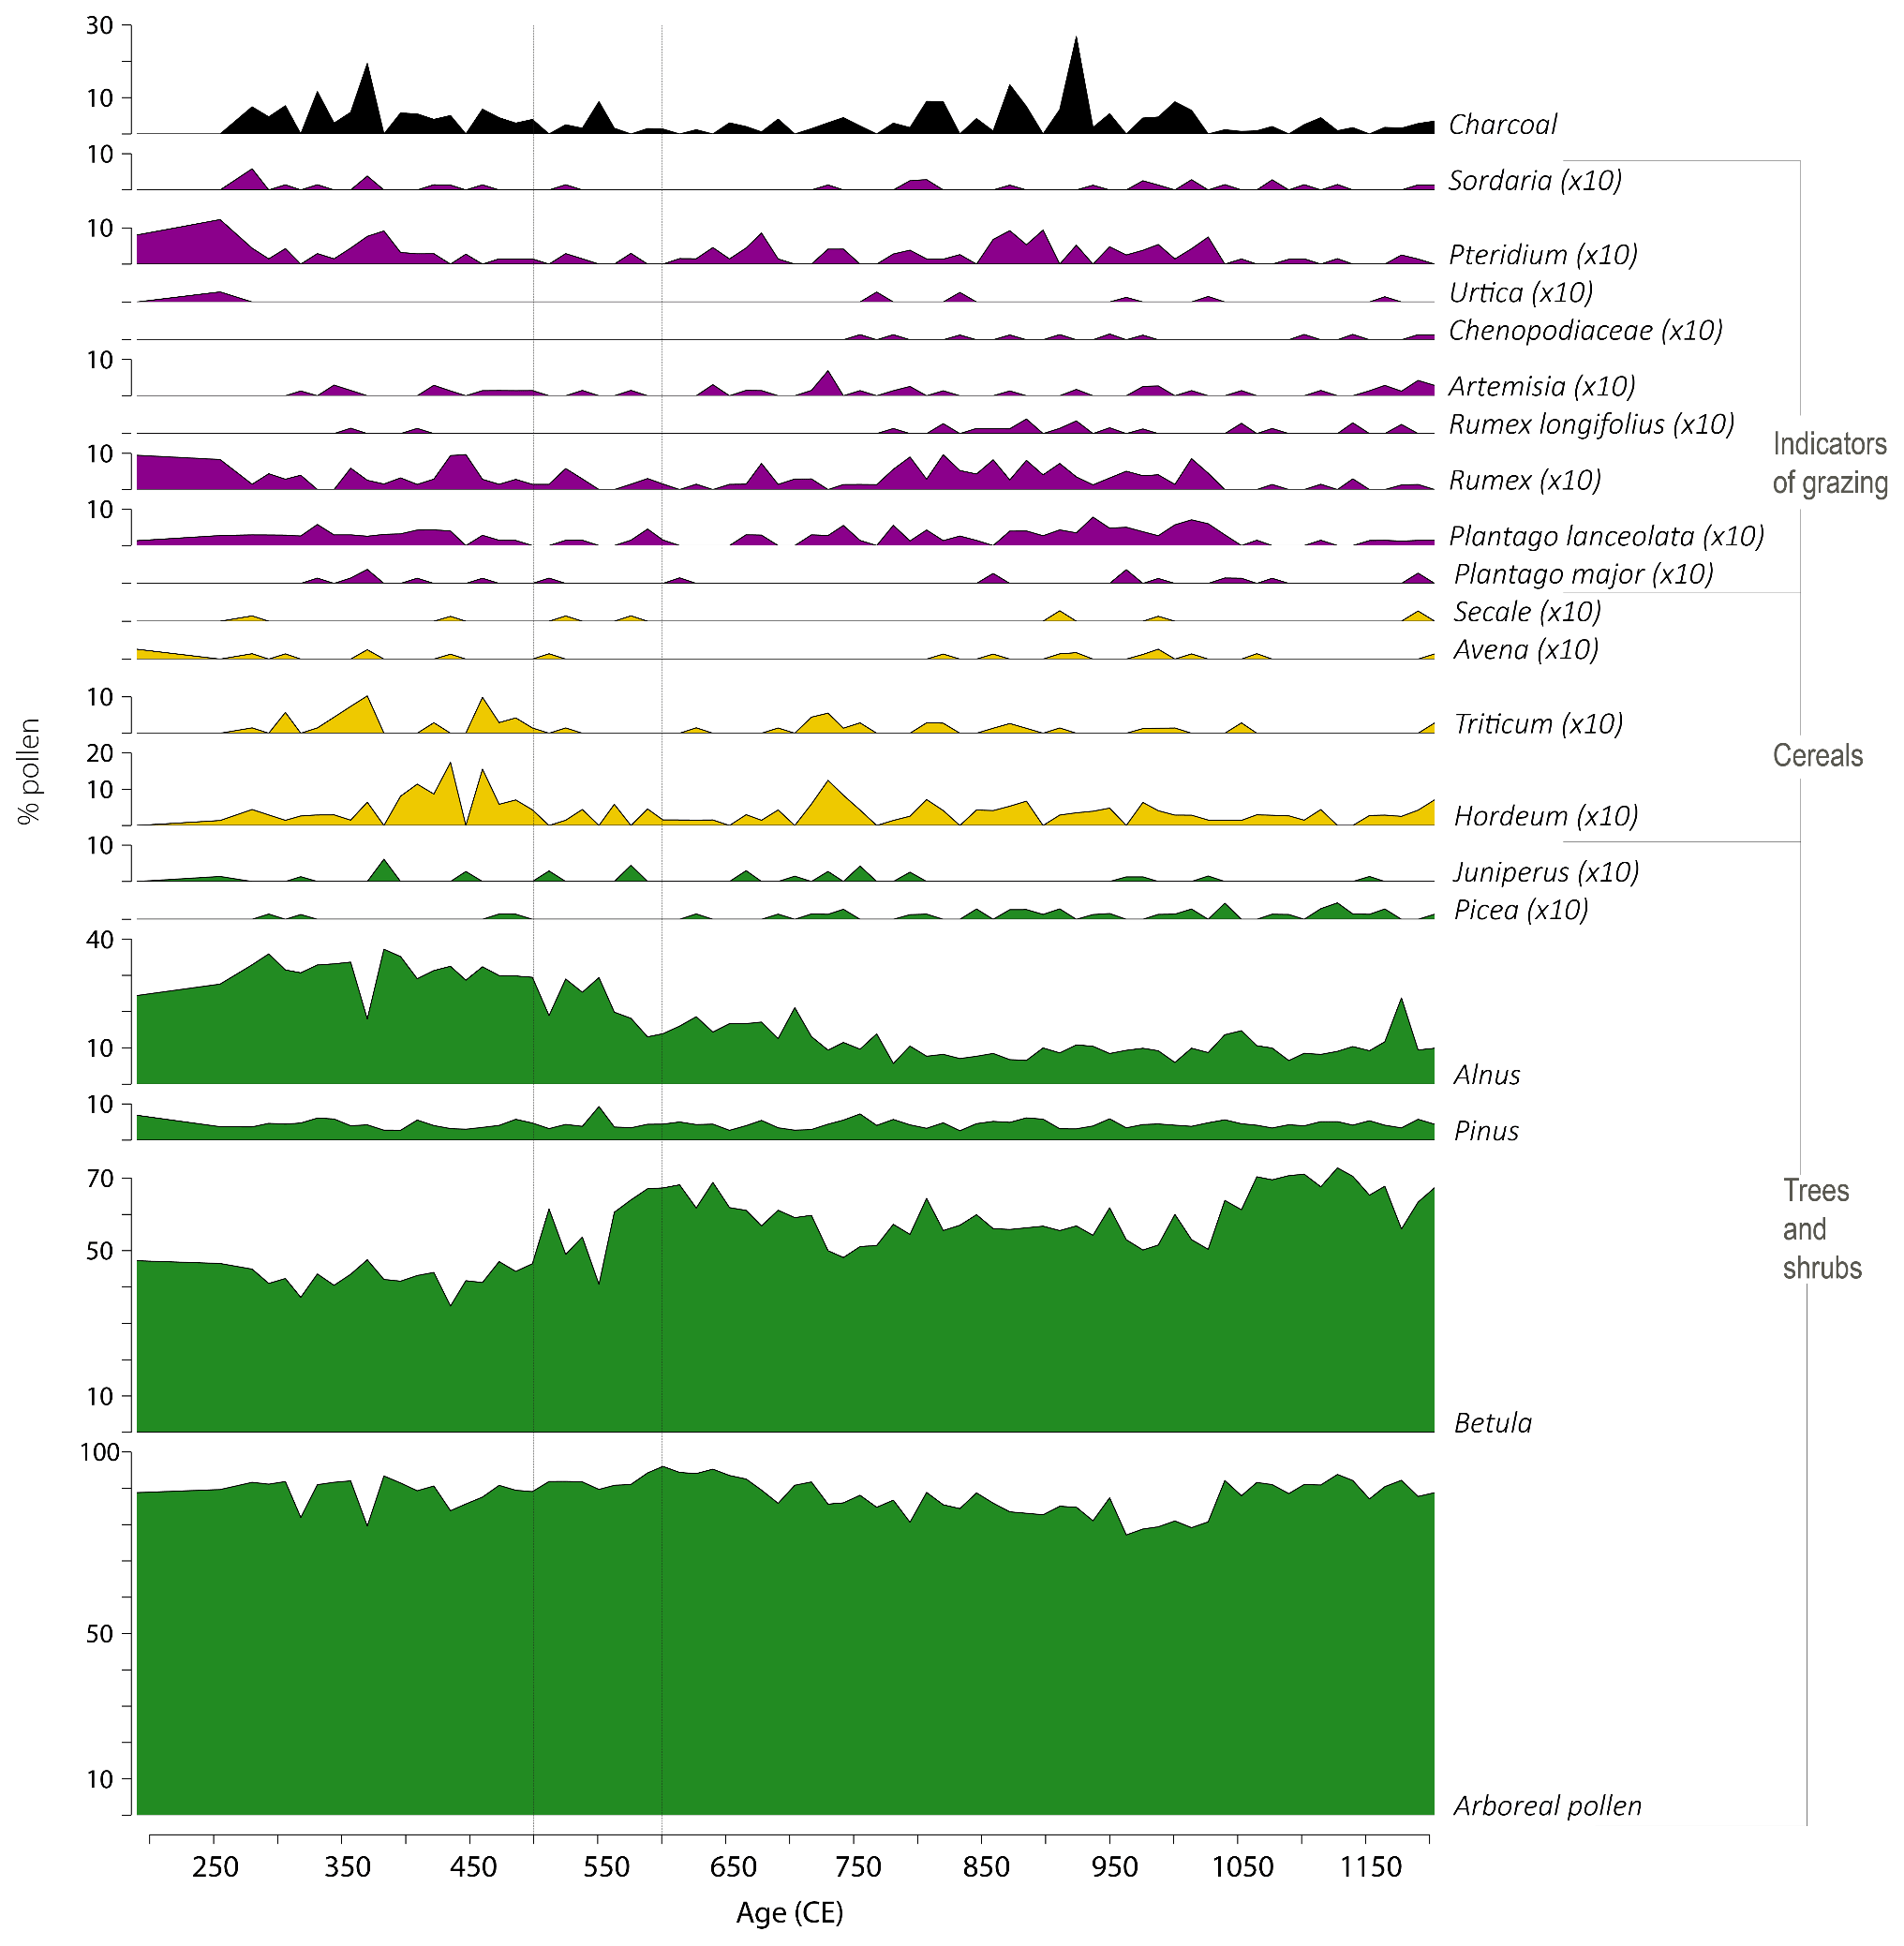
Figure A10Percentage pollen diagram for Åsheimmyr (Forsand area), showing a selection of trees, cereals, and other anthropogenic indicators according to calibrated age (CE) from 250 BCE to 1150 CE. Pollen types that were multiplied by 10 are indicated with ×10 in the title for each pollen type. Percentages of pollen, spores and non-pollen palynomorphs outside the pollen sum (X) are based on ΣP+X.
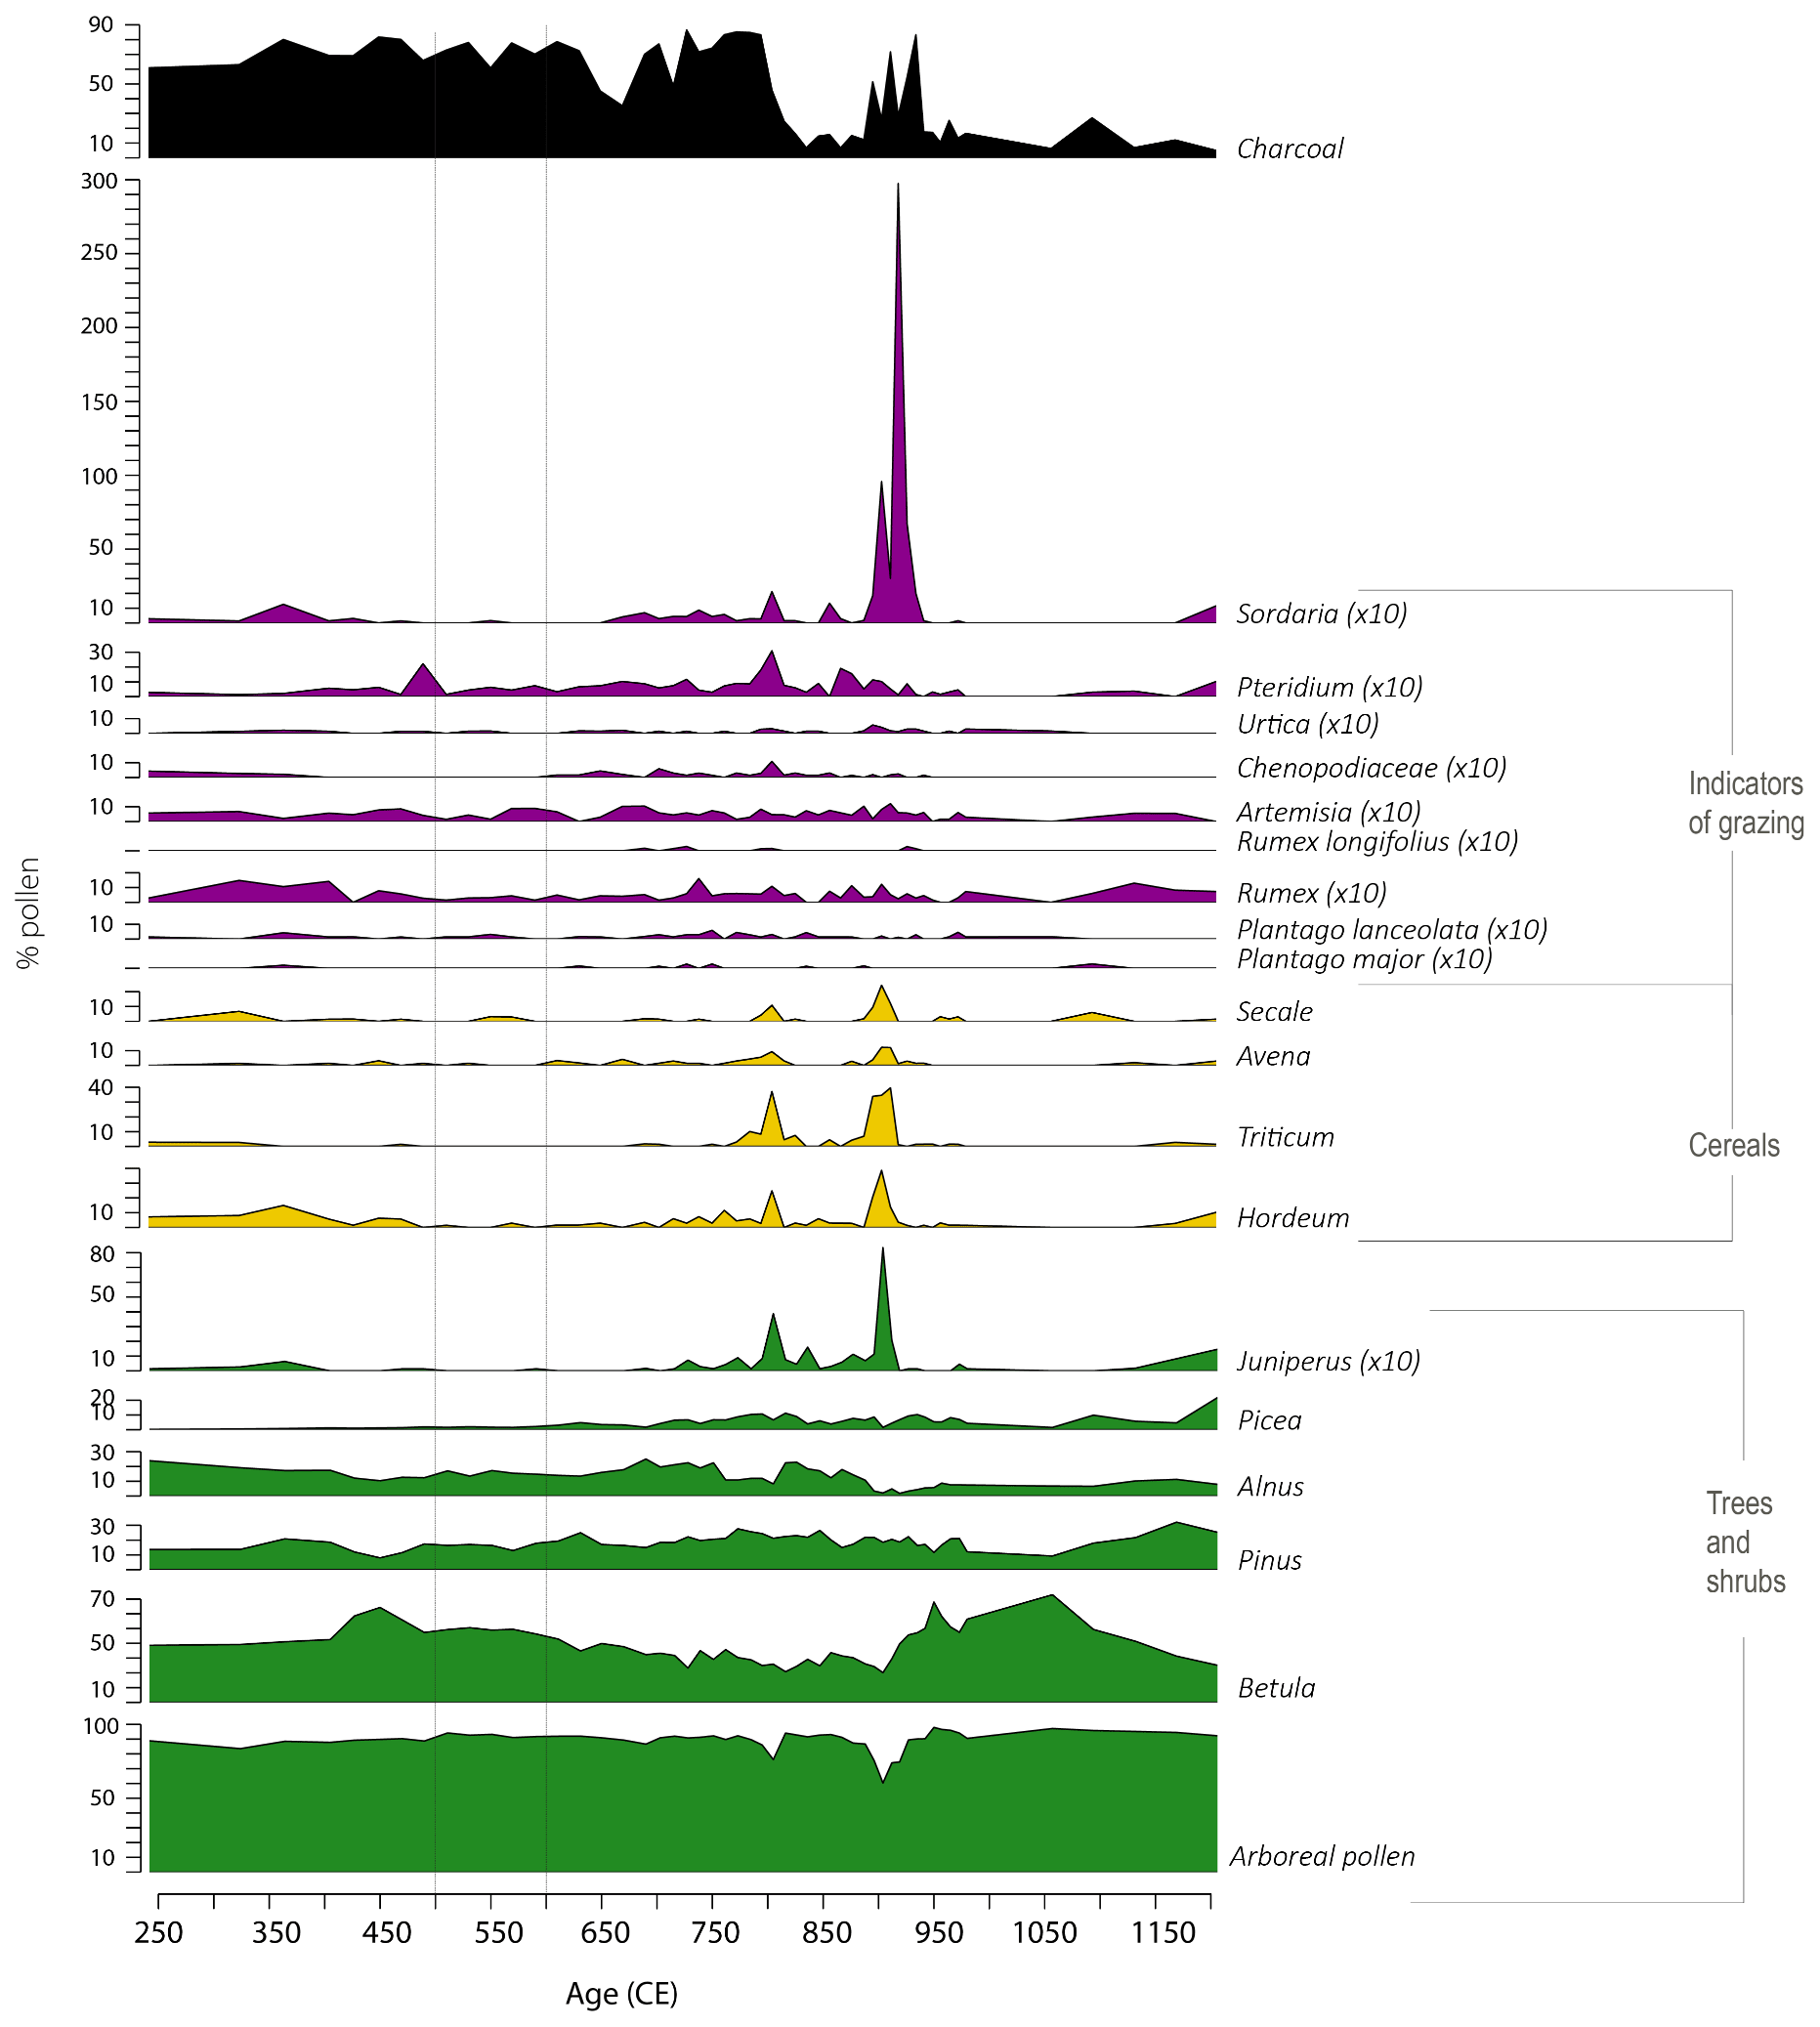
Figure A11Percentage pollen diagram of Haraldstadmyr peat sequence (Sarpsborg area), showing a selection of trees, cereals, and other anthropogenic indicators according to calibrated age (CE) from 250 BCE to 1150 CE. Pollen types that were multiplied by 10 are indicated with ×10 in the title for each pollen type. Percentages of pollen, spores and non-pollen palynomorphs outside the pollen sum (X) are based on ΣP+X.
Table A4Information about the proxies and locations marked in Fig. 9.
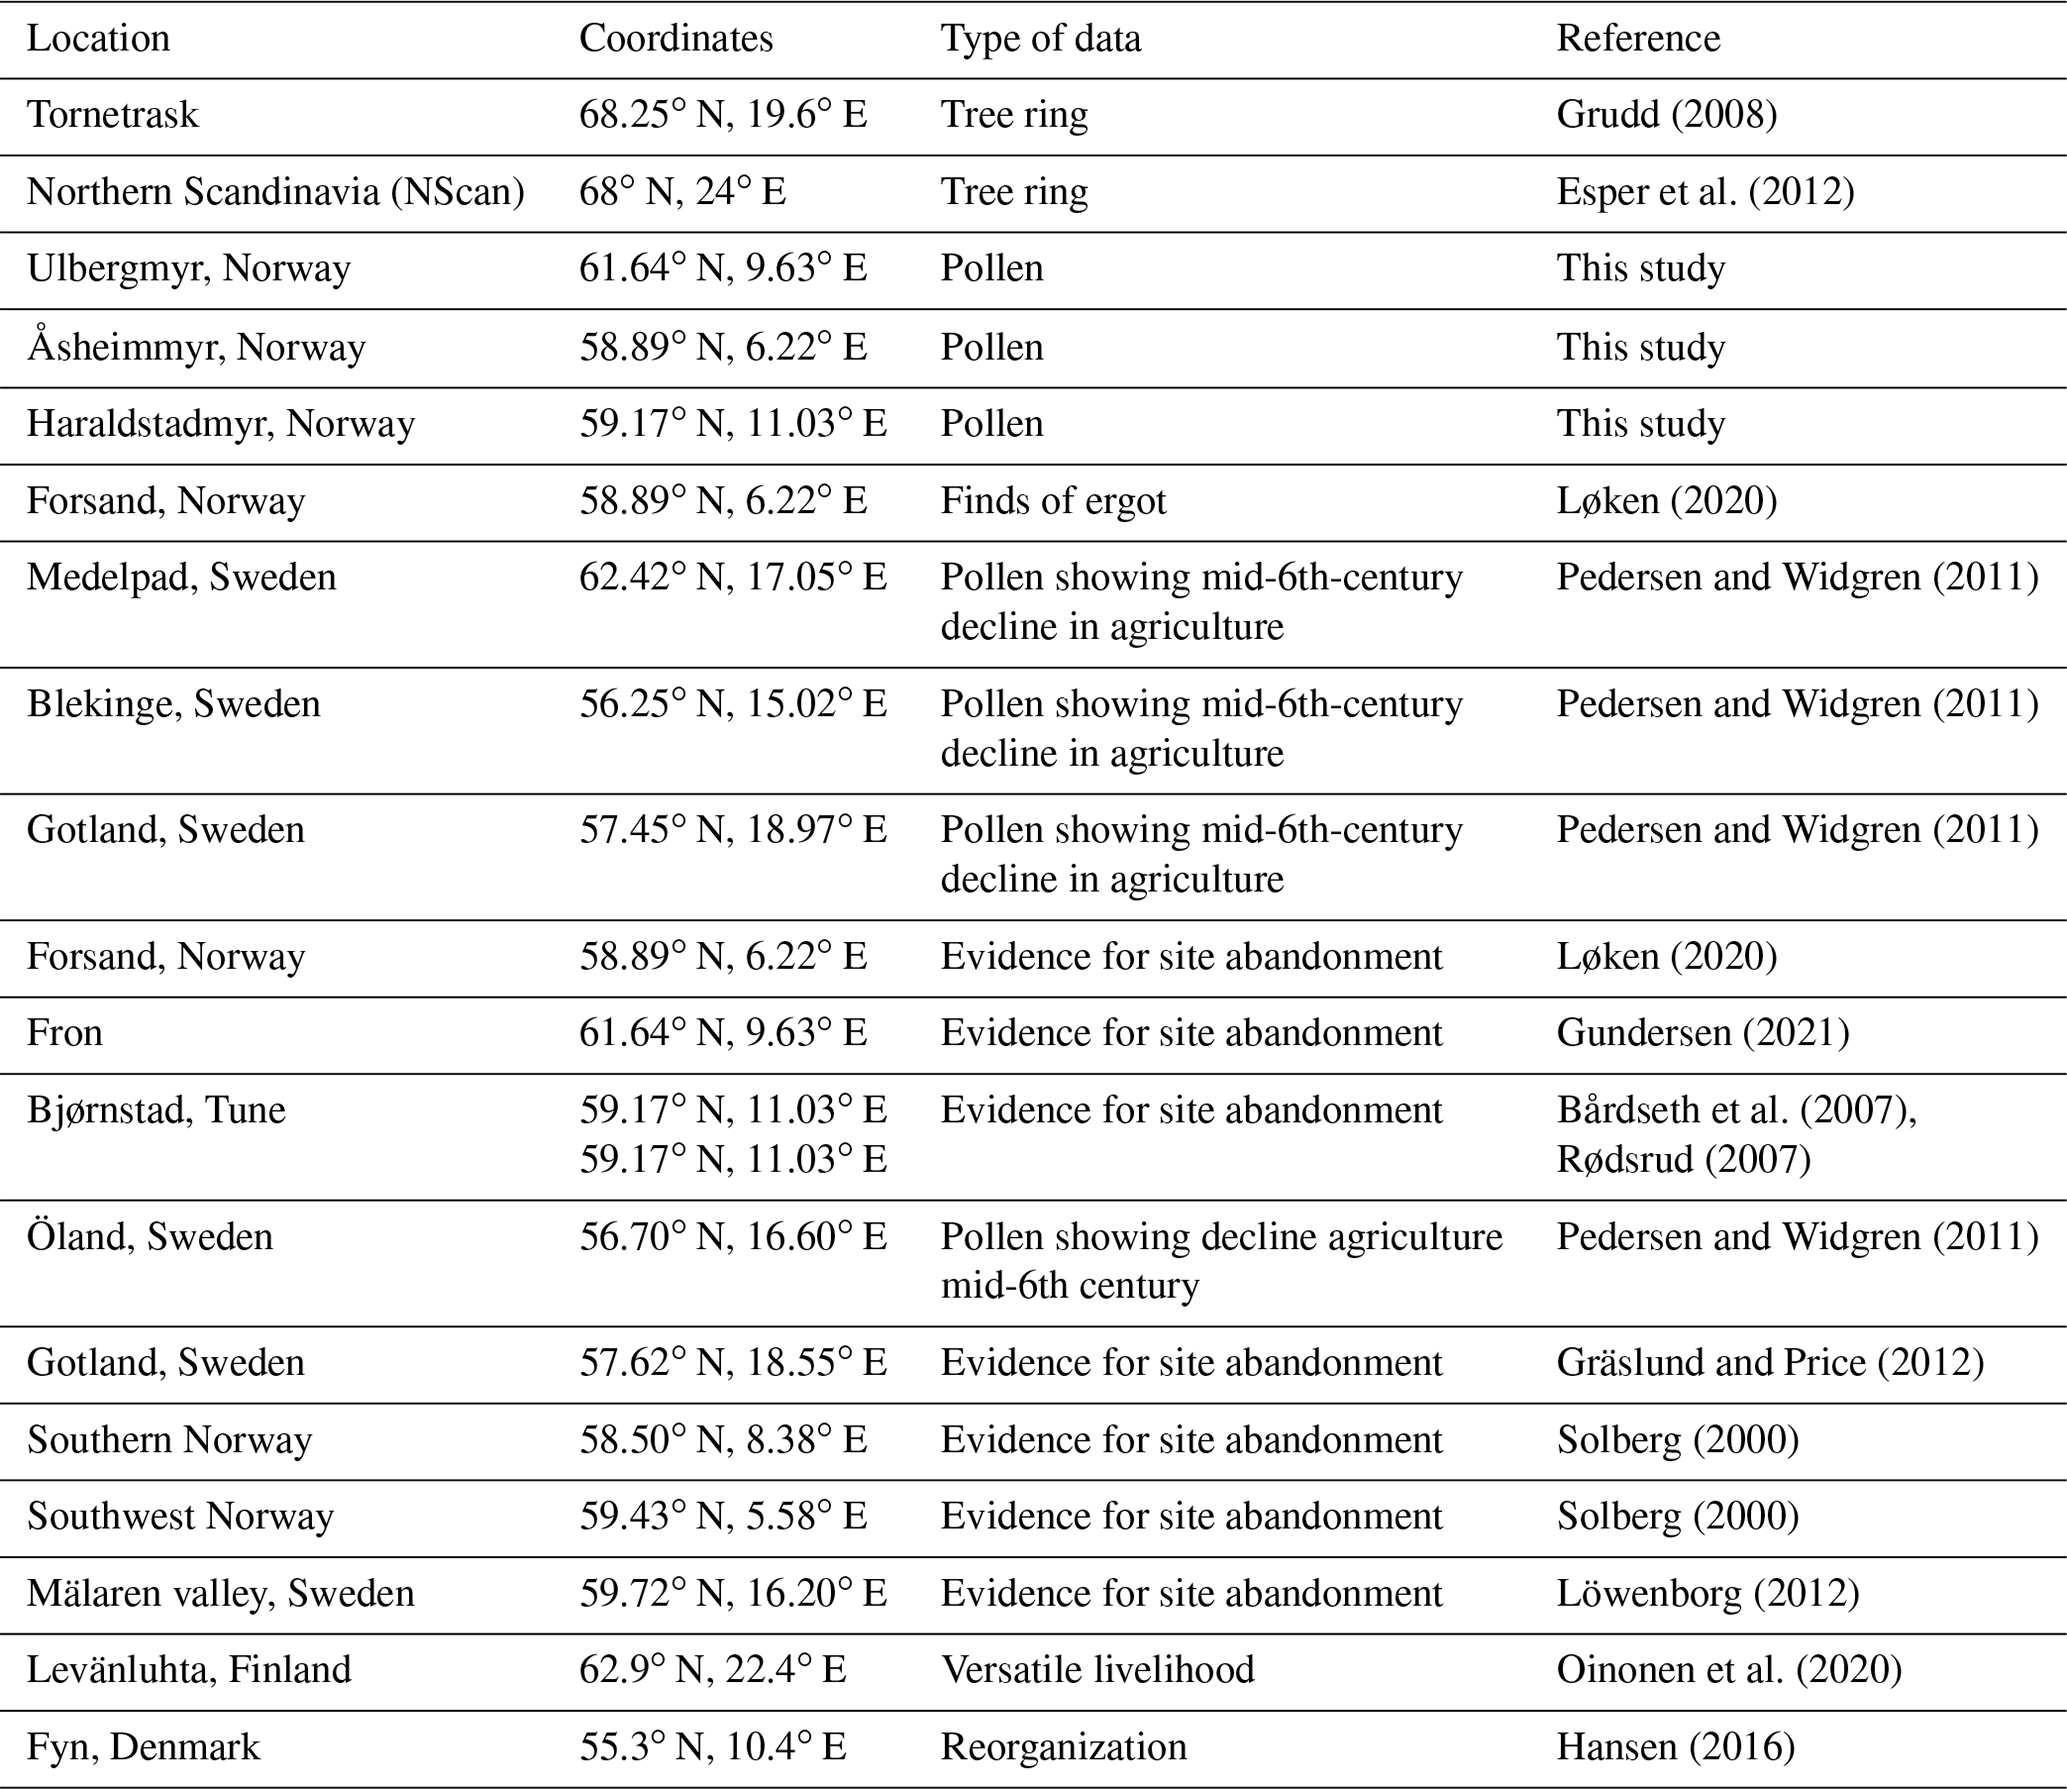
Primary data and scripts used in the analyses and other supplementary information that may be useful in reproducing the author's work are archived and can be obtained by request. Model data are now stored in the NIRD research data archive (https://doi.org/10.11582/2022.00029; Lorenz, 2022). The PMIP4 past2k simulations contribute to CMIP6 and can be retrieved via the Earth System Grid Federation network (ESGF; https://esgf.llnl.gov/, last access:19 January 2023). The GDD model is based on meteorological data from MET Norway, available at https://seklima.met.no/ (last access: 25 July 2022). Numerous Norwegian archeological collections, as well as almost all surveyed archeological sites, are digitized and available online (see https://www.unimus.no/, last access: 28 November 2022, UniMus, 2022, and https://askeladden.ra.no/, last access: 28 November 2022, Askeladden, 2022: login required).
EvD, IMG, and KK conceived the original idea. EvD led the discussion and writing of the article. EvD carried out the climate model runs, processed the data, performed the analysis, and designed the figures for the model and synthesis sections. KK, CT, and JJ contributed to the interpretation of the climate model results. IMG carried out the GDD model calculations and designed the GDD figures. FI and HH cored the bogs. HH carried out the pollen sampling, analysis, counting, and 14C sampling. AdB analyzed and designed the figures for the pollen data and constructed the age–depth models. FI, IMG, and KL created the overview map and analyzed the archeological sites. KK supervised the research project. All authors discussed the results and helped write the manuscript.
The contact author has declared that none of the authors has any competing interests.
Publisher's note: Copernicus Publications remains neutral with regard to jurisdictional claims in published maps and institutional affiliations.
This article is part of the special issue “Interdisciplinary studies of volcanic impacts on climate and society”. It is not associated with a conference.
This paper is dedicated to Frode Iversen, who barely made it to the age of 55 before he had to succumb to cancer on 4 October 2022. From 2007 until his death, Iversen worked at the Museum of Cultural History at the University of Oslo, Norway, first as section manager, then researcher, and from 2013 as professor. From 2018, Ivsersen was a key contributor to the interdisciplinary research project “VIKINGS” (funded by the Research Council Norway/TOPPFORSK), which studies volcanic eruptions and their impacts on climate, environment, and Viking society in the period 500–1250 CE. Iversen was a guiding force in the project and was also genuinely interested in scientific methods across disciplines, as this paper demonstrates. We will miss our fantastic colleague and close friend, especially his enthusiastic and humourful way of teaching us about archaeology and Norwegians.
Computations, analysis, and climate model data storage were performed on the computer of the Deutsches Klimarechenzentrum (DKRZ) and on Sigma2, the National Infrastructure for High Performance Computing and Data Storage in Norway. Claudia Timmreck acknowledges support for this research by the Deutsche Forschungsgemeinschaft Research Unit VolImpact (FOR2820,398006378) within the project VolClim (TI 344/2-1). This work also benefited from participation by some authors in the Past Global Changes Volcanic Impacts on Climate and Society working group. We would like to thank Eirik Ballo and Anneke ter Schure for their help with plotting the pollen diagrams and the discussion of the age models. Thanks to Robert David for checking the English grammar and spelling. Finally, we would like to thank the reviewers and the editor Francis Ludlow for their critical and helpful editorial comments.
This work is funded by the Norwegian Research Council (NRC)/University of Oslo Toppforsk project “VIKINGS” with the grant no. 275191.
This paper was edited by Francis Ludlow and reviewed by Felix Riede and one anonymous referee.
Alm, T. and Elvevåg, B.: Ergotism in Norway. Part 1: The symptoms and their interpretation from the late Iron Age to the seventeenth century, Hist. Psychiatr., 24, 15–33, https://doi.org/10.1177/0957154X11433960, 2013.
Andersson, T.: Altgermanische Ethnika, Namn och Bygd, 97, 5–39, 2009 (in Norwegian).
Askeladden: https://askeladden.ra.no/, last access: 28 November 2022.
Åssveen, M. and Abrahamsen, U.: Varmesum for sorter og arter av korn, Grønn forskning, 2, 55–59, 1999 (in Norwegian).
Axboe, M.: The year 536 and the Scandinavian gold hoards, Mediev. Archaeol., 43, 186–188, 1999.
Axboe, M.: Guld og guder, in: Ragnarok. Odins verden, Torsten Capelle and Christian Fischer (publishers), Silkeborg, 41–56, 2005 (in Norwegian).
Baillie, M. G.: Dendrochronology raises questions about the nature of the AD 536 dust-veil event, The Holocene, 4, 212–217, 1994.
Baillie, M. G.: Proposed re-dating of the European ice core chronology by seven years prior to the 7th century AD, Geophys. Res. Lett., 35, L15813, https://doi.org/10.1029/2008GL034755, 2008.
Bajard, M., Ballo, E., Høeg, H. I., Bakke, J., Støren, E., Loftsgarden, K., Iversen, F., Hagopian, W., Jahren, A. H., Svensen, H. H., and Krüger, K.: Climate adaptation of pre-Viking societies, Quaternary Sci. Rev., 278, 107374, https://doi.org/10.1016/j.quascirev.2022.107374, 2022.
Bårdseth, G. A.: Huset på Store Tune – og nokre betraktningar om førhistoriske hus i Østfold, in: Historien i forhistorien. Festskrift til Einar Østmo på 60-årsdagen, Kulturhistorisk museum, Universitetet i Oslo, Oslo, 273–280, ISBN 82-8084-027-3, 2006 (in Norwegian).
Bårdseth, G. A.: Kulturhistorisk syntese, in: Evaluering – resultat, E6-prosjektet Østfold. Band 5, Kulturhistorisk museum, Fornminneseksjonen, Oslo, 79–104, ISBN 978-82-8084-038-7, 2008 (in Norwegian).
Bårdseth, G. A., Sageider, B. M., and Sandvik, P. U.: Busetjingsspor og mogleg hall frå yngre jarnalder på Bjørnstad søndre (lokalitet 11), in: Hus, gard og graver langs E6 i Sarpsborg kommune. E6-prosjektet Østfold. Band 2, Kulturhistorisk museum, Fornminneseksjonen, Oslo, 71–90, ISBN 978-82-8084-035-6, 2007 (in Norwegian).
Berglund, B. E.: Human impact and climate changes – synchronous events and a causal link?, Quatern. Int., 105, 7–12, 2003.
Berglund, B. E., Birks, H. J. B., Ralska-Jasiewiczowa, M., and Wright, H. E.: Palaeoecological events during the last 15 000 years. Regional Syntheses of Palaeoecological Studies of Lakes and Mires in Europe, Whiley, Chichester, ISBN: 0471958409, 1996 (in Norwegian).
Bjørnstad, Å: Vårt daglege brød: kornets kulturhistorie, 2nd utg. edn., Vidarforlaget, Oslo, ISBN 9788279901303, 2012 (in Norwegian).
Blaauw, M. and Christen, J. A.: Flexible paleoclimate age-depth models using an autoregressive gamma process, Bayesian. Anal., 6, 457–474, 2011.
Bondeson, L. and Bondesson, T.: On the mystery cloud of AD 536, a crisis in dispute and epidemic ergotism: a linking hypothesis, Danish Journal of Archaeology, 3, 61–67, https://doi.org/10.1080/21662282.2014.941176, 2014.
Briffa, K. R., Jones, P. D., Schweingruber, F. H., and Osborn, T. J.: Influence of volcanic eruptions on Northern Hemisphere summer temperature over the past 600 years, Nature, 393, 450–455, 1998.
Brink, S.: Law and society. The Viking World, Routledge, London, 23–31, ISBN 9780415333153, 2008a.
Brink, S.: People and land in early Scandinavia, in: Franks, Northmen, and Slavs: Identities and State Formation in Early Medieval Europe, Cursor Mundi, edited by: Geary, P., Urbanìczyk, P., and Garipzanov, I. H., Brepols, Turnhout, 5, 87–112, 2008b.
Büntgen, U., Tegel, W., Nicolussi, K., McCormick, M., Frank, D., Trouet, V., Kaplan, J. O., Herzig, F., Heussner, K. U., Wanner, H., and Luterbacher, J.: 2500 years of European climate variability and human susceptibility, Science, 331, 578–582, 2011.
Büntgen, U., Myglan, V. S., Ljungqvist, F. C., McCormick, M., Di Cosmo, N., Sigl, M., Jungclaus, J., Wagner, S., Krusic, P. J., Esper, J., and Kaplan, J. O.: Cooling and societal change during the Late Antique Little Ice Age from 536 to around 660 AD, Nat. Geosci., 9, 231–236, 2016.
Carter, T. R.: Changes in the thermal growing season in Nordic countries during the past century and prospects for the future, Agr. Food Sci., 7, 161–179, https://doi.org/10.23986/afsci.72857, 1998.
Cassou, C.: Intraseasonal interaction between the Madden–Julian oscillation and the North Atlantic Oscillation, Nature, 455, 523–527, 2008.
Cook, E. R., Seager, R., Kushnir, Y., Briffa, K. R., Büntgen, U., Frank, D., Krusic, P. J., Tegel, W., van der Schrier, G., Andreu-Hayles, L., and Baillie, M.: Old World megadroughts and pluvials during the Common Era, Science Advances, 1, e1500561, https://doi.org/10.1126/sciadv.1500561, 2015.
Crema, E. R. and Bevan, A.: Inference from large sets of radiocarbon dates: software and methods, Radiocarbon, 63, 23–39, https://doi.org/10.1017/RDC.2020.95, 2020.
Dahl, B., Husvegg, J. R., and Åhrberg, E. S.: Arkeologisk og botanisk undersøkelse av hus i Bergevik. Berge gnr. 37 bnr. 1, Forsand kommune, Rogaland. Oppdragsrapport, unpublished excavation report, Arkeologisk museum, Universitetet i Stavanger, 2017 (in Norwegian).
Damlien, H., Berg-Hanse, I. M., Melheim, L., Mjærum, A., Persson, P., Schülke, A., and Solheim, S.: Steinalderen i Sørøst-Norge. Faglig program for steinalderundersøkelser ved Kulturhistorisk museum, Cappelen Damm akademisk NOASP, Oslo, https://doi.org/10.23865/noasp.141, 2021 (in Norwegian).
de Bode, A.: A pollen-based reconstruction of the paleoenvironment and cultural landscape in Southeastern Norway from the Iron Age to the Middle Ages, Bachelor thesis, Leiden University, https://hdl.handle.net/1887/3209493 (last access: 28 November 2022), 2021.
Degroot, D., Anchukaitis, K., Bauch, M., Burnham, J., Carnegy, F., Cui, J., de Luna, K., Guzowski, P., Hambrecht, G., Huhtamaa, H., and Izdebski, A.: Towards a rigorous understanding of societal responses to climate change, Nature, 591, 539–550, 2021.
Di Cosmo, N., Oppenheimer, C., and Büntgen, U.: Interplay of environmental and socio-political factors in the downfall of the Eastern Türk Empire in 630 CE, Clim. Change, 145, 383–395, 2017.
Driscoll, S., Bozzo, A., Gray, L. J., Robock, A., and Stenchikov, G.: Coupled Model Intercomparison Project 5 (CMIP5) simulations of climate following volcanic eruptions, J. Geophys. Res., 117, D17105, https://doi.org/10.1029/2012JD017607, 2012.
ESGF: https://esgf.llnl.gov/, last access:19 January 2023.
Esper, J., Büntgen, U., Timonen, M., and Frank, D. C.: Variability and extremes of northern Scandinavian summer temperatures over the past two millennia, Global Planet. Change, 88, 1–9, 2012.
Fan, Y., Tjiputra, J., Muri, H., Lombardozzi, D., Park, C. E., Wu, S., and Keith, D.: Solar geoengineering can alleviate climate change pressures on crop yields, Nature Food, 2, 373–381, 2021.
Folland, C. K., Knight, J., Linderholm, H. W., Fereday, D., Ineson, S., and Hurrell, J. W.: The summer North Atlantic Oscillation: past, present, and future, J. Climate, 22, 1082–1103, 2009.
Foss, H.: Beretning fra Statens forsøksstasjon for fjellbygdene 1925, Ottende arbeidsår, Forsøk med rug og hvete i fjellbygdene, Grøndahl & Søns Boktrykkeri, Oslo, 167–187, 1926 (in Norwegian).
Foss, H.: Kornavl i fjellbygder, Cappelen, Oslo, 167–187, 1927 (in Norwegian).
Frøseth, R. B.: Korn, in: Økologisk handbok. Matvekster, edited by: Serikstad, G. L., GAN Forlag, Oslo, 167–187, ISBN 82-492-0648-7, 2004 (in Norwegian).
Goring, S., Dawson, A., Simpson, G. L., Ram, K., Graham, R. W., Grimm, E. C., and Williams, J. W.: neotoma: A Programmatic Interface to the Neotoma Paleoecological Database, Open Quaternary, 1, 2, https://doi.org/10.5334/oq.ab, 2015.
Göthberg, H. (Ed.): Mer än bara hus och gårdar, in: Hus och bebyggelse i Uppland. Delar av förhistorisk sammanhang, Vol. 3, Riksantikvarieämbetet, Uppsala, ISBN 978-91-7209-467-3, 2007 (in Norwegian).
Göthberg, H. and Sundkvist, A.: Järnalderns gårdsmiljöer – tradition och förandring under tusen år, in: At Uppsalum – människor och landskapande. Utbyggnad av Ostkustbanan genom Gamla Uppsala, edited by: Jörpeland, L. B., Göthberg, H., Seiler, A., and Wikborg, J., Arkeologerna, Statens historiska museer, Stockholm, 21–46, ISBN: 9789198390131, 2017 (in Norwegian).
Gräslund, B.: Fimbulvintern, Ragnarök och klimatkrisen år 536-537 e. Kr., Saga och sed. Kungl. Gustav Adolfs Akademiens årsbok, 2007, 93–123, 2007 (in Norwegian).
Gräslund, B. and Price, N.: Twilight of the gods? The “dust veil event” of AD 536 in critical perspective, Antiquity, 86, 428–443, 2012.
Grudd, H.: Torneträsk tree-ring width and density AD 500–2004: a test of climatic sensitivity and a new 1500-year reconstruction of north Fennoscandian summers, Clim. Dynam., 31, 843–857, 2008.
Gundersen, I. M.: Jordbruksbosetninger i dalbunnen. Fellestrekk, in: Gård og utmark i Gudbrandsdalen. Arkeologiske undersøkelser i Fron 2011-2012, Portal forlag, Kristiansand, 121–130, https://doi.org/10.23865/noasp.56, 2016 (in Norwegian).
Gundersen, I. M.: The Fimbulwinter theory and the 6th century crisis in the light of Norwegian archaeology: Towards a human-environmental approach, Primitive tider, 21, 101–119, 2019.
Gundersen, I. M.: Iron Age Vulnerability. The Fimbulwinter hypothesis and the archaeology of the inlands of eastern Norway, PhD monograph, University of Oslo, Oslo, Zenodo [thesis], https://doi.org/10.5281/zenodo.5782896, 2021.
Gundersen, I. M., Rødsrud, C. L., and Post-Melbye, J. R.: Kokegroper som massemateriale. Regional variasjon i en kulturhistorisk brytningstid, in: Ingen vei utenom. Arkeologiske utgravninger i knyttet til etablering av ny riksveg 3 og 25 i Løten og Elverum kommuner, Innlandet, Cappelen Damm Akademisk forlag, Oslo, 187–199, ISBN 978-82-02-67233-1, 2020 (in Norwegian).
Halstead, P.: The economy has a normal surplus: economic stability and social change among early farming communities of Thessaly, Greece, in: Bad Year Economics: Cultural Responses to Risk and Uncertainty, Cambridge University Press, Cambridge, 68–80, https://doi.org/10.1017/CBO9780511521218.006, 1989.
Hansen, J.: Landsbydannelse og bebyggelsesstruktur i 1. årtusinde. En præsentation af et bebyggelseshistorisk regionalstudie, in: Socioekonomisk mångfald. Ritualer och urbanitet, Rapport från projektseminarium för Ostkustbanan (OKB) genom Gamla Uppsala, Statens Historiska Museer, Arkeologerna, Stockholm & Uppsala, 11–26, URN: urn:nbn:se:sh:diva-32057, 2016 (in Norwegian).
Hanssen-Bauer, I., Førland, E. J., Haddeland, I., Hisdal, H., Mayer, S., Nesje, A., and Ådlandsvik, B.: Climate in Norway 2100 – a knowledge base for climate adaptation, Vol. 1/2017, ISSN 2387-3027, 2017.
Harbeck, M., Seifert, L., Hänsch, S., Wagner, D. M., Birdsell, D., Parise, K. L., Wiechmann, I., Grupe, G., Thomas, A., Keim, P., and Zöller, L.: Yersinia pestis DNA from skeletal remains from the 6th century AD reveals insights into Justinianic Plague, PLoS Pathog., 9, e1003349, https://doi.org/10.1371/journal.ppat.1003349, 2013.
Hatlestad, K., Wehlin, J., and Lindholm, K.-J.: Coping with Risk. A Deep-Time Perspective on Societal Responses to Ecological Uncertainty in the River Dalälven Catchment Area in Sweden, Land, 10, 883, https://doi.org/10.3390/land10080883, 2021.
Hegerl, G. C., Crowley, T. J., Hyde, W. T., and Frame, D. J.: Climate sensitivity constrained by temperature reconstructions over the past seven centuries, Nature, 440, 1029–1032, 2006.
Helama, S., Jones, P. D., and Briffa, K. R.: Limited late antique cooling, Nat. Geosci., 10, 242–243, 2017.
Helama, S., Arppe, L., Uusitalo, J., Holopainen, J., Makela, H. M., Makinen, H., and Oinonen, M.: Volcanic dust veils from sixth century tree-ring isotopes linked to reduced irradiance, primary production and human health, Sci. Rep., 8, 1339, https://doi.org/10.1038/s41598-018-19760-w, 2018.
Helama, S., Saranpää, P., Pearson, C. L., Arppe, L., Holopainen, J., Mäkinen, H., Mielikäinen, K., Nöjd, P., Sutinen, R., Taavitsainen, J. P., and Timonen, M.: Frost rings in 1627 BC and AD 536 in subfossil pinewood from Finnish Lapland, Quaternary Sci. Rev., 204, 208–215, 2019.
Hines, J. and IJssennagger, N.: Frisians and Their North Sea Neighbours: From the Fifth Century to the Viking Age, Boydell & Brewer, https://www.jstor.org/stable/10.7722/j.ctt1t6p55t (last access: 28 November 2022), 2017.
Høeg, H. I.: Varia 39: Pollenanalytiske undersøkelser i “Østerdalsområdet” med hovedvekt på Rødsmoen, Åmot i Hedmark, Varia, ISBN 82-7181-134-7, 1996 (in Norwegian).
Høeg, H. I.: Varia 46: Pollenanalytiske undersøkelser på Øvre Romerike, Ullensaker og Nannestad, Akershus kommune, Varia, ISBN 82-7181-144-4, 1997 (in Norwegian).
Høeg, H. I.: Pollenanalytiske undersøkelser i Rogaland og Ersdal i Vest-Agder, in: Museumslandskap. Artikkelsamling til Kerstin Griffin på 60-års-dagen, Vol. AmS-Rapport 12A, 145–225, edited by: Selsing, L. and Lillehammer, G., Arkeologisk museum, Stavanger, ISBN 82-7760-060-7, 1999 (in Norwegian).
Hurrell, J. W.: Decadal trends in the North Atlantic Oscillation: Regional temperatures and precipitation, Science, 269, 676–679, 1995.
Hurrell, J. W., Kushnir, Y., Ottersen, G. and Visbeck, M.: An overview of the North Atlantic oscillation, Geophysical Monograph-American Geophysical Union, 134, 1–36, 2003.
Iles, C. E. and Hegerl, G. C.: The global precipitation response to volcanic eruptions in the CMIP5 models, Environ. Res. Lett., 9, 104012, https://doi.org/10.1088/1748-9326/9/10/104012, 2014.
Iversen, F.: Estate division: Social cohesion in the aftermath of AD 536-7, in: The Agrarian Life of the North 2000 BC AD 1000: Studies in Rural Settlement and Farming in Norway, Portal Academic, Kristiansand, 41–76, ISBN: 978-82-8314-099-6, 2016.
Iversen, F.: Between Tribe and Kingdom: People, land, and law in Scandia AD 500-1350. Rulership in 1st to 14th century Scandinavia royal graves and sites at Avaldsnes and beyond, edited by: Skre, D., De Gruter, Berlin, 245–304, https://doi.org/10.1515/9783110421101, 2019.
Iversen, F.: The Four Petty Kingdoms of Upplond: Equestrian Graves and the Political Integration of the Norwegian Highlands in Late Viking Age Norway, Viking, 84, 13–42, https://doi.org/10.5617/viking.9046, 2021.
Iversen, F. and Brendalsmo, J.: Den tidlige kirkeorganisasjonen i Eidsivatingslagen, Collegium Medievale, 33, 113–162, 2020 (in Norwegian).
Juggins, S.: rioja: Analysis of Quaternary Science Data, R package version 0.9-26, https://cran.r-project.org/package=rioja (last access: 28 November 2022), 2020.
Jungclaus, J. H., Bard, E., Baroni, M., Braconnot, P., Cao, J., Chini, L. P., Egorova, T., Evans, M., González-Rouco, J. F., Goosse, H., Hurtt, G. C., Joos, F., Kaplan, J. O., Khodri, M., Klein Goldewijk, K., Krivova, N., LeGrande, A. N., Lorenz, S. J., Luterbacher, J., Man, W., Maycock, A. C., Meinshausen, M., Moberg, A., Muscheler, R., Nehrbass-Ahles, C., Otto-Bliesner, B. I., Phipps, S. J., Pongratz, J., Rozanov, E., Schmidt, G. A., Schmidt, H., Schmutz, W., Schurer, A., Shapiro, A. I., Sigl, M., Smerdon, J. E., Solanki, S. K., Timmreck, C., Toohey, M., Usoskin, I. G., Wagner, S., Wu, C.-J., Yeo, K. L., Zanchettin, D., Zhang, Q., and Zorita, E.: The PMIP4 contribution to CMIP6 – Part 3: The last millennium, scientific objective, and experimental design for the PMIP4 past1000 simulations, Geosci. Model Dev., 10, 4005–4033, https://doi.org/10.5194/gmd-10-4005-2017, 2017.
Keller, M., Spyrou, M. A., Scheib, C. L., Neumann, G. U., Kröpelin, A., Haas-Gebhard, B., Päffgen, B., Haberstroh, J., Ribera i Lacomba, A., Raynaud, C., and Cessford, C.: Ancient Yersinia pestis genomes from across Western Europe reveal early diversification during the First Pandemic (541–750), P. Natl. Acad. Sci. USA, 116, 12363–12372, 2019.
Kostick, C. and Ludlow, F.: The dating of volcanic events and their impact upon European society, 400–800 CE, Post-Classical Archaeologies, 5, 7–30, 2015.
Larsen, L. B., Vinther, B. M., Briffa, K. R., Melvin, T. M., Clausen, H. B., Jones, P. D., Siggaard-Andersen, M. L., Hammer, C. U., Eronen, M., Grudd, H., and Gunnarson, B. E.: New ice core evidence for a volcanic cause of the AD 536 dust veil, Geophys. Res. Lett., 35, L04708, https://doi.org/10.1029/2007GL032450, 2008.
Little, L. K.: Plague and the end of antiquity: the pandemic of 541–750, Cambridge University Press, ISBN-13 978-0-521-84639-4, 2006.
Ljungkvist, J. and Frölund, P.: Gamla Uppsala–the emergence of a centre and a magnate complex, Journal of Archaeology and Ancient History (JAAH), 16, 1–29, 2015.
Loftsgarden, K.: Mass production and mountain marketplaces in Norway in the Viking and Middle Ages, Mediev. Archaeol., 64, 94–115, 2020.
Loftsgarden, K. and Solheim, S.: Uncovering population dynamics in Southeastearn Norway from 1300 BC to AD 800 using summed radiocarbon probability distributions, in: Complexity and dynamics: Settlement and landscape from the Iron Age and Medieval period in the Nordic Countries. Sidestone Press, in press, 2022.
Løken, T.: Bronze Age and Early Iron Age house and settlement development at Forsandmoen, south-western Norway, Museum of Archaeology, University of Stavanger, Stavanger, ISBN 978-82-7760-190-8, 2020.
Loktu, L. and Gundersen, I. M.: Jernaldergårdene ved Breivegen. Kontinuitet og endring over 300 år, in: Gård og utmark i Gudbrandsdalen. Arkeologiske undersøkelser i Fron 2011-2012, Portal forlag Kristiansand, 145–165, https://doi.org/10.23865/noasp.56, 2016 (in Norwegian).
Lorenz, S.: MPI-ESM 521-680 CE ensemble, Norstore [data set], https://doi.org/10.11582/2022.00029, 2022.
Lowe, J. J., Walker, M., and Walker, M. J. C.: Geomorphological evidence. Reconstructing Quaternary Environments, Routledge, New York, 19–92, ISBN: 9781315797496, 2015.
Löwenborg, D.: An Iron Age shock doctrine: did the AD 536-7 event trigger large-scale social changes in the Mälaren valley area?, Journal of Archaeology and Ancient History (JAAH), 4, 29 pp., 2012.
Ludlow, F., Stine, A. R., Leahy, P., Murphy, E., Mayewski, P. A., Taylor, D., Killen, J., Baillie, M. G., Hennessy, M., and Kiely, G.: Medieval Irish chronicles reveal persistent volcanic forcing of severe winter cold events, 431–1649 CE, Environ. Res. Lett., 8, 024035, https://doi.org/10.1088/1748-9326/8/2/024035, 2013.
Malone, K.: Widsith, Rosenkilde and Bagger, Copenhagen, 1962.
Mauritsen, T., Bader, J., Becker, T., Behrens, J., Bittner, M., Brokopf, R., Brovkin, V., Claussen, M., Crueger, T., Esch, M., and Fast, I.: Developments in the MPI-M Earth System Model version 1.2 (MPI-ESM1.2) and its response to increasing CO2, J. Adv. Model. Earth Sy., 11, 998–1038. 2019.
McCormick, M., Büntgen, U., Cane, M. A., Cook, E. R., Harper, K., Huybers, P., Litt, T., Manning, S. W., Mayewski, P. A., More, A. F., and Nicolussi, K.: Climate change during and after the Roman Empire: reconstructing the past from scientific and historical evidence, J. Interdiscipl. Hist., 43, 169–220, 2012.
McIlveen, J. F. R.: Basic meteorology : a physical outline, Van Nostrand Reinhold, Wokingham & Berkshire, UK, ISBN 0442317697, 1986.
Michelangeli, P. A., Vautard, R., and Legras, B.: Weather regimes: Recurrence and quasi stationarity, J. Atmos. Sci., 52, 1237–1256, 1995.
Miller, G. H., Geirsdóttir, Á., Zhong, Y., Larsen, D. J., Otto-Bliesner, B. L., Holland, M. M., Bailey, D. A., Refsnider, K. A., Lehman, S. J., Southon, J. R., and Anderson, C.: Abrupt onset of the Little Ice Age triggered by volcanism and sustained by sea-ice/ocean feedbacks, Geophys. Res. Lett., 39, L02708, https://doi.org/10.1029/2011GL050168, 2012.
Mordechai, L., Eisenberg, M., Newfield, T. P., Izdebski, A., Kay, J. E., and Poinar, H.: The Justinianic Plague: an inconsequential pandemic?, P. Natl. Acad. Sci. USA, 116, 25546–25554, 2019.
Munch, P. A.: Historisk-geographisk beskrivelse over kongeriget Norge (Noregsveldi) i middelalderen, Wilhelm Grams Forlag, 1849 (in Norwegian).
Myhre, B.: Landbruk, landskap og samfunn 4000 f.Kr.-800 e.Kr, in: Jorda blir levevei: 4000 f.Kr.-1350 e.Kr, edited by: Myhre, B. and Øye, I., Samlaget, Oslo, 11–213, ISBN 825215584, 2002 (in Norwegian).
Näsman, U.: Jernalderens driftsformer i arkæologisk belysning, in: Danske landbrukslandskaper gennem 2000 år, Fra digevoldinger til støtteordninger, edited by: Odgaard, B. and Rømer, J. R., Aarhus Universitetsforlag, Århus, 99–116, 2009 (in Norwegian).
Neidorf, L.: The Dating of Widsith and the Study of Germanic Antiquity, Neophilologus, 97, 165–183, 2013.
Nesje, A., Gundersen, I. M., and Cannell, R.: Flommer og flomskred i Gudbrandsdalen i et værmessig og klimatisk perspektiv, in: Gundersen, I. M., Gård og utmark i Gudbrandsdalen. Arkeologiske undersøkelser i Fron 2011-2012, Portal forlag, Kristiansand, 80–93, https://doi.org/10.23865/noasp.56, 2016 (in Norwegian).
Nielsen, K. H.: “... the sun was darkened by day and the moon by night ... there was distress among men ...” - on social and political development in the 5th- to 7th-century southern Scandinavia, in: Neue Forschungsergebnisse zur nordwesteuropäischen Frühgeschichte unter besonderer Berücksichtigung der altsächsischen Kultur im heutigen Niedersachsen, Isensee Verlag, Oldenburg, 247–285, ISBN 3899952286, 2005.
Nielsen, K. H.: Abundant Gold and Bad Harvests: Changes in Southern Scandinavian Society during the 5th to 7th Centuries, in: Transformatio mundi. The transition from the late migration period to the early Viking age in the east Baltic, Kaunas University of Technology, Department of Philosophy and Cultural Science, Kaunas, 41–50, ISBN 9789955982715, 2006.
Odgaard, B. and Nielsen, A. B.: Udvikling i arealdækning i perioden 0-1850: Pollen og landskabshistorie, in: Danske landbrukslandskaper gennem 2000 år: Fra digevoldinger til støtteordninger, Aarhus Universitetsforlag, Århus, 41–58, ISBN: 9788779344204, 2009 (in Norwegian).
Oinonen, M., Alenius, T., Arppe, L., Bocherens, H., Etu-Sihvola, H., Helama, S., Huhtamaa, H., Lahtinen, M., Mannermaa, K., Onkamo, P., and Palo, J.: Buried in water, burdened by nature – Resilience carried the Iron Age people through Fimbulvinter, PLoS ONE, 15, e0231787, https://doi.org/10.1371/journal.pone.0231787, 2020.
O'Shea, J. and Halstead, P.: Conclusion: bad year economics, in: Bad Year Economics: Cultural Responses to Risk and Uncertainty, Cambridge University Press, Cambridge, 123–126, https://doi.org/10.1017/CBO9780511521218.012, 1989.
Pedersen, E. A. and Widgren, M.: Agriculture in Sweden: 800 BC-AD 1000, in: The Agrarian history of Sweden : 4000 BC to AD 2000, edited by: Myrdal, J. and Morell, M., Nordic Academic Press, Lund, 46–71, 2011.
Procopius: History of the Wars, Volume III, translated by: Dewing, H. B., Loeb Classical Library, Harvard University Press, 1919.
Puschmann, O.: Nasjonalt referansesystem for landskap. Beskrivelse av Norges 45 landskapsregioner, NIJOS rapport 10/2005, Ås, ISBN 82-7464-355-0, 2005 (in Norwegian).
Rampino, M. R., Self, S., and Stothers, R. B.: Volcanic winters, Annu. Rev. Earth Pl. Sc., 16, 73–99, 1988.
Ranheden, H.: Vegetationsförendringar, in: Land och samhälle i förändring, Uppländska bygder i ett långtidsperspektiv, Vol. 4, 17–118, edited by: Hjärthner-Holdar, E., Ranheden, H., and Seiler, A., Riksantikvarieämbetet, Upplandsmuseet, Societas Archaeologica Upsaliensis, Uppsala, ISBN 9789172094789, 2007 (in Norwegian).
R Core Team: R: A language and environment for statistical computing, R Foundation for Statistical Computing, Vienna, Austria, https://www.R-project.org/, last access: 28 November 2022.
Reimer, P. J., Austin, W. E., Bard, E., Bayliss, A., Blackwell, P. G., Ramsey, C. B., Butzin, M., Cheng, H., Edwards, R. L., Friedrich, M., and Grootes, P. M.: The IntCal20 Northern Hemisphere radiocarbon age calibration curve (0–55 cal kBP), Radiocarbon, 62, 725–757, 2020.
Robock, A.: Volcanic eruptions and climate, Rev. Geophys., 38, 191–219, 2000.
Rødsrud, C. L.: Graver og bosetningsspor på Bjørnstad (lokalitet 44), in: Hus, gard og graver langs E6 i Sarpsborg kommune, edited by: Bårdseth, G. A., Kulturhistorisk museum, Fornminneseksjonen, Oslo, E6-prosjektet Østfold, Band 2, 91–183, ISBN 9788280840356, 2007 (in Norwegian).
Rosen, W.: Justinian's flea: plague, empire and the birth of Europe, Random House, ISBN 978 0224 07369 1, 2006.
Sigl, M., McConnell, J. R., Layman, L., Maselli, O., McGwire, K., Pasteris, D., Dahl-Jensen, D., Steffensen, J. P., Vinther, B., Edwards, R., and Mulvaney, R.: A new bipolar ice core record of volcanism from WAIS Divide and NEEM and implications for climate forcing of the last 2000 years, J. Geophys. Res.-Atmos., 118, 1151–1169, 2013.
Sigl, M., Winstrup, M., McConnell, J. R., Welten, K. C., Plunkett, G., Ludlow, F., Büntgen, U., Caffee, M., Chellman, N., Dahl-Jensen, D., and Fischer, H.: Timing and climate forcing of volcanic eruptions for the past 2,500 years, Nature, 523, 543–549, 2015.
Skre, D.: Rulership and Ruler's Sites in 1st–10th-century Scandinavia. Rulership in 1st to 14th century Scandinavia royal graves and sites at Avaldsnes and beyond, edited by: Skre, D., De Gruter, Berlin, 193–243, https://doi.org/10.1515/9783110421101, 2019.
Solberg, B.: Jernalderen i Norge: ca. 500 f. Kr.-1030 e.Kr, Cappelen akademisk forlag, ISBN 9788202231781, 2000 (in Norwegian).
Stamnes, A. A.: Effect of temperature change on Iron Age cereal production and settlement patterns in Mid-Norway, in: The Agrarian Life of the North 2000 BC AD 1000: Studies in Rural Settlement and Farming in Norway, Portal Academic, Kristiansand, 27–40, ISBN: 978-82-8314-099-6, 2016.
Stenchikov, G., Robock, A., Ramaswamy, V., Schwarzkopf, M. D., Hamilton, K., and Ramachandran, S.: Arctic Oscillation response to the 1991 Mount Pinatubo eruption: Effects of volcanic aerosols and ozone depletion, J. Geophys. Res., 107, 4803, https://doi.org/10.1029/2002JD002090, 2002.
Stothers, R. B.: Mystery cloud of AD 536, Nature, 307, 344–345, 1984.
Stothers, R. B. and Rampino, M. R.: Volcanic eruptions in the Mediterranean before AD 630 from written and archaeological sources, J. Geophys. Res., 88, 6357–6371, 1983.
Strand, E.: Korn og korndyrking, Landbruksforlaget, Oslo, ISBN 8252910270, 1984 (in Norwegian).
TeBrake, W. H.: Ecology and economy in early medieval Frisia, Viator, 9, 1–30, 1978.
Tedesco, P. S.: Joint modeling of low temperature and low wind speed events over Europe conditioned on winter weather regimes, Master thesis, University of Oslo, http://urn.nb.no/URN:NBN:no-84856 (last access: 28 November 2022), 2020.
Tejedor, E., Steiger, N. J., Smerdon, J. E., Serrano-Notivoli, R., and Vuille, M.: Global hydroclimatic response to tropical volcanic eruptions over the last millennium, P. Natl. Acad. Sci. USA, 118, e2019145118, https://doi.org/10.1073/pnas.2019145118, 2021.
ter Schure, A. T. M., Bajard, M., Loftsgarden, K., Høeg, H. I., Ballo, E., Bakke, J., Støren, E. W. N., Iversen, F., Kool, A., Brysting, A. K., and Krüger, K.: Anthropogenic and environmental drivers of vegetation change in southeastern Norway during the Holocene, Quaternary Sci. Rev., 270, 107175, https://doi.org/10.1016/j.quascirev.2021.107175, 2021.
Toohey, M. and Sigl, M.: Volcanic stratospheric sulfur injections and aerosol optical depth from 500 BCE to 1900 CE, Earth Syst. Sci. Data, 9, 809–831, https://doi.org/10.5194/essd-9-809-2017, 2017.
Toohey, M., Krüger, K., Sigl, M., Stordal, F., and Svensen, H.: Climatic and societal impacts of a volcanic double event at the dawn of the Middle Ages, Clim. Change, 136, 401–412, 2016.
Tvauri, A.: The impact of the climate catastrophe of 536–537 AD in Estonia and neighbouring areas, Eesti Arheoloogia Ajakiri, 18, 30–56, 2014.
UniMus: Resources, API documentation and links, MUSIT – the Norwegian University museum database initiative, https://www.unimus.no/, last access: 28 November 2022.
van Dijk, E., Jungclaus, J., Lorenz, S., Timmreck, C., and Krüger, K.: Was there a volcanic-induced long-lasting cooling over the Northern Hemisphere in the mid-6th–7th century?, Clim. Past, 18, 1601–1623, https://doi.org/10.5194/cp-18-1601-2022, 2022.
Van Loon, H. and Rogers, J. C.: The seesaw in winter temperatures between Greenland and northern Europe. Part I: General description, Mon. Weather Rev., 106, 296–310, 1978.
Vautard, R.: Multiple weather regimes over the North Atlantic: Analysis of precursors and successors, Mon. Weather Rev., 118, 2056–2081, 1990.
Verhulst, A.: The carolingian economy, Cambridge University Press, https://doi.org/10.1017/CBO9780511817083, 2002.
Villumsen, T.: Jernaldergården på Grytting. Gårdsbosættelse i 500 år i romertid og folkevandringstid, in: Gård og utmark i Gudbrandsdalen: arkeologiske undersøkelser i Fron 2011-2012, Portal forlag, Kristiansand, 166–180, 2016 (in Norwegian).
Wagner, D. M., Klunk, J., Harbeck, M., Devault, A., Waglechner, N., Sahl, J. W., Enk, J., Birdsell, D. N., Kuch, M., Lumibao, C., and Poinar, D.: Yersinia pestis and the Plague of Justinian 541–543 AD: a genomic analysis, Lancet Infect. Dis., 14, 319–326, 2014.
Welinder, S.: Prehistoric agriculture in Eastern Middle Sweden: a model for food production, population growth, agricultural innovations, and ecological limitations in prehistoric Eastern Middle Sweden 4000 BC-AD 1000, No. 4, LiberLäromedel/Gleerup, ISBN 9783774905276, 1975.
Westling, S. and Jensen, C. E.: Indications of rye (Secale cereale) cultivation from 7th century south-western Norway, in: Archaeobotanical studies of past plant cultivation in northern Europe, Barkhuis Publishing, Groningen, 83–100, ISBN 9789493194113, 2020.
Westling, S., Fredh, E. D., Lagerås, P., and Oma, K. A.: Agricultural Resilience during the 6th Century Crisis: Exploring Strategies and Adaptations Using Plant-Macrofossil Data from Hove-Sørbø and Forsandmoen in Southwestern Norway, Nor. Archaeol. Rev., 55, 38–63, https://doi.org/10.1080/00293652.2022.2071331, 2022.
Wickham, H.: ggplot2: elegant graphics for data analysis, Springer, ISSN: 2197-5736, 2016.
Wickham, H., Averick, M., Bryan, J., Chang, W., McGowan, L. D. A., François, R., Grolemund, G., Hayes, A., Henry, L., Hester, J., and Kuhn, M.: Welcome to the Tidyverse, Journal of Open Source Software, 4, 1686, https://doi.org/10.21105/joss.01686, 2019.
Wieckowska-Lüth, M., Kirleis, W., and Doerfler, W.: Holocene history of landscape development in the catchment of Lake Skogstjern, southeastern Norway, based on a high-resolution multi-proxy record, The Holocene, 27, 1928–1947, 2017.
Zambri, B., LeGrande, A. N., Robock, A., and Slawinska, J.: Northern Hemisphere winter warming and summer monsoon reduction after volcanic eruptions over the last millennium, J. Geophys. Res.-Atmos., 122, 7971–7989, 2017.
Zambri, B., Robock, A., Mills, M. J., and Schmidt, A.: Modeling the 1783–1784 Laki eruption in Iceland: 2. Climate impacts, J. Geophys. Res.-Atmos., 124, 6770–6790. 2019.
Zhong, Y., Miller, G. H., Otto-Bliesner, B. L., Holland, M. M., Bailey, D. A., Schneider, D. P., and Geirsdottir, A.: Centennial-scale climate change from decadally-paced explosive volcanism: a coupled sea ice-ocean mechanism, Clim. Dynam., 37, 2373–2387, 2011.