the Creative Commons Attribution 4.0 License.
the Creative Commons Attribution 4.0 License.
 | 05 Sep 2023
Carbon isotope chemostratigraphy, geochemistry, and biostratigraphy of the Paleocene–Eocene Thermal Maximum, deepwater Wilcox Group, Gulf of Mexico (USA)
Eugene Szymanski
Rebecca A. Hackworth
Alicia C. M. Kahn
Lawrence A. Febo
Jordan Oefinger
Gunnar M. Gregory
The Paleocene–Eocene Thermal Maximum (PETM) represents the most pronounced hyperthermal of the Cenozoic era and is hypothesized to have resulted in an intensification of the paleohydrologic cycle, including enhanced seasonality and increased sediment discharge to the coastal ocean. Although the PETM has been widely documented, there are few records from deposits that form the distal, deepwater components of large sediment-routing systems. This study presents new constraints on the stratigraphic placement of the PETM in the deepwater Gulf of Mexico basin through analysis of geochemical, carbon isotopic, and biostratigraphic data within a ∼124 m cored interval of the Wilcox Group. Biostratigraphic and carbon isotopic data indicate that the PETM extends over ∼13 m based on acmes in the dinoflagellate Apectodinium homomorphum and calcareous nannoplankton Rhomboaster cuspis as well as a ‰ shift in bulk organic δ13C values. A decrease in bioturbation and benthic foraminifera suggests that a reduction in oxygen of Gulf of Mexico bottom waters and/or an increase in sedimentation rates were coincident with the onset of the PETM. A ∼2 m lag in the depositional record separates the onset of the PETM negative carbon isotope excursion (CIE) and deposition of a 5.7 m thick interval of organic-lean claystone and marlstone that reflects a shut-off of the supply of sand, silt, and terrestrial palynomorphs to the basin.
We interpret deposits of the PETM in the deepwater Gulf of Mexico to reflect the combined effects of increased erosional denudation and rising sea level that resulted in sequestration of sand and silt near the coastline but that allowed delivery of terrigenous mud to the deep sea. The similarity of oceanographic changes observed in the Gulf of Mexico and Atlantic Ocean during the PETM supports the inference that these water masses were connected during latest Paleocene–earliest Eocene times. Although deposition of typical Wilcox Group facies resumed during and after the PETM recovery, an increased influx of terrestrial detritus (i.e., pollen, spores, terrestrial organic debris) relative to marine dinoflagellates is suggestive of long-lasting effects of the PETM. This study illustrates the profound and prolonged effects of climatic warming on even the most distal reaches of large ( km2) sediment-routing systems.
- Article
(14639 KB) - Full-text XML
-
Supplement
(1075 KB) - BibTeX
- EndNote


The ∼56 Ma Paleocene–Eocene Thermal Maximum (PETM) represents the most pronounced episode of global warming of the Cenozoic era, with surface temperatures increasing 5–9 ∘C in likely just a few thousand years (Foster et al., 2018; Turner, 2018). Although proxy data suggest a complex and nonuniform climatic response globally, numerous studies have shown that the PETM was associated with profound changes to Earth's hydrologic and sediment-routing systems, including enhanced precipitation and seasonality as well as an associated increase in the caliber and quantity of terrestrial sediment discharged to the coastal ocean (Carmichael et al., 2017, and references within). The PETM is also associated with changes in the global ocean that include rising sea level (Sluijs et al., 2008b), decreasing seafloor oxygen (particularly on continental shelves and slopes; Carmichael et al., 2017), acidification (Penman et al., 2014; Gutjahr et al., 2017), and major ecological shifts (Aubry, 1998; Sluijs et al., 2008a; Carmichael et al., 2017). The PETM likely represents the closest deep-time analog to ongoing and future anthropogenic climate changes (Zeebe and Zachos, 2013; Foster et al., 2018), prompting extensive study since its discovery (Kennett and Stott, 1991).
The global extent, rapid onset, and magnitude of the PETM make this hyperthermal a particularly useful natural case study to examine how changing climatic boundary conditions cause measurable changes in sedimentary parameters through time (i.e., environmental signals; Tofelde et al., 2021) within sediment-routing systems. Past research has demonstrated multiple PETM-related signals, including increased rates of siliciclastic sediment production, transport, and deposition (Giusberti et al., 2007; John et al., 2008; Foreman et al., 2012; Pujalte et al., 2015, 2016); changing sediment mineralogy, including an increase in kaolinite content (Schmitz and Pujalte, 2003; John et al., 2012); and an increase in chemical weathering as inferred from bulk sediment and isotopic weathering proxies (Ravizza et al., 2001; Wieczorek et al., 2013).

Figure 1Compilation of PETM localities by dominant sediment source type (terrigenous vs. non-terrigenous) and thickness of the PETM CIE. Numbers correspond to site ID (Table S1). Symbols are plotted in order of CIE thickness such that thicker PETM sections plot on top of thinner ones. CIE thicknesses for Gulf of Mexico sections other than the Logan-1 and Anchor 3 wells are based on biostratigraphic data (Cunningham et al., 2022). The global paleogeographic reconstruction is after Scotese (2016).
Although numerous PETM localities have been identified in terrestrial and marine settings, there is a notable lack of documented localities within the distal, deepwater portions of large sediment-routing systems (Fig. 1; McInerney and Wing, 2011; Carmichael et al., 2017). Ocean drilling programs have identified multiple non-terrigenous, open-ocean PETM sections with carbon isotope excursion (CIE) thicknesses that range from ∼ 0.1–2.5 m but have not yet targeted the PETM within the thick, often sand-rich deposits associated with deep-sea fans (Fig. 1; Table S1). Past research has suggested that large sediment-routing systems are likely to buffer pulses of sediment flux if forcing periodicity is less than the timescales over which the upstream river system adjusts to changes in boundary conditions (Paola, 1992; Castelltort and van der Dressche, 2003; Jerolmack and Paola, 2010). For example, Armitage et al. (2013) conducted a numerical experiment that predicted Milankovitch-period cyclicity (20–400 kyr) to be dampened in most of the world's largest rivers, which have equilibrium timescales on the order of 104–106 years (Castelltort and van der Dressche, 2003). However, several field studies have demonstrated transmission of climate-driven signals within large deep-sea fans, including changing sediment provenance and sediment flux (Goodbred, 2003; Hessler et al., 2018; Mason et al., 2019; Sømme et al., 2023; Vimpere et al., 2023). Tofelde et al. (2021) suggested that this apparent contradiction may be related to differences in what is meant by a “signal” and the fact that a measurable change in each signal may occur well before the upstream landscape equilibrates. Regardless, identification of the PETM within a large deep-sea fan would likely provide a valuable, integrated perspective on the sediment-routing system response to abrupt climate-related changes.
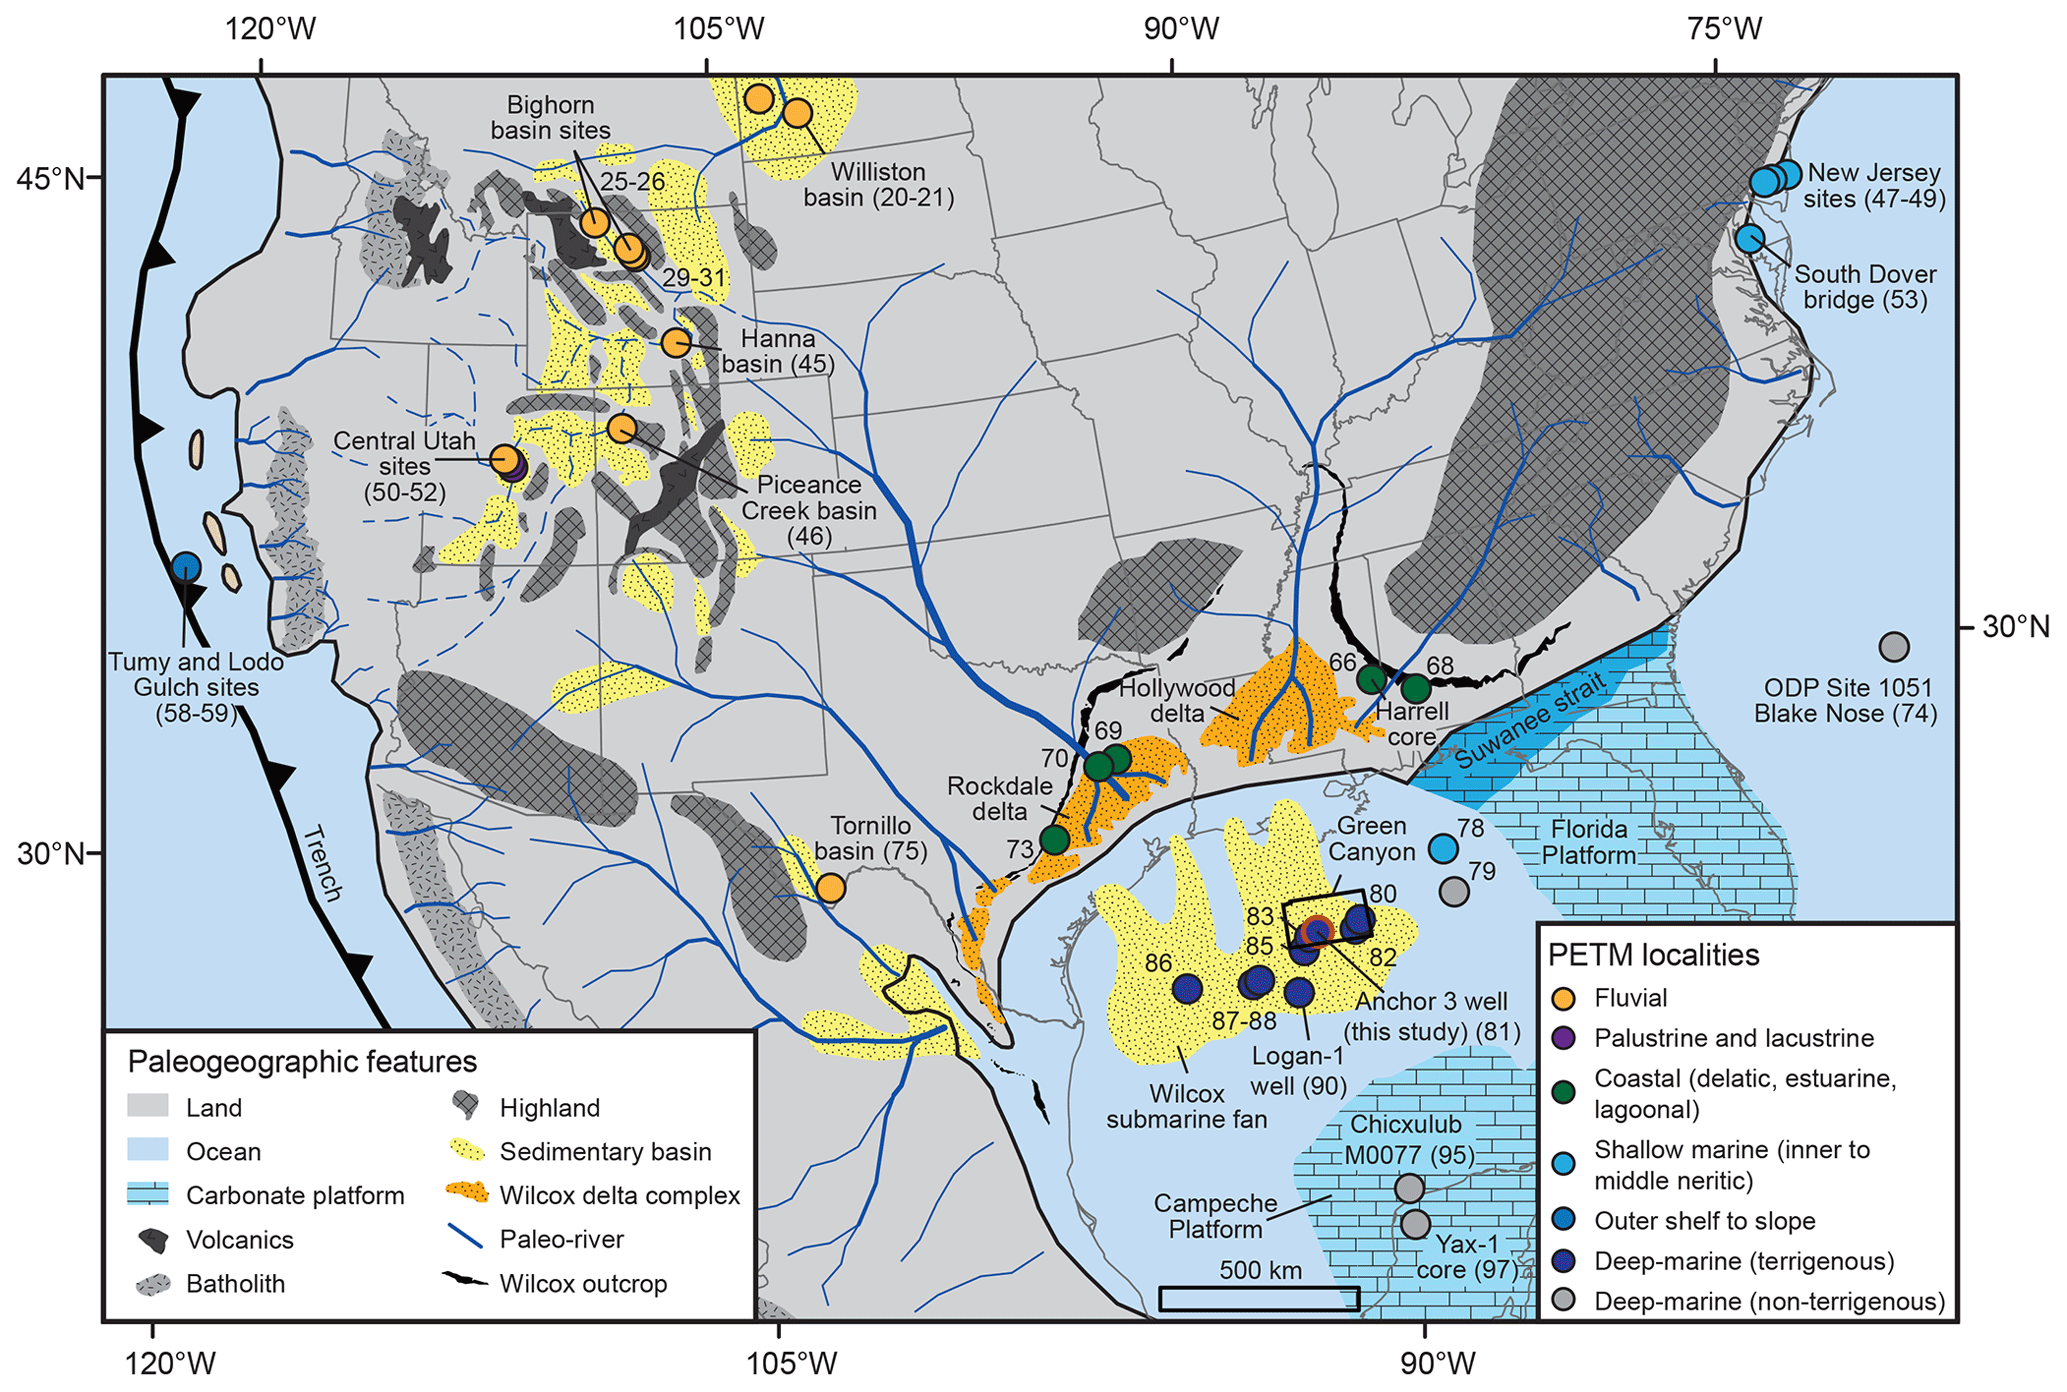
Figure 2Generalized paleogeography of central North America during Paleocene–Eocene times (modified from Zarra, 2007; Galloway et al., 2011; Sharman et al., 2017; Cunningham et al., 2022). Numbers correspond to PETM localities (Table S1).
This study documents the character of the ∼200 kyr PETM (Westerhold et al., 2018) within deep-sea fan deposits of the Gulf of Mexico (GOM) to clarify the extent to which climate-derived signals are transmitted and/or buffered from source to sink and elucidate the effects of the PETM on the Gulf of Mexico and upstream terrestrial environments. We present an analysis of ∼124 m of drill core from the Anchor 3 well that is located within the Green Canyon protraction area of the GOM basin (Fig. 2; Zarra et al., 2019). The study area is positioned on the distal fringe of a Paleogene continental-scale sediment-routing system that drained ∼ 1–3×10⁶ km2 of central North America, including well-studied PETM localities within Laramide continental foreland basins (e.g., the Bighorn and Piceance Creek basins) (Fig. 2; Wing et al., 2003; Galloway et al., 2011; Foreman et al., 2012; Sharman et al., 2017; Zhang et al., 2018). Cunningham et al. (2022) recently reviewed publicly available biostratigraphic and geochemical data from GOM wells, primarily from ditch-cutting samples, and inferred the PETM to range in thickness from 8–222 m. Biostratigraphic and carbon isotopic data from ditch-cutting samples from the Logan-1 well, positioned ∼150 km to the south of Anchor 3 (Fig. 2), indicate a ∼195 m PETM CIE with a portion of the main body of the CIE correlating with the regionally extensive Yoakum shale (Vimpere et al., 2023).
This study aims to determine the lithologic, bio-geochemical, and oceanographic effects of the PETM within the GOM and Wilcox deep-sea fan system by (1) constraining the stratigraphic position of the PETM through integration of bulk organic carbon isotopic and biostratigraphic data, (2) evaluating changes in sediment lithology and major element geochemistry with respect to the timing of the PETM onset, and (3) briefly outlining several geographically and temporally provincial biostratigraphic events that assist in defining the CIE in time. We illustrate how the combined influences of increasing terrigenous sediment supply and rising sea level shape the lithologic and geochemical manifestation of the PETM within the Wilcox deep-sea fan system.
The Paleocene–Eocene Wilcox Group comprises an expansive set of fluvio-deltaic, shelf, slope, and deepwater depositional sequences within the central and western GOM basin (e.g., Fisher and McGowen, 1967; Edwards, 1981; Galloway et al., 1991a, 2000; Xue and Galloway, 1993, 1995; Xue, 1997; Zarra, 2007). Derived primarily from the Central and North American Cordillera, these strata contain a 10 Myr record of Laramide orogenic onset and evolution, continental-scale drainage network reorganization, and deposition of derivative clastic sediment within the GOM basin (e.g., Winker, 1982, 1984; Galloway, 1987, 2008; Galloway et al., 2011). Wilcox Group sediments were delivered to GOM fluvial–deltaic outfall points by drainage systems that operated on multiple scales and reorganized through time (Galloway et al., 2000, 2011, and references therein). With drainage basin scales likely > 1×10⁶ km2, Wilcox fluvial systems drained a sizable portion of the North American midcontinent (Sweet and Blum, 2011) and contributed sediment to an immense depositional extent of deepwater turbidites ∼ 100 000 km2 in total area (Meyer et al., 2007). Age-equivalent strata extend far into the hinterland where PETM sections are recognized in several Laramide basins (Dickinson et al., 1988; Wing et al., 2003; Bowen and Bowen, 2008; Lawton, 2008; Foreman et al., 2012; Galloway et al., 2011; Kraus et al., 2015; Dechesne et al., 2020). The deepwater Wilcox Group thus represents the terminus of a continental-scale sediment-routing system with a total fluvial catchment area that was likely comparable to that of the modern-day Mississippi River (Galloway et al., 2011; Blum et al., 2017; Sharman et al., 2017).
Development of the proto-GOM basin began in Triassic–Early Jurassic times with crustal extension and terrigenous sedimentation across a wide zone of continental crust extension before the modern-day Yucatán Peninsula rifted from the rest of Laurentia during a relatively brief period (ca. 166–142 Ma) during the breakup of Pangea (Pindell, 1985; Salvador, 1987, 1991; Buffler and Thomas, 1994; Bird, 2005; Stern and Dickinson, 2010; Minguez et al., 2020; Pindell et al., 2021). From that time onward, the basin captured a nearly continuous depositional record of local and supra-regional tectono-sedimentary events and changing continental landscapes (Galloway, 2008, and references therein). The cessation of oceanic spreading, initiation of rift flank thermal subsidence, and relative dearth of siliciclastic influx during Early Cretaceous times allowed a broad coastal plain and widespread marine carbonate platforms to develop along portions of the North American rift flank (Galloway, 2008). Through most of Cretaceous times, the GOM basin remained relatively underfilled with its margin dominated by extensive carbonate platform and reef accumulations; thin clastic wedges of terrigenous sediment were delivered to the margin via small fluvial catchments that drained rift basin-proximal highlands (Loucks et al., 2017; Galloway, 2008; Snedden et al., 2016a, b, 2022).
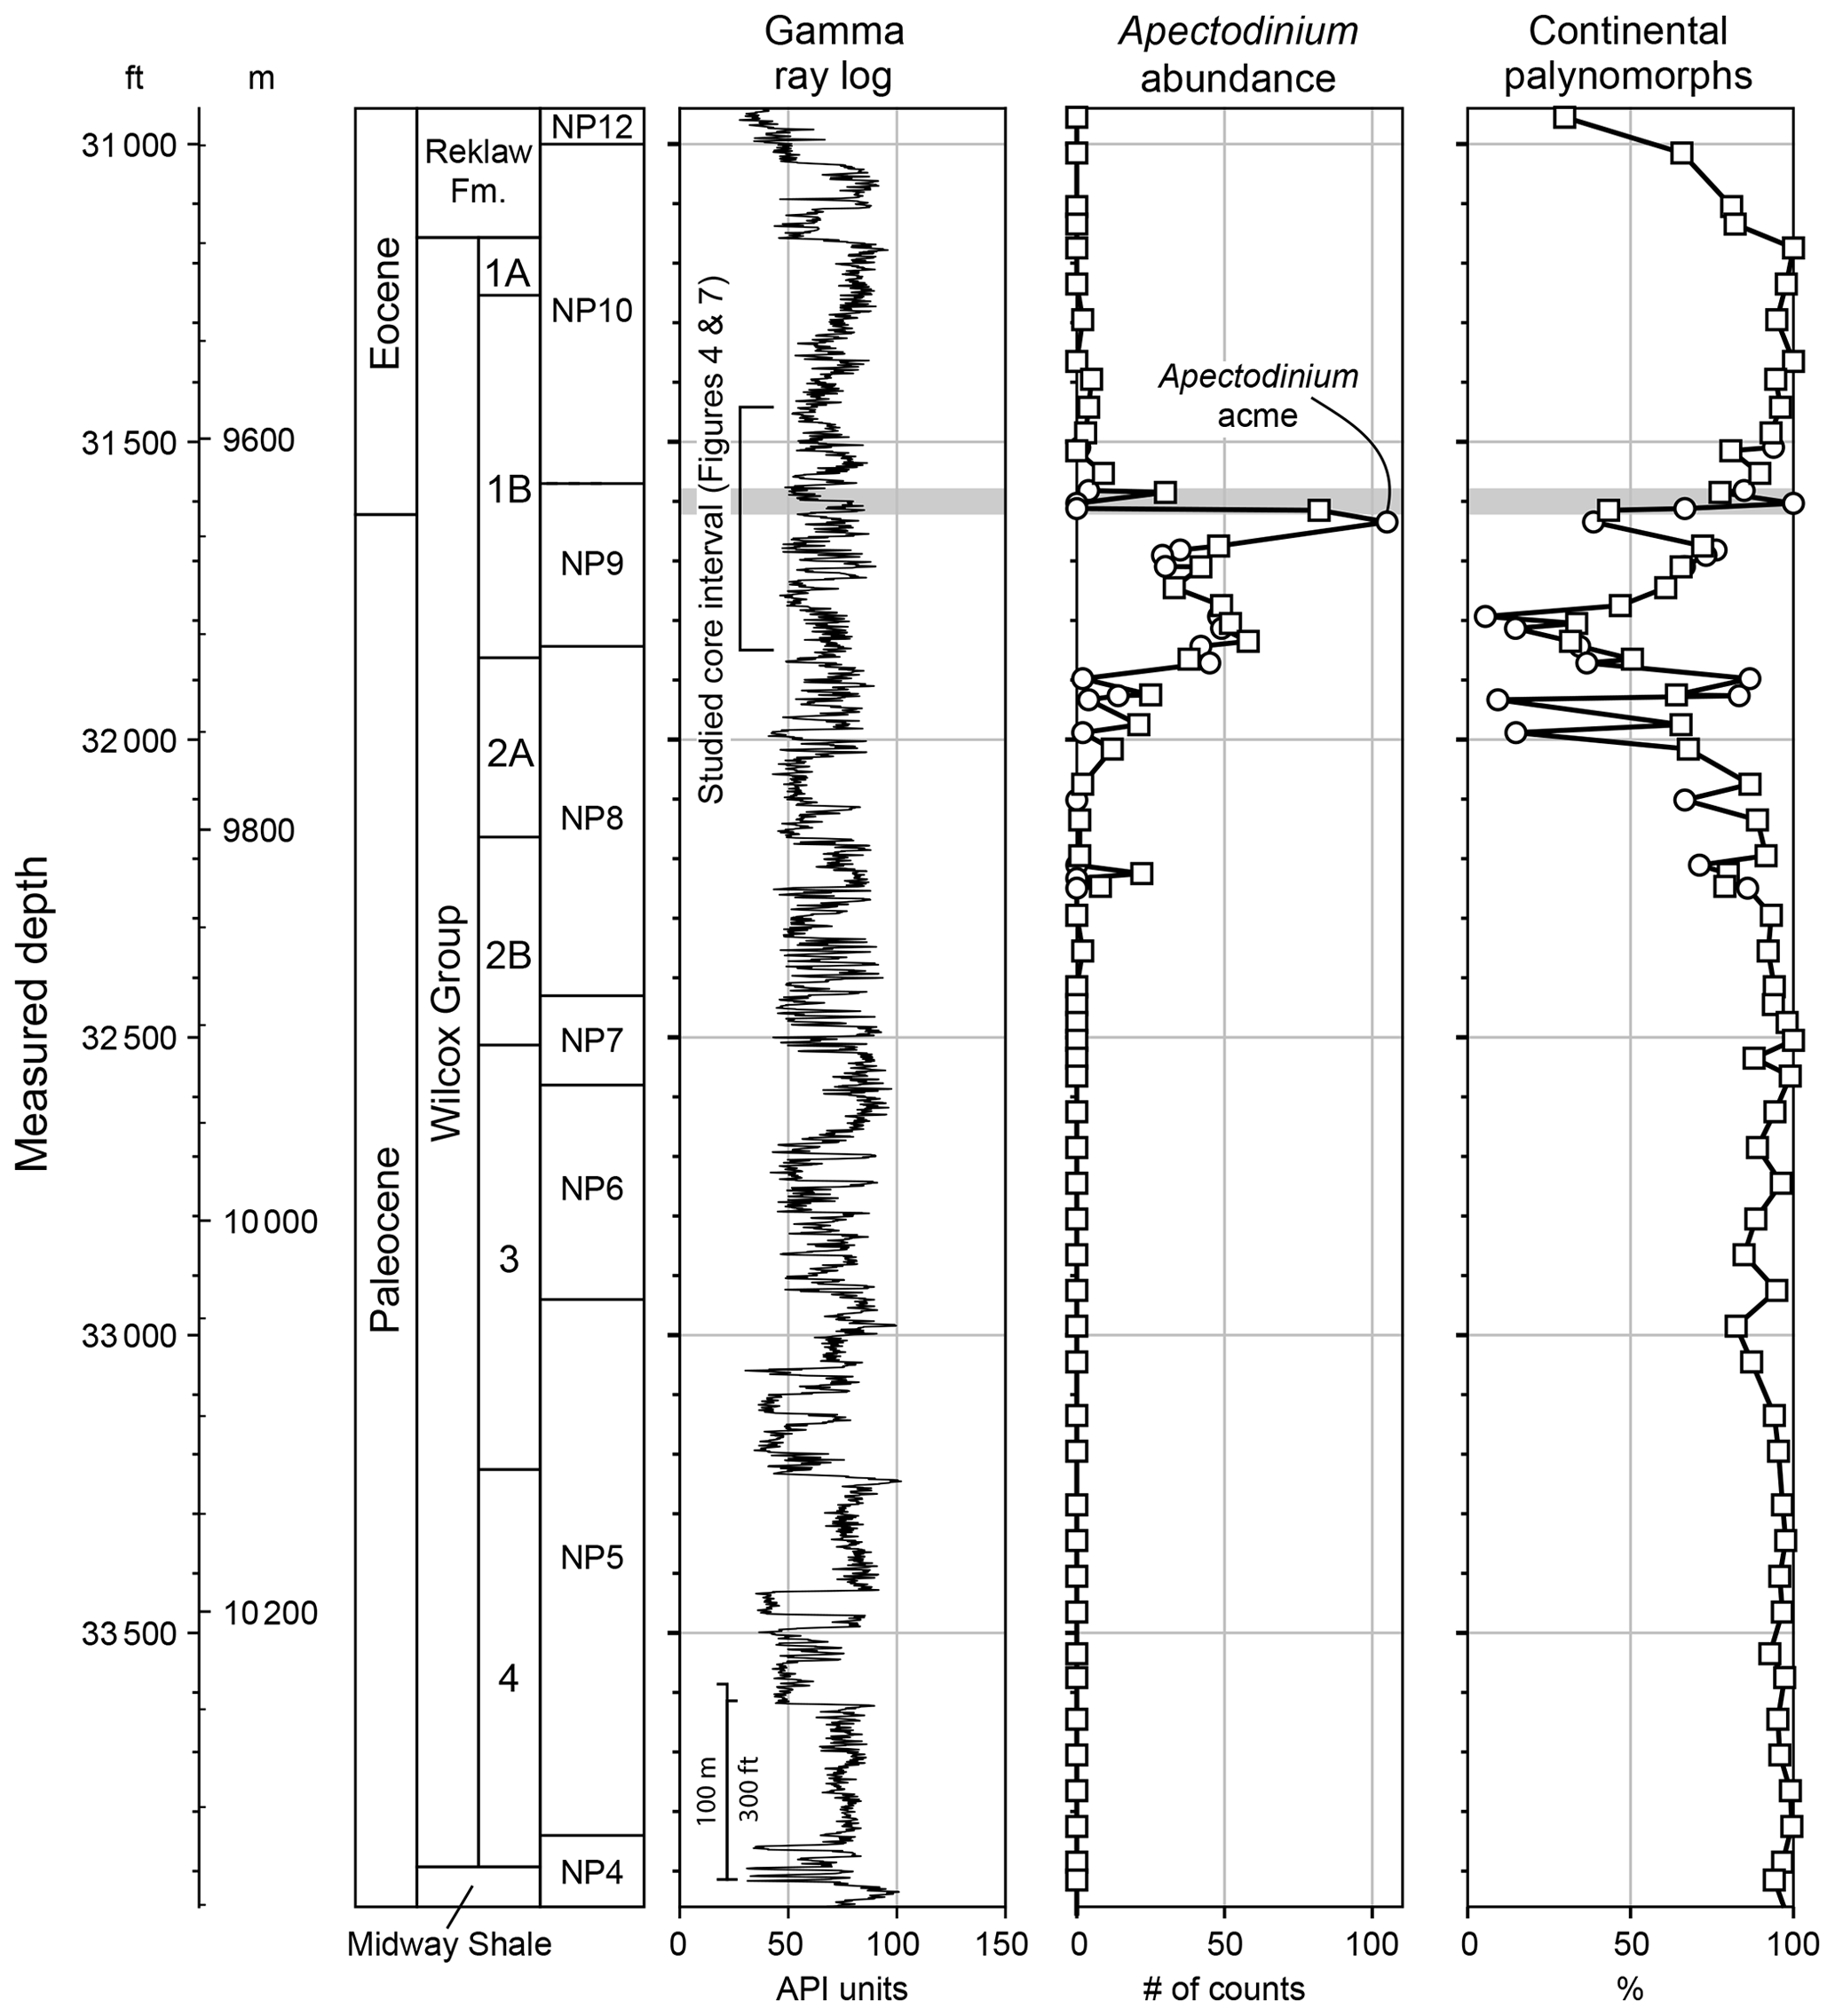
Figure 3Gamma ray log, total counts of Apectodinium, and relative abundance of continental palynomorphs in the Anchor 3 well. Units of the Wilcox Group are from Zarra et al. (2019). Nannoplankton (NP) zones are from this study. An increase in continental palynomorphs (continental spores and pollen grains) relative to marine palynomorphs (dinocysts and acritarchs) may be used to infer changes in terrestrial input into the basin relative to marine productivity. The horizontal gray bar indicates the PETM negative carbon isotope excursion (Fig. 4). Circles indicate core samples, and squares indicate cutting samples. Data are available in Sharman et al. (2022).
The onset and evolution of the Laramide Orogeny during Late Cretaceous and Paleogene times affected the North American midcontinent tectonically, stratigraphically, and climatically (Dickinson et al., 1988; Feng et al., 1994; Sewall and Sloan, 2006; Copeland et al., 2017; Yonkee and Weil, 2015; Bush et al., 2016) by creating significant hinterland relief and initiating continental-scale drainage reorganization as catchments across the United States and northern Mexico were redirected into the GOM basin (Blum and Pecha, 2014; Lawton et al., 2015; Sharman et al., 2017). Wide basin shelves typically exert a strong control on deepwater sediment budgets by leaving them susceptible to climate-driven sea-level fluctuations (e.g., Sweet and Blum, 2016), but unprecedented high sediment flux from Laramide hinterland relief generation and catchment enlargement during Paleogene greenhouse conditions overwhelmed typical eustatic and margin architectural controls (Carvajal and Steel, 2006; Carvajal et al., 2009) to carve several large submarine canyon systems (Hoyt, 1959; Galloway et al., 1991b; Galloway, 2007; McDonnell et al., 2008; Brown and Loucks, 2009; Sweet and Blum, 2011; Cornish, 2011, 2019) that received and channeled a continuous stream of sand-rich siliciclastic sediment from alluvial–deltaic systems to deep-sea fans more than 500 km basinward (Galloway et al., 2000, 2011; Meyer et al., 2007; Zarra, 2007; Blum and Pecha, 2014).
As such, researchers used these observed differences to develop a set of stratigraphic nomenclatures tied to lithostratigraphic packages, seismic sequences, and sediment flux rates (e.g., lower, middle, upper; Galloway et al., 2000) that are useful for source-to-sink system analysis (Snedden et al., 2018; Zhang et al., 2018). Chronostratigraphic frameworks were first developed with inclusion of data from deepwater environs (Zarra, 2007; Zarra et al., 2013), and subsequent refinements to biostratigraphic zonation and correlation with absolute age constraints from numerous onshore and offshore well data have led to a generally accepted age range for Wilcox Group deposition of 61.5–51.1 Ma, spanning nannofossil biozones NP5 to NP12 with the PETM located near the NP9–NP10 boundary (Zarra et al., 2019).
The Anchor 3 well was drilled in 1443 m of water and reached a total measured depth of 10 370 m within the Midway shale that underlies the ∼830 m thick Wilcox Group (Fig. 3). This study focuses on the description of 124 m of drill core that spans the Paleocene–Eocene boundary, as originally described by Zarra et al. (2019) (Fig. 3). Bedding dips in the interval of core under study are generally less than 10∘. Deposition of Wilcox Group turbidites at the Anchor 3 well site during late Paleocene to early Eocene times is estimated to have occurred within the lower portion of the upper bathyal to lower bathyal zone (500 to 2000 m) of the continental margin based on benthic foraminiferal assemblages and other considerations (see Sect. 5.3).
This study integrates biostratigraphic analysis of both core and ditch-cutting samples across the entire Wilcox Group (Fig. 3) with focused sampling of core from 31 444 to 31 852 ft (9584.1 to 9708.5 m) for lithologic, C-isotopic, and major elemental geochemical characterization (Figs. 4 and 5). All sample depths are reported as measured depth in feet, with cutting samples demarcated as a depth range (top to bottom of the cutting interval). In addition, we assembled an analog database of geologic attributes from global PETM localities (Table S1) to allow comparison with our results. Sample collection and analytical methods are outlined below.
3.1 Biostratigraphic processing and analyses
Cutting samples were collected during well-site operations at an average interval of 10 to 30 ft (∼3 to ∼9 m) for initial biostratigraphic interpretation, and post-well work on the core involved the selection of 20 core plugs. In each case, shale and silt-rich intervals were targeted for analysis, expecting optimum fossil recovery. Cuttings and core plugs were processed and analyzed for foraminifera, nannofossils, and palynology. Biostratigraphic events and zones were selected for sampling based on the presence of both marine fossils and terrestrially derived palynomorphs using range and event stratigraphy as well as quantitative assemblage patterns of various taxonomic groups. Microfossil data were incorporated into the overall biostratigraphic scheme and are available in Sharman et al. (2022).
Smear slides were prepared for calcareous nannofossil analysis by Ellington and Associates in accordance with standard smear slide settling techniques (Watkins and Bergen, 2003) and examined at 30 ft (∼9 m) resolution through the interval of interest. Core plugs were selected in collaboration with palynological and micro- and nannofossil criteria and analyzed in parallel with the cuttings. Nannofossil analysis was performed using an Olympus BX41 light microscope at 63×–100× magnification using 10× oculars, 1× optovar, and optical immersion oil. Counts were made from three full transects of each slide.
Foraminifera were prepared from 20 core samples using routine preparation techniques for mildly indurated sediments. Approximately 100 g of sediment was soaked in water for 24 h to soften and disaggregate the material. The samples were then wet-sieved over a 63 µm mesh and dried in an oven at 60 ∘C. Residues were then separated into three size fractions (63–180, 180–250, and >250 µm) to facilitate examination. Because diversity and abundances of foraminifera were low, we made absolute counts of the entire sample. Radiolarian abundance counts are relative estimates.
Cuttings and core material were processed for palynological analysis using the standard palynological preparation technique applied for dinocysts as well as pollen and spore analyses. This procedure involved the removal of all mineral material using hydrochloric acid followed by hydrofluoric acid. The resultant residues were sieved with 20 and 10 µm meshes and mounted on three slides per sample, consisting of a dual coverslip for the 10–20 and >20 µm size fractions, a >10 µm composite, and an unsieved kerogen slide. Wherever possible, the >10 µm slide was examined for a total combined count of 200 pollen grains, spores, and dinocysts under 400× magnification. The individual size fractions (10–20 µm and >20 µm) were then examined for rare (<1 % of total abundance) palynomorphs that were subsequently included in the overall count and provided a further constraint on age.
The ratio of continental to marine palynomorphs is calculated as C M = nC (nC + nM), where nC is the number of counts of continental palynomorphs (pollen + spores + freshwater algae) and nM is the number of counts of marine palynomorphs (dinocysts and acritarchs). The C M ratio plotted alongside the relative abundances of palynomorph species is applied as a proxy to understand terrestrial influence and sea-level fluctuations (e.g., Versteegh, 1994; Tyson, 1995). Kerogen slides were scanned and examined to further assess the type and quality of organic material in the palynology preps.
3.2 Lithologic and geochemical characterization
A total of 252 core plug samples were collected over an interval of 124.3 m that spans the Paleocene–Eocene boundary based on biostratigraphic constraints (Fig. 3). Sample locations were selected using core photographs, with fine-grained intervals sampled more densely (∼0.3 m per sample) than those dominated by siltstone and sandstone (∼0.6 to 1.0 m per sample). A qualitative description of each sample was created using a stereo microscope and grain size card to assess grain size, bedding features, and other notable features. Although physical access to the core was not possible due to Covid-19-related travel restrictions, sample descriptions were integrated with high-resolution core photographs (∼0.33 mm pixel dimensions) to define lithofacies using the approach of Lowe and Gosh (2004). Core photographs were visually characterized for the degree of bioturbation using the semi-quantitative approach of Droser and Bottjer (1986).
Each core plug sample was screened for major and trace element concentration using an Olympus Vanta M Series portable X-ray fluorescence (pXRF) device. A glass standard and soil standard (Montana SRM 2711a) were analyzed at the beginning and end of each session to ensure that the instrument was operating within expected parameters. Every 10th core plug was analyzed in triplicate, and 26 samples were reanalyzed in a different session to assess variability in results across subsequent analytical sessions. Of the 252 samples, 121 samples that exhibited lithologic and geochemical uniformity were selected for further geochemical characterization via ore-grade laboratory analysis of major element oxide abundance (XRF) and major and trace element concentration (ICE-AES and ICP-MS) using SGS minerals. Finally, 25 samples were analyzed by X-ray diffraction (XRD) for a qualitative assessment of mineralogy using an Olympus Terra Portable XRD/XRF system (Fig. S1). Lithologic descriptions and geochemical data are provided in Sharman et al. (2022).
The chemical index of alteration (CIA; Nesbit and Young, 1982) was calculated following McLennan (1993) based on molar proportions of major element oxides of Al, Ca, Na, and K.
Because CaO content may be influenced by Ca in carbonates and phosphates, we applied a correction to estimate CaO contributions from silicate minerals alone, CaO*, following the approach of McLennan (1993). First, CaO contributions were corrected by assuming that P2O5 is from apatite, which contributes CaO at a molar ratio of 10:3 relative to P2O5. The value of P2O5-corrected moles of CaO was used if it was less than the number of moles of Na2O; otherwise, the value of Na2O was adopted as CaO* (McLennan, 1993). Finally, CIA values were discarded from samples that displayed evidence of carbonate cementation, including anomalously high CaO, visual observations of cementation, and XRD data.
3.3 Carbon isotope chemostratigraphy
A total of 157 fine-grained (shale) samples were selected out of the total 252 core plugs for isotopic analysis of bulk organic carbon. A handheld Dremel with a diamond bit was used to sample approximately 0.5–1.0 g of material, with the outermost material discarded to avoid surface contamination. Samples were prepared using a modification of the method used by Suarez et al. (2013). To obtain δ13Corg, samples were first dried. If the Dremel did not completely powder the sample, the sample was crushed into a fine powder with a mortar and pestle. Inorganic carbon in the form of carbonate was removed via decarbonation; 10 mL of 3M HCl was added to ∼ 0.5–1.0 g of sample and reacted for ∼ 2–4 h or until the reaction went to completion. Samples were then rinsed to neutrality with deionized water, dried, and crushed (Suarez et al., 2013).
Because the core samples are from a petroleum field, migrated hydrocarbon was removed via solvent extraction before isotopic analysis (e.g., Sharman et al., 2023; Vimpere et al., 2023). Samples were prepared for hydrocarbon extraction by transferring the dried and crushed decarbonated sample to MarsXpress vessels where 10 mL of hexane (C6H14) and 10 mL of acetone (C3H60) were added directly to the sample in the vessel (Hasty and Revesz, 1995). The vessel plug and cap were then placed on the opening of the vessel and torqued to seal tightly. The vessels were placed within the sleeves of the main vessel turntable, distributed evenly in the compartment, and loaded into the CEM MarsXpress microwave-accelerated reaction digestion oven. The samples were heated using the ramp-to-temperature control style at a power level of 800 ramping up to 150 ∘C over 15 min and holding at 150 ∘C for an additional 15 min. After the microwave completed the 30 min total run time plus approximately 5 min of cooldown time, the samples were poured from the Xpress vessels into 12 mL solid-phase extraction columns with glass microfiber filters placed at the bottom of the tube and attached to a solid-phase extraction manifold. The samples were rinsed with additional acetone to maximize the return of the solid sample and ensure the complete rinse of hexane and associated hydrocarbons from the sample. The vacuum pulled the liquids out of the sample, leaving a small puck that was transferred to a 1-dram vial to be prepared for carbon isotopic analysis. Testing of the procedure on standards spiked with two-stroke motor oil indicated a ∼ 99.998 % efficiency in oil extraction (Table S2). Only sandstone samples displayed a significant proportion of extractable organic material (i.e., migrated hydrocarbon), with shale samples lacking a notable decrease in organic carbon after solvent extraction (Table S3). We attribute this difference to migrated hydrocarbon primarily being stored within sandstone-hosted porosity, with comparably less petroleum contamination in the fine-grained samples targeted for isotopic analysis.
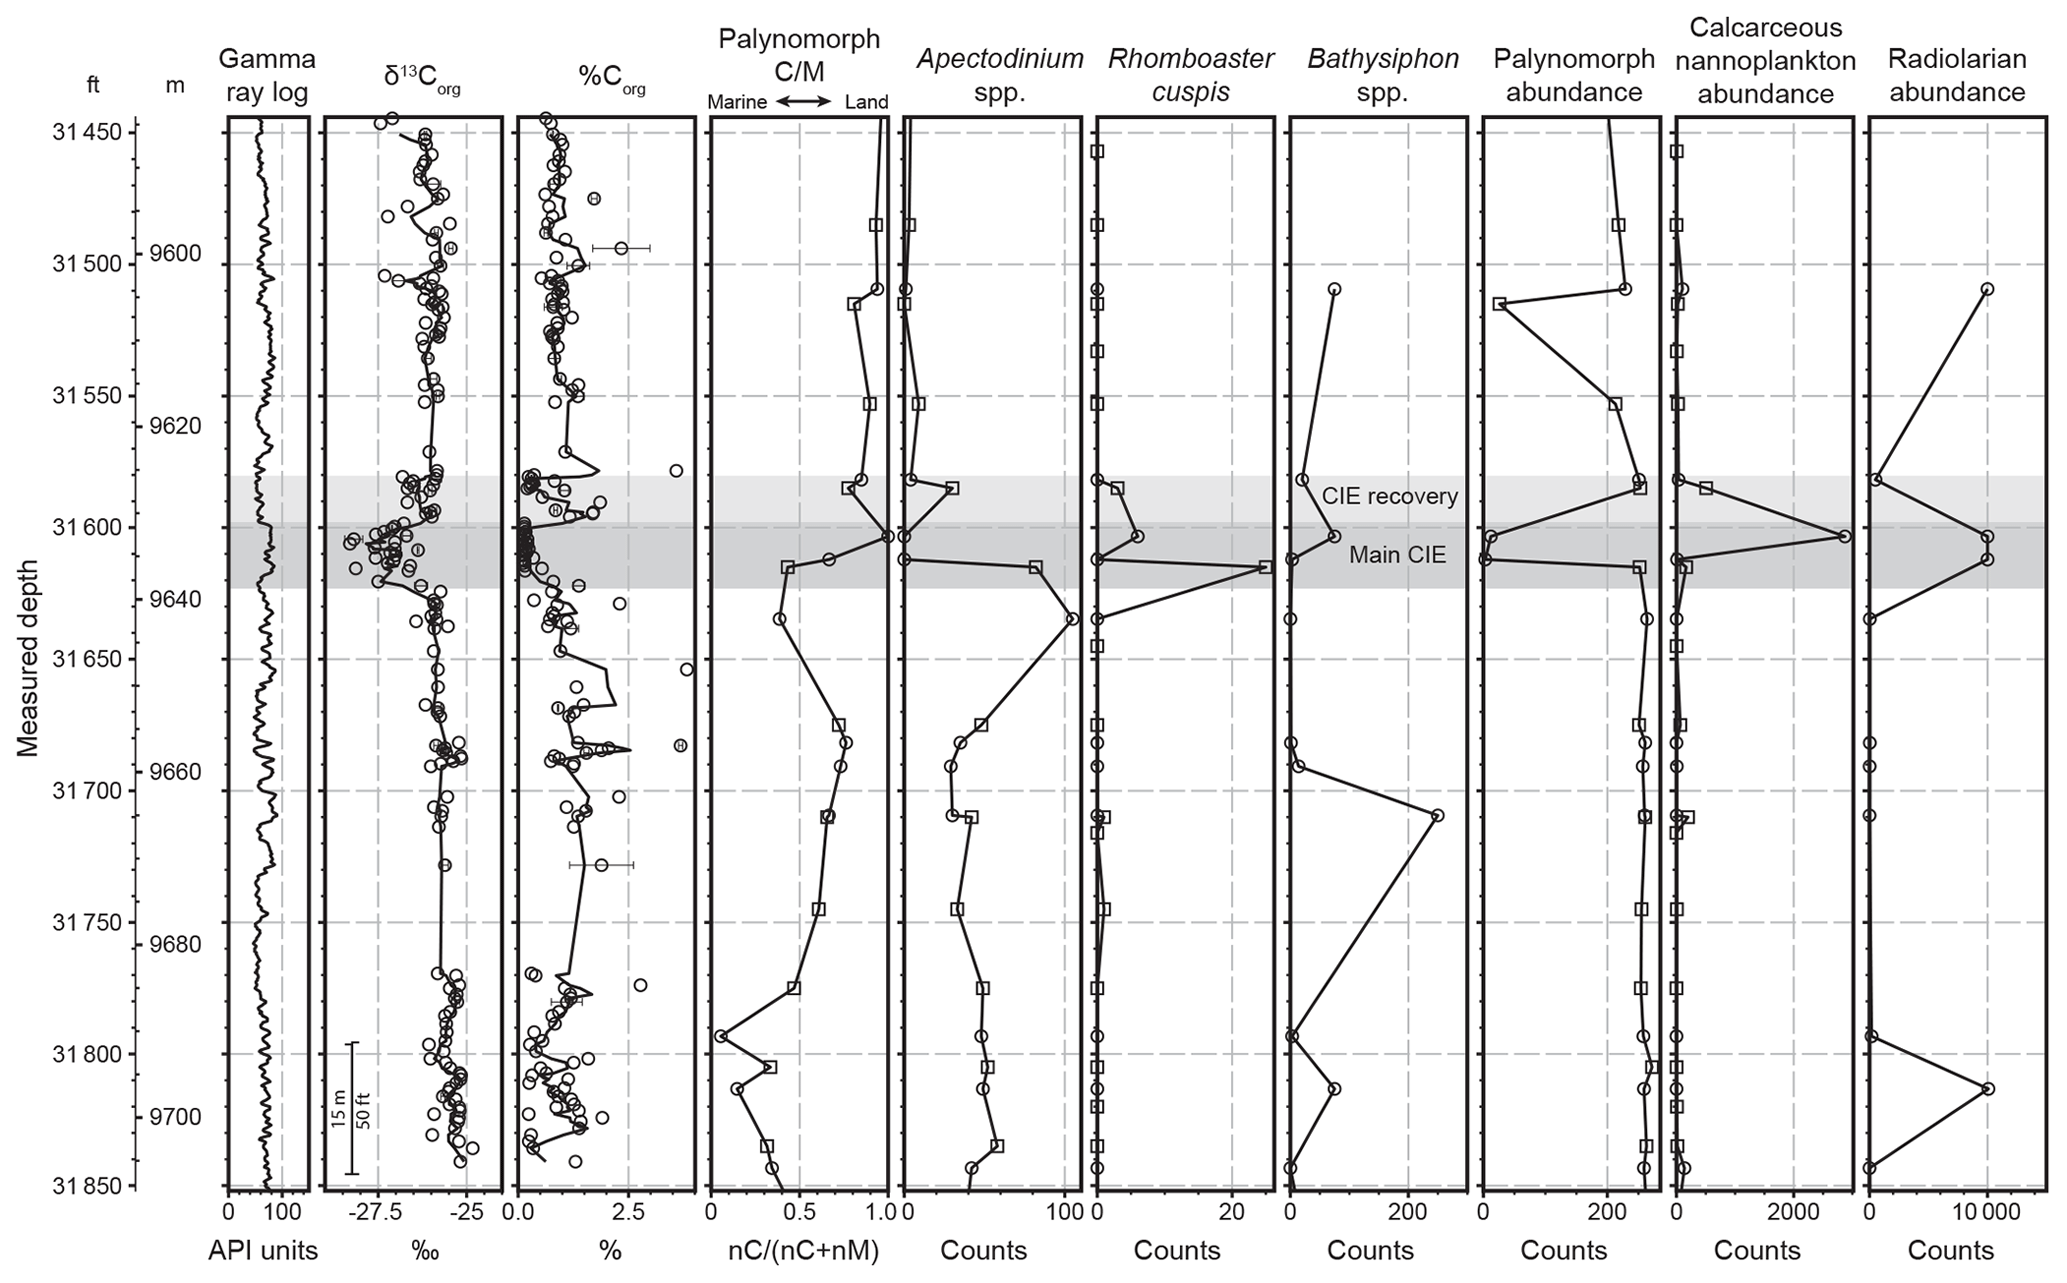
Figure 4Summary of C-isotopic and biostratigraphic results (data available in Sharman et al., 2022). Solid lines in δ13Corg and %Corg plots indicate a three-point running average. Palynomorph C M ratio is expressed as nC (nC + nM), where nC is the number of continental palynomorph specimens counted (continental spores + pollen grains) and nM is the number of marine palynomorph specimens counted (marine dinocysts + acritarchs). Only core samples are shown for Bathysiphon spp. and radiolarian counts due to poor preservation in cutting samples. The main and recovery phases of the CIE are shown by dark and light gray shading, respectively. Core samples are shown as circles, and cutting samples are shown as squares with the midpoint of the cutting depth range shown.
Following the hydrocarbon extraction process, ∼0.5 g of crushed sample was weighed into tin capsules using a Mettler Toledo DeltaRange microbalance with an accuracy of ±0.002 mg for analysis on a ThermoFinnigan Delta Advantage isotope ratio mass spectrometer (IRMS) via combustion in an elemental analyzer at the University of Arkansas Stable Isotope Laboratory. Values of δ13Corg are recorded in per mil (‰) relative to VPDB (Vienna Pee Dee Belemnite) and are calculated with the use of laboratory standards. Instrument stability, accuracy, and precision are also monitored via standard analysis. Results from the IRMS were calibrated using the following internal and international standards: corn maize ( ‰, actual −11.32 ‰), White River trout ( ‰, actual −26.63 ‰), benzoic acid ( ‰, actual −27.64 ‰), and ANU sucrose ( ‰, actual −10.4 ‰). Total organic carbon (TOC) values within the decarbonated samples were calculated using sandy soil ( ‰, %C = 0.83±0.07) following the methods of Suarez et al. (2013) and do not include organic carbon removed by the solvent extraction process. Carbon isotope data may be accessed via Sharman et al. (2022).
3.4 Compilation of PETM sections
To place the Anchor 3 core in context with other PETM sections globally, we compiled a list of PETM sections using existing compilations as a starting point (Table S1; McInerney and Wing, 2001; Carmichael et al., 2017). The thickness of the PETM CIE was measured, where available. Each locality was assigned a depositional setting classification (fluvial, lacustrine, coastal, inner–middle shelf, outer shelf to slope, or deep marine); the pre-PETM depositional setting was used if a change in depositional setting occurred during the PETM (e.g., Pujalte et al., 2016). PETM sections were further classified as terrigenous if pre-PETM lithologies are dominated by siliciclastic lithologies (e.g., sandstone, siltstone, clay-rich mudstone) or non-terrigenous if pre-CIE lithologies are dominated by non-siliciclastic, typically biogenic lithologies (e.g., limestone, marl, chalk, pelagic ooze) that reflect starvation of clastic sediment. Lithology change during the PETM was recorded and classified as a grain size increase or decrease (terrigenous localities) or as an increase or decrease in terrestrial sediment relative to carbonate or biogenic sediment (non-terrigenous localities). Paleogeographic coordinates were reconstructed using the PALEOMAP PaleoAtlas for GPlates (Scotese, 2016).
4.1 Carbon isotope chemostratigraphy
A total of 183 measurements of δ13Corg were collected from 156 depth intervals (Fig. 4). Values of 13Corg display relatively little variation (−24.8 ‰ to −26.4 ‰; average of −25.6 ‰) in the lower 66 m of the studied interval (samples 249 through 129), with an average TOC value of 1.18 %. A negative carbon isotope excursion (CIE) occurs between sample 130 (−25.7 ‰) and sample 128 (−27.5 ‰) and extends upwards for ∼13 m, with the lightest δ13Corg values occurring in the bottom ∼7.3 m, herein termed the main CIE (Fig. 5). In the main CIE, the three-point moving average of δ13Corg is up to ∼2 ‰ lighter than the pre-CIE average of −25.6 ‰. TOC values decrease rapidly following the onset of the CIE before reaching consistently low values (average of 0.17 %) between samples 121 and 104. An interval with δ13Corg values that are intermediate between the main CIE and pre-CIE values extends upwards for an additional ∼6 m (samples 102 to 83) with an average value of −26.2 ‰, herein termed the CIE recovery. TOC is variable in this interval, with some samples displaying values nearly as low as in the underlying negative CIE (e.g., average of 0.35 % from samples 89 to 82), whereas other samples have TOC more typical of pre-CIE values (average of 1.2 % from samples 102–90). The upper 41 m of core (samples 82 through 1) displays relatively consistent δ13Corg values with an average of −26.1 ‰, approximately 0.5 ‰ lighter than pre-CIE values (Fig. 4). Seven samples in this interval yielded δ13Corg less than −26.5 ‰, but these samples, and many others from the upper 19 m of core, come from intrabasinal mudclasts (Figs. 6 and 7). TOC values above the CIE recovery yield an average of 1.0 %, similar to pre-CIE values (Fig. 4).
4.2 Lithology, lithofacies, and bioturbation
Six lithofacies (LF-1 through LF-6) were defined based on core sample descriptions and visual interpretation of core photographs (Table 1; Fig. 6). LF-2 is the most abundant lithofacies, comprising 46 % of the studied interval, and is composed of thinly to moderately bedded mudstone and siltstone, with rare thin beds of lower very fine sandstone (Figs. 6 and 7; Table 1). LF-2 is distributed below and above the CIE and within the lowermost ∼1 m of the main CIE, including the onset of the excursion between samples 130 and 128. Mudstone within LF-2 has a median TOC of 0.93 %. Although carbonaceous (organic) debris is common in LF-2, it is more abundant above the CIE than below. The CIE recovery is exclusively composed of LF-2.
LF-4, moderately to thickly bedded coarse siltstone and sandstone, is the next most abundant lithofacies (33 % of the studied interval) and is found exclusively below or above the CIE except for a 0.4 m interval in the lowermost CIE (Figs. 6 and 7). LF-4 is typically either massive or planar-laminated. Below the CIE, LF-4 often overlies LF-2 in crude coarsening-upwards packages as can be observed on the gamma ray log. Above the CIE, LF-4 tends to overlie LF-2 across abrupt contacts while displaying fining-upwards packages. The upper ∼19 m of studied core consists of alternating LF-4 and LF-5 (sand-matrix, mudclast conglomerate), the latter of which is found nearly exclusively above the CIE (Fig. 7). The organic content and lithologic character of the mudclasts are very similar to LF-2.
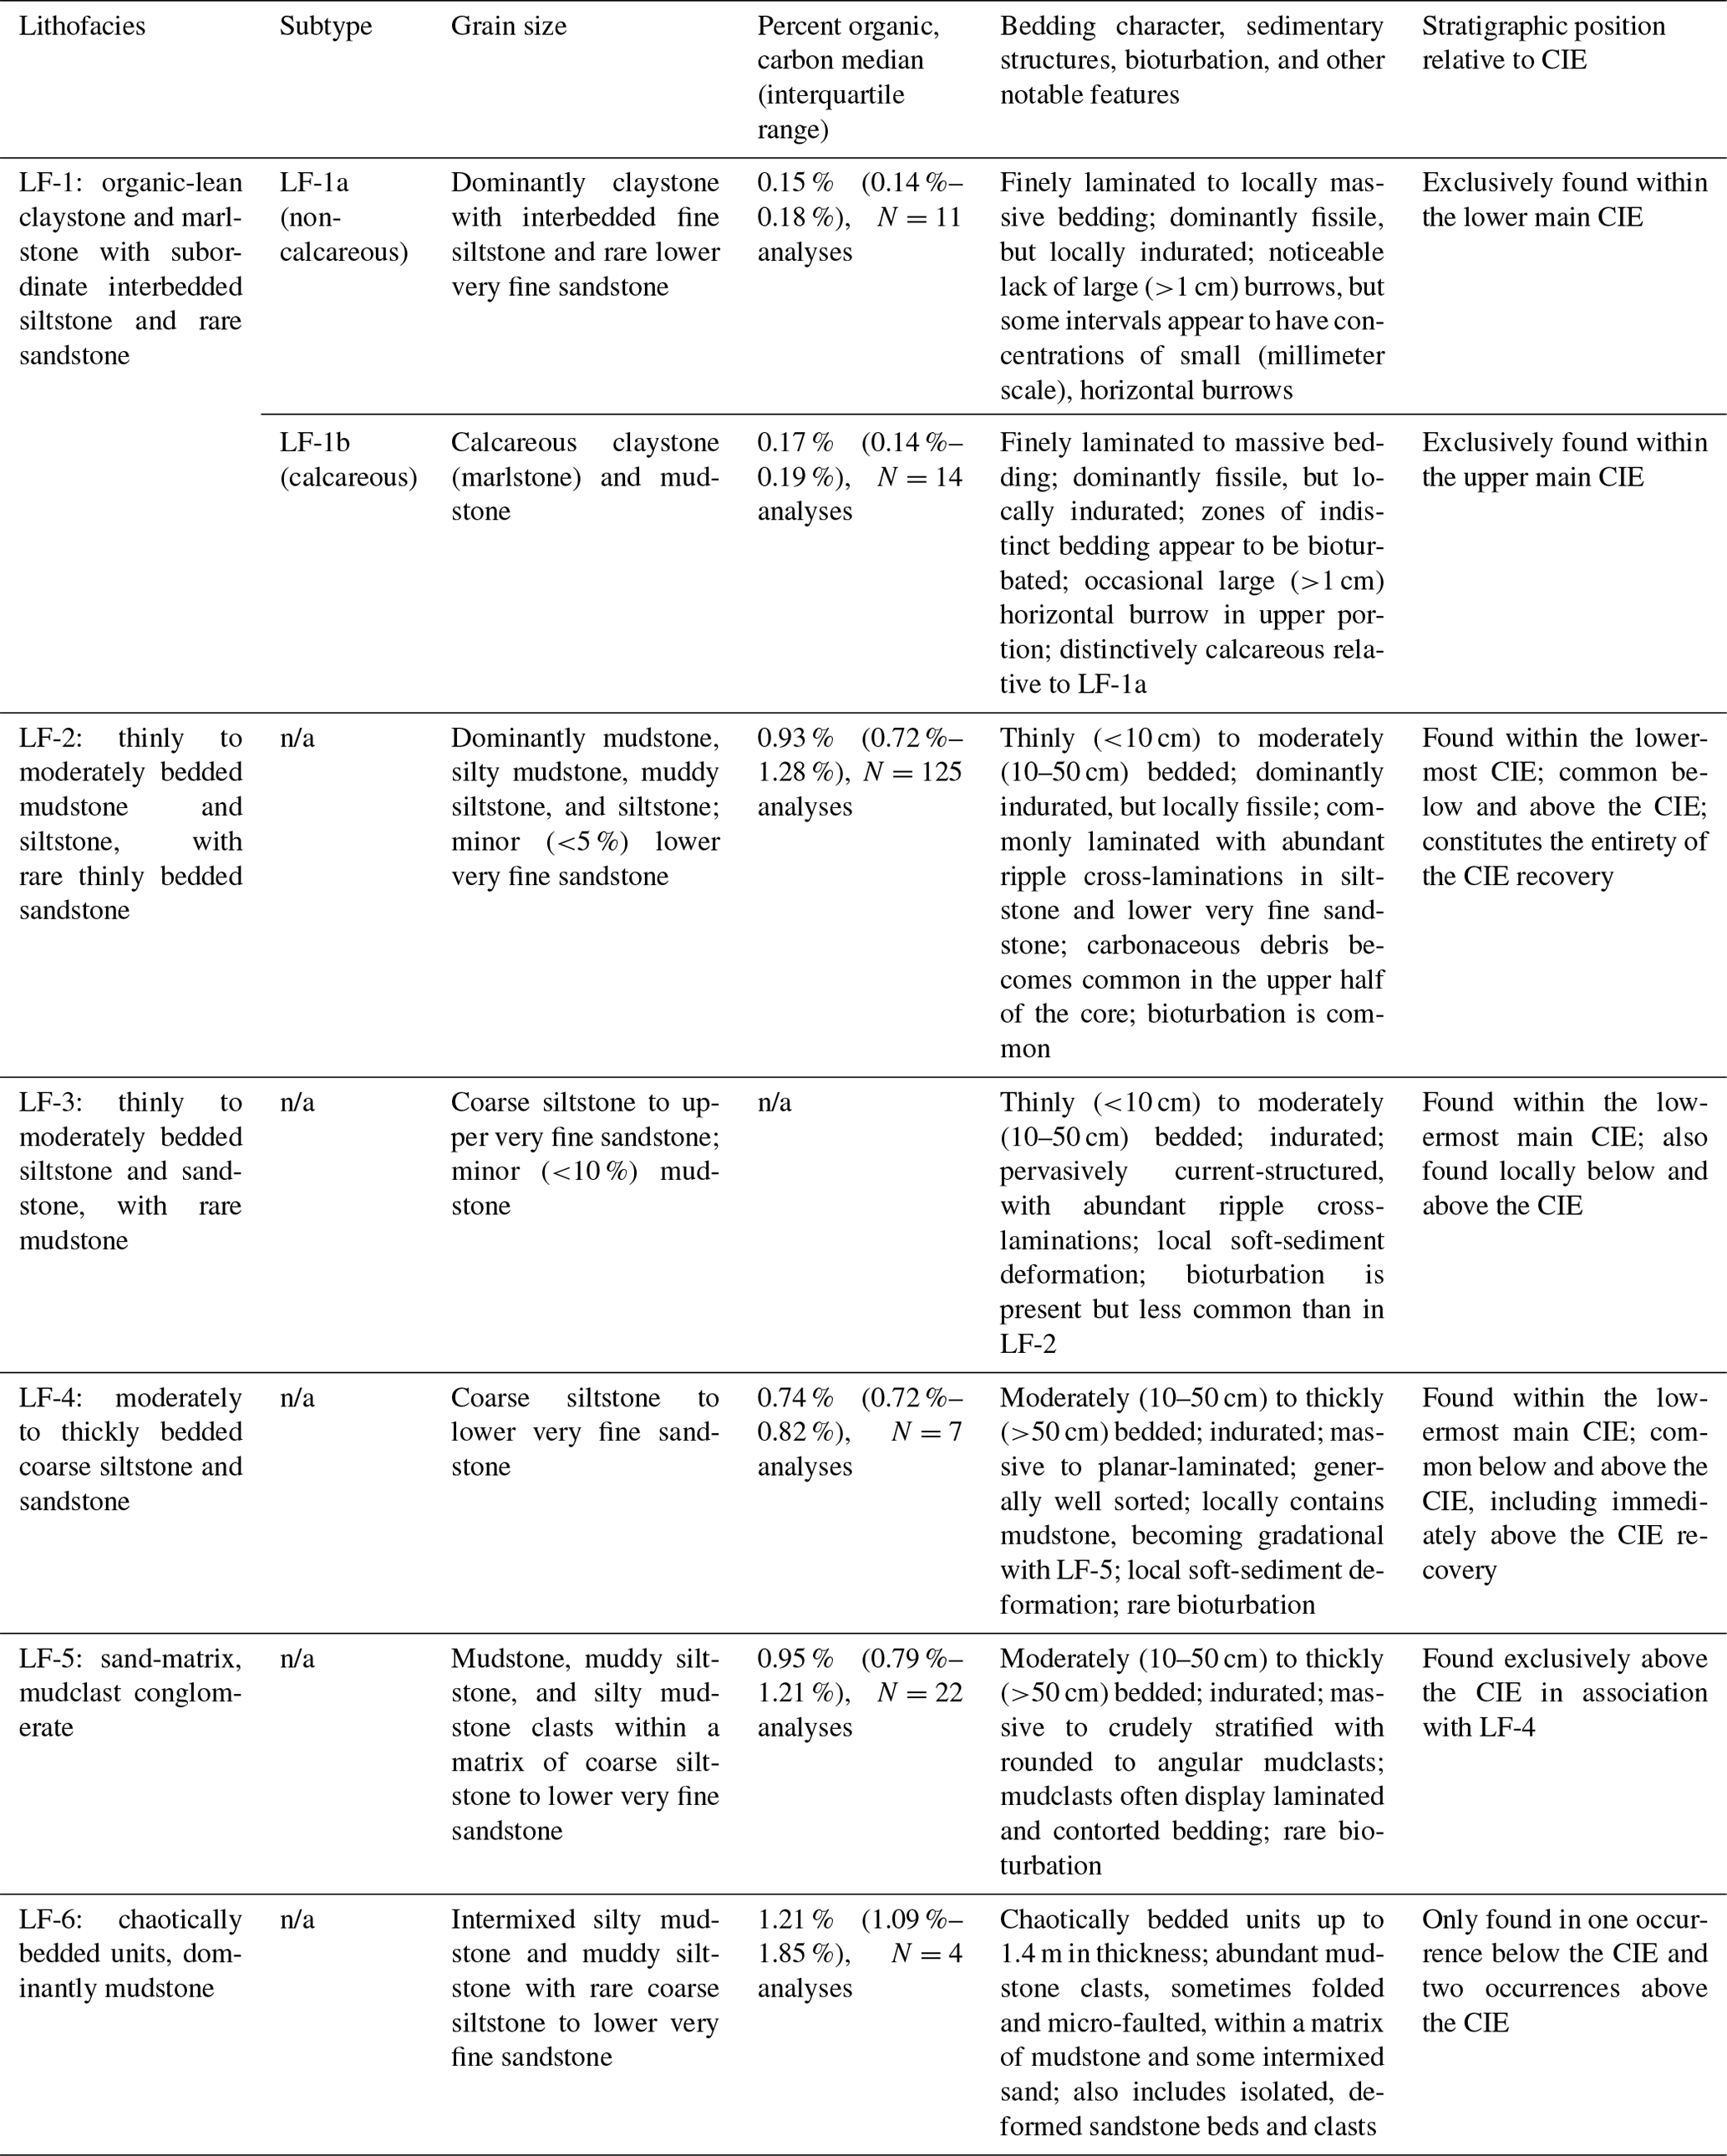
LF-1 accounts for ∼5 % of the total interval studied and consists of claystone and marlstone, with subordinate interbedded siltstone and rare very fine sandstone (Figs. 6 and 7). LF-1 is further subdivided into non-calcareous (LF-1a) and calcareous (LF-1b) subtypes. Both LF-1a and LF-1b are exclusively found within the main CIE and constitute the majority (∼77 %) of this interval. LF-1 is anomalous relative to other lithofacies in its (1) abundance of clay and corresponding lack of silt and sand, (2) low organic carbon content (median of 0.15 % to 0.17 % for LF-1a and LF-1b, respectively), and (3) associated lack of carbonaceous (organic) debris. LF-1b is the only lithofacies in the described interval to have a significant component of calcite, which is manifested as increased CaO abundance (Fig. 7).

Figure 5Summary of lithologic and carbon isotopic results across the Paleocene–Eocene boundary. The dashed and solid black lines in the sample log represent lower and upper grain sizes present, respectively. Units of the main and recovery phases of the CIE are shown on the gamma ray log plot and are discussed in the text. Abbreviations: BI – bioturbation index; cl – clay; ms – mudstone; sts – siltstone; ss – sandstone; lvf – lower very fine; uvf – upper very fine; lf – lower fine; uf – upper fine.
LF-3 comprises thinly to moderately bedded siltstone and sandstone that is pervasively current-structured, often with ripple cross-lamination (Fig. 6). LF-3 occurs in isolated intervals typically associated with either LF-2 or LF-4 and accounts for ∼5 % of the studied section. A thin interval of LF-3 (∼0.3 m) occurs immediately below LF-1a within the base of the main CIE (Fig. 7).
LF-6, with chaotically bedded units, is the least abundant lithofacies and only occurs in three discrete intervals that range in thickness from 0.4 to 1.4 m (Figs. 6 and 7). LF-6 is dominantly composed of deformed mudstone clasts within a mudstone matrix, with lower amounts of deformed sandstone clasts and sand grains within a mudstone matrix.
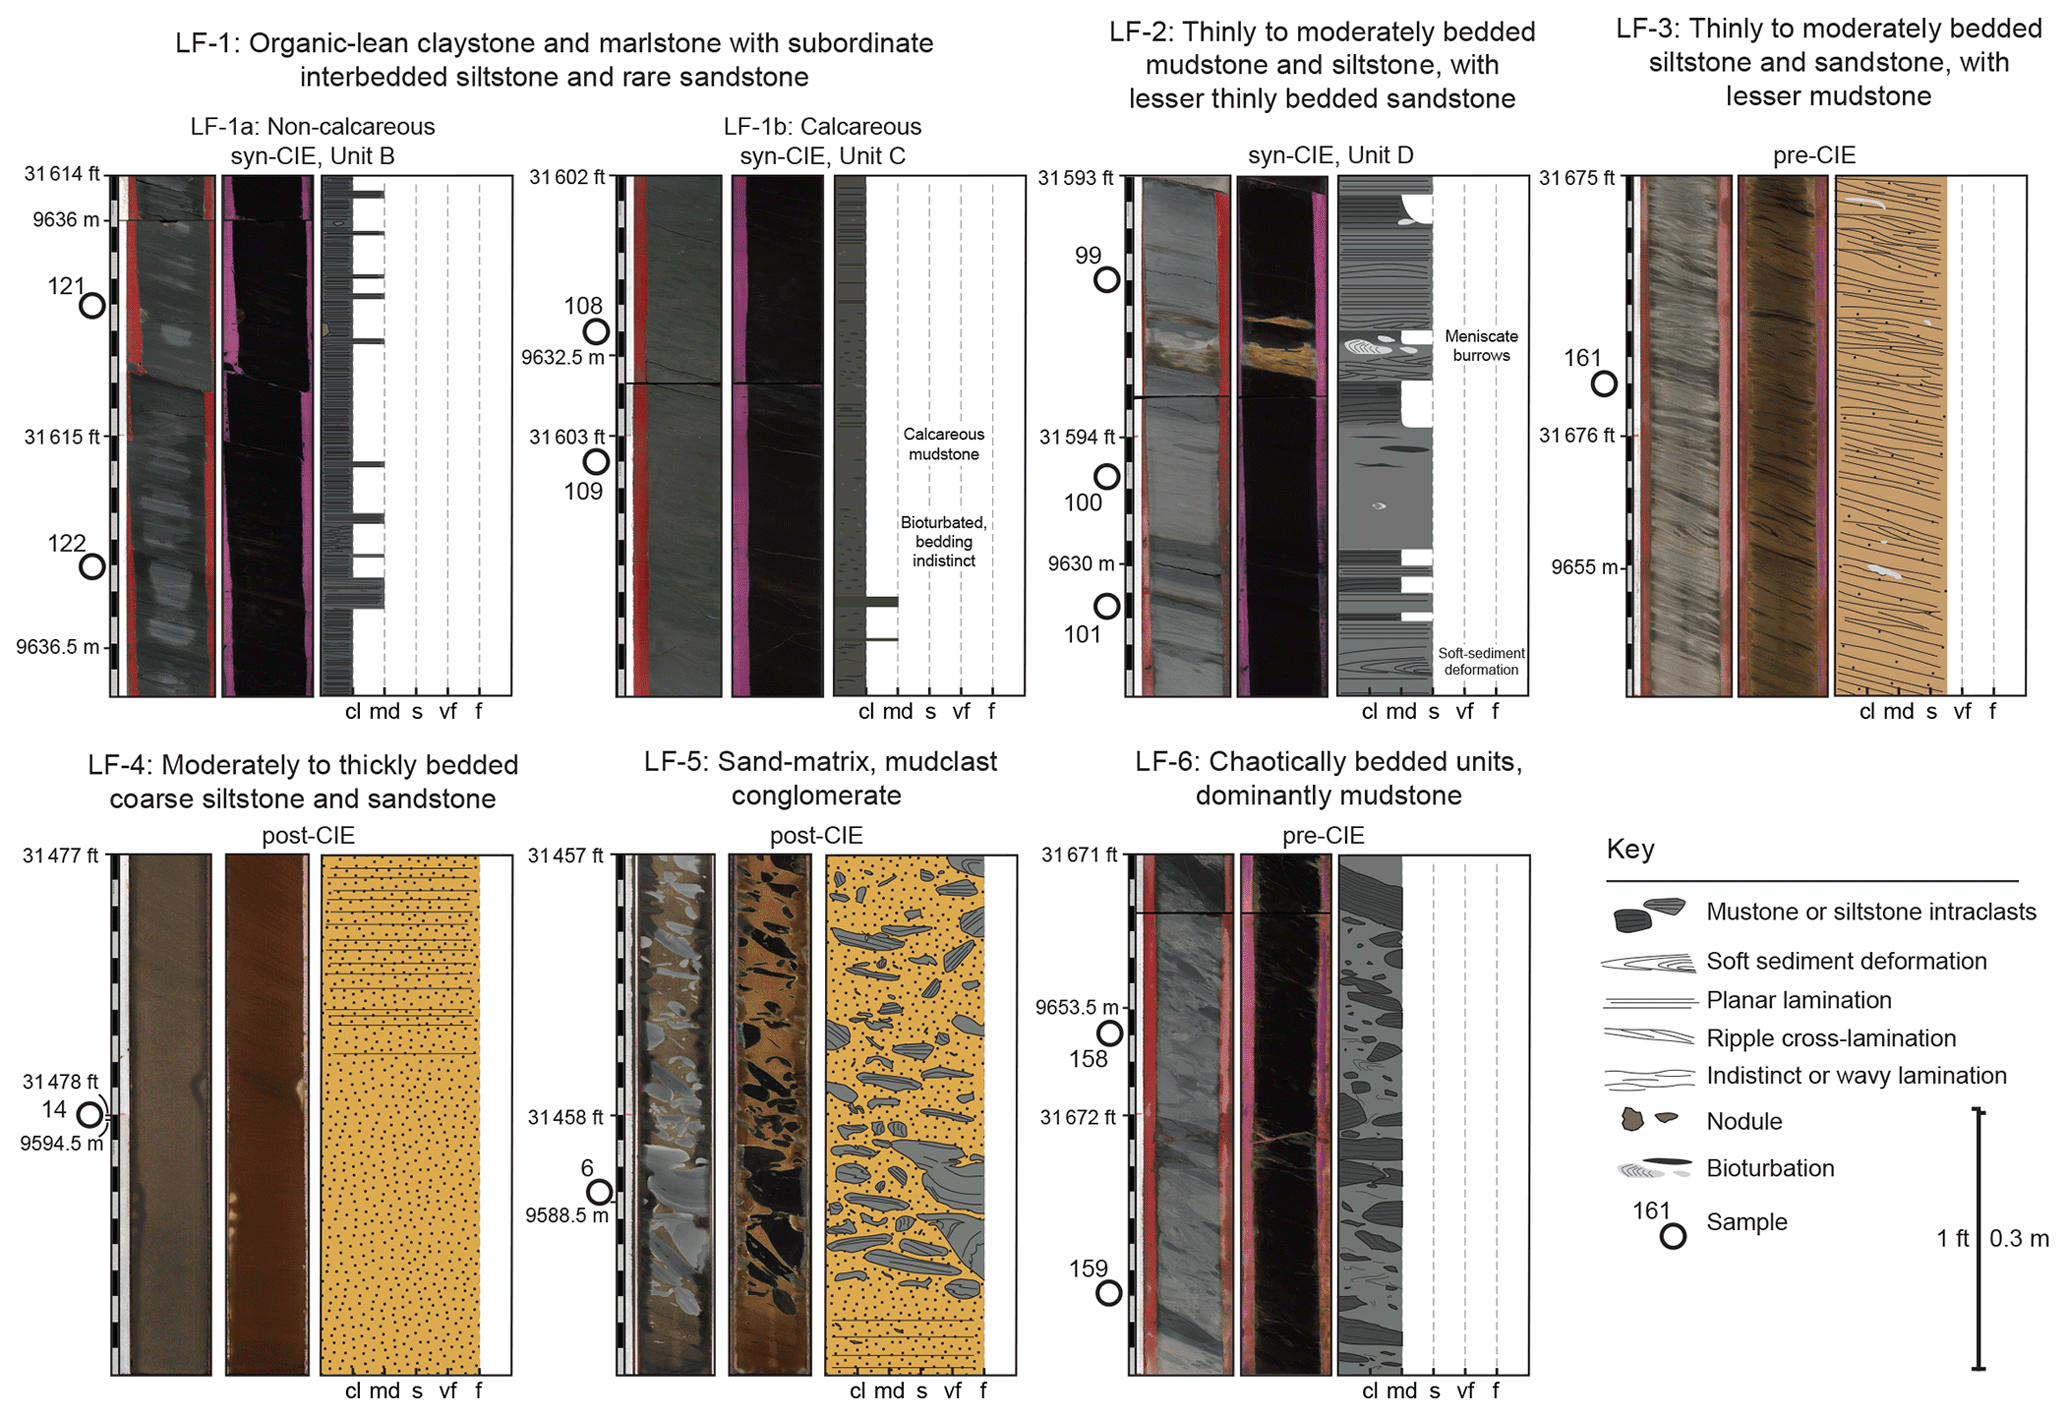
Figure 6Representative core photograph and drafted section of each lithofacies (Table 1). Core photographs are shown with plain light on the left and ultraviolet light on the right. Numbered white circles correspond to sample number. The location of the photograph with respect to the PETM CIE is identified (see Figs. 4 and 5). White and black scale marks indicate divisions of 0.1 ft (∼0.03 m). Abbreviations: cl – clay; md – mud; s – silt; vf – very fine sand; f – fine sand.
4.3 Bioturbation
Although the bioturbation index ranges from 1 to 4 (Fig. 8), most of the studied interval was assigned an index of either 1 or 2 (Fig. 7). Bioturbation is more common in LF-2 and LF-3 and is less common in LF-4, LF-5, and LF-6. There is a notable lack of bioturbation in the lower ∼2.4 m of the main CIE, despite favorable lithologies (LF-2, LF-3, and LF-1a). The bioturbation index then increases upwards within the main CIE to maximum values within LF-1b and remains high in the CIE recovery section (Fig. 7).

Figure 7Summary of lithologic and geochemical results. Gray arrows next to the gamma ray log indicate interpreted coarsening- and fining-upwards packages. The dashed and solid black lines in the sample log represent lower and upper grain sizes, respectively. The main and recovery phases of the CIE are shown by horizontal black lines. Boundaries between Units A–D are shown on the XRF panel. Lags between the onset of the PETM CIE and the associated lithologic or geochemical change are noted. Samples that display evidence of carbonate minerals are shown by black X marks and are not included in the average CIA* values noted by the vertical dashed black line. Abbreviations: cl – clay; ms – mudstone; sts – siltstone; ss – sandstone; lvf – lower very fine; uvf – upper very fine; lf – lower fine; uf – upper fine.
4.4 Biostratigraphic framework
Biostratigraphic analysis on well cuttings provided the initial chronostratigraphic framework utilizing calcareous nannofossil, foraminiferal, and palynological events to constrain the studied well interval to early Paleocene (Danian) to early Eocene (Ypresian) times with the cored interval representing late Paleocene (Thanetian) to earliest Eocene (Ypresian) times: more precisely, NP8 to NP10 nannofossil zones (Zarra et al., 2019) (Fig. 3). Biostratigraphic events are represented by the highest occurrence (top), lowest occurrence (base), and high taxon abundances (common or acme events). Significant events documented in the core and the cuttings are listed in Table 2. Note that fossil abundance varied between cutting and core samples, lithologies, and disciplines.
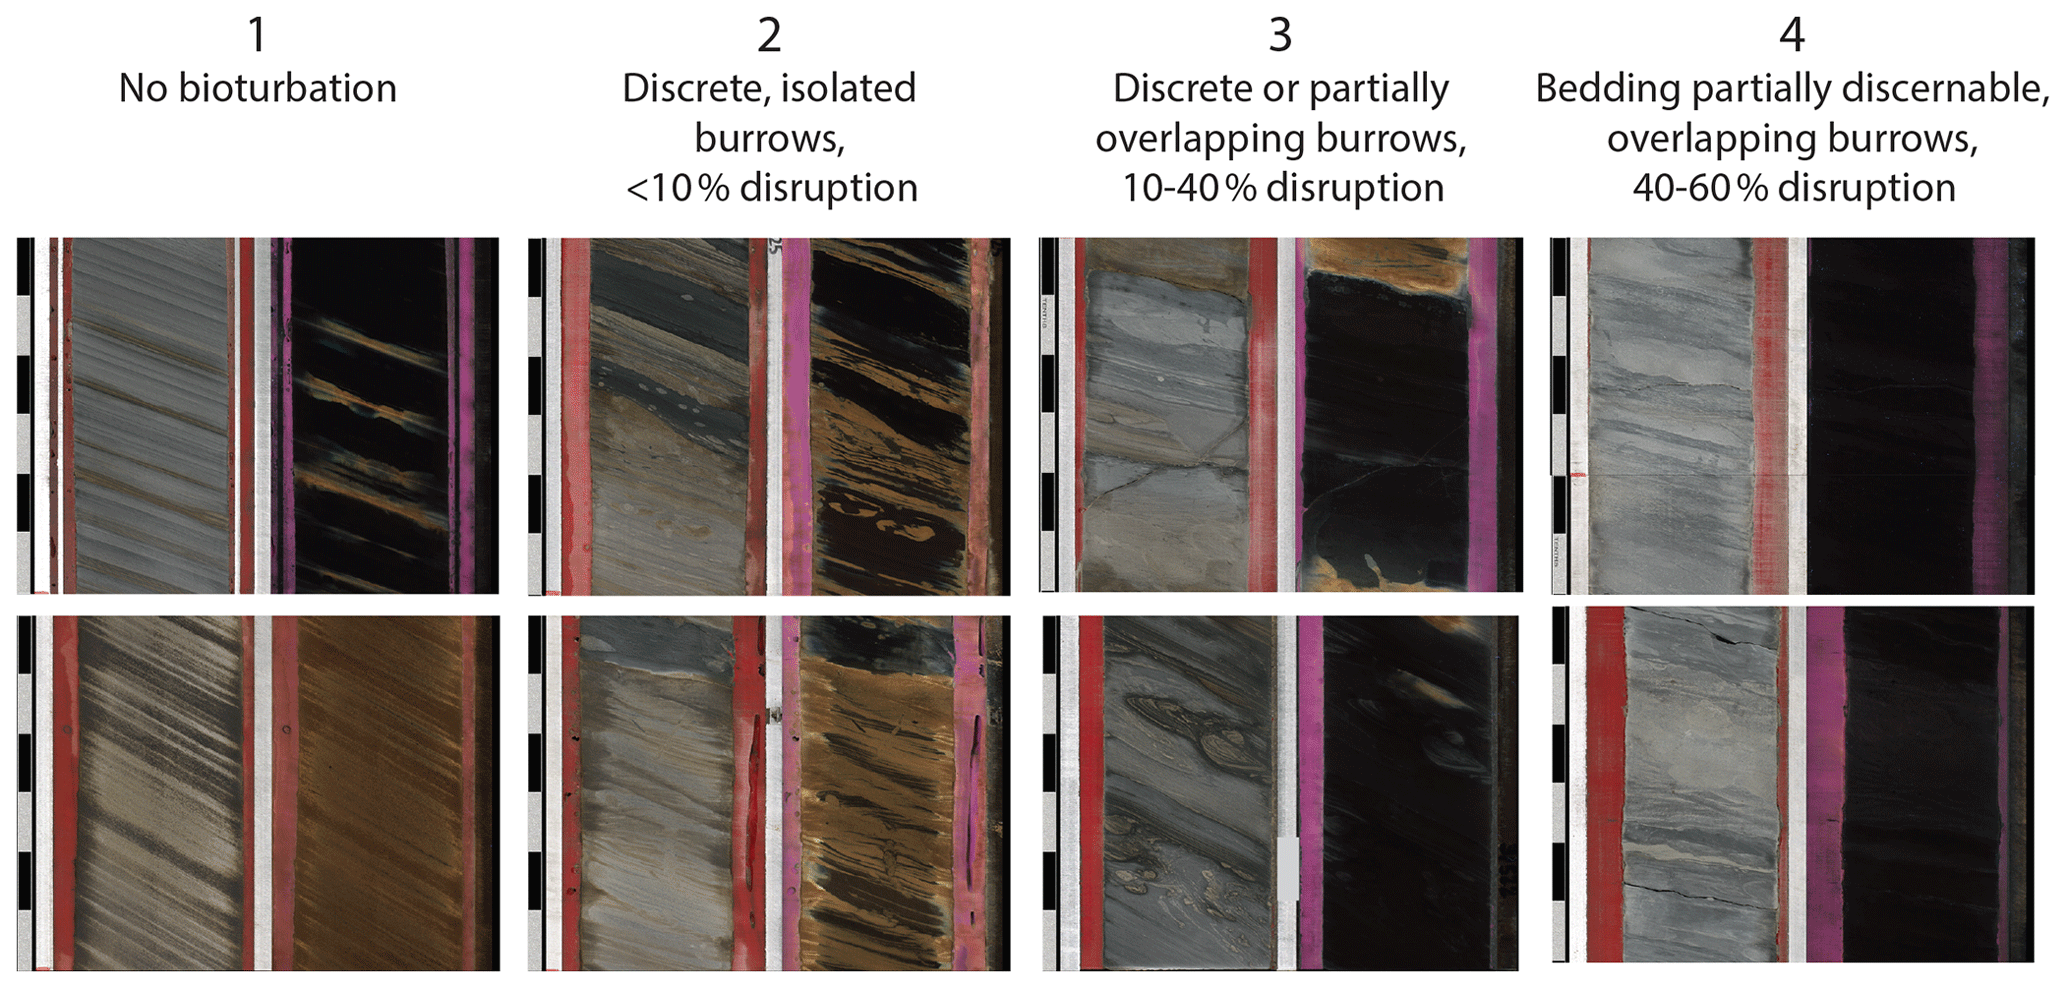
Figure 8Examples of different bioturbation indices in core photographs, with plain light on the left and ultraviolet light on the right. Bioturbation index values follow Droser and Bottjer (1986). The black-and-white scale bar shows units of 0.1 ft (∼0.03 m).
4.4.1 Nannofossils
Calcareous nannofossil assemblages are characterized by relatively low abundances in late Paleocene times, with an increase in abundance across the Paleocene–Eocene boundary and into the Eocene (Fig. 4). The CIE section is characterized by higher abundances and more diverse assemblages, including excursion taxa which are discussed below. Despite the low-abundance sections, the major nannofossil markers were in stratigraphic order and integrated with palynological, foraminiferal, and overall assemblage data to yield a robust biostratigraphic sequence (Fig. 4). Fasciculithus involutus and Fasciculithus tympaniformis (31 570–31 600 ft) are consistently present during the negative CIE with tops slightly younger than the recovery interval, indicating lowermost NP10 to uppermost NP9. Zone NP9 includes the CIE and is bracketed by tops Discoaster diastypus and Rhomboaster cuspis (31 570–31 600 ft), an acme of Fasciculithus tympaniformis (31 603.35 ft), a single occurrence of Discoaster araneus (31 660–31 690 ft), and top R. cuspis (31 730–31 760 ft). Although nannofossils are sparse in pre-CIE sections, several events within the core define the basal section of zone NP9, including top Discoaster multiradiatus (common) and top Helicosphaera kleinpelli and Helicosphaera riedelii (32 340–32 370 ft).
4.4.2 Foraminifera
Planktonic foraminifera are rare in the studied core and cutting samples. A cutting sample from 31 570–31 600 ft contains a single specimen of Subbotina velascoensis, the highest occurrence of which indicates the lower part of zone E1 (Ypresian). A core sample at 32 233.25 ft contains single specimens of Globanomalina pseudomenardii, Morozovella angulata, and Morozovella conicotruncata, plus several specimens of Igorina pusilla and Subbotina triloculinoides. The overlapping ranges of these taxa indicate zone P4b (Thanetian) as defined by Berggren and Pearson (2005, 2006) and Zarra et al. (2019). Two arenaceous events are noteworthy: the first downhole occurrences of abundant Bathysiphon eocenica at 31 690.7 ft and Rzehakina epigona at 31 926.4 ft, both of which occur in late Paleocene times at approximately 56.5 Ma (Table 2).
Table 2Key biostratigraphic events recorded in GOM Anchor 3 well.

*Denotes an event that is used in the calculation of average sedimentation rates. LDCO: last downhole common occurrence. HRO: highest regular occurrence. INCR: increase in abundance.
4.4.3 Palynomorphs
Terrestrial and marine palynomorphs fluctuate throughout the Paleogene and range from poor to excellent fossil recovery and preservation (Fig. 4). Key marker taxa and events were calibrated with calcareous nannofossil and foraminiferal events from GTS2016 (Ogg et al., 2016) and regional GOM events from previous studies (Wing et al., 2005; Hackworth et al., 2018; Zarra et al., 2019). The occurrence of the Apectodinium homomorphum acme event and rare top Apectodinium augustum at 31 634.75 and 31 600–31 630 ft, respectively, constrain the PETM interval (Fig. 4). This event is further constrained, both in cuttings and core, by the following terrestrial pollen extinction events including tops Spinaepollis spinosus (31 581.8 ft), Lanagiopollis cribellatus (31 570–31 600 ft), Holkopollenites chemardensis (31 600–31 630 ft), and Retitricolpites anguloluminosus (31 660–31 690 ft).
4.4.4 Best-fit depth–age interpretation (pre- to post-CIE)
The tops of biostratigraphically significant microfauna are detailed in the preceding paragraphs, but these tops do not necessarily occur at their first and last appearance datums. A best-fit line of correlation was made through as many of the events as possible to determine a preferred age–depth model for the Anchor 3 well. Table 2 lists the biostratigraphic events for the cored interval as well as cuttings from the Wilcox portion of the well. The depths, ages, and event names that were used in constructing the line of correlation are denoted with an asterisk. An important distinction in the results below is usage of the phrase “rock accumulation rates” instead of “linear sedimentation rates”. Rock accumulation rates represent average rates over a depth interval which may include condensed or eroded intervals that we are unable to resolve within the given framework (Carney et al., 1995). In contrast, linear sedimentation rates are instantaneous rates that are typically used in decompacted sections and within the context of shallow, late Pleistocene to Holocene sediment cores where detailed absolute ages are achievable with the precision of radiocarbon and radiogenic nuclides (Sadler, 1981).
Rock accumulation rates in the Anchor 3 Wilcox are generally rapid due to the accumulation of thick, sandy intervals averaging ∼0.12 m kyr−1. However, the 66 m interval below the CIE from the top of H. kleinpellii (31 843.35 ft) to the onset of the CIE at ∼31 623 ft shows a lower accumulation rate of ∼0.056 m kyr−1. Rock accumulation rates increase to ∼0.065 m kyr−1 from the onset of the CIE through the recovery phase (Table S4). The 12 m interval above the recovery phase, from 31 570 to 31 530 ft (tops Discoaster nobilis to Fasciculithus involutus), suggests a return to background rates of accumulation found in the pre-CIE interval, or ∼0.047 m kyr−1.
4.5 Integrated marine microfossil changes (nannofossils, palynology, and foraminifera)
Biostratigraphic data from the Anchor 3 core provide evidence of significant faunal changes and can be divided into three distinctive intervals: pre-, syn-, and post-CIE.
4.5.1 Pre-CIE interval (late Paleocene, Selandian to Thanetian)
Terrestrial palynomorphs comprise 30 % to 70 % of the palynomorphs in the pre-CIE interval with brief, periodic increases in marine-dominant excursions (>85 %) and a more prolonged marine-dominated interval (> 60 % to 80 %) at around 60 m prior to the main CIE (Fig. 4). Marine dinocysts were present in most samples, but due to the dilution by terrigenous material and preservation effects, pre-CIE abundances in some samples are based on relatively low counts (<50 cysts). Thus, assemblages in these low-abundance samples should be considered rough estimates. Two notable marine dinocyst abundance peaks of nearshore lagoonal and shelfal taxa occur in cutting samples at 31 790–31 820 ft and 31 820–31 850 ft. These samples are dominated by dinocysts in the Goniodomideae group (Cordosphaeridium complex, Operculodinium centrocarpum), the Spiniferites group, and initial increases and diversification of the Apectodinium complex. These dinocyst peaks are followed by increasing dominance of spores and pollen, particularly increases in fern spores Cicatricosisporites and Laevigatosporites at 31 660–31 690 ft and 31 690–31 730 ft cutting intervals, as well as persistent Pediastrum and Inaperaturopollenites hiatus.
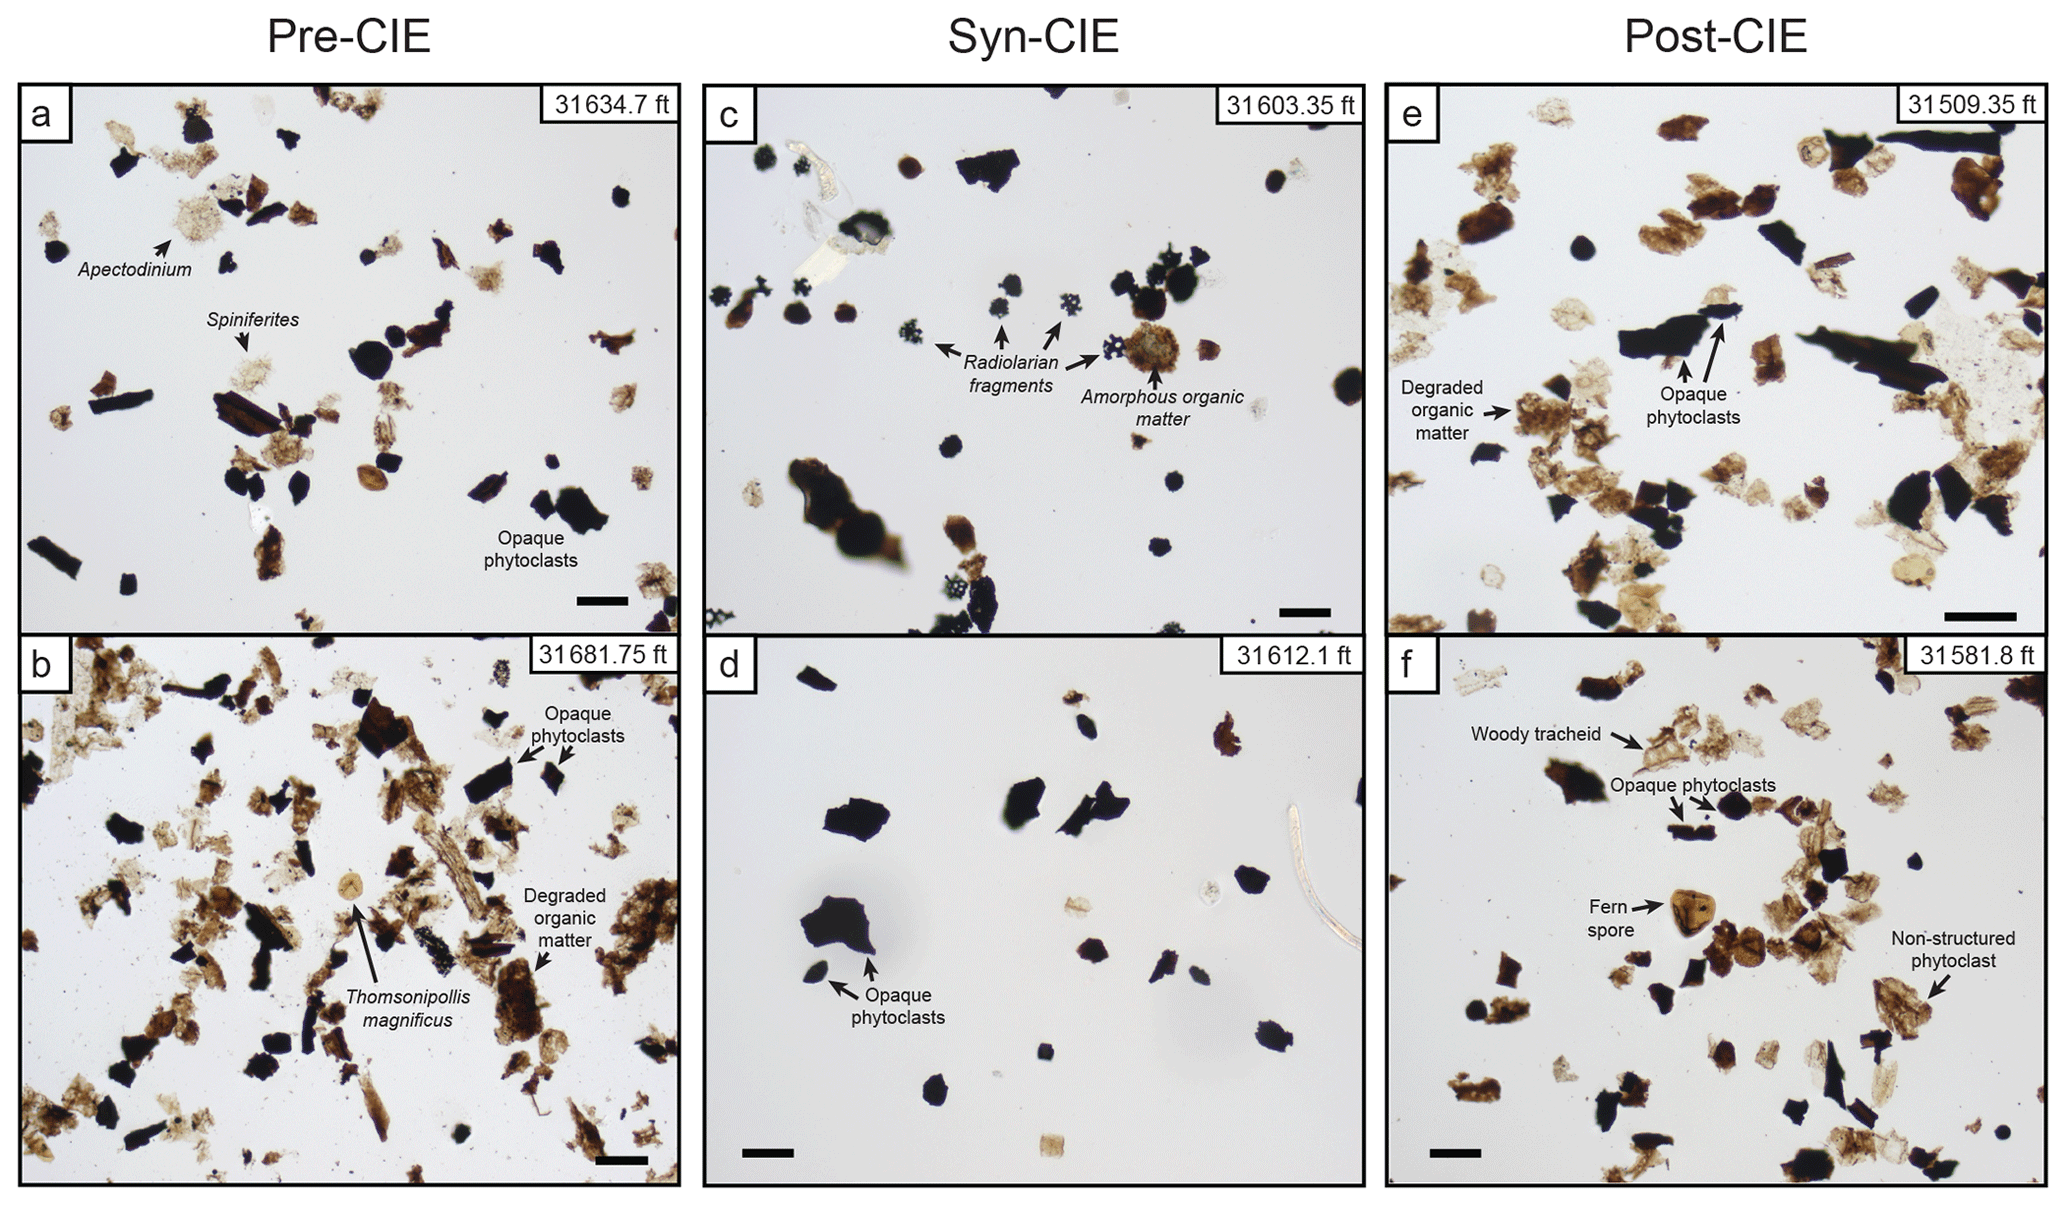
Figure 9Photomicrographs of phytoclast and organic matter slides from core samples. The black scale bar is 50 µm. (a) Mixed continental–marine palynofacies. Opaque to dark brown equidimensional “coaly” phytoclasts and light brown “fresh” phytoclasts with visible plant structure, along with some degraded organic matter, pollen, spores, and dinocysts (note the presence of Apectodinium homomorphum). (b) Terrestrially derived, translucent structured phytoclasts and non-structured light brown to darker brown organic material with microspores. Includes larger equidimensional coaly black-brown opaque phytoclasts. (c) Low abundance of organic material. Degraded, opaque coaly phytoclasts, non-structured amorphous organic matter, and pyritized radiolarian fragments. Terrestrial pollen, spores, and marine dinoflagellates are absent. (d) Lower abundance of organic material, dominated by opaque, equidimensional inertinite and degraded phytoclasts. (e) Mixed continental palynofacies with structured laths, equidimensional black-brown inertinite, and non-structured light brown fresh phytoclasts. Pollen and spores present. Rare to no marine dinocysts. (f) Mixed continental palynofacies with structured laths, equidimensional black-brown inertinite (coaly debris), and non-structured to structured brown, fresh phytoclasts (cuticles, resinous fragments, tracheidal structures). Pollen and spores present. Rare to no marine dinocysts.
Kerogen preps with a low C M ratio are abundant in terrestrially derived organic matter (OM) consisting of opaque to dark brown blocky phytoclasts, translucent phytoclasts (such as trachs and cuticle fragments), and pollen and spores (Fig. 9a, b). A low-diversity assemblage of arenaceous foraminifera occurs in samples below the CIE interval and includes Bathysiphon eocenica (Nothia robusta?), Hormosina velascoensis, Spiroplectammina spectabilis, and Trochamminoides spp. (Trochamminoides variolarius). Other forms of arborescent foraminifera include delicate fragments of small, and sometimes “glassy”, forms of Bathysiphon, which are probably varieties of Nothia excelsa. The assemblage of foraminifera in this interval, particularly Spiroplectammina spectabilis, suggests the middle to lower part of the upper bathyal zone, or in the range from 500 to 700 m water depth (Van Morkhoven et al., 1986). In general, species attributable to Nothia are found in assemblages inhabiting water depths not shallower than the upper bathyal zone (Kaminski et al., 1996).
Radiolarian shells are present in low numbers (10–50 specimens) in many samples from the >63 µm fractions throughout the pre-CIE interval, with only one sample at 31 813.25 ft exceeding 10 000 specimens (Fig. 4). Preservation is poor to moderate with significant recrystallization and silica infilling of the frustule. Although preservation is poor, radiolarian shells were still preserved well enough to distinguish between the orders Spumellaria and Nassellaria; all assemblages are dominated by Spumellaria. In the modern Gulf of Mexico, significant radiolarian accumulations are found in sediments deposited on the continental slope (Pflum and Frericks, 1976).
Nannofossils are very sparse from 32 370–33 660 ft, but markers can still be found with effort (Fig. 4). The base of Discoaster multiradiatus is interpreted at 32 233.25 ft, which is uncharacteristically deeper than the top of Heliolithus kleinpellii at 31 843.35 ft. The top of Heliolithus riedelii at 32 340–32 370 ft is of significance for designating oil and gas plays at approximately 57 million years, followed by the base and top, respectively, of Toweius eminens and a younger form of Fasciculithus magnicordis in the upper Selandian. Although F. magnicordis generally occurs within older portions of the section, two variations are noted at shallower depths with slightly modified morphology of the central body that distinguish them from the holotypic F. magnicordis.
4.5.2 Syn-CIE and recovery phase (late Paleocene to earliest Eocene)
The relative abundance of marine dinocysts increases from 27 % to 61 %, with counts of Apectodinium spp. increasing in relative abundances from 19 % to 39 % (between the cutting sample at 31 660–31 690 ft and core sample at 31 634.70 ft), ∼3.5 m below the onset of the CIE (Fig. 4). The increase in Apectodinium (particularly A. homomorphum) is immediately followed by two core samples (31 612.1 and 31 603.35 ft) within the main CIE that have low palynomorph abundances and a dramatic change in kerogen represented by opaque phytoclasts, fragments of pyritized radiolarians, and a near absence of terrestrial and marine organic matter (Fig. 9c, d).
Sample residues in the size fraction >63 µm are generally absent of microfossils, except for arenaceous foraminifera and radiolarians. Arenaceous foraminifera characterize the low-abundance foraminiferal assemblage, with indeterminate specimens and numerous fragments of small Bathysiphon spp. (Nothia excelsa?). Radiolarians occur in both core and cutting samples, with the highest abundances reaching as many as 10 000 specimens per sample at 31 603.35 and 31 612.10 ft.
Calcareous nannoplankton increase in abundance significantly across the CIE, with the most notable peaks in Rhomboaster cuspis, Bomolithus elegans, and Fasciculithus species; Toweius species; and Discoaster species at 31 603.35 ft. An acme of D. multiradiatus, the generic Eocene Discoaster sp. at 31 600–31 630 ft, co-occurs with acmes in Heliolithus spp., Fasciculithus spp. (particularly F. tympaniformis), and Toweius spp.
The CIE recovery phase is defined by C M ratios of 0.43 and 0.84 with the return of translucent phytoclasts, nearshore and shelfal dinocysts (dominated by Apectodinium and Spiniferites), and terrestrial pollen and spores (Fig. 4). These changes, in association with a peak in freshwater Pediastrum and increases in Bathysiphon sp. and agglutinated forams, point to increasing terrestrial sediment influences. Among nannofossils, this interval marks a decline in Rhomboaster cuspis and Fasciculithus species and maintains relatively high abundances of Discoaster spp. (mainly D. multiradiatus and D. lenticularis).
4.5.3 Post-CIE (early Eocene, Ypresian)
Following the negative CIE, terrestrial palynomorphs range from 65 %–98 % of relative abundance with significant floral changeover documented in the terrestrial pollen–spore assemblages, most notably a decline in Juglandaceae (Carya and Momipites types) and persistence in normapolles, Thomsonipollis magnificus, and Nudopollis terminalis. The marine palynological component documents an overall decline in species diversity and abundance, particularly in Apectodinium spp., which declines to <5 % in the post-CIE interval. Kerogen is dominated by mixed opaque and translucent phytoclasts, with abundant terrestrial spores and pollen indicating a strong influence of terrigenous material at this locality (Fig. 6e, f).
Calcareous nannofossil excursion taxa decline in abundance above the CIE in both core and cutting samples and are replaced by abundant fasciculiths and an acme of D. multiradiatus and Toweius spp. Foraminifera decrease, except for arenaceous fragments and small undifferentiated forms of Bathysiphon spp. Several specimens of moderately well-preserved Nuttalides truempyi, which are diagnostic of lower bathyal to abyssal water depths (1000 to 2000 m; Van Morkhoven et al., 1986), were observed in the cutting sample from 31 570–31 600 ft. Super-abundant radiolarians (>10 000 specimens), dominantly Spumellaria, occur at 31 509.35 ft.
4.6 Chemical index of alteration (CIA)
In total, 73 mudstone and 48 sandstone samples were analyzed for major element geochemistry using XRF. Of the mudstone samples, 10 samples were excluded from CIA calculation due to the presence of calcite, which can artificially depress calculated CIA values (Hessler et al., 2017). All but two of these calcite-bearing samples occur within the calcareous subtype of LF-1 that occupies the upper portion of the main CIE (Fig. 7). High calcareous nannofossil recovery in this zone suggests a biogenic source of calcite in these samples (Fig. 4). The remaining 63 mudstone samples yield an average CIA of 66. However, a step-like shift in CIA occurs ∼4 m above the CIE onset (between samples 117 and 116). Below this shift, 88 % of samples have CIA higher than average, and above this shift 77 % of samples have CIA lower than average (Fig. 7).
Of the sandstone samples analyzed, five samples exhibited anomalous cementation as confirmed by XRD analysis and were excluded from CIA calculation (Figs. 7, S1). The average CIA for the remaining 43 sandstone samples is 55.8. Similar to the mudstone samples, CIA values from sandstone samples exhibit a step-like shift towards lower values upwards in the section. However, the shift occurs within the CIE recovery (between samples 97 and 80), ∼9 to 10 m above the CIE onset and ∼ 5–6 m higher than the corresponding shift in mudstone CIA values (Fig. 7). Below this shift, 95 % of samples yield a CIA that is higher than average, and above the shift 90 % of samples have a CIA that is lower than the average value (Fig. 7).
5.1 Sedimentological expression of the PETM, deepwater Gulf of Mexico
5.1.1 Lithology
The PETM is manifested in four distinctive lithologic intervals (A–D; Fig. 5). Unit A comprises the lower 1.7–2.3 m of the CIE and is characterized by sedimentary facies and organic content similar to the underlying 66 m, suggesting a lag between the onset of the PETM and its associated lithologic response (Fig. 5; see also Sect. 5.1.4). Unit B extends from the top of Unit A to ∼4.5 m above the onset of the CIE and represents a transition to organic-lean claystone that is conspicuously poor in palynomorphs, silt, and sand relative to below (Fig. 4). A similar pattern was observed in the Logan-1 well, where the CIE main body was comprised of a basal sand-rich package overlain by the Yoakum shale (Vimpere et al., 2023). Although the PETM CIE was not identified in the wells studied by Cunningham et al. (2022), they reported that other GOM PETM sections were dominantly light gray shale, with rare siltstone and marlstone. Together, these records suggest that the PETM was manifested by an increase in fine-grained deposition, following a lag, over the greater Wilcox deep-sea fan.
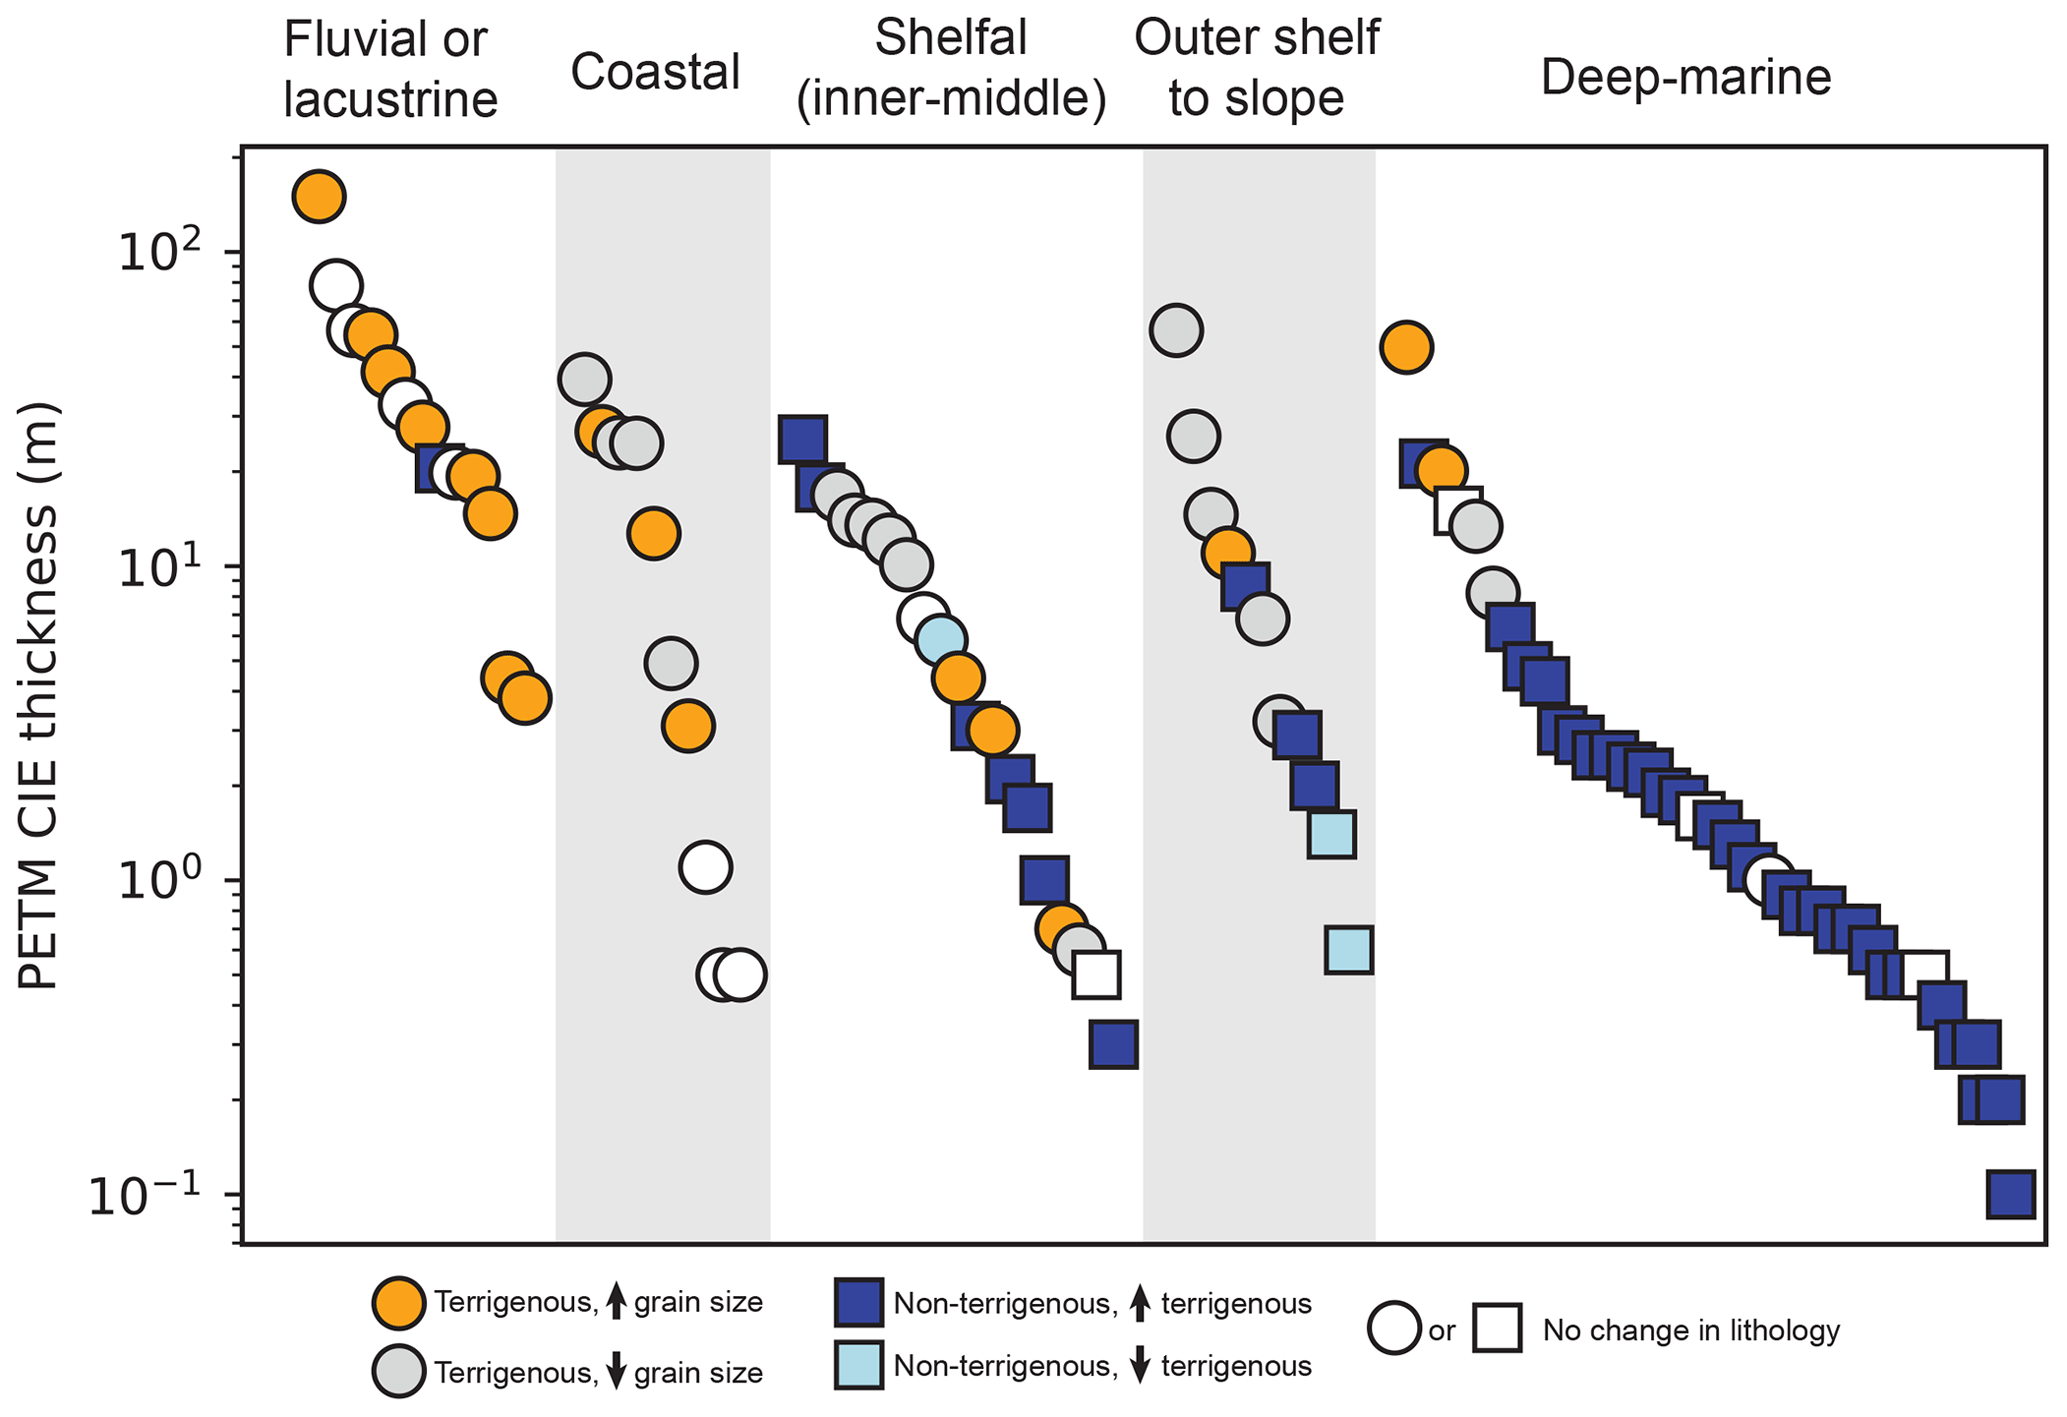
Figure 10PETM CIE thickness plotted in descending order by depositional environment (see Table S1). Marker shape corresponds to dominant sediment source (terrigenous vs. non-terrigenous), and marker color corresponds to lithologic change from before to during the PETM. Localities where lithologic change is uncertain are not shown.
Many other distal marine PETM sections (shelfal, slope, deep sea) that are connected to terrigenous sediment sources also show an increase in clay deposition (i.e., decrease in grain size) during the PETM CIE, including in nearshore shelfal sediments in Spitsbergen (Harding et al., 2011), inner–middle neritic sediments of New Jersey (Self-Trail et al., 2012), outer-shelf to slope sediments of central California (John et al., 2008), and outer neritic to deep-marine sediments of the North Sea Basin (Kender et al., 2012; Schoon et al., 2015) (Fig. 10). Sømme et al. (2023) used a combination of three-dimensional reflection seismic data and well penetrations in the Norwegian Sea to show that the PETM was manifested by progradation of large, mud-rich basin-floor fan with rates of sediment supply increasing as much as 4-fold relative to background values. Most open-marine, non-terrigenous PETM localities also show an increase in clay relative to carbonate during the PETM that is thought to reflect a combination of carbonate dissolution due to ocean acidification and enhanced rates of terrestrial sediment delivery to the global ocean (Zachos et al., 2005; Sluijs et al., 2008a). Indeed, the few PETM sections that display no change or an increase in carbonate content are considered anomalous and have been ascribed to either extreme increases in primary productivity (e.g., Bolle et al., 2000) or distance from terrestrial landmasses (e.g., Jiang and Wise, 2009; Robinson et al., 2011). Thus, lithologic change during the PETM within the Wilcox deep-sea fan shares a similar pattern to many other marine PETM localities that experienced increased accumulation rates of terrestrial clay (Fig. 10; see also Sect. 5.4).
Unit C lies within the main CIE and reflects a lithologic change to marlstone with an associated increase in CaCO3 relative to underlying claystone and rare siltstone in Unit B (Figs. 5 and 7). High abundances of calcareous nannofossils in Unit C suggest a biogenic origin of the calcite (Fig. 4). Concentrations of CaCO3 are generally very low in the siliciclastic-dominated Wilcox Group, and thus the marlstone of Unit C is anomalous. An initial rapid decrease and subsequent recovery in CaCO3 are common characteristics of open-marine PETM localities that record ocean acidification and shoaling of the calcite compensation depth (CCD) during the early stages of the PETM (e.g., Zachos et al., 2005). The excursion taxa Rhomboaster spp., which have the highest abundances in the main CIE (Fig. 4), have also previously been associated with low pH conditions (Self-Trail et al., 2012), and Vimpere et al. (2023) reported a dissolution interval within the early part of the main CIE body in the Logan-1 well. Thus, ocean acidification in the Gulf of Mexico during the early PETM may explain the lack of CaCO3 in Unit B relative to Unit C (Canudo et al., 1995; Bralower et al., 1997; Colosimo et al., 2005; Zachos et al., 2005; Raffi et al., 2009; Self-Trail et al., 2012; Penman et al., 2014; Gutjahr et al., 2017). Corresponding, the increased carbonate deposition of Unit C may reflect enhanced coccolithophore production in Gulf of Mexico surface waters that ultimately contributed to CO2 drawdown (e.g., Kelly et al., 2005). Assuming an average sedimentation rate of 0.063–0.068 m kyr−1 for the ∼13 m thick PETM CIE (∼200 kyr; Westerhold et al., 2018), we calculate deposition of CaCO3-rich mudstone to postdate the onset of the PETM by 70±7.5 kyr, an estimate that is in good agreement with deeper Ocean Drilling Program sites 1262 and 1267 from the South Atlantic and site 690 from the Weddell Sea that show CaCO3 increases beginning ∼ 60–80 kyr after CIE onset (Kelly et al., 2005; Zachos et al., 2005).
Unit D, which is interpreted to represent the CIE recovery, exhibits a return to thinly bedded mudstone and siltstone (LF-2) that is similar to pre- and post-CIE fine-grained deposits (Fig. 7). Unit D records a resumption of silt delivery to the basin that shows a corresponding change in kerogen type with an increase in well-preserved, structured terrigenous phytoclasts as well as pollen and spores mixed with shelfal to neritic dinocysts that is often indicative of turbiditic muds (Tyson, 1995) (Fig. 9e, f). Vimpere et al. (2023) reported a similar return to coarser-grained deposition during the uppermost CIE main body and recovery phase in the Logan-1 well. Although lowermost Eocene (post-CIE) lithofacies are generally comparable to those in the uppermost Paleocene (pre-CIE) (Fig. 7), there is some indication of a persistent change following the PETM. Gamma ray log motifs change from coarsening-upwards to fining-upwards (Fig. 7), suggesting a possible change in deepwater stratigraphic architecture. This observation, in combination with the appearance of extensive mudclast conglomerate associated with thickly bedded sandstone in the lower Eocene, may suggest an increase in deepwater channelized facies across the Paleocene–Eocene boundary (Figs. 7 and 11). Terrestrial spores and pollen become dominant over marine dinocysts following the PETM, indicating a corresponding increase in terrigenous sediment flux relative to late Paleocene times (Fig. 3). Thus, the Anchor 3 core may reflect an increase in terrigenous sediment supply to the deepwater GOM that persisted long after the PETM, similar to the inferences of some other studies (Foreman et al., 2012; Borneman et al., 2014).
5.1.2 Organic content
Units B and C of the main CIE display a ∼ 6-fold decrease in TOC relative to the pre-CIE and post-CIE shale average of ∼0.9 % (Fig. 4). The pronounced decrease in TOC in the Anchor 3 core during the PETM CIE is anomalous relative to many other marine PETM sites that exhibit enhanced rates of organic carbon burial (e.g., Gavrilov et al., 2003; Sluijs et al., 2008a; Schoon et al., 2015). However, nearshore shelfal sediments of the Van Mijenfjorden Group in Spitsbergen display an approximately 2-fold drop in TOC from ∼3 % before the PETM to ∼1.5 % during and after the CIE (Harding et al., 2011), a similar albeit less-pronounced decline in TOC compared to the Anchor 3 core. Ditch-cutting samples from the Logan-1 well also display a decrease in non-extractable organic carbon during the PETM, with averages of ∼2.0 % prior to the CIE and ∼1.4 % during the main CIE (Vimpere et al., 2013).
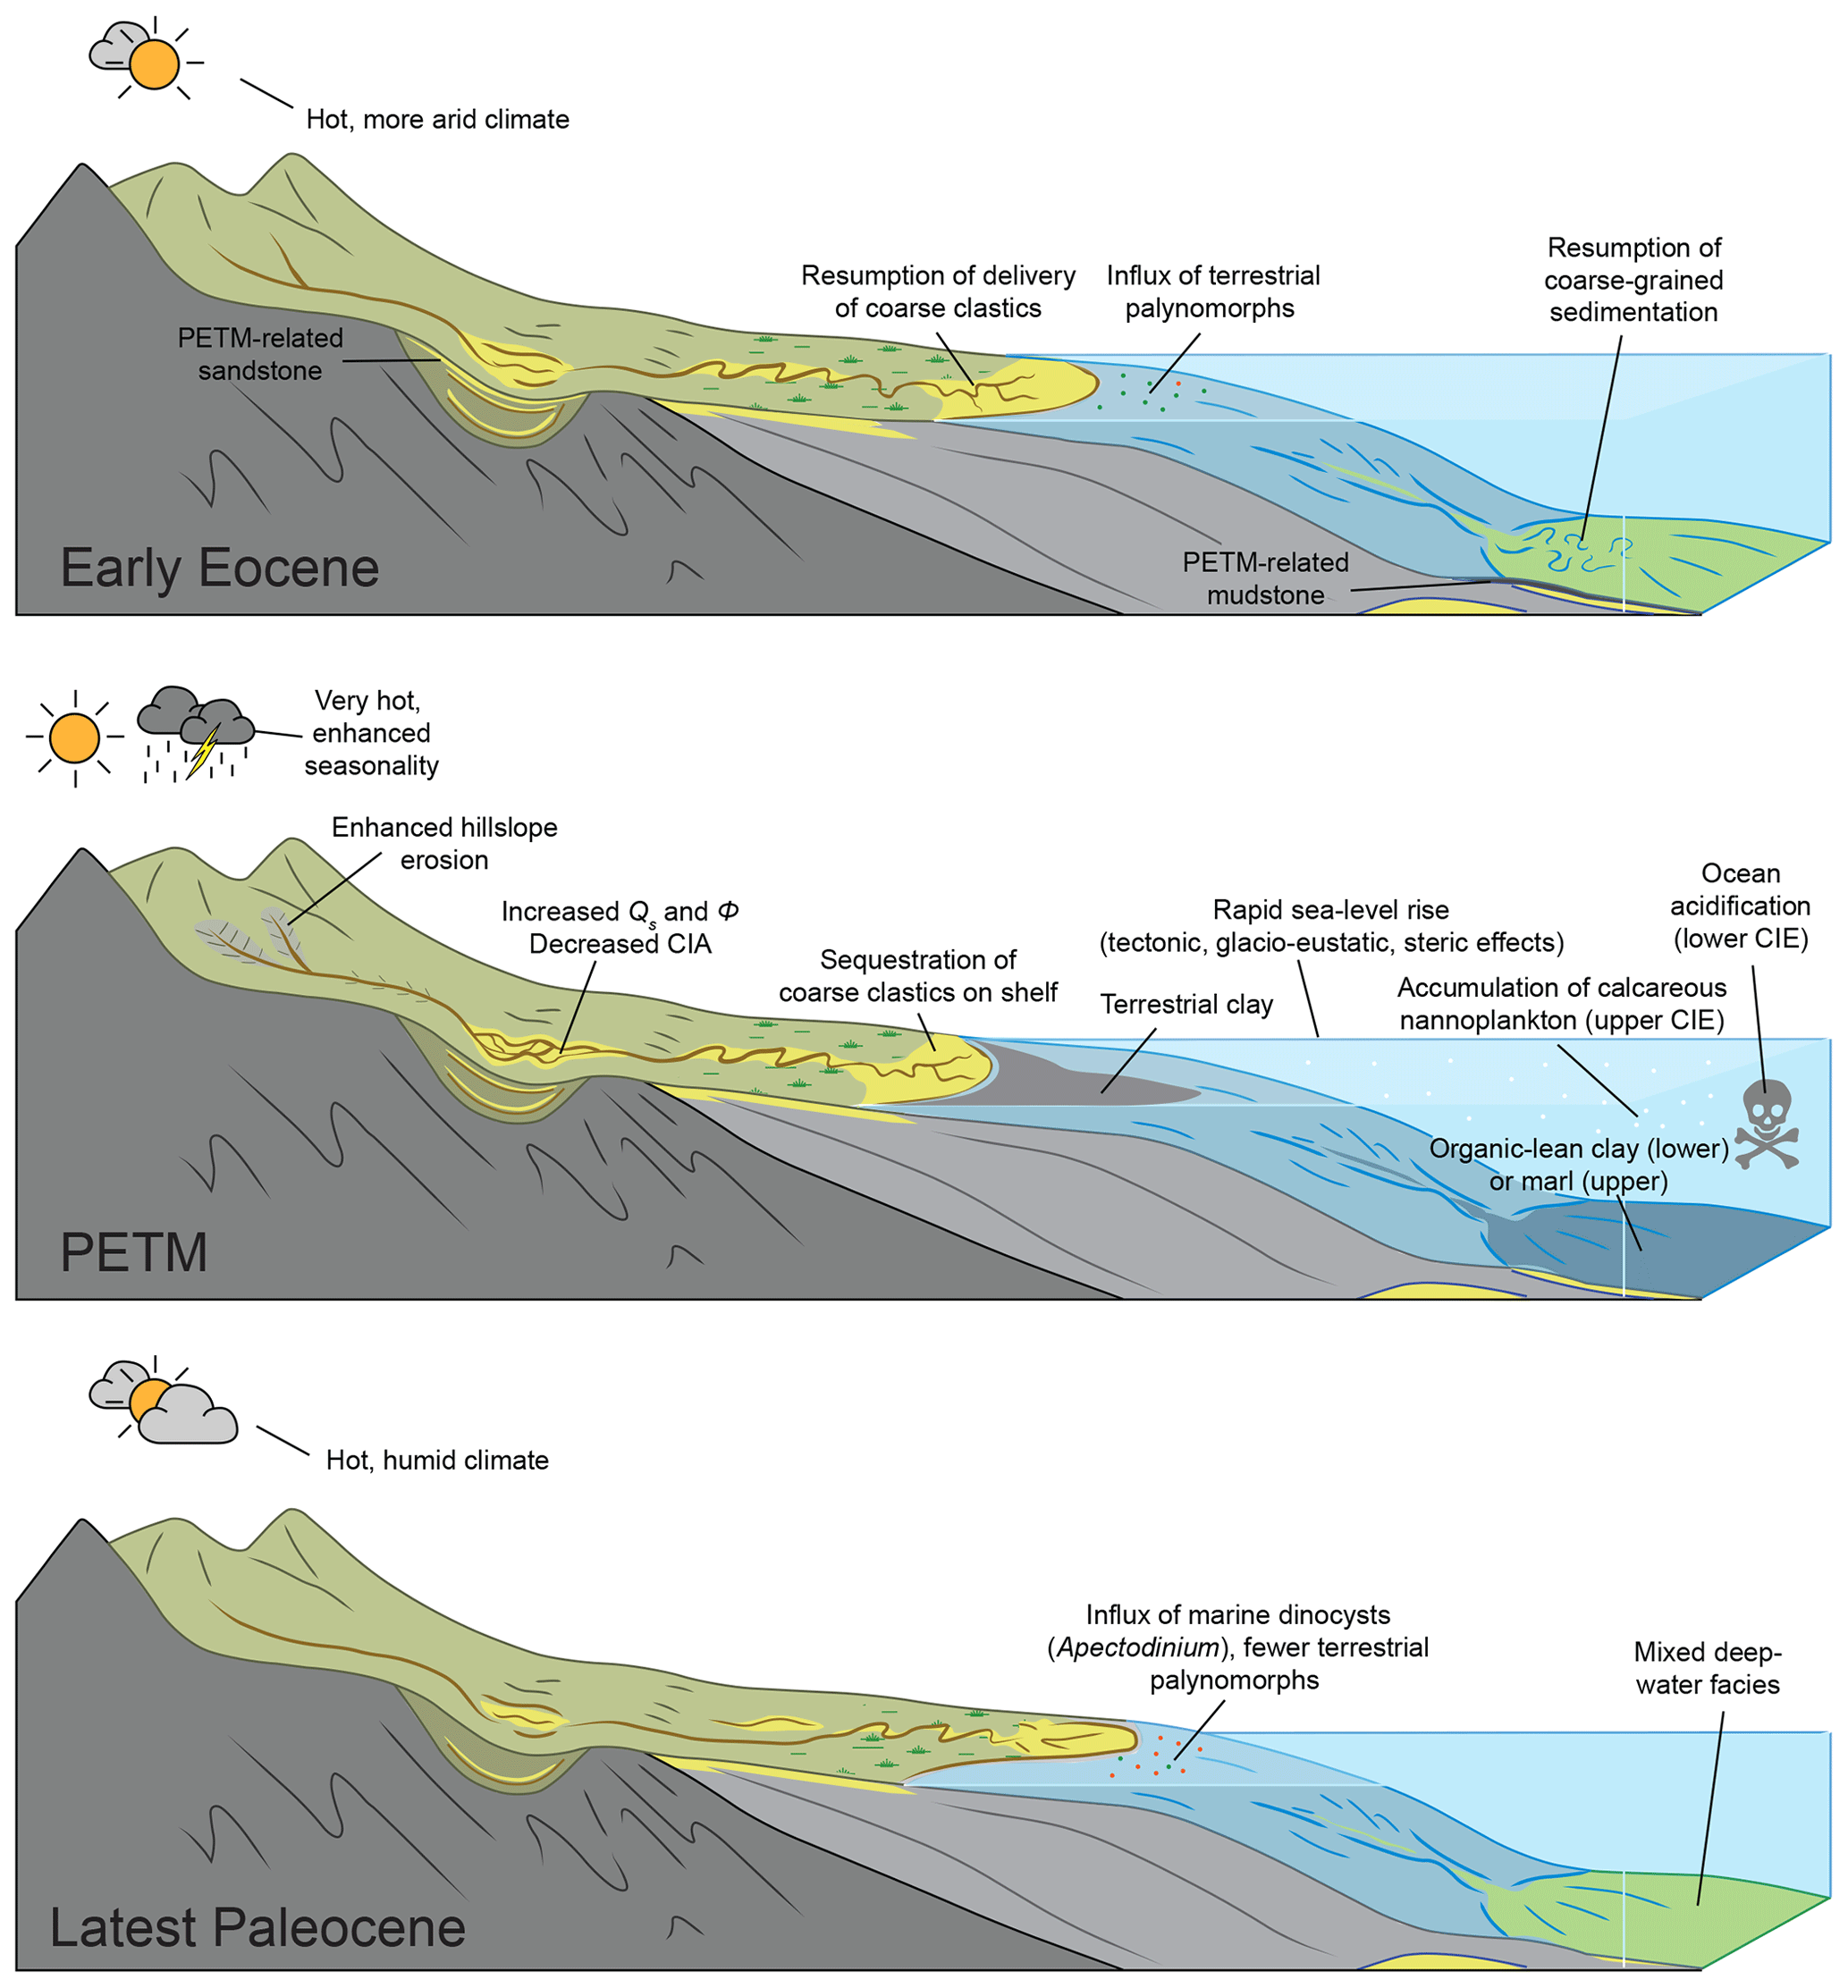
Figure 11Interpreted patterns of sediment delivery from land to the deep sea before, during, and after the PETM (modified from Romans and Graham, 2013; see Discussion text).
Decreased TOC within Units B and C of the main CIE may reflect an influx of TOC-poor terrigenous clay into the Gulf of Mexico relative to the influx of marine organic carbon or possibly organic degradation within the expanded shallow marine environment given sea-level rise (Sluijs et al., 2008b, 2014). Decreased paleosol TOC within the western United States has been linked to enhanced oxidation of organic matter within terrestrial environments during the PETM (Wing et al., 2003; Carmichael et al., 2017). Visual examination of kerogen slides from core and cutting samples indicates the presence of degraded, likely oxidized, terrigenous carbon that includes black structured to non-structured carbonized debris and inertinite (Fig. 9c, d). The low TOC within claystone and marl of Units B and C is thus suggestive of extreme siliciclastic dilution relative to primary marine productivity in the Wilcox deep-sea fan. Thus, unlike marine shales that are thought to reflect condensed sections formed by sediment starvation to the basin, the clay-rich shale and marlstone of the PETM likely reflects a pronounced increase in terrigenous clay delivered to the deep sea (Fig. 11). The abundance of degraded, coaly, and inertinitic kerogen within the PETM likely contributes to the overall noisy character of the δ13Corg excursion, with some terrestrial carbon possibly being recycled from erosion of older sedimentary units (e.g., Sluijs and Dickens, 2012; Aze et al., 2014). As with the δ13Corg record from the Logan-1 well (Vimpere et al., 2023), these considerations highlight the uncertainty with defining the boundary between the main CIE and the CIE recovery intervals given the variability in character of the δ13Corg excursion.
The organic content of Unit D fluctuates between pre-CIE and main CIE values (Fig. 5), perhaps reflecting delivery of organic carbon from different sources (e.g., Aze et al., 2014), varying rates of sediment accumulation relative to marine productivity, and/or delivery of less-oxidized organic matter to the basin. Carbonaceous organic debris was noted frequently in visual inspection of samples from Unit D relative to Units B and C of the main CIE (Fig. 5). Thus, the CIE recovery recorded in Unit D is interpreted to record a transition from low-TOC, clay-rich deposition during the main PETM CIE to more typical Wilcox Group lithologies that were deposited post-CIE.
5.1.3 Chemical weathering
The CIA has been used as a proxy for silicate mineral weathering (e.g., McLennan, 1993; Hessler et al., 2017) but is also influenced by grain size (Zhou et al., 2015; Hatano et al., 2019), provenance (Xiong et al., 2010), and the presence of carbonate and phosphate minerals (e.g., calcite, apatite). CIA values for both mudstone and sandstone display a step change at the approximate location of the PETM from higher values in the uppermost Paleocene to lower values in the lowermost Eocene (Fig. 7). The shift to lower CIA values within and after the PETM is anomalous relative to many other PETM sections that have been interpreted to record enhanced chemical weathering during the PETM (e.g., Ravizza et al., 2001) and, more generally, early Eocene times relative to late Paleocene times (Hessler et al., 2017). For instance, CIA values drop only briefly during the PETM onset before increasing during the main CIE and recovery in outer-shelf deposits of Spitsbergen (Wieczorek et al., 2013). Similarly, Chen et al. (2016) show a gradual increase in CIA during the PETM in lacustrine sediments of central China. Increased CIA values in the Tethys during deposition of highly organic sediments have been associated with erosion of highly weathered soils (Dickson et al., 2014).
One interpretation for this pattern could be a transition to deposition of less-weathered sediment during and after the PETM, with the shift occurring earlier in mudstone (approximately 3.8–4.2 m above the CIE) than in sandstone (approximately 9.5–9.9 m above the CIE; Table S4). Alternatively, decreasing CIA values could reflect a change in the abundance of carbonate minerals. Because we did not observe evidence of calcite in our XRD data (i.e., excluding anomalously cemented samples and marly samples of Unit C) and counts of calcareous nannoplankton were low outside Unit C of the CIE (Fig. 4), we see little evidence of increased CaCO3 driving lower CIA values in the earliest Eocene. Similarly, we did not detect a systematic change in grain size between sandstone and shale samples of Paleocene vs. Eocene age (Fig. 7).
The shift to lower CIA values within and after the PETM in the Anchor 3 core appears to be consistent with previous research that has inferred enhanced erosional denudation within central North America. For instance, Foreman et al. (2012) suggested a system-wide cleansing of catchment colluvium and an associated increase in bedrock erosion during the PETM, associated with both vegetation change (e.g., Wing et al., 2005) and an intensification of the hydrologic cycle. More recently, Jepson et al. (2022) used low-temperature thermochronological data to infer an increase in erosional exhumation during the PETM in the Bighorn Basin in Wyoming. CIA values increase upwards in soil profiles (Nesbitt and Young, 1982) such that erosion into deeper levels of soil profiles may produce CIA values that become closer to fresh bedrock (CIA of ∼45 for average continental crust; McLennan, 1993). The negative relationship between denudation rate and CIA of suspended sediment in modern rivers (McLennan, 1993) is consistent with the inference that an increase in denudation rate during the PETM could result in a lowering of CIA values of terrigenous sediment reaching the GOM.
5.1.4 Temporal lags in PETM signals
Although the global negative CIE associated with the PETM was synchronous with warming (Zeebe et al., 2016), lithologic changes in both the Logan-1 and Anchor 3 wells lagged behind the onset of the PETM (Vimpere et al., 2023; Figs. 5 and 7). In the Logan-1 well, this lag accounts for ∼13 % of the total CIE thickness (Vimpere et al., 2023), which is similar to the Anchor 3 well where the lag is ∼15 % of the CIE thickness (Fig. 7). Following the approach of Duller et al. (2019), we estimate an approximate temporal lag of 31±6.2 kyr between the onset of the PETM and the abrupt reduction in grain size that marks the transition between Units A and B. A similar delay in the sedimentary response to the PETM was noted by Duller et al. (2019), who estimated temporal lags of 16.5±7.5 and 16.5±1.5 kyr for terrestrial and deep-marine sites, respectively, in the Spanish Pyrenees. In proximal, fluvial environments the temporal lag was associated with a delay in coarse-grained (conglomeratic) sedimentation, whereas in deep-marine environments the lag was associated with a delay in increased mass accumulation rates of terrestrial clay, which replaced limestone as the dominant lithology during the PETM (Schmitz et al., 2001; Duller et al., 2019). John et al. (2008) inferred a ca. 20 kyr delay in increased mass accumulation of carbon and carbonate in PETM sites in central California and the New Jersey shelf. A deep-marine PETM section within the North Sea also displayed a lag of ∼ 1–2 m between the onset of the CIE and a transition to laminated mudstone (Kender et al., 2012), although the lack of definition of the CIE recovery precludes calculation of a lag time at this locality.
Theoretically, PETM-related signal lag times should depend on a number of factors summarized by Tofelde et al. (2021) that include (1) the sediment size fraction that carries the signal, with signals held in the finer-grained fraction propagating downstream more quickly than those held in coarser sediment fractions; (2) the relative proximal-to-distal position of the site of deposition, where proximal sites record changes sooner than distal sites; and (3) for marine sections, the degree of connectivity to upstream fluvial systems (e.g., Bernhardt et al., 2017). The delay in shut-off of sand and silt to the Wilcox deep-sea fan is likely related to rapid sea-level rise during the onset of the PETM that culminated in maximum flooding during the CIE peak, ∼ 10–13 kyr after the onset (Sluijs et al., 2008b; Harding et al., 2011). Deposition of sand and silt in Unit A thus persisted well after maximum flooding had been obtained. Continued coarse-grained sedimentation may reflect mobilization of sediment already staged within the submarine portion of the sediment-routing system that continued to move basinward, despite a shut-off in supply of coarser-grained sediment.
Similarly, the delayed arrival of abundant terrestrial clay to the Wilcox deep-sea fan likely reflects the timescale over which the PETM signal of increased terrigenous sediment supply was transferred to the distal portion of the Wilcox sediment-routing system. Numerical and analog experiments suggest that changes in climatic boundary conditions (e.g., an increase in precipitation) are manifested rapidly as a change in the amount of sediment exported from erosional landscapes (Bonnet and Crave, 2003; Armitage et al., 2011) such that the signal onset time (sensu Tofelde et al., 2021) is close to zero. Thus, the 31±6.2 kyr lag between CIE onset and lithologic response likely represents the time for the signal of increased sediment generation to be transferred hundreds of kilometers to the site of deposition in the Wilcox sediment-routing system, rather than reflecting a delay in landscape response to the PETM.
5.2 Biotic expression Paleocene–Eocene boundary interval, deepwater Gulf of Mexico
The marine biotic response to the climatic warming event of the PETM is well documented in localities worldwide (e.g., Thomas and Shakleton, 1996; Kahn and Aubry, 2004; Crouch et al., 2001; Sluijs et al., 2007a; Denison, 2021) and in the GOM, where it is reflected in assemblage changes or turnover in specific groups of single-celled planktonic organisms, most notably marine dinoflagellates, benthic foraminifera, and calcareous nannoplankton. Interpreting the deepwater GOM record at any single location may be complicated by a limited recovery of calcareous microfossils, but distinct trends noted in wells across the basin and in the Anchor 3 core suggest that multiple factors played a role in calcareous and organic fossil abundances. Published data from other GOM PETM localities are limited because of relatively few borehole penetrations and the often proprietary nature of company data, making this record an important addition to understanding both the global and regional variability of this event. The Anchor 3 core provides an opportunity to better understand the complex relationship between deepwater depositional facies and processes, climatic changes, and preservation of fossil abundances in a bathyal PETM section.
The diversity and distinctiveness of faunal patterns in dinocyst data at Anchor 3 record similar trends in common late Paleogene taxa (including Apectodinium group) documented in onshore eastern GOM localities (e.g., Slujis et al., 2014; Harrington and Kemp, 2001; Denison, 2021) and other localities worldwide (e.g., Crouch et al., 2001; Steurbaut et al., 2003, Sluijs et al., 2007a; Sluijs and Brinkhuis, 2009; Frieling and Sluijs, 2018; Smith et al., 2021). Short-lived taxa increases prior to the CIE occur in the Cordosphaeridium complex, Eocladopyxis peniculata (and other epicystal Goniodomideae taxa), Adnatosphaeridium multipinosum, Operculodinium spp., the Areoligera group, and Spiniferites spp., indicating that multiple factors of climatic and paleoenvironmental change (such as temperature, sea level, salinity, and nutrient availability) impacted species dominance at this deepwater locality. The peak intervals of mixed lagoonal–nearshore to neritic taxa correlate well with depositional lithofacies LF-2 and include abundant pollen and spores (such as bisaccate and swamp taxa) as well as opaque to structured phytoclasts. This mixed terrestrial to marine assemblage points to a long transport distance from the initial environments of deposition. Furthermore, the presence of lagoonal dinocysts, particularly Eocladopyxis and Apectodinium that thrive in brackish-water environments, indicates periods of peak continental runoff and enhanced nutrient availability prior to the CIE (Sluijs and Brinkhuis, 2009; Sluijs et al., 2014).
A unique and interesting biotic response documented in low-, middle-, and high-latitude localities is a global acme of Apectodinium spp. that precedes and is contemporaneous with the late Paleocene negative CIE (Denison, 2021). The increase in Apectodinium abundance has primarily been explained by increasing temperature in high-latitude sites across the PETM (e.g., Crouch et al., 2001; Frieling et al., 2014). In addition to being thermophilic, Apectodinium distribution and abundance may be influenced by other environmental factors such as salinity, ocean productivity, and ocean stratification (Sluijis and Brinkhuis, 2009). Fluctuations in Apectodinium abundance from the Tethys (Crouch et al., 2003a, b) and Spitsbergen (Harding et al., 2011) suggest a linkage to increases in continental sediment delivery and sea level. Additionally, select middle- to low-latitude sites have documented the Apectodinium acme as preceding the CIE, suggesting that a latitudinal temperature gradient and additional environmental factors may have contributed to higher Apectodinium abundances (Sluijs et al., 2007b, van Roij, 2009).
The consistent presence of Apectodinium in pre-CIE samples (∼120 m prior) indicates optimum environmental conditions for the establishment of this taxon in the late Paleocene GOM. At Anchor 3, not only is Apectodinium consistently present in pre-CIE samples, but the onset of the acme of Apectodinium also occurs in the sample just prior (∼3.5 m) to the main CIE at 31 634.7 ft (Fig 4). The sample of maximum Apectodinium abundances occurs in the muddy siltstone of LF-2 and includes the presence of a neritic taxon from the Spiniferites group and Adnatosphaeridium multispinosum; small numbers of the Areoligera complex; and terrestrially derived kerogen, pollen, and spores. It lacks previously observed Pediastrum and Goniodomideae taxa, suggesting an overall more distal influence either from sea-level rise, decline in fluvial influence, or both.
A low-palynomorph-abundance interval occurs during the main CIE and corresponds to a low-TOC, clay-rich interval of LF-1 as well as an increase in radiolarians and calcareous nannofossil excursion assemblage, the Rhomboaster spp.–Discoaster spp. association (RD; Kahn and Aubry, 2004). The RD is a unique assemblage of species of two genera that spans the CIE, and along with the Apectodinium acme it is used as a proxy for the CIE. The Discoaster spp. (D. araneus and D. anartios) are tightly constrained to the isotopic excursion, whereas the Rhomboaster spp. often range into the uppermost Paleocene, thus constraining the PETM in conjunction with the isotopic curve.
The abrupt decline in palynomorph abundance, including Apectodinium, suggests an interplay of multiple factors including the rise of sea level, decline in coarser-grained sediment influx, and deoxygenation just prior to and during the PETM. Similar observations have been documented in Harrell Core, onshore Mississippi (Slujis et al., 2014), and site M007, offshore Mexico (Smith et al., 2021). The kerogen in this organic-poor interval is dominated by opaque phytoclasts and pyritized radiolarian fragments (Fig. 9c, d). High amounts of opaque phytoclasts result from oxidation and are present in settings that are either proximal to terrestrial environments or that occur in distal settings suggestive of long transport time (Tyson, 1995). Our interpretation at the Anchor 3 bathyal locality precludes the former, as the oxidized material was transported with minimal phytoclasts or palynomorphs within this clay-rich, organic-poor interval. Similarly, the Spitsbergen locality demonstrates that in a sediment-starved environment, Apectodinium and other marine dinocysts were absent in the main CIE (Harding et al., 2011). In the LF-2 of the recovery phase, Apectodonium spp. and other marine dinocysts and terrestrial palynomorphs return, further suggesting a facies-controlled decline of palynomorphs during the peak CIE at the Anchor 3 locality.
Radiolarian oozes are abundant in lower to middle Eocene intervals throughout low-latitude sections, including many wells from the US GOM. While previous studies have documented radiolarian-rich intervals during the PETM in cutting samples (e.g., Cunningham et al., 2022), we report radiolarian-dominated intervals from a core during the CIE. In general, radiolarians are abundant in modern slope sediments where dissolved silica concentrations are relatively high to favor shell production, export, and preservation. Enhanced dissolved silica concentrations may have resulted either from upwelling within the basin or terrestrial runoff of silica from up-dip catchments that drained into the GOM. Because palynomorph assemblages contain abundant terrestrial palynomorphs and lack indicators of enhanced productivity within the same samples, we consider enhanced runoff to be the more significant factor.
Similar to dinocysts, calcareous nannofossils underwent temporary but significant assemblage changes during the PETM. These variations provide an additional tool to track the biotic and climatic response across this boundary, specifically within the genera Rhomboaster, Discoaster, and Fasciculithus (e.g., Bralower, 2002; Kahn and Aubry, 2004; Agnini et al., 2006; Self-Trail et al., 2012). The abrupt increase in these PETM excursion taxa may be linked to a rise in surface water temperatures as previous research points to these species as being adapted to warm and oligotrophic conditions (e.g., Bralower, 2002).
Though influxes of Toweius spp. and Discoaster spp. are sometimes used as indicators of inhospitable water column conditions (Self-Trail et al. 2012), this does not appear to be the case at the Anchor 3 locality because of the abundances observed across multiple genera. Fasciculiths and Discoaster spp. are also robust forms that are less prone to dissolution than others. The few occurrences of D. araneus (and absence of D. anartios) in that section could be due to water column dynamics or a sampling artifact. The fact that the small and thick R. cuspis is the only member of the RD to be preserved, alongside the more robust fasciculiths, may indicate that the more delicate forms of Rhomboaster (e.g., R. calciptrapa) were not preserved.
5.3 Paleobathymetry and bottom-water oxygen
Water depths over the cored interval are interpreted to range from the lower part of the upper bathyal zone to the lower bathyal zone, or 500 to 2000 m, on the basis of diagnostic species of foraminifera, such as Nothia spp., Spiroplectammina spectabilis, Trochamminoides variolarius, and Nuttalides truempyi. Additionally, radiolarian abundances occur in the core along with lower-diversity agglutinated foraminiferal assemblages. Together, these observations suggest bathyal (likely middle to lower) water depths given typical hypsographic depth ranges for these levels in the GOM.
Although the lithologic response to the PETM was delayed, there was an immediate decrease in bioturbation that persisted for ∼ 2.5–3 m above the CIE onset followed by a gradual increase in bioturbation into Unit C (Fig. 7). Decreases in bioturbation in the lower PETM CIE have been noted in several other marine PETM localities (Bralower et al., 1997; Mutterlose et al., 2007; Nicolo et al., 2010; Schulte et al., 2011). For example, Nicolo et al. (2010) documented an abrupt drop in trace fossil abundance coincident with the onset of the PETM CIE at Mary and Dee streams, New Zealand, with a recovery to pre-CIE levels approximately midway through the PETM. Deficiency in seafloor oxygenation and associated stress to benthic organisms during the early CIE have been invoked as a likely explanation for the decrease in bioturbation during the early PETM (Nicolo et al., 2010; Schulte et al., 2011). For example, Bralower et al. (1997) interpreted faint laminations in claystone deposited during the main phase of the PETM CIE to reflect decreased bioturbation and dysoxic bottom waters. Decreases in oxygen levels have been inferred for other deep Atlantic PETM localities based on Mn and U enrichment factors and I Ca proxies (Chun et al., 2010; Pälike et al., 2014). However, enrichment of redox trace elements in marine sediments, such Mo and U, generally occurs in organic-rich sediments deposited under fully anoxic to euxinic environments (Algeo and Lyons, 2006; Algeo and Trobivillard, 2009; Tribovillard et al., 2006). Aluminum-normalized concentrations of Mo, V, and U, as well as the enrichment factors of Mo and U, are either below detection limits or low in the pre-CIE, main, and post-CIE intervals (Table S5). Additionally, trace metal concentrations are at or below their levels for an average shale and upper crust (Wedepohl, 1971, 1991), suggesting that bottom-water oxygen was not sufficiently low enough to enhance their concentrations in the sediments. Thus, the decrease in bioturbation could alternatively be interpreted as an increase in sedimentation rates without a change in the rate of biologic disturbance (e.g., Shourd and Levin, 1976).
The lack of benthic foraminifera in sediments from the CIE interval is consistent with the benthic foraminiferal extinction observed in many classic PETM sections that has largely been considered a consequence of significant reduction of oxygen availability (Kennett and Stott, 1991; Sluijs et al., 2014). Unlike other localities spanning late Paleocene to early Eocene times, we note very low-diversity foraminiferal assemblages not just during the CIE but throughout the entire core. Characteristics relatively unique to the GOM Wilcox Group are agglutinated benthic foraminifera dominated by epifaunal arborescent foraminifera and sparse occurrences of planktonic or calcareous foraminifera. A lower diversity and dominance of just a few species are indicators of dysoxic to perennially anoxic environments in modern silled basins (e.g., Bernhard et al., 1997), but these settings are also characterized by infaunal species. In contrast to typical low-oxygen assemblages, the benthic foraminifera reported here are primarily epifaunal. A singular factor does not explain the faunal trends noted in the Anchor 3 core. A combination of factors, such as relatively high sedimentation rates, reduced oxygen but not anoxic bottom-water concentrations, and paleobathymetry at or below the CCD would best explain the observations from the benthic foraminifera.
5.4 Grain size partitioning from land to ocean during the PETM
Although rates of terrigenous sediment supply to the world's oceans are largely inferred to have increased during the PETM (Crouch et al., 2003b; John et al., 2008; Sluijs et al., 2008a, b, 2011; Aze et al., 2014; Bornemann et al., 2014; Carmichael et al., 2017; Dunkley Jones et al., 2018; Duller et al., 2019; Sømme et al., 2023), a comparison of lithologic change during the PETM from proximal to distal depositional settings reveals opposite trends in grain size change in terrestrial versus marine settings (Fig. 10). A majority of proximal terrestrial PETM localities record an increase in grain size, whereas terrigenous-sourced marine PETM localities most often record a decrease in grain size (Fig. 10; Table S1). This dichotomy is well illustrated in the Wilcox sediment-routing system, where proximal fluvial sections illustrate increases in coarse-grained sedimentation during the PETM (Foreman et al., 2012; Foreman, 2014; Dechesne et al., 2020), whereas the distal deep-sea fan records an opposite change to deposition of finer-grained sediments. Coastal PETM sections, deposited at the interface between terrestrial and marine environments, show an approximately even split between an increase and a decrease in siliciclastic grain size (Fig. 10; Table S1). Preliminary results from the deltaic centers of Paleocene–Eocene age in eastern Texas suggest an increase in grain size to the coastline during the PETM (Sharman et al., 2023).
These observations suggest pronounced partitioning of grain size during the PETM, with coarser-grained sediment sequestered in coastal or shelfal environments and finer-grained sediment (clay) distributed widely in the deep sea. This partitioning is likely a consequence of two competing changes in boundary conditions that occurred synchronously during the PETM: (1) an increase in the supply of both coarse- and fine-grained sediment and (2) sea-level rise (Sluijs et al., 2008b, 2014). If the PETM were manifested as an increase in sediment supply without a corresponding rise in sea level, it is likely that connectivity between terrestrial and deep-marine sediment-routing systems would be maintained such that an increase in sand and silt in terrigenous-sourced PETM localities would be observed, albeit with a possible lag between the arrival of fine and coarse grain size fractions (Tofelde et al., 2021). Instead, it appears that terrestrial and marine segments of many sediment-routing systems became disconnected during the PETM as a consequence of sea-level rise (Fig. 11). The ability of terrestrial clay to become widely dispersed in the ocean despite high sea level is evidenced by a nearly uniform global increase in clay deposition within normally non-terrigenous marine PETM sections (Fig. 10; Khozyem et al., 2013, Giusberti et al., 2007; Canudo et al., 1995; Crouch et al., 2003a; Bornemann et al., 2014).
A deepwater PETM section within the Spanish Pyrenean Basin provides an exception to the above statements, where the PETM is manifested as an increase in siliciclastic grain size within deepwater channelized deposits (Pujalte et al., 2015). The Orio section shows a change from tabular, massive, mudstone-capped sandstone beds to amalgamated, planar-laminated, coarse-grained deposits with an axial deepwater channel belt, interpreted to reflect a change from sediment-gravity-flow- to hyperpycnal-flow-dominated sedimentation (Pujalte et al., 2015). The difference in response between the Spanish Pyrenean Basin and the deepwater GOM may reflect differences in connectivity between terrestrial and marine segments of their respective sediment-routing systems. For example, Bernhardt et al. (2015) noted varying degrees of connectivity between fluvial and deep-sea segments of the Biobío canyon system of Chile related to the position of submarine canyon heads with respect to fluvial and longshore sediment delivery systems. Margins with narrow shelves (e.g., southern California; Covault et al., 2007) or where submarine canyons incise across the shelf to directly connect fluvial systems (e.g., the Congo River and associated deep-sea fan; Vangrieshiem et al., 2009) are known to maintain connectivity between land and the deep sea regardless of sea-level state. Such settings are thus more likely to record an increase in coarse-grained sedimentation in the deep sea during the PETM versus margins with broad shelves in which sea-level rise would more effectively sequester coarse-grained sediment in coastal and shelfal settings.
5.5 Evaluation of the Gulf of Mexico closed gateway hypothesis
Several studies have argued that the GOM became isolated from the Atlantic Ocean due to collision of the Cuban arc with the Yucatán, Bahamas, and Florida carbonate platforms during late Paleocene–early Eocene times and that the GOM underwent approximately 1–2 km of drawdown during or just prior to the Paleocene–Eocene boundary (Rosenfeld and Pindell, 2003; Cossey et al., 2019; Pindell and Cossey, 2020; Rosenfeld, 2020; Cossey et al., 2021). Proponents of the closed gateway hypothesis have suggested that release of methane hydrates during sea-level fall might explain the large release of isotopically light carbon and associated global warming that characterizes the PETM (Rosenfeld and Pindell, 2003; Cossey et al., 2016, 2021).
Several observations from the Anchor 3 core are inconsistent with the closed gateway hypothesis and instead support the interpretation that the GOM remained connected to the Atlantic Ocean (White et al., 2019; Cunningham et al., 2022). The Anchor 3 core does not show evidence of oceanic drawdown or unconformity occurrence during or immediately prior to the PETM. Marine dinocysts are dominant over terrestrial spores and pollen in the Wilcox 1B interval preceding the Paleocene–Eocene boundary (Fig. 3), suggesting a relative lack of terrestrial input to the basin. Although the drawdown hypothesis invokes widespread paleo-canyon formation and increased clastic delivery to the deep GOM during or immediately preceding the PETM, the Anchor 3 core indicates the opposite: a reduction of grain size during the main PETM CIE that is interpreted to reflect sea-level rise, not sea-level fall. If a drawdown of water occurred over the PETM interval, a shift from deepwater to shallow benthic assemblages would be expected. Our data do not show that, but instead indicate deepwater agglutinated foraminifera immediately below and above the CIE. The decline in terrestrial phytoclasts as well as spores and pollen, increase in opaque phytoclasts, and marine dinocyst assemblages with peaks in Spiniferites complex and Areoligera abundances corroborate the foraminifera record prior to the CIE and are consistent with an overall trend in sea-level rise (Sluijis et al., 2008a; Sluijis and Brinkhius, 2009). Furthermore, the deepwater GOM record across the Paleocene–Eocene boundary lacks evidence of deposition of evaporites or highly organic units that have characterized isolation and drawdown episodes of the Mediterranean and Black seas (Cunningham et al., 2022).
The PETM record from the GOM shares several features with other deep Atlantic Ocean sites, including an extinction in benthic foraminifera, a shift from CaCO3-poor to CaCO3-enriched sediment, and a decrease in bioturbation during the lower PETM CIE (e.g., Kennett and Stott, 1991; Zachos et al., 2005). These commonalities suggest similar oceanographic changes between the GOM and Atlantic Ocean during the PETM that would be best explained by these ocean basins being connected during the latest Paleocene to earliest Eocene. Thus, our analysis casts doubt on the hypothesis that methane hydrate release due to GOM drawdown was a causal mechanism for the PETM.
The Anchor 3 core contains one of the few known PETM records from a deep-sea fan system sourced from a continental-scale drainage, providing insight into the effects of this hyperthermal on the landscapes of central North America and within the GOM ocean basin itself. The PETM is manifested by a ‰ shift in bulk organic δ13C and a pronounced decrease in the supply of sand and silt after a lag of ∼2 m (approximately 31±6.2 kyr), concurrent with an influx of terrigenous clay that is notably poor in organic carbon. Comparison of the Anchor 3 core with a global compilation of PETM localities suggests that the lithologic manifestation of the PETM in the deepwater GOM was caused by the interplay of two factors: (1) increased erosional denudation of central North America that caused an increase in the supply of both coarse- and fine-grained sediment to the coastal ocean and (2) rising sea level that sequestered coarser-grained sediment near the coast but allowed terrigenous clay to reach deep-sea environments.
The record of the PETM at the Anchor 3 well indicates that global climatic changes also had a clear influence on calcareous, siliceous, and organic-walled microfossil assemblages in the GOM. The latest Paleocene interval was characterized by increasing abundances of Apectodinium spp. with mixed coastal to neritic dinocyst assemblages, shifts in the abundance of terrestrially derived kerogen, and fluctuations in radiolarian abundance that together suggest variability in sediment supply and nutrient enrichment. The Apectodinium dominance and acme event prior to the main CIE are interpreted as a response to not only the global temperature change but also enhanced runoff and increased delivery of nutrients to the surface water in the GOM. The sudden absence of these allochthonous palynomorphs and organics during the PETM can be explained by sea-level rise and sequestering of coarser-grained sediment that typically delivered these palynomorph assemblages basinward. Abundant radiolarians and the lack of calcareous microfossils, except for dissolution-resistant nannofossils, suggest rapid sediment accumulation rates and possibly a shoaling of the CCD. An anomalous lack of bioturbation and a benthic foraminiferal extinction following the PETM onset are consistent with deoxygenation of GOM bottom waters and/or an increase in sedimentation rate. The transition from CaCO3-poor to CaCO3-rich shale is consistent with ocean acidification during the early phases of the PETM. Similar observations have been made in other deep Atlantic PETM localities, suggesting connection of the GOM to the Atlantic Ocean during latest Paleocene–earliest Eocene times.
The Anchor 3 locality provides the first integrated lithologic, geochemical, and biostratigraphic record of the PETM in the deepwater GOM and is an essential record in further understanding the variability of the biotic response globally. This study reinforces the importance of multidisciplinary characterization of the PETM for understanding how climate-driven sedimentary signals are manifested within the distal portions of large sediment-routing systems. The effects of oceanographic changes during the PETM onset (e.g., a decrease in bioturbation and benthic foraminifera) were immediate, while lithologic and geochemical changes lagged by ca. 30 to 150 kyr. These results highlight both the immediate and long-lived consequences of global warming, even within the most distal portions of large sediment-routing systems.
Data that accompany this article are available in Sharman et al. (2022) (https://doi.org/10.5281/zenodo.7291552).
The supplement related to this article is available online at: https://doi.org/10.5194/cp-19-1743-2023-supplement.
GRS and ES initiated the project, framed the study, and gained partner approval for access to geologic materials that are the basis for all technical analytical work. GRS described core samples and collected XRD data. RAH, ACMK, and LAF collected, analyzed, and interpreted biostratigraphic data and worked with asset stakeholders to ensure that research progress continued within the agreed-upon scope of work. GMG and JO processed samples and collected geochemical data. GRS prepared the paper with contributions from all co-authors.
The contact author has declared that none of the authors has any competing interests.
Publisher's note: Copernicus Publications remains neutral with regard to jurisdictional claims in published maps and institutional affiliations. The views and conclusions expressed by the authors are solely their own and do not necessarily reflect the opinions, conclusions, or beliefs of the Chevron Technology Center or its affiliates.
We thank the Chevron Gulf of Mexico Business Unit and the Chevron Technology Center for access to core, scientific conversations, and the approval to publish these data. Erin Meyers and Ellen Reat Wersan provided useful reviews of early manuscripts. Erik Pollock at the University of Arkansas Stable Isotope Laboratory (UASIL) assisted with laboratory analyses. We thank Mac McGilvery for helpful discussions of Wilcox Group depositional facies.
This research has been supported by the Chevron Technology Center and by University of Arkansas start-up funds provided to Glenn R. Sharman.
This paper was edited by Arne Winguth and reviewed by two anonymous referees.
Agnini, C., Muttoni, G., Kent, D.V., and Rio, D.: Eocene biostratigraphy and magnetic stratigraphy from Possagno, Italy: The calcareous nannofossil response to climate variability, Earth Planet. Sci. Lett., 241, 815–830, 2006.
Algeo, T. J. and Lyons, T. W.: Mo-total organic carbon covariation in modern anoxic marine environments: Implications for analysis of paleoredox and paleohydrographic conditions, Paleoceanography, 12, 1–23, https://doi.org/10.1029/2004PA001112, 2006.
Algeo, T. J. and Tribovillard, N.: Environmental analysis of paleoceanographic systems based on molybdenum-uranium covariation, Chem. Geol., 268, 211–225, 2009.
Armitage, J. J., Duller, R. A., Whittaker, A. C., and Allen, P. A.: Transformation of tectonic and climatic signals from source to sedimentary archive, Nat. Geosci., 4, 231–235, https://doi.org/10.1038/ngeo1087, 2011.
Armitage, J. J., Dunkley Jones, T., Duller, R. A., Whittaker, A. C., and Allen. P. A.: Temporal buffering of climate-driven sediment flux cycles by transient climate response, Earth Planet. Sc. Lett., 369–370, 200–210, https://doi.org/10.1016/j.epsl.2013.03.020, 2013.
Aubry, M.-P.: Early Paleogene calcareous nannoplankton evolution: A tale of climatic amelioration, in: Late Paleocene-Early Eocene Climatic and Biotic Events in the Marine and Terrestrial Records, edited by: Aubry, M.-P. and Benjamini, C., Columbia Univeristy Press, New York, 158–180, ISBN 9780231102384, 1998.
Aze, T., Pearson, P. N., Dickson, A. J., Badger, M. P. S., Bown, P. R., Pancost, R. D., Gibbs, S. J., Huber, B. T., Leng, M. J., Coe, A. L., Cohen, A. S., and Foster, G. L.: Extreme warming of tropical waters during the Paleocene-Eocene thermal maximum, Geology, 42, 739–742, https://doi.org/10.1130/G35637.1, 2014.
Berggren, W. A. and Pearson, P. N.: A revised tropical to subtropical Paleogene planktonic foraminiferal zonation, J. Foramin. Res., 35, 279–298, 2005.
Berggren, W. A. and Pearson, P. N.: Tropical to subtropical Paleogene planktonic foraminiferal zonation of the Eocene and Oligocene, in: Atlas of Eocene Planktonic Foraminifera, edited by: Pearson, N. P., Olsson, R. K., Huber, B. T., Hemleben, C., and Berggren, W. A., Cushman Foundation Special Publication No. 41, 29–40, Lawrence, KS, USA, https://cushmanfoundation.org/PersonifyEbusiness/Store/Product-Details/productId/107978 (last access: 31 August 2023), 2006.
Bernard, J. M., Sen Gupta, B. K., and Borne, P. F.: Benthic foraminiferal proxy to estimate dysoxic bottom water oxygen concentrations, Santa Barbara Basin, US Pacific continental margin, J. Foramin. Res., 27, 301–310, https://doi.org/10.2113/gsjfr.27.4.301, 1997.
Bernhardt, A., Melnick, D., Jara-Muñoz, J., Argandoña, B., González, J., and Strecker, M. R.: Controls on submarine canyon activity during sea-level highstands: The Biobío canyon system offshore Chile, Geosphere, 11, 1226–1255, https://doi.org/10.1130/GES01063.1, 2015.
Bernhardt, A., Schwanghart, W., Hebbeln, D., Stuut, J. B. W., and Strecker, M. R.: Immediate propagation of deglacial environmental change to deep-marine turbidite systems along the Chile convergent margin, Earth Planet. Sci. Lett., 473, 190–204, https://doi.org/10.1016/j.epsl.2017.05.017, 2017.
Bird, D. E., Burke, K., Hall, S. A., and Casey, J. F.: Gulf of Mexico tectonic history: hotspot tracks, crustal boundaries, and early salt distribution, AAPG Bull., 89, 311–328, 2005.
Blum, M. and Pecha, M.: Mid-Cretaceous to Paleocene North American drainage reorganization from detrital zircons, Geology, 42, 607–610, 2014.
Blum, M. D., Milliken, K. T., Pecha, M. A., Snedden, J. W., Frederick, B. C., and Galloway, W. E.: Detrital-zircon records of Cenomanian, Paleocene, and Oligocene Gulf of Mexico drainage integration and sediment routing: Implications for scales of basin-floor fans, Geosphere, 13, 2169–2205, 2017.
Bolle, M. P., Pardo, A., Adatte, T., Von Salis, K., and Burns, S.: Climatic evolution on the southeastern margin of the Tethys (Negev, Israel) from the Palaeocene to the early Eocene: Focus on the late Palaeocene thermal maximum, J. Geol. Soc. London., 157, 929–941, https://doi.org/10.1144/jgs.157.5.929, 2000.
Bonnet, S. and Crave, A.: Landscape response to climate change: Insights from experimental modeling and implications for tectonic versus climatic uplift of topography, Geology, 31, 123–126, https://doi.org/10.1130/0091-7613(2003)031<0123:LRTCCI>2.0.CO;2, 2003.
Bornemann, A., Norris, R. D., Lyman, J. A., D'haenens, S., Groeneveld, J., Röhl, U., Farley, K. A., and Speijer, R. P.: Persistent environmental change after the Paleocene-Eocene Thermal Maximum in the eastern North Atlantic, Earth Planet. Sci. Lett., 394, 70–81, https://doi.org/10.1016/j.epsl.2014.03.017, 2014.
Bowen, G. J. and Bowen, B. B.: Mechanisms of a PETM global change constrained by a new record from central Utah, Geology, 36, 379–382, 2008.
Bralower, T. J.: Evidence of surface water oligotrophy during the Paleocene-Eocene thermal maximum: Nannofossil assemblage data from Ocean Drilling Program Site 690, Maud Rise, Weddell Sea, Paleoceanography, 17, 13-1–13-12, https://doi.org/10.1029/2001pa000662, 2002.
Bralower, T. J., Thomas, D. J., Zachos, J. C., Hirschmann, M. M., Röhl, U., Sigurdsson, H., Thomas, E., and Whitney, D. L.: High-resolution records of the late Paleocene thermal maximum and circum-Caribbean volcanism: Is there a causal link?, Geology, 25, 963–966, https://doi.org/10.1130/0091-7613(1997)025<0963:HRROTL>2.3.CO;2, 1997.
Brown Jr., L. F. and Loucks, R. G.: Chronostratigraphy of Cenozoic depositional sequences and systems tracts: A Wheeler chart of the northwest margin of the Gulf of Mexico Basin, Texas Bureau of Economic Geology Report of Investigations 273, Austin, 28 pp., https://store.beg.utexas.edu/reports-of-investigations/1814-ri0273.html (last access: 31 August 2023), 2009.
Buffler, R. T. and Thomas, W. A., Crustal structure and evolution of the southeastern margin of North America and the Gulf of Mexico basin, in: Phanerozoic Evolution of North American Continent-Ocean Transitions, edited by: Speed, R. C., Boulder, CO, Decade of North American Geology, Continent-Ocean Transect Series, Geological Society of America, 219–264, https://doi.org/10.1130/DNAG-COT-PEN.219, 1994.
Bush, M. A., Horton, B. K., Murphy, M. A., and Stockli, D. F.: Detrital record of initial basement exhumation along the Laramide deformation front, southern Rocky Mountains, Tectonics, 35, 2117–2130, 2016.
Canudo, J. I., Keller, G., Molina, E., and Ortiz, N.: Planktic foraminiferal turnover and δ13C isotopes across the Paleocene-Eocene transition at Caravaca and Zumaya, Spain, Palaeogeogr. Palaeocl., 114, 75–100, https://doi.org/10.1016/0031-0182(95)00073-U, 1995.
Carmichael, M. J., Inglis, G. N., Badger, M. P. S., Naafs, B. D. A., Behrooz, L., Remmelzwaal, S., Monteiro, F. M., Rohrssen, M., Farnsworth, A., Buss, H. L., Dickson, A. J., Valdes, P. J., Lunt, D. J., and Pancost, R. D.: Hydrological and associated biogeochemical consequences of rapid global warming during the Paleocene-Eocene Thermal Maximum, Global Planet. Change, 157, 114–138, https://doi.org/10.1016/j.gloplacha.2017.07.014, 2017.
Carvajal, C., Steel, R., and Petter, A.: Sediment supply: The main driver of shelf-margin growth, Earth-Sci. Rev., 96, 221–248, 2009.
Carvajal, C. R. and Steel, R. J.: Thick turbidite successions from supply-dominated shelves during sea-level highstand, Geology, 34, 665–668, 2006.
Carney, J. L. and Pierce, R. W.: Graphic Correlation and Composite Standard Databases As Tools for the Exploration Biostratigrapher, SEPM Sec. P., 53, 23–43, 1995.
Castelltort, S. and Van Den Driessche, J.: How plausible are high-frequency sediment supply-driven cycles in the stratigraphic record?, Sediment. Geol., 157, 3–13, https://doi.org/10.1016/S0037-0738(03)00066-6, 2003.
Chen, Z., Ding, Z., Yang, S., Zhang, C., and Wang, X.: Increased precipitation and weathering across the Paleocene-Eocene Thermal Maximum in central China, Geochem. Geophy. Geosy., 17, 2286–2297, https://doi.org/10.1002/2016GC006406, 2016.
Chun, C. O. J., Delaney, M. L., and Zachos, J. C.: Paleoredox changes across the Paleocene-Eocene thermal maximum, Walvis Ridge (ODP Sites 1262, 1263, and 1266): Evidence from Mn and U enrichment factors, Paleoceanography, 25, 1–13, https://doi.org/10.1029/2009PA001861, 2010.
Colosimo, A. B., Bralower, T. J., and Zachos, J. C.: Evidence for lysocline shoaling at the Paleocene/Eocene Thermal Maximum on Shatsky Rise, northwest Pacific, Proc. Ocean Drill. Progr. Sci. Results, 198, 1–36, https://doi.org/10.2973/odp.proc.sr.198.112.2006, 2005.
Copeland, P., Currie, C. A., Lawton, T. F., and Murphy, M. A.: Location, location, location: The variable lifespan of the Laramide orogeny, Geology, 45, 223–226, 2017.
Cornish, F. G.: Incised valleys of the Upper Wilcox, middle Texas Gulf Coast: Additional pathways for Wilcox sand delivery to the deep GOM?, Bulletin of the South Texas Geological Society, 51, 15–48, 2011.
Cornish, F. G.: Stratigraphy of Wilcox Canyons, Tyler and Harden Counties, Texas, GCAGS GeoGulf Transactions, 69, 333–342, 2019.
Cossey, S. P. J., Van Nieuwenhuise, D., Davis, J., Rosenfeld, J. H., and Pindell, J.: Compelling evidence from eastern Mexico for a Late Paleocene/Early Eocene isolation, drawdown, and refill of the Gulf of Mexico, Interpretation, 4, SC63–SC80, https://doi.org/10.1190/INT-2015-0107.1, 2016.
Cossey, S. P. J., Bitter, M. R., Dickens, G. R., Nieuwenhuise, D. Van, Rosenfeld, J. H., Beltrán-triviño, A., Cornick, P., and Agnini, C.: Paleo-Canyon formation and contemporaneous oil seepage near the Paleocene/Eocene boundary, Tampico-Misantla Basin, eastern Mexico, GeoGulf Trans., 69, 27–53, 2019.
Cossey, S. P. J., Rosenfeld, J., Bitter, M., and Pindell, J.: Update on the Paleogene water-level drawdown hypothesis, Gulf of Mexico, Gulf Coast Assoc. Geol. Soc. J., 10, 123–141, 2021.
Covault, J. A., Normark, W. R., Romans, B. W., and Graham, S. A.: Highstand fans in the California borderland: The overlooked deep-water depositional systems, Geology, 35, 783–786, https://doi.org/10.1130/G23800A.1, 2007.
Crouch, E. M., Heilman-Clausen, C., Brinkhuis, H., Morgan, K. M., Rogers, K. M., Egger, H., and Schmitz, B.: Global dinoflagellate event associated with the late Paleocene thermal maximum, Geology, 29, 315–318, 2001.
Crouch, E. M., Brinkhuis, H., Visscher, H., Adatte, T., and Bolle, M. P.: Late Paleocene-early Eocene dinoflagellate cyst records from the Tethys: Further observations on the global distribution of Apectodinium, in: Causes and Consequences of Globally Warm Climates in the Early Paleogene, edited by: Wing, S. L., Gingerich, P. D., Schmitz, B., and Thomas, E., Spec. Pap. Geol. Soc. Am., 369, 113–131, https://doi.org/10.1130/0-8137-2369-8.113, 2003a.
Crouch, E. M., Dickens, G. R., Brinkhuis, H., Aubry, M. P., Hollis, C. J., Rogers, K. M., and Visscher, H.: The Apectodinium acme and terrestrial discharge during the Paleocene-Eocene thermal maximum: New palynological, geochemical and calcareous nannoplankton observations at Tawanui, New Zealand, Palaeogeogr. Palaeocl., 194, 387–403, https://doi.org/10.1016/S0031-0182(03)00334-1, 2003b.
Cunningham, R., Phillips, M. P., Snedden, J. W., Norton, I. O., Lowery, C. M., Virdell, J. W., Barrie, C. D., and Avery, A.: Productivity and organic carbon trends through the Wilcox Group in the deep Gulf of Mexico: Evidence for ventilation during the Paleocene-Eocene Thermal Maximum, Mar. Pet. Geol., 140, 105634, https://doi.org/10.1016/j.marpetgeo.2022.105634, 2022.
Dechesne, M., Currano, E. D., Dunn, R. E., Higgins, P., Hartman, J. H., Chamberlain, K. R., and Holm-Denoma, C. S.: A new stratigraphic framework and constraints for the position of the Paleocene-Eocene boundary in the rapidly subsiding Hanna Basin, Wyoming, Geosphere, 16, 594–618, https://doi.org/10.1130/GES02118.1, 2020.
Denison, C. N.: Stratigraphic and sedimentological aspects of the worldwide distribution of Apectodinium in Paleocene/Eocene Thermal Maximum deposits, Geological Society, London, Special Publications, 511, 269–308, https://doi.org/10.1144/SP511-2020-4, 2021.
Dickson, A. J., Rees-Owen, R. L., März, C., Coe, A. L., Cohen, A. S., Pancost, R. D., Taylor, K., and Shcherbinina, E.: The spread of marine anoxia on the northern Tethys margin during the Paleocene-Eocene Thermal Maximum, Paleoceanography, 29, 471–488, https://doi.org/10.1002/2014PA002629, 2014.
Dickinson, W. R., Klute, M. A., Hayes, M. J., Janecke, S. U., Lundin, E. R., McKittrick, M. A., and Olivares, M. D.: Paleogeographic and paleotectonic setting of Laramide sedimentary basins in the central Rocky Mountain region, Geol. Soc. Am. Bull., 100, 1023–1039, 1988.
Droser, M. L. and Bottjer, D. J.: A semiquantitative field classification of ichnofabric, J. Sediment. Res., 56, 558–559, 1986.
Duller, R. A., Armitage, J. J., Manners, H. R., Grimes, S., and Jones, T. D.: Delayed sedimentary response to abrupt climate change at the Paleocene-Eocene boundary, northern Spain, Geology, 47, 159–162, https://doi.org/10.1130/G45631.1, 2019.
Dunkley Jones, T., Manners, H. R., Hoggett, M., Kirtland Turner, S., Westerhold, T., Leng, M. J., Pancost, R. D., Ridgwell, A., Alegret, L., Duller, R., and Grimes, S. T.: Dynamics of sediment flux to a bathyal continental margin section through the Paleocene–Eocene Thermal Maximum, Clim. Past, 14, 1035–1049, https://doi.org/10.5194/cp-14-1035-2018, 2018.
Edwards, M. B.: Upper Wilcox Rosita delta system of south Texas: Growth faulted shelf edge deltas, AAPG Bull., 65, 54–73, 1981.
Feng, J., Buffler, R. T., and Kominz, M. A.: Laramide orogenic influence on late Mesozoic-Cenozoic subsidence history, western deep Gulf of Mexico basin, Geology, 22, 359–362, 1994.
Fisher, W. L. and McGowen, J. H.: Depositional systems in the Wilcox Group of Texas and their relationship to occurrence of oil and gas, Trans. Gulf Coast Assoc. Geol. Soc., 17, 105–125, 1967.
Foreman, B. Z.: Climate-driven generation of a fluvial sheet sand body at the Paleocene-Eocene boundary in north-west Wyoming (USA), Basin Res., 26, 225–241, https://doi.org/10.1111/bre.12027, 2014.
Foreman, B. Z., Heller, P. L., and Clementz, M. T.: Fluvial response to abrupt global warming at the Palaeocene/Eocene boundary, Nature, 490, 92–95, https://doi.org/10.1038/nature11513, 2012.
Foster, G. L., Hull, P., Lunt, D. J., and Zachos, J. C.: Placing our current “hyperthermal” in the context of rapid climate change in our geological past, Philos. Trans. A, 376, 20170086, https://doi.org/10.1098/rsta.2017.0086, 2018.
Frieling, J. and Sluijs, A.: Towards quantitative environmental reconstructions from ancient non-analogue microfossil assemblages: Ecological preferences of Paleocene-Eocene dinoflagellates, Earth-Sci. Rev., 185, 956–973, https://doi.org/10.1016/j.earscirev.2018.08.014, 2018.
Frieling, J., Iakovleva, A. I., Reichart, G.-J., Aleksandrova, G. N., Gnibidenko, Z. N., Schouten, S., and Sluijs, A.: Paleocene-Eocene warming and biotic response in the epicontinental West Siberian Sea, Geology, 42, 767–770, 2014.
Galloway W. E.: Depositional and structural architecture of prograding clastic continental margins: tectonic influence on patterns of basin filling, Norsk Geologisk Tidsskrift, Oslo, Norwegen, 67, 237–251, 1987.
Galloway, W. E.: Wilcox Submarine Canyons: Distribution, Attributes, Origins, and Relationship to Basinal Sands, in: The Paleogene of the Gulf of Mexico and Caribbean Basins: Processes, Events and Petroleum Systems, edited by: Kennan, L., Pindell, J., and Rosen, N. C.; SEPM Society for Sedimentary Geology, 27, https://doi.org/10.5724/gcs.07.27, 2007.
Galloway, W. E.: Depositional evolution of the Gulf of Mexico sedimentary basin, in: The Sedimentary Basins of the United States and Canada, edited by: Miall, A. D., 5, 505–549, ISBN 9780444504258, 2008.
Galloway, W. E., Bebout, D. G., Fisher, W. L., Dunlap, J. B., Cabrera-Castro Jr., R., Lugo-Rivera, J. E., and Scott, T. M.: Cenozoic, in: The Gulf of Mexico Basin, edited by: Salvador, A., Geological Society of America, The Geology of North America, v. J., Boulder, Colorado, ISBN 9780813754598, 1991a.
Galloway, W. E., Dingus, W. F., and Paige, R. E.: Seismic and depositional facies of Paleocene-Eocene Wilcox Group submarine canyon fills, northwest Gulf Coast, USA, in: Seismic facies and sedimentary processes of submarine fans and turbidite systems, Springer, New York, NY, 247–271, ISBN-13 978-0387974699, 1991b.
Galloway, W. E., Ganey-Curry, P. E., Li, X., and Buffler, R. T.: Cenozoic depositional history of the Gulf of Mexico basin, AAPG Bull., 84, 1743–1774, 2000.
Galloway, W. E., Whiteaker, T. L., and Ganey-Curry, P.: History of Cenozoic North American drainage basin evolution, sediment yield, and accumulation in the Gulf of Mexico basin, Geosphere, 7, 938–973, https://doi.org/10.1130/GES00647.1, 2011.
Gavrilov, Y. O., Shcherbinina, E. A., and Oberhansli, H.: Paleocene-Eocene boundary events in the northeastern Peri-Tethys, in: Causes and Consequences of Globally Warm Climates in the Early Paleogene, edited by: Wing, S. L., Gingerich, P. D., Schmitz, B., and Thomas, E., Geol. Soc. Am. Spec. Pap., 369, 147–168, 2003.
Giusberti, L., Rio, D., Agnini, C., Backman, J., Fornaciari, E., Tateo, F., and Oddone, M.: Mode and tempo of the Paleocene-Eocene thermal maximum in an expanded section from the Venetian pre-Alps, Bull. Geol. Soc. Am., 119, 391–412, https://doi.org/10.1130/B25994.1, 2007.
Goodbred, S. L.: Response of the Ganges dispersal system to climate change: A source-to-sink view since the last interstade, Sediment. Geol., 162, 83–104, https://doi.org/10.1016/S0037-0738(03)00217-3, 2003.
Gutjahr, M., Ridgwell, A., Sexton, P. F., Anagnostou, E., Pearson, P. N., Pälike, H., Norris, R. D., Thomas, E., and Foster, G. L.: Very large release of mostly volcanic carbon during the Palaeocene-Eocene Thermal Maximum, Nature, 548, 573–577, https://doi.org/10.1038/nature23646, 2017.
Hackworth, R., Gary, A., Kahn, A., Febo, L., and Zarra, L.: A probabilistically-constrained zonation of the Paleogene Wilcox: Initial application of ranking and scaling (RASC) to a robust deep-water Gulf of Mexico (GoM) Wilcox palynological dataset, American Association of Stratigraphic Palynologist (AASP) – The Palynological Society 51st annual meeting, Calgary, Canada, 2018.
Harding, I. C., Charles, A. J., Marshall, J. E. A., Pälike, H., Roberts, A. P., Wilson, P. A., Jarvis, E., Thorne, R., Morris, E., Moremon, R., Pearce, R. B., and Akbari, S.: Sea-level and salinity fluctuations during the Paleocene-Eocene thermal maximum in Arctic Spitsbergen, Earth Planet. Sci. Lett., 303, 97–107, https://doi.org/10.1016/j.epsl.2010.12.043, 2011.
Harrington, G. J. and Kemp, S. J.: US Gulf Coast vegetation dynamics during the latest Palaeocene, Palaeogeogr. Palaeocl., 167, 1–21, https://doi.org/10.1016/S0031-0182(00)00228-5, 2001.
Hasty, E. and Revesz, R.: Total petroleum hydrocarbon determination by microwave solvent extraction, American Laboratory (Fairfield), 27, 66–74, 1995.
Hatano, N., Yoshida, K., and Sasao, E.: Effects of grain size on chemical weathering index: A case study of Neogene fluvial sediments in southwest Japan, Sediment. Geol., 386, 1–8, https://doi.org/10.1016/j.sedgeo.2019.03.017, 2019.
Hessler, A. M., Zhang, J., Covault, J. A., and Ambrose, W.: Continental weathering coupled to Paleogene climate changes in North America, Geology, 45, 1–4, https://doi.org/10.1130/G39245.1, 2017.
Hessler, A. M., Covault, J. A., Stockli, D. F., and Fildani, A.: Late Cenozoic cooling favored glacial over tectonic controls on sediment supply to the western Gulf of Mexico, Geology, 46, 995–998, https://doi.org/10.1130/G45528.1, 2018.
Hoyt, W. V.: Erosional Channel in Middle Wilcox Near Yoakum, Lavaca County, Texas, AAPG Bull., 43, 2515–2516, 1959.
Jepson, G., George, S., and Carrapa, B.: The Paleocene-Eocene Thermal Maximum enhanced erosion of Laramide ranges, Geological Society of America, Abstracts with Programs, 54, https://doi.org/10.1130/abs/2022AM-380363, 2022.
Jerolmack, D. J. and Paola, C.: Shredding of environmental signals by sediment transport, Geophys. Res. Lett., 37, 1–5, https://doi.org/10.1029/2010GL044638, 2010.
Jiang, S. and Wise, S. W.: Distinguishing the influence of diagenesis on the paleoecological reconstruction of nannoplankton across the Paleocene/Eocene Thermal Maximum: An example from the Kerguelen Plateau, southern Indian Ocean, Mar. Micropaleontol., 72, 49–59, https://doi.org/10.1016/j.marmicro.2009.03.003, 2009.
John, C. M., Bohaty, S. M., Zachos, J. C., Sluijs, A., Gibbs, S., Brinkhuis, H., and Bralower, T. J.: North American continental margin records of the Paleocene-Eocene thermal maximum: Implications for global carbon and hydrological cycling, Paleoceanography, 23, 1–20, https://doi.org/10.1029/2007PA001465, 2008.
John, C. M., Banerjee, N. R., Longstaffe, F. J., Sica, C., Law, K. R., and Zachos, J. C.: Clay assemblage and oxygen isotopic constraints on the weathering response to the Paleocene-Eocene thermal maximum, East Coast of North America, Geology, 40, 591–594, https://doi.org/10.1130/G32785.1, 2012.
Kahn, A. and Aubry, M. P.: Provincialism associated with the Paleocene/Eocene Thermal Maximum: temporal constraint, Mar. Micropaleontol., 52, 117–132, 2004.
Kaminski, M. A., Kuhnt, W., and Radley, J. D.: Palaeocene-Eocene deep water agglutinated foraminifera from the Numidian Flysch (Rif, Northern Morocco): their significance for the palaeoceanography of the Gibraltar gateway, J. Micropalaeontol., 15, 1–19, 1996.
Kelly, D. C., Zachos, J. C., Bralower, T. J., and Schellenberg, S. A.: Paleoceanography, 20, PA4023, https://doi.org/10.1029/2005PA001163, 2005.
Kender, S., Stephenson, M. H., Riding, J. B., Leng, M. J., Knox, R. W. O. B., Peck, V. L., Kendrick, C. P., Ellis, M. A., Vane, C. H., and Jamieson, R.: Marine and terrestrial environmental changes in NW Europe preceding carbon release at the Paleocene-Eocene transition, Earth Planet. Sci. Lett., 353–354, 108–120, https://doi.org/10.1016/j.epsl.2012.08.011, 2012.
Kennett, J. P. and Stott, L. D.: Abrupt deep-sea warming, palaeoceanographic changes and benthic extinctions at the end of the Palaeocene, Nature, 353, 225–229, https://doi.org/10.1038/353225a0, 1991.
Khozyem, H., Adatte, T., Spangenberg, J. E., Tantawy, A. A., and Keller, G.: Palaeoenvironmental and climatic changes during the Palaeocene-Eocene Thermal Maximum (PETM) at the Wadi Nukhul Section, Sinai, Egypt, J. Geol. Soc. London., 170, 341–352, https://doi.org/10.1144/jgs2012-046, 2013.
Kraus, M. J., Woody, D., Smith, J. J., and Dukic, V.: Alluvial response to the Paleocene-Eocene Thermal Maximum climatic event, Polecat Bench, Wyoming, USA, Palaeogeogr. Palaeocl., 435, 177–192, 2015.
Lawton, T. F.: Laramide sedimentary basins, in: Sedimentary basins of the world, 5, 429–450, Elsevier, https://doi.org/10.1016/S1874-5997(08)00012-9, 2008.
Lawton, T. F., Pindell, J., Beltran-Triviño, A., Juárez-Arriaga, E., Molina-Garza, R., and Stockli, D.: Late Cretaceous-Paleogene Foreland Sediment-Dispersal Systems, in: Northern and Eastern Mexico: Interpretations From Preliminary Detrital-Zircon Analysis, American Association of Petroleum Geologists Search and Discovery, 30423, 2015.
Loucks, R. G., Kerans, C., Zeng, H., and Sullivan, P. A.: Documentation and characterization of the Lower Cretaceous (Valanginian) Calvin and Winn carbonate shelves and shelf margins, onshore north-central Gulf of Mexico, AAPG Bull., 101, 119–142, 2017.
Lowe, D. R. and Ghosh, B.: A stratigraphic and architectural-element methodology for the subdivision and interpretation of deep-water clastic sequences: an example from the Cretaceous Venado Sandstone, Sacramento Valley, California, in: Deep-water Sedimentation: Technological Challenges for the Next Millennium, edited by: Appi, C. J., D'Avila, R., and Viana, A., Brazilian Association of Petroleum Geologists Special Paper, 42–56, 2004.
Mason, C. C., Romans, B. W., Stockli, D. F., Mapes, R. W., and Fildani, A.: Detrital zircons reveal sea-level and hydroclimate controls on Amazon River to deep-sea fan sediment transfer, Geology, 47, 563–567, https://doi.org/10.1130/G45852.1, 2019.
McDonnell, A., Loucks, R. G., and Galloway, W. E.: Paleocene to Eocene deep-water slope canyons, western Gulf of Mexico: Further insights for the provenance of deep-water offshore Wilcox Group plays, AAPG Bull., 92, 1169–1189, 2008.
McInerney, F. A. and Wing, S. L.: The Paleocene-Eocene Thermal Maximum: A perturbation of carbon cycle, climate, and biosphere with implications for the future, Annu. Rev. Earth Planet. Sci., 39, 489–516, https://doi.org/10.1146/annurev-earth-040610-133431, 2011.
McLennan, S. M.: Weathering and global denudation, J. Geol., 101, 295–303, https://doi.org/10.1086/648222, 1993.
Meyer, D., Zarra, L., and Yun, J.: From BAHA to Jack, Evolution of the Lower Tertiary Wilcox Trend in the Deepwater Gulf of Mexico, The Sedimentary Record, 5, 4–9, 2007.
Minguez, D., Hensel, G. E., and Johnson, E. A.: A fresh look at Gulf of Mexico tectonics: Testing rotations and breakup mechanisms from the perspective of seismically constrained potential-fields modeling and plate kinematics, Interpretation, 8, SS31–SS45, 2020.
Mutterlose, J., Linnert, C., and Norris, R.: Calcareous nannofossils from the Paleocene-Eocene Thermal Maximum of the equatorial Atlantic (ODP Site 1260B): Evidence for tropical warming, Mar. Micropaleontol., 65, 13–31, https://doi.org/10.1016/j.marmicro.2007.05.004, 2007.
Nesbitt, H. W. and Young, G. M.: Early Proterozoic climates and plate motions inferred from major element chemistry of lutites, Nature, 299, 715–717, https://doi.org/10.1038/299715a0, 1982.
Nicolo, M. J., Dickens, G. R., and Hollis, C. J.: South Pacific intermediate water oxygen depletion at the onset of the Paleocene-Eocene thermal maximum as depicted in New Zealand margin sections, Paleoceanography, 25, 1–12, https://doi.org/10.1029/2009PA001904, 2010.
Ogg, J. G., Ogg, G. M., and Gradstein, F. M.: A Concise Geologic Time Scale 1st Edition, Elsevier, 234 p., https://doi.org/10.1016/C2009-0-64442-1, 2016.
Pälike, C., Delaney, M. L., and Zachos, J. C.: Deep-sea redox across the Paleocene-Eocene thermal maximum, Geochem. Geophy. Geosy., 15, 1038–1053, https://doi.org/10.1002/2013GC005074, 2014.
Paola, C., Heller, P. L., and Angevine, C. L.: The large-scale dynamics of grain-size variation in alluvial basins, 1: Theory, Basin Res., 4, 73–90, 1992.
Penman, D. E., Hönisch, B., Zeebe, R. E., Thomas, E., and Zachos, J. C.: Rapid and sustained surface ocean acidification during the Paleocene-Eocene Thermal Maximum, Paleoceanography, 29, 357–369, https://doi.org/10.1002/2014PA002621, 2014.
Pflum, C. E. and Frerichs, W. E.: Gulf of Mexico deep-water foraminifers, Cushman Foundation for Foraminiferal Research, Spec. Publ., 14, 1–125, 1976.
Pindell, J. L.: Alleghenian reconstruction and subsequent evolution of the Gulf of Mexico, Bahamas, and Proto-Caribbean, Tectonics, 4, 1–39, https://doi.org/10.1029/TC004i001p00001, 1985.
Pindell, J. and Cossey, S.: It Is Still Viable! Paleogene Gulf of Mexico Water-Level Drawdown Hypothesis, AAPG Explorer, 2020.
Pindell, J., Villagómez, D., Molina-Garza, R., Graham, R., and Weber, B.: A revised synthesis of the rift and drift history of the Gulf of Mexico and surrounding regions in the light of improved age dating of the Middle Jurassic salt, Geological Society, London, Spec. Publ., 504, 29–76, 2021.
Pujalte, V., Baceta, J. I., and Schmitz, B.: A massive input of coarse-grained siliciclastics in the Pyrenean Basin during the PETM: the missing ingredient in a coeval abrupt change in hydrological regime, Clim. Past, 11, 1653–1672, https://doi.org/10.5194/cp-11-1653-2015, 2015.
Pujalte, V., Robador, A., Payros, A., and Samsó, J. M.: A siliciclastic braid delta within a lower Paleogene carbonate platform (Ordesa-Monte Perdido National Park, southern Pyrenees, Spain): Record of the Paleocene – Eocene Thermal Maximum perturbation, Palaeogeogr. Palaeocl., 459, 453–470, https://doi.org/10.1016/j.palaeo.2016.07.029, 2016.
Raffi, I., Backman, J., Zachos, J. C., and Sluijs, A.: The response of calcareous nannofossil assemblages to the Paleocene Eocene Thermal Maximum at the Walvis Ridge in the South Atlantic, Mar. Micropaleontol., 70, 201–212, https://doi.org/10.1016/j.marmicro.2008.12.005, 2009.
Ravizza, G., Norris, R. N., and Blusztajn, J.: As osmium isotope excursion associated with the late Paleocene thermal maximum: Evidence of intensified chemical weathering, Paleoceanography, 16, 155–163, 2001.
Robinson, S. A.: Shallow-water carbonate record of the Paleocene-Eocene Thermal maximum from a Pacific Ocean Guyot, Geology, 39, 51–54, https://doi.org/10.1130/G31422.1, 2011.
Romans, B. W. and Graham, S. A.: A deep-time perspective of land-ocean linkages in the sedimentary record, Ann. Rev. Mar. Sci., 5, 69–94, https://doi.org/10.1146/annurev-marine-121211-172426, 2013.
Rosenfeld, J.: Paleogene Drawdown of the Gulf of Mexico?, AAPG Explorer, April, 1–6, 2020.
Rosenfeld, J. and Pindell, J.: Early Paleogene Isolation of the Gulf of Mexico from the World's Oceans? Implications from Hydrocarbon Exploration and Eustasy, in: The Circum-Gulf of Mexico and the Caribbean, edited by: Bartolini, C., Buffler, R. T., and Blickwede, J., AAPG Memoir, 79, 89–103, https://doi.org/10.1306/M79877C4, 2003.
Sadler, P. M.: Sediment accumulation rates and the completeness of the stratigraphic sections, J. Geol., 89, 569–584, 1981.
Salvador, A.: Late Triassic-Jurassic paleogeography and origin of Gulf of Mexico basin, AAPG Bull., 71, 419–451, 1987.
Salvador, A.: Origin and development of the Gulf of Mexico basin, in: The Gulf of Mexico Basin, The Geology of North America, edited by: Salvador, A., Boulder, CO, Decade of North American Geology, Geological Society of America, J, 389–444, https://doi.org/10.1130/DNAG-GNA-J.389, 1991.
Schmitz, B. and Pujalte, V.: Sea-level, humidity, and land-erosion records across the initial Eocene thermal maximum from a continental-marine transect in northern Spain, Geology, 31, 689–692, https://doi.org/10.1130/G19527.1, 2003.
Schmitz, B., Pujalte, V., and Núñez-Betelu, K.: Climate and sea-level perturbations during the Initial Eocene Thermal Maximum: Evidence from siliciclastic units in the Basque basin (Ermua, Zumaia and Trabakua Pass), northern Spain, Palaeogeogr. Palaeocl., 165, 299–320, https://doi.org/10.1016/S0031-0182(00)00167-X, 2001.
Schoon, P. L., Heilmann-Clausen, C., Schultz, B. P., Sinninghe Damsté, J. S., and Schouten, S.: Warming and environmental changes in the eastern North Sea Basin during the Palaeocene-Eocene Thermal Maximum as revealed by biomarker lipids, Org. Geochem., 78, 79–88, https://doi.org/10.1016/j.orggeochem.2014.11.003, 2015.
Schulte, P., Scheibner, C., and Speijer, R. P.: Fluvial discharge and sea-level changes controlling black shale deposition during the Paleocene-Eocene Thermal Maximum in the Dababiya Quarry section, Egypt, Chem. Geol., 285, 167–183, https://doi.org/10.1016/j.chemgeo.2011.04.004, 2011.
Scotese, C.: PALEOMAP PaleoAtlas for GPlates, earthbyte.org [data set], https://www.earthbyte.org/paleomap-paleoatlas-for-gplates/ (last access: 3 May 2022), 2016.
Self-Trail, J. M., Powars, D. S., Watkins, D. K., and Wandless, G. A.: Calcareous nannofossil assemblage changes across the Paleocene-Eocene Thermal Maximum: Evidence from a shelf setting, Mar. Micropaleontol., 92–93, 61–80, https://doi.org/10.1016/j.marmicro.2012.05.003, 2012.
Sewall, J. O. and Sloan, L. C.: Come a little bit closer: A high-resolution climate study of the early Paleogene Laramide foreland, Geology, 34, 81–84, 2006.
Sharman, G. R., Covault, J. A., Stockli, D. F., Wroblewski, F. A. J., and Bush, M. A.: Early Cenozoic drainage reorganization of the United States Western Interior-Gulf of Mexico sediment routing system, Geology, 45, 187–190, https://doi.org/10.1130/G38765.1, 2017.
Sharman, G. R., Szymanski, E., Hackworth, R. A., Kahn, A. C. M., Febo, L. A., Oefinger, J., and Gregory, G. M.: Carbon-isotope, geochemical, and biostratigraphic data from the Anchor 3 well, Green Canyon protraction area, Gulf of Mexico, Zenodo [data set], https://doi.org/10.5281/zenodo.7291552, 2022.
Sharman, G. R., Covault, J. A., Flaig, P. P., Dunn, R., Fussee-Durham, P., Larson, T., Shanahan, T. M., Dubois, K., Shaw, J. B., Crowley, J. L., and Shaulis, B.: Coastal Response to Global Warming During the Paleocene-Eocene Thermal Maximum, 625, 111664, https://doi.org/10.1016/j.palaeo.2023.111664, 2023.
Shourd, M. L. and Levin, H. L.: Chrondrites in the upper Plattin subgroup (Middle Ordovician) of eastern Missouri, J. Paleontol., 50, 260–268, 1976.
Sluijs, A. and Dickens, G. R.: Assessing offsets between the δ13C of sedimentary components and the global exogenic carbon pool across early Paleogene carbon cycl perturbations, Global Biogeochem. Cy., 26, GB4005, https://doi.org/10.1029/2011GB004224, 2012.
Sluijs, A., G. J. Bowen, H. Brinkhuis, L. J. Lourens, and Thomas, E.,: The Palaeocene-Eocene Thermal Maximum super greenhouse: Biotic and geochemical signatures, age models and mechanisms of global change, in: Deep Time Perspectives on Climate Change: Marrying the Signal From Computer Models and Biological Proxies, edited by: Williams, M., Haywood, A. M., Gregory, F. J., and Schmidt, D. N., The Micropalaeontological Society, Special Publications, 2, 329–349, ISBN 9781862392403, 2007a.
Sluijs, A., Brinkhuis, H., Schouten, S., Bohaty, S. M., John, C. M., Zachos, J. C., Sinninghe Damsté, J. S., Crouch, E. M., and Dickens, G. R.: Environmental precursors to light carbon input at the Paleocene/Eocene boundary, Nature, 450, 1218–1221, https://doi.org/10.1038/nature06400, 2007b.
Sluijs, A., Röhl, U., Schouten, S., Brumsack, H. J., Sangiorgi, F., Sinninghe Damsté, J. S., and Brinkhuis, H.: Arctic late Paleocene - Early Eocene paleoenvironments with special emphasis on the Paleocene-Eocene thermal maximum (Lomonosov Ridge, Integrated Ocean Drilling Program Expedition 302), Paleoceanography, 23, 1–17, https://doi.org/10.1029/2007PA001495, 2008a.
Sluijs, A., Brinkhuis, H., Crouch, E. M., John, C. M., Handley, L., Munsterman, D., Bohaty, S. M., Zachos, J. C., Reichart, G. J., Schouten, S., Pancost, R. D., Damsté, J. S. S., Welters, N. L. D., Lotter, A. F., and Dickens, G. R.: Eustatic variations during the Paleocene-Eocene greenhouse world, Paleoceanography, 23, 1–18, https://doi.org/10.1029/2008PA001615, 2008b.
Sluijs, A. and Brinkhuis, H.: A dynamic climate and ecosystem state during the Paleocene-Eocene Thermal Maximum: inferences from dinoflagellate cyst assemblages on the New Jersey Shelf, Biogeosciences, 6, 1755–1781, https://doi.org/10.5194/bg-6-1755-2009, 2009.
Sluijs, A., van Roij, L., Harrington, G. J., Schouten, S., Sessa, J. A., LeVay, L. J., Reichart, G.-J., and Slomp, C. P.: Warming, euxinia and sea level rise during the Paleocene–Eocene Thermal Maximum on the Gulf Coastal Plain: implications for ocean oxygenation and nutrient cycling, Clim. Past, 10, 1421–1439, https://doi.org/10.5194/cp-10-1421-2014, 2014.
Smith, V., Warny, S., Vellekoop, J., Vajda, V., Gilles Escarguel, G., and Jarzen, D. M.: Palynology from ground zero of the Chicxulub impact, southern Gulf of Mexico, Palynology, 45, 283–299, https://doi.org/10.1080/01916122.2020.1813826, 2021.
Snedden, J. W., Bovay, A. C., and Xu, J.: New Models of Early Cretaceous Source-to-Sink Pathways in the Eastern Gulf of Mexico, in: Mesozoic of the Gulf Rim and Beyond: New Progress in Science and Exploration of the Gulf of Mexico Basin, edited by: Lowery, C. M., Snedden, J. W., and Rosen, N. C., Gulf Coast Section SEPM, 35, https://doi.org/10.5724/gcs.15.35, 2016a.
Snedden, J. W., Virdell, J., Whiteaker, T. L., and Ganey-Curry, P.: A basin-scale perspective on Cenomanian-Turonian (Cretaceous) depositional systems, greater Gulf of Mexico (USA), Interpretation, 4, SC1–SC22, 2016b.
Snedden, J. W., Tinker, L. D., and Virdell, J.: Southern Gulf of Mexico Wilcox source to sink: Investigating and predicting Paleogene Wilcox reservoirs in eastern Mexico deep-water areas, AAPG Bull., 102, 2045–2074, 2018.
Snedden, J. W., Hull, H. L., Whiteaker, T. L., Virdell, J. W., and Ross, C. H.: Late Mesozoic sandstone volumes recorded in Gulf of Mexico subsurface depocentres: Deciphering long-term sediment supply trends and contributions by paleo river systems, Basin Res., 00, 1–23, https://doi.org/10.1111/bre.12659, 2022.
Sømme, T. O., Huwe, S. I., Martinsen, O. J., Sandbakken, P. T., Skogseid, J., and Valore, L. A.: Stratigraphic expression of the Paleocene-Eocene Thermal Maximum climate event during long-lived transient uplift – An example from a shallow to deep-marine clastic system in the Norwegian Sea, Front. Earth Sci., 11, 1082203, https://doi.org/10.3389/feart.2023.1082203, 2023.
Stern, R. J. and Dickinson, W. R.: The Gulf of Mexico is a Jurassic backarc basin, Geosphere, 6, 739–754, 2010.
Steurbaut, E., Magioncalda, R., Dupuis, C., Van Simaeys, S., Roche, E., and Roche, M.: Palynology, paleoenvironments, and organic carbon isotope evolution in lagoonal Paleocene-Eocene boundary settings in North Belgium, in: Causes and Consequences of Globally Warm Climates in the Early Paleogene, edited by: Wing, S. L., Gingerich, P. D., Schmitz, B., and Thomas, E., Spec. Pap. Geol. Soc. Am., 369, 291–317, 2003.
Suarez, M. B., Ludvigson, G. A., González, L. A., Al-Suwaidi, A. H., and You, H.-L.: Stable isotope chemostratigraphy in lacustrine strata of the Xiagou Formation, Gansu Province, NW China, Geological Society London Special Publications, 382, 143–155, https://doi.org/10.1144/SP382.1, 2013.
Sweet, M. L. and Blum, M. D.: Paleocene-Eocene Wilcox submarine canyons and thick deepwater sands of the Gulf of Mexico: Very large systems in a Greenhouse world, not a Messinian-Like crisis, GCAGS Transactions, 61, 443–450, 2011.
Sweet, M. L. and Blum, M. D.: Connections between fluvial to shallow marine environments and submarine canyons: Implications for sediment transfer to deep water, J. Sediment. Res., 86, 1147–1162, 2016.
Thomas, E. and Shackleton, N. J.: The Palaeocene-Eocene benthic foraminiferal extinction and stable isotope anomalies, in: Correlation of the Early Paleogene in Northwest Europe, Geological Society London Special Publication, 101, edited by: Knox, R. W. O. B., Corfield, R. M., and Dunay, R. E., Geological Society of London, London, United Kingdom, 401–441, https://doi.org/10.1144/GSL.SP.1996.101.01.20, 1996.
Tofelde, S., Bernhardt, A., Guerit, L., and Romans, B. W.: Times associated with source-to-sink propagation of environmental signals during landscape transience, Front. Earth Sci., 9, 1–51, https://doi.org/10.3389/feart.2021.628315, 2021.
Turner, S. K.: Constraints on the onset duration of the Paleocene-Eocene Thermal Maximum, Philos. T. R. Soc. A, 376, 20170082, https://doi.org/10.1098/rsta.2017.0082, 2018.
Tribovillard, N., Lageo, T. J., Lyons, T., and Riboulleau, A.: Trace metals as paleoredox and paleoproductivity proxies: An Update, Chem. Geol., 232, 12–32, 2006.
Tyson, R. V.: Palynological Kerogen Classification, in: Sedimentary Organic Matter, Springer, Dordrecht, https://doi.org/10.1007/978-94-011-0739-6_20, 1995.
Vangriesheim, A., Khripounoff, A., and Crassous, P.: Turbidity events observed in situ along the Congo submarine channel, Deep-Sea Res. Part Pt. II, 56, 2208–2222, https://doi.org/10.1016/j.dsr2.2009.04.004, 2009.
Van Morkhoven, F., Berggren, W. A., and Edwards, A. S.: Cenozoic cosmopolitan deep-water benthic foraminifera, B. Cent. Rech. Expl., 11, 90–91, 1986.
van Roij, L.: The Paleocene-Eocene Thermal Maximum in the Gulf of Mexico, Utrecht University, M.S. thesis, 26 pp., 2009.
Versteegh, G. J. M.: Recognition of cyclic and non-cyclic environmental changes in the Mediterranean Pliocene: A palynological approach, Mar. Micropaleontol., 23, 147–183, https://doi.org/10.1016/0377-8398(94)90005-1, 1994.
Vimpere, L., Spangenberg, J. E., Roige, M., Adatte, T., Kaenel, E. D., Fildani, A., Clark, J., Sahoo, S., Bowman, A., Sternai, P., and Castelltort, S.: Carbon isotope and biostratigraphic evidence for an expanded Paleocene-Eocene Thermal Maximum sedimentary record in the deep Gulf of Mexico, Geology, 51, 334–339, https://doi.org/10.1130/G50641.1, 2023.
Watkins, D. K. and Bergen J. A.: Late Albian adaptive radiation in the calcareous nannofossil genus Eiffellithus, Micropaleontology, 49, 231–252, 2003.
Wedepohl, K. H.: Environmental influences on the chemical composition of shales and clays, in: Physics and Chemistry of the Earth, Pergamon, edited by: Ahrens, L. H., Press, F., Runcorn, S. K., and Urey, H. C., Oxford, 305–333, https://doi.org/10.1016/0079-1946(71)90020-6, 1971.
Wedepohl, K. H.: The composition of the upper Earth's crust and the natural cycles of selected metals, in: Metals and their Compounds in the Environment, edited by: Merian, E., VCH-Verlagsgesellschaft, Weinheim, 3–17, ISBN-13 9780895735621, 1991.
Westerhold, T., Röhl, U., Wilkens, R. H., Gingerich, P. D., Clyde, W. C., Wing, S. L., Bowen, G. J., and Kraus, M. J.: Synchronizing early Eocene deep-sea and continental records – cyclostratigraphic age models for the Bighorn Basin Coring Project drill cores, Clim. Past, 14, 303–319, https://doi.org/10.5194/cp-14-303-2018, 2018.
White, C. J., Snedden, J. W., and Virdell, J.: Calibrated seismic stratigraphic analysis of the Lavaca/Yoakum Canyon Complex, south Texas, USA, GCAGS Journal, 8, 210–230, 2019.
Wieczorek, R., Fantle, M. S., Kump, L. R., and Ravizza, G.: Geochemical evidence for volcanic activity prior to and enhanced terrestrial weathering during the Paleocene Eocene Thermal Maximum, Geochim. Cosmochim. Acta, 119, 391–410, https://doi.org/10.1016/j.gca.2013.06.005, 2013.
Wing, S. L., Harrington, G. J., Bowen, G. J., and Koch, P. L.: Floral change during the Initial Eocene Thermal Maximum in the Powder River Basin, Wyoming, in: Causes and Consequences of Globally Warm Climates in the Early Paleogene, edited by: Wing, S. L., Gingerich, P. D., Schmitz, B., and Thomas, E., Spec. Pap. Geol. Soc. Am., 369, 425–440, https://doi.org/10.1130/0-8137-2369-8.425, 2003.
Wing, S. L., Harrington, G. J., Smith, F. A., Bloch, J. I., Boyer, D. M., and Freeman, K. H.: Transient floral change and rapid global warming at the Paleocene-Eocene boundary, Science, 310, 993–996, 2005.
Winker, C. D.: Cenozoic shelf margins, northwestern Gulf of Mexico, Gulf Coast Association of Geological Societies Transactions, 32, 427–448, 1982.
Winker, C. D.: Clastic shelf margins of the post-Comanchean Gulf of Mexico: implications for deepwater sedimentation, GCSSEPM 4th Annual Bob F. Perkins Research Conference, 109–120, 2–5 December, https://doi.org/10.5724/gcs.84.05.0109, 1984.
Xiong, S., Ding, Z., Zhu, Y., Zhou, R., and Lu, H.: A ∼6 Ma chemical weathering history, the grain size dependence of chemical weathering intensity, and its implications for provenance change of the Chinese loess-red clay deposit, Quaternary Sci. Rev., 29, 1911–1922, 2010.
Xue, L.: Depositional cycles and evolution of the Paleogene Wilcox strata, Gulf of Mexico Basin, Texas, AAPG Bull., 81, 937–953, 1997.
Xue, L. and Galloway, W. E.: Sequence stratigraphic and depositional framework of the Paleocene lower Wilcox strata, northwest Gulf of Mexico Basin, Gulf Coast Association of Geological Societies Transactions, 43, 453–464, 1993.
Xue, L. and Galloway, W. E.: High-resolution depositional framework of the Paleocene middle Wilcox strata, Texas coastal plain, AAPG Bull., 79, 205–230, 1995.
Yonkee, W. A. and Weil, A. B.: Tectonic evolution of the Sevier and Laramide belts within the North American Cordillera orogenic system, Earth-Sci. Rev., 150, 531–593, 2015.
Zachos, J. C., Röhl, U., Schellenberg, S. A., Sluijs, A., Hodell, D. A., Kelley, D. C., Thomas, E., Nicolo, M., Raffi, I., Lourens, L. J., McCarren, H., and Kroon, D.: Rapid acidification of the ocean during the Paleocene-Eocene Thermal Maximum, Science, 308, 1611–1615, 2005.
Zarra, L., Meyer, D., and Neal, S. L.: Wilcox depositional systems: shelf to deep basin: abst., GCSSEPM Bob F. Perkins 23rd Annual Research Conference, 575–576, https://doi.org/10.5724/gcs.03.23.0575, 2013.
Zarra, L.: Chronostratigraphic framework for the Wilcox Formation (upper Paleocene-lower Eocene) in the deep-water Gulf of Mexico: Biostratigraphy, sequences, and depositional system, in: The Paleogene of the Gulf of Mexico and Caribbean Basins: Processes, Events and Petroleum Systems, edited by: Kennan, L., Pindell, J., and Rosen, N. C., Houston, Texas, Gulf Coast Section SEPM, 27, 81–145, https://doi.org/10.5724/gcs.07.27.0081, 2007.
Zarra, L., Hackworth, R., and Kahn, A.: Wilcox Chronostratigraphic Framework: Update, AAPG Annual Convention and Exhibition, https://www.searchanddiscovery.com/abstracts/html/2019/ace2019/abstracts/181.html (last access: 31 August 2023), 19–22 May, San Antonio, TX, USA, 2019.
Zeebe, R. E. and Zachos, J. C.: Long-term legacy of massive carbon input to the Earth system: Anthropocene versus Eocene, Phil. Trans. R. Soc. A, 371, 20120006, https://doi.org/10.1098/rsta.2012.0006, 2013.
Zeebe, R. E., Ridgwell, A., and Zachos, J. C.: Anthropogenic carbon release rate unprecedented during the past 66 million years, Nat. Geosci., 9, 325–329, https://doi.org/10.1038/ngeo2681, 2016.
Zhang, J., Covault, J., Pyrcz, M., Sharman, G., Carvajal, C., and Milliken, K.: Quantifying sediment supply to continental margins: Application to the Paleogene Wilcox Group, Gulf of Mexico, AAPG Bull., 102, 1685–1702, 2018.
Zhou, X., Li, A., Jiang, F., and Lu, J.: Effects of grain size distribution on mineralogical and chemical compositions: a case study from size-fractional sediments of the Huanghe (Yellow River) and Changjiang (Yangtze River), Geol, J., 50, 414–433, 2015.