the Creative Commons Attribution 4.0 License.
the Creative Commons Attribution 4.0 License.
 | 28 Apr 2022
Influence of warming and atmospheric circulation changes on multidecadal European flood variability
Stefan Brönnimann
Peter Stucki
Jörg Franke
Veronika Valler
Yuri Brugnara
Ralf Hand
Laura C. Slivinski
Gilbert P. Compo
Prashant D. Sardeshmukh
Michel Lang
Bettina Schaefli
European flood frequency and intensity change on a multidecadal scale. Floods were more frequent in the 19th (central Europe) and early 20th century (western Europe) than during the mid-20th century and again more frequent since the 1970s. The causes of this variability are not well understood and the relation to climate change is unclear. Palaeoclimate studies from the northern Alps suggest that past flood-rich periods coincided with cold periods. In contrast, some studies suggest that more floods might occur in a future, warming world. Here we address the contribution of atmospheric circulation and of warming to multidecadal flood variability. For this, we use long series of annual peak streamflow, daily weather data, reanalyses, and reconstructions. We show that both changes in atmospheric circulation and moisture content affected multidecadal changes of annual peak streamflow in central and western Europe over the past two centuries. We find that during the 19th and early 20th century, atmospheric circulation changes led to high peak values of moisture flux convergence. The circulation was more conducive to strong and long-lasting precipitation events than in the mid-20th century. These changes are also partly reflected in the seasonal mean circulation and reproduced in atmospheric model simulations, pointing to a possible role of oceanic variability. For the period after 1980, increasing moisture content in a warming atmosphere led to extremely high moisture flux convergence. Thus, the main atmospheric driver of flood variability changed from atmospheric circulation variability to water vapour increase.
- Article
(8446 KB) - Full-text XML
-
Supplement
(16404 KB) - BibTeX
- EndNote


Changes in flood frequency and intensity depend on many factors (Hall et al., 2014; Tarasova et al., 2019) including changes in atmospheric processes such as moisture flux, convection, precipitation at different time scales, changes in hydrological processes such as infiltration or overland flow, the seasonal coincidence of snowmelt and heavy precipitation, and on human interventions such as river bed and lake regulations, hydropower plants or other hydraulic constructions. Some of these factors are affected by climate change, but also multidecadal variations of climate play a role. During the 19th century, floods were more frequent in Alpine countries (Glaser et al., 2004, 2010; Brázdil et al., 2005; Blöschl et al., 2020; Schmocker-Fackel and Naef, 2010a, b; Himmelsbach et al., 2015; Lang et al., 2016) triggering political discussion that led to legislation on forest conservation and hydraulic engineering (Summermatter, 2005). In contrast, floods were comparably rare in central Europe in the mid-20th century, a period when large infrastructure projects were planned and carried out (Pfister, 2009). The causes of this multidecadal flood variability are not well understood. Atmospheric circulation changes played a role (Jacobeit et al., 2003; Mudelsee et al., 2004; Quinn and Wilby, 2013; Brönnimann et al., 2019), but this has not been well quantified. Furthermore, the relation to climate change is unclear. In this paper we analyse multidecadal flood variability in Europe in relation to atmospheric processes and in particular their link to climate change.
Better understanding this relation is relevant for assessing future flood risk. In that context, it is important to note that palaeoclimate studies (Stewart et al., 2011; Glur et al., 2013; Engeland et al., 2020; Wilhelm et al., 2022) from the Alps or Norway suggest that past flood-rich periods coincided with cool periods. Conversely, climate projections suggest that with global warming, flood occurrence will increase globally and an increase in flood risk is “very likely” in countries representing 70 % of the world population (Alfieri et al., 2017; IPCC, 2021). This is because of an increase in heavy precipitation due to increased atmospheric moisture, though changes are region specific and depend, among other things, on atmospheric circulation changes (IPCC, 2021). Our paper addresses effects of atmospheric circulation changes and of climate warming on European floods on a multidecadal scale, following the work of Blöschl et al. (2020). We apply a dynamical perspective to a long period (200 years) that covers both types of flood periods (cold and flood rich, warm and flood rich).
In this paper we specifically explore to what extent atmospheric processes can explain multidecadal variability in flood intensity. We also investigate how the atmospheric contribution can be further partitioned into contributions from circulation changes and moisture changes. To achieve this, we analyse long annual peak streamflow series, daily weather data, reanalyses, and reconstructions.
2.1 Annual peak streamflow series and daily precipitation series
We use annual maximum streamflow from the Global Runoff Data Center (GRDC) from all series in the region 42–60∘ N, 2∘ W to 18∘ E that are at least 110 years long. (In 1904–1905 a network was installed in Switzerland, hence coverage increases; one obviously inhomogeneous series from Sweden was excluded.) Note that daily data are not available from this source, hence our focus on annual maximum streamflow. This set was supplemented with two long daily streamflow series from the Rhône (Lang et al., 2016) and Rhine (Wetter et al., 2011), resulting in a set of 45 series (Table S1 in the Supplement). For comparison, all series were scaled with their long-term average. The 14 longest series are shown in Fig. 1a. For all further analyses, we normalized the series by fitting a Gamma distribution (Botter et al., 2013) and transforming to the quantiles of a standard normal distribution (we also analysed the raw data, which gave similar results). Since in later steps series will be aggregated, this transformation ensures that combined series have more similar properties. Both the scaling and the transformation to a normal distribution were performed based on a common reference period comprising all data after 1900. We term these series “flood intensity”, noting that not each annual value would be called a “flood”. For the two daily series, we also analysed the flood frequency (exceedance of the 98th percentile, declustered by combining events up to 3 d apart; see Sect. 2.4). A comparison for 30-year moving averages is shown in Fig. S2 in the Supplement. Note that palaeoclimate studies are often based on events with a longer return period (e.g. 10 years or longer; Wilhelm et al., 2022).
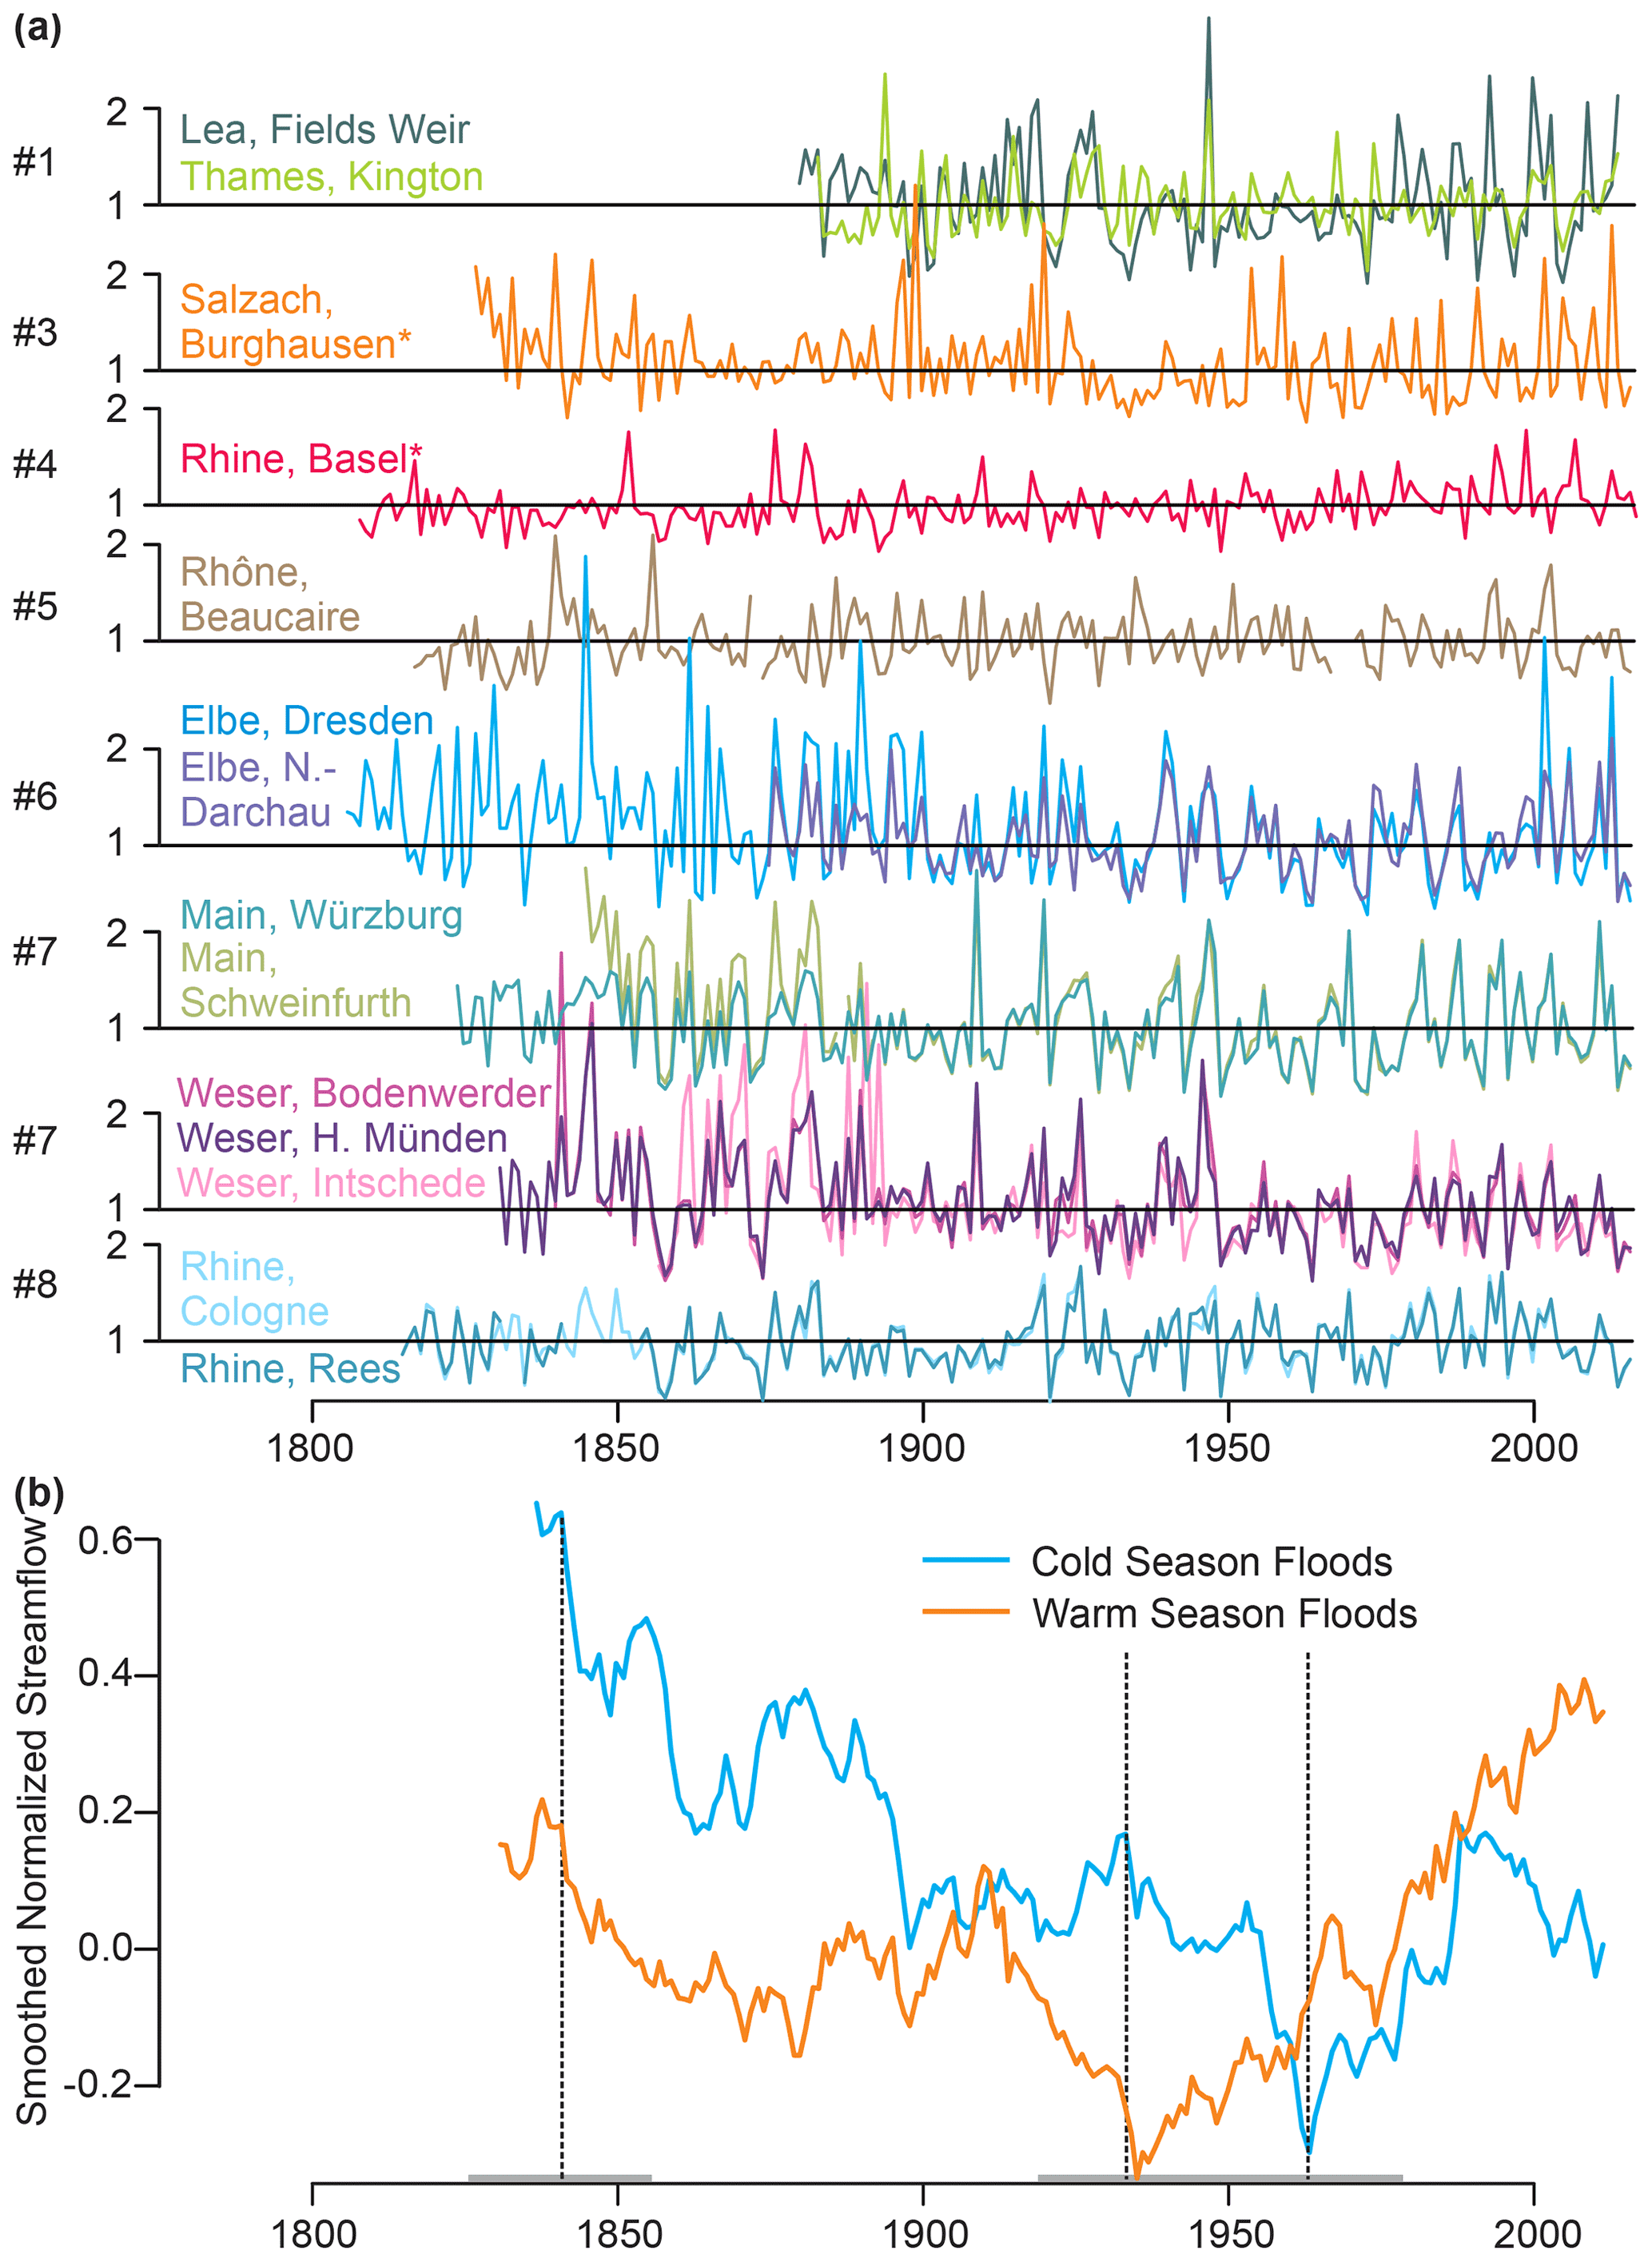
Figure 1(a) Scaled series of annual peak streamflow for the 14 longest series in central Europe (Table S1, numbers on the left refer to the regions defined in Sect. 2.2). Stars denote streamflow series with predominantly summer floods. (b) Normalized series of annual peak streamflow averaged (50 % of rivers must have data) for rivers with predominantly cold-season floods (blue) and warm-season floods (orange), smoothed with a 30-year moving average (min. 20 available years). Dashed lines with grey bars show the 30-year intervals chosen for analysis.
To each of the streamflow series a daily precipitation record from a neighbouring station was assigned. For this, we searched GHCN daily (Vose et al., 1992), ECAD (Klein Tank et al., 2002) as well as series from MeteoSwiss, and selected series that are as long as possible and, if possible, from a location upstream of the streamflow series (Table S1). Note that in some regions long precipitation records are sparse, and in some cases the same precipitation record was used for more than one streamflow record. Furthermore, it should be noted that these series have not been homogenized and their long-term stability is questionable. Only in one case (Hohenpeissenberg), we accounted for an obvious inhomogeneity by excluding data prior to 1879. From the precipitation series we calculated Rx5day and Rx20day, i.e. the annual maxima of precipitation sum over periods of 5 and 20 d, respectively. The latter is used to characterize the seasonality of hydrological preconditions (e.g. soil saturation) in a catchment, as further discussed in the next section. The former is used as a diagnostic of flood-propelling events. Previous work (Froidevaux et al., 2015; Brönnimann et al., 2019) has shown that flood events are mostly affected by precipitation on 3–4 d prior to the event. Although catchment size varies in our studies, Rx5day is expected to characterize heavy rainfall characteristics over a large range of catchments.
2.2 Regionalization
In a next step, the streamflow series were grouped into regions with hydro-meteorological characteristics as similar as possible using Ward clustering (Ward.D2 in R). We considered the seasonalities of annual maximum streamflow, Rx5day, and Rx20day (i.e. the probability of annual maximum of precipitation over a 5 d window or peak streamflow to fall into a specific month; Fig. S1 in the Supplement), the coordinates of the river gauge, as well as the coordinates of the precipitation station. The series were standardized and scaled such that streamflow, precipitation, river coordinates, and precipitation coordinates each contributed the same variance. A separation into nine clusters resulted in mostly regionally coherent, non-overlapping clusters. One cluster comprised series from two different catchments (Elbe and Danube) and was correspondingly split and merged with the existing Danube cluster and with an Elbe sub-cluster. Additionally, one river (Ilz) was moved from the Danube cluster (although the Ilz is a tributary of the Danube) to the central Germany cluster as the flood seasonality is clearly distinct from that of the Danube (Fig. S3 in the Supplement).

Figure 2Normalized smoothed streamflow series for the three Alpine regions. In each region an upstream catchment (mean altitude > 2000 m a.s.l., light blue) and streamflow series downstream from the same river system (dark blue) is shown. All series are smoothed with a 30-year moving average.

Figure 3Normalized smoothed streamflow series for all series in all eight clusters. All series are smoothed with a 30-year moving average.
Within the Alpine clusters (Rhône, Alpine Rhine, Danube), individual peak streamflow series show strikingly different trends (Fig. 2). Apart from the fact that the flood season changes from summer (in the Alps) to winter (in the lowland) in all three rivers, which is partly reflected in the clustering as the change occurs relatively far away from the Alps, also long-term trends radically change from the Alps to the Alpine foreland. The highest catchments (mean elevation > 2000 m a.s.l.) in all three regions (Rhône, Porte-Du-Scex; Rhine, Domatems; Inn, Martinsbruck) show a strong decrease since the early 20th century, whereas the long-term evolution further downstream is flat (Rhône, Chancy) or increasing (Rhine, Basel; Danube, Achleiten; Fig. 2). A possible explanation relates to the role of snow processes on high-altitude catchments. Trends could then be due to a superposition of the seasons of snowmelt and heavy precipitation in the early 20th century, whereas the two seasons are more separated today (FOEN, 2021). Other explanations include the role of power plants or other hydraulic constructions on the flood regime (which is studied for the case of Porte-du-Scex; see Hingray et al., 2010). In any case, since the focus of this study is on atmospheric processes, these rivers might confuse our results and hence we removed five series from the three clusters (Inn at Martinsbruck; Rhône at Porte-Du-Scex; and Rhine at Domatems, Neuhausen, and Rekingen). A one-series cluster in Sweden (Glomma) also is clearly affected by snowmelt and rain-on-snow events (Bøe et al., 2006). The series are shown in Fig. S4 in the Supplement but not further studied in relation to atmospheric processes. Our final selection, shown in Fig. 3, comprises a set of 39 streamflow series, aggregated into eight clusters with areas of ca. 50 000–100 000 km2. The clusters are spatially coherent, internally consistent with respect to seasonality and heavy precipitation regime, and internally homogeneous with respect to time evolution. (Exceptions are southern England, where the only two long series disagreed, and the Danube, where time evolution is less homogeneous.) The clusters represent southern England, southern Norway, the Rhône, the Alpine Rhine, the Lower Rhine, central Germany, the Elbe, and the Danube.
Seasonality is an important factor to consider as it is characteristic for a given region. Furthermore, the relevance of atmospheric process changes in the course of the year. Winter events tend to be related to different circulation patterns (e.g. zonal flow) than summer events (Stucki et al., 2012). Moreover, the role of convection is stronger in summer. In the following we will therefore perform all analyses for annual data as well as for annual series restricted to flood seasons, defined as May to October (for clusters Upper Rhine and Danube) and November to April (all other clusters). This partitioning captures the seasonal flood characteristics as well as the seasonal differences in atmospheric processes and it still ensures an adequate sample size.
2.3 Atmospheric and climate data
The focus of the paper is on the atmospheric contribution to flood intensity. However, studying atmospheric circulation 200 years back in time with a focus on extreme weather events is challenging. To compensate for potential deficiencies of long-term data sets and to obtain more robust results, we use multiple atmospheric data sets that are partly independent and are based on different methods.
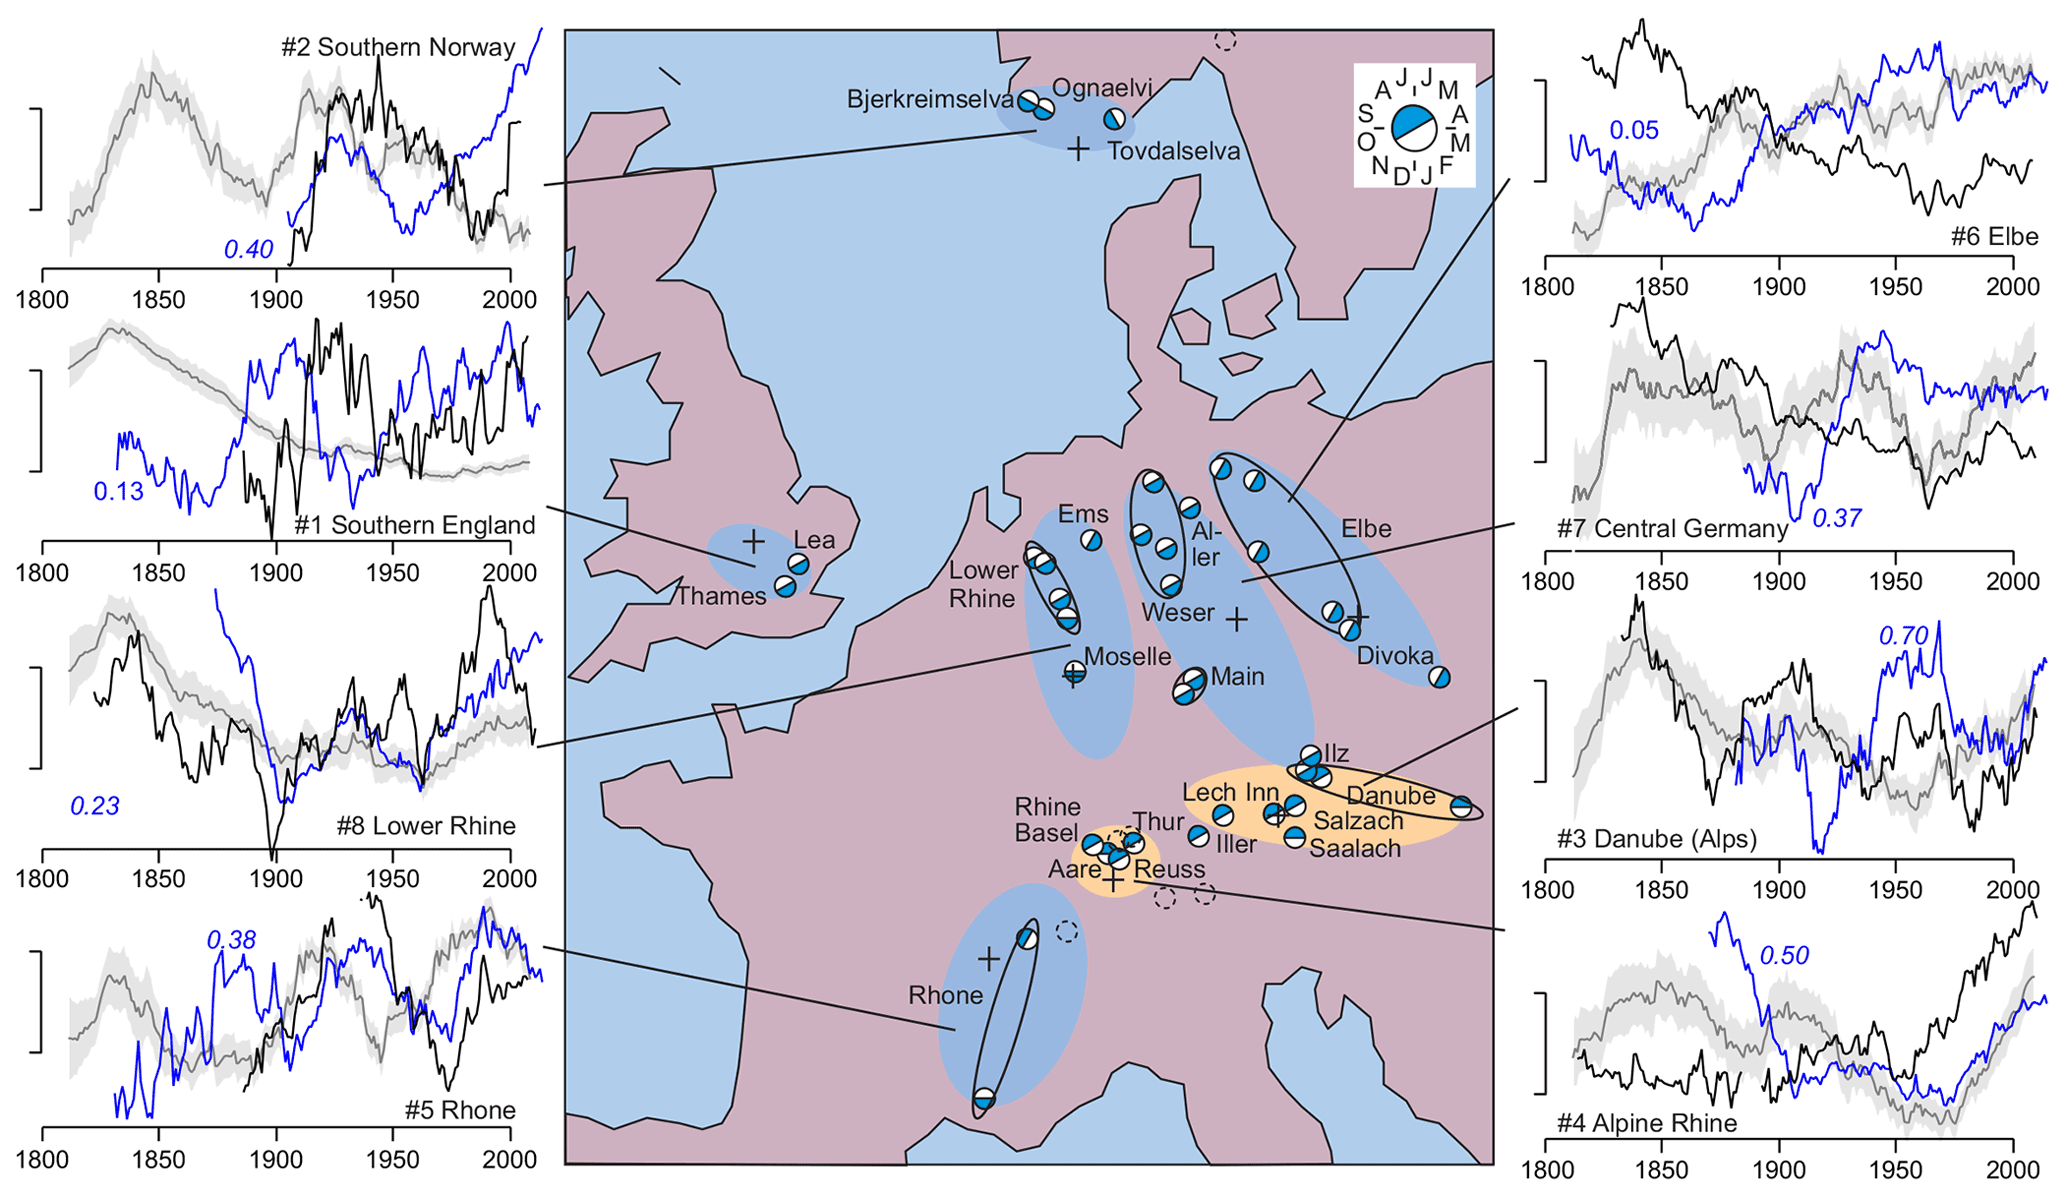
Figure 4Regionally averaged (coloured ellipses; black ellipses indicate same river) series of normalized peak streamflow (black), Rx5day (blue, the number indicates its correlations with peak streamflow at 4-year aggregation, italics indicates p < 0.05), and CONV5d during the flood season from 20CRv3 at locations of crosses (grey, shading indicates the ensemble standard deviation), standardized and subsequently smoothed with a 30-year moving average (scale bars range from −0.5 to +0.5). Regions are colour coded according to the predominance of cold (blue; November to April) or warm season floods (orange; May to October). The blue part of the white-blue circle for each river indicates the 6-month period with highest flood frequency. Dashed circles: streamflow series excluded because of likely influence of snowmelt, hydropower dams, or other hydraulic constructions on trends.
The dynamical reanalysis 20CRv3 (Slivinski et al., 2019) provides 3-hourly, 3-dimensional, global atmospheric data back to 1806. The 20CRv3 assimilates only surface pressure observations into an atmospheric model with prescribed sea-surface temperatures, sea-ice concentration, and radiative forcings. It consists of 80 equally likely members. All analyses shown here were performed for each member to obtain a physically plausible range of realizations. We extracted one grid point per region (crosses in Fig. 4; selected from the 1 × 1∘ grid such as to best represent atmospheric processes relevant for the region; note that we preferred point data, as the Rx5day data also are point data). The reanalysis allows calculating specific diagnostics, such as moisture flux convergence, at a relatively high resolution. However, the quality of 20CRv3 varies in time and space, particularly during the 19th century. The data prior to 1836 are less well evaluated and have a larger uncertainty (Slivinski et al., 2021). We always show the ensemble mean and ±1 ensemble standard deviations.
The second data set consists of daily weather types. Floods occur during specific weather patterns with similar hydro-meteorological characteristics (Stucki et al., 2012) and thus weather type classifications can be useful to study atmospheric contributions to floods. We use the Swiss CAP7 weather types back to 1763 (Cluster Analysis of Principal Components; Schwander et al., 2017) which is based on daily meteorological data from Europe, some of which overlap with 20CRv3.
The third data set is the updated global atmospheric palaeo-reanalysis EKF400v2 covering the past 400 years (Franke et al., 2020; Valler et al., 2021). The EKF400v2 provides monthly global 3-dimensional reconstructions from an offline assimilation. While there is a small overlap in input data with 20CRv3 (some of the pressure series), EKF400v2 mainly assimilates other data (temperature, precipitation, documentary data, tree rings). However, unlike for the other two data sets, EKF400v2 is not available at daily resolution. We use the monthly values to analyse seasonal precipitation and 500 hPa geopotential height (GPH).
For comparison with climate model data, we analyse monthly precipitation also directly in station data (Peterson and Vose, 1997; Alexander and Jones, 2000; Murphy et al., 2018) and in the observation-based gridded product HISTALP (Efthymiadis et al., 2006; Chimani et al., 2012), which also includes temperature. (Note that these data were assimilated into EKF400v2.)
2.4 Flood probability index
Based on the weather types, we define a flood probability index (FPI, see below), which characterizes a season or year based on sequences of weather types. To calibrate the index we need daily streamflow series, which are available only for the Rhine (Basel) and Rhône (Beaucaire). We calculate it separately for the warm season (May to October for Basel) and cold season (November to April for Beaucaire) in order to analyse the seasonally varying relation of weather types with temperature anomalies. The calculation of the FPI is based on Quinn and Wilby (2013) and is performed exactly as in Brönnimann et al. (2019). We first determined the 98th percentile of daily streamflow within the respective seasonal window and marked all days above this percentile as extreme events. Events separated by 3 or fewer days were combined to ensure independence, and from each sequence of marked days only the day of the maximum was kept. For each weather type we then calculated the fraction of days coinciding with a flood event relative to all days of that type. Then we assigned this number to each day of that weather type. This was repeated for different lead times up to 5 d such that the weather on preceding days is also considered, and lead times 5 to 0 were weighted , , , , , and . This window length and weighting was taken from a previous study (Brönnimann et al., 2019) and was based on analyses of daily discharge, precipitation, and water flux convergence on the preceding days. This procedure yields an FPI for each day in the past. (Note that the index was calibrated in the data after 1900 but calculated back to 1763.) The 75th percentile of this index calculated for each season was then chosen as an indicator of flood probability (for details see Brönnimann et al., 2019).
2.5 Water flux convergence
Atmospheric circulation was furthermore analysed in terms of advection and convection of moist air. We calculated a simplified measure of moisture flux convergence in which 850 hPa horizontal wind is multiplied with precipitable water, termed water flux convergence in the following. This was calculated for each of the 80 ensemble members of 20CRv3 and each 3 h interval. In this analysis we use the annual maximum 5 d average, CONV5d (analog to Rx5day; different windows from 3 h to 10 d gave very similar results). All series were smoothed with a 30-year moving average and finally the members were averaged. CONV5d indicates intense moisture transport and precipitation.
Based on the 3-hourly values feeding into the maximum 5 d value, we decomposed CONV5d into its contributions as follows (overbar denotes the average over the entire period (1806–2015), primes denote deviations therefrom, q denotes precipitable water, v is the wind vector with components u and v):
This decomposition results in four groups of three terms. The first three terms on the right hand side (second line) indicate the contribution by the mean flow, the next three terms (third line) the contribution by changes in circulation (while keeping moisture constant), the next three terms measure the contribution by changes in precipitable water (while keeping the circulation constant), and the last three terms describe the interaction of circulation and moisture changes.
2.6 Model simulations
To test the effect of sea-surface temperature and external forcing on multidecadal variations of atmospheric circulation, we used the global atmospheric model ECHAM6 (Giorgetta et al., 2013). It was run in the standard configuration T63L47 for the years 1851–2015. The spatial resolution corresponds to ca. 1.9∘. In total 31 members were produced using different initial conditions as well as different sea-surface temperatures (obtained by sampling from the 10 members in HadISST2); only one realization was available for sea ice (Titchner and Rayner, 2014). All other forcings (land surface, volcanic aerosols, tropospheric aerosols, and greenhouse gas concentrations) followed the Paleoclimate Modelling Intercomparison Project (PMIP) protocol (Jungclaus et al., 2017). Ensembles with individual forcings are not available.
3.1 Annual peak streamflow
The longest 14 series show that extreme floods occurred in the 19th century, particularly in the Elbe, Weser, and Main catchments, but also Salzach and Rhône show high peaks. Conversely, apart from floods in 1946 (Weser) and 1947 (Lea, Thames, Main), the period ca. 1940–1970 exhibits fewer spikes. However, the rivers exhibit different streamflow regimes and flood seasonalities (Fig. S2). The upper (Alpine) catchments of Rhine and Danube exhibit their annual maximum streamflow typically during the warm season, most other catchments during the cold season. After normalizing, the “cold season” and “warm season” rivers were therefore averaged separately and the series were smoothed as shown in Fig. 1b. Likewise, all further analyses were performed for annual series as well as for flood seasons (i.e. November to April for “cold season” flood rivers and May to October for “warm season” flood rivers). Note that throughout the paper, a 30-year moving average was used for visualization, where at least 20 values must be available. For averaging regions we require that half of the regions have available data; only when averaging within regions did we not require a minimum, as the chosen clusters were largely homogeneous such that the drop-out of a series will not have a large effect.
These aggregated curves show additional features. Less pronounced peaks for cold-season flood rivers are found in the 1870s and the early 20th century. Based on peaks in the cold-season series, three 30-year periods were selected for further investigation: 1827–1856 (primary maximum), 1949–1978 (primary minimum), and 1919–1948 (local maximum at a time when warm-season series exhibit low values). While numerous non-climatic factors (e.g. changes in the stream network and land use) contribute to long-term trends or may induce step changes (e.g. Hingray et al., 2010), multidecadal variability is less influenced by such changes (note that the Rhine series was corrected for two such changes) and hence climatic conditions are analysed.
Our findings of increased flood intensities in central Europe in the 19th century and a decrease in the mid-20th century are confirmed by documentary evidence (Naulet et al., 2005; Wetter et al., 2011; Himmelsbach et al., 2015; Lang et al., 2016). A recent, comprehensive study based on documentary data and a three-class flood magnitude index (Blöschl et al., 2020) found coherent flood phases in the mid-19th century in central and southern Europe, in the early 20th century in northwestern Europe, and in recent decades in central and western Europe, although this is not the case for each individual river (Glaser et al., 2010).
Our aggregation into eight regions retains the main phases of flood intensity but adds spatial information. This is shown for annual time series (Fig. S4) as well as for flood seasons (Fig. 4). High peak streamflow occurred in central Europe in the 19th century, in central and western Europe in the early 20th century, and low peak streamflow in all regions after 1950. Since 1970 peak streamflow has increased, although not everywhere, and some series (not only those influenced by snow) show a decline at the beginning of the 21st century.
For comparison with Blöschl et al. (2020), we add the interpolated and smoothed series calculated from their data and code to Fig. S5 in the Supplement. Correlations (at 4-year aggregation, corresponding to the voxel size in Blöschl et al., 2020) with peak streamflow (numbers in Fig. 4) are around or below 0.4, statistically significant (t test, p < 0.05) for the regions southern Norway, Upper Rhine, Rhône, and Elbe. Obviously, the comparability of measurement-based versus document-based evidence is limited. For instance, analysed statistics differ (annual maxima versus indexed extremes), the series measure different aspects of flood (streamflow versus documented flood intensity), and there is large river-to-river variability. Yet, the flood-rich decades in the middle and late 19th century in central Europe, in the early 20th century in northwestern Europe, the Europe-wide flood-poor period after 1950, and the recent increase in flood intensity are salient features of all analyses. This becomes clear when aggregating the series spatially into northwestern Europe (UK and southern Norway) and central Europe (all other regions), and smoothing the Blöschl data for better comparability with the 30-year smoothed streamflow (see Fig. S5). Hence, the regional characteristics are consistent with the documentary evidence on a climatological scale, and the fact that corresponding periods of more and less frequent floods are found with both methods opens the door for the following analyses.
In the following, we show results only for the seasonal series (results for the annual series are similar). Note that flood seasons capture ca. 80 % of peak streamflow events, and flood intensities are ca. 8 % higher than for out-of-season floods.
3.2 Atmospheric influences and the role of circulation and water vapour changes
First, we analysed the relation between flood intensity and precipitation. In most regions, flood intensities are statistically related to Rx5day. Correlations (Figs. 4 and S5, calculated from annual data) vary greatly (between 0.05 and 0.7) but are significant (t test, p < 0.05) for six regions. Note that a high correlation is not necessarily expected on a year-to-year scale as Rx5day events often do not occur together with annual peak streamflow. In winter flood regions, for instance, Rx5day occurs predominantly in summer, whereas peak streamflow occurs predominantly in winter; hence, a winter series is correlated with a summer series. Nevertheless, years with high peak streamflow coincide with years with high maximum 5 d precipitation, although the association is not very strong and one needs to keep in mind that flood intensity is not purely atmospherically driven. Note also that neither peak streamflow (except for Rhine, Basel) nor Rx5day are based on homogenized data series.
Next, we analysed atmospheric influences on the multidecadal variability of peak streamflow using the diagnostics defined in Sect. 2. The CONV5d series (grey lines and shading in Fig. 4; for visualization they were standardized prior to filtering) exhibit multidecadal variations with maximum convergence in the 19th and early 20th century and minimum convergence around 1950, although the pattern differs from region to region. They are in general agreement with the maximum streamflow curves for several regions (e.g. Rhône, Lower Rhine, central Germany, Danube), while in other regions the agreement is worse. Similarly as for Rx5day, CONV5d is less reliable in the early years, prior to ca. 1836. The steep increase in these years therefore cannot be assessed.
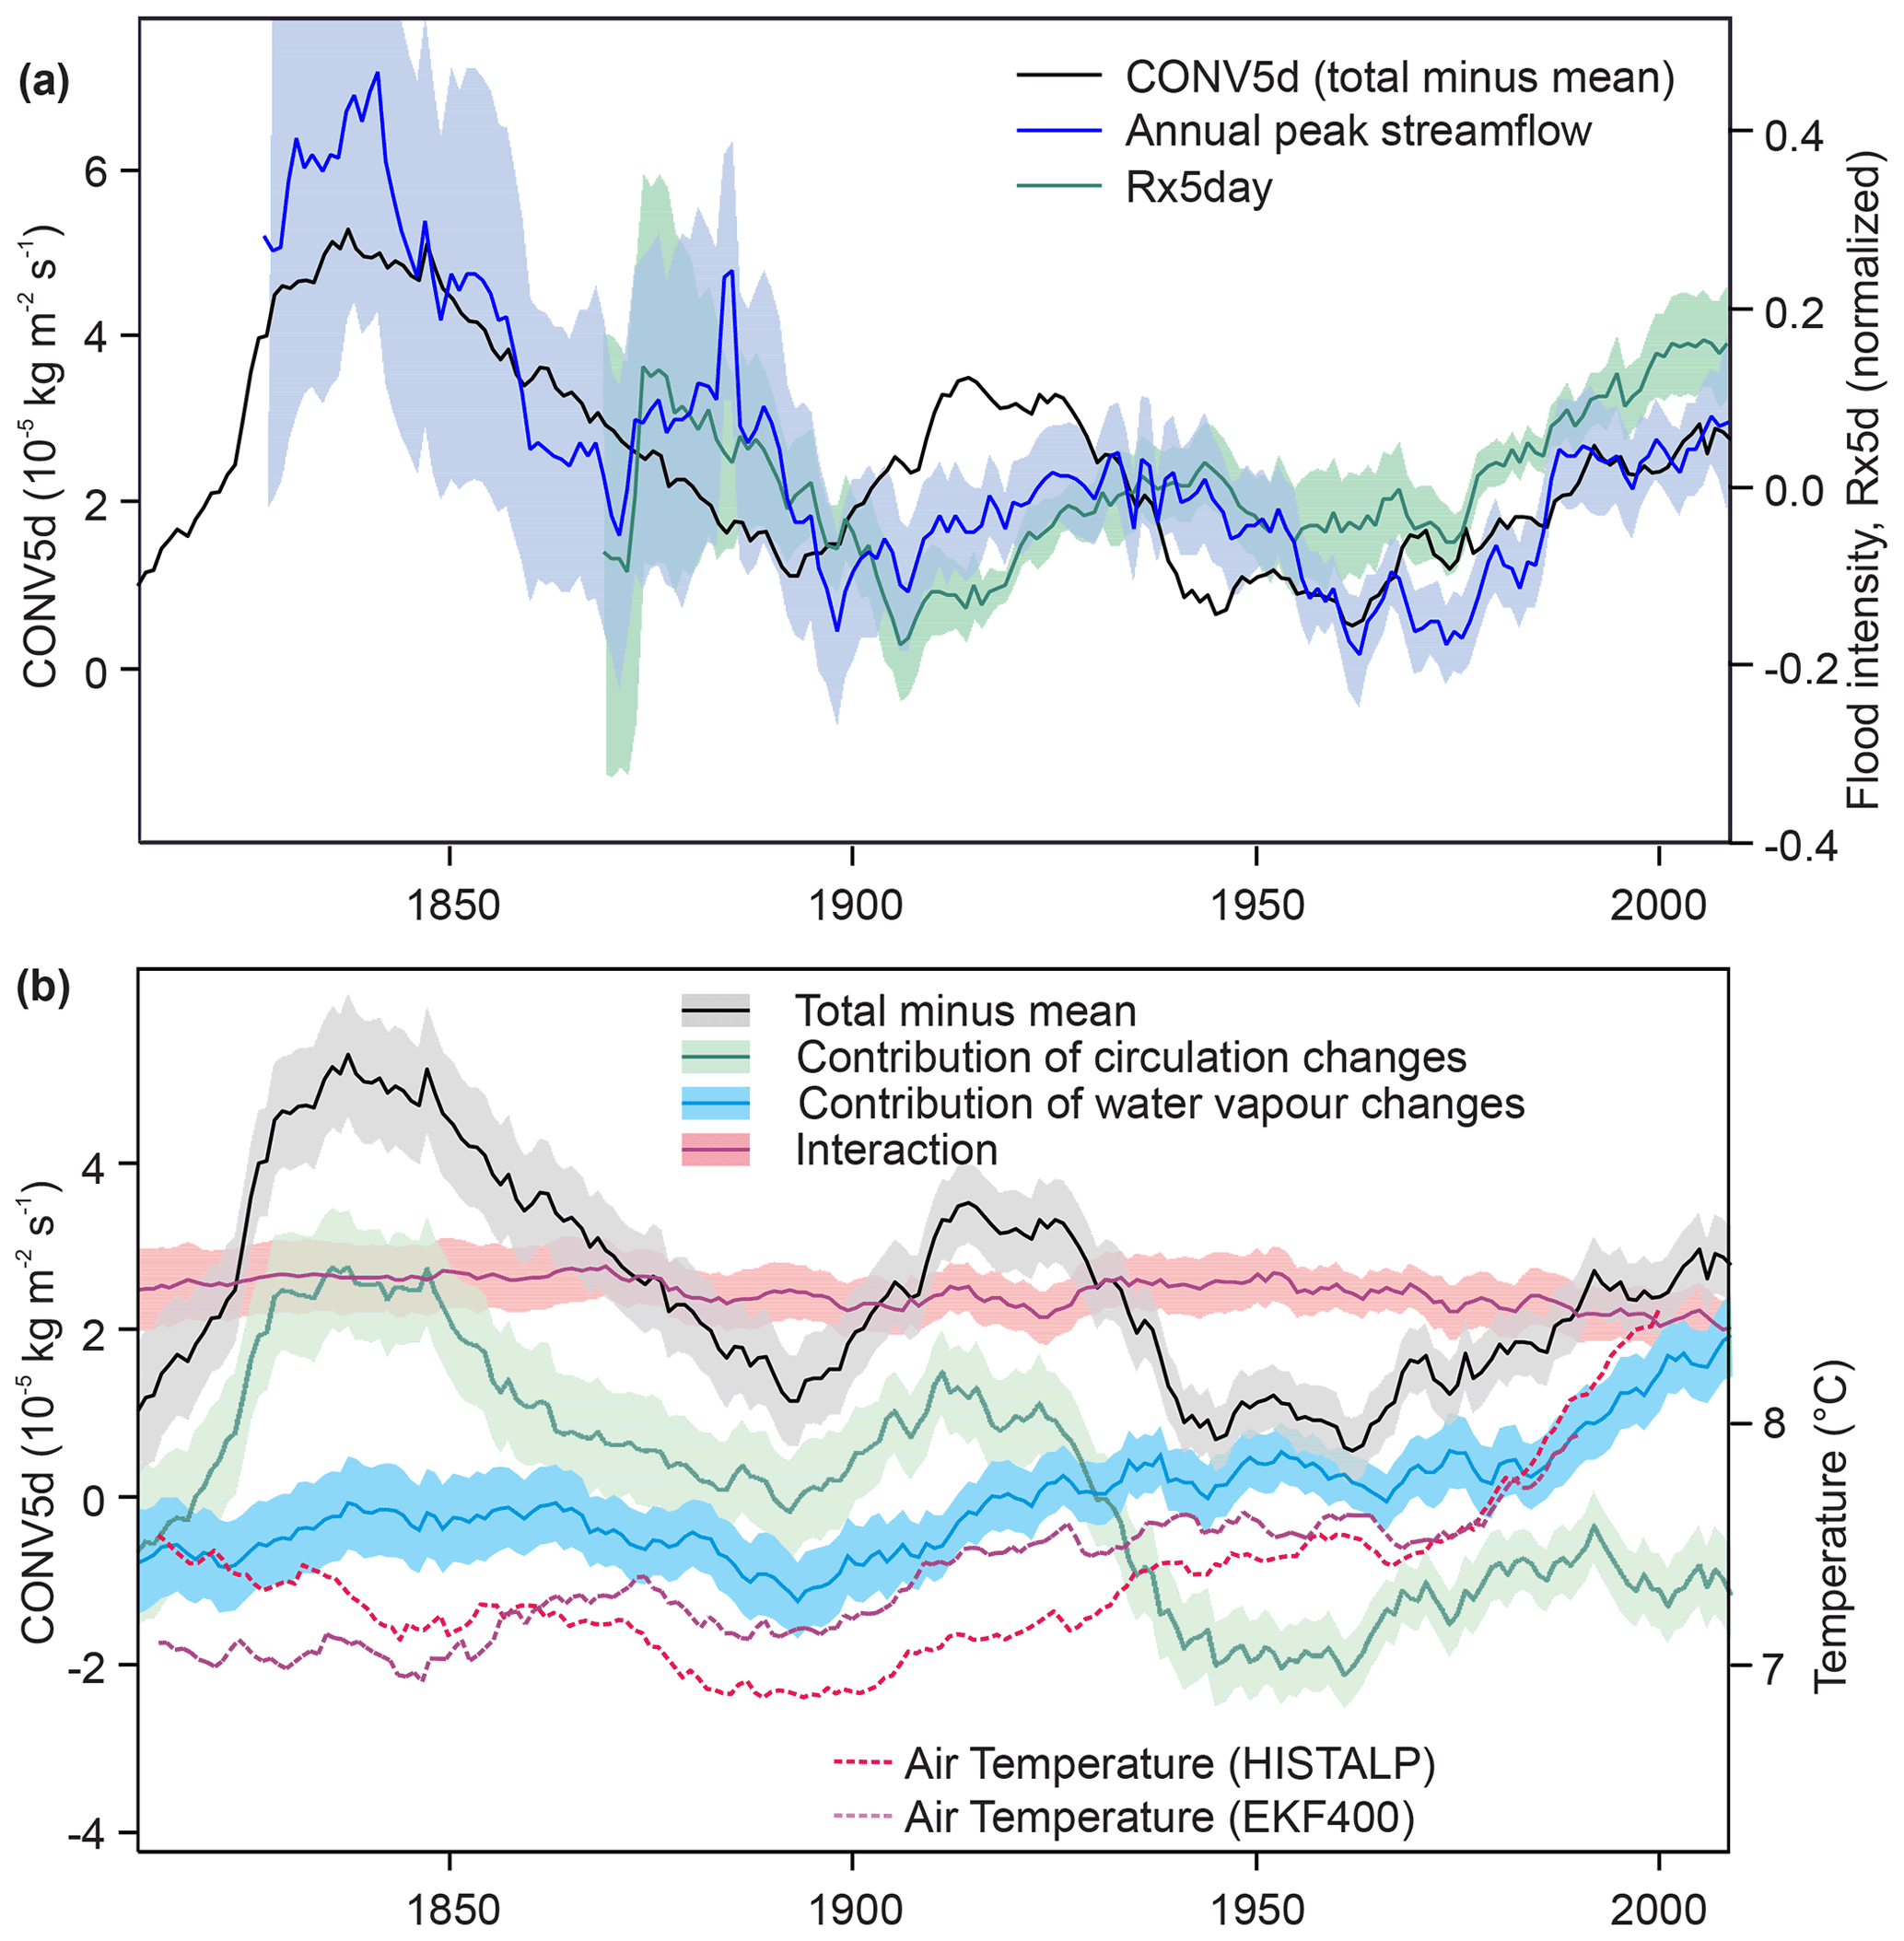
Figure 5(a) Average of regional averages of annual maxima of peak streamflow, Rx5day, and CONV5d. Shading indicates ±1 standard error. (b) Contributions to CONV5d from circulation changes, water vapour changes, and their interaction. Shading indicates ±1 standard deviation of the ensemble. Dashed curves show annual mean temperature from HISTALP and EKF400. All curves are smoothed with a 30-year moving average.
While all individual indicators (flood intensity, Rx5day, CONV5d) have uncertainties that are particularly large in the early decades, there are also clear similarities. A further aggregation reveals the common low-frequency variability even more distinctly. When averaging all three indicators across all eight regions (Fig. 5), we find a close similarity after around 1870. All series show the recent increase, the minimum in the 1960s, a peak around the 1930s, and a minimum around 1900, as shown in Fig. 1. Flood intensity and CONV5d also show a peak in the 1840s, which is, however, not seen in the (sparse) Rx5day data. The association between the three series is further supported by cross-wavelet analyses (Fig. S6 in the Supplement), which shows significant relations at time scales longer than ca. 30 years.
Thus, despite the uncertainties, we can use these indicators to trace the atmospheric impacts on the multidecadal variability in flood intensity. The atmospheric processes, in turn, can be partitioned into contributing processes as described in Sect. 2. Figure 5b shows the contributions from circulation changes, from water vapour changes, and from their interaction. The interaction term is negative with only small changes over time. The contribution from circulation changes (green line) dominates and shows all main features found in CONV5d. However, the long-term trend differs. This is due to changes in water vapour (blue line). The contribution of water vapour changes shows a two-step increase after 1900.
An analysis of linear trends in the unsmoothed series since 1963, the minimum in flood intensity, reveals an increase in CONV5d (4.04 × 10⁻⁷ kg m−2 s−1 yr−1, which is not statistically significant) and no trend in the contribution of atmospheric circulation changes, but a highly significant increase in the contribution of water vapour changes (6.13 × 10⁻⁷ kg m−2 s−1 yr−1). The contribution of water vapour changes depends on temperature through the Clausius–Clapeyron relation. To illustrate this relation, annual mean temperature in HISTALP (Efthymiadis et al., 2006), the longest gridded observational data set, and in EKF400v2 for the same regions, are plotted such that 1 ∘C corresponds to 0.46 × 10⁻⁵ kg m−2 s−1. This is equivalent to a 6.5 % change in CONV5d, the number expected following the Clausius–Clapeyron relation if annual maxima would follow the annual average trend. (Saturation can be assumed for annual maximum moisture convergence.) After around 1900, the general pattern and amplitude of the contribution of water vapour changes is consistent with an increased intensity of heavy precipitation in a warming atmosphere, although the amplitude of the CONV5d increase is somewhat smaller than that of the scaled temperature increase.
In fact, this might help to explain the varying relation between temperature and floods over time: palaeoclimate studies (Stewart et al., 2011; Glur et al., 2013; Wilhelm et al., 2022), particularly from the northern Alps, suggest that past flood-rich periods coincided with cool periods, while climate projections suggest that with global warming, flood occurrence may increase in certain regions. Although palaeoclimate studies often are based on small catchments, and target a longer return period and a low-frequency variability scale that is longer than decades as in this study, it is nevertheless interesting to analyse the relation between temperature and floods on a multidecadal scale.
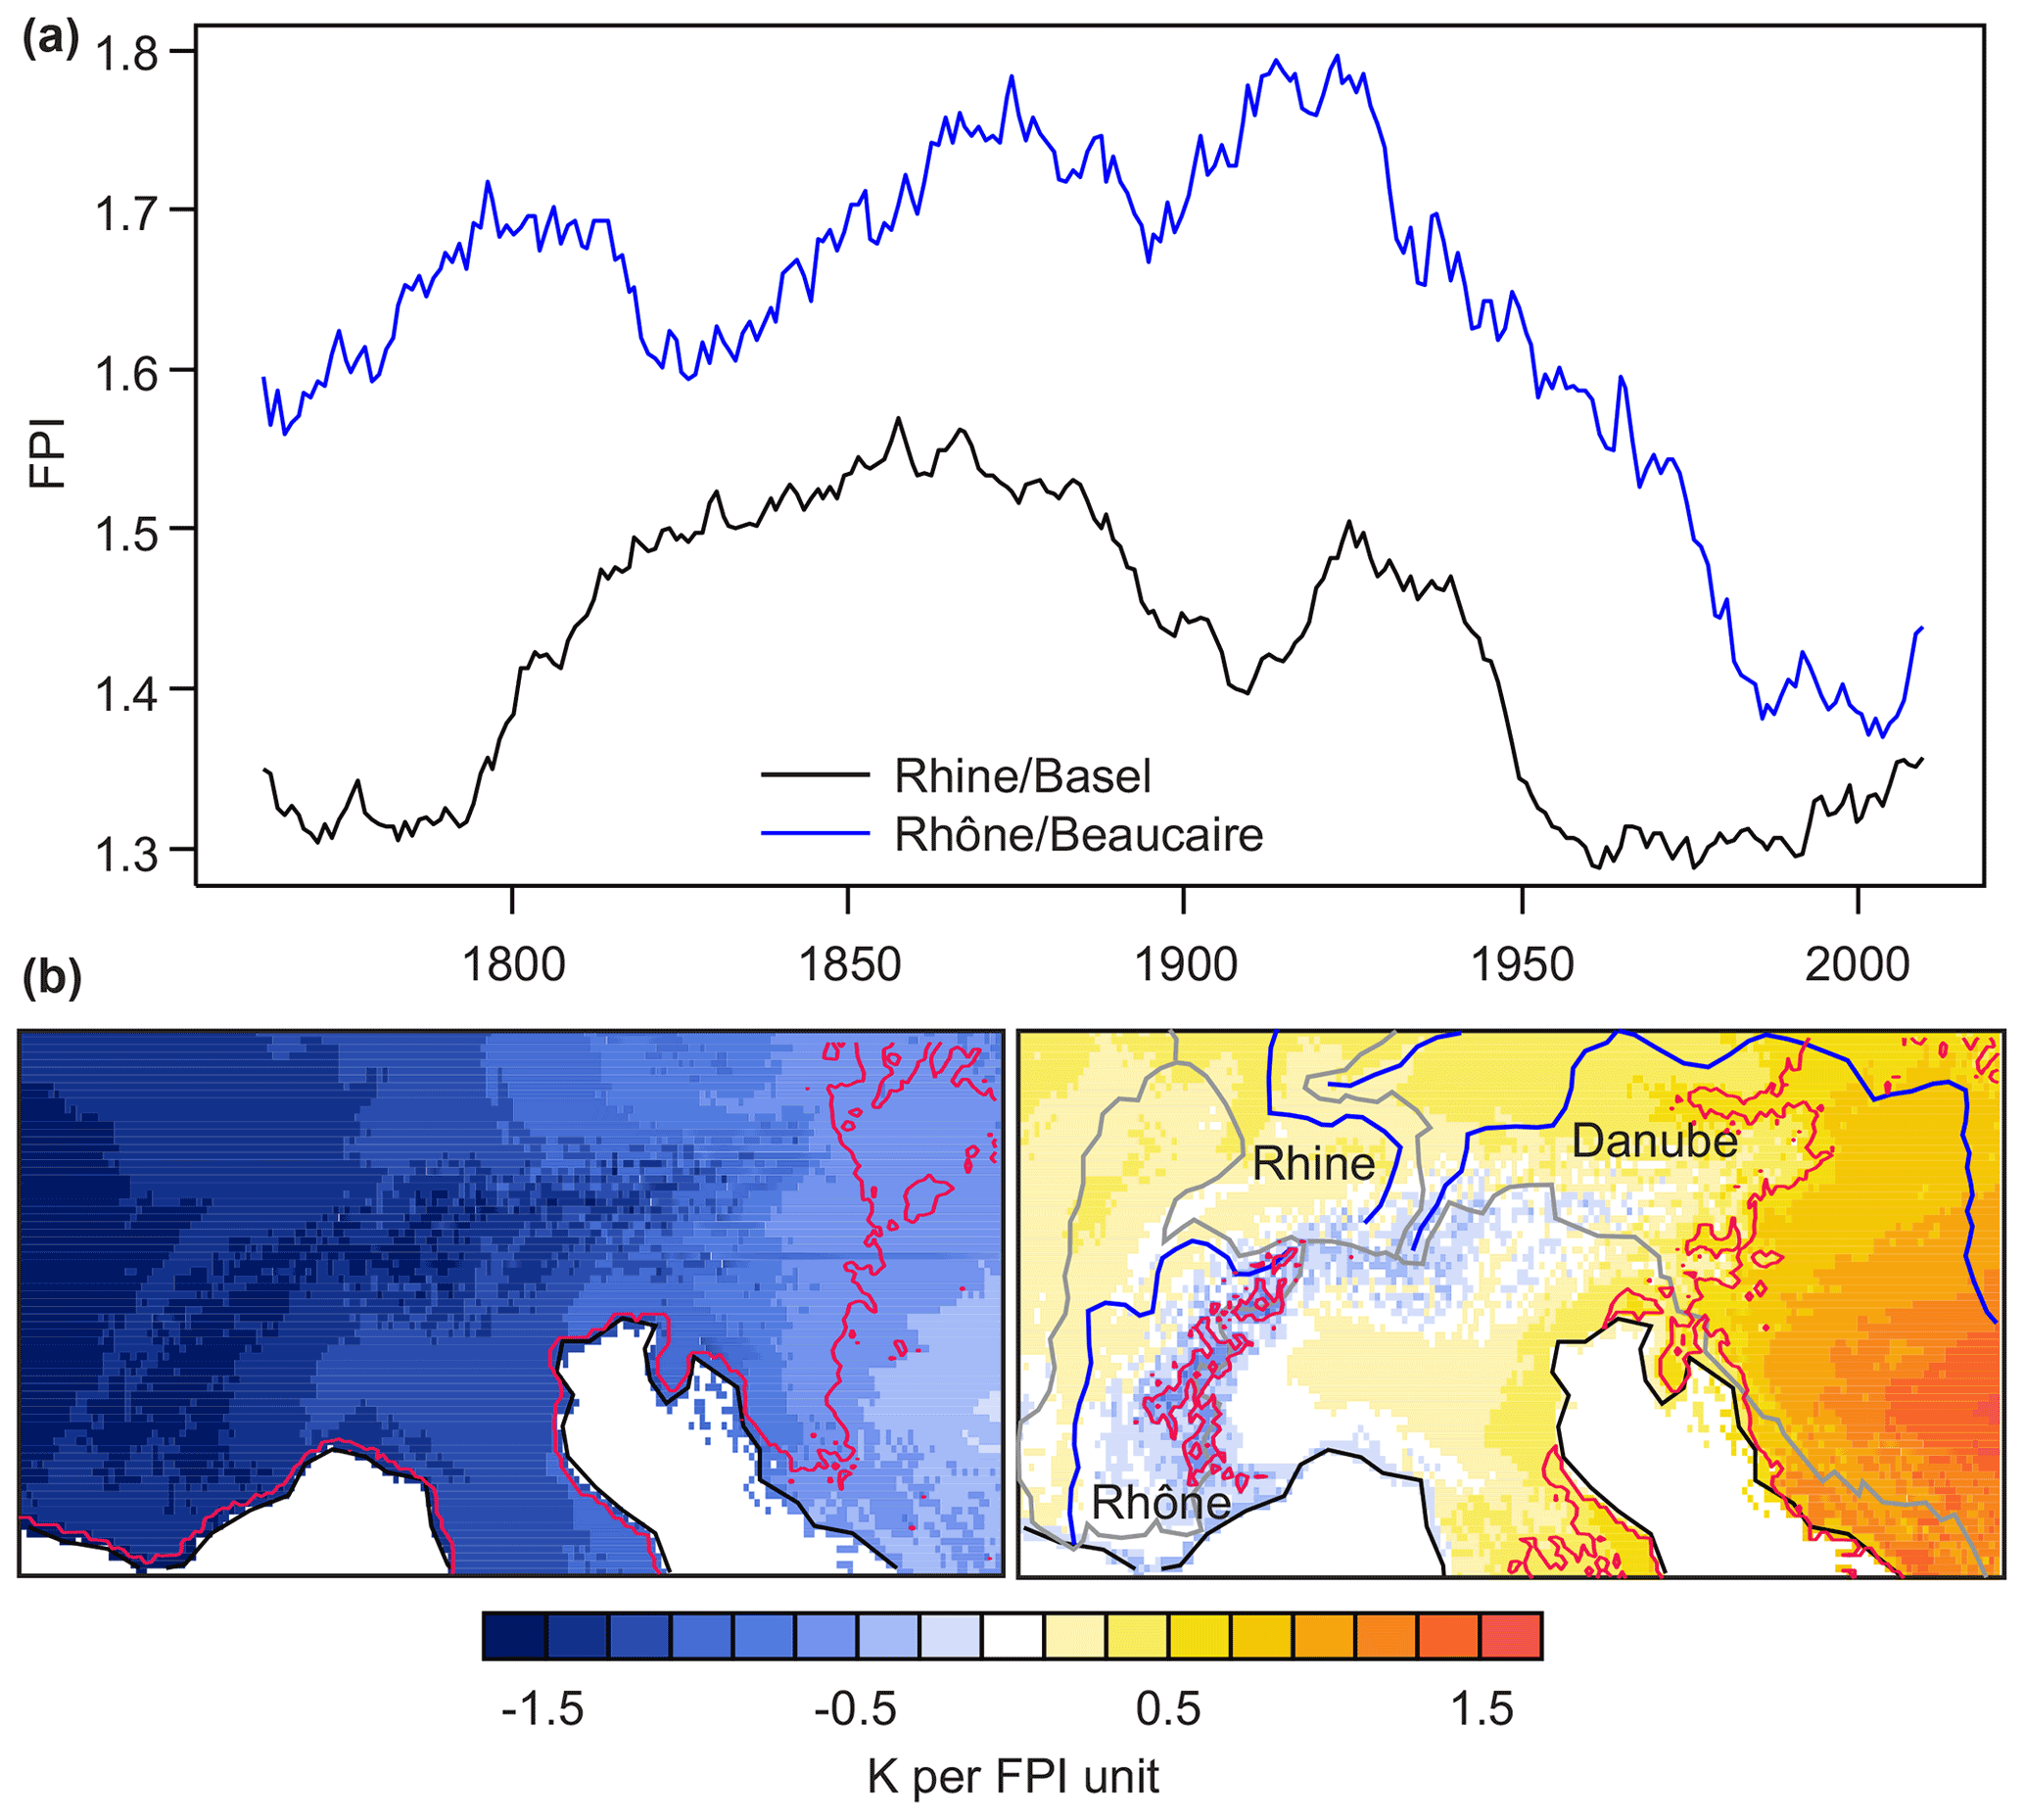
Figure 6(a) FPI index for the Rhine in Basel (May to October) and the Rhône in Beaucaire (November to April), smoothed with a 30-year moving average. (b) Regression map of detrended seasonal (May to October and November to April, respectively) mean temperature in HISTALP onto the corresponding (detrended) FPI indices. Red lines indicate significant (p < 0.05) coefficients.
To analyse the role of circulation for temperature, we used the FPI index for the Rhône and Rhine, which was calculated specifically for the corresponding flood seasons (November to April for the Rhône, May to October for the Rhine). This index measures the frequency of flood-prone weather types, to which cyclonic weather types contribute very strongly. As a consistency test, the smoothed curves (Fig. 6a) show high values in the 19th and early 20th century and a decrease after ca. 1950; further analyses of the FPI index for Basel are shown in Brönnimann et al. (2019). For the following analysis we used the unsmoothed, but detrended, FPI indices, onto which we regressed the detrended temperature fields of the corresponding seasons (Fig. 6b). For the Rhine, which is mostly affected by summer floods, flood-prone seasons are typically cold. Conversely, for the Rhône, with typically winter floods, flood-prone seasons are warmer than average in the lowland but colder than average at higher altitudes. Both are consistent with a predominance of cyclonic weather types over Switzerland: they bring colder than average weather in summer, but warmer than average in winter except at high altitudes, which normally, but not during cyclonic weather types, are above an inversion.
This means that from the contribution of circulation alone, flood-rich periods in summer-flood regions and generally in the Alps are expected to be cool. This is not the case after 1980, when the partitioning (Fig. 5b) shows a growing contribution of water vapour increase whereas the contribution of circulation changes is constant (and the FPI is low; Fig. 6a). Warming phases (also in the past) rather directly lead to an increase in CONV5d, but warming may be driven by atmospheric circulation changes that decrease CONV5d, or it may be driven by other forcings in which case atmospheric circulation does not counteract the increase in CONV5d.
3.3 Regional differences in circulation effects
Circulation changes had regionally different imprints at different times. Recall that 1827–1856 was flood rich in central Europe (year-round), 1919–1948 was flood rich in northern and western Europe (cold season), and 1949–1978 was flood poor across Europe (year-round; Fig. 1). The contribution of circulation changes to CONV5d (shown in Fig. 7 for each region) is consistent with this result. Some regions show an almost opposite behaviour to each other. For instance, in the mid-19th century, circulation changes contributed to high CONV5d in southern Norway but to relatively low values in the Rhône catchment, whereas the opposite was the case in the second half of the 20th century (Fig. 7). While the contribution of circulation differs from region to region, the contribution from water vapour changes is more uniform and shows an increase in all regions.
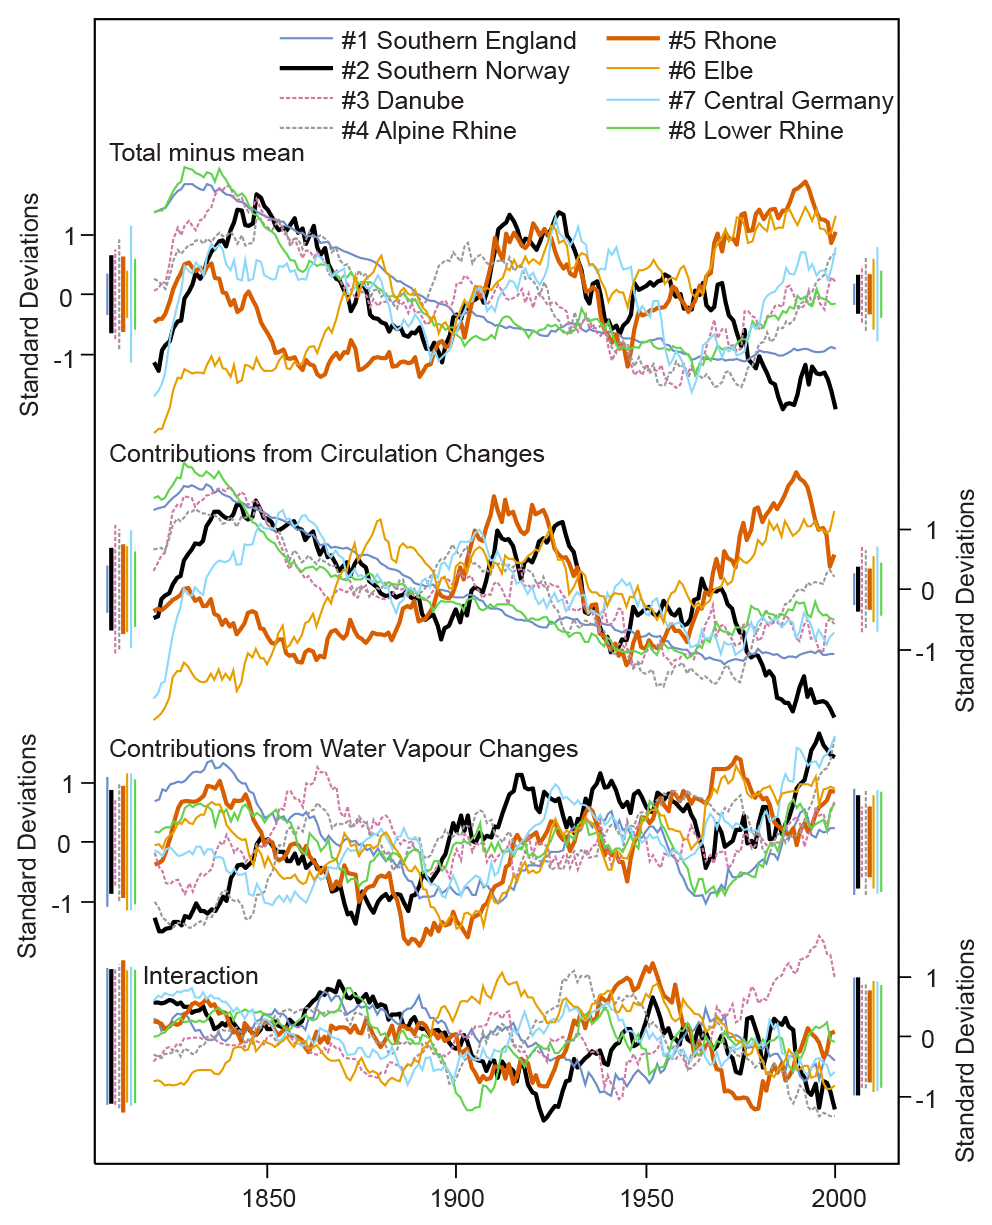
Figure 7CONV5d (total minus mean) and contributions to it from circulation changes, water vapour changes, and their interaction for each of the eight regions (ensemble mean). All series were standardized and smoothed with a 30-year moving average. Coloured bars indicate ±1 ensemble standard deviation at the beginning and end of the period. (The change in-between is close to linear.)
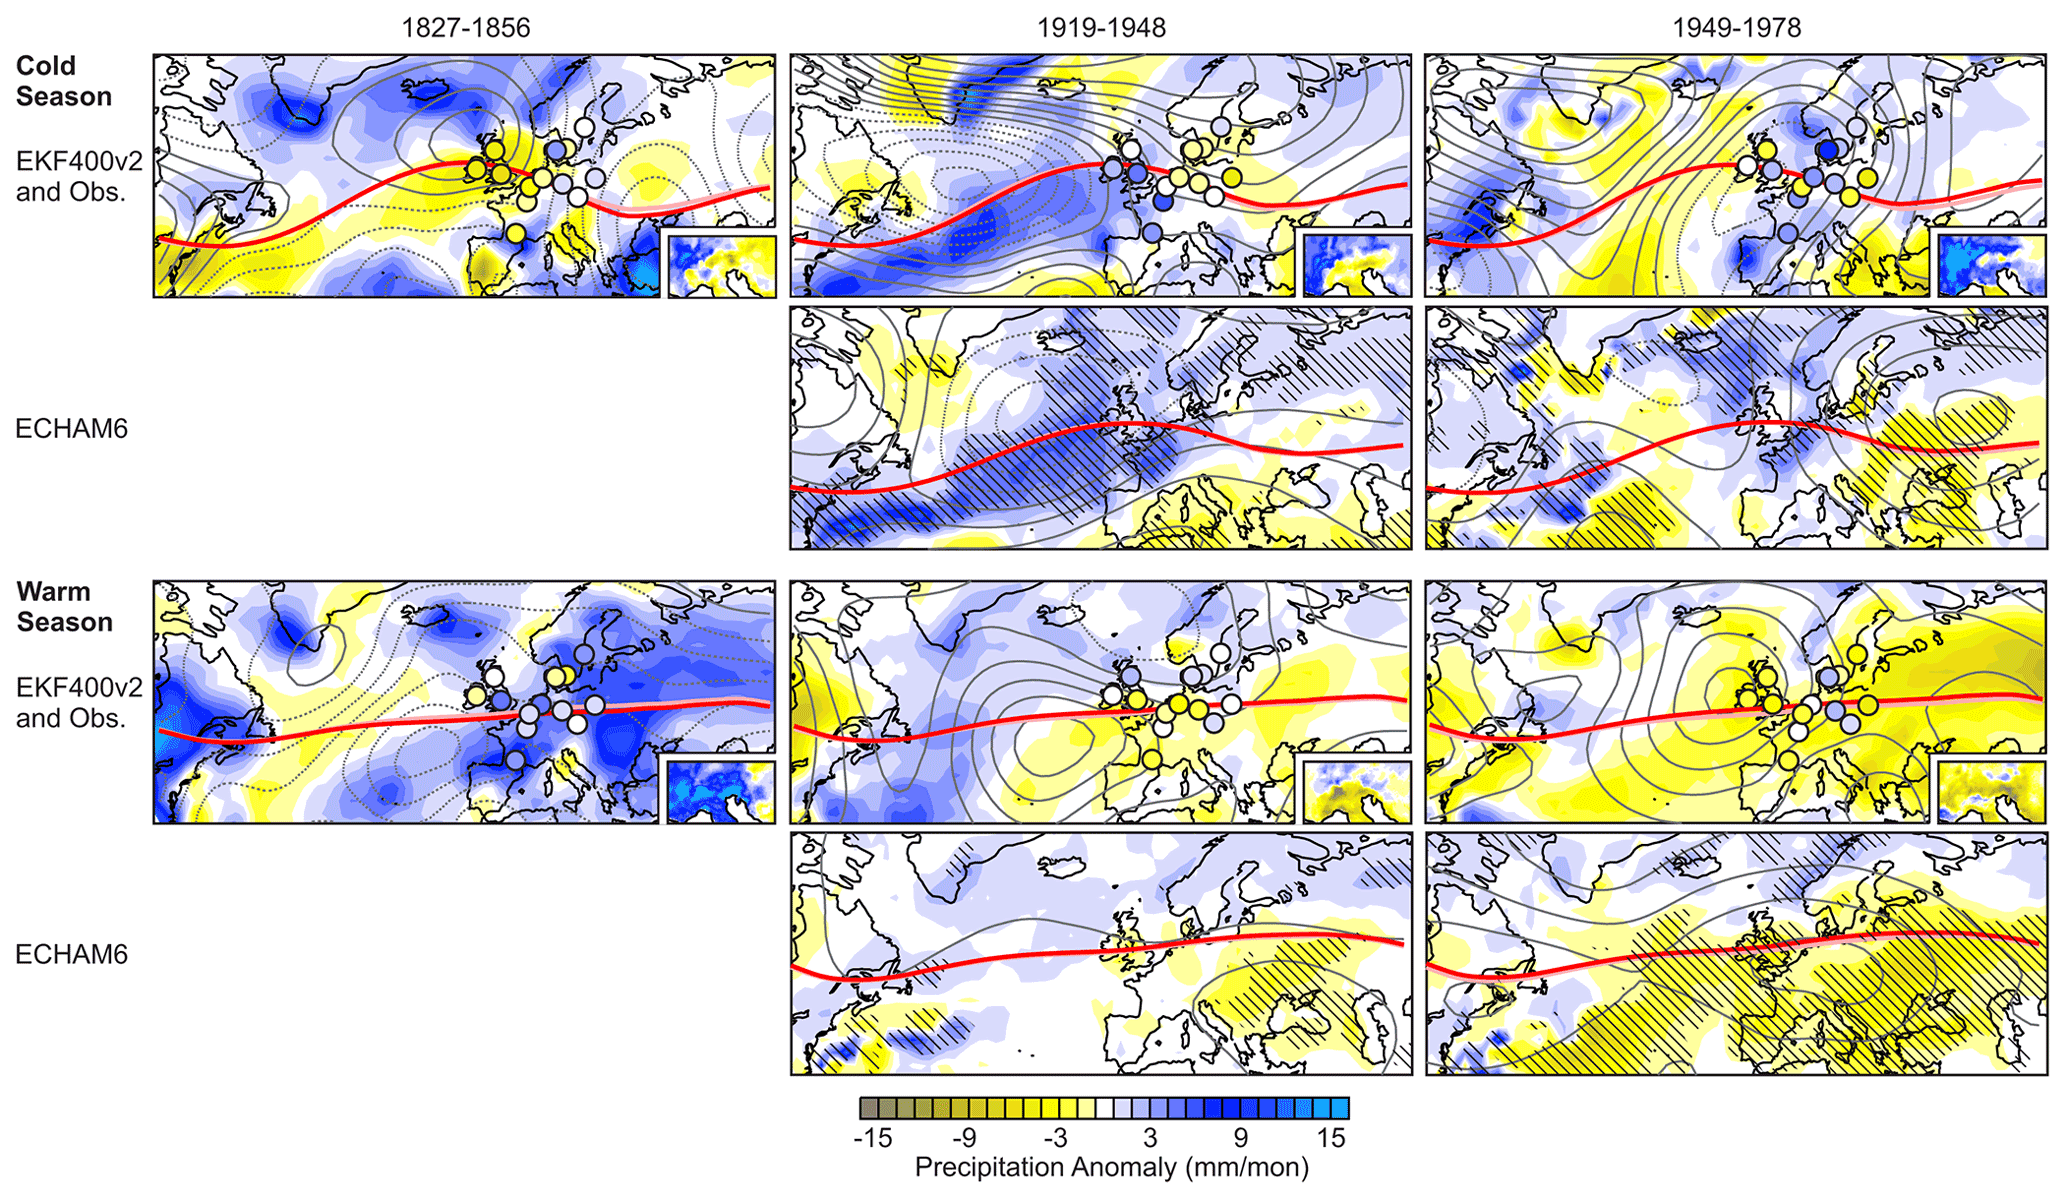
Figure 8Simulated atmospheric circulation and precipitation. Anomalies (with respect to 1851–1950) of precipitation (colours) and 500 hPa GPH (contour distance 2 gpm centred around zero, dashed contours indicate negative numbers) in the 30-year periods 1827–1856, 1919–1948, and 1949–1978 in the EKF400v2 reconstruction (ensemble mean), observations (insets: HISTALP; circles: GHCN), and ECHAM6 simulations. (Hatching denotes 95 % significance of precipitation anomalies, calculated from the 30-year averages of the 31 members using a one-sample t test.) Thick red lines show the GPH contour 5450 gpm (cold season) or 5650 gpm (warm season; light pink lines: same for 1851–1950).
To test whether these spatial differences due to atmospheric circulation are reflected in the seasonal mean large-scale flow, we analysed (Fig. 8) 30-year averages of seasonal mean anomalies in precipitation and 500 hPa GPH in EKF400v2 and observations (Peterson and Vose, 1997; Alexander and Jones, 2000; Murphy et al., 2018). In terms of seasonal mean precipitation, the cold seasons 1827–1856 and 1949–1978 show a rather mixed signal. Although not inconsistent with the observed multidecadal flood intensity, one would probably not address these periods as flood rich and flood poor, respectively, based only on seasonal mean precipitation. (Note that Blöschl et al., 2020, define a flood period in 1840–1872; corresponding plots exhibit patterns similar to those for 1827–1856; Fig. S7 in the Supplement.)
The period 1827–1856 (cold season) shows a pressure pattern that is similar to a negative mode of the North Atlantic Oscillation or East Atlantic Pattern, but with the positive pressure anomaly displaced southeast of Iceland. Seasonal mean precipitation (both in EKF400v2 and station data) shows a mixed signal, with slight increases in the Rhône catchment, central Europe, and southern Norway, but drying over England. The warm season shows negative anomalies of 500 hPa GPH over the entire continent, accompanied by increased rainfall, which is consistent with frequent flood-prone weather.
The 1919–1948 cold season average shows negative 500 hPa GPH anomalies over the Atlantic and increased precipitation over western Europe, which agrees with the increased flood intensity in this region. The clearest signal is found for the flood-poor period 1949–1978 in the warm season. The analysis show pronounced drying and positive anomalies of 500 hPa GPH. The start of this period, which coincided with massive droughts (e.g. Brázdil et al., 2016), was accompanied by a poleward shifted subtropical jet (Brönnimann et al., 2015).
We further addressed the underlying causes of multidecadal anomalies by analysing, in the same way as EKF400v2, an ensemble of 31 simulations with the ECHAM6 atmospheric model starting in 1851. (The 1827–1856 period cannot be analysed.) The precipitation anomalies and the broad features of GPH anomalies found in EKF400v2 are rather well reproduced for the 1919–1948 and 1949–1978 periods, both cold and warm seasons (for 1840–1872 see Fig. S5). For instance, for the cold season, the negative GPH anomalies over the North Atlantic in 1918–1948 and the zonal pattern of low GPH over the eastern North Atlantic and high GPH over Russia in 1949–1978 agree well. The wet conditions in western Europe in 1919–1948 in winter and the dry conditions in 1949–1978 in summer are highly significant in the atmospheric model simulations. The latter is arguably the most significant feature in the model analysis. Although this analysis concerns only changes in the seasonal means, not in extremes, it shows that atmospheric model simulations forced with, among other factors, sea-surface temperatures are able to reproduce some characteristic features of atmospheric circulation changes. However, the seasonal mean circulation and precipitation describes the flood conditions only to a limited extent. (See Zanchettin et al., 2019, for the role of Atlantic sea-surface temperature variability for floods.) Note, in addition, that also EKF400v2, despite the large number of observations assimilated, is dependent on sea-surface temperature input to the underlying model. Overall, the model simulations suggest that part of the multidecadal variability can be reproduced from model boundary conditions. (Note that in addition to sea-surface temperature, they also encompass external forcings.)
Long time series of annual peak streamflow in western and central Europe exhibit substantial multidecadal variability, consistent with previous work by other authors. Flood-rich phases occurred in the 19th century in several regions, in the early 20th century in western and northern Europe, and since the 1980s, while a flood-poor period occurred after the Second World War. The flood variability is in line with observed changes in Rx5day (except in the mid-19th century, which, however, could be due to a lower data quality).
Annual peak atmospheric water flux convergence in a reanalysis also shows the same pattern of multidecadal variability as flood intensity and Rx5day, and this is further supported by an indicator based on weather types. Although the uncertainties in each data set are large, results are robust and show the same main phases of low-frequency variability. The reanalysis data allow a more physical interpretation. Partitioning the atmospheric water flux convergence into contributions from circulation and water vapour changes, we find that peak streamflow of European rivers from around 1820 to 1980 was largely forced by atmospheric circulation changes. In contrast, the recent increase in moisture flux convergence was, to a larger extent, driven by increasing atmospheric moisture due to climate change. This might contribute to explaining why in the past, flood-rich periods coincided with cold periods (particularly in summer-flood regions such as the northern Alps, to which many proxy studies refer), while more floods may be possible in Europe in a future, warming climate. Note, however, that palaeoclimate studies often address longer time scales, smaller catchments, and longer return periods than are used in this study.
Changes in seasonal mean atmospheric circulation partly mirror the changes in flood intensity changes. Important features of these changes are reproduced in atmospheric model simulations, indicating that oceanic forcing might play a role. This is specifically the case for the dry and flood-poor summers between 1949 and 1978.
The thermodynamic effect is likely to increase further. The floodings in central and western Europe during the summer of 2021 fit into the picture of a stronger thermodynamic contribution. However, flood projections in Europe under different emission scenarios remain unclear (Kundzewicz et al., 2017), as several sources of uncertainties have to be considered (climate models, downscaling, hydrological models) and projections for flood intensity (e.g. Roudier et al., 2016), frequency (e.g. Giuntoli et al., 2015), or both (e.g. Alfieri et al., 2015) in European rivers vary.
The code for the processing of the streamflow data as well as for generating the FPI can be found in the Supplement together with all input data.
The GRDC Long-Term Statistics and Annual Characteristics data were obtained from the Global Runoff Data Centre, 56068 Koblenz, Germany and can be downloaded here: https://portal.grdc.bafg.de/ (data downloaded: 15 January 2020, last access: 27 April 2022; World Meteorological Organization, 1989). Flood series on the Rhône River at Beaucaire (1816–2016) is available from: https://www.plan-Rhone.fr/publications-131/actualisation-de-lhydrologie-des-crues-du-Rhone-1865.html?cHash=5628938abe287dc9ca390dad7373ae0e (data downloaded: 26 April 2020, last access: 27 April 2022; Bard and Lang, 2018). EKF400v2.0 is available from: https://doi.org/10.26050/WDCC/EKF400_v2.0 (Franke et al., 2020). 20CRv3 is available here: https://portal.nersc.gov/project/20C_Reanalysis/ (data downloaded: 12 May 2020, last access: 27 April 2022; Slivinski et al., 2019). HISTALP is available here: http://www.zamg.ac.at/histalp/datasets.php (data downloaded: 15 July 2020, last access: 27 April 2022; Efthymiadis et al., 2006; Chimani et al., 2012). The CAP7 weather types from Schwander et al. (2017) are available in the Supplement of Brönnimann et al. (2019).
The supplement related to this article is available online at: https://doi.org/10.5194/cp-18-919-2022-supplement.
SB designed the studies and did most of the analyses and writing. PS processed reanalysis data, JF, VV, and YB provided the EKF400v2 data and helped in the analysis, RH performed the climate model simulations, LCS, GPC, and PDS provided the 20CRv3 reanalysis data and interpretation, ML provided the Rhône data, and BS assisted in the hydrological analyses. ML and BS assisted in the hydrological interpretations. All authors actively discussed the results and all authors contributed to writing.
The contact author has declared that neither they nor their co-authors have any competing interests.
Publisher’s note: Copernicus Publications remains neutral with regard to jurisdictional claims in published maps and institutional affiliations.
This work was supported by Swiss National Science Foundation project WeaR (188701), and by the European Commission (ERC Grant PALAEO-RA, 787574). Simulations were performed at the Swiss National Supercomputing Centre CSCS. Support for the Twentieth Century Reanalysis Project version 3 dataset is provided by the U.S. Department of Energy, Office of Science Biological and Environmental Research (BER), by the National Oceanic and Atmospheric Administration Climate Program Office, and by the NOAA Physical Sciences Laboratory. We acknowledge the data providers in the ECA&D project.
This research has been supported by the Schweizerischer Nationalfonds zur Förderung der Wissenschaftlichen Forschung (grant no. 188701) and the European Research Council, H2020 European Research Council (PALAEO-RA (grant no. 787574)).
This paper was edited by Hugues Goosse and reviewed by two anonymous referees.
Alexander, L. V. and Jones, P. D.: Updated precipitation series for the UK and discussion of recent extremes, Atmos. Sci. Lett., 1, 142–150, https://doi.org/10.1006/asle.2001.0025, 2000.
Alfieri, L., Burek, P., Feyen, L., and Forzieri, G.: Global warming increases the frequency of river floods in Europe, Hydrol. Earth Syst. Sci., 19, 2247–2260, https://doi.org/10.5194/hess-19-2247-2015, 2015.
Alfieri, L., Bisselink, B., Dottori, F., Naumann, G., de Roo, A., Salamon, P., Wyser, K., and Feyen, L.: Global projections of river flood risk in a warmer world, Earth's Future, 5, 171–182, 2017.
Bard, A. and Lang, M.: Actualisation de l'hydrologie des crues du Rhône, Rapport Synthétique de diffusion des résultats, Lavaldens, France, https://www.plan-Rhone.fr/publications-131/actualisation-de-lhydrologie-des-crues-du-Rhone-1865.html?cHash=5628938abe287dc9ca390dad7373ae0e (data downloaded: 26 April 2020, last access: 27 April 2022), 2018.
Blöschl, G., Kiss, A., Viglione, A., Barriendos, M., Böhm, O., Brázdil, R., Coeur, D., Demarée, G., Llasat, M. C., Macdonald, N., Retsö, D., Roald, L., Schmocker-Fackel, P., Amorim, I., Bělínová, M., Benito, G., Bertolin, C., Camuffo, D., Cornel, D., Doktor, R., Elleder, L., Enzi, S., Garcia, J. C., Glaser, R., Hall, J., Haslinger, K., Hofstätter, M., Komma, J., Limanówka, D., Lun, D., Panin, A., Parajka, J., Petrić, H., Rodrigo, F. S., Rohr, C., Schönbein, J., Schulte, L., Silva, L. P., Toonen, W. H. J., Valent, P., Waser, J., and Wetter, O.: Current flood-rich period exceptional compared to past 500 years in Europe, Nature, 583, 522–524, 2020.
Bøe, A.-G., Dahl, S. O., Lie, Ø., and Nesje, A.: Holocene river floods in the upper Glomma catchment, southern Norway: a high-resolution multiproxy record from lacustrine sediments, Holocene, 16, 445–455, 2006.
Botter, G., Basso, S., Rodriguez-Iturbe, I., and Rinaldo, A.: Resilience of river flow regimes, P. Natl. Acad. Sci. USA, 110, 12925–12930, 2013.
Brázdil, R., Pfister, C., Wanner, H., von Storch, H., and Luterbacher, J.: Historical climatology in Europe – the state of the art, Clim. Change, 70, 363–430, 2005.
Brázdil, R., Raška, P., Trnka, M., Zahradníček, P., Valášek, H., Dobrovolný, P., Řezníčková, L., Treml, P., and Stachon, Z.: The Central European drought of 1947: causes and consequences, with particular reference to the Czech Lands, Clim. Res., 70, 161–178, 2016.
Brönnimann, S., Fischer, A. M., Rozanov, E., Compo, G. P., Poli, P., and Sardeshmukh, P. D.: Southward shift of the Northern tropical belt from 1945 to 1980, Nat. Geosci., 8, 969–974, 2015.
Brönnimann, S., Frigerio, L., Schwander, M., Rohrer, M., Stucki, P., and Franke, J.: Causes of increased flood frequency in central Europe in the 19th century, Clim. Past, 15, 1395–1409, https://doi.org/10.5194/cp-15-1395-2019, 2019.
Chimani, B., Matulla, C., Böhm, R., and Hofstätter, M.: A new high resolution absolute Temperature Grid for the Greater Alpine Region back to 1780, Int. J. Climatol., 33, 2129–2141, https://doi.org/10.1002/joc.3574, 2012.
Efthymiadis, D., Jones, P. D., Briffa, K. R., Auer, I., Böhm, R., Schöner, W., Frei, C., and Schmidli, J.: Construction of a 10-min-gridded precipitation data set for the Greater Alpine Region for 1800–2003, J. Geophys. Res., 111, D01105, https://doi.org/10.1029/2005JD006120, 2006 (data available at: http://www.zamg.ac.at/histalp/datasets.php, data downloaded: 15 July 2020, last access: 27 April 2022).
Engeland, K., Aano, A., Steffensen, I., Støren, E., and Paasche, Ø.: New flood frequency estimates for the largest river in Norway based on the combination of short and long time series, Hydrol. Earth Syst. Sci., 24, 5595–5619, https://doi.org/10.5194/hess-24-5595-2020, 2020.
Federal Office for the Environment (FOEN): Effects of climate change on Swiss water bodies, Hydrology, water ecology and water management, Federal Office for the Environment FOEN, Bern, Environmental Studies No. 2101, 125 pp., https://www.bafu.admin.ch/bafu/en/home/topics/water/water--publications/publications-water/effects-of-climate-change-on-swiss-water-bodies.html (last access: 24 April 2022), 2021.
Franke, J., Valler, V., Brugnara, Y., and Brönnimann, S.: Ensemble Kalman Fitting Paleo-Reanalysis Version 2 (EKF400_v2), World Data Center for Climate (WDCC) at DKRZ [data set], https://doi.org/10.26050/WDCC/EKF400_v2.0, 2020.
Froidevaux, P., Schwanbeck, J., Weingartner, R., Chevalier, C., and Martius, O.: Flood triggering in Switzerland: the role of daily to monthly preceding precipitation, Hydrol. Earth Syst. Sci., 19, 3903–3924, https://doi.org/10.5194/hess-19-3903-2015, 2015.
Giorgetta, M. A., Roeckner, E., Mauritsen, T., Bader, J., Crueger, T., Esch, M., Rast, S., Kornblueh, L., Schmidt, H., Kinne, S., Hohenegger, C., Möbis, B., Krismer, T., Wieners, K.-H., and Stevens, B.: The atmospheric general circulation model ECHAM6 – Model description, Reports on Earth System Science, 135, Max Planck Institute for Meteorology, Hamburg, ISSN 1614-1199, 2013.
Giuntoli, I., Vidal, J.-P., Prudhomme, C., and Hannah, D. M.: Future hydrological extremes: the uncertainty from multiple global climate and global hydrological models, Earth Syst. Dynam., 6, 267–285, https://doi.org/10.5194/esd-6-267-2015, 2015.
Glaser, R., Stangl, H., and Lang, M.: Floods in Central Europe since AD 1300 and their regional context, Houille Blanche, 5, 43–49, 2004.
Glaser, R., Riemann, D., Schönbein, J., Barriendos, M., Brázdil, R., Bertolin, C., Camuffo, D., Deutsch, M., Dobrovolný, P., van Engelen, A., Enzi, S., Halíčková, M., Koenig, S. J., Kotyza, O., Limanówka, D., Macková, J., Sghedoni, M., Martin, B., and Himmelsbach, I.: The variability of European floods since AD 1500, Clim. Change, 101, 235–256, 2010.
Glur, L., Wirth, S. B., Büntgen, U., Gilli, A., Haug, G. H., Schär, C., Beer, J., and Anselmetti, F. S.: Frequent floods in the European Alps coincide with cooler periods of the past 2500 years, Sci. Rep., 3, 2770, https://doi.org/10.1038/srep02770, 2013.
Hall, J., Arheimer, B., Borga, M., Brázdil, R., Claps, P., Kiss, A., Kjeldsen, T. R., Kriaučiūnienė, J., Kundzewicz, Z. W., Lang, M., Llasat, M. C., Macdonald, N., McIntyre, N., Mediero, L., Merz, B., Merz, R., Molnar, P., Montanari, A., Neuhold, C., Parajka, J., Perdigão, R. A. P., Plavcová, L., Rogger, M., Salinas, J. L., Sauquet, E., Schär, C., Szolgay, J., Viglione, A., and Blöschl, G.: Understanding flood regime changes in Europe: a state-of-the-art assessment, Hydrol. Earth Syst. Sci., 18, 2735–2772, https://doi.org/10.5194/hess-18-2735-2014, 2014.
Himmelsbach, I., Glaser, R., Schoenbein, J., Riemann, D., and Martin, B.: Reconstruction of flood events based on documentary data and transnational flood risk analysis of the Upper Rhine and its French and German tributaries since AD 1480, Hydrol. Earth Syst. Sci., 19, 4149–4164, https://doi.org/10.5194/hess-19-4149-2015, 2015.
Hingray, B., Schaefli, B., Mezghani, A., and Hamdi, Y.: Signature-based model calibration for hydrological prediction in mesoscale Alpine catchments, Hydrol. Sci. J., 55, 1002–1016, 2010.
IPCC: Summary for Policymakers, in: Climate Change 2021: The Physical Science Basis. Contribution of Working Group I to the Sixth Assessment Report of the Intergovernmental Panel on Climate Change, edited by: Masson-Delmotte, V., Zhai, P., Pirani, A., Connors, S. L., Péan, C., Berger, S., Caud, N., Chen, Y., Goldfarb, L., Gomis, M. I., Huang, M., Leitzell, K., Lonnoy, E., Matthews, J. B. R., Maycock, T. K., Waterfield, T., Yelekçi, O., Yu, R., and Zhou, B., Cambridge University Press, in press, 2021.
Jacobeit, J., Glaser, R., Luterbacher, J., and Wanner, H.: Links between flood events in Central Europe since AD 1500 and largescale atmospheric circulation modes, Geophys. Res. Lett., 30, 1172–1175, 2003.
Jungclaus, J. H., Bard, E., Baroni, M., Braconnot, P., Cao, J., Chini, L. P., Egorova, T., Evans, M., González-Rouco, J. F., Goosse, H., Hurtt, G. C., Joos, F., Kaplan, J. O., Khodri, M., Klein Goldewijk, K., Krivova, N., LeGrande, A. N., Lorenz, S. J., Luterbacher, J., Man, W., Maycock, A. C., Meinshausen, M., Moberg, A., Muscheler, R., Nehrbass-Ahles, C., Otto-Bliesner, B. I., Phipps, S. J., Pongratz, J., Rozanov, E., Schmidt, G. A., Schmidt, H., Schmutz, W., Schurer, A., Shapiro, A. I., Sigl, M., Smerdon, J. E., Solanki, S. K., Timmreck, C., Toohey, M., Usoskin, I. G., Wagner, S., Wu, C.-J., Yeo, K. L., Zanchettin, D., Zhang, Q., and Zorita, E.: The PMIP4 contribution to CMIP6 – Part 3: The last millennium, scientific objective, and experimental design for the PMIP4 past1000 simulations, Geosci. Model Dev., 10, 4005–4033, https://doi.org/10.5194/gmd-10-4005-2017, 2017.
Klein Tank, A. M. G., Wijngaard, J. B., Können, G. P., Böhm, R., Demarée, G., Gocheva, A., Mileta, M., Pashiardis, S., Hejkrlik, L., Kern-Hansen, C., Heino, R., Bessemoulin, P., Müller-Westermeier, G., Tzanakou, M., Szalai, S., Pálsdóttir, T., Fitzgerald, D., Rubin, S., Capaldo, M., Maugeri, M., Leitass, A., Bukantis, A., Aberfeld, R., van Engelen, A. F. V., Forland, E., Mietus, M., Coelho, F., Mares, C., Razuvaev, V., Nieplova, E., Cegnar, T., Antonio López, J., Dahlström, B., Moberg, A., Kirchhofer, W., Ceylan, A., Pachaliuk, O., Alexander, L. V., and Petrovic, P.: Daily dataset of 20th-century surface air temperature and precipitation series for the European Climate Assessment, Int. J. Climatol., 22, 1441–1453, 2002.
Kundzewicz, Z. W., Krysanova, V., Dankers, R., Hirabayashi, Y., Kanae, S., Hattermann, F. F., Huang, S., Milly, P. C. D., Stoffel, M., Driessen, P. P. J., Matczak, P., Quevauviller, P., and Schellnhuber, H.-J.: Differences in flood hazard projections in Europe – their causes and consequences for decision making, Hydrol. Sci. J., 62, 1–14, 2017.
Lang, M., Coeur, D., Audouard, A., Villanova-Oliver, M., and Pène, J.-P.: BDHI: a French national database on historical floods, E3S Web Conf., 7, 04010, https://doi.org/10.1051/e3sconf/20160704010, 2016.
Mudelsee, M., Börngen, M., Tetzlaff, G., and Grünewald, U.: Extreme floods in central Europe over the past 500 years: Role of cyclone pathway “Zugstrasse Vb”, J. Geophys. Res., 109, D23101, https://doi.org/10.1029/2004JD005034, 2004.
Murphy, C., Broderick, C., Burt, T. P., Curley, M., Duffy, C., Hall, J., Harrigan, S., Matthews, T. K. R., Macdonald, N., McCarthy, G., McCarthy, M. P., Mullan, D., Noone, S., Osborn, T. J., Ryan, C., Sweeney, J., Thorne, P. W., Walsh, S., and Wilby, R. L.: A 305-year continuous monthly rainfall series for the island of Ireland (1711–2016), Clim. Past, 14, 413–440, https://doi.org/10.5194/cp-14-413-2018, 2018.
Naulet, R., Lang, M., Ouarda, T. B., Coeur, D., Bobée, B., Recking, A., and Moussay, D.: Flood frequency analysis on the Ardèche river using French documentary sources from the last two centuries, J. Hydrol., 313, 58–78, 2005.
Peterson, T. C. and Vose, R. S.: An overview of the Global Historical Climatology Network temperature database, B. Am. Meteorol. Soc., 78, 2837–2849, 1997.
Pfister, C.: Die “Katastrophenlücke” des 20 Jahrhunderts und der Verlust traditionalen Risikobewusstseins, Gaia, 18, 239–246, 2009.
Quinn, N. and Wilby, R. L.: Reconstructing multi-decadal variations in fluvial flood risk using atmospheric circulation patterns, J. Hydrol., 487, 109–121, 2013.
Roudier, P., Andersson, J., Donnelly, C., Feyen, L., Gruell, W., and Ludwig, F.: Projections of future floods and hydrological droughts in Europe under a +2 ∘C global warming, Clim. Change, 135, 341–355, 2016.
Schmocker-Fackel, P. and Naef, F.: Changes in flood frequencies in Switzerland since 1500, Hydrol. Earth Syst. Sci., 14, 1581–1594, https://doi.org/10.5194/hess-14-1581-2010, 2010a.
Schmocker-Fackel, P. and Naef, F.: More frequent flooding? Changes in flood frequency in Switzerland since 1850, J. Hydrol., 381, 1–8, 2010b.
Schwander, M., Brönnimann, S., Delaygue, G., Rohrer, M., Auchmann, R., and Brugnara, Y.: Reconstruction of Central European daily weather types back to 1763, Int. J. Climatol., 37, 30–44, 2017.
Slivinski, L. C., Compo, G. P., Whitaker, J. S., Sardeshmukh, P. D., Giese, B. S., McColl, C., Allan, R., Yin, X., Vose, R., Titchner, H., Kennedy, J., Spencer, L. J., Ashcroft, L., Brönnimann, S., Brunet, M., Camuffo, D., Cornes, R., Cram, T. A., Crouthamel, R., Domínguez‐Castro, F., Freeman, J. E., Gergis, J., Hawkins, E., Jones, P. D., Jourdain, S., Kaplan, A., Kubota, H., Le Blancq, F., Lee, T., Lorrey, A., Luterbacher, J., Maugeri, M., Mock, C. J., Moore, G. K., Przybylak, R., Pudmenzky, C., Reason, C., Slonosky, V. C., Smith, C., Tinz, B., Trewin, B., Valente, M. A., Wang, X. L., Wilkinson, C., Wood, K., and Wyszyński, P.: Towards a more reliable historical reanalysis: Improvements to the Twentieth Century Reanalysis system, Q. J. Roy. Meteorol. Soc., 145, 2876–2908, https://doi.org/10.1002/qj.3598, 2019 (data availale at: https://portal.nersc.gov/project/20C_Reanalysis/, data downloaded: 12 May 2020, last access: 27 April 2022).
Slivinski, L. C., Compo, G. P., Sardeshmukh, P. D., Whitaker, J. S., McColl, C., Allan, R. J., Brohan, P., Yin, X., Smith, C. A., Spencer, L. J., Vose, R. S., Rohrer, M., Conroy, R. P., Schuster, D. C., Kennedy, J. J., Ashcroft, L., Brönnimann, S., Brunet, M., Camuffo, D., Cornes, R., Cram, T. A., Domínguez-Castro, F., Freeman, J. E., Gergis, J., Hawkins, E., Jones, P. D., Kubota, H., Lee, T., Lorrey, A., Luterbacher, J., Mock, C. J., Przybylak, R., Pudmenzky, C., Slonosky, V. C., Tinz, B., Trewin, B., Wang, X. L., Wilkinson, C., Wood, K., and Wyszyński, P.: An evaluation of the performance of the 20th Century 1 Reanalysis version 3, J. Climate, 34, 1417–1438, 2021.
Stewart, M. M., Grosjean, M., Kuglitsch, F. G., Nussbaumer, S. U., and von Gunten, L.: Reconstructions of late Holocene paleofloods and glacier length changes in the Upper Engadine Switzerland (ca. 1450 BC–AD 420), Palaeogeogr. Palaeocl., 311, 215–223, 2011.
Stucki, P., Rickli, R., Brönnimann, S., Martius, O., Wanner, H., Grebner, D., and Luterbacher, J.: Five weather patterns and specific precursors characterize extreme floods in Switzerland, Meteorol. Z., 21, 531–550, 2012.
Summermatter, S.: Die Überschwemmungen von 1868 in der Schweiz, Unmittelbare Reaktion und längerfristige Prävention mit näherer Betrachtung des Kantons Wallis, T. Bautz, Nordhausen, ISBN 978-3-88309-327-7, 2005.
Tarasova, L., Merz, R., Kiss, A., Basso, S., Blöschl, G., Merz, B., Viglione, A., Plötner, S., Guse, B., Schumann, A., Fischer, S., Ahrens, B., Anwar, F., Bárdossy, A., Bühler, P., Haberlandt, U., Kreibich, H., Krug, A., Lun, D., Müller-Thomy, H., Pidoto, R., Primo, C., Seidel, J., Vorogushyn, S., and Wietzke, L.: Causative classification of river flood events, WIREs Water, 6, e1353, https://doi.org/10.1002/wat2.1353, 2019.
Titchner, H. A. and Rayner, N. A.: The Met Office Hadley Centre sea ice and sea surface temperature data set version 2: 1 Sea ice concentrations, J. Geophys. Res., 119, 2864–2889, 2014.
Valler, V., Franke, J., Brugnara, Y., and Brönnimann, S.: An updated global atmospheric paleo-reanalysis covering the last 400 years, Geosci. Data J., https://doi.org/10.1002/gdj3.121, online first, 2021.
Vose, R. S., Schmoyer, R. L., Steurer, P. M., Peterson, T. C., Heim, R., Karl, T. R., and Eischeid, J. K.: The Global Historical Climatology Network: Long-term monthly temperature, precipitation, sea level pressure, and station pressure data, Oak Ridge National Laboratory Environmental Sciences Division Publ. 3912, 324 pp., https://doi.org/10.2172/7129456, 1992.
Wetter, O., Pfister, C., Weingartner, R., Luterbacher, J., Reist, T., and Trösch, J.: The largest floods in the High Rhine basin since 1268 assessed from documentary and instrumental evidence, Hydrol. Sci. J., 56, 733–758, 2011.
Wilhelm, B., Rapuc, W., Amann, B., Anselmetti, F. S., Arnaud, F., Blanchet, J., Brauer, A., Czymzik, M., Giguet-Covex, C., Gilli, A., Glur, L., Grosjean, M., Irmler, R., Nicolle, M., Sabatier, P., Swierczynski, T., and Wirth, S. B.: Impact of warmer climate periods on flood hazard in the European Alps, Nat. Geosci., 15, 118–123, 2022.
World Meteorological Organization: The global water runoff project, Workshop on the global runoff data set and grid estimation, Koblenz, Switzerland, 10–15 November 1988, WCRP-22, WMO-TD No. 302, Geneva, Switzerland, 1989.
Zanchettin, D., Toniazzo, T., Taricco, C., Rubinetti, S., Rubino, A., and Tartaglione, N.: Atlantic origin of asynchronous European interdecadal hydroclimate variability, Sci. Rep., 9, 10998, https://doi.org/10.1038/s41598-019-47428-6, 2019.