the Creative Commons Attribution 4.0 License.
the Creative Commons Attribution 4.0 License.
 | 22 Apr 2021
Dynamics of the Mediterranean droughts from 850 to 2099 CE in the Community Earth System Model
Christoph C. Raible
In this study, we analyze the dynamics of multi-year droughts over the western and central Mediterranean for the period of 850–2099 CE using the Community Earth System Model version 1.0.1. Overall, the model is able to realistically represent droughts over this region, although it shows some biases in representing El Niño–Southern Oscillation (ENSO) variability and mesoscale phenomena that are relevant in the context of droughts over the region.
The analysis of the simulations shows that there is a discrepancy among diverse drought metrics in representing duration and frequencies of past droughts in the western and central Mediterranean. The self-calibrated Palmer drought severity index identifies droughts with significantly longer duration than other drought indices during 850–1849 CE. This re-affirms the necessity of assessing a variety of drought indices in drought studies in the paleoclimate context as well.
Independent of the choice of the drought index, the analysis of the period 850–1849 CE suggests that Mediterranean droughts are mainly driven by internal variability of the climate system rather than external forcing. Strong volcanic eruptions show no connection to dry conditions but instead are connected to wet conditions over the Mediterranean. The analysis further shows that Mediterranean droughts are characterized by a barotropic high-pressure system together with a positive temperature anomaly over central Europe. This pattern occurs in all seasons of drought years, with stronger amplitudes during winter and spring. The North Atlantic Oscillation (NAO) and ENSO are also involved during Mediterranean multi-year droughts, showing that droughts occur more frequently with positive NAO and La Niña-like conditions. These modes of variability play a more important role during the initial stage of droughts. As a result, the persistence of multi-year droughts is determined by the interaction between the regional atmospheric and soil moisture variables, i.e., the land–atmosphere feedbacks, during the transition years of droughts.
These feedbacks are intensified during the period 1850–2099 CE due to the anthropogenic influence, thus reducing the role of modes of variability on droughts in this period. Eventually, the land–atmosphere feedbacks induce a constant dryness over the Mediterranean region for the late 21st century relative to the period 1000–1849 CE.
- Article
(11216 KB) - Full-text XML
- BibTeX
- EndNote


Drought is an extreme weather and climate event characterized by a prolonged period with persistent depletion of atmospheric moisture and surface water balance from its mean average condition. Drought is also characterized by a slow onset and devastating impacts on society, the economy, and the environment (Wilhite, 1993; Dai, 2011; Mishra and Singh, 2010), and it can be classified into four types: meteorological drought, associated with the decrease in precipitation; agricultural drought, associated with the depletion of soil moisture and impacts on crops and plants; hydrological drought, characterized by the depletion of streamflow and water reservoirs; and lastly socio-economic drought that occurs when the other types of droughts cause impacts on society, in a way that the water supply cannot meet the demand from society (Mishra and Singh, 2010). If a meteorological drought lasts for a longer period, it has the potential to propagate to other types of droughts, such as agricultural or hydrological drought. In this sense, different types of droughts can become connected to each other. Thus, meteorological drought is one of the causes of other types of droughts, among other processes such as seasonal changes of run-off or an increase in evapotranspiration demand (Wang et al., 2016; Zhu et al., 2019). The severity and duration of a drought can be quantified through different indices that capture hydrological conditions associated with a regional water balance (Dai, 2011). However, a single universal index cannot characterize the entire complex nature of droughts (Lloyd-Hughes, 2014) and the connection among different types of droughts (Mukherjee et al., 2018). Thus, one index does not necessarily show a similar value to other indices even for the same region and period (Raible et al., 2017; Mukherjee et al., 2018). Some of the widely used indices are the self-calibrated Palmer drought severity index (Wells et al., 2004), the Standardized Precipitation Index (McKee et al., 1993), and the Standardized Precipitation Evapotranspiration Index (Vicente-Serrano et al., 2009), among many others.
The Mediterranean region is known as a climate change hot spot (Giorgi, 2006), i.e., the region is highly responsive to current and future global warming, showing a decrease in precipitation and an increase in drought episodes (Dubrovský et al., 2014; Liu et al., 2018). The climate of the Mediterranean is characterized as semi-arid with a pronounced annual cycle, which means a high temporal variability of the availability of water resources (Lionello et al., 2006). Therefore, droughts or periods with scarcity of water are intrinsic parts of the climatic conditions over the Mediterranean. Overall, the region shows mild and wet winters and hot and dry summers (Lionello et al., 2006). The variability of precipitation is not uniform across the entire Mediterranean. The western and eastern regions show different precipitation regimes, in particular in winter. A regional mode of circulation that explains this spatial difference is the Mediterranean Oscillation, characterized by the opposite pressure and precipitation patterns between the western and eastern region (Dünkeloh and Jacobeit, 2003). Besides, the regional precipitation is strongly influenced by the midlatitude storm tracks and cyclones, which become stronger during the winter (Lionello et al., 2016; Raible et al., 2007, 2010; Ulbrich et al., 2009); regional cyclones (Alpert et al., 1990); and large-scale modes of variability, such as the North Atlantic Oscillation (NAO), East Atlantic–West Russian pattern (EA–WR) and El Niño–Southern Oscillation (ENSO) (Lionello et al., 2006; Raible, 2007). The influence of these large-scale patterns varies within the Mediterranean region. The NAO exerts its control on precipitation by affecting the strength of westerlies and latitudinal movement of storm tracks. Precipitation decreases during the positive phase of the NAO, mostly in the western and central Mediterranean, whereas it increases during the negative phase of NAO (Wallace and Gutzler, 1981; Hurrell, 1995). The EA-WR influences the southeastern Mediterranean hydroclimate causing drier conditions during its positive phase (Barnston and Livezey, 1987; Krichak and Alpert, 2005). The response of the Mediterranean climate to ENSO is more complex: it varies over time, as illustrated by historical cases (Brönnimann, 2007; Brönnimann et al., 2007), and it depends on the maturity of the ENSO state (Vicente-Serrano, 2005), the seasons (Mariotti et al., 2002), and the co-occurrence with NAO (Brönnimann, 2007; Raible et al., 2001, 2003). Mariotti et al. (2002) demonstrated that precipitation decreases over the western Mediterranean during La Niña in autumn and spring. Brönnimann (2007) showed a connection between La Niña (El Niño) and the positive (negative) phase of the NAO in the late winter.
In the Mediterranean, increases in the severity and number of droughts have been already observed since the mid to late 20th century (e.g., Mariotti et al., 2008; Philandras et al., 2011; Sousa et al., 2011; Seager et al., 2014; Vicente-Serrano et al., 2014; Spinoni et al., 2015). In recent decades, the occurrence of droughts with a pan-European characteristic that cover a large part of the western and central Mediterranean region have been also detected (García-Herrera et al., 2019; Spinoni et al., 2017). The increase in dryness is attributed to the increase in the atmospheric greenhouse gas (GHG) concentrations, which causes a strong increase in the surface temperature and a decrease in precipitation over this region (Mariotti et al., 2008). General circulation models (GCMs) project that this drying trend, together with the increases in dry days and drought episodes, will be intensified in the future under the business-as-usual scenario, causing substantial socio-economic impacts and changes in the region (Mariotti et al., 2008; Field et al., 2012; Lehner et al., 2017; Naumann et al., 2018). The future changes in the Mediterranean droughts are due to increasing tropical SSTs (Hoerling et al., 2011), changes in the mean regional circulation associated with intensified subsidence and low-level mass divergence (Seager et al., 2014), the expansion of the Hadley cell and of the subtropical subsidence zones (Previdi and Liepert, 2007), an intensification of subtropical highs (Li et al., 2012), and a northward shift of the storm tracks (Raible et al., 2010).
Although the dryness projected in the future scenarios is unprecedentedly intense, multi-year dry periods are not a completely new phenomenon over the Mediterranean. Using the summer self-calibrated Palmer drought severity index (scPDSI) based on tree ring reconstructions (also known as the Old World Drought Atlas; OWDA; Cook et al., 2015), Cook et al. (2016a) found that the region has experienced several dry periods during the last 900 years, some with persistent pan-Mediterranean characteristics. The variability of these Mediterranean droughts shows the frequencies of not only interannual but also multidecadal timescales.The causes of these past droughts are still unclear, but a connection to large-scale patterns, such as the NAO, Eastern Atlantic, and Scandinavian patterns may be relevant.
Besides paleoclimate proxies, GCMs have been used to study long-term changes and continuous variability of global and regional hydroclimate and extreme events during the last millennium (PAGES Hydro2k Consortium, 2017; Haywood et al., 2019). Modeling studies on the long-term variability of droughts are focused on the continental US, mainly to investigate the variability and mechanisms of southwestern United States (SW) droughts (Coats et al., 2013, 2016; Parsons et al., 2018; Parsons and Coats, 2019) and North American pan-continental droughts (Coats et al., 2015; Cook et al., 2016b). The results show that different GCMs are able to reproduce the duration and intensity of SW megadroughts and North American pan-continental droughts. The authors further suggest that internal variability is the main driver of these droughts, although the specific processes are largely model dependent.
Globally, Stevenson et al. (2018) used the Community Earth System Last Millennium Ensemble (CESM‐LME; Otto-Bliesner et al., 2016) to examine the connection between past global hydrological mega-events and climate variability and external forcings during the last millennium. Among the major modes of climate variability, ENSO and AMO are identified as having an influence on mega-events; both modes significantly alter the megadrought risks and persistence in drought-prone regions, such as southern Australia, the Sahel, and the southern United States. The study provides insights into the dynamic of megadroughts associated with different mode of variability on global scales. However, a detailed analysis on Europe and the Mediterranean is missing.
Over the European domain, Ljungqvist et al. (2019) examined a long-term covariability between the summer temperature and hydroclimate during the Common Era. By comparing the instrumental records, tree-ring-based reconstructions, and model simulations, they found that a warm dry relationship with multidecadal variability is more dominant in southern Europe. Though all datasets share some common leading modes of covariability across different time frequencies, there are some discrepancies among instrumental records, proxies, and models. The proxies present a stronger positive temperature–hydroclimate relationship, while the model exhibits a stronger negative relationship than the instrumental records. Xoplaki et al. (2018) investigated the interaction between past central and eastern Mediterranean societies and the hydroclimate conditions, including droughts, by comparing the historical records, proxies, and GCM simulations. Analyzing three particular historical periods, they concluded that the multidecadal variability of precipitation in the region is driven by internal dynamics of the climate system: large discrepancies between the model trajectories are detected. Therefore, no agreement in timing between models, proxies, and historical records can be expected. Nevertheless, the models elucidate some possible explanations about the dynamics of extreme dry and wet events in some past periods.
Despite a number of studies on past hydrological variability, a long-term continuous perspective on the mechanisms of past extreme hydrological events, specifically of droughts over the Mediterranean during the last millennium, is still missing. As a long trend of dryness has already been detected in the instrumental era and is expected to intensify in the future scenario, it is necessary to provide a long-term picture on the variability and changes of past dry events and their mechanisms. Therefore, we aim to examine the physical mechanisms involved in yearly and multi-year long droughts during the Common Era (850–1849 CE) and historical, present, and future periods (1850–2099 CE) over the western and central Mediterranean region. We choose this specific area, as this region has been affected by recent large-scale droughts (García-Herrera et al., 2019; Spinoni et al., 2017), which can be seen as pan-western–central Mediterranean droughts. Moreover, the region shows coherent desiccation in the future scenario (Dubrovský et al., 2014). From now on, for simplicity, we refer to the western and central Mediterranean region in our study simply as the Mediterranean region. We focus on understanding the dynamics that induce past persistent pan-regional multi-year droughts and whether the dynamics that induce droughts in the past will change in the historical and future periods with the anthropogenic increase in GHG.
For our purpose, we use the Community Earth System Model version 1.0.1 (CESM), which includes the active biogeochemical cycle and has a horizontal resolution of (Lehner et al., 2015). The spatial resolution of the model is a clear advantage for our study on a relatively small confined area. The precipitation of the region is strongly influenced by extratropical cyclones and in general, GCMs have difficulties in reproducing the dynamics and precipitation associated with these mesoscale phenomena (Raible et al., 2007; Watterson, 2006). Nevertheless, these atmospheric dynamics and precipitation are better represented in GCMs with finer spatial resolutions (Champion et al., 2011; Watterson, 2006). Hence, using a model that provides a seamless simulation for the period 850–2099 CE with a relatively finer spatial resolution can improve a representation of precipitation-related processes and thus drought-associated mechanisms over the region.
This paper is composed of the following sections: in Sect. 2, we introduce the model and simulations; the hydrological variables given by the model; the definitions of droughts and drought indices; the proxy and observation datasets; and methods. In Sect. 3, we present the results of the analysis: first, we compare the simulation, proxy reconstruction, and observations to validate the model simulation; second, we describe how the model depicts past droughts, whether the quantification of past droughts over the region is sensitive to the choice of drought metrics, and whether there is some possible connection between the volcanic eruptions and droughts; third, we present the climate conditions associated with the past Mediterranean droughts and their connection with regional-scale circulation and modes of variability, i.e., the NAO and ENSO; lastly, we discuss whether mechanisms that induce past droughts have changed in the historical and future periods. Finally, the conclusions are presented in Sect. 4.
2.1 Description of the model and simulations
We use the Community Earth System model version 1.0.1 in this study. Two simulations are used: a continuous transient simulation of 1250 years (850–2099 CE) and a control simulation of 400 years at perpetual 850 CE conditions (Lehner et al., 2015). In the simulations, the atmosphere has the horizontal resolution of and 26 vertical layers, and the land has the same horizontal resolution as the atmosphere with 15 sub-surface layers. The ocean has the horizontal resolution of with displaced pole grids with 60 ocean layers. The sea ice component shares the same horizontal resolution as the ocean.
The control simulation uses constant forcing parameters set to the 850 CE values: the land use and land use changes (LULUC), the total solar irradiance in which the value is 1360.228 W m−2, and the greenhouse gas (GHG) concentrations, such as the CO2 of 279.3 ppm, CH4 of 674.5 ppb, and the N2O of 266.9 ppb. Unlike other forcings, the orbital parameters are set to 1990 CE conditions.
The transient simulation includes the active biogeochemical cycle and forcing, such as the LULUC, total solar irradiance, volcanic eruptions, and GHG concentrations that vary over time. The GHG concentrations and LULUC vary little before 1850, showing pronounced changes and increases after that year. Then, the period 2005–2099 CE is run with the RCP 8.5 scenario. The transient forcing follows the third Paleoclimate Modeling Intercomparison Project (PMIP4; Schmidt et al., 2012) – Fifth Coupled Model Intercomparison Project (CMIP5; Taylor et al., 2012) protocols. A more detailed overview of the forcing and initial set-up of the simulations is presented in Lehner et al. (2015).
2.2 Region of study, analysis, and methods
The focus area of the study is the western and central Mediterranean region (33–45∘ N, 15∘ W–28∘ E; Fig. 1). The extent of the region is selected based on empirical orthogonal function (EOF) analysis on the monthly precipitation from the observation (gridded station precipitation from U.Delaware v5.01; Willmott and Matsuura, 2001). The region overall shares a similar variability in the first EOF (13.28 %) and second EOF (11.01 %); this similarity can also be attributed to the influence of the NAO on the precipitation over the region (Dünkeloh and Jacobeit, 2003).

Figure 1(a) Variance explained by the first EOF and second EOF in the observed monthly precipitation from the U.Delaware v5.01 dataset for the period of 1901–2000 CE. The red rectangle indicates the region of study: western and central Mediterranean. (b) Percentage of area with the soil moisture anomaly below 0 mm per month in the region of study during the last millennium in CESM. Brown shading indicates the years with droughts.
For the analysis, the monthly anomalies of variables associated with the hydrological condition, such as the surface and air temperatures, precipitation, zonal and meridional winds, geopotential heights, and sea level pressure are calculated with respect to the 1000–1849 CE (850 years) mean annual cycle for each grid point in the transient simulation. For the control simulation, the entire 400 years is taken as a reference period to calculate the anomalies.
We split the transient simulation into two parts: the first period from 850 to 1849 CE is used to study the natural variability of droughts excluding the effect of an accelerated increase in the GHGs, and the second period from 1850 to 2099 CE is used to examine the effects of anthropogenic changes on the natural variability of droughts. For the first period (850–1849 CE), the drought condition in the transient simulation is compared to that in the control simulation to assess the influence of the natural variability and forcings. A Mann–Whitney U test is performed to statistically compare the distributions between the transient and the control simulation. The null hypothesis of a Mann–Whitney U test states that the distributions of both populations (in this case, the transient and the control simulations) are equal. For the second period (1850–2099 CE), a linear detrending method is applied to the anomalies in order to examine changes in the variability and mechanisms associated with droughts during this period. For this, the time period is split into two and the least-squares method is applied to each of the periods separately: from 1850 to 2000 and from 2001 to 2099 CE (Fig. A1). Following this, the detrended anomalies are compared to the anomalies in the non-detrended (1850–2099 CE) and the first (850–1849 CE) periods.
Composites of positive and negative phases of two modes of variability, NAO and ENSO, are also investigated. The NAO is taken as the difference in the sea level pressure anomalies between the regions confined to 35–39∘ N, 33–21∘ W and 63–67∘ N, 25–13∘ W, which reflect the Azores high and the Iceland low, respectively (Wallace and Gutzler, 1981; Trigo et al., 2002). The ENSO is characterized by the annual mean sea surface temperature anomalies over Niño 3.4 region in the tropical equatorial Pacific (5∘ S–5∘ N, 170–120∘ W) (Trenberth, 1997).
We further perform a wavelet coherence analysis (Grinsted et al., 2004; Gouhier et al., 2018) and a superposed epoch analysis (e.g., Malevich, 2018; Rao et al., 2017) in order to find a possible connections between droughts and volcanic eruptions. Thereby, we use the time series of the drought indices (Sect. 2.3) and of volcanic eruptions (Gao et al., 2008). Note that all time series for these analysis are normalized to have a zero mean and 1 standard deviation.
2.3 Drought definitions
We use four drought metrics to quantify droughts and to perform the comparison among them: the Standardized Precipitation Index (SPI), Standardized Precipitation Evapotranspiration Index (SPEI), self-calibrated Palmer drought severity index (scPDSI), and annual soil moisture anomaly (SOIL).
The SPI only requires a long-term precipitation record, and the accumulated precipitation is fitted to a probabilistic distribution, in our case a gamma distribution. Following this, the fitted distribution is transformed to a normalized Gaussian distribution (McKee et al., 1993). The SPEI is similar to the SPI, but instead of only using a precipitation record, it considers the climate water balance given by the difference between the precipitation and atmospheric evaporative demand. This difference is fitted to a log-logistic probability distribution and then transformed to a normal distribution (Vicente-Serrano et al., 2009). For the atmospheric evaporative demands, we use the potential evapotranspiration derived from the Thornthwaite equation, which only requires surface temperature and latitude (Thornthwaite, 1948). The scPDSI computes the water balance by assuming a two-layer soil bucket model, and it requires temperature and potential evapotranspiration records. Other necessary variables, such as runoff and losses, are estimated from the temperature and potential evapotranspiration (Palmer, 1965; Wells et al., 2004; Zhong et al., 2018). Again, the potential evapotranspiration is calculated by using Thornthwaite equation similar to for the SPEI. The SOIL is the upper 10 cm soil moisture anomaly calculated with respect to the 850-year mean (1000–1849 CE) annual cycles. The soil moisture is a direct output from the model.
All indices are calculated with respect to the same reference period (1000–1849 CE) and with the 12-months annual timescale for the SPI, SPEI, and SOIL. The scPDSI has an inherent timescale that ranges from 9 to 14 months depending on the region (Vicente-Serrano et al., 2010, 2015). Thus, we use a 12-month timescale for the other indices in order to be comparable to the scPDSI. Then, the area-weighted average of each index is calculated over the Mediterranean region (Fig. 1). The summer scPDSI is also calculated by averaging the June–July–August scPDSI, in order to compare with the summer scPDSI from the tree-ring-based reconstruction, the Old Word Drought Atlas (OWDA; Cook et al., 2015).
For all indices, we define a drought event as consecutive years with negative indices, in which at least 1 year with the index falls below the 10th percentile of its 850-year (1000–1849 CE) distribution. In such a way, we assure that the dry condition is maintained consistently during drought years, without being interrupted by a single wet year or season. This method, which imposes a threshold based on the extreme percentiles, assures that strong negative anomalies persist throughout the entire year with droughts. Thus, we only include relatively severe droughts in the analysis.
Droughts with a duration of more than 3 years are considered multi-year droughts. In Sect. 3.3., we analyze the mean condition during droughts in the control and transient simulations taking into account all short (1 and 2 years in duration) and long (more than 3 years in duration) Mediterranean droughts. For the next part of the analysis in Sect. 3.4., we examine the dynamics associated with persistent multi-year droughts (more than 3 years in duration). These long droughts are separated into three stages: the initiation years as the first years of droughts, the termination years as the last years, and the rest as the transition years. The evolution of droughts is analyzed for each of the stages. This separation method is similar to the one used by Parsons and Coats (2019).
Lastly, in order to define droughts with pan-western–central Mediterranean characteristics, we select only drought events where more than 70 % of the region of study is occupied by negative indices (Fig. 1b). However, for multi-year droughts, we concede that this condition does not need to be fulfilled for the initiation and termination years but only needs to be fulfilled for the transition years: a drought can start weak and with a more local characteristic, expand to a larger proportion of the Mediterranean, and weaken again in the termination years.
2.4 Observation and proxy reconstruction datasets for the validation
To validate the model simulation, we compare mean seasonal and annual precipitation, time series of droughts and climate conditions associated with droughts among the observation, and proxy reconstruction and model simulations for the period 1901–2000 CE. We use the gridded station data for temperature and precipitation from U.Delaware v5.01 (Willmott and Matsuura, 2001), the sea surface temperature from the Extended Reconstructed Sea Surface Temperature v5 (ERSST v5; Huang et al., 2017a), and geopotential heights from the 20th Century Reanalysis v2 (CR v2; Compo et al., 2011). The anomalies of variables are calculated by extracting the mean annual cycles with respect to 1950–1979 CE. The scPDSI is calculated using the U.Delaware v5.01 temperature and precipitation. The same calibration period 1950–1979 is used to calculate the scPDSI for the observation and model. Furthermore, we take the gridded tree-ring-based reconstruction of European summer scPDSI: OWDA (Cook et al., 2015). Among all drought indices, we use only scPDSI for comparison and validation, as the OWDA only provides this specific drought metric. The time series of scPDSI during this period are statistically compared to each other using the t tests with the null hypothesis of equal means between two time series. The analysis of patterns associated with droughts is performed by calculating the spatial correlations between the scPDSI and SST, scPDSI, and geopotential height fields.
3.1 Validation of CESM: comparison among observation, proxy and model (1901–2000 CE)
In this section, we compare the mean precipitation, mean scPDSI, number and duration of droughts, and atmospheric conditions associated with Mediterranean dry conditions among the observation, OWDA, and CESM simulation for the period of 1901–2000 CE.
The model simulation exhibits similar spatial patterns of mean seasonal precipitation to those from the observation (Fig. 2), although some regions are statistically different. In the summer, both the central and western Mediterranean present dry conditions, whereas in the winter both regions are less dry than the summer, with wet conditions over Portugal and Balkans. For the mean annual cycle, the model in general shows less precipitation than the observed values over both the central and western Mediterranean. Nevertheless, the model reproduces the annual precipitation cycle well, correctly depicting the maximum and minimum periods of precipitation.
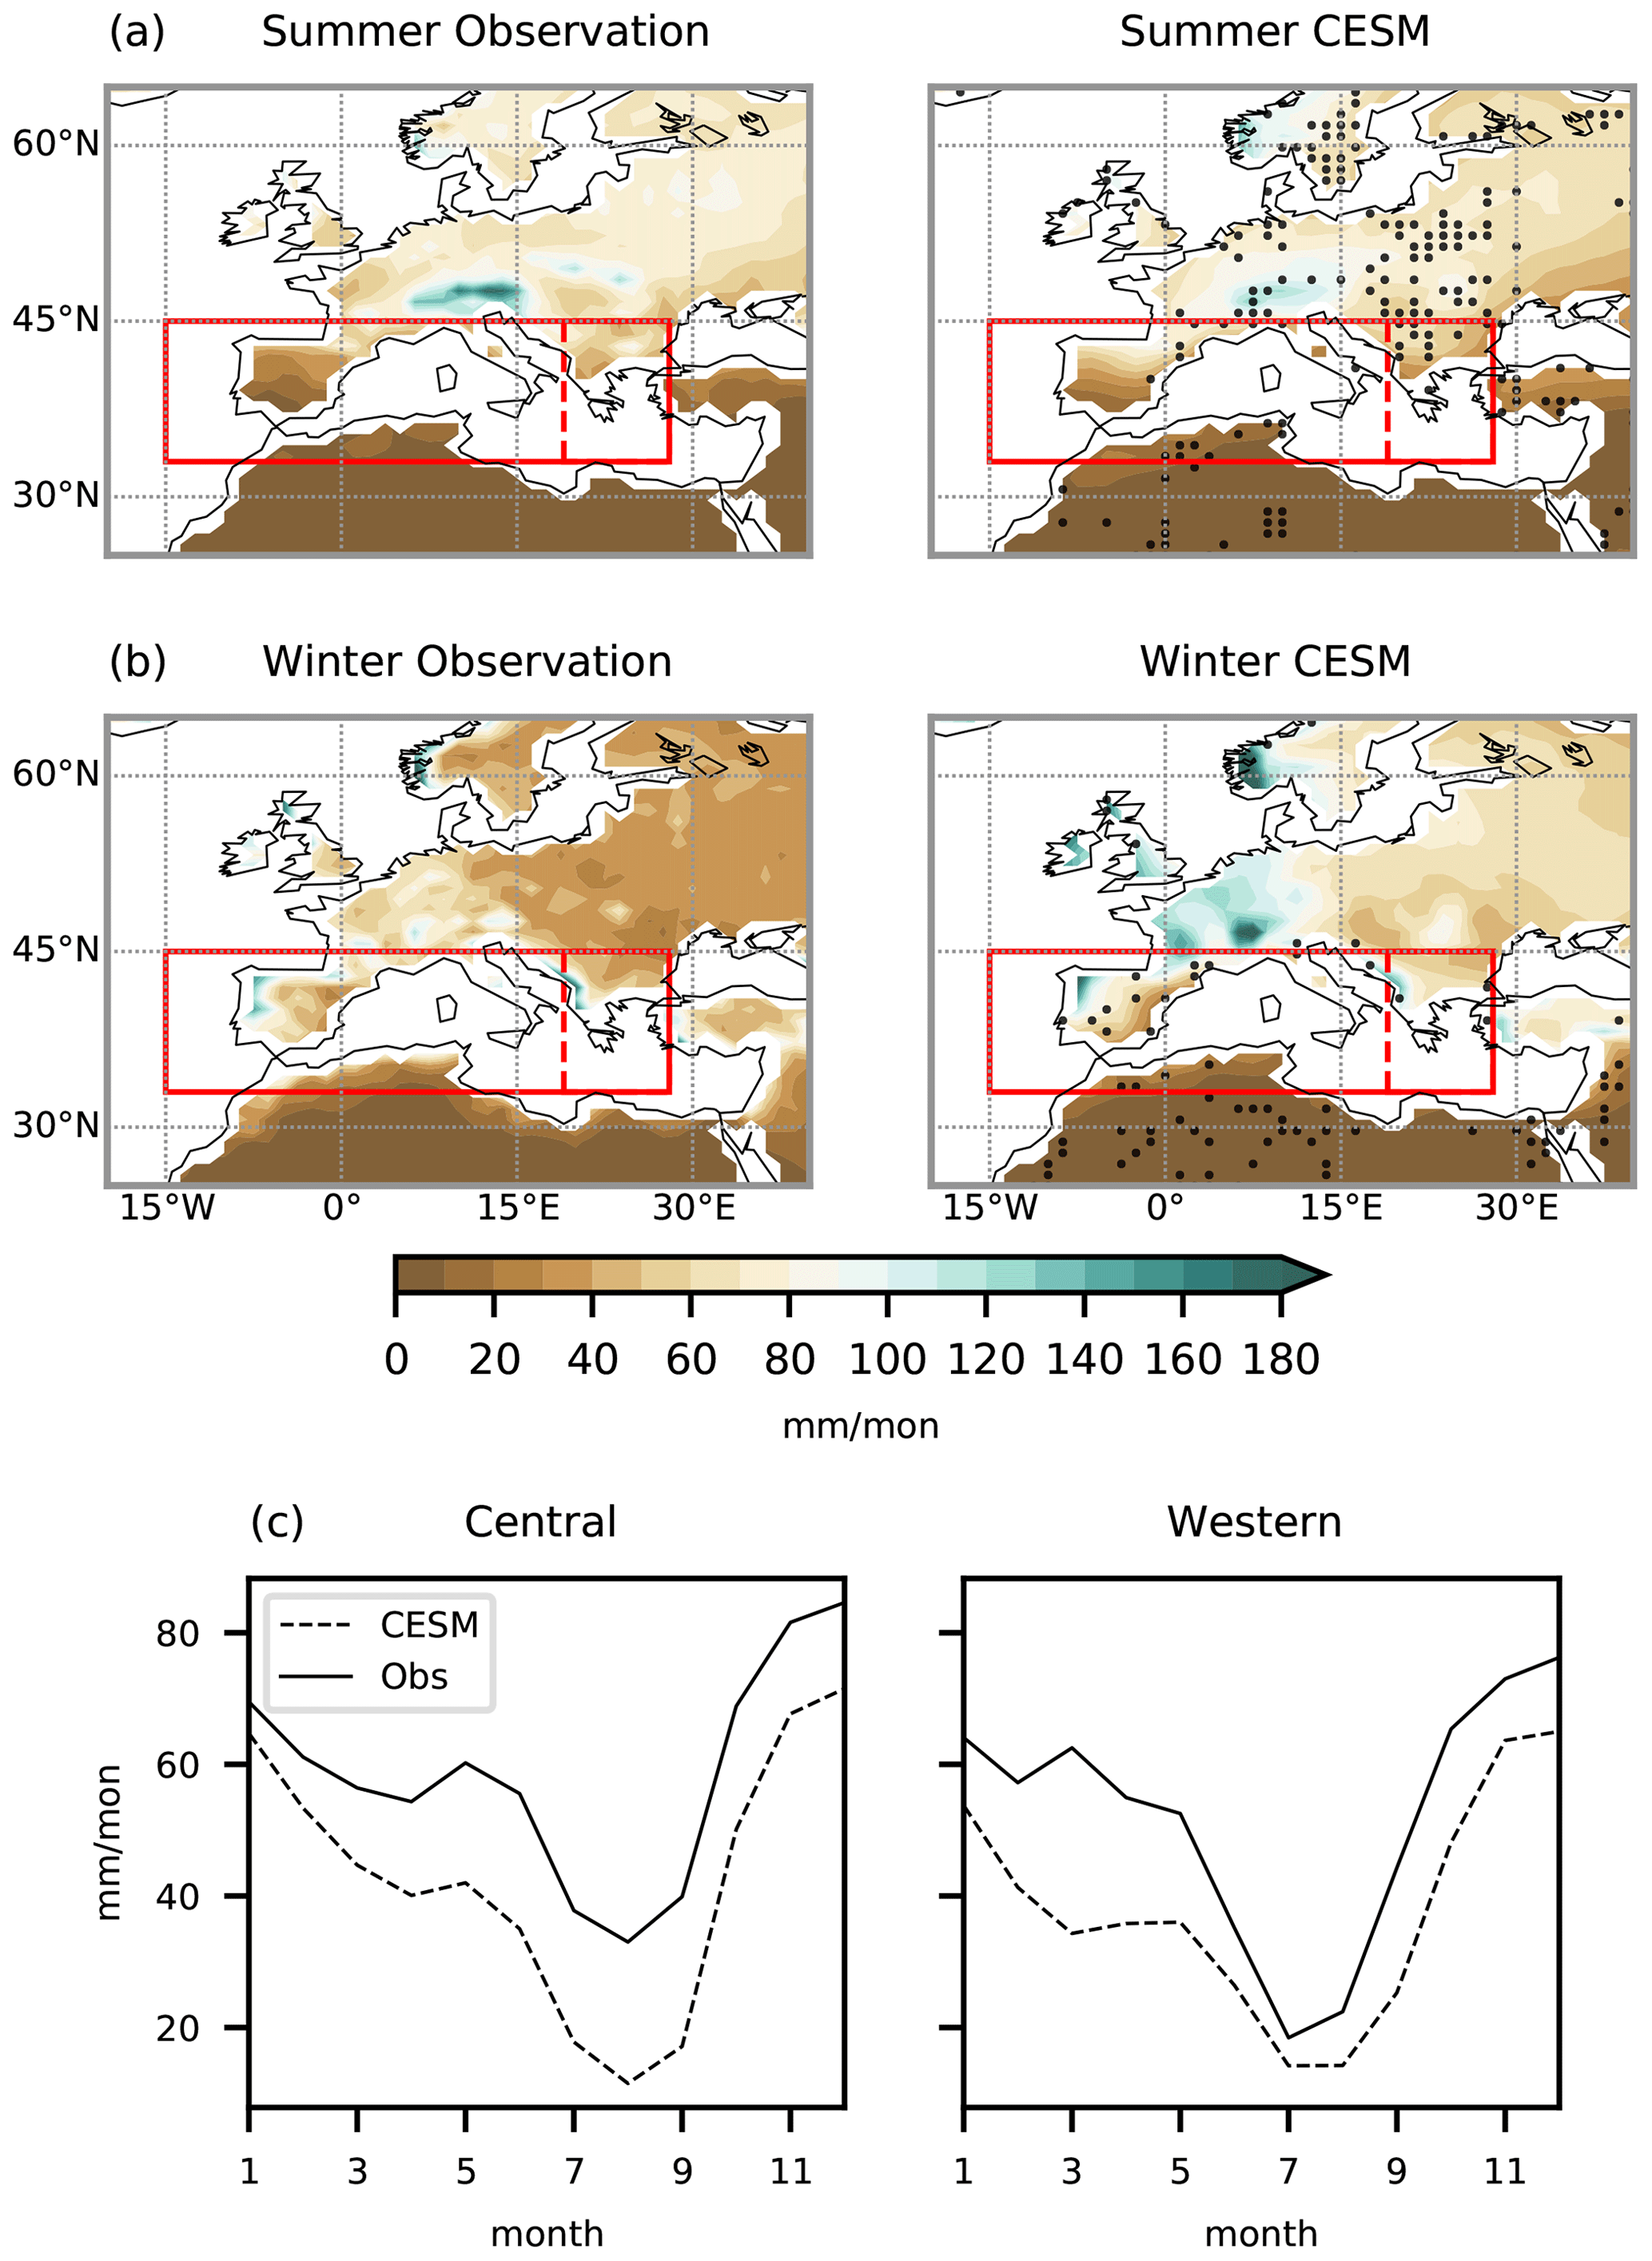
Figure 2Mean seasonal precipitation for the observation (left) and CESM (right) in the (a) summer and (b) winter for the period of 1901–2000 CE. Black dots on the composites of CESM indicate the regions where the means between the observation and model are not statistically similar at a 5 % confidence level from the t tests. (c) Mean annual cycles of precipitation for the same period over the areas in the rectangles. The observation is in continuous lines, and CESM is in dashed lines.
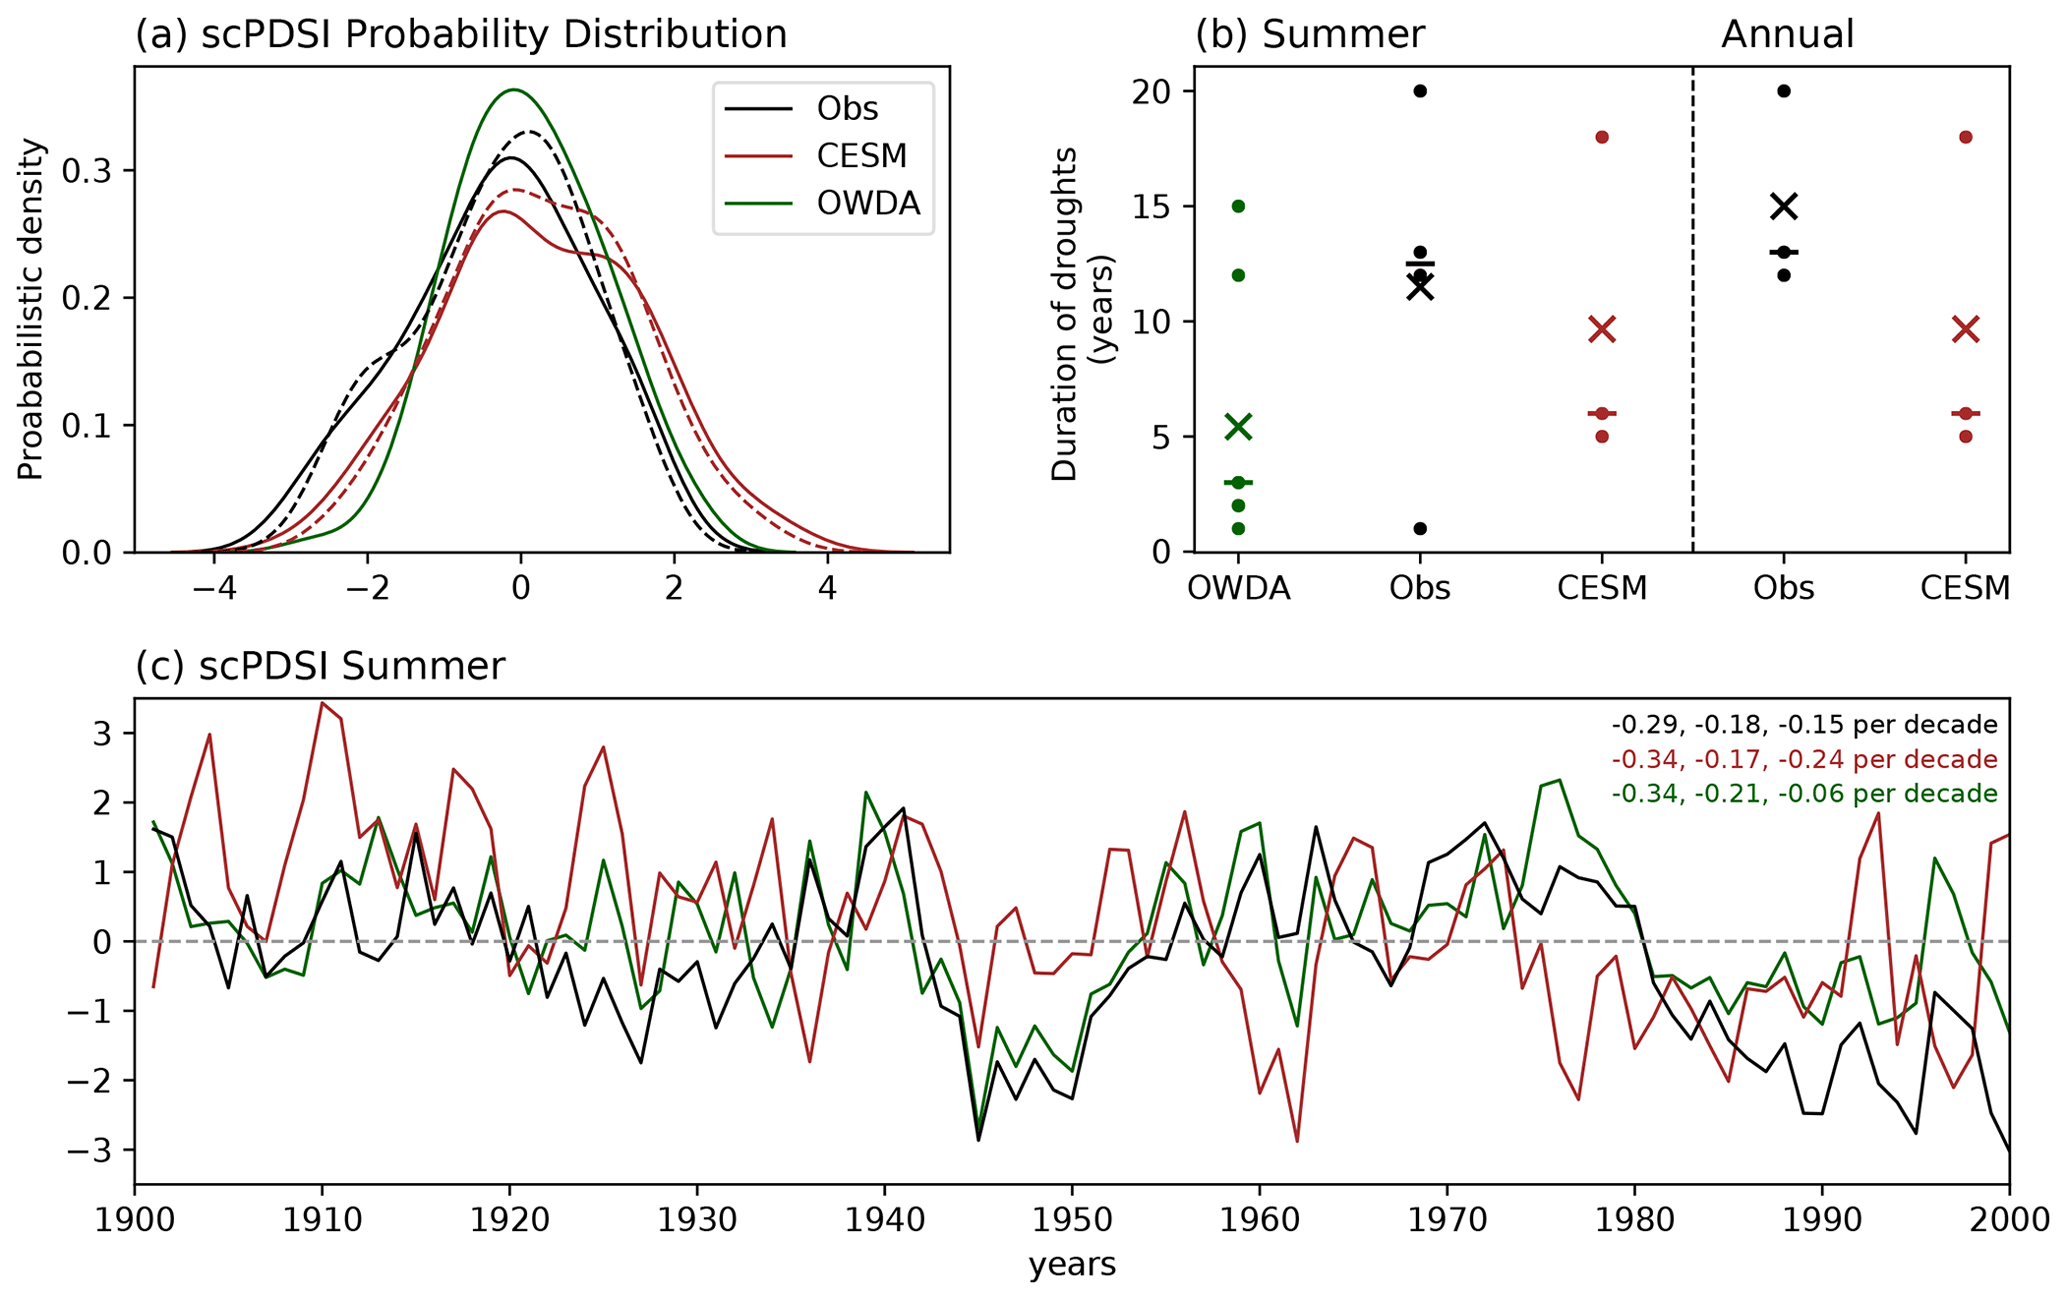
Figure 3(a) Probabilistic distribution of the yearly self-calibrated Palmer drought severity indices (scPDSIs) from the U.Delaware v5.01 observation (black), CESM (red), and OWDA (green) smoothed by kernel density estimates using Gaussian kernels. Continuous lines indicate the summer, and dashed lines indicate the annual scPDSIs. The t tests are applied among these distribution under the null hypothesis of equal means between two time series.The p value between the summer scPDSI from CESM and OWDA is 0.28, between the OWDA and observation it is 0.01, and between the CESM and observation it is 0.001 for both summer and annual values. (b) Distribution of duration of annual droughts in different datasets. Crosses are the means and horizontal dashes the medians of the duration of droughts. (c) Time series of summer scPDSIs from the observation (black), CESM (red), and OWDA (green) for 1901–2000 CE. The numbers on the upper right indicate the values of the trends per decade, from left to right, for the periods 1901–1950 CE, 1951–2000 CE, and 1901–2000 CE. All of these trends are statistically significant at 95 % confidence interval based on the Mann–Kendall tests.
Comparing the time series of scPDSI (Fig. 3a and c), the summer means between the model and OWDA are statistically similar to each other (p value from the t test of 0.28). The same happens between the OWDA and observation but with much lower confidence level of 1 % (p value of 0.01). However, the means of both summer and annual scPDSI in the model are statistically different to those in the observation (p values of 0.001). Nevertheless, all three scPDSI show negative trends during 1901–2000 CE (Fig. 3c) and in each sub-period (1901–1950 and 1951–2000 CE), indicating a continuous increase of drying over the region, which is in line with the previous studies (Mariotti et al., 2008; Sousa et al., 2011; Spinoni et al., 2015). Based on the Mann–Kendall tests, these trends are all statistically significant at the 95 % confidence interval. For the number of droughts (Fig. 3b), the observation presents 4 events, OWDA presents 7 events, and CESM presents 3 events during the last century. For the duration of droughts, the mean (5.43 years) and median (3 years) in OWDA are lower than those in the observation (11.50 and 12.50 years, respectively). CESM also exhibits a lower median (6 years) compared to the observation, although its mean (9.67 years) better resembles the observation than the one in OWDA. These differences in the means and medians between the observation and CESM are also present in annual scPDSI.
Overall, the model tends to underestimate the duration of present-day droughts more than those from the observation. However, the model to a certain extent still shows its ability to reproduce persistent droughts of multi-year duration. Additionally, the mean duration of droughts in CESM is longer than in OWDA. Still, it is important to note that the analysis of annual-scale extreme dry events based on a relatively short present period of 100 years is not sufficient to draw comprehensive conclusions on present-day multi-year droughts due to the limited number of events.
One reason for the difference in the scPDSI between the model and observations is potentially related to the model performance on mesoscale phenomena, which play an important role for the regional precipitation during the wet season (Alpert et al., 1990; Ulbrich et al., 2009; Champion et al., 2011; Watterson, 2006). Additionally, the model performance on internal variability may contribute to this discrepancy, which will be discussed in the following paragraphs. The difference in scPDSI between OWDA and the observation, which shows a p value at the limit of 1 % confidence level, can be explained by some characteristics of tree-ring-based reconstructions. The annually resolved summer (JJA) OWDA is based on tree ring reconstructions, which are known to be biased towards the growing season. Thus, the annual signal is not fully preserved (Franke et al., 2013). Moreover, tree-ring-based reconstructions for droughts tend to overestimate low-frequency variability compared to the instrumental observations (Franke et al., 2013), and the distribution of tree rings used to generate the gridded reconstruction over the Mediterranean may not be enough to capture precipitation events associated with regional-scale cyclones and fully depict dry–wet variability for the entire region (Babst et al., 2018).

Figure 4Pearson correlation coefficients between the scPDSI and anomalies of (a) sea surface temperature from ERSST v5 and (b) geopotential height at 850 hPa from the CR20 for the observation (left) and CESM (right) during the period of 1901–2000 CE. The linear trends of variables are removed before applying the correlation. Black dots on the maps show the regions where correlations are statistically not significant at 5 % confidence level.
After all, the model simulation and observation share many common patterns associated with the variability of scPDSI. Figure 4 shows the correlation patterns between the scPDSI and SST and the scPDSI and geopotential height at 850 hPa. The observation and model exhibit significant positive correlations over the central equatorial Pacific, though in the observation the region with statistically significant correlation is located more in the central North Pacific than in the model. The observation and model simulation share a common wave-like pattern from the North Pacific to Siberia over the extratropical latitudinal belt. Within this wave-like pattern, there is a prominent bipolar pattern with a significant negative correlation centered over the Mediterranean region and a positive correlation over the northern high latitudes. In the observation, the area of negative correlation of this bipolar pattern is larger over Europe, and the positive correlation is shifted to the Scandinavian region compared to the model simulation. Additionally, the observation and model present some common patterns occurring over the regions of ENSO (the tropical equatorial Pacific) and NAO (the North Atlantic).
As these two modes of variability are important in the climate system, including the European climate, it is necessary to point out that the amplitude of ENSO is too strong in this version of CESM (Parsons et al., 2017; Stevenson et al., 2018). In the case of the NAO, the seasonal variability of this mode seems to be amplified, similar to many other CMIP models (Fasullo et al., 2020). These inherent biases related to the modes of variability can partially explain the differences we observe here between the model simulation and observation. Nevertheless, it is found that CESM is still able to capture the hydroclimate condition associated with the ENSO teleconnection relatively well (Stevenson et al., 2018). The model also resembles the present-day NAO pattern well, including the spatial precipitation and temperature associated with this mode of variability in Europe (Deser et al., 2017).
Although there are some discrepancies between the model simulation and the observation, the model is able to reproduce the climate conditions associated with the variability of present-day scPDSI. In particular, the model is able to simulate multi-year droughts, and these droughts have a longer duration than those in OWDA. As it also shows statistical similarity to OWDA over the region, the model is suitable to analyze past Mediterranean droughts. The biases mentioned here are considered in detail in Sect. 4 when discussing the results of this study.
3.2 Variability of Mediterranean droughts during the 850–1849 CE and their connection to the volcanic forcing
To gain an overview of drought conditions in the Mediterranean, we assess the indices defined in the Sect. 2.3 using the period 850 to 1849 CE by focusing on the drought events and their duration. We compare the variability and duration of droughts of the summertime scPDSI in CESM with those in OWDA. Note that a direct comparison between the proxies and the model simulation is not possible due to the different initial conditions and the chaotic behavior of the climate system (PAGES Hydro2k Consortium, 2017; Xoplaki et al., 2018). Thus, we focus on comparing the simulated summer drought variability with the one of OWDA. Following this, we assess whether the simulated and reconstructed droughts respond similarly to the same external forcing, i.e., the volcanic eruptions.
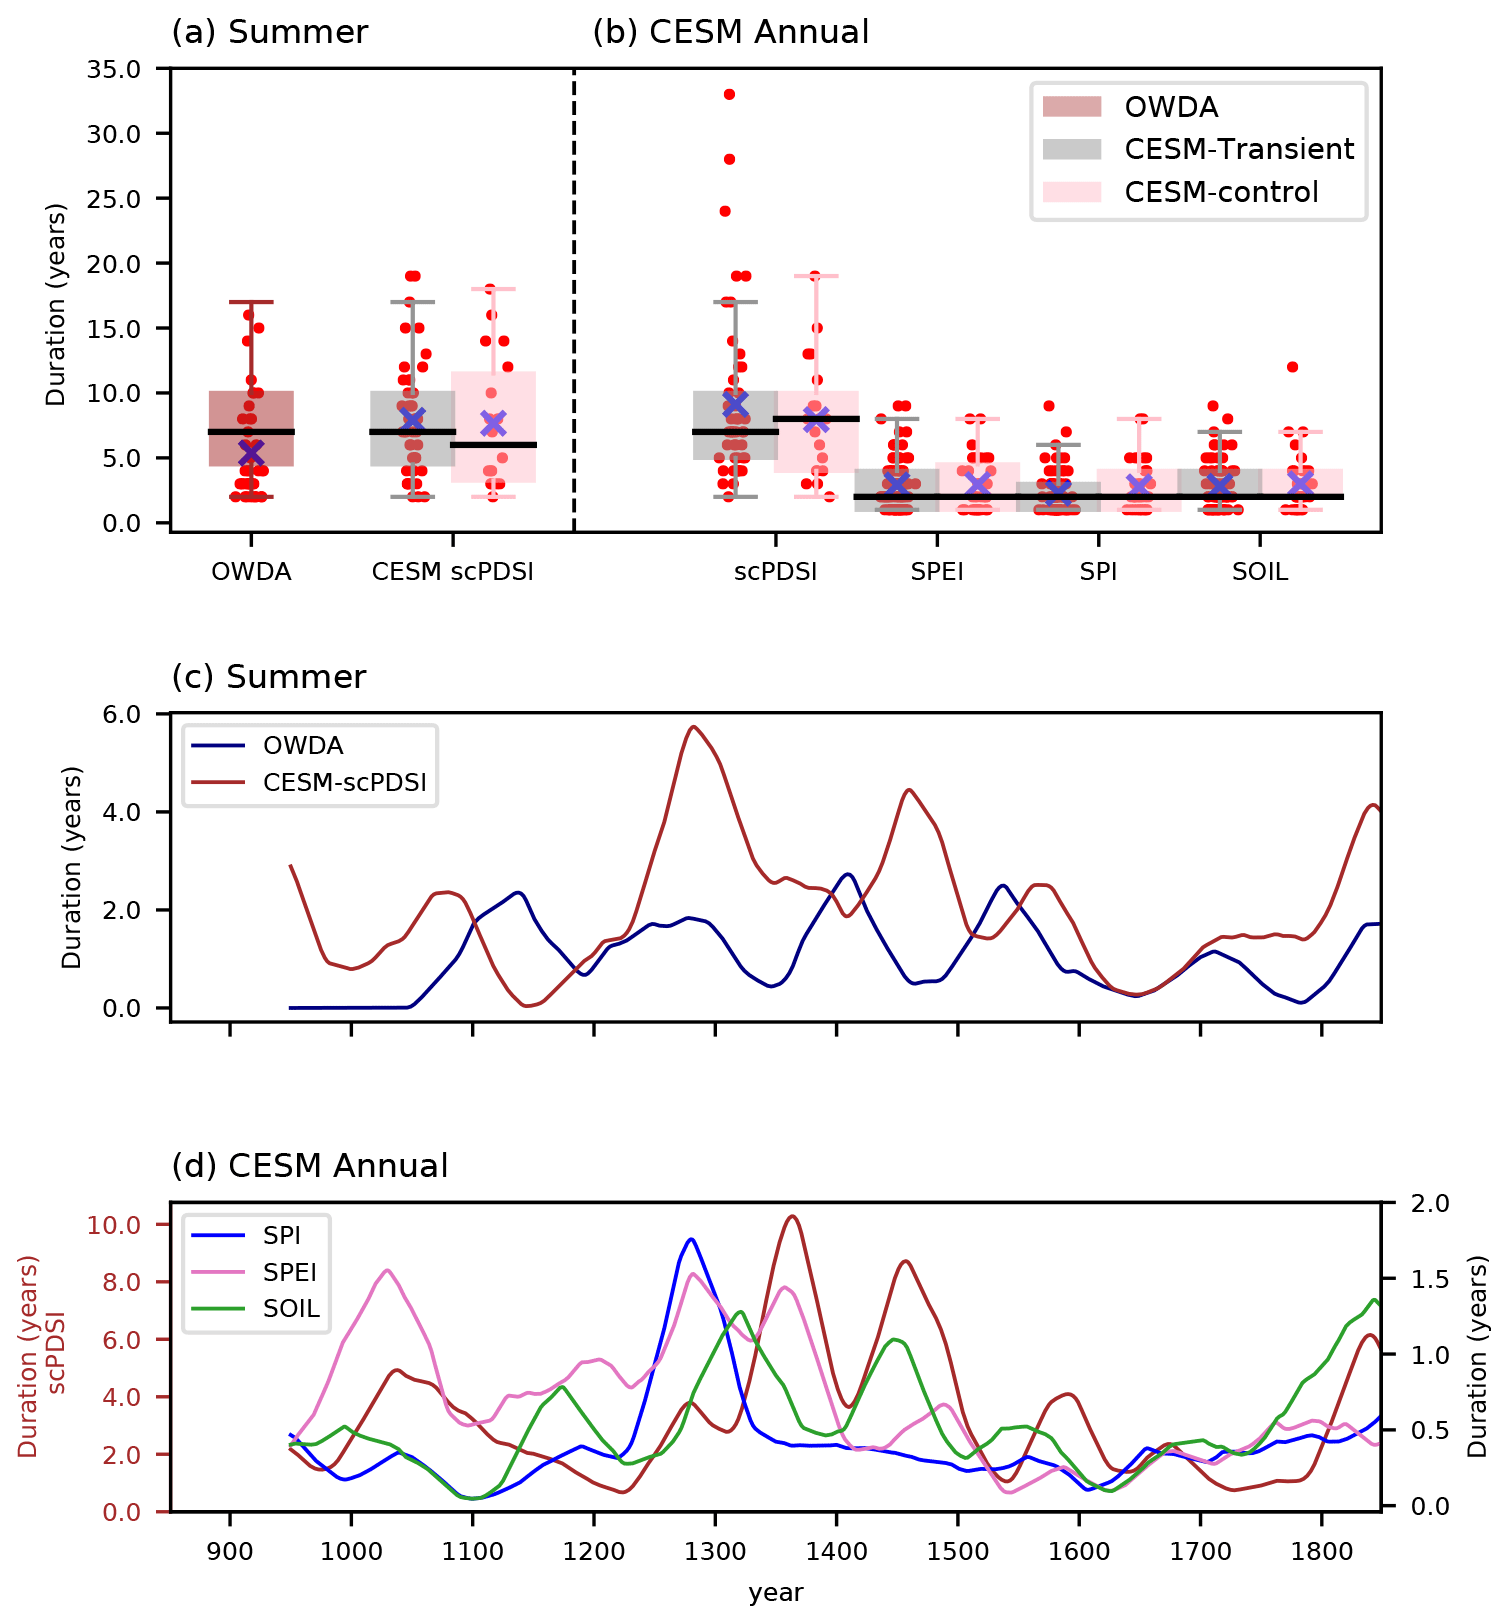
Figure 5(a) Distribution of the duration of droughts for the summer scPDSIs from OWDA and the transient and control simulations, and for (b) the annual drought indices from the transient and control simulations in CESM. Red points indicate individual drought events, black lines on the boxes are the medians of the duration, and blue crosses are the means of duration. (c) The 100-year running means of the duration of droughts for the summer scPDSIs and (d) the annual drought indices. The indices are the self-calibrated Palmer drought index (scPDSI) from OWDA, summer scPDSI (CESM-scPDSI), annual Standardized Precipitation Index (SPI), Standardized Precipitation Evapotranspiration Index (SPEI), soil moisture anomaly (SOIL), and annual scPDSI from CESM. Note that the annual scPDSI (brown line in d) has a separate y axis for its duration. The Mann–Whitney U tests (MW tests) are applied to the duration of droughts in (a) and (b) under the null hypothesis of an equal distribution between two time series of duration of droughts. The p value between the duration of summer scPDSI in OWDA and CESM is 0.003, which indicates that their distributions are statistically different from each other. This is also the case for all the annual indices, except between the SPEI and SOIL, with a p value of 0.87. The p values between the indices in the transient and control simulations are all statistically similar, indicating that the distribution of duration of droughts in the transient simulation is in the range of variability of the control simulation. The p values from the MW tests between the transient and control simulations are presented in Table A1.
Figure 5a and c exhibit the distributions and the 100-year running means of duration of summer droughts in OWDA and CESM. For the duration of summer droughts in 850–1849 CE (Fig. 5a), the discrepancy between CESM and OWDA is clear, with OWDA presenting the mean duration of 5.38 years and CESM presenting a mean duration of 7.89 years. The distributions associated with these means are statistically different from each other. This seems to be consistent with the result in the previous section (Sect. 3.1) that shows that OWDA identifies droughts with shorter duration compared to the present-day observation and CESM in the Mediterranean region. Thus, this characteristic is still present during the entire last millennium. The variability of droughts over time in OWDA and CESM are also different from each other (Fig. 5c). A period of increase in droughts, which is common in OWDA and CESM, is not identified. This gives us a first hint that the occurrence of droughts over the region is not mainly driven by the external natural forcings. However, both time series present a common period of decrease in droughts around 1600 CE.
Similarly, Fig. 5b and d show the distributions and the running means of duration of annual Mediterranean droughts in CESM using different indices. As expected, different indices do not exactly behave similarly in terms of the occurrence, number of events, and duration (Raible et al., 2017; Mukherjee et al., 2018). However, in the 850–1849 CE period, the indices coincide for some years: over 89 years, all indices indicate the same overlapped drought periods. In terms of duration in 850–1849 CE, the scPDSI is the one which shows more longer-lasting droughts than other indices, with a mean duration of 9.1 years. Following this, the SPEI, SOIL, and SPI present the mean durations of 2.9, 2.8, and 2.3 years, respectively. The SPI shows more events than other indices but with shorter duration. All of these means are statistically different from each other, except the means between SPEI and SOIL, which are statistically similar (p value of 0.87). This difference in the duration of droughts among the indices is also evident in the control simulation.
The difference in the duration of droughts among indices can be explained by the water balance variables involved in the computation of each index. For instance, the SPI only takes precipitation as its input variable. Thus, it does not consider the atmospheric evaporative demands, which can be intensified during dry periods. Therefore, we expect that the SPI shows a reduced duration of droughts compared to the scPDSI and SPEI, which include the potential evapotranspiration in their water balance. The same holds true for the SOIL index. Although the soil moisture in the model is closely connected to the hydrological cycle, reflecting the balance between the precipitation and actual evapotranspiration, the magnitude of actual evapotranspiration over the region is smaller than the potential evapotranspiration derived from the Thornthwaite method. Hence, the water balance involved in SOIL is affected in such a way that the drought duration is reduced compared to the scPDSI and SPEI. Lastly, droughts with a relatively long duration in the scPDSI are explained by the memory effect embedded in the calculation scheme of scPDSI (Palmer, 1965; Wells et al., 2004), which other indices that are obtained by being normalized with respect to certain statistical distribution families do not include. The scPDSI is an accumulating index; therefore, during the calculation process, the weighted value of preceding months is used to estimate the index for the current month, implying a persistence of the events. Hence, with the scPDSI, an intense yearly drought would likely induce a drought in the following year, and this effect can be exacerbated in the context of intense multi-year droughts.
Importantly, for the same indices, the distributions of the duration of droughts are statistically similar to the distributions in the control simulation at the 99 % confidence interval (Fig. 5a and b, and Table A1). This implies that the variability of droughts in the transient simulation is within the range given by the internal variability in the control simulation.
In terms of the timing of the occurrence of droughts over the period of 850–1849 CE (Fig. 5d), coherent changes among all indices are not identified, which is expected due to the different input variables and calculation schemes among drought indices. This fact also indicates that each index responds differently to the changes in precipitation and temperature, and hence potential evapotranspiration, caused by the externally forced variability, e.g., the volcanic forcing.
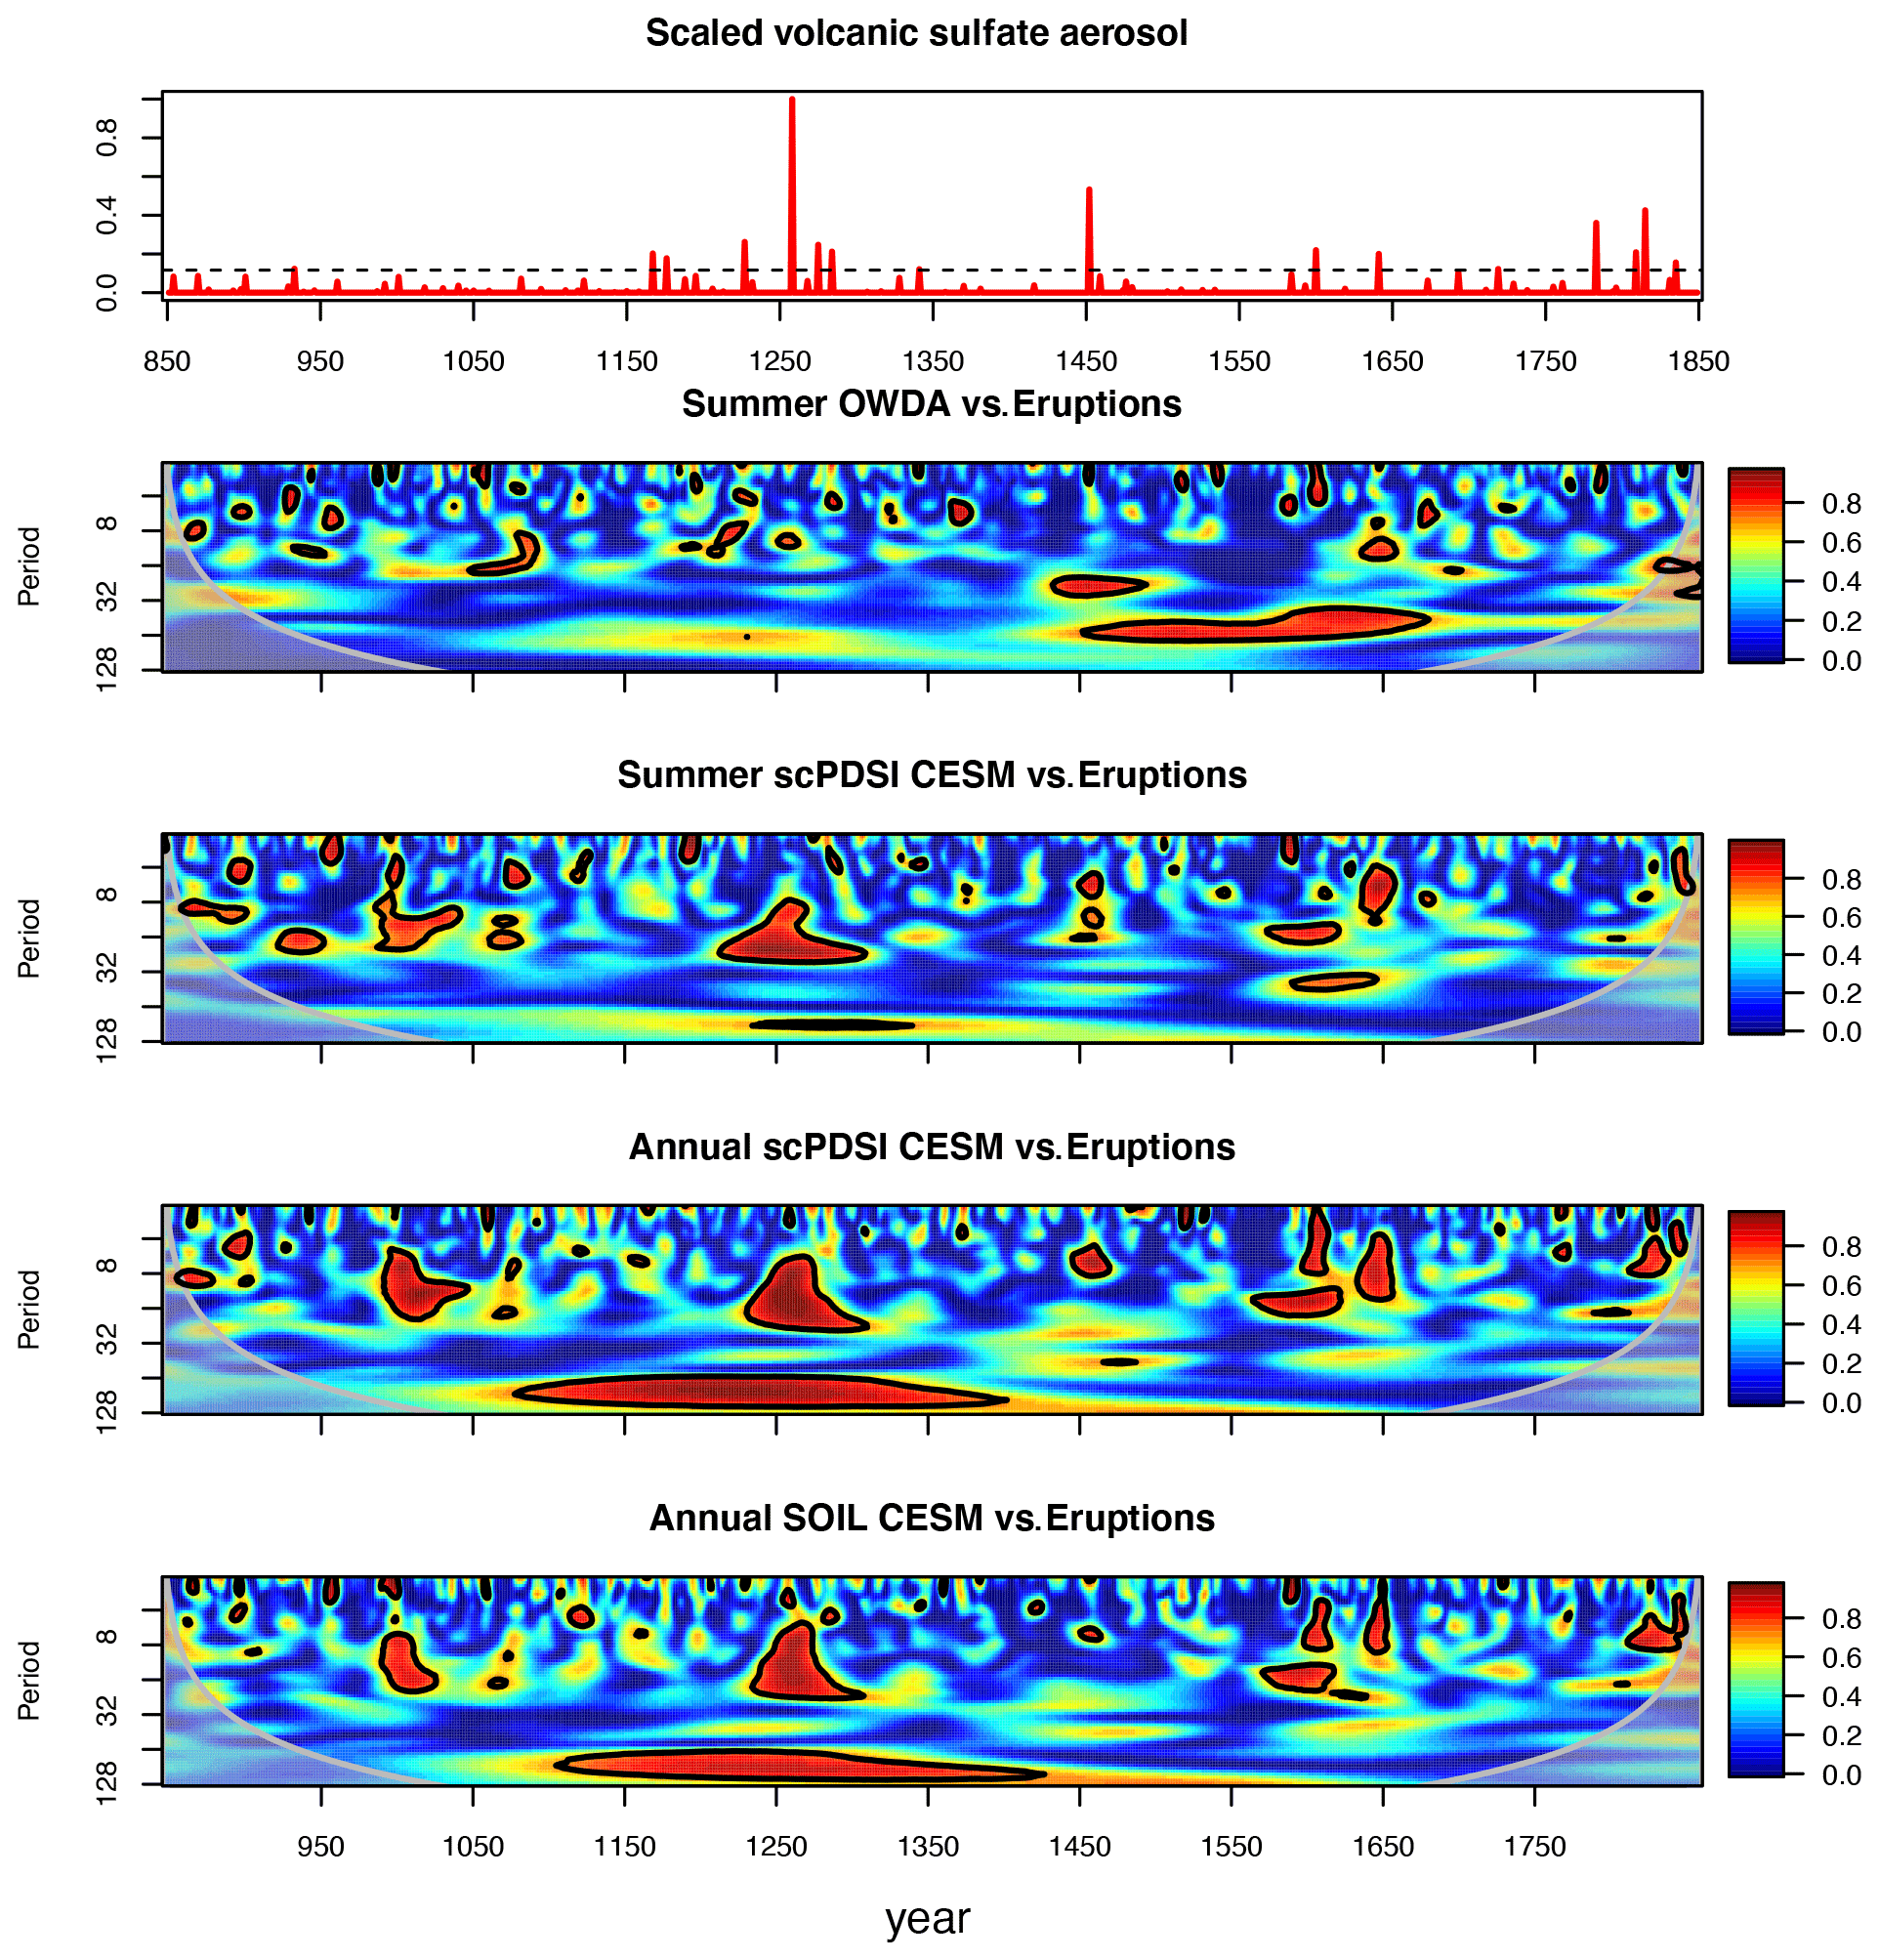
Figure 6Time series of scaled total stratospheric sulfate aerosol injections for the volcanic eruptions in 850–1849 CE (Gao et al., 2008) (top panel). The dashed black line indicates the threshold for large eruptions with a stratospheric sulfate aerosol loading of more than 30 Tg. Wavelet coherence analysis between the time series of volcanic eruptions and the drought indices (lower panels). The red shaded regions are where the coherences of two time series are statistically significant at the 95 % confidence level, as estimated from Monte Carlo resampling of the time series.
To further assess a potential connection between the drought indices and volcanic eruptions, a wavelet coherence analysis is applied (Fig. 6). The analysis shows that significant co-variability between the simulated drought indices (SOIL and scPDSI) and eruptions are found during periods with strong and frequent volcanic eruptions, for instance, around the 1257 Samala and 1600 Huaynaputina eruptions. For small eruptions, the signals of co-variability are not uniform among the eruptions, with some showing significant co-variability while others do not. In addition, the phase relationships between the eruptions and the drought indices also vary among the eruptions (not shown). This non-uniformity of co-variability between the small eruptions and the drought indices is a strong indication that no physical connection between them exists, i.e., the significant co-variability is merely due to statistical artifacts. OWDA does not show a strong significant co-variability during the 1257 Samala eruption, which was the strongest eruption in the last millennium (Gao et al., 2008). Still, OWDA shows, similar to CESM, a significant co-variability during the period of the Little Ice Age (around 1400–1600 CE).
The wavelet coherence analysis is clearly useful to distinguish the effects of strong and small eruptions on the variability of drought indices. However, the analysis poses some problems in handling discontinuous time series with a sporadic occurrence of the events, such as the volcanic eruptions. Filtering certain frequency bands from this kind of discontinuous time series smears out the effects of eruptions (i.e., an eruption starts earlier and lasts longer than in reality), adding some non-physical artifacts in the time series. Some of these are also reflected in Fig. 6, showing that the significant co-variability occurs earlier than the actual eruption years.

Figure 7Superposed epoch analysis between the yearly drought indices in CESM (summer scPDSI, annual scPDSI, and SOIL) and years of eruptions for (a–c) the 16 largest eruptions and (d–f) the 16 smallest eruptions. The upward-pointing bars indicate the positive changes and downward-pointing bars show the negative changes before and after the eruptions. Continuous lines indicate the 99 % confidence interval and dashed lines the 95 % confidence interval from the bootstrap resampling of the time series. The list of the eruptions used for the analysis is in Table A2.
Hence, for a more detailed analysis on causal effects of volcanic eruptions on drought variability, the superposed epoch analysis is applied to the 16 largest eruptions and the 16 smallest eruptions (Fig. 7; for the list of the eruption years, see Table A2). The analysis shows that the increases in drought indices follow large eruptions, and this positive association lasts up to 3 years in CESM. On the other hand, no significant response of drought indices to small eruptions is noted. This finding is in line with Rao et al. (2017) and McConnell et al. (2020), who demonstrated wetter conditions in the Mediterranean region after strong eruptions. Thus, the analysis shows that large eruptions are associated with increases in drought indices, i.e., wet periods. In other words, the occurrence of yearly and multi-year Mediterranean droughts are not driven by the volcanic eruptions but instead by the internal variability.
In the next sections, we investigate the underlying dynamics using only the SOIL data as a drought indicator in order to understand the role of the internal variability in Mediterranean droughts. We use SOIL as it reflects the regional hydrological balance associated with the precipitation and evapotranspiration. Another advantage of this index is that the variable is a direct output from the model; thus, it does not require any further steps (except for calculating the anomalies) or statistical assumptions as other indices do. In addition, SOIL overlaps full or a partial drought periods given by the other three indices without significantly underestimating the multi-year duration of droughts. The droughts in SOIL overlap 36 %, 25 %, and 29 % of the droughts in scPDSI, SPEI, and SPI, respectively. In addition, SOIL and each of the other indices are statistically correlated at 1 % confidence level for the entire period of 850–1849 CE with Pearson correlation coefficients of 0.81 (thus, 66 % of variance) with scPDSI, 0.78 (0.61 %) with SPEI, and 0.86 (74 %) with SPI. Hence, the results in the following sections can be partially transferred to the other indices. To guarantee the transferability, the analysis in the next sections was repeated with each of the drought indices, showing similar results as for SOIL (therefore, these figures are not shown).
3.3 Atmospheric circulation associated with Mediterranean droughts (850–1849 CE)
In this section, the atmospheric circulation associated with Mediterranean droughts is investigated by using SOIL in the control and transient simulations up to 1849 CE. The control simulation presents 7.25 droughts per century with a mean duration of 3.06 years, and the transient simulation shows 8 droughts per century with a mean duration of 2.81 years.
Figure 8(a) Mean geopotential height anomaly at 850 hPa and (b) mean surface temperature anomaly for the control (left) and transient (right) simulations during Mediterranean droughts in 850–1849 CE. Black dots on the composites of the transient simulation indicate the regions where the distributions between the control and transient simulations are statistically different from each other at the 5 % confidence level according to the Mann–Whitney U tests.
To get a first glance of the atmospheric circulation during drought conditions, we analyze the mean circulation conditions during all short (1-year and 2-year duration) and long (more than 3-year duration) Mediterranean droughts together. Figure 8 shows the anomalies of geopotential height at 850 hPa and surface temperature during Mediterranean droughts for each simulation. The structures of geopotential height and temperature anomalies during Mediterranean droughts are similar, with a high-pressure system centered over central Europe accompanied by a positive temperature anomaly. This high-pressure anomaly, which from now on is called the drought high, is found in all heights from 850 to 300 hPa (figures not shown), indicating a barotropic nature of this atmospheric circulation system. Additionally, a low-pressure anomaly is situated over the area of Scandinavia to Russia. Thus, the atmospheric circulation shows a northeasterly shift of the westerlies over Europe, and thus moist air masses from the North Atlantic are passed around the Mediterranean.
Outside the European continent, a negative temperature anomaly over the tropical equatorial Pacific and a positive anomaly over the North Pacific are prominent in both simulations. These temperature patterns resemble the cold phase of the ENSO and the positive phase of the Pacific Decadal Oscillation (PDO), respectively. Besides, a positive geopotential height anomaly at the midlatitudes and a negative anomaly at the high latitudes over the North Atlantic region is another pattern that both simulations share in common during droughts. This pattern is similar to the positive phase of the NAO; however, the southerly center of action is shifted to central Europe, which also partially resembles the East Atlantic Pattern (EA). The distributions of these common patterns are also statistically similar between both simulations, indicating that they are derived from the same statistical population. Thus, the simulations share common mechanisms associated with droughts, mainly driven by the internal variability of the climate system in the model. This reaffirms the result in the previous section.
Some statistically significant dissimilarities between the control and transient simulations are noticeable mostly in the temperature anomalies. Over the regions where the temperature anomalies are statistically different, the anomalies are rather weak, except the warming in Siberia. However, this positive temperature anomaly in Siberia is not associated with a geopotential height pattern, showing statistically indistinguishable geopotential height anomalies in the region between the control and transient simulations (Fig. 8). This indicates that there is no change in the circulation pattern over this region that can possibly be connected to the Mediterranean drought condition.
Figure 9Mean geopotential height anomaly at 850 hPa (color shaded) and surface temperature anomaly (contours every 0.2 ∘C; positive in red and negative in blue) during Mediterranean droughts for each season in the transient simulation.
The drought high is a clear feature that appears during all droughts over the region. This pattern over central Europe and the western Mediterranean is similar to the pattern of the first mode of canonical correlation described by Xoplaki et al. (2003). In Xoplaki et al. (2003), this pattern is associated with the variability of temperature during the summertime in the Mediterranean region. In this study, the high-pressure system is present during all seasons of years with droughts, showing a relatively stronger intensity in winter and spring than in summer (Fig. 9). This is expected, as the variability of the geopotential height fields over Europe and the North Atlantic is reduced in summer compared to the other seasons because the meridional temperature gradient on the Northern Hemisphere is also reduced. Therefore, the main forcing of the atmospheric circulation is weakened. The findings show that the atmospheric conditions in wet seasons, i.e., winter and spring, are determinant in controlling the annual mean hydroclimate, indicating the importance of precipitation and dynamics during the wet season in annual-scale Mediterranean droughts (Lionello et al., 2006; Xoplaki et al., 2004; Zveryaev, 2004).
As expected, a decrease in precipitation occurs in all seasons during droughts: the winter and spring precipitation decreases by 13 % and the summer and autumn precipitation decreases by 11 % compared to non-drought periods. These changes in precipitation are comparable to the rates of the expected decrease in annual precipitation over the Mediterranean region in the future scenario. In the future, the regional precipitation is expected to reduce by 5 %–30 % from its present-day value (Dubrovský et al., 2014; Mariotti et al., 2008). The temperature shows a positive anomaly over the region in all seasons, with the strongest signals during summer and autumn, a finding which is in line with Xoplaki et al. (2003). The positive temperature anomaly indicates that Mediterranean droughts are more associated with anomalously warmer atmospheric conditions.
3.4 Dynamics of multi-year droughts
For the analysis on multi-year Mediterranean droughts, we focus on droughts with a minimum duration of 3 years. As shown in the previous section in Fig. 8, the drought high is a prominent atmospheric circulation pattern during Mediterranean droughts. The pattern resembles the positive NAO-like pattern, albeit with a shift to the northeast. At the same time, colder than normal conditions over the tropical equatorial Pacific are detected that are similar to La Niña-like conditions. Here, we investigate the origin and the evolution of Mediterranean long droughts associated with NAO, ENSO-like conditions, and drought highs using the transient simulation up to 1849 CE.
The phases of NAO and ENSO are defined with respect to the non-drought period: the values below the 25th (above 75th) percentile of NAO and ENSO during the non-droughts period are considered negative (positive) phases of NAO and ENSO, respectively (Fig. 10). The extreme NAO and ENSO are also defined in a similar way by taking the values below the 5th percentile for negative extremes and above the 5th percentile for positive extremes. Defining thresholds relative to the non-drought period facilitates the comparison between the two periods, showing whether (and how) these modes of variability during droughts differ from those during the opposite hydroclimate conditions. For simplicity, we call these relative negative and positive phases simply positive and negative NAO and ENSO without referring constantly to the fact that they are defined relative to the non-drought period.

Figure 10(a) Box plots of NAO and ENSO during multi-year Mediterranean droughts. Dashed red lines indicate the 25th and 75th percentiles of distributions of NAO and ENSO during non-drought periods that are taken as thresholds to discern relative negative or positive phases of NAO and ENSO. Dashed brown lines indicate the 5th and 95th percentiles of distributions that are taken as thresholds for extreme negative or positive NAO and ENSO. Black crosses represent the means of extreme positive NAO (values above the 95th percentile), and the means of extreme negative ENSO (values below the 5th percentile). (b) Frequencies of occurrence of positive and negative phases of NAO (left) and ENSO (right) in annual, winter, and each stage of droughts. Black crosses indicate the frequencies of occurrence of extreme positive NAO and extreme negative ENSO.
Considering all short and long droughts, the simulation shows that droughts occur more frequently during the positive phase of annual and winter NAO than during the non-drought period: 38 % of the drought years show the positive phase of annual NAO and 32 % for the winter, while the negative annual NAO occupies 16 % and 23 % in the winter. However, the positive NAO condition does not persist throughout the entire years of droughts. Rather, it fluctuates from the positive to negative phases during multi-year droughts. For the co-occurrence between droughts and phases of ENSO, we find that La Niña-like conditions are present in 37 % of total drought periods and El Niño-like conditions are present in 22 % of total drought periods. Similar to NAO, La Niña-like conditions do not persist throughout entire drought years.
The extreme positive NAO occurs slightly more frequently during droughts. In addition, the distributions of extreme positive NAO during droughts is statistically different from the distribution during the non-drought period at 5 % confidence level for both annual and winter NAO (p values from MW U test of 0.02 for annual and 0.002 for winter). However, for ENSO there is no statistically significant change in the distribution and frequency of extreme La Niña-like conditions during droughts.
To examine the behavior of the atmosphere during multi-year Mediterranean droughts, the frequency of modes of variability and mean composites of circulation during droughts are split into three stages: initiation, transition, and termination years (Sect. 2.3). The frequencies of occurrence of NAO and ENSO in each stage are presented in Fig. 10. The positive NAO occurs more frequently in the initiation years than in the transition and termination years of droughts. The positive NAO occupies 49 % of the initiation years. This shows that the occurrence of positive NAO almost doubles in the initiation years of droughts compared to the non-drought period (25 % of the occurrence of positive NAO). In the transition years, positive NAO decreases and finally falls to 29 % in the termination years. The frequency of extreme positive NAO also decreases over time. In the case of ENSO, the frequency of La Niña-like conditions is 40 % in the initiation years relative to the non-drought period. The occurrence of La Niña-like conditions increases slightly in the transition years, although this increase is not statistically significant with respect to the previous stage. Following this, it decreases to 20 % in the termination years. After the initiation years, there are increases in negative NAO and El Niño-like states. These changes in the frequencies of NAO and ENSO in each stage of droughts indicate a weakening role of large-scale circulation patterns at sustaining the persistence of droughts over time. As the intensities of droughts become more severe with their duration, some other factors need to be involved in sustaining the longevity of multi-year Mediterranean droughts from the transition to termination years.
Figure 11Evolution of atmospheric conditions in each stage of drought. Anomalies of (above) specific humidity and (below) temperature, both at 925 hPa during the initiation, transition, and termination years of droughts. Arrows indicate winds at 925 hPa.
The mean circulation and atmospheric conditions during the development of multi-year Mediterranean droughts are shown in Fig. 11 and are depicted by the specific humidity, temperature, and winds at 925 hPa level. In the initiation years, the southerly winds prevail over the southern Mediterranean region. These southerlies block the intrusion of the westerly systems from the North Atlantic, and together with the cyclonic winds in the East Atlantic distribute dry and warm air masses from the East Atlantic, southern Mediterranean, and West Africa to the continent. In the transition years, a complete anticyclonic circulation associated with the high over central Europe and the Mediterranean region is developed. This anticyclonic system distributes the dry and warm air to the north and west of the continent and sustains dry and warm conditions over the region. During these years, the westerlies from the North Atlantic are clearly weakened. In the termination years, the anticyclonic circulation over Europe is not observed anymore, indicating a break-up of the high.
The mean circulation in each stage shows that the development of the high-pressure system, namely the drought high in Fig. 8, takes place in the transition years. This indicates that some mechanisms associated with this circulation are possibly important in determining the longevity of droughts after the initiation years. A possible candidate for an important process for the transition stage of Mediterranean droughts is the interaction among regional atmospheric and soil variables initiated by the anticyclonic circulation system over the region.
The presence of the atmosphere–soil interaction during the transition years is supported by the increases in frequencies of positive surface temperature (TS) and sensible heat flux (SH) and negative soil moisture (SOIL), evapotranspiration (EV), and latent heat flux (LH) anomalies during this period (Fig. 12). The mechanism associated with these regional atmospheric and soil variables is explained as follows: a decrease in precipitation supported by the positive NAO and/or La Niña-like conditions induce initial regional dryness and a stable atmospheric condition associated with the increase in geopotential high anomaly (GP) over the region. A positive GP induces an initial increase in the regional TS. This positive TS decreases SOIL and EV. The latter increases SH and decreases LH during the initiation year. During the transition years, the positive TS is even magnified due to the stable atmospheric condition that still persists (positive GP) and the increase in SH and loss of LH in the previous stage. TS in turn again increases SH, decreases EV and LH, and thus decreases SOIL. Over time, the complete high is developed and persists, again fueling this positive temperature–soil moisture feedback (Seneviratne et al., 2010; Yin et al., 2014). Thus, during the transition years, the means and occurrence of these variables associated with the feedback (positive TS, negative SOIL, negative EV, positive SH, negative LH) are clearly larger than their values during the initiation years (Fig. 12). This mechanism continues until the termination years. During the termination years, the positive GP and TS still prevail over the region, albeit with reduced anomalies. In addition, the magnitudes of other variables are reduced compared to the previous stage.
Figure 12The same boxplot as Fig. 10 but for standardized regional atmospheric and soil variables over the region of study during Mediterranean droughts: anomalies of geopotential height at 850 hPa (GP), surface temperature (TS), soil moisture (SOIL), sensible heat flux (SH), latent heat flux (LH), and evapotranspiration (EV). (b) Frequencies of occurrences of positive and negative anomalies in each stage of droughts in order: initiation, transition, and termination years.
This result indicates that once the drought high is developed, the temperature–soil moisture feedback is a more important mechanism than the connection to NAO and La Niña-like patterns in order to sustain the continuous depletion of soil moisture. This means that although the large-scale circulation patterns help to support the regional dry conditions, after the initiation years their roles in sustaining droughts are diminished.
3.5 Historical and future condition on droughts: 1850 to 2099 CE
Here, the behavior of Mediterranean droughts and the associated mechanisms for the period 1850–2099 CE are presented. For an overview, the time series of the soil and precipitation anomalies (with respect to 1000–1849 CE) over the Mediterranean region for the period 1850–2099 CE are shown in Fig. 13. The simulation indicates that the region becomes drier in this period than in the past, showing pronounced decreases in soil moisture and precipitation. The reduction in these two variables is already apparent from the beginning of 1850 CE, concomitant with the anthropogenic increase in GHG. By the end of the 21st century, the region experiences a continuous drought without any wet anomaly with respect to the 1000–1849 CE conditions. This indicates a shift of the mean climate of the region to a drier climate, and this transition has been initiated since the pre-industrial period and intensified under the RCP 8.5 scenario.
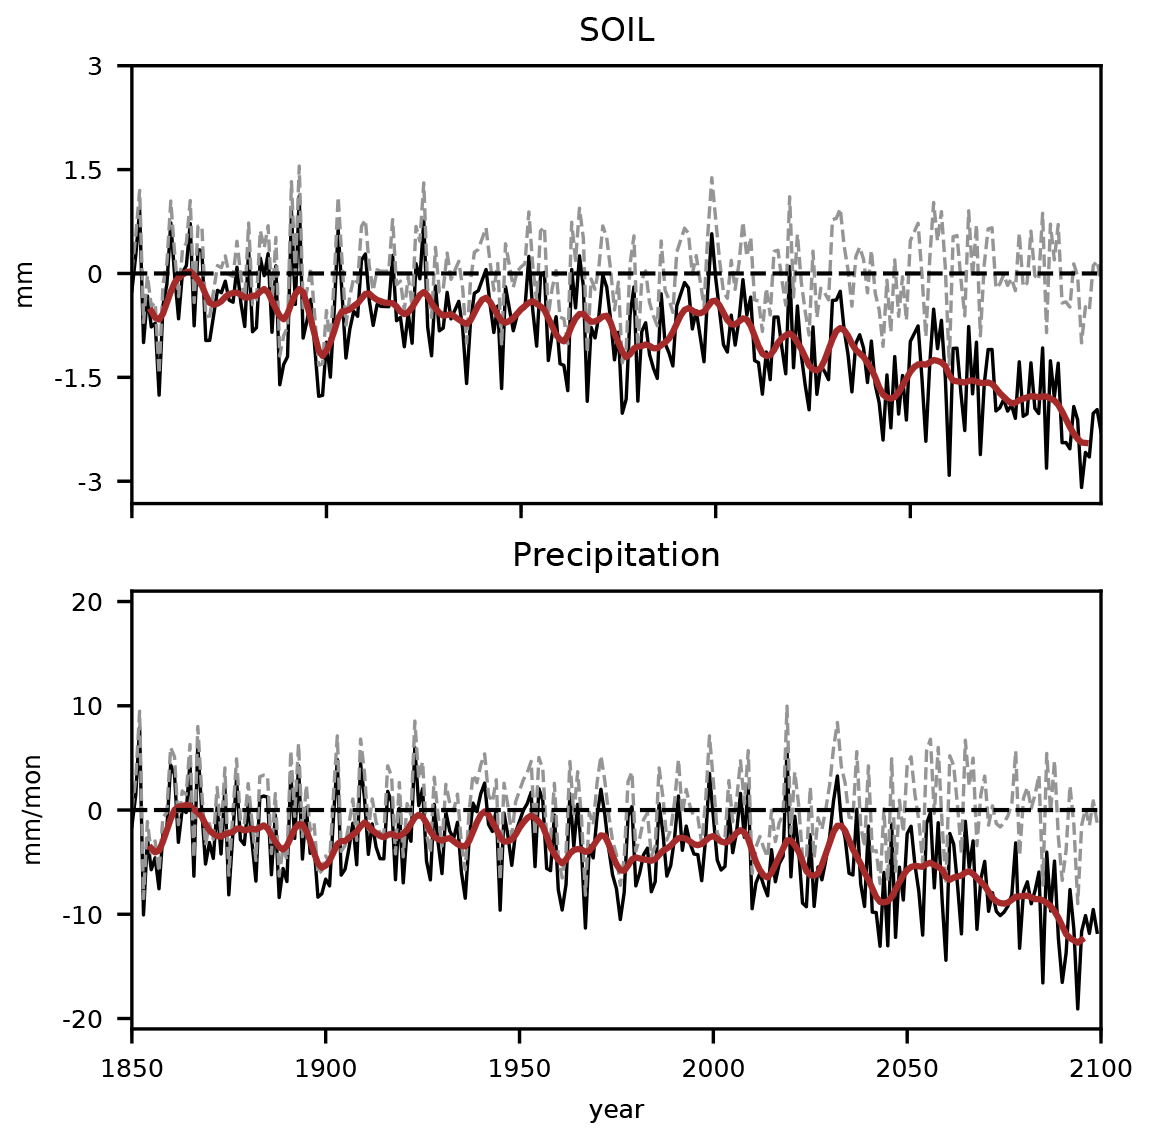
Figure 13Time series of annual soil moisture (SOIL) and precipitation anomalies from 1850 to 2099 CE with respect to the 1000–1849 CE means. Brown lines indicate a 10-year running means, and dashed lines indicate the detrended time series. The values of the removed trends are presented in Fig. A1.
We examine whether the mechanisms associated with Mediterranean droughts described in the previous section are affected by the anthropogenic influences on climate and whether these changes contribute to the intensification of droughts and eventual aridification in the region occurring in this period. For this, the detrending method is applied to the simulation following the steps mentioned in the Sect. 2.2. First, we analyze the non-detrended drought-related variables with the anthropogenic influences on them and then analyze the detrended variables to see the background climate during droughts when excluding the linear trends.
As for the period 850–1849 CE, droughts during the period 1850–2099 CE are associated with the intense positive geopotential height and temperature anomalies over central Europe and the Mediterranean. However, these features show more intense amplitudes in geopotential height (GP) and temperature (TS) anomalies than during the period 850–1849 CE (Fig. 14a). The variances of GP, TS, and SOIL are also enlarged compared to the past; therefore, their medians and extreme tails are also magnified, which implies that the dryness and its associated atmospheric conditions becomes more frequent and severe in 1850–2099 CE. The increases in GP and TS clearly intensify the above-mentioned interaction among regional atmospheric and soil variables, i.e., the positive temperature–soil moisture feedback. This intensification aids the longevity and intensity of droughts, which is reflected by a reduction in the surface soil moisture anomaly (Fig. 13). Additionally, the precipitation–soil moisture feedback is also involved: a continuous reduction in precipitation decreases the available soil moisture, inducing less evapotranspiration, which again leads to a reduction in precipitation (Seneviratne et al., 2010).
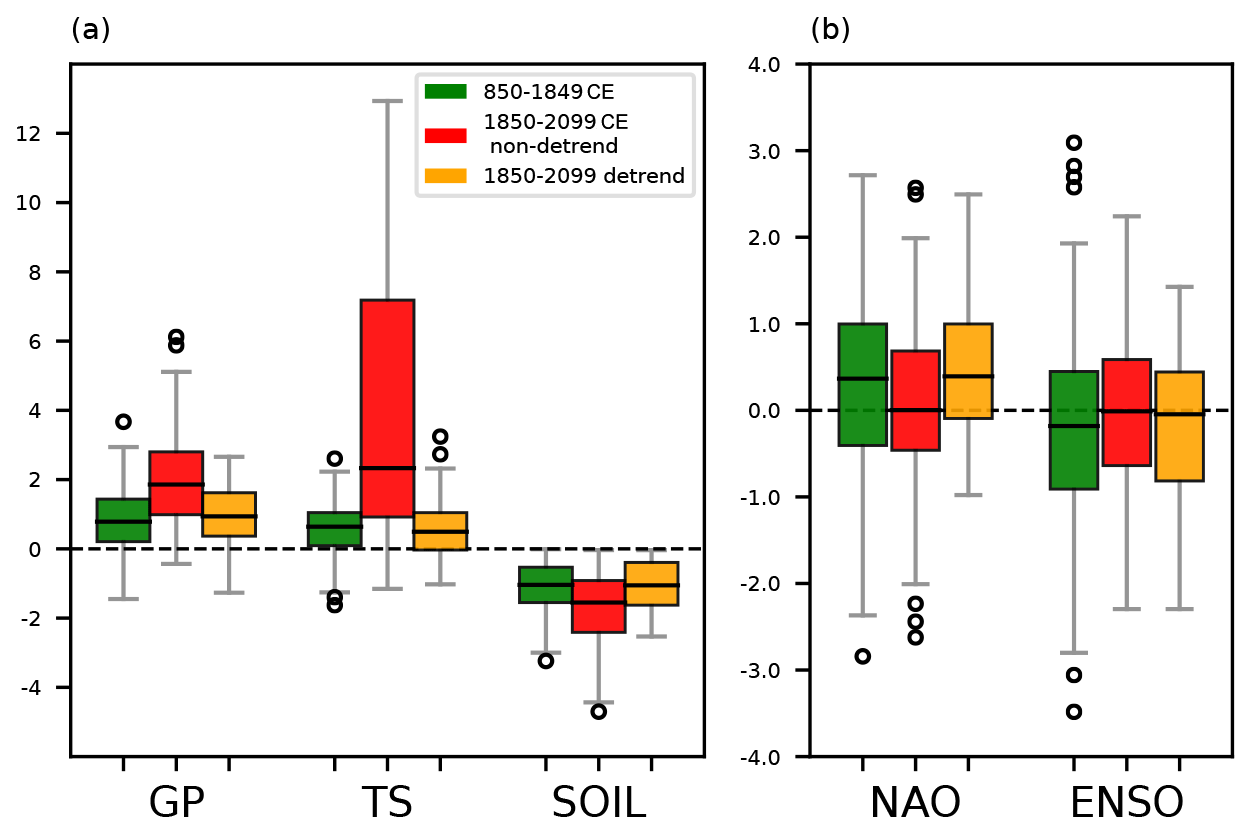
Figure 14(a) Standardized regional variables: anomalies of geopotential height at 850 hPa (GP), surface temperature (TS), and soil moisture (SOIL) over the region of study. (b) Indices of large-scale circulation patterns: NAO and ENSO during Mediterranean droughts for the period of 850–1849 CE (green), non-detrended 1850–2099 CE (red), and detrended 1850–2099 CE (yellow). The GP, TS, and SOIL between the detrended 1850–2099 CE and the 850–1849 CE periods present p values from the Mann–Whitney U tests of 0.09, 0.02, and 0.29, respectively. For NAO and ENSO, the p values between these two periods are 0.19 and 0.29, respectively.
Related to the modes of variability, the frequencies of positive NAO and La Niña-like conditions during droughts also seem to be affected by the overall change in global temperature (Fig. 14b). Compared to 850–1849 CE, the non-detrended 1850–2099 CE period shows reduced frequencies of both positive NAO and La Niña-like conditions during droughts. This result is in line with the previously mentioned intensification of land–atmosphere feedbacks: in this situation where the GP and TS become intense, the regional atmospheric variables play a more dominant role in Mediterranean droughts and the importance of modes of variability is reduced, even during the initial stages of droughts. Hence, the role of positive NAO and La Niña-like conditions in different stages of droughts is diminished. However, the model biases in representing large-scale modes of variability, in particular ENSO, might be relevant. Many CMIP5 models have problems with realistically reproducing the cold SST in the eastern tropical Pacific. Therefore, these models would show fewer La Niña events in future warmer conditions (Seager et al., 2019). An overall increase in El Niño-like conditions here (Fig. 14b) can also be partially related to this bias. Nevertheless, considering this bias does not affect the result that the interaction among the regional variables is changed by the increase in temperature, causing more intensified regional land–atmosphere feedbacks during this period.
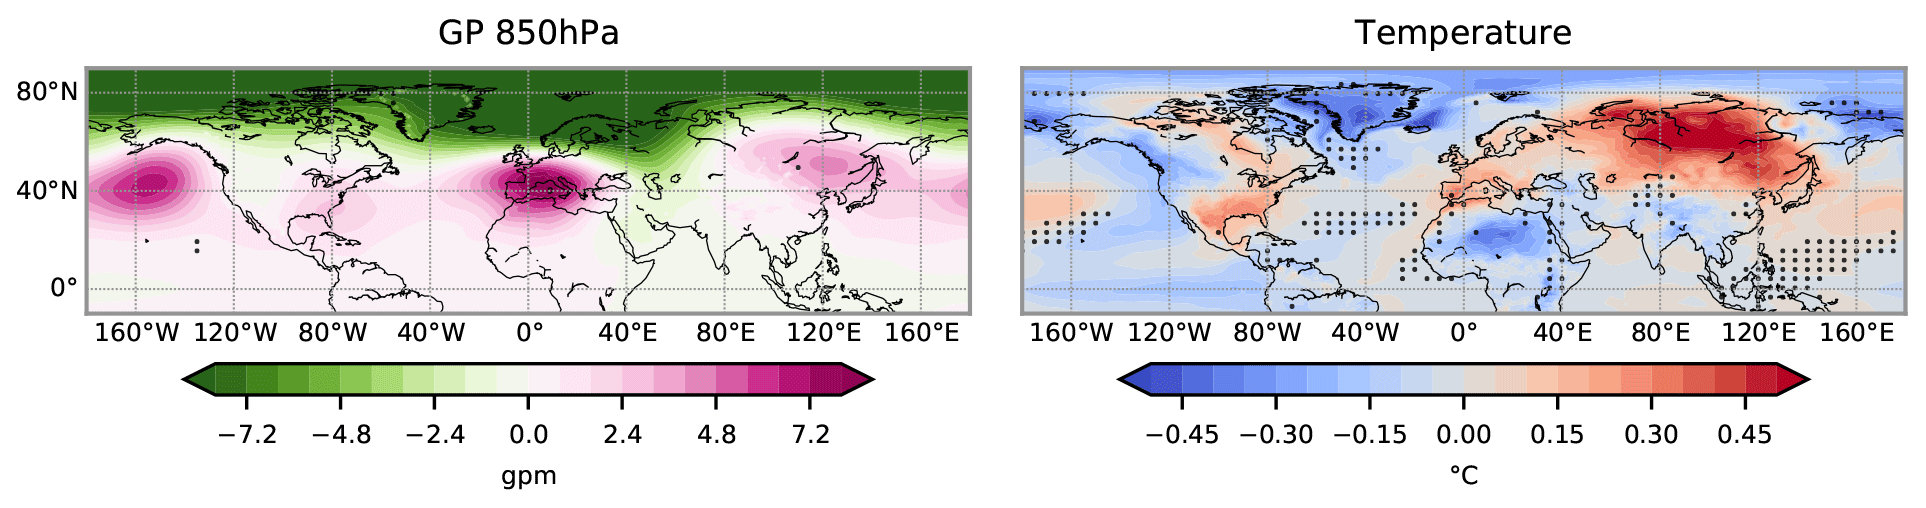
Figure 15Detrended mean geopotential height anomaly at 850 hPa and surface temperature anomaly during Mediterranean droughts for the 1850–2099 CE. Black dots indicate the regions where the distributions between the detrended 1850–2099 CE and 850–1849 CE are statistically different at the 5 % confidence level (Fig. 8) from the Mann–Whitney U tests.
For the detrended variables, the GP anomalies and SOIL during droughts of the period 1850–2099 CE are statistically similar to the ones in the period 850–1849 CE (p-value of 0.09 for GP and 0.44 for SOIL). The same is also true for the NAO and ENSO during droughts (p values of 0.19 and 0.29 for each). The detrended TS over the region is statistically similar to the 850–1849 CE value but only at the 2 % confidence level (p value of 0.02). This indicates that the detrending method is not able to fully remove the strong effects of anthropogenic changes on temperature in future droughts. Nevertheless, the mean spatial composites of the detrended surface temperature and geopotential height at 850 hPa during Mediterranean droughts in the period 1850–2099 (Fig. 15) statistically agree with the ones in 850–1849 CE period (Fig. 7) over a large portion of the Mediterranean region.
Hence, when the anthropogenic effect is removed (i.e., the variables are detrended), the mechanisms involved in droughts remain unchanged during 1850–2099 CE. The comparison of non-detrended variables with detrended variables thus indicates that no factor other than the anthropogenic influence in temperature is the cause of the severe dryness in this period. In the future scenario, the intensities of both land–atmosphere feedbacks are magnified due to the increases in GP and TS caused by the increases in GHG, and these feedbacks become dominant in controlling the desiccation over the region.
We have investigated the variability and mechanisms of multi-year droughts over the western and central Mediterranean region with pan-regional characteristics for the period of 850–1849 CE and whether these mechanisms associated with Mediterranean droughts have changed after the pre-industrial period from 1850 to 2099 CE with the anthropogenic increase in GHG. For this we used simulations from CESM (Lehner et al., 2015).
Firstly, the quantification of droughts is sensitive to the choice of drought index even in the paleoclimate context. For example, the scPDSI exhibits drought events with longer duration than other indices, such as SPEI, SPI, and soil moisture anomalies. Although the major mechanisms that induce multi-year droughts over the region remain similar due to the same overlapping periods and statistically significant correlations among indices, this discrepancy among indices can lead to different conclusions, mostly in the number and duration of past drought events. This shows that using just one unique index is still complicated, even in the paleoclimate context. Hence, the uncertainty associated with different indices must be taken into account when comparing indices in drought studies (Dai, 2011; Raible et al., 2017; Mukherjee et al., 2018), particularly in cases where only a single drought index is used and the focus is on the assessment of the duration of extreme hydrological events in past periods.
Secondly, we found that past Mediterranean droughts were mainly induced by the internal dynamics of climate system, supporting the finding of Xoplaki et al. (2018). The duration of droughts and the patterns of surface temperature and circulation over the Mediterranean during droughts in the control simulation are statistically similar to those in the transient simulation with external forcing. Moreover, a causal connection between volcanic eruptions and Mediterranean dry conditions is not identified. However, our result indicates a connection between large volcanic eruptions and wet periods over the region, supporting the findings of previous studies (McConnell et al., 2020; Rao et al., 2017). A distinct atmospheric pattern occurring during Mediterranean droughts is a barotropic high-pressure system accompanied by a positive temperature anomaly over central Europe and the Mediterranean region. This warm high persists during all seasons when droughts occur in the region, showing stronger intensity during winter and spring. This result emphasizes the importance of the wet cold seasons, i.e., winter and spring climate and circulation in annual Mediterranean droughts. Additionally, the positive NAO and La Niña are other patterns that occur more frequently during Mediterranean droughts.
Thirdly, the mechanisms associated with sustaining multi-year droughts change through the stages of droughts. We found that the large-scale circulation patterns, such as the positive NAO and negative ENSO, play a more important role during the early stage of droughts by providing dry conditions over the western and central Mediterranean region that are required to initiate such events. Therefore, the longevity of droughts is determined by the interaction of regional circulation variables, which involve stable atmospheric conditions, an increase in temperature, and changes in evapotranspiration and surface heat fluxes. Namely, this is the temperature–soil moisture feedback, which continues until the termination of droughts. During these transition years of droughts, the role played by the large-scale patterns is reduced. Hence, the persistence and duration of multi-year droughts should not be fully attributed to the states of large-scale circulation patterns, such as NAO and ENSO, as the roles of regional feedback and circulations regarding droughts become as important as (or more important than) large-scale modes of variability after the initial development of droughts.
It is important to note that the inherent model biases in representing ENSO and NAO (Bellenger et al., 2014; Fasullo et al., 2020) can have some implications in our results on the frequencies of ENSO and NAO at different stages of droughts. The model may produce too frequent and strong La Niña conditions and positive NAO during droughts due to its amplified variability (decadal for ENSO and seasonal for NAO). Moreover, due to the uncertainty associated with the changes in these modes in the future scenario, caution is required when interpreting the connection between droughts and modes of variability in the future warming scenario. Many CMIP5 models show an overall warming of the tropical equatorial Pacific reducing the west–east gradient of SST, which is different from what is observed in the present period (Seager et al., 2019). This model bias to the observation implicates reduced La Niña conditions in CMIP5 models in a warmer world. Nonetheless, this problem does not affect our conclusion: the roles of ENSO and NAO become weaker with the longevity of droughts, while the regional circulation and feedback become more dominant at maintaining the persistence of droughts, which is also found in the future warming scenario.
Fourthly, the decreases in soil moisture and precipitation anomalies have already been detected since the pre-industrial period concomitantly with the anthropogenic increase in GHG. This means that the intensification of droughts and the shift of the mean climate over the region to a drier climate already started during the pre-industrial era. This regional desiccation is principally caused by the anthropogenic increase in GHG, which induces the intensification of interactions between the regional atmospheric and soil variables, associated with the temperature–soil moisture and precipitation–soil moisture feedbacks. If the increase in temperature and decrease in precipitation continue, the region will suffer from a continuous aridification instead of droughts, as droughts are the deviation from the mean hydrological condition.
Fifthly, it is important to mention that our analysis is based on a single-model output and that this raises questions related to single-model studies, such as boundary condition problems and model-dependent biases and physics (PAGES Hydro2k Consortium, 2017). Nevertheless, for a small confined area that surrounds a large body of water (the Mediterranean Sea) and where the land coverage is limited, a finer horizontal resolution is needed to represent the regional climate and the mesoscale processes that are involved more realistically. In the end, our study provides a useful understanding of the long-term variability and mechanisms of Mediterranean droughts by analyzing the entire last millennium. We addressed the influences of external and internal variability on Mediterranean droughts and the different roles of the large-scale modes of variability and regional circulation during the different stages of multi-year droughts.
Lastly, we emphasize again the importance of assessing different drought indices in the paleoclimate context and also in the present and future warming scenario. The reason is that most of the commonly used offline drought indices, such as scPDSI, are based on a water balance that only considers the atmospheric moisture supply and demand, and these indices tend to overestimate drought risks in the future warming scenario (Berg et al., 2017; Mukherjee et al., 2018; Swann et al., 2016). Moreover, Berg et al. (2017) found that the upper-level soil moisture indicates droughts, whereas the mean 3 m soil moisture shows wet or relatively weak dry conditions compared to the surface level. In our study, we used the upper 10 cm soil moisture anomaly that partially reflects the water stress on plants. However, the upper 10 cm of the soil is not enough to fully assess the complex atmosphere–soil–vegetation interaction and the variability in the deeper levels of the soil. In addition, the upper 10 cm soil moisture used here also magnifies drought risks to some extent, in a similar manner to other offline drought indices. Nevertheless, the Mediterranean is one of the regions where the depletion of soil moisture still occurs both at the surface and in the mean 3 m soil level, though the amplitude of the rate of decrease is reduced in the 3 m soil moisture compared to the rate in the surface soil moisture (Berg et al., 2017).
As a next step, more studies on drought metrics need to be conducted in order to assess the future drought risk in the region properly. In addition, as vegetation is known to have more complex responses to the changing climate and droughts (Swann, 2018; Swann et al., 2016), the role of vegetation in extreme hydrological events should be investigated to get a more comprehensive view of drought mechanisms and their changes in the future. The Mediterranean region is considered one of the most vulnerable regions under future warming scenarios (e.g., Giorgi and Lionello, 2008; Lehner et al., 2017), and human impacts can modify the natural mechanisms and propagation of droughts, increasing droughts risks and water shortage issues over the region (Van Loon et al., 2016). Hence, more studies on the topics related to droughts and permanent future aridification in the Mediterranean region, including the role of vegetation during this period, are necessary to develop a better preparedness for upcoming changes.
Table A1P values from the Mann–Whitney U tests between the drought indices in the control and transient simulations.
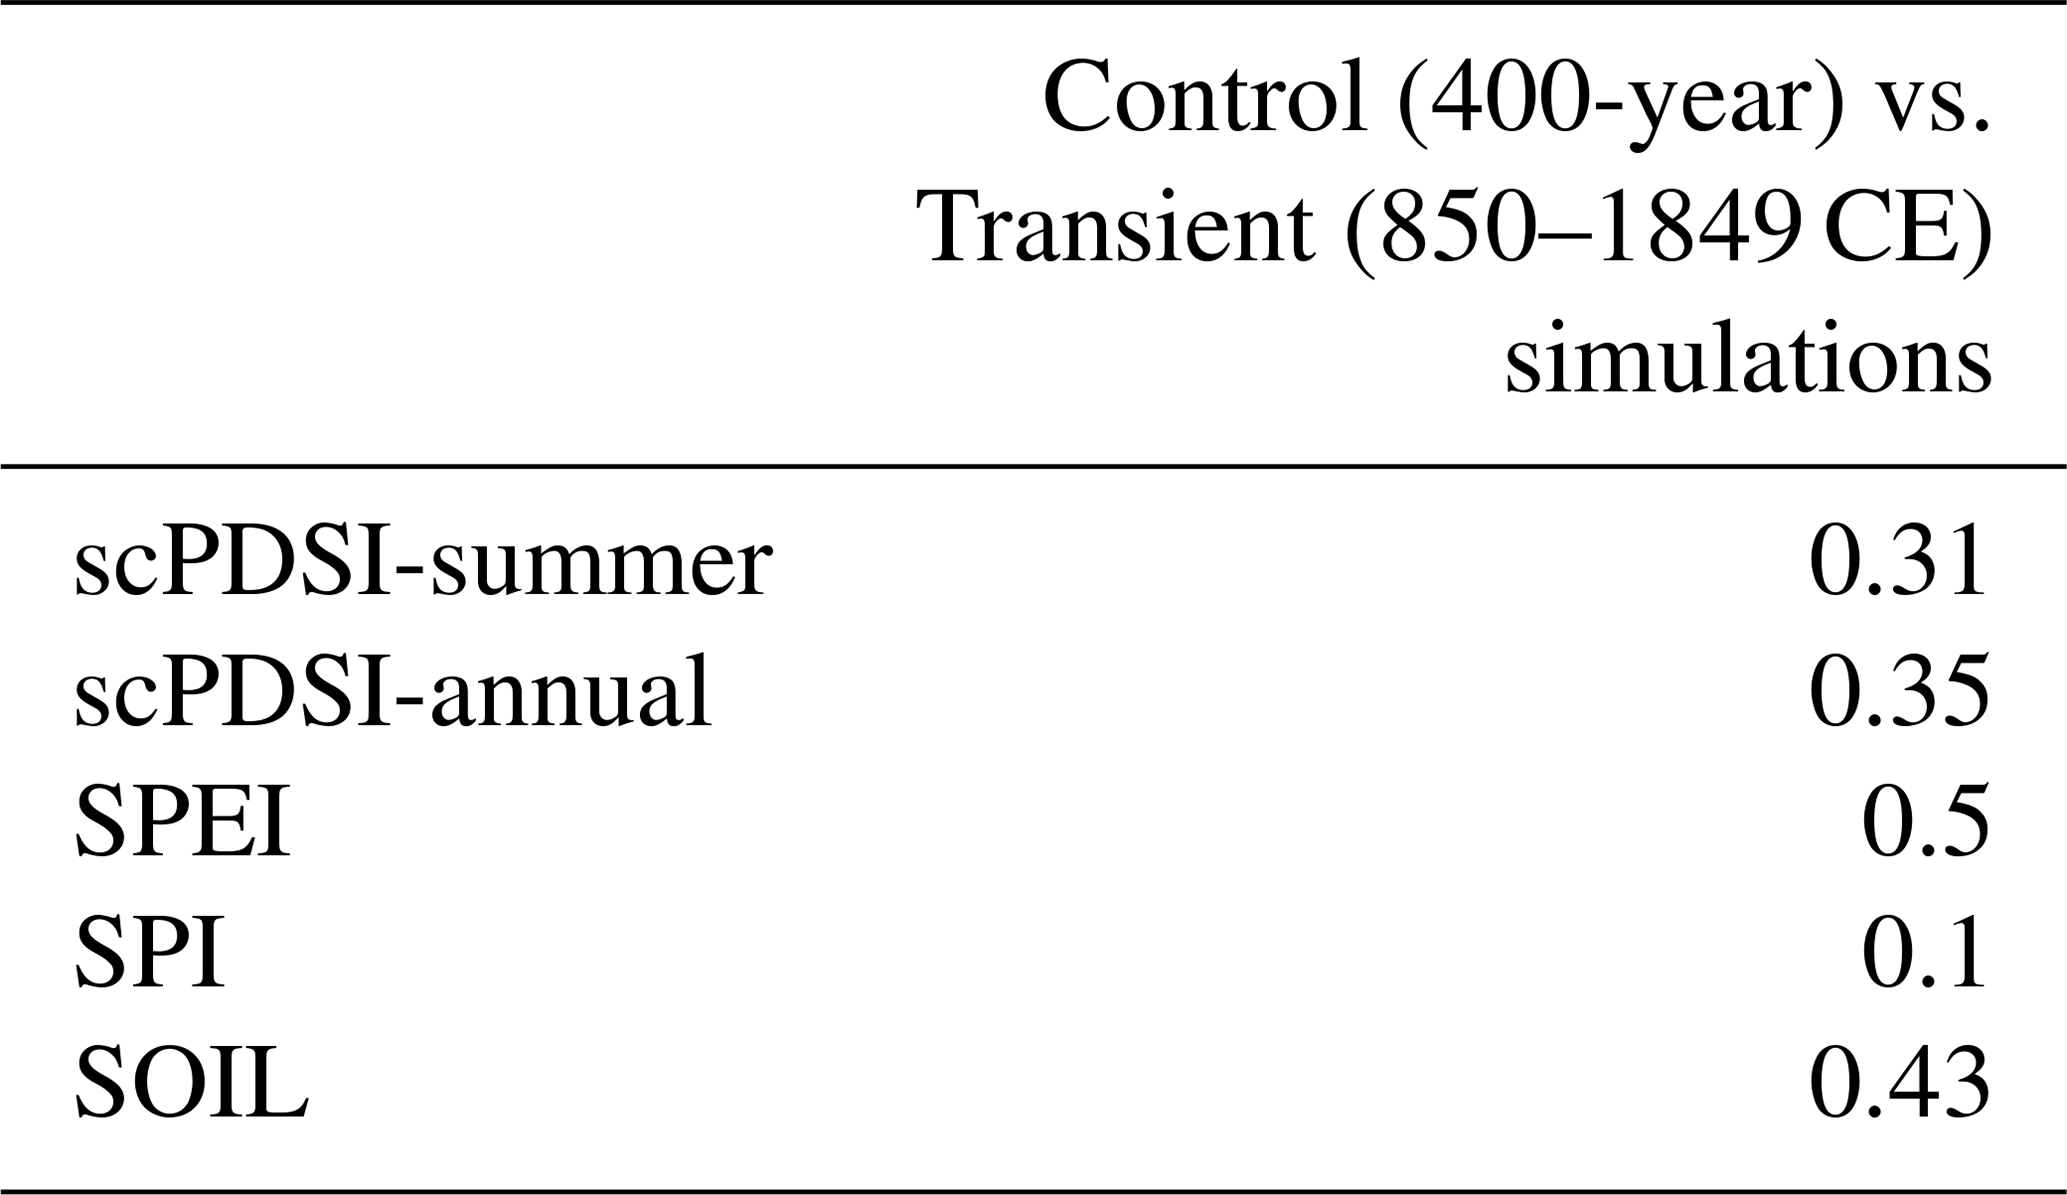
Table A2Years and total stratospheric sulfate aerosol injection of the 16 largest and 16 smallest volcanic eruptions in 850–1849 CE from Gao et al. (2008).
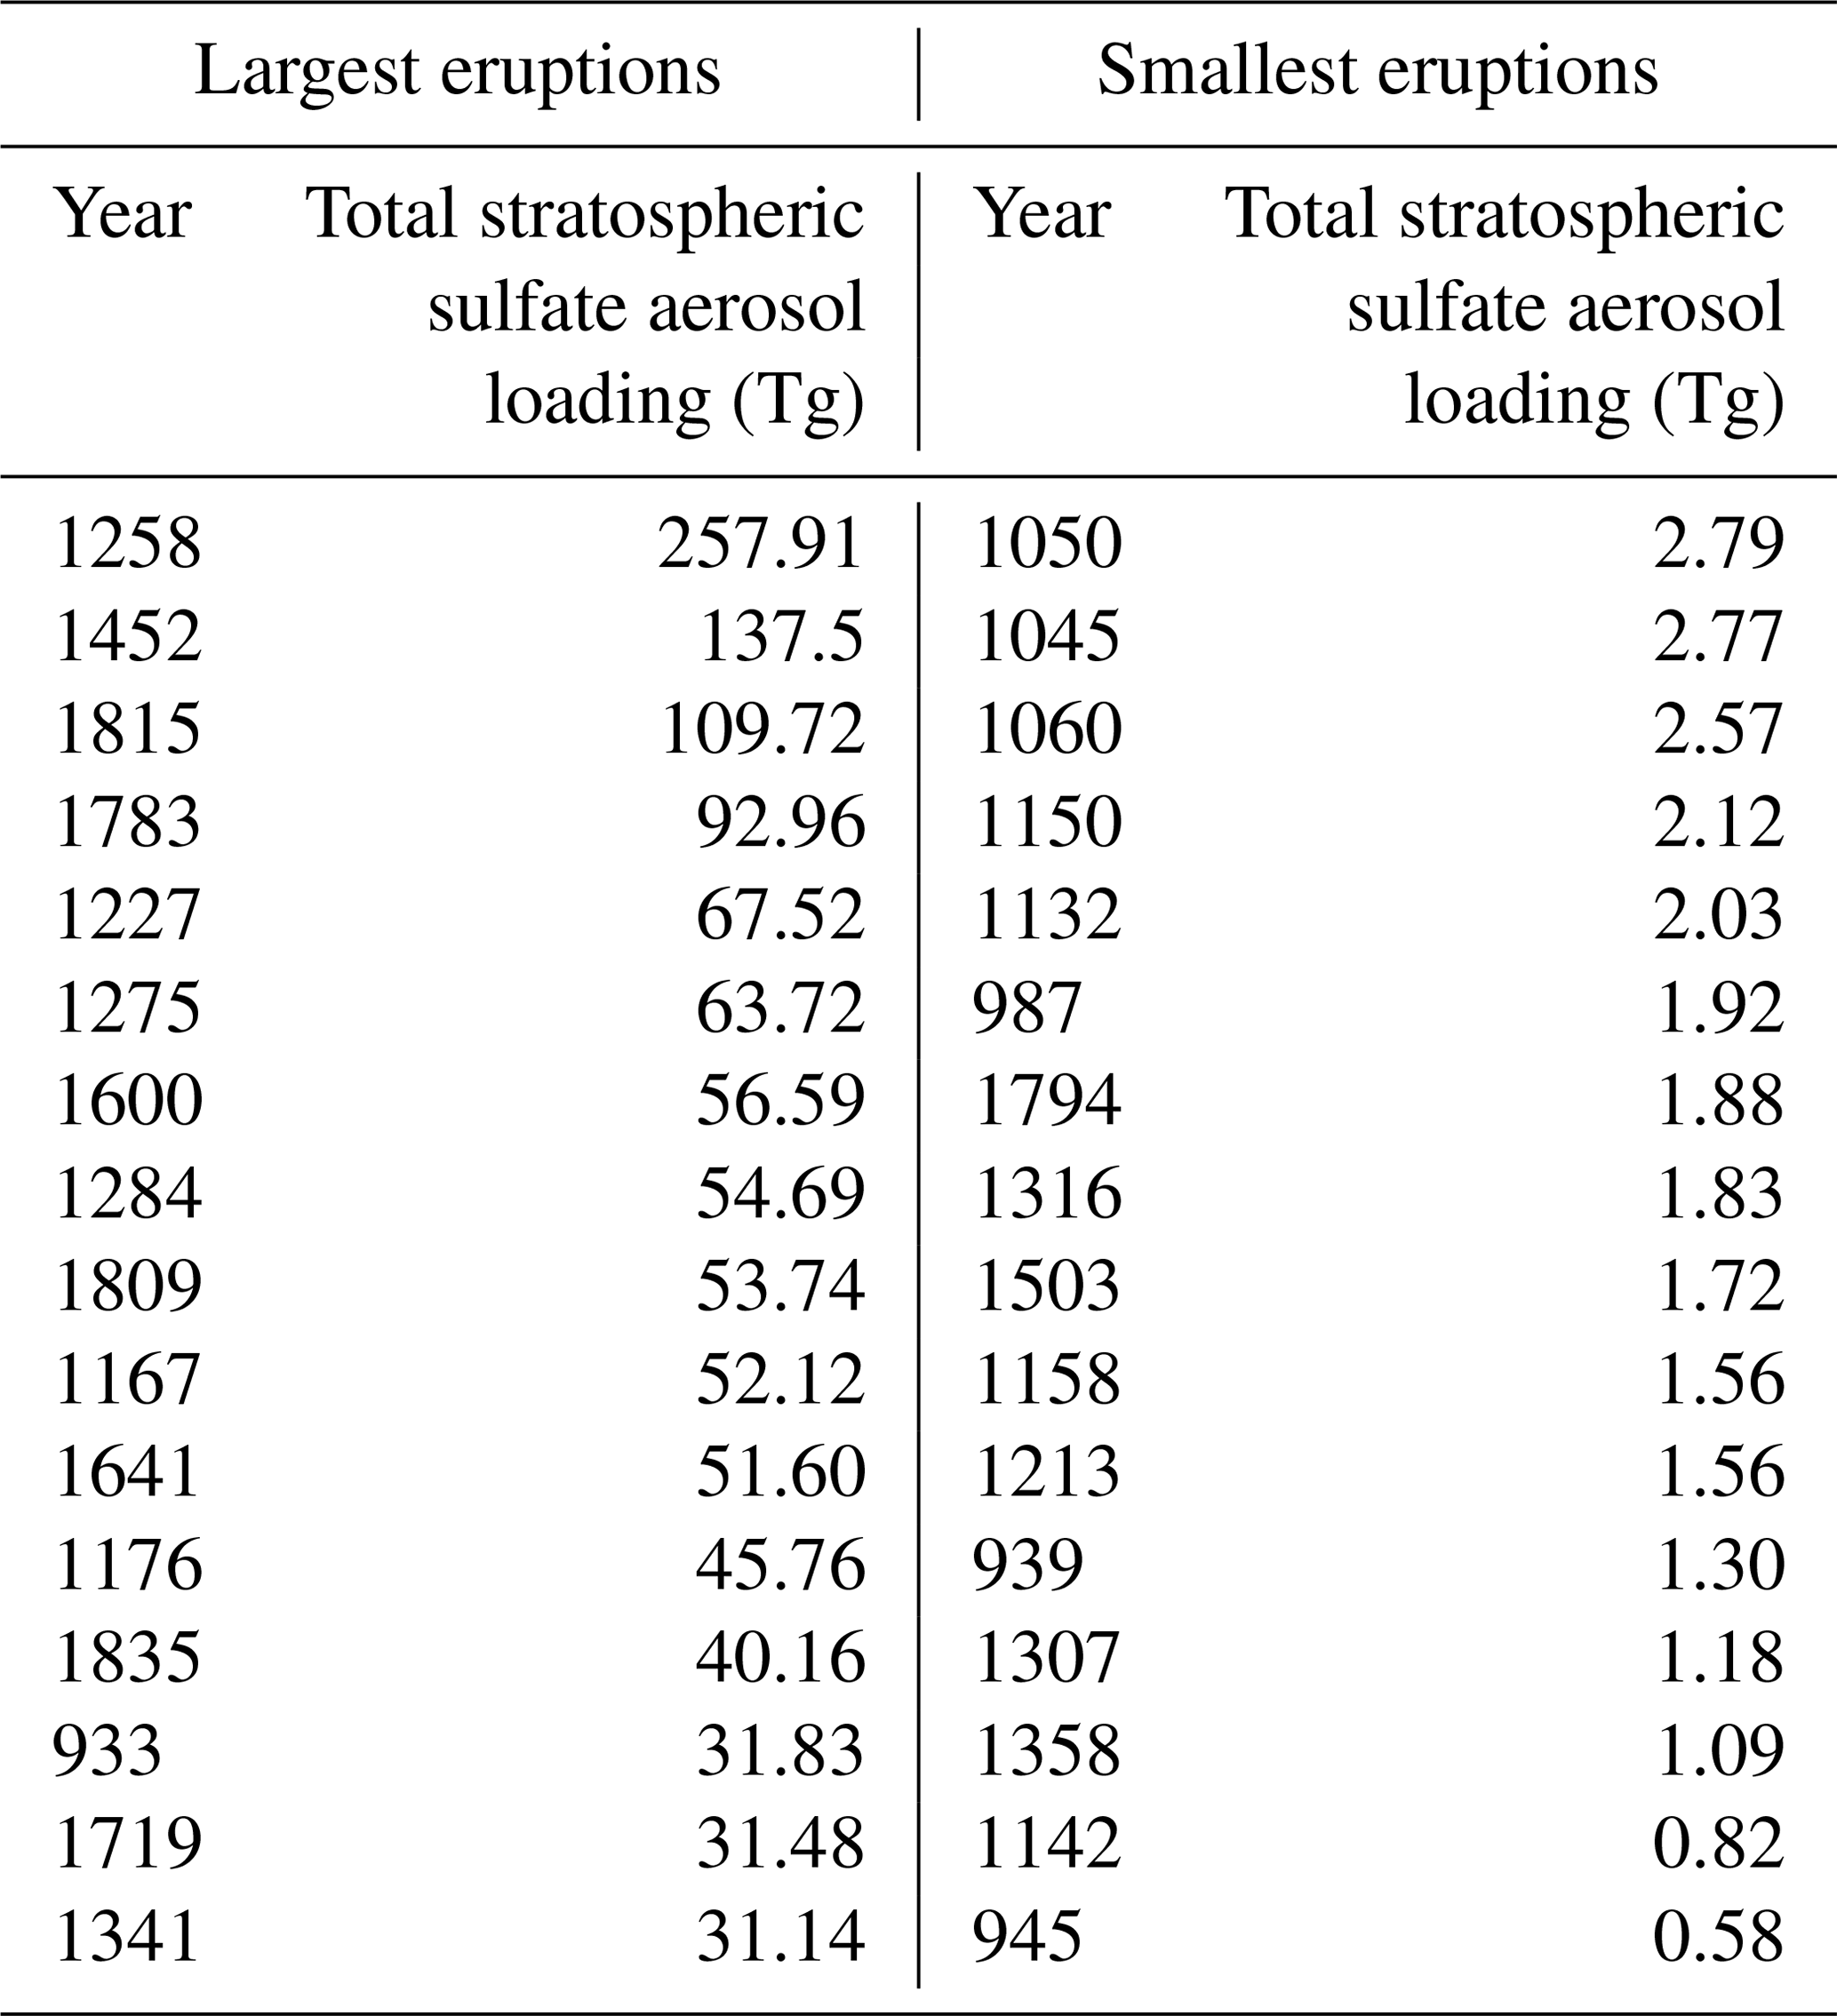
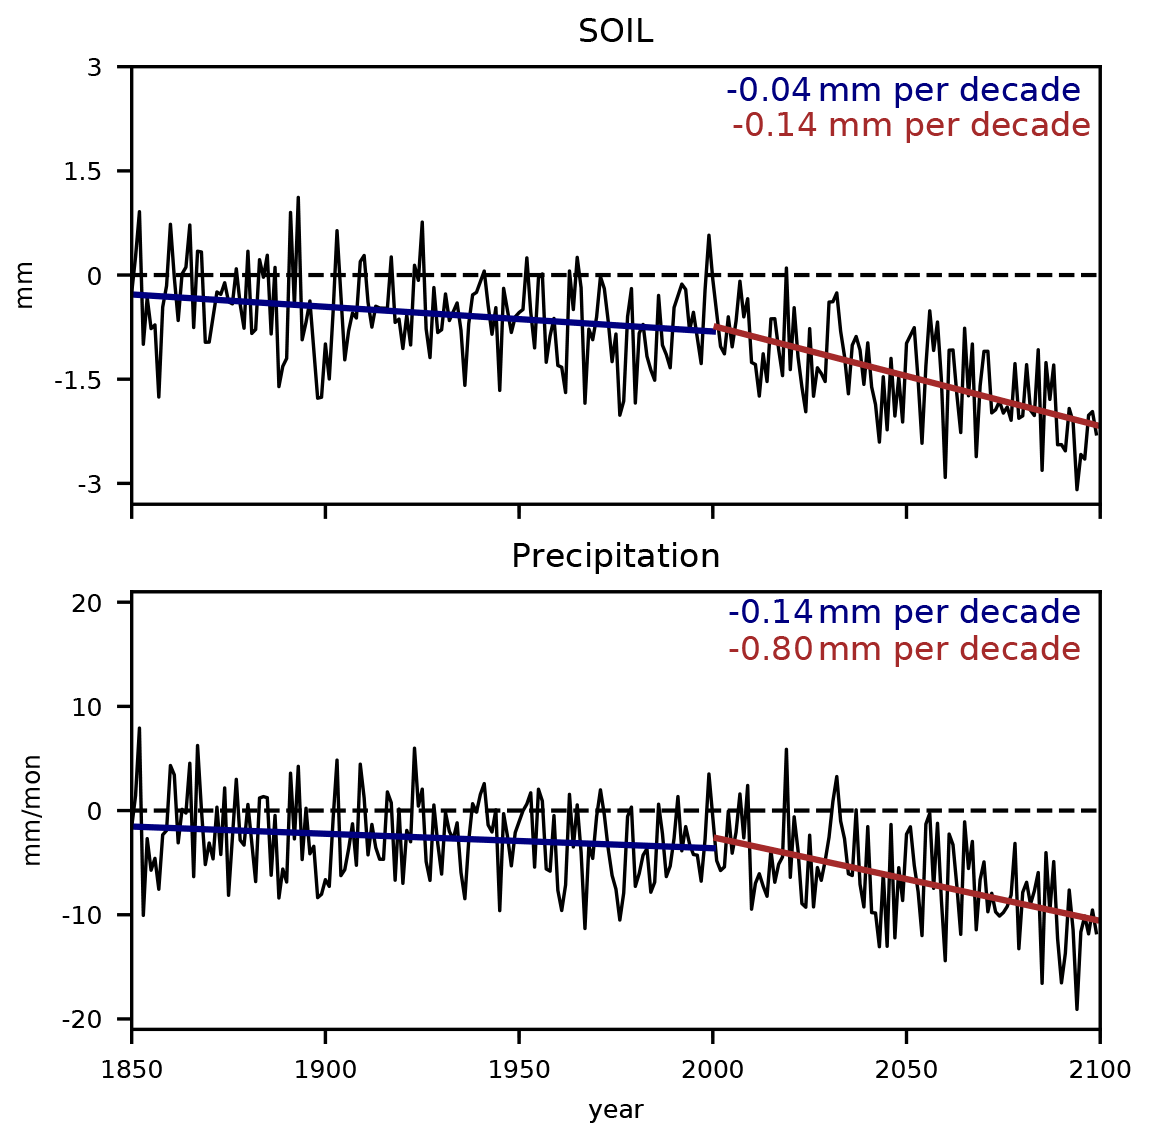
Figure A1Time series of annual soil moisture (SOIL) and precipitation anomalies from 1850 to 2099 CE with respect to the 1000–1849 CE means for the detrending method. The least-squares method is applied to two separate time periods: 1850–2000 CE and 2001–2099 CE. The trends and their values for each period are also shown.
Two R packages were used to calculate the drought indices: the scPDSI (https://CRAN.R-project.org/package=scPDSI, Zhong et al., 2018) and the SPEI (Vicente-Serrano et al., 2009). The biwavelet (https://github.com/tgouhier/biwavelet, Gouhier et al., 2018) was used for the wavelength coherence analysis, and burnr (https://CRAN.R-project.org/package=burnr, Malevich, 2018) was used for the superposed epoch analysis.
The summer scPDSI from the Old World Drought Atlas are available at https://www.ncdc.noaa.gov/paleo-search/study/19419 (Cook et al., 2015) and the sea surface temperature ERSST v5 (Huang et al., 2017a) are available at https://doi.org/10.7289/V5T72FNM (Huang et al., 2017b). The 20th Century Reanalysis V2 (https://psl.noaa.gov/data/gridded/data.20thC_ReanV2.html; Compo et al., 2011) and UDel_AirT_Precip data (https://psl.noaa.gov/data/gridded/data.UDel_AirT_Precip.html; Willmott and Matsuura, 2001) are provided by the NOAA/OAR/ESRL PSL, Boulder, Colorado, USA. The CESM simulations (Lehner et al., 2015) are available on request from the University of Bern.
WMK and CCR discussed and set up the initial research idea. WMK performed the analysis and drafted the manuscript under the supervision of CCR. CCR provided critical feedback on the results and the manuscript. Both authors contributed to the interpretation and discussion of the results and edited the manuscript together.
The authors declare that they have no conflict of interest.
The study is funded by the Swiss National Science Foundation (SNSF, grant 200020_172745). We acknowledge that some simulations were performed at the Swiss National Super Computing Centre (CSCS). Support for the 20th Century Reanalysis Project dataset is provided by the U.S. Department of Energy, Office of Science Innovative and Novel Computational Impact on Theory and Experiment (DOE INCITE) program, and Office of Biological and Environmental Research (BER); by the National Oceanic and Atmospheric Administration Climate Program Office; and by the National Oceanic and Atmospheric Administration Climate Program Office, and by the NOAA Physical Sciences Laboratory. The 20th Century Reanalysis V2 and UDel_AirT_Precip data are provided by the NOAA/OAR/ESRL PSL, Boulder, Colorado, USA, from their website at https://psl.noaa.gov/. The authors greatly thank the editor Hugues Goosse and the anonymous reviewers for their constructive feedbacks and insightful comments. The comments from the reviewers helped us to improve the analysis and the presentation of the results.
This research has been supported by the Swiss National Science Foundation (SNSF) (grant no. 200020_172745).
This paper was edited by Hugues Goosse and reviewed by two anonymous referees.
Alpert, P., Neeman, B., and Shay-El, Y.: Climatological analysis of Mediterranean cyclones using ECMWF data, Tellus A, 42, 65–77, https://doi.org/10.3402/tellusa.v42i1.11860, 1990. a, b
Babst, F., Bodesheim, P., Charney, N., Friend, A. D., Girardin, M. P., Klesse, S., Moore, D. J. P., Seftigen, K., Björklund, J., Bouriaud, O., Dawson, A., DeRose, R. J., Dietze, M. C., Eckes, A. H., Enquist, B., Frank, D. C., Mahecha, M. D., Poulter, B., Record, S., Trouet, V., Turton, R. H., Zhang, Z., and Evans, M. E. K.: When tree rings go global: challenges and opportunities for retro-and prospective insight, Quaternary Sci. Rev., 197, 1–20, https://doi.org/10.1016/j.quascirev.2018.07.009, 2018. a
Barnston, A. G. and Livezey, R. E.: Classification, seasonality and persistence of low-frequency atmospheric circulation patterns, Mon. Weather Rev., 115, 1083–1126, https://doi.org/10.1175/1520-0493(1987)115<1083:CSAPOL>2.0.CO;2, 1987. a
Bellenger, H., Guilyardi, É., Leloup, J., Lengaigne, M., and Vialard, J.: ENSO representation in climate models: From CMIP3 to CMIP5, Clim. Dynam., 42, 1999–2018, https://doi.org/10.1007/s00382-013-1783-z, 2014. a
Berg, A., Sheffield, J., and Milly, P. C.: Divergent surface and total soil moisture projections under global warming, Geophys. Res. Lett., 44, 236–244, https://doi.org/10.1002/2016GL071921, 2017. a, b, c
Brönnimann, S.: Impact of El Niño–southern oscillation on European climate, Rev. Geophys., 45, RG3003, https://doi.org/10.1029/2006RG000199, 2007. a, b, c
Brönnimann, S., Xoplaki, E., Casty, C., Pauling, A., and Luterbacher, J.: ENSO influence on Europe during the last centuries, Clim. Dynam., 28, 181–197, https://doi.org/10.1007/s00382-006-0175-z, 2007. a
Champion, A. J., Hodges, K. I., Bengtsson, L. O., Keenlyside, N. S., and Esch, M.: Impact of increasing resolution and a warmer climate on extreme weather from Northern Hemisphere extratropical cyclones, Tellus A, 63, 893–906, https://doi.org/10.1111/j.1600-0870.2011.00538.x, 2011. a, b
Coats, S., Smerdon, J. E., Seager, R., Cook, B. I., and González-Rouco, J. F.: Megadroughts in southwestern North America in ECHO-G millennial simulations and their comparison to proxy drought reconstructions, J. Climate, 26, 7635–7649, https://doi.org/10.1175/JCLI-D-12-00603.1, 2013. a
Coats, S., Cook, B. I., Smerdon, J. E., and Seager, R.: North American pancontinental droughts in model simulations of the last millennium, J. Climate, 28, 2025–2043, https://doi.org/10.1175/JCLI-D-14-00634.1, 2015. a
Coats, S., Smerdon, J. E., Cook, B., Seager, R., Cook, E. R., and Anchukaitis, K. J.: Internal ocean-atmosphere variability drives megadroughts in Western North America, Geophys. Res. Lett., 43, 9886–9894, https://doi.org/10.1002/2016GL070105, 2016. a
Compo, G. P., Whitaker, J. S., Sardeshmukh, P. D., Matsui, N., Allan, R. J., Yin, X., Gleason, B. E., Vose, R. S., Rutledge, G., Bessemoulin, P., Brönnimann, S., Brunet, M., Crouthamel, R. I., Grant, A. N., Groisman, P. Y., Jones, P. D., Kruk, M. C., Kruger, A. C., Marshall, G. J., Maugeri, M., Mok, H. Y., Nordli, Ø., Ross, T. F., Trigo, R. M., Wang, X. L., Woodruff, S. D., and Worley, S. J.: The twentieth century reanalysis project, Q. J. Roy. Meteor. Soc., 137, 1–28, https://doi.org/10.1002/qj.776, 2011 (data available at: https://psl.noaa.gov/data/gridded/data.20thC_ReanV2.html, last access: 20 April 2021). a, b
Cook, B. I., Anchukaitis, K. J., Touchan, R., Meko, D. M., and Cook, E. R.: Spatiotemporal drought variability in the Mediterranean over the last 900 years, J. Geophys. Res.-Atmos., 121, 2060–2074, https://doi.org/10.1002/2015JD023929, 2016a. a
Cook, B. I., Cook, E. R., Smerdon, J. E., Seager, R., Williams, A. P., Coats, S., Stahle, D. W., and Díaz, J. V.: North American megadroughts in the Common Era: Reconstructions and simulations, WIRES Clim. Change, 7, 411–432, https://doi.org/10.1002/wcc.394, 2016b. a
Cook, E. R., Seager, R., Kushnir, Y., Briffa, K. R., Büntgen, U., Frank, D., Krusic, P. J., Tegel, W., van der Schrier, G., Andreu-Hayles, L., Baillie, M., Baittinger, C., Bleicher, N., Bonde, N., Brown, D., Carrer, M., Cooper, R., Čufar, K., Dittmar, C., Esper, J., Griggs, C., Gunnarson, B., Günther, B., Gutierrez, E., Haneca, K., Helama, S., Herzig, F., Heussner, K.-U., Hofmann, J., Janda, P., Kontic, R., Köse, N., Kyncl, T., Levanič, T., Linderholm, H., Manning, S., Melvin, T. M., Miles, D., Neuwirth, B., Nicolussi, K., Nola, P., Panayotov, M., Popa, I., Rothe, A., Seftigen, K., Seim, A., Svarva, H., Svoboda, M., Thun, T., Timonen, M., Touchan, R., Trotsiuk, V., Trouet, V., Walder, F., Ważny, T., Wilson, R., and Zang, C.: Old World megadroughts and pluvials during the Common Era, Sci. Adv., 1, e1500561, https://doi.org/10.1126/sciadv.1500561, 2015 (data available at: https://www.ncdc.noaa.gov/paleo-search/study/19419, last access: 20 April 2021). a, b, c, d
Dai, A.: Drought under global warming: a review, WIRES Clim. Change, 2, 45–65, https://doi.org/10.1002/wcc.81, 2011. a, b, c
Deser, C., Hurrell, J. W., and Phillips, A. S.: The role of the North Atlantic Oscillation in European climate projections, Clim. Dynam., 49, 3141–3157, https://doi.org/10.1007/s00382-016-3502-z, 2017. a
Dubrovský, M., Hayes, M., Duce, P., Trnka, M., Svoboda, M., and Zara, P.: Multi-GCM projections of future drought and climate variability indicators for the Mediterranean region, Reg. Environ. Change, 14, 1907–1919, https://doi.org/10.1007/s10113-013-0562-z, 2014. a, b, c
Dünkeloh, A. and Jacobeit, J.: Circulation dynamics of Mediterranean precipitation variability 1948–98, Int. J. Climatol., 23, 1843–1866, https://doi.org/10.1002/joc.973, 2003. a, b
Fasullo, J. T., Phillips, A., and Deser, C.: Evaluation of Leading Modes of Climate Variability in the CMIP Archives, J. Climate, 33, 5527–5545, https://doi.org/10.1175/JCLI-D-19-1024.1, 2020. a, b
Field, C. B., Barros, V., Stocker, T. F., and Dahe, Q.: Managing the risks of extreme events and disasters to advance climate change adaptation: Special Report of Working Groups I and II of the Intergovernmental Panel on Climate Change (IPCC), Cambridge University Press, Cambridge, UK, 2012. a
Franke, J., Frank, D., Raible, C. C., Esper, J., and Brönnimann, S.: Spectral biases in tree-ring climate proxies, Nat. Clim. Change, 3, 360–364, https://doi.org/10.1038/nclimate1816, 2013. a, b
Gao, C., Robock, A., and Ammann, C.: Volcanic forcing of climate over the past 1500 years: An improved ice core-based index for climate models, J. Geophys. Res.-Atmos., 113, D23111, https://doi.org/10.1029/2008JD010239, 2008. a, b, c, d
García-Herrera, R., Garrido-Perez, J. M., Barriopedro, D., Ordóñez, C., Vicente-Serrano, S. M., Nieto, R., Gimeno, L., Sorí, R., and Yiou, P.: The European 2016/17 Drought, J. Climate, 32, 3169–3187, https://doi.org/10.1175/JCLI-D-18-0331.1, 2019. a, b
Giorgi, F.: Climate change hot-spots, Geophys. Res. Lett., 33, L08707, https://doi.org/10.1029/2006GL025734, 2006. a
Giorgi, F. and Lionello, P.: Climate change projections for the Mediterranean region, Global Planet. Change, 63, 90–104, https://doi.org/10.1016/j.gloplacha.2007.09.005, 2008. a
Gouhier, T. C., Grinsted, A., and Simko, V.: R package biwavelet: Conduct Univariate and Bivariate Wavelet Analyses (Version 0.20.17), available at: https://github.com/tgouhier/biwavelet (last access: 1 October 2020), 2018. a, b
Grinsted, A., Moore, J. C., and Jevrejeva, S.: Application of the cross wavelet transform and wavelet coherence to geophysical time series, Nonlin. Processes Geophys., 11, 561–566, https://doi.org/10.5194/npg-11-561-2004, 2004. a
Haywood, A. M., Valdes, P. J., Aze, T., Barlow, N., Burke, A., Dolan, A. M., von der Heydt, A. S., Hill, D. J., Jamieson, S. S. R., Otto-Bliesner, B. L., Salzmann, U., Saupe, E., and Voss, J.: What can Palaeoclimate Modelling do for you?, Earth Systems and Environment, 3, 1–18, https://doi.org/10.1007/s41748-019-00093-1, 2019. a
Hoerling, M., Eischeid, J., Perlwitz, J., Quan, X., Zhang, T., and Pegion, P.: On the Increased Frequency of Mediterranean Drought, J. Climate, 25, 2146–2161, https://doi.org/10.1175/JCLI-D-11-00296.1, 2011. a
Huang, B., Thorne, P. W., Banzon, V. F., Boyer, T., Chepurin, G., Lawrimore, J. H., Menne, M. J., Smith, T. M., Vose, R. S., and Zhang, H.-M.: Extended reconstructed sea surface temperature, version 5 (ERSSTv5): upgrades, validations, and intercomparisons, J. Climate, 30, 8179–8205, https://doi.org/10.1175/JCLI-D-16-0836.1, 2017a. a, b
Huang, B., Thorne, P. W., Banzon, V. F., Boyer, T., Chepurin, G., Lawrimore, J. H., Menne, M. J., Smith, T. M., Vose, R. S., and Zhang, H.-M.: NOAA Extended Reconstructed Sea Surface Temperature (ERSST), Version 5 [data set], NOAA National Centers for Environmental Information, https://doi.org/10.7289/V5T72FNM, 2017b. a
Hurrell, J. W.: Decadal trends in the North Atlantic Oscillation: regional temperatures and precipitation, Science, 269, 676–679, https://doi.org/10.1126/science.269.5224.676, 1995. a
Krichak, S. O. and Alpert, P.: Decadal trends in the east Atlantic–west Russia pattern and Mediterranean precipitation, Int. J. Climatol., 25, 183–192, https://doi.org/10.1002/joc.1124, 2005. a
Lehner, F., Joos, F., Raible, C. C., Mignot, J., Born, A., Keller, K. M., and Stocker, T. F.: Climate and carbon cycle dynamics in a CESM simulation from 850 to 2100 CE, Earth Syst. Dynam., 6, 411–434, https://doi.org/10.5194/esd-6-411-2015, 2015. a, b, c, d, e
Lehner, F., Coats, S., Stocker, T. F., Pendergrass, A. G., Sanderson, B. M., Raible, C. C., and Smerdon, J. E.: Projected drought risk in 1.5 ∘C and 2 ∘C warmer climates, Geophys. Res. Lett., 44, 7419–7428, https://doi.org/10.1002/2017GL074117, 2017. a, b
Li, W., Li, L., Ting, M., and Liu, Y.: Intensification of Northern Hemisphere subtropical highs in a warming climate, Nat. Geosci., 5, 830–834, https://doi.org/10.1038/ngeo1590, 2012. a
Lionello, P., Malanotte-Rizzoli, P., Boscolo, R., Alpert, P., Artale, V., Li, L., Luterbacher, J., May, W., Trigo, R., Tsimplis, M., Ulbrich, U., and Xoplaki, E.: The Mediterranean climate: An overview of the main characteristics and issues, in: Developments in Earth and Environmental Sciences, edited by: Lionello, P., Malanotte-Rizzoli, P., and Boscolo, R., vol. 4 of Mediterranean, Elsevier, 1–26, https://doi.org/10.1016/S1571-9197(06)80003-0, 2006. a, b, c, d
Lionello, P., Trigo, I. F., Gil, V., Liberato, M. L., Nissen, K. M., Pinto, J. G., Raible, C. C., Reale, M., Tanzarella, A., Trigo, R. M., Ulbrich, S., and Ulbrich, U.: Objective climatology of cyclones in the Mediterranean region: a consensus view among methods with different system identification and tracking criteria, Tellus A, 68, 29391, https://doi.org/10.3402/tellusa.v68.29391, 2016. a
Liu, W., Sun, F., Lim, W. H., Zhang, J., Wang, H., Shiogama, H., and Zhang, Y.: Global drought and severe drought-affected populations in 1.5 and 2 °C warmer worlds, Earth Syst. Dynam., 9, 267–283, https://doi.org/10.5194/esd-9-267-2018, 2018. a
Ljungqvist, F. C., Seim, A., Krusic, P. J., González-Rouco, J. F., Werner, J. P., Cook, E. R., Zorita, E., Luterbacher, J., Xoplaki, E., Destouni, G., García-Bustamante, E., Aguilar, C. A. M., Seftigen, K., Wang, J., Gagen, M. H., Esper, J., Solomina, O., Fleitmann, D., and Büntgen, U.: European warm-season temperature and hydroclimate since 850 CE, Environ. Res. Lett., 14, 084015, https://doi.org/10.1088/1748-9326/ab2c7e, 2019. a
Lloyd-Hughes, B.: The impracticality of a universal drought definition, Theor. Appl. Climatol., 117, 607–611, https://doi.org/10.1007/s00704-013-1025-7, 2014. a
Malevich, S.: burnr: Fire-History Analysis in R, r package version 0.2.2, available at: https://CRAN.R-project.org/package=burnr (last access: 1 February 2021), 2018. a, b
Mariotti, A., Zeng, N., and Lau, K.-M.: Euro-Mediterranean rainfall and ENSO – a seasonally varying relationship, Geophys. Res. Lett., 29, 1621, https://doi.org/10.1029/2001GL014248, 2002. a, b
Mariotti, A., Zeng, N., Yoon, J.-H., Artale, V., Navarra, A., Alpert, P., and Li, L. Z.: Mediterranean water cycle changes: transition to drier 21st century conditions in observations and CMIP3 simulations, Environ. Res. Lett., 3, 044001, https://doi.org/10.1088/1748-9326/3/4/044001, 2008. a, b, c, d, e
McConnell, J. R., Sigl, M., Plunkett, G., Burke, A., Kim, W. M., Raible, C. C., Wilson, A. I., Manning, J. G., Ludlow, F., Chellman, N. J., Innes, H. M., Yang, Z., Larsen, J. F., Schaefer, J. R., Kipfstuhl, S., Mojtabavi, S., Wilhelms, F., Opel, T., Meyer, H., and Steffensen, J. P.: Extreme climate after massive eruption of Alaska's Okmok volcano in 43 BCE and effects on the late Roman Republic and Ptolemaic Kingdom, P. Natl. Acad. Sci. USA, 117, 15443–15449, https://doi.org/10.1073/pnas.2002722117, 2020. a, b
McKee, T. B., Doesken, N. J., and Kleist, J.: The relationship of drought frequency and duration to time scales, in: Proceedings of the 8th Conference on Applied Climatology, 17–22 January 1993, Anaheim, California, USA, vol. 17, 179–183, 1993. a, b
Mishra, A. K. and Singh, V. P.: A review of drought concepts, J. Hydrol., 391, 202–216, https://doi.org/10.1016/j.jhydrol.2010.07.012, 2010. a, b
Mukherjee, S., Mishra, A., and Trenberth, K. E.: Climate Change and Drought: a Perspective on Drought Indices, Current Climate Change Reports, 4, 145–163, https://doi.org/10.1007/s40641-018-0098-x, 2018. a, b, c, d, e
Naumann, G., Alfieri, L., Wyser, K., Mentaschi, L., Betts, R., Carrao, H., Spinoni, J., Vogt, J., and Feyen, L.: Global changes in drought conditions under different levels of warming, Geophys. Res. Lett., 45, 3285–3296, https://doi.org/10.1002/2017GL076521, 2018. a
Otto-Bliesner, B. L., Brady, E. C., Fasullo, J., Jahn, A., Landrum, L., Stevenson, S., Rosenbloom, N., Mai, A., and Strand, G.: Climate variability and change since 850 CE: An ensemble approach with the Community Earth System Model, B. Am. Meteorol. Soc., 97, 735–754, https://doi.org/10.1175/BAMS-D-14-00233.1, 2016. a
PAGES Hydro2k Consortium: Comparing proxy and model estimates of hydroclimate variability and change over the Common Era, Clim. Past, 13, 1851–1900, https://doi.org/10.5194/cp-13-1851-2017, 2017. a, b, c
Palmer, W. C.: Meteorological drought, U.S. Department of Commerce, Weather Bureau Research Paper 45, U.S. Weather Bureau, Washington, D.C., USA, 58 pp., 1965. a, b
Parsons, L. A. and Coats, S.: Ocean-atmosphere trajectories of extended drought in Southwestern North America, J. Geophys. Res.-Atmos., 124, 8953–8971, https://doi.org/10.1029/2019JD030424, 2019. a, b
Parsons, L. A., Loope, G. R., Overpeck, J. T., Ault, T. R., Stouffer, R., and Cole, J. E.: Temperature and precipitation variance in CMIP5 simulations and paleoclimate records of the last millennium, J. Climate, 30, 8885–8912, https://doi.org/10.1175/JCLI-D-16-0863.1, 2017. a
Parsons, L. A., Coats, S., and Overpeck, J. T.: The continuum of drought in Southwestern North America, J. Climate, 31, 8627–8643, https://doi.org/10.1175/JCLI-D-18-0010.1, 2018. a
Philandras, C. M., Nastos, P. T., Kapsomenakis, J., Douvis, K. C., Tselioudis, G., and Zerefos, C. S.: Long term precipitation trends and variability within the Mediterranean region, Nat. Hazards Earth Syst. Sci., 11, 3235–3250, https://doi.org/10.5194/nhess-11-3235-2011, 2011. a
Previdi, M. and Liepert, B. G.: Annular modes and Hadley cell expansion under global warming, Geophys. Res. Lett., 34, L22701, https://doi.org/10.1029/2007GL031243, 2007. a
Raible, C.: On the relation between extremes of midlatitude cyclones and the atmospheric circulation using ERA40, Geophys. Res. Lett., 34, L07703, https://doi.org/10.1029/2006GL029084, 2007. a
Raible, C., Luksch, U., Fraedrich, K., and Voss, R.: North Atlantic decadal regimes in a coupled GCM simulation, Clim. Dynam., 18, 321–330, 2001. a
Raible, C., Yoshimori, M., Stocker, T., and Casty, C.: Extreme midlatitude cyclones and their implications for precipitation and wind speed extremes in simulations of the Maunder Minimum versus present day conditions, Clim. Dynam., 28, 409–423, https://doi.org/10.1007/s00382-006-0188-7, 2007. a, b
Raible, C. C., Luksch, U., and Fraedrich, K.: Precipitation and northern hemisphere regimes, Atmos. Sci. Lett., 5, 43–55, https://doi.org/10.1016/j.atmoscilet.2003.12.001, 2003. a
Raible, C. C., Ziv, B., Saaroni, H., and Wild, M.: Winter synoptic-scale variability over the Mediterranean Basin under future climate conditions as simulated by the ECHAM5, Clim. Dynam., 35, 473–488, https://doi.org/10.1007/s00382-009-0678-5, 2010. a, b
Raible, C. C., Bärenbold, O., and Gómez-Navarro, J. J.: Drought indices revisited – improving and testing of drought indices in a simulation of the last two millennia for Europe, Tellus A, 69, 1287492, https://doi.org/10.1080/16000870.2017.1296226, 2017. a, b, c
Rao, M. P., Cook, B. I., Cook, E. R., D'Arrigo, R. D., Krusic, P. J., Anchukaitis, K. J., LeGrande, A. N., Buckley, B. M., Davi, N. K., Leland, C., and Griffin, K. L.: European and Mediterranean hydroclimate responses to tropical volcanic forcing over the last millennium, Geophys. Res. Lett., 44, 5104–5112, https://doi.org/10.1002/2017GL073057, 2017. a, b, c
Schmidt, G. A., Jungclaus, J. H., Ammann, C. M., Bard, E., Braconnot, P., Crowley, T. J., Delaygue, G., Joos, F., Krivova, N. A., Muscheler, R., Otto-Bliesner, B. L., Pongratz, J., Shindell, D. T., Solanki, S. K., Steinhilber, F., and Vieira, L. E. A.: Climate forcing reconstructions for use in PMIP simulations of the Last Millennium (v1.1), Geosci. Model Dev., 5, 185–191, https://doi.org/10.5194/gmd-5-185-2012, 2012. a
Seager, R., Liu, H., Henderson, N., Simpson, I., Kelley, C., Shaw, T., Kushnir, Y., and Ting, M.: Causes of Increasing Aridification of the Mediterranean Region in Response to Rising Greenhouse Gases, J. Climate, 27, 4655–4676, https://doi.org/10.1175/JCLI-D-13-00446.1, 2014. a, b
Seager, R., Cane, M., Henderson, N., Lee, D.-E., Abernathey, R., and Zhang, H.: Strengthening tropical Pacific zonal sea surface temperature gradient consistent with rising greenhouse gases, Nat. Clim. Change, 9, 517–522, https://doi.org/10.1038/s41558-019-0505-x, 2019. a, b
Seneviratne, S. I., Corti, T., Davin, E. L., Hirschi, M., Jaeger, E. B., Lehner, I., Orlowsky, B., and Teuling, A. J.: Investigating soil moisture–climate interactions in a changing climate: A review, Earth-Sci. Rev., 99, 125–161, https://doi.org/10.1016/j.earscirev.2010.02.004, 2010. a, b
Sousa, P. M., Trigo, R. M., Aizpurua, P., Nieto, R., Gimeno, L., and Garcia-Herrera, R.: Trends and extremes of drought indices throughout the 20th century in the Mediterranean, Nat. Hazards Earth Syst. Sci., 11, 33–51, https://doi.org/10.5194/nhess-11-33-2011, 2011. a, b
Spinoni, J., Naumann, G., Vogt, J. V., and Barbosa, P.: The biggest drought events in Europe from 1950 to 2012, J. Hydrol., 3, 509–524, https://doi.org/10.1016/j.ejrh.2015.01.001, 2015. a, b
Spinoni, J., Naumann, G., and Vogt, J. V.: Pan-European seasonal trends and recent changes of drought frequency and severity, Global Planet. Change, 148, 113–130, https://doi.org/10.1016/j.gloplacha.2016.11.013, 2017. a, b
Stevenson, S., Overpeck, J. T., Fasullo, J., Coats, S., Parsons, L., Otto-Bliesner, B., Ault, T., Loope, G., and Cole, J.: Climate variability, volcanic forcing, and last millennium hydroclimate extremes, J. Climate, 31, 4309–4327, https://doi.org/10.1175/JCLI-D-17-0407.1, 2018. a, b, c
Swann, A. L.: Plants and drought in a changing climate, Current Climate Change Reports, 4, 192–201, https://doi.org/10.1007/s40641-018-0097-y, 2018. a
Swann, A. L., Hoffman, F. M., Koven, C. D., and Randerson, J. T.: Plant responses to increasing CO2 reduce estimates of climate impacts on drought severity, P. Natl. Acad. Sci. USA, 113, 10019–10024, https://doi.org/10.1073/pnas.1604581113, 2016. a, b
Taylor, K. E., Stouffer, R. J., and Meehl, G. A.: An overview of CMIP5 and the experiment design, B. Am. Meteorol. Soc., 93, 485–498, https://doi.org/10.1175/BAMS-D-11-00094.1, 2012. a
Thornthwaite, C. W.: An approach toward a rational classification of climate, Geogr. Rev., 38, 55–94, https://doi.org/10.2307/210739, 1948. a
Trenberth, K. E.: The Definition of El Niño, B. Am. Meteorol. Soc., 78, 2771–2778, https://doi.org/10.1175/1520-0477(1997)078<2771:TDOENO>2.0.CO;2, 1997. a
Trigo, R., Osborn, T., and Corte-Real, J.: The North Atlantic Oscillation influence on Europe: climate impacts and associated physical mechanisms, Clim. Res., 20, 9–17, https://doi.org/10.3354/cr020009, 2002. a
Ulbrich, U., Leckebusch, G., and Pinto, J. G.: Extra-tropical cyclones in the present and future climate: a review, Theor. Appl. Climatol., 96, 117–131, https://doi.org/10.1007/s00704-008-0083-8, 2009. a, b
Van Loon, A. F., Gleeson, T., Clark, J., Van Dijk, A. I. J. M., Stahl, K., Hannaford, J., Di Baldassarre, G., Teuling, A. J., Tallaksen, L. M., Uijlenhoet, R., Hannah, D. M., Sheffield, J., Svoboda, M., Verbeiren, B., Wagener, T., Rangecroft, S., Wanders, N., and Van Lanen, H. A. J.: Drought in the Anthropocene, Nat. Geosci., 9, 89–91, https://doi.org/10.1038/ngeo2646, 2016. a
Vicente-Serrano, S. M.: El Niño and La Niña influence on droughts at different timescales in the Iberian Peninsula, Water Resour. Res., 41, W12415, https://doi.org/10.1029/2004WR003908, 2005. a
Vicente-Serrano, S. M., Beguería, S., and López-Moreno, J. I.: A Multiscalar Drought Index Sensitive to Global Warming: The Standardized Precipitation Evapotranspiration Index, J. Climate, 23, 1696–1718, https://doi.org/10.1175/2009JCLI2909.1, 2009. a, b, c
Vicente-Serrano, S. M., Beguería, S., López-Moreno, J. I., Angulo, M., and El Kenawy, A.: A new global 0.5 gridded dataset (1901–2006) of a multiscalar drought index: comparison with current drought index datasets based on the Palmer Drought Severity Index, J. Hydrometeorol., 11, 1033–1043, https://doi.org/10.1175/2010JHM1224.1, 2010. a
Vicente-Serrano, S. M., Lopez-Moreno, J.-I., Beguería, S., Lorenzo-Lacruz, J., Arturo Sanchez-Lorenzo, García-Ruiz, J. M., Azorin-Molina, C., Morán-Tejeda, E., Revuelto, J., Ricardo Trigo, Coelho, F., and Espejo, F.: Evidence of increasing drought severity caused by temperature rise in southern Europe, Environ. Res. Lett., 9, 044001, https://doi.org/10.1088/1748-9326/9/4/044001, 2014. a
Vicente-Serrano, S. M., Van der Schrier, G., Beguería, S., Azorin-Molina, C., and Lopez-Moreno, J.-I.: Contribution of precipitation and reference evapotranspiration to drought indices under different climates, J. Hydrol., 526, 42–54, https://doi.org/10.1016/j.jhydrol.2014.11.025, 2015. a
Wallace, J. M. and Gutzler, D. S.: Teleconnections in the Geopotential Height Field during the Northern Hemisphere Winter, Mon. Weather Rev., 109, 784–812, https://doi.org/10.1175/1520-0493(1981)109<0784:TITGHF>2.0.CO;2, 1981. a, b
Wang, W., Ertsen, M. W., Svoboda, M. D., and Hafeez, M.: Propagation of drought: from meteorological drought to agricultural and hydrological drought, Adv. Meteorol., 2016, e6547209, https://doi.org/10.1155/2016/6547209, 2016. a
Watterson, I.: The intensity of precipitation during extratropical cyclones in global warming simulations: a link to cyclone intensity?, Tellus A, 58, 82–97, https://doi.org/10.1111/j.1600-0870.2006.00147.x, 2006. a, b, c
Wells, N., Goddard, S., and Hayes, M. J.: A Self-Calibrating Palmer Drought Severity Index, J. Climate, 17, 2335–2351, https://doi.org/10.1175/1520-0442(2004)017<2335:ASPDSI>2.0.CO;2, 2004. a, b, c
Wilhite, D.: Understanding the Phenomenon of Drought, Drought Mitigation Center Faculty Publications, available at: https://digitalcommons.unl.edu/droughtfacpub/50 (last access: 1 April 2020), 1993. a
Willmott, C. J. and Matsuura, K.: Terrestrial air temperature and precipitation: Monthly and annual time series (1950–1999) Version 1.02, Center for Climatic Research, University of Delaware, Newark, USA, 2001 (data available at: https://psl.noaa.gov/data/gridded/data.UDel_AirT_Precip.html, last access: 20 April 2021). a, b, c
Xoplaki, E., González-Rouco, J. F., Luterbacher, J., and Wanner, H.: Mediterranean summer air temperature variability and its connection to the large-scale atmospheric circulation and SSTs, Clim. Dynam., 20, 723–739, https://doi.org/10.1007/s00382-003-0304-x, 2003. a, b, c
Xoplaki, E., González-Rouco, J., Luterbacher, J., and Wanner, H.: Wet season Mediterranean precipitation variability: influence of large-scale dynamics and trends, Clim. Dynam., 23, 63–78, 2004. a
Xoplaki, E., Luterbacher, J., Wagner, S., Zorita, E., Fleitmann, D., Preiser-Kapeller, J., Sargent, A. M., White, S., Toreti, A., Haldon, J. F., Mordechai, L., Bozkurt, D., Akçer-Ön, S., and Izdebski, A.: Modelling Climate and Societal Resilience in the Eastern Mediterranean in the Last Millennium, Hum. Ecol., 46, 363–379, https://doi.org/10.1007/s10745-018-9995-9, 2018. a, b, c
Yin, D., Roderick, M. L., Leech, G., Sun, F., and Huang, Y.: The contribution of reduction in evaporative cooling to higher surface air temperatures during drought, Geophys. Res. Lett., 41, 7891–7897, https://doi.org/10.1002/2014GL062039, 2014. a
Zhong, R., Chen, X., Wang, Z., and Lai, C.: scPDSI: Calculation of the Conventional and Self-Calibrating Palmer Drought Severity Index, r package version 0.1.3, available at: https://CRAN.R-project.org/package=scPDSI (last access: 1 November 2019), 2018. a, b
Zhu, Y., Liu, Y., Wang, W., Singh, V. P., Ma, X., and Yu, Z.: Three dimensional characterization of meteorological and hydrological droughts and their probabilistic links, J. Hydrol., 578, 124016, https://doi.org/10.1016/j.jhydrol.2019.124016, 2019. a
Zveryaev, I. I.: Seasonality in precipitation variability over Europe, J. Geophys. Res.-Atmos., 109, D05103, https://doi.org/10.1029/2003JD003668, 2004. a