the Creative Commons Attribution 4.0 License.
the Creative Commons Attribution 4.0 License.
 | 15 Oct 2021
Climate, cryosphere and carbon cycle controls on Southeast Atlantic orbital-scale carbonate deposition since the Oligocene (30–0 Ma)
Anna Joy Drury
Diederik Liebrand
Thomas Westerhold
Helen M. Beddow
David A. Hodell
Nina Rohlfs
Roy H. Wilkens
Mitchell Lyle
David B. Bell
Dick Kroon
Heiko Pälike
Lucas J. Lourens
The evolution of the Cenozoic cryosphere from unipolar to bipolar over the past 30 million years (Myr) is broadly known. Highly resolved records of carbonate (CaCO3) content provide insight into the evolution of regional and global climate, cryosphere, and carbon cycle dynamics. Here, we generate the first Southeast Atlantic CaCO3 content record spanning the last 30 Myr, derived from X-ray fluorescence (XRF) ln(Ca Fe) data collected at Ocean Drilling Program Site 1264 (Walvis Ridge, SE Atlantic Ocean). We present a comprehensive and continuous depth and age model for the entirety of Site 1264 (∼ 316 m; 30 Myr). This constitutes a key reference framework for future palaeoclimatic and palaeoceanographic studies at this location. We identify three phases with distinctly different orbital controls on Southeast Atlantic CaCO3 deposition, corresponding to major developments in climate, the cryosphere and the carbon cycle: (1) strong ∼ 110 kyr eccentricity pacing prevails during Oligocene–Miocene global warmth (∼ 30–13 Ma), (2) increased eccentricity-modulated precession pacing appears after the middle Miocene Climate Transition (mMCT) (∼ 14–8 Ma), and (3) pervasive obliquity pacing appears in the late Miocene (∼ 7.7–3.3 Ma) following greater importance of high-latitude processes, such as increased glacial activity and high-latitude cooling. The lowest CaCO3 content (92 %–94 %) occurs between 18.5 and 14.5 Ma, potentially reflecting dissolution caused by widespread early Miocene warmth and preceding Antarctic deglaciation across the Miocene Climatic Optimum (∼ 17–14.5 Ma) by 1.5 Myr. The emergence of precession pacing of CaCO3 deposition at Site 1264 after ∼ 14 Ma could signal a reorganisation of surface and/or deep-water circulation in this region following Antarctic reglaciation at the mMCT. The increased sensitivity to precession at Site 1264 between 14 and 13 Ma is associated with an increase in mass accumulation rates (MARs) and reflects increased regional CaCO3 productivity and/or recurrent influxes of cooler, less corrosive deep waters. The highest carbonate content (%CaCO3) and MARs indicate that the late Miocene–early Pliocene Biogenic Bloom (LMBB) occurs between ∼ 7.8 and 3.3 Ma at Site 1264; broadly contemporaneous with the LMBB in the equatorial Pacific Ocean. At Site 1264, the onset of the LMBB roughly coincides with appearance of strong obliquity pacing of %CaCO3, reflecting increased high-latitude forcing. The global expression of the LMBB may reflect increased nutrient input into the global ocean resulting from enhanced aeolian dust and/or glacial/chemical weathering fluxes, due to enhanced glacial activity and increased meridional temperature gradients. Regional variability in the timing and amplitude of the LMBB may be driven by regional differences in cooling, continental aridification and/or changes in ocean circulation in the late Miocene.
- Article
(29857 KB) - Full-text XML
-
Supplement
(26877 KB) - BibTeX
- EndNote


Over the last 30 million years (Myr), Earth's climate system evolved considerably from the early unipolar Antarctic Coolhouse to our modern-day Icehouse world (Zachos et al., 2001; De Vleeschouwer et al., 2017, 2020; Littler et al., 2019; Westerhold et al., 2020). Inferred from benthic foraminiferal oxygen isotope data (δ18O), the Oligocene–early Miocene (30–17 million years ago [Ma]) was characterised by variable Antarctic ice volumes (Liebrand et al., 2017). This unipolar Coolhouse was marked by high-amplitude glacial–interglacial cycles that were predominantly eccentricity paced (Wade and Pälike, 2004; Pälike et al., 2006; Liebrand et al., 2016, 2017; Beddow et al., 2018). During the warm Miocene Climatic Optimum (MCO; 17–14.7 Ma), the Antarctic ice sheet shrank relative to its early Miocene size (Shevenell et al., 2004, 2008; Holbourn et al., 2015; Gasson et al., 2016; Levy et al., 2016), before prevalent unipolar conditions were re-established when Antarctica reglaciated across the middle Miocene Climate Transition (mMCT) around ∼ 13.9 Ma (Shevenell et al., 2004, 2008; Holbourn et al., 2005, 2014; Levy et al., 2016). Following the onset of strong obliquity pacing at ∼ 7.7 Ma (Drury et al., 2017, 2018b) and further global cooling during the late Miocene–early Pliocene (7–5 Ma, Herbert et al., 2016), a fully bipolar Icehouse world was established at ∼ 2.7 Ma (Bailey et al., 2013).
High-resolution carbonate records provide insight into past dynamics and long-term evolution of Earth's climate and carbon cycle. Carbonate deposition is largely controlled by a combination of the amount of biogenic carbonate productivity in the surface waters and the degree of dissolution in the water column and/or seafloor, as well as sedimentary processes such as winnowing and dilution (Berger, 1970; Van Andel et al., 1975; Lyle et al., 1995, 2019; Lyle, 2003; Pälike et al., 2012). Primary and export productivity are sensitive recorders of past climate variability, responding to changes in solar insolation and nutrient availability (Coxall and Wilson, 2011; Pälike et al., 2012; Lyle and Baldauf, 2015; Carter et al., 2016; Liebrand et al., 2018). Dissolution at the seafloor is primarily driven by regional changes in the lysocline and carbonate compensation depth, with less carbonate preserving at greater depths and/or in areas with corrosive bottom waters (Berger, 1970; Van Andel et al., 1975; Lyle et al., 2019). Changes in deep-sea currents can alter the composition of the sediment through processes like winnowing or dilution, which respectively remove fine-grained material or increase certain sedimentary components relative to others (e.g. increased dilution with terrigenous material). Understanding past changes in carbonate deposition can inform about past climate development by helping to disentangle how global processes affected regional production and deposition of biogenic carbonates. Deep marine carbonate variability in the Equatorial Pacific Ocean is well documented for the Cenozoic (Van Andel et al., 1975; Lyle, 2003; Pälike et al., 2012; Lyle and Baldauf, 2015; Kochhann et al., 2016; Beddow et al., 2018; Lyle et al., 2019). However, relatively few Atlantic records of comparable quality, resolution and extent exist (e.g. Liebrand et al., 2016), limiting our understanding of the palaeoceanographic evolution of this basin. Improving our understanding of the Southeast Atlantic Ocean, including the Angola Basin, is of particular interest, as the water column structure and surface and deep-water ocean circulation in this region were affected by palaeoceanographic conditions in both the North Atlantic Ocean and Southern Ocean (Seidov and Maslin, 2001; Bell et al., 2015).
Here, we present the first astronomically tuned record of Southeast Atlantic carbonate deposition spanning the last 30 Myr at orbital-scale resolution. We use expanded deep-sea sedimentary sequences from Ocean Drilling Program (ODP) Site 1264 (Leg 208; Shipboard Scientific Party Leg 208, 2004a), located on the Angola Basin side of Walvis Ridge. New high-resolution X-ray fluorescence (XRF) core-scanning data is collected for the middle Miocene–present sediments at ODP Site 1264, which is integrated with published Oligocene–early Miocene XRF data from ODP Sites 1264 and 1265 (Liebrand et al., 2016). The XRF ln(Ca Fe) data are used to verify, update and revise the composite depth scale and splice at Site 1264 to form a continuous 315.96 m record. Carbonate content (%CaCO3) is estimated using the XRF ln(Ca Fe) data. We generate an astrochronology between 3 and 17 Ma using the new %CaCO3 data, which is integrated with published Oligocene–early Miocene and Plio-Pleistocene age models (Bell et al., 2014; Liebrand et al., 2016). The resulting high-resolution records will help determine shifts in the orbital pacing of Southeast Atlantic CaCO3 deposition in relation to the broader climatic trends of the last 30 Myr. We investigate how widespread Miocene warmth followed by Antarctic glaciation influenced the pacing and preservation of Southeast Atlantic carbonate deposition. Finally, we establish the relative timing of the late Miocene–early Pliocene Biogenic Bloom (LMBB; acronym from Lyle et al., 2019) in the Southeast Atlantic Ocean versus Pacific Ocean and explore what this reveals about the global and regional driving forces of this multi-million-year productivity event.
2.1 ODP Sites 1264 and 1265
This study utilises material recovered at ODP Site 1264 on the Angola Basin side of Walvis Ridge in the Southeast Atlantic (Fig. 1; 28∘31.955′ S, 2∘50.730′ E, 2505 m water depth; Shipboard Scientific Party Leg 208, 2004a), which was drilled during ODP Leg 208 to provide a Cenozoic deep-sea record of the South Atlantic (Shipboard Scientific Party Leg 208, 2004a, b). At Site 1264, a continuous ∼ 316 m shipboard stratigraphic splice was developed back to the early Oligocene using magnetic susceptibility and 600/450 nm colour reflectance data (Shipboard Scientific Party Leg 208, 2004a). Oligocene–early Miocene XRF ln(Ca Fe) data were used to verify the shipboard splice and produce a revised composite depth (rmcd) scale (Liebrand et al., 2016, 2018). Liebrand et al. (2016) filled four short Oligocene–early Miocene core gaps at Site 1264 with data from Site 1265 (Fig. 1; 28∘50.101′ S, 2∘38.354′ E, 3059 m water depth; Shipboard Scientific Party Leg 208, 2004b) to provide a continuous sedimentary sequence. Site 1264 and the relevant intervals of Site 1265 are characterised by high biogenic carbonate, with shipboard analysis indicating an average CaCO3 content of 92 %–96 % (Shipboard Scientific Party Leg 208, 2004a, b). At Site 1264, shipboard linear sedimentation rates (LSR) derived from bio-magnetostratigraphy were exceptionally low for the early–middle Miocene (19–12 Ma; LSR = 3.9–5.4 m Myr−1, average of 4.7 m Myr−1). Higher shipboard LSR occurred during the Oligocene–early Miocene (30–19 Ma; LSR = 5.3–9.3 m Myr−1, average of 7.1 m Myr−1) and early Plio-Pleistocene (3–0 Ma; LSR = 4.5–7.4 m Myr−1, average of 6.0 m Myr−1). The highest shipboard LSR occurred in the late Miocene–early Pliocene (12–3 Ma), where LSR average 15.9 m Myr−1 (7.7–30.5 m Myr−1). The shipboard LSR for the Oligocene–early Miocene (30–17 Ma) and Plio-Pleistocene (5.3–0.0 Ma) were confirmed by previous studies on Sites 1264 and 1265, which also support the shipboard notion that these sites are excellent recorders of orbital-scale climate dynamics (Liebrand et al., 2011, 2016, 2017, 2018; Bell et al., 2014, 2015).
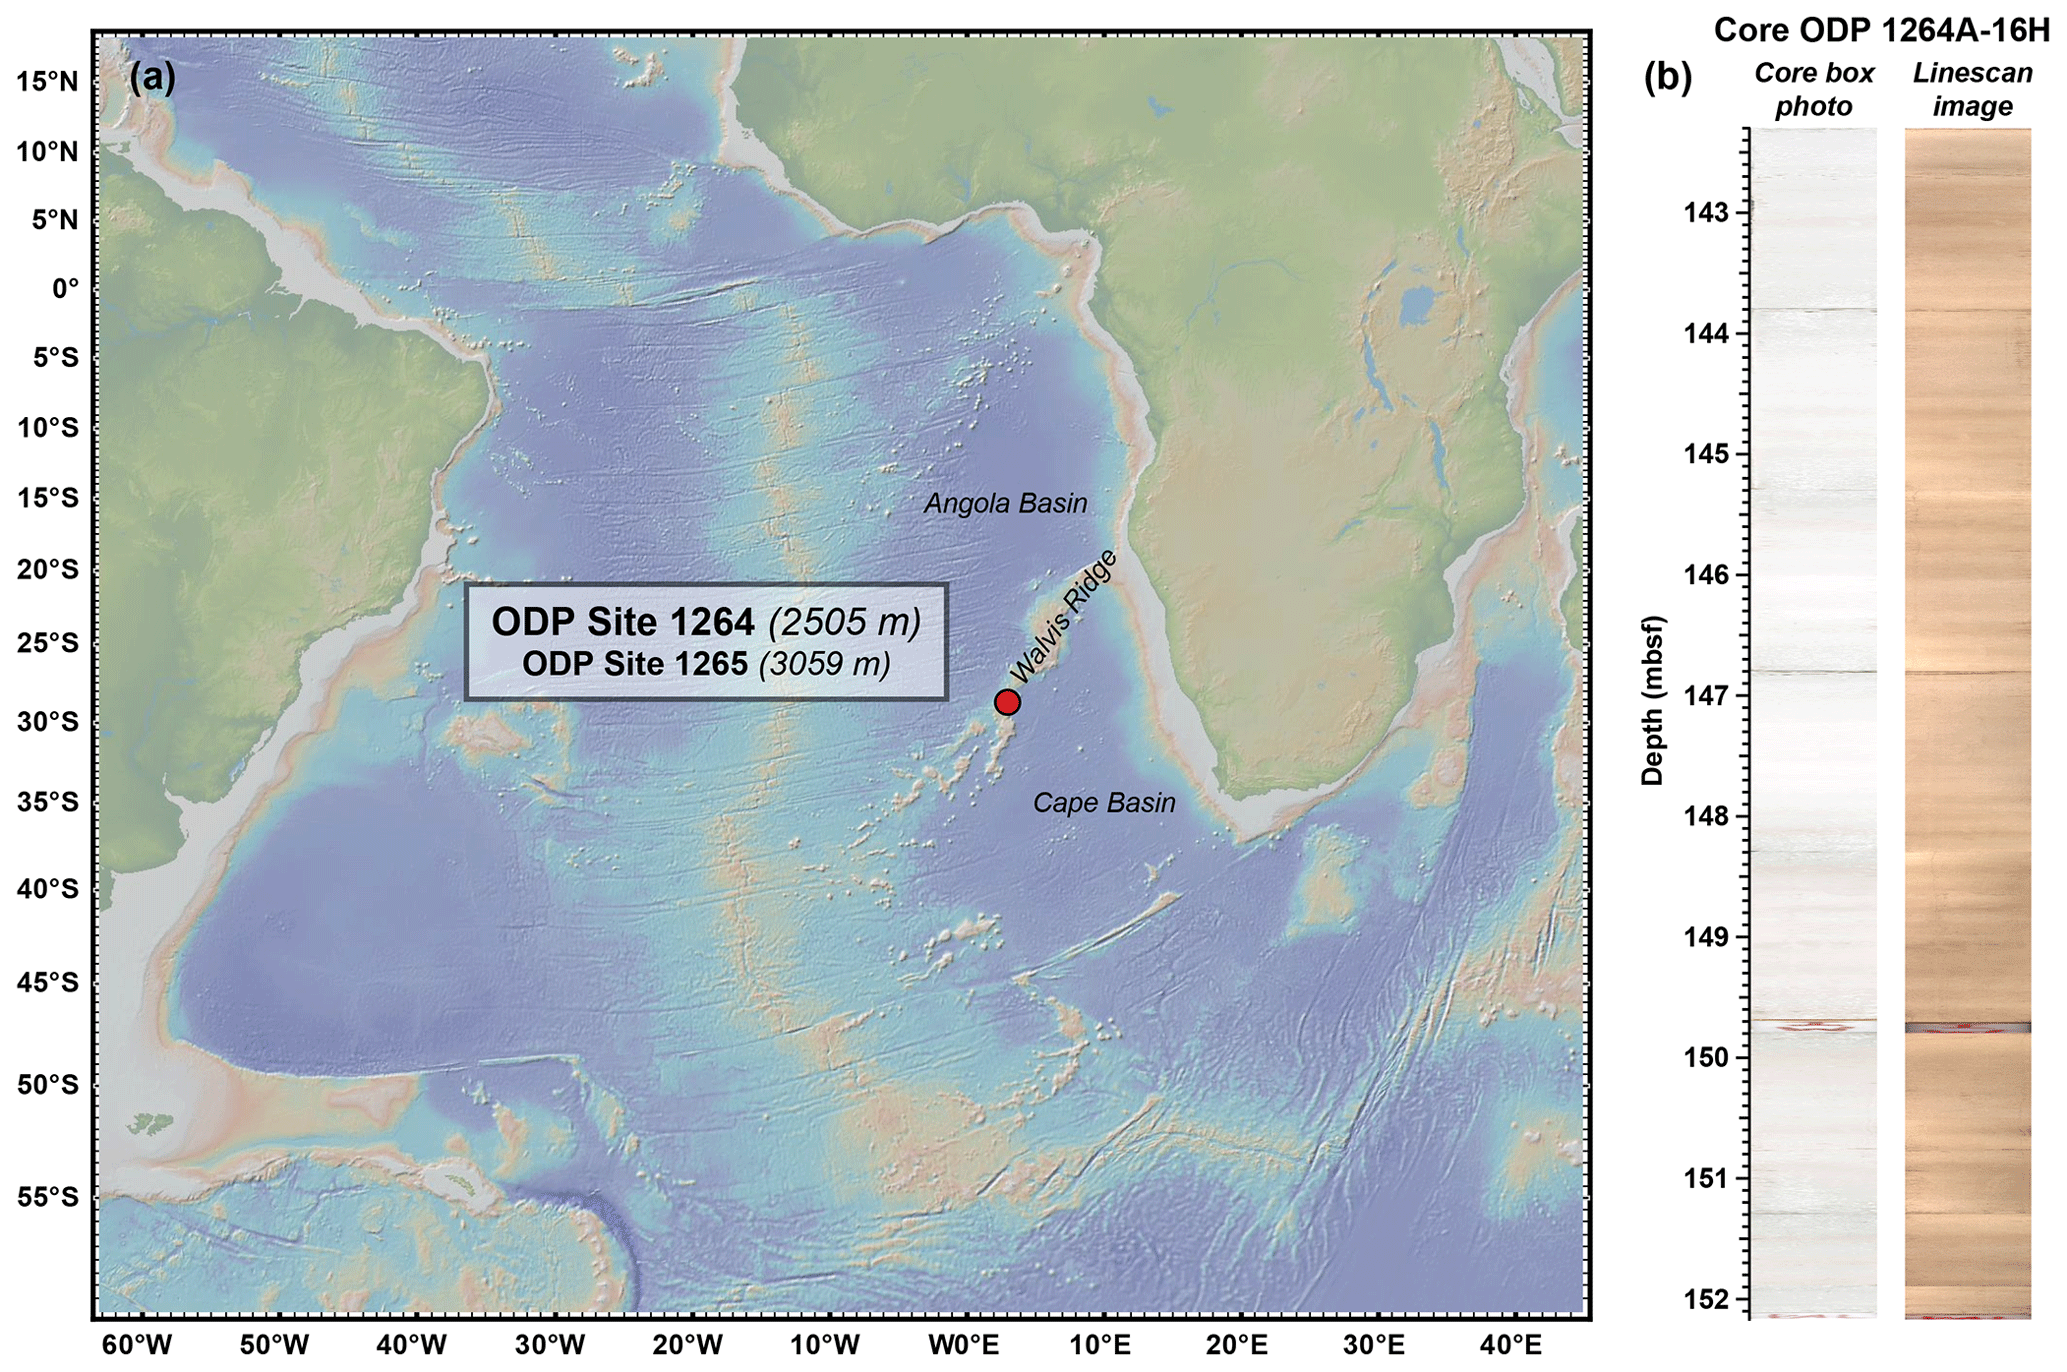
Figure 1(a) Site overview showing location of Sites 1264 and 1265 on the Angola Basin side of Walvis Ridge, as well as (b) the differences between core box photos and line scan images compiled with CODD. Figure made with GeoMapApp (http://www.geomapapp.org, last access: 9 September 2021)/CC BY/CC BY (Ryan et al., 2009).
2.2 Core images
To assist with splice verification, astronomical tuning and data interpretation, we compiled composite core images for ODP Site 1264 from both cropped line scan images and core table-top photos (JANUS – http://www-odp.tamu.edu/database/, last access: May 2020 for core table-top photos and November 2014 for line scan images) using Code for Ocean Drilling Data (CODD 2.1 – http://www.codd-home.net, last access: May 2021; Wilkens et al., 2017). After cropping the original line scan images, core section images were compiled into a single image for each core and scaled to depth using the “Includes_Core_Image_Assembly” functions. The line scan images obtained during ODP Leg 208 “Walvis Ridge” are redder in colour than they appear in the core table-top photos. This is likely an artefact of the line-scanning calibration, which had only recently been introduced at the time (Fig. 1). The individual core images were also compiled from lighting-corrected table-top core box photos using the “Includes_Core_Table_Photos” functions. These table-top core box images more realistically represent the original colour of the cores. However, because the core-box-derived images are exceptionally white, we preferentially use the line-scan-derived images, as the sedimentary cyclicity at Site 1264 is better visible in these images, and thus these are more beneficial to evaluating and revising the stratigraphic splice together with XRF and physical property data (see Fig. 2; Sect. 2.3 and 3.1). The individual core box and line scan core images were then combined into a single composite image along the revised Site 1264 splice using the “SpliceImages” function. The individual core box and line scan core images from Site 1265 (Westerhold et al., 2017) were spliced into the four Oligocene–early Miocene core gaps in the Site 1264 splice image using the Site 1264 to Site 1265 ties from Liebrand et al. (2016) updated to accommodate any splice revisions (see also Sect. 3.1 and Fig. S5 and Table S5 in the Supplement). This resulted in a continuous spliced image of the sedimentary succession at Site 1264–1265 spanning the early Oligocene to present day.
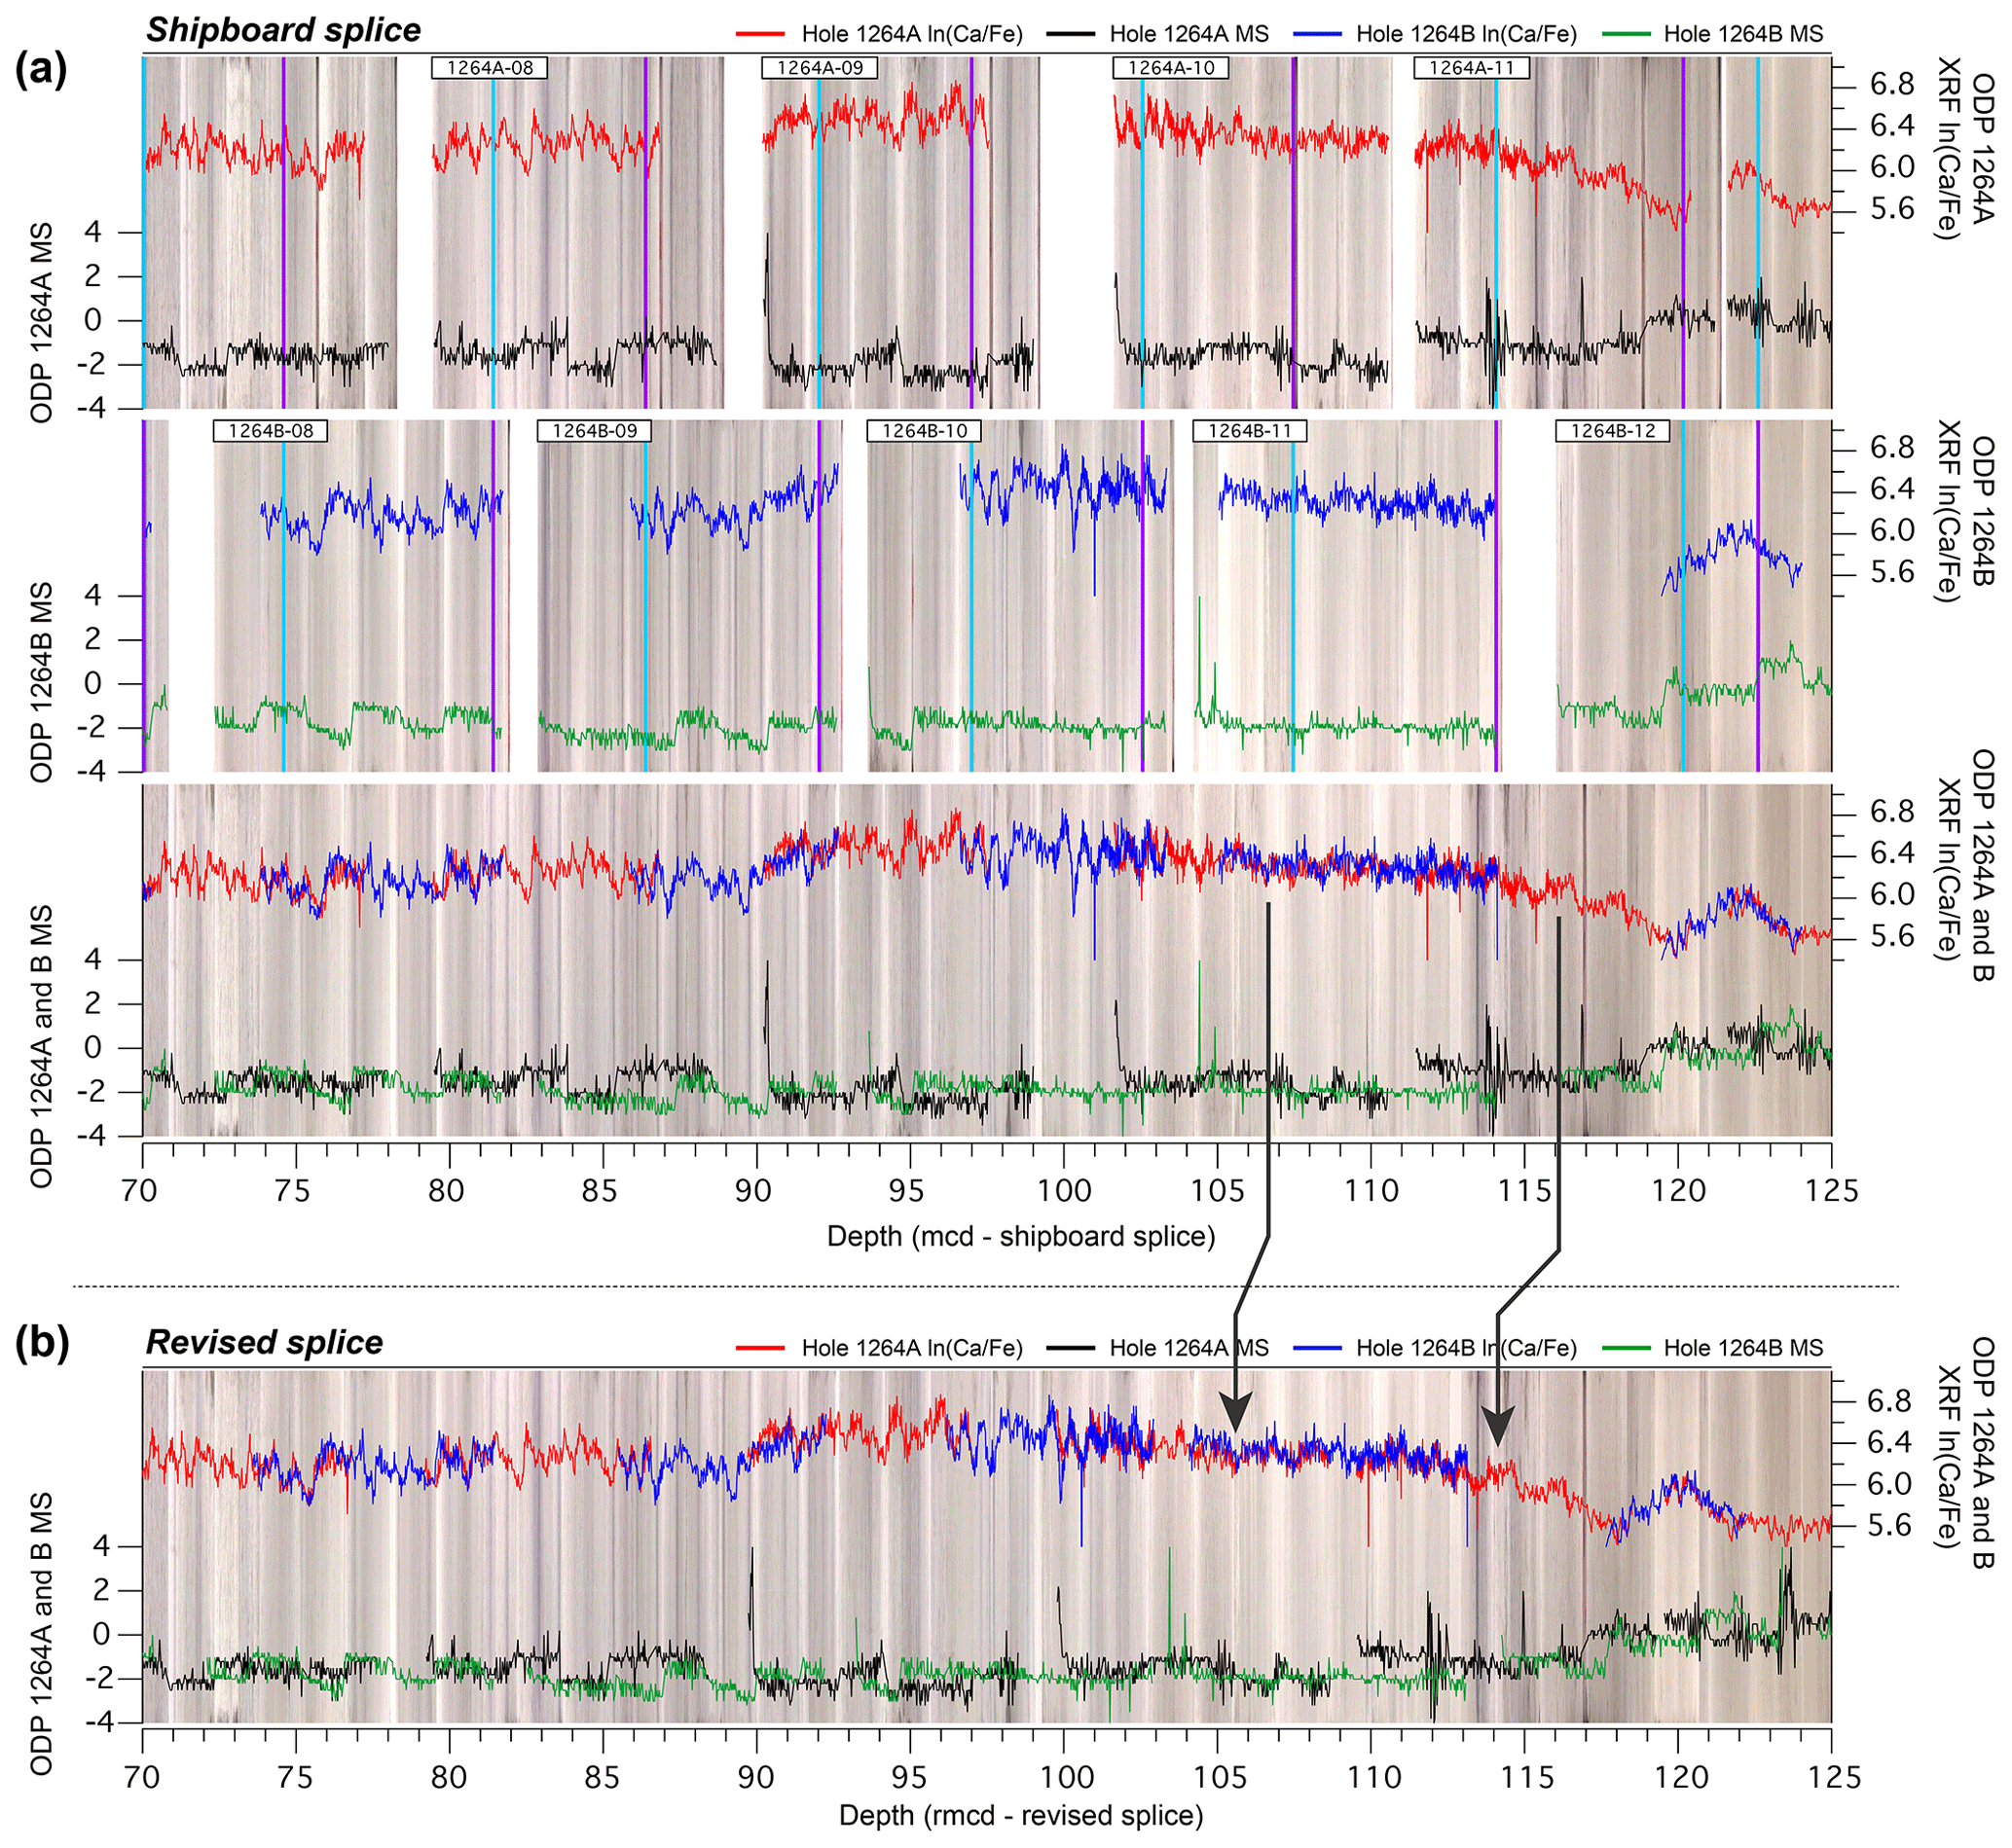
Figure 2Overview of main splice change between the shipboard splice (a) and the revised splice presented in this study (b). The interval between arrows on the splice was revised based on the ln(Ca Fe) data. The shipboard magnetic susceptibility (MS) is too low amplitude in the late Miocene in particular to robustly revise the splice, whereas ln(Ca Fe) data showed the sedimentary variability well. In certain high CaCO3 intervals Ba counts were also used to revise the composite splice (Fig. S3). The individual holes are shown for the shipboard splice only, with splice intervals shown between consecutive turquoise (top) and purple (bottom) vertical lines.
2.3 X-ray fluorescence core scanning
XRF core scanner data were collected at ODP Site 1264 between 0 and 205 rmcd (revised metres composite depth, this study) to connect with previously published XRF core-scanning data spanning 205–315.96 rmcd (Liebrand et al., 2016). The new XRF data were generated in four measurement campaigns in 2011 (195–205 rmcd), 2013 (29.21–153.28 rmcd), 2017 (141.49–195.12 rmcd) and 2018 (0–33.35 rmcd). Ca, Fe, K, Mn, Si and Ti were measured directly at the core surface of Site 1264 archive halves using a 10 kV run at 1–2 cm resolution over a 1.2 cm2 area with a slit size of 10 mm down-core and 12 mm cross-core with XRF Core Scanner II/III (AVAATECH serial no. 2/12) at the MARUM – University of Bremen. In 2018, Ba and Sr were additionally measured with the same slit conditions using a 50 kV run across intervals that proved more problematic to accurately correlate between holes. The following settings were used: in 2011, 10 kV/0.15 mA/10 s count time/Cl-Rh filter on the MARUM XRF III (see also Liebrand et al., 2016); in 2013, 10 kV/0.2 mA/15 s count time/Cl-Rh filter on the MARUM XRF III; in 2017, 10 kV/0.15 mA/15 s count time/no filter on the MARUM XRF II; and in 2018, 50 kV/0.5 mA/7 s count time/Cu filter and 10 kV/0.035 mA/7 s count time/no filter on the MARUM XRF III. The split core surface was covered with a 4 µm thick SPEXCerti Prep Ultralene1 foil to avoid contamination of the XRF measurement unit and desiccation of the sediment. Selected intervals were rerun during successive campaigns to account for differences in measurement intensity between datasets, including with the published Liebrand et al. (2016) data. All data were inspected directly following collection, and outliers were removed if they were clearly associated with cracks and/or uneven sediment surface. A further four measurement points, often at section ends, were removed because intensities were unrealistically low. The XRF datasets collected in 2011, 2013 and 2017 were calibrated to the 2018 dataset using an individual linear regression for each element (see Supplement and Figs. S1 and S2). The 2011 XRF dataset includes the data originally published in Liebrand et al. (2016). All XRF core-scanning intensity data and derived information are reported in Table S1.
2.4 XRF-derived CaCO3 estimates and CaCO3 MARs
Liebrand et al. (2016) showed that the XRF ln(Ca Fe) ratio shows a strong positive correlation with shipboard coulometric CaCO3 data from Site 1264 (Shipboard Scientific Party Leg 208, 2004a). We use a similar approach to generate a continuous record of CaCO3 content using the combined Site 1264 XRF ln(Ca Fe) dataset calibrated to the shipboard CaCO3 data (%CaCO; r2 = 0.622; Fig. S6). The Oligocene–early Miocene calibration used by Liebrand et al. (2016) is within the 2σ uncertainty of the new %CaCO3 calibration, which equates to ±2.2 % in the calibrated %CaCO3 dataset. The uncertainty in the calibration likely originates from the scatter of the shipboard coulometry-derived %CaCO3 data that were used in the calibration. This uncertainty only pertains to the absolute %CaCO3 values. The trends and cyclicity observed in the calibrated CaCO3 data are independent of this uncertainty, as these patterns are present in the raw ln(Ca Fe) time series.
The new and recalibrated %CaCO3 data from Site 1264 were combined with the %CaCO3 data from Site 1265 (Liebrand et al., 2016) to form a ∼ 315 m/∼ 30 Myr continuous record of CaCO3 content at Walvis Ridge. Bulk and CaCO3 mass accumulation rates (MARs; g cm−2 kyr−1) were calculated using the following formulas:
The LSR (here in cm kyr−1) were calculated using the new astrochronology (Sect. 4). Dry bulk density ρdry (g cm−3) was estimated using the shipboard gamma ray attenuation (GRA) bulk density data calibrated to the shipboard discrete dry density data (Shipboard Scientific Party Leg 208, 2004a) (Fig. S7). The uncertainty in the MARs is difficult to quantify. The largest uncertainties affecting bulk, CaCO3 and detrital MARs arise from uncertainties in the ρdry, which was calculated using shipboard GRA and discrete dry density data, and the LSR, both of which are difficult to estimate. CaCO3 MARs additionally have ±2.2 % 2σ calibration uncertainty. However, as %CaCO3 is so high at Site 1264, the %CaCO3 calibration uncertainty will have a smaller affect compared with the changes in LSR. Because detrital MARs are low and calculated using the difference between bulk and CaCO3 MARs, changes in detrital MARs should be treated cautiously.
3.1 Site 1264 splice revision, off-splice mapping, and the Site 1264 to Site 1265 correlation
The line scan core photos and XRF data, especially the ln(Ca Fe) and Ba data, show that there are several misalignments in sedimentary features when using the shipboard composite depth scale, leading to duplicated and/or missing intervals in the shipboard splice (Fig. 2). These misalignments are especially pronounced in intervals where the shipboard physical property data was low amplitude due to very high CaCO3 content, e.g. during the late Miocene–early Pliocene interval. Predominantly using the XRF ln(Ca Fe) ratio, the shipboard splice was verified between 0 and 205 rmcd and revised where needed (Figs. 2 and S3; Tables S2 and S3). Where the inter-hole correlation based on the ln(Ca Fe) ratio was ambiguous, the Ba data were used (see Fig. S3). Revisions were made between 27 and 149 rmcd and generally resulted in changes of less than 0.6 m relative to the shipboard composite depth (Tables S2 and S3), with the exception where Core 1264A-11H was shifted by −1.26 m relative to Core 1264B-11H to improve the correlation (Fig. 2). The core images, the new ln(Ca Fe) data, and shipboard 600/450 nm colour reflectance and MS data (Shipboard Scientific Party Leg 208, 2004a) were also used to map off-splice intervals of Holes 1264A and 1264B onto the splice between 0 and 196.13 rmcd (Table S4).
Liebrand et al. (2016, 2018) previously revised the Oligocene–early Miocene interval of the composite depth scale, stratigraphic splice and mapping pairs for Site 1264, as well as the Site-to-Site correlation between Sites 1264 and 1265. The revisions in the upper sedimentary succession (0–205 rmcd) result in a cumulative shift of −1.96 m to the Liebrand et al. (2016, 2018) Site 1264 composite depth scale, stratigraphic splice, mapping pairs and Site 1264 depths in the Site 1264 to Site 1265 correlation between 196.13 and 315.96 rmcd (Tables S2–S5). Furthermore, the line scan composite core photos showed that the mapping of Core 1264B-29H to the splice, erroneously corrected in Liebrand et al. (2018) from original mapping in Liebrand et al. (2016), should be adjusted (see Fig. S4 and Table S4). The composite depth scale and splice revisions resulted in two small gaps in the Plio-Pleistocene Site 1264 isotope record (Bell et al., 2014): ∼ 15 cm (∼ 17 kyr) between 27.25–27.40 rmcd and ∼ 25 cm (∼ 11 kyr) between 54.18–54.43 rmcd, which were filled with new isotope data (Westerhold et al., 2020).
3.2 Site 1264 XRF intensities, CaCO3 estimates and MARs
The XRF-derived CaCO3 content at Site 1264 is generally high throughout, ranging between minimum values of 92 % and maximum values of 97 % (Fig. 3). The range of observed %CaCO3 variability is close to the 2.2 % uncertainty associated with the calibration. However, we are confident that both the long-term trends and short-term variability discussed below represent true changes in carbonate content, as these patterns originate in the original ln(Ca Fe) ratio. The calibration uncertainty is most relevant to the absolute carbonate content. The recalibrated CaCO3 content span 93 %–96 % between ∼ 205 and ∼ 316 rmcd (early Oligocene–early Miocene), which agrees within error with the original calibrated CaCO3 content reported and discussed in detail by Liebrand et al. (2016). The lowest CaCO3 content (92 %–93 %) occurs between 205 and 190 rmcd (middle Miocene). The CaCO3 content shows especially clear 0.5 m cycles in this interval. CaCO3 content increases slightly to 94 % between 190 and 180 rmcd (middle Miocene) and then remains around 94 %–95 % until ∼ 118 rmcd (early late Miocene). The CaCO3 content initially displays short 0.6 m cycles, but after ∼ 185 rmcd (middle Miocene), 0.2–0.3 m cycles are superimposed upon ∼ 1–2 m cycles. CaCO3 content then undergoes a two-step rapid increase to 96 % between ∼ 118 and 110 rmcd and again to 97 % between 105 and 100 rmcd (both latest Miocene). CaCO3 content remains around 97 % until 90 rmcd, after which the CaCO3 content decreases slightly to around 96 % until 40 rmcd (early Pliocene). Between ∼ 118 and ∼ 40 rmcd (latest Miocene–early Pliocene), ∼ 1.0 m cycles and occasionally ∼ 0.5 m cycles are prevalent, although the amplitude of the short-term cycles is reduced compared to the deeper interval. CaCO3 content slowly drops to 95 % by 15 rmcd (Pleistocene) and decrease further to 93 %–94 % in the upper 15 m of the record. Short-term cycles are less well expressed in this upper interval. The Si and K intensities are comparable throughout the record, although Si is generally slightly higher than K (Fig. 3). Both elements, together with Fe and Ti intensities, display the same short-term variability and long-term trends (Figs. 3 and S2), indicating that these elements reflect changes in aluminosilicates. As the trends of Si and K are inverse to those seen in the CaCO3 content, this supports that Site 1264 is predominantly composed of carbonate and clay, with minimal influence of biogenic silica. The amplitude of changes in Si and K becomes much smaller relative to CaCO3 content changes between ∼ 115 and 0 rmcd compared to between ∼ 315 and 115 rmcd.
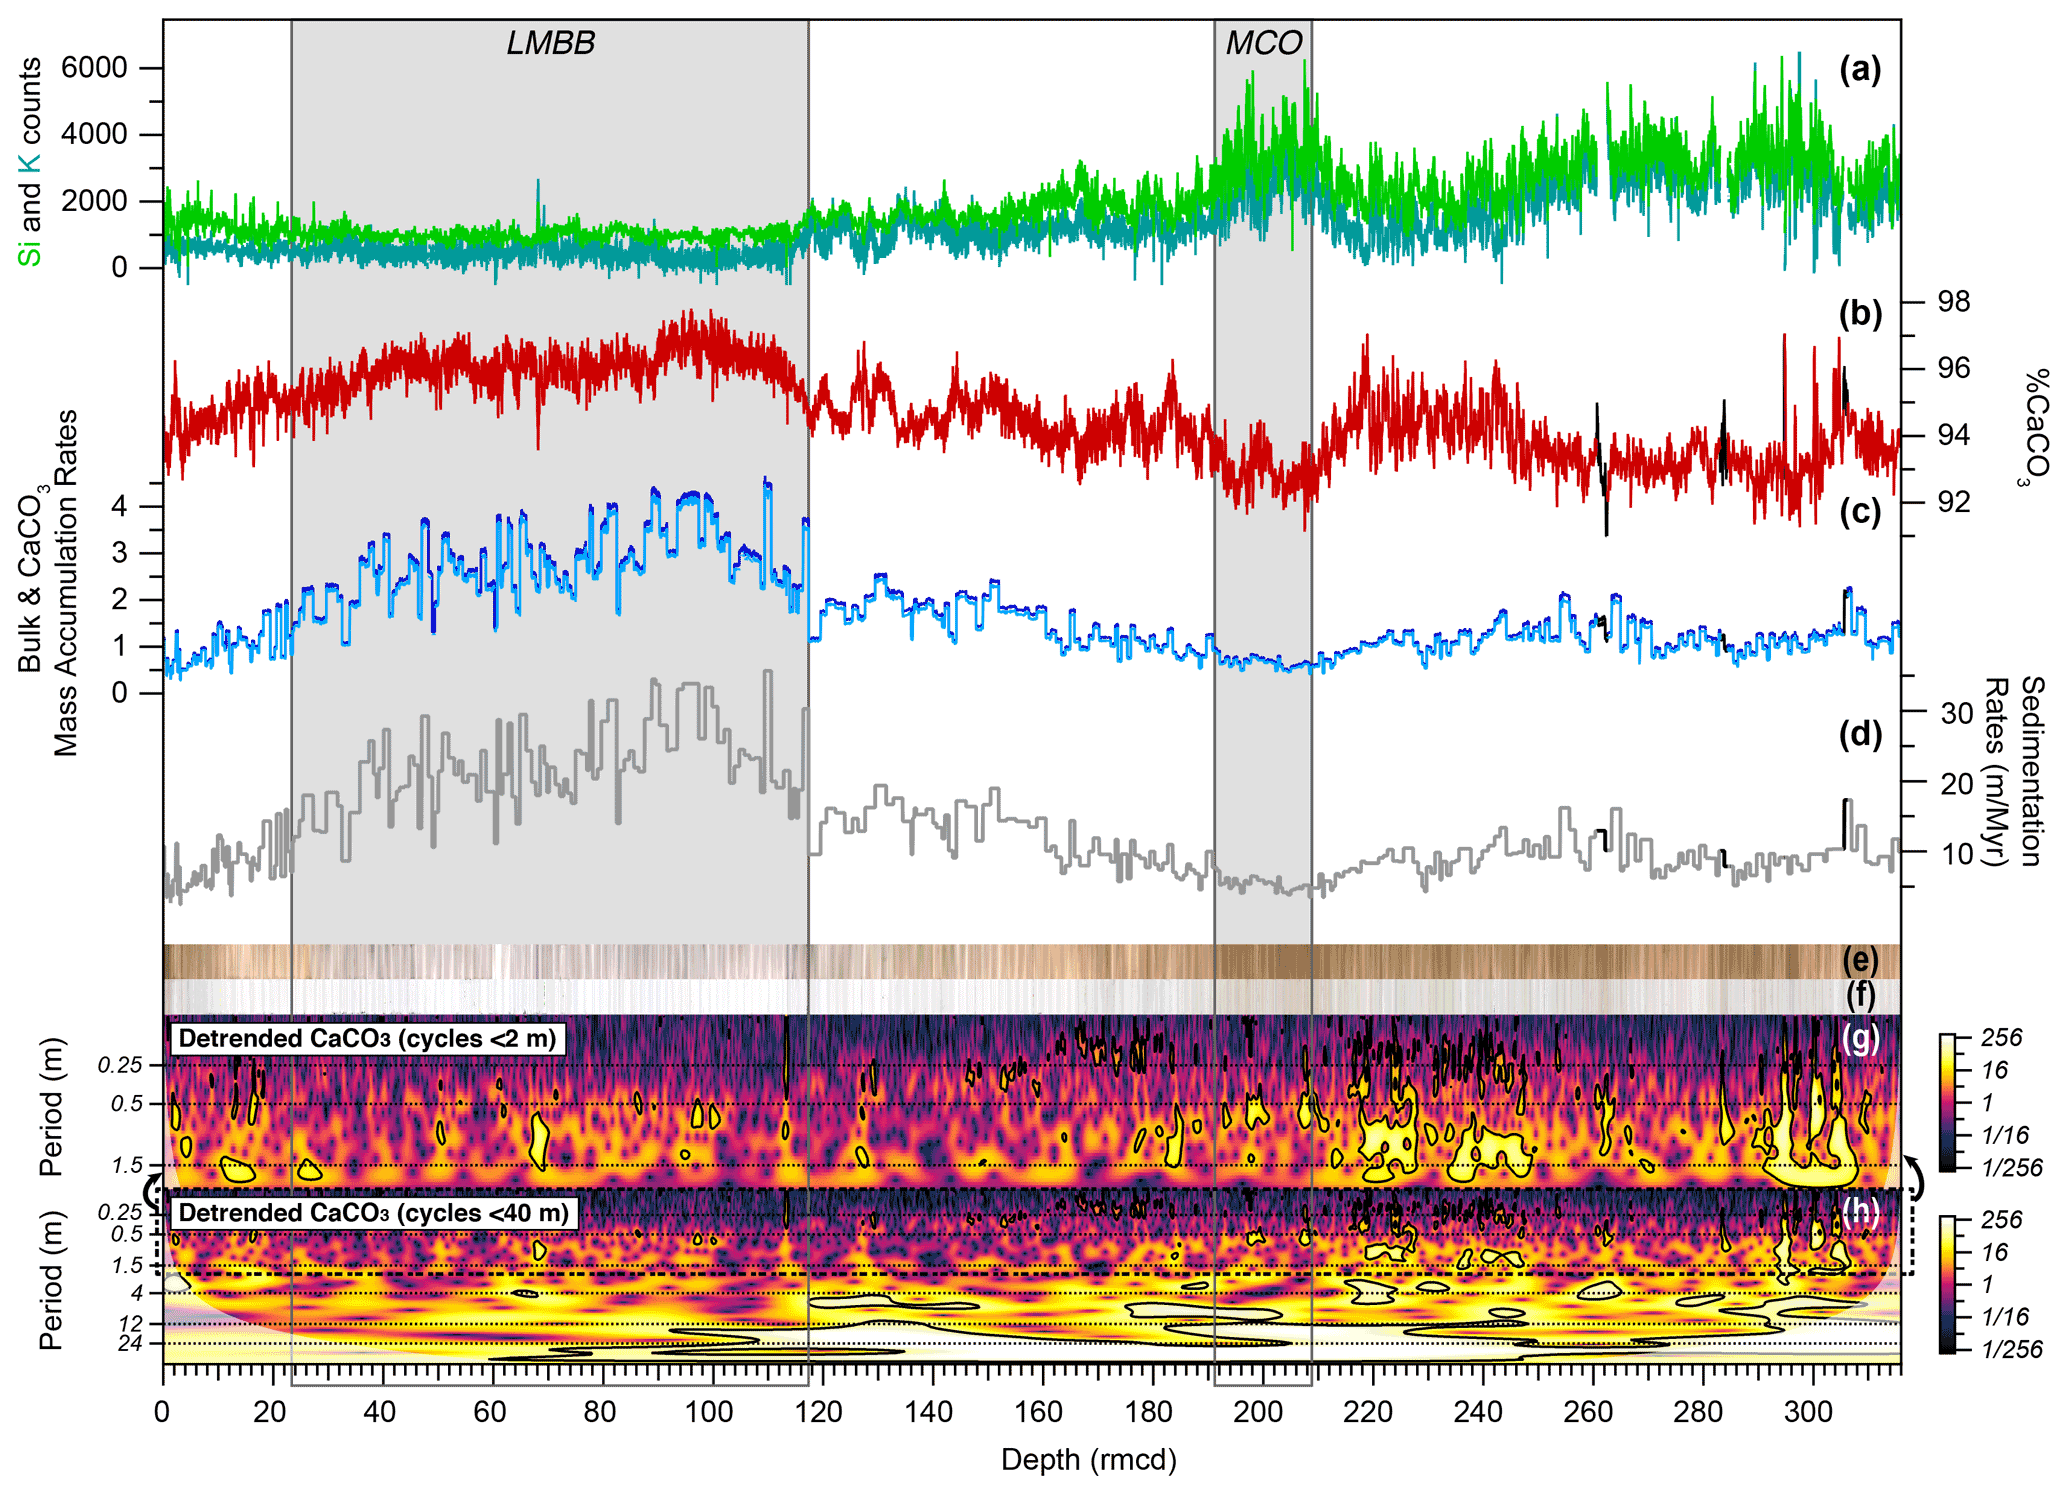
Figure 3On the new revised composite depth (rmcd) (a) Site 1264 XRF Si (green) and K (teal) intensities, (b) %CaCO3 data derived from ln(Ca Fe) for Sites 1264 (dark red) and 1265 (black), (c) bulk and CaCO3 MARs for Sites 1264 (bulk is dark blue; CaCO3 is light blue) and 1265 (bulk is black; CaCO3 is dark grey), (d) sedimentation rates in m Myr−1 for Sites 1264 (light grey) and 1265 (black), and the combined composite core photo for Site 1264–1265 compiled using line scan (e) and core box photo images (f). The depth-domain wavelet spectra are shown for the %CaCO3 data after it was detrended to remove all cycles greater than 2 m (g) or greater than 40 m (h). The periods are highlighted in metres. The wavelets were generated using the code from Torrence and Compo (1998) and Grinsted et al. (2004). The approximate stratigraphic location of the MCO and the LMBB are highlighted by shaded grey areas.
Because CaCO3 content accounts for > 90 % of the sediment mass, the bulk (0.3–4.7 g cm−2 kyr−1) and CaCO3 (0.3–4.5 g cm−2 kyr−1) MARs are remarkably similar, with trends controlled almost completely by variability in LSR (Fig. 3). LSR also strongly affect detrital MARs; however, these remain low throughout at Site 1264 (0.01–0.2 g cm−2 kyr−1). The Oligocene-early Miocene CaCO3 MARs generally oscillate between 1 and 2 g cm−2 kyr−1 from ∼ 315 to 205 rmcd. MARs are very low (∼ 0.3–0.7 g cm−2 kyr−1) between 205 and 190 rmcd, before slowly increasing to 1.0–2.5 g cm−2 kyr−1 between 190 and ∼ 118 rmcd. The highest CaCO3 MARs (2.5–4.5 g cm−2 kyr−1) occur between ∼ 118 and 35 rmcd, with values decreasing back to 1–2 g cm−2 kyr−1 after ∼ 35 rmcd. The highest frequency variability in the bulk and CaCO3 MARs results from changes in dry bulk density (Shipboard Scientific Party Leg 208, 2004a); however, this variability is smaller than that variability reflecting the changing resolution of the astrochronology (see Sect. 4.2).
4.1 Cyclostratigraphy and initial bio-/magnetostratigraphic age model
Here, we describe the imprint of cyclic patterns on the Site 1264 CaCO3 content (Fig. 3). New cyclostratigraphy covers the upper ∼ 205 m of the sedimentary succession at Site 1264, which corresponds to strata of middle Miocene to late Pleistocene age. Cyclostratigraphy of the lowermost ∼ 111 m from Site 1264 (between ∼ 205 and ∼ 316 rmcd), which corresponds to the early Oligocene to early Miocene time interval, was previously described in great detail (Liebrand et al., 2016). A cycle interpretation and age model were also previously presented for the upper ∼ 57 m from Site 1264 (Bell et al., 2014); however, due to several splice revisions between 27 and 55 rmcd (see Sect. 3.1) we briefly re-evaluate the cycle imprint on this part of the record (see Sect. 4.1.3 and 4.1.4).
The upper ∼ 205 m is split into four intervals that are characterised by distinct cyclic patterns and/or average sedimentation rates (Sect. 4.1.1, 4.1.2, 4.1.3 and 4.1.4). We apply an 11th order polynomial age model computed on selected (i.e. high-quality) biostratigraphic and magnetostratigraphic depth-age points to obtain a first-order approximation of the durations of the cycles that we identify in the depth domain (see Table S6, Figs. S8 and S9). After applying the polynomial age model, the record was tuned to generate an astrochronology (Sect. 4.2; Figs. 4 and S10).

Figure 4Overview of the new astrochronology for the last 30 Myr. The four panels show the different tuning strategies employed. (I.a) 30–9.7 Ma: CaCO3(/benthic δ18O) to eccentricity; (I.b) 9.7–8.0 Ma: CaCO3 to E(T); (II) 8.0–3.3 Ma: CaCO3(/benthic δ18O) to ET–P; and (III) 3.3–0.0 Ma: benthic δ18O to LR04. The composite core photo compiled from line scan images is used here as it highlights the sedimentological cyclicity best. Zoomed in figures showing the exact depth-age tie points are shown in Fig. S10.
4.1.1 Depth interval between 205 and 190 rmcd
The depth-domain wavelet analysis of the CaCO3 content between 205 and 190 rmcd highlights the lithological cycles in %CaCO3, which broadly varies around 2 and 0.5 m in length (Fig. 3) The biostratigraphic and magnetostratigraphic (bio-magnetostratigraphic) age model indicates that the LSR vary around 5 m Myr−1. Applying this LSR to the 2 and 0.5 m cycles yield durations of approximately 405 and ∼ 110 kyr, respectively. These durations are in very close agreement with the strong eccentricity pacing of CaCO3 content variability found for the underlying early Oligocene–early Miocene sediment package (Liebrand et al., 2016). We infer that eccentricity pacing of the carbonate record remained dominant from the base of Site 1264 to ∼ 190 rmcd regardless of the changes in LSR, which were lower between 205 and 190 rmcd compared to the deeper interval (Fig. 3). This interpretation is in agreement with visual inspection of the data, which shows bundling of ∼ 110 kyr cycles (e.g. the ∼ 95 and ∼ 125 kyr cycles) within longer 405 kyr cycles (Figs. 3 and 4I.a).
4.1.2 Depth interval between 190 and 115 rmcd
The depth interval between 190 and 115 rmcd is marked by cycles that gradually shift from 0.2 to 0.3 m, from ∼ 1 to ∼ 2 m, and from ∼ 4 to ∼ 6 m respectively in the depth-domain wavelet analysis of the CaCO3 data (Fig. 3). The bio-magnetostratigraphic age model indicates that these gradually shifting, quasi-stable cyclicities in the depth domain reflect low but gradually increasing LSR from ∼ 10 m Myr−1 between 190 and 160 rmcd to ∼ 15 m Myr−1 between 160 and 115 rmcd. Based on this initial age model, we tentatively link the 0.2 to 0.3 m cycles to precession, the ∼ 1 to ∼ 2 m cycles to ∼ 110 kyr eccentricity and the ∼ 4 to ∼ 6 m cycles to 405 kyr eccentricity (Fig. S9). These inferred durations of these cycles correspond to known ratios between precession, short and long eccentricity of five precession cycles per ∼ 110 kyr cycle, and about four ∼ 110 kyr cycles per 405 kyr cycle. Overall, the bio-magnetostratigraphic age model suggests that the ∼ 110 kyr eccentricity cycle remains the most strongly expressed cycle between 17 and 13 Ma, in line with the strong ∼ 110 kyr eccentricity cycles observed between 30 and 17 Ma (see Sect. 4.1.1 and Liebrand et al., 2016). Strong ∼ 110 kyr eccentricity cycles were also noted in this interval in the equatorial Pacific (Kochhann et al., 2016). The presence of a weak 405 kyr signal in the Site 1264 CaCO3 content contrasts with the Oligocene interval, for which no uniform imprint of the 405 kyr cycle on CaCO3 content could be discerned (Liebrand et al., 2016).
4.1.3 Depth interval between 115 and 35 rmcd
Because of several splice revisions in the upper 55 rmcd of Site 1264 (see Sect. 3.1.), we deem a modest re-evaluation of the cyclostratigraphy for this interval beneficial for subsequently obtaining a final tuned age model (see also Sect. 4.1.4.), even though detailed investigations were previously made (Bell et al., 2014). Visible inspection of the CaCO3 content data and the associated depth-domain wavelet analysis both show that there is short-term cyclicity present in the data between 115 and 35 rmcd (Fig. 3). However, the amplitude of these cycles is much reduced in comparison to the previous depth intervals, which means that the cycles are not statistically significant above the 95 % level in the depth-domain wavelet analyses. Nevertheless, we document depth periodicities of ∼ 0.5, ∼ 1, ∼ 3–4, and ∼ 10–12 m. We compute average LSR of 20 to 30 m Myr−1 based on the bio-magnetostratigraphic ages and tentatively infer that these depth cycles are respectively linked to the 20 kyr precession (∼ 0.5 m), the 40 kyr obliquity (∼ 1 m), and the ∼ 110 and 405 kyr eccentricity cycles (∼ 3–4 and ∼ 10–12 m) (Figs. 3, S8 and S9). Between 55 and 35 rmcd, we visually derive an antiphase relationship between CaCO3 content data and benthic foraminiferal δ18O data (Fig. S11), which aids our tuning approach for this interval (see Sect. 4.2.2).
4.1.4 Depth interval between 35 and 0 rmcd
At Site 1264, clear cyclicity is generally hard to observe in the upper interval of the depth-domain CaCO3 content wavelet analysis, except for the presence of occasional stronger ∼ 1.0–1.5 m cycles. Visually, we can identify higher-frequency cycles in the CaCO3 content data; however, the amplitude of these cycles is muted compared to the cycles observed between 115 and 35 rmcd. Benthic foraminiferal δ18O maxima (Bell et al., 2014) appear to coincide with CaCO3 content minima in the upper 35 m; however, this phase relationship is not well defined throughout this interval and becomes less clear at the top of the record. We derive averaged LSR of < 10 m Myr−1 for 0–35 rmcd based on the initial bio-magnetostratigraphic age model. The observed 1.0 to 1.5 m cycles are probably linked to the ∼ 110 kyr eccentricity paced cycles or the main ice age cycles of the middle and late Pleistocene. This would indicate a change in response of both benthic foraminiferal δ18O and CaCO3 content during this time interval, in line with the evolution of the global cryosphere and climate systems during this time (Bailey et al., 2013). Based on the initial age model we note an absence of clear precession and obliquity-paced cyclicity in both benthic foraminiferal δ18O and CaCO3 content records during the last 2.5 Ma (Fig. S9).
4.2 Astronomically tuned age model
Two published astrochronologies exist for Site 1264–1265: (1) an Oligocene–early Miocene one (30 to 17 Ma), based on tuning CaCO3 content to eccentricity (Liebrand et al., 2016), and (2) a Plio-Pleistocene one (5.3 to 0 Ma) based on a correlation of the Site 1264 benthic foraminiferal δ18O record to the LR04 Plio-Pleistocene benthic δ18O stack (Lisiecki and Raymo, 2005; Bell et al., 2014). Because of the splice revisions between 27 and 149 rmcd at Site 1264, we re-evaluated the Bell et al. (2014) chronology in the early Pliocene prior to 3.5 Ma/∼ 27 rmcd. The Oligocene to early Miocene astrochronology remains unchanged, but we updated the depth–age tie points to accommodate the cumulative −1.96 m shift in the revised composite depth scale of the overlying sedimentary sequence. The cyclostratigraphic analyses in the depth-domain indicate that the combined Site 1264–1265 CaCO3 content record is suitable for developing an astrochronology for the interval 17–3.5 Ma (see Sect. 4.1) using the flexible best-practice guidelines outlined in Sinnesael et al. (2019). Because of the variable imprint of eccentricity (E), obliquity (T) and precession (P) recorded at Site 1264, it was not possible to implement a uniform tuning strategy for the entire record. In all, we employed three distinct strategies to achieve a 30 Myr astrochronology for Site 1264 (Table S7 and Fig. S10):
- I.
30–8.0 Ma: CaCO3 content tuned to eccentricity; obliquity is also used in 2.4 Myr minima (when stable in the solution).
- a.
30–9.7 Ma: CaCO3 content tuned to E (visually aided by δ18O, where available).
- b.
9.7–8.0 Ma: CaCO3 tuned content to E(T).
- a.
- II.
8.0–3.3 Ma: CaCO3 content tuned to ET−P (visually aided by δ18O, where available).
- III.
3.3–0.0 Ma: benthic δ18O tuned to LR04.
4.2.1 Early Oligocene–late Miocene (30.0–8.0 Ma)
Liebrand et al. (2016) showed that CaCO3 content maxima between 30 and 17 Ma coincide with benthic δ18O maxima, which are both antiphase with the ∼ 110 kyr eccentricity components. They generated an astrochronology by tuning CaCO3 content minima to eccentricity maxima (see Liebrand et al., 2016, for details). As the variability and dominant cyclicity in CaCO3 content for the 17–8 Ma interval are comparable to the 30–17 Ma interval (see Sect. 4.3.1 and 4.3.2), we consider the inverse phase relationship between CaCO3 content and ∼ 110 kyr eccentricity to be valid between 30 and 8 Ma. We therefore also employ the Liebrand et al. (2016) tuning strategy of CaCO3 content minima to eccentricity maxima between 17 and 8 Ma (Fig. 4). When benthic foraminiferal stable isotope records become available for the interval between 17 and 8 Ma, the stability of the Oligocene–late Miocene phase relationship between CaCO3 content and ∼ 110 kyr eccentricity can be tested.
The CaCO3 content to eccentricity tuning strategy is very robust where the amplitude modulation of ∼ 110 kyr eccentricity is high; however, this amplitude is muted during 2.4 Myr eccentricity minima (∼ 17.0–16.6, ∼ 14.6–14.2, ∼ 12.6–12.2, ∼ 9.7–9.3 Ma). The imprint of obliquity is apparent in these 2.4 Myr eccentricity minima and can act as an alternative tuning target when ∼ 110 kyr eccentricity amplitude is reduced. However, because of uncertainties in past changes to tidal dissipation and dynamical ellipticity, the exact phase of obliquity is not known before 10 Ma (Lourens et al., 2005; Zeeden et al., 2013, 2014). We therefore apply two slightly adapted approaches of the Liebrand et al. (2016) tuning strategy to the 17–8 Ma interval.
- I.a.
From 17 to 9.7 Ma, we tune CaCO3 content minima to E maxima (La2004; Laskar et al., 2004), with an uncertainty better than ±50 kyr. This uncertainty increases to up to ±100 kyr in the 2.4 Myr minima at ∼ 17.0–16.6, ∼ 14.6–14.2 and ∼ 12.6–12.2 Ma (Fig. 4I.a).
- I.b.
From 9.7 to 8.0 Ma, we tune CaCO3 content minima to E(T) maxima (La2004; Laskar et al., 2004). Generally, the CaCO3 content minima are tuned to E maxima, with an uncertainty better than ±50 kyr. During the 2.4 Myr eccentricity minima ∼ 9.7–9.3 Ma, CaCO3 content minima are tuned to ET maxima (uncertainty up to ±40 kyr; Fig. 4I.b).
We chose to tune to the La2004 solution (Laskar et al., 2004), as over the last 30 Myr the eccentricity components are essentially identical to the La2011_ecc3L solution (Laskar et al., 2011) used in Liebrand et al. (2016). Furthermore, the obliquity solution used in the (I.b) approach is currently only available in the La2004 solution.
There was potential to develop an astrochronology at precession level, as the cyclostratigraphic analyses show that precession cycles are also imprinted in the CaCO3 content younger than 14 Ma (see Sect. 4.1). However, as uncertainties in past tidal dissipation and dynamical ellipticity mean the phase of precession is also uncertain before 10 Ma (Lourens et al., 2005; Zeeden et al., 2013), we chose a conservative strategy of only tuning to eccentricity prior to 9.7 Ma.
4.2.2 Late Miocene–mid-Pliocene (8.0–3.3 Ma)
After 8 Ma, the ∼ 110 kyr eccentricity imprint on CaCO3 content decreases significantly, whilst the imprint of obliquity and precession is more prevalent between 8 and 2.5 Ma. We therefore apply a different tuning strategy between 8.0 and 3.3 Ma to accommodate the change in prevalent cyclicity in the CaCO3 content from eccentricity–precession-driven content (older than 8 Ma) to obliquity–precession-driven content (younger than 8 Ma) (see Sect. 4.1). The contrasting relationship between benthic δ18O and CaCO3 content in the latest Miocene–Pleistocene compared to the Oligocene–early Miocene also indicates that different tuning approaches are warranted. Where latest Miocene–Pleistocene benthic δ18O and CaCO3 content are both available (6.0–3.3 Ma; Bell et al., 2014; Westerhold et al., 2020), the two proxies show an inverse relationship, with the obliquity- and precession-driven CaCO3 content minima coinciding with benthic δ18O maxima. This contrast to the Oligocene–early Miocene relationship between these proxies with the 110 kyr eccentricity-driven CaCO3 content minima coinciding with benthic δ18O minima (Liebrand et al., 2016). The late Miocene–Pleistocene phase relationship between benthic δ18O and obliquity is well established, with benthic δ18O minima coinciding with obliquity maxima (Shackleton et al., 1995; Shackleton and Hall, 1997; Hodell et al., 2001; Zeeden et al., 2013; Drury et al., 2017, 2018b). As the relationship between benthic δ18O and CaCO3 content is inverse after 6.0 Ma, we assume that CaCO3 content maxima correlate to obliquity maxima for the entire 8 to 3.3 Ma interval. Precession and obliquity are the two prevalent cyclicities present in both the CaCO3 content and benthic δ18O data. The interference pattern observed in both benthic δ18O and CaCO3 content is most similar to an ET−P solution. We therefore generated an astrochronology by tuning CaCO3 maxima to ET−P maxima guided by benthic δ18O where these are available (uncertainty up to ±10 kyr; Fig. 4II). Based on the shipboard biostratigraphy, there was some indication that there might be an unconformity of ∼ 0.6 Myr in the late Miocene at the base of Core 1264A-7H (∼ 76–77 rmcd) (Shipboard Scientific Party Leg 208, 2004a). However, we find excellent agreement between the CaCO3 content and the ET−P solution, with 80 and 75 rmcd correlating well with 6.3–6.1 Ma (Fig. 4II).
4.2.3 Mid-Pliocene–Pleistocene (3.3–0.0 Ma)
We used the original Bell et al. (2014) age model between 3.3 and 0 Ma because no changes were made to the shipboard splice in the upper 27 rmcd (3.5 Myr). The Bell et al. (2014) age model was generated by correlating a benthic foraminiferal δ18O stack comprising data from ODP Sites 1264 and 1267 to the LR04 δ18O stack (Lisiecki and Raymo, 2005). We validated the Bell et al. (2014) age model by comparing the Site 1264 δ18O record to the equatorial Atlantic CR17 δ18O stack (Wilkens et al., 2017), which has an independent tuning based on MS and lightness. The agreement between the 1264 and CR δ18O records is very good (Fig. 4III), which further supports the accuracy of the original Bell et al. (2014) age model in this interval.
5.1 History of South Atlantic CaCO3 deposition and its changing orbital pacing since the Oligocene
Previous work at ODP Site 1264 shows that the recovered sediments record the orbital climate variability of the Southeast Atlantic for the last 30 Myr (Shipboard Scientific Party Leg 208, 2004a; Bell et al., 2014, 2015; Liebrand et al., 2016). Oligocene to early Miocene carbonate and benthic δ18O records from Site 1264 show that the early Coolhouse was dominated by large ∼ 110 kyr eccentricity-driven variability in the Antarctic ice sheet (for full discussion, see Liebrand et al., 2016, 2017). By the Pliocene, Atlantic benthic δ13C gradients indicate that North Atlantic Deep Water (NADW) heavily influenced Southeast Atlantic Site 1264 (for full discussion, see Bell et al., 2014, 2015). The new complete and continuous depth (∼ 316 m; Sect. 3.1; Fig. 3) and age (∼ 30 Myr; Sect. 4; Fig. 4) model presented here constitutes a reference framework for future palaeoclimatic and palaeoceanographic studies at Site 1264. Furthermore, the new data (Fig. 5) enable investigation of how long-term climate trends and orbital-scale climate variability impacted this region, especially between 17 and 5 Ma, for which no high-resolution Southeast Atlantic records previously existed.
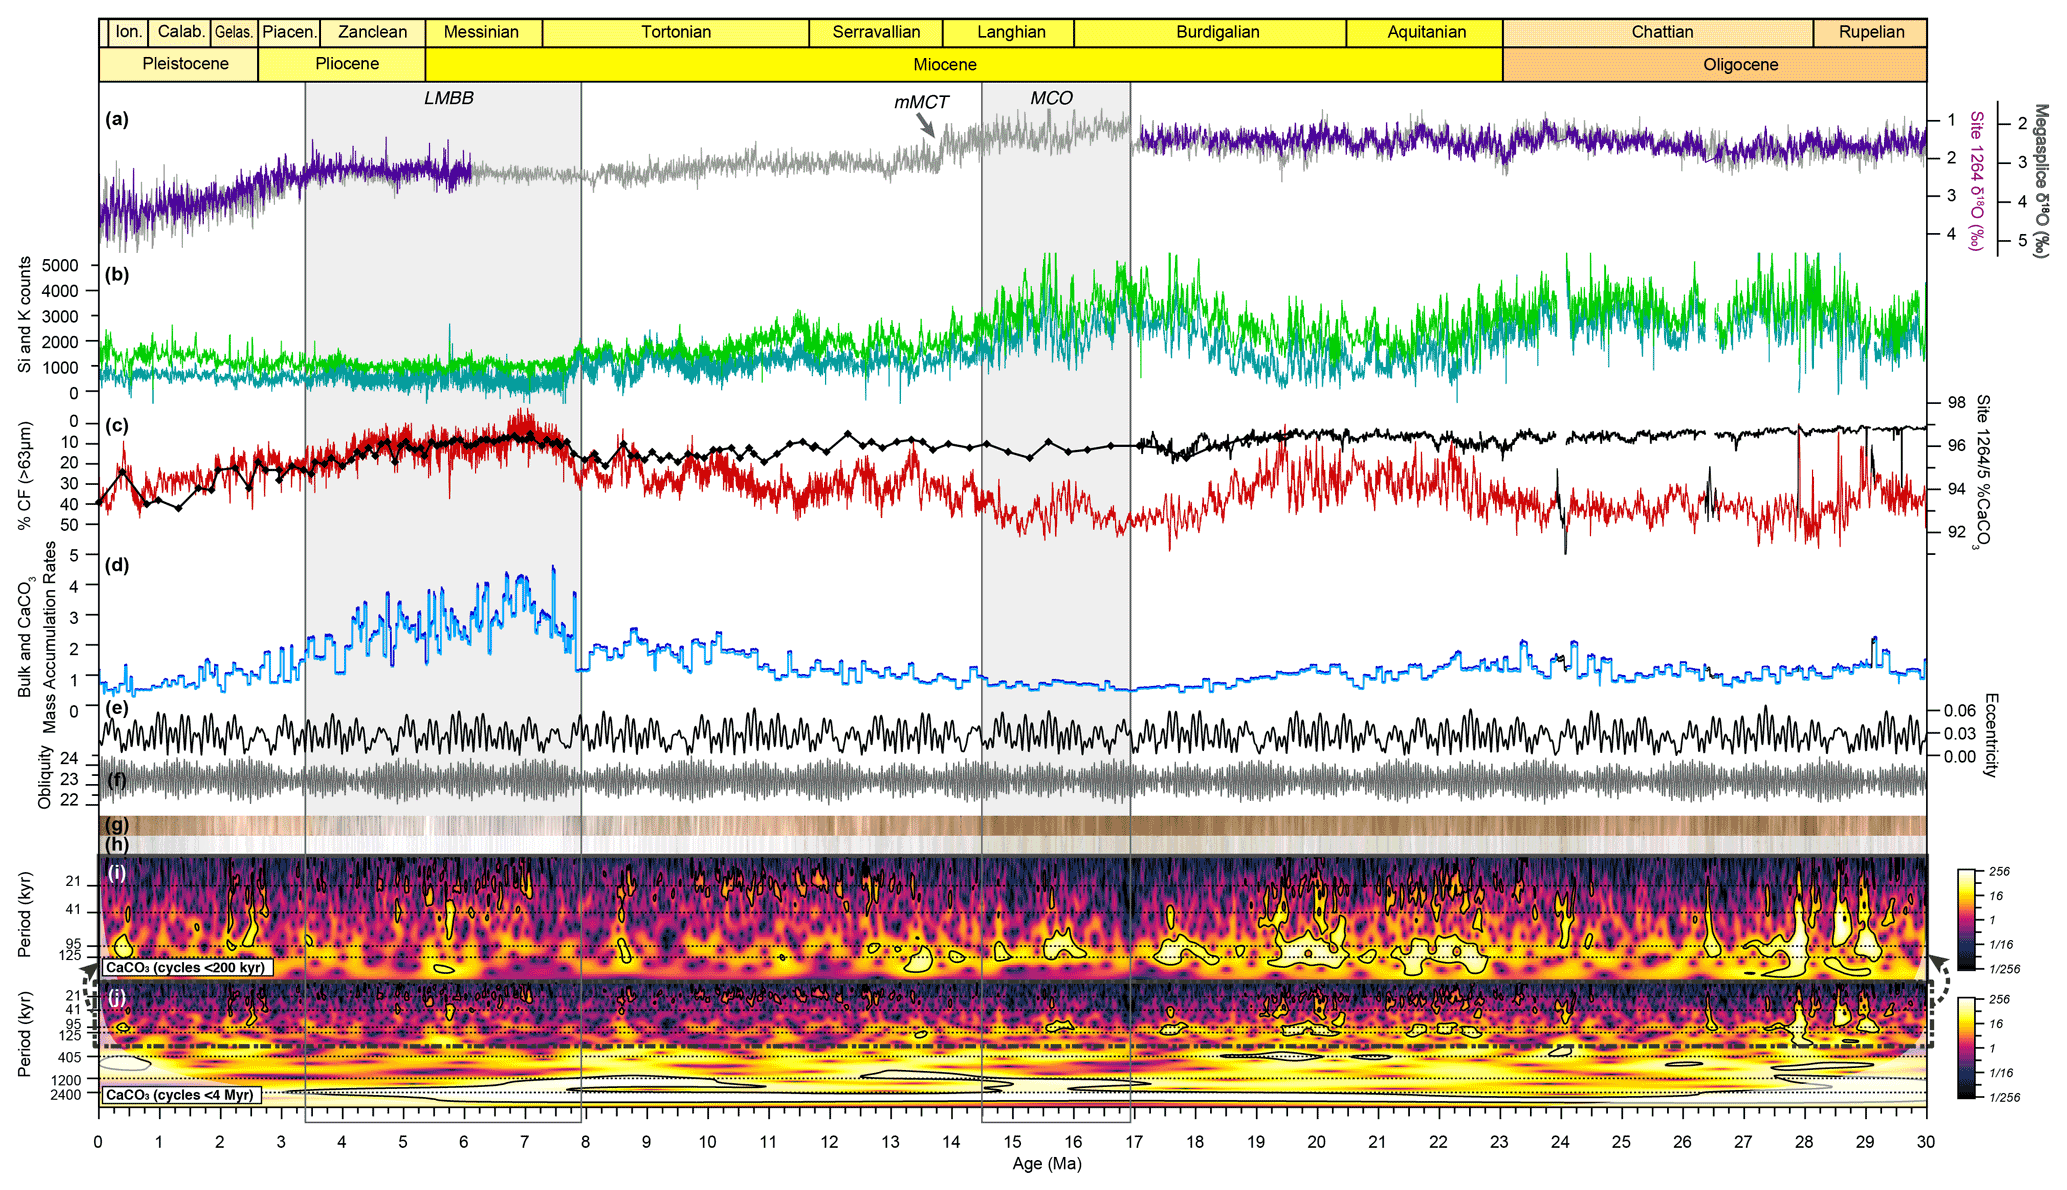
Figure 5New data from Site 1264–1265 on the new astrochronology. (a) Site 1264 benthic foraminiferal δ18O (Bell et al., 2014; Liebrand et al., 2016; Westerhold et al., 2020) and the benthic δ18O Megasplice (De Vleeschouwer et al., 2017). (b) Site 1264 Si intensity (counts). The left axis of (c) shows %> 63 µm coarse fraction (%CF) (Liebrand et al., 2016; Keating-Bitonti and Peters, 2019), and the right axis shows XRF-derived CaCO3 data from Sites 1264 (dark red) and 1265 (black). (d) Bulk and CaCO3 MARs for Sites 1264 (dark and light blue, respectively) and 1265 (black and grey, respectively). (e) Eccentricity and (f) obliquity solutions (Laskar et al., 2004). (g) Line scan and (h) core box photo Site 1264–1265 composite core photos. (i) Wavelet spectra in the time domain of the CaCO3 data detrended to remove cycles over 200 kyr. (j) Wavelet spectra in the time domain of the CaCO3 data detrended to remove cycles over 4 Myr (Torrence and Compo, 1998; Grinsted et al., 2004). The MCO, mMCT and LMBB are annotated.
At Site 1264, CaCO3 content is very high, with all long- and short-term variability occurring between 92 % and 97.5 % CaCO3 (Fig. 5). CaCO3 content varied between 94 % and 96 % during the Oligocene-early Miocene (30–18.5 Ma), with MARs of ∼ 1–2.5 g cm−2 kyr−1 and are discussed in greater detail in Liebrand et al. (2016). The lowest CaCO3 content (92 %–93.5 %) and MARs (∼ 0.3–0.7 g cm−2 kyr−1) occur between ∼ 18.5 and 14.4 Ma, which broadly coincides with the Miocene Climatic Optimum (MCO; 17–14.7 Ma; Shevenell et al., 2004; Holbourn et al., 2005) (see Sect. 5.2 for discussion). Broadly concurrent with cooling in the lead up to the middle Miocene Climate Transition (mMCT; ∼ 13.9 Ma), CaCO3 content increases and remains between 94 % and 96 % during the early late Miocene (14.4–8.0 Ma), coincident with MARs of ∼ 1–2.5 g cm−2 kyr−1 (see Sect. 5.2 for discussion). The highest CaCO3 content (96 %–97.5 %) and MARs (2.5–4.5 g cm−2 kyr−1) occur between 8 and 4 Ma (Fig. 5), potentially indicating high carbonate productivity coincident with the known age of the global late Miocene–early Pliocene Biogenic Bloom (LMBB; acronym from Lyle et al., 2019) (see Sect. 5.3 for further discussion).
Carbonate deposition is strongly affected by the balance between biogenic carbonate productivity (mostly in the surface water) and carbonate dissolution in the water column and at the sea floor. Sedimentary processes, such as dilution with terrigenous material and/or the removal of fine-grained material through winnowing, can affect both the amount and composition of the carbonate preserved. The relative importance of biogenic productivity versus dissolution is discussed in detail in Liebrand et al. (2016) for the Oligocene to early Miocene, in Sect. 5.2 for the early–middle Miocene and in Sect. 5.3 for the late Miocene–early Pliocene. Over the last 30 Myr, detrital MARs were low, indicating that dilution with terrigenous material was not a major contributing factor in controlling carbonate deposition at Site 1264. Winnowing may have removed fine fraction material, including coccolith carbonate, thereby reducing carbonate deposition at Site 1264. By comparing MARs between nearby sites recovered during DSDP Leg 74, Shackleton et al. (1984) suggested that winnowing may have affected parts of the Walvis Ridge. They suggested that winnowing was especially pronounced at DSDP Site 526 (1054 m water depth) since the late Oligocene. Site 1264 is situated on a very gentle slope above the lysocline and carbonate compensation depth (palaeowater depths: 2–2.5 km). Winnowing likely had less of an effect on Site 1264 compared to Site 526, as Site 1264 is not positioned on the shallowest parts of the Walvis Ridge bathymetry. Nonetheless, Shackleton et al. (1984) also found some indication of winnowing at DSDP Site 525 (2467 m water depth) since the late Pliocene. Independent constraints on winnowing are not available for the entire 30 Myr interval; however, detailed fine fraction weights are available between 30 and 17 Ma (Liebrand et al., 2016; their Fig. 2). If these data are interpreted as a proxy for winnowing, this would suggest that winnowing is modest during the middle Oligocene, increasing during late Oligocene warming and relatively high across the Oligocene–Miocene Transition (OMT; Fig. 5). During the early Miocene (post OMT, pre-middle Miocene) winnowing is comparable to late Oligocene values (Fig. 5). There is evidence for winnowing to have increased towards the condensed middle Miocene part of the Site 1264 record, as there is an increase in both high-resolution and low-resolution percent > 63 µm coarse fraction (%CF) (Liebrand et al., 2016; Keating-Bitonti and Peters, 2019) (Fig. 5). However, between 18.5 and 8 Ma, the Site 1264 %CF varies within a 5 % range, suggesting the amount of winnowing remained stable (Fig. 5; Keating-Bitonti and Peters, 2019). After ∼ 3 Ma, %CF gradually increases from 20 % to 40 % (Fig. 5), which is the largest increase seen in the entire record and could indicate that Site 1264 is affected by winnowing at this time. The presence of winnowing is also supported by the fact that deeper Walvis Ridge Site 1266 and Site 1267 both have higher sedimentation rates than Site 1264 in the last 3 Ma, whereas the opposite would be expected if deep-sea dissolution alone was considered (productivity should affect all sites similarly).
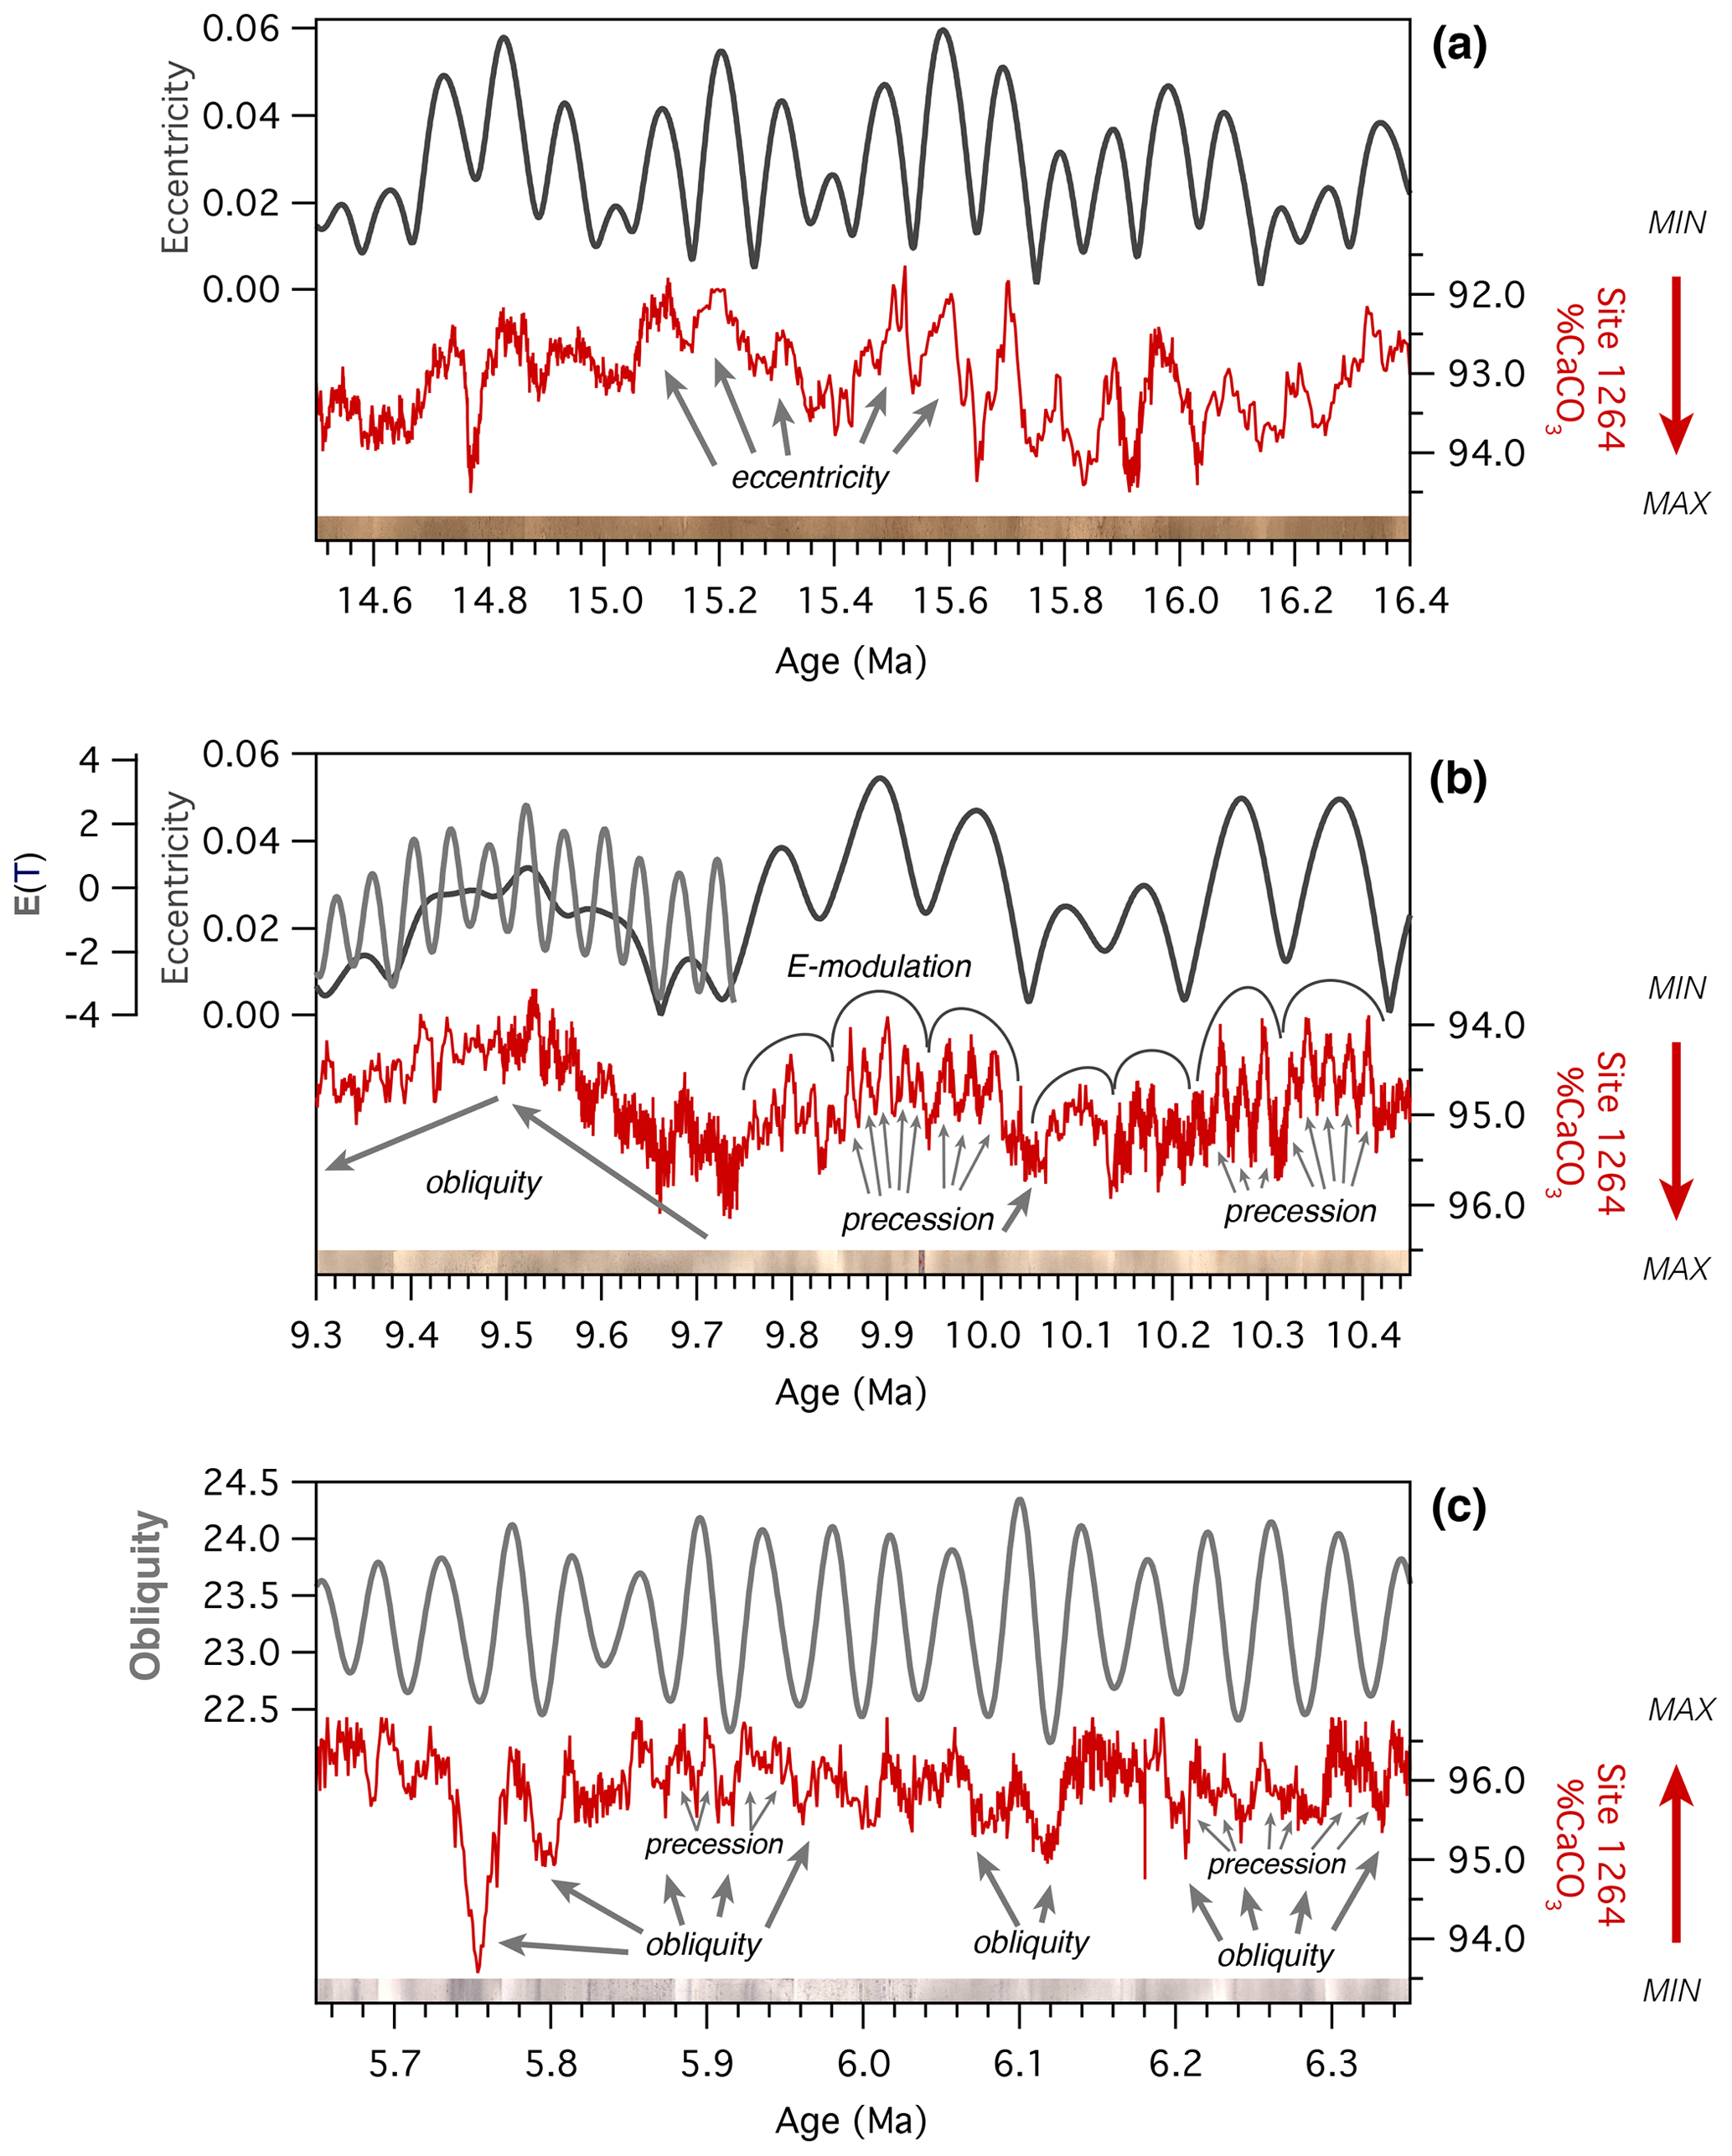
Figure 6Zoomed-in panels highlighting the three distinctly different orbital controls on Southeast Atlantic CaCO3 deposition. (a) Example of strong eccentricity (E) pacing present between 30 and 13 Ma. (b) Example of the prevalent eccentricity-modulated precession pacing present between 14 and 8 Ma. (c) Example of the pervasive obliquity forcing present between 8 and ∼ 3.3 Ma. An example of stronger obliquity appearing in a 2.4 Myr eccentricity minimum, when eccentricity-modulated precession is muted, is also shown in (b). CaCO3 minima correlate with eccentricity maxima between 30 and 8 Ma (a, b). Between 8 and 0 Ma, CaCO3 maxima correlate with obliquity maxima (c).
The influence of the long 405 kyr eccentricity on CaCO3 deposition at Site 1264 is complicated. The imprint of the 405 kyr cycle on CaCO3 content was not constant during the Oligocene interval at Site 1264 (Liebrand et al., 2016). This contrasts with the clearer imprint of a 405 kyr cycle on CaCO3 deposition during the Miocene between ∼ 21 and 5 Ma. For periodicities shorter than 405 kyr, we can recognise three distinctly different orbital imprints on the variability in CaCO3 content (Figs. 5 and 6).
-
The ∼ 110 kyr eccentricity is the dominant driver between 30 and ∼ 13 Ma (Fig. 6a).
-
Precession-driven %CaCO3 oscillations appear ∼ 14–13 Ma and are the main pacer of short-term variability until ∼ 8 Ma (Fig. 6b).
-
Obliquity becomes a significant driver at Site 1264 after ∼ 7.7 Ma and together with precession imprints a characteristic interference pattern on %CaCO3 (Fig. 6c).
Although different tuning strategies are used to generate a continuous astrochronology (Sect. 4.2), these shifts in imprinted cyclicity are also visible in the depth and bio-magnetostratigraphic age model spectra, indicating that the shifts are independent of the changes in tuning strategy (see Sect. 4.1 and Fig. S9).
The three pacings observed in Southeast Atlantic CaCO3 deposition broadly coincide with major developments in climate, the cryosphere and/or the carbon cycle over the last 30 Myr. At Site 1264, the strong expression of ∼ 110 kyr eccentricity-driven %CaCO3 variability between 17 and 13 Ma parallels the dominant pacing of %CaCO3 during the Oligocene–early Miocene (30–17 Ma; Figs. 5 and 6a; for further details, see Liebrand et al., 2016). The prevalence of ∼ 110 kyr eccentricity pacing at Site 1264 is in line with the wider understanding that Oligocene to middle Miocene unipolar Coolhouse climate was predominantly paced by short-term eccentricity during widespread global warmth (Pälike et al., 2006; Tian et al., 2013; Holbourn et al., 2014, 2015; Beddow et al., 2016, 2018; Voigt et al., 2016; Kochhann et al., 2016; Liebrand et al., 2016, 2017; De Vleeschouwer et al., 2017, 2020; Westerhold et al., 2020). The strong ∼ 110 kyr cyclicity observed in marine archives is attributed to eccentricity-driven changes in ice volume and/or deep-sea temperature, likely associated with changes in atmospheric CO2 (Pälike et al., 2006; Holbourn et al., 2015; Liebrand et al., 2017; Greenop et al., 2019).
The orbital imprint on CaCO3 content shifts between 14 and 13 Ma, when eccentricity-modulated precession cycles progressively become more clearly superimposed on the larger ∼ 110 kyr cycles. These precession cycles remain the main driver of carbonate deposition until ∼ 8 Ma, although obliquity cycles are visible during the 2.4 Myr eccentricity minima from ∼ 12.6 to 12.2 Ma and ∼ 9.7 to 9.3 Ma, when the imprint of precession and ∼ 110 kyr eccentricity is muted (Figs. 5 and 6b). Strong obliquity was also observed in benthic δ18O data from the South China Sea during the ∼ 9.7–9.3 Ma node (Holbourn et al., 2013). The strong obliquity intervals that are observed across multiple marine archives support the idea that obliquity exerts greater control on the climate system as a whole when the orbital configuration is characterised by long-term eccentricity minima coincident with long-term obliquity maxima (Holbourn et al., 2013, 2018; Drury et al., 2017; Levy et al., 2019). The shift to stronger precession pacing occurs after global cooling and the reglaciation of Antarctica across the mMCT (∼ 13.9 Ma; Holbourn et al., 2005). Some precession-driven %CaCO3 cycles were observed and superimposed on larger ∼ 110 kyr eccentricity cycles between 23.5 and 19.5 Ma at Site 1264 (Fig. 5; Liebrand et al., 2016). However, the relative amplitude of eccentricity and precession is different in the middle to late Miocene compared to the Oligocene–early Miocene. In the Oligocene–early Miocene, the amplitude of the ∼ 110 kyr eccentricity cycles in CaCO3 content were greater than the precession-driven CaCO3 content cycles. In contrast, we observe a decrease in strength of the ∼ 110 kyr eccentricity cycles concurrent with the strong precession pacing of the CaCO3 content between 14 and 8 Ma (Fig. 5). The influence of early–middle Miocene climate evolution on Southeast Atlantic carbonate deposition is discussed further in Sect. 5.2.
Although some power remains in the ∼ 110 kyr eccentricity bandwidth, the orbital imprint seen in CaCO3 content changes around 7.7 Ma to a strong obliquity–precession interference pattern, which remains visible until ∼ 3.3 Ma (Figs. 5 and 6c). The onset of prevalent obliquity–precession pacing of %CaCO3 observed at Site 1264 after ∼ 7.7 Ma has been observed globally in benthic δ18O records and is associated with increased influence of high-latitude processes, such as enhanced glacial activity and high-latitude cooling (Drury et al., 2016, 2017, 2018b; Holbourn et al., 2018; see also Sect. 5.3). Although benthic δ18O data are not available at Site 1264 between 8.0 and 6.0 Ma, the obliquity–precession interference pattern is visible in the benthic δ18O record between 6.0 and 3.3 Ma (Fig. 4). Relative to the Oligocene–early late Miocene, the amplitude of the variability in CaCO3 content is reduced during the latest Miocene and early Pliocene. Concurrent with the waning influence of ∼ 110 kyr eccentricity at Site 1264, the highest CaCO3 content (96 %–97.5 %) of the entire record occurs between 8 and 4 Ma. The influence of the complex late Miocene climate system on carbonate deposition is discussed in Sect. 5.3.
After 3.3 Ma, the short-term orbital imprint is more difficult to characterise. The wavelet analysis shows that ∼ 110 kyr eccentricity influence increases in the Plio-Pleistocene compared to the latest Miocene (Fig. 5). The influence of some obliquity and precession forcing on %CaCO3 remains until ∼ 0.9 Ma, when the ∼ 110 kyr eccentricity pacing characteristic of the middle Pleistocene appears after the mid-Pleistocene Transition (MPT; Bell et al., 2014). Compared to Site 1264, the transition from ∼ 40 to ∼ 110 kyr pacing is recorded more clearly at nearby Site 1267, where it is visible in the benthic δ18O data, composite core photos and physical property data (physical property data from Shipboard Scientific Party Leg 208, 2004c; benthic δ18O data from Bell et al., 2014; composite core photos from Westerhold et al., 2017). This difference in expression of the MPT may partly relate to water depth differences between the sites, as the deeper Site 1267 (4356 m water depth) may record a stronger deep-water signal compared to Site 1264 (2507 m water depth). Alternatively, winnowing may have obscured some of the cyclicity at Site 1264, considering the indication that both Sites 1264 and 525 (both ∼ 2.4–2.5 km water depth) were affected by winnowing in the late Pliocene–early Pleistocene. Nonetheless, although the onset of the Pleistocene ∼ 110 kyr cycles is not exceptionally clear at Site 1264, it is apparent that these cycles only appear after 0.9 Ma at both Sites 1264 and 1267 (Fig. 5), which is considerably later than in the eastern equatorial Pacific, where ∼ 110 kyr cycles first appear in carbonate records at 1.6 Ma (Lyle et al., 2019).
Benthic foraminiferal δ18O records are only available for the Oligocene–early Miocene (30–17 Ma; Liebrand et al., 2011, 2016) and the Plio-Pleistocene (5.3–0.0 Ma; Bell et al., 2014). It is therefore not yet possible to track the evolution of the relationship between the climate–cryosphere system (encompassed by benthic δ18O) and South Atlantic carbonate deposition over the last 30 Myr. However, in contrast to the in-phase %CaCO3–benthic δ18O relationship on ∼ 110 kyr eccentricity periodicities between 30 and 17 Ma (Liebrand et al., 2016), the new Site 1264 %CaCO3 data have an inverse relationship with benthic δ18O on obliquity periodicities for the last 6.0 Myr (Figs. 4 and S11). This points to a considerably different relationship between the cryosphere and controls on carbonate deposition at Site 1264 in the late Miocene–Pleistocene compared to the Oligocene–early Miocene. The in-phase Oligocene to early Miocene %CaCO3-benthic δ18O relationship on ∼ 110 kyr periodicities observed at Site 1264 has been observed elsewhere for the Oligocene through to the middle Miocene, including across the mMCT (Holbourn et al., 2014, 2015; Kochhann et al., 2016; Liebrand et al., 2016; Beddow et al., 2018; Tian et al., 2018). It is possible that the %CaCO3–benthic δ18O relationship changed from in-phase on 110 kyr eccentricity periodicities to anti-phase on obliquity periodicities, concurrent with the ∼ 7.7 Ma shift in CaCO3 deposition from a predominantly eccentricity–precession-paced system to one that is more controlled by obliquity–precession. Such an interpretation would further support the notion that the Earth's system underwent a major shift in its response to orbital forcing in the late Miocene–early Pliocene, with Northern Hemisphere high-latitude processes steadily growing in importance in the latest Miocene (Kirtland Turner, 2014; Drury et al., 2017, 2018b; De Vleeschouwer et al., 2020).
5.2 Eccentricity to precession switch, low %CaCO3 deposition and the early–middle Miocene warmth
The early–middle Miocene marks a warm interval where Antarctic ice volume underwent major change and climatic trends deviated from the overall Cenozoic cooling pattern (Miller et al., 1991; Shevenell et al., 2004; Holbourn et al., 2005, 2014, 2015; Tian et al., 2013, 2014; Super et al., 2018). The MCO (defined in the benthic foraminiferal δ18O as between 17 and 14.7 Ma; Holbourn et al., 2015) was characterised by pervasive global warmth and more humid conditions, together with lower meridional temperature gradients and greatly reduced continental ice sheets in Antarctica compared to the present day (Lear et al., 2000, 2015; Billups and Schrag, 2002; Shevenell et al., 2004; John et al., 2011; Pound et al., 2012; Gasson et al., 2016; Levy et al., 2016). Distal marine records that track variations in land ice volume and deep-sea temperatures are marked by a strong ∼ 110 kyr eccentricity pacing, coupled with large 400 kyr driven carbon cycle perturbations (Monterey Excursion) (Shevenell et al., 2008; Holbourn et al., 2014, 2015; Tian et al., 2014; Kochhann et al., 2016; Ohneiser and Wilson, 2018). The MCO warmth, ice volume decrease and carbon cycle perturbations have been hypothesised to be driven by increased atmospheric CO2 levels associated with volcanic degassing from the Columbia River Flood Basalts, with the earliest eruptions occurring after ∼ 17.2 Ma (Foster et al., 2012; Barry et al., 2013; Greenop et al., 2014; Kasbohm and Schoene, 2018; Moore et al., 2018, 2020; Super et al., 2018; Cahoon et al., 2020; Sosdian et al., 2020). The warm MCO conditions were reversed ∼ 13.9 Ma during the mMCT when major continental ice sheets reappeared on Antarctica associated with a large decrease in atmospheric CO2 and global temperatures (Shevenell et al., 2004; Holbourn et al., 2005; Foster et al., 2012; Pound et al., 2012; Badger et al., 2013; Lear et al., 2015; Gasson et al., 2016; Levy et al., 2016; Super et al., 2018, 2020).

Figure 7Middle to late Miocene Site 1264–1265 data on the new astrochronology: (a) BAYSPAR TEX86 SSTs from Site 608 (blue dots are the 50th percentile; medium blue is 65 % CL; light blue is 95 % CL; Super et al., 2018); (b) benthic δ18O Megasplice (De Vleeschouwer et al., 2017); (c) XRF-derived CaCO3 data from Site 1264–1265; (d) bulk and CaCO3 MARs for Site 1264–1265 (dark and light blue, respectively); (e) Site 1264–1265 line scan and (f) core box composite core photos; and (g) wavelet spectra in the time domain of the CaCO3 data detrended to remove cycles > 200 kyr (Torrence and Compo, 1998; Grinsted et al., 2004). The approximate location of the MCO and the mMCT are also shown.
Benthic foraminiferal δ18O records are not yet available at Site 1264 for this interval, so it is not possible to recognise the MCO using this dataset. Nonetheless, the lowest %CaCO3 content (92 %–93.5 %) and MARs (∼ 0.3–0.7 g cm−2 kyr−1) occur between ∼ 18.5 and 14.4 Ma and broadly coincide with the MCO (Figs. 5c and 7c). Low detrital MARs (bulk–CaCO3 MARs), Si and K intensity indicates that biogenic silica and detrital input remains relatively constant and minimal across this interval. The low detrital MARs at Site 1264 (average 0.09 g cm−2 kyr−1) are comparable to the non-carbonate MARs of nearby sites drilled during Leg 74, particularly DSDP Site 525 (Shackleton et al., 1984). Dilution was therefore not the main driving factor of the early–middle Miocene low %CaCO3 content at Site 1264. Winnowing could have removed the < 63 µm fraction at Site 1264 (Fig. 5); however, such winnowing also tends to remove both small CaCO3 and detrital particles, ultimately raising the overall CaCO3 content but lowering the CaCO3 MAR (Marcantonio et al., 2014). A 10 % increase in the percent > 63 µm coarse fraction (%CF) after ∼ 18.5 Ma (Fig. 5; Liebrand et al., 2016) indicates that some winnowing occurred. However, between 18.5 and 8 Ma, the Site 1264 %CF varies within a 5 % range but never increases to the high %CF values seen in the Plio-Pleistocene (Fig. 5; Keating-Bitonti and Peters, 2019). This indicates that increased dissolution and/or decreased productivity likely also drove the early–middle Miocene low CaCO3 content at Site 1264. An increase of B Ca concentration at Sites 1264 and 1266 after 15.5 Ma (Kender et al., 2014) indicates that dissolution influenced the early–middle Miocene low CaCO3 content at Site 1264.
The recovery of %CaCO3 content ∼ 14.5 Ma agrees well with the end of the MCO ∼ 14.7 Ma (Holbourn et al., 2015). However, at Site 1264, the decreasing CaCO3 content starts ∼ 18.5 Ma, which is ∼ 1.5 Myr before the decrease in benthic δ18O normally associated with the onset of the MCO (Fig. 5). During the early–middle Miocene, low %CaCO3 and CaCO3 MARs were observed at multiple sites in the eastern equatorial Pacific Ocean (EEP; DSDP Site 574; IODP Sites U1335 to U1338), initially decreasing after 18–17.5 Ma, before recovering to early Miocene values by 15–14.5 Ma (Piela et al., 2012; Kochhann et al., 2016). Multiproxy evidence at these EEP sites indicates that the low %CaCO3 and CaCO3 MARs values were associated with increased deep-sea dissolution rather than decreased productivity, with the peak dissolution occurring at the onset of the MCO (Piela et al., 2012; Kochhann et al., 2016). This dissolution horizon has been traced regionally across the equatorial Pacific as the “Lavender” seismic unconformity, with the dissolution potentially linked to the intensification of proto-NADW formation leading to increased corrosive Antarctic Bottom Water (AABW) reaching the Pacific (Mayer et al., 1985). This hypothesis could not be tested at the time due to the absence of any comparable Atlantic carbonate records. However, the new evidence of low %CaCO3 and CaCO3 MARs at Site 1264 in the Southeast Atlantic indicates that dissolution occurred in the Atlantic and the Pacific during the early to middle Miocene. Increased dissolution across ocean basins indicates a global forcing, supporting suggestions that the dissolution seen in the Pacific was associated with elevated atmospheric pCO2, increased carbon storage in the deep ocean and shoaling of the carbonate compensation depth during the early–middle Miocene global warmth (Pälike et al., 2012; Piela et al., 2012; Kochhann et al., 2016).
Assuming that the low CaCO3 content and MARs at Site 1264 is dissolution driven (e.g. see also Kender et al., 2014), rather than reflecting a decrease in carbonate rain, there is evidence that carbonate dissolution preceded the MCO by ∼ 1.5 Myr in the Southeast Atlantic (Site 1264) and ∼ 1.0–0.5 Myr in the equatorial Pacific (Piela et al., 2012; Kochhann et al., 2016). Few early–middle Miocene atmospheric CO2 or sea surface temperature (SST) records extend back to 18.5 Ma, but long-term trends in early–middle Miocene TEX86-derived SSTs from the North Atlantic Ocean indicate that SSTs may have been at MCO levels since ∼ 20 Ma (Super et al., 2018; Fig. 7a). It is not yet clear whether elevated SSTs prior to the MCO are a global phenomenon. However, the likely dissolution-induced lows in Southeast Atlantic and equatorial Pacific CaCO3 deposition up to ∼ 1.5 Myr before the MCO indicate that the MCO itself was preconditioned by elevated temperatures and atmospheric pCO2.
Shortly after the MCO, the overall Cenozoic cooling trend resumes across the mMCT with the reappearance of large ice sheets on Antarctica around 13.9 Ma. At Site 1264, the %CaCO3 values increase after ∼ 14.5 Ma, which could reflect decreased deep-sea dissolution and/or increased surface ocean productivity. Between 14 and 13 Ma, the orbital imprint on CaCO3 at Site 1264 progressively shifts from ∼ 110 kyr eccentricity-dominated pacing to precession-dominated pacing superimposed on the ∼ 110 kyr eccentricity cycles (Figs. 6a, b and 7c). In comparison to the Oligocene–early Miocene, the ∼ 110 kyr eccentricity cycles are more muted, and the precession cycles are of higher amplitude and more clearly expressed during the middle to late Miocene (Figs. 5 and 6b). The change in orbital imprint at Site 1264 after the mMCT may indicate that productivity in this region became more sensitive to precession forcing following changes to ocean circulation and/or the hydrological cycle driven by the reglaciation of Antarctica, global cooling and increased meridional temperature gradients. The shift towards strong precession pacing occurs as carbonate content recovers after the MCO. Site 1264 likely experienced increased carbonate deposition during the MCO as indicated by low LSR and MARs between 18.5 and 14.4 Ma. The increased preservation of precession cycles at Site 1264 after 14 Ma (i.e. after the mMCT) could also reflect a shift in deep-water circulation patterns bringing less corrosive deep waters to Site 1264, which is supported by the increase in B Ca at Sites 1264 and 1266 (Kender et al., 2014). This deep-water change would have enabled better preservation of precession-driven productivity cycles after the mMCT compared to the early–middle Miocene.
5.3 Late Miocene-early Pliocene Biogenic Bloom
The latest Miocene (∼ 8–5.3 Ma) was a complicated and dynamic interval when climate and ecosystems recognisable to the present-day first appeared (Herbert et al., 2016). There is abundant evidence for a global and long-lasting increase in primary productivity in the global surface ocean during the late Miocene to early Pliocene (Farrell et al., 1995; Dickens and Owen, 1999; Diester-Haass et al., 2002, 2005). This late Miocene–early Pliocene Biogenic Bloom (LMBB; as defined by Lyle et al., 2019) has been recognised between ∼ 8 and 4 Ma in upwelling and oligotrophic areas of all major oceanic basins (Kroon et al., 1991; Dickens and Owen, 1999; Hermoyian and Owen, 2001; Diester-Haass et al., 2002, 2004, 2005; Grant and Dickens, 2002; Liao and Lyle, 2014; Lyle and Baldauf, 2015; Lyle et al., 2019). At Site 1264–1265, the highest CaCO3 content (96 %–97.5 %) occurs between ∼ 8 and 4 Ma, and the highest bulk and CaCO3 MARs (∼ 2–4.5 g cm−2 kyr−1) are found between ∼ 7.8 and 3.3 Ma (Figs. 5 and 8c), which falls within the broad timing associated with the LMBB. As %CaCO3 is so high at Site 1264, CaCO3 MARs account for most of the variability in the bulk MARs. Similarly, Lyle et al. (2019) showed that the LMBB is expressed between ∼ 8 and 4.4 Ma in the bulk and CaCO3 MAR of six sites in the eastern equatorial Pacific (EEP), with CaCO3 MARs accounting for most of the bulk MAR variability (Fig. 8d). Despite the influence of palaeogeographical heterogeneity on the absolute EEP MARs, it becomes apparent after normalisation that common productivity patterns are visible across the EEP (Lyle et al., 2019; Fig. 8b and d). The Site 1264 CaCO3 MARs are generally higher than the EEP sites (Fig. 8c and d), except for ODP Sites 849 and 850, which are the two highest sedimentation EEP sites (Lyle et al., 2019).

Figure 8Late Miocene to present data on the new astrochronology. (a) The left axis shows XRF-derived CaCO3 data from Site 1264 (dark red), and the right axis shows > 63 µm coarse fraction (%CF) (Keating-Bitonti and Peters, 2019). (b) Normalised Site 1264 MARs (this study) and a normalised eastern equatorial Pacific (EEP) stack comprising data from ODP Sites 848, 849, 850, and 851 and IODP Sites U1335, U1337, and U1338 (Lyle et al., 2019). (c) Site 1264 CaCO3 MARs. (d) MARS from EEP ODP Sites 848, 849, 850, and 851 and IODP Sites U1335 and U1338 (Lyle et al., 2019). Site U1337 is not shown here as it was partly affected by winnowing (see Lyle et al., 2019, for details).
The exact cause of the LMBB is poorly understood; however, key hypotheses suggest the increased primary productivity was caused by (1) increased nutrient input into the surface ocean through increased weathering/dust input and/or (2) changes to the global distribution of nutrients through changes in atmospheric and oceanic circulation patterns. The widespread documentation of the LMBB shows that the expression and timing is regionally variable (Liao and Lyle, 2014; Lyle et al., 2019; Sutherland et al., 2019). However, most of these records are low resolution and insufficient for accurately constraining regional differences, so we cannot yet distinguish between global changes to the nutrient budget and changes to the regional distribution of nutrients in the ocean (e.g. changes in ocean circulation and/or upwelling). The availability of orbital-scale %CaCO3 and MARs from Site 1264 and the EEP provide the opportunity to compare the LMBB at high resolution for the first time. Based on increased CaCO3 MARs, the timing of the LMBB at Site 1264 and the EEP generally agrees well (Fig. 8b), which corroborates the global nature of the LMBB. After increasing from 8 Ma onwards, MARs peak between 7.2 and 6.6 Ma at both Walvis Ridge and the equatorial Pacific (Fig. 8b), which supports a global LMBB optimum occurring between ∼ 7.0 and 6.4 Ma (Lyle and Baldauf, 2015; Lyle et al., 2019). Site 1264 also has the highest absolute %CaCO3 values between 7.2 and 6.6 Ma, indicating high productivity of carbonate producers at this time (Figs. 5 and 8a). However, the LMBB extends to 3.3 Ma at Site 1264, in contrast to the western EEP, where the LMBB ends ∼ 4.4 Ma (Fig. 8b). In the far eastern equatorial Pacific near South America, high CaCO3 MARs continue to ∼ 3 Ma (Fig. 8 in Lyle et al., 2019), which is further evidence for regional variability of the termination of the LMBB production interval. The recognition of global patterns and temporal heterogeneity in the expression of the LMBB between the Pacific and the Southeast Atlantic could reflect different regional responses to a single climatic forcing and/or multiple driving forces.
Constraining which primary producers drove the LMBB at different regions will be useful for disentangling regional and global patterns. During the latest Miocene–early Pliocene (∼ 8–3 Ma), the new Site 1264 %CaCO3 data displays an inverse relationship with the low-resolution record of the percent > 63 µm coarse fraction (%CF) (Keating-Bitonti and Peters, 2019; adapted to this study's new composite depth and age model; Figs. 5c and 8a). The %CF specifically shows the opposite trend to %CaCO3 across the LMBB: decreasing %CF from 8 Ma, with the lowest %CF values occurring ∼ 7 Ma, in line with the maximum values in %CaCO3. Through the middle to late Miocene and early Pliocene, the LSR at Site 1264 are either similar or higher at Site 1264 (2505 m) relative to deeper Site 1266 (3806 m). The available %CF and %CaCO3 from Site 1264 also do not display a strong relationship prior to 8 Ma. This all suggests that any winnowing at Site 1264 was minimal and stable for the middle to late Miocene and early Pliocene. The inverse %CF-%CaCO3 relationship therefore could indicate that the LMBB was predominantly driven by a change in the calcareous phytoplankton (coccolithophores) versus foraminifera ratio at Site 1264. Based on Si intensity, there is no evidence that biogenic silica producers play a major role in the LMBB at Site 1264 (Fig. 5). This contrasts with the EEP, which is upwelling dominated and where a combination of calcareous (coccolithophores) and siliceous (diatoms) phytoplankton drove the LMBB (Lyle and Baldauf, 2015; Lyle et al., 2019).
Although we cannot yet accurately distinguish global increases in nutrient delivery to the ocean versus the regional redistribution of nutrients causing localised increased primary productivity, we can consider links between this prolonged productivity event and the dynamic changes observed during the late Miocene. Terrestrial and sea surface temperatures decreased rapidly during the late Miocene cooling between ∼ 7.0 and 5.4 Ma (Pound et al., 2011, 2012; Herbert et al., 2016). There is evidence for dynamic ice sheet activity, although there is no major late Miocene increase in benthic δ18O records suggesting that there was no long-term expansion in continental ice sheet extent or substantial deep-sea cooling (Hodell et al., 2001; Drury et al., 2016, 2017, 2018b; Holbourn et al., 2018; Tian et al., 2018). The carbon cycle underwent major change in the atmospheric, terrestrial and marine realms, with evidence for an atmospheric pCO2 decrease around ∼ 8–7 Ma (Bolton and Stoll, 2013; Herbert et al., 2016; Mejía et al., 2017; Tanner et al., 2020), the rise of terrestrial C4 plants on land (Cerling et al., 1997; Behrensmeyer et al., 2007; Uno et al., 2016; Tauxe and Feakins, 2020) and the globally synchronous marine late Miocene carbon isotope shift (LMCIS; ∼ 7.5–6.9 Ma) linked to global changes in oceanic circulation (Haq et al., 1980; Hodell and Venz-Curtis, 2006; Reghellin et al., 2015, 2020; Drury et al., 2017, 2018a).
At Site 1264, the onset of elevated CaCO3 MARs (∼ 7.8 Ma) roughly coincides with the shift from eccentricity–precession pacing to pervading obliquity–precession pacing of %CaCO3, which infers an increased influence of high-latitude processes in the Southeast Atlantic (Fig. 5). The onset of strong obliquity pacing is also observed ∼ 7.7 Ma as asymmetric (i.e. sawtooth-shaped) benthic δ18O cycles, which have a characteristic “interglacial–glacial” anti-phase relationship with benthic δ13C on obliquity timescales (Drury et al., 2017). The appearance of strong obliquity forcing in multiple systems shortly after 8 Ma implies increased influence of high-latitude climate processes, such as increased glacial activity and high-latitude cooling. There is widespread evidence that the late Miocene cooling was especially pronounced in the high latitudes and reached near-modern gradients around 5.4 Ma (Pound et al., 2012; Herbert et al., 2016). The growing importance of the high-latitudes in the latest Miocene is further supported by evidence that deep-sea stable δ13C and δ18O switched from in-phase to anti-phase on eccentricity timescales (Kirtland Turner, 2014; De Vleeschouwer et al., 2020) as a result of continental carbon reservoirs shrinking during cold periods due to increased extent of low-carbon Arctic biomes, such as ice sheets, polar deserts and tundra (De Vleeschouwer et al., 2020). There is also ice-proximal evidence for enhanced glacial activity in both the Northern Hemisphere and Southern Hemisphere, potentially indicating early transient bipolar cryosphere activity in the latest Miocene (O'Connell et al., 1996; Fronval and Jansen, 1996; Wolf-Welling et al., 1996; Kong et al., 2010; Williams et al., 2010). Increased glacial weathering after 8 Ma may have contributed to the onset of the LMBB through increased the nutrient influx into the ocean. An increased nutrient flux may also be driven by enhanced chemical weathering through Himalayan uplift and the intensification of the Indian and Asian monsoon systems in the latest Miocene (Kroon et al., 1991; Filippelli, 1997; Zhisheng et al., 2001; Holbourn et al., 2018; Yang et al., 2019). Finally, the LMBB may be partly driven by increased nutrient input into the ocean as a result of widespread continental aridification coupled with trade wind intensification due to greater meridional gradients during the late Miocene cooling (7–5.4 Ma) (Hovan, 1995; Filippelli, 1997; Diester-Haass et al., 2006; Tipple and Pagani, 2007; Lyle et al., 2008; Pound et al., 2012; Herbert et al., 2016).
Regional variability in the LMBB may in turn be driven by regional differences in the extent of late Miocene cooling (Pound et al., 2012; Herbert et al., 2016), as well as regional diachrony in aridification (Molnar, 2005; Schuster et al., 2006; Lyle et al., 2008; Dupont et al., 2013). The LMCIS (∼ 7.5–6.9 Ma) has been linked to the onset of near-modern thermohaline circulation with NADW percolating further into the South Atlantic (Hodell and Venz-Curtis, 2006; Drury et al., 2017; Keating-Bitonti and Peters, 2019). A major shift in oceanic circulation would likewise affect the redistribution of nutrients around the globe, thereby potentially contributing to regional differences in nutrient supply. All these aspects go some way to explain why the LMBB began after ∼ 8 Ma; however, it is unclear why the LMBB continued into the Pliocene, and especially why it continued until 3.3 Ma at Site 1264. Further work disentangling global versus regional productivity patterns is needed in future to explore causal links in greater detail.
We present a continuous Site 1264-encompassing depth (∼ 316 m) and age (∼ 30 Myr) model that constitutes a reference framework for future palaeoclimatic and palaeoceanographic studies. To achieve this framework, we generated new high-resolution (1–2 cm) XRF records between 17 and 0 Ma at ODP Site 1264 in the Southeast Atlantic. We used the XRF data to revise the shipboard composite splice, especially in the late Miocene–early Pliocene interval. The new ln(Ca Fe) records were integrated with previously published Oligocene–early Miocene XRF records and calibrated to shipboard %CaCO3 data to obtain the first continuous Southeast Atlantic carbonate record spanning the last 30 million years. Because of the variable orbital forcing imprint recorded in the Site 1264 CaCO3 content, we employed three distinct tuning strategies to achieve a 30 Myr astrochronology: (I.a) 30–9.7 Ma: CaCO3 content(/benthic δ18O) to eccentricity; (I.b) 9.7–8.0 Ma: CaCO3 content to E(T); (II) 8.0–3.3 Ma: CaCO3 content(/benthic δ18O) to ET−P; and (III) 3.3–0.0 Ma: benthic δ18O to LR04.
The %CaCO3 and CaCO3 MARs were used to investigate carbonate deposition in the Southeast Atlantic since the Oligocene. We recognise three distinct orbital pacings of the short-term %CaCO3 variability, broadly related to major changes in climate, the cryosphere and/or the carbon cycle: (1) ∼ 110 kyr eccentricity-driven pacing dominates from 30 to ∼ 13 Ma during Oligocene–Miocene global warmth; (2) eccentricity-modulated precession-driven pacing appears after the mMCT and prevails from 14 to 8 Ma; (3) increased obliquity–precession-driven pacing prevails between ∼ 7.7 and 3.3 Ma, following increased influence of high-latitude processes.
The lowest CaCO3 content (92 %–94 %) occurs between 18.5 and 14.4 Ma, suggesting increased dissolution and/or decreased carbonate rain at Site 1264 potentially caused by the widespread global warmth associated with the MCO. However, the beginning of the low CaCO3 content at Site 1264 precedes the MCO by ∼ 1.5 Myr, in line with evidence for dissolution-induced %CaCO3 lows in the equatorial Pacific Ocean 1.0–0.5 Myr before the MCO. This may indicate that the global warmth and Antarctic deglaciation across the MCO was preconditioned for up to ∼ 1.5 Myr by a prolonged interval of early Miocene global warmth. The emergence of precession-driven pacing in the Site 1264 CaCO3 content after ∼ 14 Ma suggests that Antarctic ice sheet expansion and global cooling across the mMCT caused regional productivity to become more sensitive to precession forcing and/or signifies the appearance of less corrosive deep waters at Site 1264 leading to better preservation of precession-driven productivity cycles.
In association with the late Miocene Biogenic Bloom (LMBB), the highest CaCO3 content (95 %–97.5 %) occurs between ∼ 8 and 4 Ma and the highest CaCO3 MARs (∼ 2–4.5 g cm−2 kyr−1) are found between ∼ 7.8 and 3.3 Ma. The onset of elevated CaCO3 MARs (∼ 7.8 Ma) roughly coincides with the shift from eccentricity–precession pacing to pervading obliquity–precession pacing of %CaCO3, which suggests a link between the onset of the LMBB and the increased influence of high-latitude processes, such as enhanced glacial activity and high-latitude cooling. The timing of the LMBB in the Site 1264 MARs agrees well with the onset in the eastern equatorial Pacific (EEP), although the LMBB lasts ∼ 1 Myr longer in the South Atlantic (∼ 3.3 Ma) than in the EEP (∼ 4.4 Ma). Global patterns in the LMBB may be driven by increased nutrient input through increased late Miocene glacial weathering and/or increased weathering associated with Himalayan uplift/intensification of the monsoon. A global increase in the oceanic nutrient flux may be related to increased dust input following increased continental aridification and enhanced trade winds due to the increased latitudinal temperature gradients that appeared during the late Miocene cooling (7–5.4 Ma). Regional differences in the expression of the LMBB most likely reflect changes in oceanic nutrients distribution driven by regional differences in the extent of the late Miocene cooling, diachrony in the spread of continental aridification and/or changes in oceanic circulation following the late Miocene carbon isotope shift.
All data are archived on the open-access database PANGAEA (https://doi.org/10.1594/PANGAEA.919489, Drury et al., 2020). A presentation discussing this publication is available at https://doi.org/10.5194/egusphere-egu21-3152 (Drury et al., 2021a). All figures are available as high-resolution downloads, and further information (including all datasets) is also available in the Supplement.
The key findings of this publication are summarised in a webinar by Anna Joy Drury, as part of the SedsOnline Scientific Webinar series. This webinar is available at https://www.youtube.com/watch?v=G30Eo0twx9s (last access: 4 October 2021; Drury et al., 2021b).
A list of supplemental tables and figures is provided here.
Supplementary tables:
-
S1. Site 1264 XRF and Site 1264–1265 CaCO3 data, including sedimentation rates and all MARs. The uncalibrated Site 1264 XRF datasets and the full Site 1265 CaCO3 data are also included.
-
S2. Offsets/affine tables for Site 1264.
-
S3. Splice tie table for Site 1264.
-
S4. Mapping tables for Site 1264.
-
S5. Site 1264 to Site 1265 correlation to accommodate splice revisions.
-
S6. Selected (i.e. high-quality) bio-magnetostratigraphic events for Site 1264.
-
S7. New astrochronology (with sedimentation rates) for Site 1264
Supplementary figures:
-
S1. XRF intercalibration of the four measurement campaigns.
-
S2. Downcore intercalibrated XRF data from Site 1264, including ln(Ca Fe), Si, Fe, K, Ti and Mn.
-
S3. Splice revision panels for the entire interval showing revisions.
-
S4. Revisions to the off-splice mapping pairs of Core 1264B-29H.
-
S5. Generation of the composite core image of ODP Sites 1264 and 1265.
-
S6. Calibration of ln(Ca Fe) to shipboard %CaCO3.
-
S7. Calculation of bulk and CaCO3 MARs.
-
S8. Polynomial fit through the selected (i.e. high-quality) bio-magnetostratigraphic events for Site 1264.
-
S9. Spectral analysis of %CaCO3 on the polynomial age model.
-
S10. Oversized panels showing depth-to-age tie points and age model generation.
-
S11. Antiphase relationship between benthic δ18O and %CaCO3.
The supplement related to this article is available online at: https://doi.org/10.5194/cp-17-2091-2021-supplement.
AJD, DL, LJL and TW designed the study. AJD, DL, TW, HMB, LJL, NR, RHW, HP, DAH, DK, DBB and ML contributed to the data collection, processing and analysis. AJD, DL, TW and LJL contributed to the stratigraphy and astrochronology. AJD wrote the manuscript with input from all co-authors (DL, TW, HMB, DAH, NR, RHW, ML, DDB, DK, HP, LJL).
The authors declare that they have no conflict of interest.
Publisher's note: Copernicus Publications remains neutral with regard to jurisdictional claims in published maps and institutional affiliations.
This research used samples and data provided by the Ocean Drilling Program (ODP), sponsored by the US National Science Foundation (NSF) and participating countries. This research used data acquired at the XRF Core Scanner Lab at the MARUM – Center for Marine Environmental Sciences, University of Bremen, Germany. We especially thank Ursula Röhl and Vera Lukies (MARUM) for their assistance with XRF core scanning; Alex Wülbers, Walter Hale, and Holger Kuhlmann (IODP Bremen Core Repository) for core handling, and Tim van Peer for valuable discussions. We also thank both reviewers for their constructive insights and Luc Beaufort for serving as editor.
Funding for this research was provided by the Deutsche Forschungsgemeinschaft (DFG, German Research Foundation) to Thomas Westerhold and Anna Joy Drury (project no. 242225091, 408101468). Anna Joy Drury and Diederik Liebrand were postdoctoral researchers and Heiko Pälike was the principal investigator in ERC Consolidator Grant “EARTHSEQUENCING” (grant agreement no. 617462). Anna Joy Drury is currently funded by the European Union's Horizon 2020 research and innovation programme under the Marie Skłodowska-Curie grant (agreement no. 796220). Diederik Liebrand is funded through the Cluster of Excellence “The Ocean Floor – Earth’s Uncharted Interface” (Research Unit Recorder), DFG grant no. 390741603. Mitch Lyle was funded by NSF grant OCE-1656960. Lucas J. Lourens's part of the research was carried out under the program of the Netherlands Earth System Science Centre (NESSC; gravitation grant no. 024.002.001), financially supported by the Dutch Ministry of Education, Culture and Science (OCW) through a NWO-ALW grant (project no. 865.10.001).
This research has been supported by the Deutsche Forschungsgemeinschaft (grant nos. 242225091 and 408101468), the H2020 European Research Council (grant no. 617462), European Union's Horizon 2020 research and innovation programme under the Marie Skłodowska-Curie grant (grant no. 796220), the National Science Foundation (grant no. OCE-1656960), the Cluster of Excellence “The Ocean Floor – Earth’s Uncharted Interface” (Research Unit Recorder, DFG Grant Number 390741603), the Netherlands Earth System Science Centre (NESSC; gravitation grant no. 024.002.001), and the Dutch Ministry of Education, Culture and Science (OCW) through NWO-ALW grant (project no. 865.10.001).
The article processing charges for this open-access publication were covered by the University of Bremen.
This paper was edited by Luc Beaufort and reviewed by two anonymous referees.
Badger, M. P. S., Lear, C. H., Pancost, R. D., Foster, G. L., Bailey, T. R., Leng, M. J., and Abels, H. A.: CO2 drawdown following the middle Miocene expansion of the Antarctic Ice Sheet, Paleoceanography, 28, 42–53, https://doi.org/10.1002/palo.20015, 2013.
Bailey, I., Hole, G. M., Foster, G. L., Wilson, P. A., Storey, C. D., Trueman, C. N., and Raymo, M. E.: An alternative suggestion for the Pliocene onset of major northern hemisphere glaciation based on the geochemical provenance of North Atlantic Ocean ice-rafted debris, Quat. Sci. Rev., 75, 181–194, https://doi.org/10.1016/j.quascirev.2013.06.004, 2013.
Barry, T. L., Kelley, S. P., Reidel, S. P., Camp, V. E., Self, S., Jarboe, N. A., Duncan, R. A., and Renne, P. R.: Eruption chronology of the Columbia River Basalt Group, Spec. Pap. Geol. Soc. Am., 497, 45–66, https://doi.org/10.1130/2013.2497(02), 2013.
Beddow, H. M., Liebrand, D., Sluijs, A., Wade, B. S., and Lourens, L. J.: Global change across the Oligocene-Miocene transition: High-resolution stable isotope records from IODP Site U1334 (equatorial Pacific Ocean), Paleoceanography, 31, 81–97, https://doi.org/10.1002/2015PA002820, 2016.
Beddow, H. M., Liebrand, D., Wilson, D. S., Hilgen, F. J., Sluijs, A., Wade, B. S., and Lourens, L. J.: Astronomical tunings of the Oligocene–Miocene transition from Pacific Ocean Site U1334 and implications for the carbon cycle, Clim. Past, 14, 255–270, https://doi.org/10.5194/cp-14-255-2018, 2018.
Behrensmeyer, A. K., Quade, J., Cerling, T. E., Kappelman, J., Khan, I. A., Copeland, P., Roe, L., Hicks, J., Stubblefield, P., Willis, B. J., and Latorre, C.: The structure and rate of late Miocene expansion of C4 plants: Evidence from lateral variation in stable isotopes in paleosols of the Siwalik Group, northern Pakistan, Geol. Soc. Am. Bull., 119, 1486–1505, https://doi.org/10.1130/b26064.1, 2007.
Bell, D. B., Jung, S. J. A., Kroon, D., Lourens, L. J., and Hodell, D. A.: Local and regional trends in Plio-Pleistocene δ18O records from benthic foraminifera, Geochem. Geophy. Geosy., 15, 3304–3321, https://doi.org/10.1002/2014GC005297, 2014.
Bell, D. B., Jung, S. J. A., Kroon, D., Hodell, D. A., Lourens, L. J., and Raymo, M. E.: Atlantic Deep-water Response to the Early Pliocene Shoaling of the Central American Seaway., Sci. Rep., 5, 12252, https://doi.org/10.1038/srep12252, 2015.
Berger, W. H.: Biogenous Deep-Sea Sediments: Fractionation by Deep-Sea Circulation, GSA Bulletin, 81, 1385–1402, https://doi.org/10.1130/0016-7606(1970)81[1385:BDSFBD]2.0.CO;2, 1970.
Billups, K. and Schrag, D. P.: Paleotemperatures and ice volume of the past 27 Myr revisited with paired Mg Ca and 18O 16O measurements on benthic foraminifera, Paleoceanography, 17, 1003, https://doi.org/10.1029/2000pa000567, 2002.
Bolton, C. T. and Stoll, H. M.: Late Miocene threshold response of marine algae to carbon dioxide limitation, Nature, 500, 558–62, https://doi.org/10.1038/nature12448, 2013.
Cahoon, E. B., Streck, M. J., Koppers, A. A. P., and Miggins, D. P.: Reshuffling the Columbia river basalt chronology-picture gorge basalt, the earliest-and longest-erupting formation, Geology, 48, 348–352, https://doi.org/10.1130/G47122.1, 2020.
Carter, S. C., Griffith, E. M., and Penman, D. E.: Peak intervals of equatorial Pacific export production during the middle Miocene climate transition, Geology, 44, 923–926, https://doi.org/10.1130/G38290.1, 2016.
Cerling, T. E., Harris, J. M., MacFadden, B. J., Leakey, M. G., Quade, J., Eisenmann, V., and Ehleringer, J. R.: Global vegetation change through the Miocene/Pliocene boundary, Nature, 389, 153–158, https://doi.org/10.1038/38229, 1997.
Coxall, H. K. and Wilson, P. A.: Early Oligocene glaciation and productivity in the eastern equatorial Pacific: Insights into global carbon cycling, Paleoceanography, 26, 1–18, https://doi.org/10.1029/2010PA002021, 2011.
De Vleeschouwer, D., Vahlenkamp, M., Crucifix, M., and Pälike, H.: Alternating Southern and Northern Hemisphere climate response to astronomical forcing during the past 35 m.y, Geology, 45, 375–378, https://doi.org/10.1130/G38663.1, 2017.
De Vleeschouwer, D., Drury, A. J., Vahlenkamp, M., Rochholz, F., Liebrand, D., and Pälike, H.: High-latitude biomes and rock weathering mediate climate-carbon cycle feedbacks on eccentricity timescales, Nat. Commun., 11, 1–10, https://doi.org/10.1038/s41467-020-18733-w, 2020.
Dickens, G. R. and Owen, R. M.: The Latest Miocene-Early Pliocene biogenic bloom: A revised Indian Ocean perspective, Mar. Geol., 161, 75–91, https://doi.org/10.1016/S0025-3227(99)00057-2, 1999.
Diester-Haass, L., Meyers, P. A., and Vidal, L.: The late Miocene onset of high productivity in the Benguela Current upwelling system as part of a global pattern, Mar. Geol., 180, 87–103, https://doi.org/10.1016/S0025-3227(01)00207-9, 2002.
Diester-Haass, L., Meyers, P. A., and Bickert, T.: Carbonate crash and biogenic bloom in the late Miocene: Evidence from ODP Sites 1085, 1086, and 1087 in the Cape Basin, southeast Atlantic Ocean, Paleoceanography, 19, 1–19, https://doi.org/10.1029/2003PA000933, 2004.
Diester-Haass, L., Billups, K., and Emeis, K. C.: In search of the late Miocene-early Pliocene “biogenic bloom” in the Atlantic Ocean (Ocean Drilling Program Sites 982, 925, and 1088), Paleoceanography, 20, 1–13, https://doi.org/10.1029/2005PA001139, 2005.
Diester-Haass, L., Billups, K., and Emeis, K. C.: Late Miocene carbon isotope records and marine biological productivity: Was there a (dusty) link?, Paleoceanography, 21, PA4216, https://doi.org/10.1029/2006pa001267, 2006.
Drury, A. J., John, C. M., and Shevenell, A. E.: Evaluating climatic response to external radiative forcing during the late Miocene to early Pliocene: New perspectives from eastern equatorial Pacific (IODP U1338) and North Atlantic (ODP 982) locations, Paleoceanography, 31, 167–184, https://doi.org/10.1002/2015PA002881, 2016.
Drury, A. J., Westerhold, T., Frederichs, T., Tian, J., Wilkens, R., Channell, J. E. T., Evans, H., John, C. M., Lyle, M., and Röhl, U.: Late Miocene climate and time scale reconciliation: Accurate orbital calibration from a deep-sea perspective, Earth Planet. Sci. Lett., 475, 254–266, https://doi.org/10.1016/j.epsl.2017.07.038, 2017.
Drury, A. J., Lee, G. P., Gray, W. R., Lyle, M., Westerhold, T., Shevenell, A. E., and John, C. M.: Deciphering the state of the late Miocene to early Pliocene equatorial Pacific, Paleoceanogr. Paleocl., 33, 246–263, https://doi.org/10.1002/2017PA003245, 2018a.
Drury, A. J., Westerhold, T., Hodell, D., and Röhl, U.: Reinforcing the North Atlantic backbone: revision and extension of the composite splice at ODP Site 982, Clim. Past, 14, 321–338, https://doi.org/10.5194/cp-14-321-2018, 2018b.
Drury, A. J., Liebrand, D., Westerhold, T., Beddow, H. M., Hodell, D. A., Rohlfs, N., Wilkens, R. H., Lyle, M. W., Bell, D. B., Kroon, D., Pälike, H., Lourens, L. J.: Climate, cryosphere and carbon cycle controls on Southeast Atlantic orbital-scale carbonate deposition since the Oligocene (30–0 Ma), PANGAEA [data set], https://doi.org/10.1594/PANGAEA.919489, 2020.
Drury, A. J., Liebrand, D., Westerhold, T., Beddow, H. M., Hodell, D. A., Rohlfs, N., Wilkens, R. H., Lyle, M. W., Bell, D. B., Kroon, D., Pälike, H., and Lourens, L. J.: Disentangling controls and orbital pacing of South-East Atlantic carbonate deposition since the Oligocene (30–0 Ma), EGU General Assembly 2021, online, 19–30 April 2021, EGU21-3152, https://doi.org/10.5194/egusphere-egu21-3152, 2021a.
Drury, A. J., Liebrand, D., Westerhold, T., Beddow, H., Hodell, D. A., Rohlfs, N., Wilkens, R. H., Lyle, M., Bell, D. B., Kroon, D., De Vleeschouwer, D., Vahlenkamp, M., Rochholz, F., Palike, H., and Lourens, L. J.: Disentangling the controls and orbital pacing of South-East Atlantic carbonate deposition since the Oligocene (30–0 Ma), YouTube, available at: https://youtu.be/G30Eo0twx9s, last access: 4 October 2021b.
Dupont, L. M., Rommerskirchen, F., Mollenhauer, G., and Schefuß, E.: Miocene to Pliocene changes in South African hydrology and vegetation in relation to the expansion of C4 plants, Earth Planet. Sci. Lett., 375, 408–417, https://doi.org/10.1016/j.epsl.2013.06.005, 2013.
Farrell, J. W., Raffi, I., Janecek, T. R., Murray, D. W., Levitan, M., Dadey, K. A., Emeis, K.-C., Lyle, M., Flores, J.-A., and Hovan, S.: Late Neogene sedimentation patterns in the eastern equatorial Pacific Ocean, edited by: Pisias, N. G., Mayer, L. A., Janecek, T. R., Palmer-Julson, A., and van Andel, T. H., Proceedings of the Ocean Drilling Program, Scientific Results, College Station, TX (Ocean Drilling Program), 138, 7, https://doi.org/10.2973/odp.proc.sr.138.143.1995, 1995.
Filippelli, G. M.: Intensification of the Asian monsoon and a chemical weathering event in the late Miocene-early Pliocene: Implications for late Neogene climate change, Geology, 25, 27–30, https://doi.org/10.1130/0091-7613(1997)025<0027:IOTAMA>2.3.CO;2, 1997.
Foster, G. L., Lear, C. H., and Rae, J. W. B.: The evolution of pCO2, ice volume and climate during the middle Miocene, Earth Planet. Sci. Lett., 341–344, 243–254, 2012.
Fronval, T. and Jansen, E.: Late Neogene paleoclimates and paleoceanography in the Iceland-Norwegian Sea: evidence from the Iceland and Vøring Plateaus, Proceedings of the Ocean Drilling Program, Scientific Results, 151, 455–468, https://doi.org/10.2973/odp.proc.sr.151.134.1996, 1996.
Gasson, E., Deconto, R. M., Pollard, D., and Levy, R. H.: Dynamic Antarctic ice sheet during the early to mid-Miocene, Proc. Natl. Acad. Sci. USA, 113, 3459–3464, https://doi.org/10.1073/pnas.1516130113, 2016.
Grant, K. M. and Dickens, G. R.: Coupled productivity and carbon isotope records in the southwest Pacific Ocean during the late Miocene-early Pliocene biogenic bloom, Palaeogeogr. Palaeocl., 187, 61–82, https://doi.org/10.1016/S0031-0182(02)00508-4, 2002.
Greenop, R., Foster, G. L., Wilson, P. A., and Lear, C. H.: Middle Miocene climate instability associated with high-amplitude CO2 variability, Paleoceanography, 29, 845–853, https://doi.org/10.1002/2014PA002653, 2014.
Greenop, R., Sosdian, S. M., Henehan, M. J., Wilson, P. A., Lear, C. H., and Foster, G. L.: Orbital Forcing, Ice Volume, and CO2 Across the Oligocene-Miocene Transition, Paleoceanogr. Paleocl., 34, 316–328, https://doi.org/10.1029/2018PA003420, 2019.
Grinsted, A., Moore, J. C., and Jevrejeva, S.: Application of the cross wavelet transform and wavelet coherence to geophysical time series, Nonlin. Processes Geophys., 11, 561–566, https://doi.org/10.5194/npg-11-561-2004, 2004.
Haq, B., Worsley, T., and Burckle, L.: Late Miocene marine carbon-isotopic shift and synchroneity of some phytoplanktonic biostratigraphic events, Geology, 8, 427–431, https://doi.org/10.1130/0091-7613(1980)8<427:LMMCSA>2.0.CO;2, 1980.
Herbert, T. D., Lawrence, K. T., Tzanova, A., Peterson, L. C., Caballero-Gill, R., and Kelly, C. S.: Late Miocene global cooling and the rise of modern ecosystems, Nat. Geosci., 9, 843–847, https://doi.org/10.1038/ngeo2813, 2016.
Hermoyian, C. S. and Owen, R. M.: Late miocene-early pliocene biogenic bloom: Evidence from low-productivity regions of the Indian and Atlantic Oceans, Paleoceanography, 16, 95–100, https://doi.org/10.1029/2000pa000501, 2001.
Hodell, D. A. and Venz-Curtis, K. A.: Late Neogene history of deepwater ventilation in the Southern Ocean, Geochem. Geophy. Geosy., 7, Q09001, https://doi.org/10.1029/2005GC001211, 2006.
Hodell, D. A., Curtis, J. H., Sierro, F. J., and Raymo, M. E.: Correlation of late Miocene to early Pliocene sequences between the Mediterranean and North Atlantic, Paleoceanography, 16, 164–178, https://doi.org/10.1029/1999pa000487, 2001.
Holbourn, A., Kuhnt, W., Schulz, M., and Erlenkeuser, H.: Impacts of orbital forcing and atmospheric carbon dioxide on Miocene ice-sheet expansion, Nature, 438, 483–487, https://doi.org/10.1038/nature04123, 2005.
Holbourn, A., Kuhnt, W., Clemens, S., Prell, W., and Andersen, N.: Middle to late Miocene stepwise climate cooling: Evidence from a high-resolution deep water isotope curve spanning 8 million years, Paleoceanography, 28, 688–699, https://doi.org/10.1002/2013PA002538, 2013.
Holbourn, A., Kuhnt, W., Lyle, M., Schneider, L., Romero, O., and Andersen, N.: Middle Miocene climate cooling linked to intensification of eastern equatorial Pacific upwelling, Geology, 42, 19–22, https://doi.org/10.1017/CBO9781107415324.004, 2014.
Holbourn, A., Kuhnt, W., Kochhann, K. G. D., Andersen, N., and Sebastian Meier, K. J.: Global perturbation of the carbon cycle at the onset of the Miocene Climatic Optimum, Geology, 43, 123–126, https://doi.org/10.1130/G36317.1, 2015.
Holbourn, A. E., Kuhnt, W., Clemens, S. C., Kochhann, K. G. D. D., Jöhnck, J., Lübbers, J., and Andersen, N.: Late Miocene climate cooling and intensification of southeast Asian winter monsoon, Nat. Commun., 9, 1584, https://doi.org/10.1038/s41467-018-03950-1, 2018.
Hovan, S. A.: Late Cenozoic Atmospheric Circulation Intensity and Climatic History Recorded by Eolian Deposition in the Eastern Equatorial Pacific Ocean, Leg 138, Proc. Ocean Drill. Program, 138 Sci. Results, 138, 615–625, https://doi.org/10.2973/odp.proc.sr.138.132.1995, 1995.
John, C. M., Karner, G. D., Browning, E., Leckie, R. M., Mateo, Z., Carson, B., and Lowery, C.: Timing and magnitude of Miocene eustasy derived from the mixed siliciclastic-carbonate stratigraphic record of the northeastern Australian margin, Earth Planet. Sci. Lett., 304, 455–467, https://doi.org/10.1016/j.epsl.2011.02.013, 2011.
Kasbohm, J. and Schoene, B.: Rapid eruption of the Columbia River flood basalt and correlation with the mid-Miocene climate optimum, Sci. Adv., 4, 1–9, https://doi.org/10.1126/sciadv.aat8223, 2018.
Keating-Bitonti, C. R. and Peters, S. E.: Influence of increasing carbonate saturation in Atlantic bottom water during the late Miocene, Palaeogeogr. Palaeocl., 518, 134–142, https://doi.org/10.1016/j.palaeo.2019.01.006, 2019.
Kender, S., Yu, J., and Peck, V. L.: Deep ocean carbonate ion increase during mid Miocene CO2 decline, Sci. Rep., 4, 1–6, https://doi.org/10.1038/srep04187, 2014.
Kirtland Turner, S.: Pliocene switch in orbital-scale carbon cycle/climate dynamics, Paleoceanography, 29, 1256–1266, https://doi.org/10.1002/2014PA002651, 2014.
Kochhann, K. G. D., Holbourn, A., Kuhnt, W., Channell, J. E. T., Lyle, M., Shackford, J. K., Wilkens, R. H., and Andersen, N.: Eccentricity pacing of eastern equatorial Pacific carbonate dissolution cycles during the Miocene Climatic Optimum, Paleoceanography, 31, 1176–1192, https://doi.org/10.1002/2016PA002988, 2016.
Kong, P., Huang, F., Liu, X., Fink, D., Ding, L., and Lai, Q.: Late Miocene ice sheet elevation in the Grove Mountains, East Antarctica, inferred from cosmogenic 21Ne–10Be–26Al, Glob. Planet. Change, 72, 50–54, https://doi.org/10.1016/j.gloplacha.2010.03.005, 2010.
Kroon, D., Steens, T., and Troelstra, S. R.: Onset of monsoonal related upwelling in the western Arabian Sea as revealed by planktonic foraminifers, edited by: Prell, W. L., Niitsuma, N., Emeis, K.-C., and Meyers, P. A., Proceedings of the Ocean Drilling Program, Scientific Results, College Station, TX (Ocean Drilling Program), 117, 257—263, https://doi.org/10.2973/odp.proc.sr.117.126.1991, 1991.
Laskar, J., Robutel, P., Joutel, F., Gastineau, M., Correia, A. C. M. M., and Levrard, B.: A long-term numerical solution for the insolation quantities of the Earth, Astron. Astrophys., 428, 261–285, https://doi.org/10.1051/0004-6361:20041335, 2004.
Laskar, J., Gastineau, M., Delisle, J.-B., Farrés, a., and Fienga, A.: Strong chaos induced by close encounters with Ceres and Vesta, Astron. Astrophys., 532, L4, https://doi.org/10.1051/0004-6361/201117504, 2011.
Lear, C. H., Elderfield, H., and Wilson, P. A.: Cenozoic deep-sea temperatures and global ice volumes from Mg Ca in benthic foraminiferal calcite, Science, 287, 269–272, https://doi.org/10.1126/science.287.5451.269, 2000.
Lear, C. H., Coxall, H. K., Foster, G. L., Lunt, D. J., Mawbey, E. M., Rosenthal, Y., Sosdian, S. M., Thomas, E., and Wilson, P. A.: Neogene ice volume and ocean temperatures: Insights from infaunal foraminiferal Mg Ca paleothermometry, Paleoceanography, 30,1437–1454, https://doi.org/10.1002/2015PA002833, 2015.
Levy, R., Harwood, D. M., Florindo, F., Sangiorgi, F., Tripati, R., Eynatten, H. Von, von Eynatten, H., Gasson, E., Kuhn, G., Tripati, A., DeConto, R., Fielding, C., Field, B., Golledge, N., McKay, R., Naish, T., Olney, M. M., Pollard, D., Schouten, S., Talarico, F., Warny, S., Willmott, V., Acton, G., Panter, K., Paulsen, T., Taviani, M., Askin, R., Atkins, C., Bassett, K., Beu, A., Blackstone, B., Browne, G., Ceregato, A., Cody, R., Cornamusini, G., Corrado, S., Del Carlo, P., Di Vincenzo, G., Dunbar, G., Falk, C., Frank, T., Giorgetti, G., Grelle, T., Gui, Z., Handwerger, D., Hannah, M., Harwood, D. M., Hauptvogel, D., Hayden, T., Henrys, S., Hoffmann, S., Iacoviello, F., Ishman, S., Jarrard, R., Johnson, K., Jovane, L., Judge, S., Kominz, M., Konfirst, M., Krissek, L., Lacy, L., Maffioli, P., Magens, D., Marcano, M. C., Millan, C., Mohr, B., Montone, P., Mukasa, S., Niessen, F., Ohneiser, C., Passchier, S., Patterson, M., Pekar, S., Pierdominici, S., Raine, I., Reed, J., Reichelt, L., Riesselman, C., Rocchi, S., Sagnotti, L., Sandroni, S., Schmitt, D., Speece, M., Storey, B., Strada, E., Tuzzi, E., Verosub, K., Wilson, G., Wilson, T., Wonik, T., and Zattin, M.: Antarctic ice sheet sensitivity to atmospheric CO2 variations in the early to mid-Miocene, Proc. Natl. Acad. Sci. USA, 113, 3453–3458, https://doi.org/10.1073/pnas.1516030113, 2016.
Levy, R. H., Meyers, S. R., Naish, T. R., Golledge, N. R., McKay, R. M., Crampton, J. S., DeConto, R. M., De Santis, L., Florindo, F., Gasson, E. G. W., Harwood, D. M., Luyendyk, B. P., Powell, R. D., Clowes, C., and Kulhanek, D. K.: Antarctic ice-sheet sensitivity to obliquity forcing enhanced through ocean connections, Nat. Geosci., 12, 132–137, https://doi.org/10.1038/s41561-018-0284-4, 2019.
Liao, Y. and Lyle, M.: Late Miocene to Pleistocene sedimentation and sediment transport on the Cocos Ridge, eastern tropical Pacific Ocean, Mar. Geol., 355, 1–14, https://doi.org/10.1016/j.margeo.2014.05.007, 2014.
Liebrand, D., Lourens, L. J., Hodell, D. A., de Boer, B., van de Wal, R. S. W., and Pälike, H.: Antarctic ice sheet and oceanographic response to eccentricity forcing during the early Miocene, Clim. Past, 7, 869–880, https://doi.org/10.5194/cp-7-869-2011, 2011.
Liebrand, D., Beddow, H. M., Lourens, L. J., Pälike, H., Raffi, I., Bohaty, S. M., Hilgen, F. J., Saes, M. J. M. M., Wilson, P. A., van Dijk, A. E., Hodell, D. A., Kroon, D., Huck, C. E., and Batenburg, S. J.: Cyclostratigraphy and eccentricity tuning of the early Oligocene through early Miocene (30.1–17.1 Ma): Cibicides mundulus stable oxygen and carbon isotope records from Walvis Ridge Site 1264, Earth Planet. Sci. Lett., 450, 392–405, https://doi.org/10.1016/j.epsl.2016.06.007, 2016.
Liebrand, D., De Bakker, A. T. M. M., Beddow, H. M., Wilson, P. A., Bohaty, S. M., Ruessink, G., Pälike, H., Batenburg, S. J., Hilgen, F. J., Hodell, D. A., Huck, C. E., Kroon, D., Raffi, I., Saes, M. J. M. M., Van Dijk, A. E., and Lourens, L. J.: Evolution of the early Antarctic ice ages, Proc. Natl. Acad. Sci. USA, 114, 3867–3872, https://doi.org/10.1073/pnas.1615440114, 2017.
Liebrand, D., Raffi, I., Fraguas, Á., Laxenaire, R., Bosmans, J. H. C., Hilgen, F. J., Wilson, P. A., Batenburg, S. J., Beddow, H. M., Bohaty, S. M., Bown, P. R., Crocker, A. J., Huck, C. E., Lourens, L. J., and Sabia, L.: Orbitally Forced Hyperstratification of the Oligocene South Atlantic Ocean, Paleoceanogr. Paleocl., 33, 511–529, https://doi.org/10.1002/2017PA003222, 2018.
Lisiecki, L. E. and Raymo, M. E.: A Pliocene-Pleistocene stack of 57 globally distributed benthic δ18O records, Paleoceanography, 20, PA1003, https://doi.org/10.1029/2004PA001071, 2005.
Littler, K., Westerhold, T., Drury, A. J., Liebrand, D., Lisiecki, L., and Pälike, H.: Astronomical time keeping of earth history: An invaluable contribution of scientific ocean drilling, Oceanography, 32, 72–76, https://doi.org/10.5670/oceanog.2019.122, 2019.
Lourens, L., Hilgen, F. J., Shackleton, N. J., Laskar, J., and Wilson, D.: The Neogene Period, in: A Geologic Time Scale 2004, edited by: Gradstein, F. M., Ogg, J. G., and Smith, A. G., Cambridge University Press, Cambridge, UK, 409–440, https://doi.org/10.1017/CBO9780511536045.022, 2005.
Lyle, M.: Neogene carbonate burial in the Pacific Ocean, Paleoceanography, 18, 1–19, https://doi.org/10.1029/2002PA000777, 2003.
Lyle, M. and Baldauf, J.: Biogenic sediment regimes in the Neogene equatorial Pacific, IODP Site U1338: Burial, production, and diatom community, Palaeogeogr. Palaeocl., 433, 106–128, https://doi.org/10.1016/j.palaeo.2015.04.001, 2015.
Lyle, M., Dadey, K. A., and Farrell, J. W.: The late Miocene (11–8 Ma) eastern Pacific carbonate crash: evidence for reorganization of deep-water circulation by the closure of the Panama Gateway, edited by: Pisias, N. G., Mayer, L. A., Janecek, T. R., Palmer-Julson, A., and van Andel, T. H., Proc. Ocean Drill. Program, Sci. Results, 138, 821–838, https://doi.org/10.2973/odp.proc.sr.138.157.1995, 1995.
Lyle, M., Barron, J., Bralower, T. J., Huber, M., Lyle, A. O., Ravelo, A. C., Rea, D. K., and Wilson, P. A.: Pacific ocean and Cenozoic evolution of climate, Rev. Geophys., 46, RG2002, https://doi.org/10.1029/2005rg000190, 2008.
Lyle, M., Drury, A. J., Tian, J., Wilkens, R., and Westerhold, T.: Late Miocene to Holocene high-resolution eastern equatorial Pacific carbonate records: stratigraphy linked by dissolution and paleoproductivity, Clim. Past, 15, 1715–1739, https://doi.org/10.5194/cp-15-1715-2019, 2019.
Marcantonio, F., Lyle, M., and Ibrahim, R.: Particle sorting during sediment redistribution processes and the effect on 230Th-normalized mass accumulation rates, Geophys. Res. Lett., 41, 5547–5554, https://doi.org/10.1002/2014GL060477, 2014.
Mayer, L. A., Shipley, T. H., Theyer, F., Wilkens, R. H., and Winterer, E. L.: Seismic modeling and paleoceanography at Deep Sea Drilling Project Site 574, edited by: Mayer, L., Theyer, E., et al., Initial Reports of the Deep Sea Drilling Project, Washington (U.S. Govt. Printing Office), 85, 947–970, https://doi.org/10.2973/dsdp.proc.85.132.1985, 1985.
Mejía, L. M., Méndez-Vicente, A., Abrevaya, L., Lawrence, K. T., Ladlow, C., Bolton, C., Cacho, I., and Stoll, H.: A diatom record of CO2 decline since the late Miocene, Earth Planet. Sci. Lett., 479, 18–33, https://doi.org/10.1016/j.epsl.2017.08.034, 2017.
Miller, K. G., Wright, J. D., and Fairbanks, R. G.: Unlocking the ice house: Oligocene-Miocene oxygen isotopes, eustasy, and margin erosion, J. Geophys. Res.-Sol. Ea., 96, 6829–6848, https://doi.org/10.1029/90JB02015, 1991.
Molnar, P.: Mio-pliocene growth of the Tibetan plateau and evolution of East Asian climate, Palaeontol. Electron., 8, 1–23, 2005.
Moore, N. E., Grunder, A. L., and Bohrson, W. A.: The three-stage petrochemical evolution of the Steens Basalt (southeast Oregon, USA) compared to large igneous provinces and layered mafic intrusions, Geosphere, 14, 2505–2532, 2018.
Moore, N. E., Grunder, A. L., Bohrson, W. A., Carlson, R. W., and Bindeman, I. N.: Changing mantle sources and the effects of crustal passage on the Steens Basalt, SE Oregon: Chemical and isotopic constraints, Geochem. Geophy. Geosy., 21, e2020GC008910 https://doi.org/10.1029/2020gc008910, 2020.
O'Connell, S., Wolf-Welling, T. C. W., Cremer, M., and Stein, R.: Neogene Paleoceanography and Paleoclimate history from Fram Strait: changes in accumulation rates, edited by: Thiede, J., Myhre, A. M., Firth, J. V., Johson, G. I., and Ruddiman, W. F., Proc. ODP, Sci. Results, 151: College Station, TX (Ocean Drilling Program), 569–582, https://doi.org/10.2973/odp.proc.sr.151.140.1996, 1996.
Ohneiser, C. and Wilson, G. S.: Eccentricity-Paced Southern Hemisphere Glacial-Interglacial Cyclicity Preceding the Middle Miocene Climatic Transition, Paleoceanogr. Paleocl., 33, 795–806, https://doi.org/10.1029/2017PA003278, 2018.
Pälike, H., Norris, R. D., Herrle, J. O., Wilson, P. A., Coxall, H. K., Lear, C. H., Shackleton, N. J., Tripati, A. K., and Wade, B. S.: The heartbeat of the Oligocene climate system, Science, 314, 1894–8, https://doi.org/10.1126/science.1133822, 2006.
Pälike, H., Lyle, M. W., Nishi, H., Raffi, I., Ridgwell, A., Gamage, K., Klaus, A., Acton, G., Anderson, L., Backman, J., Baldauf, J., Beltran, C., Bohaty, S. M., Bown, P., Busch, W., Channell, J. E. T. T., Chun, C. O. J. J., Delaney, M., Dewangan, P., Dunkley Jones, T., Edgar, K. M., Evans, H., Fitch, P., Foster, G. L., Gussone, N., Hasegawa, H., Hathorne, E. C., Hayashi, H., Herrle, J. O., Holbourn, A., Hovan, S., Hyeong, K., Iijima, K., Ito, T., Kamikuri, S. I., Kimoto, K., Kuroda, J., Leon-Rodriguez, L., Malinverno, A., Moore, T. C., Murphy, B. H., Murphy, D. P., Nakamura, H., Ogane, K., Ohneiser, C., Richter, C., Robinson, R., Rohling, E. J., Romero, O., Sawada, K., Scher, H., Schneider, L., Sluijs, A., Takata, H., Tian, J., Tsujimoto, A., Wade, B. S., Westerhold, T., Wilkens, R., Williams, T., Wilson, P. A., Yamamoto, Y., Yamamoto, S., Yamazaki, T., and Zeebe, R. E.: A Cenozoic record of the equatorial Pacific carbonate compensation depth, Nature, 488, 609–614, https://doi.org/10.1038/nature11360, 2012.
Piela, C., Lyle, M., Marcantonio, F., Baldauf, J., and Olivarez Lyle, A.: Biogenic sedimentation in the equatorial Pacific: Carbon cycling and paleoproduction, 12–24 Ma, Paleoceanography, 27, 12–24, https://doi.org/10.1029/2011PA002236, 2012.
Pound, M. J., Haywood, A. M., Salzmann, U., Riding, J. B., Lunt, D. J., and Hunter, S. J.: A Tortonian (Late Miocene, 11.61–7.25 Ma) global vegetation reconstruction, Palaeogeogr. Palaeocl., 300, 29–45, https://doi.org/10.1016/j.palaeo.2010.11.029, 2011.
Pound, M. J., Haywood, A. M., Salzmann, U., and Riding, J. B.: Global vegetation dynamics and latitudinal temperature gradients during the Mid to Late Miocene (15.97–5.33 Ma), Earth-Sci. Rev., 112, 1–22, https://doi.org/10.1016/j.earscirev.2012.02.005, 2012.
Reghellin, D., Coxall, H. K., Dickens, G. R., and Backman, J.: Carbon and oxygen isotopes of bulk carbonate in sediment deposited beneath the eastern equatorial Pacific over the last 8 million years, Paleoceanography, 30, 1261–1286, https://doi.org/10.1002/2015PA002825, 2015.
Reghellin, D., Dickens, G. R., Coxall, H. K., and Backman, J.: Understanding Bulk Sediment Stable Isotope Records in the Eastern Equatorial Pacific, From Seven Million Years Ago to Present Day, Paleoceanogr. Paleocl., 35, 1–22, https://doi.org/10.1029/2019PA003586, 2020.
Ryan, W. B. F., Carbotte, S. M., Coplan, J. O., O'Hara, S., Melkonian, A., Arko, R., Weissel, R. A., Ferrini, V., Goodwillie, A., Nitsche, F., Bonczkowski, J., and Zemsky, R.: Global Multi-Resolution Topography synthesis, Geochem. Geophy. Geosy., 10, Q03014, https://doi.org/10.1029/2008GC002332, 2009.
Schuster, M., Duringer, P., Ghienne, J. F., Vignaud, P., Mackaye, H. T., Likius, A., and Brunet, M.: The age of the Sahara desert, Science, 311, 821 pp., https://doi.org/10.1126/science.1120161, 2006.
Seidov, D. A. N. and Maslin, M.: Atlantic Ocean heat piracy and the bipolar climate see-saw during Heinrich and Dansgaard–Oeschger events, J. Quaternary Sci., 16, 321–328, https://doi.org/10.1002/jqs.595, 2001.
Shackleton, N., Moore Jr., T. C., Rabinowitz, P. D., Boersma, A., Borella, P. E., Chave, A. D., Due'e, G., Fütterer, D., Jiang, M.-J., Kleinert, K., Lever, A., Manivit, H., O'Connell, S., and Richardson, S. H.: Accumulation Rates in Leg 74 Sediments, edited by: Moore Jr., T, C., Rabinowitz, P. D., et al., Initial Reports of the Deep Sea Drilling Project (U.S. Govt. Printing Office), 74, 621–644, https://doi.org/10.2973/dsdp.proc.74.117.1984, 1984.
Shackleton, N. J. and Hall, M. A.: The Late Miocene Stable Isotope Record, Site 926, in: Proceedings of the Ocean Drilling Program, Scientific Results, edited by: Shackleton, N. J., Curry, W. B., Richter, C., and Bralower, T. J., College Station, TX (Ocean Drilling Program), vol. 154, 367–373, 1997.
Shackleton, N. J., Hall, M. A., and Pate, D.: Pliocene Stable Isotope Stratigraphy of Site 846, edited by: Pisias, N. G., Mayer, L. A., Janecek, T. R., Palmer-Julson, A., and van Andel, T. H., Proc. Ocean Drill. Program, Sci. Results, 138, 337–355, 1995.
Shevenell, A. E., Kennett, J. P., and Lea, D. W.: Middle Miocene Southern Ocean Cooling and Antarctic Cryosphere Expansion, Science, 305, 1766–1770, https://doi.org/10.1126/science.1100061, 2004.
Shevenell, A. E., Kennett, J. P., and Lea, D. W.: Middle Miocene ice sheet dynamics, deep-sea temperatures, and carbon cycling: A Southern Ocean perspective, Geochem. Geophy. Geosy., 9, Q02006, https://doi.org/10.1029/2007gc001736, 2008.
Shipboard Scientific Party Leg 208: Site 1264, in: Proceedings of the Ocean Drilling Program, Initial Reports, edited by: Zachos, J. C., Kroon, D., Blum, P., and Shipboard Scientific Party Leg 208, College Station, TX (Ocean Drilling Program), vol. 208, 1–73, 2004a.
Shipboard Scientific Party Leg 208: Site 1265, in: Proceedings of the Ocean Drilling Program, Initial Reports, edited by: Zachos, J. C., Kroon, D., Blum, P., and Shipboard Scientific Party Leg 208, College Station, TX (Ocean Drilling Program), vol. 208, 1–87, 2004b.
Shipboard Scientific Party Leg 208: Site 1267, in: Proceedings of the Ocean Drilling Program, Initial Reports, edited by: Zachos, J. C., Kroon, D., Blum, P., and Shipboard Scientific Party Leg 208, College Station, TX (Ocean Drilling Program), vol. 208, 1–87, 2004c.
Sinnesael, M., De Vleeschouwer, D., Zeeden, C., Batenburg, S. J., Da Silva, A.-C., de Winter, N. J., Dinarès-Turell, J., Drury, A. J., Gambacorta, G., Hilgen, F. J., Hinnov, L. A., Hudson, A. J. L., Kemp, D. B., Lantink, M. L., Laurin, J., Li, M., Liebrand, D., Ma, C., Meyers, S. R., Monkenbusch, J., Montanari, A., Nohl, T., Pälike, H., Pas, D., Ruhl, M., Thibault, N., Vahlenkamp, M., Valero, L., Wouters, S., Wu, H., and Claeys, P.: The Cyclostratigraphy Intercomparison Project (CIP): consistency, merits and pitfalls, Earth-Sci. Rev., 199, 102965, https://doi.org/10.1016/j.earscirev.2019.102965, 2019.
Sosdian, S. M., Babila, T. L., Greenop, R., Foster, G. L., and Lear, C. H.: Ocean Carbon Storage across the middle Miocene: a new interpretation for the Monterey Event, Nat. Commun., 11, 1–11, https://doi.org/10.1038/s41467-019-13792-0, 2020.
Super, J. R., Thomas, E., Pagani, M., Huber, M., Brien, C. O., and Hull, P. M.: North Atlantic temperature and pCO2 coupling in the early-middle Miocene, Geology, 46, 519–522, https://doi.org/10.1130/G40228.1, 2018.
Super, J. R., Thomas, E., Pagani, M., Huber, M., O'Brien, C. L., and Hull, P. M.: Miocene Evolution of North Atlantic Sea Surface Temperature, Paleoceanogr. Paleocl., 35, e2019PA003748, https://doi.org/10.1029/2019pa003748, 2020.
Sutherland, R., Dickens, G. R., Blum, P., Agnini, C., Alegret, L., Asatryan, G., Bhattacharya, J., Bordenave, A., Chang, L., Collot, J., Cramwinckel, M. J., Dallanave, E., Drake, M. K., Etienne, S. J. G., Giorgioni, M., Gurnis, M., Harper, D. T., Huang, H.-H. M., Keller, A. L., Lam, A. R., Li, H., Matsui, H., Morgans, H. E. G., Newsam, C., Park, Y.-H., Pascher, K. M., Pekar, S. F., Penman, D. E., Saito, S., Stratford, W. R., Westerhold, T., and Zhou, X.: Expedition 371 Summary, 2019, Proceedings of the International Ocean Discovery Program, volume 371, https://doi.org/10.14379/iodp.proc.371.101.2019, 2019.
Tanner, T., Hernández-Almeida, I., Drury, A. J., Guitián, J., and Stoll, H.: Decreasing Atmospheric CO2 During the Late Miocene Cooling, Paleoceanogr. Paleocl., 35, 1–25, https://doi.org/10.1029/2020PA003925, 2020.
Tauxe, L. and Feakins, S. J.: A re-assessment of the chronostratigraphy of late Miocene C3–C4 transitions, Paleoceanography and Paleoclimatology, 35, e2020PA003857, https://doi.org/10.1029/2020PA003857, 2020.
Tian, J., Yang, M., Lyle, M. W., Wilkens, R., and Shackford, J. K.: Obliquity and long eccentricity pacing of the Middle Miocene climate transition, Geochem. Geophy. Geosy., 14, 1740–1755, https://doi.org/10.1002/ggge.20108, 2013.
Tian, J., Ma, W., Lyle, M. W., and Shackford, J. K.: Synchronous mid-Miocene upper and deep oceanic δ13C changes in the east equatorial Pacific linked to ocean cooling and ice sheet expansion, Earth Planet. Sci. Lett., 406, 72–80, https://doi.org/10.1016/j.epsl.2014.09.013, 2014.
Tian, J., Ma, X., Zhou, J., Jiang, X., Lyle, M., Shackford, J., and Wilkens, R.: Paleoceanography of the east equatorial Pacific over the past 16 Myr and Pacific–Atlantic comparison: High resolution benthic foraminiferal δ18O and δ13C records at IODP Site U1337, Earth Planet. Sci. Lett., 499, 185–196, https://doi.org/10.1016/j.epsl.2018.07.025, 2018.
Tipple, B. J. and Pagani, M.: The Early Origins of Terrestrial C4 Photosynthesis, Annu. Rev. Earth Planet. Sci., 35, 435–461, https://doi.org/10.1146/annurev.earth.35.031306.140150, 2007.
Torrence, C. and Compo, G. P. G. P.: A practical guide to wavelet analysis, Bull. Am. Meteorol. Soc., 79, 61–78, https://doi.org/10.1175/1520-0477(1998)079<0061:APGTWA>2.0.CO;2, 1998.
Uno, K. T., Polissar, P. J., Jackson, K. E., and deMenocal, P. B.: Neogene biomarker record of vegetation change in eastern Africa, Proc. Natl. Acad. Sci. USA, 113, 6355–6363, https://doi.org/10.1073/pnas.1521267113, 2016.
Van Andel, T. H., Heath, G. R., and Moore, T. C.: Cenozoic History and Paleoceanography of the Central Equatorial Pacific Ocean, Mem. Geol. Soc. Am., 143, 1–223, https://doi.org/10.1130/MEM143-p1, 1975.
Voigt, J., Hathorne, E. C., Frank, M., and Holbourn, A.: Minimal influence of recrystallization on middle Miocene benthic foraminiferal stable isotope stratigraphy in the eastern equatorial Pacific, Paleoceanography, 31, 98–114, https://doi.org/10.1002/2015PA002822, 2016.
Wade, B. S. and Pälike, H.: Oligocene climate dynamics, Paleoceanography, 19, PA4019, https://doi.org/10.1029/2004PA001042, 2004.
Westerhold, T., Röhl, U., Frederichs, T., Agnini, C., Raffi, I., Zachos, J. C., and Wilkens, R. H.: Astronomical calibration of the Ypresian timescale: implications for seafloor spreading rates and the chaotic behavior of the solar system?, Clim. Past, 13, 1129–1152, https://doi.org/10.5194/cp-13-1129-2017, 2017.
Westerhold, T., Marwan, N., Drury, A. J., Liebrand, D., Agnini, C., Anagnostou, E., Barnet, J. S. K., Bohaty, S. M., De Vleeschouwer, D., Florindo, F., Frederichs, T., Hodell, D. A., Holbourn, A. E., Kroon, D., Laurentano, V., Littler, K., Lourens, L. J., Lyle, M., Pälike, H., Röhl, U., Tian, J., Wilkens, R. H., Wilson, P. A., and Zachos, J. C.: An astronomically dated record of Earth's climate and its predictability over the last 66 Million Years, Science, 369, 1383–1388, https://doi.org/10.1126/SCIENCE.ABA6853, 2020.
Wilkens, R. H., Westerhold, T., Drury, A. J., Lyle, M., Gorgas, T., and Tian, J.: Revisiting the Ceara Rise, equatorial Atlantic Ocean: isotope stratigraphy of ODP Leg 154 from 0 to 5 Ma, Clim. Past, 13, 779–793, https://doi.org/10.5194/cp-13-779-2017, 2017.
Williams, T., van de Flierdt, T., Hemming, S. R., Chung, E., Roy, M., and Goldstein, S. L.: Evidence for iceberg armadas from East Antarctica in the Southern Ocean during the late Miocene and early Pliocene, Earth Planet. Sci. Lett., 290, 351–361, https://doi.org/10.1016/j.epsl.2009.12.031, 2010.
Wolf-Welling, T. C. W., Cremer, M. M., O'Connell, S., Winkler, A., and Thiede, J.: Cenozoic Arctic Gateway paleoclimate variability: indications from changes in coarse-fraction composition, edited by: Thiede, J., Myhre, A. M., Firth, J. V., Johnson, G. L., and Ruddiman, W. F., Proc. ODP, Sci. Results, College Station, TX (Ocean Drilling Program), 151, 515–567 https://doi.org/10.2973/odp.proc.sr.151.139.1996, 1996.
Yang, R., Yang, Y., Fang, X., Ruan, X., Galy, A., Ye, C., Meng, Q., and Han, W.: Late Miocene Intensified Tectonic Uplift and Climatic Aridification on the Northeastern Tibetan Plateau: Evidence From Clay Mineralogical and Geochemical Records in the Xining Basin, Geochem. Geophy. Geosy., 20, 829–851, https://doi.org/10.1029/2018GC007917, 2019.
Zachos, J., Pagani, H., Sloan, L., Thomas, E., Billups, K., Pagani, M., Sloan, L., Thomas, E., Billups, K., Pagani, H., Sloan, L., Thomas, E., and Billups, K.: Trends, rhythms, and aberrations in global climate 65 Ma to present, Science, 292, 686–693, https://doi.org/10.1126/science.1059412, 2001.
Zeeden, C., Hilgen, F., Westerhold, T., Lourens, L., Röhl, U., and Bickert, T.: Revised Miocene splice, astronomical tuning and calcareous plankton biochronology of ODP Site 926 between 5 and 14.4 Ma, Palaeogeogr. Palaeocl., 369, 430–451, https://doi.org/10.1016/j.palaeo.2012.11.009, 2013.
Zeeden, C., Hilgen, F. J., Hüsing, S. K., and Lourens, L. L.: The Miocene astronomical time scale 9-12-Ma: New constraints on tidal dissipation and their implications for paleoclimatic investigations, Paleoceanography, 29, 296–307, https://doi.org/10.1002/2014PA002615, 2014.
Zhisheng, A., Kutzbach, J. E., Prell, W. L., and Porter, S. C.: Evolution of Asian monsoons and phased uplift of the Himalaya-Tibetan plateau since Late Miocene times., Nature, 411, 62–66, https://doi.org/10.1038/35075035, 2001.