the Creative Commons Attribution 4.0 License.
the Creative Commons Attribution 4.0 License.
 | 18 May 2021
The speleothem oxygen record as a proxy for thermal or moisture changes: a case study of multiproxy records from MIS 5–MIS 6 speleothems from the Demänová Cave system
Jacek Pawlak
Speleothems are an important source of palaeoclimatic information about the terrestrial environment. The basic advantages of speleothems are their high preservation potential, the possibility of precise dating using the uranium-series (U-series) method, and many different proxies, such as stable isotopes, trace elements, and microfabrics, which can be interpreted in terms of palaeoclimatic conditions. Currently, central Europe is located in a transitional climate zone under the influence of both oceanic and continental climates. However, in the past, the region could have been under a stronger continental climate influence during cold glacial episodes or a stronger oceanic climate influence during wetter interglacial episodes. Long-term speleothem records can add new beneficial data about past climate changes in the region. The multiproxy record of the JS9 stalagmite, collected in the Demänová Cave system (Slovakia), represents a ca. 60 kyr period (143–83 ka). A multiproxy interpretation of the JS9 record shows that long-term δ18O trends can be interpreted as global/regional temperature changes, whereas short-term δ18O signals reflect changes in humidity. In contrast to the records from the Alps and the northern Tatra Mountains, the δ18O record of speleothem JS9 shows instantaneous decreasing episodes during Termination II. This indicates that the Carpathian Belt was an important climatic barrier at that time.
- Article
(7689 KB) - Full-text XML
- BibTeX
- EndNote


Speleothems are important palaeoenvironmental archives (Lachniet, 2009; Fairchild and Treble, 2009; Fairchild and Baker, 2012; Koltai et al., 2018; Kern et al., 2019). Many different palaeoclimatic proxies are currently being studied in speleothems, such as stable isotope compositions, trace element contents, calcite microfabrics and the isotopic compositions of water from speleothem inclusions (Fairchild and Treble, 2009; Wong and Breecker, 2015; Frisia, 2015; Demény et al., 2017; Baker et al., 2019). Nevertheless, the δ18O proxy is still the most commonly used for regional and global comparisons (Lisiecki and Raymo, 2005; McDermott et al., 2011; Govin et al., 2015). Therefore, understanding which climatic factor has the strongest influence on δ18O composition at a given site is a crucial problem (Lachniet, 2009).
Basically, the δ18O value of speleothems reflects the oxygen isotopic composition of precipitation. The isotopic composition of precipitation depends on global factors, such as the mean isotopic composition of ocean surface water. On a long-term scale, the global volume of glacial ice has an influence on the δ18O value of ocean surface water (Dansgaard, 1964). Currently, the Atlantic Ocean is the main source of vapour for precipitation in Europe. Other potential sources are the Mediterranean Sea, the Black Sea and the Nordic Seas (Ionita, 2014). Water from the Mediterranean Sea surface is enriched in 18O compared with water from the Atlantic Ocean. During glaciations, the Fennoscandian ice sheet (which is enriched in 16O) affects atmospheric circulation in central Europe and, thus, the isotopic composition of meteoric water (Bianchi and McCave 1999; Elmore et al., 2015). During deglaciations, cold meltwater can slow down the circulation of Atlantic currents. The consequence of such a situation for central Europe may be the limited influence of the Atlantic Ocean and the stronger influence of enriched 18O moisture transported from the Black Sea and Mediterranean region (Celle-Jeanton et al., 2001). The other regional factor shaping δ18O in Europe is the continental effect (McDermott et al., 2011). Finally, the isotopic composition of rainwater at the precipitation site is modified by local factors such as altitude, amount effect and local temperature (Drysdale et al., 2005; Moseley et al., 2015).
The isotopic composition of dripping waters can also be modified inside the soil and epikarst zone by evaporation and prior calcite precipitation (PCP; Baker et al., 2019). However, PCP affects the δ13C value of dissolved CO2 more than the δ18O value. In a cave environment, the isotopic fractionation between the dripping water and crystallising calcite depends on the cave air temperature. The cave air temperature usually reflects the mean annual temperature in the near-cave area. Additionally, the isotopic composition of the crystallising calcite can be altered by kinetic effects when the relative humidity of the cave air is less than 100 % (Dorale and Liu 2009).
Recently, more than a dozen speleothem records of the last interglacial age have been obtained from the European continent (Meyer et al., 2008; Couchoud et al., 2009; Moseley et al., 2015; Vansteenberge et al., 2016; Demény et al., 2017; Pawlak et al., 2019, 2020). The temperature, amount of precipitation at the cave site and changes in the main source of vapour for precipitation are considered to be the main factors determining the δ18O value of precipitated calcite. However, for records from the Alps and central Europe, temperature appears to be a more important factor (Moseley et al., 2015; Kern et al., 2019; Pawlak et al., 2019, 2020; Comas-Bru et al., 2020). This result is consistent with the observations made by Różański et al. (1993) which showed that the isotopic composition of rainfall in temperate regions of Europe mainly depends on local temperature. However, distinguishing which factor is the most dominant is not always a simple task. For example, coastal sites are more influenced by the amount of precipitation (Couchoud et al., 2009; Vansteenberge et al., 2016).
Unlike most European records, the records from the Middle East appear to be influenced by more factors, such as the amount of precipitation, the temperature and changes in the main source of vapour for precipitation (the source effect; Bar-Matthews et al., 2003; Nehme et al., 2015). These factors can be associated with changes in the prevailing circulation patterns, the impact of evaporation on the Mediterranean Sea surface δ18O and the lower amplitude of long-term mean annual temperature changes during the last interglacial period at lower latitudes (Rybak et al., 2018).
Currently, Slovakia is influenced by two main climate types: a boreal and fully humid climate with warm summers (Dfb) in the east, and a warm temperate and fully humid climate (Cfb) in the west (Kottek et al., 2006). However, in the past, the local climate could have been more continental during the colder and drier glacial periods and more transitional during the warmer interglacial periods (Feurdean et al., 2014). The new long-term speleothem records can add beneficial data about past climate changes in this region. This paper presents an approximately 60 kyr long multiproxy record (δ18O, δ13C, Mg, Sr, Ba, Na, P, Fe, Mn and Si) of a Marine Isotope Stage (MIS) 5–6 age stalagmite collected in the Demänová Cave system, Slovakia. The interpretation of these proxies focuses on distinguishing dry continental climate phases from more wet transitional climate episodes. Additionally, the interpretation of stable isotopic compositions and trace element contents helps to distinguish which factor had the strongest influence on the shape of the δ18O record: the local temperature, the humidity or the source effect.
The Demänová Cave system (DCS) is located in the Low Tatras (Fig. 1a), Western Carpathians, Slovakia (49.00∘ N, 19.58∘ E; 837 ). The DCS is 41.4 km (Fig. 1b) long, and its denivelation is 196 m (Herich, 2017). The DCS includes 10 caves that are connected to each other. Sample JS9 was collected in the Demänovská Slobody Cave (Fig. 1b). The DCS has nine cave levels that can be correlated with fluvial terraces of the Demänovká Stream according to Droppa (1966, 1972). The cave system was formed by fluvial processes and the cave corridors were formed by allochthonous sinking streams during the late Pliocene (Bella, 1993). The host rocks of the DCS are Middle Triassic carbonate rocks, primarily the Gutenstein and Annaberg limestones (early Anisian), organodetritic limestones (late Anisian), and Ramsau dolomite (Ladinian) (Droppa, 1957; Gaál, 2016; Gaál and Michalík, 2017).
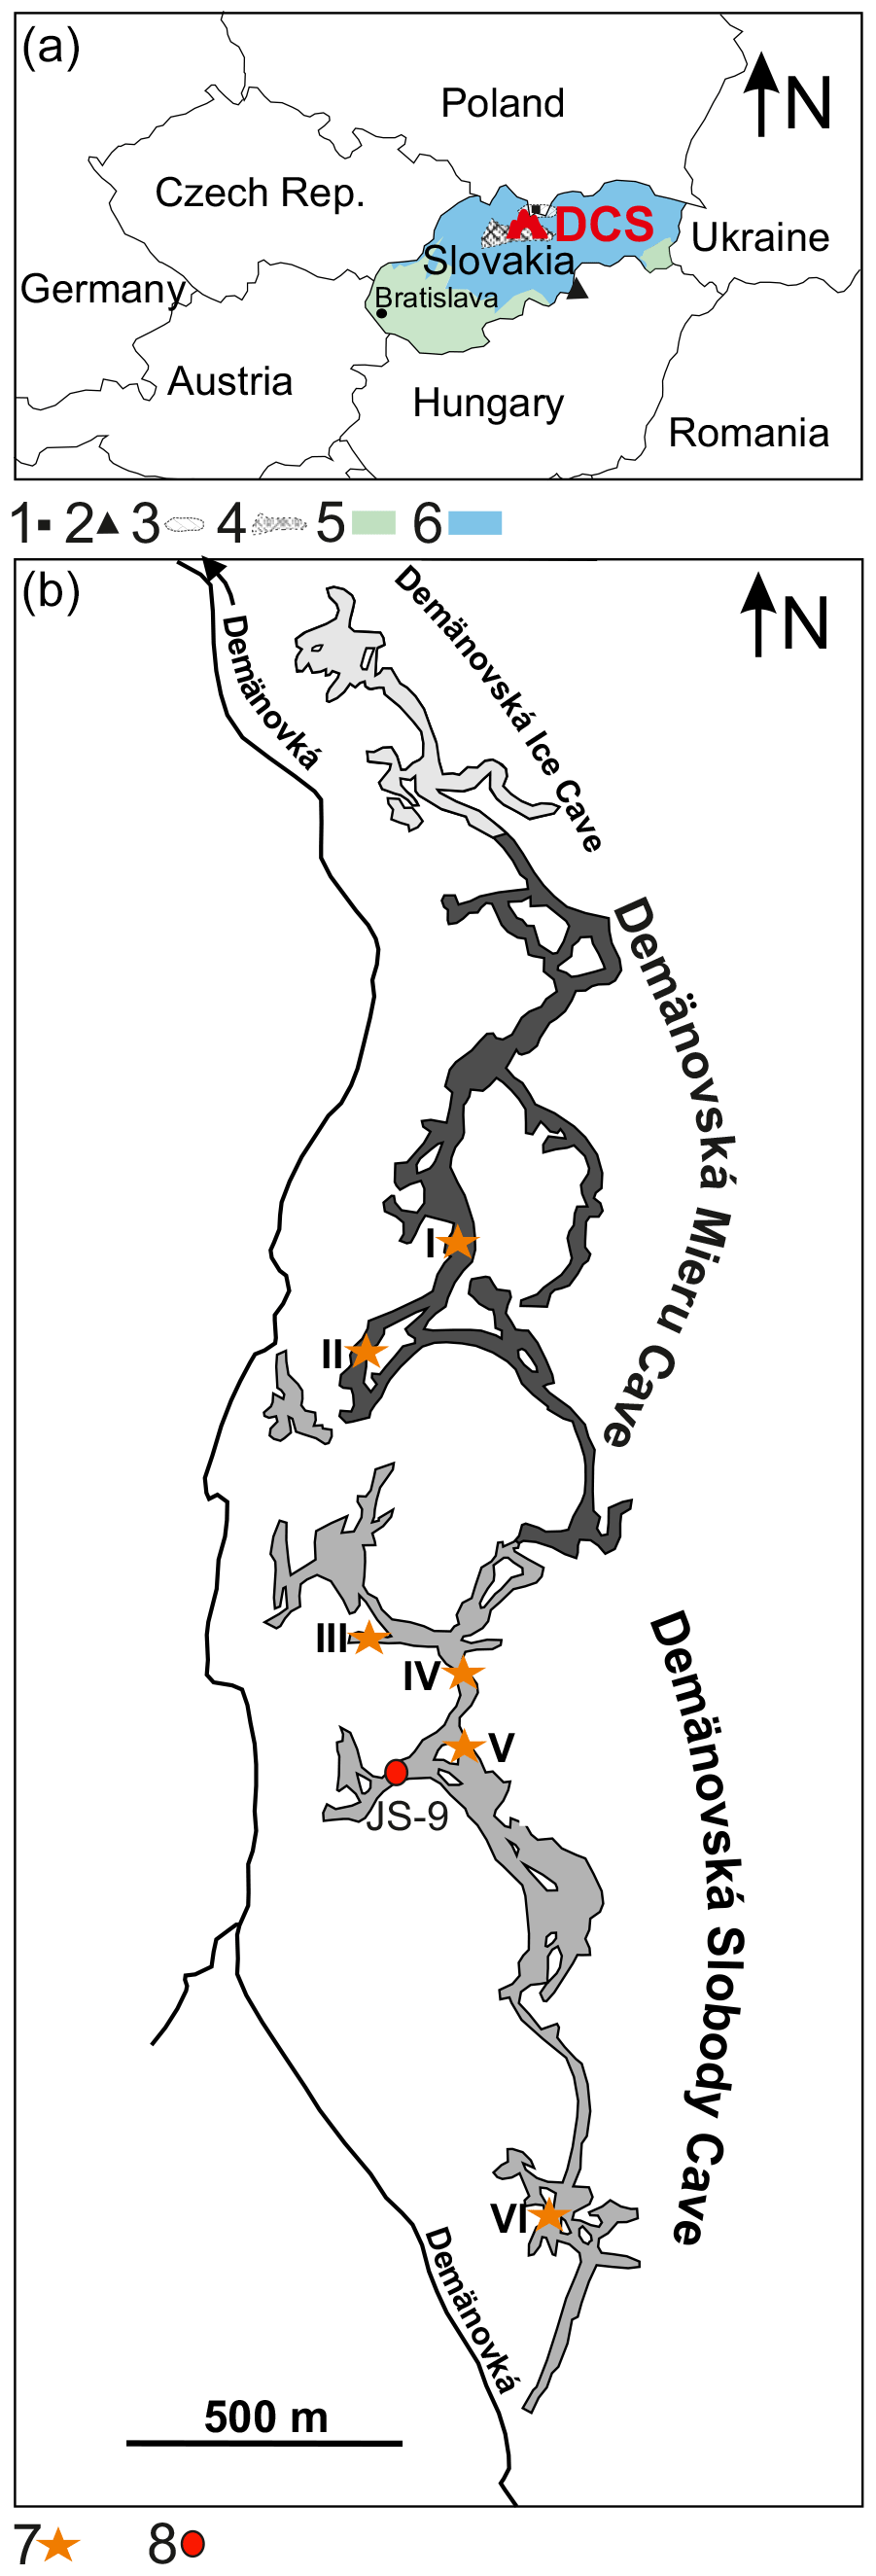
Figure 1(a) The location of the Demänová Cave system. (b) A map of the Demänová Cave system. The numbers used in the panel legends refer to the following: 1 – the Magurska Cave site, 2 – the Baradla Cave site, 3 – the Tatra Mountains, 4 – the Low Tatras, 5 – the Cfb climate zone, 6 – the Dfb climate zone, 7 – the sites with cave temperature monitoring and 8 – the sample collection site.
The DCS is located in a transitional climate zone between oceanic and continental climates (Sotak and Borsanyi, 2004; Kottek et al., 2006). There are two meteorological stations near the DCS: the first is located in the township of Liptovský Mikuláš close to the Demänovská valley entrance (49.07∘ N, 19.61∘ E; 570 ), and the second is located on Chopok peak under the influence of a cold mountain climate (48.94∘ N, 19.59∘ E; 2008 ). Chopok peak has a colder and wetter climate (mean annual temperature of −0.1 ∘C; mean annual precipitation of 1325 mm), whereas Liptovský Mikuláš has a warmer and drier climate (mean annual temperature of +6.9 ∘C; mean annual precipitation of 537 mm). The local climate has strong seasonality: the coldest and driest months are January and February, whereas the warmest months are July and August; the greatest amount of precipitation is usually noted in June and July. Despite the high altitude and thermal gradient along the valley, the mean annual δ18O value of precipitation at Chopok peak (−10.43 ‰) is similar to the value in Liptovský Mikuláš (−10.92 ‰) (Holko et al., 2012). The average cave temperature measured in 2015–2016 at several sites in the DCS was 6.3 ± 0.6 ∘C (Hercman et al., 2020).
Based on a large number of uranium-series (U-series) ages, several stages of speleothem crystallisation, which developed chiefly in the warmer periods of the Pleistocene and in the Holocene, were distinguished in the DCS (e.g. Hercman et al., 1997, 2020; Hercman, 2000; Bella et al., 2021). Field observations along with a chemical study of underground water in caves (Motyka et al., 2005) suggest that many speleothems still grow in the DCS. Sample JS9 was collected in the northern part of the Demänovská Slobody Cave (Fig. 1b).
3.1 Petrography
The entire JS9 stalagmite profile was analysed by a Nikon Eclipse LV100POL microscope, including microfabric structures, the appearance of calcite crystals, potential discontinuities and porosity. The analysis of speleothem microfabrics and microfabric log construction was based on the methodology proposed by Frisia (2015). The microscopic analyses were performed at the Institute of Geological Sciences at the Polish Academy of Sciences (Warsaw, Poland).
3.2 U-series and age–depth model
A total of 10 calcite samples (0.1–0.5 g) were collected by drilling the JS9 speleothem through its growth axes. The samples were drilled as thin as possible and had an average thickness of 2.5 ± 0.2 mm. The chemical preparation of the samples was performed at the Uranium-Series Laboratory of the Institute of Geological Sciences, Polish Academy of Sciences (Warsaw, Poland). In order to control the efficiency of the chemical procedure, a spike (233U, 236U and 229Th mixture) was initially added to the samples. In the first step of the chemical procedure, the samples were heated to decompose potential organic matter. The samples were then dissolved in nitric acid. Finally, uranium and thorium were separated from the solution by chromatographic methods using TRU Resin (Hellstrom, 2003). In addition to the regular samples, the internal standards and blank samples were processed by the same procedure. U and Th isotopic compositions of all the samples and standards were measured at the Institute of Geology of the Czech Academy of Sciences public research institution (Prague, Czech Republic) by a double-focusing sector-field inductively coupled plasma (ICP) mass analyser (Element 2, Thermo Finnigan MAT). The spectrometer settings were at a low mass resolution ( ≥ 300).
Table 1U-series results. AR stands for activity ratio.
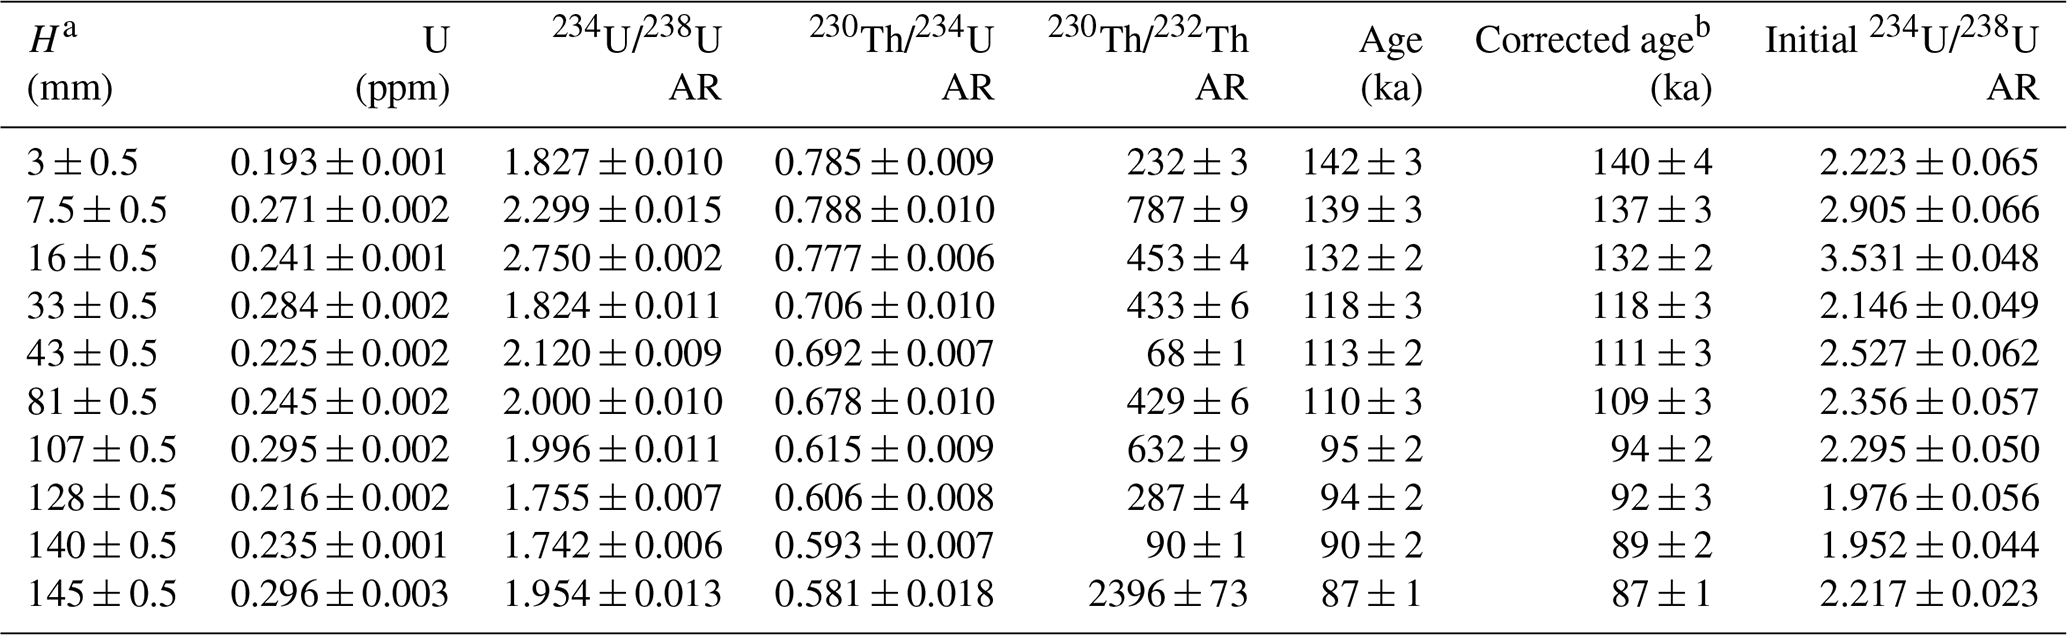
a Distance from the base. b Corrected ages using the modified algorithm proposed by Hellstrom (2006).
The obtained measurements were corrected for background counts and chemical blanks. The final results were reported as the activity ratios (Table 1). The final U-series ages were calculated using the latest decay constants (in yr−1): λ238 = (1.55125 ± 0.0017) × 10−10 (Jaffey et al., 1971), λ234 = (2.826 ± 0.0056) × 10−6 (Cheng et al., 2013), λ232 = (4.95 ± 0.035) × 10−11 (Holden, 1990) and λ230 = (9.1577 ± 0.028) × 10−6 (Cheng et al., 2013). The reported age errors were estimated using error propagation rules. All measurement errors were considered except for the decay constant.
A modified version of the Hellstrom algorithm was applied to correct the obtained ages (Hellstrom, 2006), with the assumption of initial contamination by 230Th, 234U and 238U isotopes. The algorithm searches for the lowest values of initial contamination by 230Th, 234U and 238U isotopes from detrital sources, which were able to correct series of ages in stratigraphic order (Błaszczyk et al., 2021). The age–depth model was calculated using the MOD-AGE algorithm (Hercman and Pawlak, 2012).
3.3 Stable isotopes
The samples for stable isotopic composition measurement were drilled by a Micro Mill with a 0.1 mm drill bit diameter. The final number of obtained samples was 290. In the first stage, the JS9 speleothem was sampled along its growth axis at a resolution of one sample per millimetre. The lower part of the stalagmite (0 to 40 mm) was additionally sampled at a resolution of one sample every 0.3 mm to minimise the difference in resolution between the lower and upper parts of the record caused by differences in growth rate. The isotopic composition of O and C was measured by a Thermo Kiel IV carbonate device connected to a Finnigan Deltaplus isotope-ratio mass spectrometer (IRMS) in dual-inlet mode. The results were normalised to three international standards, NBS 19, NBS 18 and IAEA CO 8, and were reported relative to the Vienna Pee Dee Belemnite (VPDB) international standard. The analytical precision (1σ) was better than 0.03 ‰ and 0.08 ‰ for δ13C and δ18O respectively. The reproducibility was checked by measurement of two internal standards after every 12 samples (± 0.03 ‰ for δ13C; ± 0.08 ‰ for δ18O). The analyses were performed in the Stable Isotope Laboratory (Institute of Geological Sciences, Polish Academy of Sciences) in Warsaw.
3.4 Trace elements
The trace element content was analysed from thin sections by an analyte excite excimer laser ablation (LA) system with a wavelength of 193 nm connected to an Element 2 ICP mass spectrometer (ICP-MS; Thermo Finnigan); a fluence of 2.44 J cm−2 was obtained at 50 % laser power with 10 Hz pulses. The width of each line was 50 µm, and the laser speed at each scan was 5 µm s−1. Additional details of the LA-ICP-MS analytical procedure followed the procedure described by Eggins et al. (1997). Measurements of near-surface trace element contents, namely, Mg, Sr, Na, Ba, P Si, Fe and Mn, were performed at medium resolution. The obtained raw data were normalised to Ca. Finally, the data were smoothed by the adjected averaging method using 10 nearby data points.
4.1 Petrography
The results of petrographic studies are presented in Fig. 2. The JS9 sample is a 155 mm long columnar stalagmite with a diameter of 80 mm. Macroscopically, the JS9 stalagmite is composed of laminated calcite (Fig. 2a). The colour of the laminae changes from light cream to dark brown (Fig. 2a). Between 75 and 85 mm, the stalagmite has a grey colour. The light cream laminae between 40 and 75 mm have a zone of macroscopically visible porosity in the axial part of the stalagmite. Microscopic analysis of the appearance of calcite crystals and the identification of textural features show that most of the observed stalagmite consist of columnar polycrystals with length-to-width ratios that are usually > 10:1. “Fibre-like” calcite individuals compose each polycrystal. The overall appearance of this layer resembles spherulite, which is composed of bundles of elongated crystals bent outward (Fig. 2b, c). The polycrystals show brush extinction that converges away from the substrate when the rotating table is turned clockwise. The characteristics mentioned above are similar to those described by Frisia (2015); these characteristics indicate that the columnar radiaxial fibrous (Crf) texture is a dominant fabric in the JS9 stalagmite (Fig. 2b). Parts of stalagmites containing Crf fabric are usually separated by thin layers of small calcite crystals and detrital material – those layers are dark in cross-polarised light (Fig. 2c). The appearance of these thin layers indicates the micrite (M) fabric described by Frisia (2015). Micrite fabric is most abundant in the middle part and in the youngest layers of the JS9 stalagmite (Fig. 2c).

Figure 2The JS9 sample lithology: (a) a photo of the JS9 stalagmite, (b) a microfabric log scaled by distance from the base of the stalagmite and (c) exemplary photos of microfabrics. M denotes micrite fabric, and Crf denotes columnar radiaxial fibrous microfabric.
4.2 U-series dating and age–depth model construction
The results of 10 U-series dates are presented in Table 1. The reported errors are 2σ and vary from 0.8 % to 2.8 %. The analysed samples do not show any visible detrital contamination at the dissolution stage. However, four of the measured samples have a ratio lower than 300. In the case of measurement by mass spectrometry, these samples should be considered contaminated by detrital admixtures (Hellstrom, 2006). Therefore, the entire profile was corrected using a modified procedure proposed by Hellstrom (2006). The result of correction shows that the corrected ages are within the error range of the uncorrected ages (Table 1).
Based on the results of U-series dating, an age–depth model was constructed for the JS9 stalagmite (Fig. 3). According to the obtained age–depth model, deposition of the JS9 stalagmite started at 142 ± 4 ka and ended at 84 ± 3 ka. The growth rate of the JS9 stalagmite was not uniform. From 142 to 112 ka, its growth rate was relatively slow at 1.4 mm kyr−1; after 112 ka, it rapidly grew at a rate of 11.5 mm kyr−1, which ended at 109 ka, and then the growth rate slowed to 1.9 mm kyr−1. The last intensive change in the growth rate occurred after 95 ka when it increased to 4.2 mm kyr−1.
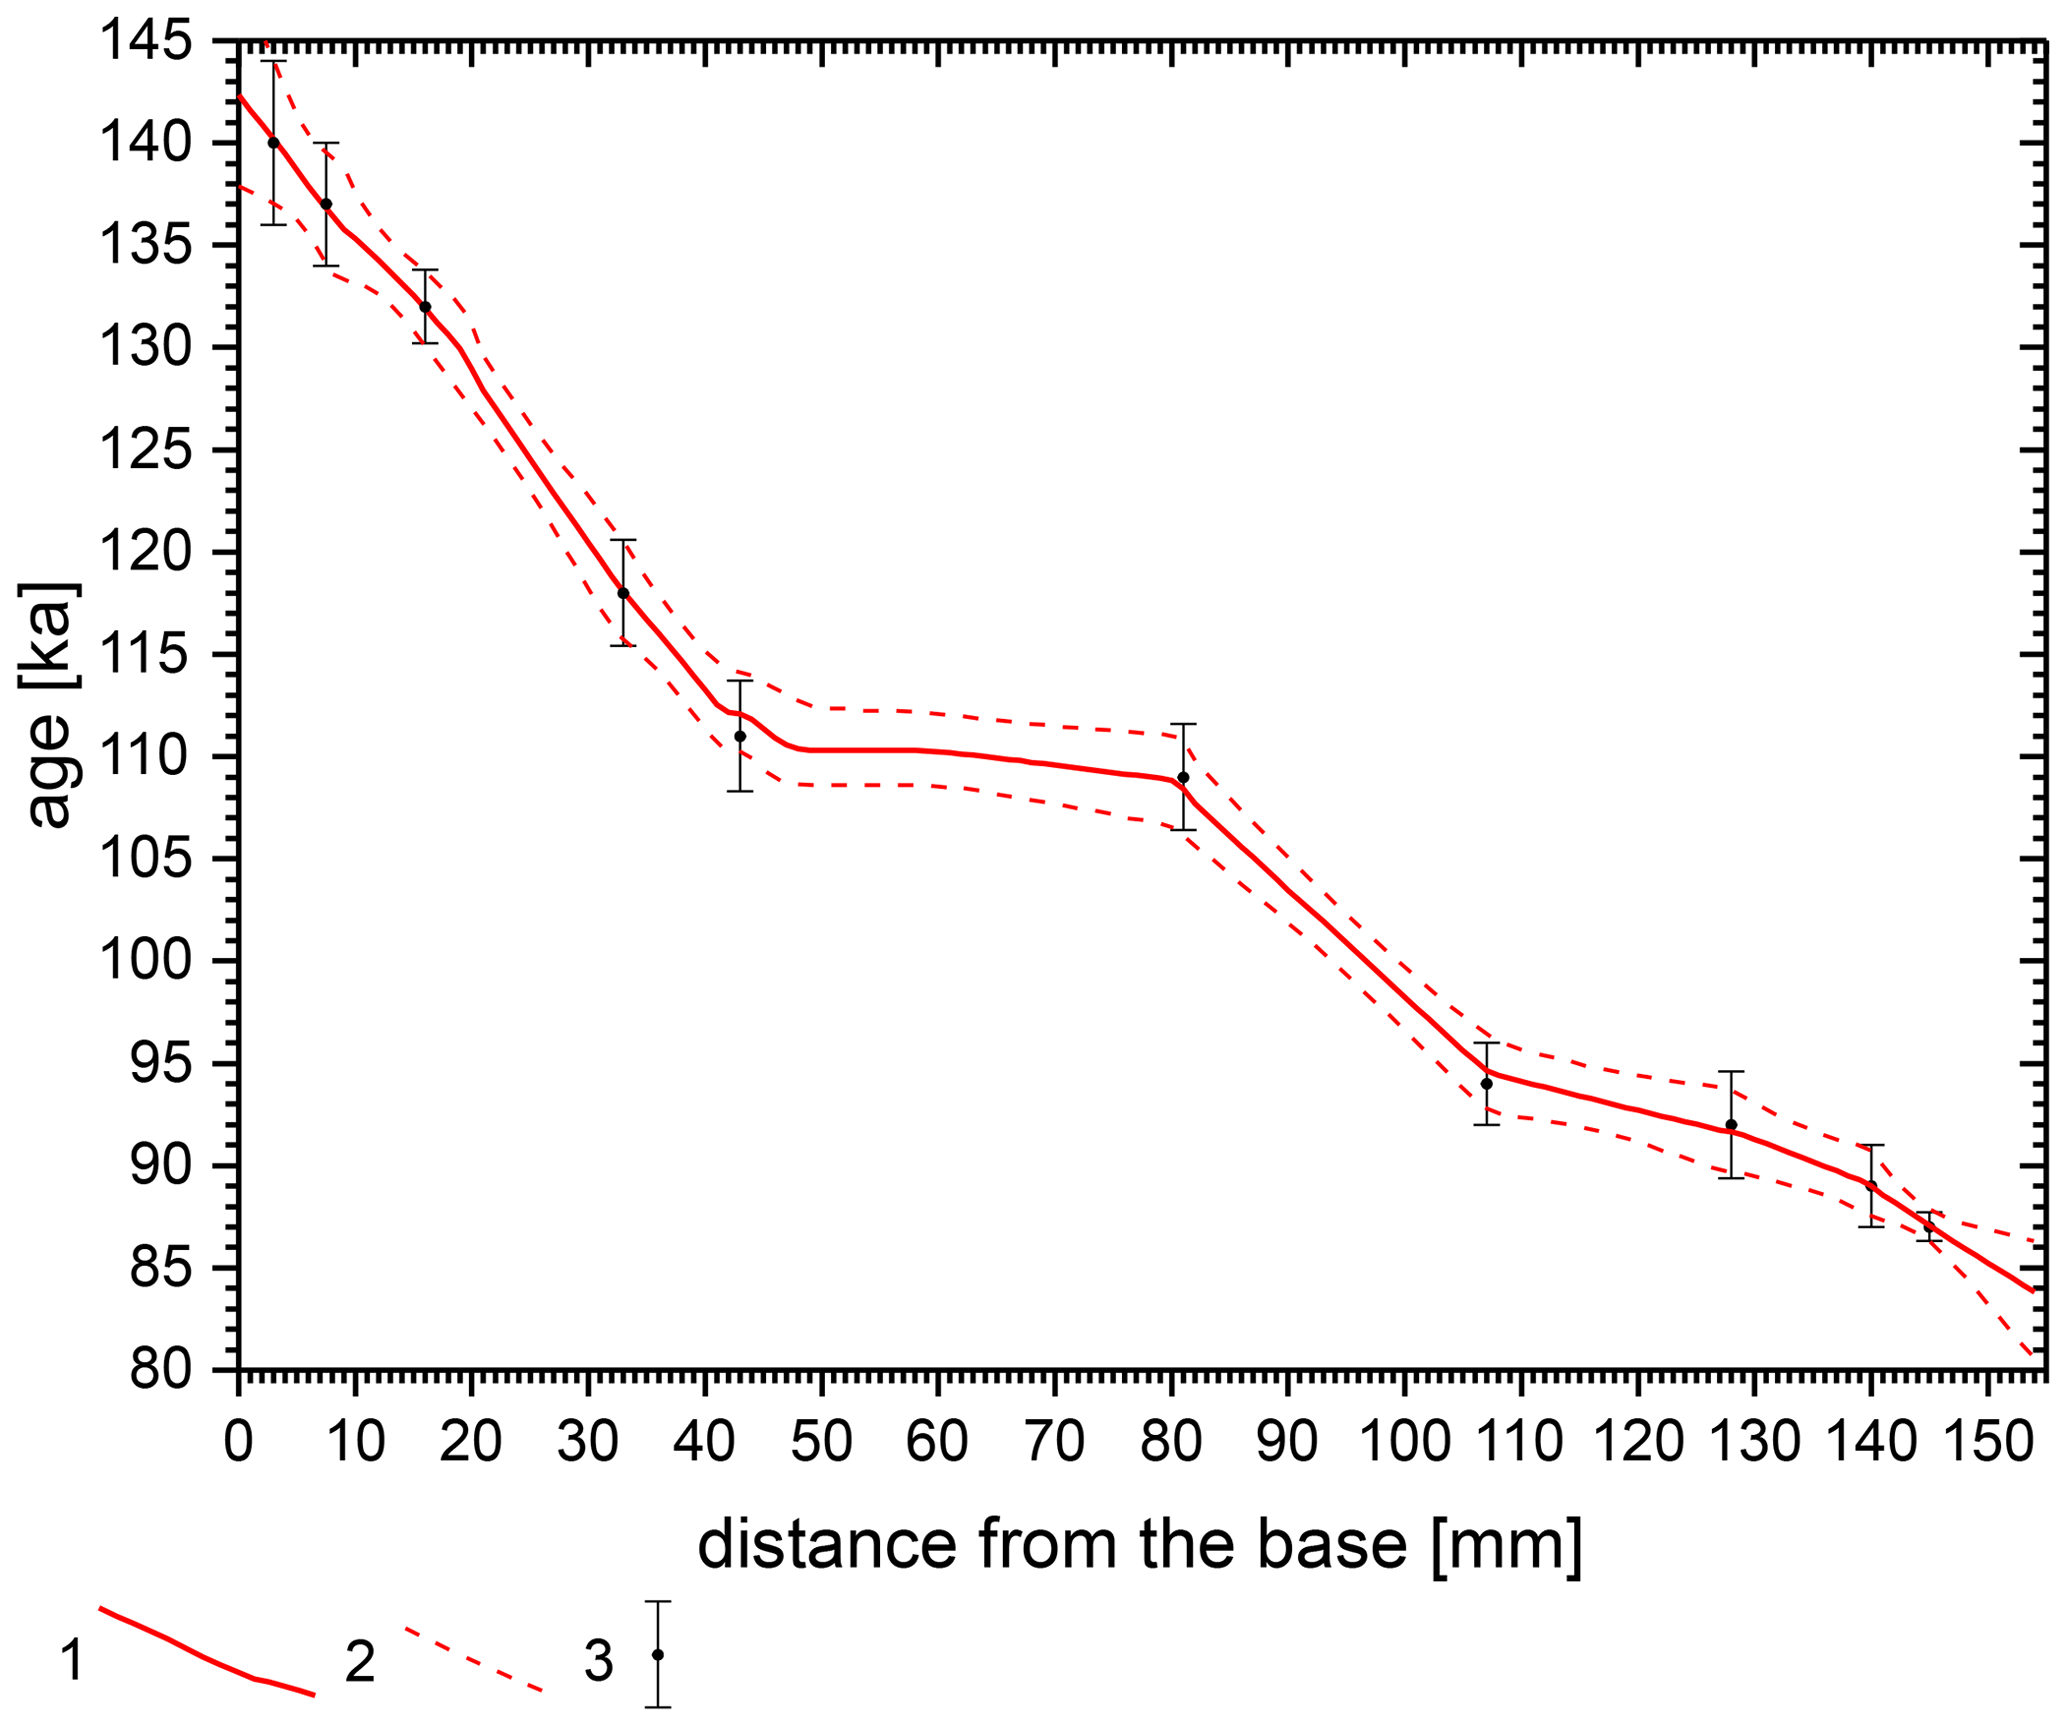
Figure 3Age–depth model for the JS9 stalagmite. 1 denotes the age–depth model median, 2 denotes the 2σ confidence band and 3 denotes the U-series ages with 2σ uncertainties.
4.3 Stable isotopes
The obtained isotopic records (Fig. 4a, b) cover the interval from the late MIS 6 to MIS 5a. The mean value of the δ18O record is −7.05 ‰ (Fig. 4a), and its value varies in a range from −9 ‰ to −5.7 ‰. The δ18O signal expresses short time changes, and the average value of its amplitude is ca. 0.8 ‰ (Fig. 4a). At the end of MIS 6, an increase in δ18O values is interrupted by a 1.2 ‰ instant decline. The next important change occurs at the boundary between MIS 5d and MIS 5c – an episode of elevated δ18O values greater than −6 ‰. Finally, a short episode occurs at the boundary between MIS 5c and MIS 5b, where δ18O values decrease to −9 ‰ (Fig. 4a). The δ13C record expresses changes in its values from −1 ‰ to −9.8 ‰ (Fig. 4b). The average amplitude of δ13C values for changes over a short period is close to 1 ‰. In contrast to the δ18O record, the δ13C curve is dominated by episodes of lower and higher values. They are divided by large-scale shifts (Fig. 4b). From 143 to 139 ka, δ13C values rise to −1 ‰. From 139 to 130 ka (an interval of 9 ka), δ13C values decrease from −2 ‰ to −7 ‰ (5 ‰), and the values are low ca. −8 ‰ until 110 ka. From 110 to 107 ka, δ13C values increase from −9.3 ‰ to −2.6 ‰ (6.7 ‰) and decrease from −1 ‰ to −8.5 ‰ (7 ‰) at 101 ka. From 100 to 85 ka, δ13C values oscillate at approximately −8.2 ‰. After 85 ka, δ13C values increase to −5.6 ‰ (Fig. 4b).
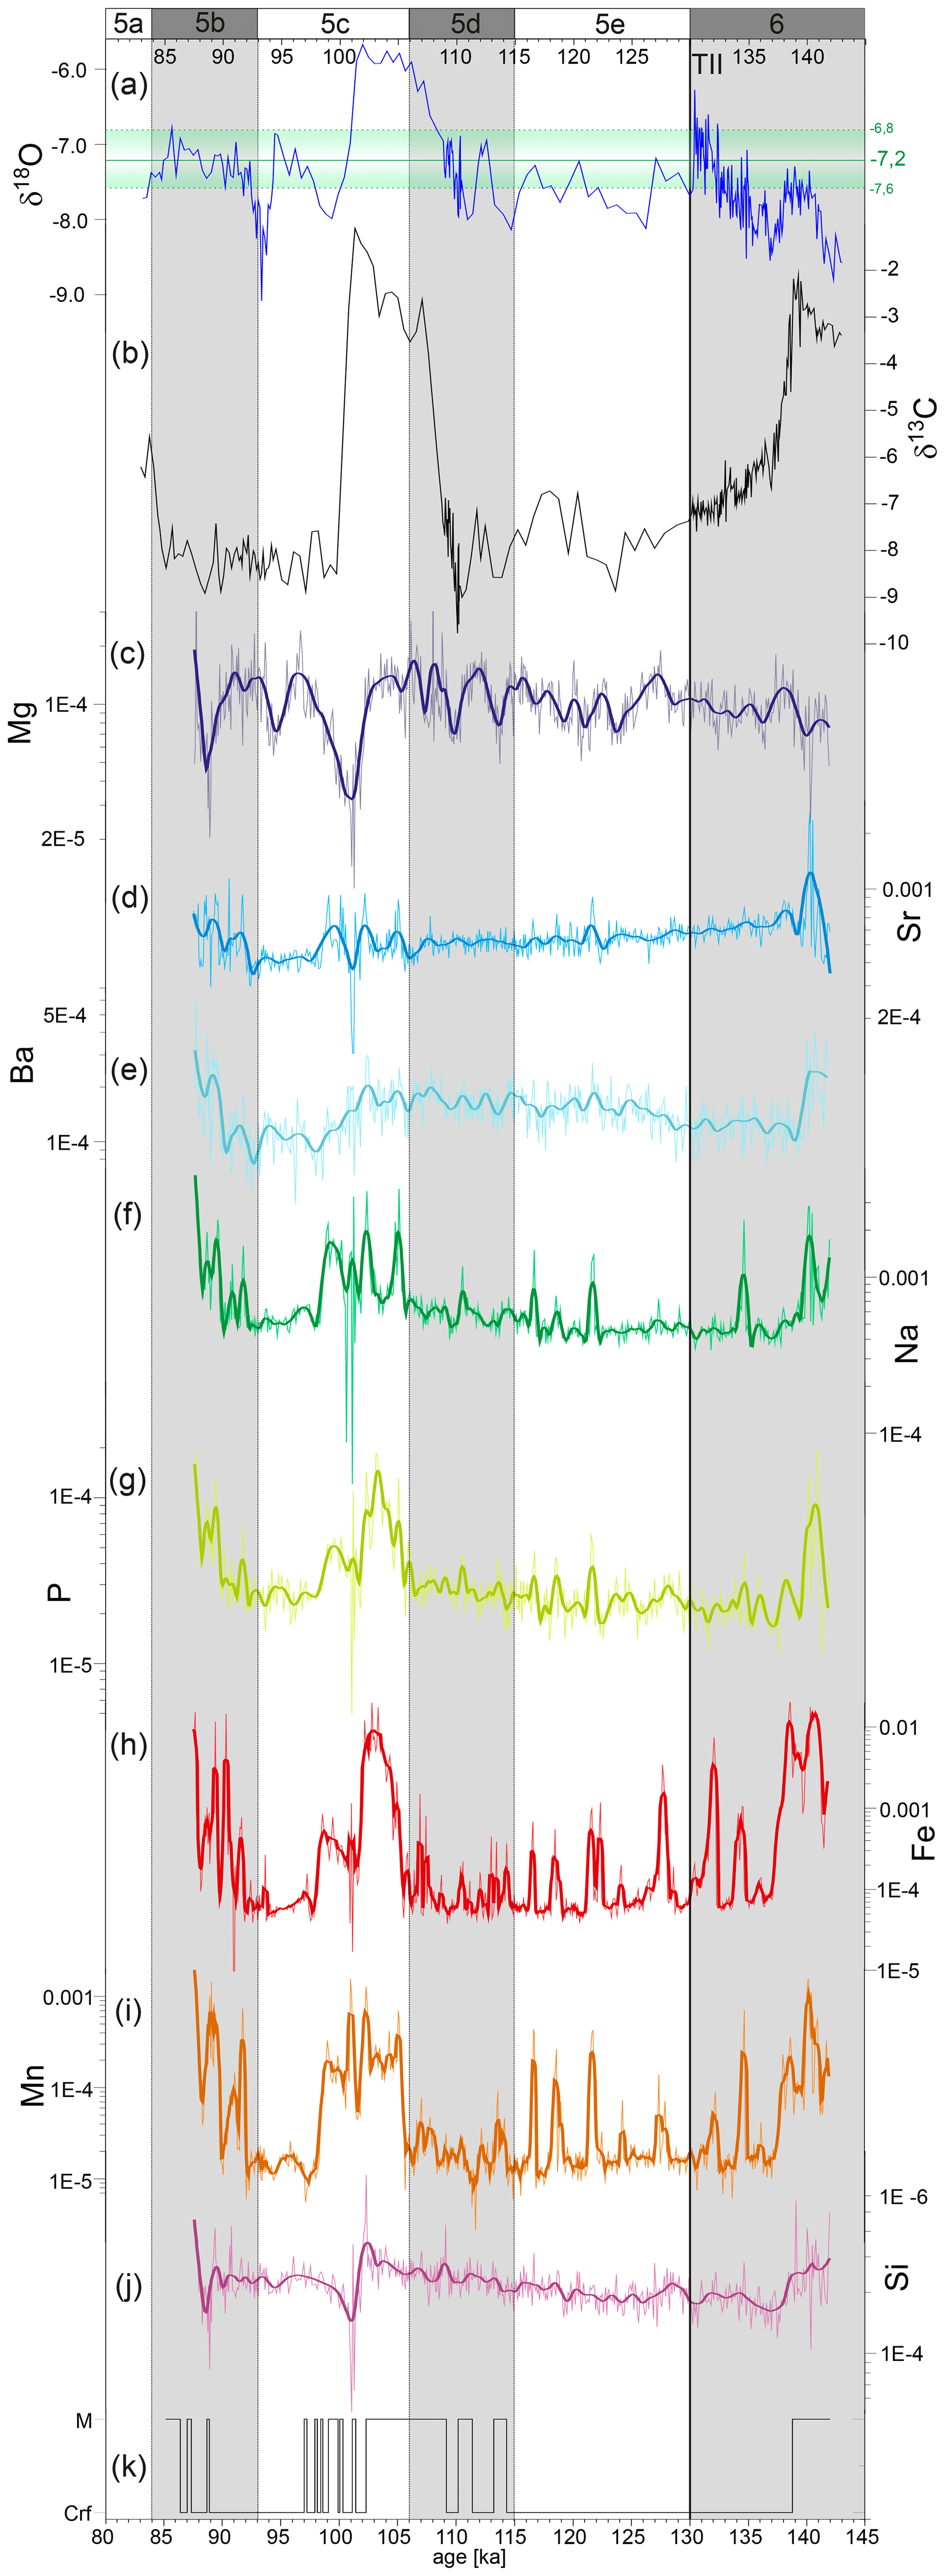
Figure 4Results of multiproxy analyses of the JS9 stalagmite: (a) δ18O composition with the mean value for the Holocene from DCS shown as a green line, (b) δ13C composition, (c) Mg content, (d) Sr content, (e) Ba content, (f) Na content, (g) P content, (h) Fe content, (i) Mn content, (j) Si content and (k) the microfabrics log. The data are available at https://doi.org/10.6084/m9.figshare.13116506.v1.
4.4 Trace elements
The trace element content results are presented in Fig. 4c–j. Mg, Sr and Ba contents do not show clear correlations or anticorrelations (Fig. 4c–e). However, a few single Mg extremes are clearly in phase or out of phase with the Sr content. For example, at 138 ka, they are in phase, and at 122.5 ka, they are out of phase (Fig. 4c, d). Generally, Mg and Ba records are similar from 138 to 101 ka, whereas Sr and Ba contents show more similarities before 138 ka and after 101 ka. Mg and Sr contents have minimums at 101 ka, whereas the minimum Ba content occurs at 93 ka and is mimicked by a decreasing Sr content during the same period.
Na, P, Fe and Mn contents show a similar pattern (Fig. 4f–i), and they have three intervals of increased values: before 138 ka, from 106 to 98 ka and after 92.5 ka. From 98 to 92 ka, Na, P, Fe and Mn contents are lower. This trend is also similar for Ba and Sr contents, and only the Mg content has a different pattern in this interval. The Fe content has the largest number of peaks (Fig. 4h), several of which are also shown by Na, P and Mn contents (Fig. 4f, g, and i respectively). In comparison to those four records, the P content has the lowest peak amplitude (Fig. 4g).
The Si content shows a few different patterns. The most visible pattern is a short maximum at 102 ka, which transitions into a minimum almost immediately at 101 ka, but the amplitude of changes in the Si content is relatively low. However, from 122 to 102 ka, it has an increasing trend, and a similar trend can be observed for Na and P contents (Fig. 4f, g, j). Similar to the Fe, Mn, P, Na and Ba contents, the Si content has higher values before 138 ka and after 98 ka.
5.1 Drivers of δ18O in DCS speleothems
The meteorological data collected in Slovakia show that there is a significant dependency between the δ18O value of atmospheric precipitation and the mean annual temperature (R2 = 0.73; Holko et al., 2012). The influence of the annual amount of precipitation on the δ18O value is less obvious (R2 = 0.48; Holko et al., 2012). In the DCS region, the temperature gradient for the δ18O of precipitation is 0.36 (Holko et al., 2012). The current δ18O precipitation value changes during the year from −16 ‰ in February to −6 ‰ in July (Holko et al., 2012). Currently, nearly 65 % of precipitation occurs during the spring and summer months (April–September). Therefore, the seepage water is biased by the seasonal effect, and its mean δ18O value is higher than expected based on the mean annual temperature.
Recently, a meta-analysis of cave drip water and precipitation monitoring records showed that the isotopic composition of dripping water is not affected by evaporation in climates with mean annual temperatures lower than +15 ∘C and aridity indices higher than 0.65 (Baker et al., 2019). The current climate of the study region fits the above-mentioned mean annual temperature and aridity index conditions. Therefore, current interglacial conditions are more conducive for δ18O signals to reflect the regional temperature conditions and isotopic composition of meteoric water. In contrast, during glacial episodes, when the local climate was more continental and the aridity index was lower, the studied δ18O record could have theoretically been affected by the evaporation effect. However, due to the low mean annual temperature, the effect should not be high.
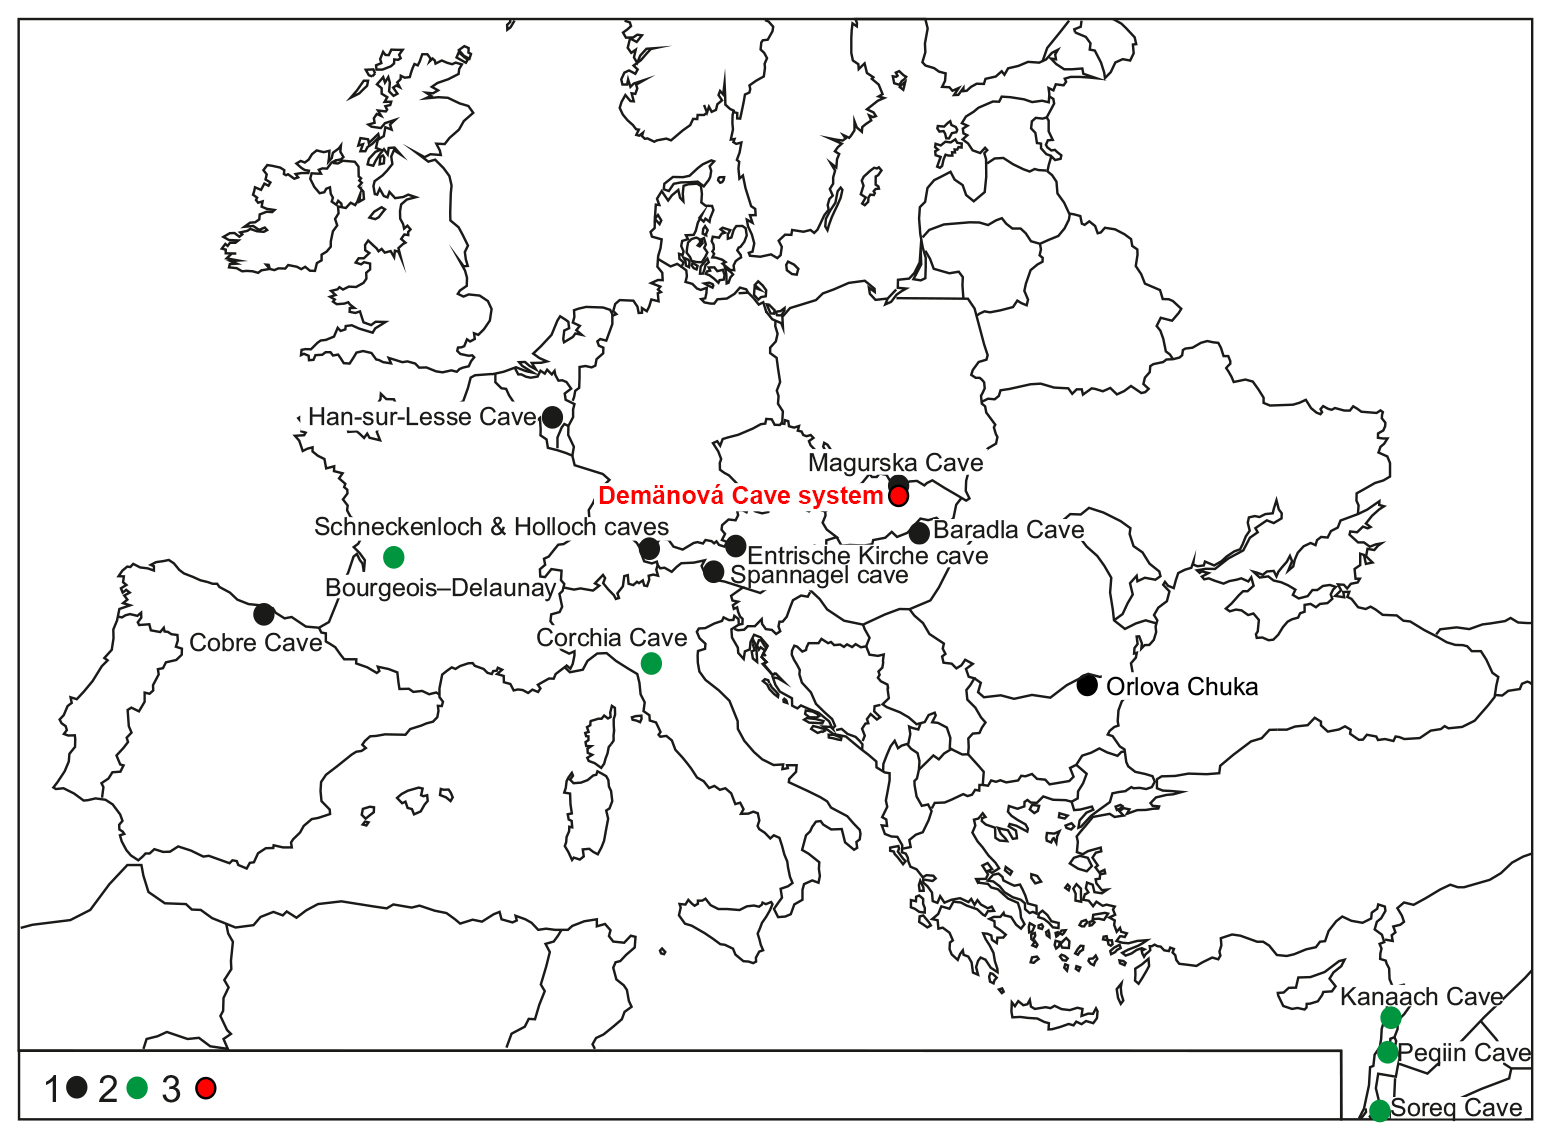
Figure 5The locations of the European and Middle Eastern MIS 5–MIS 6 speleothem sites. The numbers used in the panel legend refer to the following: 1 – speleothems with temperature as a dominant factor influencing the δ18O value, 2 – speleothems for which the changes in the isotopic composition of rainwater and the amount of precipitation are dominant factors influencing the δ18O value and 3 – the study site.
The main factor shaping the δ18O value of western and central European speleothems during the Holocene and last interglacial period was the temperature (Moseley et al., 2015; Kern et al., 2019; Comas-Bru et al., 2020; Hercman et al., 2020). For example, stalagmites from Cobre Cave, which is located on the northern coast of Spain (Fig. 5), reflect changes in the oceanic moisture isotopic composition, which is dependent on temperature (Fig. 6; Rossi et al., 2014). Similarly, the δ18O record from Han-sur-Lesse Cave in Belgium (Fig. 6) is driven by temperature and by changes in the isotopic composition of the ocean surface (Vansteenberge et al., 2016). The main trend of the δ18O record from the Hungarian stalagmite collected in Baradla Cave (Fig. 5) reflects temperature changes (Demény, 2017).
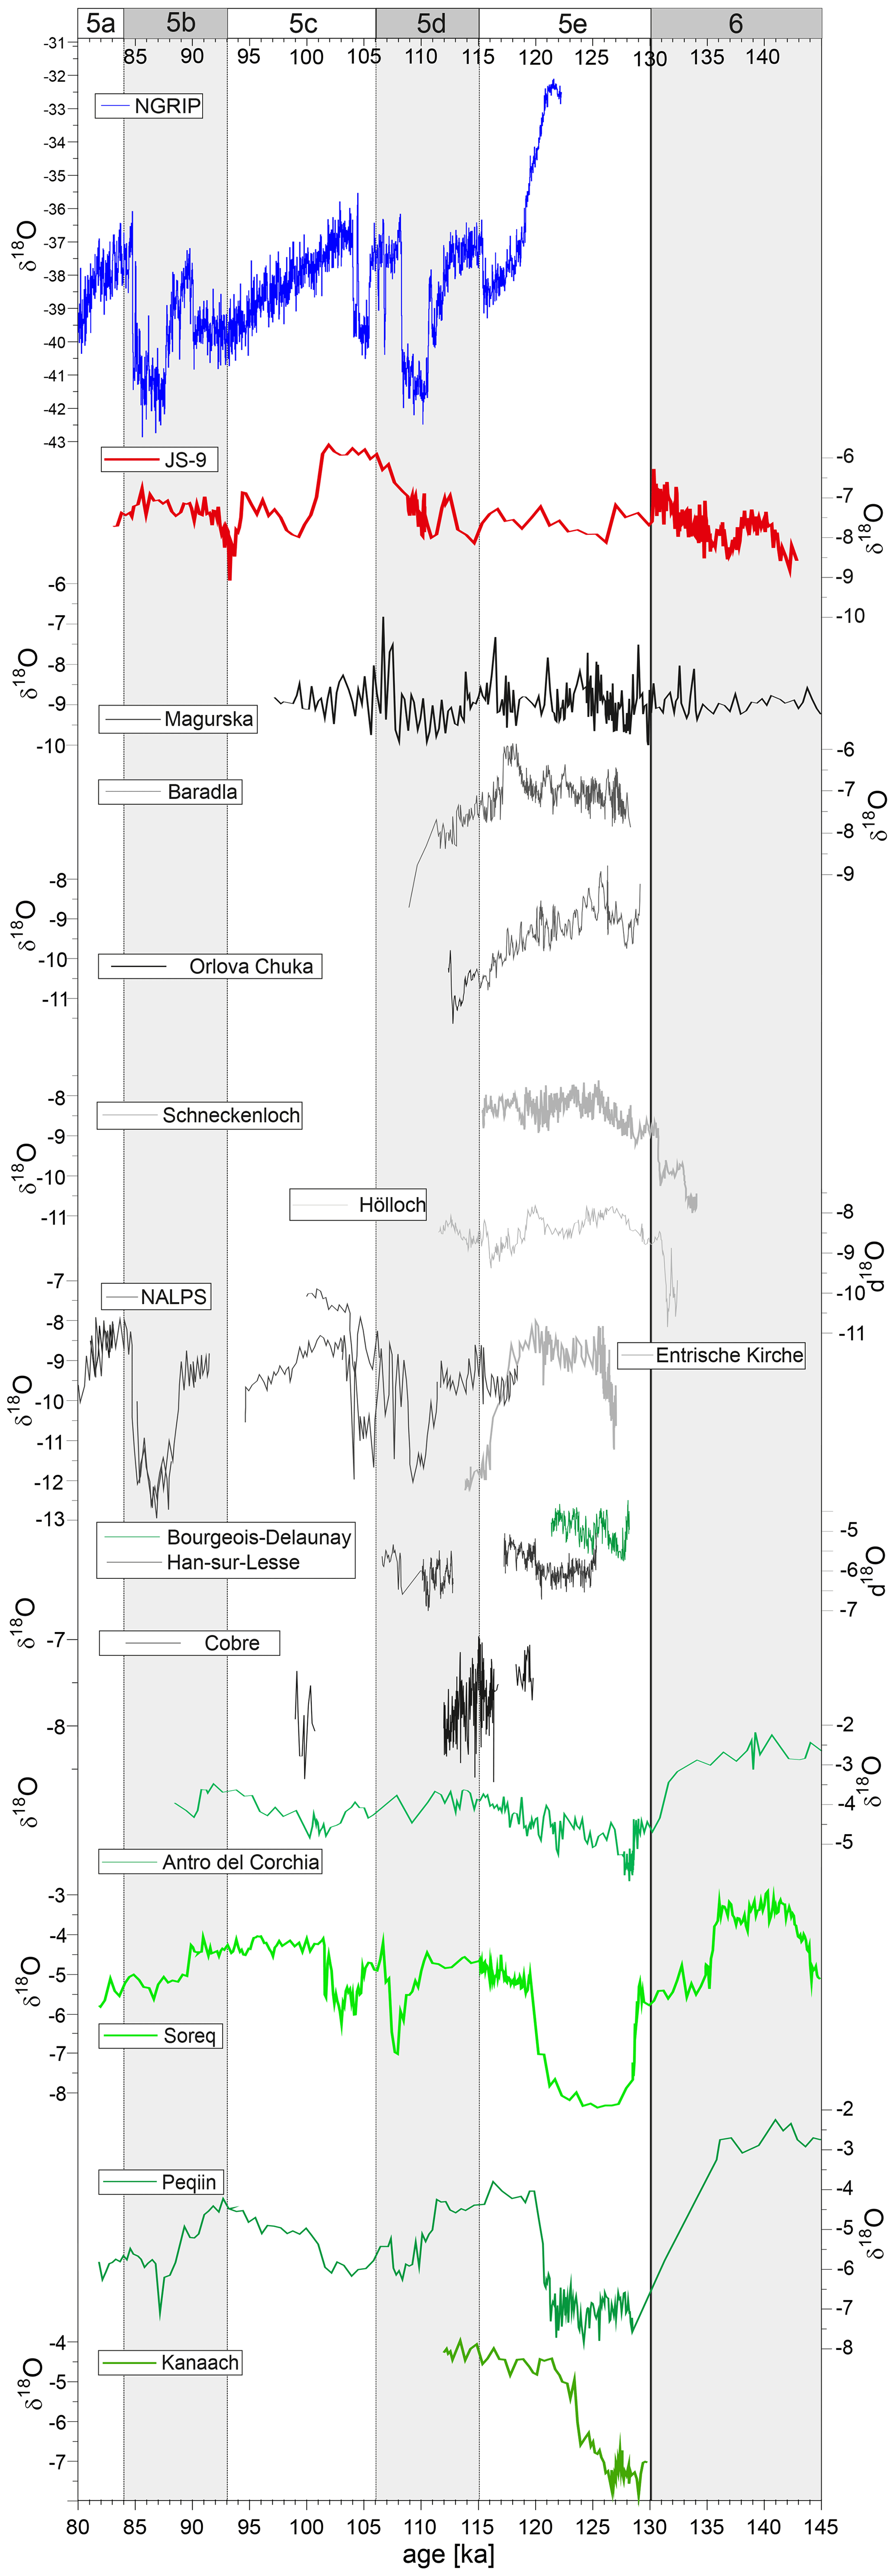
Figure 6Comparison of the JS9 δ18O record with other records of MIS 5–MIS 6 age from Europe and the Middle East. The records used for the comparison are as follows: NGRIP (Andersen et al., 2004); Magurska (Pawlak et al., 2020), Baradla (Demény et al., 2017); Orlova Tchuka (Pawlak et al., 2019), Schneckenloch (Mosley et al., 2015), Hölloch (Moseley et al., 2015), NALPS (Boch et al., 2011), Entrische Kirche (Meyer et al., 2008), Bourgeois-Delaunay (Couchoud et al., 2009), Cobre (Rossi et al., 2014), Han-sur-Lesse (Vansteenberge et al., 2016), Antro del Corchia (Drysdale et al., 2005), Soreq (Bar-Matthews et al., 2003), Peqiin (Bar-Matthews et al., 2003) and Kanaan (Nehme et al., 2015). The black and grey lines refer to speleothems where temperature is a dominant factor influencing the δ18O value, green lines denote speleothems where changes in the isotopic composition of rainwater and the amount of precipitation are dominant factors influencing the δ18O value, and the red line denotes the study site.
According to the facts listed above, it can be assumed that, in the long term, the temperature effect on atmospheric precipitation is the main factor shaping the δ18O value of the DCS stalagmites.
However, in the short term, the δ18O value can be additionally affected by humidity and aridity effects, as described in the case of the Bourgeois–Delaunay Cave (Couchoud et al., 2009).
The whole temperature effect on the δ18O value of the DCS speleothems calcite is lower than the presently observed δ18O temperature gradient of local precipitation (0.36 ; Holko et al., 2012). It is caused by the opposite temperature effect on calcite crystallisation (−0.18 ; Tremaine et al., 2011). The expected net temperature gradient is ca 0.18 .
5.2 Drivers of δ13C and trace elements in DCS speleothems
The δ13C value of speleothem calcite depends on the proportion of CO2 from a soil source and from a host rock source. CO2 from a soil source can reflect the changes in the isotopic composition of atmospheric CO2 and is also enriched in 12C due to biological activity. Due to that fact, a well-developed soil cover results in a lower δ13C value. The level of soil development depends on climatic conditions such as temperature and humidity. Currently, the vegetation cover over the DCS is dominated by mixed forests, including mountain-type forests and grasslands connected with mountain slope activity (Hercman et al., 2020). During the cold episodes of the last glacial period, the Slovakian landscape was dominated by boreal trees, tundra dwarf shrubs and grasslands (Feurdean et al., 2014; Jankovska et al., 2002). The beginning of the Holocene was marked by the development of temperate-type forests (Feurdean et al., 2014). Recently, a set of five Holocene speleothems from different parts of the DCS was investigated (Hercman et al., 2020). The mean δ13C value varied from ca. −8 ‰ to ca. −2 ‰ and was site-dependent (Hercman et al., 2020). Despite these values, the shape of all Holocene δ13C records from the DCS reflects the changes from boreal and tundra vegetation types to temperate and mountain forest types. This change suggests that the δ13C proxy in the DCS can be interpreted in terms of vegetation changes.
Trace elements such as Mg, Sr and Ba are transported in water solution. Their relative abundance depends on the time of water residence and on the host rock composition (Fairchild and Treble, 2009). Drier conditions result in longer water residence times. The process of dolomite rock dissolution is slower than the process of limestone rock dissolution. Therefore, during longer water residence times, the contribution of trace elements from dolomite host rock sources increases. Dolomite normally contains less Sr and Ba than calcite, resulting in higher and lower and ratios during drier conditions (Roberts et al., 1998; Tremaine and Froelich, 2013; Rossi et al., 2014). The DCS is developed mostly in Gutenstein limestones and Ramsau dolomites (Gaál, 2016). Therefore, the dissolution of both limestones and dolomites is possible in the DCS. On the other hand, prior calcite precipitation (PCP) can also occur during dry episodes when the water residence time is longer. However, PCP results in an increase in all ratios because Ca2+ cations are preferred during calcite crystallisation (Tremaine and Froelich, 2013). Episodes of synchronous increases in and ratios are not observed in the record in this study.
Elements, such as Fe, Mn and Si, may be transported as detrital particles or submicron-size colloids (Fairchild and Treble, 2009). Additionally, all elements that can be incorporated into the calcite structure can be transported as absorbed ions on the clay mineral structure. During drier periods under higher aeolian supply conditions, particles can be transported into the cave environment without water transportation (Hu et al., 2005).
5.3 Temporal evolution of environmental proxies in the JS9 speleothem
Recently, a set of five speleothems of Holocene age from the DCS was investigated (Hercman et al., 2020). Holocene δ18O records from DCS speleothems reflect the same pattern (Hercman et al., 2020). Additionally, the mean value for all of these records is similar. This proves that the δ18O value from DCS speleothems reflects the final regional climatic conditions. Comparing Holocene δ18O values with the record in this study can be useful for its interpretation. A total of 95 % percent of Holocene δ18O values from the DCS are in the range from −7.6 % to −6.8 % with a mean value of −7.2 ‰ (Fig. 4a). There are five periods in which the δ18O value of the JS9 stalagmite was slightly different than the δ18O mean value of the Holocene: 143–135, 127–123, 116–113, 108–101 and 94–92 ka (Fig. 4a).
The δ13C and δ18O values in the JS9 stalagmite change dynamically during the 143–130 ka period. The short episode of elevated δ18O and δ13C values from 143 to 137 ka may be the result of drier conditions with a higher level of evaporation at the end of MIS 6 (Gascoyne, 1992; Genty et al., 2006, Couchoud et al., 2009). During the 143–137 ka time interval, Mg and Ba contents are elevated, whereas the Sr content is lower (Fig. 4c–e). Trace element contents (Mg, Ba and Sr) support this interpretation. From 143 to 137 ka, the Fe, Mn and Si contents are elevated. This result may be related to the lack of developed soil cover and increased frost erosion of the surface above the cave. The other explanation of elevated values of listed proxies is the presence of micrite (Fig. 4k). However, this explanation also leads to dryer conditions (Frisia, 2015). New data revealing CO2 concentration changes during MIS 6 (Shin et al., 2020) show a local minimum CO2 concentration between 142 and 138 ka. Therefore, the episode recorded in the JS9 stalagmite may be global in nature.
After 137 ka, the change in the negative value observed in the δ13C record (ca. 5 ‰) is ca. 2 times larger than that observed in the DCS δ13C records at the beginning of the Holocene (ca. 2.5 ‰; Hercman et al., 2020). This may reflect the more substantial change in the environment from periglacial tundra conditions to temperate forests. According to data from other speleothems, the long-term tendencies of δ13C and δ18O are clearly related to improvements in thermal conditions after the MIS 6 glacial maximum and before the MIS 6–MIS 5e transition (Pawlak et al., 2020; Moseley et al., 2015; Meyer et al., 2008; Holzkamper et al., 2004).
Termination II (T II) in the JS9 stalagmite is highlighted by rapid decrease of ca. 1.2 ‰ in the δ18O value (Fig. 4a). This decrease is in contrast to the δ18O signal recorded in speleothems from the northern rim of the European Alps (NALPS; Fig. 6). The observed positive shift in Alpine δ18O records during T II is the result of two processes: the improvement of thermal conditions and the change from winter-dominated precipitation to summer-dominated precipitation (Moseley et al., 2015; Meyer et al., 2008; Holzkamper et al., 2004; Fig. 6). Similarly, in the caves on the northern slopes of the Tatra Mountains, T II is visible as a positive change in δ18O (Pawlak et al., 2020). However, in the case of the δ18O record from Magurska Cave (Tatra Mountains, Poland), the change towards positive values is preceded by an instant decrease of ca. 2 ‰ in its value (Fig. 6). The difference between the Low Tatras and caves located on the northern slopes of the Tatra Mountains (ca. 39 km towards the NE) is that the Tatra Mountains were an important climatic barrier for moisture at that time. In the case of the JS9 stalagmite, the δ13C and trace element contents did not show any signal that could be equivalent to the rapid 1.2 ‰ negative change in the δ18O record at 130 ka (Fig. 4). Therefore, the recorded 1.2 ‰ negative shift must be caused by factors that affect only the δ18O proxy. Additionally, the δ18O value after T II remains at the lower level until the end of MIS 5e. Its average value for MIS 5e (−7.6 ‰) is ca. 0.4 ‰ lower than the average δ18O value (−7.2 ‰) for Holocene speleothems of the DCS (Hercman et al., 2020). According to the present temperature gradient in Slovakia, the −0.4 ‰ difference could be interpreted as a lower mean temperature of MIS 5e of ca. 1 ∘C in comparison to the Holocene. However, the probability of this simple interpretation is low. Other reasons, such as changes from summer-dominated precipitation to winter-dominated precipitation or more humid conditions than at present, are more probable. Generally, in central Europe, the beginning of MIS 5e is related to changes from continental to more transient climates (Demény et al., 2017; Moseley et al., 2015). Therefore, the other reason for the observed shift may be the source effect and rapid increase in the depletion of 18O moisture from the Atlantic source. The negative shift in the δ18O record observed in JS9 speleothems is similar to the change observed in Mediterranean records (Antro del Corchia, Soreq, Peqiin; Fig. 6). This type of shift in Mediterranean records can be explained as a source effect when the change in the δ18O composition of speleothems is caused by the change in the δ18O value of the Mediterranean Sea surface, which is documented by marine cores, and the change in the proportion of moisture from Atlantic and Mediterranean sources (Bar-Matthews et al., 2003; Nehme et al., 2015). These are similar to records from Antro del Corchia (CC5 stalagmite; Drysdale et al., 2005), which has an approximately 2.5 ‰ decrease in its δ18O values during T II at ca. 130 ka (Fig. 6). In the case of the JS9 stalagmite, the observed 1.2 ‰ negative change is the result of a muted response. This response must have been caused by local or regional effects, which were stronger than the thermal effect at that time. The possible effect that may have caused the lower δ18O value is the circulation effect and changes from sources of precipitation, such as the Adriatic Sea or the Black Sea, to Atlantic sources and vapour recycling over the European continent (Drysdale et al., 2005). The instant change to negative values may have been caused by source and continental effects, which overcame the temperature effect at that time.
The MIS 5e interval in the JS9 stalagmite can be divided into two parts. The first part (127–123 ka) has lower values of δ18O and δ13C (Fig. 4a, b). The Mg content during this period is lower than its average value, with a local minimum at 124 ka (Fig. 4c). Usually, low δ13C and δ18O values can be interpreted as a sign of wetter and colder conditions (Gascoyne, 1992; Genty et al., 2006; Couchoud et al., 2009). However, on a global scale, the 127–123 ka period is a time of the highest sea level and warm temperature conditions (Goelzer et al., 2016). At that time, other European records show high sensitivity to changes in the amount of precipitation. For example, the δ18O record of a stalagmite from Bourgeois–Delaunay Cave (Couchoud et al., 2009) shows millennial variability with amplitudes lower than 1 ‰ (Fig. 6). The δ18O changes are reiterated by δ13C changes (Couchoud et al., 2009). The authors' interpretation considers the influence of the amount of precipitation as the main driver of δ18O changes. Based on the above-mentioned facts recorded in JS9 stalagmite, episodes of low δ18O and δ13C values can be interpreted as wet periods with more intensive vegetation.
The second part of MIS 5e (122–115 ka) has ca. 0.3 ‰ higher δ18O values and ca. 0.5 ‰ higher δ13C values. Globally, this period is characterised by a systematic deterioration of climatic conditions, a global mean temperature decrease of approximately 1 ∘C (Goelzer et al., 2016) and a sea level decrease of approximately 30 m (Grant et al., 2012). The NGRIP record shows a 6 ‰ decrease, which reflects the changes in thermal conditions (Rasmussen et al., 2014). At the local scale, the elevated δ13C value is the response to a decline in vegetation conditions. The increase in the δ18O value is caused by aridification. Evaporation overcomes the temperature effect, which should be negative. A similar episode containing high δ18O and δ13C values at approximately 119–117 ka is observed in the records from Baradla Cave and Magurska Cave; these records are interpreted as indicating an episode of dry continental climate (Demény et al., 2017; Pawlak et al., 2020). Records from Magurska Cave, located in the Tatra Mountains, and from Baradla Cave, located in Hungary (Fig. 6), are more similar to the JS9 record during the 122–115 ka period than during the older 127–123 ka period, which suggests that the climate of the region becomes more uniform at the end of MIS 5e.
During the 108–101 ka interval, the δ18O and δ13C values of the JS9 stalagmite were elevated, and their values were the highest in comparison to the whole recorded period. The mean value of δ18O for this interval was ca. 1.3 ‰ higher than the mean δ18O value for Holocene in the DCS (Fig. 4). Elevated stable isotope values are related to elevated Fe, Mn, P and Na contents. In the case of the JS9 stalagmite, the interpretation of the 108–101 ka period as a dry interval is probable and is in accordance with δ18O, δ13C and Mg proxies. Elevated values of geochemical proxies are related to micrite microfabrics (Fig. 4k). It appears plausible that the presence of micrite fabric (M) is indicative of bio-influenced processes, as micrite layers may be associated with shifts to more positive C isotope ratios (Kaźmierczak et al., 1996). In a sample from the Nullarbor, δ13C values shift from −10.5 ‰ to −4.0 ‰ in stromatolitic-like micrite (M) layers. This phenomenon was interpreted as a possible result of microbial colonisation of the speleothem surface during a dry period (Frisia, 2015). According to all of this information, the 108–101 ka interval in the JS9 stalagmite record can be interpreted as a stable dry continental climatic period.
In contrast, the global and regional situations at that time are different. After 110 ka, the decrease in the global ocean level ended. From 108 to 101 ka, the world ocean level became elevated to 20 m in comparison to the local minimum at 110 ka (Grant et al., 2012), which suggests that the global mean annual temperature increased. This trend is also in accordance with increased insolation at that time (Berger 1978). However, the global sea level was more unstable with changes reaching 10 m. Similarly, the NGRIP record has elevated δ18O values with a short decreasing disturbance at 105 ka, which also reflects climatic instability (Fig. 6; Rasmussen et al., 2014). The climate instability at 108–101 ka is also expressed by the δ18O record from Magurska Cave (Fig. 6) and by records from the northern rim of the Alps (Boch et al., 2011). In contrast, the JS9 record expresses specific local stable conditions during the 108–101 ka period. A possible explanation is that the DCS region was constantly influenced by the continental climate at that time, in contrast to the northern Tatra Mountains and the Alps. The ca. 2 ‰ instant decrease and the lowest δ18O value in the JS9 record at 94–95 ka are not connected with any significant change in the other measured proxies. However, this episode is expressed in the NALPS δ18O records (Fig. 6) as a 1 ‰ instant drop and stalagmite growth cessation and is correlated with Greenland Stadial 23 (Mosley et al., 2020).
Temperature is the main factor shaping the increasing tendency in δ18O values in the JS9 stalagmite in the older part of the record (143–130 ka). The instant change to negative values during T II could have been caused by source and continental effects, which overcame the temperature effect at that time. The observed response is the result of both the increase in the mean annual temperature and the source/circulation effect, which overcame each other. During T II, the records located in the western Alps and on the northern slopes of the Tatra Mountains had a positive shift in δ18O. This shows that mountains such as the Carpathian Belt and the Alps were important climatic barriers at that time. The older MIS 5e period (127–123 ka) had a warmer and wetter climate. The response of proxies recorded in the JS9 stalagmite was dominated by the influence of wetter conditions. MIS 5e records from the Tatra Mountains and Baradla Cave located in Hungary (Fig. 6) are more similar to the JS9 record during the 122–115 ka period than during the older 127–123 ka period, which suggests that the climate of the region became more uniform at the end of MIS 5e. The climate instability at 108–101 ka is also expressed by the δ18O record from Magurska Cave (Fig. 6) and by records from the northern rim of the Alps (Boch et al., 2011). In contrast to the records from the northern rim of the Alps and Tatra Mountains (Fig. 6), the JS9 record expresses specific local stable and dry environmental conditions during the 108–101 ka period. A possible explanation is that the DCS region was constantly influenced by the continental climate at that time, in contrast with the northern Tatra Mountains and the Alps.
All U-series ages used for the age–depth model estimation are presented in Table 1. The estimated age–depth model and the isotopic and trace element record data are available in digital form from Figshare: https://doi.org/10.6084/m9.figshare.13116506.v1 (Pawlak, 2020). Other data used for the comparison (Fig. 6) are available at https://www.ncdc.noaa.gov/data-access/paleoclimatology-data/datasets (North Greenland Ice Core Project members, 2004) as well as in the supplementary materials of the papers cited in the caption of Fig. 6.
The author declares that there is no conflict of interest.
This study was supported by the National Science Centre of Poland (grant no. 20 15/19/D/ST10/00571). U-series dating and geochemical analyses were supported by the Plan of Institutional Financing of the Institute of Geology, The Czech Academy of Sciences (grant no. RVO 67985831). This research would not have been possible without a permit and help from the Tatra National Park and Slovak Caves Administration. The author would like to thank the reviewers and his colleagues from the Uranium-Series Laboratory (LUT) of the Institute of Geological Sciences, Polish Academy of Sciences, for their constructive comments on this paper.
This research has been supported by the National Science Centre of Poland (grant no. 20 15/19/D/ST10/00571) and the Czech Academy of Sciences (grant no. RVO 67985831).
This paper was edited by Marie-France Loutre and reviewed by two anonymous referees.
Andersen, K., Azuma, N., Barnola, J. M., Bigler, M., Biscaye, P., Caillon, N., Chappellaz, J., Clausen, H. B., Dahl-Jensen, D., Fisher, H., Flückiger, J., Fritzsche, D., Fujii, Y., Goto-Azuma, K., Grønvold, K., Gundestrup, N. S., Hansson, M., Huber, C., Hvidberg, C. S., Johnsen, S. J., Jonsell, U. Y., Jouzel, J., Kipfstuhl, S., Landais, A., Leuenberger, M., Lorrain, R., Masson-Delmotte, V., Miller, H., Motoyama, H., Narita, H., Popp, T., Rasmussen, S. O., Raynaud, D., Röthlisberger, R., Ruth, U., Samyn, D., Schwander, J., Shoji, H., Siggaard-Andersen, M. J., Steffensen, J. P., Stocker, T., Sveinbjörnsdottir, A. E., Svensson, A. M., Takata, M., Tison, J. L., Thorsteinsson, Th., Watanabe, O., Wilhelms, F., and White, J. W. C.: High-resolution record of Northern Hemisphere climate extending into the last interglacial period, Nature, 431, 147–151, 2004.
Baker, A., Hartmann, A., Duan, W., Hankin, S., Comas-Bru, L., Cuthbert, M. O., Treble, P. C., Banner, J., Genty, D. Baldini, L.M, Bartolomé, M., Moreno, A., Pérez-Mejías, C., and Werner, M.: Global analysis reveals climatic controls on the oxygen isotope composition of cave drip water, Nat Commun., 10, 2984, https://doi.org/10.1038/s41467-019-11027-w, 2019.
Bar-Matthews, M., Ayalon, A., Gilmour, M., Matthews, A., and Hawkesworth, C. J.: Sea–land oxygen isotopic relationships from planktonic foraminifera and speleothems in the Eastern Mediterranean region and their implication for paleorainfall during interglacial intervals, Geochim. Cosmochim. Ac., 67, 3181–3199, 2003.
Bella, P.: Remarks on the genesis of the Demänová Cave System, Slovenský kras, 31, 43–53, 1993 (in Slovak, English abstract).
Bella, P., Gradziński, M., Hercman, H., Leszczyński, S., and Nemec, W.: Sedimentary anatomy and hydrological record of relic fluvial deposits in a karst cave conduit, Sedimentology, 68, 425–448, 2021.
Berger, A.: Long-Term Variations of Daily Insolation and Quaternary Climatic Changes, J. Atmos. Sci., 35, 2362–2367, 1978.
Bianchi, G. G. and McCave, I. N.: Holocene periodicity in North Atlantic climate and deep-ocean flow south of Iceland, Nature, 397, 515–517, 1999.
Błaszczyk, M., Hercman, H., Pawlak, J., and Szczygieł, J.: Paleoclimatic reconstruction in the Tatra Mountains of the western Carpathians during MIS 9–7 inferred from a multiproxy speleothem record, Quaternary Res., 99, 290–304, 2021.
Boch, R., Cheng, H., Spötl, C., Edwards, R. L., Wang, X., and Häuselmann, Ph.: NALPS: a precisely dated European climate record 120–60 ka, Clim. Past, 7, 1247–1259, https://doi.org/10.5194/cp-7-1247-2011, 2011.
Celle-Jeanton, H., Travi, Y., and Blavoux, B.: Isotopic typology of the precipitation in the Western Mediterranean region at three different time scale, Geophys. Res. Lett., 28, 1215–1218, 2001.
Cheng, H., Edwards, R. L., Shen, C. C., Polyak, V. J., Asmerom, Y., Woodhead, J., Hellstrom, J., Wang, Y., Kong, X., Sp, C., Wang, X., and Alexander, E. C.: Improvements in 230Th dating, 230Th and 234U half-live values, and U-Th isotopic measurements by multi-collector inductively coupled plasma mass spectrometry, Earth Planet. Sc. Lett., 371–372, 82–91, 2013.
Comas-Bru, L., Rehfeld, K., Roesch, C., Amirnezhad-Mozhdehi, S., Harrison, S. P., Atsawawaranunt, K., Ahmad, S. M., Brahim, Y. A., Baker, A., Bosomworth, M., Breitenbach, S. F. M., Burstyn, Y., Columbu, A., Deininger, M., Demény, A., Dixon, B., Fohlmeister, J., Hatvani, I. G., Hu, J., Kaushal, N., Kern, Z., Labuhn, I., Lechleitner, F. A., Lorrey, A., Martrat, B., Novello, V. F., Oster, J., Pérez-Mejías, C., Scholz, D., Scroxton, N., Sinha, N., Ward, B. M., Warken, S., Zhang, H., and SISAL Working Group members: SISALv2: a comprehensive speleothem isotope database with multiple age–depth models, Earth Syst. Sci. Data, 12, 2579–2606, https://doi.org/10.5194/essd-12-2579-2020, 2020.
Couchoud, I., Genty, D., Hoffmann, D., Drysdale, R., and Blamart, D.: Millennial-scale climate variability during the Last Interglacial recorded in a speleothem from south-western France, Quaternary Sci. Rev., 28, 3263–3274, 2009.
Dansgaard, W.: Stable isotopes in precipitation, Tellus, 16, 436–468, 1964.
Demény, A., Kern, Z., Czuppon, G., Németh, A., Leél-Őssy, S., Siklósy, Z., Lin, K., Hu, H.-M., Shen, C.-C., Vennemann, T. W., and Haszpra, L.: Stable isotope compositions of speleothems from the last interglacial – Spatial patterns of climate fluctuations in Europe, Quaternary Sci. Rev., 161, 68–80, 2017.
Dorale, J. A. and Liu, Z.: Limitations of Hendy Test criteria in judging the paleoclimatic suitability of speleothems and the need for replication, J. Cave Karst Stud., 71, 73–80, 2009.
Droppa, A.: Demänovské jaskyne, Vydavatelstvo Slovenskej Akadémie Vied, Bratislava, 1957 (in Slovak, German summary).
Droppa, A.: The correlation of some horizontal caves with river terraces, Studies in Speleology, 1, 186–192, 1966.
Droppa, A.: Geomorfologické pomery Demänovskej doliny, Slovenský Kras, 10, 9–46, 1972 (in Slovak, German summary).
Drysdale, R. N., Zanchetta, G., Hellstrom, J. C., Fallick, A. E., and Zhao, J.: Stalagmite evidence for the onset of the Last Interglacial in southern Europe at 129 ± 1 ka, Geophys. Res. Lett., 32, L24708, https://doi.org/10.1029/2005GL024658, 2005.
Eggins, S. M., Woodhead, J. D., Kinsley, L. P. J., Mortimer, G. E., Sylvester, P., McCulloch, M. T., Hergt, J. M., and Handler, M. R.: A simple method for the precise determination of ≥ 40 trace elements in geological samples by ICPMS using enriched isotope internal standardization, Chem. Geol., 134, 311–326, 1997.
Elmore, A., Wright, J. D., and Southon, J.: Continued meltwater influence on North Atlantic Deep. Water instabilities during the early Holocene, Mar. Geol., 360, 17–24, 2015.
Fairchild, I. J. and Baker, A.: Speleothem Science: From Process to Past Environment, Willey-Blackwell, ISBN 9781405196208, 1–432, available at: https://bcs.wiley.com/he-bcs/Books?action=index&bcsId=7193&itemId=1405196203 (last access: 11 May 2021), 2012.
Fairchild, I. and Treble, P.: Trace elements in speleothems as recorders of environmental change, Quaternary Sci. Rev., 28, 449–468, 2009.
Feurdean, A., Perşoiu, A., Tanţău, I., Stevens, T., Magyari, E. K., Onac, B. P., Marković, S., Andrič, M., Connor, S., Fărcaş, S., Gałka, M., Gaudeny, T., Hoek, W., Kolaczek, P., Kuneš, P., Lamentowicz, M., Marinova, E., Michczyńska, D. J., Perşoiu, I., Płóciennik, M., Słowiński, M., Stancikaite, M., Sumegi, P., Svensson, A, Tămaş, T., Timar, A., Tonkov, S., Toth, M., Veski, S., Willis, K. J., and Zernitskaya, V.: Climate variability and associated vegetation response throughout Central and Eastern Europe (CEE) between 60 and 8 ka, Quaternary Sci. Rev., 106, 206–244, 2014.
Frisia, S.: Microstratigraphic logging of calcite fabrics in speleothems as tool for palaeoclimate studies, Int. J. Speleol., 44, 1–16, 2015.
Gaál, L.: Litológia karbonatických hornín Demänovského jaskynného systému, Slovenský kras, 54, 109–129, 2016 (in Slovak, English abstract).
Gaál, L. and Michalík, J.: Strednotriasové vápence v jaskyni Okno (Demänovská dolina, Nízke Tatry): litológia a faciálne typy, Slovenský kras, 55, 145–154, 2017 (in Slovak, English abstract).
Gascoyne, M.: Paleoclimate determination from cave calcite deposits, Quaternary Sci. Rev., 11, 609–632, 1992.
Genty, D., Blamart, D., Ghaleb, B., Plagnes, V., Causse, C., Bakalowicz, M., Zouari, K., Chkir, N., Hellstrom, J., Wainer, K., and Bourges, F.: Timing and dynamics of the last deglaciation from European and North African δ13C stalagmite profiles–comparison with Chinese and South Hemisphere stalagmites, Quaternary Sci. Rev., 25, 2118–2142, 2006.
Goelzer, H., Huybrechts, P., Loutre, M.-F., and Fichefet, T.: Last Interglacial climate and sea-level evolution from a coupled ice sheet–climate model, Clim. Past, 12, 2195–2213, https://doi.org/10.5194/cp-12-2195-2016, 2016.
Govin, A., Capron, E., Tzedakis, P. C., Verheyden, S., Ghaleb, B., Hillaire-Marcel, C., St-Onge, G., Stoner, J. S., Bassinot, F., Bazin, L., Blunier, T., Combourieu-Nebout, N., Ouahabi, A. E., Genty, D., Gersonde, R., Jimenez-Amat, P., Landais, A., Martrat B, Masson-Delmotte, V., Parrenin, F., Seidenkrantz, M. S., Veres, D., Waelbroeck, C., and Zahn, R.: Sequence of events from the onset to the demise of the Last Interglacial: Evaluating strengths and limitations of chronologies used in climatic archives. Quaternary Sci. Rev., 129, 1–36, 2015.
Grant, K. M., Rohling, E. J., Bar-Matthews, M., Ayalon, A., Medina-Elizalde, M., Ramsey, C. B., Satow, C., and Roberts, A. P.: Rapid coupling between ice volume and polar temperature over the past 150 000 years, Nature, 491, 744–747, 2012.
Hellstrom, J.: Rapid and accurate U/Th dating using parallel ion counting multicollector ICP-MS, J. Anal. Atom. Spectrom., 18, 1346–1351, 2003.
Hellstrom, J.: U–Th dating of speleothems with high initial 230Th using stratigraphical constraint, Quat. Geochronol., 1, 289–295, 2006.
Hercman, H.: Reconstruction of palaeoclimatic changes in central Europe between 10 and 200 thousand years BP, based on analysis of growth frequency of speleothems, Studia Quaternaria, 17, 35–70, 2000.
Hercman, H. and Pawlak, J.: MOD-AGE: An age-depth model construction algorithm, Quat. Geochronol., 12, 1–10, 2012.
Hercman, H., Bella, P., Głazek, J., Gradziński, J., Lauritzen, S., and Lovlie, R.: Uranium series dating of speleothems from Demanova ice cave: a step to age estimation of the Demanova cave system (Nizkie Tatry Mts., Slovakia), Ann. Soc. Geol. Pol., 67, 439–450, 1997.
Hercman, H., Gąsiorowski, M., Pawlak, J., Błaszczyk, M., Gradziński, M., Matoušková, Š., Zawidzki, P., and Bella, P.: Atmospheric circulation and the differentiation of precipitation sources during the Holocene inferred from five stalagmite records from Demänová Cave System (Central Europe), Holocene, 30, 834- 846, 2020.
Herich, P.: Demänová caves. The most extensive underground karst phenomenon in Slovakia, in: Bulletin of the Slovak Speleological Society, Issued for the purpose of the 17th Congress of the IUS, 23–29 July 2017, Sydney, Australia, 27–38, 2017.
Holden, N. E.: Total half-lives for selected nuclides, Pure Appl. Chem., 62, 941–958, 1990.
Holko, L., Dóša, M., Michalko, J., and Šanda, M.: Isotopes of oxygen-18 and deuterium in precipitation in Slovakia, J. Hydrol. Hydrom., 60, 265–276, 2012.
Holzkamper, S., Mangini, A., Spotl, C., and Mudelsee, M.: Timing and progression of the Last Interglacial derived from a high alpine stalagmite, Geophys. Res. Lett., 31, L07201, https://doi.org/10.1029/2003GL019112, 2004.
Hu, C., Huang, J., Fang, N., Xie, S., Henderson, G. M., and Cai, Y.: Adsorbed silica in stalagmite carbonate and its relationship to past rainfall, Geochim. Cosmochim. Ac., 69, 2285–2292, 2005.
Ionita, M.: The impact of the East Atlantic/Western Russia pattern on the hydroclimatology of Europe from mid-winter to late spring, Climate, 2, 296–309, 2014.
Jaffey, A. H., Flynn, K. F., Glendenin, L. E., Bentley, W. C., and Essling, A. M.: Precision measurement of half-lives and specific activities of 235U and 238U, Phys. Rev. C, 4, 1889–1905, 1971.
Jankovská, V., Chromý, P., and Nižnianská, M.: Safarka a first palaeobotanical data on vegetation and landscape character of Upper Pleistocene in West Carpathians (North East Slovakia), Acta Palaeobotanica, 42, 29–52, 2002.
Kaźmierczak, J., Coleman, M. L., Gruszczyński, M., and Kempe, S.: Cyanobacterial key to the genesis of micritic and peloidal limestones in ancient seas, Acta Palaeontol. Pol., 41, 319–338, 1996.
Kern, Z., Demény, A., Perşoiu, A., and Hatvani, I G.: Speleothem Records from the Eastern Part of Europe and Turkey—Discussion on Stable Oxygen and Carbon Isotopes, Quaternary, 2, 3–31, 2019.
Koltai, G., Cheng, H., and Spötl, C.: Palaeoclimate significance of speleothems in crystalline rocks: a test case from the Late Glacial and early Holocene (Vinschgau, northern Italy), Clim. Past, 14, 369–381, https://doi.org/10.5194/cp-14-369-2018, 2018.
Kottek, M., Grieser, J., Beck, C., Rudolf, B., and Rubel, F.: World Map of the Koppen-Geiger climate classification updated, Meteorol. Z., 15, 259–263, 2006.
Lachniet, M. S.: Climatic and environmental controls on speleothem oxygen-isotope values, Quaternary Sci. Rev., 28, 412–432, 2009.
Lisiecki, L. E. and Raymo, M. E.: A Pliocene-Pleistocene stack of 57 globally distributed benthic δ18O records, Paleoceanography, 20, PA1003, https://doi.org/10.1029/2004PA001071, 2005.
McDermott, F., Atkinson, T. C., Fairchild, I. J., Baldini, L. M., and Mattey, D. P.: A first evaluation of the spatial gradients in δ18O recorded by European Holocene speleothems, Global Planet. Change, 79, 275–287, 2011.
Meyer, M. C., Spötl, C., and Mangini, A.: The demise of the Last Interglacial recorded in isotopically dated speleothems from the Alps, Quaternary Sci. Rev., 27, 476–496, 2008.
Moseley, G. E., Spötl, C., Cheng, H., Boch, R., Min, A., and Edwards, L. R.: Termination-II interstadial/stadial climate change recorded in two stalagmites from the north European Alps, Quaternary Sci. Rev., 127, 229–239, 2015.
Moseley, G. E., Spötl, C., Brandstätter, S., Erhardt, T., Luetscher, M., and Edwards, R. L.: NALPS19: sub-orbital-scale climate variability recorded in northern Alpine speleothems during the last glacial period, Clim. Past, 16, 29–50, https://doi.org/10.5194/cp-16-29-2020, 2020.
Motyka, J., Gradziński, M., Bella, P., and Holúbek, P.: Chemistry of waters from selected caves in Slovakia – a reconnaissance study, Environ. Geol., 48, 682–692, 2005.
Nehme, C., Verheyden, S., Noble, S. R., Farrant, A. R., Sahy, D., Hellstrom, J., Delannoy, J. J., and Claeys, P.: Reconstruction of MIS 5 climate in the central Levant using a stalagmite from Kanaan Cave, Lebanon, Clim. Past, 11, 1785–1799, https://doi.org/10.5194/cp-11-1785-2015, 2015.
North Greenland Ice Core Project members: High-resolution record of Northern Hemisphere climate extending into the last interglacial period, Nature, 431, 147–151, https://doi.org/10.1038/nature02805, 2004 (data avaliable: https://www.ncdc.noaa.gov/data-access/paleoclimatology-data/datasets, last access: 18 May 2021).
Pawlak, J.: Speleothem oxygen record – thermal or moisture changes proxy? A case study of multiproxy record from MIS 5/MIS 6 age speleothems from Demänová Cave System, figshare [dataset], https://doi.org/10.6084/m9.figshare.13116506.v1, 2020.
Pawlak, J., Błaszczyk, M., Hercman, H., and Matoušková, Š.: A continuous stable isotope record of last interglacial age from the Bulgarian Cave Orlova Chuka, Geochronometria, 46, 87–101, 2019.
Pawlak, J., Błaszczyk, M., Hercman, H., and Matoušková, Š.: Palaeoenvironmental conditions during MIS 6/MIS 5 transition recorded in speleothems from the Tatra Mountains, Boreas, 50, 224–241, 2020.
Rasmussen, O. S., Bigler, M., Blockley, S. P., Blunier, T., Buchardt, S. L., Clausen, H. B., Cvijanovic, I., Dahl-Jensen, D., Johnsen, S. J., Fischer, H., Gkinis, V., Guillevic, M., Hoek, W. Z., Lowe, J. J., Pedro, J. B., Popp, T., Seierstad, I. K., Steffensen, J. P., Svensson, A. M., Vallelonga, P., Vinther, B. M., Walker, M. J. C., Wheatley, J. J., and Winstrup, M.: A stratigraphic framework for abrupt climatic changes during the Last Glacial period based on three synchronized Greenland ice-core records: refining and extending the INTIMATE event stratigraphy, Quaternary Sci. Rev., 106, 14–28, 2014.
Roberts, N., Smart, P. L., and Baker, A.: Annual trace element variations in a holocene speleothem, Earth Planet. Sc. Lett., 154, 237–246, 1998.
Rossi, C., Mertz-Kraus, R., and Osete, M. L.: Paleoclimate variability during the Blake geomagnetic excursion (MIS 5d) deduced from a speleothem record, Quaternary Sci. Rev., 102, 166–180, 2014.
Różański, K., Araguás-Araguás, L., Gonfiantini, R.: Isotopic patterns in Global Precipitation, J. Geophys. Res.-Atmos., 78, 1–36, 1993.
Rybak, O. O., Volodin, E. M., and Morozova, P. A.: Reconstruction of Climate of the Eemian Interglacial Using an Earth System Model. Part 1. Set–up of Numerical Experiments and Model Fields of Surface Air Temperature and Precipitation Sums, Russ. Meteorol. Hydrol., 43, 357–365, 2018.
Shin, J., Nehrbass-Ahles, C., Grilli, R., Chowdhry Beeman, J., Parrenin, F., Teste, G., Landais, A., Schmidely, L., Silva, L., Schmitt, J., Bereiter, B., Stocker, T. F., Fischer, H., and Chappellaz, J.: Millennial-scale atmospheric CO2 variations during the Marine Isotope Stage 6 period (190–135 ka), Clim. Past, 16, 2203–2219, https://doi.org/10.5194/cp-16-2203-2020, 2020.
Sotak, S. and Borsanyi, P.: Monitoring klimy SHMU na uzemi Nizkych Tatier, in: Priroda Nizkych Tatier 1, State nature protection of the Slovak Republic Low Tatras National Park Administration, Banska Bystrica, Slovakia, 275–282, 2004.
Tremaine, D. M. and Froelich, P. N.: Speleothem trace element signatures: A hydrologic geochemical study of modern cave drip waters and farmed calcite, Geochim. Cosmochim. Ac., 121, 522–545, 2013.
Tremaine, D. M., Froelich, P. N., and Wang, Y.: Speleothem calcite farmed in situ: Modern calibration of δ18O and δ13C paleoclimate proxies in a continuously-monitored natural cave system, Geochim. Cosmochim. Ac., 75, 4929–4950, 2011.
Wong, C. I. and Breecker, D. O.: Advancements in the use of speleothems as climate archives, Quaternary Sci. Rev., 127, 1–18, 2015.
Vansteenberge, S., Verheyden, S., Cheng, H., Edwards, R. L., Keppens, E., and Claeys, P.: Paleoclimate in continental northwestern Europe during the Eemian and early Weichselian (125–97 ka): insights from a Belgian speleothem, Clim. Past, 12, 1445–1458, https://doi.org/10.5194/cp-12-1445-2016, 2016.