the Creative Commons Attribution 4.0 License.
the Creative Commons Attribution 4.0 License.
 | 04 Apr 2019
The climate of Granada (southern Spain) during the first third of the 18th century (1706–1730) according to documentary sources
Fernando S. Rodrigo
The climatic information recorded by the physician Francisco Fernández Navarrete in Granada (southern Spain) during the first third of the 18th century is analyzed in this work. His observations are included in the book Cielo y suelo granadino ('Sky and soil in Granada'), and consist of qualitative comments relating climatic conditions to illness and diseases from 1706 to 1730, as well as instrumental observations (using an “English barometer” and a “Florentine thermometer”) from December 1728 to February 1730. To the best of our knowledge, these are the earliest instrumental observations recorded in Spain. An alternative methodology to Pfister indices, based on the frequency of extreme events, was applied to study this new set of documentary data. The analysis shows that seasonal mean values of temperature and precipitation during the period 1706–1730 were very similar to those of periods of similar length at the beginning of the 20th century, such as 1906–1930. However, some years were especially extreme, such as the dry first half of the 1720s or the winter of 1728–1729 when a strong cold wave affected the city.
- Article
(8733 KB) - Full-text XML
- BibTeX
- EndNote


Historical climatology offers the possibility of reconstructing climatic conditions during the pre-instrumental period, that is, before the establishment of meteorological observation networks around 1850. Documentary sources are basic data sources for this time period because they record climatic anomalies and extreme events, making it possible to relate such events to climatic changes. In recent years a large number of papers on historical climatology in many areas of the globe have been published (Brázdil et al., 2005, 2010). In addition, the recovering of the early instrumental observations is a priority objective in climatic research (Brönnimann et al., 2018).
There are many example of work on the historical climate in the Iberian Peninsula using documentary sources and early instrumental observations from Spain and Portugal (see, for instance, Bullón, 2008; Domínguez-Castro et al., 2010, 2014; Alcoforado et al., 2012; Barriendos et al., 2014; Fragoso et al., 2015). The first meteorological measurements in the Iberian Peninsula were taken in Portugal between 1 November 1724 and 11 January 1725 (Domínguez-Castro et al., 2013). In Spain, the Ephemerides barométrico-médicas matritenses ('Barometric–medical ephemeris for Madrid') by the physician Francisco Fernández Navarrete has been considered to be the first meteorological instrumental series (Anduaga Egaña, 2012). It is a set of daily and sub-daily meteorological observations taken in Madrid between March and October 1737. In this work we present a set of observations taken by the same observer in Granada (in the south of the country) some years before, between December 1728 and February 1730. These observations are included in a handwritten book dated to 1732 and kept in the Archive of the Franciscan Order in Cataluña (Gil Albarracín, 1997). The title of the book is Cielo y suelo granadino ('Sky and soil in Granada'; Fig. 1), and it may be regarded as one of the first Spanish medical treatises that followed the neo-Hippocratic hypothesis concerning the influence of climate on human health. In the following sections these observations along with qualitative comments by the author on the climatic conditions from 1706 to 1730 will be analyzed.
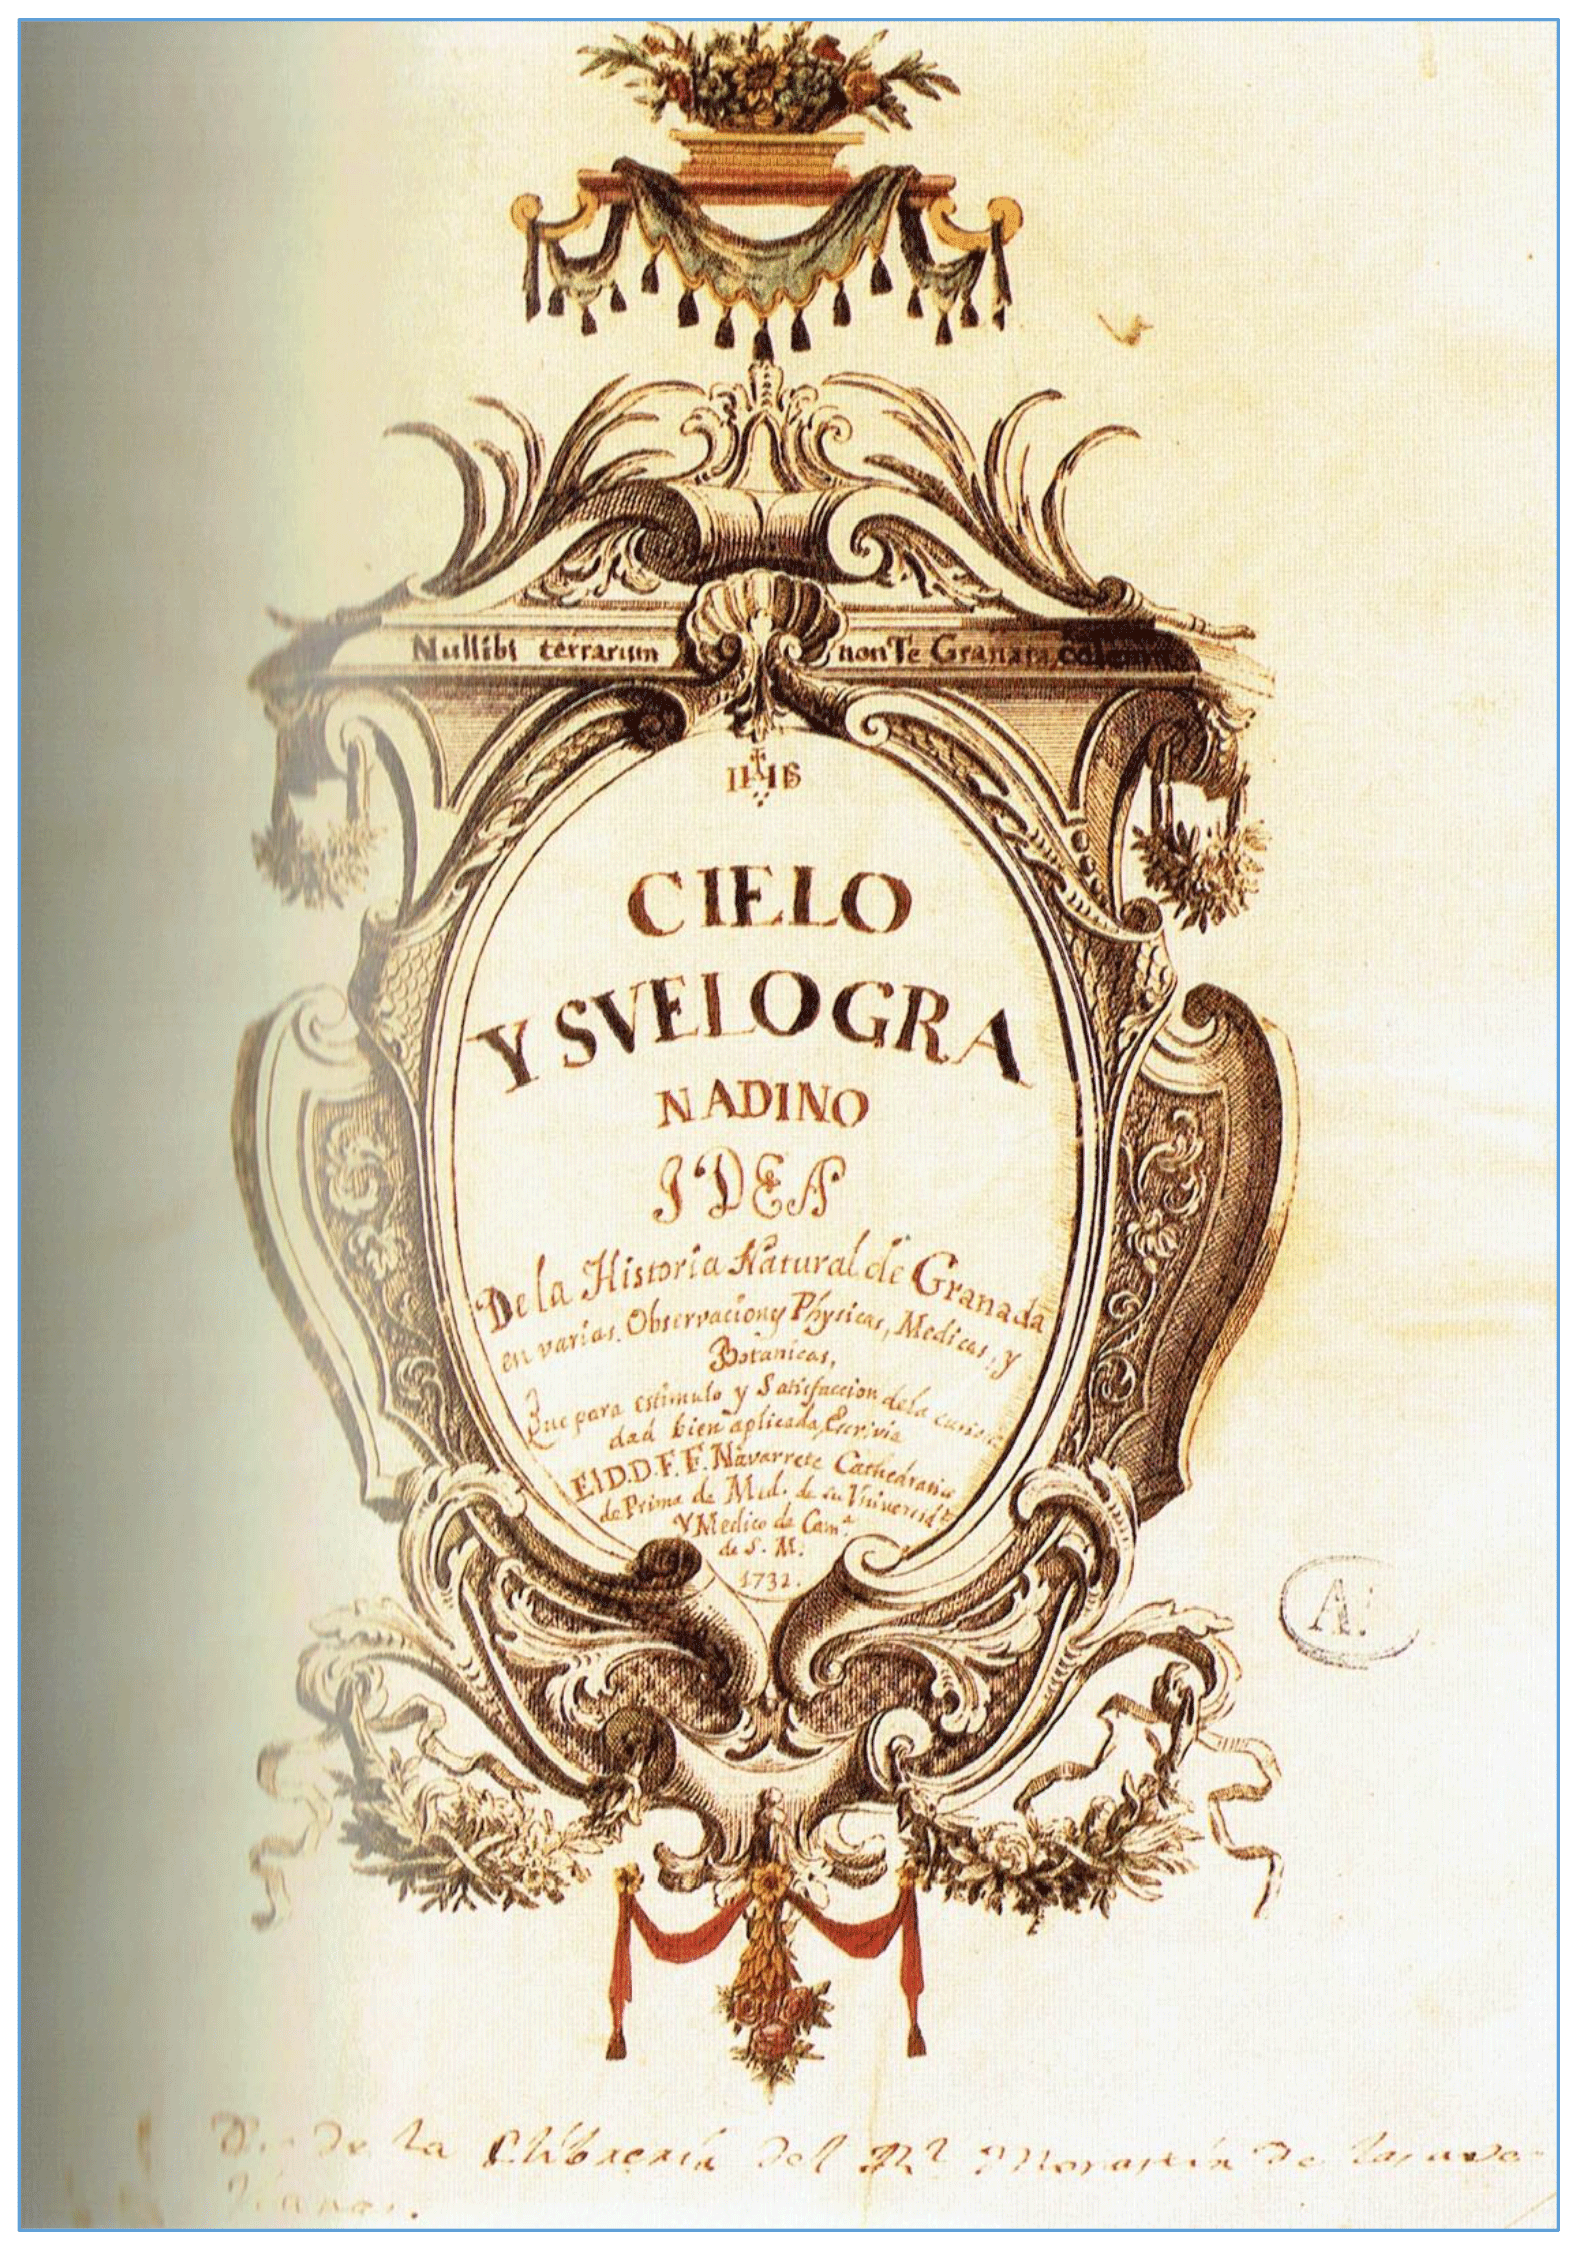
Figure 1Book cover of the handwritten book Cielo y suelo granadino by Navarrete (1732).
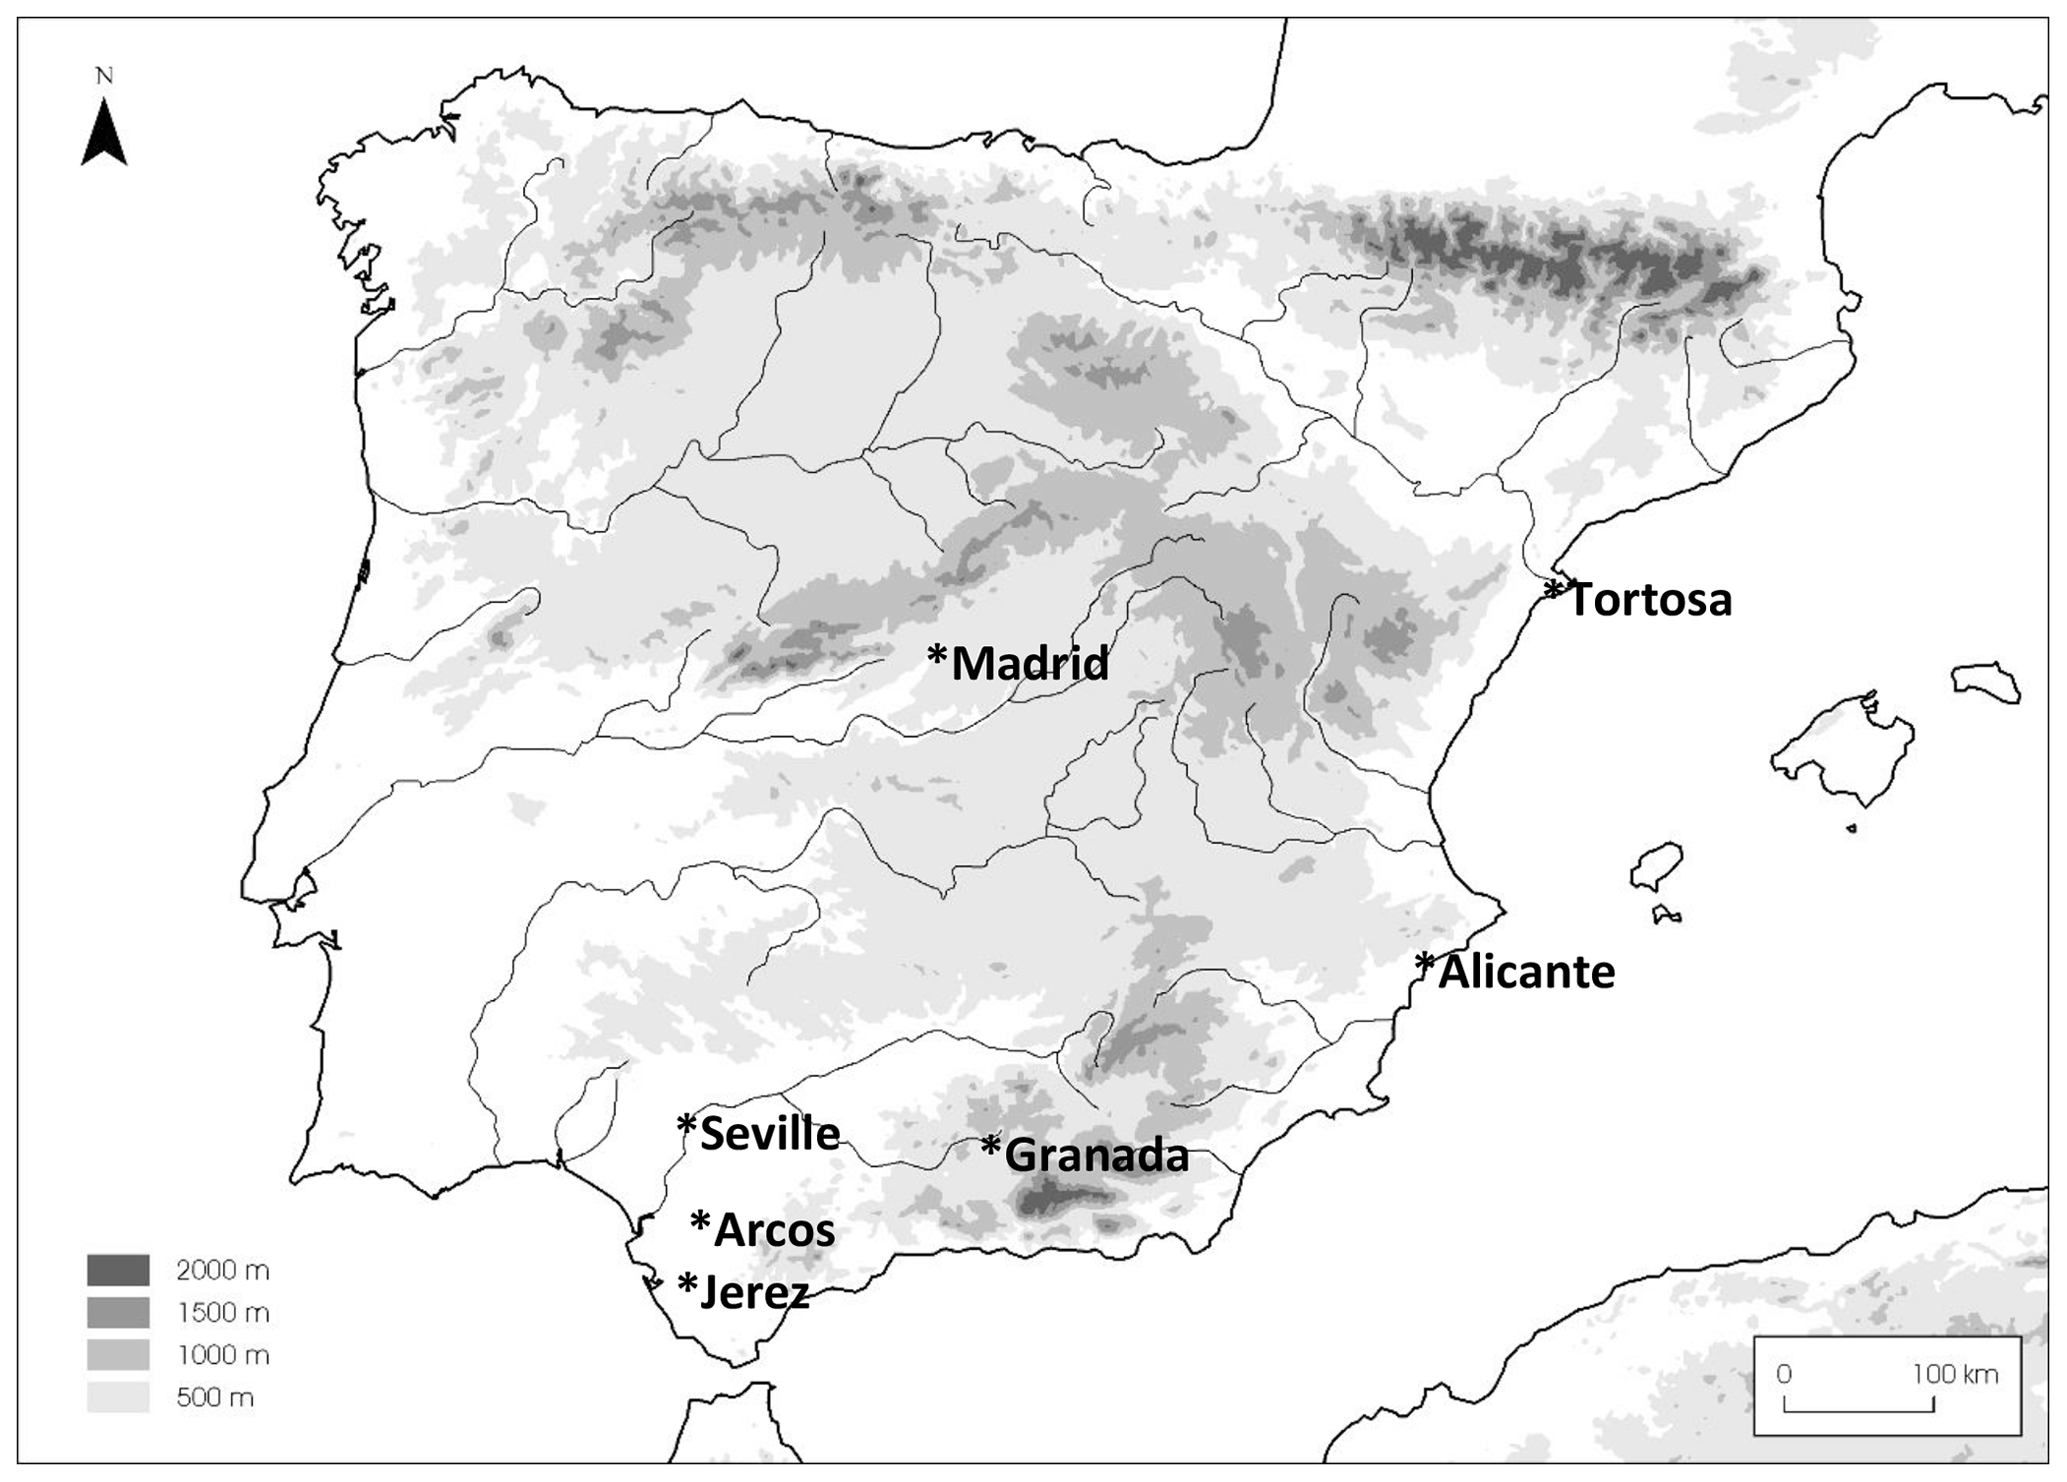
The climatic interest of Granada, in the south of the Iberian Peninsula, is due not only to its geographic location (37∘10′ N, 3∘36′ W), near the Mediterranean Sea and exposed to Atlantic disturbances and Mediterranean influences, but also to its height, 660 m above sea level (a.s.l.) and proximity to the highest mountain ridge in the Iberian Peninsula, the Sierra Nevada, with some peaks of 3000 m a.s.l. (Fig. 2). The study period is interesting because it begins at the end of the cold period called Maunder Minimum (1645–1715; Owens et al., 2017), and continues during subsequent decades. Therefore, it allows us to explore the climate behavior in a city located in the Mediterranean area (hot spot of climatic change; Giorgi, 2006) when natural climatic changes occurred.
The outline of the paper is as follows: biographical and bibliographical information on the author and his texts are described in Sect. 2; Sect. 3 studies general conditions during the period 1706–1730, and Sect. 4 is focused on the instrumental observations from December 1728 to February 1730; Sect. 5 discusses main results, and some concluding remarks are included in the last section.
Francisco Fernández Navarrete (born in Granada, 1680; died in Madrid, 1742) studied medicine in Granada, where he lived until 1734, when he moved to Madrid as doctor of King Felipe V. He was an active member of the Royal Academy of Medicine (founded in 1734) and the Royal Academy of History (founded in 1738). He developed his work following the neo-Hippocratic hypothesis. According to this medical paradigm, illness, epidemics, and public health are related to environmental conditions, in particular to the variability of meteorological variables (Demareé, 1996). This idea was predominant in Spain until at least the mid-19th century (Rodrigo, 2016). So, it is not surprising that medical academies and physicians were the prime movers of early meteorological observations in Spain.
Navarrete was the author of many works, most of them unedited and kept as manuscripts in the archives of the Spanish academies of Medicine and History. His attention was focused not only on medicine, but also on physical observations, cosmography, geography, botany, and, in general, all the fields considered to be part of “natural history”. His main work was Ephemérides barométrico-médicas matritenses ('Barometric–medical ephemeris for Madrid'; Navarrete, 1737), published in Madrid in 1737 (this text is digitized and available at the library of Seville University: http://fondosdigitales.us.es, last access: 28 March 2019). It is a set of daily meteorological observations (atmospheric pressure, temperature, wind direction, qualitative comments on rain, cloudiness, and other meteorological events) taken in Madrid from March to November 1737. Here, the author establishes the basis of an observational program dedicated to compiling all the meteorological data potentially useful to medical studies not only in Madrid, but also in other Spanish cities. This program was based on the main ideas of the neo-Hippocratic hypothesis, which was the predominant medical paradigm during the 18th century in Spain. Unfortunately, this program was not accomplished due to a lack of interest by the authorities, although it was partially recovered in the last decades of the century by the medical academies of Seville, Madrid, and Barcelona (Anduaga Egaña, 2012).
A precursor of the Ephemerides is the book studied in this paper, Cielo y suelo granadino (`Sky and soil in Granada'). The manuscript is dated to 1732, and although it was not ultimately published, the book was finished and prepared for publication. It is kept in the Library and Archive of the Franciscan Province of Cataluña, Barcelona, and it has been edited recently (Gil Albarracín, 1997). Among the multiple aspects of natural history studied by the author, we are interested in the climatological and meteorological observations. Chapter IV is entitled “Observations of the atmosphere using the barometer and the thermometer” and includes monthly summaries (with daily resolution) of these observations from December 1728 to February 1730. Chapter XVI is entitled “Medical observations for the knowledge of climate”. Here, the author offers a summary of climatic conditions (rainfall, dryness, snowfall, frosts, warm or cold weather, winds) at a monthly and/or seasonal resolution from 1706 to 1730 in Granada as well as their relationships with the occurrence of illness in the city, following the neo-Hippocratic paradigm. We place the beginning of the qualitative series in 1706 because the author, in the description of the cold winter 1729, indicates that this year was the “coldest winter seen in 24 years”, suggesting that he began to compile his observations that year. These data are available at the data repository of the University of Almería (Rodrigo, 2018a; file “NavarreteData.xlsx”, http://hdl.handle.net/10835/6248, last access: 28 March 2019). In next sections we study both chapters separately because the time resolution and the nature of the data are different in each case.
Chapter XVI of the book by Navarrete (fols. 105–107 of the manuscript) is dedicated to exposing the “alterations in health due to mutations of the air and general causes obtained from the long observation and practical knowledge of the country”. Here, the author establishes relationships between different diseases and climatic conditions. Qualitative information only refers to certain years when extreme events occurred. So, for instance, in paragraph 13 (fol. 106v), he says that “If cold, rain, and snowfall continue until May: difficult births, chest pains, and dangerous anginas; the year is 1727”. This paragraph allows us to characterize the spring of 1727 as wet and cold. The analysis of the contents of this chapter yields as a result the summary shown in Table 1, where the seasons that are unmistakably cold, warm, wet, or dry are indicated (in the following we designate these seasons as “extreme seasons”). Seasons are defined as is usual: winter (December, January, February; winters identified by the year corresponding to January and February), spring (March, April, May), summer (June, July, August), and autumn (September, October, November).
Table 1Extreme seasons in Granada from 1706 to 1730 (Rodrigo, 2018a, NavarreteData.xlsx, http://hdl.handle.net/10835/6248, last access: 28 March 2019).
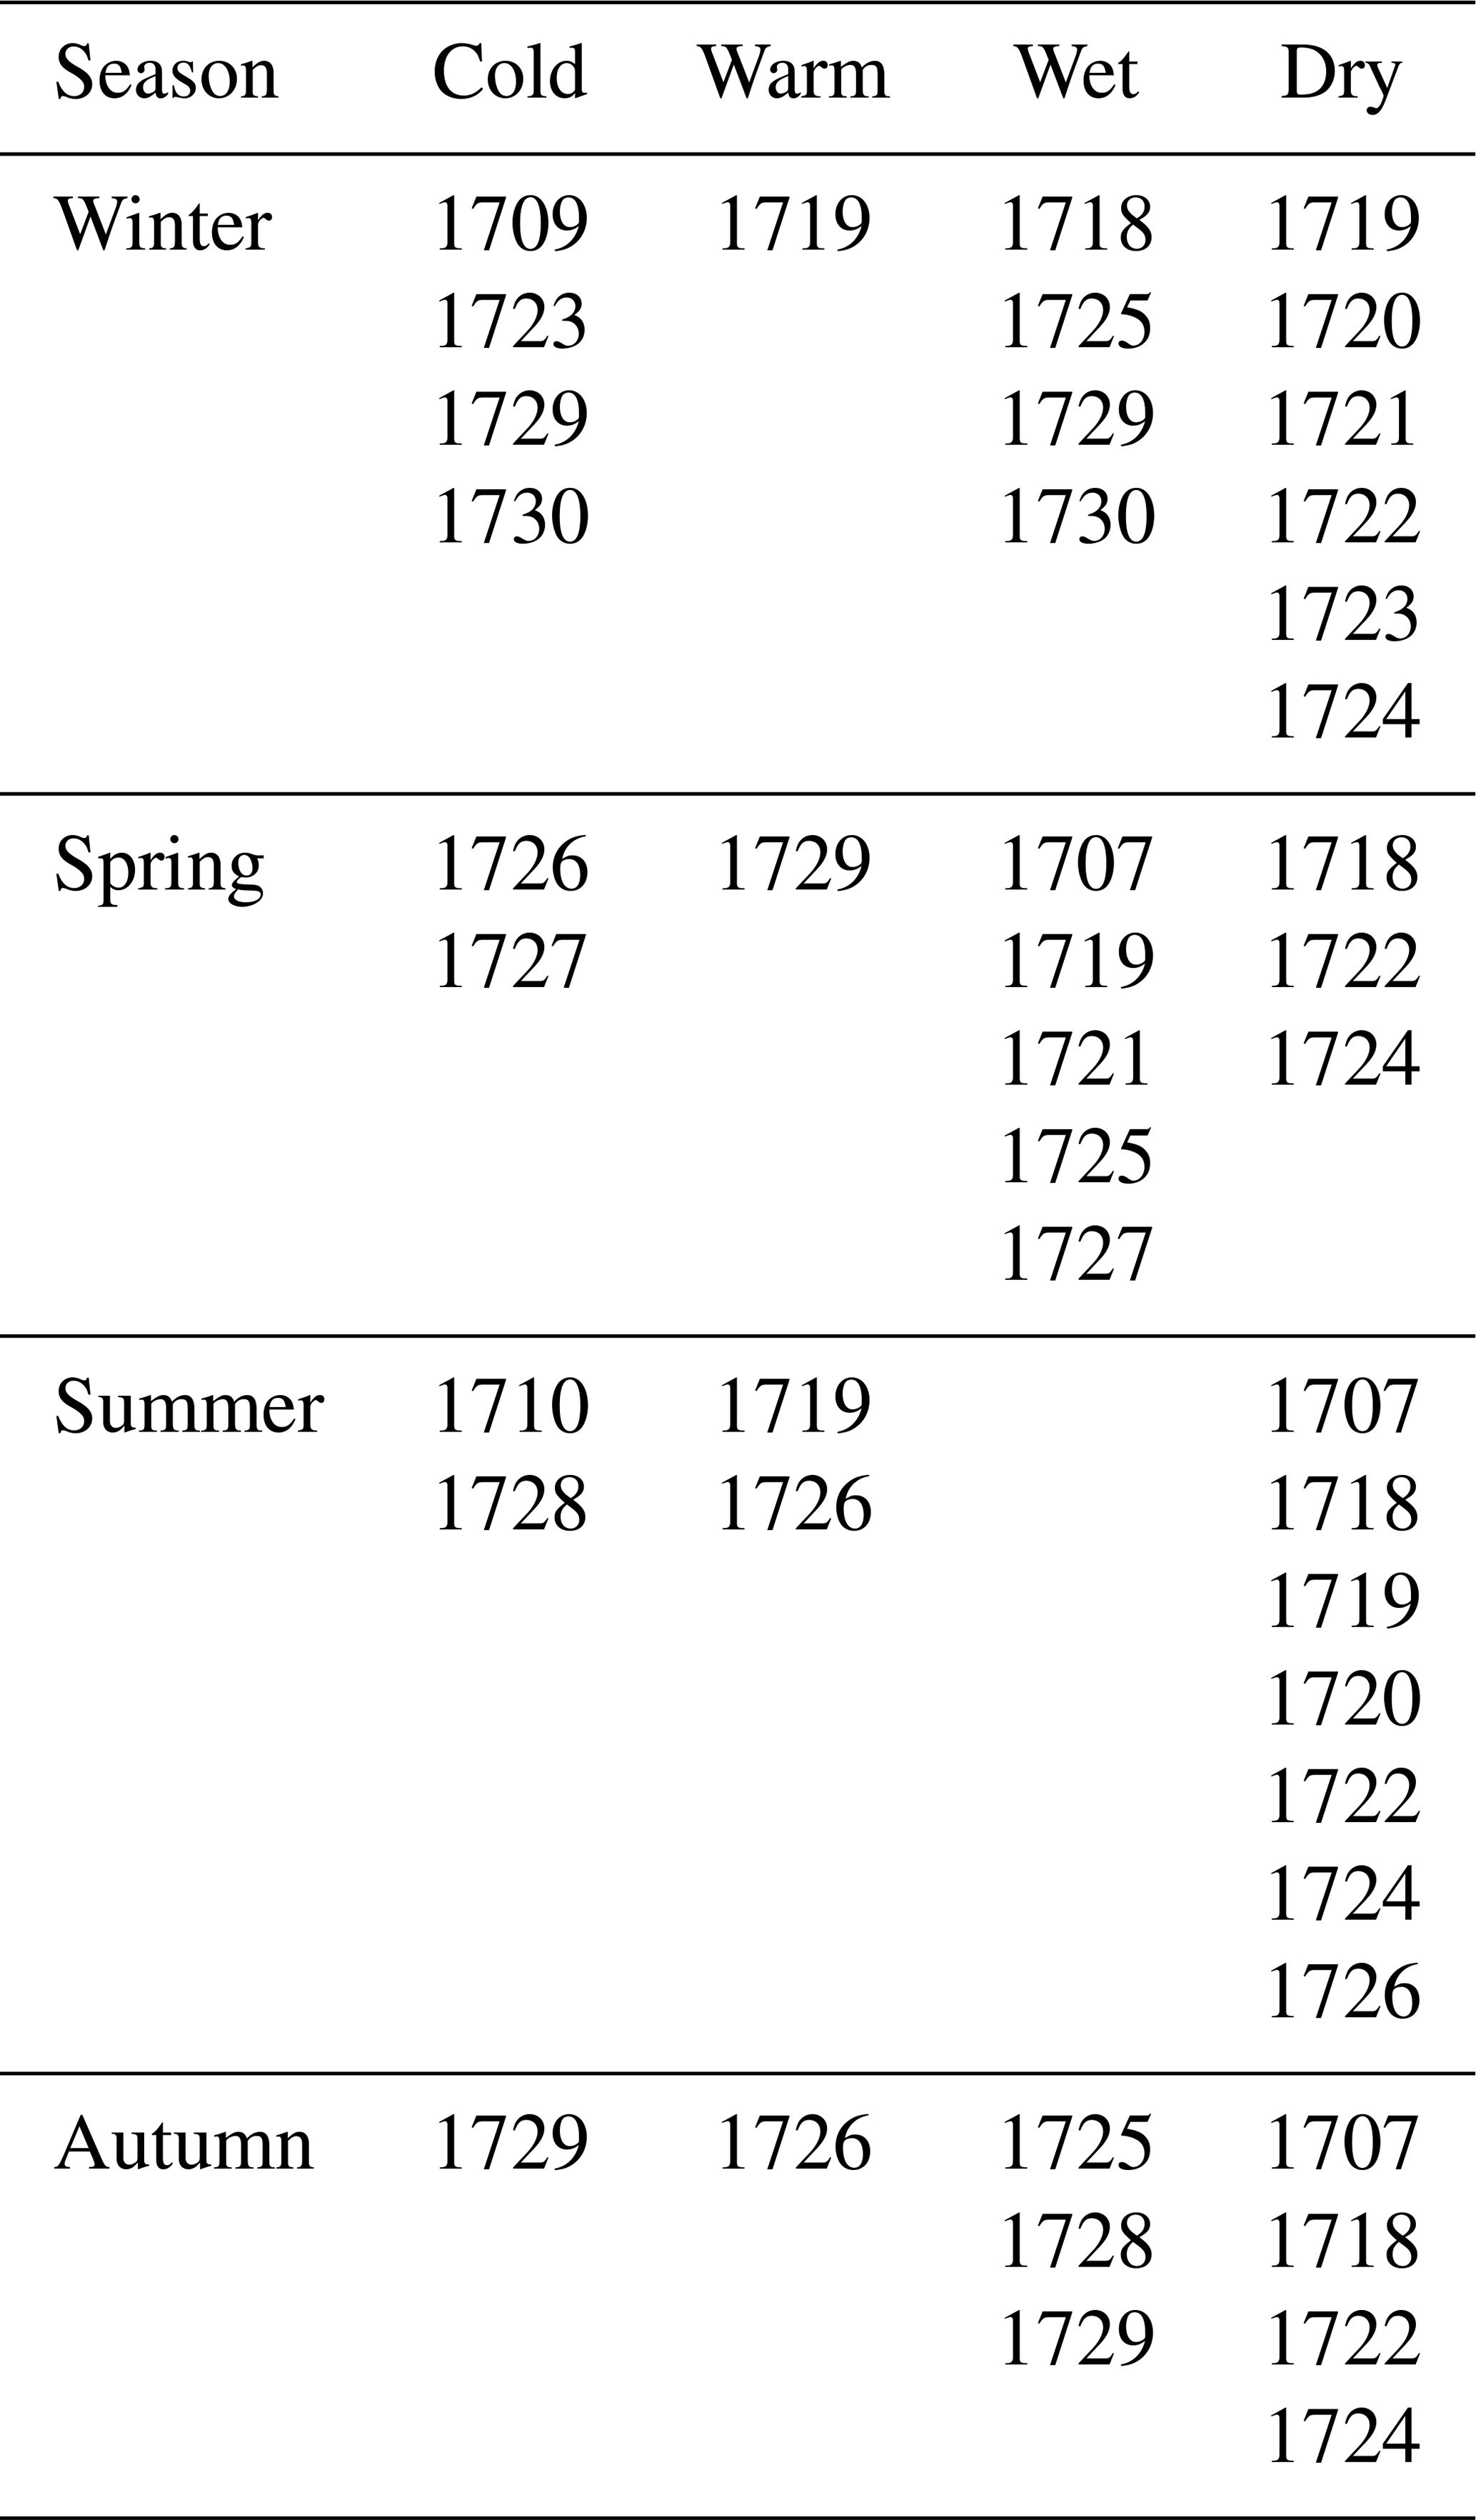
At a first glance, it seems that there is a predominance of cold over warm conditions in winter and spring, and dry over wet conditions in all the seasons except spring. Some of these extreme seasons are confirmed by other data sources. So, for instance, cold winters in 1709, 1729, and 1730 have been reported in other Spanish cities, such as Tortosa, Seville, and Alicante (Alberola Romá, 2014) and the drought during the 1720s has been reported for Jerez de la Frontera (AHVM, 1722), Arcos de la Frontera (ACAF, 1723), and Seville (Zúñiga, 1747), where pro pluvia rogations were celebrated. According to Domínguez-Castro et al. (2010), droughts in Spain from the early 18th century to 1730s are very scarce and their extension is very limited, except precisely in 1724, coinciding with the observations by Navarrete.
Documentary data normally provide information on extreme events. In a first step, it is possible to obtain a catalogue of episodes like droughts, intense rainfall, snowfall, or hailstorms. A preliminary view of this catalogue may be misleading, the risk is to consider that these events were the “normal” climatic conditions in the studied period. The question is whether the historical frequency of extreme seasons is exceptional or, on the contrary, may be regarded as “normal” according to 20th-century standards. The usual methodology, based on ordinal indices (Brázdil et al., 2010), maintains this view if there is no appropriate overlapping period between documentary and instrumental data to calibrate and validate the index and to reconstruct long series of a climate variable. In our case, there is no overlapping period between documentary and instrumental data, so a different methodology must be applied.
Rodrigo (2008) proposed an alternative methodology to indices, trying to overcome the problem of the lack of an overlapping period. This method was tested using climate model paleo simulations (Rodrigo et al., 2012). If p10 and p90 are the percentiles 10 and 90 of a climatic series X of a mean value u and standard deviation SD, we can find corresponding normalized values q10 and q90:
The percentiles qi (i=10, 90) correspond to the standard normal distribution FX. The normality hypothesis is the simplest choice, and it is valid for the series of temperature and rainfall in the four seasons of the year, except in the case of summer rainfall (Rodrigo et al., 2012). We can obtain the values qi from the number of extreme seasons ni, with n=25 (number of years of our series), that is,
From Eq. (1), we can express the corresponding standard deviation SD, and mean value u as
The basic idea is to accept that threshold values pi (obtained from the instrumental observations) are also valid for defining extreme values in the past, that is, we accept that during a past extreme season the value of the climate variable X was lower (higher) than p10 (p90). Percentiles 10 and 90 are commonly used to define the frequency of extreme indices, such as cold nights or warm days, and correspond to moderately extreme events (Zhang et al., 2005). Summarizing, from documentary data analysis, the numbers of extreme seasons ni (i=10, 90) are obtained (Table 1). These numbers are used to estimate qi (Eq. 2), and the SD and u values are calculated considering the values pi corresponding to the instrumental period (Eq. 3). The hypothesis here is that climatic changes are revealed not only by changes in the mean value of the variables, but also in the frequency and intensity of extreme events. Therefore, if we know the frequency of extremes during a given period, and accepting the normality hypothesis, we can determine the mean value and standard deviation of the climate variable corresponding to that period. This methodology does not try to provide the year-to-year variability but the general characteristics of the studied period. This is a weakness of the analysis, although it is possible to reconstruct this interannual variability when documentary and instrumental periods are consecutive (Rodrigo et al., 2012). However, this methodology has advantages in comparison with the standard indices methodology. First, ordinal indices may be skewed by the subjectivity of the authors in original sources and/or by the interpretation of the researcher of descriptions in the sources. In addition, ordinal indices are often based on the impact of the events on the socioeconomic infrastructures (for example, destruction of bridges during a river flood or loss of harvests), and these impacts may change in different periods. The risk here is to consider as heavy extremes certain events that show the vulnerability of the system more than the extreme character of climate variables. The method followed is not based on the severity of the phenomena and, in consequence, at least to a certain degree, avoids these problems. In second place, it does not need an overlapping period with instrumental data, which are necessary to calibrate and validate indices and to reconstruct a climate variable. There is a third problem of a statistical nature: the calibration of indices is normally done using a regression procedure between proxy data (indices) and instrumental data during an overlapping period. From a statistical point of view, the consequence is the loss of variance in the reconstructed series, a problem that is normally solved using an “inflation factor” to correct the reconstructed series (Rutherford et al., 2005). With this method, in principle, it is not necessary to introduce this mathematical artifact.
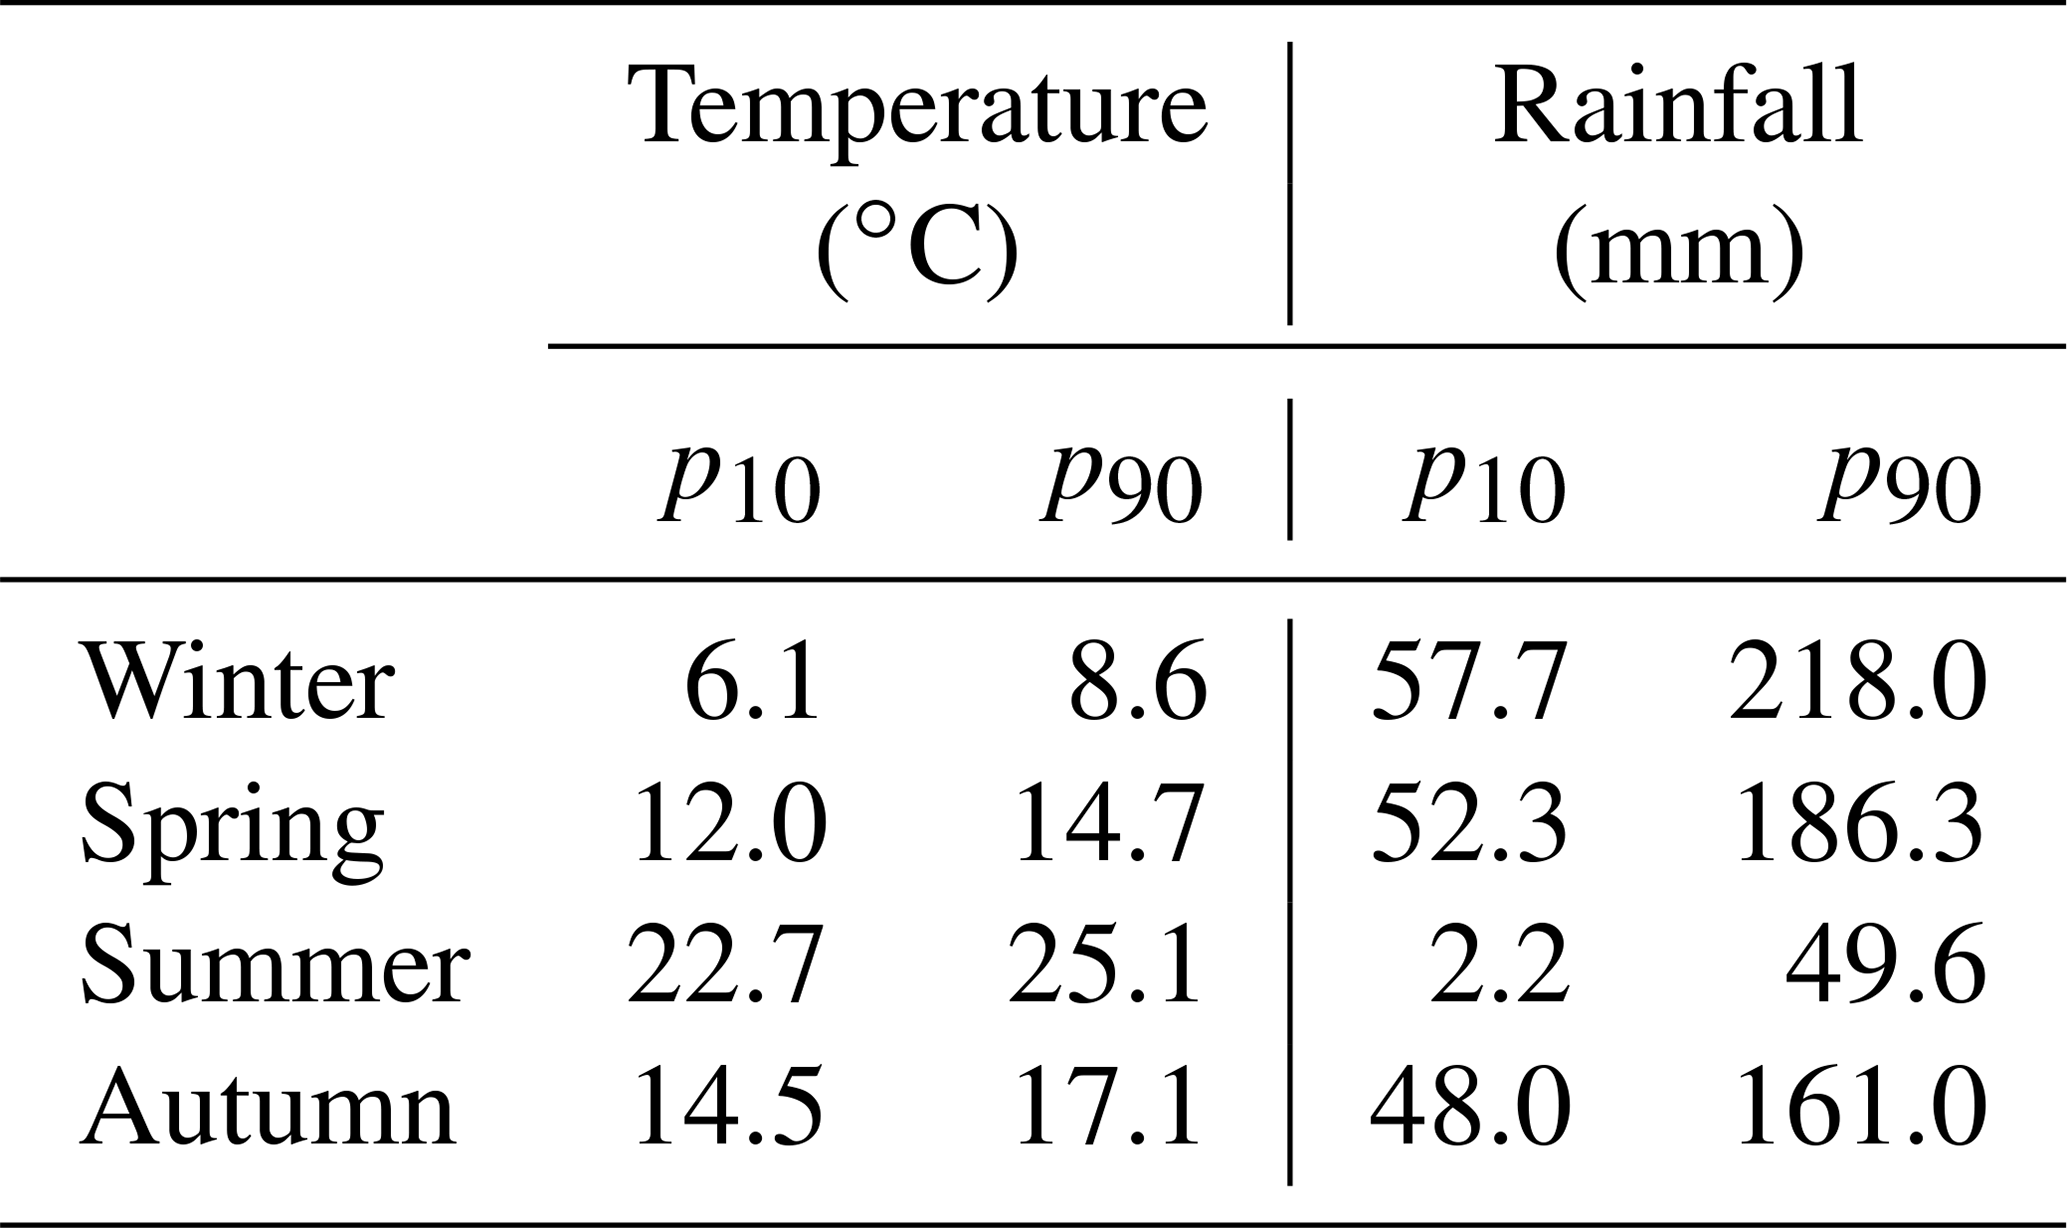
The reconstruction of SD and u depends on the values pi previously established as threshold values to define extreme seasons. These values may be established using the percentiles 10 and 90 corresponding to a given reference period. Therefore, the reconstruction is strongly dependent on the chosen reference period. A possible solution is to select as reference period a period in which there are different climatic situations. Here we use the period 1895–2005, which contains years characterized by a weak warming signal (first decades), and years with a clear warming signal (last decades of the 20th century). Temperature data are extracted from the database Spanish Daily Adjusted Temperature Series (SDATS; Brunet et al., 2006). Monthly rainfall data are extracted from the database made by the Spanish Agency of Meteorology (AEMET; Luna et al., 2012). These databases are available on the web page of the AEMET (http://www.aemet.es, last access: 28 March 2019). All the series are homogeneous and do not present missing data or gaps. Table 2 shows the percentiles 10 and 90 of seasonal mean temperature and accumulated precipitation in Granada corresponding to the complete period 1895–2005.
Table 2Percentiles 10 and 90 of seasonal mean temperature (SDATS; Brunet et al., 2006) and total rainfall in Granada from 1895 to 2005 (AEMET; Luna et al., 2012).
To calibrate the method, the complete series was divided into 25-year running periods, the first one being 1895–1919, the second one 1896–1920, and the last 1981–2005. This procedure was adopted to obtain a large empirical sample. For each individual period, the mean value u and the standard deviation SD were calculated and compared with the corresponding values u and SD estimated from the numbers n10 and n90 of extreme seasons. Correlation coefficients between estimated and observed values, as well as the root-mean-squared error (RMSE), were calculated. RMSE is used in forecasts verification and can also be thought as a typical magnitude for forecast errors (Wilks, 1995). Values of RMSE were used to provide an estimate of the uncertainties that are associated with the reconstruction methodology. Table 3 shows the results of this calibration. All the correlation coefficients were significant at the 95 % confidence level. According to correlation coefficient values, the method offers better results for the mean value u (standard deviation SD) of temperature (rainfall). These differences may be due to deviations from normality in the case of rainfall, particularly in summer. As an example, Fig. 3 shows the comparison for the autumn rainfall series.
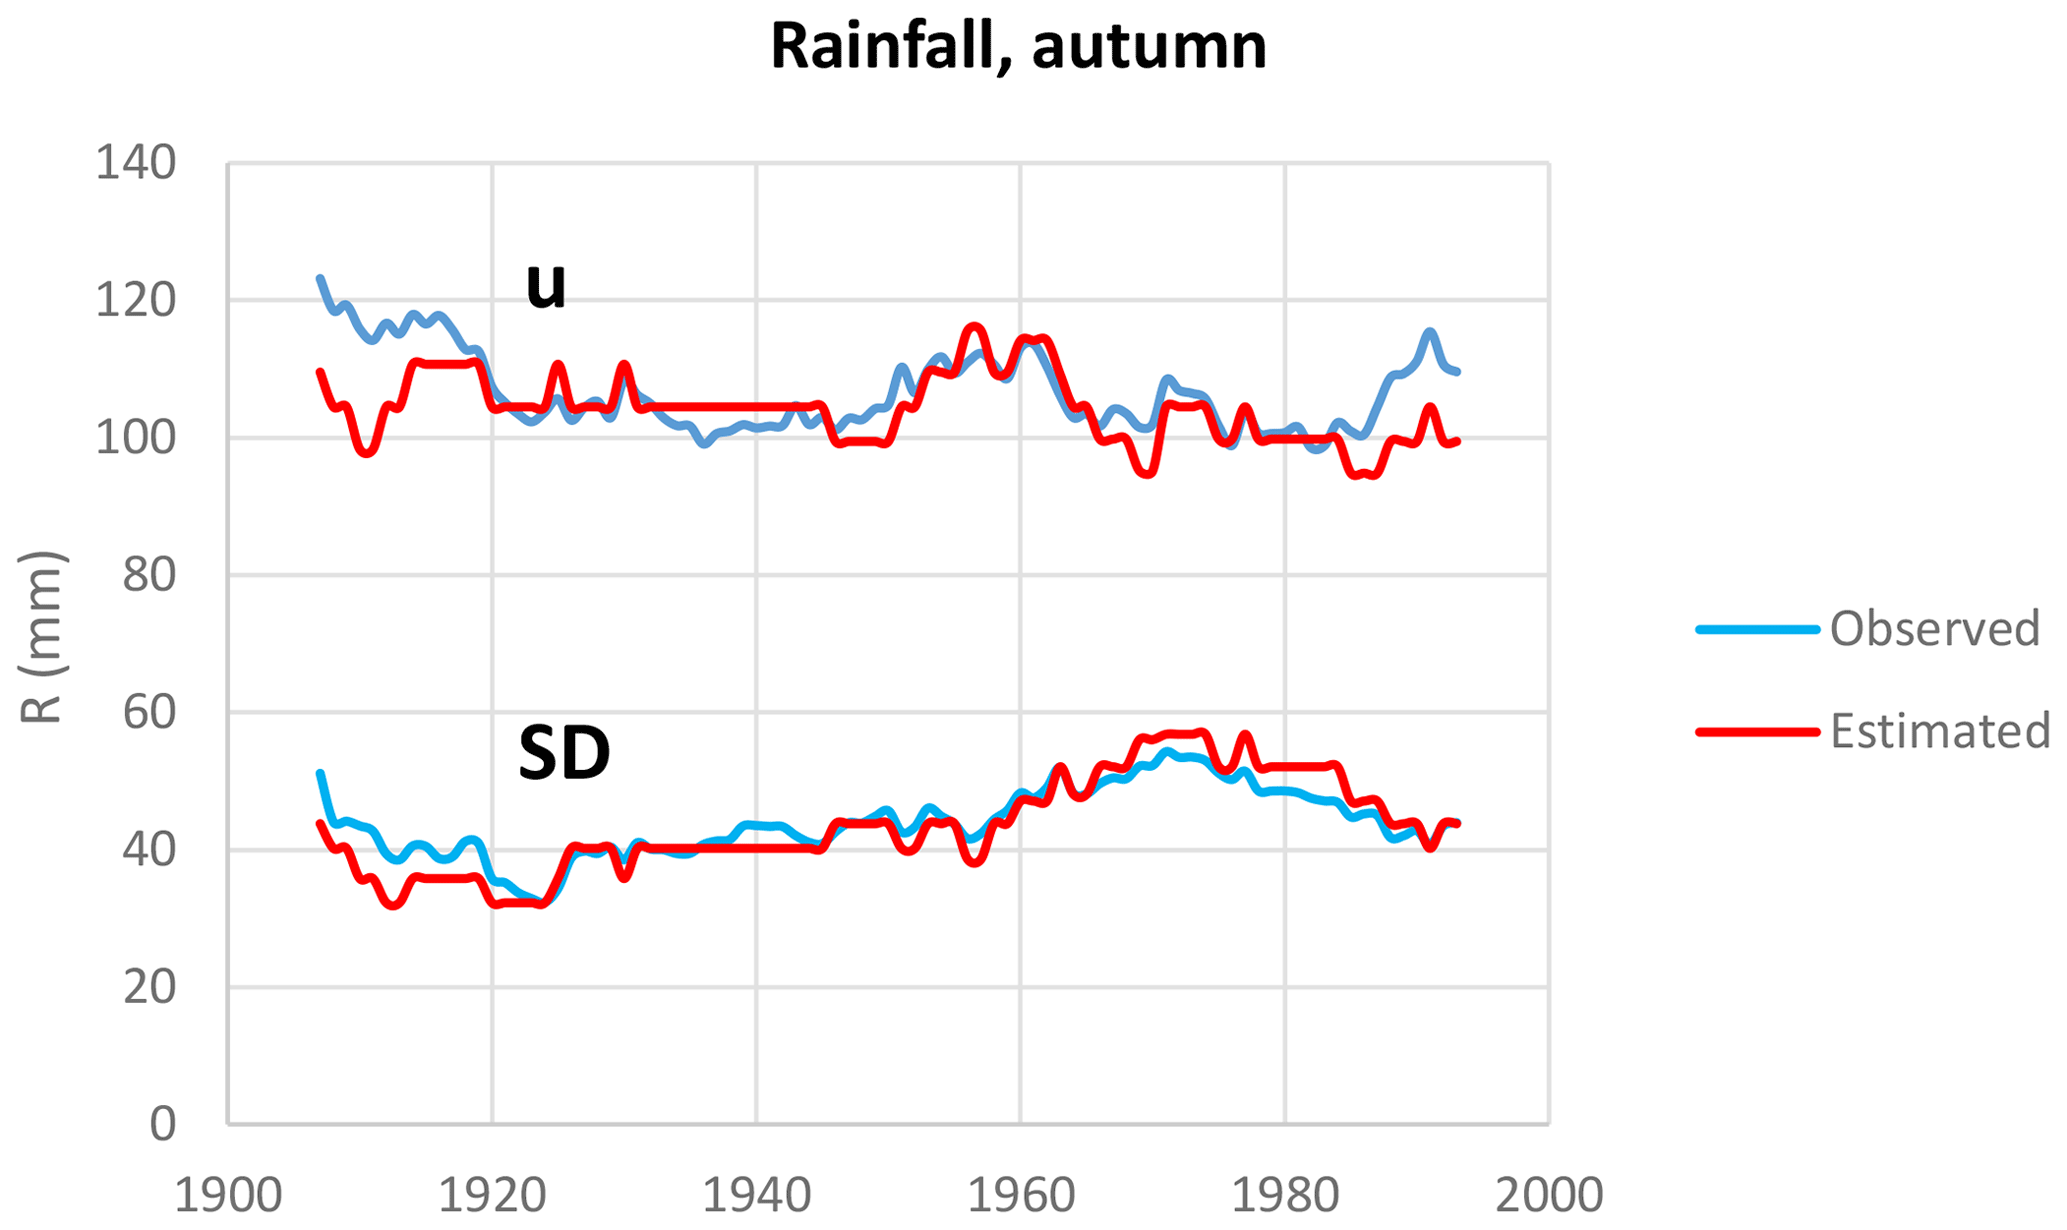
Figure 3Calibration of the reconstruction method for autumn rainfall in Granada from 1805 to 2005. u: mean value; SD: standard deviation.
Table 3Calibration of the reconstruction methodology using 25-year moving series from 1895 to 2005. u: mean value; SD: standard deviation; RMSE: root-mean-square error; r: correlation coefficient between observed and estimated parameters.

The method was applied to the period 1706–1730, using the data of Table 1 as ni and percentiles pi of the reference period (Table 2). Figures 4 and 5 and Table 4 show the reconstruction of seasonal temperature and accumulated rainfall distribution functions, accepting the normality hypothesis. Only in the case of summer rainfall was the reconstruction not accomplished because of the absence of extreme wet seasons (Table 1) and the non-normal character of summer rainfall. RMSE values previously estimated are used as error margins. Results are compared with the corresponding values of two 25-year periods in the 20th century – 1906–1930 and 1976–2000 – when the warming signal is very different. To obtain a best view of this comparison, Table 5 shows the statistics corresponding to these periods. According to these results, seasonal mean temperatures during 1706–1730 were very similar to those during 1906–1930, even slightly warmer, and lower (except in summer) than temperatures during 1976–2000: around 0.7 ∘C in winter, 0.4 ∘C in spring, and 1 ∘C in autumn. Standard deviations of temperature during 1706–1730 were similar to 1906–1930 and smaller than that of 1976–2000, suggesting smaller variability in the past. Total rainfall shows values very similar in autumn for the three periods: slightly wetter conditions in spring during 1706–1730 and 1906–1930 and slightly wetter conditions in winter of 1706–1730 in comparison with 1906–1930. The variability of rainfall in 1706-1730 is similar to that in 1976–2000, except in spring, characterized during 1976–2000 by drier conditions.
Table 4Reconstruction of the period 1706–1730 in Granada. u: mean value; SD: standard deviation.
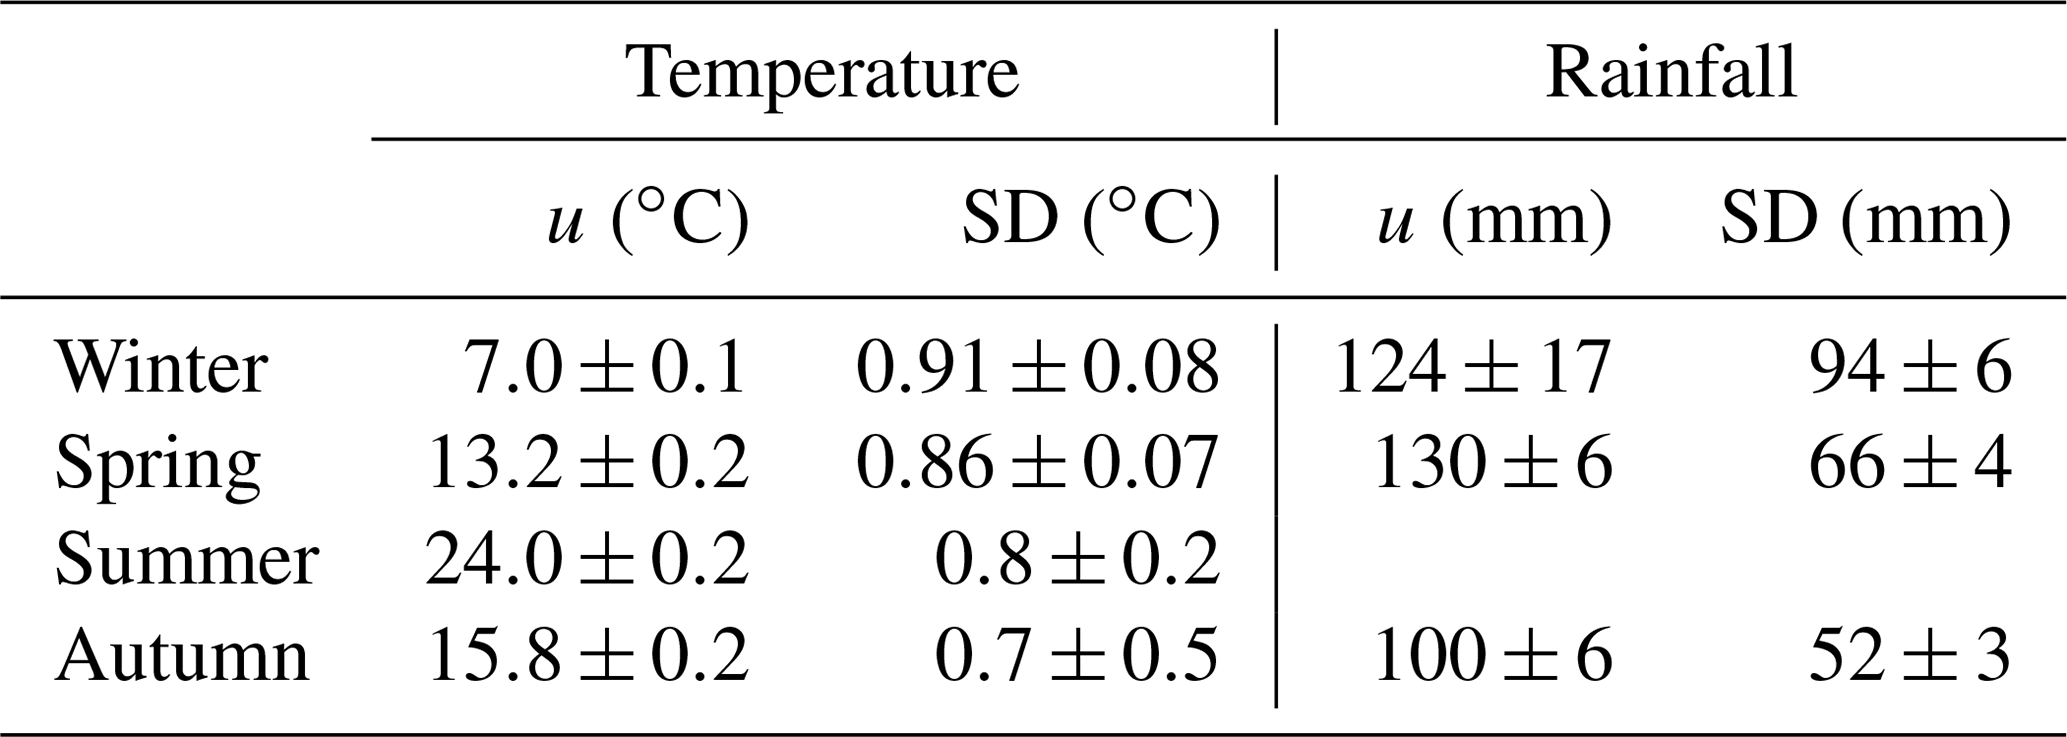
Table 5Statistics of the periods 1906–1930 and 1976–2000 in Granada. u: mean value; Iu: 95 % confidence level interval for mean value; SD: standard deviation; ISD: 95 % confidence level interval for standard deviation.

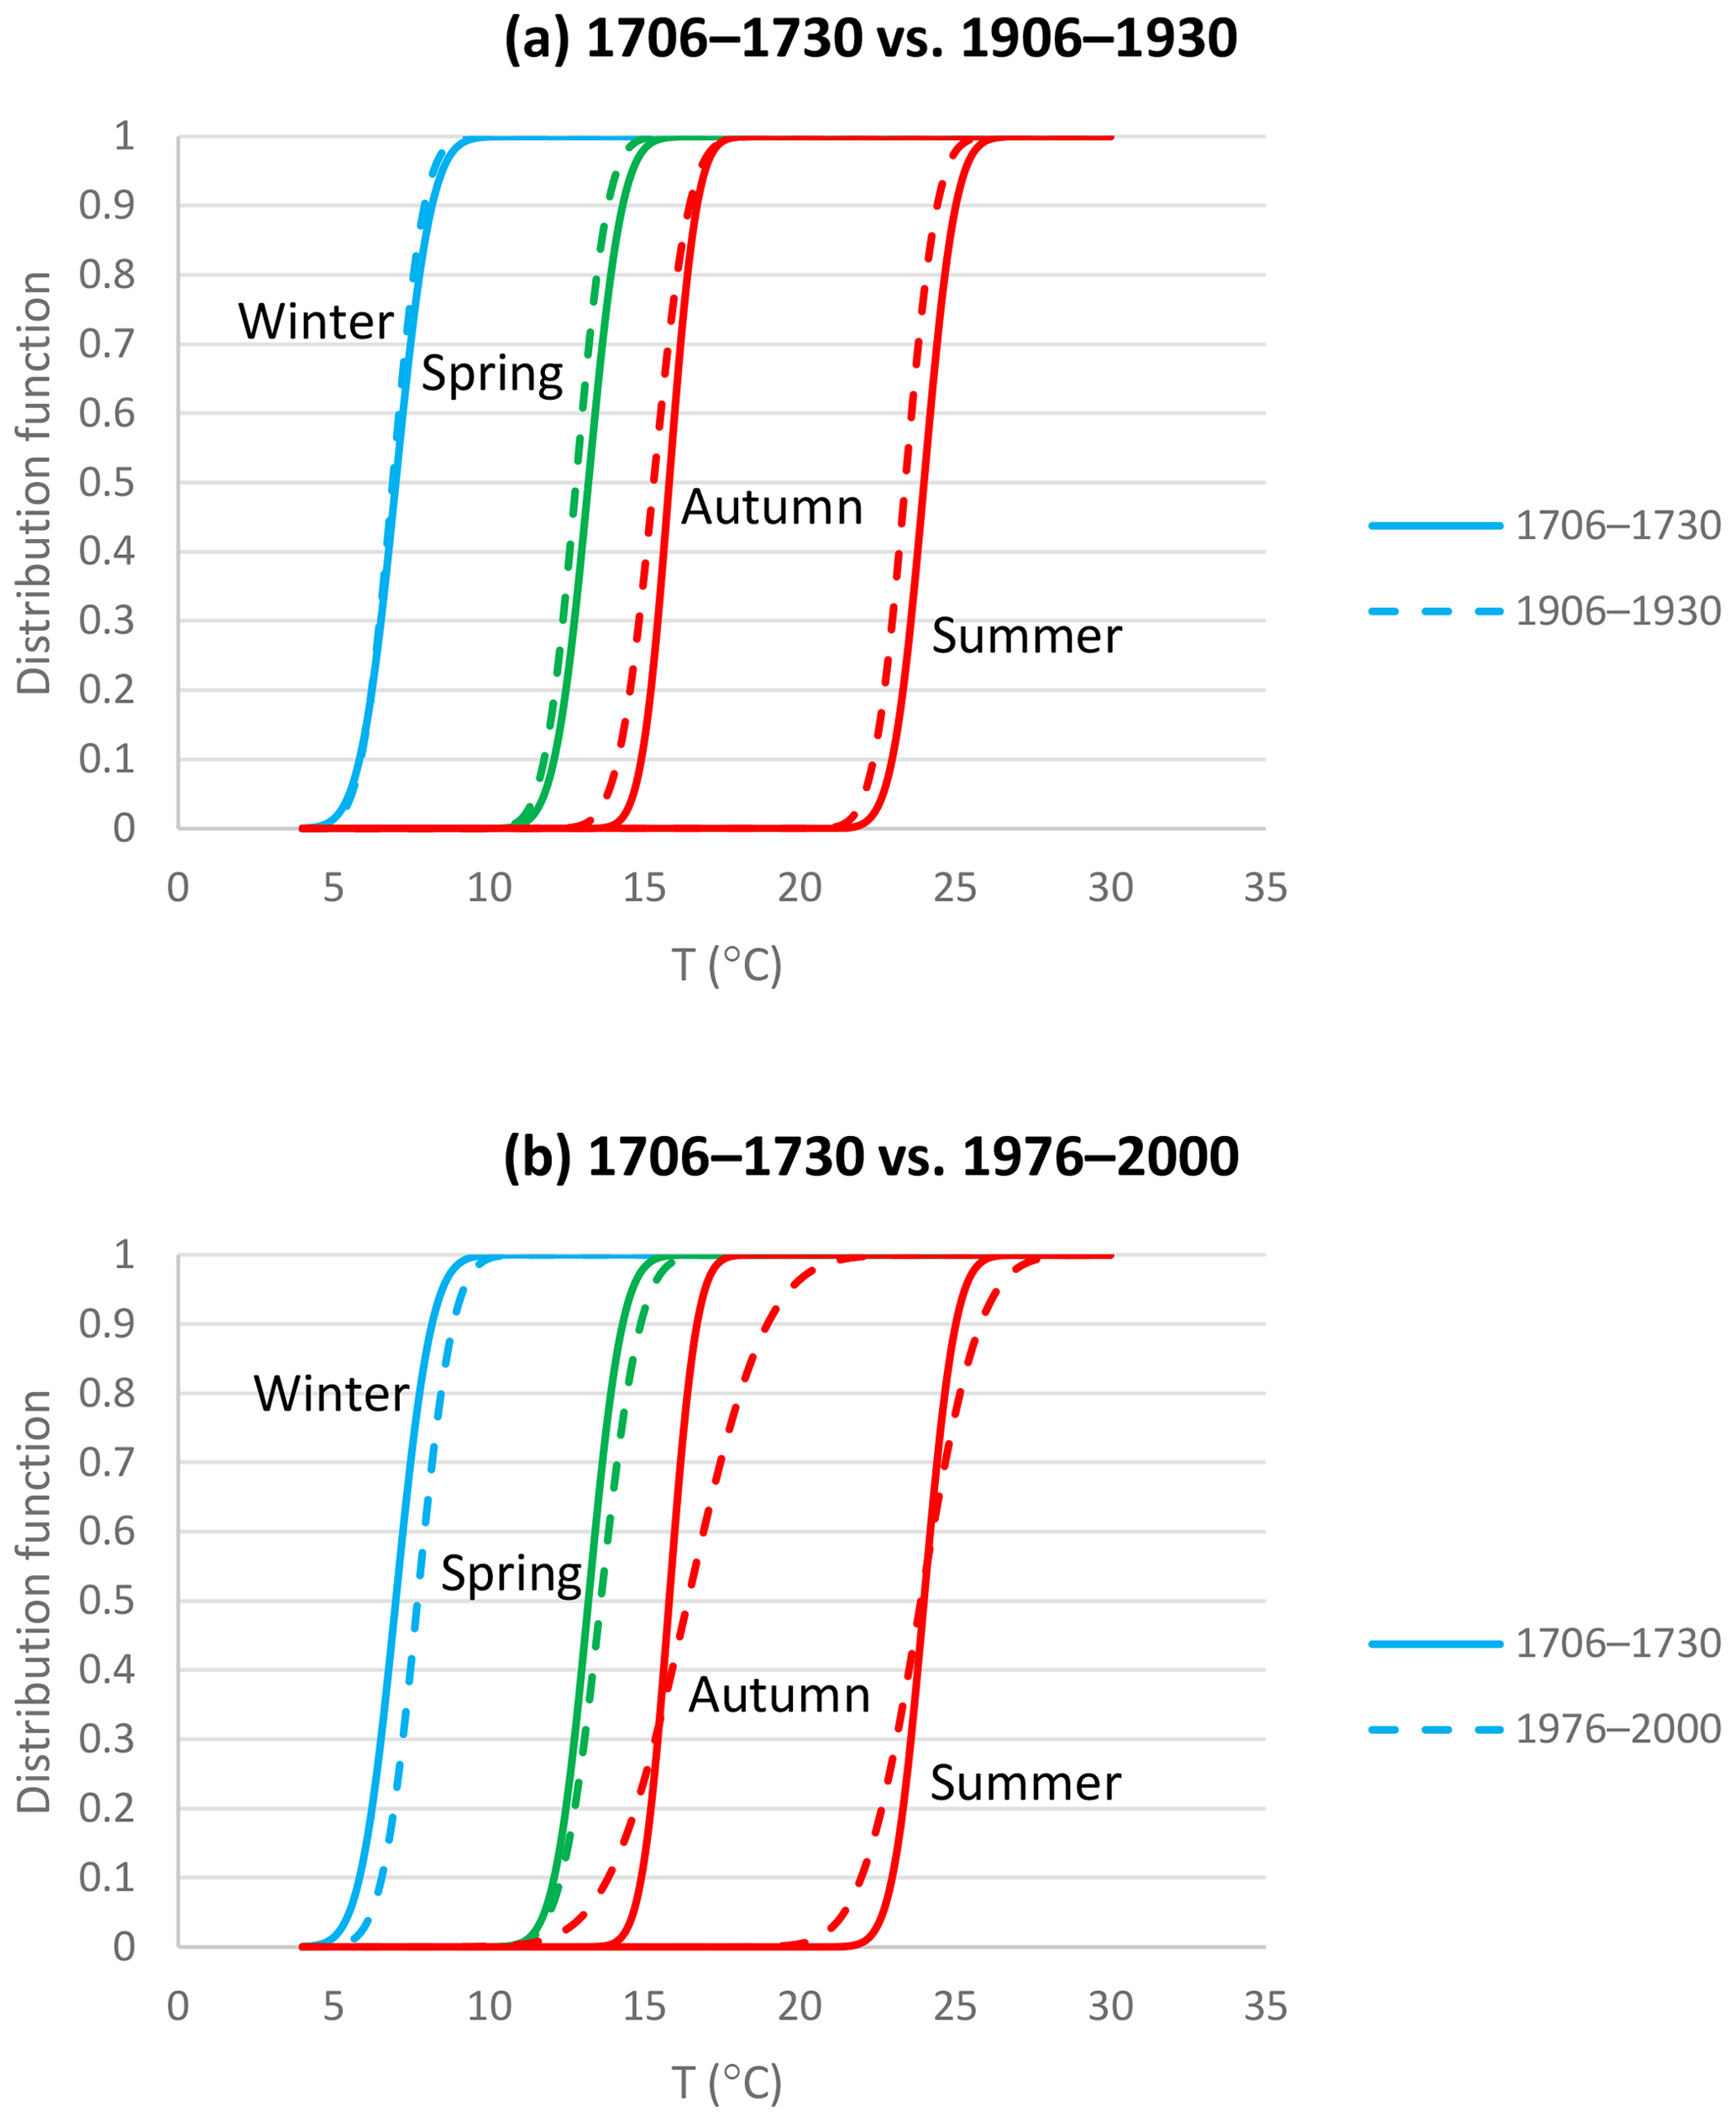
Figure 4Distribution functions of seasonal temperatures of 1706–1730 and comparison with 1906–1930 (a) and 1976–2000 (b).
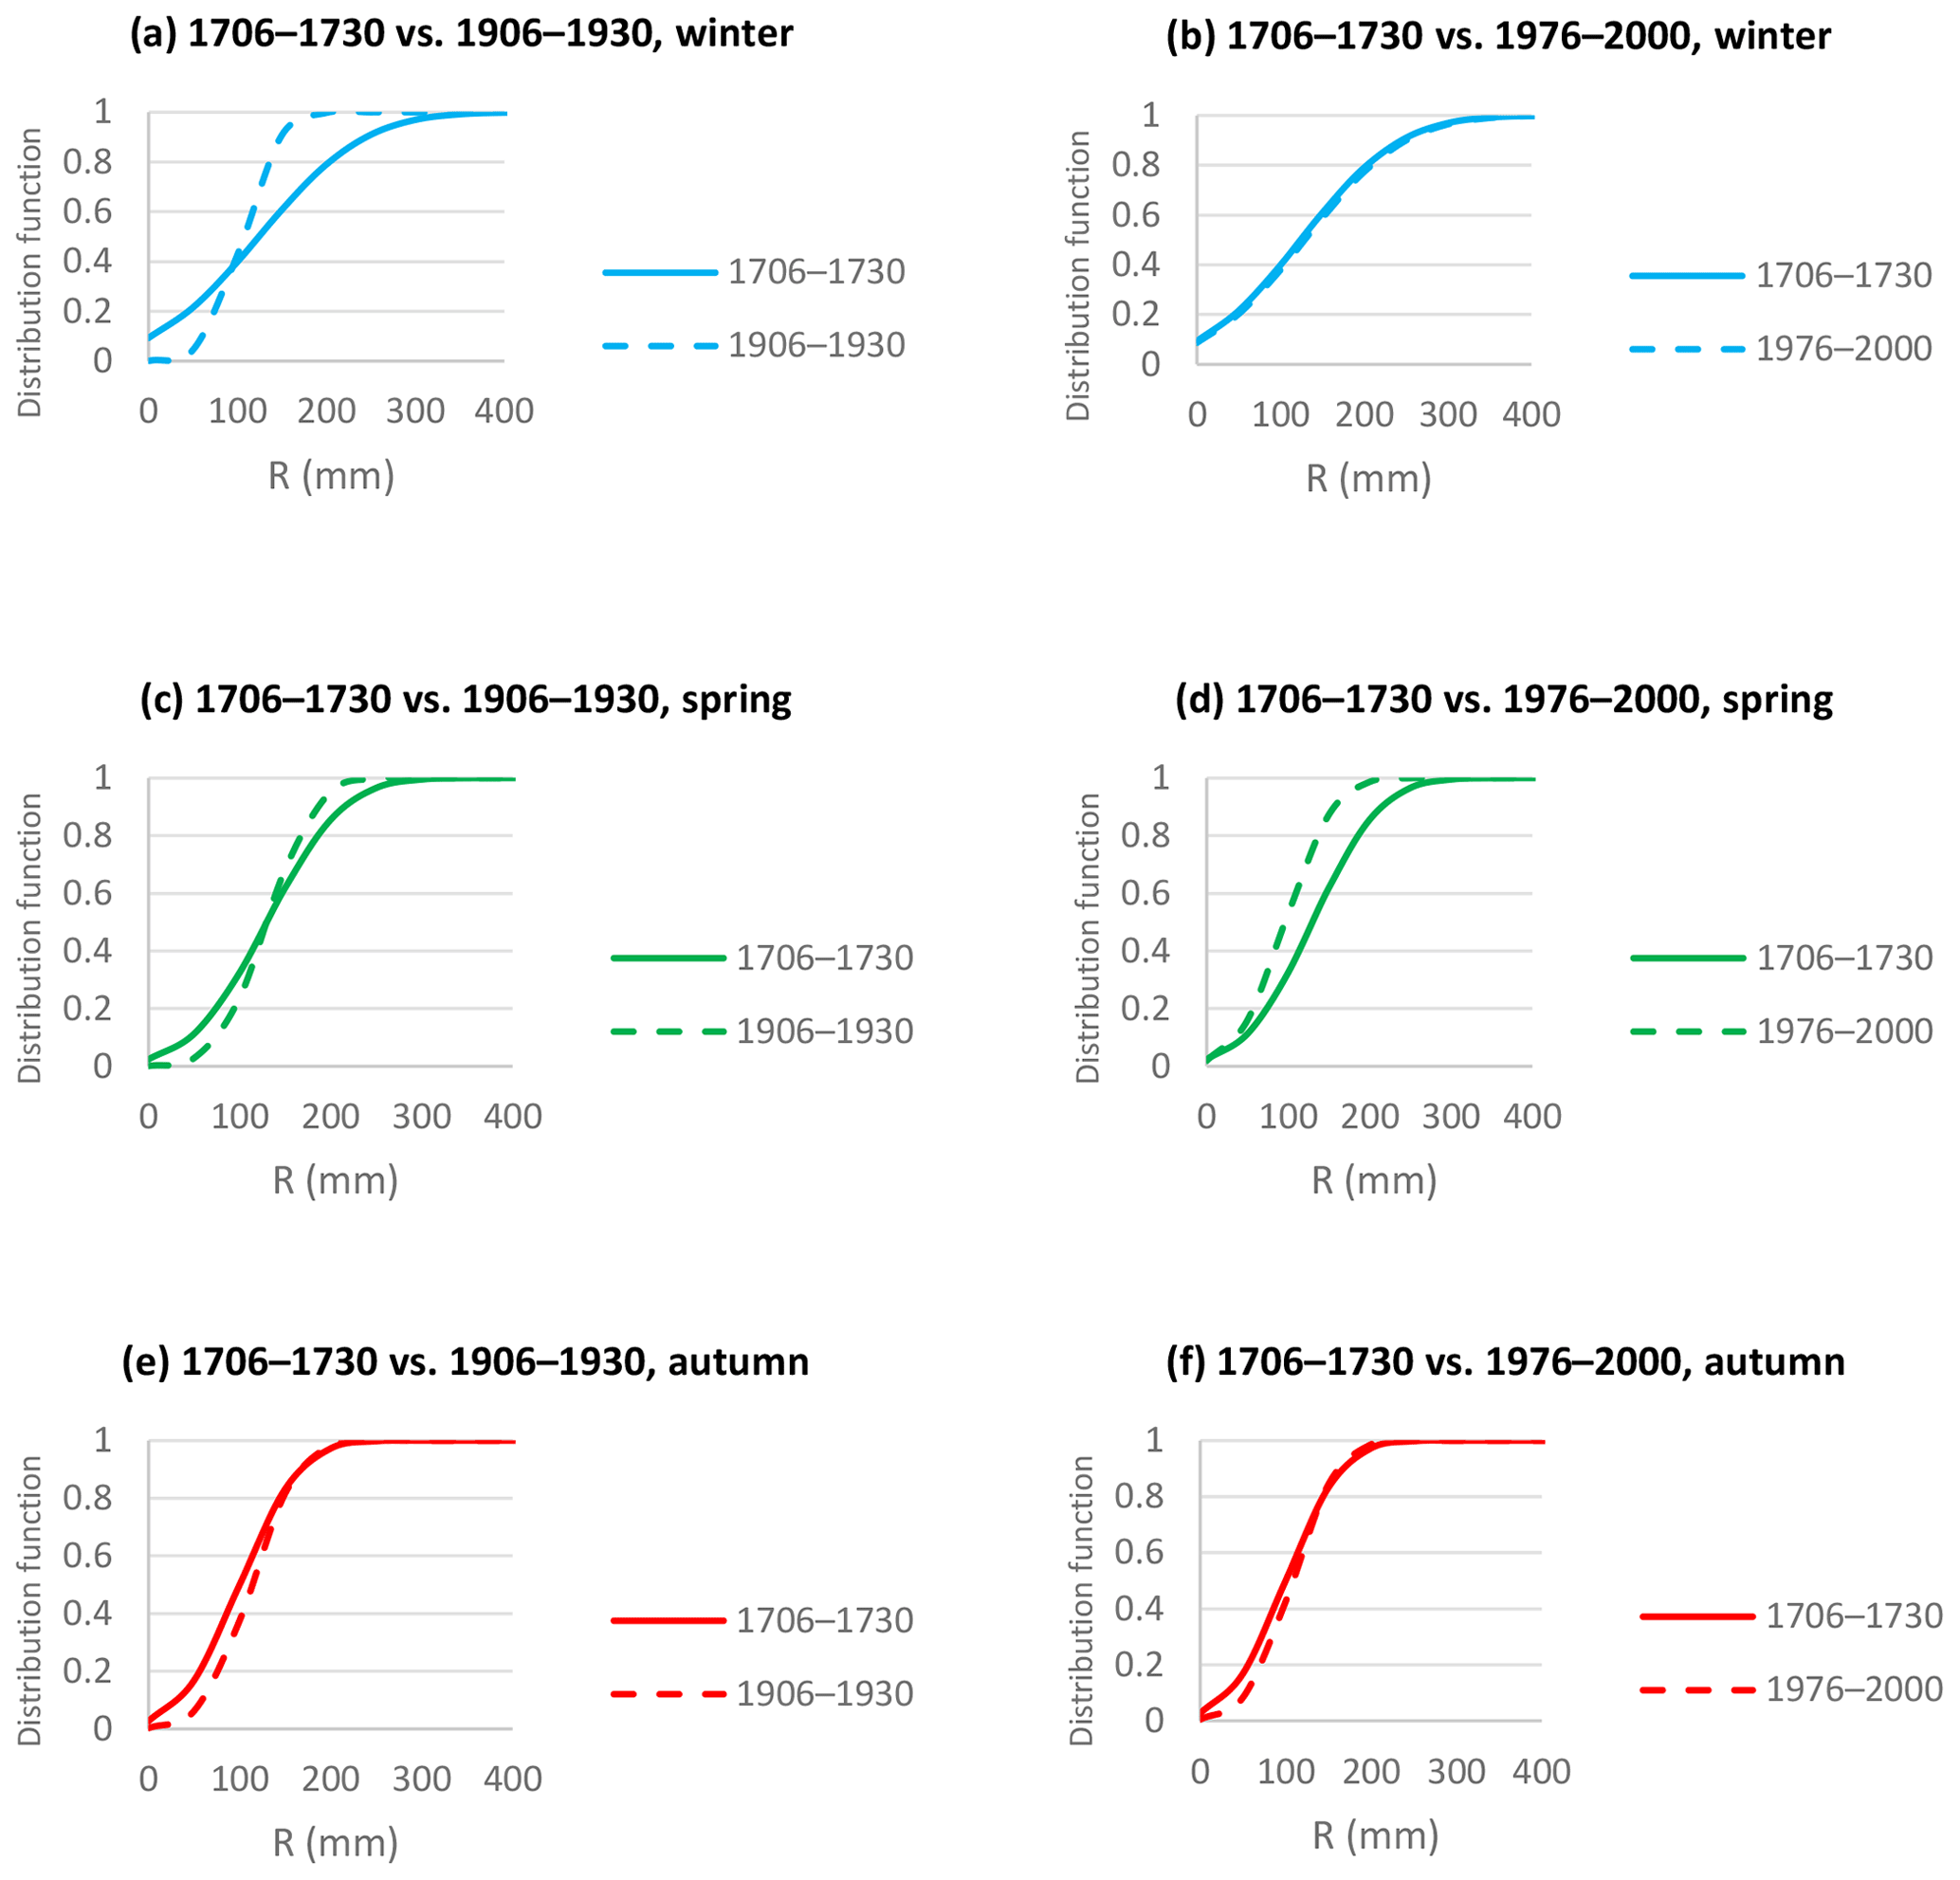
Figure 5Distribution functions of seasonal rainfall of 1706–1730 and comparison with 1906–1930 (a, c, e) and 1976–2000 (b, d, f).
Chapter IV of the book (fols. 12–16 of the manuscript) is entitled “Observations of the atmosphere using the barometer and the thermometer”. It is the first compilation of early instrumental meteorological data in Spain, so far as we know. It begins in December 1728 and ends in February 1730. The author explains that he shows his observations of 1729 as an example of the effects of atmospheric variability and that these observations “are broadly in line with the observations that I have taken during 9 years with these instruments to determine the conditions of the atmosphere”. Unfortunately, we have not found documentary sources with these nine years of data, and we have to be content with the available information. In addition, information is not presented tabulated but as monthly summaries, indicating characteristic values or corresponding to critical moments, and it does not cover in detail all the days of the period. Sometimes, he adds comments on winds and other meteorological events (fog, cloudiness), and he indicates the number of rainy days of some months. So, for instance, for August 1729 he indicates that
August began with warm weather; on day 2, the thermometer indicated 34, and there was a southerly wind. On day 8, the thermometer increased by two lines, from 38 to 40, during the total lunar eclipse, which was at 1 o'clock. Day 14 seemed to be the warmest day of the year; however the thermometer indicated 37, and from day 18 onwards there were slight northerly winds and the temperature decreased to 46.
This information was tabulated for analysis and may be found in Rodrigo (2018a, NavarreteData.xlsx, p. Gr1728-1730).
Instruments used by Navarrete were an “English barometer” and a “Florentine thermometer”. There is no information about the installation of the instruments or the exact time at which readings were taken, and in the case of temperature, the scale does not correspond to any of the better-known scales that were introduced later (for instance, the Reamur scale). This means that any values measured are only important in relative terms (Brázdil et al., 2008). Nevertheless, we have tried to “calibrate” these observations using the information provided by the observer.
Navarrete used a Florentine thermometer with “spirit of wine” as thermometric liquid. After a brief description of the instrument, he explains how he established the scale used to measure temperatures: he distinguishes between “maximum cold”, in the extreme cold of winter or when the “little bottle was buried in snow with salt ammoniac”, and “maximum heat”, in the extreme warm summer or “at the front of an oven”. Navarrete marks “maximum cold” with the value T=100, and “maximum heat” with the value T=1, and divides the length of the thermometer into equal divisions, calling the intermediate value T=50 an “equilibrium”. The lower defining point of the Fahrenheit scale (0 ∘F = −17.78 ∘C) was established as the temperature of a solution of brine made from equal parts of ice, water, and ammonium chloride (Fahrenheit, 1724). Note that the “maximum cold” was established by Navarrete in a similar way, although, unfortunately, he does not indicate the proportion of salt nor the alcohol content of the thermometric liquid. In chap. V (“What can be deduced from these observations?”) Navarrete explains that these limits correspond to “regular conditions”, but they may be exceeded. Figure 6 shows the measurements recorded by Navarrete from December 1728 to February 1730. The sensitivity or resolution of the scale is 0.5 degrees (on 12 July 1729 Navarrete recorded T=38.5 degrees, and from 26 to 28 December 1729, T=87.5 degrees). The author indicates the appearance of frosts on 25 December 1728 (T=90), 28 December 1728 (T=99), and 19 February 1729 (T=98) and explains that on 2 February 1729, when the thermometer indicated T=86, “ice melted”. We estimate the minimum value indicated as T=90 as the threshold value of the occurrence of frosts. In relation to the “equilibrium” (T=50), Navarrete indicates that “it is normal that during the month of May cold and heat equalize, on 29 May the thermometer reached the exact average value”.
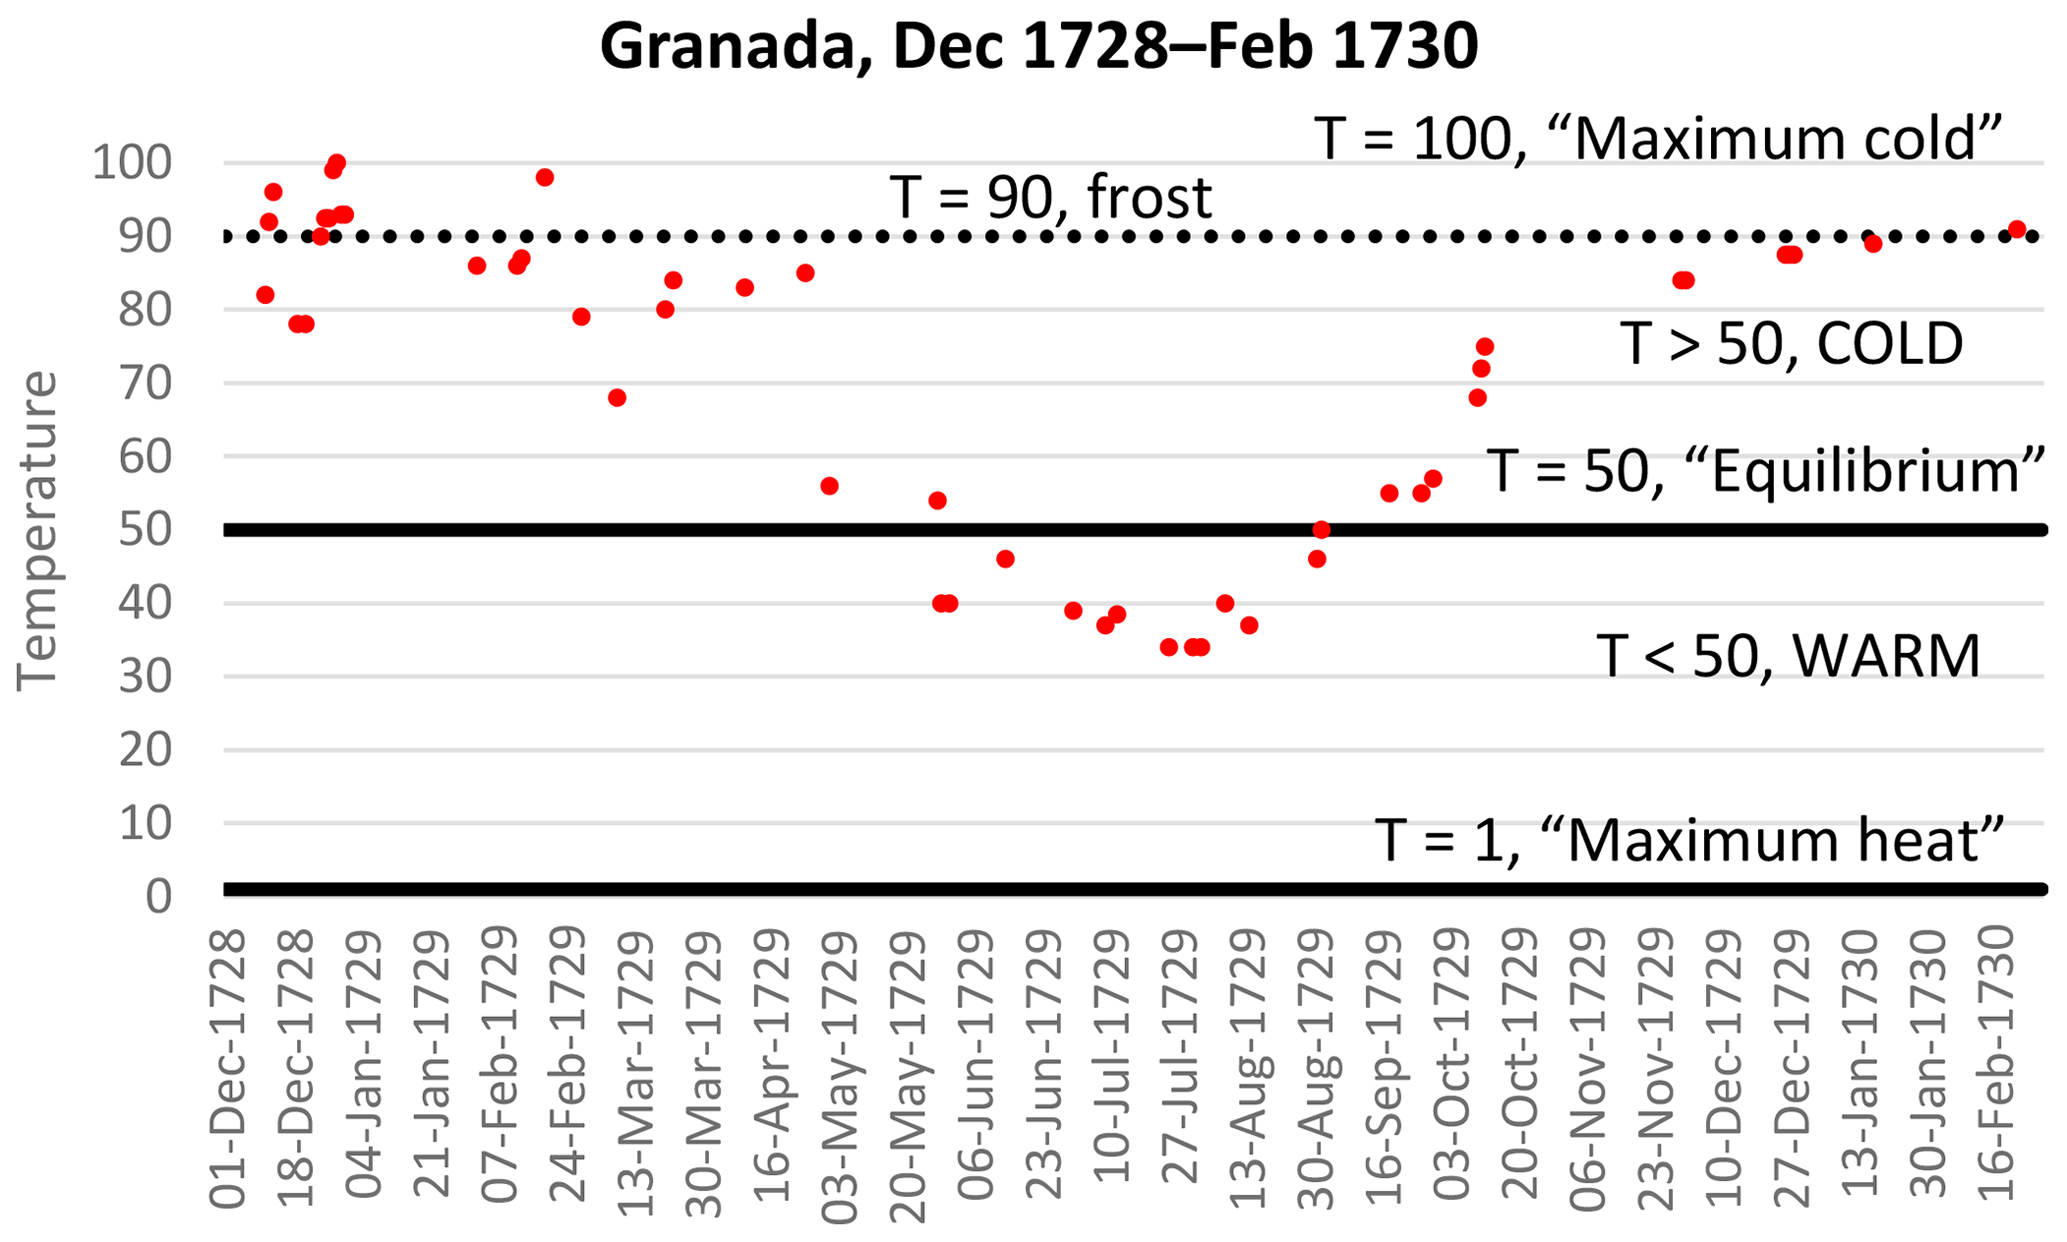
Figure 6Temperatures measured and scale defined by Navarrete with the Florentine thermometer.
We do not know the exposure conditions or the time of day at which measurements were taken. However, some information may be obtained from the analysis of the text. In particular, when the author describes the month of July, he explains that “on the first day, the thermometer exposed to the sun at siesta time increased from 39 to 12”. Given the magnitude of other measurements (for instance, T=34 on 25 July 1729, “the warmest day of the year”), we can infer that measurements were taken sheltered from the solar radiation (probably indoors) in the afternoon (“siesta”). Therefore, these measurements may be regarded as proxies of daily maximum temperatures (Camuffo, 2002; Wheeler, 1995).
We have tried to calibrate these measurements accepting a linear relationship between the scale used by Navarrete and the Celsius scale (Vittori and Mestitz, 1981). For calibration, taking into account the previous comments, we assign 0.0±0.1 ∘C to (frosts) and 23.3±0.1 ∘C (mean value of daily maximum temperature corresponding to May during the reference period 1906–1930 and standard error at the 95 % confidence level) to (“equilibrium”). This last hypothesis is based on results of the previous section that indicated the similarity between temperatures of the period 1706–1730 and 1906–1930. The calibration equation is
Using the law of propagation of uncertainty, the parameters of the equation are and ∘C. Equation (4) was applied to the daily temperatures recorded by Navarrete, and afterwards the monthly mean values were estimated and compared with the monthly mean value of daily maximum (mean) temperatures TX (TM) recorded during the period 1906–1930. Results are showed in Fig. 7. It may be seen that conditions were colder than modern reference values in winter 1729, autumn 1729, and winter 1730, even with values lower than reference period TM values. From May to August, however, reconstructed values and their margin errors match with modern TX values.
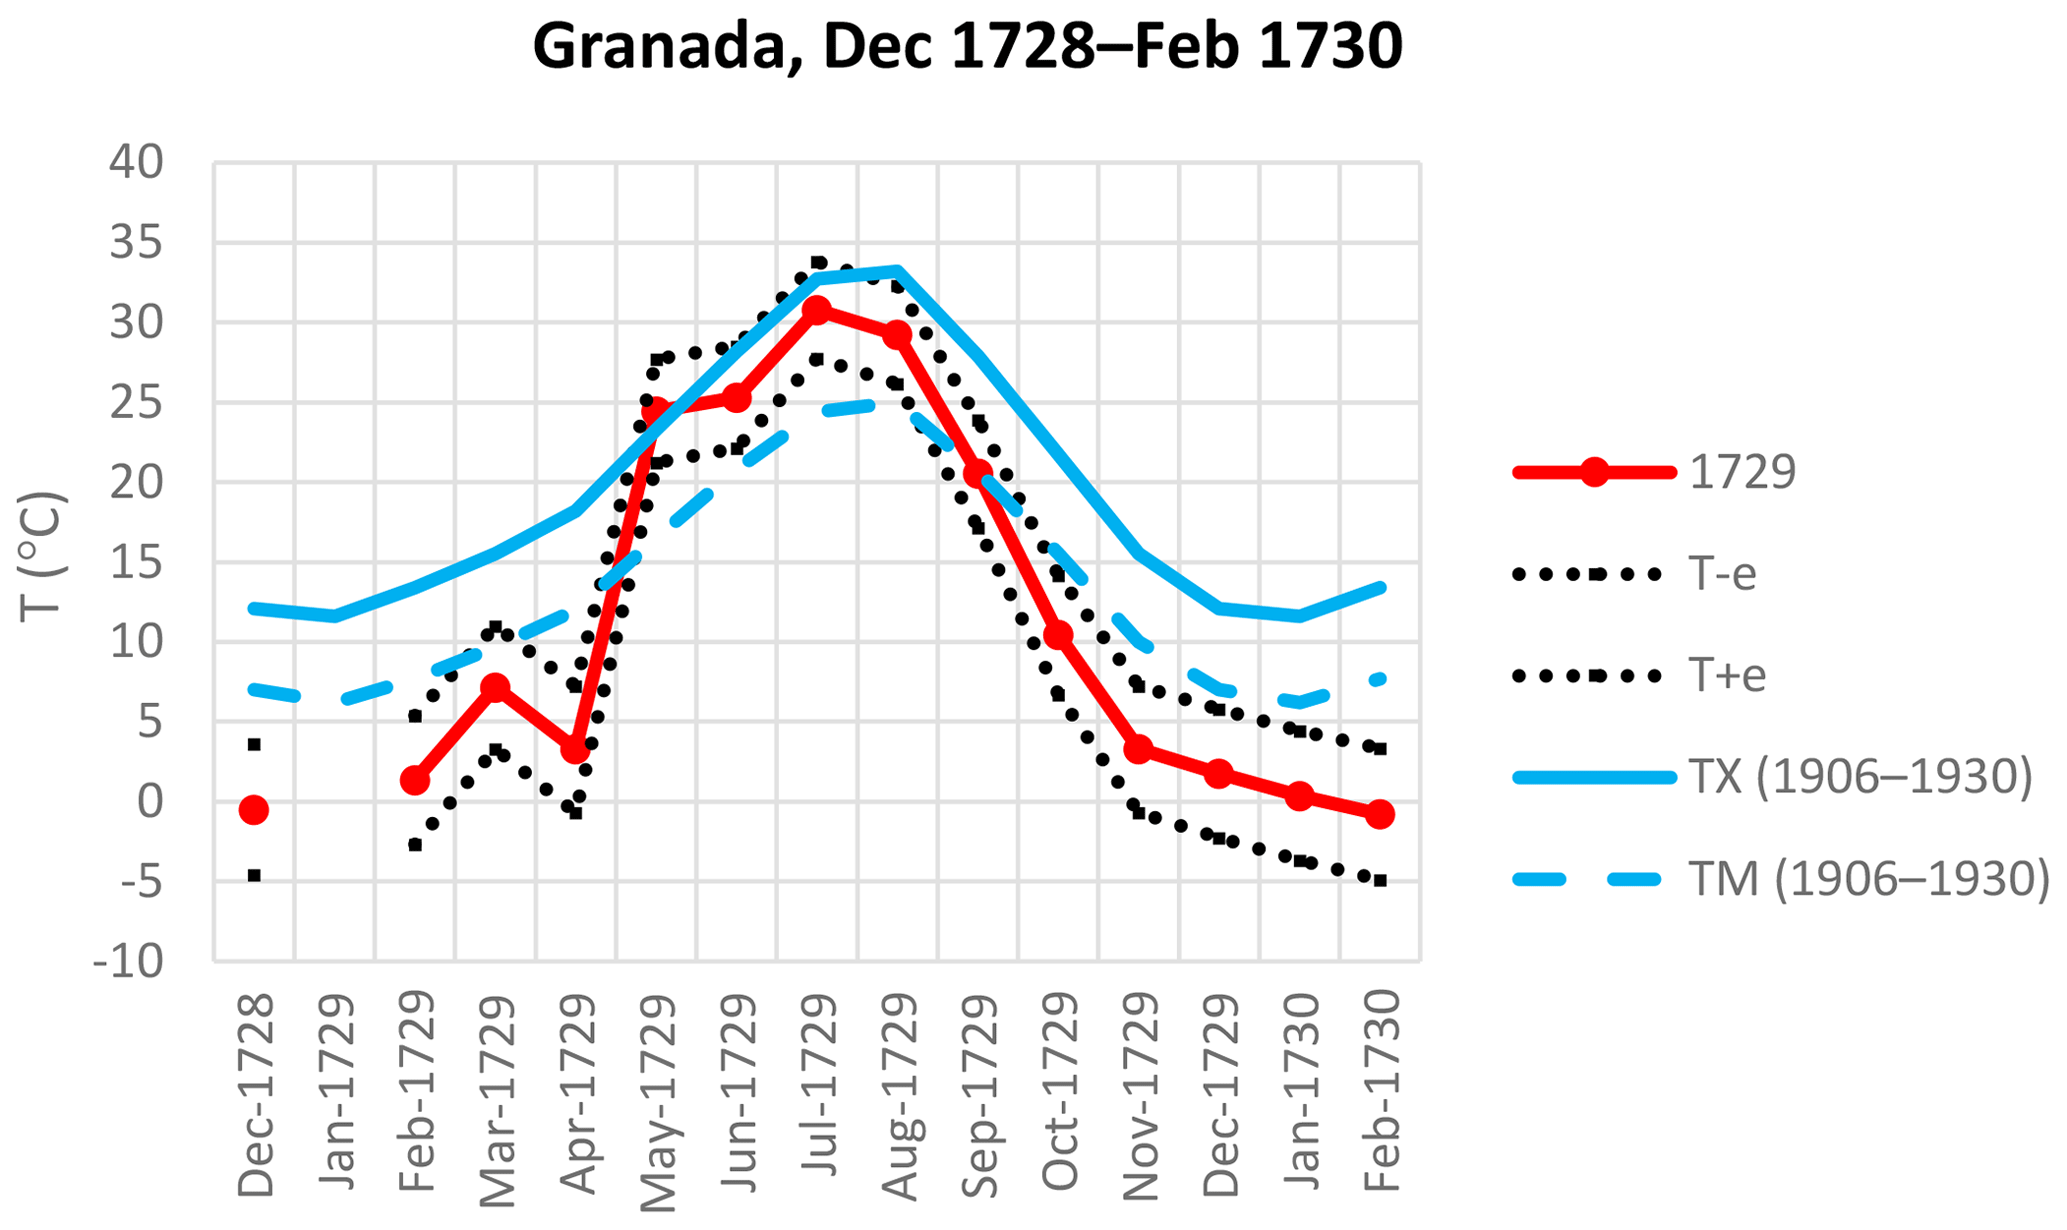
Figure 7Monthly mean value of daily temperature in 1729 and error margins estimated and comparison with monthly mean value of daily maximum temperature (TX) and monthly mean value of daily mean temperature (TM) of 1906–1930.
Winter 1729, “the coldest winter seen in 24 years” according our author, deserves special attention. Figure 8 summarizes quantitative and qualitative observations made during this winter: the first days of December 1728 were dominated by a “cold fog” and high pressures. A sharp decrease in pressure marked the snowfall on 13 December and three consecutive rainy days from 19 to 21 December. Frosts, rainfall, snowfall, hail, and northern winds characterized the last days of this month, with ( ∘C, according our calibration) on 29 December. After cloudy days on 30 and 31 December, 4 snowy days (on 7, 12, 13, and 18 January) were recorded (in the reference period, the mean value of snowy days is 0). Ice and snow stayed “in shady places” until 2 February, when it rained. During February “fog, sun, and frosts continued”. Temperatures indicated by the author during this winter were colder than (7±4 ∘C). Figure 9 shows the monthly average sea level pressure field (SLP; Fig. 9a, c, e), and anomalies of the SLP field with respect to the reference period (Fig. 9b, d, f) according to the independent reconstruction by Luterbacher et al. (2002), available at http://climexp.knmi.nl (last access: 28 March 2019). Anticyclonic conditions, especially during February, made possible the appearance of frosts and morning fogs, with northwestern winds. The negative anomalies corresponding to December and January would explain the predominance of rainfall and snowfall between mid-December and mid-January.

Figure 8Observations during winter 1729. Left axis (dots): temperature according to Navarrete's scale. Right axis: rainy and snowy days.
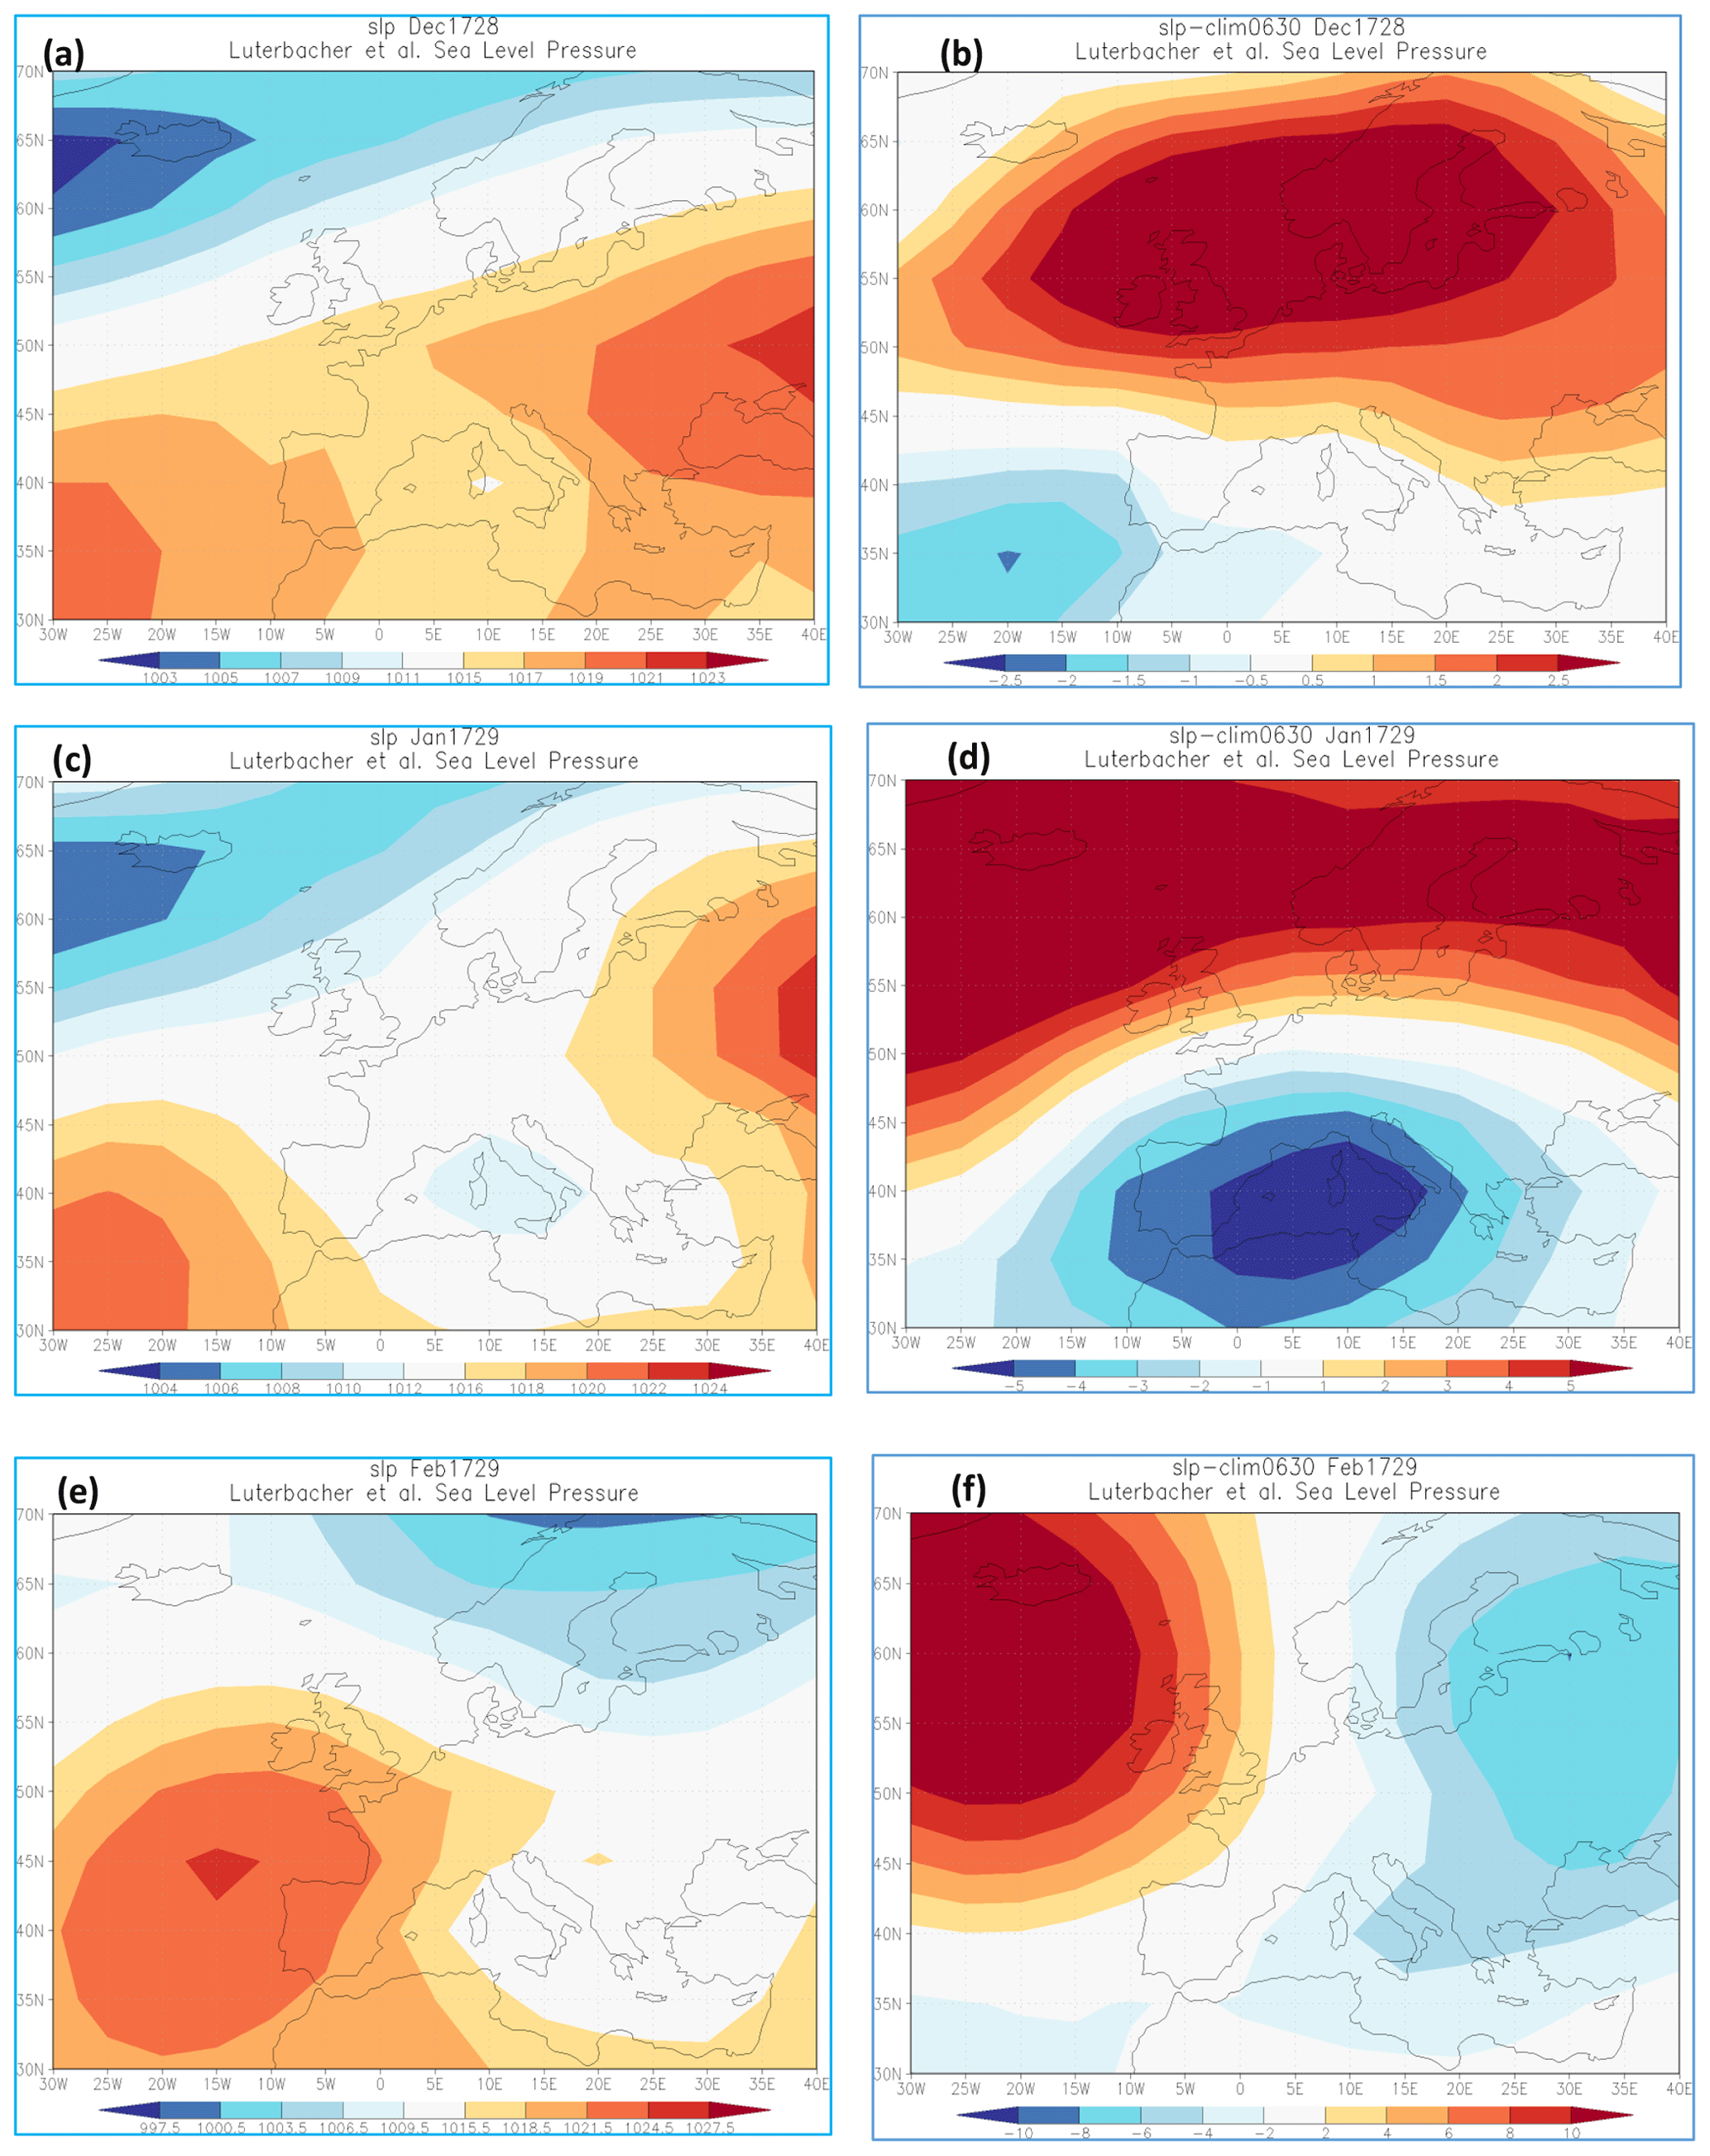
Figure 9Reconstruction of the monthly SLP field in western Europe (a, c, e) and anomalies of the monthly SLP field with respect to the reference period 1906–1930 (b, d, f) for December (a, b), January (c, d), and February (e, f) 1729, according to Luterbacher et al. (2002).
Atmospheric pressure was measured using an English barometer. The observer was more interested in the fluctuations of this variable than in absolute values. So, sometimes, he records deviations with respect to a mean value, which it is not specified (in the 20th-century reference period, the annual mean value of pressure in Granada is 939 hPa, of an order of 28 English inches). A deviation of 1 line means changes of an order of 3 hPa. Barometers usually had a mobile scale with qualitative marks (Guijarro, 2005), from the highest value (“very dry”) to the lowest value (“very wet”). The number of quantitative measurements is scarce, and we do not know the exposure conditions nor the temperature of the barometer; in consequence it is impossible to apply the usual correction to 0 ∘C. Information on atmospheric pressure is basically qualitative, with references to “very dry”, “good weather”, “variable”, “windy and/or wet”, and “very wet” categories. “very dry” conditions are recorded on 12 December 1728, with a positive deviation of 4 lines above the mean line, that is, around 12 hPa. On 13 December, according to the author, “the thermometer and the barometer fell four lines in the morning. I predicted snow. It arrived soon; it was a lot of snow and persisted all day”. The categories “variable” and “good weather” are associated with pressure values 1 line above the mean value (for instance on 25 April 1729 and 17 January 1730). The class “windy and/or wet” indicated by the barometer is associated with information on snowfall (27 December 1728), strong rainfall (26 September 1729), or intense rainfall accompanied by westerly winds (30 November 1729). On 29 December 1728 the barometer indicated “very wet” conditions (“it rained a lot and hailed”). Therefore, pressure information is related to other variables (snowfall, rainfall, winds). Sometimes, the author summarizes the general behavior of a concrete month, for instance when he indicates that during April 1729 “westerly winds continued, with clouds and water, well-marked by the barometer”. This month it rained on days 1, 2, 8, 11, 13, 14, and 23; that is to say, there were 7 rainy days, coinciding with the average value of days with rain higher than 1 mm during the reference period 1971–2000 (INM, 2004; data on rainy days are not available in the database by Luna et al. (2012). Therefore, we used the AEMET climate summary of the reference period 1971–2000). Note that rainfall information is often accompanied by information on west winds, and cold weather is associated with north winds. South winds are associated with hot conditions (for instance, on 29 May “a southeast wind blew, and the afternoon was hot”, and the author indicates southwest wind on 25 July 1729, “the warmest day of the year”). As we know, from the analysis of the 20th-century climate in the Iberian Peninsula, westerly flow in winter is connected with a higher percentage of extreme precipitation, and cold extremes are associated with the advection of cold air masses from the north (Fernández-Montes et al., 2012). On the other hand, a great part of warm days in spring and summer is related to southern flows (Fernández-Montes et al., 2013). Therefore, although the information yielded by Navarrete is scarce, it seems coherent with climatic observations based on instrumental data in the 20th century.
In this work we have reconstructed the climatic mean conditions of a poorly documented period for Spain (the first third of the 18th century) in Granada (southern Spain) using documentary data. To date, there have been few attempts to reconstruct temperatures in the Iberian Peninsula, due to the scarcity of information (Bullón, 2008). Therefore, this work represents a new contribution to reconstruct historical temperatures in Spain. Results suggest that during 1706–1730, temperatures were very similar to those of the first decades of the 20th century, when the warming signal may be considered very small in comparison with the last decades of the 20th century. This result contrasts with the analysis by Taborda et al. (2004) on southern Portugal, where the two first decades of the 18th century were very cold. A possible explanation may be the variation in climate conditions from west to east in the southern Iberian Peninsula. The climate of Granada is characterized by a diminishing of the Atlantic mechanisms that affect the southwestern Iberian Peninsula and a strengthening influence of the Mediterranean mechanisms. The convenience of distinguishing between western and eastern stations (particularly in winter) has been highlighted in a previous work (Rodrigo, 2018b). We must note that the period 1706–1730 is immediately subsequent to the coldest years of the Maunder Minimum in central and northern Europe. Luterbacher et al. (2004, 2007) and Xoplaki et al. (2005) found a warming trend in European winter and spring temperatures from the late Maunder Minimum, culminating in the late 1730s. On the other hand, the mean value of the autumn temperature in central England between 1729 and 1738 was 10.5 ∘C, equal to that recorded during 1991–2000 (Jones and Briffa, 2006). Warming from the markedly cold decade of the 1690s to the 1730s is probably due to the scarcity of major explosive volcanic eruptions from the early 1700s compared to the previous two decades (Jones and Briffa, 2006). It is an open question whether there were differences between southern and northern Europe, but our results suggest that temperature trends in Granada were similar to those of central and northern Europe.
In relation to rainfall, there are no clear differences between periods, except in spring of 1976–2000, when there were drier conditions than in the past. According to dendroclimatological studies (Manrique and Fernández-Cancio, 2000), the main phase of the Little Ice Age in Spain corresponds to the 16th and 17th centuries, with a high variability. This high variability has also been recorded from dendroclimatological studies covering the whole Mediterranean Basin (Nicault et al., 2008). According to these analyses, the 18th century marks the beginning of a period with more stable conditions. This result has also been found by Spanish climate historians (Font Tullot, 1988; Alberola Romá, 2014). Therefore, the Little Ice Age was not a continuous and homogeneous cold and wet period in southern Spain, but it was characterized by the alternation of different phases, and the first third of the 18th century would correspond to a more stable phase.
We have retrieved a new early meteorological data series, from December 1728 to February 1730, probably the first instrumental series measured in Spain. Although the series and metadata are not complete, it has been possible to calibrate the scale defined by the author and convert temperature values to Celsius degrees. Applying Eq. (4) we calculate that (“maximum cold” recorded) is equivalent to ∘C and (“maximum heat” recorded) to 32±3 ∘C. The value (recorded on 1 July 1729 at the afternoon and with the thermometer exposed to solar radiation) would be equivalent to 45±2 ∘C. These values are plausible: “maximum cold” (obtained when thermometer is in a bath of snow with salt ammoniac) must correspond to a temperature below 0 ∘C (due to the freezing-point depression of a salt solution), the mean value of daily maximum temperatures in July is 32.7±0.1 ∘C, and the absolute daily maximum temperature is 40.9±0.1 ∘C during the reference period 1906–1930. Additionally, the estimation of monthly mean values of temperature is in a good agreement with qualitative comments made by Navarrete in chap. XVI, where he describes winter 1729, autumn 1729, and winter 1730 as cold seasons and spring 1730 as a warm season, and he does not indicate particular conditions for summer 1730, which, in consequence, it may be regarded as a “normal” season. Other variables (surface atmospheric pressure, rainfall, wind direction) are presented in a qualitative way, but they allow inferences in relation to atmospheric circulation at certain times within the brief period described by the author.
As a result of this work, some conclusions can be obtained.
-
Seasonal temperature and rainfall during the period 1706–1730 were very similar to those in the 1906–1930 period, at the beginning of the 20th century, when the global warming signal was of less importance. The first decades of the 18th century can be characterized as a period of transition to a new phase after the coldest years of the Maunder Minimum period.
-
Some important extreme events were detected, such as the drought in the first half of the 1720s and the cold wave during winter 1729.
-
The original temperature scale was calibrated and converted to the Celsius scale, obtaining plausible values, which, at daily and monthly timescales, allow us to characterize the annual cycle of temperature in 1729.
-
The reconstruction agrees with independent reconstructions of past climates, in particular, the sea level pressure field in western Europe.
-
More research is needed to complete our view on past climate conditions. In particular, it is hoped that more daily instrumental observations and weather registers may eventually come to light. The enlargement of databases, and the study of documentary data and early instrumental data, may contribute to the knowledge of natural climate variability and, therefore, to the understanding of climate processes.
Data are available at http://hdl.handle.net/10835/6248 (Rodrigo, 2018a).
The author declares that there is no conflict of interest.
The author wishes to express his gratitude to the anonymous referees for their useful comments.
This paper was edited by Chantal Camenisch and reviewed by two anonymous referees.
ACAF: Archivo Capitular de Arcos de la Frontera, in: Libro Capitular y Cabildo, Rogativa a Na Sa de las Nieves, Arcos de la Frontera, 1723.
AHVM: Archivo de la Hermandad de la Virgen de la Merced, Rogativas a la Virgen de la Merced, Jerez de la Frontera, 1722.
Alberola Romá, A.: Los Cambios Climáticos. La Pequeña edad de Hielo en España, Cátedra, Madrid, España, 341 pp. 2014.
Alcoforado, M. J., Vaquero, J. M., Trigo, R. M., and Taborda, J. P.: Early Portuguese meteorological measurements (18th century), Clim. Past, 8, 353–371, https://doi.org/10.5194/cp-8-353-2012, 2012.
Anduaga Egaña, A.: Meteorología, Ideología y Sociedad en la España comtemporánea, Consejo Superior de Investigaciones Científicas, Madrid, España, 450 pp., 2012.
Barriendos, M., Ruiz-Bellet, J. L., Tuset, J., Mazón, J., Balasch, J. C., Pino, D., and Ayala, J. L.: The “Prediflood” database of historical floods in Catalonia (NE Iberian Peninsula) AD 1035–2013, and its potential applications in flood analysis, Hydrol. Earth Syst. Sci., 18, 4807–4823, https://doi.org/10.5194/hess-18-4807-2014, 2014.
Brázdil, R., Pfister, C., Wanner, H., von Storch, H., and Luterbacher, J.: Historical climatology in Europe – the state of the art, Climatic Change, 70, 363–430, https://doi.org/10.1007/S10584-005-5924-1, 2005.
Brázdil, R., Kiss, A., Luterbacher, J., and Valásek, H.: Weather patterns in eastern Slovakia 1717–1730, based on records from the Breslau meteorological network, Int. J. Climatol., 28, 1639–1651, https://doi.org/10.1002/joc.1667, 2008.
Brázdil, R., Dobrovolný, P., Luterbacher, J., Moberg, A., Pfister, C., Wheeler, D., and Zorita, E.: European climate of the past 500 years: new challenges for historical climatology, Climatic Change, 101, 7–40, 2010.
Brönnimann, S., Brugnara, Y., Allan, R. J., Brunyet, M., Compo, G. P., Crouthamel, R. I., Jones, P. D., Jourdain, S., Luterbacher, J., Siegmund, P., Valente, M. A., and Wilkinson, C. W.: A roadmap to climate data rescue services, Geosci. Data J., 5, 28–39, 2018.
Brunet, M., Saladié, O., Jones, P., Sigró, J., Aguilar, E., Moberg, A., Lister, D., Walther, A, Lopez, D., and Almarza, C.: The development of a new dataset of Spanish daily adjusted temperature series (SDATS) (1850–2003), Int. J. Climatol., 26, 1777–1802, 2006.
Bullón, T.: Winter temperatures in the second half of the sixteenth century in the central area of the Iberian Peninsula, Clim. Past, 4, 357–367, https://doi.org/10.5194/cp-4-357-2008, 2008.
Camuffo, D.: Calibration and instrumental errors in early measurements of air temperature, Climatic Change, 53, 297–329, https://doi.org/10.1023/A:1014914707832, 2002.
Demareé, G. R.: The neo-hippocratic hypothesis – an integrated 18th century view on medicine, climate and environment, Zeszyty Naukowe Uniwersutetu Jagiellonskiego, MCLXXXVI, Prace Geograficzne, Zeszyt, 102, 515–518, 1996.
Domínguez-Castro, F., García-Herrera, R., Ribera, P., and Barriendos, M.: A shift in the spatial pattern of Iberian droughts during the 17th century, Clim. Past, 6, 553–563, https://doi.org/10.5194/cp-6-553-2010, 2010.
Domínguez-Castro, F., Trigo, R. M., and Vaquero, J. M.: The first meteorological measurements in the Iberian Peninsula: evaluationg the storm of November 1724, Climatic Change, 118, 443–455, https://doi.org/10.1007/s10584-012-0628-9, 2013.
Domínguez-Castro, F., Vaquero, J. M., Rodrigo, F. S., Farrona, M. M., Gallego, M. C., García-Herrera, R., Barriendos, M., and Sánchez-Lorenzo, A.: Early Spanish Meteorological records (1780–1850), Int. J. Climatol., 34, 593–603, https://doi.org/10.1002/joc.3709, 2014.
Fahrenheit, D. G.: Experimenta & observationes de congelatione aquæ in vacuo factæ, Philosophical Transactions, 1724, 78–84, 1724.
Fernández-Montes, S., Seubert, S., Rodrigo, F. S., and Hertig, E.: Wintertime circulation types over the Iberian Peninsula: long-term variability and relationships with weather extremes, Clim. Res., 53, 205–227, https://doi.org/10.3354/cr01095, 2012.
Fernández-Montes, S., Rodrigo, F. S., Seubert, S., and Sousa, P. M.: Spring and summer extreme temperatures in Iberia during last century in relation to circulation types, Atmos. Res., 127, 154–177, https://doi.org/10.1016/j.atmosres.2012.07.013, 2013.
Font Tullot, I.: Historia del clima de España, Instituto nacional de Meteorología, Madrid, España, 297 pp., 1988 (in Spanish).
Fragoso, M., Marques, D., Santos, J. A., Alcoforado, M. J., Amorim, I., García, J. C., Silva, L., and Nunes, M. F.: Climatic extremes in Portugal in the 1780s based on documentary and instrumental records, Clim. Res., 66, 151–159, https://doi.org/10.3354/cr01337, 2015.
Gil Albarracín, A. (Ed.): Francisco Fernández Navarrete 1732. Cielo y suelo granadino (transcripción, edición, estudio e índices), GBGeditora, Almería-Barcelona, 1997.
Giorgi, F.: Climate Change hot-spots, Geophys. Res. Lett., 33, 217–222, 2006.
Guijarro, V.: El barómetro y los proyectos meteorológicos de la Ilustración: el caso español, ENDOXA Series Filosóficas, 19, 159–190, 2005.
INM: Guía resumida del Clima en España 1971–2000, Instituto Nacional de Meteorología, Madrid, 257 pp., 2004.
Jones, P. D. and Briffa, K. R.: Unsual climate in northwest Europe during the period 1730 to 1745 based on instrumental and documentary data, Climatic Change, 79, 361–379, 2006.
Luna, M. Y., Guijarro, J. A., and López, J. A.: A monthly precipitation database for Spain (1851–2008): reconstruction, homogeneity and trends, Adv. Sci. Res., 8, 1–4, https://doi.org/10.5194/asr-8-1-2012, 2012.
Luterbacher, J., Xoplaki, E., Dietrich, D., Rickli, R., Jacobeit, J., Beck, C., Gyalistras, D., Schmutz, C., and Wanner, H.: Reconstruction of sea level pressure fields over the Eastern North Atlantic and Europe back to 1500, Clim. Dynam., 18, 545–561, https://doi.org/10.1007/s00382-001-0196-6, 2002.
Luterbacher, J., Dietrich, D., Xoplaki, E., Grosjean, M., and Wanner, H.: European seasonal and annual temperature variability, trends and extremes since 1500, Science, 303, 1499–1503, https://doi.org/10.1126/science.1093877, 2004.
Luterbacher, J., Liniger, M. A., Menzel, A., Estrella, N., Della-Marta, P. M., Pfister, C., Rutishauser, T., and Xoplaki, E.: The exceptional European warmth of autumn 2006 and winter 2007: Historical context, the underlying dynamics and its phenological impact, Geophys. Res. Lett., 34, L12704, https://doi.org/10.1029/2007GL029951, 2007.
Manrique, E. and Fernández-Cancio, A.: Extreme climatic events in dendroclimatic reconstructions from Spain, Climatic Change, 44, 123–138, 2000.
Navarrete, F. F.: Cielo y suelo Granadino. Idea de la Historia Natural de Granada en varias observaciones Físicas, Médicas y Botánicas, Biblioteca y Archivo de la Provincia Franciscana de Cataluña, Barcelona, Ms. 1/E/8, 1732.
Navarrete, F. F.: Efemérides barométrico-médicas matritenses, Biblioteca de la Universidad de Sevilla, sgn: 110-57, available at: http://fondosdigitales.us.es (last access: 28 March 2019), 1737.
Nicault, A., Alleaume, S., Brewer, S., Carrer, M., Nola, P., and Guiot, J.: Mediterranean drought fluctuation during the last 500 years based on tree-ring data, Clim. Dynam., 31, 227–245, https://doi.org/10.1007/s00382-007-0349-3, 2008.
Owens, M. J., Lockwood, M., Hawkins, E., Usoskin, I., Jones, G. S., Barnard, L., Schurer, A., and Fasullo, J.: The Maunder Minimum and the Little Ice Age: an update from recent recosntructions and climate simulations, J. Space Weather Spac., 7, A33, https://doi.org/10.1051/swsc/2017034, 2017.
Rodrigo, F. S.: A new method to reconstruct low-frequency climatic variability from documentary sources: application to winter rainfall series in Andalusia (southern Spain) from 1501 to 2000, Climatic Change, 87, 471–487, 2008.
Rodrigo, F. S.: Afecciones meteorológicas: Medicina y Meteorología en Andalucía 1754–1852, Obradoiro de Historia Moderna, 25, 95–113, https://doi.org/10.15304/ohm.25.2944, 2016.
Rodrigo, F. S.: Meteorological observations in Granada 1706–1730, Data Repository, University of Almería, Spain, http://hdl.handle.net/10835/6248 (last access: 28 March 2019), 2018a.
Rodrigo, F. S.: A review of the Little Ice Age in Andalusia (southern Spain): results and research challengues, Geographical Research Letters, 44, 245–265, https://doi.org/10.18172/cig.3316, 2018b.
Rodrigo, F. S., Gómez-Navarro, J. J., and Montávez Gómez, J. P.: Climate variability in Andalusia (southern Spain) during the period 1701–1850 based on documentary sources: evaluation and comparison with climate model simulations, Clim. Past, 8, 117–133, https://doi.org/10.5194/cp-8-117-2012, 2012.
Rutherford, S., Mann, M. E., and Osborn, T. J.: Proxy-based Northern Hemisphere surface temperature reconstructions: sensitivity to method, predictor network, target season, and target domain, J. Climate, 18, 2308–2329, 2005.
Taborda, J. P., Alcoforado, M. J., and García, J. C.: The climate of southern Portugal during the 18th century: a reconstruction based on descriptive and instrumental sources, in: Geoecologia, Rel. 2, Centro de Estudios Geográficos, Lisboa, 2004.
Vittori, O. and Mestitz, A.: Calibration of the “Florentine Little Thermometer”, Endeavour, 5, 113–118, 1981.
Wheeler, D.: Early instrumental weather data from Cádiz: a study of late eighteenth and early nineteenth century records, Int. J. Climatol., 15, 801–810, https://doi.org/10.1002/joc.3370150707, 1995.
Wilks, D. S.: Statistical methods in the atmospheric sciences, Academic Press, San Diego, USA, 464 pp., 1995.
Xoplaki, E., Luterbacher, J., Paeth, H., Dietrich, D., Steiner, N., Grosjean, M., and Wanner, H.: European spring and autumn temperature variability and change of extremes over the last half millenium, Geophys. Res. Lett., 32, L15713, https://doi.org/10.1029/2005GL023424, 2005.
Zhang, X., Hegerl, G., Zwiers, F. W., and Kenyon, J.: Avoiding Inhomegeneity in Percentile-based Indices of Temperature Extremes, J. Climate, 18, 1641–1651, 2005.
Zúñiga, B. L.: Anales eclesiásticos y seglares de la M.N. y M.L. ciudad de Sevilla: que comprenden la Olimpiada ó Lustro de la Corte en ella; con dos Apéndices, uno desde el año de 1671 hasta el de 1728, y otro desde 1734 hasta el de 1746, Biblioteca de Andalucía, Spain, Sgn.: ANT-XVIII-470, 1747.