the Creative Commons Attribution 4.0 License.
the Creative Commons Attribution 4.0 License.
Understanding the Australian Monsoon change during the Last Glacial Maximum with a multi-model ensemble
Bin Wang
Axing Zhu
Liang Ning
Jian Cao
The response of the Australian monsoon to external forcings and related mechanisms during the Last Glacial Maximum (LGM) are investigated by multi-model experiments in CMIP5–PMIP3. Although the annual mean precipitation over the Australian monsoon region decreases, the annual range, or the monsoonality, is enhanced. The precipitation increases in early austral summer and decreases in austral winter, resulting in the amplified annual range, but the main contribution comes from the decreased precipitation in austral winter. The decreased winter precipitation is primarily caused by weakened upward motion, although reduced water vapor also has a moderate contribution. The weakened upward motion is induced by the enhanced land–sea thermal contrast, which intensifies the divergence over northern Australia. The increased Australian monsoon rainfall in early summer, however, is an integrated result of the positive effect of local dynamic processes (enhanced moisture convergence) and the negative effect of thermodynamics (reduced moisture content). The enhanced moisture convergence is caused by two factors: the strengthened northwest–southeast thermal contrast between the cooler Indochina–western Indonesia and the warmer northeastern Australia, and the east–west sea surface temperature gradients between the warmer western Pacific and cooler eastern Indian Ocean, both due to the alteration of land–sea configuration arising from the sea level drop. The enhanced Australian monsoonality in the LGM is not associated with global-scale circulation change such as the shift of the Intertropical Convergence Zone; rather, it is mainly due to the change of regional circulations around Australia arising from the changes in land–sea contrast and the east–west SST gradients over the Indian and western Pacific oceans. This finding should be taken into account when investigating its future change under global warming. Our findings may also explain why proxy records indicate different changes in Australian monsoon precipitation during the LGM.
- Article
(15791 KB) - Full-text XML
-
Supplement
(1648 KB) - BibTeX
- EndNote
The changes of the Australian monsoon are crucial for human society and ecology in Australia (Reeves et al., 2013a), considering the socioeconomic importance of monsoon rainfall (Wang et al., 2017). As the monsoons of the summer hemisphere are linked via outflows from the opposing winter hemisphere, the Australian monsoon can also influence the Asian–Indonesian–Australian monsoon system (Eroglu et al., 2016). It is important to understand how and why the Australian monsoon would change in response to global climate change.
With strong climatic forcings (including low greenhouse gas (GHG) concentrations, large ice sheets, and low sea level, etc.), the Last Glacial Maximum (LGM) is one of the key periods that provides an opportunity to better understand the mechanisms of how global and regional climate respond to external forcings (Hewitt et al., 2001; Braconnot et al., 2007, 2012a; Harrison et al., 2014). Previous studies have investigated how the external forcings and boundary conditions during the LGM affected the Intertropical Convergence Zone (ITCZ) (Broccoli et al., 2006; Donohoe et al., 2013; McGee et al., 2014), the Walker circulation (DiNezio et al., 2011), the Indo-Pacific climate (Xu et al., 2010; DiNezio and Tierney, 2013; DiNezio et al., 2016), the Southern Hemisphere (SH) circulation (Rojas, 2013), and the global monsoon (Jiang et al., 2015; Yan et al., 2016). The Australian monsoon onset and variability during the post-glacial period, the late deglaciation period, and the Holocene have also been studied using proxy datasets (Ayliffe et al., 2013; De Deckker et al., 2014; Kuhnt et al., 2015; Bayon et al., 2017). However, due to the limitation of the scarce proxy datasets, the Australian monsoon change during the LGM is far from being clearly understood.
There are different proxy evidences indicating different Australian monsoon change during the LGM. Here, the Australian monsoon intensity is represented by the seasonality of precipitation, i.e., a stronger monsoon means a wetter summer and/or drier winter. Some records show wet conditions over Australia during the LGM (Ayliffe et al., 2013), while other proxies indicate drier conditions (Denniston et al., 2013, 2017; DiNezio and Tierney, 2013). The isotopes from eggshells of five regions across Australia affirm that Australia becomes drier during the LGM (Miller et al., 2016), while the archaeological record showed a refugia-type hunter–gatherer response over northwest and northeast Australia during the LGM (Williams et al., 2013), indicating that these areas might have had a wetter summer and were therefore preferred by people as refugia. The synthesis by the OZ-INTIMATE (Australian INTIMATE “Integration of ice core, marine and terrestrial records”) project (Turney et al., 2006; Petherick et al., 2013) showed that the paleoenvironment over northern Australia during the LGM was characterized by drier conditions, although wet periods were also noted in the fluvial records (Reeves et al., 2013a, b).
The change in the Australian monsoon was inconclusive during the LGM based on proxy data. Therefore, scholars started investigating the Australian monsoon change from numerical simulation perspectives. The sensitivity of the Australian monsoon to forcings during the late Quaternary has been analyzed using simulations by the Fast Ocean Atmosphere Model (Marshall and Lynch, 2006, 2008). Numerical experiments have been conducted to analyze the impacts of obliquity and precession with a coupled general circulation model (Wyrwoll et al., 2007) and orbital timescale circulation with Community Climate System Model (Wyrwoll et al., 2012) on the Australian monsoon. However, different models may have different responses to the same external forcings, such that the simulated results may have model dependence. A multi-model ensemble (MME) can reduce the model biases and therefore provide more reasonable results of how and why a climate system responds to the external forcing changes. The MME can also provide a clearer perspective on model uncertainties.
Yan et al. (2016) thus used the multi-model ensemble approach to examine the response of global monsoons to the LGM conditions. It was found that the global monsoon and most sub-monsoons weakened under the LGM conditions. A brief hypothesis was made to explain the changes from global and hemispheric perspectives. The Australian monsoon was thought to be strengthened due to the southward shift of the ITCZ resulting from the hemispheric thermal contrast and due to the land–sea thermal contrast resulting from the land configuration. However, this simulated result of strengthened monsoon or wet conditions has not been proven yet. As mentioned above, it is inconclusive whether the Australian monsoon is strengthened or not during the LGM due to the limitations of proxies' and models' uncertainties. Neither model outputs nor proxy records provide a “true” record of the LGM, as proxy records require interpretation and calibration and may be spatially incomplete, while models contain biases. Therefore, model–data and inter-model comparisons are needed and studies on the mechanisms are required to better understand the Australian monsoon change during the LGM. Moreover, some studies show that the Australian climate during the last glacial period was modulated by additional mechanisms rather than simply the ITCZ (Bayon et al., 2017). Thus, single forcing runs are also required to figure out the contributions of different forcings.
This paper investigates the Australian monsoon change during the LGM and its mechanisms from both thermodynamics and dynamics perspectives, using the multi-model ensemble mean derived from models in the fifth phase of the Coupled Model Intercomparison Project (CMIP5) (Taylor et al., 2012) and the third phase of the Paleoclimate Modeling Intercomparison Project (PMIP3) (Braconnot et al., 2012a, b). We also try to quantify the contributions of the thermodynamic and the dynamic processes to the Australian monsoon change during the LGM. Additionally, we apply a single forcing run to test the effect of land configuration as mentioned in Yan et al. (2016). The models and experiments used in this paper are introduced in Sect. 2. Section 3 describes simulated results and the physical mechanisms. The comparison with proxies and other simulations is discussed in Sect. 4 and the conclusions are made in Sect. 5.
2.1 CMIP5–PMIP3 models and experiments
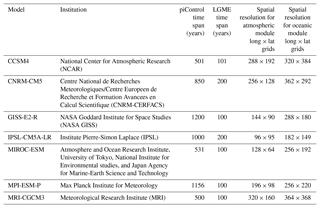
Two experiments performed by models participating in CMIP5–PMIP3 are compared in this paper: the Last Glacial Maximum experiment (LGME) and the preindustrial (PI) control run (piControl). The models and experiments are listed in Table 1, including seven models and two experiments.
The last 100 years of the LGME and the last 500 years of piControl from each model are used to calculate the model climatology. To obtain the MME, the model outputs are interpolated into a fixed 2.5∘ (latitude) × 2.5∘ (longitude) grid using the bilinear interpolation method.
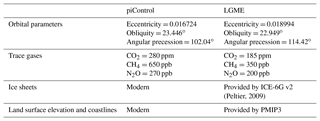
The LGM external forcings and boundary conditions are listed in Table 2. More specific documentation can be found on the PMIP3 website (https://pmip3.lsce.ipsl.fr, last access: February 2017). Compared with the PI period, during the LGM the SH low latitudes (from 30∘ S to the Equator) receive more insolation from January to August and less from August to December. The NH low latitudes (from the Equator to 30∘ N) receive less insolation from June to October and more from November to May (Fig. S1 in the Supplement). Due to the decreased sea level, the landmasses expand during the LGM. A land bridge forms between Indochina and western Indonesia, and the Arafura Sea between New Guinea and Australia is closed and becomes landmass (Fig. S2).
To illustrate the robust changes simulated by the different models, the signal-to-noise ratio (SNR) test is used. The SNR is defined by the ratio of the absolute mean of the MME (as the signal) to the averaged absolute deviation of the individual model against the MME (as the noise) (Yan et al., 2016). In the following sections, we only consider the areas in which the SNR exceeds one when we examine the differences between the LGME and the piControl derived from the MME.
The models contributed to CMIP5 have been evaluated in previous studies to have better performance than those in the CMIP Phase 3 (CMIP3) in simulating the Australian monsoon precipitation seasonality or seasonal cycle (Jourdain et al., 2013; Brown et al., 2016), which is used to represent the Australian monsoon intensity in this study. However, we need to keep in mind that there are large uncertainties in model simulations, which require careful model–data comparison and inter-model comparison.
2.2 NESM model and experiments
To isolate the impacts of land–sea configuration change, two additional sensitivity experiments are conducted using a newly developed fully coupled Earth system model, the Nanjing University of Information Science and Technology Earth System model version 1 (NESM v1, Cao et al., 2015). One is the piControl run (NESM_PI), using the same PI boundary conditions as the PMIP3 protocol. The other is the land sea configuration sensitivity run (NESM_LSM), using the same PI boundary conditions as the NESM_PI but with the LGM land sea configuration. The two experiments are run for 500 years after spin-up, and the last 100 years are used.
2.3 Decomposition method
For attribution of precipitation changes, we use a simplified relation based on the linearized equation of moisture budget used in the previous works (Chou et al., 2009; Seager et al., 2010; Huang et al., 2013; Endo and Kitoh, 2014; Liu et al., 2016). Considering a quasi-equilibrium state, the vertical integrated moisture conservation can be written as
where q is specific humidity, v is horizontal velocity, p is pressure, P is precipitation, and E is surface evaporation. Since the water vapor is concentrated in the lower troposphere, the vertical integrated total column moisture divergence can be approximately replaced by the integration from the surface to 500 hPa. Define the Δ(.) as the change from PI period to the LGM, i.e.,
Then the precipitation change ΔP can be calculated as follows:
To further simplify the equation, we use −ω500 to represent vertical integrated ∇v and q at the surface to represent vertical integrated specific humidity (Huang et al., 2013). Thus, the precipitation change (ΔP) can be represented as
where is 500 hPa vertical velocity in the PI period, is surface specific humidity in the PI period and ΔTadv is the changes due to the moisture advection .
The first term in the right-hand side of Eq. (4) () represents thermodynamic effect (due to the change of q), and the second term () represents dynamic effect (due to the change of circulation).
2.4 Monsoon domain
The monsoon domain is defined following the hydroclimate definition, i.e., a contrast between wet summer and dry winter (Wang and Ding, 2008). The monsoon domain is defined by the area where the annual range (local summer minus local winter) exceeds 2.0 mm day−1, and the local summer precipitation exceeds 55 % of the annual total precipitation. Here in the SH, summer means November to March and winter means May to September. Since the domains derived from different models are different, and the changes of domain are also different, we use the fixed domain derived from the merged Climate Prediction Center Analysis of Precipitation (CMAP, Xie and Arkin, 1997) and Global Precipitation Climatology Project (GPCP, Huffman et al., 2009) data.
Note that the monsoon domain is shown to give a general view of precipitation change. But the monsoon domain is not the purpose of this study; i.e., the following analyses are not based on the monsoon domain.
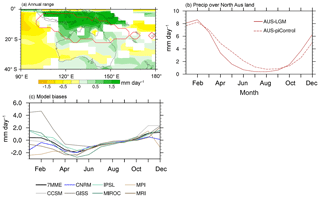
Figure 1(a) Spatial distribution of changes in the annual range (AR) of precipitation measured by the difference between LGME and piControl, (b) seasonal distribution of the precipitation in the increased AR area (20–5∘ S, 120–145∘ E), and (c) seasonal distribution of the precipitation differences in the increased AR area derived from the 7MME (black line) and each model (colored lines). The solid red line in (a) encloses the Australian monsoon rainfall domain. The dashed (solid) line in (b) denotes the seasonal distribution of precipitation derived from the piControl (LGME) run. Only those areas where the signal-to-noise ratio exceeds 1 are plotted in (a).
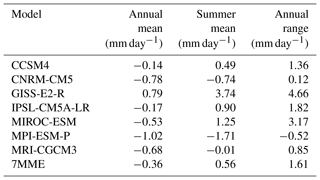
We define the difference of precipitation rate between austral summer (DJF) and austral winter (JJA) as the annual range, i.e., the seasonality, to measure the monsoonality of the Australian monsoon. An increased annual range (or seasonality) means a strengthened monsoonality. Unlike the South African and South American monsoon regions (not shown), the monsoonality of the Australian monsoon derived from the seven models' multi-model ensemble (7MME) is strengthened during the LGM (Fig. 1a). This amplified annual range is the result of increased precipitation in austral summer and decreased precipitation in austral winter (Fig. 1b). Note that the largest decrease in precipitation occurs from April to July (late autumn to early winter), not exactly in austral winter, and the largest increase in precipitation occurs in November and December (ND), i.e., early austral summer. Since the amount of autumn–winter reduction of precipitation exceeds the increased precipitation in early summer, the annual mean precipitation over the strengthened annual range region decreases (by 0.36 mm day−1). In summary, while the total annual precipitation decreases in the LGM, the annual range (or the seasonality) of the Australian monsoon rainfall is amplified due to seasonal redistribution of the precipitation, especially the drying in austral autumn (April–May) and winter (JJA) over Australia.
Although there are model biases, most of the models (except MPI-ESM-P) simulate an enhanced annual range (or seasonality–monsoonality) in the central Australian monsoon region (20–5∘ S, 120–145∘ E) (Table 3 and Fig. 1c). Most of the models (except CNRM-CM5 and MPI-ESM-P) also simulate an increased summer precipitation over that region. All the models simulate decreased precipitation from April to September (Fig. 1c). Conversely, the simulated annual mean precipitation is decreased in most models, except GISS-E2-R. The model uncertainties will be discussed later in Sect. 4.
Table 3Annual mean, austral summer (DJF) mean and annual range of precipitation change over the region of 20–5∘ S, 120–145∘ E. The area averaged value is calculated based on the areas where the signal-to-noise ratio exceeds 1.
3.1 Reasons for the decreased precipitation during the LGM in austral winter (JJA)
During the LGM, the lower GHG concentration and the large ice sheets are the primary causes for the decreased global temperature and humidity. The global surface specific humidity is reduced by 2 g kg−1 (or 20 %) in JJA during the LGM, compared with the PI period. For the SH monsoon regions, the surface specific humidity is reduced more over the Australian monsoon region than over the other two monsoon regions of South Africa and South America (Fig. 2).
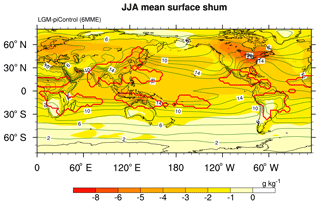
Figure 2Difference of JJA mean surface specific humidity between LGME and piControl (shaded). The green contours denote the climatology derived from piControl. The red lines enclose the monsoon domains. Only those areas where the signal-to-noise ratio exceeds 1 are plotted.
As suggested by the Clausius–Clapeyron relation (C–C relation), 1∘ of temperature decrease would lead to about a 7 % decrease in the saturation water vapor (Held and Soden, 2006), or roughly the same scale of decrease in the low tropospheric specific humidity. If the circulation, evaporation and advection remain unchanged, the precipitation should also be reduced by 7 % with regard to Eq. (4). During the LGM, the simulated near-surface air temperature over the central Australian monsoon region (20–5∘ S, 120–145∘ E) decreases significantly by 2.5 K in JJA, which implies a decreased precipitation of about 17 % resulting from the C–C relation. However, the simulated precipitation in the LGM is reduced by 1.45 mm day−1 or 44 % compared to the PI period, which is far beyond the value suggested by the thermodynamic effect (approximately 17 %). This suggests that the majority of the reduction in winter precipitation is due to the changes in the rest of the terms in Eq. (4), including the circulation change (dynamics), the evaporation change and the change due to the advection term. The changes of each term show that the circulation change plays a dominant role in the precipitation change over Australia (Fig. S3). The change due to the evaporation is also important. The change due to the advection term is negligible.
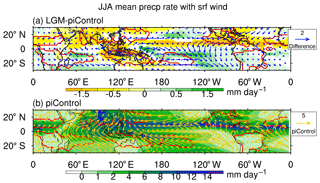
Figure 3(a) JJA mean precipitation (shading) difference and surface wind (vectors) difference between LGME and piControl, and (b) the climatology of JJA mean precipitation (shading) and surface wind (vectors) derived from piControl. The red lines enclose the monsoon domains. The thick black lines in (a) denote the coastal lines in LGME provided by CMIP5–PMIP3, and the thin black lines denote the coastal lines in piControl. Only those areas where the signal-to-noise ratio exceeds 1 are plotted in (a).
The change of the surface wind field shows a strengthened divergence pattern over the Australian monsoon region (Fig. 3a, vector), which is consistent with the strengthened descending flow over the Australian monsoon region (Fig. 4) and thus the reduced precipitation (Fig. 3a, shading). The JJA mean near-surface air temperature shows that the land is cooler than the adjacent ocean around northern Australia (Fig. 5a), which illustrates a strengthened land–sea thermal contrast because the land cools more than the ocean surface during the LGM. This strengthened land–sea thermal contrast leads to a higher sea level pressure (SLP) over land and lower SLP over ocean in general (Fig. 5b, shading), and thus the air outflows from the land (Fig. 5b, vector). The geopotential height at 850 hPa also shows the relative pattern that matches the wind change (Fig. S4a). The difference of divergence–convergence field (Fig. 5c) also indicates that the divergence at 850 hPa over northern Australia is strengthened during the LGM. The vertical velocity at 500 hPa over the central Australian monsoon region (20–5∘ S, 120–145∘ E) illustrates that the descending flow strengthened by about 48 %.

Figure 4The difference of JJA mean vertical velocity at 500 hPa between LGME and piControl (in shading) and the corresponding climatology derived from piControl (yellow contours). The thick black lines denote the coastal lines in LGME provided by CMIP5–PMIP3, and the thin black lines denote the coastal lines in piControl. Only those areas where the signal-to-noise ratio exceeds 1 are plotted in the difference pattern.
In conclusion, both the dynamic process (increased subsidence) and the thermodynamic process (reduced water vapor content) contribute to the drier winter in the Australian monsoon region, but the local dynamic process plays a dominant role in the reduction of Australian winter precipitation.
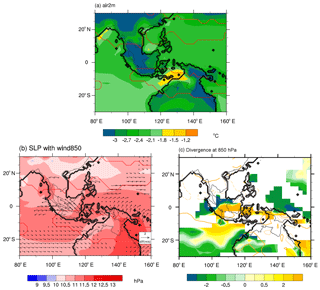
Figure 5JJA mean (a) surface air temperature, (b) sea level pressure (shading) with 850 hPa wind (vector), and (c) 850 hPa divergence differences between LGME and piControl. The red lines in (a) and (b) enclose the monsoon domains. The orange lines in (c) represent the climatology derived from piControl. The thick black lines denote the coastal lines in LGME provided by CMIP5–PMIP3, and the thin black lines denote the coastal lines in piControl. Only those areas where the signal-to-noise ratio exceeds 1 are plotted.
3.2 Why the precipitation increased in austral early summer (ND)
During ND, the LGM minus PI surface wind difference field shows a strengthened convergence pattern over the central northern Australian monsoon region (Fig. 6a, vector), which is consistent with the increased precipitation (Fig. 6a, shading). The vertical velocity at 500 hPa also shows a strengthened ascending flow over this area (Fig. 7). The increased precipitation over the central Australian monsoon region is clearly against the thermodynamic effects of the low GHG concentration and the presence of the ice sheets, which tend to reduce the precipitation. The 2 m air temperature is decreased by 2.2 K and the surface specific humidity is reduced by 2.6 g kg−1 (or 16.0 %) over the Australian monsoon region (Fig. 8). The precipitation would decrease by 15.4 % according to the thermodynamic effect without the circulation change. However, the precipitation over the Australian monsoon region is increased by about 13.0 %. Therefore, the changes in dynamic processes must induce a 29 % increase in precipitation, so that the net increase in precipitation reaches 13 %.
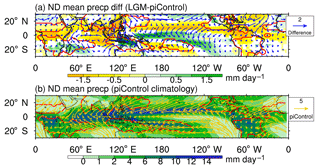
Figure 6(a) ND mean precipitation (shading) difference and surface wind (vectors) difference between LGME and piControl, and (b) the climatology of ND mean precipitation (shading) and surface wind (vectors) derived from piControl. The red lines enclose the monsoon domains. The thick black lines in (a) denote the coastal lines in LGME provided by CMIP5–PMIP3, and the thin black lines denote the coastal lines in piControl. Only those areas where the signal-to-noise ratio exceeds 1 are plotted in (a).
There is a cyclonic wind anomaly associated with an anomalous low pressure over northwest Australia (Figs. 6a and 9b, vector), accompanied by a strengthened low-level convergence (Fig. 9c), which favors increased precipitation in the Australian monsoon region. The change of the moisture transport (moisture flux) also indicates increased moisture transport into northern Australia (not shown). The cyclonic vorticity in northwest Australia is partially caused by the enhanced strong low-level westerlies that prevail north of Australia.
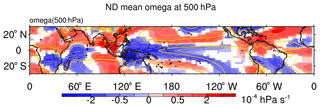
Figure 7The difference of the ND mean vertical velocity at 500 hPa between LGME and piControl (in shading) and the corresponding climatology derived from piControl (yellow contours). The thick black lines denote the coastal lines in LGME provided by CMIP5–PMIP3, and the thin black lines denote the coastal lines in piControl. Only those areas where the signal-to-noise ratio exceeds 1 are plotted in the difference pattern.
We now seek to determine why there is a strengthened low-level westerly with a maximum over the north of Australia. We first consider the temperature change. The ND mean 2 m air temperature during the LGM shows that the two enlarged landmasses over the Indo-Pacific warm pool region (resulting from the lower sea level) change differently (Fig. 9a). It is cooler over the northwest landmass (western Indonesia–Indochina) and relatively warmer over the southeast landmass (eastern Indonesia–northern Australia). This temperature variation forms a southeast–northwest temperature gradient (Figs. 9a and S5a, b), accompanied by a northwest–southeast SLP gradient (Figs. 9b and S5c, d). The northwest–southeast pressure gradient is stronger in the geopotential height change at 850 hPa (Fig. S4b). The high pressure in the western Indonesia–Indochina is a part of the larger-scale enhanced winter monsoon over the South China Sea. This enhanced winter monsoon flows across the Equator from the NH to the SH and turns into strong westerlies due to deflection induced by the Coriolis force. The 850 hPa convergence strengthens over the Australian monsoon region (Fig. 9c), and the corresponding ascending motion at 500 hPa also increases over the Australian monsoon region.
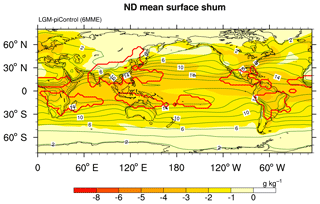
Figure 8Difference of ND mean surface specific humidity between LGME and piControl (shaded). The green contours denote the climatology derived from piControl. The red lines enclose the monsoon domains. Only those areas where the signal-to-noise ratio exceeds 1 are plotted.
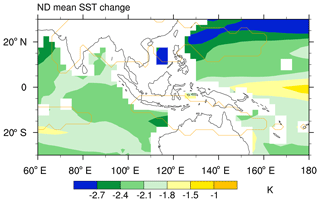
Another reason for circulation change is the sea surface temperature (SST) gradient change. The SST anomaly in ND shows a warmer western Pacific and cooler eastern Indian Ocean pattern (Fig. 10), indicating a westward temperature gradient (Fig. S5e), and thus an eastward pressure gradient, which, in the equatorial region, can directly enhance westerly winds near the northern Australian monsoon region (Fig. 9b). Li et al. (2012) also found that a cold state of the Wharton Basin (100∘ E, 20–5∘ S) was accompanied by anomalous westerlies and cyclonic circulation anomalies in the Australian monsoon region, which were associated with a strong tropical Australian summer monsoon and enhanced rainfall over northeast Australia.
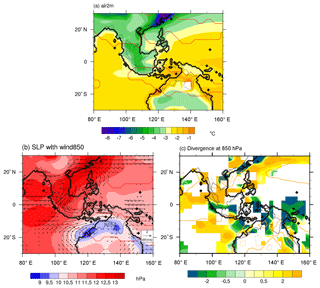
Figure 9ND mean (a) surface air temperature, (b) sea level pressure (shading) with 850 hPa wind (vector), and (c) 850 hPa divergence difference between LGME and piControl (shading). The red lines in (a) and (b) enclose the monsoon domains. The orange lines in (c) represent the climatology derived from piControl. The thick black lines denote the coastal lines in LGME provided by CMIP5–PMIP3, and the thin black lines denote the coastal lines in piControl. Only those areas where the signal-to-noise ratio exceeds 1 are plotted.
In summary, during ND, the enlarged land area due to sea level drop enhances the land–sea thermal contrast and forms a northwest–southeast thermal contrast that induces low pressure over northern Australia but high pressure over the adjacent ocean and Indochina–western Indonesia, leading to the enhanced convergence over northern Australia and thus the increased early summer monsoon rainfall. The SST gradients between the warm equatorial western Pacific and the relatively cool eastern Indian Ocean during the pre-summer monsoon season also contribute to the strengthened equatorial westerlies and the cyclonic wind anomaly over northern Australia. These dynamic mechanisms have a positive contribution to the early summer precipitation. The thermodynamic effects have a negative contribution to the precipitation change, but with smaller magnitude. Therefore, the early summer precipitation over northern Australia increases. We can also tell from the changes of the decomposed terms that the dynamics plays a much more important role in the precipitation change over Australia, especially the distribution pattern (Fig. S6). The impacts of evaporation and advection terms are small.
The intensification of the Australian monsoon in this study is measured by the enhanced seasonal difference (or the seasonality) of precipitation and is particularly attributed to the decreased austral winter precipitation. This is consistent with the reconstructed results by Mohtadi et al. (2011), which indicated that it was not significantly drier in austral summer during the LGM, while the winter monsoon was as weak as the modern period. However, the annual mean precipitation is decreased, which means the Australian monsoon would be weakened during the LGM when it is measured by the annual mean precipitation. The modeling study by DiNezio and Tierney (2013) suggested decreasing rainfall across northern Australia during the LGM, consistent with the proxy synthesis by stalagmite (Denniston et al., 2017). The decreased rainfall in their work represents the annual mean precipitation, which is also consistent with our work. Conversely, the increased rainfall in austral summer in this study is consistent with what has been revealed in the reconstructed work by Liu et al. (2015), which found intense austral summer precipitation over Papua New Guinea and North Australia in the LGM. The decreased annual mean precipitation and the intensified seasonality of precipitation over the Australian monsoon region are in agreement with the synthesis from the simulated result by Tharammal et al. (2013) using a set of experiments.
For the forcings and mechanisms of the Australian monsoon change during the LGM, there are large changes in four external forcings during the LGM, including the insolation change resulting from the orbital change, the land–sea configuration change, the GHG change and the presence of ice sheets. The lower GHG concentrations and the presence of ice sheets are likely to be contributors to the thermodynamic effect leading to the reduced water vapor and thus the decreased rainfall in both austral winter and early summer. The enlarged landmasses over western Indonesia and northeastern Australia are essential to the local dynamic processes that influence the rainfall. The low obliquity and high precession during the LGM may be other factors that can affect the rainfall (Liu et al., 2015). However, the impact of the insolation change caused by the orbital change remains unknown.
During the LGM, the insolation over the tropical region increases from December to June and decreases from July to November relative to the present day (Fig. 11a). In the annual variation, the precipitation responds to the lower tropospheric moisture convergence. The moisture change depends on the temperature change while the circulation change depends on the surface temperature gradient change. The change of the surface temperature lags insolation changes because the ocean and land surfaces have heat capacity (thermal inertial). In other words, insolation is a heating rate that equals to temperature change (tendency) but not the temperature itself. Thus the precipitation change would lag the insolation change by about 2 months, due to the ocean–atmosphere interaction without other processes. However, the simulated Australian monsoon precipitation is decreased from March to September and increased from November to February (Fig. 11b), quite different from what it would be (i.e., decrease from September to January and increase from February to August). This indicates that the insolation change might have little effect on the Australian monsoon precipitation. Meanwhile, the insolation over SH is increased during the LGM from April to August, when Australia is in late autumn and winter. An increased insolation might make land warmer than ocean (i.e., cooler land and warmer ocean in winter). However, the simulated surface temperature reduces more over Australia than the adjacent oceans (Fig. 5a). Conversely, the synthesis of Wyrwoll et al. (2007) and Liu et al. (2015) indicates that the strong convergence rain belt (ITCZ) stays in the north during those times with low obliquity and high precession, which is a little more northerly than that in our study. These mean that the effect of orbital change and thus the insolation change might be suppressed by other factors.
Moreover, the paleoclimate records suggested that it was dry and cool in the Indo-Pacific warm pool region during the LGM (Xu et al., 2010). The simulated SST is consistent with the reconstructions. Although in the early austral summer over the Indian Ocean warm pool, it is cooler over the SH, and over the Pacific warm pool, it is cooler over the NH (Fig. S7). Such anomalous SST asymmetry may favor the southward shift of the ITCZ over Australia and the southwest Pacific, which might be related to the enhanced austral summer monsoon precipitation. However, the 7MME shows no significant ITCZ shift during the LGM, particularly over the central Australian monsoon region (Fig. S8). The reconstructions and simulations by McGee et al. (2014) and Mohtadi et al. (2014) also suggested that there was no significant shift of ITCZ position during the LGM.
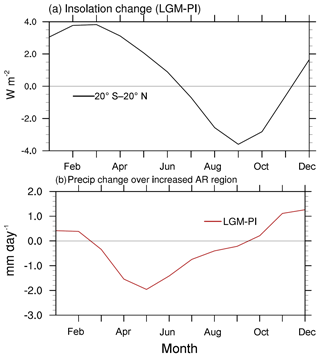
Figure 11Seasonal distribution of (a) insolation change between 20∘ S and 20∘ N and (b) precipitation change over the increased AR region as indicated in Fig. 1b (20–5∘ S, 120–145∘ E). The changes are calculated by the LGM value minus the PI value.
Therefore, it is the local dynamical processes, instead of the large-scale circulation such as the position of the ITCZ induced by the NH–SH thermal contrast, that might be the key factor influencing the early summer mean precipitation change over the Australian monsoon region during the LGM. To test this hypothesis, we compared the results from the two additional runs, the NESM_PI and the NESM_LSM. The changes of the ND mean precipitation and wind field at 1000 hPa between the NESM_LSM and the NESM_PI are similar to the changes derived from the 7MME, i.e., the precipitation is increased and the convergence is strengthened over northern Australia (Fig. 12a). The changes of the 2 m air temperature, SLP and 850 hPa wind field (Fig. 12b and c) are also similar to those results in the 7MME (Fig. 9). It is also cooler over the northwest landmass (western Indonesia–Indochina) and relatively warmer over the southeast landmass (eastern Indonesia–northern Australia) (Fig. 12b). This temperature variation is also accompanied by a northwest–southeast SLP gradient and the strengthened cross-equatorial flow converging to north Australia (Fig. 12c). This sensitivity simulation confirms that the local dynamical processes induced by the land–sea configuration are essential to the Australian monsoonality change.
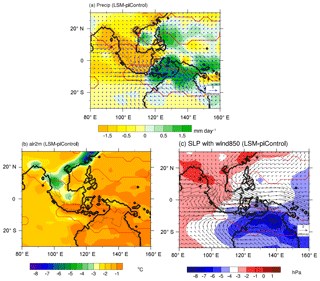
Figure 12ND mean (a) precipitation (shading) with 1000 hPa wind (vector), (b) surface air temperature, and (c) sea level pressure (shading) with an 850 hPa wind (vector) difference between the NESM_LSM and the NESM_PI. The red lines enclose the monsoon domains. The thick black lines denote the coastal lines in NESM_LSM, and the thin black lines denote the coastal lines in NESM_PI.
Although the 7MME simulates a strengthened Australian monsoonality, there are uncertainties among individual models. The most notable uncertainty is the increased austral summer (DJF) precipitation. Five out of the seven models simulate increased DJF mean precipitation over the Australian monsoon region during the LGM (CCSM4, GISS-E2-R, IPSL-CM5A-LR, MIROC-ESM and MRI-CGCM3), while the other two simulate decreased precipitation (CNRM-CM5 and MPI-ESM-P) (Fig. 13), especially over the land area. The wind field at 850hPa geopotential height shows a cyclonic anomaly pattern over northern Australia in the five models (Fig. 14a), accompanied by a strengthened ascending flow (not shown). However, in the other two models, there is no cyclonic wind anomaly over Australia (Fig. 14b), and the ascending flow is weakened (not shown). The different changes of wind field indicate the different precipitation responses to the LGM boundary conditions in the two model groups.
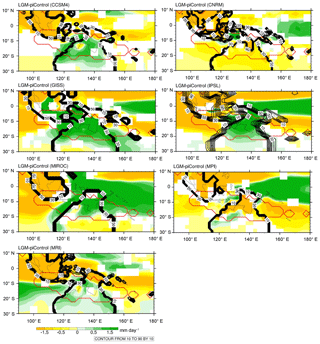
Figure 13DJF mean precipitation differences between LGME and piControl derived from each model. The red lines enclose the monsoon domains. The dark black lines show the land area fraction used for the LGME in each model. Only those areas where the signal-to-noise ratio exceeds 1 are plotted.
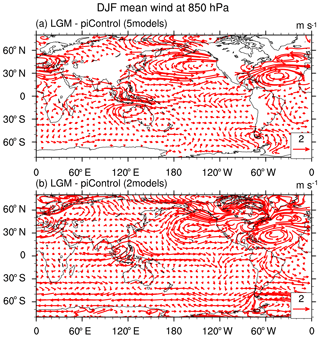
Figure 14DJF mean 850 hPa wind differences between LGME and piControl derived from (a) the five models and (b) the two models. Only those areas where the signal-to-noise ratio exceeds 1 are plotted.
The austral spring and summer mean 2 m air temperature and SST also change differently in these two model groups. The main differences are located over the tropic Pacific Ocean and the North Atlantic Ocean. It is cooler over high-latitude North Atlantic Ocean in the five models, whereas it is warmer in the two models, mainly in the austral spring (Fig. 15a and b). In the austral summer, there is an eastern Pacific El Niño-like patter in the five models, while there is a pattern similar to the central Pacific El Niño (CP-El Niño) in the two models (Fig. 15c and d). Studies have shown that the CP-El Niño is related to the Asian–Australian monsoon system (Yu et al. 2009) and would lead to a markedly decreased precipitation in December (Taschetto et al., 2009).
Therefore, the different SST responses over the Pacific Ocean and the North Atlantic Ocean in austral spring and summer in different models might be the key factor that leads to different wind anomalies and thus different Australian monsoon precipitation changes. Note that the resolution of land configuration in each model might not be the key factor that affects the SST gradient over the eastern Indian Ocean and western Pacific Ocean (Fig. S9).
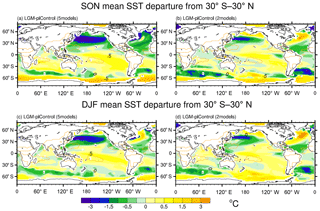
Figure 15SON mean (a, b) and DJF mean (c, d) SST differences between LGME and piControl derived from (a, c) the five models and (b, d) the two models. Only those areas where the signal-to-noise ratio exceeds 1 are plotted. The area average of tropical (30∘ S–30∘ N) SST change is distracted subtracted to make it clearer to illustrate the regional differences.
The global mean temperature and water vapor have an overall decrease under the LGM forcings (lower GHG and large ice sheets). Nevertheless, the simulated Australian monsoon seasonality derived from CMIP5–PMIP3 multi-model ensemble has a distinctive amplification (or the monsoonality is intensified) compared with the weakened global monsoons elsewhere during the LGM. This study then investigated the possible reasons for this strengthened Australian monsoonality from both thermodynamic and dynamic perspectives.
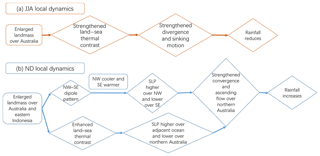
Figure 16Mechanisms of Australian monsoon precipitation change (a) in JJA, and (b) in ND during the LGM, in the local dynamics perspective.
The conclusions are as follows.
-
The Australian monsoon seasonality is strengthened as a result of the enhanced seasonal difference between austral summer and winter, i.e., the increased early summer (ND) mean rainfall and the reduced winter (JJA) mean rainfall. Both the dynamic processes and thermodynamic effects contribute to the precipitation change; however, the dynamic processes have a much stronger contribution than the thermodynamic effects.
-
The Australian winter (JJA mean) precipitation derived from 7MME is decreased during the LGM relative to the preindustrial control experiment. The dynamic processes, induced by the enhanced land–ocean thermal contrast, contribute more to the decreased rainfall through the strengthened divergence over northern Australia (Fig. 16a), whereas the thermodynamic effect (i.e., the reduced atmospheric water vapor due to the lower temperature induced by the lower GHGs and the presence of ice sheets) and evaporation have moderate contributions.
-
For the increased precipitation in early summer (ND) in the 7MME, the local dynamic processes have a positive contribution and the thermodynamic effect has a negative contribution. Both the decomposition method and the sensitivity simulations show that the dynamic effect plays the most important role in the increased rainfall. The local dynamic processes are mainly induced by the northwest–southeast thermal contrast between Indochina–western Indonesia and northeastern Australia. The eastern Indian Ocean–western Pacific Ocean thermal gradient also contributes to these processes (Fig. 16b).
-
The sensitivity simulation illustrates that the change in circulation over Australia is very likely to be rooted in the enlarged landmasses over Indochina–western Indonesia, New Guinea and northern Australia. Another factor contributing to the circulation change might be the asymmetric change between the western Pacific Ocean and eastern Indian Ocean. These have critical impacts on the thermal gradients that induce changes in the low-level circulation pattern and convergence–divergence.
Note that models have uncertainties; i.e., not all the models simulate an intensified seasonality of Australian monsoon. The different SST responses over the Pacific Ocean and Atlantic Ocean in different models to the same external forcings are essential for the model uncertainties. More model–data comparison and inter-model comparison are required to better understand the model–data disagreement and improve confidence in model results.
Our results are based on the equilibrium simulation, representing a mean state of the Australian monsoon change and its possible mechanisms during the LGM. More simulations with single forcing (such as the SST asymmetry change, the insolation change) are required to further understand the effect of each factor and to specifically quantify the contribution of each forcing to the Australian monsoon change.
The CMIP5–PMIP3 dataset is accessed from the Earth System Grid Federation (ESGF) portal (https://esgf-node.llnl.gov/projects/cmip5/; Peterschmitt et al., 2013). The additional sensitivity experiment output is not publicly available yet. Please contact Jian Cao (jianc@nuist.edu.cn) if interested in using the data.
The supplement related to this article is available online at: https://doi.org/10.5194/cp-14-2037-2018-supplement.
MY, BW and JL designed the work. MY made all the figures and prepared the paper. BW, AXZ and LN helped with the analyses and discussions. JC made the additional sensitivity experiments.
The authors declare that they have no conflict of interest.
We acknowledge Jack Williams and the two reviewers for the comments
helping to clarify and improve the paper. This research was jointly supported
by the National Key Research and Development Program of China (grant
no. 2016YFA0600401), the National Basic Research Program (grant no. 2015CB953804),
the National Natural Science Foundation of China (grant nos. 41671197,
41420104002 and 41501210) and the Priority Academic Development Program of
Jiangsu Higher Education Institutions (PAPD, grant no. 164320H116). We
acknowledge the World Climate Research Programme's Working Group on Coupled
Modeling, which is responsible for CMIP, and we thank the climate modeling
groups for producing and making available their model outputs. For the CMIP,
the U.S. Department of Energy's program for climate model diagnosis and
intercomparison provided coordinating support and led the development of software
infrastructure in partnership with the Global Organization for Earth System
Science Portals. We thank LetPub (http://www.letpub.com/, last access: September 2017) for its
linguistic assistance during the preparation of this paper. This is the
ESMC publication 243.
Edited by: Pascale Braconnot
Reviewed by: two anonymous referees
Ayliffe, L. K., Gagan, M. K., Zhao, J. X., Drysdale, R. N., Hellstrom, J. C., Hantoro, W. S., Griffiths, M. L., Scott-Gagan, H., St Pierre, E., Cowley, J. A., and Suwargadi, B. W.: Rapid interhemispheric climate links via the Australasian monsoon during the last deglaciation, Nat. Commun., 4, 2908, https://doi.org/10.1038/ncomms3908, 2013.
Bayon, G., De Deckker, P., Magee, J. W., Germain, Y., Bermell, S., Tachikawa, K., and Norman, M. D.: Extensive wet episodes in Late Glacial Australia resulting from high-latitude forcings, Scient. Rep., 7, 44054, https://doi.org/10.1038/srep44054, 2017.
Braconnot, P., Otto-Bliesner, B., Harrison, S., Joussaume, S., Peterchmitt, J.-Y., Abe-Ouchi, A., Crucifix, M., Driesschaert, E., Fichefet, T., Hewitt, C. D., Kageyama, M., Kitoh, A., Loutre, M.-F., Marti, O., Merkel, U., Ramstein, G., Valdes, P., Weber, L., Yu, Y., and Zhao, Y.: Results of PMIP2 coupled simulations of the Mid-Holocene and Last Glacial Maximum – Part 2: feedbacks with emphasis on the location of the ITCZ and mid- and high latitudes heat budget, Clim. Past, 3, 279–296, https://doi.org/10.5194/cp-3-279-2007, 2007.
Braconnot, P., Harrison, S. P., Kageyama, M., Bartlein, P. J., Masson-Delmotte, V., Abe-Ouchi, A., Otto-Bliesner, B., and Zhao, Y.: Evaluation of climate models using palaeoclimatic data, Nat. Clim. Change, 2, 417–424, https://doi.org/10.1038/nclimate1456, 2012a.
Braconnot, P., Harrison, S. P., Otto-Bliesner, B., Abe-Ouchi, A., Jungclaus, J., and Peterschmitt, J. Y.: The Paleoclimate Modeling Intercomparison Project contribution to CMIP5, CLIVAR Exchanges, 56, 15–19, 2012b.
Broccoli, A. J., Dahl, K. A., and Stouffer, R. J.: Response of the ITCZ to Northern Hemisphere cooling, Geophys. Res. Lett., 33, L01702, https://doi.org/10.1029/2005gl024546, 2006.
Brown, J. R., Moise, A. F., Colman, R., and Zhang, H.: Will a Warmer World Mean a Wetter or Drier Australian Monsoon?, J. Climate, 29, 4577–4596, https://doi.org/10.1175/jcli-d-15-0695.1, 2016.
Cao, J., Wang, B., Xiang, B., Li, J., Wu, T., Fu, X., Wu, L., and Min, J.: Major modes of short-term climate variability in the newly developed NUIST Earth System Model (NESM), Adv. Atmos. Sci., 32, 585–600, https://doi.org/10.1007/s00376-014-4200-6, 2015.
Chou, C., Neelin, J. D., Chen, C.-A., and Tu, J.-Y.: Evaluating the “Rich-Get-Richer” Mechanism in Tropical Precipitation Change under Global Warming, J. Climate, 22, 1982–2005, https://doi.org/10.1175/2008jcli2471.1, 2009.
De Deckker, P., Barrows, T. T., and Rogers, J.: Land–sea correlations in the Australian region: post-glacial onset of the monsoon in northwestern Western Australia, Quaternary Sci. Rev., 105, 181–194, https://doi.org/10.1016/j.quascirev.2014.09.030, 2014.
Denniston, R. F., Wyrwoll, K.-H., Asmerom, Y., Polyak, V. J., Humphreys, W. F., Cugley, J., Woods, D., LaPointe, Z., Peota, J., and Greaves, E.: North Atlantic forcing of millennial-scale Indo-Australian monsoon dynamics during the Last Glacial period, Quaternary Sci. Rev., 72, 159–168, https://doi.org/10.1016/j.quascirev.2013.04.012, 2013.
Denniston, R. F., Asmerom, Y., Polyak, V. J., Wanamaker, A. D., Ummenhofer, C. C., Humphreys, W. F., Cugley, J., Woods, D., and Lucker, S.: Decoupling of monsoon activity across the northern and southern Indo-Pacific during the Late Glacial, Quaternary Sci. Rev., 176, 101–105, https://doi.org/10.1016/j.quascirev.2017.09.014, 2017.
DiNezio, P. N. and Tierney, J. E.: The effect of sea level on glacial Indo-Pacific climate, Nat. Geosci., 6, 485–491, https://doi.org/10.1038/ngeo1823, 2013.
DiNezio, P. N., Clement, A., Vecchi, G. A., Soden, B., Broccoli, A. J., Otto-Bliesner, B. L., and Braconnot, P.: The response of the Walker circulation to Last Glacial Maximum forcing: Implications for detection in proxies, Paleoceanography, 26, PA3217, https://doi.org/10.1029/2010pa002083, 2011.
DiNezio, P. N., Timmermann, A., Tierney, J. E., Jin, F.-F., Otto-Bliesner, B., Rosenbloom, N., Mapes, B., Neale, R., Ivanovic, R. F., and Montenegro, A.: The climate response of the Indo-Pacific warm pool to glacial sea level, Paleoceanography, 31, 866–894, https://doi.org/10.1002/2015PA002890, 2016.
Donohoe, A., Marshall, J., Ferreira, D., and McGee, D.: The Relationship between ITCZ Location and Cross-Equatorial Atmospheric Heat Transport: From the Seasonal Cycle to the Last Glacial Maximum, J. Climate, 26, 3597–3618, https://doi.org/10.1175/jcli-d-12-00467.1, 2013.
Endo, H. and Kitoh, A.: Thermodynamic and dynamic effects on regional monsoon rainfall changes in a warmer climate, Geophys. Res. Lett., 41, 1704–1711, https://doi.org/10.1002/2013gl059158, 2014.
Eroglu, D., McRobie, F. H., Ozken, I., Stemler, T., Wyrwoll, K. H., Breitenbach, S. F., Marwan, N., and Kurths, J.: See-saw relationship of the Holocene East Asian-Australian summer monsoon, Nat. Commun., 7, 12929, https://doi.org/10.1038/ncomms12929, 2016.
Harrison, S. P., Bartlein, P. J., Brewer, S., Prentice, I. C., Boyd, M., Hessler, I., Holmgren, K., Izumi, K., and Willis, K.: Climate model benchmarking with glacial and mid-Holocene climates, Clim. Dynam., 43, 671–688, https://doi.org/10.1007/s00382-013-1922-6, 2014.
Held, I. M. and Soden, B. J.: Robust responses of the hydrological cycle to global warming, J. Climate, 19, 5686–5699, 2006.
Hewitt, C., Broccoli, A. J., Mitchell, J. F. B., and Stouffer, R.: A coupled model study of the last glacial maximum: Was part of the North Atlantic relatively warm?, Geophys. Res. Lett., 28, 1571–1574, 2001.
Huang, P., Xie, S.-P., Hu, K., Huang, G., and Huang, R.: Patterns of the seasonal response of tropical rainfall to global warming, Nat. Geosci., 6, 357–361, https://doi.org/10.1038/ngeo1792, 2013.
Huffman, G. J., Adler, R. F., Bolvin, D. T., and Gu, G.: Improving the global precipitation record: GPCP Version 2.1, Geophys. Res. Lett., 36, L17808, https://doi.org/10.1029/2009gl040000, 2009.
Jiang, D., Tian, Z., Lang, X., Kageyama, M., and Ramstein, G.: The concept of lobal monsoon applied to the last glacial maximum: A multi-model analysis, Quaternary Sci. Rev., 126, 126–139, https://doi.org/10.1016/j.quascirev.2015.08.033, 2015.
Jourdain, N. C., Gupta, A. S., Taschetto, A. S., Ummenhofer, C. C., Moise, A. F., and Ashok, K.: The Indo-Australian monsoon and its relationship to ENSO and IOD in reanalysis data and the CMIP3/CMIP5 simulations, Clim. Dynam., 41, 3073–3102, https://doi.org/10.1007/s00382-013-1676-1, 2013.
Kuhnt, W., Holbourn, A., Xu, J., Opdyke, B., De Deckker, P., Rohl, U., and Mudelsee, M.: Southern Hemisphere control on Australian monsoon variability during the late deglaciation and Holocene, Nat. Commun., 6, 5916, https://doi.org/10.1038/ncomms6916, 2015.
Li, J., Feng, J., and Li, Y.: A possible cause of decreasing summer rainfall in northeast Australia, Int. J. Climatol., 32, 995–1005, https://doi.org/10.1002/joc.2328, 2012.
Liu, F., Chai, J., Wang, B., Liu, J., Zhang, X., and Wang, Z.: Global monsoon precipitation responses to large volcanic eruptions, Sci. Rep., 6, 24331, https://doi.org/10.1038/srep24331, 2016.
Liu, Y., Lo, L., Shi, Z., Wei, K. Y., Chou, C. J., Chen, Y. C., Chuang, C. K., Wu, C. C., Mii, H. S., Peng, Z., Amakawa, H., Burr, G. S., Lee, S. Y., DeLong, K. L., Elderfield, H., and Shen, C. C.: Obliquity pacing of the western Pacific Intertropical Convergence Zone over the past 282,000 years, Nat. Commun., 6, 10018, https://doi.org/10.1038/ncomms10018, 2015.
Marshall, A. G. and Lynch, A. H.: Time-slice analysis of the Australian summer monsoon during the late Quaternary using the Fast Ocean Atmosphere Model, J. Quaternary Sci., 21, 789–801, https://doi.org/10.1002/jqs.1063, 2006.
Marshall, A. G. and Lynch, A. H.: The sensitivity of the Australian summer monsoon to climate forcing during the late Quaternary, J. Geophys. Res., 113, D11107, https://doi.org/10.1029/2007jd008981, 2008.
McGee, D., Donohoe, A., Marshall, J., and Ferreira, D.: Changes in ITCZ location and cross-equatorial heat transport at the Last Glacial Maximum, Heinrich Stadial 1, and the mid-Holocene, Earth Planet. Sc. Lett., 390, 69–79, https://doi.org/10.1016/j.epsl.2013.12.043, 2014.
Miller, G. H., Fogel, M. L., Magee, J. W., and Gagan, M. K.: Disentangling the impacts of climate and human colonization on the flora and fauna of the Australian arid zone over the past 100 ka using stable isotopes in avian eggshell, Quaternary Sci. Rev., 151, 27–57, https://doi.org/10.1016/j.quascirev.2016.08.009, 2016.
Mohtadi, M., Oppo, D. W., Steinke, S., Stuut, J.-B. W., De Pol-Holz, R., Hebbeln, D., and Lückge, A.: Glacial to Holocene swings of the Australian–Indonesian monsoon, Nat. Geosci., 4, 540–544, https://doi.org/10.1038/ngeo1209, 2011.
Mohtadi, M., Prange, M., Oppo, D. W., De Pol-Holz, R., Merkel, U., Zhang, X., Steinke, S., and Lückge, A.: North Atlantic forcing of tropical Indian Ocean climate, Nature, 509, 76–80, https://doi.org/10.1038/nature13196, 2014.
Peltier, W. R.: Closure of the budget of global sea level rise over the GRACE Era: The importance and magnitudes of the required corrections for global glacial isostatic adjustment, Quaternary Sci. Rev., 28, 1658–1674, https://doi.org/10.1016/j.quascirev.2009.04.004, 2009.
Peterschmitt, J. Y., Denvil, S., Morgan, M., and the PMIP 3 Participants Team: The PMIP 3 Database: latest news, European Geosciences Union 2013, EGU2013-9107, 10 April 2013, Vienna, Austria, http://pmip3.lsce.ipsl.fr/ (last access: December 2018), 2013.
Petherick, L., Bostock, H., Cohen, T. J., Fitzsimmons, K., Tibby, J., Fletcher, M. S., Moss, P., Reeves, J., Mooney, S., Barrows, T., Kemp, J., Jansen, J., Nanson, G., and Dosseto, A.: Climatic records over the past 30 ka from temperate Australia – a synthesis from the Oz-INTIMATE workgroup, Quaternary Sci. Rev., 74, 58–77, https://doi.org/10.1016/j.quascirev.2012.12.012, 2013.
Reeves, J. M., Barrows, T. T., Cohen, T. J., Kiem, A. S., Bostock, H. C., Fitzsimmons, K. E., Jansen, J. D., Kemp, J., Krause, C., Petherick, L., and Phipps, S. J.: Climate variability over the last 35,000 years recorded in marine and terrestrial archives in the Australian region: an OZ-INTIMATE compilation, Quaternary Sci. Rev., 74, 21–34, https://doi.org/10.1016/j.quascirev.2013.01.001, 2013a.
Reeves, J. M., Bostock, H. C., Ayliffe, L. K., Barrows, T. T., De Deckker, P., Devriendt, L. S., Dunbar, G. B., Drysdale, R. N., Fitzsimmons, K. E., Gagan, M. K., Griffiths, M. L., Haberle, S. G., Jansen, J. D., Krause, C., Lewis, S., McGregor, H. V., Mooney, S. D., Moss, P., Nanson, G. C., Purcell, A., and van der Kaars, S.: Palaeoenvironmental change in tropical Australasia over the last 30,000 years – a synthesis by the OZ-INTIMATE group, Quaternary Sci. Rev., 74, 97–114, https://doi.org/10.1016/j.quascirev.2012.11.027, 2013b.
Rojas, M.: Sensitivity of Southern Hemisphere circulation to LGM and 4×CO2 climates, Geophys. Res. Lett., 40, 965-9-70, https://doi.org/10.1002/grl.50195, 2013.
Seager, R., Naik, N., and Vecchi, G. A.: Thermodynamic and Dynamic Mechanisms for Large-Scale Changes in the Hydrological Cycle in Response to Global Warming, J. Climate, 23, 4651–4668, https://doi.org/10.1175/2010jcli3655.1, 2010.
Taschetto, A. S., Ummenhofer, C. C., Sen Gupta, A., and England, M. H.: Effect of anomalous warming in the central Pacific on the Australian monsoon, Geophys. Res. Lett., 36, L12704, https://doi.org/10.1029/2009gl038416, 2009.
Taylor, K. E., Stouffer, R. J., and Meehl, G. A.: An Overview of CMIP5 and the Experiment Design, B. Am. Meteorol. Soc., 93, 485–498, https://doi.org/10.1175/bams-d-11-00094.1, 2012.
Tharammal, T., Paul, A., Merkel, U., and Noone, D.: Influence of Last Glacial Maximum boundary conditions on the global water isotope distribution in an atmospheric general circulation model, Clim. Past, 9, 789–809, https://doi.org/10.5194/cp-9-789-2013, 2013.
Turney, C. S. M., Haberle, S., Fink, D., Kershaw, A. P., Barbetti, M., Barrows, T. T., Black, M., Cohen, T. J., Corrège, T., Hesse, P. P., Hua, Q., Johnston, R., Morgan, V., Moss, P., Nanson, G., van Ommen, T., Rule, S., Williams, N. J., Zhao, J. X., D'Costa, D., Feng, Y. X., Gagan, M., Mooney, S., and Xia, Q.: Integration of ice-core, marine and terrestrial records for the Australian Last Glacial Maximum and Termination: a contribution from the OZ INTIMATE group, J. Quaternary Sci., 21, 751–761, https://doi.org/10.1002/jqs.1073, 2006.
Wang, B. and Ding, Q.: Global monsoon: Dominant mode of annual variation in the tropics, Dynam. Atmos. Oceans, 44, 165–183, https://doi.org/10.1016/j.dynatmoce.2007.05.002, 2008.
Wang, P. X., Wang, B., Cheng, H., Fasullo, J., Guo, Z., Kiefer, T., and Liu, Z.: The global monsoon across time scales: Mechanisms and outstanding issues, Earth-Sci. Rev., 174, 84–121, https://doi.org/10.1016/j.earscirev.2017.07.006, 2017.
Williams, A. N., Ulm, S., Cook, A. R., Langley, M. C., and Collard, M.: Human refugia in Australia during the Last Glacial Maximum and Terminal Pleistocene: a geospatial analysis of the 25–12 ka Australian archaeological record, J. Archaeol. Sci., 40, 4612–4625, https://doi.org/10.1016/j.jas.2013.06.015, 2013.
Wyrwoll, K.-H., Liu, Z., Chen, G., Kutzbach, J. E., and Liu, X.: Sensitivity of the Australian summer monsoon to tilt and precession forcing, Quaternary Sci. Rev., 26, 3043–3057, https://doi.org/10.1016/j.quascirev.2007.06.026, 2007.
Wyrwoll, K.-H., Hopwood, J. M., and Chen, G.: Orbital time-scale circulation controls of the Australian summer monsoon: a possible role for mid-latitude Southern Hemisphere forcing?, Quaternary Sci. Rev., 35, 23–28, https://doi.org/10.1016/j.quascirev.2012.01.003, 2012.
Xie, P. and Arkin, P.: Global precipitation: a 17-year monthly analysis based on Gauge Obseravations, satellite estimates, and numerical model outputs, B. Am. Meteorol. Soc., 78, 2539–2558, 1997.
Xu, J., Kuhnt, W., Holbourn, A., Regenberg, M., and Andersen, N.: Indo-Pacific Warm Pool variability during the Holocene and Last Glacial Maximum, Paleoceanography, 25, PA4230, https://doi.org/10.1029/2010pa001934, 2010.
Yan, M., Wang, B., and Liu, J.: Global monsoon change during the Last Glacial Maximum: a multi-model study, Clim. Dynam., 47, 359–374, https://doi.org/10.1007/s00382-015-2841-5, 2016.


