the Creative Commons Attribution 4.0 License.
the Creative Commons Attribution 4.0 License.
 | 01 Nov 2018
Effect of high dust amount on surface temperature during the Last Glacial Maximum: a modelling study using MIROC-ESM
Ayako Abe-Ouchi
Ryouta O'ishi
Toshihiko Takemura
Akinori Ito
Tomohiro Hajima
Shingo Watanabe
Michio Kawamiya
The effect of aerosols is one of many uncertain factors in projections of future climate. However, the behaviour of mineral dust aerosols (dust) can be investigated within the context of past climate change. The Last Glacial Maximum (LGM) is known to have had enhanced dust deposition in comparison with the present, especially over polar regions. Using the Model for Interdisciplinary Research on Climate Earth System Model (MIROC-ESM), we conducted a standard LGM experiment following the protocol of the Paleoclimate Modelling Intercomparison Project phase 3 and sensitivity experiments. We imposed glaciogenic dust on the standard LGM experiment and investigated the impacts of glaciogenic dust and non-glaciogenic dust on the LGM climate. Global mean radiative perturbations by glaciogenic and non-glaciogenic dust were both negative, consistent with previous studies. However, glaciogenic dust behaved differently in specific regions; e.g. it resulted in less cooling over the polar regions. One of the major reasons for reduced cooling is the ageing of snow or ice, which results in albedo reduction via high dust deposition, especially near sources of high glaciogenic dust emission. Although the net radiative perturbations in the lee of high glaciogenic dust provenances are negative, warming by the ageing of snow overcomes this radiative perturbation in the Northern Hemisphere. In contrast, the radiative perturbation due to high dust loading in the troposphere acts to warm the surface in areas surrounding Antarctica, primarily via the longwave aerosol–cloud interaction of dust, and it is likely the result of the greenhouse effect attributable to the enhanced cloud fraction in the upper troposphere. Although our analysis focused mainly on the results of experiments using the atmospheric part of the MIROC-ESM, we also conducted full MIROC-ESM experiments for an initial examination of the effect of glaciogenic dust on the oceanic general circulation module. A long-term trend of enhanced warming was observed in the Northern Hemisphere with increased glaciogenic dust; however, the level of warming around Antarctica remained almost unchanged, even after extended coupling with the ocean.
- Article
(10128 KB) - Full-text XML
-
Supplement
(1091 KB) - BibTeX
- EndNote


The Last Glacial Maximum (ca. 21 000 years before present; LGM), which is the most recent period featuring maximum expansion of the land ice sheets in the Northern Hemisphere, has been investigated thoroughly using various palaeo-proxy records and via modelling studies (Braconnot et al., 2007a, b; Kageyama et al., 2006, 2017). Climate modelling is an essential tool in investigations seeking to clarify the mechanisms of climate change, as stated in the Intergovernmental Panel on Climate Change (IPCC) assessment reports (IPCC, 2013). Therefore, it is especially important to evaluate the capability of numerical models to capture past climatic conditions.
Palaeo-proxy data and modelling studies are both required for a proper understanding of past climates; however, the focus of this study is on modelling. General circulation models (GCMs) are one of the tools used most widely for investigation of the mechanisms of both climate and climate change. The improvement of computational resources has allowed for the development of models with high complexity that permit interactive coupling of various climatic components. In comparison with proxy data, previous modelling experiments targeting the LGM have tended to underestimate the magnitude of cooling, especially over high latitudes (Masson-Delmotte et al., 2006, 2010). The importance of feedback related to dust and vegetation has been identified in Chapter 5 of the IPCC Fifth Assessment Report (IPCC, 2013).
It is recognised that uncertainty over the effect of aerosols is one of the most important factors regarding radiative perturbation in estimates of global warming. Mineral dust is the most abundant atmospheric aerosol, even in the present climate. For example, Mahowald et al. (2010) investigated the trend of the amount of atmospheric dust in the 20th century based on observations and modelling. They reported a correlation between an increase in desert dust and a net negative radiative perturbation. Examination of proxy data has suggested a clear enhancement of dust during the LGM, which was especially pronounced at high latitudes, i.e. reaching levels more than 20 times greater than the present day over Antarctica (Lambert et al., 2008; Lamy et al., 2014; Dome Fuji Ice Core Project members, 2017). Although the enhancement of dust deposition was found less over lower latitudes, it was still several times higher in comparison with the present day (Winckler et al., 2008).
Although earlier studies (Mahowald et al., 1999; Lunt and Valdes, 2002; Claquin et al., 2003) have estimated higher dust amounts during the LGM in comparison with the pre-industrial (PI) period, dust amounts over Antarctica have tended to be underestimated. Claquin et al. (2003) estimated the radiative perturbation at the top of the atmosphere (TOA). They reported a cooling effect attributable to dust, but they also found a warming effect due to dust deposition on snow. Later, Mahowald et al. (2006a, b) estimated the glaciogenic dust flux and the aerosol–radiation interaction. Their standard LGM experiment simulated an underestimation of dust deposition flux, especially over high latitudes, in comparison with the DIRTMAP proxy data archive (Kohfeld and Harrison, 2001). Then, they considered the effect of sources of glaciogenic dust surrounding the ice sheets and glaciers. Such areas are defined to generate substantial amounts of glacial flour during glacial periods (Bullard et al., 2016). The study considered the emission of various fluxes of dust from these glaciogenic source areas and a best fit to the DIRTMAP deposition distribution was obtained. Although this estimate could conceal other possible and non-introduced processes of dust sources, it constitutes an important step forward in the determination of a reasonable representation of both the atmospheric loading and the depositional distribution of dust during the LGM. However, they did not estimate the effects of aerosol–cloud interaction. Takemura et al. (2009) used the Model for Interdisciplinary Research on Climate (MIROC) Atmospheric GCM (AGCM) with an online aerosol module to determine both the aerosol–radiation and the aerosol–cloud interactions for the LGM and PI periods at both the surface and the tropopause. However, they underestimated the amount of dust deposition over Antarctica, probably because they did not consider glaciogenic dust. Lambert et al. (2013) used two general circulation models coupled with online aerosol models and obtained underestimated dust flux and radiative forcing. This underestimation was global, but more pronounced over the polar regions, and they suggested the possibility that it contributes to an underestimation of polar amplification for LGM and future projections. Yue et al. (2011) used an AGCM to estimate the aerosol–radiation interaction for dust and they reported an evident cooling effect. Albani et al. (2014) supposed high erodibility areas to obtain better representation of LGM dust. They also highlighted the importance of the optical properties and size distribution of dust aerosols. In comparison with the control setting, Sagoo and Strelvmo (2017) applied an emission factor of 3.4 to the dust emissions in an LGM level CO2 experiment (i.e. the land sea mask and ice sheets were unchanged from the control) to mimic the high dust situation during the LGM and they estimated the aerosol–cloud interaction. Hopcroft et al. (2015) investigated the aerosol–radiation interaction at the TOA using an AGCM and the land module of an Earth system model (ESM), based on which they suggested the necessity of further analyses of aerosol–cloud interaction as future work. They also summarised the global mean dust emissions and loadings of the PI and LGM periods reported in previous studies. It was suggested that the amount of dust is highly dependent on the model used, not only for the LGM but also for the PI. The latest review of previous studies is also in Albani et al. (2018).
Another aspect of dust is related to the ageing of the snow surface, which possibly modulates the surface temperature via albedo reduction. Krinner et al. (2006) discussed the importance of the ageing effect of snow, particularly over eastern Siberia. Their ageing scheme was based on that of Warren and Wiscombe (1980) and Wiscombe and Warren (1980). Moreover, Ganopolski et al. (2010) simulated the glacial–interglacial cycle using an intermediate complexity model, in which the ageing effect was implemented via simple scaling.
Previous studies have not included a dynamic ocean in this context, so the impacts on global ocean circulation are unknown.
In summary, we claim that the evaluation of the total effect of dust on the LGM surface temperature is incomplete. Therefore, this study addresses the problem by incorporating the effects of aerosol–radiation interaction, aerosol–cloud interaction, snow ageing, and dust–ocean interaction. We undertook AGCM simulations and full ESM simulations of the LGM with sensitivity experiments targeting the effects of dust on climate.
The following section explains the modelling and experimental set-ups. The resulting estimations of dust amount and dust depositional distribution are presented in Sect. 3.1, and the influence of dust on surface temperature is described in Sect. 3.2. To investigate how dust might modulate the atmospheric state, the radiative perturbation attributable to dust is described in Sect. 3.3 and the effect of glaciogenic dust on the ocean is discussed in Sect. 3.4. The results of the simulations are summarised and discussed in Sect. 4.
2.1 Description of the MIROC-ESM
The MIROC-ESM (Watanabe et al., 2011) used in this study was the version submitted to both the Coupled Model Intercomparison Project phase 5 (CMIP5) and the Paleoclimate Modelling Intercomparison Project phase 3 (PMIP3). The resolution of the atmosphere in the model is T42 with 80 vertical levels, while that of the ocean is about 1∘ (256×192). Although the model is capable of computing the amount of CO2 in the atmosphere, we prescribed the level of atmospheric CO2 in our experimental set-up. The spatially explicit individual-based Dynamic Global Vegetation Model (SEIB-DGVM) (Sato et al., 2007) was implemented to simulate global vegetation dynamics and terrestrial carbon cycling in the system, but it returns only the leaf area index (LAI) to the Minimal Advanced Treatments of Surface Interaction and Runoff (MATSIRO) land module (Takata et al., 2003). In this model, the SEIB-DGVM received several variables from the AGCM, but it returned only the carbon flux to the atmosphere. Also implemented was the Spectral Radiation–Transport Model for Aerosol Species (SPRINTARS) online aerosol module (Takemura et al., 2000, 2002, 2005, and 2009), which explicitly treats organic, black carbon, and mineral dust, sea-salt aerosols, and sulfate and its precursor gases. This module was coupled with the radiation and cloud microphysical schemes to calculate the aerosol–radiation and aerosol–cloud interactions. In the calculation of the former, refractive indices depending on wavelengths, size distributions, and hygroscopic growth were considered. The refractive index of dust aerosols was taken from Deepak and Gerber (1983) but its imaginary part was reduced for consistency with recent measurements of weaker shortwave absorption to 1.530– at 0.55 µm dust (Takemura et al., 2005). Number concentrations of both cloud droplets and ice crystals are prognostic variables, as are their mass mixing ratios, and the changes in their radii and precipitation rates were calculated. Thus, the aerosol–cloud interaction was taken into account (see Takemura et al., 2009, for more details). The processes controlling dust generation are the surface wind, vegetation type, soil moisture, LAI, and snow cover. Once dust is generated, it is transported via atmospheric circulation and deposited via the processes of wet–dry deposition and gravitational settling. In this study, glaciogenic dust was imposed for the sensitivity experiments. The generation of glaciogenic dust flux followed the estimate of Mahowald et al. (2006a). This flux was added as a time-invariant source into the simulations and is not dependent on modelled land surface or atmospheric conditions.
In the MATSIRO module, the effect of dirt in snow (i.e. snow ageing) was considered based on the work of both Yang et al. (1997) and Warren and Wiscombe (1981). The magnitude of dirt concentration at the snow surface was varied to fit an observed relation between snow albedo and dirt concentration (Aoki et al., 2006). The dirt concentration in snow was calculated from the deposition fluxes of dust and soot calculated in the SPRINTARS module. The relative strength of the absorption coefficients for dust and soot were weighted as a function of the deposition fluxes to obtain radiatively effective amounts of dirt in the snow.
2.2 Experimental design
We performed eight experiments: five using the AGCM part of the MIROC-ESM and three using the full MIROC-ESM. The specific experiments labelled PI.a and PI.e represent the AD 1850 control climate of the PI era, with PI.e having been submitted to CMIP5. The previous 100-year climatology of sea surface temperature (SST) and sea ice of the period submitted to CMIP5 was used as a boundary condition for PI.a. The experiments labelled LGM.e and LGM.a represent the LGM climate following the PMIP3 protocol (Abe-Ouchi et al., 2015). The LGM.e experiment was submitted to CMIP5–PMIP3 (Sueyoshi et al., 2013). The LGM.a experiment was the AGCM experiment using the SST and sea ice taken from the PMIP3 LGM experiment (LGM.e). The LGM.e experiment was extended for a further 800 years beyond the PMIP3 period (Fig. 1). The LGMglac.a experiment was a new experiment based on the same conditions as LGM.a, but with an additional glaciogenic dust flux following Mahowald et al. (2006a). The LGMglac.naging.a and LGM.naging.a experiments had the same settings as LGMglac.a and LGM.a, but without the effect of snow ageing. The LGMglac.e experiment was the full ESM version of LGMglac.a, which branched from the LGM.e experiment 40 years prior to the period submitted to CMIP5–PMIP3 (Fig. 1). The glaciogenic dust flux from each area was set identical to the estimates of Mahowald et al. (2006a) and the emission areas were defined as shown in Fig. S1 in the Supplement to follow their work as closely as possible; i.e. the three areas of strongest emission were the pampas of South America, central North America, and eastern Siberia. In contrast to non-glaciogenic dust, the emission of glaciogenic dust was independent of dust emission conditions and it was emitted constantly for consistency with the dust flux in Mahowald et al. (2006a) (Table 1b). Once emitted into the atmosphere, the treatment of glaciogenic dust was identical to non-glaciogenic dust. The integration of LGMglac.e was performed for 940 years. Table 2 lists the details of all the experiments.
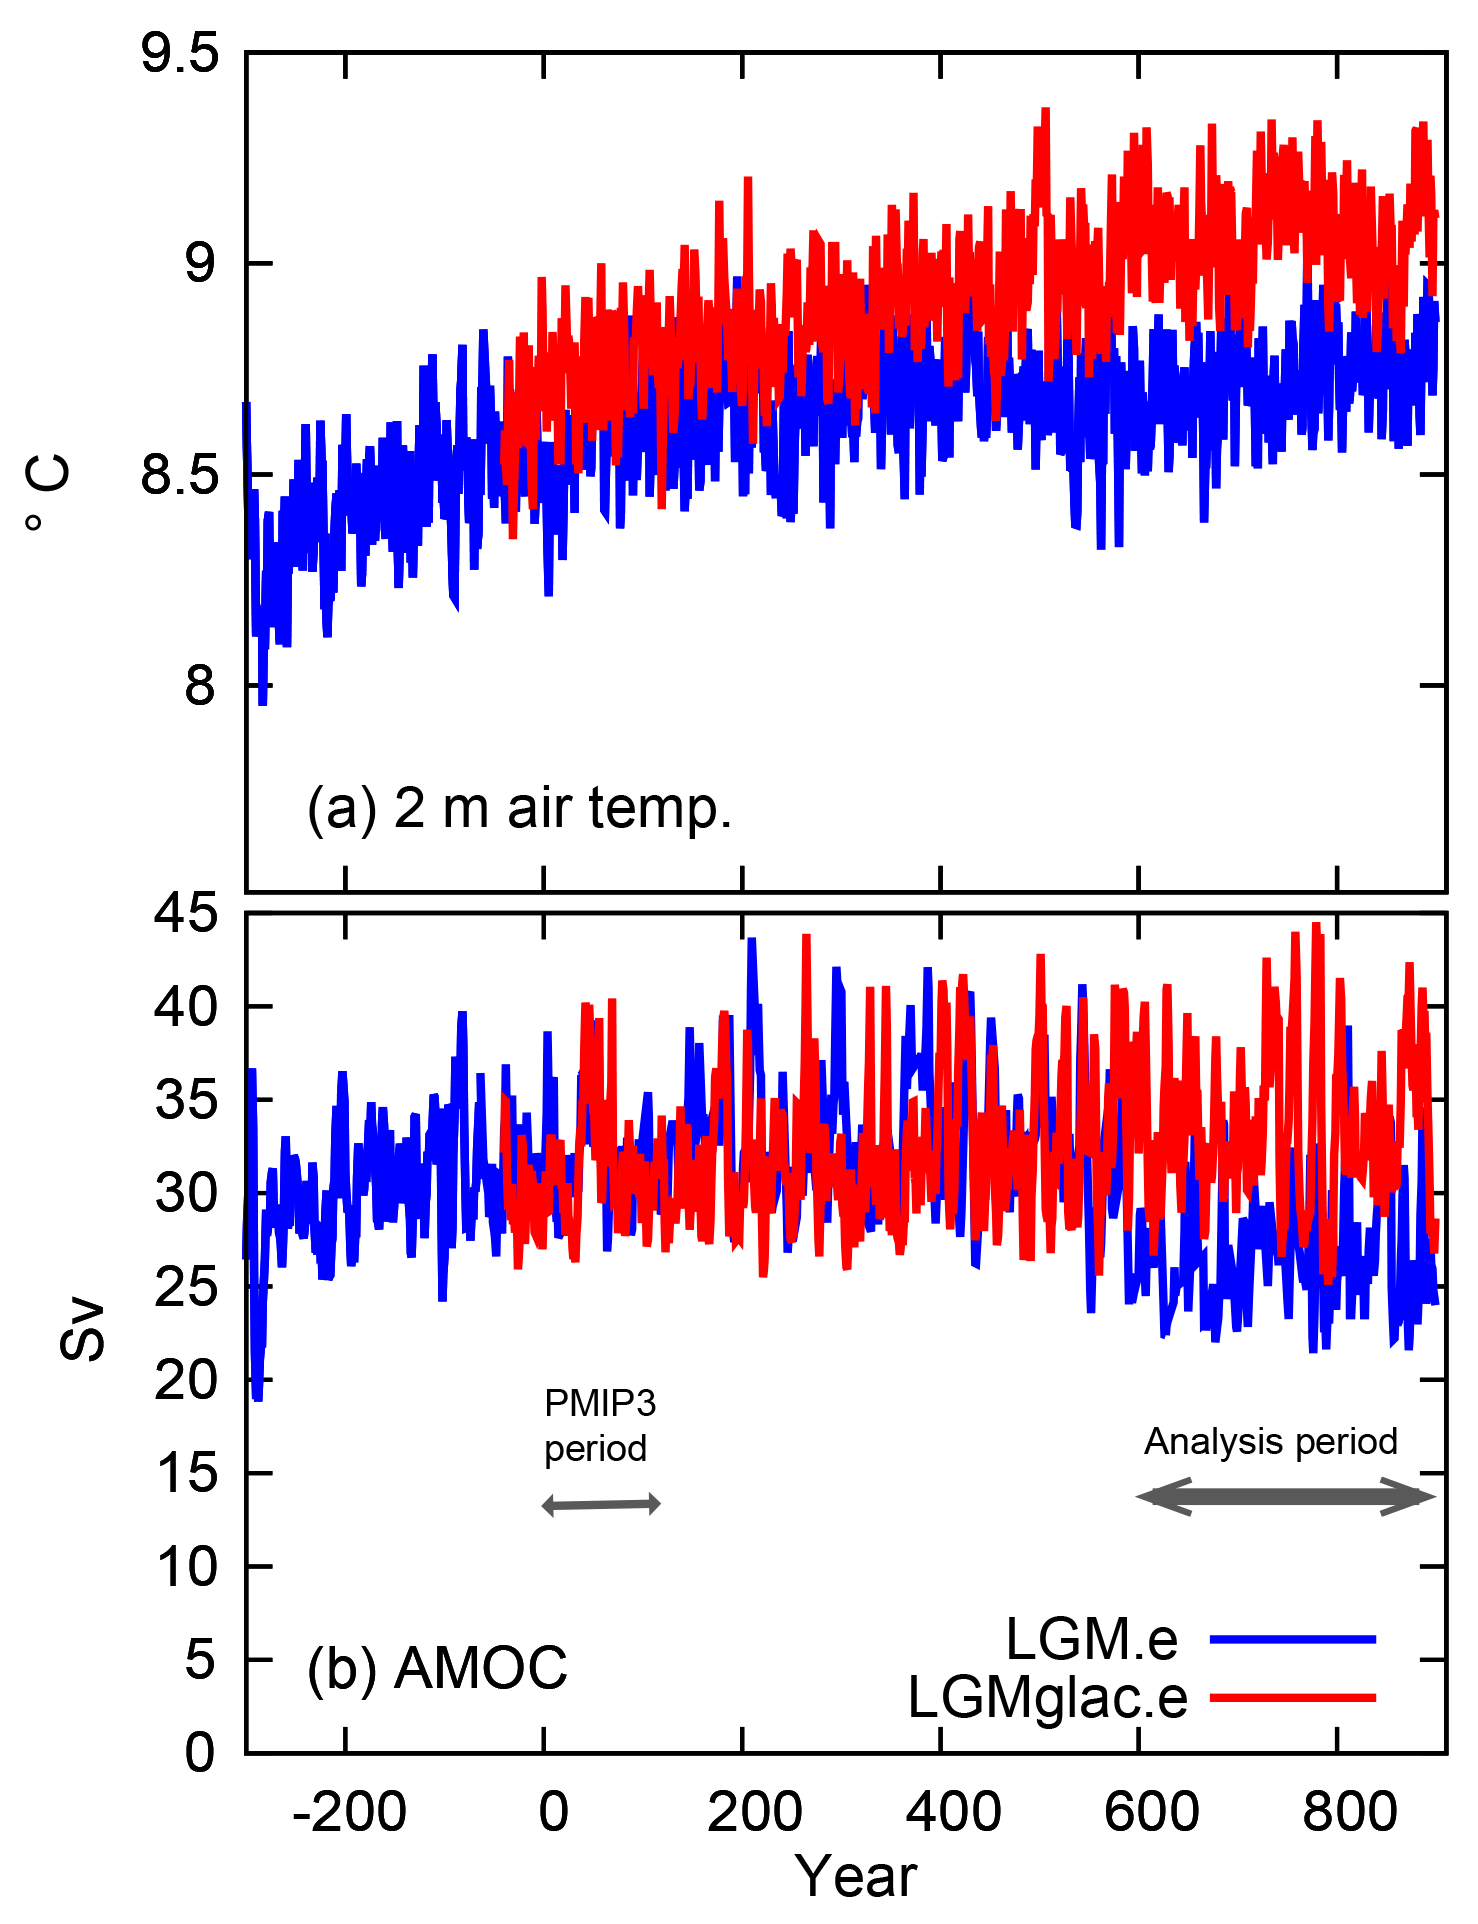
Figure 1Time series of (a) global mean annual temperature at 2 m of height (∘C) and (b) peak strength of the Atlantic Meridional Overturning Circulation (AMOC; Sv) for LGM.e and LGMglac.e. The year zero was set to the beginning of the period submitted to CMIP5.
3.1 Dust amount and comparison with data archives
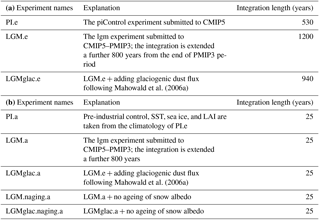
The emission flux of dust (g m−2 yr−1) is shown in Fig. 2 for the PI.a, LGM.a, and LGMglac.a experiments. For the PI.a experiment, the major dust sources are the Sahara, Arabian, Gobi, and Taklamakan deserts. A minor source is also found in the mid-latitude region of South America. While these dust sources look reasonable based on the present-day situation, there is too little dust emission from the other plausible dust sources such as Australia, southern Africa, and south-western North America. The wet bias over these areas in the PI.a experiment leads to excess vegetation, which prevents dust emission, and persists in the LGM.a and LGMglac.a experiments. In the LGM.a and LGMglac.a experiments, the dust emission flux in the Sahara, Gobi, and Taklamakan deserts is significantly enhanced, which is the result of a windier and drier climate during the LGM, with additional emission flux evident from northern Siberia. In contrast, the emission flux from South America is reduced, which is probably because of increased soil moisture resulting from enhanced precipitation in this region. For the LGMglac.a experiment, glaciogenic dust emission is evident surrounding the extended ice sheets during the LGM. The total emission amount is 2540 (Tg yr−1) for the PI.a experiment, 7250 (Tg yr−1) for the LGM.a experiment, and 13 400 (Tg yr−1) for the LGMglac.a experiment. The total simulated emissions and atmospheric loads are listed in Table 1.
Table 1(a) Simulated total dust emissions (Tg yr−1) and atmospheric burden (Tg) for PI.a, LGM.a, and LGMglac.a. (b) Glaciogenic dust flux (Tg yr−1) (Mahowald et al., 2006a) from the areas shown in Fig. S1 in the Supplement in longitudinal order.
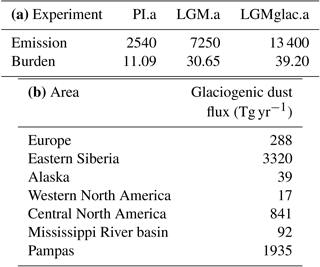
Table 2List of experiments. (a) Experiment using MIROC-ESM. (b) Experiments using the AGCM part of MIROC-ESM.
The global dust budget can be compared with the findings of previous studies. Hopcroft et al. (2015) summarised it in their Table 1. They clarified that the dust amount is highly dependent on the model, not only for the LGM experiments but also for the PI experiments. Our emission and load values fall in the middle of the ranges determined by previous studies. However, they are close to those of Takemura et al. (2009) for PI.a and LGM.a, probably because the models adopted are from the same model family and use the same aerosol module. The emission of LGMglac.a is close to that of Mahowald et al. (2006a), most likely because we adopted their glaciogenic dust, but the load of LGMglac.a (39 Tg) is about 60 % of Mahowald's loading (62 Tg), which suggests overestimation of immediate dust deposition rates near the source areas (Fig. 4) attributable to our assumption of the independence of dust emission from wind speed. The change in the zonal mean dust loading in the atmosphere for the ratios LGM.a ∕ PI.a and LGMglac.a ∕ PI a is shown in Fig. 3a and b, respectively. In the LGM.a experiment, the dust mass concentration in the Northern Hemisphere is enhanced, but decreased in the Southern Hemisphere compared with the PI.a experiment. In contrast, the mass concentration is enhanced significantly in both the northern and southern high latitudes in the LGMglac.a experiment. The glaciogenic dust reached higher levels of the troposphere in the Southern Hemisphere compared with the Northern Hemisphere. This can be attributed to the different conditions of the strong dust sources. In the Southern Hemisphere, they are exposed to stronger winds because of the lack of continental land, whereas in the Northern Hemisphere, the strong sources of glaciogenic dust are located over continents that are subject to lower wind speeds. The distribution of dust deposition for each experiment is shown in Fig. 4a–c and the ratio to PI.a is shown in Fig. 5 for comparison with the archives of ice and sediment core data, as indicated by the coloured circles (Kohfeld et al., 2013; Albani et al., 2014). The scatter plots shown in Fig. 4d–f compare the data with the modelled deposition rate at the grids corresponding to the data locations. The colours and mark types are used for categorisation according to the area and the type of core data. Reasonable correlation is seen for the PI.a experiment, except in the grids over the Southern Ocean, which are mostly located in the southern Pacific Ocean region. The main source of the dust deposited in this region is expected to be Australia (Li et al., 2010; Albani et al., 2012), where our model underestimates the emission. In the LGM.a experiment, the dust deposition flux is underestimated in North America, Eurasia, the South Pacific, the Southern Ocean, and Antarctica. In contrast, in the LGMglac.a experiment, the underestimation is generally improved. The model–data linear correlation coefficients in the logarithmic scale are 0.79, 0.62, and 0.80 for the PI.a, LGM.a, and LGMglac.a experiments, respectively. The differences in the deposition flux between the PI.a and PI.e experiments, LGM.a and LGM.e experiments, and LGMglac.a and LGMglac.e experiments are almost negligible.
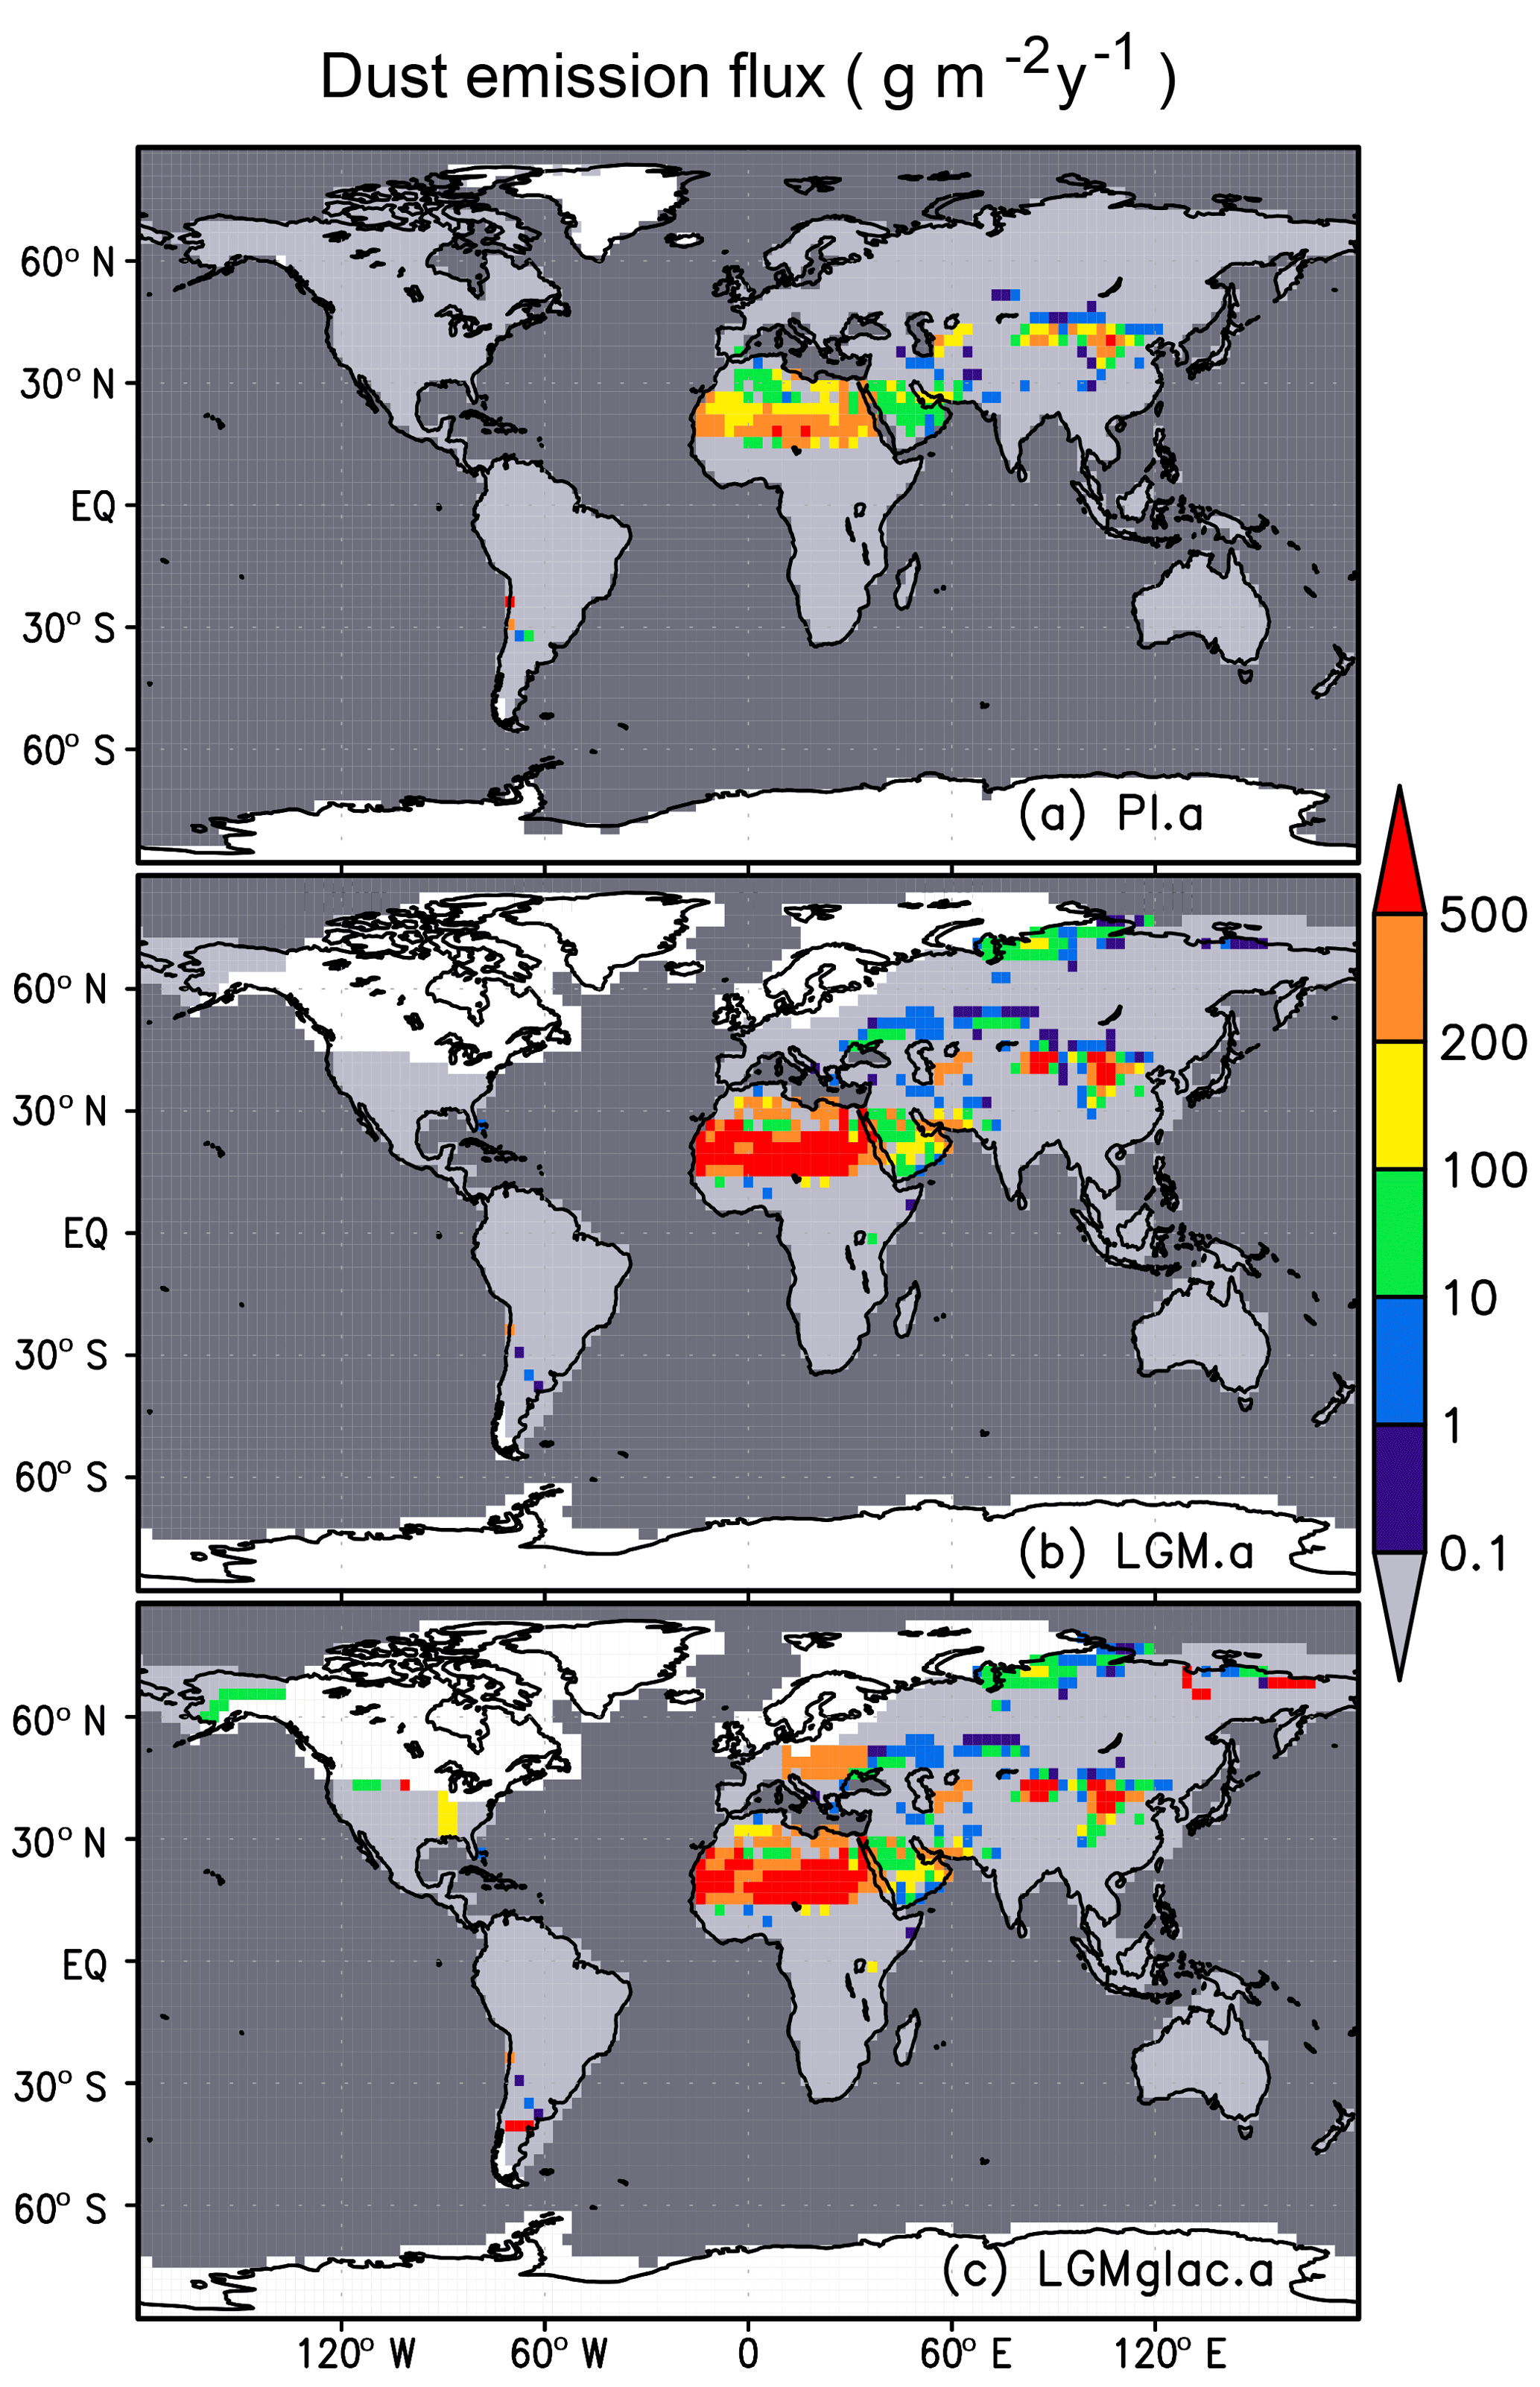
Figure 2Dust emission flux (g m−2 yr−1) for (a) PI.a, (b) LGM.a, and (c) LGMglac.a. Ocean areas are dark grey and ice sheets are white.
3.2 Surface temperature at LGM and the effect of glaciogenic dust
The surface temperature anomaly for LGM.a–PI.a is presented in Fig. 6a. The cooling is about 2.3 ∘C over the tropics and increases towards high latitudes. The most pronounced cooling is seen over the ice sheets in the Northern Hemisphere. This general view is also seen in Fig. 6b, which shows the temperature anomaly for LGMglac.a to PI.a. Figure 7b and c show the anomaly of the downward radiation for LGM to PI for these experiments. The cooled atmosphere at the LGM results in reduced longwave radiation reaching the Earth's surface, which is consistent with the distribution of the temperature anomalies in Fig. 6.
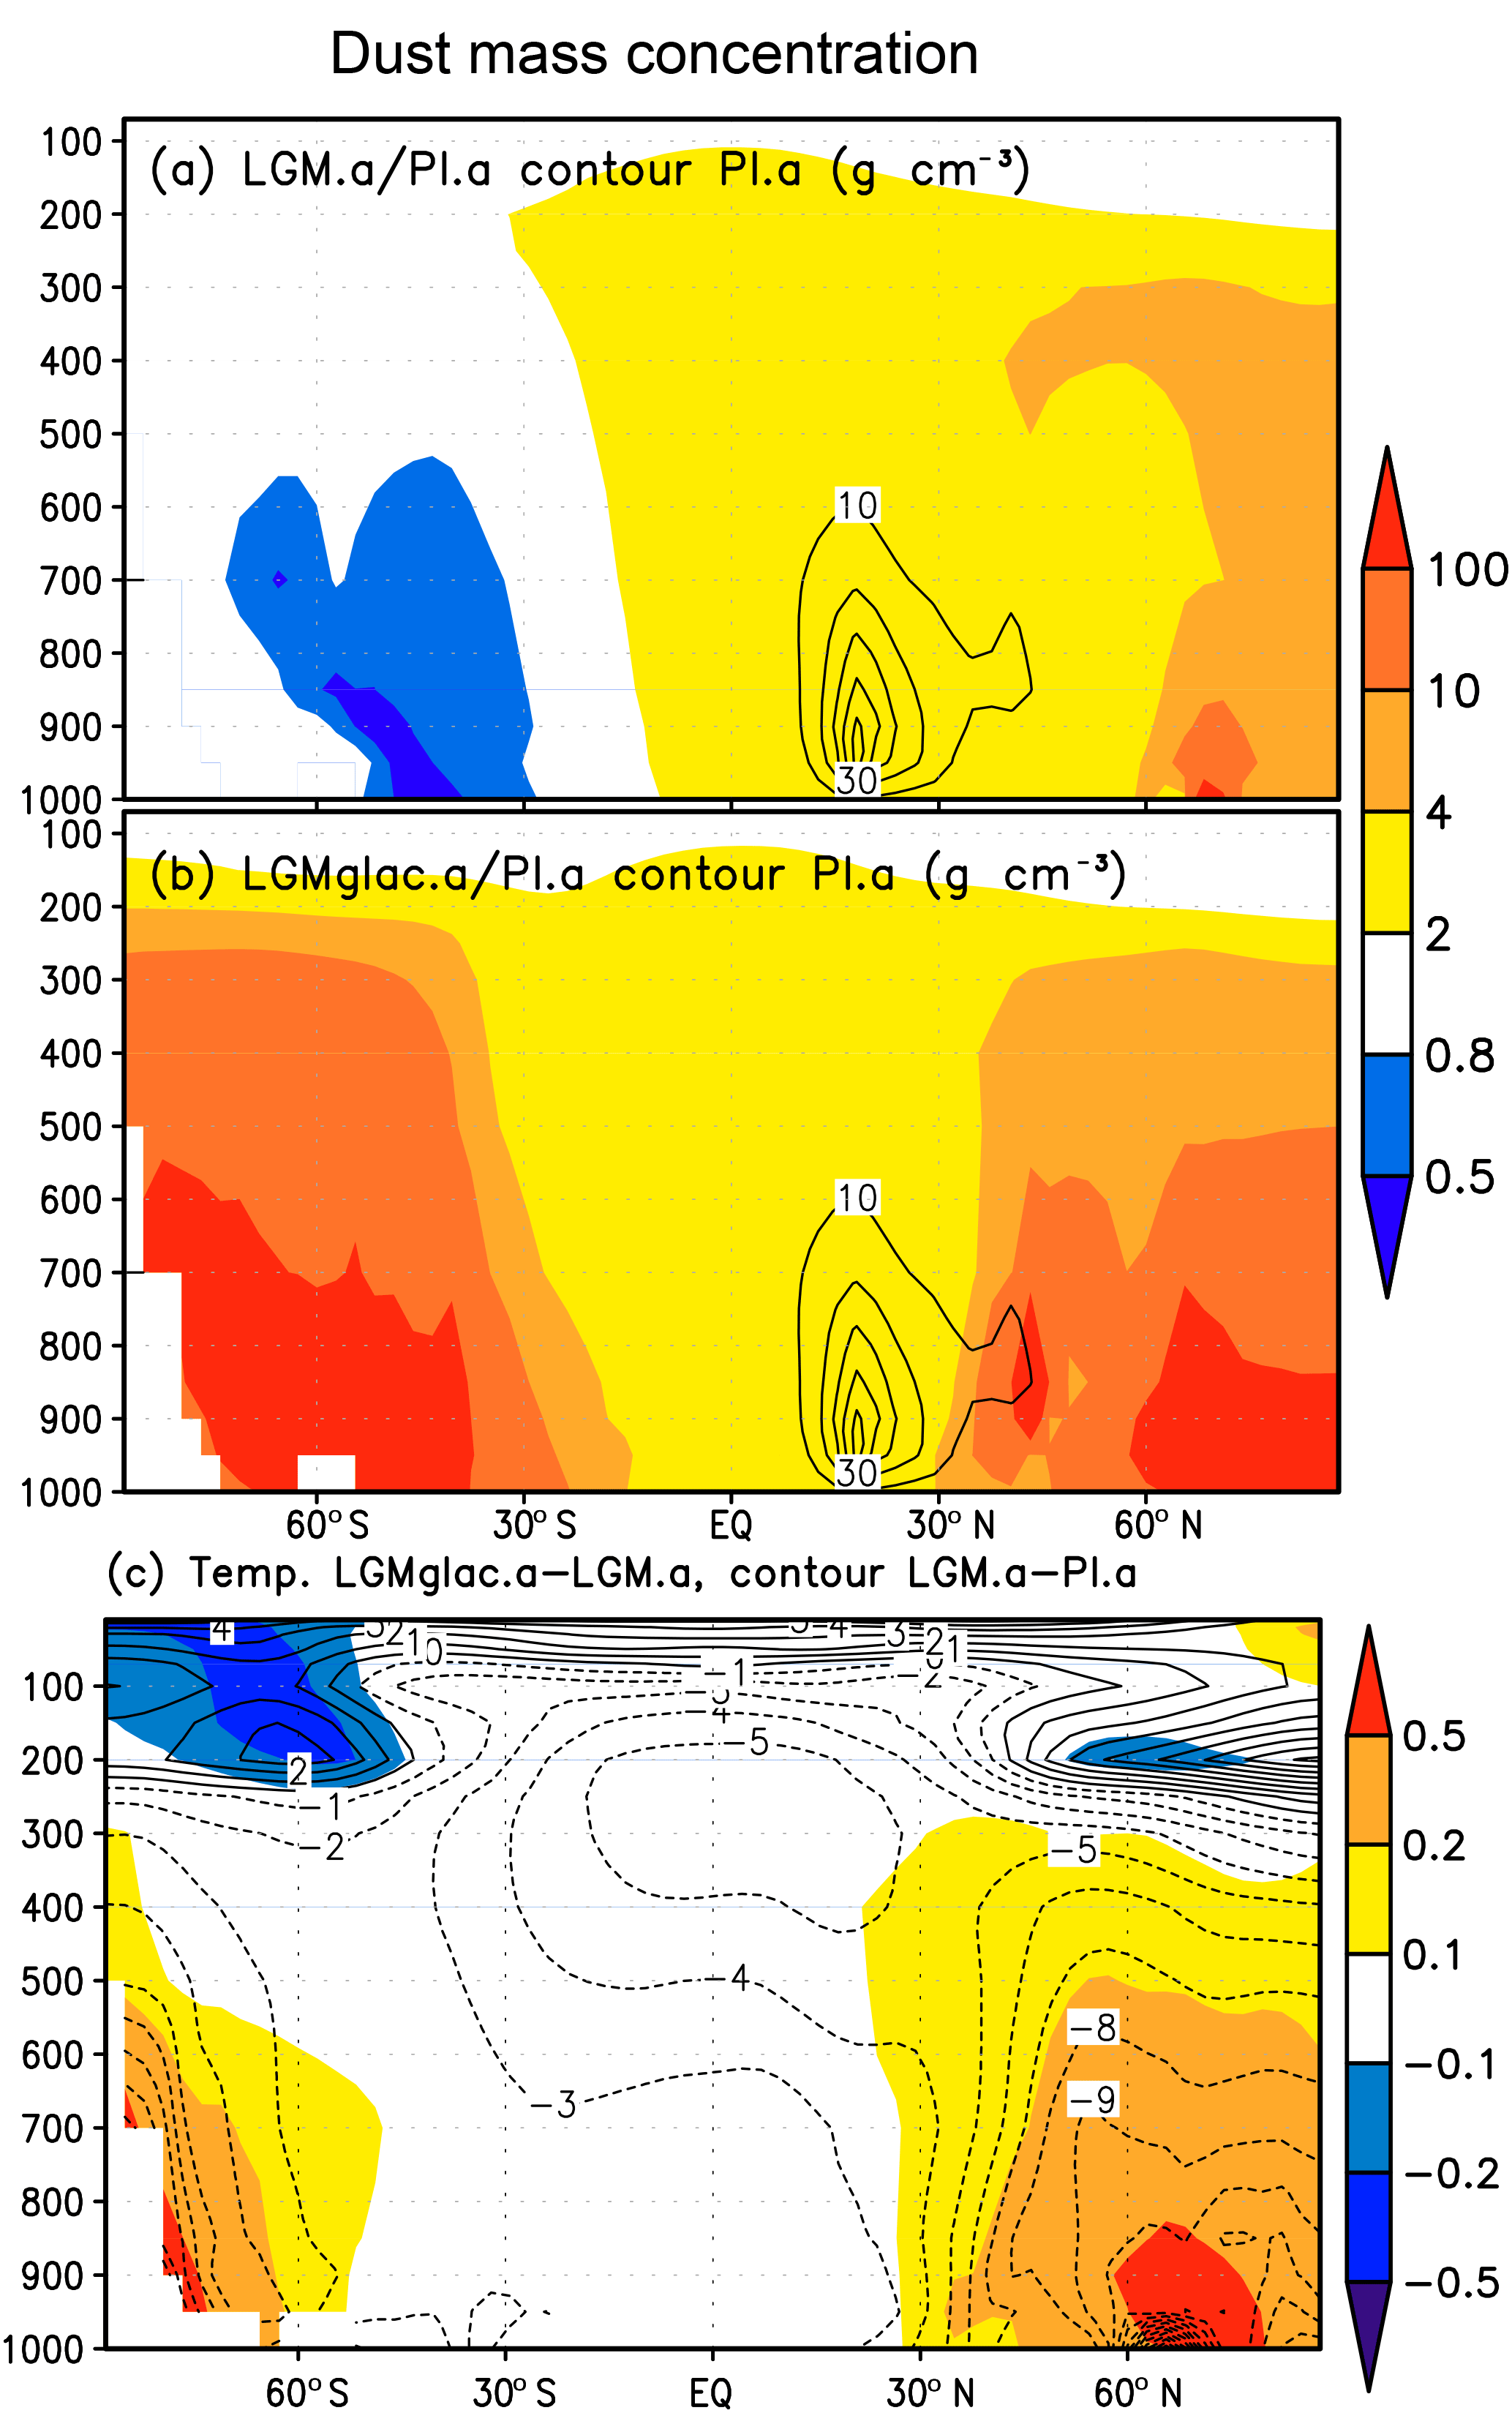
Figure 3All panels are zonal mean height plots. Ratio of the dust mass concentration for (a) LGM.a ∕ PI.a, (b) LGMglac.a ∕ PI.a, and (c) temperature change for LGMglac.a–LGM.a. Contour lines in (a) and (b) show the dust mass concentration for PI.a (g cm−3) and in (c) the temperature change for LGM.a–PI.a (∘C).
Now, we focus on imposed glaciogenic dust. The surface temperature at the height of 2 m is influenced by glaciogenic dust and the difference in LGMglac.a relative to LGM.a is presented in Fig. 6c. The warming (i.e. less cooling compared with the PI.a results) is pronounced in the high latitudes in contrast to the expectation of the likely cooling effect of the dust (IPCC, 2013).

Figure 4Model–data comparison of dust deposition flux (g m−2 yr−1) estimated from the ice and sediment core data archives obtained from Kohfeld et al. (2013) and bulk data from Albani et al. (2014): (a) PI.a, (b) LGM.a, and (c) LGMglaca. Model–data scatter plots for (d) PI.a, (e) LGM.a, and (f) LGMglaca. Colours and marks represent areas and core types, i.e. red: Eurasia, brown: North America, orange: Indian Ocean, pink and light blue: Atlantic and Pacific oceans in the Northern Hemisphere, respectively, green and light green: Atlantic and Pacific oceans in the Southern Hemisphere, respectively, blue: Southern Ocean, turquoise blue: Arctic, and dark blue: Antarctica. Crosses, circles, and diamonds represent terrestrial, marine core, and ice core sediments, respectively.
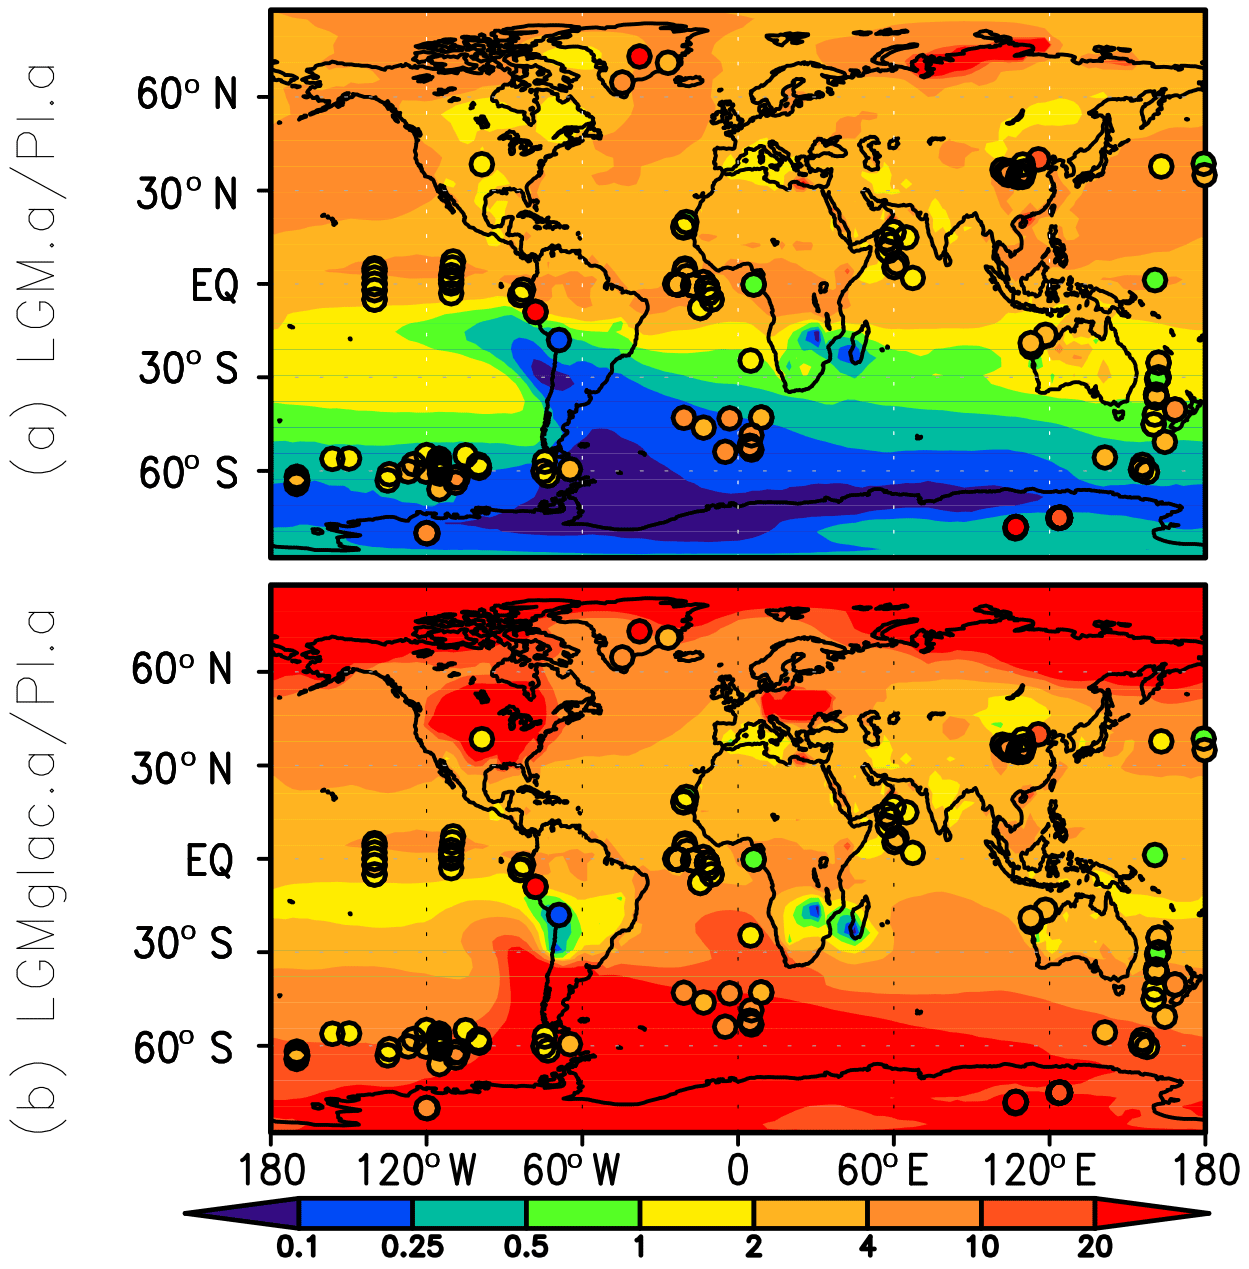
Figure 5Model–data comparison of the ratio of dust deposition flux estimated from the ice and sediment core data archives obtained from Kohfeld et al. (2013) and Albani et al. (2014): (a) LGM.a ∕ PI.a and (b) LGMglac.a ∕ PI.a.
The changes in the LGMglac.a result relative to the LGM.a result for the net, longwave, and shortwave downward radiation at the surface are presented in Fig. 7a, d, and g. The figures represent the total effect of the atmospheric loading of glaciogenic dust on radiation toward the Earth's surface. Figure 7g shows a negative anomaly in shortwave radiation near the strong sources of glaciogenic dust, as well as in the northern high latitudes and the edge of Antarctica. In contrast, a positive anomaly of longwave radiation in the LGMglac.a experiment is pronounced around Antarctica and in the northern high latitudes (Fig. 7d). While the negative anomaly in shortwave radiation dominates the net change near the areas of glaciogenic dust emission, the positive longwave anomaly dominates the region surrounding Antarctica. The radiative perturbation attributable to glaciogenic dust is detailed in the next section.
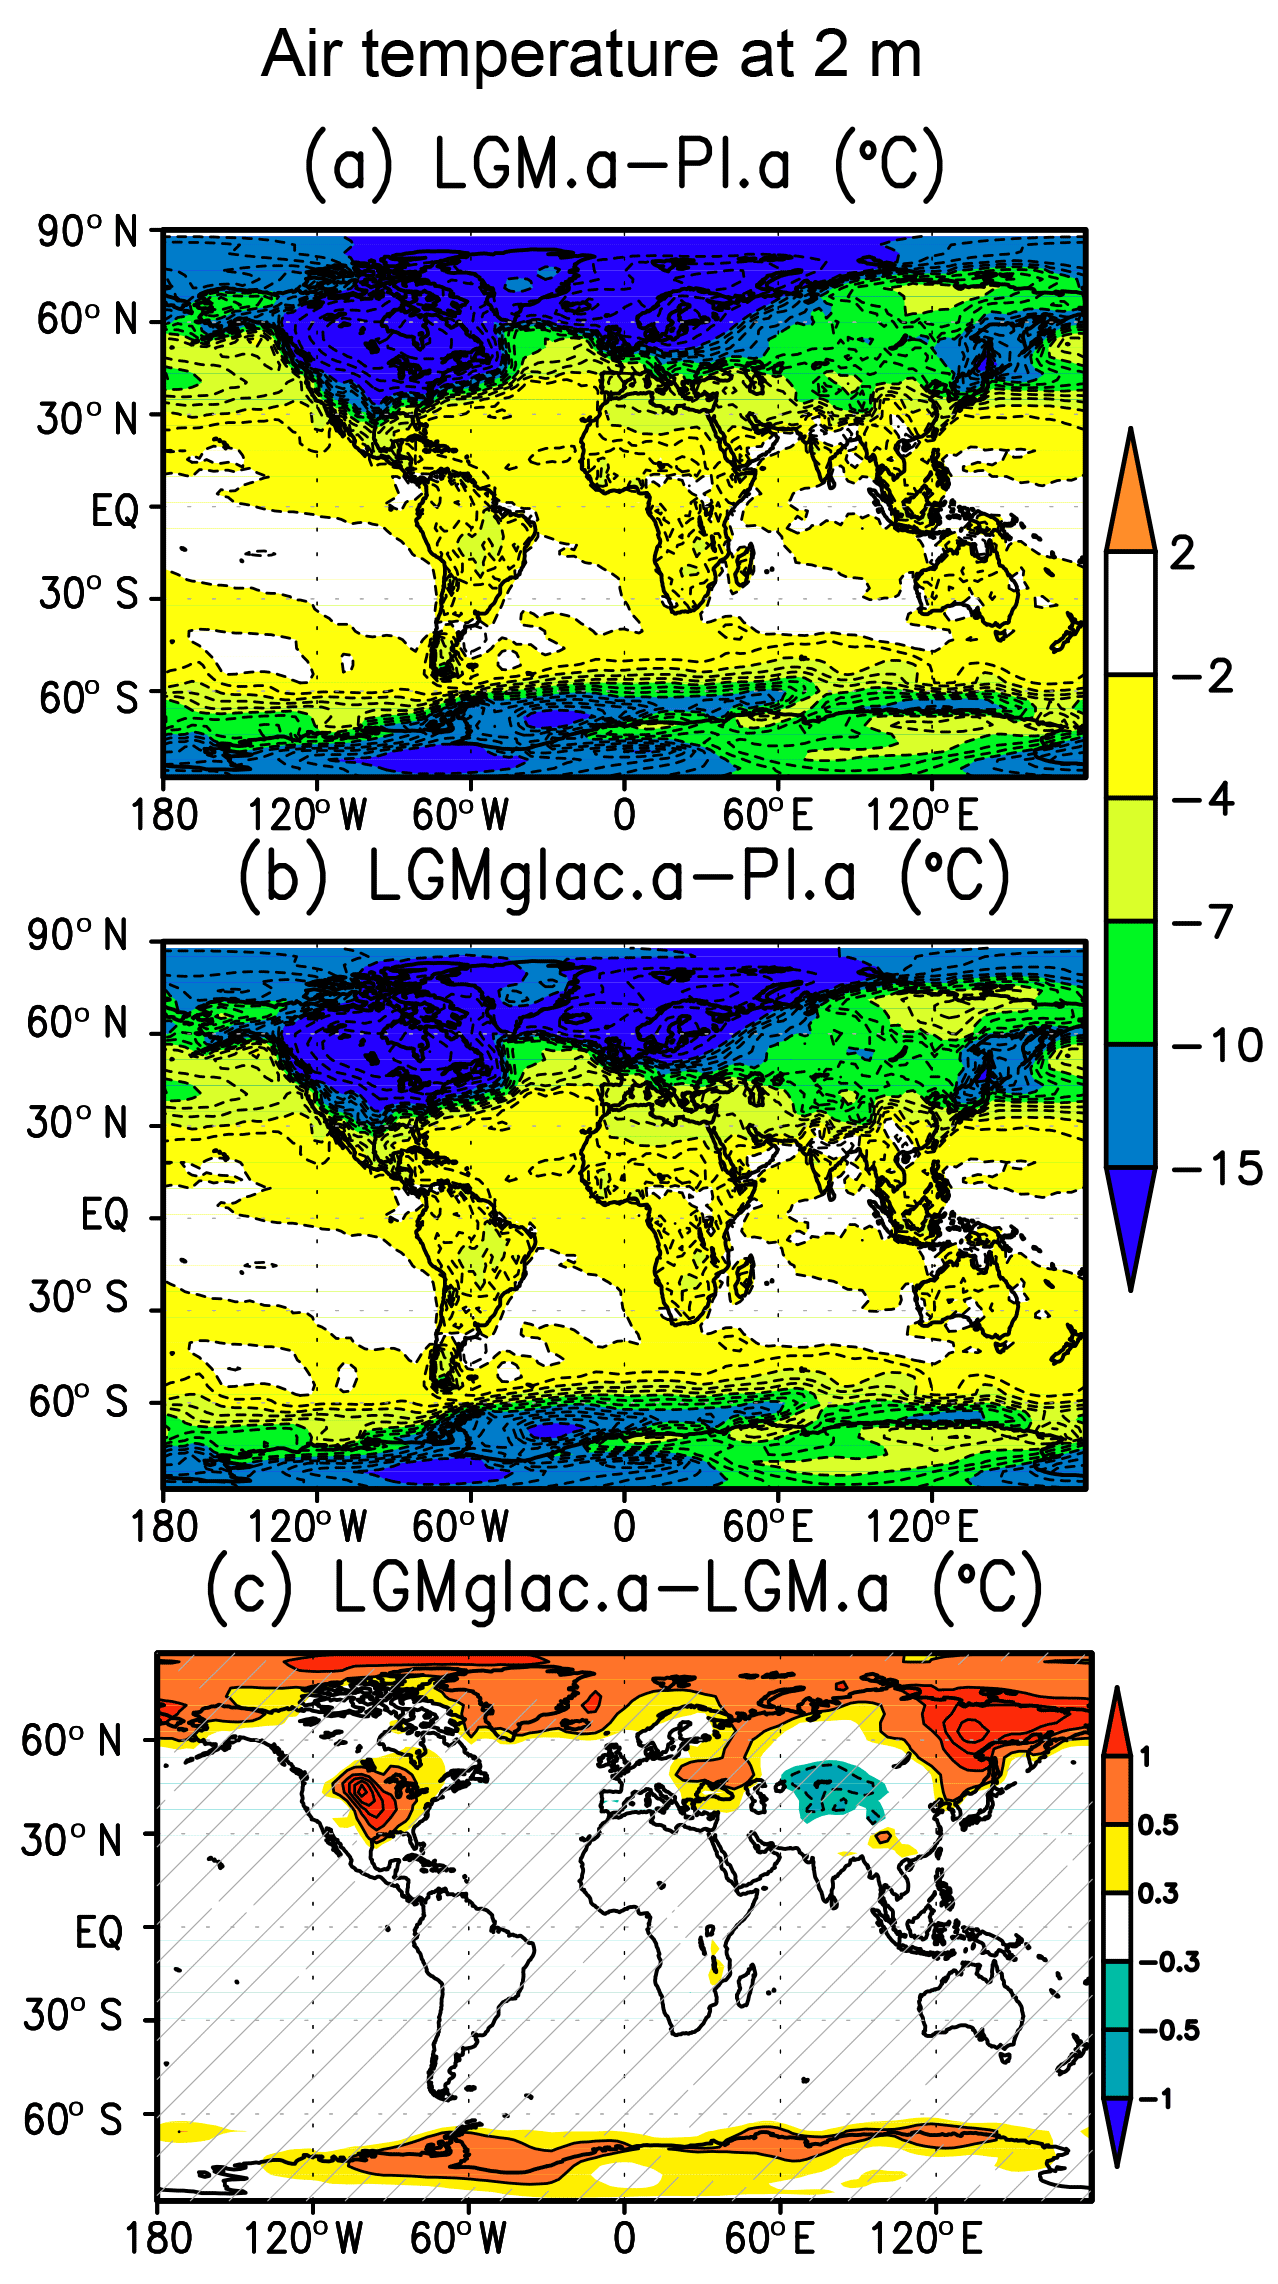
Figure 6Difference in surface temperature at 2 m of height (∘C) for (a) LGM.a–PI.a, (b) LGMglac.a–PI.a, and (c) LGMglac.a–LGM.a. Change is considered not significant at the 95 % confidence level in the hatched area based on a t test.
Figure 8 shows that warming of LGMglac.a–LGM.a south of 55∘ S is evident without the inclusion of the effects of the ageing of snow (LGMglac.naging.a–LGM.naging.a). This suggests the warming around Antarctica is not the result of snow ageing but that it follows from the change in the radiation balance in the atmosphere. Moreover, the magnitude of the warming is not significantly affected by ocean coupling (LGMglac.e–LGM.e). In contrast, more than 80 % of the warming in the Northern Hemisphere is the result of the ageing of the snow surface, as is evident by inspection of the LGMglac.naging.a–LGM.naging.a results (Fig. 8). The high dust deposition rate reduces the surface albedo as shown in Fig. S2 in the Supplement and leads to a reduction of reflected shortwave radiation, which overcomes the cooling effect of the dust loading in the atmosphere, resulting in warming (Fig. 6c). The warming in the Northern Hemisphere is most pronounced over eastern Siberia and central North America, where large amounts of glaciogenic dust are deposited and therefore where the albedo of the LGMglac.a experiment is reduced significantly. The snow in the LGMglac.a experiment thaws earlier in the year than in the LGM.a experiment over eastern Siberia. Substantial snowmelt over a large area within this region accelerates warming via albedo reduction. This is consistent with the results of Krinner about snow ageing preventing the accumulation of snow in this region. In contrast, in central North America, the snow is reduced compared with the LGM.a experiment but it is still significantly higher than the PI.a experiment. The position of the −2 ∘C isotherm averaged over June–August, which is the threshold of ice sheet retreat–extension (Ohmura et al., 1996), shifted northward by about 1∘ latitude, which is significantly less than the model resolution. Therefore, the effect of our dust flux on climate is lesser melting of the Laurentide Ice Sheet. However, we question whether the model is able to represent the appropriate ageing of snow under such a high dust deposition flux. As this is beyond the scope of this study, further evaluation of the effects of snow ageing are required.
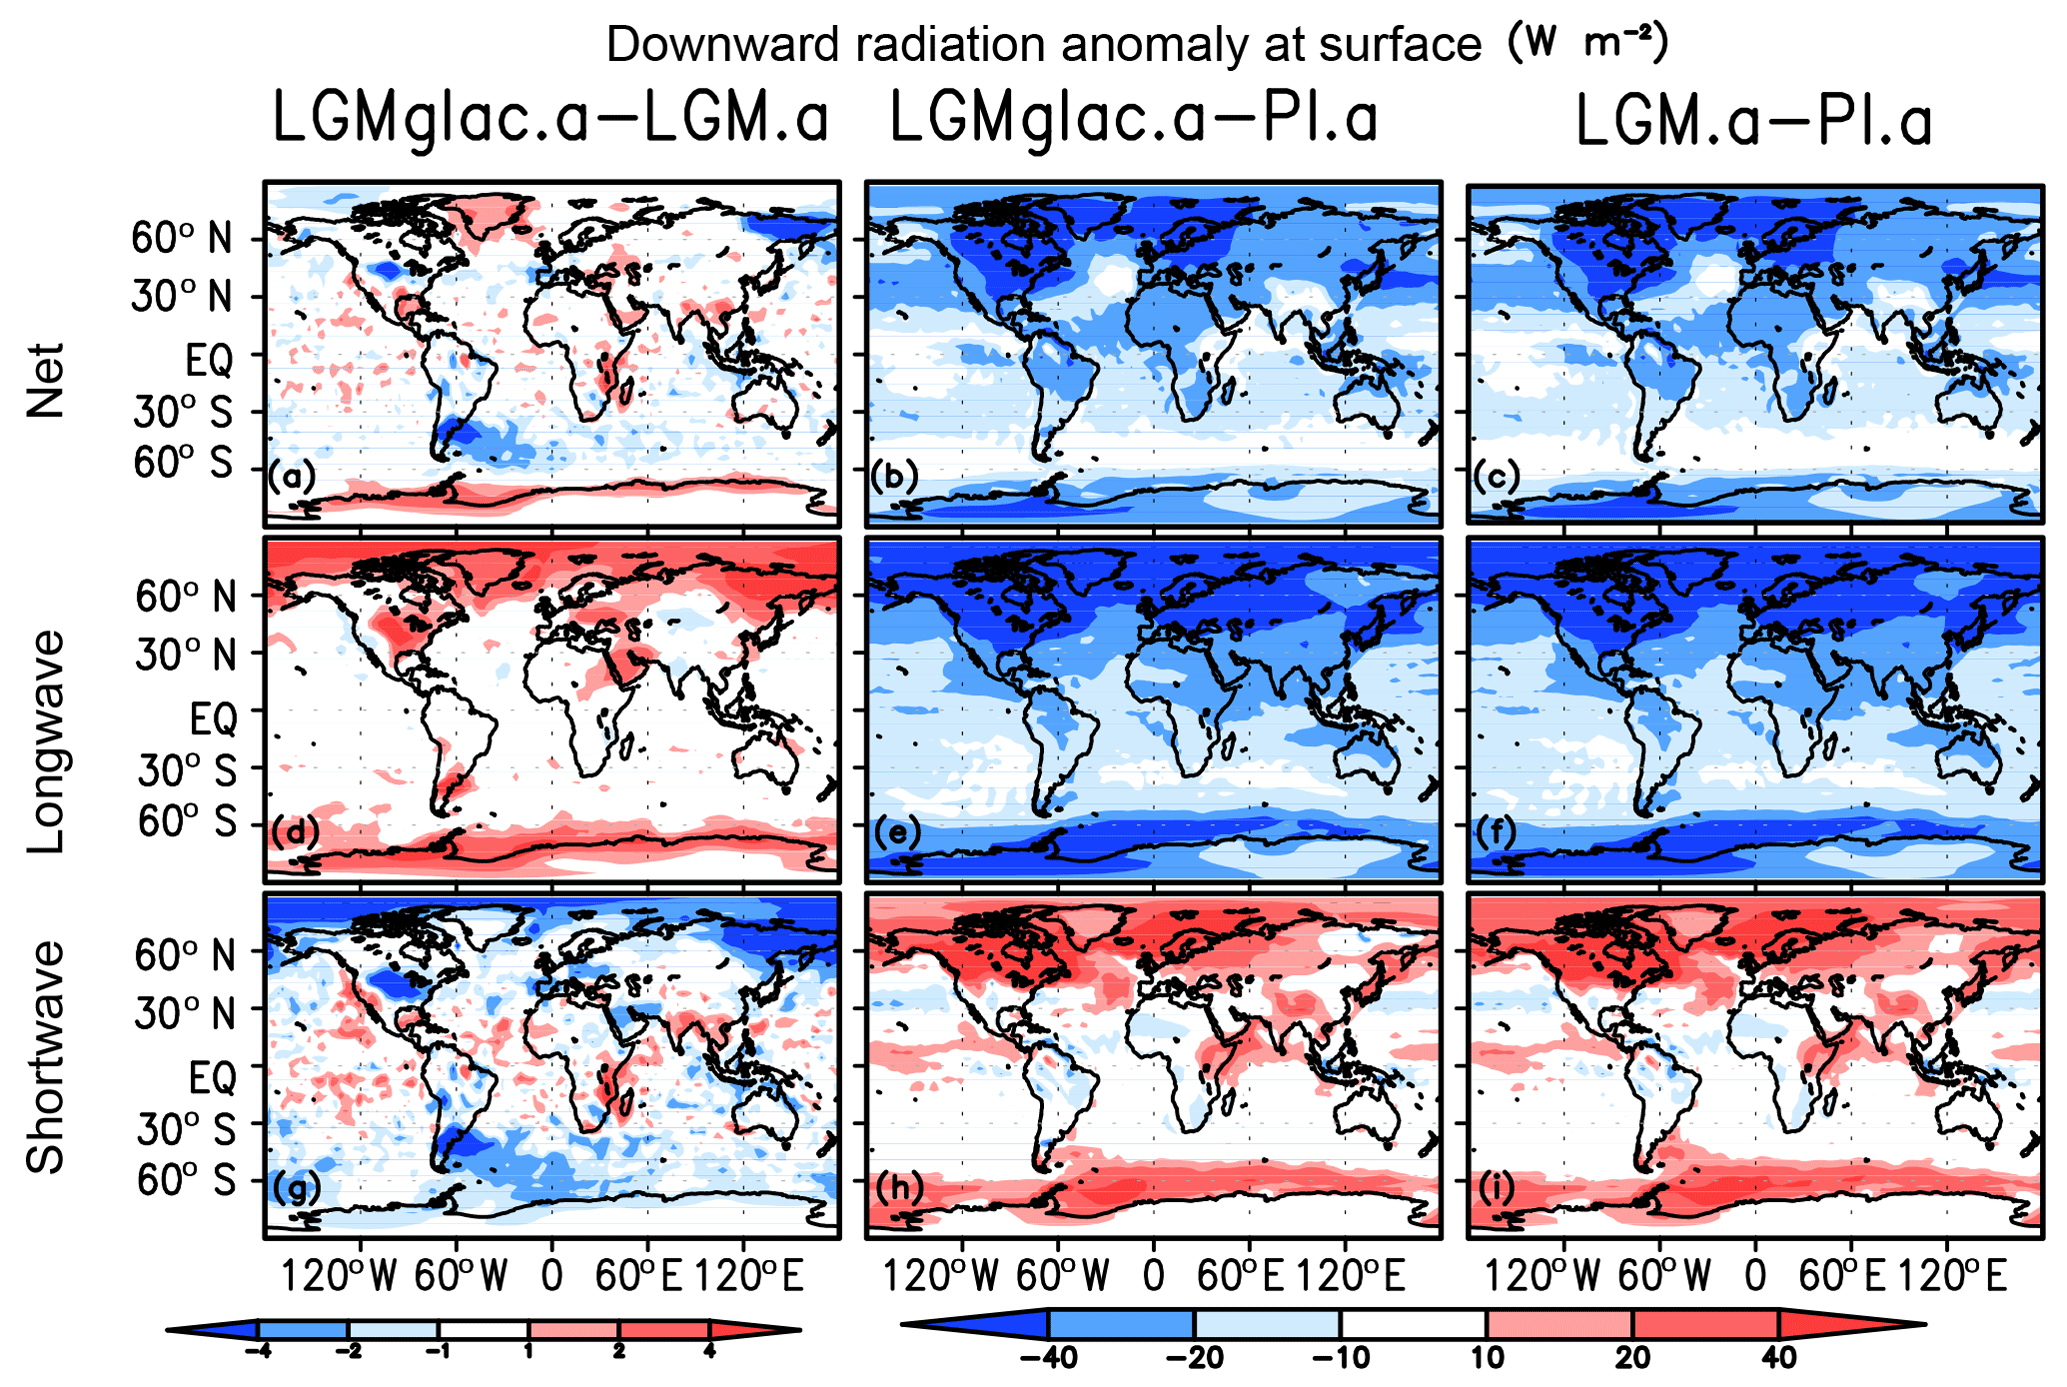
Figure 7Change in (a) net, (d) longwave, and (g) shortwave downward radiation at the surface for LGMglac.a–LGM.a (W m−2) (downward, positive). The same in (b), (e), and (h) for LGMglac.a–PI.a and (c), (f), and (i) for LGM.a–PI.a.
3.3 Dust-related aerosol–radiation and aerosol–cloud interactions
The aerosol–radiation and aerosol–cloud interactions were estimated using the same method as Takemura et al. (2009). The aerosol–radiation interaction was estimated based on the difference between a standard experiment including dust impacts and another experiment under the same conditions but without the dust affecting radiation. The aerosol–cloud interaction was estimated based on the difference between a standard experiment and another experiment under the same condition but without dust at all.
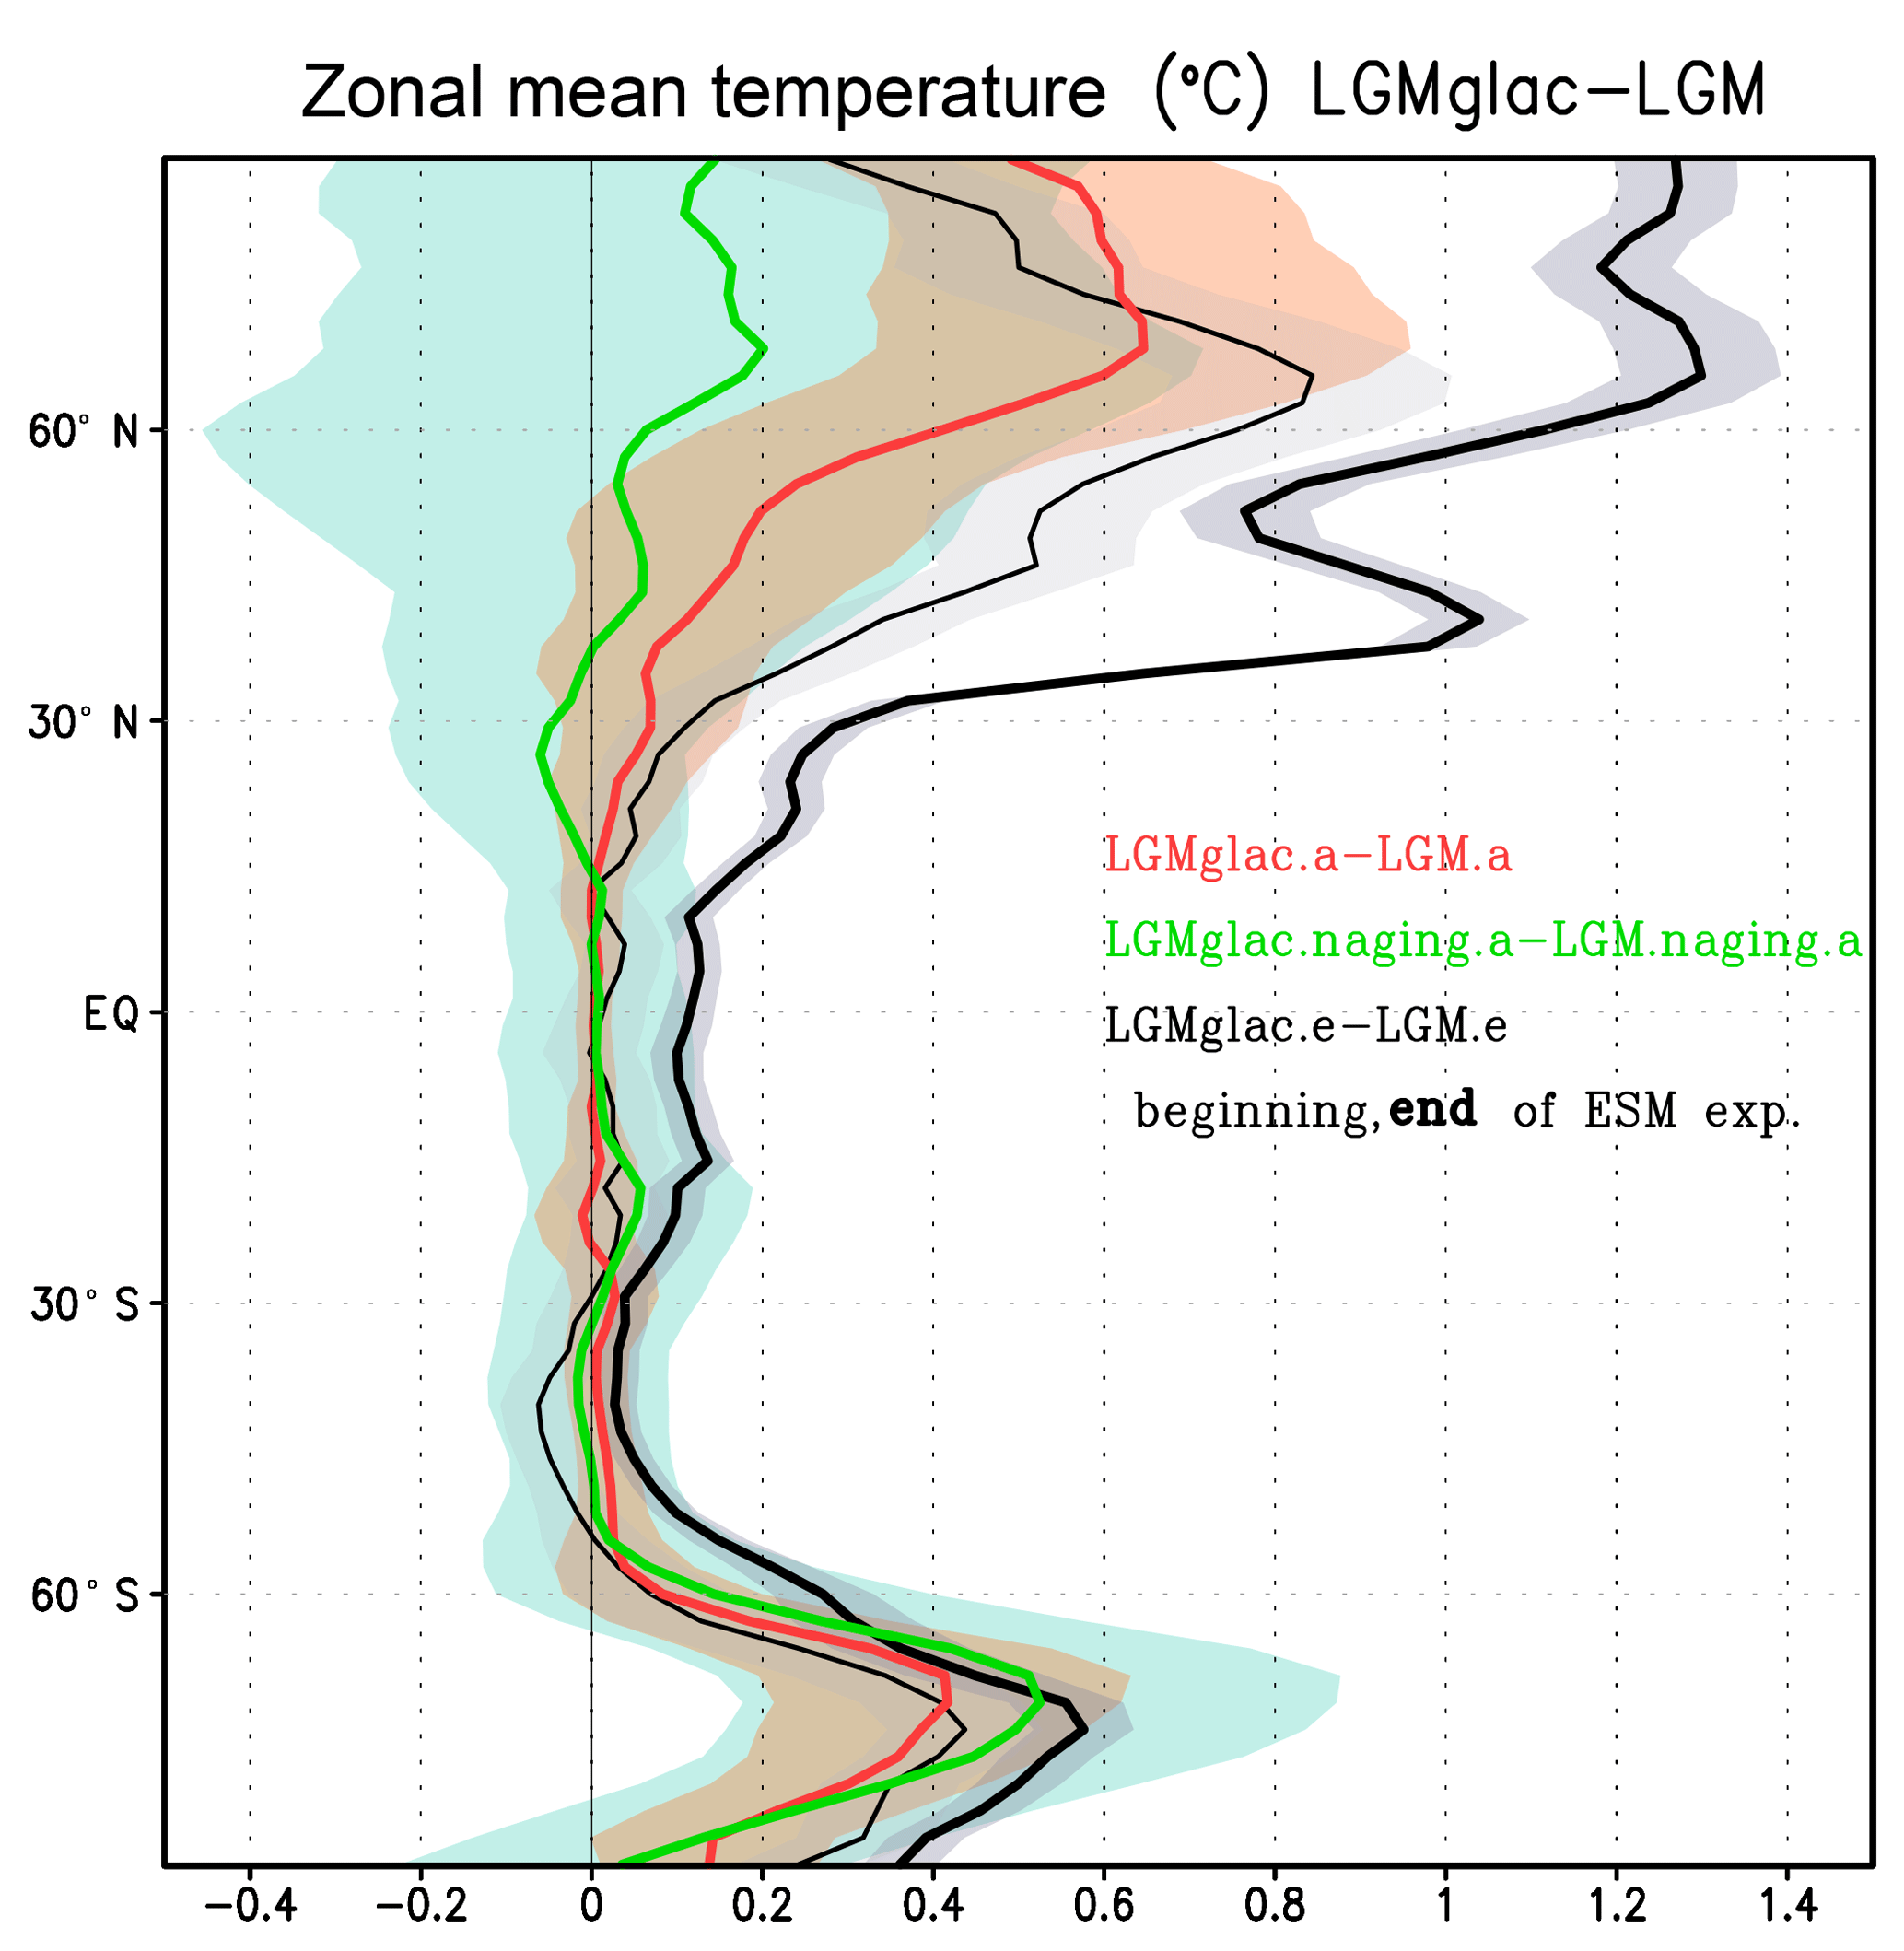
Figure 8Difference in 2 m air temperature between LGMglac and LGM. Red line denotes LGMglac.a–LGM.a. Green line denotes LGMglac.naging.a–LGM.naging.a, which means the change is not attributable to the ageing effect of snow. Thin and thick black lines denote LGMglac.e–LGM.e at the beginning (average of year 1 to 100 in Fig. 1) and the end (average of year 701 to 900) of the experiments, respectively. Shading represents the year-to-year standard deviation.
The net global mean radiative perturbation (aerosol–radiation and aerosol–cloud) of dust is one of cooling at the Earth's surface for all the experiments; i.e. PI.a: −0.99 W m−2, LGM.a: −1.50 W m−2, and LGMglac.a: −1.71 W m−2. The breakdown of the LGM experiments relative to the PI experiment for the change in the global mean radiative perturbation is listed in Table 3. The net change in the global mean aerosol–radiation interaction at the TOA is slightly positive for LGM.a–PI.a and it amounts to 0.12 W m−2 for the LGMglac.a–PI.a results. Albani et al. (2018) summarised the results from previous studies about aerosol–radiation interaction at the TOA. Our positive anomaly at the TOA is located around the upper end of previous studies, ranging from about −3 to 0.1 W m−2. On the other hand, the change at the surface is negative both with (−0.21 W m−2) and without (−0.30 W m−2) glaciogenic dust. The change at the surface is of similar magnitude to the findings of previous studies (e.g. −0.25 and −0.56 W m−2 with and without glaciogenic dust in Mahowald et al. (2006b), −0.23 W m−2 in Takemura et al. (2009), and −0.26 W m−2 in Albani et al., 2014), and it is caused primarily by changes in shortwave radiation. The net change in the global mean aerosol–cloud interaction at the TOA for the LGM.a–PI.a result is −0.36 W m−2. Both the shortwave and longwave radiation increased with glaciogenic dust, resulting in a net change of −0.39 W m−2. At the surface, without glaciogenic dust, there is net negative reduction in comparison with the TOA. With the inclusion of glaciogenic dust, however, the change at the surface is slightly more negative than the change at the TOA. Considering the total effect of dust, but without glaciogenic dust, the radiative perturbation change at the TOA relative to the surface is small, whereas the inclusion of glaciogenic dust results in surface cooling via aerosol–radiation interaction.
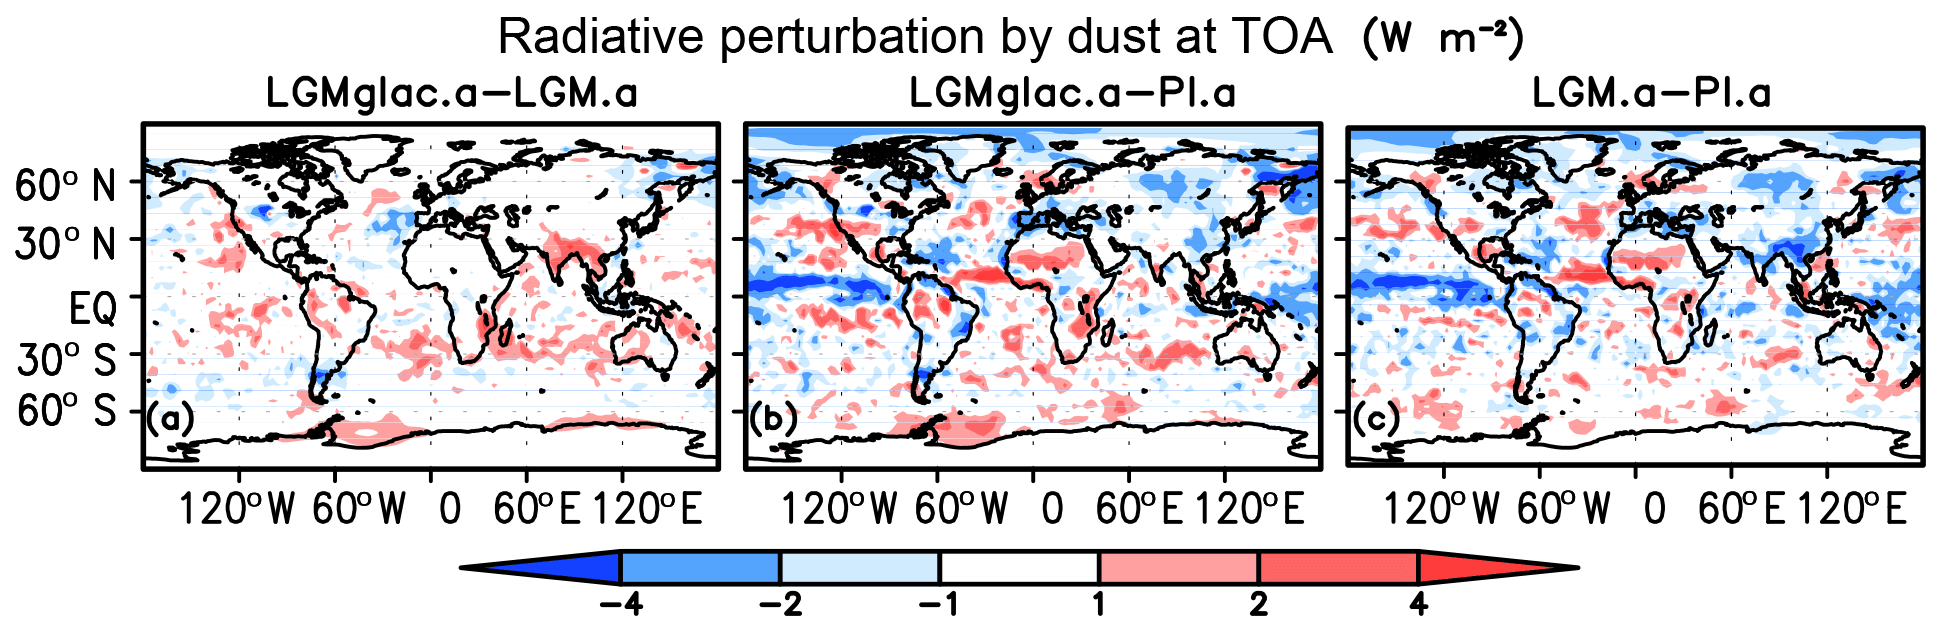
Figure 9Change in net radiative perturbation by dust at the top of the atmosphere (TOA): (a) LGMglac.a–LGM.a, (b) LGMglac.a–PI.a, and (c) LGM.a–PI.a.
Figure 9 shows the spatial distribution of radiative perturbation by dust at the TOA, which has a smaller difference between the LGMglac.a and LGM.a results compared with the surface (Fig. 10a). At the TOA, although the influence of glaciogenic dust from the pampas region is distributed over the Southern Ocean, the positive longwave and negative shortwave radiation almost cancel each other out. There are local negative effects over the strong sources of glaciogenic dust but the amplitudes are much smaller than at the surface (Figs. 9a and 10a). Figure S3 in the Supplement shows the LGMglac.a–LGM.a anomaly of aerosol–radiation and aerosol–cloud interactions for the TOA and the surface; it also presents the same information but without the snow ageing effect. The panels clarify the fact that the effect of snow ageing is independent from radiative perturbation by dust load in the atmosphere. The figure also clarifies the fact that the anomaly of the aerosol–radiation interaction tends to be significant at the level of 0.1 W m−2, whereas the significance of the anomaly of the aerosol–cloud interaction is difficult to determine. Nevertheless, the positive anomaly around Antarctica at the surface is significant. Therefore, although glaciogenic dust changes the TOA radiation budget only marginally, it heats and/or cools the atmosphere and causes a greater change in the radiation budget at the surface. The global mean change resulting from the addition of glaciogenic dust is cooling (−0.19 W m−2), but with local atmospheric heating over the high latitudes. Hereafter, we investigate the changes in the spatial distribution and strength of radiation at the surface under different climatic conditions.
Table 3LGMglac.a–PI.a and LGM.a–PI.a changes in global mean radiative perturbation by dust (a) at the surface and (b) at the top of the atmosphere (TOA) (W m−2).
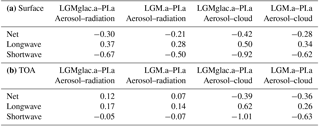
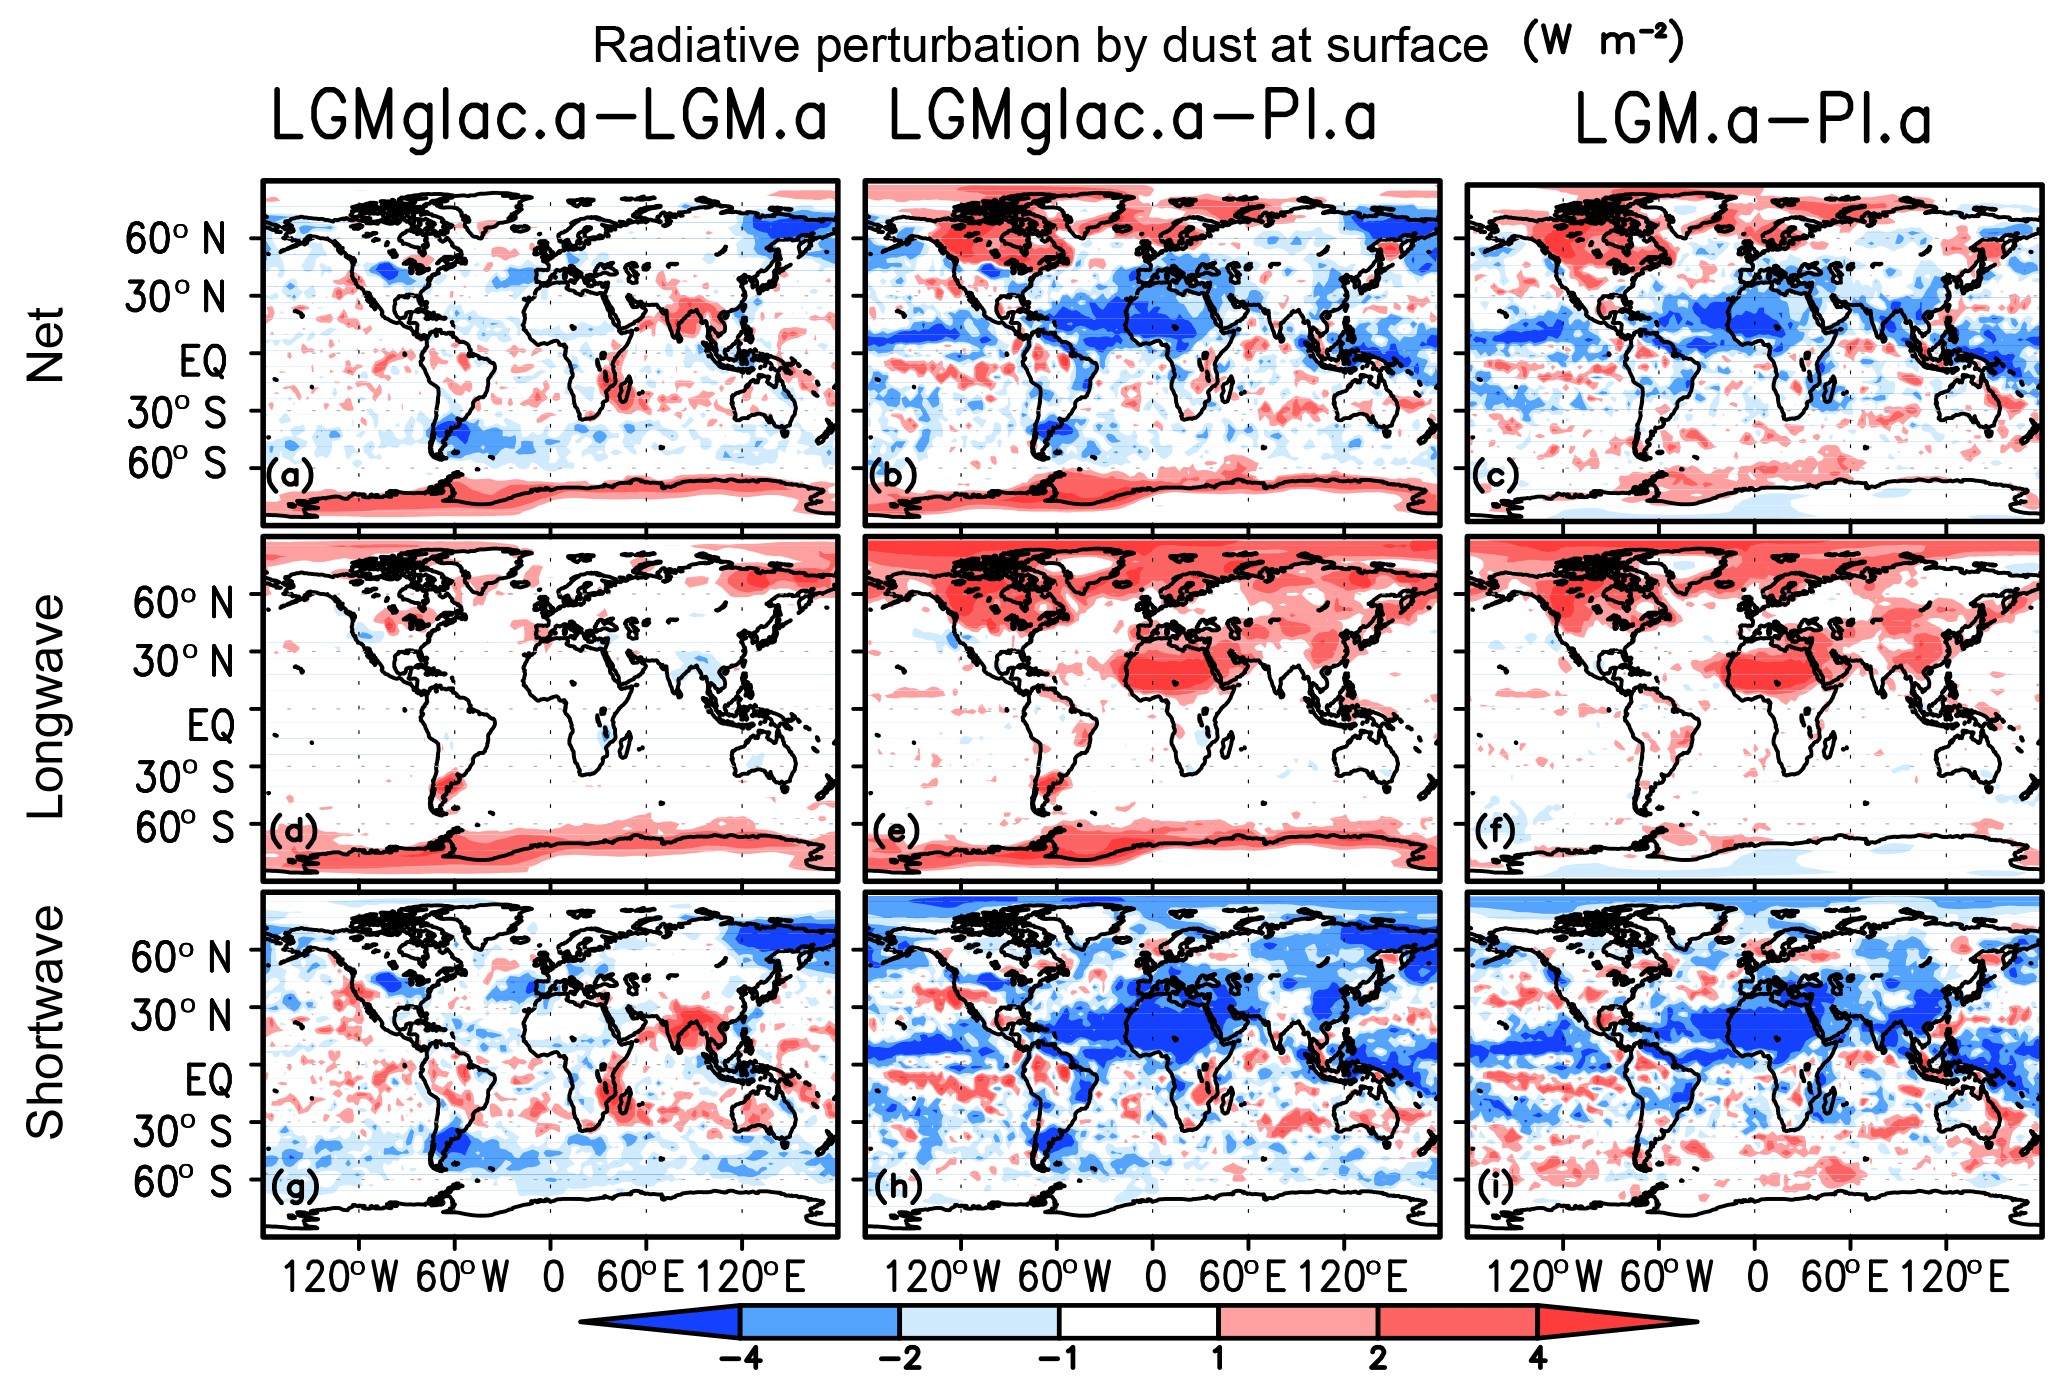
Figure 10Change in net radiative perturbation by dust at the surface: (a) LGMglac.a–LGM.a, (b) LGMglac.a–PI.a, and (c) LGM.a–PI.a. Decomposition of net change for longwave radiation: (d) LGMglac.a–LGM.a, (e) LGMglac.a–PI.a, and (f) LGM.a–PI.a; for shortwave radiation: (g) LGMglac.a–LGM.a, (h) LGMglac.a–PI.a, and (i) LGM.a–PI.a.
Figure 10 shows the change in the net radiative perturbation due to dust at the surface for the LGMglac.a–LGM.a, LGMglac.a–PI.a, and LGM.a–PI.a experiments. The aerosol–radiation interaction dominates near the massive dust sources, e.g. the Sahara Desert. Except for such regions, the aerosol–cloud interaction dominates the radiative perturbation. The addition of glaciogenic dust acts to reduce shortwave radiation. The negative radiative perturbation is distinct near the emission areas. In contrast, for longwave radiation, a general positive radiative perturbation resulting from glaciogenic dust is obvious, especially near the strong sources of dust and at the edge of Antarctica. The negative shortwave radiation forcing overcomes the positive longwave radiation forcing near the sources of glaciogenic dust. However, the positive longwave radiative perturbation plays a role in the regions surrounding Antarctica. The higher dust loading in the higher troposphere in the Southern Hemisphere promotes the generation of cloud ice nucleation and high-level clouds, especially in the regions surrounding Antarctica, likely resulting in an enhanced greenhouse effect, which warms the lower troposphere (Figs. 3c and 11). Because the dust deposition flux of the standard LGM.a experiment is higher than the PI.a experiment in the Northern Hemisphere but lower in the Southern Hemisphere, the impact of glaciogenic dust might be more efficient in the Southern Hemisphere. Sagoo and Strelvmo (2017) reported global mean cooling in a “high” dust experiment, consistent with our results (Table 3). The discrepancies could arise because of different cloud ice nuclei schemes, their experimental setting (no change in land from their control), and/or because their sources of high dust emission were located mainly in desert areas, whereas our glaciogenic dust sources are located in the high latitudes.
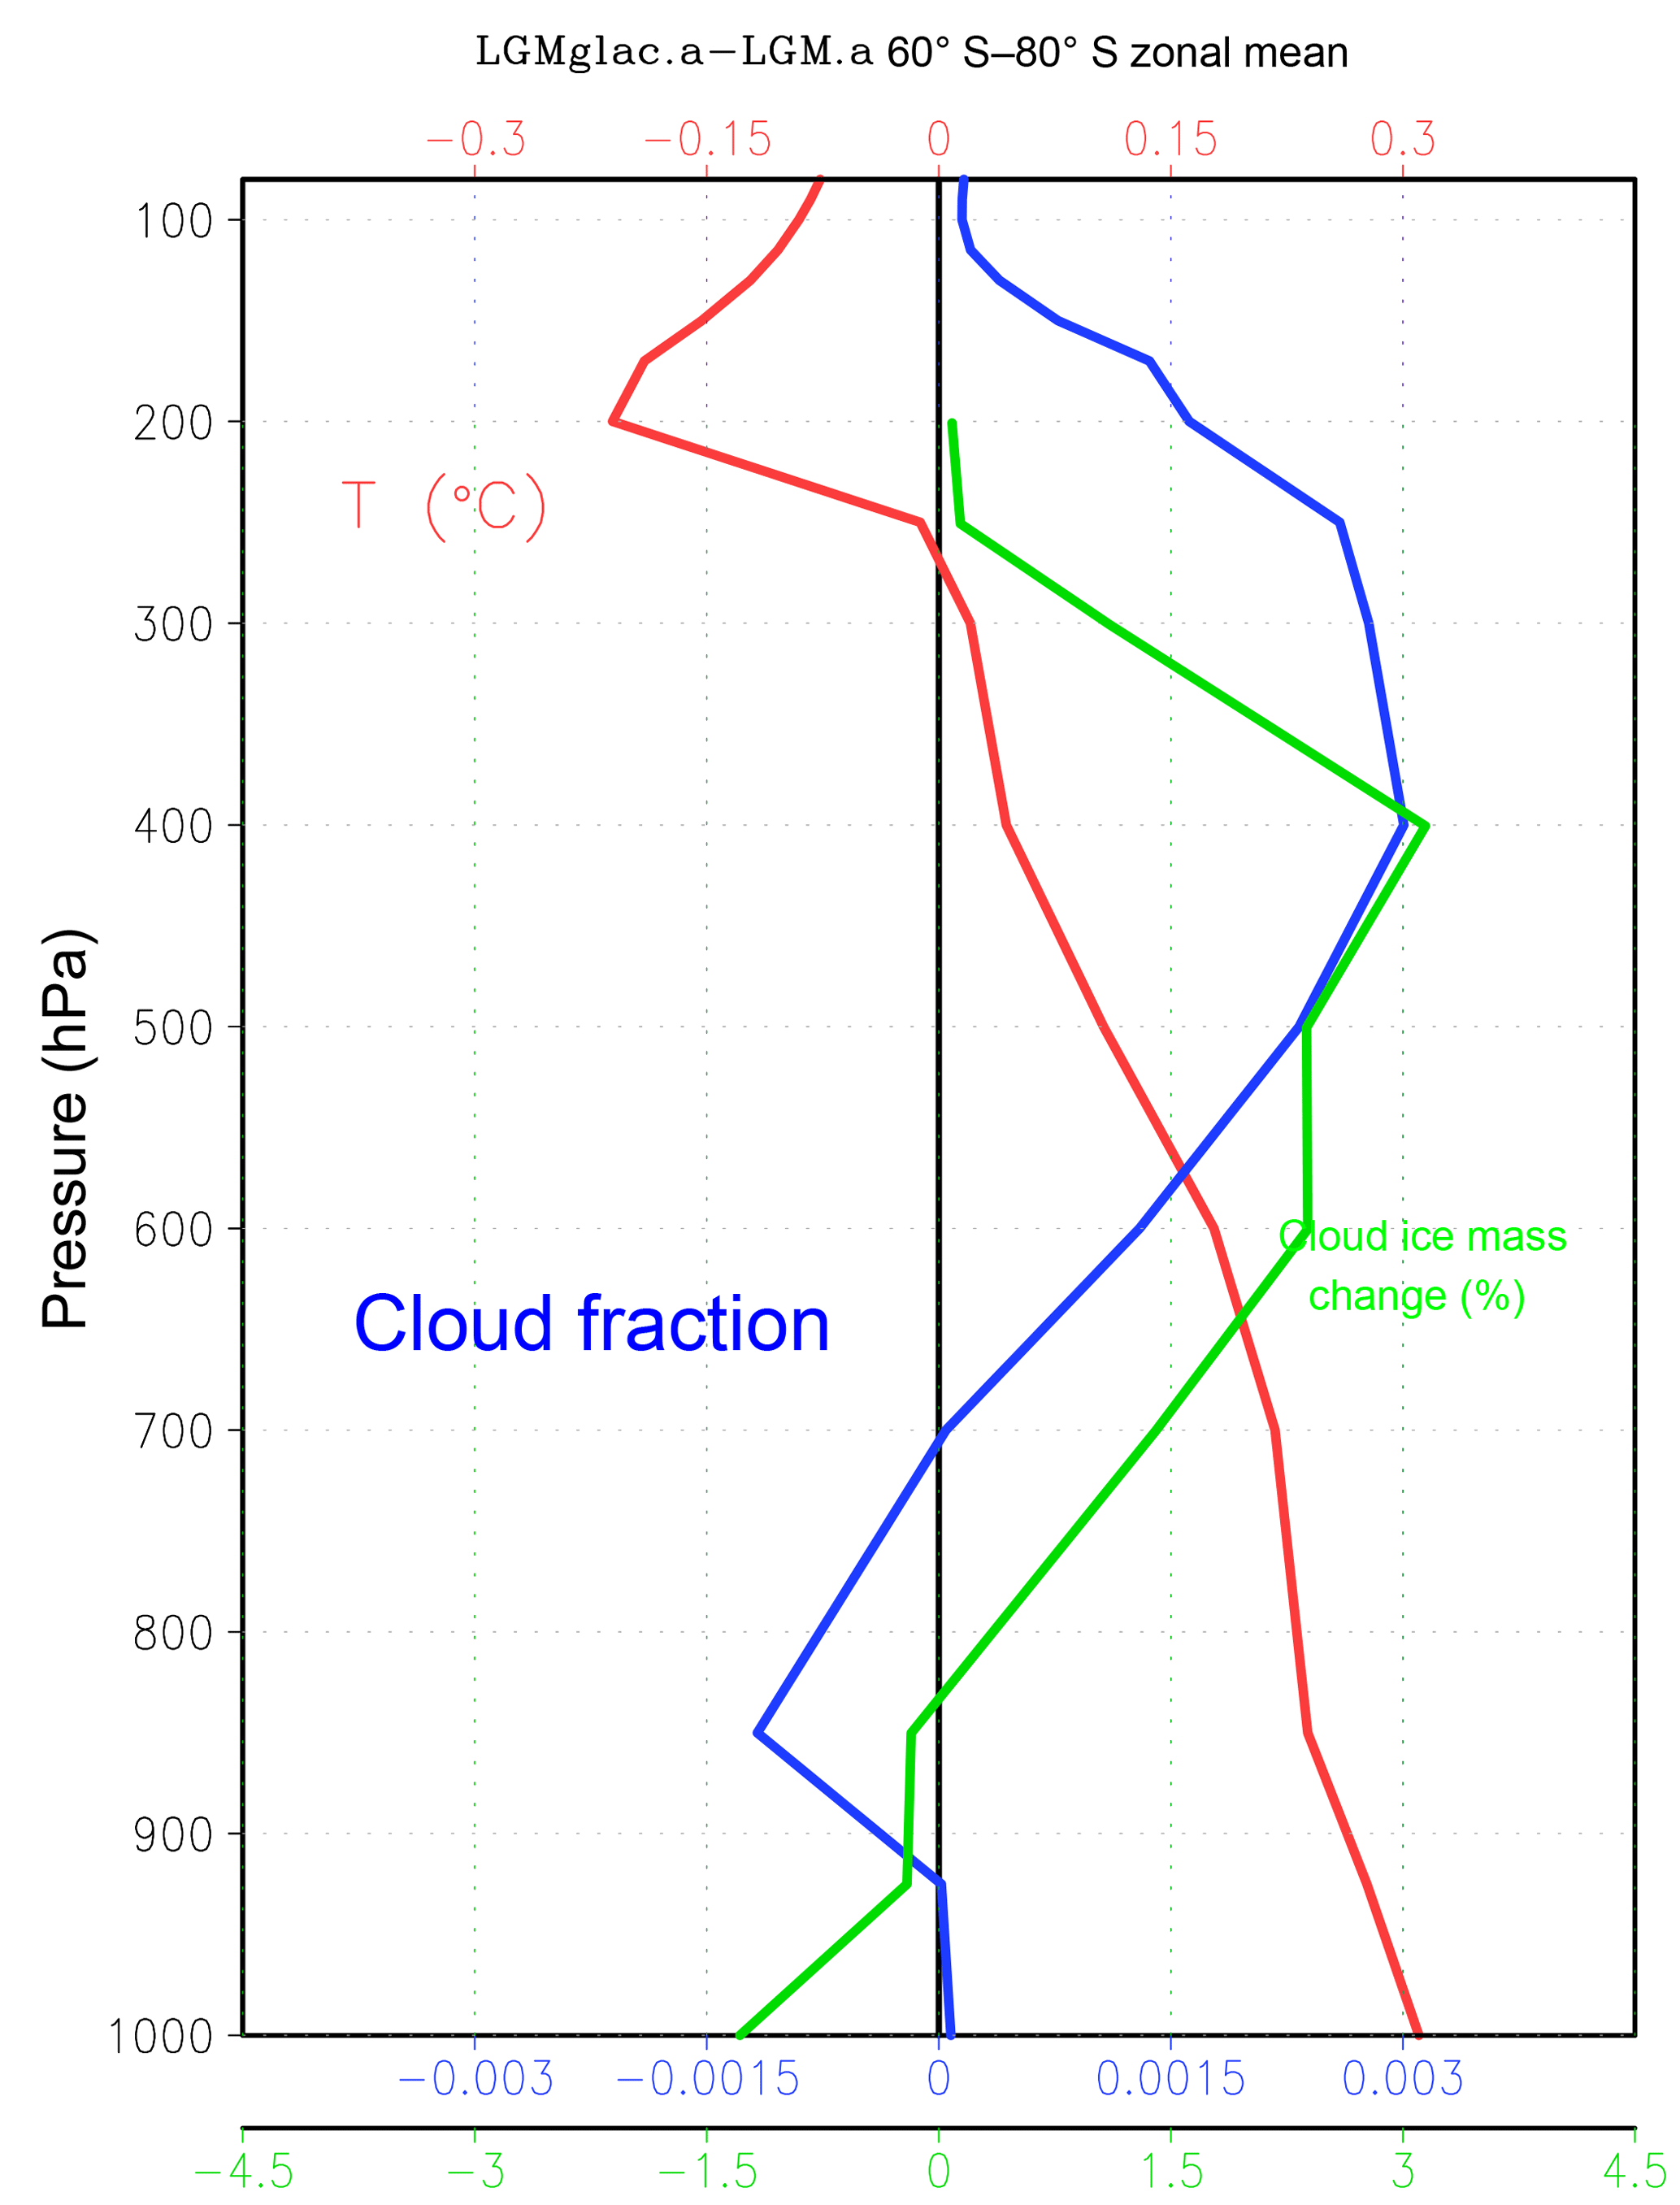
Figure 11Averaged value height plot (60–80∘ S) for change in LGMglac.a–LGM.a for temperature (red), cloud fraction (blue), and cloud ice mass concentration (green). Note that the cloud ice mass concentration is plotted only at values exceeding kg kg−1 in LGM.a.
3.4 Influence of glaciogenic dust on the ocean
We extended the LGM.e experiment by 800 years beyond the original PMIP3 period (Fig. 1) and the LGMglac.e experiment was conducted for 940 years. Because the temperatures become quasi-stable after year 600 in Fig. 1, the average of the final 300 years is used for the analyses. The strength of the Atlantic Meridional Overturning Circulation (AMOC) of LGM.e was reduced by about 10 Sv in the analysis period compared with the spin-up period and LGMglac.e. The strength of the abyssal cells (Fig. S4 in the Supplement) is more stable but with differences of a few Sverdrups between LGM.e and LGMglac.e, reflecting the AMOC state. The surface air temperature and SST changes according to the LGMglac.e–LGM.e results are presented in Fig. 12. The zonal mean anomaly of air temperature over land and scatter plots of the anomaly in the proxy data (Bartlein et al., 2011) and the anomaly of the corresponding model grids are shown in Fig. S5 in the Supplement. It illustrates the level of agreement between the model and the proxy archives. Pronounced discrepancy is evident in the northern high latitudes around 70∘ N, with some proxy data over Alaska suggesting warmer temperatures than PI, which is not resolved in all our LGM experiments and the other LGM experiment in PMIP3 models. Although the differences between LGM.e and LGMglac.e appear minor in comparison with the pollen proxy archive, LGMglac.e generally exhibits slightly closer agreement with the proxy data.
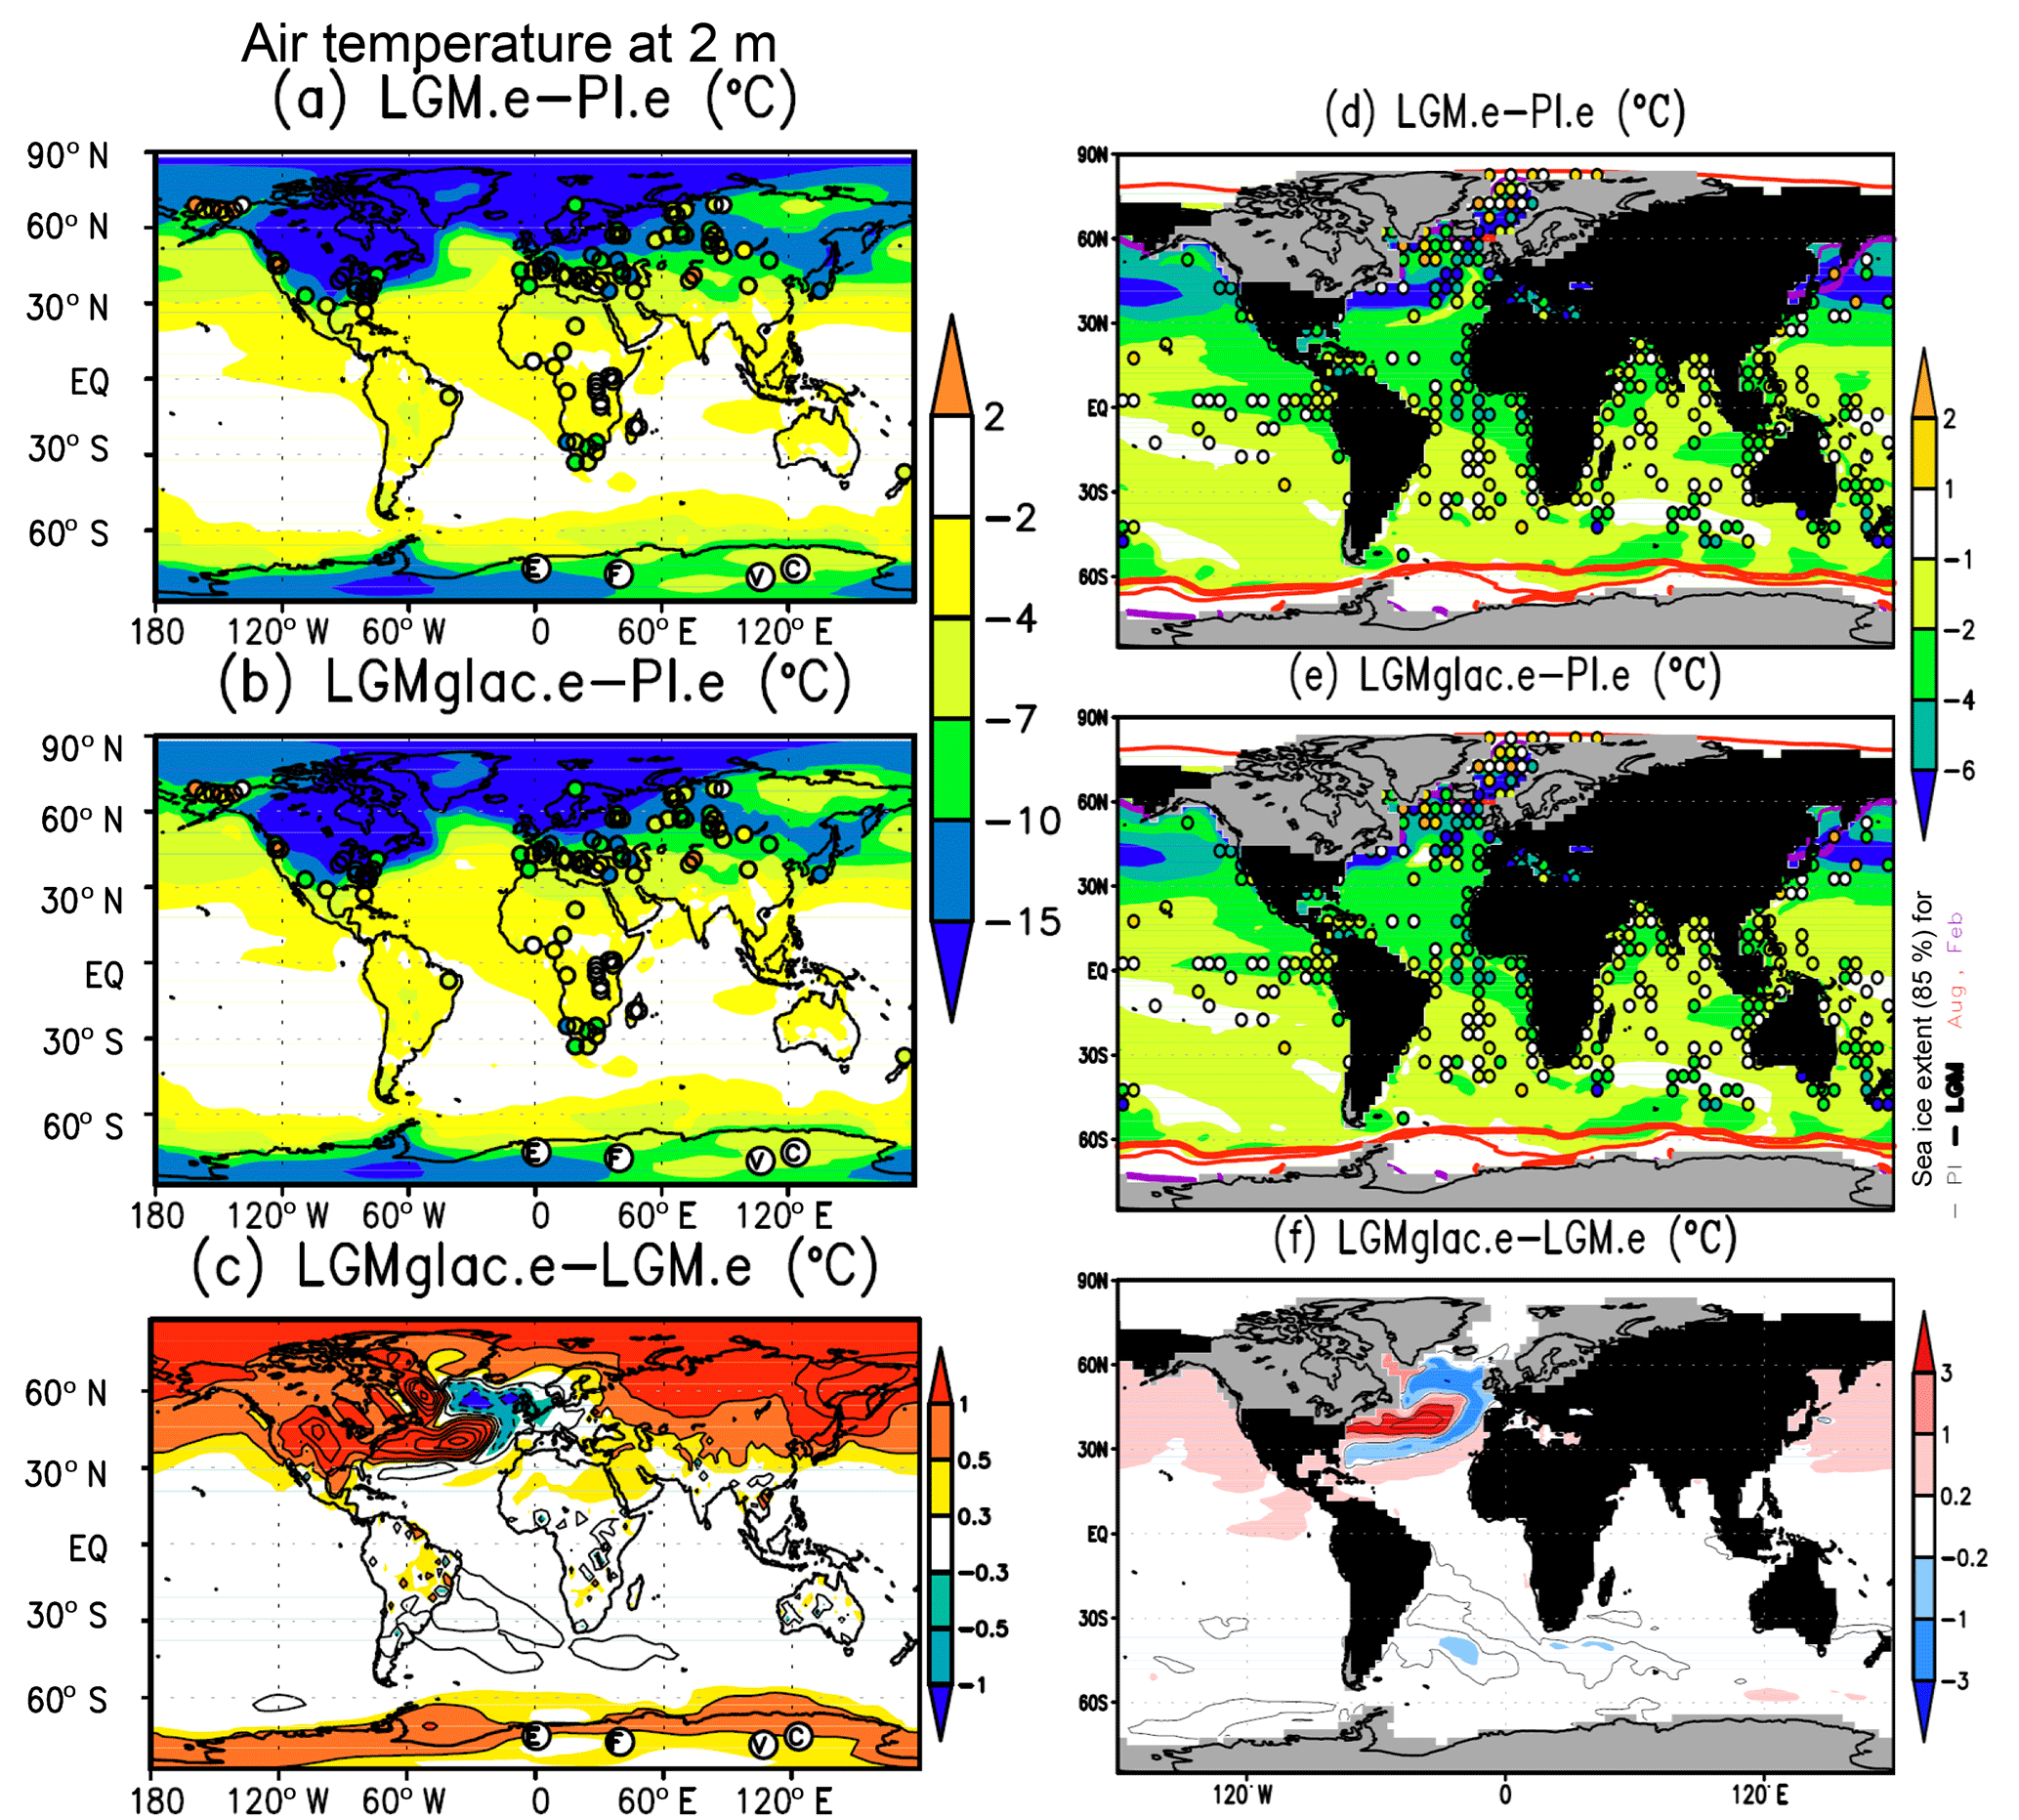
Figure 12Difference in surface temperature at 2 m of height: (a) LGM.e–PI.e, (b) LGMglac.e–PI.e, and (c) LGMglac.e–LGM.e. Coloured circles represent reconstructed temperature change by pollen proxy archives (Bartlein et al., 2011). Circled letters in Antarctica represent four ice core locations: E for EDML, F for Dome Fuji, V for Vostok, and C for Dome C. Sea surface temperature (SST) changes: (d) LGM.e–PI.e, (e) LGMglac.e–PI.e, and (f) LGMglac.e–LGM.e. Purple and red lines in (d) and (e) are 85 % sea ice concentration in February and August for PI (thin) and LGM (thick), respectively. Coloured circles represent MARGO SST reconstruction (MARGO project members, 2009). Light grey represents ice sheet areas.
Warming of the SST by the increased air temperature for LGMglac.e compared to LGM.e is obvious in the northern high latitudes, but the magnitude of the SST change is mostly below 0.5 ∘C. Locally strong warming along the Gulf Stream can be attributed to differences in the strength of the thermohaline circulation. Although investigation of the effect of dust on the thermohaline circulation is left for future work, we note that there might be a possibility of an effect of strong snow ageing in the Northern Hemisphere. In contrast, almost no change is calculated in the SST around Antarctica (Fig. 12f), which confirms that warming around Antarctica is not attributable to a change in the temperature of the ocean surface. Even after the extended integration times of our simulations, the high plateau over Antarctica, which is often the location of ice core sites, does not warm further (see e.g. circled letters in Fig. 12a–c). The LGMglac.e cooling from the PI.e results for this area is largely within the range of observational estimates (−7 to −10 ∘C) (Stenni et al., 2010; Uemura et al., 2012).
The SST anomaly in both the LGM.e-PI.e and the LGMglac.e–PI.e experiments appears reasonable in comparison with the LGM SST reconstruction shown by coloured circles (MARGO project members, 2009) (Fig. 12d and e). Local cooling of the ocean temperature is seen in the lee of the source of glaciogenic dust in Argentina, which would be caused by the negative radiative perturbation (Figs. 7 and 10a).
The zonal mean potential temperature and salinity anomalies in the Atlantic and Pacific oceans for the LGM.e–PI.e and LGMglac.e–PI.e experiments are presented in Figs. S6 and S7 in the Supplement. The positive anomalies in the Northern Hemisphere in Figs. S6c and 7c in the Supplement are attributable to the difference in the strength of the AMOC between LGM.e and LGMglac.e. The minor negative anomaly in the upper 100 m around 30∘ S in the Atlantic basin can be attributed to the effect of glaciogenic dust from the pampas area.
This study used the MIROC-ESM to investigate the effect of mineral dust aerosols on the glacial climate. The representations of climatology by the PI.a and PI.e simulations are considered reasonable for a state-of-the-art ESM (Watanabe et al., 2011). The cooling evident in the LGM.e experiment in comparison with the PI.e results is also generally comparable with palaeo-proxy archives (Fig. 12). The net radiative effect of global mean dust during the LGM is negative, which is the same trend as reported in previous studies (Albani et al., 2014; Hopcroft 2015; Mahowald et al., 2006b; Sagoo and Strelvmo, 2017). The global mean value is dominated by a high emission of dust from subtropical deserts. Takemura et al. (2009) suggested an LGM-PI anomaly of −0.9 W m−2 for the global mean aerosol–cloud interaction, whereas our anomaly is −0.36 W m−2 (Table 3), even though the results are based on models from the same model family. This difference in the global mean value is derived mainly from the different boundary conditions used for the PI experiment. The SST used by Takemura et al. (2009) (Ohgaito and Abe-Ouchi, 2009; Fig. 1) over the warm pool was about 1∘ warmer than the SST used in this study (Sueyoshi et al., 2013; Fig. 4), suggesting different convective activity and consequently different amounts of cloud ice and cloud water. This tropical difference influences the global mean value, suggesting that the SST bias of the control experiment could affect both regional and global mean radiative perturbations.
The focus of this study was on the high latitudes, with investigation of the effect of glaciogenic dust based on new LGMglac.a and LGM.a experiments using the AGCM part of the MIROC-ESM. The effect of the addition of glaciogenic dust on climate is evident mainly as warming in the high latitudes. The effect of mineral dust aerosol on climate is highly uncertain but cooling is relatively likely (IPCC, 2013). Our results suggest the effect of dust on climate is dependent on background condition. However, our glaciogenic dust worked differently from that demonstrated by Mahowald et al. (2006b) in the zonal mean. Especially for the northern high latitudes, areas are warmed via albedo reduction because of snow ageing and because of the prolonged disappearance of snow at certain periods, which is especially pronounced in eastern Siberia. Although the longwave radiative perturbation is negative near the strong sources of glaciogenic dust flux, the snow ageing effect overcomes this cooling, resulting in a net increase in temperature. The possibility of overestimating the ageing of snow effect or our simple emission method may influence the result.
The warming effect resulting from the addition of glaciogenic dust is also seen in areas surrounding Antarctica; however, it is not attributable to snow ageing but to longwave aerosol–cloud interactions. Accounting for this effect would alter the distribution of the scatter evident in Fig. 5.5d in the IPCC Fifth Assessment Report, which shows the correlation of eastern Antarctic cooling during the LGM with the future projection.
We adopted additional dust sources from Mahowald et al. (2006a, b) as a first step in which their glaciogenic dust flux was identified as a best fit to the DIRTMAP data archive. Nevertheless, as noted, their deposition flux does not correspond well to new proxy data at locations in the Southern Ocean. However, in our case, this mismatch can also be attributed to a feature of our model, i.e. insufficient dust emission from Australia and South Africa, which is caused mainly by an overestimation of soil moisture and the resulting excess of vegetation. It should be noted that there is still a possibility of contamination by ice-rafted debris at the edge of the sea ice extent. Our study draws attention to the high dust loading over the Southern Ocean that affects the increase in surface temperature in areas surrounding Antarctica, implying the necessity of investigating climate sensitivity to the amount of dust emission in future work. However, over the Southern Ocean, SST is affected minimally (Fig. 8) by the surface radiation change (Figs. 7a and 10a), probably because of the large heat capacity of the ocean.
Glaciogenic dust was imposed constantly in this study, which is not realistic. In reality, temporal variability of glaciogenic dust should be dependent on changes both in wind speed and the threshold wind friction velocity at which dust emission is initiated. Thus, the independence of dust emission from wind speed might cause an overestimation of dust deposition rates at the grids close to emission areas and under low atmospheric loading. However, our results are in good agreement with the measurements of deposition flux in general. It will be necessary to implement a better scheme for glaciogenic dust in subsequent research. Sagoo and Strevmo (2017) prescribed a globally “idealised high” dust emission factor for their LGM-like experiment. Because our glaciogenic dust sources are located in the high latitudes, the influence of glaciogenic dust emission on the surface temperature around Antarctica is likely more pronounced in our simulation results.
In the tropics, the effect of enhanced dust input on the surface temperature is similar to what Mahowald et al. (2010) reported in their study of the middle to late 20th century but with contrasting effects at high latitudes. The major difference is that dust is enhanced at low latitudes, i.e. the Sahara–Sahel drought in the 20th century perturbation compared with the additional high dust inputs at high latitudes in our study, at which the background albedo is high because of the extended areas of snow and ice cover.
In the MIROC-ESM, snow cover in the PI.e (PI.a) experiment tends to persist in boreal spring over Siberia in comparison with reanalysis data (Fig. S8 in the Supplement). This positive bias might influence the change we see in the LGM.e (LGM.a) and LGMglac.e (LGMglac.a) experiments.
The strong effect of snow ageing is especially significant in the Northern Hemisphere. Because snow ageing has been tuned to fit modern observations in Hokkaido, Japan (Aoki et al., 2003, 2006), in the MIROC-ESM, a strong dust provenance near snow-covered areas is lacking, e.g. as in the glaciogenic dust situation seen in eastern Siberia. Therefore, evaluation of the quantitative influence of snow ageing using various observational sites is needed. The albedo impurity relationship provided by Aoki et al. (2003, 2006), in which ageing starts to work when the impurity is ≥10 ppmw, explains the reason for the considerable snow ageing in the Northern Hemisphere but lack of snow ageing over Antarctica. The deposition flux over Antarctica is 3–4 orders of magnitude smaller than the regions of high dust emission in the Northern Hemisphere. The threshold of activation of snow ageing is between the high dust deposition in the Northern Hemisphere and the low deposition flux around Antarctica.
Although we were unable to treat the effect of Fe supply to the ocean in this model, activating the Fe fertilisation effect and enhancing the amount of plankton would influence CO2 uptake, especially over the Southern Ocean (Martin, 1990). Improved representation of the distribution of dust deposition is possible as a boundary condition for offline biogeochemical models to investigate CO2 uptake, e.g. in a more realistic version of the experiments by Oka et al. (2011). Further investigation of the non-negligible effect of the change in the size distribution of dust as identified by Albani et al. (2014), Mahowald et al. (2014), and Hopcroft et al. (2015) might also be necessary.
Plant functional types are considered in the dynamic vegetation module but not returned to the land module in the MIROC-ESM; i.e. the climate–vegetation interaction is limited. The importance of full vegetation coupling was highlighted by O'ishi and Abe-Ouchi (2013), who suggested the necessity for future models to evaluate changes in plant functional types, especially their effect on dust cycles.
Under global warming, the amount of dust emission remains uncertain (Tegen et al., 2004; Woodward et al., 2005; Mahowald et al., 2006a; Jacobson and Streets, 2009; Liao et al., 2009; Ito and Kok, 2017). Therefore, improving the understanding of dust processes in models of the past climate would be a practical way to reduce the uncertainty of projections into the future.
PI.e and LGM.e experiment results can be downloaded from the ESGF server (https://esgf-node.llnl.gov/search/cmip5/, last access: 30 October 2018) (ESGF, 2018) as piControl and lgm. The other experiments in the paper are available by request.
The supplement related to this article is available online at: https://doi.org/10.5194/cp-14-1565-2018-supplement.
RuO, AAO, and RO discussed the palaeoclimate motivations for LGM dust and experimental design. RuO designed, conducted, and analysed experiments and prepared the paper. TT and AI advised the analyses on the aerosol module. SW, TH, and MK developed MIROC-ESM. All authors contributed to discussions.
The authors declare that they have no conflict of interest.
This article is part of the special issue “Paleoclimate Modelling Intercomparison Project phase 4 (PMIP4) (CP/GMD inter-journal SI)”. It is not associated with a conference.
This research was supported by the Integrated Research Program for
Advancing Climate Models (TOUGOU programme) from the Ministry of Education,
Culture, Sports, Science and Technology (MEXT), Japan, and was also partly
supported by the Japan Society for the Promotion of Science (JSPS) KAKENHI
under grant numbers 17H06104 and JP17H06323. The model experiments were
conducted on the Earth Simulator of JAMSTEC. The authors are grateful for
the help and inspiring discussions offered by the MIROC development team of
JAMSTEC/U and Tokyo/NIES, especially Kumiko Takata for her help in
understanding
the MATSIRO land module. We appreciate two anonymous reviewers for their
constructive and shrewd comments, which improved this study significantly. We
also thank James Buxton MSc from the Edanz Group (https://www.edanzediting.com/ac, last access: 12 July 2018) for
English reviewing an earlier version of the paper.
Edited by: Masa Kageyama
Reviewed by: two anonymous referees
Abe-Ouchi, A., Saito, F., Kageyama, M., Braconnot, P., Harrison, S. P., Lambeck, K., Otto-Bliesner, B. L., Peltier, W. R., Tarasov, L., Peterschmitt, J.-Y., and Takahashi, K.: Ice-sheet configuration in the CMIP5/PMIP3 Last Glacial Maximum experiments, Geosci. Model Dev., 8, 3621–3637, https://doi.org/10.5194/gmd-8-3621-2015, 2015.
Albani, S., Mahowald, N. M., Delmonte, B., Maggi, V., and Winckler, G.: Comparing modeled and observed changes in mineral dust transport and deposition to Antarctica between the Last Glacial Maximum and current climates, Clim. Dynam., 38, 1731–1755, https://doi.org/10.1007/s00382-011-1139-5, 2012.
Albani, S., Mahowald, N. M., Perry, A. T., Scanza, R. A., Zender, C. S., Heavens, N. G., Maggi, V., Kok, J. F., and Otto-Bliesner, B. L.: Improved dust representation in the Community Atmosphere Model., J. Adv. Model. Earth Sy., 6, 541–570, https://doi.org/10.1002/2013ms000279, 2014.
Albani, S., Balkanski, Y., Mahowald, N., Winckler, G., Maggi, V., and Delmonte, B.: Aerosol-Climate Interactions During the Last Glacial Maximum, Curr. Clim. Change Rep., 4, 99–114, https://doi.org/10.1007/s40641-018-0100-7, 2018.
Aoki, T., Hachikubo, A., and Hori, M.: Effects of snow physical parameters on shortwave broadband albedos, J. Geophys. Res.-Atmos., 108, 4616, https://doi.org/10.1029/2003jd003506, 2003.
Aoki, T., Motoyoshi, H., Kodama, Y., Yasunari, T. J., Sugiura, K., and Kobayashi, H.: Atmospheric Aerosol Deposition on Snow Surfaces and Its Effect on Albedo, Sola, 2, 13–16, https://doi.org/10.2151/sola.2006-004, 2006.
Bartlein, P. J., Harrison, S. P., Brewer, S., Connor, S., Davis, B. A. S., Gajewski, K., Guiot, J., Harrison-Prentice, T. I., Henderson, A., Peyron, O., Prentice, I. C., Scholze, M., Seppa, H., Shuman, B., Sugita, S., Thompson, R. S., Viau, A. E., Williams, J., and Wu, H.: Pollen-based continental climate reconstructions at 6 and 21 ka: a global synthesis, Clim. Dynam., 37, 775–802, https://doi.org/10.1007/s00382-010-0904-1, 2011.
Braconnot, P., Otto-Bliesner, B., Harrison, S., Joussaume, S., Peterchmitt, J.-Y., Abe-Ouchi, A., Crucifix, M., Driesschaert, E., Fichefet, Th., Hewitt, C. D., Kageyama, M., Kitoh, A., Laîné, A., Loutre, M.-F., Marti, O., Merkel, U., Ramstein, G., Valdes, P., Weber, S. L., Yu, Y., and Zhao, Y.: Results of PMIP2 coupled simulations of the Mid-Holocene and Last Glacial Maximum – Part 1: experiments and large-scale features, Clim. Past, 3, 261–277, https://doi.org/10.5194/cp-3-261-2007, 2007a.
Braconnot, P., Otto-Bliesner, B., Harrison, S., Joussaume, S., Peterchmitt, J.-Y., Abe-Ouchi, A., Crucifix, M., Driesschaert, E., Fichefet, Th., Hewitt, C. D., Kageyama, M., Kitoh, A., Loutre, M.-F., Marti, O., Merkel, U., Ramstein, G., Valdes, P., Weber, L., Yu, Y., and Zhao, Y.: Results of PMIP2 coupled simulations of the Mid-Holocene and Last Glacial Maximum – Part 2: feedbacks with emphasis on the location of the ITCZ and mid- and high latitudes heat budget, Clim. Past, 3, 279–296, https://doi.org/10.5194/cp-3-279-2007, 2007b.
Bullard, J. E., Baddock, M., Bradwell, T., Crusius, J., Darlington, E., Gaiero, D., Gasso, S., Gisladottir, G., Hodgkins, R., Mcculloch, R., Mckenna-Neuman, C., Mockford, T., Stewart, H., and Thorsteinsson T.: High-latitude dust in the Earth system, Rev. Geophys., 54, 447–485, https://doi.org/10.1002/2016RG000518, 2016.
Claquin, T., Roelandt, C., Kohfeld, K. E., Harrison, S. P., Tegen, I., Prentice, I. C., Balkanski, Y., Bergametti, G., Hansson, M., Mahowald, N., Rodhe, H., and Schulz, M.: Radiative forcing of climate by ice-age atmospheric dust, Clim. Dynam., 20, 193–202, https://doi.org/10.1007/s00382-002-0269-1, 2003.
Deepak, A. and Gerber, H. E.: Report of the experts meeting on aerosols and their climatic effects WCP-55, Int. Council Sci. Unions, WMO, available at: https://library.wmo.int/index.php?lvl=notice_display&id=16813#.W9LRZ2j7Rdg, 1983.
Dome Fuji Ice Core Project members: Kawamura K., Abe-Ouchi A., Motoyama H., et al.: State dependence of climatic instability over the past 720 000 years from Antarctic ice cores and climate modeling, Science Advances, 2, e1600446, https://doi.org/10.1126/sciadv.1600446, 2017.
ESGF: PI.e and LGM.e experiment results, available at: https://esgf-node.llnl.gov/search/cmip5/, last access: 30 October 2018.
Ganopolski, A., Calov, R., and Claussen, M.: Simulation of the last glacial cycle with a coupled climate ice-sheet model of intermediate complexity, Clim. Past, 6, 229–244, https://doi.org/10.5194/cp-6-229-2010, 2010.
Hopcroft, P. O., Valdes, P. J., Woodward, S., and Joshi, M. M. : Last glacial maximum radiative forcing from mineral dust aerosols in an Earth system model, J. Geophys. Res.-Atmos., 120, 8186–8205, https://doi.org/10.1002/2015jd023742, 2015.
IPCC: Climate Change 2013: The Physical Science Basis, Contribution of Working Group I to the Fifth Assessment Report of the Intergovernmental Panel on Climate Change, edited by: Stocker, T. F., Qin, D., Plattner, G.-K., Tignor, M., Allen, S. K., Boschung, J., Nauels, A., Xia, Y., Bex, V., and Midgley, P. M., Cambridge University Press, Cambridge, UK and New York, NY, USA, 1535 pp., https://doi.org/10.1017/CBO9781107415324, 2013.
Ito, A. and Kok, J. F.: Do dust emissions from sparsely vegetated regions dominate atmospheric iron supply to the Southern Ocean?, J. Geophys. Res.-Atmos., 122, 3987–4002, https://doi.org/10.1002/2016JD025939, 2017.
Jacobson, M. Z. and Streets, D. G.: Influence of future anthropogenic emissions on climate, natural emissions, and air quality, J. Geophys. Res.-Atmos., 114, D08118, https://doi.org/10.1029/2008JD011476, 2009.
Kageyama, M., Laine, A., Abe-Ouchi, A., Braconnot, P., Cortijo, E., Crucifix, M., De Vernal, A., Guiot, J., Hewitt, C. D., Kitoh, A., Kucera, M., Marti, O., Ohgaito, R., Otto-Bliesner, B., Peltier, W. R., Rosell-Mele, A., Vettoretti, G., Weber, S. L., and Yu, Y.: Last Glacial Maximum temperatures over the North Atlantic, Europe and western Siberia: a comparison between PMIP models, MARGO sea-surface temperatures and pollen-based reconstructions, Quaternary Sci. Rev., 25, 2082–2102, https://doi.org/10.1016/j.quascirev.2006.02.010, 2006.
Kageyama, M., Albani, S., Braconnot, P., Harrison, S. P., Hopcroft, P. O., Ivanovic, R. F., Lambert, F., Marti, O., Peltier, W. R., Peterschmitt, J.-Y., Roche, D. M., Tarasov, L., Zhang, X., Brady, E. C., Haywood, A. M., LeGrande, A. N., Lunt, D. J., Mahowald, N. M., Mikolajewicz, U., Nisancioglu, K. H., Otto-Bliesner, B. L., Renssen, H., Tomas, R. A., Zhang, Q., Abe-Ouchi, A., Bartlein, P. J., Cao, J., Li, Q., Lohmann, G., Ohgaito, R., Shi, X., Volodin, E., Yoshida, K., Zhang, X., and Zheng, W.: The PMIP4 contribution to CMIP6 – Part 4: Scientific objectives and experimental design of the PMIP4-CMIP6 Last Glacial Maximum experiments and PMIP4 sensitivity experiments, Geosci. Model Dev., 10, 4035–4055, https://doi.org/10.5194/gmd-10-4035-2017, 2017.
Kohfeld K. E. and Harrison S. P.: DIRTMAP: the geological record of dust, Earth-Sci. Rev., 54, 81–114, 2001.
Kohfeld, K. E., Graham, R. M., De Boer, A. M., Sime, L. C., Wolff, E. W., Le Quere, C., and Bopp, L.: Southern Hemisphere westerly wind changes during the Last Glacial Maximum: paleo-data synthesis, Quaternary Sci. Rev., 68, 76–95, https://doi.org/10.1016/j.quascirev.2013.01.017, 2013.
Krinner, G., Boucher, O., and Balkanski, Y.: Ice-free glacial northern Asia due to dust deposition on snow, Clim. Dynam., 27, 613–625, https://doi.org/10.1007/s00382-006-0159-z, 2006.
Lambert, F., Delmonte, B., Petit, J. R., Bigler, M., Kaufmann, P. R., Hutterli, M. A., Stocker, T. F., Ruth, U., Steffensen, J. P., and Maggi, V.: Dust-climate couplings over the past 800 000 years from the EPICA Dome C ice core, Nature, 452, 616–619, https://doi.org/10.1038/nature06763, 2008.
Lambert, F., Kug, J. S., Park, R. J., Mahowald, N., Winckler, G., Abe-Ouchi, A., O'ishi, R., Takemura, T., and Lee, J. H.: The role of mineral-dust aerosols in polar temperature amplification, Nat. Clim. Change, 3, 487–491, https://doi.org/10.1038/nclimate1785, 2013.
Lamy, F., Gersonde, R., Winckler, G., Esper, O., Jaeschke, A., Kuhn, G., Ullermann, J., Martinez-Garcia, A., Lambert, F., and Kilian, R.: Increased Dust Deposition in the Pacific Southern Ocean During Glacial Periods, Science, 343, 403–407, https://doi.org/10.1126/science.1245424, 2014.
Li, F. Y., Ramaswamy, V., Ginoux, P., Broccoli, A. J., Delworth, T., and Zeng, F. R.: Toward understanding the dust deposition in Antarctica during the Last Glacial Maximum: Sensitivity studies on plausible causes, J. Geophys. Res.-Atmos., 115, D24120, https://doi.org/10.1029/2010JD014791, 2010.
Liao, H., Zhang, Y., Chen, W. T., Raes, F., and Seinfeld, J. H.: Effect of chemistry-aerosol-climate coupling on predictions of future climate and future levels of tropospheric ozone and aerosols, J. Geophys. Res.-Atmos., 114, D10306, https://doi.org/10.1029/2008JD010984, 2009.
Lunt, D. J. and Valdes, P. J.: Dust deposition and provenance at the Last Glacial Maximum and present day, Geophys. Res. Lett., 22, 2085, https://doi.org/10.1029/2002gl015656, 2002.
Mahowald, N., Kohfeld, K., Hansson, M., Balkanski, Y., Harrison, S. P., Prentice, I. C., Schulz, M., and Rodhe, H.: Dust sources and deposition during the last glacial maximum and current climate: A comparison of model results with paleodata from ice cores and marine sediments, J. Geophys. Res.-Atmos., 104, 15895–15916, https://doi.org/10.1029/1999jd900084, 1999.
Mahowald, N. M., Muhs, D. R., Levis, S., Rasch, P. J., Yoshioka, M., Zender, C. S., and Luo, C.: Change in atmospheric mineral aerosols in response to climate: Last glacial period, preindustrial, modern, and doubled carbon dioxide climates, J. Geophys. Res.-Atmos., 111, D10202, https://doi.org/10.1029/2005jd006653, 2006a.
Mahowald, N. M., Yoshioka, M., Collins, W. D., Conley, A. J., Fillmore, D. W., and Coleman, D. B.: Climate response and radiative forcing from mineral aerosols during the last glacial maximum, pre-industrial, current and doubled-carbon dioxide climates, Geophys. Res. Lett., 33, L20705, https://doi.org/10.1029/2006gl026126, 2006b.
Mahowald, N. M., Kloster, S., Engelstaedter, S., Moore, J. K., Mukhopadhyay, S., McConnell, J. R., Albani, S., Doney, S. C., Bhattacharya, A., Curran, M. A. J., Flanner, M. G., Hoffman, F. M., Lawrence, D. M., Lindsay, K., Mayewski, P. A., Neff, J., Rothenberg, D., Thomas, E., Thornton, P. E., and Zender, C. S.: Observed 20th century desert dust variability: impact on climate and biogeochemistry, Atmos. Chem. Phys., 10, 10875–10893, https://doi.org/10.5194/acp-10-10875-2010, 2010.
Mahowald, N., Albani, S., Kok, J. F., Engelstaeder, S., Scanza, R., Ward, D. S., and Flanner, M. G.: The size distribution of desert dust aerosols and its impact on the Earth system, Aeolian Res., 15, 53–71, 2014.
MARGO project members: Waelbroeck C., Paul A., Kucera M., et al.: Constraints on the magnitude and patterns of ocean cooling at the Last Glacial Maximum, Nat. Geosci., 2, 127–132, https://doi.org/10.1038/ngeo411, 2009.
Martin, J. H.: Glacial-Interglacial CO2 change: The iron hypothesis, Paleoceanography, 5, 1–13, https://doi.org/10.1029/PA005i001p00001, 1990.
Masson-Delmotte, V., Kageyama, M., Braconnot, P., Charbit, S., Krinner, G., Ritz, C., Guilyardi, E., Jouzel, J., Abe-Ouchi, A., Crucifix, M., Gladstone, R. M., Hewitt, C. D., Kitoh, A., Legrande, A. N., Marti, O., Merkel, U., Motoi, T., Ohgaito, R., Otto-Bliesner, B., Peltier, W. R., Ross, I., Valdes, P. J., Vettoretti, G., Weber, S. L., Wolk, F., and Yu, Y.: Past and future polar amplification of climate change: climate model intercomparisons and ice-core constraints, Clim. Dynam., 26, 513–529, https://doi.org/10.1007/s00382-005-0081-9, 2006.
Masson-Delmotte, V., Stenni, B., Pol, K., Braconnot, P., Cattani, O., Falourd, S., Kageyama, M., Jouzel, J., Landais, A., Minster, B., Barnola, J. M., Chappellaz, J., Krinner, G., Johnsen, S., Rothlisberger, R., Hansen, J., Mikolajewicz, U., and Otto-Bliesner, B.: EPICA Dome C record of glacial and interglacial intensities, Quaternary Sci. Rev., 29, 113-128, https://doi.org/10.1016/j.quascirev.2009.09.030, 2010.
Ohgaito, R. and Abe-Ouchi, A.: The effect of sea surface temperature bias in the PMIP2 AOGCMs on mid-Holocene Asian monsoon enhancement, Clim. Dynam., 33, 975–983, 2009.
Ohmura, A., Wild, M., and Bengtsson, L.: A possible change in mass balance of Greenland and Antarctic ice sheets in the coming century, J. Climate, 9, 2124–2135, 1996.
O'ishi, R. and Abe-Ouchi, A.: Influence of dynamic vegetation on climate change and terrestrial carbon storage in the Last Glacial Maximum, Clim. Past, 9, 1571–1587, https://doi.org/10.5194/cp-9-1571-2013, 2013.
Oka, A., Abe-Ouchi, A., Chikamoto, M. O., and Ide, T.: Mechanisms controlling export production at the LGM: Effects of changes in oceanic physical fields and atmospheric dust deposition, Global Biogeochem. Cy., 25, GB2009, https://doi.org/10.1029/2009gb003628, 2011.
Sagoo, N. and Storelvmo, T.: Testing the sensitivity of past climates to the indirect effects of dust, Geophys. Res. Lett., 44, 5807–5817, 2017.
Sato, H., Itoh, A., and Kohyama, T.: SEIB-DGVM: A new dynamic global vegetation model using a spatially explicit individual-based approach, Ecol. Model., 200, 279–307, 2007.
Stenni, B., Masson-Delmotte, V., Selmo, E., Oerter, H., Meyer, H., Rothlisberger, R., Jouzel, J., Cattani, O., Falourd, S., Fischer, H., Hoffmann, G., Iacumin, P., Johnsen, S. J., Minster, B., and Udisti, R.: The deuterium excess records of EPICA Dome C and Dronning Maud Land ice cores (East Antarctica), Quaternary Sci. Rev., 29, 146–159, https://doi.org/10.1016/j.quascirev.2009.10.009, 2010.
Sueyoshi, T., Ohgaito, R., Yamamoto, A., Chikamoto, M. O., Hajima, T., Okajima, H., Yoshimori, M., Abe, M., O'ishi, R., Saito, F., Watanabe, S., Kawamiya, M., and Abe-Ouchi, A.: Set-up of the PMIP3 paleoclimate experiments conducted using an Earth system model, MIROC-ESM, Geosci. Model Dev., 6, 819–836, https://doi.org/10.5194/gmd-6-819-2013, 2013.
Takata, K., Emori, S., and Watanabe, T.: Development of the minimal advanced treatments of surface interaction and runoff, Global Planet. Change, 38, 209–222, 2003.
Takemura, T., Okamoto, H., Maruyama, Y., Numaguti, A., Higurashi, A., and Nakajima, T.: Global three-dimensional simulation of aerosol optical thickness distribution of various origins, J. Geophys. Res.-Atmos., 105, 17853–17873, https://doi.org/10.1029/2000jd900265, 2000.
Takemura, T., Nakajima, T., Dubovik, O., Holben, B. N., and Kinne, S.: Single-scattering albedo and radiative forcing of various aerosol species with a global three-dimensional model, J. Climate, 15, 333–352, https://doi.org/10.1175/1520-0442(2002)015<0333:ssaarf>2.0.co;2, 2002.
Takemura, T., Nozawa, T., Emori, S., Nakajima, T. Y., and Nakajima, T.: Simulation of climate response to aerosol direct and indirect effects with aerosol transport-radiation model, J. Geophys. Res.-Atmos., 110, D02202, https://doi.org/10.1029/2004JD005029, 2005.
Takemura, T., Egashira, M., Matsuzawa, K., Ichijo, H., O'ishi, R., and Abe-Ouchi, A.: A simulation of the global distribution and radiative forcing of soil dust aerosols at the Last Glacial Maximum, Atmos. Chem. Phys., 9, 3061–3073, https://doi.org/10.5194/acp-9-3061-2009, 2009.
Tegen, I., Werner, M., Harrison, S. P., and Kohfeld, K. E.: Relative importance of climate and land use in determining present and future global soil dust emission, Geophys. Res. Lett., 31, L05105, https://doi.org/10.1029/2003GL019216, 2004.
Uemura, R., Masson-Delmotte, V., Jouzel, J., Landais, A., Motoyama, H., and Stenni, B.: Ranges of moisture-source temperature estimated from Antarctic ice cores stable isotope records over glacial–interglacial cycles, Clim. Past, 8, 1109–1125, https://doi.org/10.5194/cp-8-1109-2012, 2012.
Warren, S. G. and Wiscombe, W. J.: A model for the spectral albedo of snow.II: snow containing atmospheric aerosols, J. Atmos. Sci., 37, 2734–2745, 1980.
Watanabe, S., Hajima, T., Sudo, K., Nagashima, T., Takemura, T., Okajima, H., Nozawa, T., Kawase, H., Abe, M., Yokohata, T., Ise, T., Sato, H., Kato, E., Takata, K., Emori, S., and Kawamiya, M.: MIROC-ESM 2010: model description and basic results of CMIP5-20c3m experiments, Geosci. Model Dev., 4, 845–872, https://doi.org/10.5194/gmd-4-845-2011, 2011.
Winckler, G., Anderson, R. F., Fleisher, M. Q., Mcgee, D., and Mahowald, N.: Covariant glacial-interglacial dust fluxes in the equatorial Pacific and Antarctica, Science, 320, 93–96, https://doi.org/10.1126/science.1150595, 2008.
Wiscombe, W. J. and Warren, S. G.: A model for the spectral albedo of snow.I: pure snow, J. Atmos. Sci., 37, 2712–2733, 1980.
Woodward, S., Roberts, D. L., and Betts, R. A.: A simulation of the effect of climate change-induced desertification on mineral dust aerosol, Geophys. Res. Lett., 32, L18810, https://doi.org/10.1029/2005GL023482 2005.
Yang, Z. L., Dickinson, R. E., Robock, A., and Vinnikov, K. Y.: Validation of the snow submodel of the biosphere-atmosphere transfer scheme with Russian snow cover and meteorological observational data, J. Climate, 10, 353–373, 1997.
Yue, X., Wang, H. J., Liao, H., and Jiang, D. B.: Simulation of the Direct Radiative Effect of Mineral Dust Aerosol on the Climate at the Last Glacial Maximum, J. Climate, 24, 843–858, https://doi.org/10.1175/2010jcli3827.1, 2011.