the Creative Commons Attribution 4.0 License.
the Creative Commons Attribution 4.0 License.
 | 22 Apr 2026
Weakened Miocene temperature response to orbital forcing compared to the modern-day
Yurui Zhang
Jilin Wei
Zhen Li
Nan Dai
Weipeng Zheng
Qiuzhen Yin
Agatha M. de Boer
Zhengguo Shi
Lixia Zhang
Although orbital signal is widely identified in Miocene proxy records, the climate mechanisms linking insolation changes to regional temperature within this warm, low-ice period remains not well known. Here we use fully coupled climate model simulations to assess temperature response to maximum and minimum boreal summer insolation under Miocene and pre-industrial (PI) conditions. Under both conditions, temperature exhibits broadly anti-phased responses to increased and decreased insolation, but the Miocene response is overall weaker, with regionally dependent contrasts and reduced symmetry between two orbital cases. Three notable Miocene-PI differences emerge: (1) reduced boreal continental sensitivity in the Miocene due to dampened albedo, water-vapor and cloud feedbacks in a warmer, low-ice climate; (2) stronger Miocene cooling over tropical North Africa under high insolation, driven by intensified hydrological and moisture-feedbacks supported by a wider Tethys Sea; (3) reversed Southern Ocean anomalies under low insolation, where poleward-restricted Miocene sea ice enables winter insolation changes to trigger positive ice-albedo feedbacks. These results demonstrate that background climate state strongly modulates orbital-scale responses and provide important context for interpreting Miocene proxy records and long-term changes in Earth's climate sensitivity through the Neogene.
- Article
(4877 KB) - Full-text XML
-
Supplement
(3375 KB) - BibTeX
- EndNote


The Miocene (∼23–5.3 Ma) marks a pivotal stage in Earth's long-term Cenozoic cooling trajectory, characterized by major reorganization of the cryosphere, monsoon systems and global climate (Steinthorsdottir et al., 2021). The warmest interval of this epoch, the Miocene Climatic Optimum (MCO, ∼17–14 Ma), was marked by globally elevated temperatures, reduced meridional temperature gradients, limited Antarctic sea ice, and intensified hydrological activity in the tropics and subtropics (Holbourn et al., 2013; Steinthorsdottir et al., 2021; Acosta et al., 2024; Goldner et al., 2014; Burls et al., 2021). Following the MCO, the climate transitioned toward cooler conditions, accompanied by stepwise expansion of Antarctic sea ice and intensified monsoons circulation (e.g., Steinthorsdottir et al., 2021; Holbourn et al., 2013, 2018; Westerhold et al., 2020; Frigola et al., 2021; Halberstadt et al., 2021). These large-scale reorganizations have been widely interpreted as responses to changes in external forcing acting on an evolving climate background state.
A growing body of evidence links these Miocene climate changes to orbital forcing, through mechanisms involving Antarctic ice-sheet dynamics (Levy et al., 2019; Naish et al., 2009) and eccentricity-paced variations in the marine carbon cycle associated with an intensified tropical hydrological cycle (Holbourn et al., 2007; Liu et al., 2024; Tian et al., 2013). Long-term marine records further indicate that the sensitivity of Antarctic ice sheets to obliquity forcing intensified from the Miocene onward and persisted into the Pliocene and Pleistocene (Levy et al., 2019; Van Peer et al., 2024). Spectral analyses of benthic δ18O and δ13C records show dominatant 400 kyr eccentricity pacing during the Miocene, followed by the emergence of stronger 100 and 40 kyr variability later in the Neogene (Holbourn et al., 2007; Tian et al., 2013; Westerhold et al., 2020; Liu et al., 2024).
Orbital variation in eccentricity, obliquity, and precession regulate the seasonal and latitudinal distribution of incoming solar radiation, thereby influencing the climate system such as monsoon strength, cryosphere dynamics, and ocean–atmosphere coupling (Berger, 1978; Hays et al., 1976; Milanković, 1941). Specifically, summer insolation in the high latitudes of the Northern Hemisphere (NH) has been suggested as a key driver of Quaternary glacial–interglacial cycle (Milanković, 1941). Elevated NH summer insolation enhances land–sea thermal contrast, shifts convection inland, strengths rainfall from Africa to Southeast Asia (Battisti et al., 2014; Bosmans et al., 2018; Dai et al., 2024; Herold et al., 2012; Yin and Beger, 2012). In the Southern Hemisphere, orbital forcing modulates Antarctic ice-sheet sensitivity, with geological records indicating enhanced obliquity responses from the Miocene onwards (Levy et al., 2019; Naish et al., 2009; Van Peer et al., 2024). Eccentricity-paced variations in the marine carbon cycle and tropical hydrological processes further point to a strong imprint of long-period orbital forcing during this interval (Holbourn et al., 2007; Tian et al., 2013; Liu et al., 2024).
However, the climate expression of orbital forcing is not stationary through time. Miocene δ18O and δ13C records are dominated by 400 kyr eccentricity variability, whereas stronger 100 and 40 kyr cycles emerge later in the Neogene (Holbourn et al., 2007; Westerhold et al., 2020). Comparable shifts during the Mid-Pleistocene transition (MPT) and the Mid-Brunhes Transition (MBT) occurred without major changes in orbital parameters, suggesting an important role for background climate state, threshold behavior, or internal feedbacks related to the Southern Ocean ventilation and Antarctic ice dynamics (Kemp et al., 2010; Yin, 2013). Recent analyses further emphasize changes in the relative influence of precession and obliquity across these transitions (Berger et al., 2024). Collectively, these observations imply a state-dependent orbital–climate relationship rather than a simple linear response to insolation forcing.
Although geological archives document pervasive orbital pacing during the Miocene, the mechanisms by which orbital-scale insolation variations translate into regional climate responses – particularly in warm climates lacking large Northern Hemisphere ice sheets – remain poorly constrained. Proxy records alone cannot isolate the respective roles of forcing, feedbacks, and internal variability, while climate modeling studies explicitly targeting orbital effects under realistic Miocene boundary conditions remain scarce.
Here, we use fully coupled climate model simulations to evaluate the climate response to orbital-driven insolation changes in the Miocene framework. We assess the sensitivity of high-latitude climate, tropical hydrological cycle, and ocean-cryosphere interactions to orbital forcing, and how these responses differ from those under the pre-industrial (PI) condition. By comparing these responses with those patterns inferred from proxy records, we assess how background climate state modulates orbital-scale climate variability and to provide context for evaluation of orbital-climate coupling through the Neogene.
2.1 FGOALS-g3 climate model and simulation setup
We use the fully coupled general circulation model FGOALS-g3, which is part of CMIP6. It has been widely applied to both present-day climate studies (Li et al., 2020; Lin et al., 2022; Wang et al., 2020) and paleoclimate simulations from the Miocene to the mid-Holocene (Wei et al., 2023; Zheng et al., 2020). A detailed description of model components and evaluation is provided in Sect. S1 in the Supplement.
Table 1Model simulation setup.
1 Top-of-Atmosphere (TOA) radiation imbalance. 2 Global Mean Air Temperature.
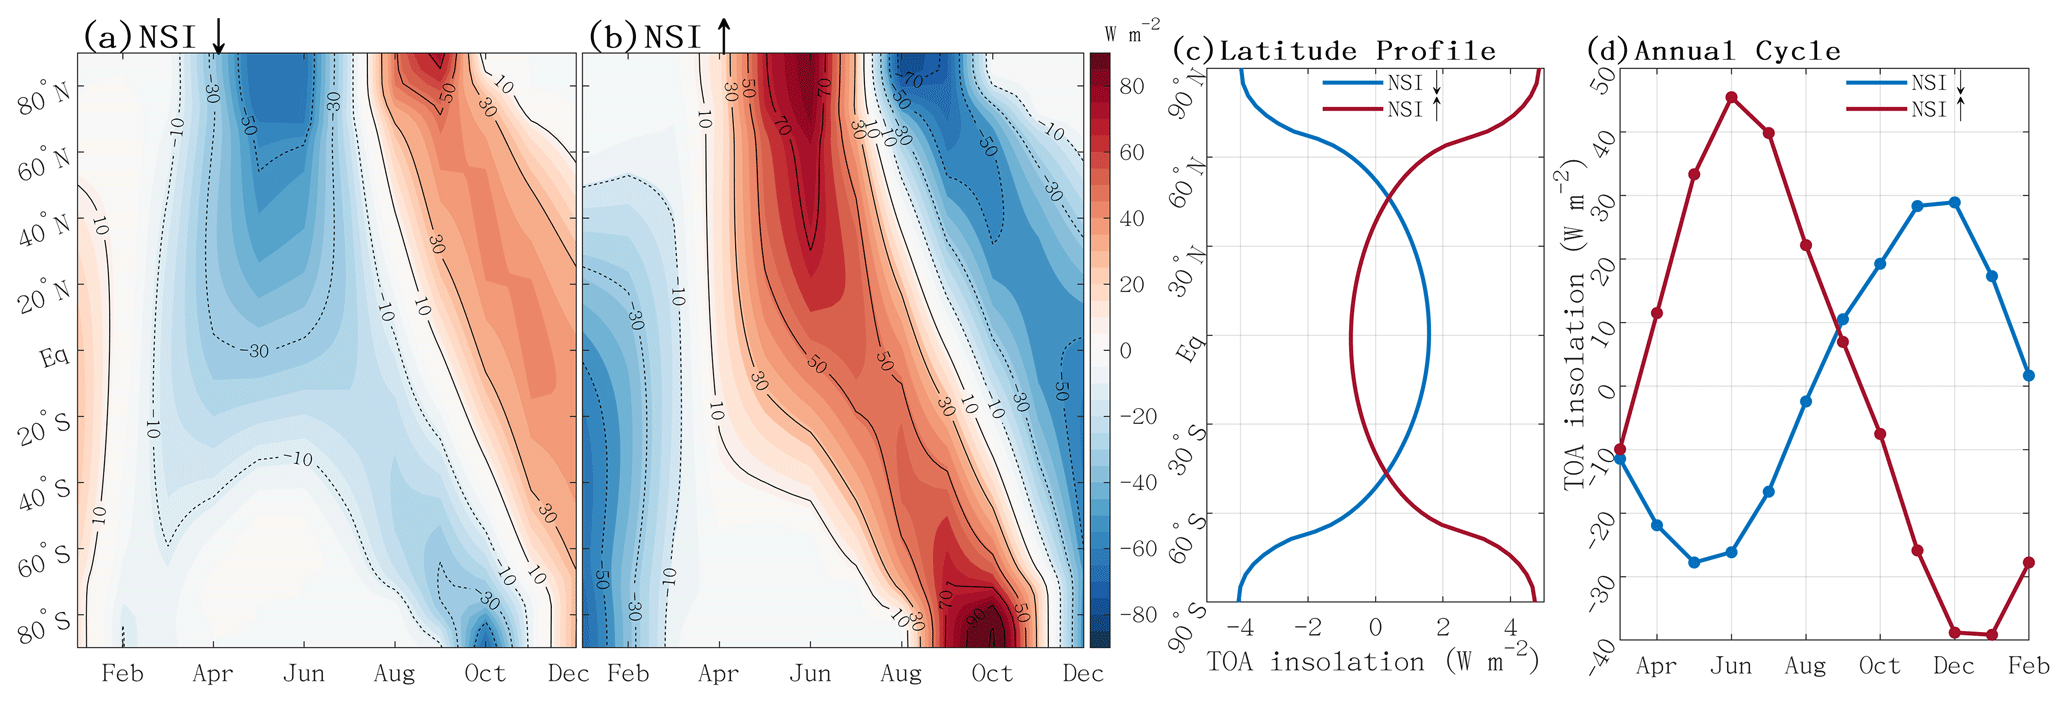
Figure 1Orbital-induced insolation changes (W m−2) of the NSImin (a) and NSImax (b) simulations from the baseline simulation (marked as NSI↓ and NSI↑ in turn), and their latitude profile of annual-mean insolation (c) and globally averaged annual insolation cycle (d).
Two baseline experiments were conducted: a pre-industrial (PI) simulation and a Miocene simulation (MCO). The PI simulation is performed with standard pre-industrial climate forcing. The MCO simulation adopts the MioMIP2 protocol and incorporates reconstructed Miocene boundary conditions, including paleogeography, vegetation, ice sheet, and an atmospheric CO2 concentration three times the PI level (Burls et al., 2021). The solar constant, orbital parameters, and aerosol concentration in MCO are kept identical to those of the PI simulation.
To examine the climate response to orbital forcing, we conducted sensitivity simulations by modifying orbital parameters in each baseline experiment. For both the PI and MCO climate, we performed minimum (NSImin) and maximum (NSImax) boreal summer insolation simulations, corresponding to winter- and summer-perihelion configurations with perihelion longitudes of 281 and 68°, respectively. (Table 1). These orbital simulations are designed to represent mid- to late Miocene intervals characterized by pronounced δ13C excursions and widespread carbon burial associated with the Monterey events (Holbourn et al., 2018; Westerhold et al., 2020). Specifically, we selected two representative time slices at 10.777 Ma (NSImax) and 10.767 Ma (NSImin) (Fig. S1). This orbital sensitivity framework has been widely applied in previous Pleistocene studies (Battisti et al., 2014; Bosmans et al., 2018; Dai et al., 2024). The main differences between these configurations are primarily driven by precession, whose amplitude is modulated by eccentricity.
The June insolation contrast between NSImax and NSImin is substantial, reaching 130 W m−2 at 65° N and 90 W m−2 at 20° N (Figs. 1, S1 and S2 in the Supplement). In NSImax, enhanced boreal summer insolation and reduced winter insolation amplify the globally averaged annual insolation cycle by relative to the baseline, whereas NSImin weakens the annual cycle by 60 W m−2 (Fig. 1d). Meridionally, NSImax increases annual-mean insolation at high latitudes while slightly reducing it in the tropics due to its higher obliquity, with the opposite pattern in NSImin (Fig. 1c). Applying these orbital forcings yields two pairs of experiments: PINSImax/PINSImin for the pre-industrial and MCONSImax/MCONSImin for the Miocene. It's worth noting that although these specific configurations are chosen for the Miocene, similar orbital patterns recur throughout the Pleistocene (Fig. S3).
Both PI and MCO baseline simulations were each run for 1700 years to reach quasi-equilibrium. The orbital simulations were then branched from the year 1601th of the corresponding baseline runs and integrated for additional 300 (PINSImax, PINSImin) and 400 years (MCONSImax, MCONSImin), respectively. Over the final 100 years of each experiment, the global mean top-of-Atmosphere (TOA) radiation imbalance within (Table 1).
We note that the MCO runs have not fully reached quasi-equilibrium. However, as this study focuses primarily on the atmospheric and upper-ocean response, the remaining drift does not affect the interpretation of the results. Monthly means from these equilibrated periods are used for all subsequent analysis. The PI simulation reasonably captures the spatial pattern and magnitude of present-day seasonal temperature variations relative to the CMIP5 multi-model mean and ERA5, with a minor cold bias in Arctic Eurasia linked to excessive sea ice (see Sect. S2 for more details).
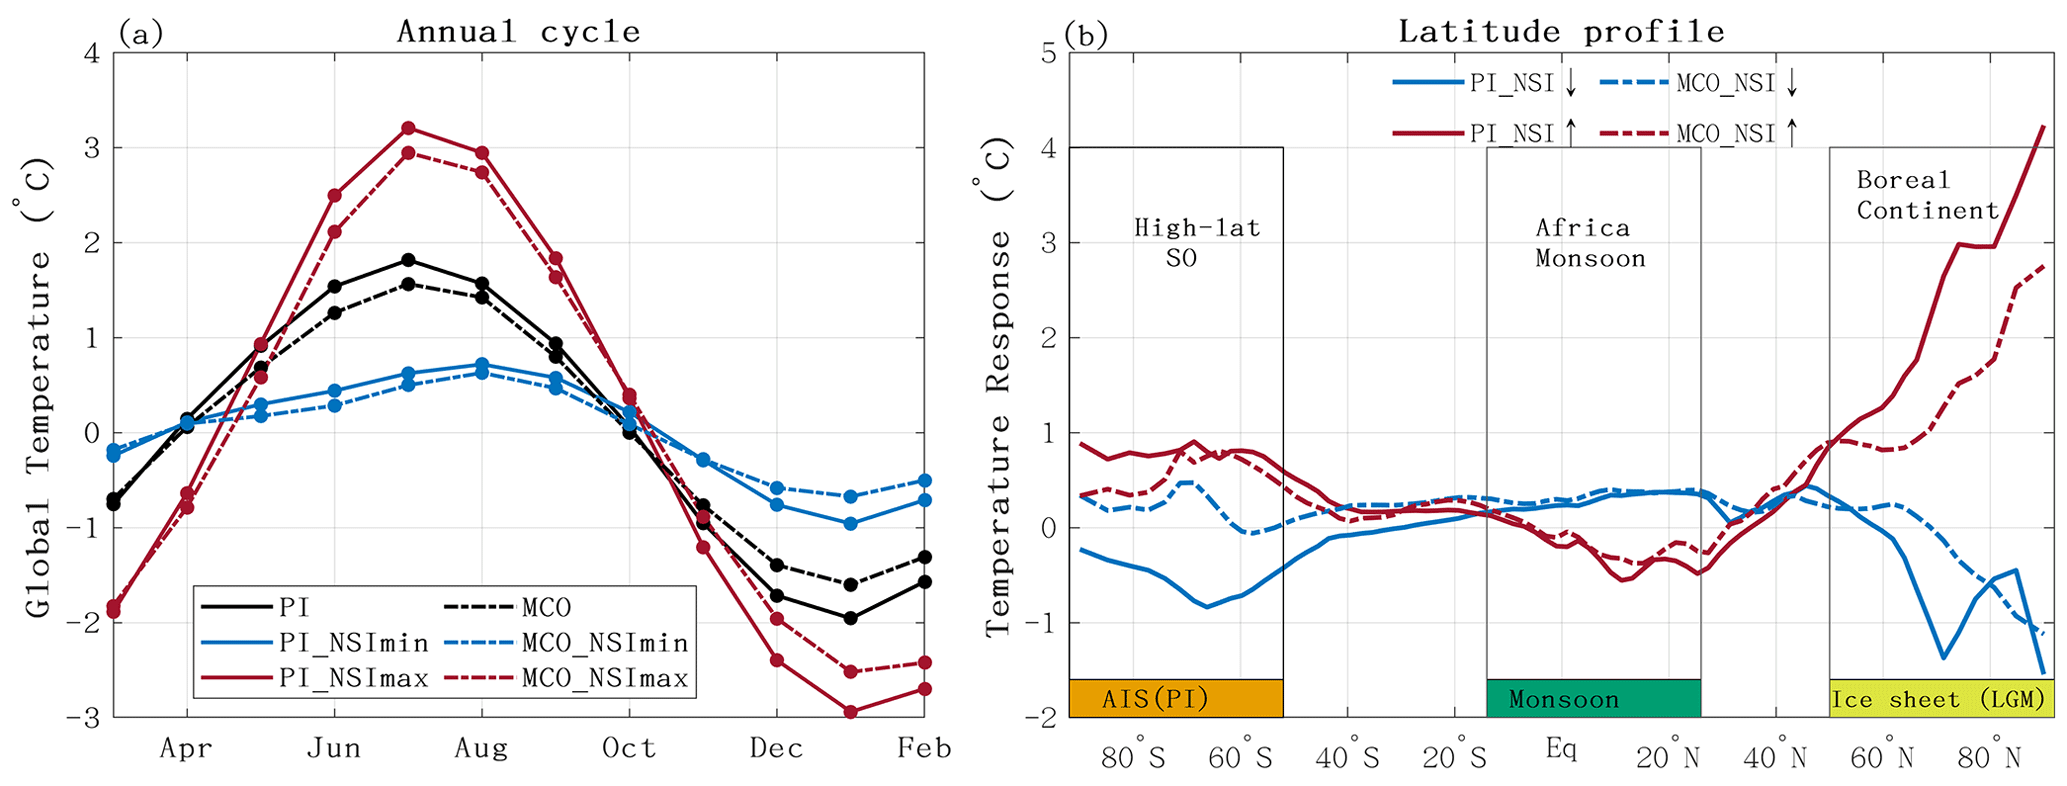
Figure 2(a) Annual cycle of temperature anomalies relative to the annual mean, with black, red and blue lines representing baseline, NSImax and NSImin simulations, respectively. Solid lines denote the PI climate, and dashed lines denote the Miocene climate. (b) Latitude profile of temperature response to orbital forcing, shown as anomalies to their baseline simulation and using the same color scheme as in (a). The locations of modern Antarctic Ice sheet (AIS), major monsoon regions and the Last glacial maximum Ice sheets are indicated in (b).
2.2 Diagnostic analysis
To diagnose the processes controlling the temperature response to orbital forcing, we apply a one-dimensional Energy Balance Model ananlysis (EBM) following Heinemann et al. (2009) and Wei et al. (2023). The EBM balances net incoming shortwave radiation against outgoing longwave radiation and meridional heat transport, using radiative fluxes from the coupled general circulation model (GCM) as input. Temperature differences between simulations are decomposed into contributions from surface albedo, water-vapor greenhouse trapping, cloud radiative effects, and meridional heat transport. Cloud effects are further decomposed into shortwave and longwave components.
The EBM components reproduce the zonal-mean temperature responses simulated by the GCM, with deviations generally within 0.1–0.9 °C (Fig. S4). Slight underestimates occur in the NH subtropics and polar regions, while overestimation appears near 70–80° N (Fig. S4), consistent with previous studies and mainly reflecting nonlinear processes associated with seasonal and zonal averaging (Lunt et al., 2012). The EBM decomposition is used to interpret the relative roles of albedo, water vapour, clouds, and heat transport in shaping the spatial structure of orbital-scale temperature changes.
3.1 Weaker seasonality of temperature response during the Miocene
The annual temperature cycle in the MCO is 3.2 °C, smaller than the 3.7 °C in PI, reflecting reduced July warming and weaker January cooling (Fig. 2a). The MCO-1x simulation shows an intermediate amplitude of ∼3.5 °C (Fig. S5), suggesting both elevated CO2 and Miocene boundary conditions contribute to the reduced seasonality, with the latter exerting a slightly larger influence. Orbital forcing substantially modulates the amplitude of the seasonal temperature cycle. Reduced boreal summer insolation weakens the seasonal cycle by 1.9 °C in MCONSImin, and by 2.0–1.6 °C in PI_NSImin. Conversely, increased boreal summer insolation intensifies seasonality, raising it to 5.4 °C in MCONSImax and 6.4 °C in PI_NSImax (Fig. 2). Consequently, seasonal global-mean air temperature (GMAT) variations rise by more than 2 °C in the NSImax simulations and decline by a similar magnitude in the NSImin simulations relative to their respective baselines. The JJA temperature differences between NSImax and NSImin exceed 2.5 °C (Fig. 2), comparable to the ∼3 °C global cooling during the late Miocene (Westerhold et al., 2020), underscoring the potential of orbital forcing to generate large-amplitude temperature variability.
Compared with the PI climate, the MCO simulation exhibits weaker seasonality and a dampened orbital response (Fig. 2a). The GMAT response to orbital forcing is diminished by ∼0.1 °C in both MCONSImin and MCONSImax simulations, yielding ∼10 % weaker changes in seasonal amplitude. This diminished Miocene temperature response is also evident in the latitudinal profile, showing differences of up to 1 °C at high latitudes (Fig. 2b). Because comparable analyses are not yet available for other warm climate intervals, it remains uncertain whether the reduced orbital response identified here is specific to the MCO or reflect a more general feature of warm climate states. This question requires further investigation. A detailed analysis of the ocean circulation response will be presented in a separate study focusing on Miocene ocean–atmosphere dynamics.
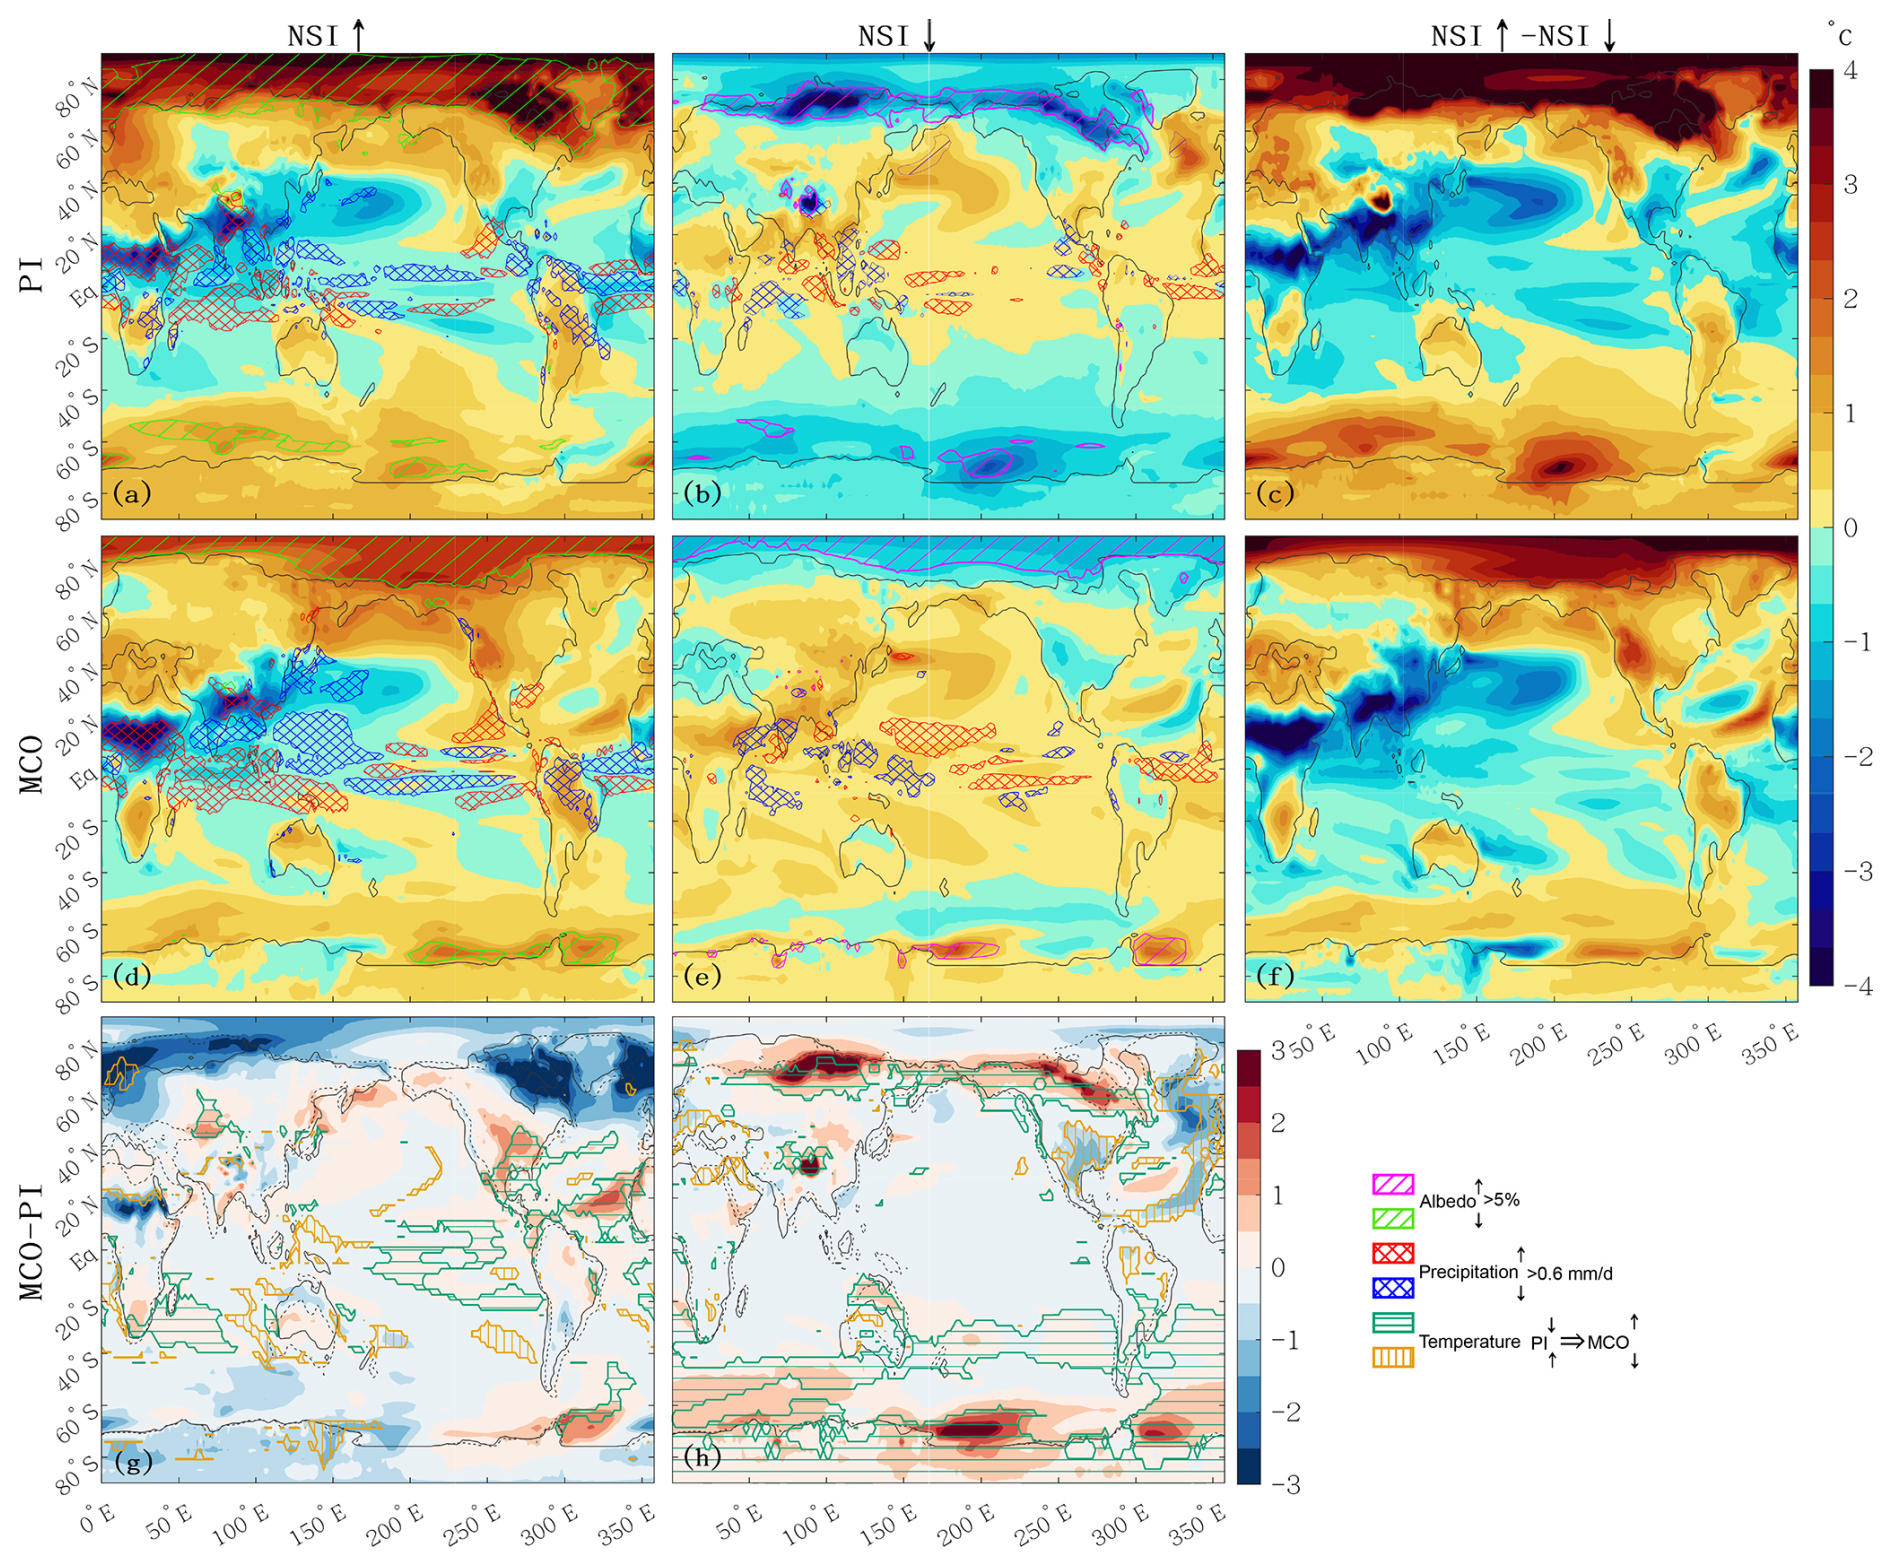
Figure 3Annual-mean air temperature response (°C). Upper panel: Anomalies of NSImax and NSImin simulations relative to the baseline simulation (a, b) and the difference between NSImax and NSImin simulations (c), all for the PI. Cross marked regions indicate where precipitation increased (red) or decreased (blue) by more than 0.6 mm d−1. Hatching indicates regions where albedo increase (magenta) or decrease (green) by over 5 %. Middle panel:Same as upper panel but for the Miocene. Lower panel: Differences between the Miocene and PI baseline simulations for the NSImax (g) and for the NSImin (h) Teal green horizontal and orange vertical hatching regions indicate where the sign of anomalies is reversed – shifting from negative in PI to positive in Miocene, and vice versa.
This reduced Miocene seasonality is consistent with proxy evidence indicating weaker seasonality in Europe during the warming Miocene (Harzhauser et al., 2011), and a reduced meridional temperature gradient in North America (Reichgelt et al., 2023). Variation in Miocene seasonal response to identical orbital forcing can alter the relationship between growing-season and annual mean temperatures, potentially biasing proxy-based temperature reconstructions. This highlight the importance of applying seasonality adjustments that account for different paleoclimate background, rather than relying solely on modern analogues, when addressing well-documented seasonal biases in proxies (Bova et al., 2021; Marsicek et al., 2018; Laepple and Lohmann, 2009; Laepple et al., 2022).
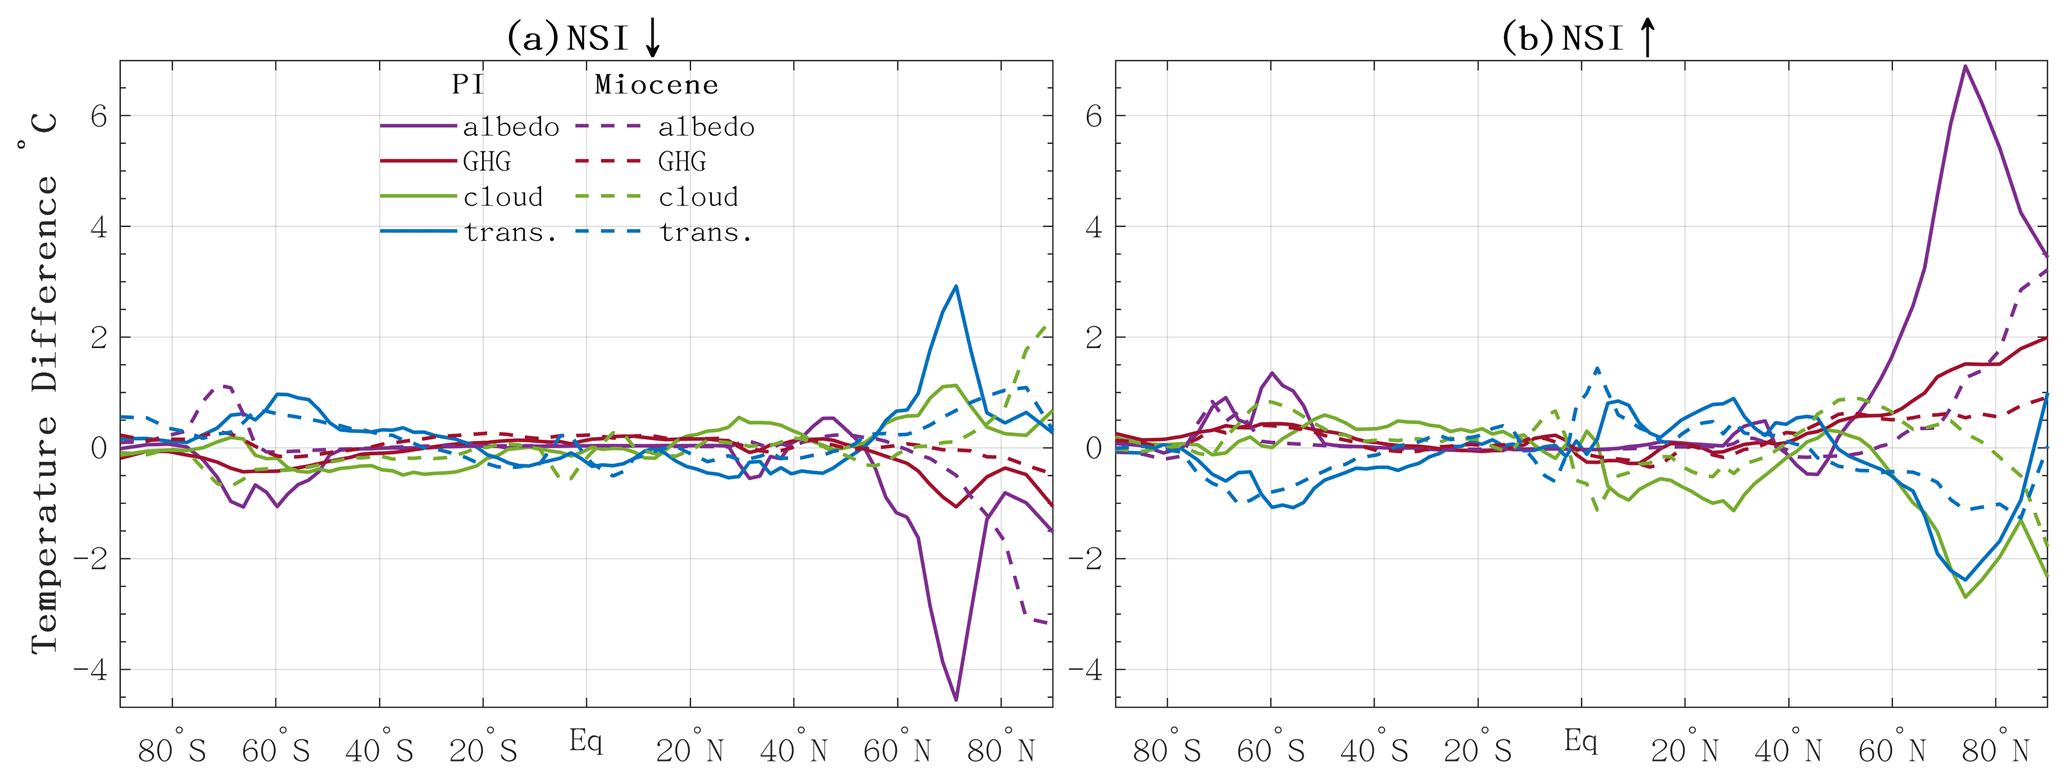
Figure 4Zonal mean surface temperature responses to orbital forcing from the EBM decomposition. Total response is decomposed into contributions from the surface albedo (albedo), water vapor's greenhouse (GHG), meridional heat transport (trans), and cloud effects (cloud).
3.2 Spatially varied Miocene temperature responses
The NSImax and NSImin simulations show overall anti-phased annual mean temperature responses (Fig. 3). Compared to the MCO and PI baselines, NSImax simulations show a dipole pattern, with polar warming but cooling in the tropics and subtropics of both hemispheres. Conversely, NSImin simulations show high-latidue cooling, alongside extratropical and tropical warming that extending up to ∼60° N and 40° S. Similar high versus low-latitude contrasts have been reported in simulations of interglacials characterized by high obliquity and precession, such as Mid-Holocene (Brierley et al., 2020; Dai et al., 2024) and other interglacials (Yin et al., 2012; Herold et al., 2012). These patterns are primarily related to the change in obliquity and precession, and are further amplified by feedback including high-latitude albedo changes and shifts in the tropical hydrological cycle (Figs. S7 and S8).
3.2.1 Reduced High-latitude Orbital Response in the MCO
Compared to PI, the Miocene orbital response is notably weaker at high northern latitudes (Fig. 3). Under PI conditions, the strongest PINSImax warming (∼4.8 °C) occurs over northeast Canada and the Labrador Sea, whereas the MCONSImax warming is less than half as large (Fig. 3b). Similarly, cooling in the PINSImin simulation reaches 4.4 °C over Western Siberia, but only 1 °C in MCONSImin (Fig. 3a and c). The strongest Miocene response – 2.8 °C over the Chukchi Sea – remains weaker than its PI counterpart.
EBM results show that much of the weaker Miocene temperature responses in NH high-latitudes can be attributed to smaller changes in surface albedo (Fig. 4). In the Miocene, the albedo contribution is roughly half of that in the PI. For example, albedo-driven warming reaches 6 °C in PINSImax but only ∼3 °C in MINSImax. Similarly, MCONSImin shows poleward-shifted and weaker albedo-driven cooling than PINSImin. This reduced albedo feedback dampens the Miocene temperature responses to orbital forcing, with temperature changes closely matching the spatial pattern of the Miocene albedo response (Fig. 3). Further analysis (Fig. S7) shows that strong albedo changes in the PI simulations coincides with ice sheets and sea ice, where ice–albedo feedbacks amplifies the climate response to orbital forcing. By contrast, the warmer Miocene climate, characterized by widespread vegetation, limited sea ice, and lower surface albedo, is less sensitive to orbital perturbations.
The strong albedo response is further reinforced by water-vapor greenhouse effect but partly offset by cloud changes. Water-vapor contributions largely follow albedo patterns, reflecting their dependence on surface energy availability, whereas clouds exert an opposing influence. Further decomposition into shortwave and longwave components reveal that shortwave cloud radiative effects dominate, yielding a generally weaker net negative feedback in the Miocene (Fig. S4).
These results are consistent with previous studies suggesting a reduced meridional temperature gradient in eastern North America during the warm Miocene relative to the modern era (Reichgelt et al., 2023). The larger temperature variations in the PI simulation point to enhanced sensitivity to orbital forcing, consistent with the development of pronounced NH glacial–interglacial cycles. In contrast, the Miocene's dampened response implies weakened temperature response to orbital forcing and thus possibly reduced amplitude of orbital-scale climate variability under warmer background conditions.
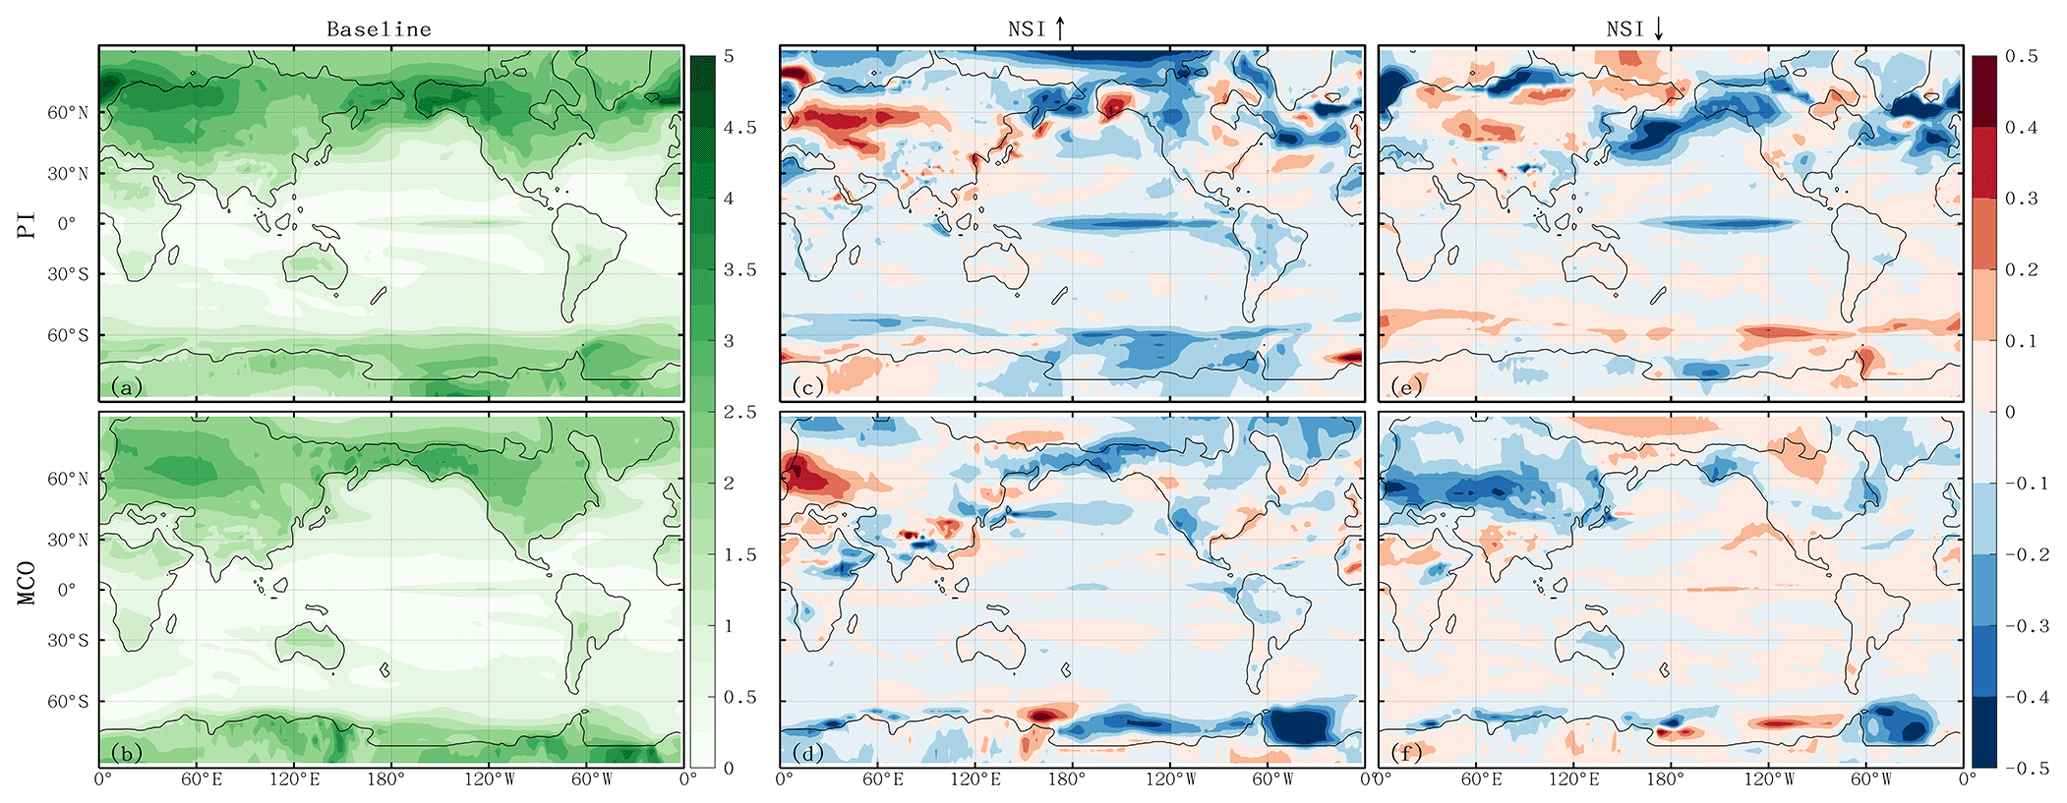
Figure 5Standard deviation of deseasonalized temperature (°C), and its responses to orbital forcing.
3.2.2 Enhanced tropical North Africa cooling in the MCONSImax
An exception to the weaker Miocene response is the enhanced tropical North Africa cooling in the MCONSImax simulation (Fig. 3d). Here, annual-mean temperature decreases by 4.4 °C – greater than the 3.8 °C in PINSImax – and the anomaly extends farther north. Seasonal decomposition indicates that this cooling persists even during boreal summer, despite increased insolation (Figs. S1 and S8). It coincides with intensified precipitation, indicating a dominant role of hydrological changes in controlling temperature.
These enhanced Miocene cooling effects under MCONSImax are consistent with increased precipitation. EBM diagnostics further reveal a stronger cooling contribution from water-vapor and cloud in Miocene (−0.34 and −1.12 °C), in contrast to warming contributions in PI (0.28 and 0.94 °C). Additional analysis of moisture flux divergence suggests that more moisture is from the Tethys Sea during the Miocene, feeding precipitation over tropical North Africa (Fig. S9). A wider Tethys Sea provides an efficient moisture source, while a warmer climate accelerates the hydrological cycle (Fig. S8) (Sarr et al., 2022; Huntington, 2006). These findings are in line with proxy evidence for intensified Miocene hydrological cycle and increased precipitation over the Mediterranean and North African region (Hoelzmann et al., 2001; Liu et al., 2024; Acosta et al., 2024; Zhang et al., 2014), supporting the interpretation that the cooling in MCONSImax is associated with enhanced hydrological feedbacks.
3.2.3 Disrupted Southern Ocean warming in the MCONSImin
In MCONSImin simulation, unexpected warming occurs over the Ross and Weddell Sea despite reduced local annual-mean insolation, in contrast to the cooling simulated in PINSImin. This Miocene response deviates from the near-symmetric responses observed in PI, where broadly follows local insolation changes.
This anomalous warming is particularly evident during Austral winter (Fig. S11), disrupting the expected anti-phase signal and generating an out-of-phase response. EBM analysis indicates that the reversed temperature response in MCONSImin (1.1 °C warming at 71° S instead of cooling) is mainly attributed to albedo and water-vapor effects (Fig. 4). During the Miocene, the maximum sea–ice edge lies closer to the pole (∼70° S), where significant winter insolation anomalies (Fig. S10) promote positive ice-albedo feedback: reducing sea ice and enhanced ocean–atmosphere heat exchange, and additional atmospheric water vapor (Figs. 3 and S4). In contrast, PI sea ice extends to lower latitudes, where insolation changes were smaller, limiting sensitivity to seasonal orbital forcing (Fig. S11). It is worth noting that land ice-sheet is prescribed in the model and therefore exerts a one-way influence on the climate system; associated feedback would like amiply the response. A full assessment of this effect, however, would require coupling with an interactive ice-sheet model (Halberstadt et al., 2021).
These results support geological evidence that ocean–atmosphere–ice sheet interactions amplified Antarctic ice-sheets sensitivity to orbital forcing during Miocene ice-sheet growth (De Vleeschouwer et al., 2017; Levy et al., 2019; Naish et al., 2009). Sediment records further indicate a stronger and more stable climate response as ice sheets and sea ice expanded, compared with warmer periods such as the Early Eocene, when carbon-climate coupling dominated (De Vleeschouwer et al., 2017; Levy et al., 2019; Naish et al., 2009; Reichgelt et al., 2023; Setty et al., 2023). Overall, these findings underscore strong background-state control on Southern Ocean sea–ice feedbacks (Bloch-Johnson et al., 2021).
3.3 Spatially diverse Miocene responses to orbital forcing and weakened internal temperature variability
Beyond differences in magnitude, the spatial extent of warming and cooling response also differs between the PI and Miocene simulation. Under PI conditions, high-latitude temperature responses are largely symmetric between NSImax and NSImin. In contrast, the Miocene simulations show warming in both MCONSImin and MCONSImax over Siberia and Alaska, resulting in distinct regional responses across 60–70° N spanning Eurasia, Alaska and North America continent (Fig. 3e, green line). Similarly, the Weddell Sea and Ross Sea exhibit overall warming in both Miocene orbital simulations, deviating from the symmetric PI behavior (Figs. 3 and S11). These deviations suggest a less symmetric and less predictable Miocene response, likely consistent with proxy evidence for dominance of longer-period orbital variability (e.g. the 400 kyr) rather than 40 and 100 kyr cycle characteristic of the Pleistocene (Holbourn et al., 2007; Tian et al., 2013; Westerhold et al., 2020; Liu et al., 2024). This also implies that simple NSImax minus NSImin, without examining spatial patterns in detail, can obscure nonlinear responses – particularly under warmer background conditions.
In addition to mean changes, internal temperature variability provides insight into climate stability (Harzhauser et al., 2011). We therefore examine de-seasonalised variability (standard deviation) over key high-latitude regions of active glacial dynamics. Mid-latitude Eurasia and North America exhibit higher variability in the PI simulation, which is further amplified in both PINSImin and PINSImax, reflecting enhanced ice-albedo interactions. By contrast, Miocene variability is lower and further reduced in MCONSImin (Fig. 5), suggesting a more stable high-latitude climate with dampened feedbacks under warmer conditions. Reduced eastern Pacific variability in the Miocene likely reflects enhanced inter-basin exchange through an open Panama Seaway, which buffers regional responses (Lunt et al., 2008). The stronger PI variability supports pronounced NH glacial–interglacial cycles, whereas the dampened Miocene response suggests weaker orbital pacing.
The Miocene, particularly the interval following the Miocene Climatic Optimum (MCO), shows strong orbital pacing in geological records despite warm boundary conditions, limited Northern Hemisphere ice, and reduced meridional temperature gradients. However, the mechanisms linking orbital forcing to climate variability during this warm epoch are not well understood. By conducting parallel orbital sensitivity experiments under mid-Miocene and pre-industrial (PI) conditions, we evaluate how background climate state modulates the expression of orbital-driven temperature change.
In general, both temperature exhibit broadly anti-phased temperature responses between maximum and minimum boreal summer insolation, each characterized by a meridional high-to-low latitude dipole. However, the Miocene response is ∼1 °C weaker, with regionally dependent contrasts and reduced symmetry between two orbital cases. Three key differences emerge: (1) reduced Northern Hemisphere continental sensitivity in the Miocene, reflecting weaker surface-albedo, water-vapor, and cloud radiative effects in a warmer, low-ice, vegetation-modified climate – consistent with proxy evidence for diminished high-latitude climate sensitivity after the MCO; (2) stronger hydrological cooling in North Tropical Africa in MCONSImax, driven by enhanced precipitation, cloud, and moisture-feedbacks within an intensified Miocene hydrological cycle supported by a wider Tethys Sea – indicating amplified hydrological sensitivity to orbital forcing in warm climates; and (3) a reversed Southern Ocean warming in MCONSImin under lower insolation, where poleward-restricted Miocene sea ice allows winter insolation anomalies to trigger positive ice-albedo feedbacks, matching proxy evidence for heightened Antarctic obliquity sensitivity.
These differences highlight that the strength and pattern of orbital impact depend strongly on background climate state. The Miocene's weaker seasonal amplitude and reduced internal variability imply diminished orbital pacing relative to the PI climate, consistent with dominant 400 kyr eccentricity variability in Miocene proxy records. This has two key implications: first, Miocene proxy reconstructions may overestimate annual mean temperatures if modern seasonal analogues are applied, underscoring the need for context-specific seasonality corrections; and second, the stronger and more symmetric PI response reflects the emergence of high-latitude cryosphere feedbacks central to Quaternary glacial–interglacial cycles.
Model output data from this study are available at https://doi.org/10.17605/OSF.IO/ZRC48 (Zhang, 2025).
The supplement related to this article is available online at https://doi.org/10.5194/cp-22-879-2026-supplement.
Conceptualization and Study Design: YZ; Methodology and Simulations: YZ, JW, with support from WZ; Formal Analysis and Investigation: YZ, with guidance from YQ, AMdB, ZS, LZ; Data Curation: ZL, ND; Writing – Original Draft: YZ; Writing – Review and Editing: All authors.
The authors have the following competing interests: Some authors are members of the editorial board of journal Climate of the Past.
Publisher's note: Copernicus Publications remains neutral with regard to jurisdictional claims made in the text, published maps, institutional affiliations, or any other geographical representation in this paper. The authors bear the ultimate responsibility for providing appropriate place names. Views expressed in the text are those of the authors and do not necessarily reflect the views of the publisher.
The authors are grateful to the two anonymous referees for their valuable comments that substantially improved the manuscript, as well as the Editor, Ran Feng, for managing the review process. We appreciate the technical support of the National Large Scientific and Technological Infrastructure, Earth System Numerical Simulation Facility (https://cstr.cn/31134.02.EL, last access: 17 March 2026).
This research has been supported by the National Key Research and Development Program of China (grant-no.: 2023YFF0803902, 2023YFF0803904).
This paper was edited by Ran Feng and reviewed by two anonymous referees.
Acosta, R. P., Burls, N. J., Pound, M. J., Bradshaw, C. D., De Boer, A. M., Herold, N., Huber, M., Liu, X., Donnadieu, Y., Farnsworth, A., Frigola, A., Lunt, D. J., von der Heydt, A. S., Hutchinson, D. K., Knorr, G., Lohmann, G., Marzocchi, A., Prange, M., Sarr, A. C., Li, X., and Zhang, Z.: A Model-Data Comparison of the Hydrological Response to Miocene Warmth: Leveraging the MioMIP1 Opportunistic Multi-Model Ensemble, Paleoceanography and Paleoclimatology, 39, e2023PA004726, https://doi.org/10.1029/2023PA004726, 2024.
Battisti, D. S., Ding, Q., and Roe, G. H.: Coherent pan-Asian climatic and isotopic response to orbital forcing of tropical insolation, J. Geophys. Res.-Atmos., 119, https://doi.org/10.1002/2014jd021960, 2014.
Berger, A.: Long-Term Variations of Daily Insolation and Quaternary Climatic Changes, J. Atmos. Sci., 35, 2362–2367, https://doi.org/10.1175/1520-0469(1978)035<2362:LTVODI>2.0.CO;2, 1978.
Berger, A., Yin, Q., and Wu, Z.: Length of astronomical seasons, total and average insolation over seasons, Quaternary Sci. Rev., 334, 108620, https://doi.org/10.1016/j.quascirev.2024.108620, 2024.
Bloch-Johnson, J., Rugenstein, M., Stolpe, M. B., Rohrschneider, T., Zheng, Y., and Gregory, J. M.: Climate Sensitivity Increases Under Higher CO2 Levels Due to Feedback Temperature Dependence, Geophys. Res. Lett., 48, https://doi.org/10.1029/2020gl089074, 2021.
Bosmans, J. H. C., Erb, M. P., Dolan, A. M., Drijfhout, S. S., Tuenter, E., Hilgen, F. J., Edge, D., Pope, J. O., and Lourens, L. J.: Response of the Asian summer monsoons to idealized precession and obliquity forcing in a set of GCMs, Quaternary Sci. Rev., 188, 121–135, https://doi.org/10.1016/j.quascirev.2018.03.025, 2018.
Bova, S., Rosenthal, Y., Liu, Z., Godad, S. P., and Yan, M.: Seasonal origin of the thermal maxima at the Holocene and the last interglacial, Nature, 589, 548–553, https://doi.org/10.1038/s41586-020-03155-x, 2021.
Brierley, C. M., Zhao, A., Harrison, S. P., Braconnot, P., Williams, C. J. R., Thornalley, D. J. R., Shi, X., Peterschmitt, J.-Y., Ohgaito, R., Kaufman, D. S., Kageyama, M., Hargreaves, J. C., Erb, M. P., Emile-Geay, J., D'Agostino, R., Chandan, D., Carré, M., Bartlein, P. J., Zheng, W., Zhang, Z., Zhang, Q., Yang, H., Volodin, E. M., Tomas, R. A., Routson, C., Peltier, W. R., Otto-Bliesner, B., Morozova, P. A., McKay, N. P., Lohmann, G., Legrande, A. N., Guo, C., Cao, J., Brady, E., Annan, J. D., and Abe-Ouchi, A.: Large-scale features and evaluation of the PMIP4-CMIP6 midHolocene simulations, Clim. Past, 16, 1847–1872, https://doi.org/10.5194/cp-16-1847-2020, 2020.
Burls, N. J., Bradshaw, C. D., De Boer, A. M., Herold, N., Huber, M., Pound, M., Donnadieu, Y., Farnsworth, A., Frigola, A., Gasson, E., von der Heydt, A. S., Hutchinson, D. K., Knorr, G., Lawrence, K. T., Lear, C. H., Li, X., Lohmann, G., Lunt, D. J., Marzocchi, A., Prange, M., Riihimaki, C. A., Sarr, A. C., Siler, N., and Zhang, Z.: Simulating Miocene Warmth: Insights From an Opportunistic Multi-Model Ensemble (MioMIP1), Paleoceanography and Paleoclimatology, 36, https://doi.org/10.1029/2020pa004054, 2021.
Dai, G., Zhang, Z., Otterå, O. H., Langebroek, P. M., Yan, Q., Zhang, R., and Zhu, Z.: Winter Insolation Modulates Boreal Tropical Monsoonal Temperatures in the Late Pleistocene, J. Geophys. Res.-Atmos., 129, https://doi.org/10.1029/2023jd040577, 2024.
De Vleeschouwer, D., Vahlenkamp, M., Crucifix, M., and Pälike, H.: Alternating Southern and Northern Hemisphere climate response to astronomical forcing during the past 35 m.y., Geology, 45, 375–378, https://doi.org/10.1130/g38663.1, 2017.
Frigola, A., Prange, M., and Schulz, M.: A dynamic ocean driven by changes in CO2 and Antarctic ice-sheet in the middle Miocene, Palaeogeogr. Palaeocl., 579, 110591, https://doi.org/10.1016/j.palaeo.2021.110591, 2021.
Goldner, A., Herold, N., and Huber, M.: The challenge of simulating the warmth of the mid-Miocene climatic optimum in CESM1, Clim. Past, 10, 523–536, https://doi.org/10.5194/cp-10-523-2014, 2014.
Halberstadt, A. R. W., Chorley, H., Levy, R. H., Naish, T., DeConto, R. M., Gasson, E., and Kowalewski, D. E.: CO2 and tectonic controls on Antarctic climate and ice-sheet evolution in the mid-Miocene, Earth Planet. Sc. Lett., 564, 116908, https://doi.org/10.1016/j.epsl.2021.116908, 2021.
Harzhauser, M., Piller, W. E., Müllegger, S., Grunert, P., and Micheels, A.: Changing seasonality patterns in Central Europe from Miocene Climate Optimum to Miocene Climate Transition deduced from the Crassostrea isotope archive, Global Planet. Change, 76, 77–84, https://doi.org/10.1016/j.gloplacha.2010.12.003, 2011.
Hays, J. D., Imbrie, J., and Shackleton, N. J.: Variations in the Earth's Orbit: Pacemaker of the Ice Ages, Science, 194, 1121–1132, https://doi.org/10.1126/science.194.4270.1121, 1976.
Heinemann, M., Jungclaus, J. H., and Marotzke, J.: Warm Paleocene/Eocene climate as simulated in ECHAM5/MPI-OM, Clim. Past, 5, 785–802, https://doi.org/10.5194/cp-5-785-2009, 2009.
Herold, N., Yin, Q. Z., Karami, M. P., and Berger, A.: Modelling the climatic diversity of the warm interglacials, Quaternary Sci. Rev., 56, 126–141, https://doi.org/10.1016/j.quascirev.2012.08.020, 2012.
Hoelzmann, P., Keding, B., Berke, H., Kröpelin, S., and Kruse, H.-J.: Environmental change and archaeology: lake evolution and human occupation in the Eastern Sahara during the Holocene, Palaeogeogr. Palaeocl., 169, 193–217, https://doi.org/10.1016/S0031-0182(01)00211-5, 2001.
Holbourn, A., Kuhnt, W., Schulz, M., Flores, J.-A., and Andersen, N.: Orbitally-paced climate evolution during the middle Miocene “Monterey” carbon-isotope excursion, Earth Planet. Sc. Lett., 261, 534–550, https://doi.org/10.1016/j.epsl.2007.07.026, 2007.
Holbourn, A., Kuhnt, W., Clemens, S., Prell, W., and Andersen, N.: Middle to late Miocene stepwise climate cooling: Evidence from a high-resolution deep water isotope curve spanning 8 million years, Paleoceanography, 28, 688–699, https://doi.org/10.1002/2013pa002538, 2013.
Holbourn, A., Kuhnt, W., Clemens, S. C., Kochhann, K. G. D., Johnck, J., Lubbers, J., and Andersen, N.: Late Miocene climate cooling and intensification of southeast Asian winter monsoon, Nat. Commun., 9, 1584, https://doi.org/10.1038/s41467-018-03950-1, 2018.
Huntington, T. G.: Evidence for intensification of the global water cycle: Review and synthesis, J. Hydrol., 319, 83–95, https://doi.org/10.1016/j.jhydrol.2005.07.003, 2006.
Kemp, A. E. S., Grigorov, I., Pearce, R. B., and Naveira Garabato, A. C.: Migration of the Antarctic Polar Front through the mid-Pleistocene transition: evidence and climatic implications, Quaternary Sci. Rev., 29, 1993–2009, https://doi.org/10.1016/j.quascirev.2010.04.027, 2010.
Laepple, T. and Lohmann, G.: Seasonal cycle as template for climate variability on astronomical timescales, Paleoceanography, 24, https://doi.org/10.1029/2008pa001674, 2009.
Laepple, T., Shakun, J., He, F., and Marcott, S.: Concerns of assuming linearity in the reconstruction of thermal maxima, Nature, 607, E12–E14, https://doi.org/10.1038/s41586-022-04831-w, 2022.
Levy, R. H., Meyers, S. R., Naish, T. R., Golledge, N. R., McKay, R. M., Crampton, J. S., DeConto, R. M., De Santis, L., Florindo, F., Gasson, E. G. W., Harwood, D. M., Luyendyk, B. P., Powell, R. D., Clowes, C., and Kulhanek, D. K.: Antarctic ice-sheet sensitivity to obliquity forcing enhanced through ocean connections, Nat. Geosci., 12, 132–137, https://doi.org/10.1038/s41561-018-0284-4, 2019.
Li, L. Y., Yongqiang, Tang, Y., Lin, P., Xie, J., Song, M., Dong, L., Zhou, T., Liu, L., Wang, L., Pu, Y., Chen, X., Chen, L., Xie, Z., Liu, H., Zhang, L., Huang, X., Feng, T., Zheng, W., Xia, K., Liu, H., Liu, J., Wang, Y., Wang, L., Jia, B., Xie, F., Wang, B., Zhao, S., Yu, Z., Zhao, B., and Wei, J.: The Flexible Global Ocean–Atmosphere–Land System Model Grid-Point Version 3 (FGOALS-g3): Description and Evaluation, J. Adv. Model. Earth Sy., 12, https://doi.org/10.1029/2019ms002012, 2020.
Lin, P., Zhao, B., Wei, J., Liu, H., Zhang, W., Chen, X., Jiang, J., Ding, M., Man, W., Jiang, J., Zhang, X., Ding, Y., Bai, W., Jin, C., Yu, Z., Li, Y., Zheng, W., and Zhou, T.: The Super-large Ensemble Experiments of CAS FGOALS-g3, Adv. Atmos. Sci., 39, 1746–1765, https://doi.org/10.1007/s00376-022-1439-1, 2022.
Liu, F., Du, J., Huang, E., Ma, W., Ma, X., Lourens, L. J., and Tian, J.: Accelerated marine carbon cycling forced by tectonic degassing over the Miocene Climate Optimum, Sci. Bull. (Beijing), 69, 823–832, https://doi.org/10.1016/j.scib.2023.12.052, 2024.
Lunt, D. J., Valdes, P. J., Haywood, A., and Rutt, I. C.: Closure of the Panama Seaway during the Pliocene: implications for climate and Northern Hemisphere glaciation, Clim. Dynam., 30, 1–18, https://doi.org/10.1007/s00382-007-0265-6, 2008.
Lunt, D. J., Haywood, A. M., Schmidt, G. A., Salzmann, U., Valdes, P. J., Dowsett, H. J., and Loptson, C. A.: On the causes of mid-Pliocene warmth and polar amplification, Earth Planet. Sc. Lett., 321–322, 128–138, https://doi.org/10.1016/j.epsl.2011.12.042, 2012.
Marsicek, J., Shuman, B. N., Bartlein, P. J., Shafer, S. L., and Brewer, S.: Reconciling divergent trends and millennial variations in Holocene temperatures, Nature, 554, 92–96, https://doi.org/10.1038/nature25464, 2018.
Milanković, M.: Canon of insolation and the ice-age problem Belgrade, 1941, Kanon der Erdbestrahlung und seine Anwendung auf das Eiszeitenproblem, Jerusalem, xxiii, 484 p., 1941.
Naish, T., Powell, R., Levy, R., Wilson, G., Scherer, R., Talarico, F., Krissek, L., Niessen, F., Pompilio, M., Wilson, T., Carter, L., DeConto, R., Huybers, P., McKay, R., Pollard, D., Ross, J., Winter, D., Barrett, P., Browne, G., Cody, R., Cowan, E., Crampton, J., Dunbar, G., Dunbar, N., Florindo, F., Gebhardt, C., Graham, I., Hannah, M., Hansaraj, D., Harwood, D., Helling, D., Henrys, S., Hinnov, L., Kuhn, G., Kyle, P., Laufer, A., Maffioli, P., Magens, D., Mandernack, K., McIntosh, W., Millan, C., Morin, R., Ohneiser, C., Paulsen, T., Persico, D., Raine, I., Reed, J., Riesselman, C., Sagnotti, L., Schmitt, D., Sjunneskog, C., Strong, P., Taviani, M., Vogel, S., Wilch, T., and Williams, T.: Obliquity-paced Pliocene West Antarctic ice sheet oscillations, Nature, 458, 322–328, https://doi.org/10.1038/nature07867, 2009.
Reichgelt, T., Baumgartner, A., Feng, R., and Willard, D. A.: Poleward amplification, seasonal rainfall and forest heterogeneity in the Miocene of the eastern USA, Global Planet. Change, 222, https://doi.org/10.1016/j.gloplacha.2023.104073, 2023.
Sarr, A.-C., Donnadieu, Y., Bolton, C. T., Ladant, J.-B., Licht, A., Fluteau, F., Laugié, M., Tardif, D., and Dupont-Nivet, G.: Neogene South Asian monsoon rainfall and wind histories diverged due to topographic effects, Nat. Geosci., 15, 314–319, https://doi.org/10.1038/s41561-022-00919-0, 2022.
Setty, S., Cramwinckel, M. J., van Nes, E. H., van de Leemput, I. A., Dijkstra, H. A., Lourens, L. J., Scheffer, M., and Sluijs, A.: Loss of Earth system resilience during early Eocene transient global warming events, Science Advances, 9, eade5466, https://doi.org/10.1126/sciadv.ade5466, 2023.
Steinthorsdottir, M., Coxall, H. K., de Boer, A. M., Huber, M., Barbolini, N., Bradshaw, C. D., Burls, N. J., Feakins, S. J., Gasson, E., Henderiks, J., Holbourn, A. E., Kiel, S., Kohn, M. J., Knorr, G., Kürschner, W. M., Lear, C. H., Liebrand, D., Lunt, D. J., Mörs, T., Pearson, P. N., Pound, M. J., Stoll, H., and Strömberg, C. A. E.: The Miocene: The Future of the Past, Paleoceanography and Paleoclimatology, 36, https://doi.org/10.1029/2020pa004037, 2021.
Tian, J., Yang, M., Lyle, M. W., Wilkens, R., and Shackford, J. K.: Obliquity and long eccentricity pacing of the Middle Miocene climate transition, Geochem. Geophy. Geosy., 14, 1740–1755, https://doi.org/10.1002/ggge.20108, 2013.
van Peer, T. E., Liebrand, D., Taylor, V. E., Brzelinski, S., Wolf, I., Bornemann, A., Friedrich, O., Bohaty, S. M., Xuan, C., Lippert, P. C., and Wilson, P. A.: Eccentricity pacing and rapid termination of the early Antarctic ice ages, Nat. Commun., 15, 10600, https://doi.org/10.1038/s41467-024-54186-1, 2024.
Wang, Y., Yu, Z., Lin, P., Liu, H., Jin, J., Li, L., Tang, Y., Dong, L., Chen, K., Li, Y., Yang, Q., Ding, M., Meng, Y., Zhao, B., Wei, J., Ma, J., and Sun, Z.: FGOALS-g3 Model Datasets for CMIP6 Flux-Anomaly-Forced Model Intercomparison Project, Adv. Atmos. Sci., 37, 1093–1101, https://doi.org/10.1007/s00376-020-2045-8, 2020.
Wei, J., Liu, H., Zhao, Y., Lin, P., Yu, Z., Li, L., Xie, J., and Duan, A.: Simulation of the climate and ocean circulations in the Middle Miocene Climate Optimum by a coupled model FGOALS-g3, Palaeogeogr. Palaeocl., 617, https://doi.org/10.1016/j.palaeo.2023.111509, 2023.
Westerhold, T., Marwan, N., Drury, A. J., Liebrand, D., Agnini, C., Anagnostou, E., Barnet, J. S. K., Bohaty, S. M., De Vleeschouwer, D., Florindo, F., Frederichs, T., Hodell, D. A., Holbourn, A. E., Kroon, D., Lauretano, V., Littler, K., Lourens, L. J., Lyle, M., Pälike, H., Röhl, U., Tian, J., Wilkens, R. H., Wilson, P. A., and Zachos, J. C.: An astronomically dated record of Earth's climate and its predictability over the last 66 million years, Science, 369, 1383–1387, https://doi.org/10.1126/science.aba6853, 2020.
Yin, Q. and Berger, A.: Individual contribution of insolation and CO2 to the interglacial climates of the past 800 000 years, Clim. Dynam., 38, 709–724, https://doi.org/10.1007/s00382-011-1013-5, 2012.
Yin, Q.: Insolation-induced mid-Brunhes transition in Southern Ocean ventilation and deep-ocean temperature, Nature, 494, 222–225, https://doi.org/10.1038/nature11790, 2013.
Zhang, Y.: Miocene_orb, OSF [data set], https://doi.org/10.17605/OSF.IO/ZRC48, 2025.
Zhang, Z., Ramstein, G., Schuster, M., Li, C., Contoux, C., and Yan, Q.: Aridification of the Sahara desert caused by Tethys Sea shrinkage during the Late Miocene, Nature, 513, 401–404, https://doi.org/10.1038/nature13705, 2014.
Zheng, W., Yu, Y., Luan, Y., Zhao, S., He, B., Dong, L., Song, M., Lin, P., and Liu, H.: CAS-FGOALS Datasets for the Two Interglacial Epochs of the Holocene and the Last Interglacial in PMIP4, Adv. Atmos. Sci., 37, 1034–1044, https://doi.org/10.1007/s00376-020-9290-8, 2020.