the Creative Commons Attribution 4.0 License.
the Creative Commons Attribution 4.0 License.
 | 17 Apr 2026
Interplay of North Atlantic freshening and deep convection during the last deglaciation constrained by Iberian speleothems
Carlos Pérez-Mejías
Ruza Ivanovic
Lauren Gregoire
Anna L. C. Hughes
Hai Cheng
Heather Stoll
The last deglaciation featured abrupt climate shifts driven by interactions among Earth system components, notably retreating ice sheets and meltwater input. While globally detected, the magnitude, timing, and sequence of North Atlantic meltwater events remain uncertain. We present a Uranium-Thorium-dated stalagmite from northwestern Iberia spanning 24–12 ka BP, capturing both the impact of North Atlantic meltwater on surface ocean chemistry and regional air temperature changes. Our record reveals primarily gradual meltwater inflow during the Last Glacial Maximum and early deglaciation (about 20.8–18.2 ka BP), followed by abrupt increases during Heinrich Stadial 1. The first abrupt cooling is decoupled from the first meltwater pulse, appearing around 810 years later – unlike the timing observed for later pulses. This evolving relationship between meltwater and cooling provides new constraints on the changing sensitivity of deep Atlantic convection to meltwater input throughout the deglaciation.
- Article
(8241 KB) - Full-text XML
- BibTeX
- EndNote


The last deglaciation started in the Northern Hemisphere (NH) around 19 thousand years before present (ka BP), and marks the transition from the Last Glacial Maximum (LGM), lasting from approximately 23–18 ka before present (BP), into the Holocene (Clark et al., 2012). During the LGM, the NH was covered by large ice sheet complexes (Fig. 1a) covering much of North America and Eurasia (Stokes et al., 2012; Hughes et al., 2016). An increase in boreal summer insolation triggered their retreat and during their subsequent deglaciation there were episodically large amounts of meltwater (MW) and icebergs delivered into the North Atlantic (e.g. Toucanne et al., 2015; Hodell et al., 2017; Lin et al., 2021; Zhou and McManus, 2024).
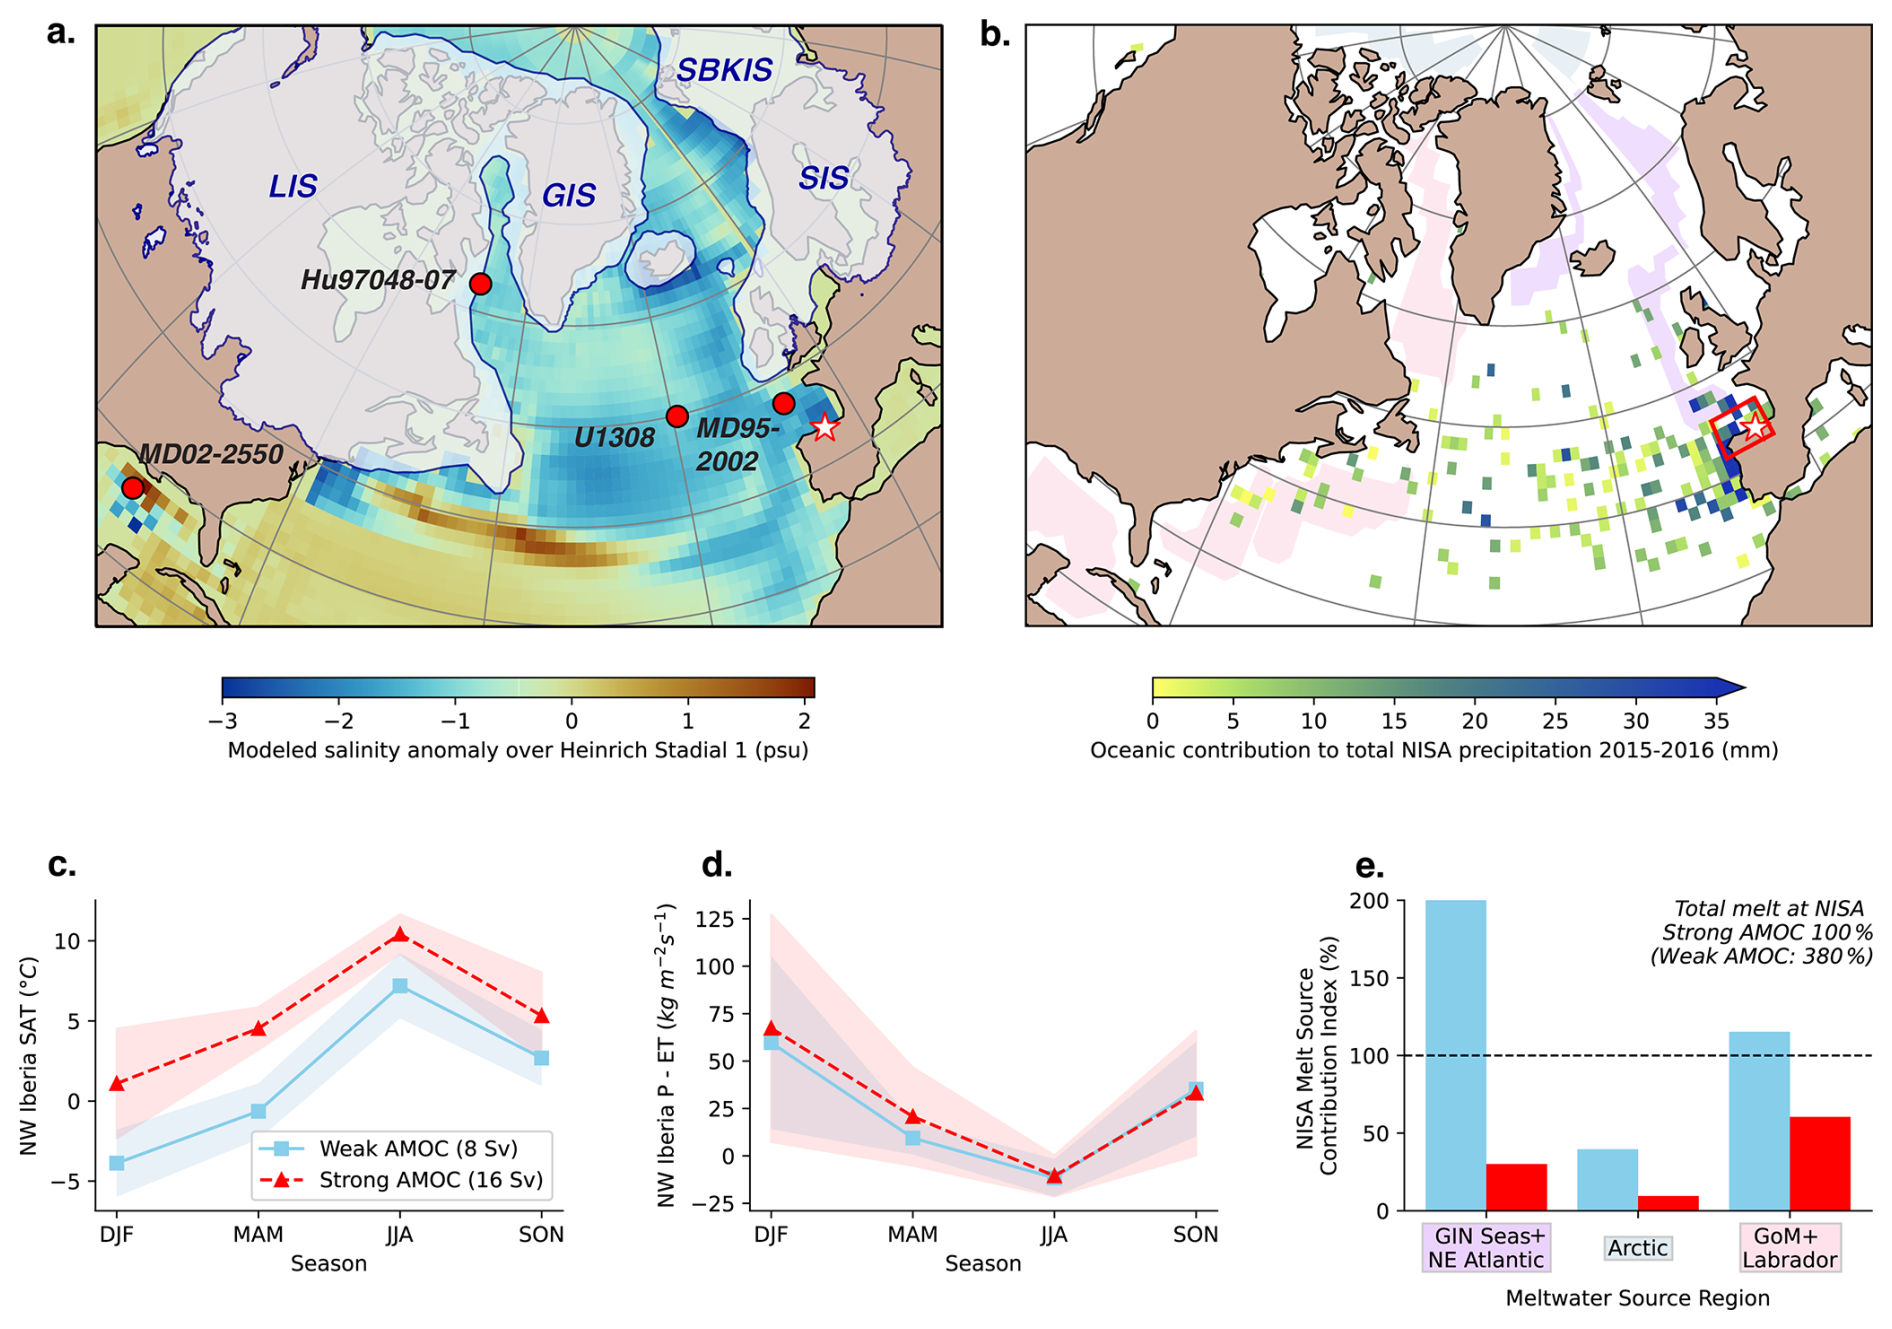
Figure 1Overview of sites referenced in this study, the expected meltwater signal originating from different ocean bassins, and the expected environmental changes related to an AMOC decline. (a) A Map including the study site NISA (red-rimmed white star) and other sediment cores used in this study for proxy comparison (red circles), namely MD95-2002 (Toucanne et al., 2015), U1308 (Hodell et al., 2017), Hu97048-07 (Rashid et al., 2012), and MD02–2550 (Wickert et al., 2023). The maximum LGM ice sheet extent (Batchelor et al., 2019) (grey, blue border) is illustrated for the main northern ice sheet sectors: Laurentide (LIS), Greenland (GIS) and the European Ice sheet (EIS) sectors: Svalbard–Barents–Kara (SBKIS), Scandinavian (SIS) and British-Isles (BIIS). Ocean colouring illustrates the simulated mean annual sea surface salinity anomaly expected for Heinrich Stadial 1 (Ivanovic et al., 2018) due to meltwater input and associated AMOC decline. (b) A Map showing the oceanic moisture source areas from a Hysplit analysis on precipitation monitoring data at NISA cave sites (red-rimmed white star) from 2015–2016 (González, 2019). The colored regions denote three composite Northern Hemisphere ice sheet's meltwater source regions: the GIN Seas and northeastern North Atlantic (purple), the Arctic Ocean (light green), and the Gulf of Mexico and Labrador Sea (orange). These regions were further used to compute the regional NISA Melt Source Contribution Indexes in (e). (c, d) Based on a simulation simulating regional meltwater discharge at 17.8 ka, re-employed from Romé et al. (2022), the expected difference at our NISA study site (averaged over the red rectangular region) between different AMOC states for (c) surface air temperature and (d) moisture availability (precipitation-evapotranspiration; P-ET). (e) Barplot shows the NISA Melt Source Contribution Index (Appendix B); a relative mean contribution estimate of how much meltwater reaches the NISA location from each of the three regions after 200–300 years of continuous injection during a weak (blue) and strong (red) AMOC state, based on a simulation using meltwater input at 17.8 ka BP (Romé et al., 2022).
It is well established, both conceptually (Denton et al., 2010; Alvarez-Solas and Ramstein, 2011; Menviel et al., 2020) and by modeling studies (Jackson et al., 2015; Klockmann et al., 2018; Romé et al., 2022), that MW contributions can cause an abrupt weakening of the Atlantic Meridional Overturing Circulation (AMOC) – the zonal integral of the surface and deep currents in the Atlantic – if the Atlantic is conditioned for instability. Such weakening, in turn, would lead to hemispheric-scale cooling in the north, warming in the south and trigger atmospheric CO2 rise (Broecker et al., 2010). While there is evidence for several episodes of AMOC weakening and NH cooling during the deglaciation (Mcmanus et al., 2004; Shakun et al., 2012; Ng et al., 2018), linking these to specific melt discharge events remains challenging. Uncertainties in ice geometry, even at the scale of total volume and global distribution (Stokes et al., 2015), propagate into the derived meltwater histories mostly used for transient deglacial simulations (Bethke et al., 2012; Sherriff-Tadano et al., 2018; Kapsch et al., 2022; Snoll et al., 2024). Furthermore, direct evidence for meltwater from palaeoclimatic records is sparse and retrieving accurate radiocarbon ages from marine cores on such short centennial time scales is hindered by the increased stratification during weak AMOC states (Peck et al., 2006; Peck, 2017). Generally, time scales relevant for melt events range from a few years to a few centuries, a time range in which the North Atlantic ocean and its adjoint ice sheets are not able to equilibrate (Wunsch and Heimbach, 2008, Fig. 1c), emphasizing the need for more regional records to reconstruct their sequence and impact on the Earth system. Even more so, as modulations of AMOC strength depend on background climate (Zhu et al., 2015), and can occur directly forced by freshwater (Zhu et al., 2017; Snoll et al., 2024), spontaneously (Romé et al., 2022; Armstrong et al., 2023) or delayed (Alvarez-Solas and Ramstein, 2011; Romé et al., 2024). This adds an additional layer of complexity to the synchronization of regional melt events with global records.
To move forward our understanding of the relationship between melt-induced freshening and AMOC strength, we are building upon a direct freshening mechanism by detecting the 18O-depleted MW in speleothem δ18O proximal to the melt water source regions, an effect previously documented in the Northwest Iberian Speleothem Archive (NISA) (Stoll et al., 2022) and model simulations (Zhu et al., 2017). Here, we provide a new decadally-resolved isotopic record from NISA, 24–12 ka BP, to constrain the timing of MW addition and elucidate the relationship between melt-induced freshening, North Atlantic temperature changes and AMOC strength throughout the entire last deglaciation. Given the coastal location of our site and prevailing atmospheric conditions induced by Earth's rotation, the direct effect of δ18O-depleted MW on the surface ocean is captured by δ18O in the speleothem, allowing us to infer the history of NH MW at high temporal resolution. In addition, we provide a coeval record of relative temperature from speleothem δ13C, which we have corrected for in-cave fractionation effects (). Since both stable isotopes are measured on the exact same samples, this allows a direct and high-resolution study of the temporal relationship between the influx of NH MW to the ocean and temperature change in the North Atlantic realm.
2.1 Cave site, sample, preparation, and sampling procedure
Modern precipitation at the cave site is dominated by cool season rainfall, but many drips remain active also during the summer period of lower precipitation-evapotranspiration. Speleothem Glas has been selected for this detailed study because of the absence of any signs for non-continuous growth and for featuring a homogenous trace element structure, also when diverging from the main growth axis (Appendix A, Fig. A1). We focus on the 4.2 cm interval of Glas bracketed by a growth discontinuity on the older part and significant decrease in growth rate on the younger boundary (Fig. 2). Due to the slow growth rate and the presence of abrupt climate changes over the early last deglaciation, the sampling strategy for dating has been optimised by continuously micro-milling the sample with a 50 µm trench along growth layers, measuring stable isotopes on these individual samples, before combining the remaining powder of around 10 samples to retrieve one date. This approach is superior when aiming for high temporal resolution in a slow-growing stalagmite because it eliminates possible mismatches when aligning the midpoint of a dating hole to the isotope track. Samples were collected by a trench using the ESI NewWave microdrill. The trench drill track was pre-programmed to follow growth layers within the Image Processing Software Fiji (Schindelin et al., 2012), based on prior analysis of microscopic and confocal laser scanning microscopy. The new trench was aligned to an older 100 µm trench for quality control and aligning trace element measurements (Appendix, Fig. A9).
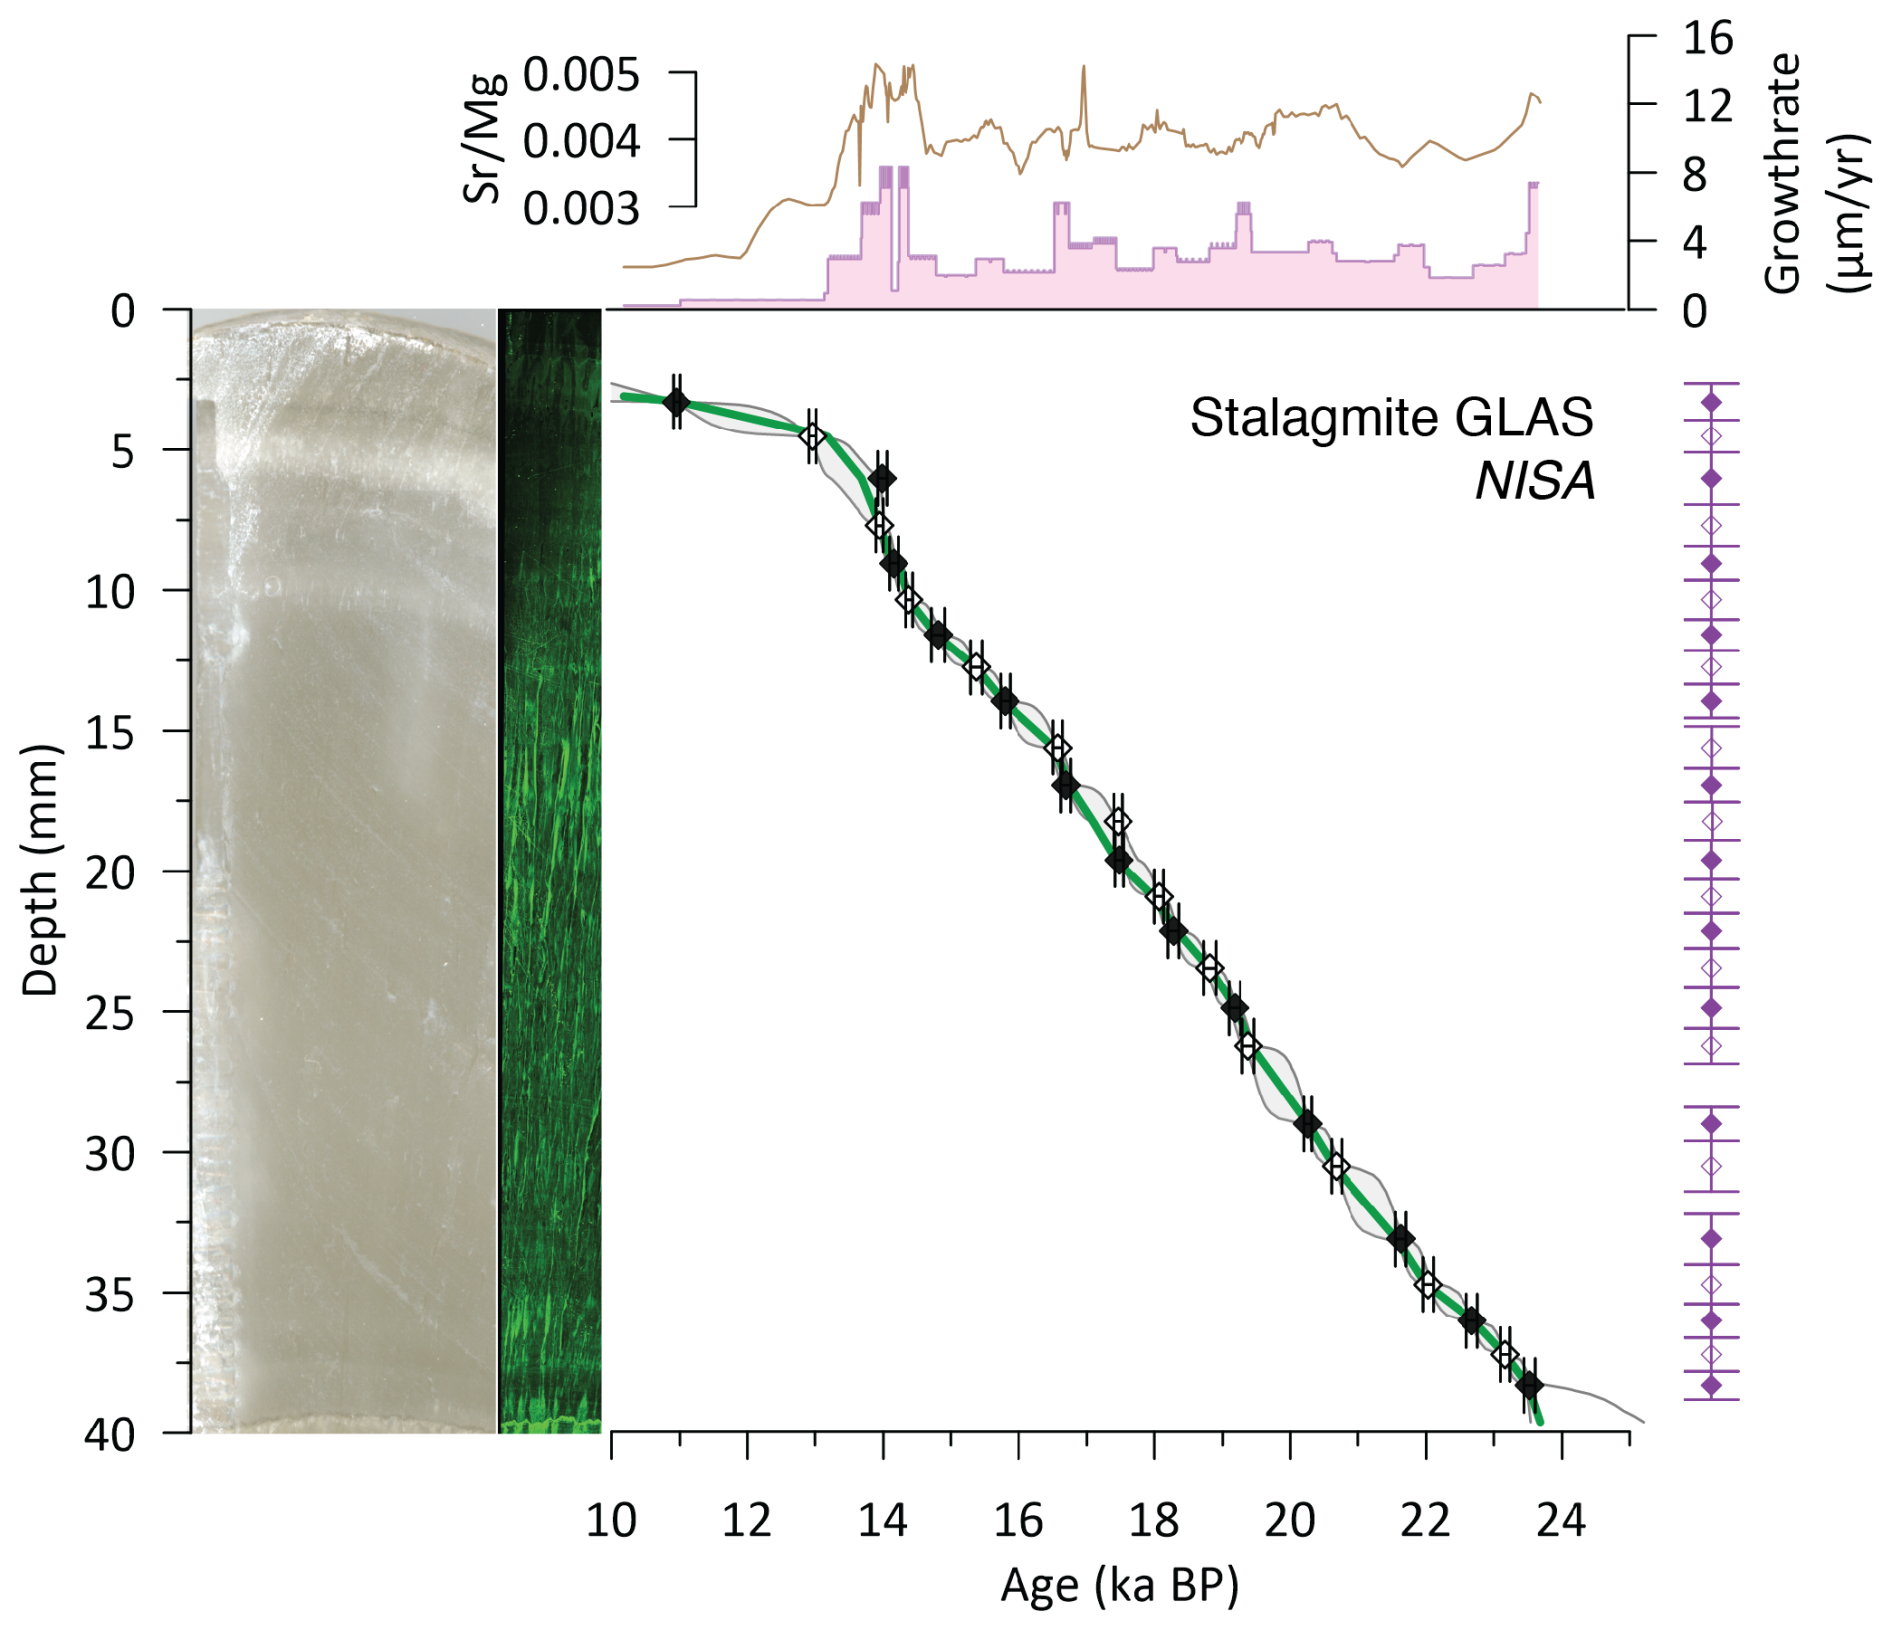
Figure 2Age model of NISA Stalagmite Glas. Main panel from left to right: scan of the slab used for analysis (grey shading); the corresponding Confocal laser scanning microscopy image (green shading); and the constructed BChron age model (green line) used in all further analysis (Methods), based on the U−Th ages (black diamonds, bounded by horizontal errorbars denoting the 2σ uncertainty); and, on the right, actual depth of the combined, original samples used in this study (purple vertical errorbar). Open and filled symbols were chosen to simplify retrieving the width of a specific dating hole by comparing directly with the purple vertical errorbar indicators. Note that our sampling procedure ensures no shift between the assigned depths for dating and isotope track. In the top panel, growth rate is calculated based on the BChron age model (pink fill), and we use ratio (brown line) as an additional indicator for changes in growth rate to confirm the age model from the dating sequence. The pearson correlation coefficient between and growth rate of the author age model is 0.6.
2.2 U−Th dating and age model
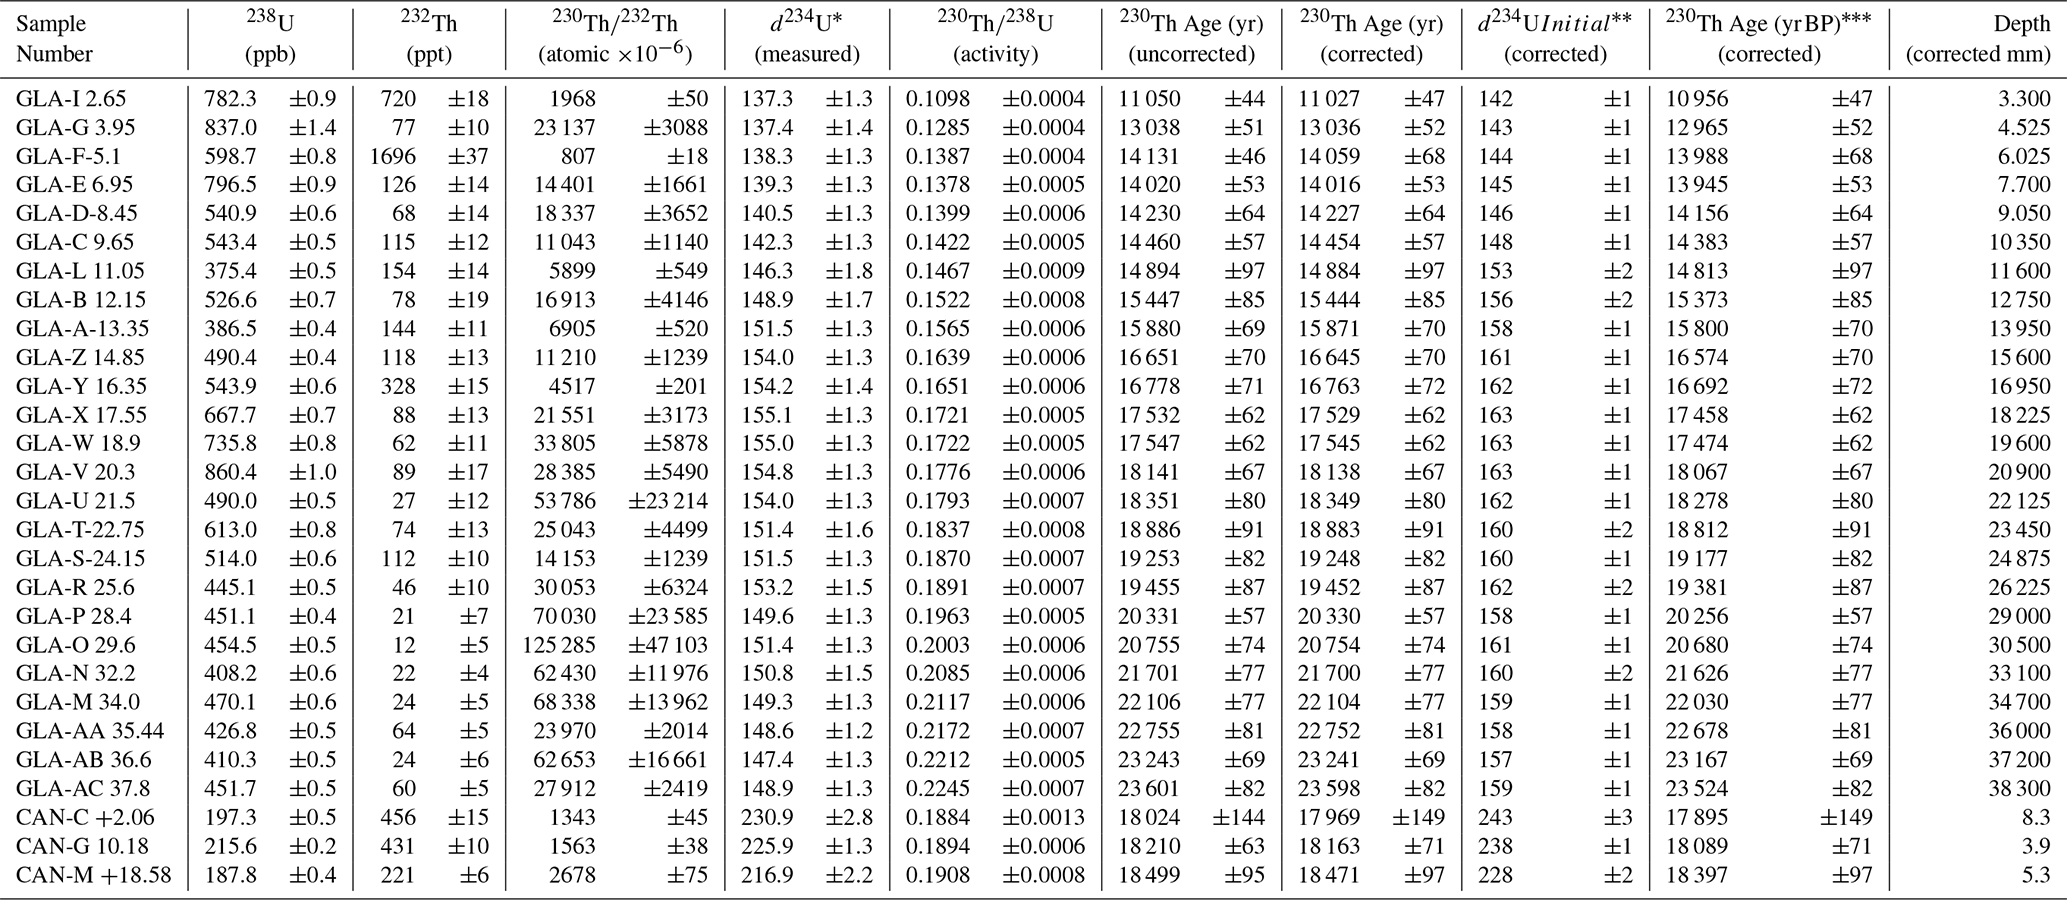
Despite small sample sizes (20–40 mg), good analytical errors of less than 100 years have been achieved in each sample. U−Th samples were analyzed with a ThermoFisher Neptune plus Multicollector Inductively Coupled Plasma Mass Spectrometer (MC-ICP-MS) at Xi'an Jiaotong University, following the methodology and decay constants reported in Cheng et al. (2013), see Appendix Table A1.
The age-depth model (Fig. 2) has been computed per the algorithm of Haslett and Parnell (2008), using the package BChron with 50 000 iterations, equal outlier probability of 0.1 for each sample and by explictly providing the dating sample thickness as an additional constraint. The age uncertainties stated in the paper are the 95 % credible interval (CI) output of this statistical model. The chosen author age model that is used for further analyis in this work is selected from the full ensemble of plausible posterior BChron age models as one of the posterior realisations featuring the highest correlation with the ratio, while also exhibiting a comparably small root mean square error (RMSE) compared to the BChron median age model. An extended comparison plot between the differences in the resulting growth rates available in the Appendix (Fig. A2). The author age-depth model remains within the 95 % CI of the BChron model and correlates to ratio with a pearson correlation coefficient of 0.6 (BChron Median: 0.15). We consider this age model superior to the statistical median model as it allows to use to inform on any short term growth rate variations that are not resolved by the coarser sampling increment. This assessment is based on prior studies documenting that from this cave system correlates well with growth due to the growth rate dependence of Sr partitioning (Sliwinski et al., 2023). Further, we investigated whether changes in the delivery of Mg from sea spray could break this relationship by monitoring the delivery of sea aerosols to the cave system (Kost and Stoll, 2023): median modern dripwater Na concentrations in the interior cave sectors where Glas was collected are 5 ppm, thus for the minimum stalagmite at 9 mmol mol−1 (DMg of 0.0225) this Mg from marine aerosols would consitute 3 %–6 % of the dripwater Mg for open system dissolution in the range of 600–8000 ppmv CO2, leading to variations in the drip water and of about 3 % between glacial and interglacial endmembers, a very small variation compared to the measured range of 0.002–0.006 (a 40 % increase) in this sample.
2.3 Stable isotope and trace element ratios measurements
Stable isotope ratios were measured at ETH Zurich with a Thermo-Finnegan Delta V Plus coupled to Gas Bench II (Breitenbach et al., 2015). Carbonate powder for trace element analysis were dissolved in 2 % HNO3 and analyzed for trace element to calcium ratios employing an Agilent 8800 QQQ ICP-MS at ETH. Samples and standards were run at Ca concentrations of 400 ppm. Calibration used matrix-matched standards prepared from single element standard solutions to cover the range of trace element to Ca ratios found in stalagmite samples. Our calibration standard composition accounts for trace element impurities in the Ca standard, which were determined using standard additions. Calibration was conducted offliine using the intensity ratio method described by De Villiers et al. (2002). Analytical drifte was corrected with standards run afteer every 10 unknowns. Precision on and ratios is <2 % (1σ).
2.4 Correction for in-cave fractionation
Prior calcite precipitation (PCP) occurs when parts of the initial dripwater solution already supersaturate and precipitate due to the exchange with cave air before reaching the stalagmite. PCP can alter the δ13C signature significantly, by preferentially removing 12C from the remaining dripwater solution (Rudzka et al., 2011; Fohlmeister et al., 2020). To focus on the temperature signal preserved in soil CO2 and consequently δ13C, the record was corrected for PCP by using the ratio as a guide line for the amount of degassing occurring, following the methodology of Stoll et al. (2023), with details being described in Appendix B. In contrast, in most instances, the actual bedrock δ13C is of minor relevance, as the system can be assumed to be rather open and therefore the CO2 in the soil overwhelms the rock signature (Lechleitner et al., 2021).
2.5 Event nomenclature, midpoint and duration estimation
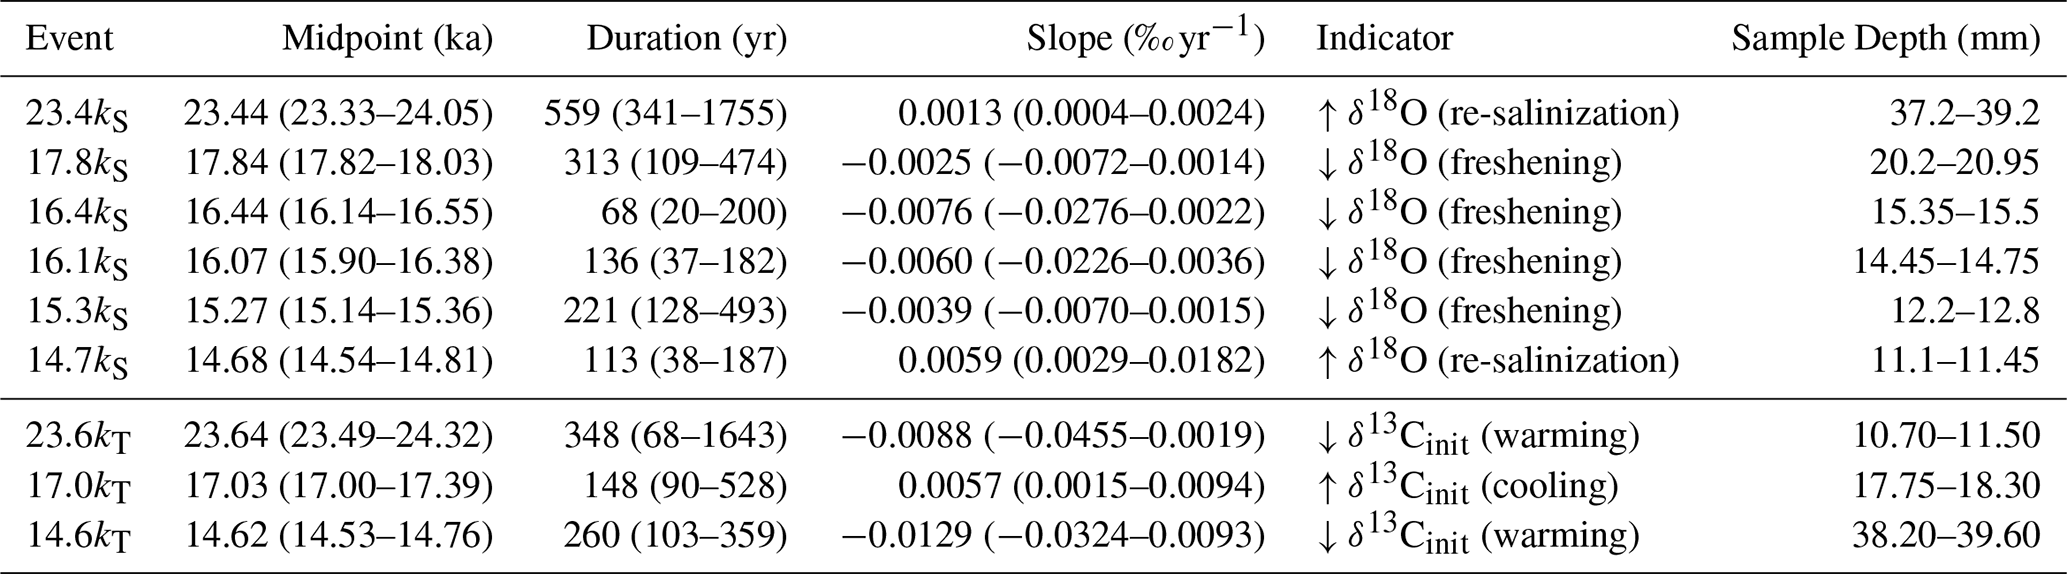
To estimate the timing and rate of the key transitions discussed in the manuscript, we propagated age and measurement uncertainties using a Monte Carlo errors-in-variables framework. For each of the 6000 age-depth posterior realizations derived from the Bayesian age model (BChron, Haslett and Parnell, 2008), we extracted a start and end age corresponding to the two bracketing depths of a given transition. Measurement uncertainty in δ18O (±0.1 ‰, 1σ) was incorporated by adding Gaussian noise to the observed endpoint values in each realization. For the author age model and each posterior draw i, we computed the midpoint as and the rate of change by computing the slope . Duration of an event was estimated similarly by subtracting the end from the start age in all posterior realisations. Uncertainty estimates (95 % CI) were obtained directly from the empirical distributions of these quantities across all posterior realizations, while the event names are derived from the author age model. To assess robustness to the exact choice of bracketing depths, we repeated the analysis using adjacent samples surrounding each transition. The resulting midpoint ages and durations remained within the 95 % CI of the original estimates, indicating that the inferred timing and rates are not sensitive to small variations when selecting the depth interval. Further, the estimates of the author age model also remain within the 95 % CI for all values, which gives further support that the author age model is consistent with all data and not an outlier realisation. The summarized results are given in Table 1 and are visualised in Fig. A3.
Table 1Overview of the abrupt salinity and temperature transitions in stalagmite Glas, which are discussed further in this work. All events are named by their midpoint and their type, where “S” and “T” indicate variation in surface ocean salinity (related to freshwater input) and abrupt change in regional temperatures, respectively. The first value in the columns Midpoint, Duration and Slope indicate the value derived from the author age model, while the 95 % CI from the BChron ensemble is given in brackets. The sample depth informs about the start and end point chosen to characterise the transition. This analysis was repeated using adjacent samples surrounding each transition, resulting in midpoint ages and durations remaining within the 95 % CI of the original estimates. Computation of midpoints and their uncertainties are visualised in Appendix Fig. A3.
2.6 Climate model experiments and NISA Melt Source Contribution Index
We reemploy an already published HadCM3 model simulation (Romé et al., 2022) to examine the progression of a freshwater anomaly from different source origins and under different AMOC states to the NISA location. The original simulation includes 10 000 model years and captures a glacial climate state with an AMOC that oscillates between a strong (relatively “warm” climate) and a weak (relatively “cold” climate) state, with about 1500 year periodicity, triggered by a constant meltwater flux corresponding to a reconstructed ice sheet history at 17.8 ka BP (GLAC-1D, Ivanovic et al., 2016), with more detailed model description in Appendix B3. To study the effect of an AMOC decline on the regional climate above the cave, we have computed the seasonal averages of surface air temperature and precipitation – evapotranspiration, plotted in Fig. 1c and d, for the region confined by a red border in Fig. 1b. To distinguish between a strong and a weak state AMOC within the simulation, we followed the methodology of Romé et al. (2025), where the years that fulfilled each condition were selected based on changes in the mixed layer depth (MLD) in key convection sites (Irminger and GIN Seas). In these simulations, Irminger Sea MLD is in the range 17–25 m during the weak AMOC state, deepening to 25–65 m during the strong AMOC state. GIN seas MLD is 27–40 and 65–105 m, respectively. From the full simulation, 2367 years fulfilled the “weak” condition (average AMOC strength at 26.5° N: 8 Sv), and 1488 years fulfilled the “strong” condition (16 Sv), coined “zonal” in Romé et al. (2022).
Segments of the simulation were re-run for our study, adding a set of passive ocean tracers tagging the different likely meltwater source regions to assess the potential of each region to influence the isotope signal at our study site. The results are presented as a qualitative NISA Melt Source Contribution Index (Fig. 1e). We calculate the index by scaling the model's surface-ocean dye anomalies after 200–300 years of continuous injection (Fig. 1b) using estimated moisture uptake at the site and provide a percentage estimate of three key delivery regions to the full signal at NISA expected for a strong AMOC mode. The uptake estimates are derived from a HYSPLIT analysis based on rainfall at the NISA location El Pindal during 2015–2016 (González, 2019). The index is not tied to a specific meltwater scenario; instead, it provides a relative estimate of how efficiently meltwater from a given northern ice sheet sector can reach our study site under varying AMOC circulation modes. The constant meltwater flux that was applied in the underlying simulations has the consequence that lag times between meltwater injection and AMOC decline can not be assessed for these simulations. However, both, AMOC theory (e.g. Barker and Knorr, 2021) and GCM model results (e.g. Romé et al., 2025), suggest that the response of AMOC to a specific meltwater forcing is likely climate and ocean background state dependent and includes the possibility of a delayed response. For example, a recent high resolution GCM model found AMOC collapse occurred 1750 model years after the onset of a gradually increasing North Atlantic freshwater forcing (Van Westen et al., 2024). As we argue here, NISA speleothem data provides a direct pathway to investigate such lag times by comparing the two proxy time series δ18O and δ13Cinit, thus contributing to the understanding of AMOC strength sensitivity to a meltwater forcing under evolving background conditions.
3.1 Sensitivity of NISA to surface ocean freshening and cooling
At NISA cave locations (Fig. 1), precipitation is mainly controlled by westerly winds and the passage of Atlantic fronts while the Cantabrian mountain ridge reduces the influence of water vapor transport from the south (Moreno et al., 2021), making rainfall from the proximal North Atlantic the dominant moisture source. Over the penultimate and the last deglaciation, speleothem closely tracks the long term trend in δ18O of seawater () reconstructed from marine archives from the eastern North Atlantic (Stoll et al., 2022). This strong response to the moisture source composition occurs because in this setting, the temperature-dependent fractionation of δ18O into calcite is of a similar magnitude but opposite sign to the temperature dependence of δ18O in precipitation (McDermott et al., 2006; Stoll et al., 2015), which mitigates additional speleothem δ18O variability due to temperature changes. Additionally, due to the coastal cave location, effects on δ18O due to changes in altitude or prior rainout are minimized.
On a centennial time scale, a freshwater anomaly originating from a certain ice sheet sector will not spread evenly across latitudes and depths. This may amplify or attenuate the impact of a given meltwater flux on the proxy archive. To test the dependency of source origin and AMOC background state, the distribution of meltwater from different NH ice sheet sectors has been tracked by adding conservative dye tracers to the simulations of Romé et al. (2022). We compute the relative intensity of the tracer in the proximal sector of the modern NISA moisture source region (Fig. 1b). The sensitivity of the tracer to the source region and AMOC state is expressed as the NISA Melt Source Contribution Index (Appendix B). The Melt Source Contribution Index demonstrates that for a given meltwater flux (Fig. 1b and e), the signal from ice sheet meltwater reaching the NISA sites is higher when AMOC is in a weak state than in a strong state, regardless of the melt source region. This is because a stronger AMOC more rapidly redistributes meltwater throughout the global ocean. Furthermore, we can identify that under the weak AMOC state, the tracked NISA source region more strongly accumulates meltwater of Eurasian origin delivered to the GIN Seas and the Eastern North Atlantic, whereas meltwater discharged by the Laurentide ice sheet to the western North Atlantic more strongly accumulates in the tracked region under strong AMOC conditions (Fig. 1b). For both, weak and strong AMOC, meltwater anomalies originating from the Arctic will already largely propagate to the subsurface waters and have limited impact on the surface North Atlantic .
In our record, provides a qualitative measure of regional surface air temperature. This is because the δ13C of cave dripwater is initially set by the exchange of infiltrating water with CO2 in the soil and epikarst. In moisture-replete regions such as NW Iberia, warmer temperatures stimulate higher heterotrophic and autotrophic respiration rates and raise soil CO2 (Romero-Mujalli et al., 2019). Because respired CO2 is much lower in δ13C than atmospheric CO2, warm periods of high soil CO2 lead to a more negative δ13C signature in cave dripwater. While in-cave processes of degassing and prior calcite precipitation (PCP) can in some cases subsequently modify the δ13C signature in cave dripwater (Mühlinghaus et al., 2007; Mickler et al., 2019), recent approaches using as an independent PCP indicator allow calculation of the initial defined by the soil and vegetation processes from the measured δ13C (Stoll et al., 2023; Lechleitner et al., 2021) (parameters are given in Appendix B). The relative temperature indicator is likely to be more sensitive in a colder climate, as then the overall soil CO2 is lower and δ13C of soil CO2 follows the Keeling mixing line (Kost et al., 2022).
The temperature sensitive indicator δ13Cinit is criticial for this work, because Northwestern Iberia is also particularly sensitive to AMOC-driven changes in temperature (global maps in Appendix, Fig. A5). A switch from a strong to weak AMOC state in the early deglaciation drives surface air temperature changes of up to −5 °C in NW Iberia for all seasons in our simulations (Fig. 1c), a finding in agreement with previous studies highlighting the Eastern North Atlantic sensitivity to AMOC strength variation in the context of millennial-scale variability (Zhang et al., 2015). In contrast, the moisture availability within the region remains similar across such transitions (Fig. 1d). Over the entire last deglaciation other processes besides AMOC variability may have influenced North Iberian surface temperatures such as changes in arctic sea ice extent and export (Condron et al., 2020), atmospheric circulation (Ludwig et al., 2016; Bellomo et al., 2023) as well as further changes in global climate feedbacks and insolation (e.g. Alley and Clark, 1999). Thus, attributing the well-dated NISA temperature changes to a change in AMOC strength follows a combined assessment with other proxy archives indicating variation in AMOC strength in the studied interval (Shakun et al., 2012; Ng et al., 2018; Pöppelmeier et al., 2023).
3.2 The deglacial North Atlantic climate record of Glas
The stalagmite named “Glas” originates from the NISA cave “La Vallina” (4.8067° W, 43.4100° N), located 4 km from the modern coastline. Twenty-five new dates, with analytical errors of less than 100 years, constrain the chronology of Glas between 24–12 ka; and potential variations in growth rates are assessed through comparison with measurements (Fig. 2, Table A1, Figs. A1 and A2). Annual growth rate averages 4 µm, but drops to 1 µm around 13 ka. By using combined aliquots of the same sample powder for Uranium-Thorium dating as have been used for high-resolution stable isotope analysis, a fully consistent age model with minimized depth uncertainties is attained for the sequence of isotopic events despite the slow growth rate. The slow growth rates and the lack of seasonal laminations in Glas suggest that the speleothem has been growing from a matrix-fed drip, which, at the depth of the cave passage (>20 m), may have continued dripping throughout the year. At the depth of the cave passage, the seasonal soil temperature cycle is muted, while overall temperatures are expected to remain above freezing even under a weak AMOC state (e.g. model results in Tapia et al., 2025, Fig. 8). Featuring this improved age model, Glas supersedes the prior NISA stack for the last deglaciation, but the main features of Glas have been validated in other NISA records (Appendix, Fig. A4). The record features a several abrupt transitions within δ18O and δ13Cinit, which are summarized in Table 1.
3.3 North Atlantic surface ocean freshening history
3.3.1 LGM evolution
Our new record from Glas captures the end of Heinrich Stadial 2 (HS2) with a trend to more saline conditions in the North Atlantic indicated by the shift to a heavier δ18O signature (event 23.4kS, see Table 1 and Fig. 3), and the coincident rapid recovery to warmer temperatures evident by a shift to more negative δ13Cinit (event 23.6kT). The observed warming likely reflects a strengthening of AMOC after HS2, which results in a more efficient dispersal/removal of δ18O anomalies from the surface ocean, a process highlighted by our modeling results for which the NISA melt source Contribution Index is dampened if the AMOC is stronger for all meltwater source origin sites (Fig. 1e). Our chronology is consistent with the proposition that the HS2 phase of Southern BIIS retreat and associated enhanced MW flux to the ocean ended around 23.5 ka, aligning with the Southern European Ice sheet (EIS) events found in sediment cores (Toucanne et al., 2015). The ice sheet model GLAC-1D (Ivanovic et al., 2016), which has been used to force transient deglacial climate simulations in a number of studies previously (Snoll et al., 2024), suggests a slightly later timing of peak meltwater delivery from the Southern Laurentide ice sheet (LIS) via the Labrador Sea and the Gulf of Mexico as well as some meltwater discharging into the Arctic region (Fig. 3a and b.; extended discussion and ice sheet mass loss maps in Appendix A4, Fig. A7). Thus, the new Glas record suggests that either the GLAC-1D model shows these elevated melt events around 500 years too late, or despite a persistently high meltwater discharge, AMOC has restrengthened and successfully dissipated the surface δ18O anomaly from a LIS meltwater pulse postdating HS2.
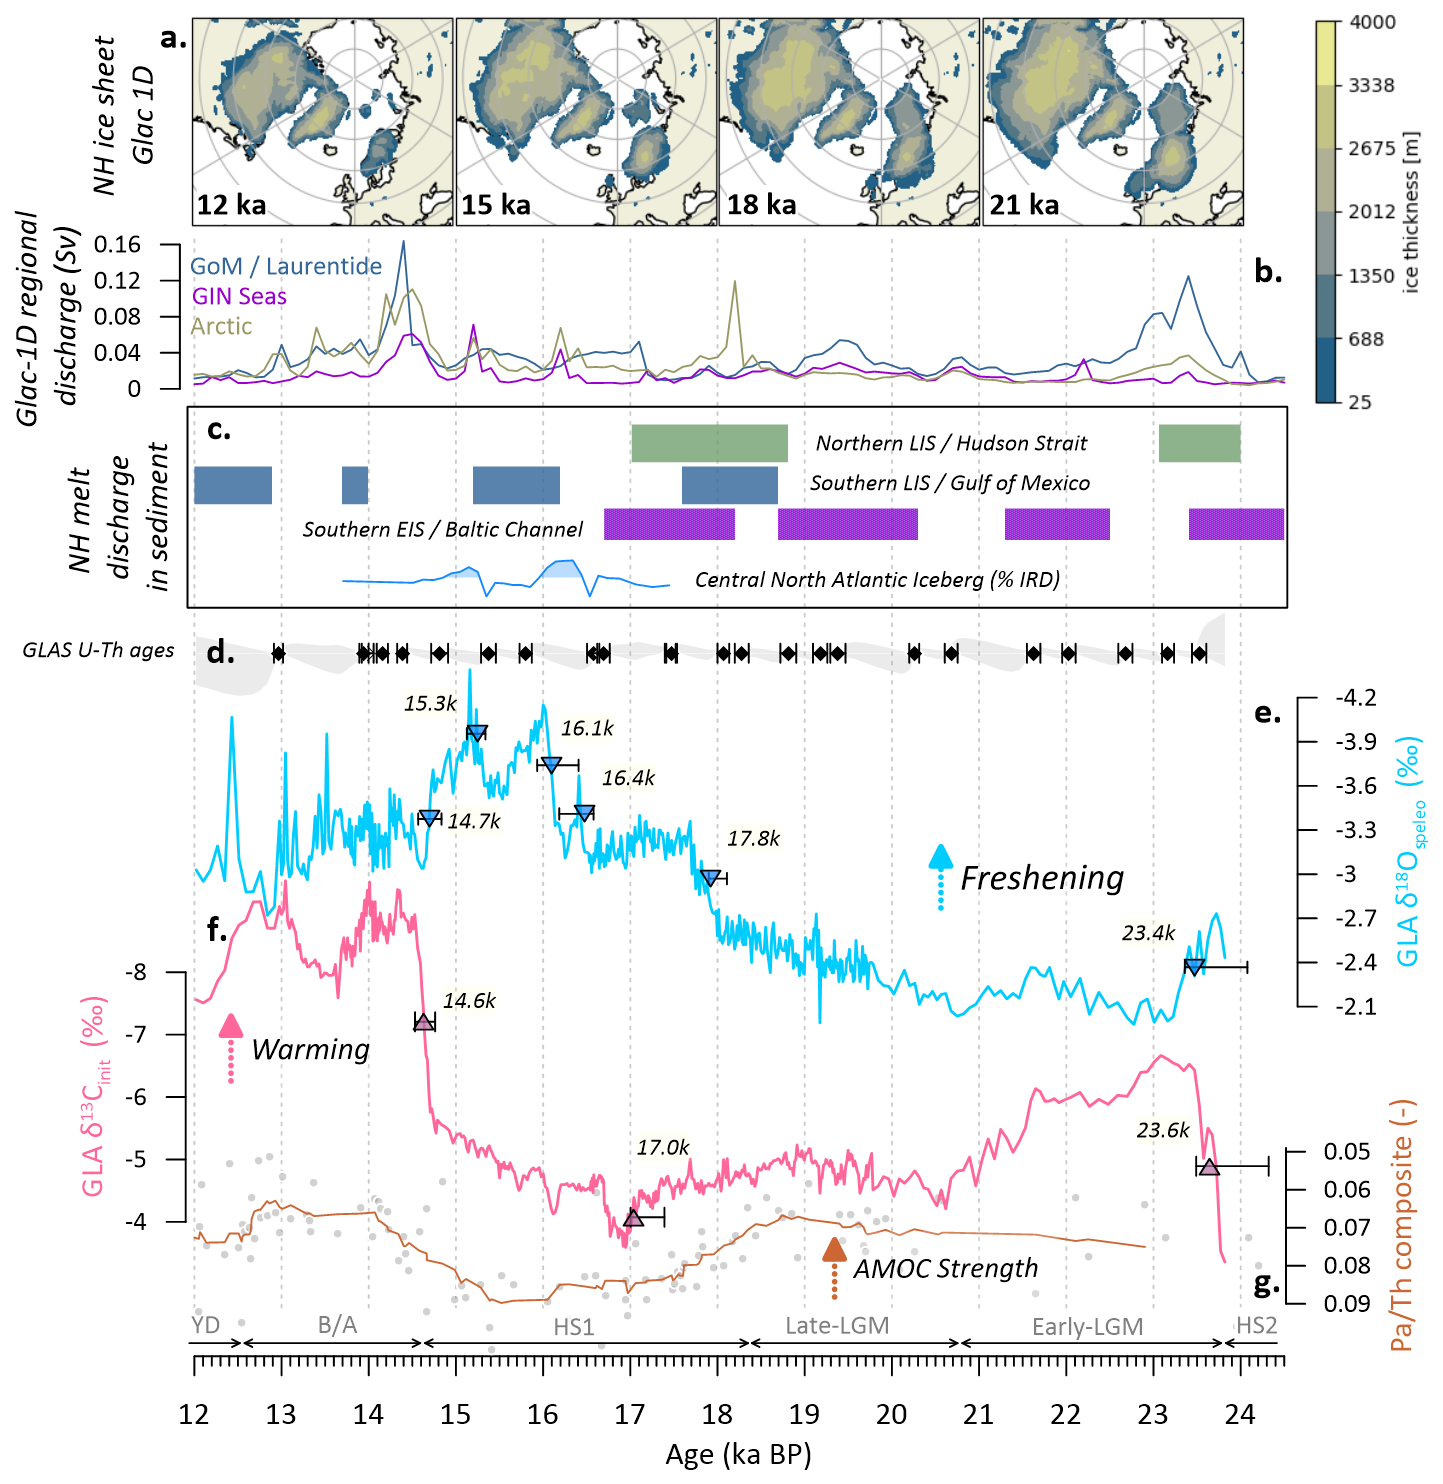
Figure 3Speleothem record Glas and its relationship to last deglaciation ice sheet history and AMOC strength. (a) Snapshots of GLAC-1D ice sheet history at key intervals (Ivanovic et al., 2016). (b) River-routed MW delivered to the three key ocean regions identified in Fig. 1, computed in Romé et al. (2022) from the GLAC-1D ice sheet reconstruction. (c) Simplified history of proposed MW discharge events from different Northern Hemisphere ice sheet sectors in sedimentary archives, broadly: the Northern Laurentide (Denton et al., 2021; Rashid et al., 2012), Southern Laurentide (Wickert et al., 2023), Channel River discharge (Toucanne et al., 2015), and distally transported iceberg rafted debris (IRD) concentration at site U1308 (Hodell et al., 2017); simplified (Appendix, Fig. A6). The new data of Glas (this study) is plotted in (d) the position of ages (black diamonds), their associated analytical age uncertainty (black errorbars) and schematic representation of resulting age model uncertainty (grey shading); (e) δ18O, used as a proxy for surface ocean freshening, and (f) , used as a proxy for surface air temperature above the cave. The triangles in both Glas time series mark the location of the midpoints of abrupt events discussed in this manuscript, with the nomenclature introduced in Table 1. (g) 9-point average composite ratio inferred to respond to AMOC strength (Ng et al., 2018). The brown fill reflects the 2-σ standard error of the composite and the grey dots the individual composite data points.
A subsequent episode of melting from 22.5 to 21.5 ka is suggested by a small, gradual decrease in δ18O of −0.3 ‰, which returns to previous levels between 21.5–20.5 ka. Sustained freshening begins around 20.5 ka, marked by a gradual decrease of −0.5 ‰ δ18O over 2 ky (Fig. 3). This progressive freshening confirms the presence of MW in the eastern North Atlantic, for which a source could be melt from the Scandinavian ice-sheet (SIS) as previously suggested by Nd isotope provenance of detrital minerals delivered into the Bay of Biscay (Toucanne et al., 2015).
3.3.2 Abrupt freshwater increase at 17.80 ka
An abrupt freshening (−0.58 ‰ δ18O in years, event 17.8kS in Table 1) occurrs centered around its midpoint at 17.8 ka BP and which we interpret as the onset of Heinrich Stadial 1, with other regional Iberian speleothem records also indicating negative δ18O shift around this time (OST2, Bernal-Wormull et al., 2021). This freshening may reflect accelerated ice sheet melting in various regions (Fig. 3c). For example, there is evidence of elevated freshwater drainage from the Southern Laurentide to the Gulf of Mexico (Wickert et al., 2023), and reconstructions of EIS evolution (Hughes et al., 2016; Clark et al., 2022) suggest a strong likelihood that SIS and BIIS separated by 18 ka BP. The river-routed GLAC-1D ice model time series suggests discharge mainly into the Arctic, but since our dye tracking indicates that freshwater discharged into the Arctic produces only a weak signal in our speleothem record (Fig. 1e), the strong and abrupt freshening signal recorded by Glas at 17.8 ka BP rather suggests that at least part of the associated melt from the overall EIS retreat, visualised in the maps in Fig. 3a, were delivered to the GIN Seas and Eastern North Atlantic directly. This route would be consistent with the high terrestial input through the channel river recorded at that time (Toucanne et al., 2015). Although the NISA Melt Source Contribution Index (Fig. 1e) shows that the elevated freshening levels could alternatively be explained by a simultaneous weakening of AMOC amplifying the signal in the North Atlantic surface ocean, on the identical chronology of GLAS we find no evidence of a major AMOC weakening at this time (see Sect. 3.4.2).
The phase of elevated freshening is directly followed by a period of sustained low δ18O, indicating that the sources and sinks of a MW-induced δ18O anomaly were in balance over the next 1500 years. A negative δ18O value from a freshwater pulse can be subsequently sustained despite lowered meltwater delivery if AMOC is weak, especially if the MW discharge region (i.e. GIN Seas and NE Atlantic) is close to our study site (Fig. 1b). In this case, sustained low δ18O values in a weak AMOC state could potentially also mask limited ice sheet regrowth, as suggested in Wickert et al. (2023). Alternatively, marine records from the Hudson Strait indicate elevated meltwater delivery to the Atlantic (Rashid et al., 2012; Denton et al., 2021), which could provide an additional source to sustain the Glas δ18O anomaly provided that the AMOC remains relatively vigorous.
3.3.3 Transient freshening from 16.5 ka through the Bølling-Allerød
A first smaller excursion with a midpoint at 16.4 ka BP and a change of −0.5 ‰ δ18O, is followed by two larger events with transition midpoints at 16.1 and 15.3 ka BP with a shift around −0.79 ‰δ18O each (Table 1). All events are short-lived and dissipate from the subtropical North Atlantic in a few hundred years. The latter two events coincide with the radiocarbon age estimates for two distinct central North Atlantic ice rafted debris (IRD) peaks (Fig. 3c), which have been interpreted as two episodes of enhanced iceberg calving from the Laurentide Ice Sheet related to Heinrich Event 1 (Hodell et al., 2017). Such a twin-peak structure has also been achieved with simulations considering dynamic meltwater re-routing, which produces a second wave of enhanced Laurentide iceberg calving around 1000 years after the first episode (Ziemen et al., 2019). In addition, all events feature an abrupt onset of the negative δ18O anomaly but a gradual dissipation of the anomaly, which is consistent with a binge-purge mechanism suggested for Heinrich events (MacAyeal, 1993). Alternatively, the timing of the later 15.3 ka BP freshening pulse is within age uncertainty of the most likely timing for Cordillerean-Laurentide (CIS-LIS) ice saddle collapse ( ka; Norris et al., 2022).
At the onset of the Bølling-Allerød (BA), in our record centered at ka (Table 1), the subpolar North Atlantic δ18O relaxes back quickly to values characterizing the plateau following the freshening at 17.8 ka BP. This decline is analagous to the end of HS2 (23.4kS), where in both instances the AMOC likely re-strenghtened, promoting the accelerated removal of the surface ocean anomalies as predicted by our model (Fig. 1e). The remainder of the Glas record (until 12.5 ka) exhibits higher variability in δ18O, with numerous high amplitude, short lived freshening pulses. While some of the variability might also be caused by the decrease in growth rate at that point, we propose that the continued ice sheet shrinkage (Fig. 3a) causes a greater vulnerability to climate change, creating more reactive ice sheets, and that together with a stronger AMOC (compared to the earlier deglaciation) explains the observed higher variability in δ18O. Surprisingly, the rapid and large (14–18 m) sea-level rise termed Meltwater Pulse 1A (MWP-1A), thought to have occurred around the start of the BA at approximately 14.6 ka (Deschamps et al., 2012; Gregoire et al., 2016), appears only as a minor freshening anomaly in our record. Potentially, Northern Hemisphere ice-sheet melt during MWP-1A was lower than previously suggested, with the total sea-level rise instead explained by a larger contribution from the West Antarctic Ice Sheet (Coonin et al., 2025). Further, consistent with our modeling (Fig. 1e), a more vigorous AMOC may have efficiently downwelled surface freshwater anomalies, such that even strong Northern Hemisphere freshening would lead to only short-lived and more muted surface ocean anomalies in the North Atlantic.
3.4 Iberian temperatures and relationship to freshening
3.4.1 AMOC insensitive to gradual freshening during the LGM
The new record from Glas provides a direct speleothem chronology for a relative regional temperature evolution in the North Atlantic region (Fig. 3f). The Glas record highlights the warmer temperatures of the early LGM, followed by a significant cooling 21.5–20.5 ka BP to values sustained through the late LGM. This cooling is likely a global cooling, as it follows closely the timing of the LGM sea level lowstand (Yokoyama et al., 2018). During the two periods of very gradual freshening of the early and late LGM intervals, the stable temperatures indicated by suggests that AMOC is too stable and/or the MW forcing is too gradual and insufficient to disrupt convection at this time.
3.4.2 Delayed AMOC response to HS1 freshening
The rather sustained temperatures over the late LGM in northern Iberia are followed by a rapid decline to coldest temperatures during the earliest part of HS1. Previous studies have interpreted the increased ratio in marine sediment cores as an indicator of weakened AMOC during HS1 (Fig. 3g), but distal changes in surface productivity and boundary scavenging are now hypothesized to drive a significant fraction of this signal (Missiaen et al., 2020; Scheen et al., 2025). Additionally, the composite record by Ng et al. (2018) integrates results from multiple sediment cores all with greater uncertainty on age models than the Glas chronology, so the rate and chronology of circulation and associated biogeochemical cycle changes cannot be precisely inferred from the composite proxy record. However, a substantial weakening of AMOC over HS1 remains plausible considering also the signals detected in other proxy systems (Shakun et al., 2012; Pöppelmeier et al., 2023). Further, during the early stages of the last deglaciation, temperature changes are typically not manifest in Greenland ice core (NGRIP) δ18O (Fig. 4a) because a decrease in winter rainfall changes the overall annual δ18O signature and cancels the temperature effect (He et al., 2021b). Critically, Glas suggest gradual cooling temperatures starting around 19 ka BP, however, compared to the described abrupt freshening 17.8kS (Table 1), the δ13Cinit indicates that regional surface air temperature initially remained stable, but significantly cooled only years later, around 17.0 ka BP (event 17.0kT, Table 1). Because both isotope records derive from the same powders, this reflects a genuine lag between the two series. As has been shown by model studies (Romé et al., 2022; Van Westen et al., 2024), the abrupt temperature change within the European realm and at NISA cave locations is a key characteristic of a transition into a weak AMOC state (see Fig. 1c). We, accordingly, interpret the Glas record such that, even though subtropical North Atlantic surface freshening peaked over the 17.8kS event (Table 1) and the circulation strength might have weakened in concert with the temperature decline after 19 ka BP, the most effective AMOC weakening did occur later, at ka BP (17.0kT, Table 1), where the coldest deglacial temperatures at our site were reached. In Glas our sampling technique prioritizes a tight chronological control by splitting power for dating and iostope proxies, but this may underestimate the magnitude of the cooling by smoothing across the layers covering the most extreme cold period.
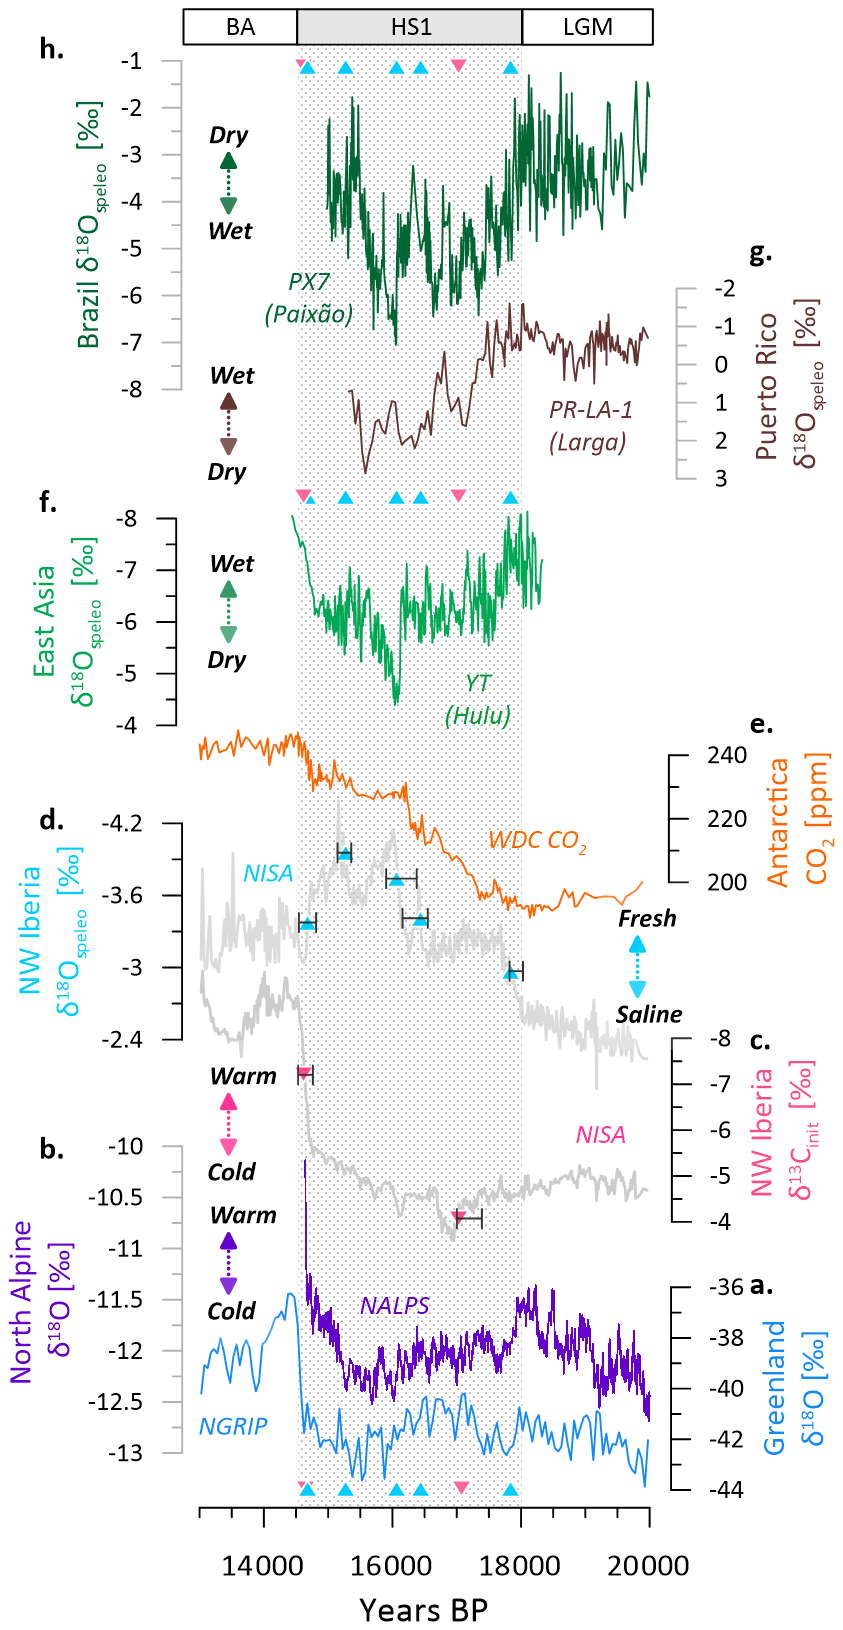
Figure 4Abrupt events over the last deglaciation recorded in Glas and their temporal relationship to published proxy data featuring highly resolved independent age control and a relationship to AMOC strength. Temperature evolution adjacent to the North Atlantic is shown by (a) the Greenland ice core on GCC05 timescale (North Greenland Ice Core Project members, 2004) and (b) the alpine speleothem record NALPS (Luetscher et al., 2015), and compared to Glas (c–d, this study). The transition midpoints, summarized in Table 1 are displayed throughout the entire figure as upward and downward facing triangles indicating abrupt changes in δ18O and , respectively. Glas is further compared to (e) CO2 from West Antarctica ice core (Marcott et al., 2014) and, (f), Chinese Speleothem record YT from Hulu Cave recording changes in the East Asian Summer Monsoon (EASM) (Zhang et al., 2014). The concurrent shifts in South American Summer Monsoon and drying over Puerto Rico are shown through the Brazilian speleothem record PX-7 (Stríkis et al., 2015) and Larga cave record PR-LA-1 (Warken et al., 2020). The errorbars of the transition midpoints indicate the 95 % CI.
In many cases the weakening of AMOC scales directly and almost immediately with freshwater forcing (Snoll et al., 2024), however, this is not necessarily true if the forcing is not strong enough, not well located, or the background state of the ocean is not (yet) sensitive enough (Van Westen et al., 2024; Romé et al., 2025). We propose that the delayed cooling after the first abrupt freshwater input (17.8kS, Table 1) reflects the need to build up a positive subsurface salinity anomaly or/and a required CO2 level to cross an AMOC threshold and trigger its weakening. The required delay is expected to depend on the meltwater forcing properties, internal ocean structure and ice sheet geometry (Kapsch et al., 2022; Romé et al., 2025). Additionally, already before the rapid decline, shows early signs of a prior slight weakening, which would be consistent with a mechanism involving the build-up of subsurface anomalies (Alvarez-Solas and Ramstein, 2011). The period of most extreme cooling was brief and recovered back to near late-LGM levels without any evident change in North Atlantic surface freshwater conditions. Alternatively or in addition, the weakening could have been triggered directly by additional local meltwater close to the convection centres, e.g. in the Norwegian Seas.
The sequence of the Glas record and its comparison to radiocarbon dated IRD events (Hodell et al., 2017) both suggest that cooling has preceeded the large discharge of icebergs into the North Atlantic associated with Heinrich Event 1 by a bit more than 800 years (events 16.1kS, 15.3kS; Table 1). A similar sequence of events with a lag between initial surface ocean cooling by planktic and peak IRD abundance was recorded within a single core on the Iberian Margin (Skinner and Shackleton, 2006) as well as in % NPS to IRD abundance in core ODP983 (Barker et al., 2015).
3.4.3 Temperature response to transient freshwater from 16.5 ka onward
Coinciding with the negative shift in δ18O at 16.1 ka BP (Table 1) is a very short-lived cooling, for which the precise duration and magnitude cannot be well constrained due to very slow growth rates. Notably, a similarly short-lived cooling also accompanied the largest freshwater pulse of the Penultimate Deglaciation (MWPTII-B around 134.25 ka BP, Stoll et al., 2022). Such brief episodes could link to the presence of faster, potentially atmospheric, pathways, reorganizing global circulation patterns (Markle et al., 2017; Fohlmeister et al., 2023), as well as the expression of a direct AMOC response due to more freshwater forcing (Snoll et al., 2024) or simply North Atlantic sea ice expansion in response to freshening. In sharp contrast, no temperature response is present for the subsequent freshening (15.3kS, Table 1), which we hypothesize indicates that this pulse was not able to alter AMOC strength any further.
3.4.4 Meltwater forcing and AMOC restrengthening in the Bølling-Allerød
The progressive decay of the MW anomaly in HS1d following the negative peak after event 15.3kS, suggests that the anomaly in the eastern North Atlantic was diminishing already before the the Bølling-Allerød (BA) warming, which is recorded in Glas δ13Cinit at ka BP (14.6kT, Table 1), a timing indistinguishable from that in NGRIP North Greenland Ice Core Project members, 2004), see Fig. 4. The abrupt BA warming coincided with a subsequent steep increase in Glas δ18O, which might be related to a decrease in freshwater input in the surface ocean North Atlantic but could also reflect a decrease in surface ocean accumulation due to the accelerated advection and downwelling due to AMOC strengthening as suggested by the NISA melt source contribution index (Fig. 1e) and as previously hypothesized in Sect. 3.3.3. While having less freshwater in the North Atlantic may have facilitated the resumption of AMOC at the BA onset, the Glas record suggests a surface freshwater anomaly comparable to the end of the prior freshening event 17.8kS, where there was no evidence of AMOC restrengthening. Thus, instead of changes in NH MW, the initial trigger for BA warming might be the crossing of a AMOC sensitivity threshold related to the evolving climate and ocean boundary conditions or located within the Southern Hemisphere cryosphere.
Within BA, the record indicates two warm phases separated by a cooling initiating around 14 ka BP, potentially consistent with the onset of the Older Dryas (e.g. as seen in NGRIP North Greenland Ice Core Project members, 2004), while the ice core resolves here more detail (Buizert et al., 2014). Here, the slowed growth rate makes the Glas record potentially more smoothed and the age model more uncertain – complicating precise chronological constraints for this cooling event, and we therefore discourage detailed comparison using the Glas record during this younger interval. We note that temperature broadly tracks changes in δ18O, consistent with AMOC strength responding to meltwater input as in most hosing simulations (Snoll et al., 2024), during the early BA (14.7–13.7 ka BP, approximately). In contrast, no clear temperature response is evident during the later BA (13.7–12.6 ka BP, approximately), suggesting a shift toward reduced sensitivity to meltwater inputs.
3.5 Comparison with impacts beyond the North Atlantic Realm
We evaluate the relationship of North Atlantic abrupt freshening and temperature change events to other aspects of the global climate system recorded in archives posessing an absolute layer counted ice core or speleothem U−Th chronology (Fig. 4). Because the expected ocean circulation changes during HS1 complicate assumptions about ocean reservoir ages and thus limiting the accuracy of radiocarbon chronologies in sediment cores (Skinner et al., 2014), we do not include marine archives in the comparison presented here. The following analysis concentrates on the abrupt transitions that have been described previously in the manuscript (Table 1).
3.5.1 Propagation of the signal to North Atlantic–adjacent archives
In other published Iberian speleothems covering the same time, namely OST2 (Bernal-Wormull et al., 2021) and MAAT (Pérez-Mejías et al., 2021), due to the respective cave systems, the δ18O signal is likely to be affected not only by the meltwater signal (as recorded in Glas) but also additional influence from changes in temperature and moisture availability (extended discussion and records shown in Appendix A5).
Over the Northern Hemisphere, specifically over Europe and Greenland, cooler temperatures can be expected with a weakening of AMOC. The onset of such a cooling, described as a shift in storm track and local rainfall patterns, has been detected in the NALPS record (Luetscher et al., 2015). NALPS (Fig. 4b), in many instances, follows the structure of the Greenland ice core NGRIP (Fig. 4a), as has been shown by Luetscher et al. (2015) and Li et al. (2021). However, here we would like to emphasize that the onset of HS1, around 18 ka BP, is more pronounced in the NALPS record than in NGRIP and we suggest two factors contributing. Firstly, as previously noted, winter rainfall is expected to decrease with a AMOC weakening over Greenland, which is a process that is likely mitigating the impact of temperature change on the δ18O recorded in the Greenland ice core (He et al., 2021b). Secondly, the sudden shift recorded in NALPS is a shift towards more negative δ18O, which, in the context of this work and modeling evidence presented by Zhu et al. (2017), could also be amplified through a change in moisture source isotopic composition, caused by the addition of meltwater to the North Atlantic surface ocean. Further, in NGRIP, the start of GS-2.1a has been placed at 17.43±0.33 ka BP, which is in agreement with the pronounced cooling in Glas at ka BP (17.0kT) when respecting the associated age uncertainties. In all those records the onset of the BA is pronounced and with a timing indistinguishable from the one in Glas, emphasizing the synchronized structure of this transition further.
More evidence for a concurrent re-organization of the North Atlantic ocean and atmosphere circulation patterns over HS1 stems from Brazil speleothems (Fig. 4h), which record the southward shift of ITCZ precipitation during AMOC weakenings. Brazil speleothem PX-7 from Paixão cave suggests two episodes of intensification of the South American monsoon system from 18.1 to 16.66 ka BP, and from 16.11–14.69 ka BP (Stríkis et al., 2015). While broadly consistent with the Glas record, this first intensification is slightly earlier than the abrupt signal in Glas. We hypothesize, that this difference could also be related to feedbacks not only with the ocean but also the Northern Hemisphere ice sheet thickness altering global monsoon systems (see e.g. Fig. 3 in Gao et al., 2020), resulting in a shift in the recorded timing between PX-7 and Glas. A similar structure with two phases of drier conditions, similarly related to hydroclimate re-organization, has also been found in the Puerto Rico speleothem PR-LA-1 (Fig. 4g), with a reported onset at approximately 17.5 ka BP (Warken et al., 2020).
3.5.2 Monsoon and the Westerly Jet over Asia
Isotope-enabled models suggest that millennial scale positive anomalies in the δ18O in rainfall and speleothems from the East Asian summer monsoon domain (EASM) reflect reduced intensity of convection and rainfall over the Indian summer monsoon and southward-shifted westerly jet enhancing southern EASM rainfall and reducing northern EASM rainfall (He et al., 2021a). The EASM record from Hulu Cave (Fig. 4d) features a positive shift in δ18O from 17.8–17.5 ka suggesting a southward shift of the westerly jet concurrent or slightly lagging the first abrupt North Atlantic freshening found in Glas (17.8kS). Thus, the shift in the westerly jet may have preceeded the subsequent abrupt cooling in Glas (17.0kT), which is a further indicator that beside the ocean feedbacks with the cryosphere, namely changes in SBKIS and the separation of SIS and BIIS (Hughes et al., 2016), might have been affecting the atmospheric circulation and even facilitate the extreme cooling and AMOC weakening around 17.0 ka BP. Alternatively, already earlier slight weakening of AMOC, as suggested by the gradual cooling in Glas from 19 ka BP onwards, might have been sufficient in order to alter the EASM rainfall patterns.
Centered around 16.1 ka BP, the freshening signal and cooling recorded in Glas is concurrent with the abrupt positive δ18O shift indicating a rapid southward shift of the Westerly jet in phase with the North Atlantic freshening in that interval. The recovery of the jet position is coincident with the relaxation of the freshwater anomaly. The freshening recorded at 15.3 ka BP, in contrast, has no corresponding changepoint in the EASM record, similar to the previously discussed Iberian record OST2. This may reflect that it was another pulse of freshwater into an already weak AMOC, which triggered no further cooling. Such an interpretation also strengthens our prior hypothesis based on the NISA melt source contribution index that the surface freshening anomaly originates from a source that makes it well visible in Glas, but less effective in further disrupting AMOC, such as meltwater from the Gulf of Mexico (Fig. 1e), consistent with the most likely timing of CIS-LIS breakup (Norris et al., 2022). In addition, any further effect of freshwater on the Westerly Jet may have been compensated for by the atmospheric effects of changes in LIS height (Ullman et al., 2014). At the onset of the BA event, the rapid northward shift of the Westerly Jet is synchronous with the abrupt warming, confirming previous interpretations of a coherent global response to AMOC reinvigoration (Pöppelmeier et al., 2023). Overall, our findings imply that while millennial scale variations in the δ18O from speleothems in the EASM do share many features with the North Atlantic realm, it is not an exact copy of its ocean dynamics and caution is needed when tuning the centennial to millennial scale features of North Atlantic records directly to an EASM signal.
3.5.3 Links between AMOC and atmospheric CO2 rise
The onset of the first rapid deglacial atmospheric rise in CO2 at 18.1±0.2 ka BP (Fig. 4e) has been hypothesized to be “broadly coincident” with the reduction in AMOC strength (Marcott et al., 2014), but hitherto, this has been difficult to evaluate since the NGRIP ice core does not mark well the HS1 cooling. The results from Glas indicate that the first centuries of rapid CO2 rise, like the shift in the EASM, began with, or slightly after the freshening, and the rise might be conditioned by a gradual AMOC weakening following 19 ka BP but the timing is distinct from the abrupt cooling recorded in Glas at 17.0 ka BP. This sequence of events should be further studied in more non-bioturbated high resolution North Atlantic records, but we thus hypothesize here that the first centennial carbon cycle response could rather be linked to rapid atmospheric reorganization, e.g. related to changes in ice sheet or also to more southern influences (Trombini et al., 2025) and those predate the abrupt North Atlantic ocean re-organization at 17.0 ka BP. Thereafter, the millennial scale CO2 increase corresponds to the coldest period in NW Iberia, interpreted to reflect the weakest AMOC (Fig. 4c). Further, both the small precursor freshening at 16.4 ka BP and the larger event at 16.1 ka BP are visible as abrupt CO2 rise, with the latter confirming the global nature of the ongoing changes around 16.1 ka BP. Interestingly, there is a small CO2 excursion at the following freshening event 15.4kS, which might hint to concurrent processes occurring in Antarctica (e.g. see Li et al., 2023). In the aftermath of the synchronized rise with the onset of BA around 14.7 ka BP, it has been suggested that the plateau may reflect a balance between ocean CO2 emission and uptake of CO2 by regrowth of the terrestrial biosphere (Marcott et al., 2014), which may be consistent with continued reduction of the NH ice sheet area evidenced by persistent MW pulses. Alternatively, the CO2 content of waters ventilating in the Southern Ocean may be stabilizing through this later part of HS1 (Yu et al., 2022).
The new Northern Iberian stalagmite record from Glas resolves the timing of North Atlantic surface freshening anomalies from melting NH ice sheets during the last deglaciation (24–12 ka BP). After the LGM, a gradual freshening is followed by a series of transient freshening events with midpoints at , , , and ka BP. Many of these freshening pulses are present in river-routed time series of the GLAC-1D ice sheet model and meltwater-proxies from sediment cores, but the new Glas record provides a coherent, deglacial history with accurate U−Th dating. Additionally, our combined analysis with model output suggests that for the first abrupt freshening around 17.8 ka BP, stalagmite and proxy time series are most consistent with European ice sheet origin but more southerly meltwater routing for the earliest event than derived from river-routed GLAC-1D estimation. With the onset of Bølling-Allerød, in Glas recorded around 14.7 ka BP, the subpolar North Atlantic re-salinizies according to our data. The comparison with the modeled distribution data elucidates that this rapid decline of a negative surface ocean δ18O anomaly is likely linked to the concurrent AMOC re-strengthening at this point. Critically, the new speleothem record shows only a very minor North Atlantic freshening coincident with the classically cited onset of MWP 1a around 14.6 ka BP. We hypothesize based on our modeling that the minor signal could be caused by the very vigorous AMOC and rapid advection out of the surface, and/or that the melt event occured in multiple steps, involving also a more significant contribution from the southern hemispere.
Because this record also resolves regional temperature changes resulting from changes in AMOC strength, the record elucidates the evolution of AMOC sensitivity to local meltwater perturbations over the critical period of the last deglaciation. Slight gradual cooling, thus potentially early AMOC weakening, occurs after 19 ka BP. However, while some of the following transient freshening events, namely the one at 16.1 ka BP, trigger immediate albeit brief intensification of the cooling suggestive of direct rapid AMOC weakening, the initial abrupt freshening is de-coupled from the most abrupt cooling, with the latter emerging around ka BP, this is years later. In contrast, the freshening event around 15.3 ka BP does not trigger further cooling nor can it be seen in global archives, thus likely did not further affect the AMOC. These varied responses of AMOC to meltwater in our new record re-enforce the view that there is not an ubiquitous response of AMOC to freshening in the North Atlantic but it is instead background state dependent. Yet, the similar timing of early meltwater pulses and GLAC-1D suggests that model difficulties simulating AMOC weakenings with GLAC-1D freshwater forcing may reflect challenges in simulating evolving AMOC sensitivity to freshening rather than erroneous timing of the meltwater forcing. Taken together, these results suggest non-linear dynamics within the coupled ice-ocean-climate system which invite advanced transient AMOC sensitivity studies and need to be further evaluated with precise model-data comparisons.
A1 The Glas sample and its connection to the NISA speleothem archive
Stalagmite Glas originates from the cave “La Vallina” in Northwest Iberia, which is one of the key caves in the Northwest Iberian Speleothem Archive (NISA) (Stoll et al., 2022). Glas is a very compact and translucent sample (Fig. A1). Glas has been selected for this detailed study because of the absence of any signs for non-contiunuous growth and for featuring a homogenous trace element structure, also when diverging from the main growth axis. Other NISA speleothems were revisited in the scope of this study, namely Candela and Laura (Fig. A4). Laura confirms the presence of a double-peak freshening structure before Bølling-Allerød warming occurs (data from Stoll et al., 2022). A set of new dates on Candela using the procedure outlined in this study, confirms the presence of a shift around 18.04 ka BP, but has also indicated condensed/ceased growth from 17.8 to 15.6 ka BP (Table A1).
Table A1New Uranium and thorium isotopic compositions and 230Th ages for Glas (GLA) and Candela (CAN) samples analyzed by ICP-MS. U decay constants: (Jaffey et al., 1971) and (Cheng et al., 2013). Th decay constant: (Cheng et al., 2013). * . d234U initial was calculated based on 230Th age (T), i.e. . Corrected 230Th ages assume the initial atomic ratio of . Those are the values for a material at secular equilibrium, with the bulk earth value of 3.8. The errors are arbitrarily assumed to be 50 %. B.P. stands for “Before Present” where the “Present” is defined as the year 1950 A.D. The depth noted in the last column is the mid-depth of all isotope sample trenches combined for the U−Th dating.
A2 Simulated Temperature and Precipitation response to a change in simulated AMOC state
A number of studies have previously simulated the effect of changes in AMOC on global climate (e.g. Jackson et al., 2015; Van Westen et al., 2024) and the most dominant features such as cooling of the Northern Hemisphere and large-scale precipitation changes, such as a weakening of Asian summer monsoon, are robust across models and form the theoretical background to interpret global archives in the context of AMOC strength. In this study, a quasi-idealised simulation is re-employed from Romé et al. (2022) featuring a glacial climate state with an oscillating AMOC strength (period ca. 1500 years, see methods main manuscript), which is triggered by a constant meltwater (MW) flux of 0.084 Sv corresponding to the GLAC-1D ice sheet history at 17.8 ka BP. From the two strong states defined in Romé et al. (2022), here we selected the more stable zonal mode as the strong mode. When comparing periods of strong and a weak state, the simulation does show the expected global climatic patterns for a AMOC slowdown, with a temperature reduction of up to 10 K the North Atlantic realm in winter, a southward shift of the ITCZ and significant changes in winter rainfall patterns (Fig. A5).
A3 Meltwater time series from sediment cores
In main text Fig. 3, previously published MW time series are presented as simplified blocks for a better visual overview. For completeness, the underlying time series are presented here in Fig. A6. Note that the event classification in both, Toucanne et al. (2015) and Wickert et al. (2023) are taken from the original publication, respective the associated dataset (Wickert, 2023). For the Baffin Slope record (Rashid et al., 2012), melt events were set in this study based on the prominent negative δ18O shifts (shading in Fig. A6).
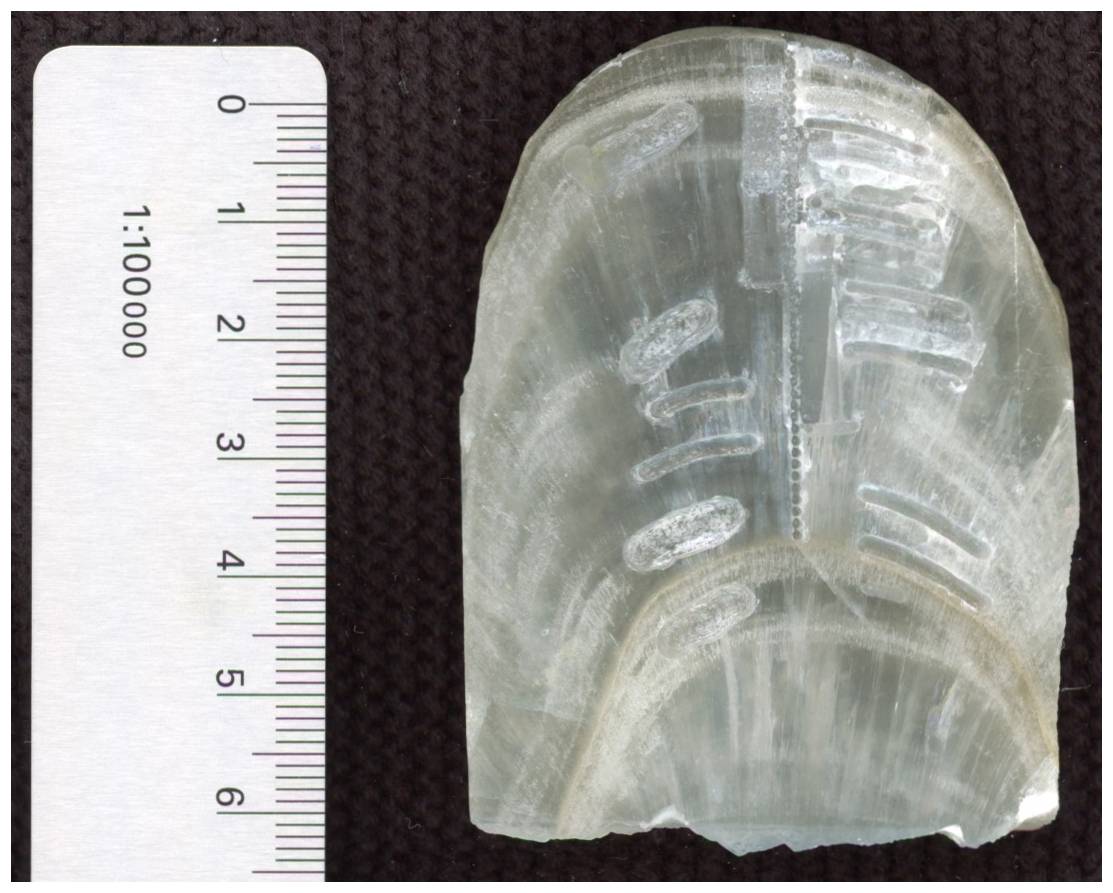
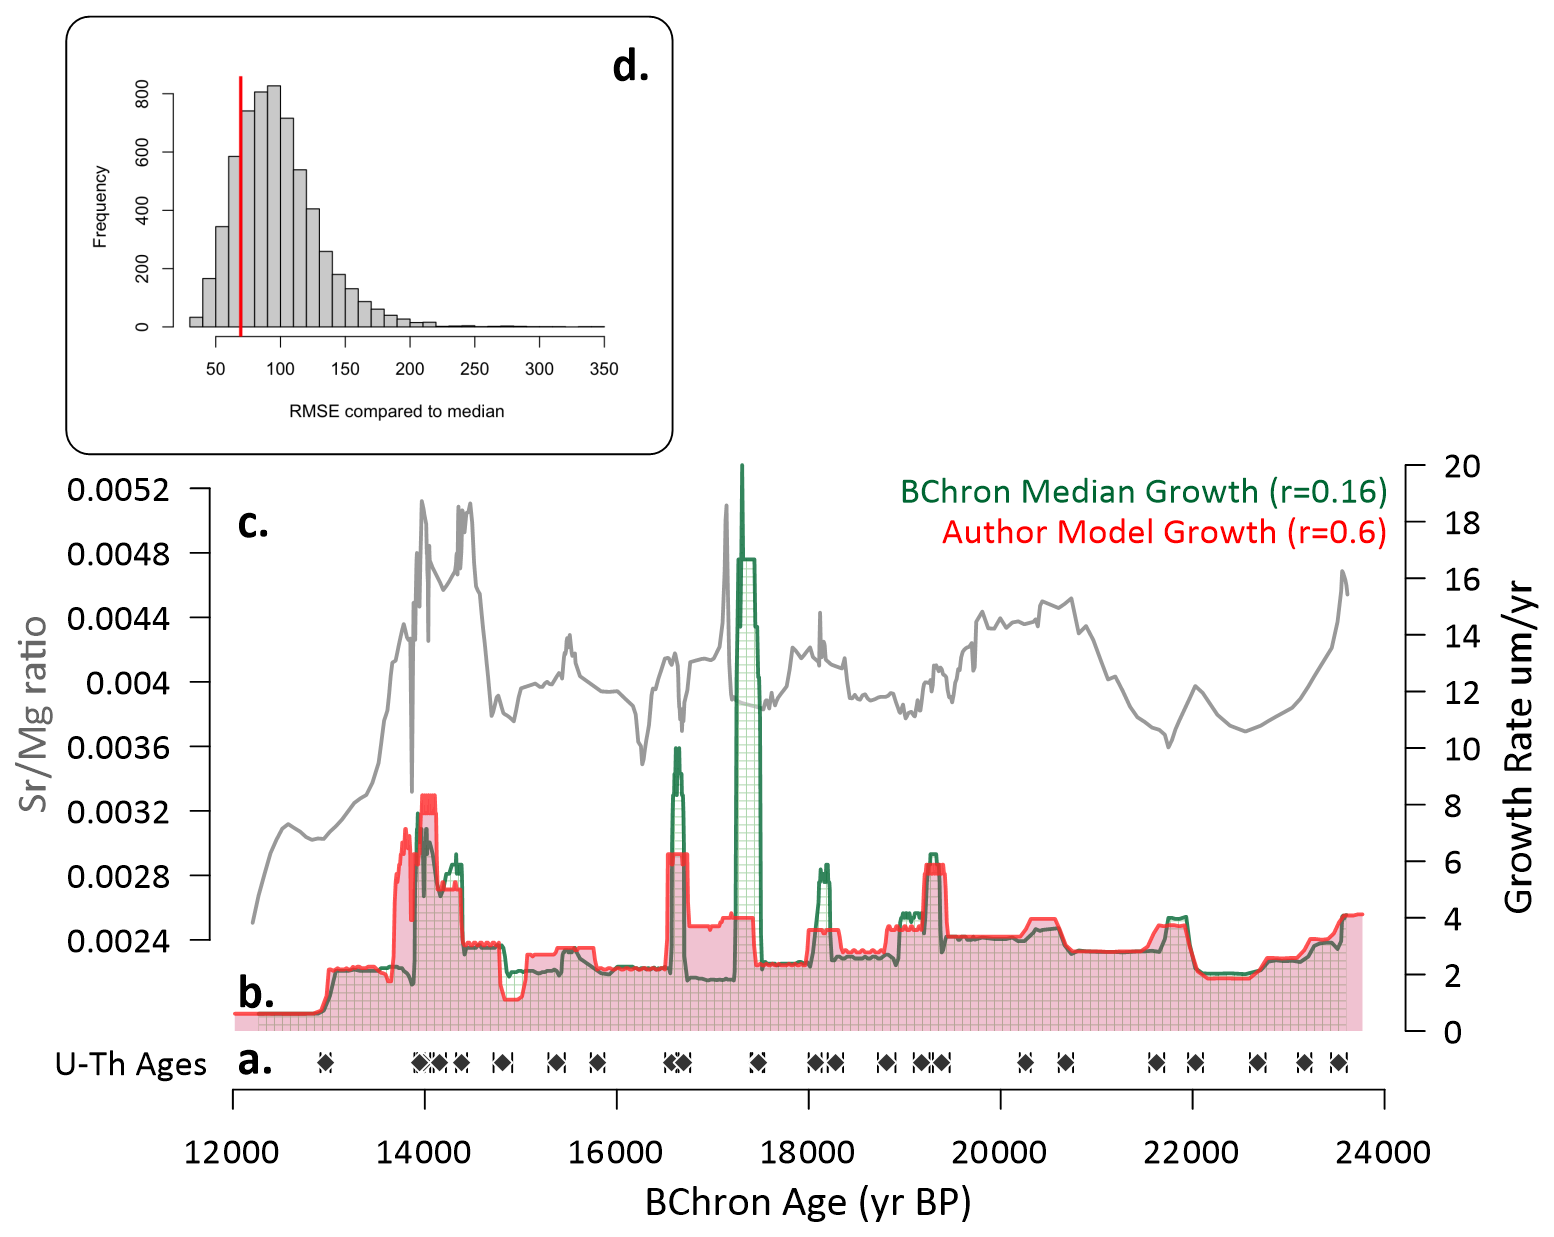
Figure A2Comparison of growth rates from the pointwise median BChron age model to the posterior realization selected as author age model. The age model has been calculated using 26 U−Th ages (a), and the respective growth rates have been computed using a centered differences. The goal was to improve the correlation with the ratio measured in Glas (c). Correlation coefficients were computed for the 6000 posteriors from the BChron age models and a realisation showing high correlation with ratio, as well as reasonable growth rates and a low RMSE, thus high similarity, compared to the median BChron (d).
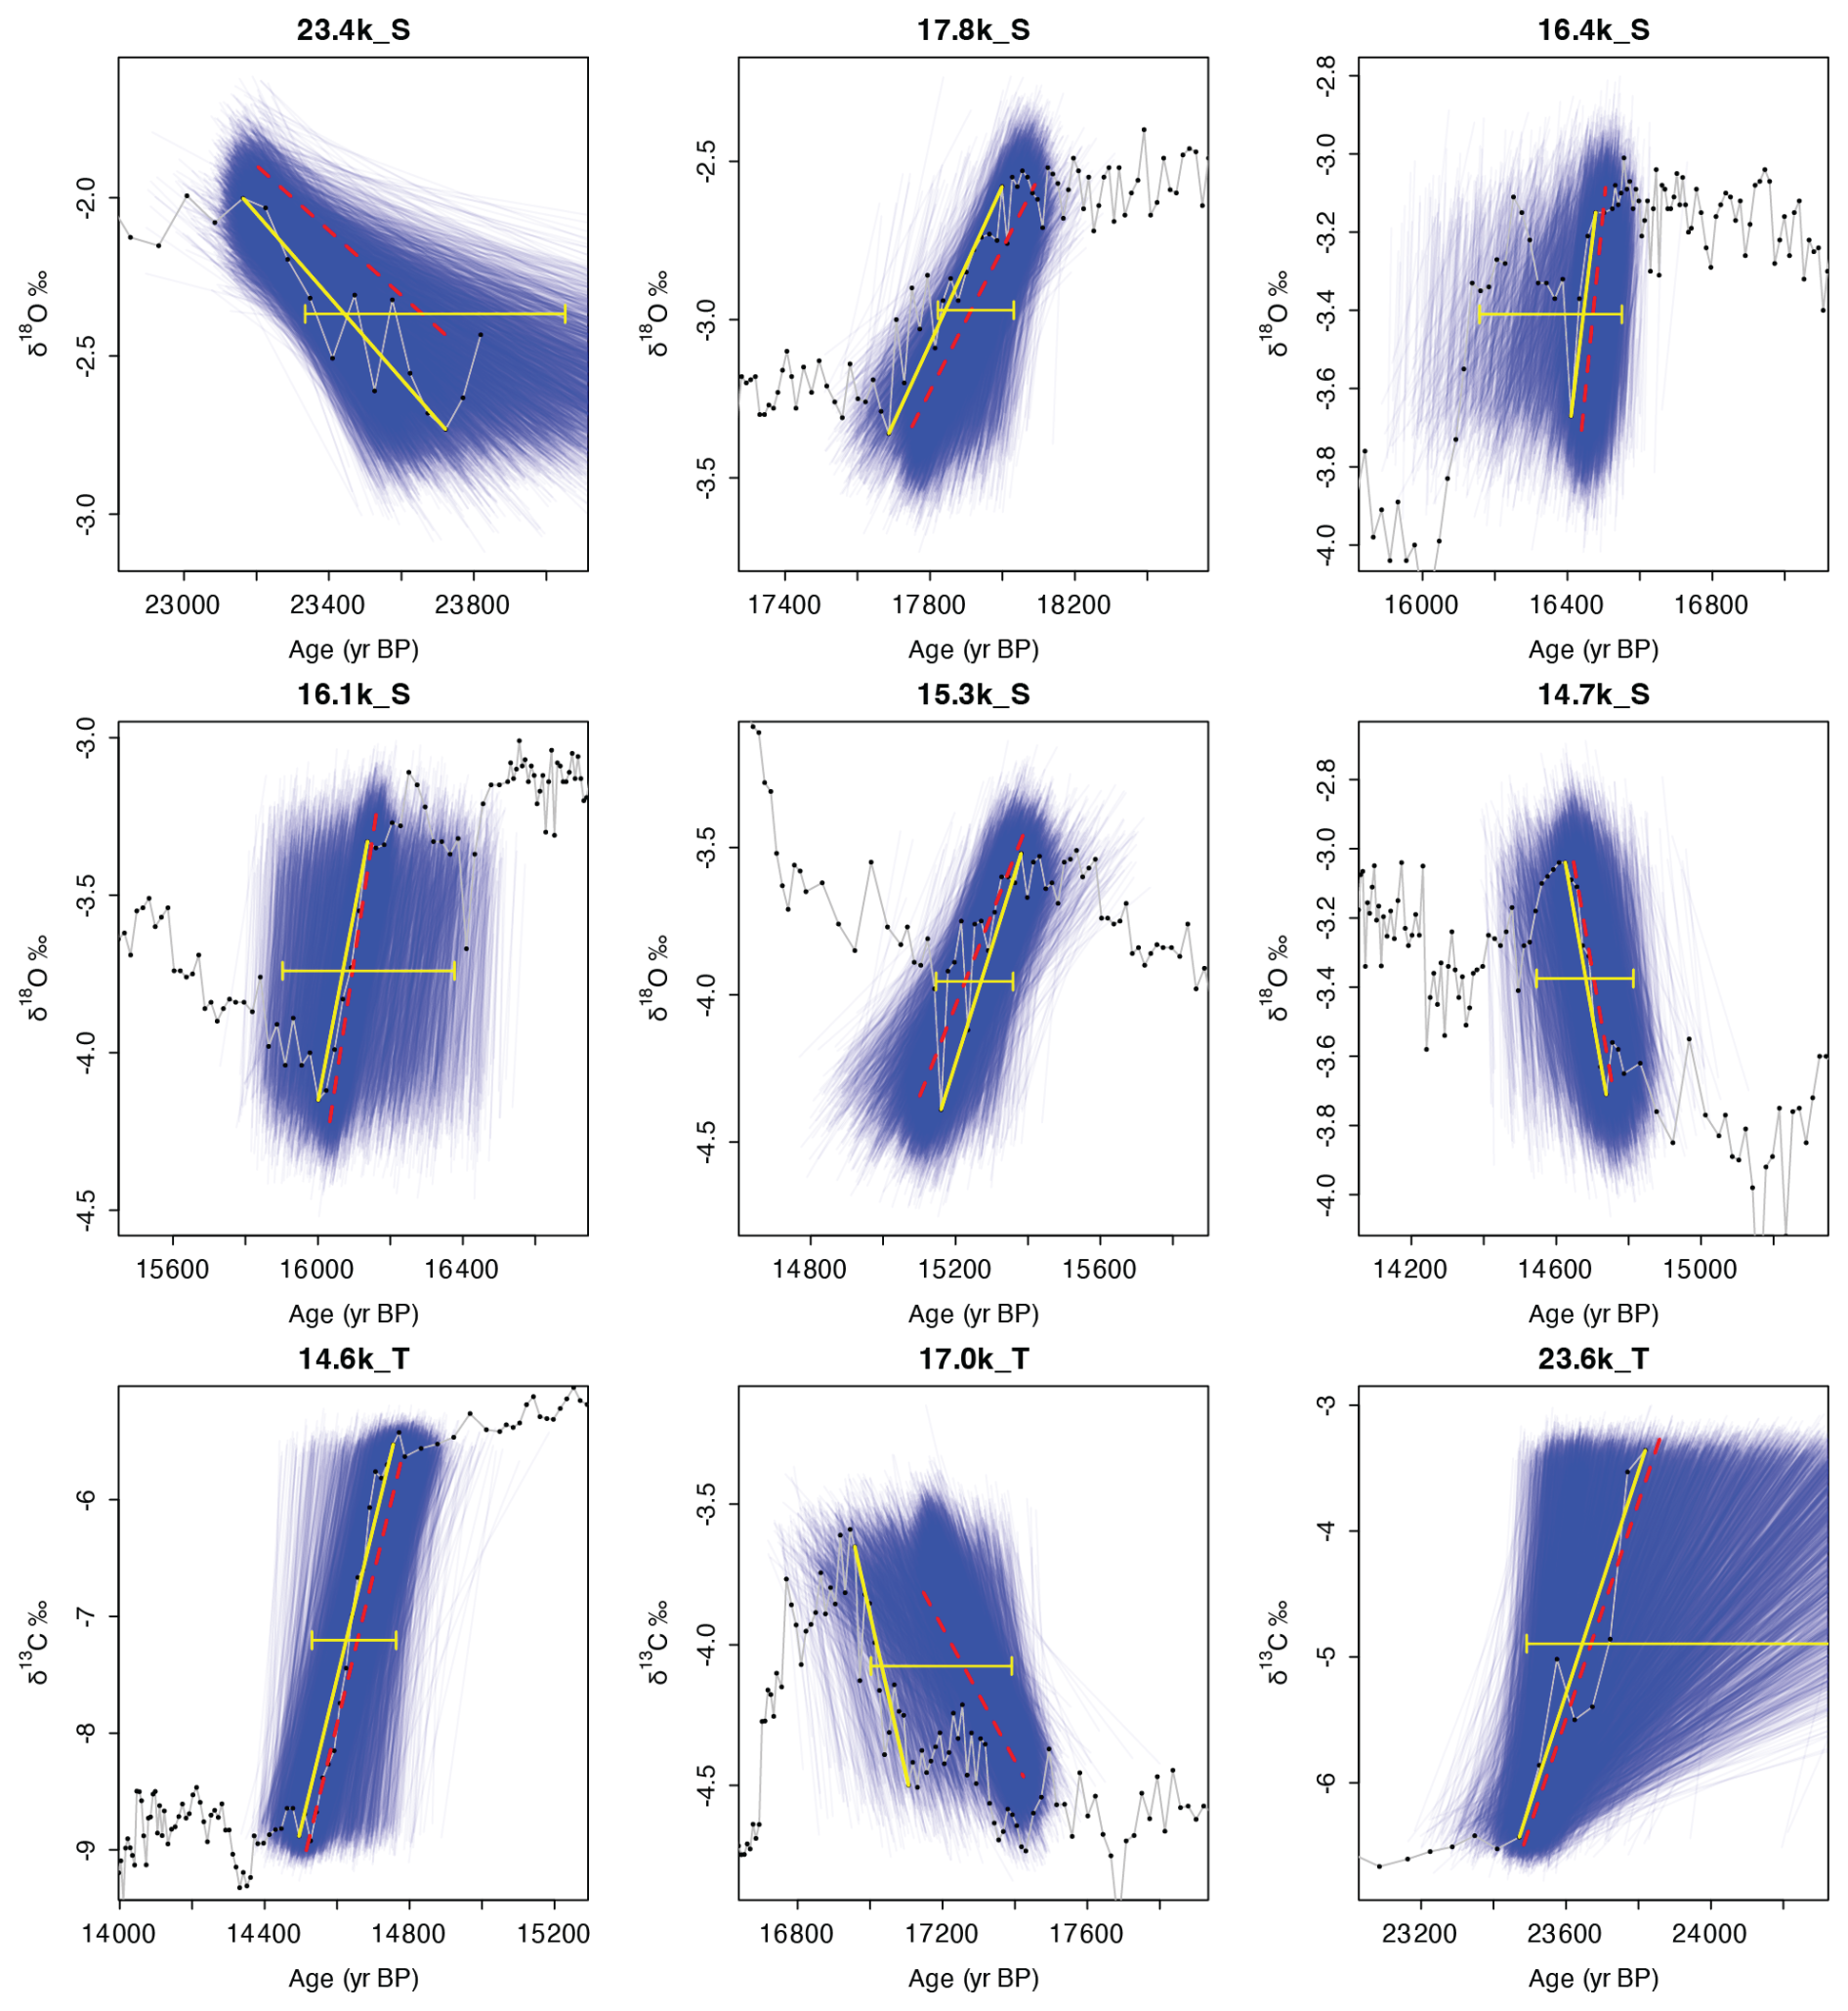
Figure A3Visualization of the transition mid point derivation from computation with the full BChron posterior age ensemble, data is summarized in Table 1. The subtitles for the individual panels are according to the nomenclature in Table 1. In each panel, blue lines connect the two age estimates at the relevant sample depths, while the yellow line is the estimate from the author age model and the red dashed line is the BChron median estimate. The horizontal errorbar denotes the 95 % Credible Interval (CI) of the full ensemble, representing the uncertainty reported throughout the manuscript. The isotope data plotted on the author age model is shown as a grey line.
A4 Extended comparison with ice sheet reconstruction GLAC-1D and the derived discharge time series
The GLAC-1D ice sheet model (Ivanovic et al., 2016) was used to derive river-routed regional MW time series for three key regions (Fig. A7a), which were introduced previously (Romé et al., 2022, see Appendix A2 and in methods main manuscript). The three regions are (1) the GIN Seas (pink shading in Fig. A7a), (2) Arctic Ocean (green shading), and (3) Labrador Sea+Gulf of Mexico (GoM) (purple shading). Comparison between the discharge time series derived from GLAC-1D, sediment cores and from the Glas record show significant differences in timing and location of expected discharge, as featured in Fig. 3 in the main text. These differences likely expose the still existing uncertainties in reconstructing the MW discharge.
For GLAC-1D, the estimated source ice sheet sector for MW pulses ending up in the three regions used in this study (Fig. A7a), is exposed by plotting ice sheet mass loss maps over short time snippets (Appendix A4, Fig. A7b and c). However, although this is informative, the timings have to be taken with caution since GLAC-1D is a model, not an ice sheet reconstruction. For example, the calculation of river-routed MW crucially depends on the ice sheet height and global distribution expected at LGM, which also remains challenging to constrain from data.
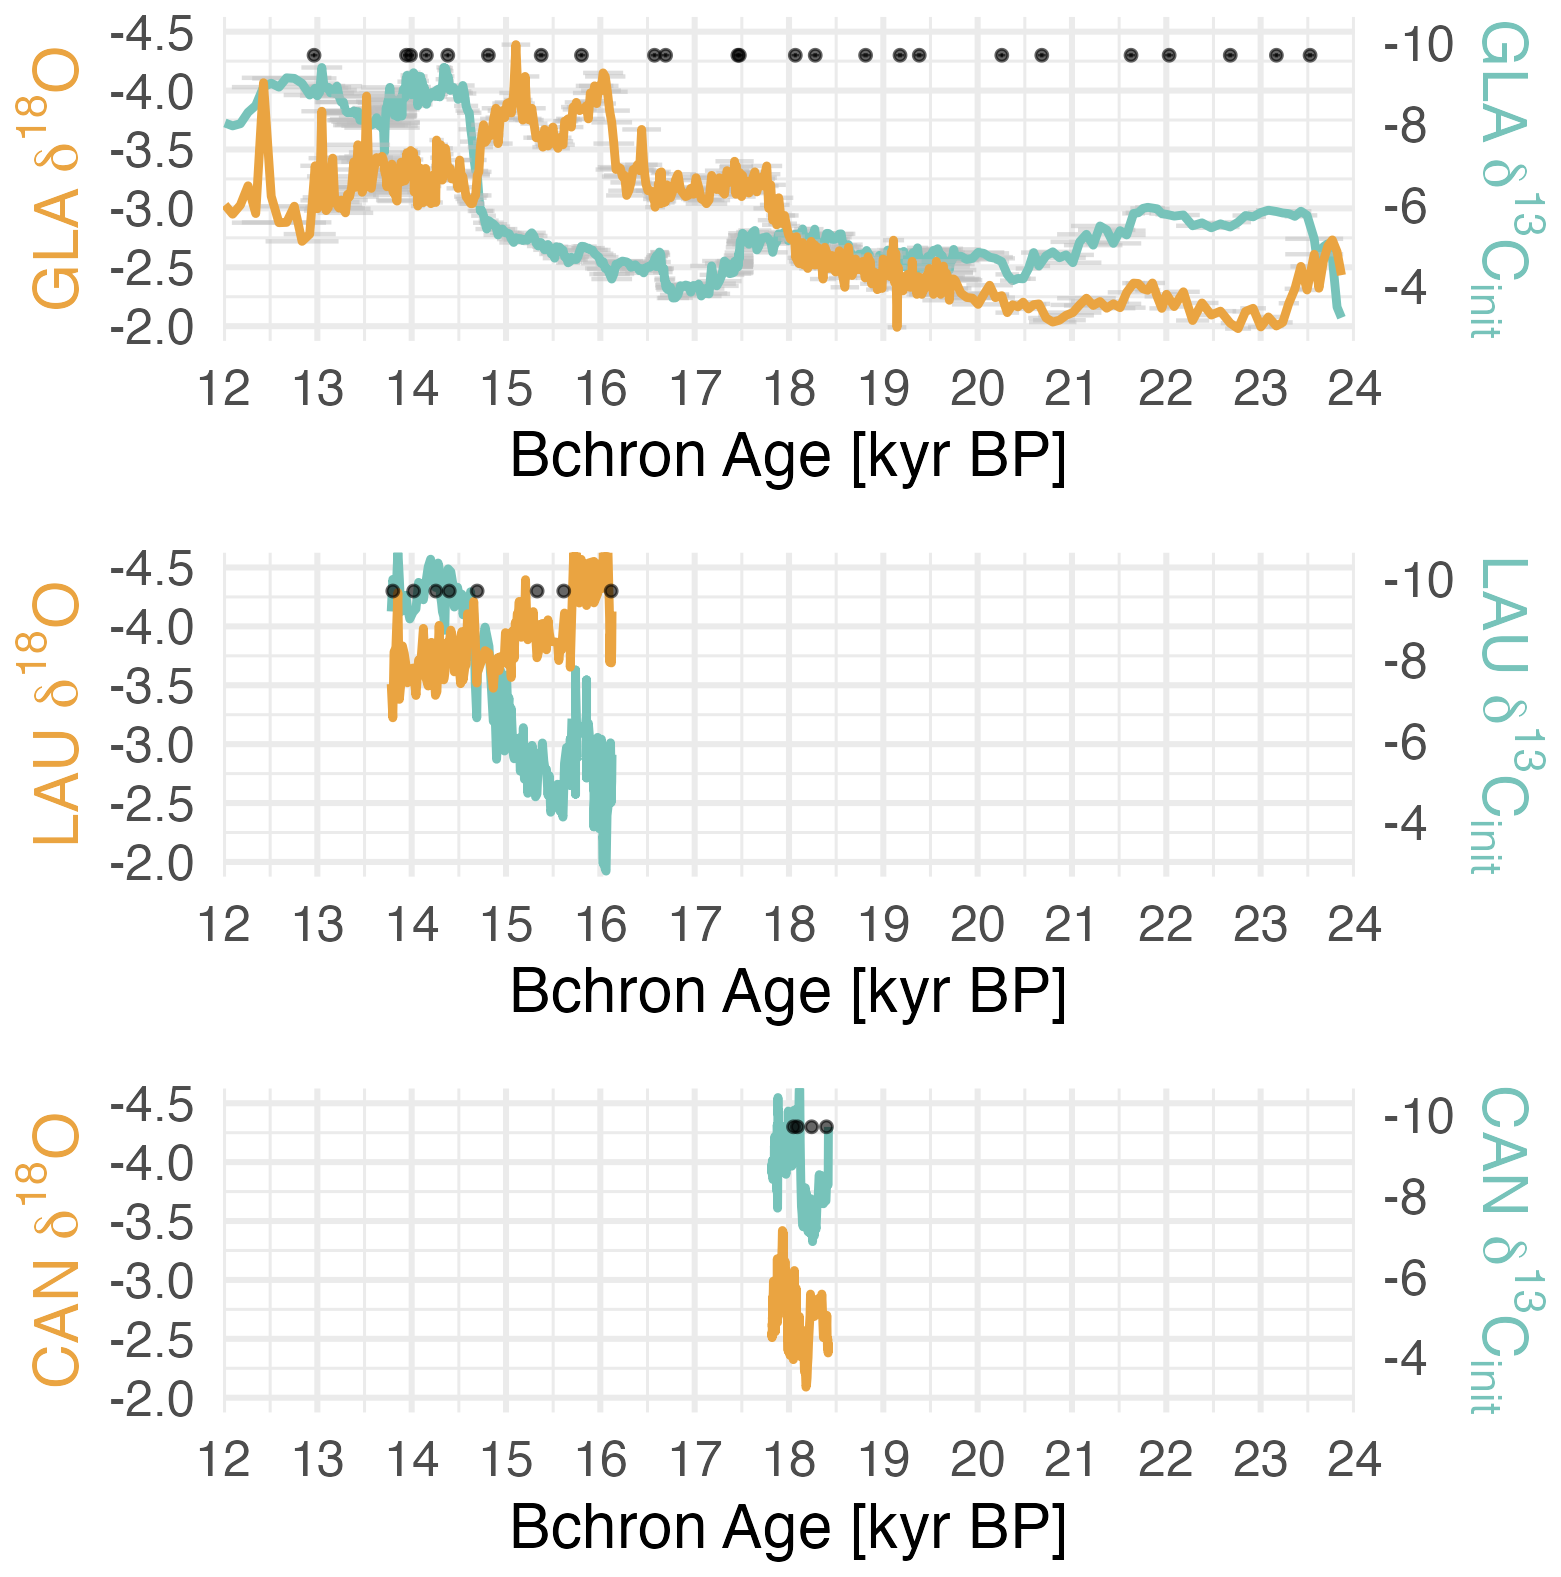
Figure A4Comparison with NISA stalagmites covering segments of the same period: Laura (LAU) and Candela (CAN). Ages of Laura have been previously published in Stoll et al. (2022), ages of Candela are ages on a new trench and are provided here in Table A1.
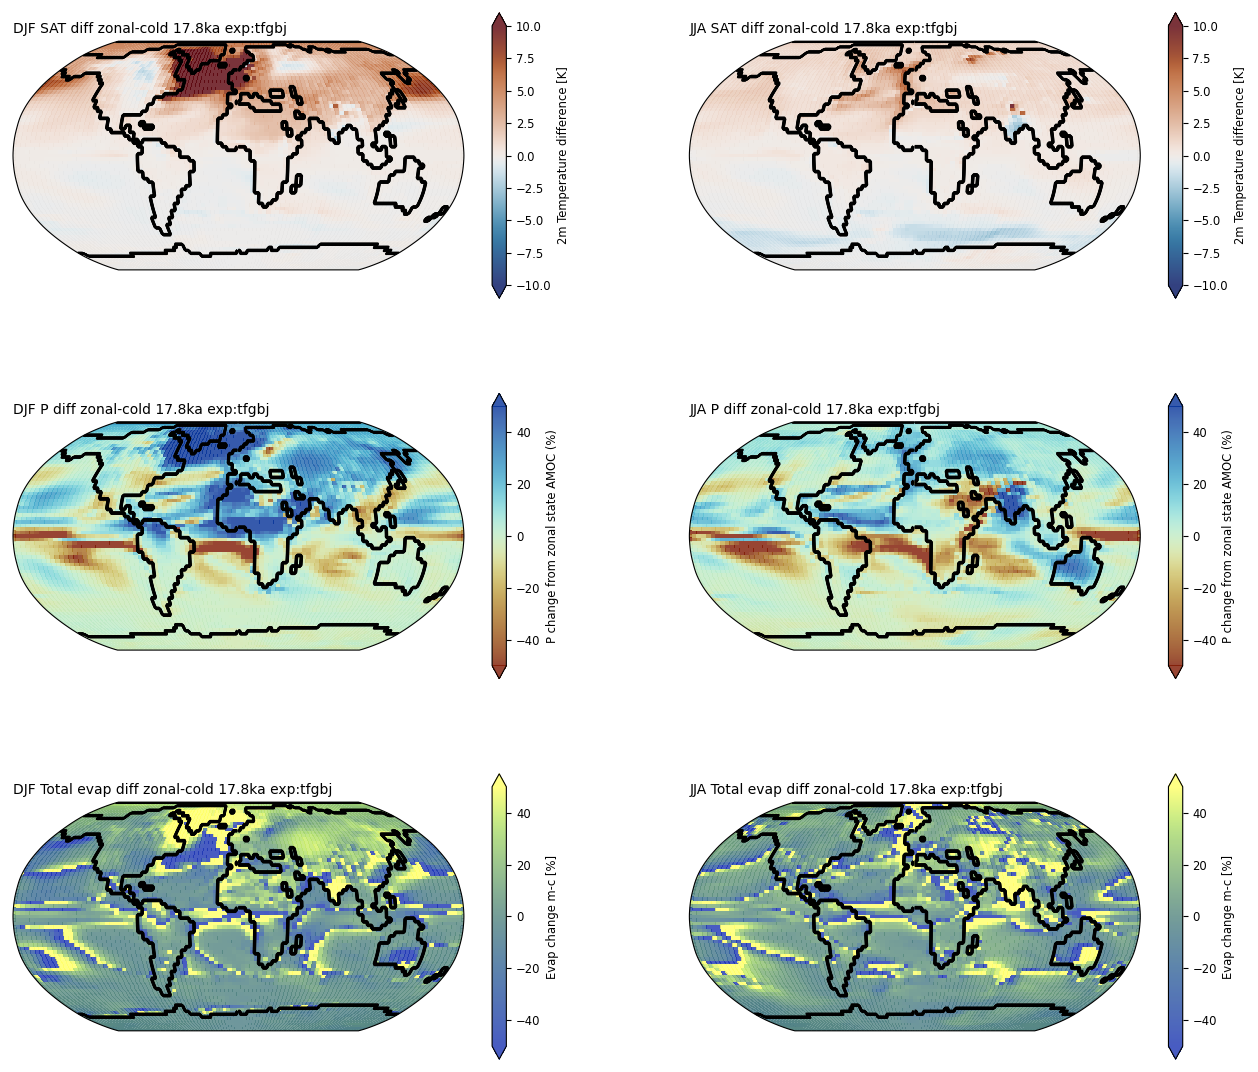
Figure A5Global maps of expected environmental changes due to AMOC weakening. Results from the simulation described in Romé et al. (2022), snapshot 17.8 ka. The toprow shows differences (strong-weak AMOC) in surface air temperature (SAT) on the left for winter (DJF) and on the right for summer (JJA). The middle row shows the same analysis for differences in Precipitation (P), and the bottom for total evaporation.
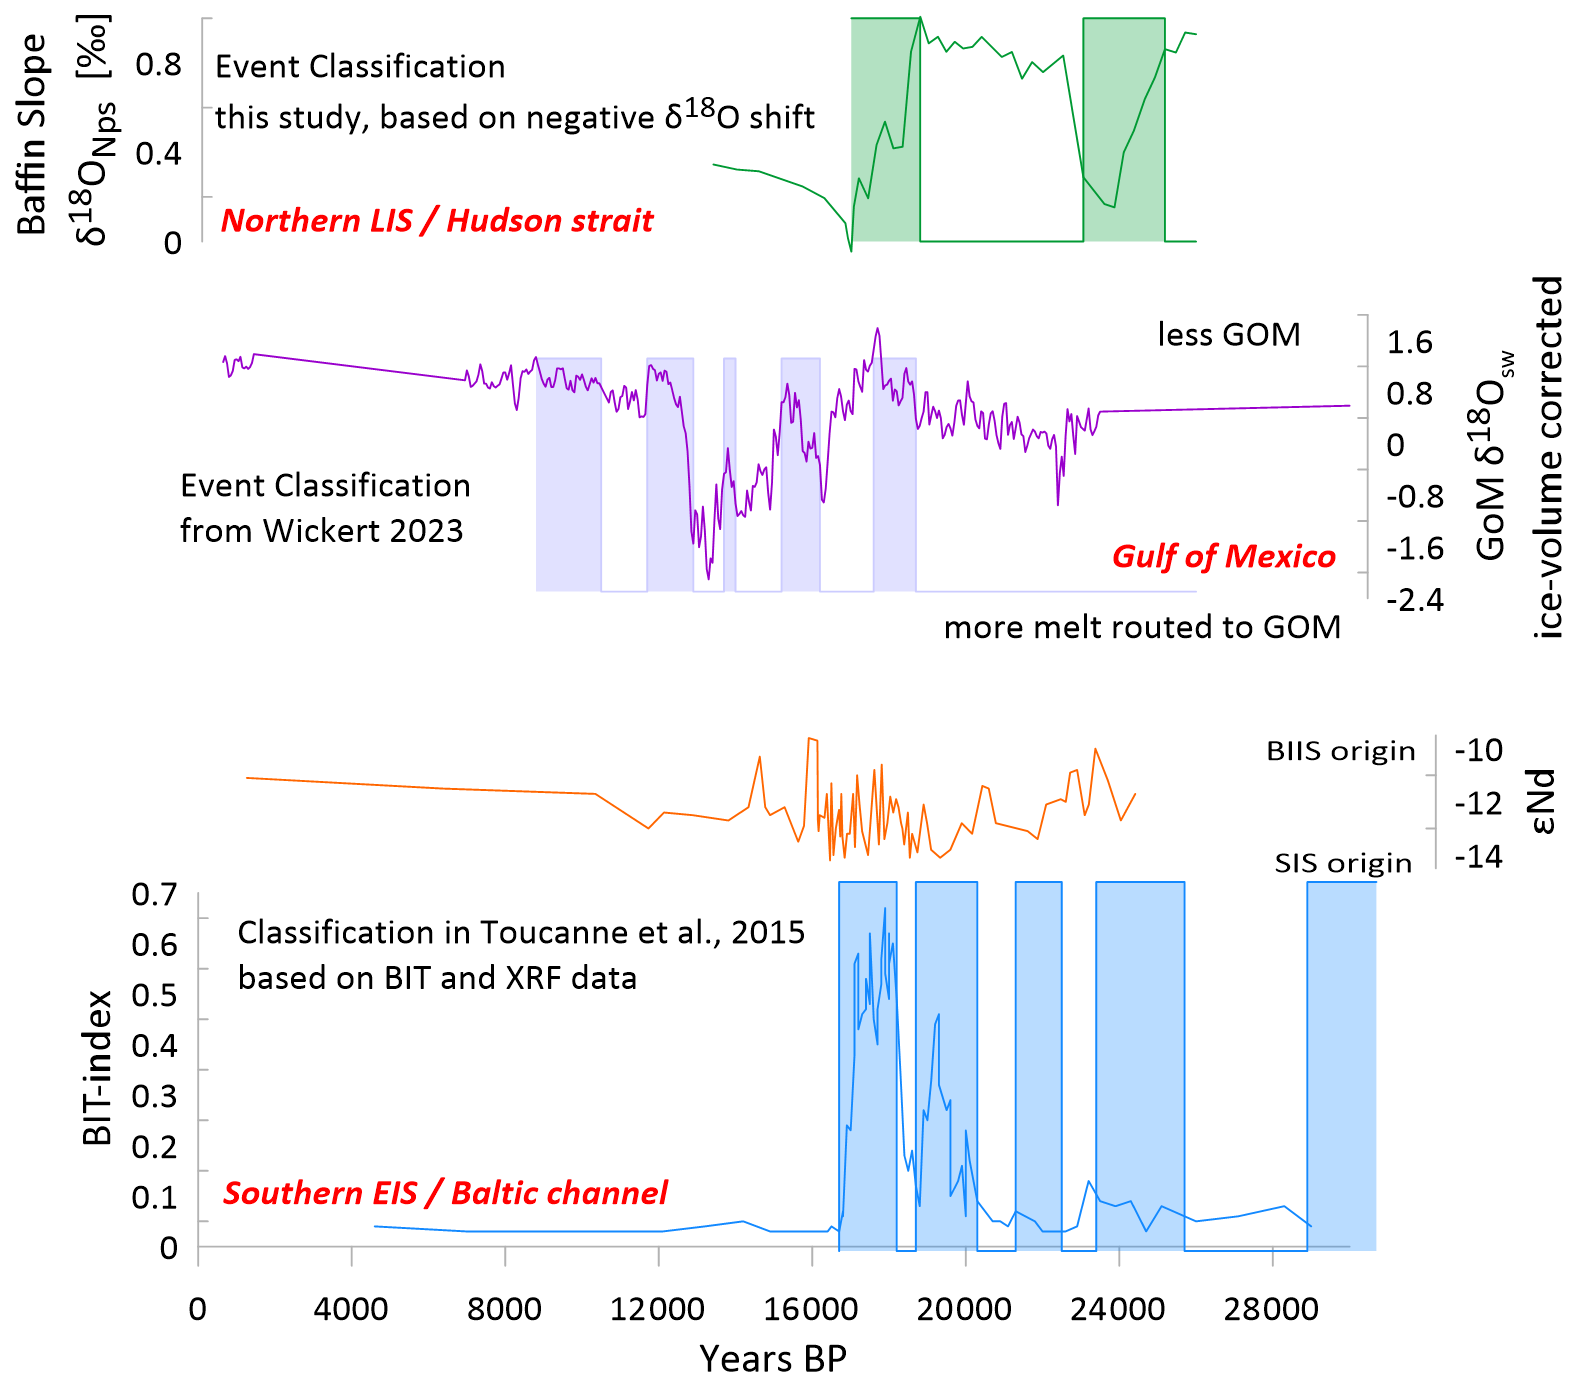
Figure A6Previously published meltwater discharge time series in sediment cores: Baffin slope δ18O (Rashid et al., 2012) (green), Gulf of Mexico (Wickert et al., 2023) (purple), and from the Bay of Biscay (Toucanne et al., 2015) (orange,blue). Shaded areas are the bulk events featured in the main manuscript Fig. 3c. Classification of the events is taken from the original publication for the Gulf of Mexico and the Bay of Biscay. For the Baffin slope record we have defined the events based on the large shifts in δ18O in the here plotted time series. All data is plotted on the age model of the original publication which may feature several ky of uncertainty.
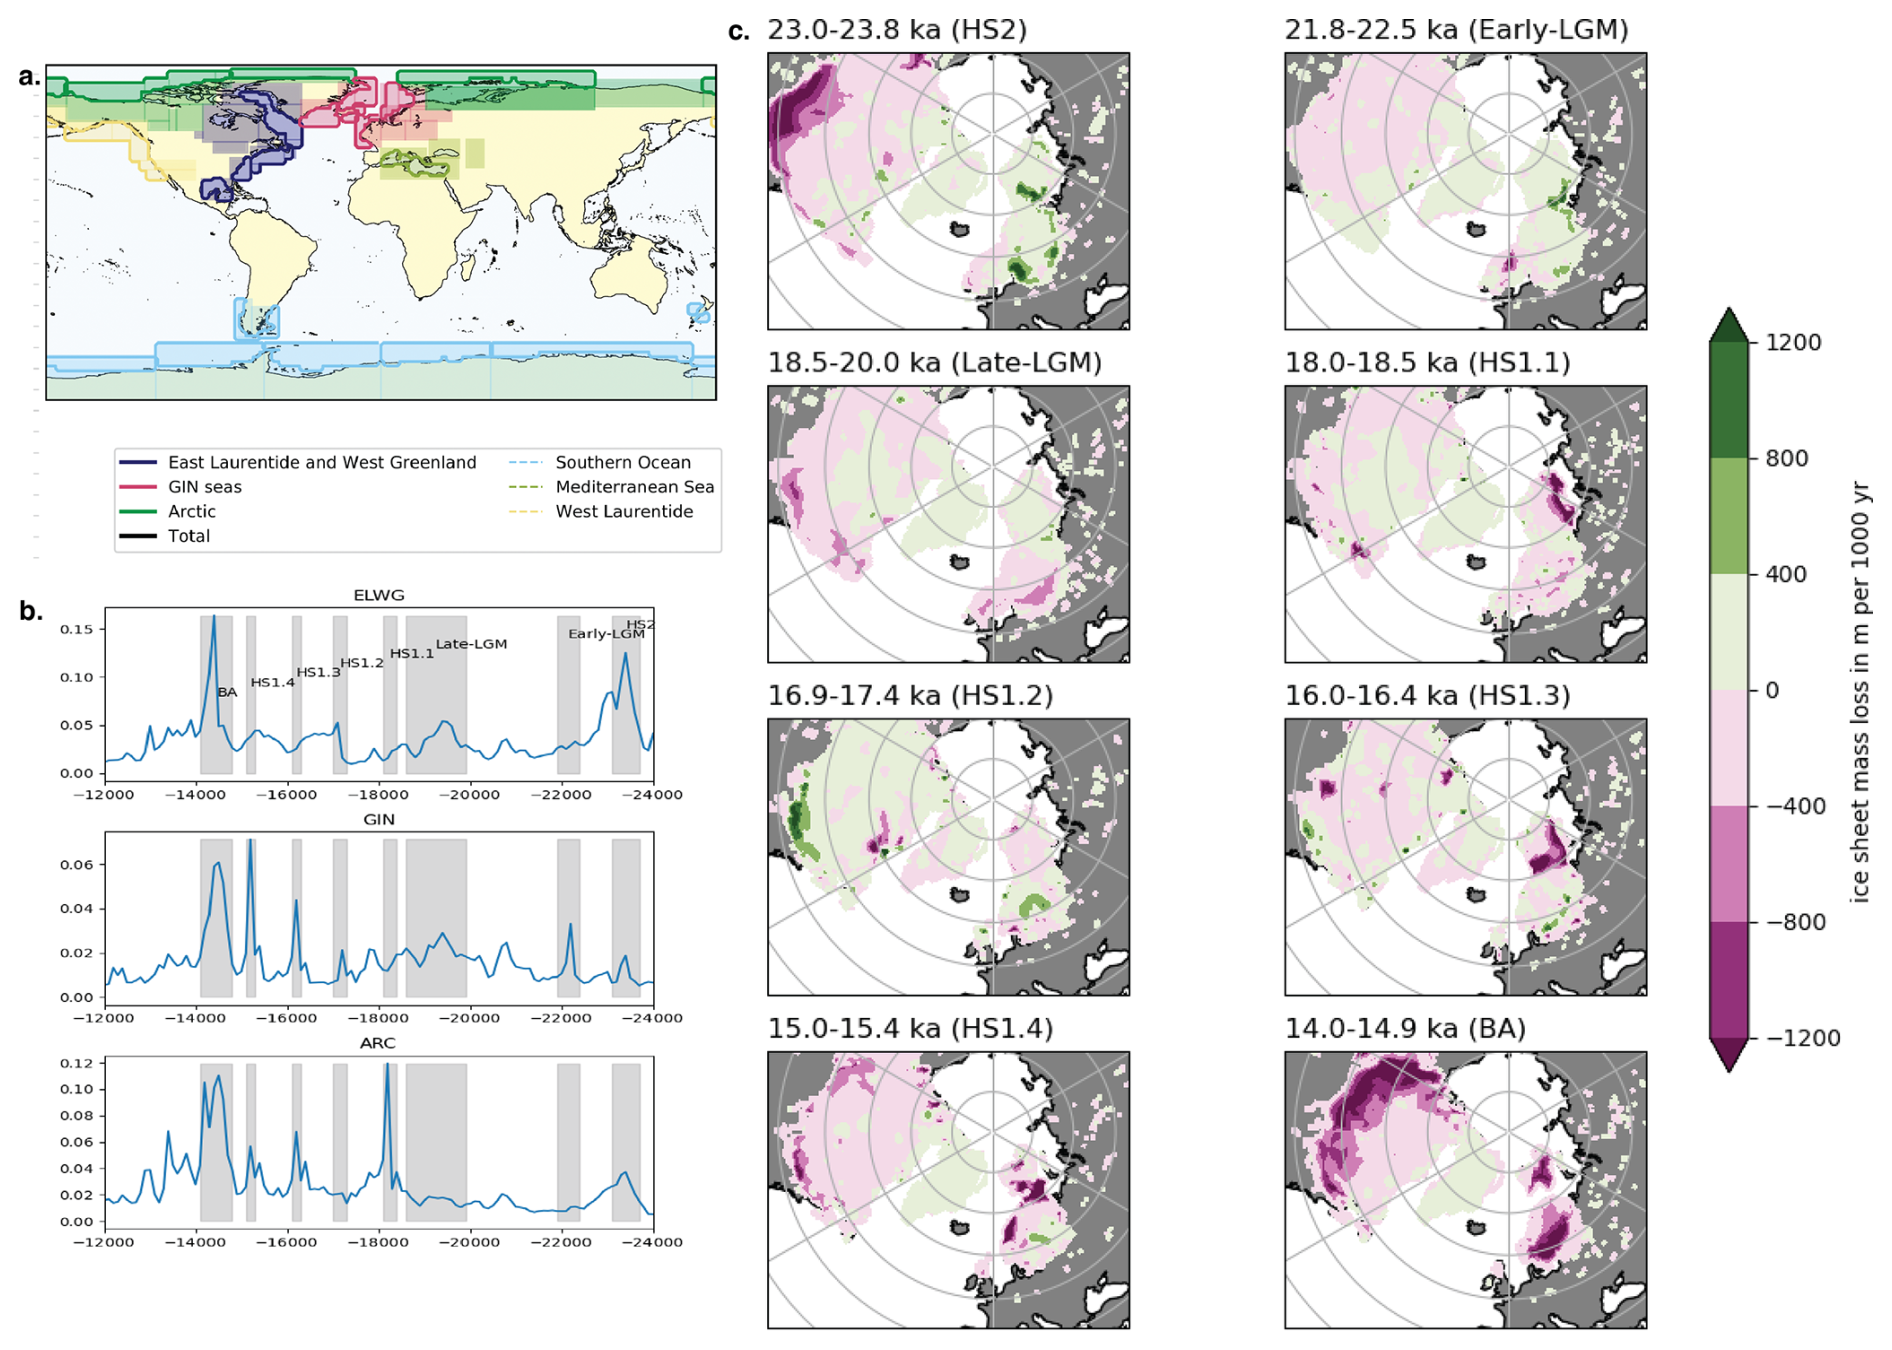
Figure A7GLAC-1D Ice sheet mass loss over selected time snapshots. (a) shows a global map including the three regions used in this study East Laurentide and West Greenland (ELWG), Arctic (ARC) and GIN seas, replotted from Romé et al. (2022). In this study, we renamed the ELWG after the drainage ocean bassins and called it Labrador+GoM. (b) Detail line plot of the three river-routed time series ELWG, ARC and GIN seas. The grey shadings indicate the time snippets defining name, and start/stop year for the maps in (c). (c) ice sheet mass loss maps over selected periods with significant peaks in the derived meltwater time series. The ice sheet mass loss has been converted into m per 1000 year for easier comparison between the panels.
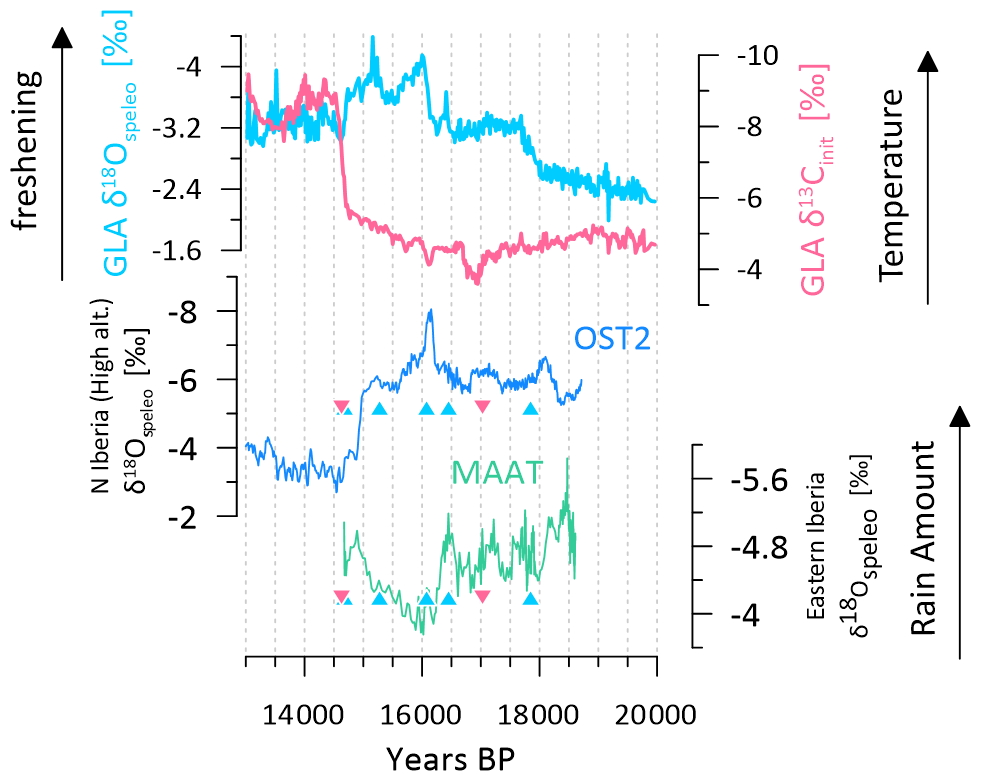
Figure A8Extended comparison with Iberian records. The record of Glas is compared to OST2 (Bernal-Wormull et al., 2021) and MAAT (Pérez-Mejías et al., 2021).
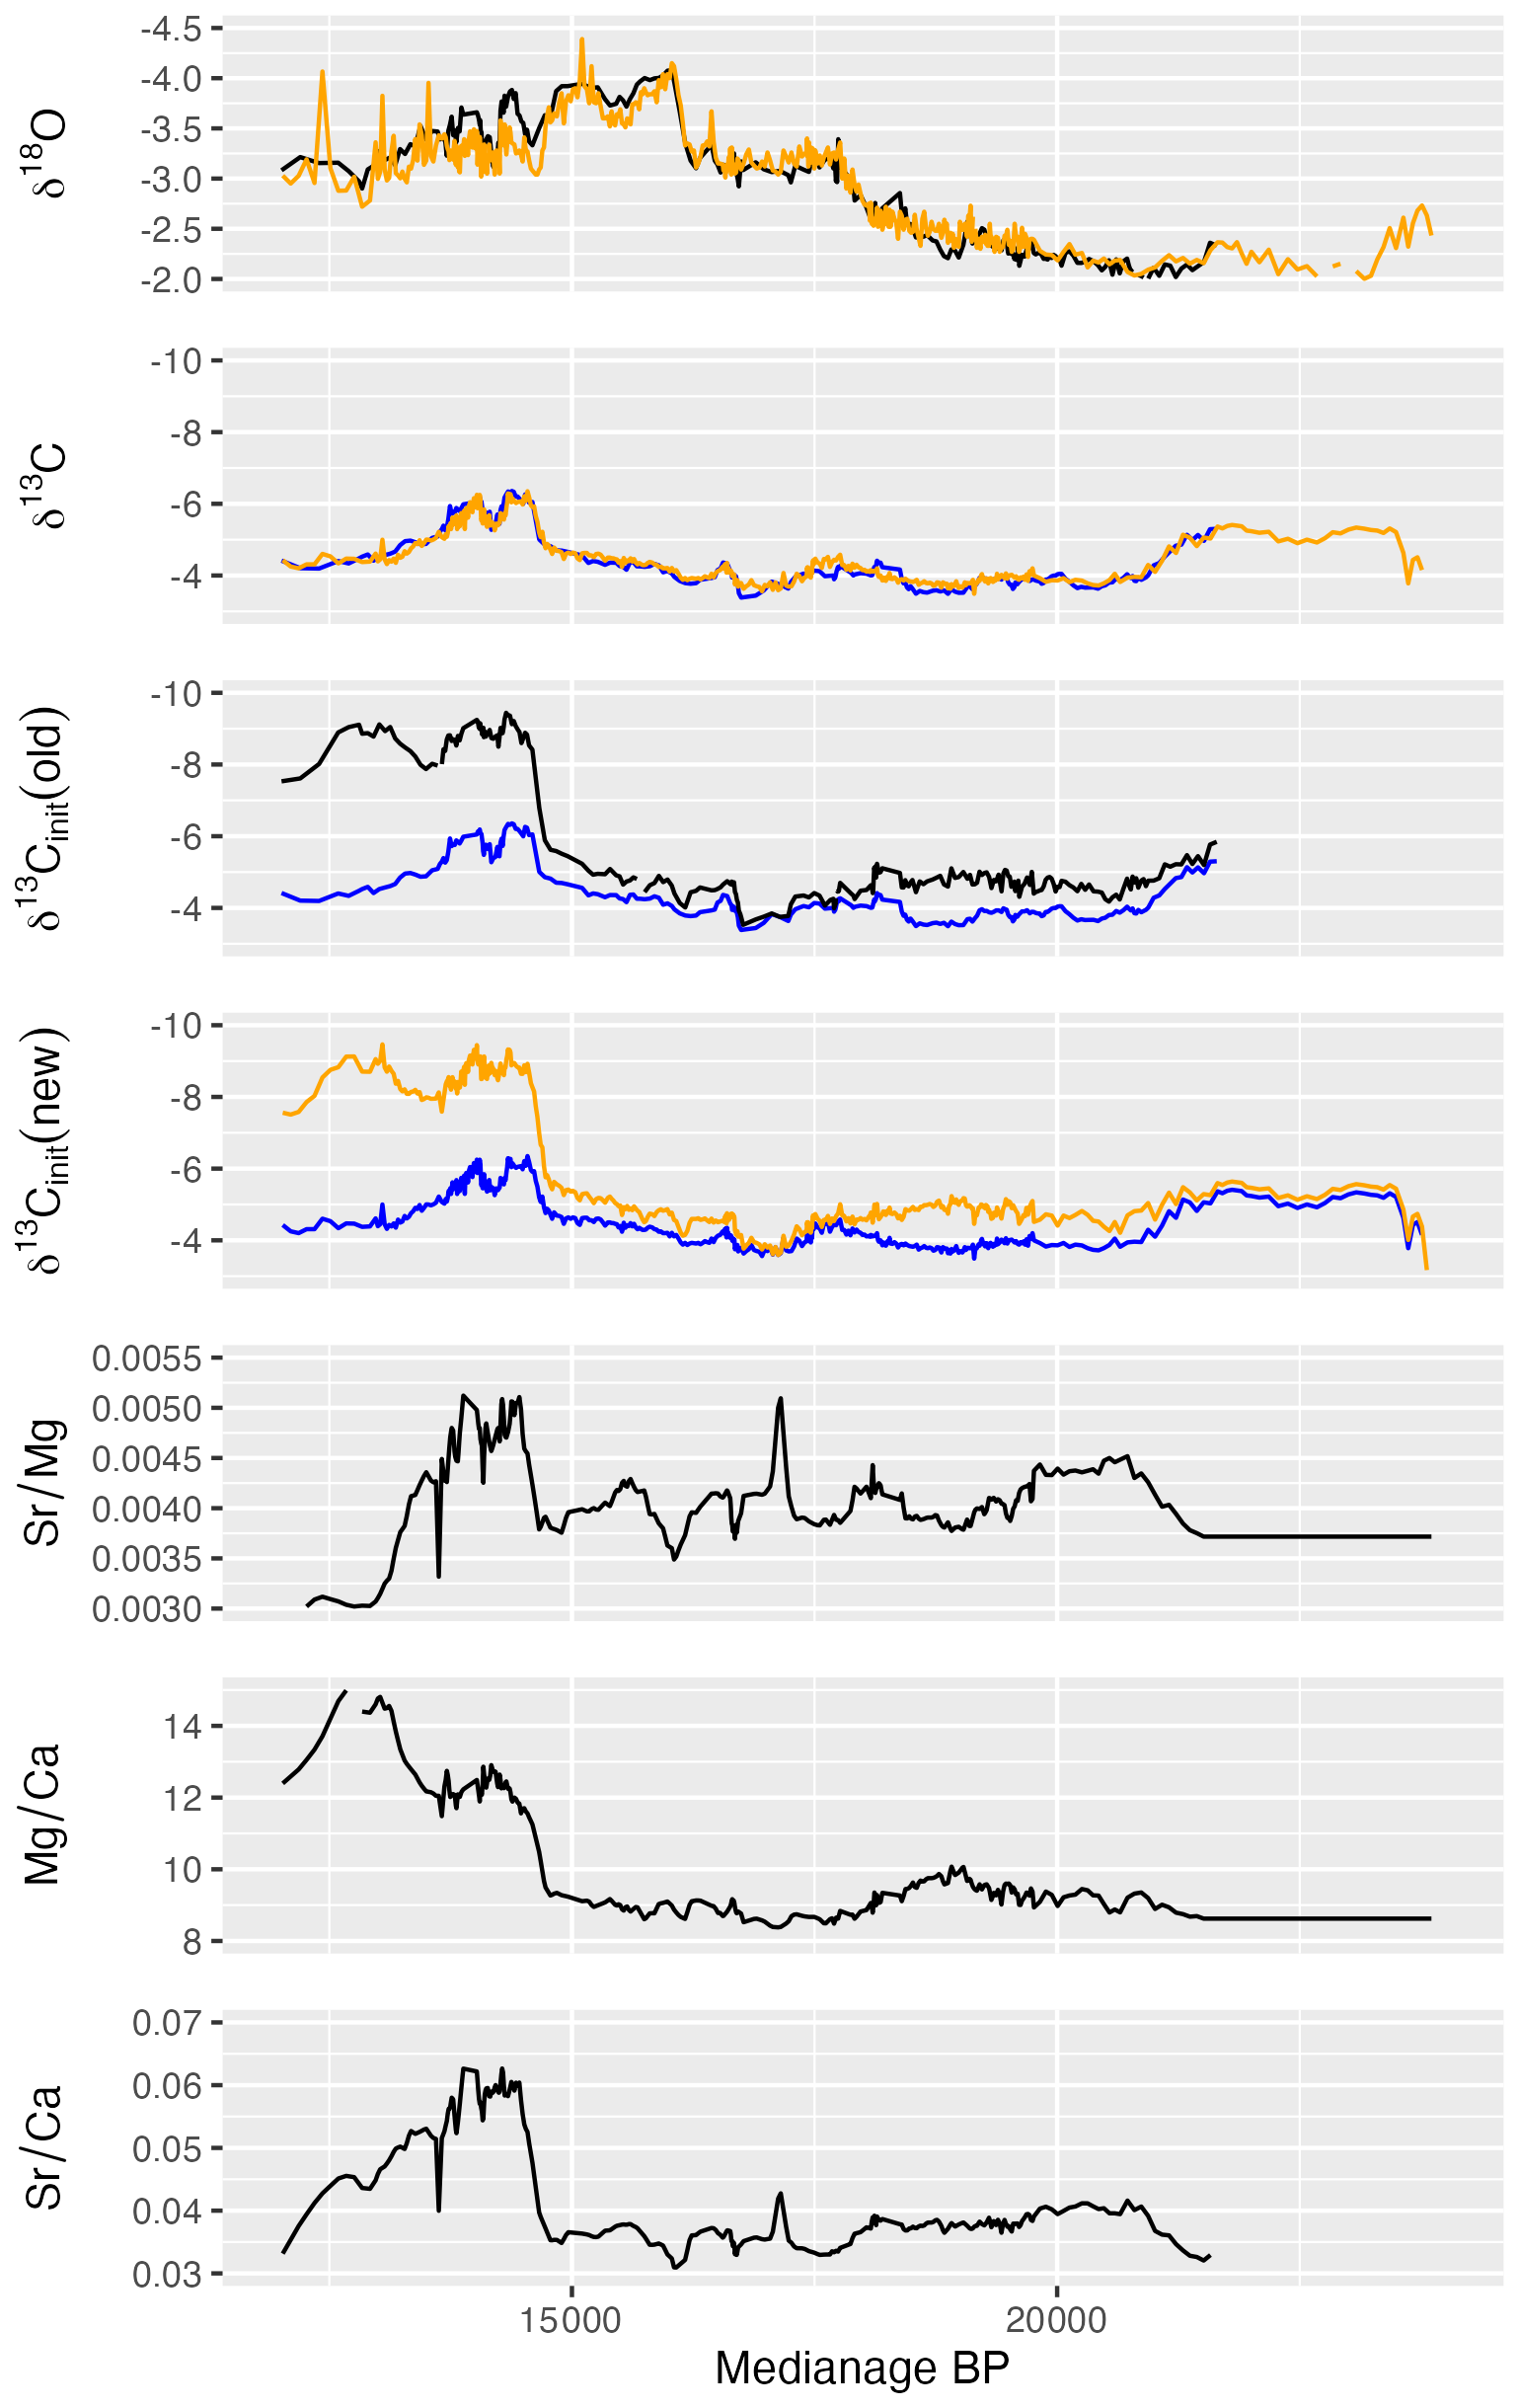
Figure A9Comparison between a prior low resolution trench (black), that was aligned to the new data (orange) with the help of Qanalyseries (Kotov and Pälike, 2018). Trace element data of the old trench was used to correct δ13C in the new trench. The blue line indicates the measured δ13C before applying the degassing correction.
Yet, by considering the difference maps in Fig. A7c, for end of Heinrich-Stadial 2 (HS2), strong Southern LIS melt has driven the peak visible in the Laurentide+GoM region and some of Northern LIS/CIS melt also discharges into the Arctic region. Further, some MW that could be visible in Glas maybe also originates from the Southern edge of BIIS. This aligns with Southern BIIS discharge also being registered by Toucanne et al. (2015), as outlined in the main text Fig. 3. In Early-LGM, MW discharges into GIN seas, related to thinning of the ice sheet border between BIIS and SIS, according to GLAC-1D. This slight freshening, close to the Glas site, is consistent and visible as a small excursion in our record. The gradual increase in Late-LGM is reflected in stalagmite Glas, sediment cores and GLAC-1D. For GLAC-1D, most of the discharge seems to originate from southern BIIS, SIS and also Southern part of Laurentide ice sheet. Over this period, proximal MW into Bay of Biscay seems plausible but also some of the signal could originate from the Southern Laurentide melt. Conversly, the MW sediment cores do not show evidence of MW over this time into the GoM (Wickert et al., 2023). From 18.5–18 ka, GLAC-1D models a rapid melt of Svalbard–Barents–Kara ice sheet (SBKIS), which is dumped into Arctic, which we believed might have at least partially discharged into GIN Seas, or routed to the channel river. In addition, the collapse of Hudson strait, often seen to be connected to enhanced ice berg discharge (HE1), seems to occur from 17.4–16.9 ka, reflected in the peak in the purple region Labrador+GoM. Nothing changes during this time in Glas, and sediment cores, so it might be plausible that this peak could be shifted, i.e. either collapse was later, or melt discharge delayed. The interval 16.4–16 ka shows here mostly the collapse of SBKIS, and is also the only time with ice sheet mass loss in Greenland. This exposes a certain contrast to the general idea to have HE1 then, supposedly sourced from LIS. GLAC-1D 15.4–15 ka shows a peak in GIN seas, originating from SIS and potentially related to Glas 15.4 ka BP. With the beginning of BA, GLAC-1D shows a large retreat of all NH ice sheets, to accustom for sea level changes, and associated with MWP1a. Interestingly, neither Glas nor any of the discharge proxy time series in this study show a big MW signal there.
A5 Complementary discussion of other Iberian speleothems
A noteworthy record from another regional cave from Northern Iberian Peninsula is OST2 from Ostolo cave (Bernal-Wormull et al., 2021) and MAAT from Meravelles cave (Pérez-Mejías et al., 2021) (Fig. A8). Ostolo cave features higher elevation and has nearly double the rainfall compared to La Vallina, indicative of a strong orographic enhancement. Therefore, beside OST2 also showing a shift towards more negative δ18O likely associated to a changed isotopic signature of the surface ocean moisture source around 18 and 16.1 ka, also the cold air temperature is described to cause negative shifts in δ18O of the stalagmite, an effect superimposed on the changes in the δ18Osw seen in the coastal caves. Consequently, while some meltwater signals may be manifest, such as the short-lived excursion to negative δ18O values in OST2, corresponding to to the Glas event 16.1kS (Bernal-Wormull et al., 2021), temperature and hydrological processes amplify the signal in OST2. The onset of BA in OST2, reported as 14.9 ka BP (reported age uncertainty ±80 years) predates both the estimates of the warming in Glas (14.6kT, with the midpoint at ka BP) and the onset in Greenland ice cores (start at 14.64±0.19 ka BP; Rasmussen et al. (2014), Fig. 4a). In contrast, in mediterranean caves, such as Meravelles cave (MAAT), the onset of HS1 is synchronous with a shift to more positive δ18O, which in this setting has been interpreted to indicate a decrease in rainfall and resulting deficit in moisture balance consistent with regional downscaled models of precipitation for the region during weakened AMOC. Additionally, stalagmite MAAT shows also an abrupt decrease in temperature, visible in δ13C (Pérez-Mejías et al., 2021).
B1 Alignment of the old and new trench
Due to the slow growth rate and the presence of abrupt climate changes over the early last deglaciation the sampling strategy for dating has been optimised by continuously micro-milling the sample with a 50 µm trench along growth layers, measure stable isotopes on these individual samples before combining the remaining powder of about 10 samples to one date. Trace elements and stable isotopes were also measured on a parallel trench and results from the two trenches were aligned using QAnalySeries (Kotov and Pälike, 2018). The two trenches are plotted on top of each other in Fig. A9. In all other figures oxygen isotope results are plotted from the same trench as dates, and δ13Cinit are plotted using δ13C from the trench corrected with trace elements from the parallel trench.
B2 Details about δ13Cinit correction
Through the correction of the δ13C ratio for in-cave process of Prior calcite precipitation (PCP), δ13Cinit becomes an improved qualitative indicator for temperature above the cave. We follow the procedure of Stoll et al. (2023): the initial is assumed to be the minimum ratio over the entire dataset and is used to compute the remaining calcite fraction (fCa) over time. Specifically, the equation to calculate the remaining calcite fraction is . Based on previous sensitivity experiments for a glacial Northwest Iberian climate and the La Vallina cave setting (Lechleitner et al., 2021; Stoll et al., 2023), the degassing slope fCaslope is set to −8 ‰, the bedrock scaling factor B to 1, and the attenuation factor AF also to 1 for the entire last deglaciation. The resulting equation to calculate the PCP-corrected δ13Cinit is . The comparison between the measured δ13C and the corrected time series is shown in Fig. A9.
B3 Details about the model simulation
The underlying simulation is the experiment “tfgbj”, previously published and made publicly availble in Rome et al. (2022). The simulation was completed using the HadCM3 atmosphere-ocean general circulation model in the BRIDGE (Bristol Research Initiative for the Dynamic Global Environment group) version (Valdes et al., 2017). The model consists of 19 atmosphere layers (2.5°×3.75°) (Pope et al., 2000), coupled to an ocean model with 20 layers (1.25°×1.25°) (Gordon et al., 2001), and includes the Moses 2.1 land model and TRIFFID dynamic vegetation model (Cox, 2001). The passive advective tracers were added and run for 500 years in two selected periods, in which the AMOC was strong or weak, respectively.
Details of the new U−Th data presented in this study is reported in Appendix, Table A1. All meta, geochemical and age data for speleothem Glas is further available in SISALv3 submission format (https://doi.org/10.5194/essd-16-1933-2024, Kaushal et al., 2024) in the ETH Research collection (https://doi.org/10.3929/ethz-b-000726747, Endres et al., 2025), and will be added to the SISAL database with their next release. The underlying model simulation data is available from the NERC Centre for Environmental Data Analysis repository (https://doi.org/10.5285/AFF921A9F2A34F008744342F0BAAA9A5, Rome et al., 2022). The analysis script to compute the transition midpoints is available on Zenodo (https://doi.org/10.5281/zenodo.19348269, Endres, 2026).
The study was designed by HS, RI and LE. LE wrote the paper with substantial scientific contributions from RI, LG, ALCH, and HS. Uran-Thorium dating was conducted by CPM and HC Fieldwork campaigns were organized by HMS. Sample preparation and geochemical labwork was carried out by LE and ETH Zürich technical staff. GCM dye tracer modeling was conducted by LE, RI, and University of Leeds technical staff. All authors contributed to reading and editing the text.
The contact author has declared that none of the authors has any competing interests.
Publisher's note: Copernicus Publications remains neutral with regard to jurisdictional claims made in the text, published maps, institutional affiliations, or any other geographical representation in this paper. The authors bear the ultimate responsibility for providing appropriate place names. Views expressed in the text are those of the authors and do not necessarily reflect the views of the publisher.
This work was funded by ETH Zürich base funding and ETH doc.mobility. Additionally funding was provided from the National Natural Science foundation of China (Grant-no. 42472244). We thank the scientific assistants Janine Schmitter, Sandra Bernegger, Romain Alosius and especially Lab Manager Madalina Jäggi for their support. Further, we thank Axel Timmermann, James Rae and Andrea Burke for fruitful scientific discussions. OpenAI ChatGPT was used for minor text editing.
This research has been supported by the National Natural Science Foundation of China (grant no. 42472244).
This paper was edited by Kathleen Wendt and reviewed by two anonymous referees.
Alley, R. B. and Clark, P. U.: The deglaciation of the Northern Hemisphere: a global perspective, Annu. Rev. Earth Pl. Sc., 27, 149–182, https://doi.org/10.1146/annurev.earth.27.1.149, 1999. a
Alvarez-Solas, J. and Ramstein, G.: On the triggering mechanism of Heinrich events, P. Natl. Acad. Sci. USA, 108, https://doi.org/10.1073/pnas.1116575108, 2011. a, b, c
Armstrong, E., Izumi, K., and Valdes, P.: Identifying the mechanisms of DO-scale oscillations in a GCM: a salt oscillator triggered by the Laurentide ice sheet, Clim. Dynam., 60, 3983–4001, https://doi.org/10.1007/s00382-022-06564-y, 2023. a
Barker, S. and Knorr, G.: Millennial scale feedbacks determine the shape and rapidity of glacial termination, Nat. Commun., 12, https://doi.org/10.1038/s41467-021-22388-6, 2021. a
Barker, S., Chen, J., Gong, X., Jonkers, L., Knorr, G., and Thornalley, D.: Icebergs not the trigger for North Atlantic cold events, Nature, 520, 333–336, https://doi.org/10.1038/nature14330, 2015. a
Batchelor, C. L., Margold, M., Krapp, M., Murton, D. K., Dalton, A. S., Gibbard, P. L., Stokes, C. R., Murton, J. B., and Manica, A.: The configuration of Northern Hemisphere ice sheets through the quaternary, Nat. Commun., 10, https://doi.org/10.1038/s41467-019-11601-2, 2019. a
Bellomo, K., Meccia, V. L., D'Agostino, R., Fabiano, F., Larson, S. M., Von Hardenberg, J., and Corti, S.: Impacts of a weakened AMOC on precipitation over the Euro-Atlantic region in the EC-Earth3 climate model, Clim. Dynam., 61, 3397–3416, https://doi.org/10.1007/s00382-023-06754-2, 2023. a
Bernal-Wormull, J., Moreno, A., Pérez-Mejías, C., Bartolomé, M., Aranburu, A., Arriolabengoa, M., Iriarte, E., Cacho, I., Spötl, C., Edwards, R., and Cheng, H.: Immediate temperature response in Northern Iberia to last deglacial changes in the North Atlantic, Geology, 49, 999–1003, https://doi.org/10.1130/G48660.1, 2021. a, b, c, d, e
Bethke, I., Li, C., and Nisancioglu, K. H.: Can we use ice sheet reconstructions to constrain meltwater for deglacial simulations?, Paleoceanography, 27, 2011PA002258, https://doi.org/10.1029/2011PA002258, 2012. a
Breitenbach, S. F., Lechleitner, F. A., Meyer, H., Diengdoh, G., Mattey, D., and Marwan, N.: Cave ventilation and rainfall signals in dripwater in a monsoonal setting – a monitoring study from NE India, Chem. Geol., 402, 111–124, https://doi.org/10.1016/j.chemgeo.2015.03.011, 2015. a
Broecker, W. S., Denton, G. H., Edwards, R. L., Cheng, H., Alley, R. B., and Putnam, A. E.: Putting the younger dryas cold event into context, Quaternary Sci. Rev., 29, 1078–1081, https://doi.org/10.1016/j.quascirev.2010.02.019, 2010. a
Buizert, C., Gkinis, V., Severinghaus, J. P., He, F., Lecavalier, B. S., Kindler, P., Leuenberger, M., Carlson, A. E., Vinther, B., Masson-Delmotte, V., White, J. W. C., Liu, Z., Otto-Bliesner, B., and Brook, E. J.: Greenland temperature response to climate forcing during the last deglaciation, Science, 345, 1177–1180, https://doi.org/10.1126/science.1254961, 2014. a
Cheng, H., Lawrence Edwards, R., Shen, C. C., Polyak, V. J., Asmerom, Y., Woodhead, J., Hellstrom, J., Wang, Y., Kong, X., Spötl, C., Wang, X., and Calvin Alexander, E.: Improvements in 230Th dating, 230Th and 234U half-life values, and U−Th isotopic measurements by multi-collector inductively coupled plasma mass spectrometry, Earth Planet. Sc. Lett., 371, 82–91, https://doi.org/10.1016/j.epsl.2013.04.006, 2013. a, b, c
Clark, C. D., Ely, J. C., Hindmarsh, R. C. A., Bradley, S., Ignéczi, A., Fabel, D., Ó Cofaigh, C., Chiverrell, R. C., Scourse, J., Benetti, S., Bradwell, T., Evans, D. J. A., Roberts, D. H., Burke, M., Callard, S. L., Medialdea, A., Saher, M., Small, D., Smedley, R. K., Gasson, E., Gregoire, L., Gandy, N., Hughes, A. L. C., Ballantyne, C., Bateman, M. D., Bigg, G. R., Doole, J., Dove, D., Duller, G. A. T., Jenkins, G. T. H., Livingstone, S. L., McCarron, S., Moreton, S., Pollard, D., Praeg, D., Sejrup, H. P., Van Landeghem, K. J. J., and Wilson, P.: Growth and retreat of the last British–Irish ice sheet, 31 000 to 15 000 years ago: the BRITICE-CHRONO reconstruction, Boreas, 51, 699–758, https://doi.org/10.1111/bor.12594, 2022. a
Clark, P. U., Shakun, J. D., Baker, P. A., Bartlein, P. J., Brewer, S., Brook, E., Carlson, A. E., Cheng, H., Kaufman, D. S., Liu, Z., Marchitto, T. M., Mix, A. C., Morrill, C., Otto-Bliesner, B. L., Pahnke, K., Russell, J. M., Whitlock, C., Adkins, J. F., Blois, J. L., Clark, J., Colman, S. M., Curry, W. B., Flower, B. P., He, F., Johnson, T. C., Lynch-Stieglitz, J., Markgraf, V., McManus, J., Mitrovica, J. X., Moreno, P. I., and Williams, J. W.: Global climate evolution during the last deglaciation, P. Natl. Acad. Sci. USA, 109, https://doi.org/10.1073/pnas.1116619109, 2012. a
Condron, A., Joyce, A. J., and Bradley, R. S.: Arctic sea ice export as a driver of deglacial climate, Geology, 48, 395–399, https://doi.org/10.1130/G47016.1, 2020. a
Coonin, A. N., Lau, H. C. P., and Coulson, S.: Meltwater pulse 1A sea-level-rise patterns explained by global cascade of ice loss, Nat. Geosci., 18, 254–259, https://doi.org/10.1038/s41561-025-01648-w, 2025. a
Cox, P. M.: Description of the TRIFFID dynamic global vegetation model, Hadley Centre Technical Note 24, https://www.researchgate.net/profile/Peter-Cox-3/publication/245877262_Description_of_the_TRIFFID_dynamic_global_vegetation_model/links/0c9605215c2aadfa24000000/Description-of-the-TRIFFID-dynamic-global-vegetation-model.pdf (last access: 13 April 2026) 2001. a
De Villiers, S., Greaves, M., and Elderfield, H.: An intensity ratio calibration method for the accurate determination of and of marine carbonates by ICP-AES, Geochem. Geophy. Geosy., 3, 2001GC000169, https://doi.org/10.1029/2001GC000169, 2002. a
Denton, G. H., Anderson, R. F., Toggweiler, J. R., Edwards, R. L., Schaefer, J. M., and Putnam, A. E.: The last glacial termination, Science, 328, 1652–1656, https://doi.org/10.1126/science.1184119, 2010. a
Denton, G. H., Putnam, A. E., Russell, J. L., Barrell, D. J., Schaefer, J. M., Kaplan, M. R., and Strand, P. D.: The Zealandia switch: ice age climate shifts viewed from Southern Hemisphere moraines, Quaternary Sci. Rev., 257, 106771, https://doi.org/10.1016/j.quascirev.2020.106771, 2021. a, b
Deschamps, P., Durand, N., Bard, E., Hamelin, B., Camoin, G., Thomas, A. L., Henderson, G. M., Okuno, J., and Yokoyama, Y.: Ice-sheet collapse and sea-level rise at the Bølling warming 14,600 years ago, Nature, 483, 559–564, https://doi.org/10.1038/nature10902, 2012. a
Endres, L.: Compute palaeo midpoints with an error-in-variables approach and MCMC ensemble, Zenodo [data set], https://doi.org/10.5281/zenodo.19348269, 2026. a
Endres, L., Pérez-Mejías, C., and Stoll, H.: Metadata, chronology and geochemical measurements of NISA speleothem “Glas” in SISAL submission format v15, ETH Zurich [data set], https://doi.org/10.3929/ethz-b-000726747, 2025. a
Fohlmeister, J., Voarintsoa, N. R. G., Lechleitner, F. A., Boyd, M., Brandtstätter, S., Jacobson, M. J., and Oster, J. L.: Main controls on the stable carbon isotope composition of speleothems, Geochim. Cosmochim. Ac., 279, 67–87, https://doi.org/10.1016/j.gca.2020.03.042, 2020. a
Fohlmeister, J., Sekhon, N., Columbu, A., Vettoretti, G., Weitzel, N., Rehfeld, K., Veiga-Pires, C., Ben-Yami, M., Marwan, N., and Boers, N.: Global reorganization of atmospheric circulation during Dansgaard–Oeschger cycles, P. Natl. Acad. Sci. USA, 120, e2302283120, https://doi.org/10.1073/pnas.2302283120, 2023. a
Gao, Y., Liu, Z., and Lu, Z.: Dynamic effect of last glacial maximum ice sheet topography on the East Asian summer monsoon, J. Climate, 33, 6929–6944, https://doi.org/10.1175/JCLI-D-19-0562.1, 2020. a
González, M. I.: Variabilidad Climática Del Noroeste de La Península Ibérica Durante Los Ultimos 1500 Años Descrita Por Espeleotemas de Diversas Cuevas Del Principado de Asturias, PhD thesis, Universidad de Oviedo, http://hdl.handle.net/10651/54112 (last access: 13 April 2026), 2019. a, b
Gordon, C., Cooper, C., Senior, C. A., Banks, H., Gregory, J. M., Johns, T. C., Mitchell, J. F. B., and Wood, R. A.: The simulation of SST, sea ice extents and ocean heat transports in a version of the Hadley Centre coupled model without flux adjustments, Clim. Dynam., 16, 147–168, https://doi.org/10.1007/s003820050010, 2001. a
Gregoire, L. J., Otto-Bliesner, B., Valdes, P. J., and Ivanovic, R.: Abrupt Bølling warming and ice saddle collapse contributions to the meltwater pulse 1a rapid sea level rise, Geophys. Res. Lett., 43, 9130–9137, https://doi.org/10.1002/2016GL070356, 2016. a
Haslett, J. and Parnell, A.: A simple monotone process with application to radiocarbon-dated depth chronologies, J. Roy. Stat. Soc. C-App., 57, 399–418, https://doi.org/10.1111/j.1467-9876.2008.00623.x, 2008. a, b
He, C., Liu, Z., Otto-Bliesner, B. L., Brady, E., Zhu, C., Tomas, R., Clark, P., Zhu, J., Jahn, A., Gu, S., Zhang, J., Nusbaumer, J., Noone, D., Cheng, H., Wang, Y., Yan, M., and Bao, Y.: Hydroclimate footprint of Pan-Asian monsoon water isotope during the last deglaciation, Science Advances, 7, eabe2611, https://doi.org/10.1126/sciadv.abe2611, 2021a. a
He, C., Liu, Z., Otto-Bliesner, B. L., Brady, E. C., Zhu, C., Tomas, R., Buizert, C., and Severinghaus, J. P.: Abrupt Heinrich Stadial 1 cooling missing in Greenland oxygen isotopes, Science Advances, 7, 1007–1023, 2021b. a, b
Hodell, D. A., Nicholl, J. A., Bontognali, T. R., Danino, S., Dorador, J., Dowdeswell, J. A., Einsle, J., Kuhlmann, H., Martrat, B., Mleneck-Vautravers, M. J., Rodríguez-Tovar, F. J., and Röhl, U.: Anatomy of Heinrich Layer 1 and its role in the last deglaciation, Paleoceanography, 32, 284–303, https://doi.org/10.1002/2016PA003028, 2017. a, b, c, d, e
Hughes, A. L. C., Gyllencreutz, R., Lohne, Ø. S., Mangerud, J., and Svendsen, J. I.: The last Eurasian ice sheets – a chronological database and time-slice reconstruction, DATED-1, Boreas, 45, 1–45, https://doi.org/10.1111/bor.12142, 2016. a, b, c
Ivanovic, R. F., Gregoire, L. J., Kageyama, M., Roche, D. M., Valdes, P. J., Burke, A., Drummond, R., Peltier, W. R., and Tarasov, L.: Transient climate simulations of the deglaciation 21–9 thousand years before present (version 1) – PMIP4 Core experiment design and boundary conditions, Geosci. Model Dev., 9, 2563–2587, https://doi.org/10.5194/gmd-9-2563-2016, 2016. a, b, c, d
Ivanovic, R. F., Gregoire, L. J., Burke, A., Wickert, A. D., Valdes, P. J., Ng, H. C., Robinson, L. F., McManus, J. F., Mitrovica, J. X., Lee, L., and Dentith, J. E.: Acceleration of northern ice sheet melt induces AMOC slowdown and northern cooling in simulations of the early last deglaciation, Paleoceanography and Paleoclimatology, 33, 807–824, https://doi.org/10.1029/2017PA003308, 2018. a
Jackson, L. C., Kahana, R., Graham, T., Ringer, M. A., Woollings, T., Mecking, J. V., and Wood, R. A.: Global and European climate impacts of a Slowdown of the AMOC in a high resolution GCM, Clim. Dynam., 45, 3299–3316, https://doi.org/10.1007/s00382-015-2540-2, 2015. a, b
Jaffey, A. H., Flynn, K. F., Glendenin, L. E., Bentley, W. C., and Essling, A. M.: Precision measurement of half-lives and specific activities of 235U and 238U, Phys. Rev. C, 4, 1889–1906, https://doi.org/10.1103/physrevc.4.1889, 1971. a
Kapsch, M.-L., Mikolajewicz, U., Ziemen, F., and Schannwell, C.: Ocean response in transient simulations of the last deglaciation dominated by underlying ice-sheet reconstruction and method of meltwater distribution, Geophys. Res. Lett., 49, https://doi.org/10.1029/2021GL096767, 2022. a, b
Kaushal, N., Lechleitner, F. A., Wilhelm, M., Azennoud, K., Bühler, J. C., Braun, K., Ait Brahim, Y., Baker, A., Burstyn, Y., Comas-Bru, L., Fohlmeister, J., Goldsmith, Y., Harrison, S. P., Hatvani, I. G., Rehfeld, K., Ritzau, M., Skiba, V., Stoll, H. M., Szücs, J. G., Tanos, P., Treble, P. C., Azevedo, V., Baker, J. L., Borsato, A., Chawchai, S., Columbu, A., Endres, L., Hu, J., Kern, Z., Kimbrough, A., Koç, K., Markowska, M., Martrat, B., Masood Ahmad, S., Nehme, C., Novello, V. F., Pérez-Mejías, C., Ruan, J., Sekhon, N., Sinha, N., Tadros, C. V., Tiger, B. H., Warken, S., Wolf, A., Zhang, H., and SISAL Working Group members: SISALv3: a global speleothem stable isotope and trace element database, Earth Syst. Sci. Data, 16, 1933–1963, https://doi.org/10.5194/essd-16-1933-2024, 2024. a
Klockmann, M., Mikolajewicz, U., and Marotzke, J.: Two AMOC states in response to decreasing greenhouse gas concentrations in the coupled climate model MPI-ESM, J. Climate, 31, 7969–7984, https://doi.org/10.1175/JCLI-D-17-0859.1, 2018. a
Kost, O. and Stoll, H.: Marine aerosols in coastal areas and their impact on cave drip water – a monitoring study from Northern Spain, Atmos. Environ., 302, 119730, https://doi.org/10.1016/j.atmosenv.2023.119730, 2023. a
Kost, O., González-Lemos, S., Rodríguez-Rodríguez, L., Sliwinski, J., Endres, L., Haghipour, N., and Stoll, H.: Relationship of seasonal variations in drip water δ13CDIC, δ18O, and trace elements with surface and physical cave conditions of La Vallina cave, NW Spain, Hydrol. Earth Syst. Sci., 27, 2227–2255, https://doi.org/10.5194/hess-27-2227-2023, 2023. a
Kotov, S. and Pälike, H.: QAnalySeries – a Cross-Platform Time Series Tuning and Analysis Tool, ESS Open Archive [code], https://doi.org/10.1002/essoar.10500226.1, 2018. a, b
Lechleitner, F. A., Day, C. C., Kost, O., Wilhelm, M., Haghipour, N., Henderson, G. M., and Stoll, H. M.: Stalagmite carbon isotopes suggest deglacial increase in soil respiration in western Europe driven by temperature change, Clim. Past, 17, 1903–1918, https://doi.org/10.5194/cp-17-1903-2021, 2021. a, b, c
Li, H., Spötl, C., and Cheng, H.: A high-resolution speleothem proxy record of the late glacial in the European Alps: extending the NALPS19 record until the beginning of the holocene, J. Quaternary Sci., 36, 29–39, https://doi.org/10.1002/jqs.3255, 2021. a
Li, T., Robinson, L. F., MacGilchrist, G. A., Chen, T., Stewart, J. A., Burke, A., Wang, M., Li, G., Chen, J., and Rae, J. W. B.: Enhanced subglacial discharge from Antarctica during meltwater pulse 1A, Nat. Commun., 14, 7327, https://doi.org/10.1038/s41467-023-42974-0, 2023. a
Lin, Y., Hibbert, F. D., Whitehouse, P. L., Woodroffe, S. A., Purcell, A., Shennan, I., and Bradley, S. L.: A reconciled solution of meltwater pulse 1A sources using sea-level fingerprinting, Nat. Commun., 12, 2015, https://doi.org/10.1038/s41467-021-21990-y, 2021. a
Ludwig, P., Schaffernicht, E. J., Shao, Y., and Pinto, J. G.: Regional atmospheric circulation over Europe during the last glacial maximum and its links to precipitation, J. Geophys. Res., 121, 2130–2145, https://doi.org/10.1002/2015JD024444, 2016. a
Luetscher, M., Boch, R., Sodemann, H., Spötl, C., Cheng, H., Edwards, R. L., Frisia, S., Hof, F., and Müller, W.: North Atlantic storm track changes during the last glacial maximum recorded by Alpine speleothems, Nat. Commun., 6, 6344, https://doi.org/10.1038/ncomms7344, 2015. a, b, c
MacAyeal, D. R.: Binge/purge oscillations of the Laurentide ice sheet as a cause of the North Atlantic's Heinrich events, Paleoceanography, 8, 775–784, https://doi.org/10.1029/93PA02200, 1993. a
Marcott, S. A., Bauska, T. K., Buizert, C., Steig, E. J., Rosen, J. L., Cuffey, K. M., Fudge, T. J., Severinghaus, J. P., Ahn, J., Kalk, M. L., McConnell, J. R., Sowers, T., Taylor, K. C., White, J. W. C., and Brook, E. J.: Centennial-scale changes in the global carbon cycle during the last deglaciation, Nature, 514, 616–619, https://doi.org/10.1038/nature13799, 2014. a, b, c
Markle, B. R., Steig, E. J., Buizert, C., Schoenemann, S. W., Bitz, C. M., Fudge, T. J., Pedro, J. B., Ding, Q., Jones, T. R., White, J. W. C., and Sowers, T.: Global atmospheric teleconnections during Dansgaard–Oeschger events, Nat. Geosci., 10, 36–40, https://doi.org/10.1038/ngeo2848, 2017. a
McDermott, F., Schwarcz, H., and Rowe, P. J.: Isotopes in speleothems, in: Isotopes in palaeoenvironmental research (pp. 185–225), edited by: Leng, M. J., Springer Netherlands, https://doi.org/10.1007/1-4020-2504-1_05, 2006. a
Mcmanus, J. F., Francois, R., Gherardi, J.-M., Keigwin, L. D., and Brown-Leger, S.: Collapse and rapid resumption of Atlantic meridional circulation linked to deglacial climate changes, Nature, 428, 834–837, https://doi.org/10.1038/nature02494, 2004. a
Menviel, L. C., Skinner, L. C., Tarasov, L., and Tzedakis, P. C.: An ice–climate oscillatory framework for Dansgaard–Oeschger cycles, Nature Reviews Earth and Environment, 1, 677–693, https://doi.org/10.1038/s43017-020-00106-y, 2020. a
Mickler, P. J., Carlson, P., Banner, J. L., Breecker, D. O., Stern, L., and Guilfoyle, A.: Quantifying carbon isotope disequilibrium during in-cave evolution of drip water along discreet flow paths, Geochim. Cosmochim. Ac., 244, 182–196, https://doi.org/10.1016/j.gca.2018.09.027, 2019. a
Missiaen, L., Menviel, L. C., Meissner, K. J., Roche, D. M., Dutay, J.-C., Bouttes, N., Lhardy, F., Quiquet, A., Pichat, S., and Waelbroeck, C.: Modelling the impact of biogenic particle flux intensity and composition on sedimentary , Quaternary Sci. Rev., 240, 106394, https://doi.org/10.1016/j.quascirev.2020.106394, 2020. a
Moreno, A., Iglesias, M., Azorin-Molina, C., Pérez-Mejías, C., Bartolomé, M., Sancho, C., Stoll, H., Cacho, I., Frigola, J., Osácar, C., Muñoz, A., Delgado-Huertas, A., Bladé, I., and Vimeux, F.: Measurement report: Spatial variability of northern Iberian rainfall stable isotope values – investigating atmospheric controls on daily and monthly timescales, Atmos. Chem. Phys., 21, 10159–10177, https://doi.org/10.5194/acp-21-10159-2021, 2021. a
Mühlinghaus, C., Scholz, D., and Mangini, A.: Modelling stalagmite growth and δ13C as a function of drip interval and temperature, Geochim. Cosmochim. Ac., 71, 2780–2790, https://doi.org/10.1016/j.gca.2007.03.018, 2007. a
Ng, H. C., Robinson, L. F., McManus, J. F., Mohamed, K. J., Jacobel, A. W., Ivanovic, R. F., Gregoire, L. J., and Chen, T.: Coherent deglacial changes in western Atlantic ocean circulation, Nat. Commun., 9, https://doi.org/10.1038/s41467-018-05312-3, 2018. a, b, c, d
Norris, S. L., Tarasov, L., Monteath, A. J., Gosse, J. C., Hidy, A. J., Margold, M., and Froese, D. G.: Rapid retreat of the southwestern Laurentide ice sheet during the Bølling-Allerød interval, Geology, 50, 417–421, https://doi.org/10.1130/G49493.1, 2022. a, b
North Greenland Ice Core Project members: High-resolution record of Northern Hemisphere climate extending into the last interglacial period, Nature, 431, 147–151, https://doi.org/10.1038/nature02805, 2004. a, b, c
Peck, V., Hall, I., Zahn, R., Elderfield, H., Grousset, F., Hemming, S., and Scourse, J.: High resolution evidence for linkages between NW European ice sheet instability and Atlantic meridional overturning circulation, Earth Planet. Sc. Lett., 243, 476–488, https://doi.org/10.1016/j.epsl.2005.12.023, 2006. a
Peck, V. L.: Sedimentology, and stable carbon and oxygen isotope ratios of sediment core MD01-2461, in: Paleoclimate Records from Core MD01-2461, Porcupine Seabight, NE Atlantic, PANGAEA [data set], https://doi.org/10.1594/PANGAEA.881904, 2017. a
Pérez-Mejías, C., Moreno, A., Bernal-Wormull, J., Cacho, I., Osácar, M. C., Edwards, R. L., and Cheng, H.: Oldest dryas hydroclimate reorganization in the Eastern Iberian peninsula after the iceberg discharges of Heinrich event 1, Quaternary Res., 101, 67–83, https://doi.org/10.1017/qua.2020.112, 2021. a, b, c, d
Pope, V. D., Pope, V. D., Gallani, M. L., Rowntree, P. R., and Stratton, R. A.: The impact of new physical parametrizations in the Hadley Centre climate model: HadAM3, Clim. Dynam., 16, 123–146, https://doi.org/10.1007/s003820050009, 2000. a
Pöppelmeier, F., Jeltsch-Thömmes, A., Lippold, J., Joos, F., and Stocker, T. F.: Multi-proxy constraints on Atlantic circulation dynamics since the last ice age, Nat. Geosci., 16, 349–356, https://doi.org/10.1038/s41561-023-01140-3, 2023. a, b, c
Rashid, H., Saint-Ange, F., Barber, D., Smith, M., and Devalia, N.: Fine scale sediment structure and geochemical signature between eastern and western North Atlantic during Heinrich events 1 and 2, Quaternary Sci. Rev., 46, 136–150, https://doi.org/10.1016/j.quascirev.2012.04.026, 2012. a, b, c, d, e
Rasmussen, S. O., Bigler, M., Blockley, S. P., Blunier, T., Buchardt, S. L., Clausen, H. B., Cvijanovic, I., Dahl-Jensen, D., Johnsen, S. J., Fischer, H., Gkinis, V., Guillevic, M., Hoek, W. Z., Lowe, J. J., Pedro, J. B., Popp, T., Seierstad, I. K., Steffensen, J. P., Svensson, A. M., Vallelonga, P., Vinther, B. M., Walker, M. J., Wheatley, J. J., and Winstrup, M.: A stratigraphic framework for abrupt climatic changes during the last glacial period based on three synchronized Greenland ice-core records: refining and extending the INTIMATE event stratigraphy, Quaternary Sci. Rev., 106, 14–28, https://doi.org/10.1016/j.quascirev.2014.09.007, 2014. a
Rome, Y., Ivanovic, R., Valdes, P., and Tindall, J.: HadCM3 general circulation model forced simulations of oscillating last glacial maximum forced with deglacial meltwater. NERC EDS Centre for Environmental Data Analysis [data set], https://doi.org/10.5285/AFF921A9F2A34F008744342F0BAAA 9A5, 2022. a, b
Romé, Y. M., Ivanovic, R. F., Gregoire, L. J., Sherriff-Tadano, S., and Valdes, P. J.: Millennial-scale climate oscillations triggered by deglacial meltwater discharge in last glacial maximum simulations, Paleoceanography and Paleoclimatology, 37, e2022PA004451, https://doi.org/10.1029/2022PA004451, 2022. a, b, c, d, e, f, g, h, i, j, k, l, m, n
Romé, Y. M., Ivanovic, R. F., Gregoire, L. J., Sherriff-Tadano, S., and Valdes, P. J.: Abrupt Climate Changes during the Last Ice Age: A Study of Millennial-Scale Variability in Climate Simulations, PhD thesis, https://etheses.whiterose.ac.uk/id/eprint/34761/ (last access: 13 April 2026), 2024. a
Romé, Y. M., Ivanovic, R. F., Gregoire, L. J., Swingedouw, D., Sherriff-Tadano, S., and Börner, R.: Simulated millennial-scale climate variability driven by a convection–advection oscillator, Clim. Dynam., 63, 150, https://doi.org/10.1007/s00382-025-07630-x, 2025. a, b, c, d
Romero-Mujalli, G., Hartmann, J., Börker, J., Gaillardet, J., and Calmels, D.: Ecosystem controlled soil-rock pCO2 and carbonate weathering – constraints by temperature and soil water content, Chem. Geol., 527, 118634, https://doi.org/10.1016/j.chemgeo.2018.01.030, 2019. a
Rudzka, D., McDermott, F., Baldini, L., Fleitmann, D., Moreno, A., and Stoll, H.: The coupled δ13C-radiocarbon systematics of three late glacial/early holocene speleothems; insights into soil and cave processes at climatic transitions, Geochim. Cosmochim. Ac., 75, 4321–4339, https://doi.org/10.1016/j.gca.2011.05.022, 2011. a
Scheen, J., Lippold, J., Pöppelmeier, F., Süfke, F., and Stocker, T. F.: Promising regions for detecting the overturning circulation in Atlantic : a model-data comparison, Paleoceanography and Paleoclimatology, 40, e2024PA004869, https://doi.org/10.1029/2024PA004869, 2025. a
Schindelin, J., Arganda-Carreras, I., Frise, E., Kaynig, V., Longair, M., Pietzsch, T., Preibisch, S., Rueden, C., Saalfeld, S., Schmid, B., Tinevez, J. Y., White, D. J., Hartenstein, V., Eliceiri, K., Tomancak, P., and Cardona, A.: Fiji: an open-source platform for biological-image analysis, Nat. Methods, 9, 676–682, https://doi.org/10.1038/nmeth.2019, 2012. a
Shakun, J. D., Clark, P. U., He, F., Marcott, S. A., Mix, A. C., Liu, Z., Otto-Bliesner, B., Schmittner, A., and Bard, E.: Global warming preceded by increasing carbon dioxide concentrations during the last deglaciation, Nature, 484, 49–54, https://doi.org/10.1038/nature10915, 2012. a, b, c
Sherriff-Tadano, S., Abe-Ouchi, A., Yoshimori, M., Oka, A., and Chan, W. L.: Influence of glacial ice sheets on the Atlantic meridional overturning circulation through surface wind change, Clim. Dynam., 50, 2881–2903, https://doi.org/10.1007/s00382-017-3780-0, 2018. a
Skinner, L. and Shackleton, N.: Deconstructing terminations I and II: revisiting the glacioeustatic paradigm based on deep-water temperature estimates, Quaternary Sci. Rev., 25, 3312–3321, https://doi.org/10.1016/j.quascirev.2006.07.005, 2006. a
Skinner, L. C., Waelbroeck, C., Scrivner, A. E., and Fallon, S. J.: Radiocarbon evidence for alternating northern and southern sources of ventilation of the deep Atlantic carbon pool during the last deglaciation, P. Natl. Acad. Sci. USA, 111, 5480–5484, https://doi.org/10.1073/pnas.1400668111, 2014. a
Sliwinski, J., Kost, O., Endres, L., Iglesias, M., Haghipour, N., González-Lemos, S., and Stoll, H.: Exploring soluble and colloidally transported trace elements in stalagmites: the strontium-yttrium connection, Geochim. Cosmochim. Ac., 343, 64–83, https://doi.org/10.1016/j.gca.2022.12.023, 2023. a
Snoll, B., Ivanovic, R., Gregoire, L., Sherriff-Tadano, S., Menviel, L., Obase, T., Abe-Ouchi, A., Bouttes, N., He, C., He, F., Kapsch, M., Mikolajewicz, U., Muglia, J., and Valdes, P.: A multi-model assessment of the early last deglaciation (PMIP4 LDv1): a meltwater perspective, Clim. Past, 20, 789–815, https://doi.org/10.5194/cp-20-789-2024, 2024. a, b, c, d, e, f
Stokes, C. R., Tarasov, L., and Dyke, A. S.: Dynamics of the North American ice sheet complex during its inception and build-up to the last glacial maximum, Quaternary Sci. Rev., 50, 86–104, https://doi.org/10.1016/j.quascirev.2012.07.009, 2012. a
Stokes, C. R., Tarasov, L., Blomdin, R., Cronin, T. M., Fisher, T. G., Gyllencreutz, R., Hättestrand, C., Heyman, J., Hindmarsh, R. C., Hughes, A. L., Jakobsson, M., Kirchner, N., Livingstone, S. J., Margold, M., Murton, J. B., Noormets, R., Peltier, W. R., Peteet, D. M., Piper, D. J., Preusser, F., Renssen, H., Roberts, D. H., Roche, D. M., Saint-Ange, F., Stroeven, A. P., and Teller, J. T.: On the reconstruction of palaeo-ice sheets: recent advances and future challenges, Quaternary Sci. Rev., 125, 15–49, https://doi.org/10.1016/j.quascirev.2015.07.016, 2015. a
Stoll, H., Mendez-Vicente, A., Gonzalez-Lemos, S., Moreno, A., Cacho, I., Cheng, H., and Edwards, R. L.: Interpretation of orbital scale variability in mid-latitude speleothem δ18O: significance of growth rate controlled kinetic fractionation effects, Quaternary Sci. Rev., 127, 215–228, https://doi.org/10.1016/j.quascirev.2015.08.025, 2015. a
Stoll, H. M., Cacho, I., Gasson, E., Sliwinski, J., Kost, O., Iglesias, M., Torner, J., Perez-mejias, C., Haghipour, N., Cheng, H., Edwards, R. L., and Moreno, A.: Rapid Northern Hemisphere ice sheet melting during the penultimate deglaciation, Nat. Commun., 13, https://doi.org/10.1038/s41467-022-31619-3, 2022. a, b, c, d, e, f
Stoll, H. M., Day, C., Lechleitner, F., Kost, O., Endres, L., Sliwinski, J., Pérez-Mejías, C., Cheng, H., and Scholz, D.: Distinguishing the combined vegetation and soil component of δ13C variation in speleothem records from subsequent degassing and prior calcite precipitation effects, Clim. Past, 19, 2423–2444, https://doi.org/10.5194/cp-19-2423-2023, 2023. a, b, c, d
Stríkis, N. M., Chiessi, C. M., Cruz, F. W., Vuille, M., Cheng, H., De Souza Barreto, E. A., Mollenhauer, G., Kasten, S., Karmann, I., Edwards, R. L., Bernal, J. P., and Sales, H. D. R.: Timing and structure of mega-SACZ events during Heinrich Stadial 1, Geophys. Res. Lett., 42, 5477, https://doi.org/10.1002/2015GL064048, 2015. a, b
Tapia, N., Endres, L., Jaggi, M., and Stoll, H.: Accelerated phosphorous leaching during abrupt climate transitions in a temperate Atlantic ecosystem in Northwest Spain recorded by stalagmite variations, Biogeosciences, 22, 6861–6875, https://doi.org/10.5194/bg-22-6861-2025, 2025. a
Toucanne, S., Soulet, G., Freslon, N., Silva Jacinto, R., Dennielou, B., Zaragosi, S., Eynaud, F., Bourillet, J. F., and Bayon, G.: Millennial-scale fluctuations of the European ice sheet at the end of the last glacial, and their potential impact on global climate, Quaternary Sci. Rev., 123, 113–133, https://doi.org/10.1016/j.quascirev.2015.06.010, 2015. a, b, c, d, e, f, g, h, i
Trombini, I., Weitzel, N., Valdes, P. J., Baudouin, J.-P., Armstrong, E., and Rehfeld, K.: Atmospheric and oceanic pathways drive separate modes of Southern Hemisphere climate in simulations of spontaneous Dansgaard-Oeschger-type oscillations, Geophys. Res. Lett., 52, e2024GL111473, https://doi.org/10.1029/2024GL111473, 2025. a
Ullman, D. J., LeGrande, A. N., Carlson, A. E., Anslow, F. S., and Licciardi, J. M.: Assessing the impact of Laurentide Ice Sheet topography on glacial climate, Clim. Past, 10, 487–507, https://doi.org/10.5194/cp-10-487-2014, 2014. a
Valdes, P. J., Armstrong, E., Badger, M. P. S., Bradshaw, C. D., Bragg, F., Crucifix, M., Davies-Barnard, T., Day, J. J., Farnsworth, A., Gordon, C., Hopcroft, P. O., Kennedy, A. T., Lord, N. S., Lunt, D. J., Marzocchi, A., Parry, L. M., Pope, V., Roberts, W. H. G., Stone, E. J., Tourte, G. J. L., and Williams, J. H. T.: The BRIDGE HadCM3 family of climate models: HadCM3@Bristol v1.0, Geosci. Model Dev., 10, 3715–3743, https://doi.org/10.5194/gmd-10-3715-2017, 2017. a
Van Westen, R. M., Kliphuis, M., and Dijkstra, H. A.: Physics-based early warning signal shows that AMOC is on tipping course, Science Advances, 10, eadk1189, https://doi.org/10.1126/sciadv.adk1189, 2024. a, b, c, d
Warken, S. F., Vieten, R., Winter, A., Spötl, C., Miller, T. E., Jochum, K. P., Schröder-Ritzrau, A., Mangini, A., and Scholz, D.: Persistent link between Caribbean precipitation and Atlantic ocean circulation during the last glacial revealed by a speleothem record from Puerto Rico, Paleoceanography and Paleoclimatology, 35, https://doi.org/10.1029/2020pa003944, 2020. a, b
Wickert, A. D.: Wickert2023-LaurentideGulfOfMexico: Isotopic Evidence for Laurentide Ice Sheet Advance and Retreat since the Last Glacial Maximum and Synthetic Paleodrainage History, Zenodo [code], https://doi.org/10.5281/zenodo.7681780, 2023. a
Wickert, A. D., Williams, C., Gregoire, L. J., Callaghan, K. L., Ivanović, R. F., Valdes, P. J., Vetter, L., and Jennings, C. E.: Marine-calibrated chronology of southern Laurentide ice sheet advance and retreat: ∼2,000-year cycles paced by meltwater–climate feedback, Geophys. Res. Lett., 50, e2022GL100391, https://doi.org/10.1029/2022GL100391, 2023. a, b, c, d, e, f, g
Wunsch, C. and Heimbach, P.: How long to oceanic tracer and proxy equilibrium?, Quaternary Sci. Rev., 27, 637–651, https://doi.org/10.1016/j.quascirev.2008.01.006, 2008. a
Yokoyama, Y., Esat, T. M., Thompson, W. G., Thomas, A. L., Webster, J. M., Miyairi, Y., Sawada, C., Aze, T., Matsuzaki, H., Okuno, J., Fallon, S., Braga, J. C., Humblet, M., Iryu, Y., Potts, D. C., Fujita, K., Suzuki, A., and Kan, H.: Rapid glaciation and a two-step sea level plunge into the last glacial maximum, Nature, 559, 603–607, https://doi.org/10.1038/s41586-018-0335-4, 2018. a
Yu, J., Oppo, D. W., Jin, Z., Lacerra, M., Ji, X., Umling, N. E., Lund, D. C., McCave, N., Menviel, L., Shao, J., and Xu, C.: Millennial and centennial CO2 release from the Southern Ocean during the last deglaciation, Nat. Geosci., 15, 293–299, https://doi.org/10.1038/s41561-022-00910-9, 2022. a
Zhang, W., Wu, J., Wang, Y., Wang, Y., Cheng, H., Kong, X., and Duan, F.: A detailed East Asian monsoon history surrounding the “Mystery Interval” derived from three Chinese speleothem records, Quaternary Res., 82, 154–163, https://doi.org/10.1016/j.yqres.2014.01.010, 2014. a
Zhang, X., Prange, M., Merkel, U., and Schulz, M.: Spatial fingerprint and magnitude of changes in the Atlantic meridional overturning circulation during marine isotope stage 3, Geophys. Res. Lett., 42, 1903–1911, https://doi.org/10.1002/2014GL063003, 2015. a
Zhou, Y. and McManus, J. F.: Heinrich event ice discharge and the fate of the Atlantic meridional overturning circulation, Science, 384, 983–986, https://doi.org/10.1126/science.adh8369, 2024. a
Zhu, J., Liu, Z., Zhang, J., and Liu, W.: AMOC response to global warming: dependence on the background climate and response timescale, Clim. Dynam., 44, 3449–3468, https://doi.org/10.1007/s00382-014-2165-x, 2015. a
Zhu, J., Liu, Z., Brady, E. C., Otto-Bliesner, B. L., Marcott, S. A., Zhang, J., Wang, X., Nusbaumer, J., Wong, T. E., Jahn, A., and Noone, D.: Investigating the direct meltwater effect in terrestrial oxygen-isotope paleoclimate records using an isotope-enabled Earth system model, Geophys. Res. Lett., 44, https://doi.org/10.1002/2017GL076253, 2017. a, b, c
Ziemen, F. A., Kapsch, M.-L., Klockmann, M., and Mikolajewicz, U.: Heinrich events show two-stage climate response in transient glacial simulations, Clim. Past, 15, 153–168, https://doi.org/10.5194/cp-15-153-2019, 2019. a