
the Creative Commons Attribution 4.0 License.
the Creative Commons Attribution 4.0 License.
 | 04 Aug 2026
Atmospheric pressure and anemological conditions in south-western Greenland in the second half of the 18th century
Konrad Chmist
Garima Singh
Andrzej Araźny
Rajmund Przybylak
Przemysław Wyszyński
Anemological and atmospheric pressure conditions were analysed based on two series (1767/68 and 1784–1792) of meteorological observations from Nuuk, the capital of Greenland, located on the island's south-western coast. The first series is the oldest long-term series of instrumental measurements available for the area around Nuuk. Meteorological observations were conducted using instructions and instruments provided by the Palatinate Meteorological Society. The materials used in this work come from European archives: Moravian Archives in Herrnhut (Germany) and Det Kgl. Bibliotek in Copenhagen (Denmark).
Wind speed, visually assessed by Moravian observers in a several-degree intensity scale, was compared to the Beaufort scale and, finally, recalculated to the presently used units (m s−1). Atmospheric pressure measurements had been taken using a mercury barometer with Paris inch scales, whereas air temperature had been measured with thermometers in Fahrenheit/Réaumur scales; these were recalculated to hPa and Celsius degrees, respectively. Monthly frequencies of occurrence of daily average atmospheric pressure values (stratified into various intervals describing the intensity of highs and lows) was examined, as were the magnitudes of day-to-day changes that affect the human body. Each year during the historical period, episodes of atmospheric pressure exceeding 1020 hPa occurred. Day-to-day changes were typically below 8 hPa, but changes exceeding 12 hPa occurred in almost every month. The annual and seasonal frequencies of winds from each of eight directions were exceptionally low for the SE direction (3 % to 12 %) and highest for winds from the NE (19 % to 37 %).
Atmospheric pressure in the historical period was 5.9 hPa lower than the contemporary period (1991–2020), while the average wind speed for both periods was 6.1 m s−1.
- Article
(4918 KB) - Full-text XML
-
Supplement
(639 KB) - BibTeX
- EndNote


As is well known, average air temperature values are rising all over the Earth. This process, called global warming, is currently most visible in the Arctic regions, where changes are occurring as much as several times faster than in other regions of our planet (Walsh et al., 2011; Jeffries et al., 2013; Przybylak and Wyszyński, 2020; IPCC, 2021). Understanding these changes in terms of both thermal conditions and other meteorological elements requires a thorough analysis of the climate in this region using the oldest available data through to present-day data. Obtaining a sufficiently long series of measurements covering the pre-industrial period will support the estimation of the extent to which currently observed climate changes are the result of natural changes or human impacts (Przybylak et al., 2024). A better understanding of the climatic conditions in the Arctic requires knowledge of the climatic conditions that prevailed in the past, (as described in, e.g., Przybylak, 2000; Wood and Overland, 2003, 2006, 2010; Przybylak and Vízi, 2005; Vinther et al., 2006; Demarée and Ogilvie, 2008, 2021; Miller et al., 2010; Przybylak et al., 2010, 2013, 2016, 2022, 2024; Nordli et al., 2014, 2020; Przybylak and Wyszyński, 2017; Araźny, 2019; Demarée et al., 2020; Chmist et al., 2025b; Singh et al., 2025).
The oldest meteorological data found so far for the Arctic come from Greenland – specifically, from the settlement of Nuuk (now the island's capital) in the south-west of the island. These data are taken from records of weather observations conducted using meteorological instruments by Moravian missionaries who had set up a religious mission in this area. The earliest surviving records of air pressure and wind measurements had a duration of almost 1 year (September 1767 to July 1768). After a long break, the next available series of such observations covers the period 1784–1792.
The thermal conditions in Nuuk for this period have already been described by Przybylak et al. (2024). Thus, the main goal of this work is to focus on less-studied meteorological variables for the south-western coast of Greenland in the second half of the 18th century – namely, atmospheric pressure and anemological conditions – and to compare them with the contemporary period (1991–2020).
2.1 Area
The coastline of south-western Greenland is densely indented with fjords. At the tip of one small (∼70-km-long) peninsula is present-day Nuuk (64°10′ N, 51°45′ W). The city is located about 20 km from the open ocean and about 120 km from the compact mass of the Greenland ice sheet (Fig. 1). The Moravian missionaries established their mission in an area that is now within the city of Nuuk, formerly also known as Neu-Herrnhut, Godthaab, Godthab or Godthåb (for more details see Przybylak et al., 2024; Araźny et al., 2026).
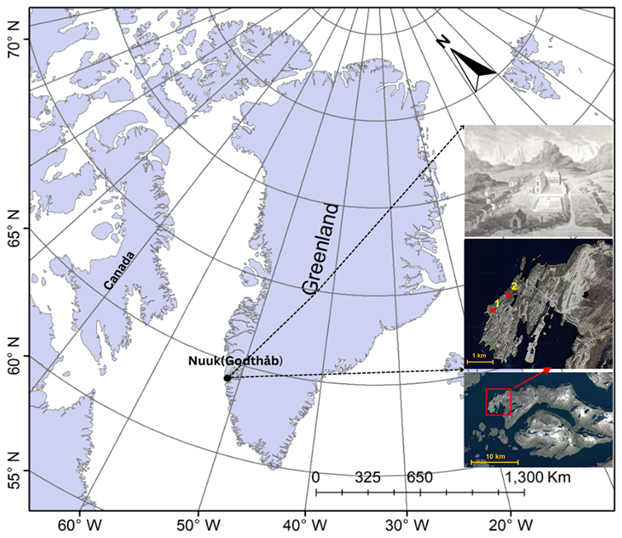
Figure 1Location of the study area. Explanation: 1 – Nuuk, historical; 2 – Nuuk, present-day; Upper photo – Nuuk (Neu-Herrnhut). Source: authors' own work, based on Google Earth ([2024], https://www.google.pl/earth/, last access: 16 October 2025). Map data for the location of sites: ©Google Earth; images ©2023 Maxar Technologies, ©2023 Airbus, and © 2023 Asiaq.
According to the Köppen–Geiger climate classification (Kottek et al., 2006), the climate in this part of the island is of the polar tundra climate type (ET – Tundra climate). As reported by Cappelen and Drost Jensen (2021) in their Greenland climate report, the mean annual air temperature for Nuuk in the contemporary period (1991–2020) is −1.0 °C. The warmest month is July (7.0 °C) and the coldest is February (−8.3 °C). Atmospheric pressure is at an annual average of 1006.9 hPa and ranges from 998.4 hPa for January to 1013.8 hPa for May. The annual average wind speed is 6.0 m s−1. The monthly average speeds are highest for January (7.1 m s−1) and lowest for July (4.9 m s−1). For most of the year, winds are northerly and north-easterly. In this study (Cappelen and Drost Jensen, 2021), both annual and monthly values were calculated from daily averages based on 24 hourly measurements per day.
2.2 Sources and data
The climatic conditions in SW Greenland were characterised using data from handwritten diaries containing records of meteorological measurements taken during the historical period. These materials were prepared by the Moravian missionaries, who were conducting missions at that time, including in Arctic areas. The aforementioned materials are kept in European archives: (1) Moravian Archives in Herrnhut (Germany), catalogue number MH R.15 J.a.13.9; (2) Det Kgl. Bibliotek in Copenhagen (Denmark), manuscript title Astronomiske og meteorologisk Iagttagelser, anstillede i Godthaab i Grønland 1782–1792. The records present two periods: (1) September 1767–July 1768; (2) September 1784–June 1792. This second period consisted of four shorter series: September 1784–June 1785, October 1786–June 1787, November–December 1788, January 1790–June 1792 (hereinafter, all series are often referred to collectively as those of the “historical period”).
The meteorological observations conducted by the Moravian brothers in Nuuk in 1767/68 were based on meteorological instruments (a thermometer and a barometer) provided by Christian Gottlieb Kratzenstein (1723–1795), Rector of the University of Copenhagen (Borm et al., 2021). Unfortunately, no information on the methods of these observations (e.g., location, exposition) has been found. The measurements in 1782–1792 used instruments provided by the Palatine Meteorological Society. The Society prepared instructions for conducting meteorological observations, which were also included in the publication Societas Meteorologica Palatina: Ephemerides Societatis Meteorologicae Palatinae 1781 (1783).
During the first historical sub-period (1767/68), observations were made twice a day: at 07:00 and 14:00. The parameters measured at that time were: air temperature (°F), atmospheric pressure (Paris inch and Paris line), wind direction (eight directions, N, NE, E, etc.) and wind force (6° scale, 1–6). One Paris inch is 27.07 mm long and corresponds to 12 Paris lines of 2.256 mm (Lamb, 1986). For this series, atmospheric pressure measurements began only on 26 October, whereas the air temperature series contains a break from 4–25 October. In the second sub-period (1784–1792), observations were made three times a day: at 07:00, 14:00 and 21:00 local time (LT). The measurements taken included: air temperature (°R), atmospheric pressure (Paris inches and Paris lines) and wind direction and wind force (this last having been measured on a scale of 1–4 that differs from that used during the first period). For the second period, there are no data on wind force for September 1784–June 1785, so the analyses herein ultimately cover the 1767/68 period and the years 1786–1792. All data used for this purpose have been published in the repository (https://doi.org/10.18150/XGCONO, Chmist et al., 2025a).
The work also uses contemporary data to compare against prevailing conditions in the historical period. These data come from the Danish Meteorological Institute (DMI) (Cappelen and Drost Jensen, 2021) and are available on their website (https://www.dmi.dk/publikationer/, last access: 14 July 2026). The range of the data used covers the period from January 1991 to December 2020, with a few gaps. The analyses were based on meteorological observations made at 07:00, 14:00 and 21:00 LT and included variables such as air temperature (°C), atmospheric pressure (hPa), wind speed (m s−1) and wind direction.
2.3 Methods
This work uses data on air temperature, atmospheric pressure, wind direction and wind force from Nuuk (Greenland) from 1767/68 and 1784–1792. They were quality controlled and then converted to modern units.
As mentioned earlier, we did not have information on the calibration required for the thermometers. Therefore, we decided to simply convert the historical thermometer's units to modern units. For the first stage of the historical period (1767/68), temperature was converted from °F to °C, whereas for the second period (1784–1792) it was converted from °R to °C. For atmospheric pressure, measurements were taken using barometers with a scale in Paris inches and Paris lines. The results were converted to mmHg and then to hPa. Corrections were applied to the resulting data, enabling comparison between historical and contemporary data. A normal gravity correction (Pφ corr) (i.e., pressure reduction consistent with gravity values observed at an altitude of 0 m above sea level and a latitude of φ=45° N) was applied, and the pressure was converted to sea-level altitude (SLP) using the formulas provided in Cappelen (2009). For more details, see Przybylak et al. (2013).
Temperature and pressure records taken from a barometer equipped with a thermometer are also available for Nuuk for the period from November 1788 to June 1792. These measurements allowed the correction of atmospheric pressure to a temperature value of 0 °C. For this purpose, the Kämtz formula provided in Können et al. (2003) was applied. For more details, see Przybylak et al. (2013). The obtained correction values averaged for individual months (Table S1 in the Supplement) were used to correct the remaining atmospheric pressure data at Nuuk.
Wind speed and direction measurements were used to analyse anemological conditions in Nuuk. Wind direction did not require conversion because it was recorded using wind rose directions. The greatest challenge in meteorological observations was measuring wind force, which was recorded using numerical scales. The sources do not provide information on which speed corresponds to a given scale value, but they do describe the conditions around the stations that should occur for each wind category. These historical categories were then compared with descriptions of conditions for each Beaufort scale category (García-Herrera et al., 2003). This allowed for the conversion of wind force from numerical scales of 1–6 and 0–4 to m s−1. The obtained results provide information about wind speed at a height of 10 m above ground level. In the contemporary period, “calm” was defined as wind speeds below 0.3 m s−1.
Based on available data, an analysis of atmospheric pressure values and anemological conditions was conducted for the historical period (1767/68; 1784–1792) and the contemporary period (1991–2020). For atmospheric pressure, the course of daily and monthly mean and extreme values were examined. Furthermore, the monthly frequency and day-to-day variation of individual atmospheric pressure events were presented for each year and for the entire periods (historical and contemporary). Day-to-day changes in atmospheric pressure can be bothersome. Depending on the intensity of the changes, they can be felt as weak (≤4.0 hPa), moderate (4.1–8.0 hPa), strong (8.1–12.0 hPa) or very strong (>12.0 hPa).
Wind speeds (as with atmospheric pressure) were examined in terms of daily and monthly averages and extreme values. Observed wind directions were compared against contemporary measurements, with the analyses covering individual months, entire seasons and multi-year periods. The article also presents how observed wind direction correlates with air temperature and with atmospheric pressure.
3.1 Atmospheric pressure conditions
The atmospheric pressure data for the 1784–1792 sub-period at Nuuk reveal significant seasonal and interannual variations. The highest individual observed atmospheric pressures (Pmax,abs) occurred in late winter and spring (February–May), with some values exceeding 1030 hPa (Table 1). Conversely, the lowest pressures were recorded in autumn and early winter, falling below 975 hPa. The mean monthly maximum (Pmax) and minimum (Pmin) pressure values, calculated from the mean of the daily (respectively) maximum and minimum atmospheric pressures showed their greatest fluctuations in winter and spring months. For instance, in April 1791, the mean maximum pressure (Pmax) was 1004.2 hPa, and the mean minimum pressure (Pmin) was 995.9 hPa. The mean monthly atmospheric pressure (P) during the year varied within a relatively narrow range, usually oscillating around 1000 hPa. For example, in 1791, it ranged from 1001.9 hPa in December to 1003.8 hPa in April. The winter months were characterised by greater variability compared to the more stable summer months (Table S2).
Table 1Annual (Septmber–August), seasonal (SON, DJF, MAM, JJA) and monthly mean (P), maximum (Pmax) and minimum (Pmin) values, and highest (Pmax,abs) and lowest (Pmin,abs) observed atmospheric pressure values (hPa) at Nuuk in historical sub-period 1784–1792.

Explanations: SD – standard deviation.
The values Pmax,abs and Pmin,abs represent (respectively) the absolute highest and lowest individual atmospheric pressure values measured at a given station during the analysed period. During the multi-year sub-period 1784 to 1792, Pmax abs reached 1036.2 hPa on 6 April 1791 at 07:00, whereas Pmin,abs was 961.2 hPa on 22 January 1790 at 14:00 Mean monthly pressure (P) values fluctuated around 1002.9 hPa throughout the sub-period, with the highest values generally occurring in spring and winter and the lowest in late autumn and early winter. The standard deviation values further highlight that the winter and spring seasons underwent the highest fluctuations in pressure (Table 1).
The frequency distribution of Nuuk's average daily atmospheric pressure values reveals distinct seasonal and interannual variations – during both the historical period (1767/68; 1784–1792) and the contemporary period (1991–2020) (Fig. 2). The classification follows predefined pressure thresholds. Across all years, weak low-pressure conditions (991–1005 hPa) and normal pressure conditions (1006–1020 hPa) dominated, particularly during autumn and winter. In contrast, strong high-pressure events (≥1021 hPa) were more frequent in spring and summer, with occasional occurrences of very strong highs (>1035 hPa), as seen in 1790–1791. Notably, 1790–1791 displayed increased variability, with the appearance of a small fraction of extremely strong highs and extremely weak lows. The seasonal progression highlights a pattern consistent with large-scale atmospheric circulation in the Arctic, with low-pressure systems being more prominent in winter, whereas high-pressure systems stabilise in summer. Contrasting the full historical period with the contemporary one (1991–2020) hints at a possible gradual change. The latest figures reflect an upsurge in normal pressure situations across the year and a steadier display of strong high-pressure systems, mainly in the spring and summer months. At the same time, weaker low-pressure systems (especially very weak lows) seem to occur less frequently in the contemporary period.
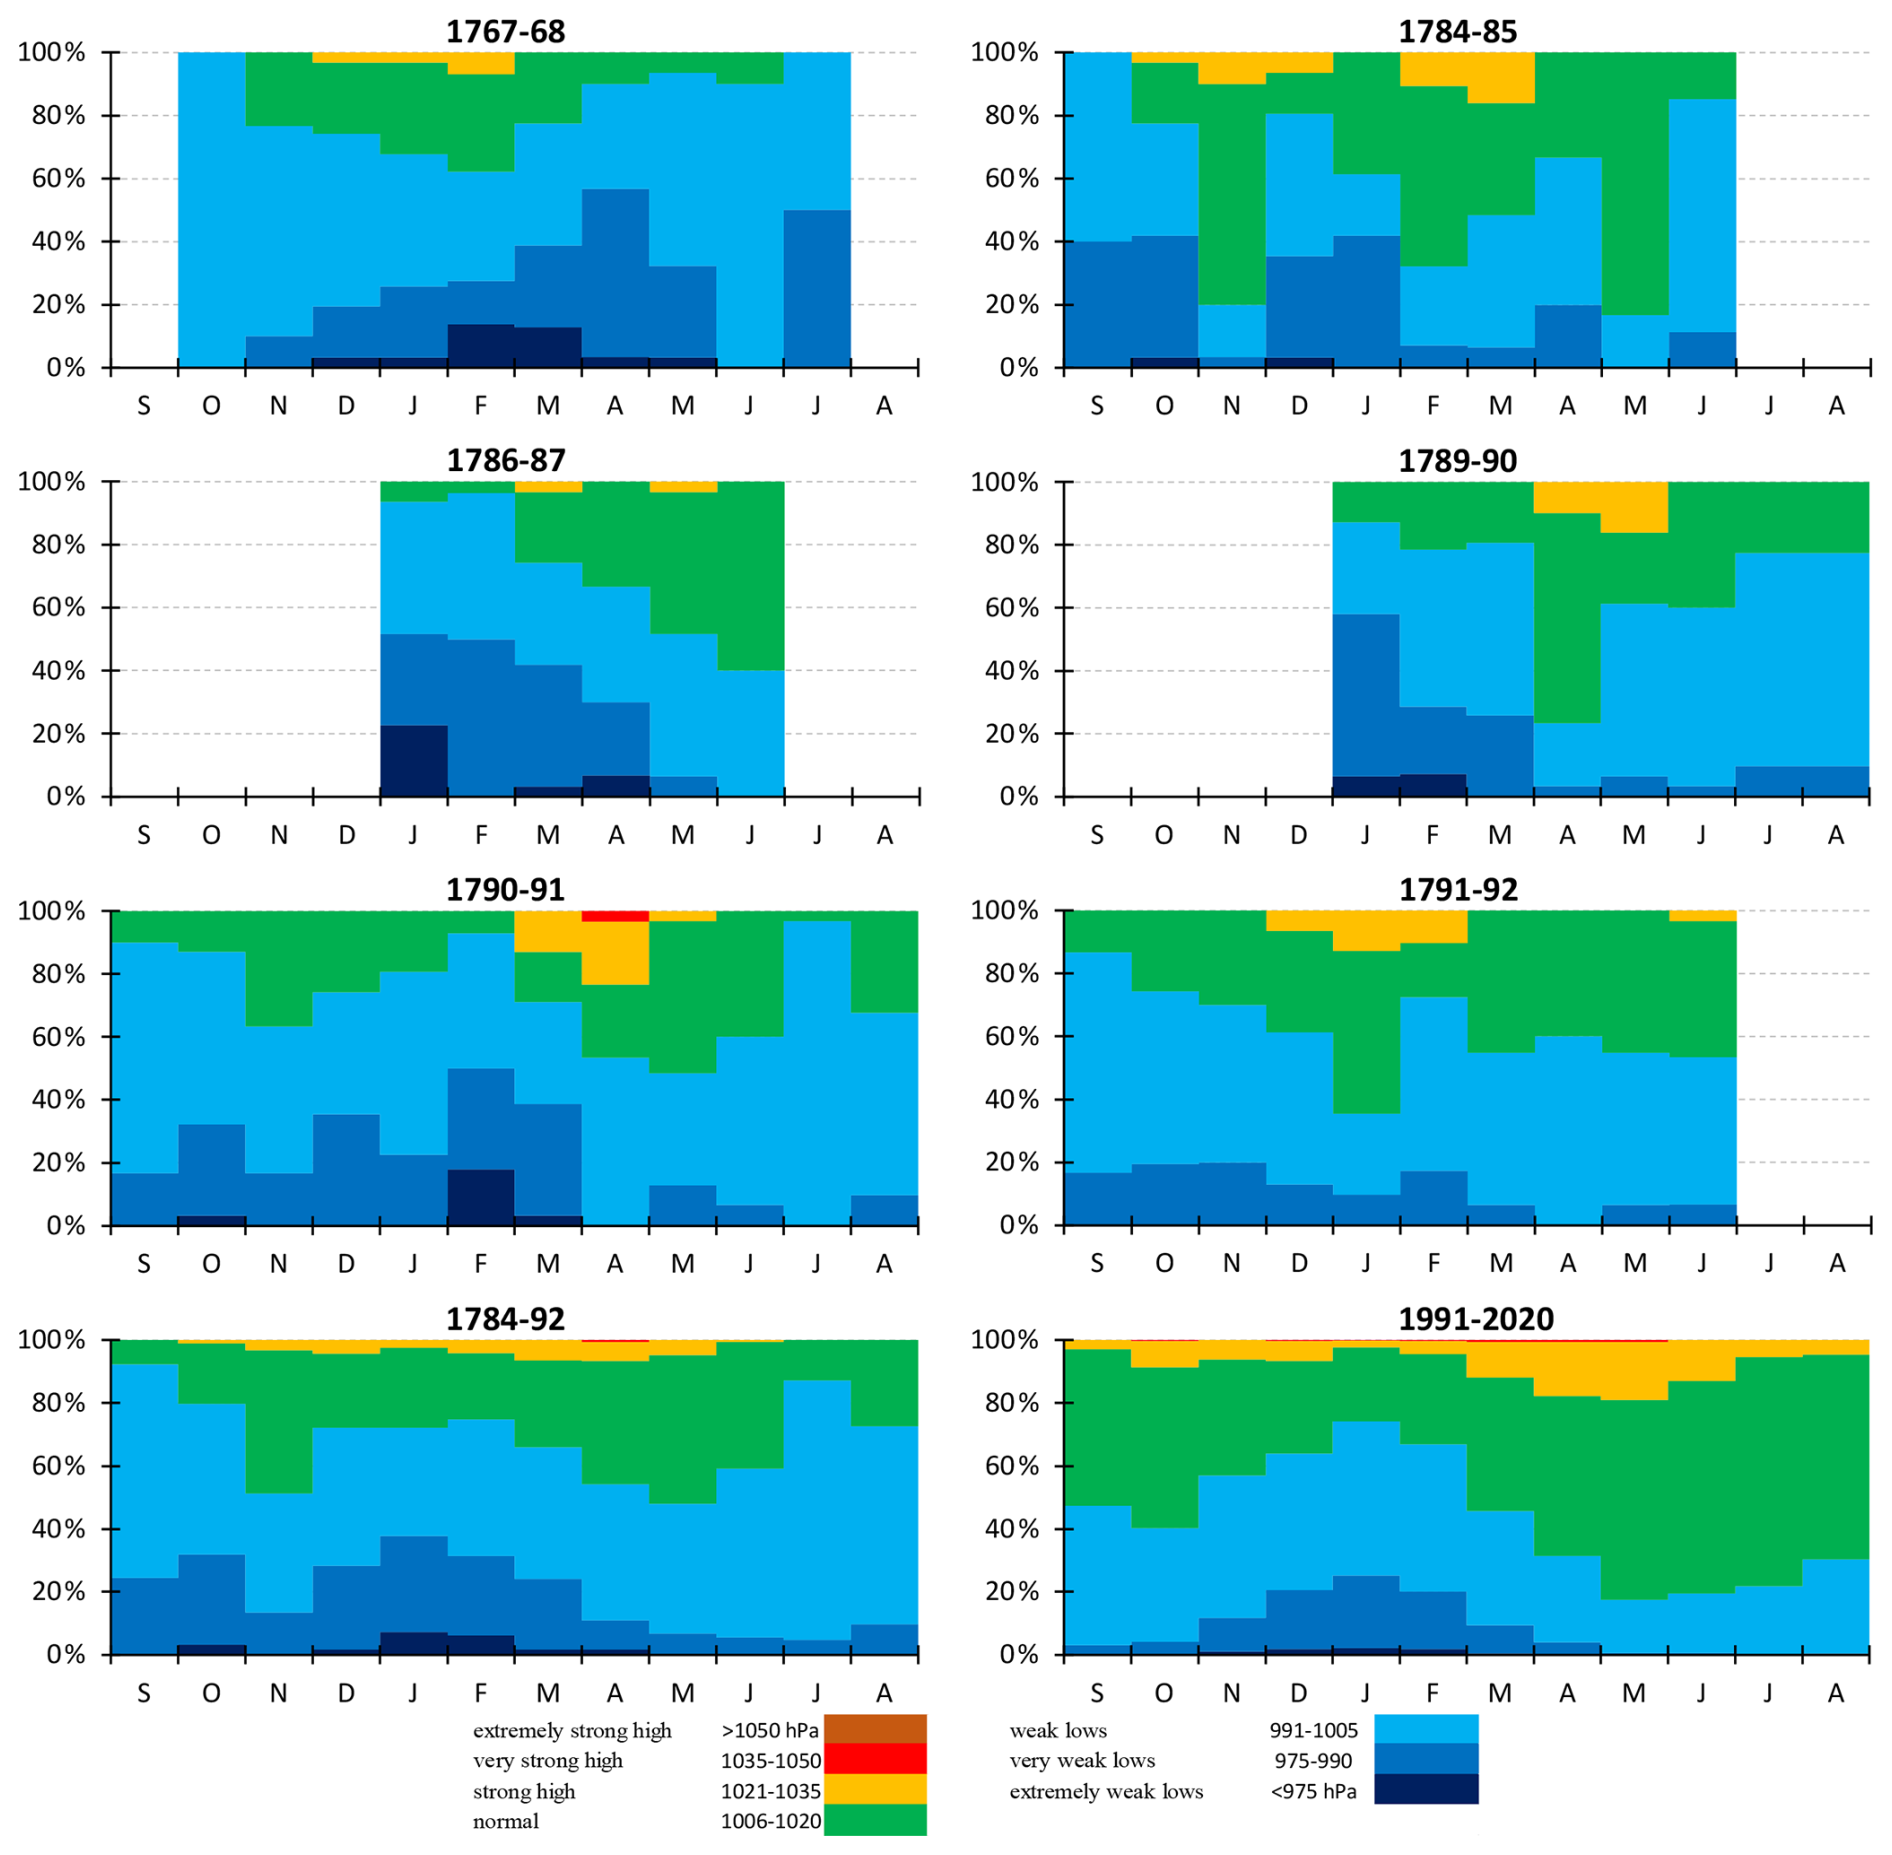
Figure 2Frequency classes of average daily atmospheric pressure values for Nuuk (according to daily averages) for the historical period (according to the thresholds). Graph for individual months, seasons and years, cumulated to 100 %.
The day-to-day atmospheric pressure variations were calculated based on the day-to-day difference between daily mean values. Nuuk's historical and contemporary day-to-day variations in atmospheric pressure are categorised according to specific pressure thresholds in Fig. 3.
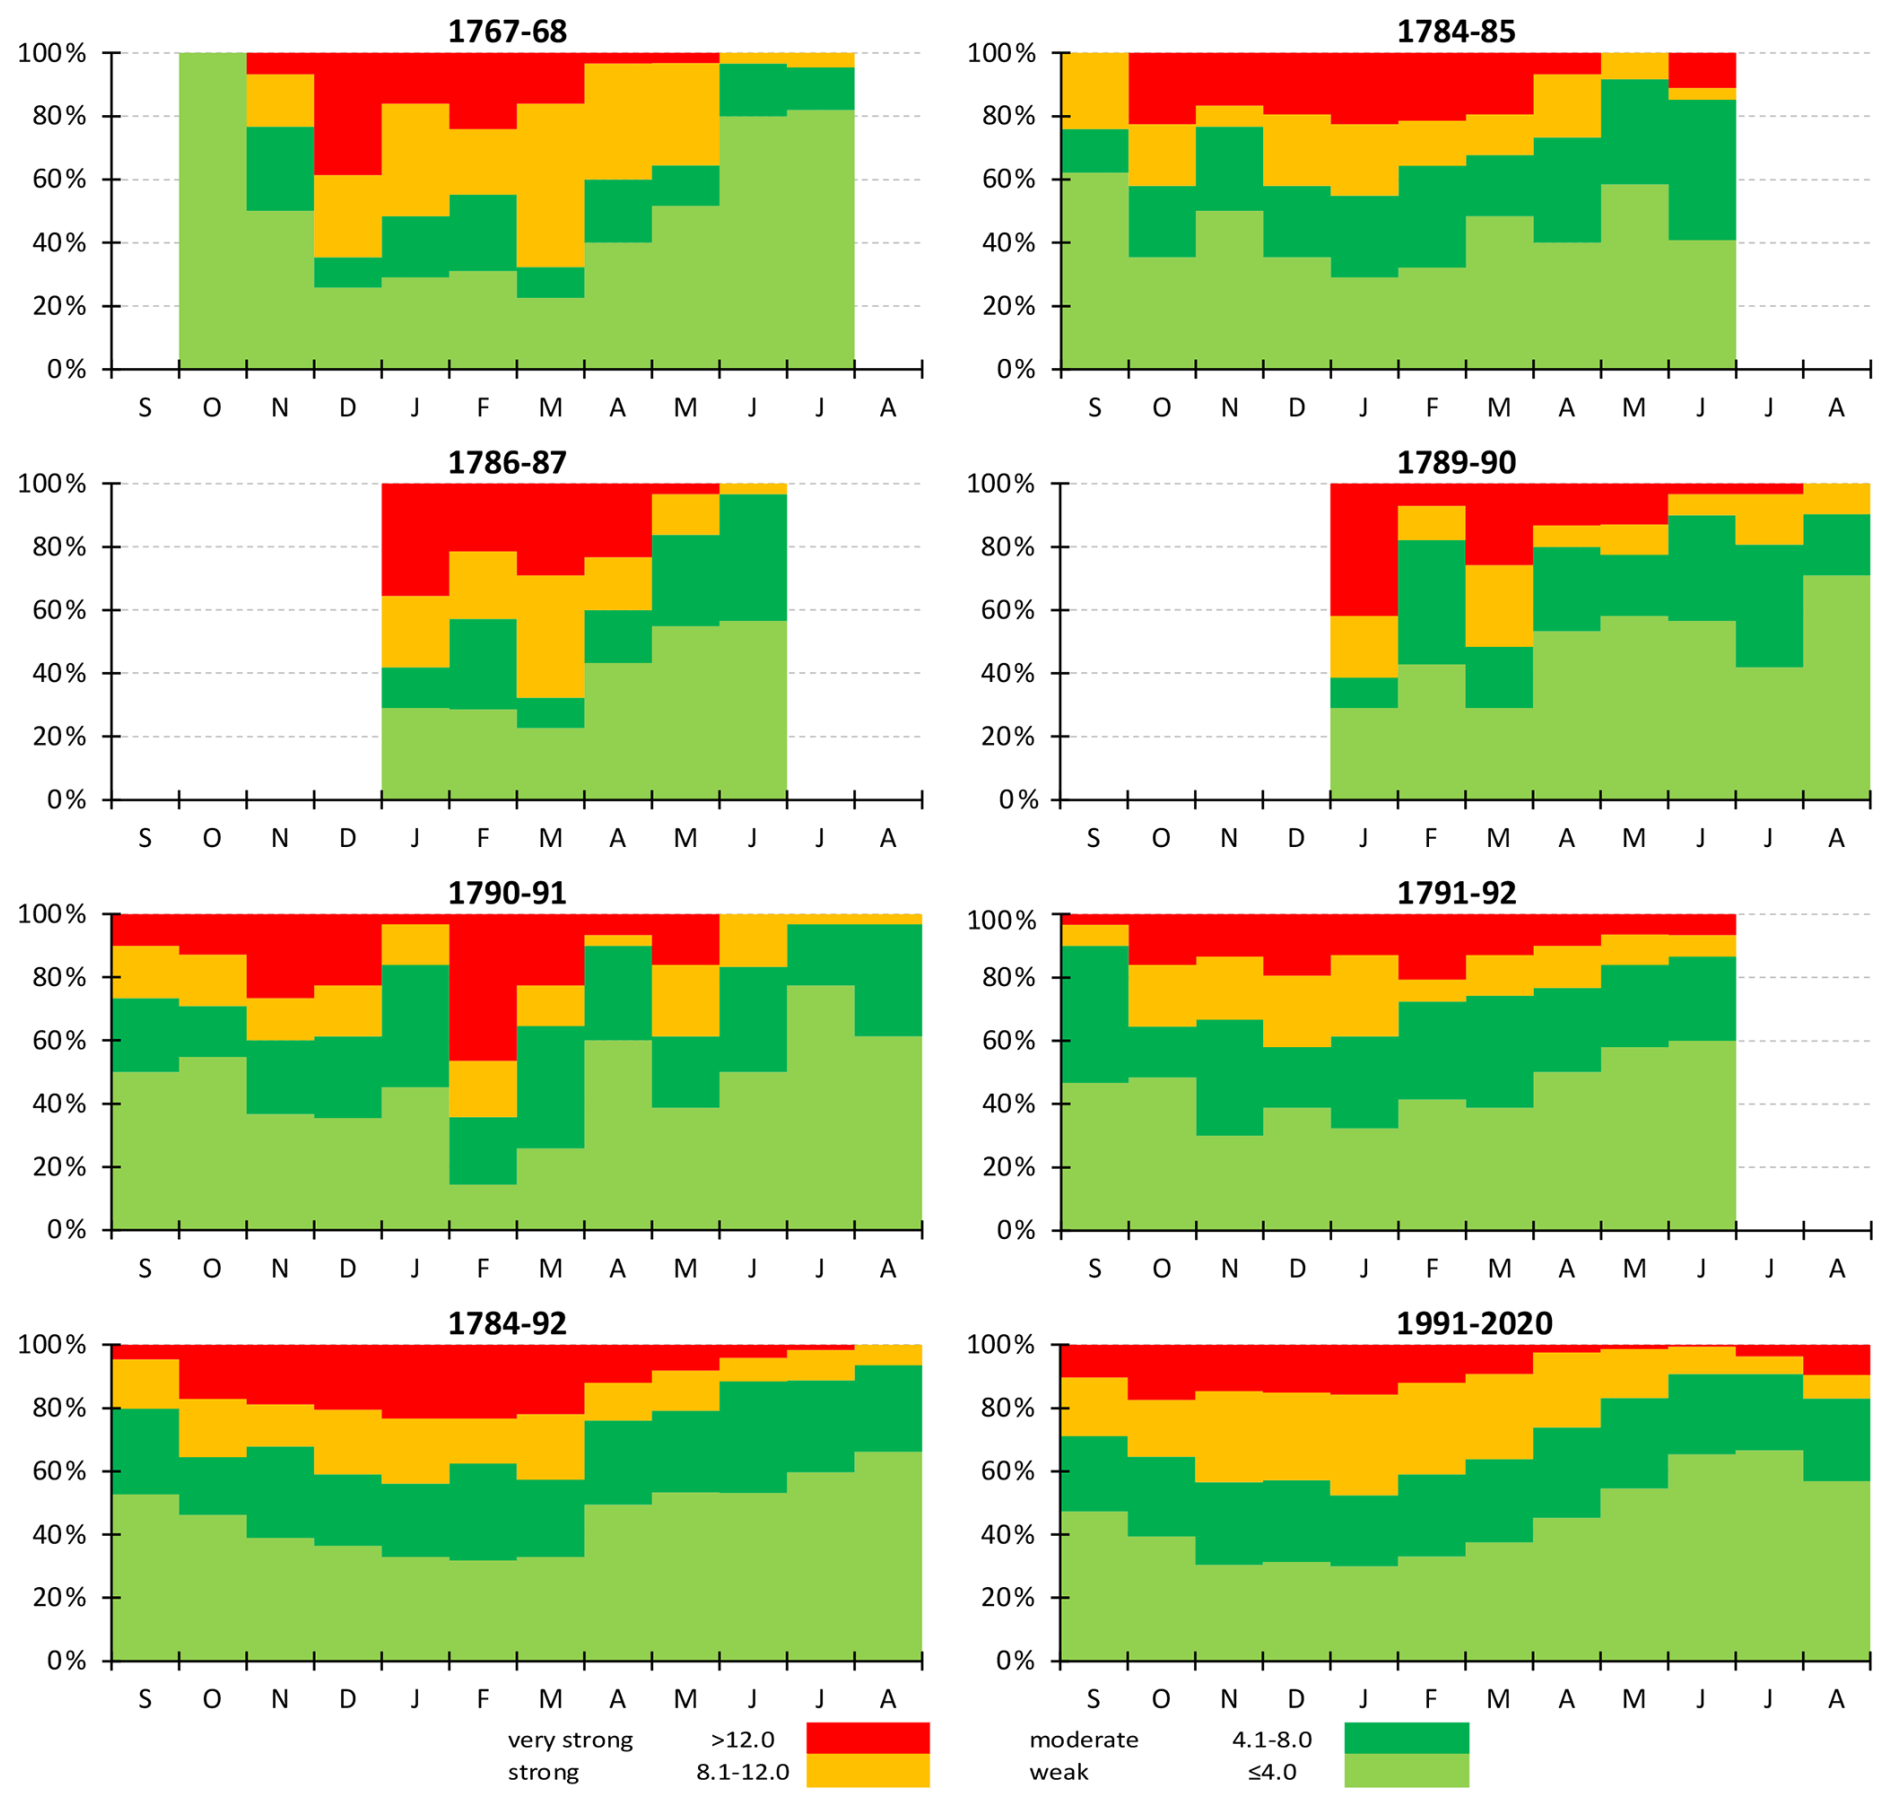
Figure 3Day-to-day variations in atmospheric pressure for the historical period Nuuk (according to daily averages). Graph for individual months, seasons and years, cumulated to 100 %. Explanations: Human perceptions of day-to-day changes in atmospheric pressure: weak, moderate, strong, very strong.
Compared to the historical period, the modern era shows a tendency towards a higher frequency of days characterised by weak and moderate day-to-day pressure variations. Conversely, days exhibiting strong and very strong day-to-day pressure variations appear to be less frequent in the 1991–2020 period compared to some parts of the historical record. This means that, in the contemporary period, the frequency of the human sensation of changes in atmospheric pressure has been lower than in the historical period (Fig. 3).
In the annual cycle of average daily atmospheric pressure values (Fig. 4), during the historical period, the daily mean atmospheric pressure in Nuuk typically ranged approximately from 985 to 1015 hPa. Lower pressure values were more frequent during the autumn and winter months, indicating of a more significant influence of cyclonic activity, whereas higher pressure values were more common in late winter and spring, suggesting periods of greater atmospheric stability. The use of an 11-d moving average to “smooth” the historical series facilitated comparison with the contemporary period. The years 1991–2020 clearly show higher average daily atmospheric pressure throughout the year. The typical range of daily averages for the contemporary period is between 1000 and 1020 hPa, which represents a clear increase in pressure. Though a seasonal cycle of lower pressures in autumn and winter and higher pressures in warmer months persists, it occurs at these elevated pressure levels.
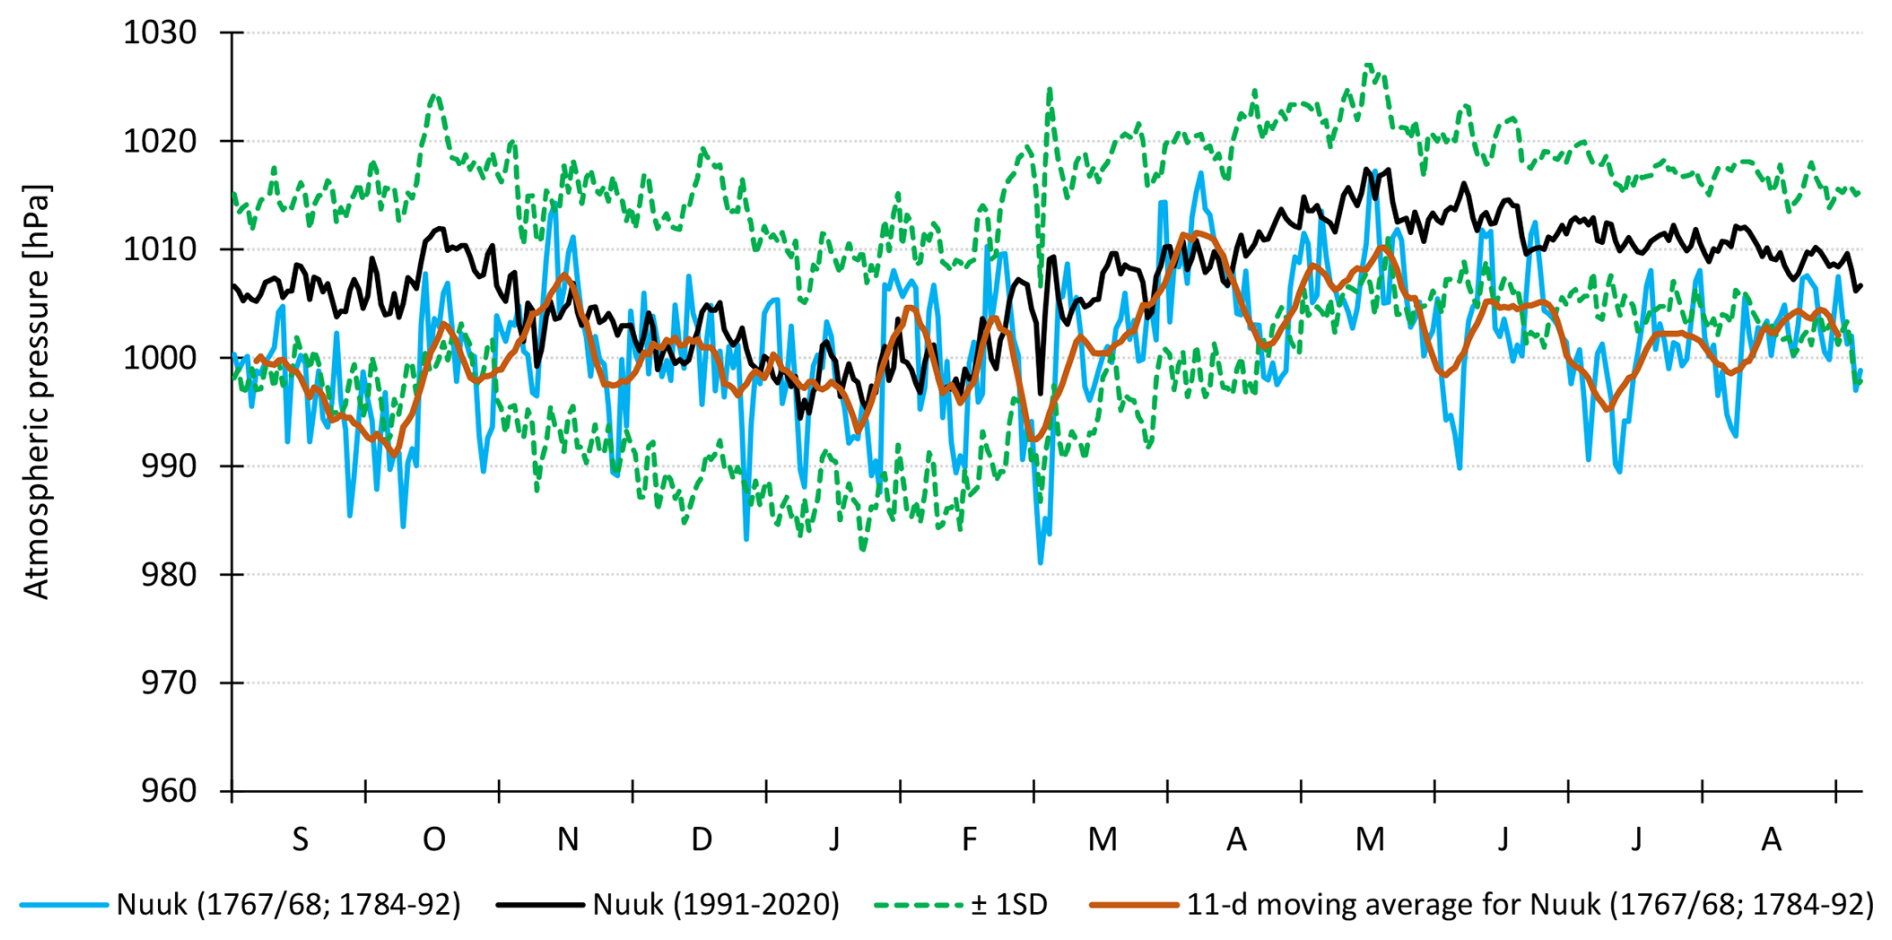
Figure 4Annual course of daily means of atmospheric pressure and 11-d moving average at Nuuk in the historical (1767/68; 1784–1792) and contemporary (1991–2020) periods, along with the standard deviation. Explanations: SD – standard deviation (±1 SD).
3.2 Anemological conditions
3.2.1 Wind speed
The multi-year average monthly wind speeds (V) at the Nuuk station were calculated from daily average wind speeds, based on the arithmetic mean of three measurements taken over the 24-h period. During the historical period the mean monthly wind speed ranged from 4.8 m s−1 in August to 7.3 m s−1 in September. During the years analysed, in almost every month (except August), a wind speed of 30.5 m s−1 was measured, as evidenced by Vmax,abs. This was the highest value that could be recorded. For seasonal values, the highest average speeds (V) occurred in autumn. The highest average of daily maximums (Vmax) occurred in winter, whereas the lowest average of daily minimums (Vmin) was recorded in summer (Table 2).
Table 2Annual (September–August), seasonal (SON, DJF, MAM, JJA) and monthly mean (V), maximum (Vmax) and minimum (Vmin) values, and highest (Vmax,abs) and lowest (Vmin,abs) observed wind speed values (m s−1) at Nuuk in the historical period (1767/68; 1786–1792).

Explanations: SD – standard deviation.
In the historical period, complete data for the entire measurement year (September–August) were available in only one instance (1790/91). Therefore, we decided to focus analysis based on the average of the six months for which data were most frequently available (January–June) (Table S3). In this way, individual years can also be compared. Based on the designated half-year, the period of highest wind speeds occurred in 1787 (7.0 m s−1), and the lowest speeds occurred in 1792 (5.4 m s−1) (Table S3).
A comparison of average monthly wind speeds shows a similarity in values between the historical and contemporary periods, and their differences do not exceed 2.0 m s−1 (Fig. 5). In the years 1991–2020, average monthly wind speed values ranged from 4.8 m s−1 in July to 7.1 m s−1 in January. For both periods, the annual mean values are 6.1 m s−1 (Tables 2, S4). This does not mean, however, that, over the annual cycle, wind speeds fluctuated the same in the historical period as in the contemporary period. The two periods both exhibited their lowest mean monthly speeds (Vmin) in summer, reaching 4.8 m s−1. However, in the 18th century, the month with the weakest winds was July, whereas in the contemporary period it was August. An even greater difference is evident in the highest speeds (Vmax), which were recorded in September during the historical period and in January during the comparative period.
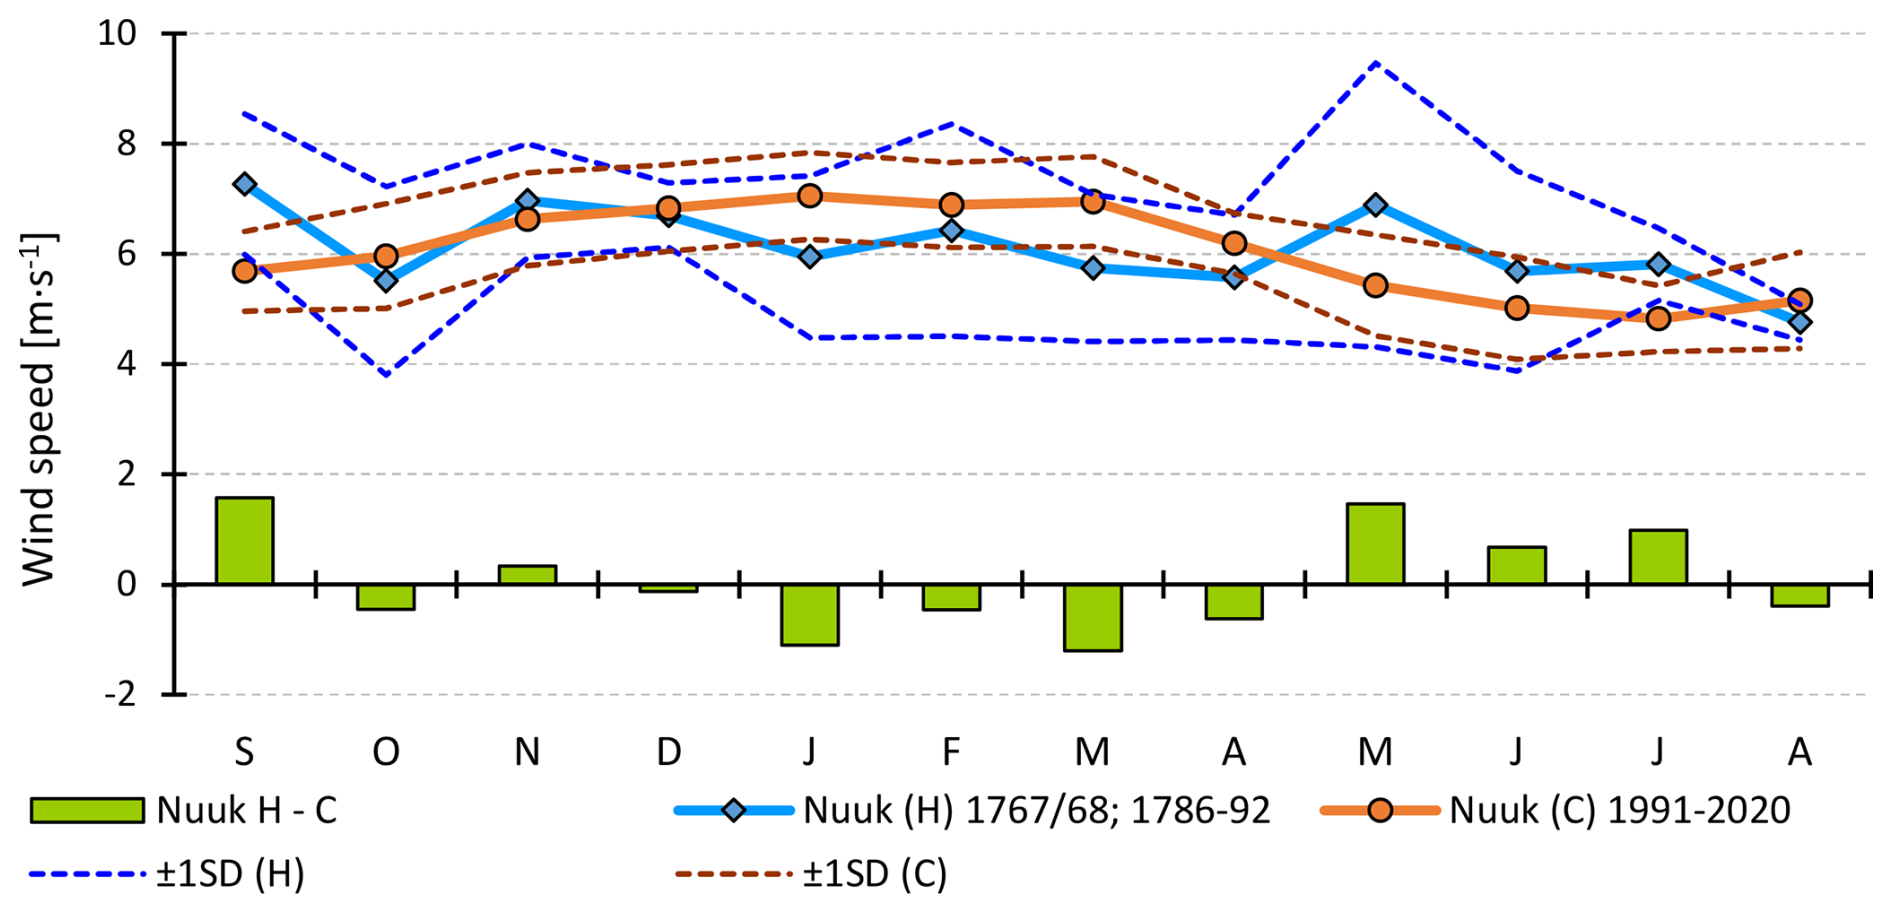
Figure 5Annual course of monthly means of wind speed at Nuuk in the historical (H) (1767/68; 1786–1792) and the contemporary (C) (1991–2020) periods, with standard deviation. Explanations: bars – differences in monthly mean values between stations from the historical and contemporary periods, ±1 SD (H) – standard deviation for the historical period, ±1 SD (C) – standard deviation for the contemporary period.
The annual cycle of daily average wind speed values at Nuuk in the historical period is largely similar to that of the contemporary period (Fig. 6). In the contemporary period, the course is more even, which is attributable to the length of the measurement series (30 years).
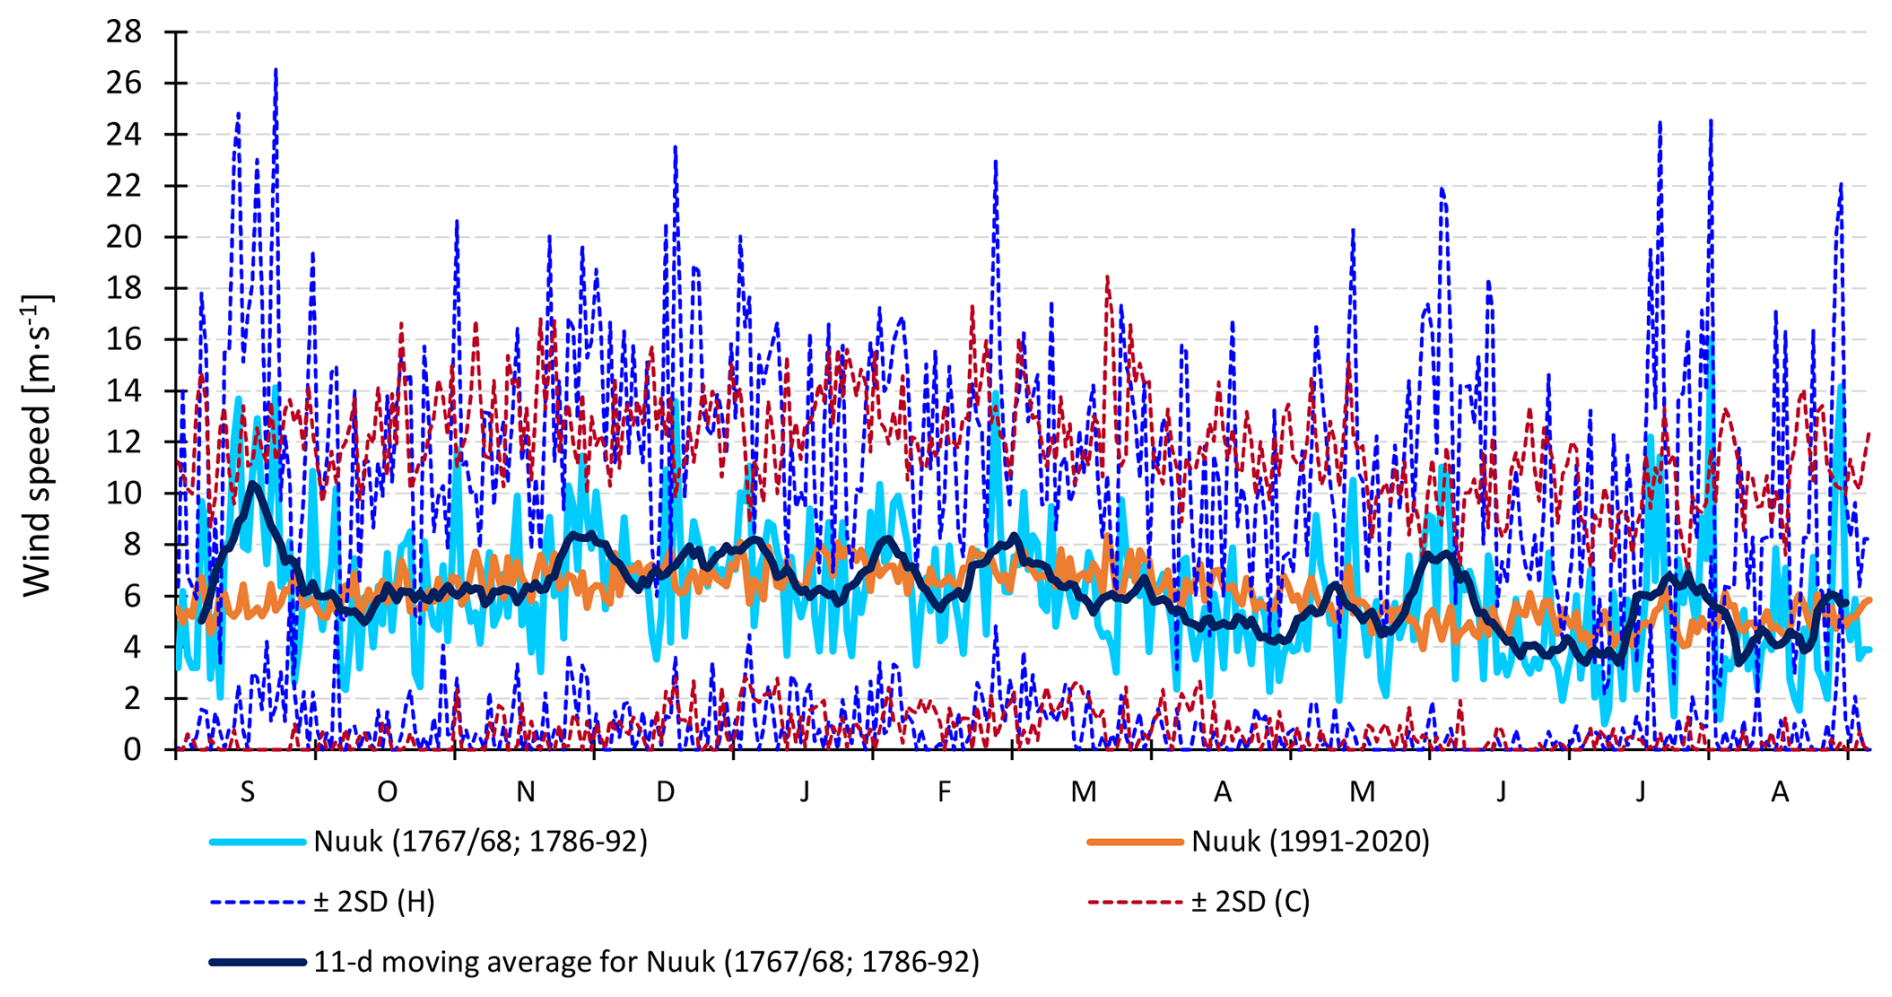
Figure 6Annual cycle of daily means of wind speed and 11-d moving average at Nuuk in the historical (1767/68; 1786–1792) and contemporary (1991–2020) periods. Explanations: ±2 SD – 2 standard deviation for the historical period, ±2 SD (C) – 2 standard deviation for the contemporary period.
Wind speeds in this period oscillate from 4.0 to 8.4 m s−1. For the historical period, the data have a much larger range (1.0 to 16.0 m s−1), but the vast majority fall within ±2 standard deviations, and the speeds rarely exceed the range of 2.0 to 10.0 m s−1 (Fig. 6).
3.2.2 Wind direction
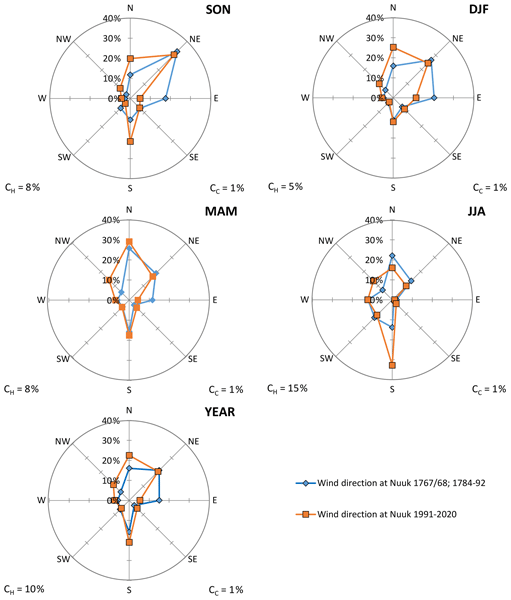
Analysing the wind directions in the historical and contemporary periods, eight-way wind roses were made to show their frequencies (Fig. 7). In the years 1767/68 and 1784–1792, the most common wind direction was north-easterly (21 % of cases), followed by northerly and easterly (16 % and 15 % of cases, respectively). In total, the wind from the N-NE-E sector accounted for 52 % of all measurements. Another distinctive direction was southerly, which accounted for 16 % of measurements. Calm accounted for 10 % of observations. In comparison, in the years 1991–2020, the most common winds were northerlies (23 % of cases), while winds from the NW-N-NE sector constituted 54 % of all records. Similarly to the historical period, wind from the south had a significant share, accounting for 21 % of measurements. However, calm was recorded in only 1 % of cases in the contemporary period (Fig. 7, Table S5).
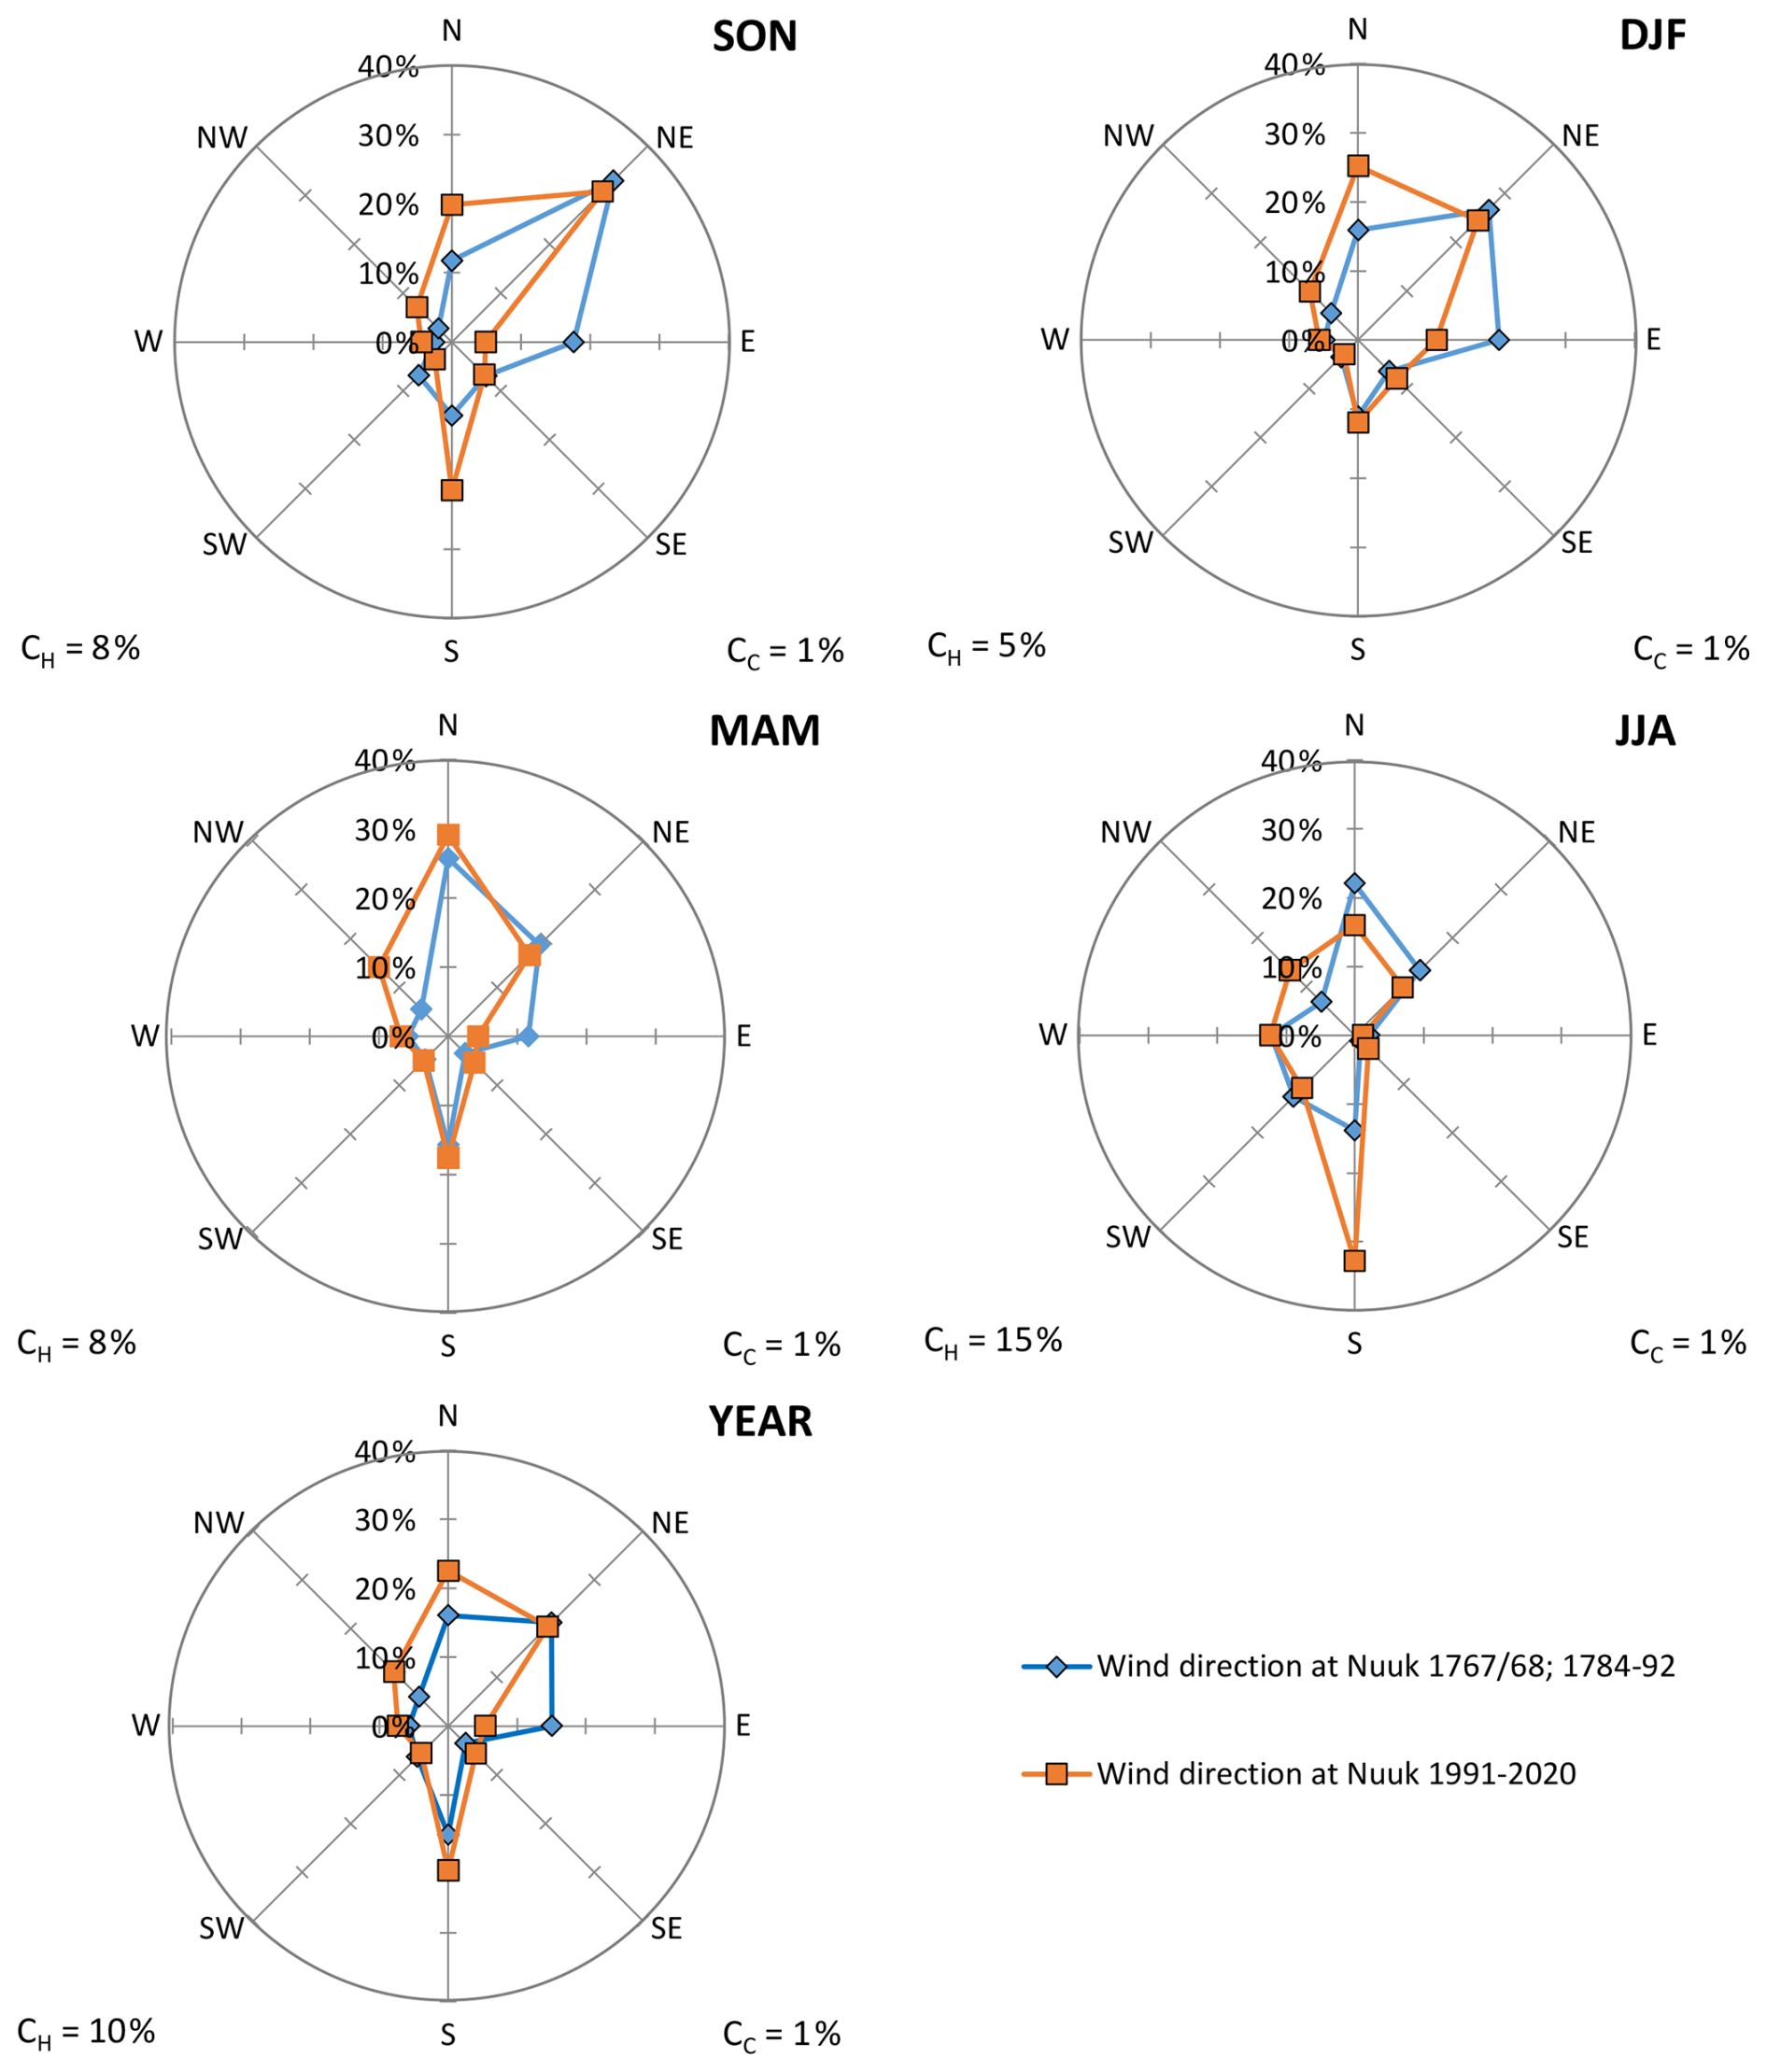
Figure 7Seasonal (SON, DJF, MAM, JJA) and annual (YEAR) frequencies (in %) of wind directions and calms (C) at Nuuk in historical (1767/68; 1784–1792) and contemporary (1991–2020) periods.
From a seasonal perspective, in the historical period, winds from the northerly to easterly directions (N-NE-E) were the most frequent in autumn, winter, and spring, constituting, respectively, 63 %, 63 %, and 57 % of all winds. In summer, the frequency of these directions was significantly weaker, but still constituted 37 % of measurements. During summer, winds from the southerly-to-westerly sector (S-SW-W) prevailed over the N-NE-E sector, reaching 39 % of cases. In autumn, winter and spring, these accounted for 21 %, 19 % and 27 %, respectively. In the contemporary period, the dominant sectors from which the wind blew were northerly to easterly (N-NE-E) and northerly (NW-N-NE). From autumn to spring, the northerly sector constituted from 58 % to 60 % of all measurements. As in the historical period, summer differed from the other seasons, with southerly to westerly (S-SW-W) directions dominating, but with a greater frequency of 56 % (Fig. 7, Table S5).
The frequency of wind directions in the historical period can be analysed on a monthly basis (Table S6). The most frequently observed wind direction was north-easterly (21.1 % of cases). This direction dominated in five months, from September to February (excluding December, in favour of the southerly direction, which also dominated in June and August). The second most frequently occurring wind direction was from the north, which from March to May and in July was the most frequently observed (Table S6). Anemological conditions at the analysed station are largely dependent on the orography of the area. The wind here blows mainly along the coast (which runs N/NE–S), which is consistent with the conclusions drawn by Vizi (2008), who described, among others, anemological conditions in northern Canada.
3.2.3 Wind direction vs. air temperature
Using air temperature measurements taken during anemological observations, we were able to determine the relationship between air temperature differences and wind direction. For this purpose, as in the previous analyses, eight-way wind roses were used (Fig. 8). The mean annual air temperature at the Nuuk station during the historical period was −2.3 °C. The lowest air temperature values were associated with winds from the north and north-east (NW-N-NE-E), during which, the annual mean air temperatures ranged on average from −3.9 to −6.0 °C. The highest temperatures were recorded during southerly and south-westerly (S-SW) winds, being 1.0 and 0.3 °C, respectively. In the contemporary period, the mean annual air temperature was higher and reached −0.8 °C. The lowest annual mean air temperatures occurred during winds from similar directions as in the historical period (NW-N-NE-E), though air temperature ranged from −1.6 to −4.4 °C. The highest annual mean air temperatures were measured (as in the historical period) during southerly and south-westerly winds (2.5 and 1.6 °C, respectively) (Fig. 8, Table S7).
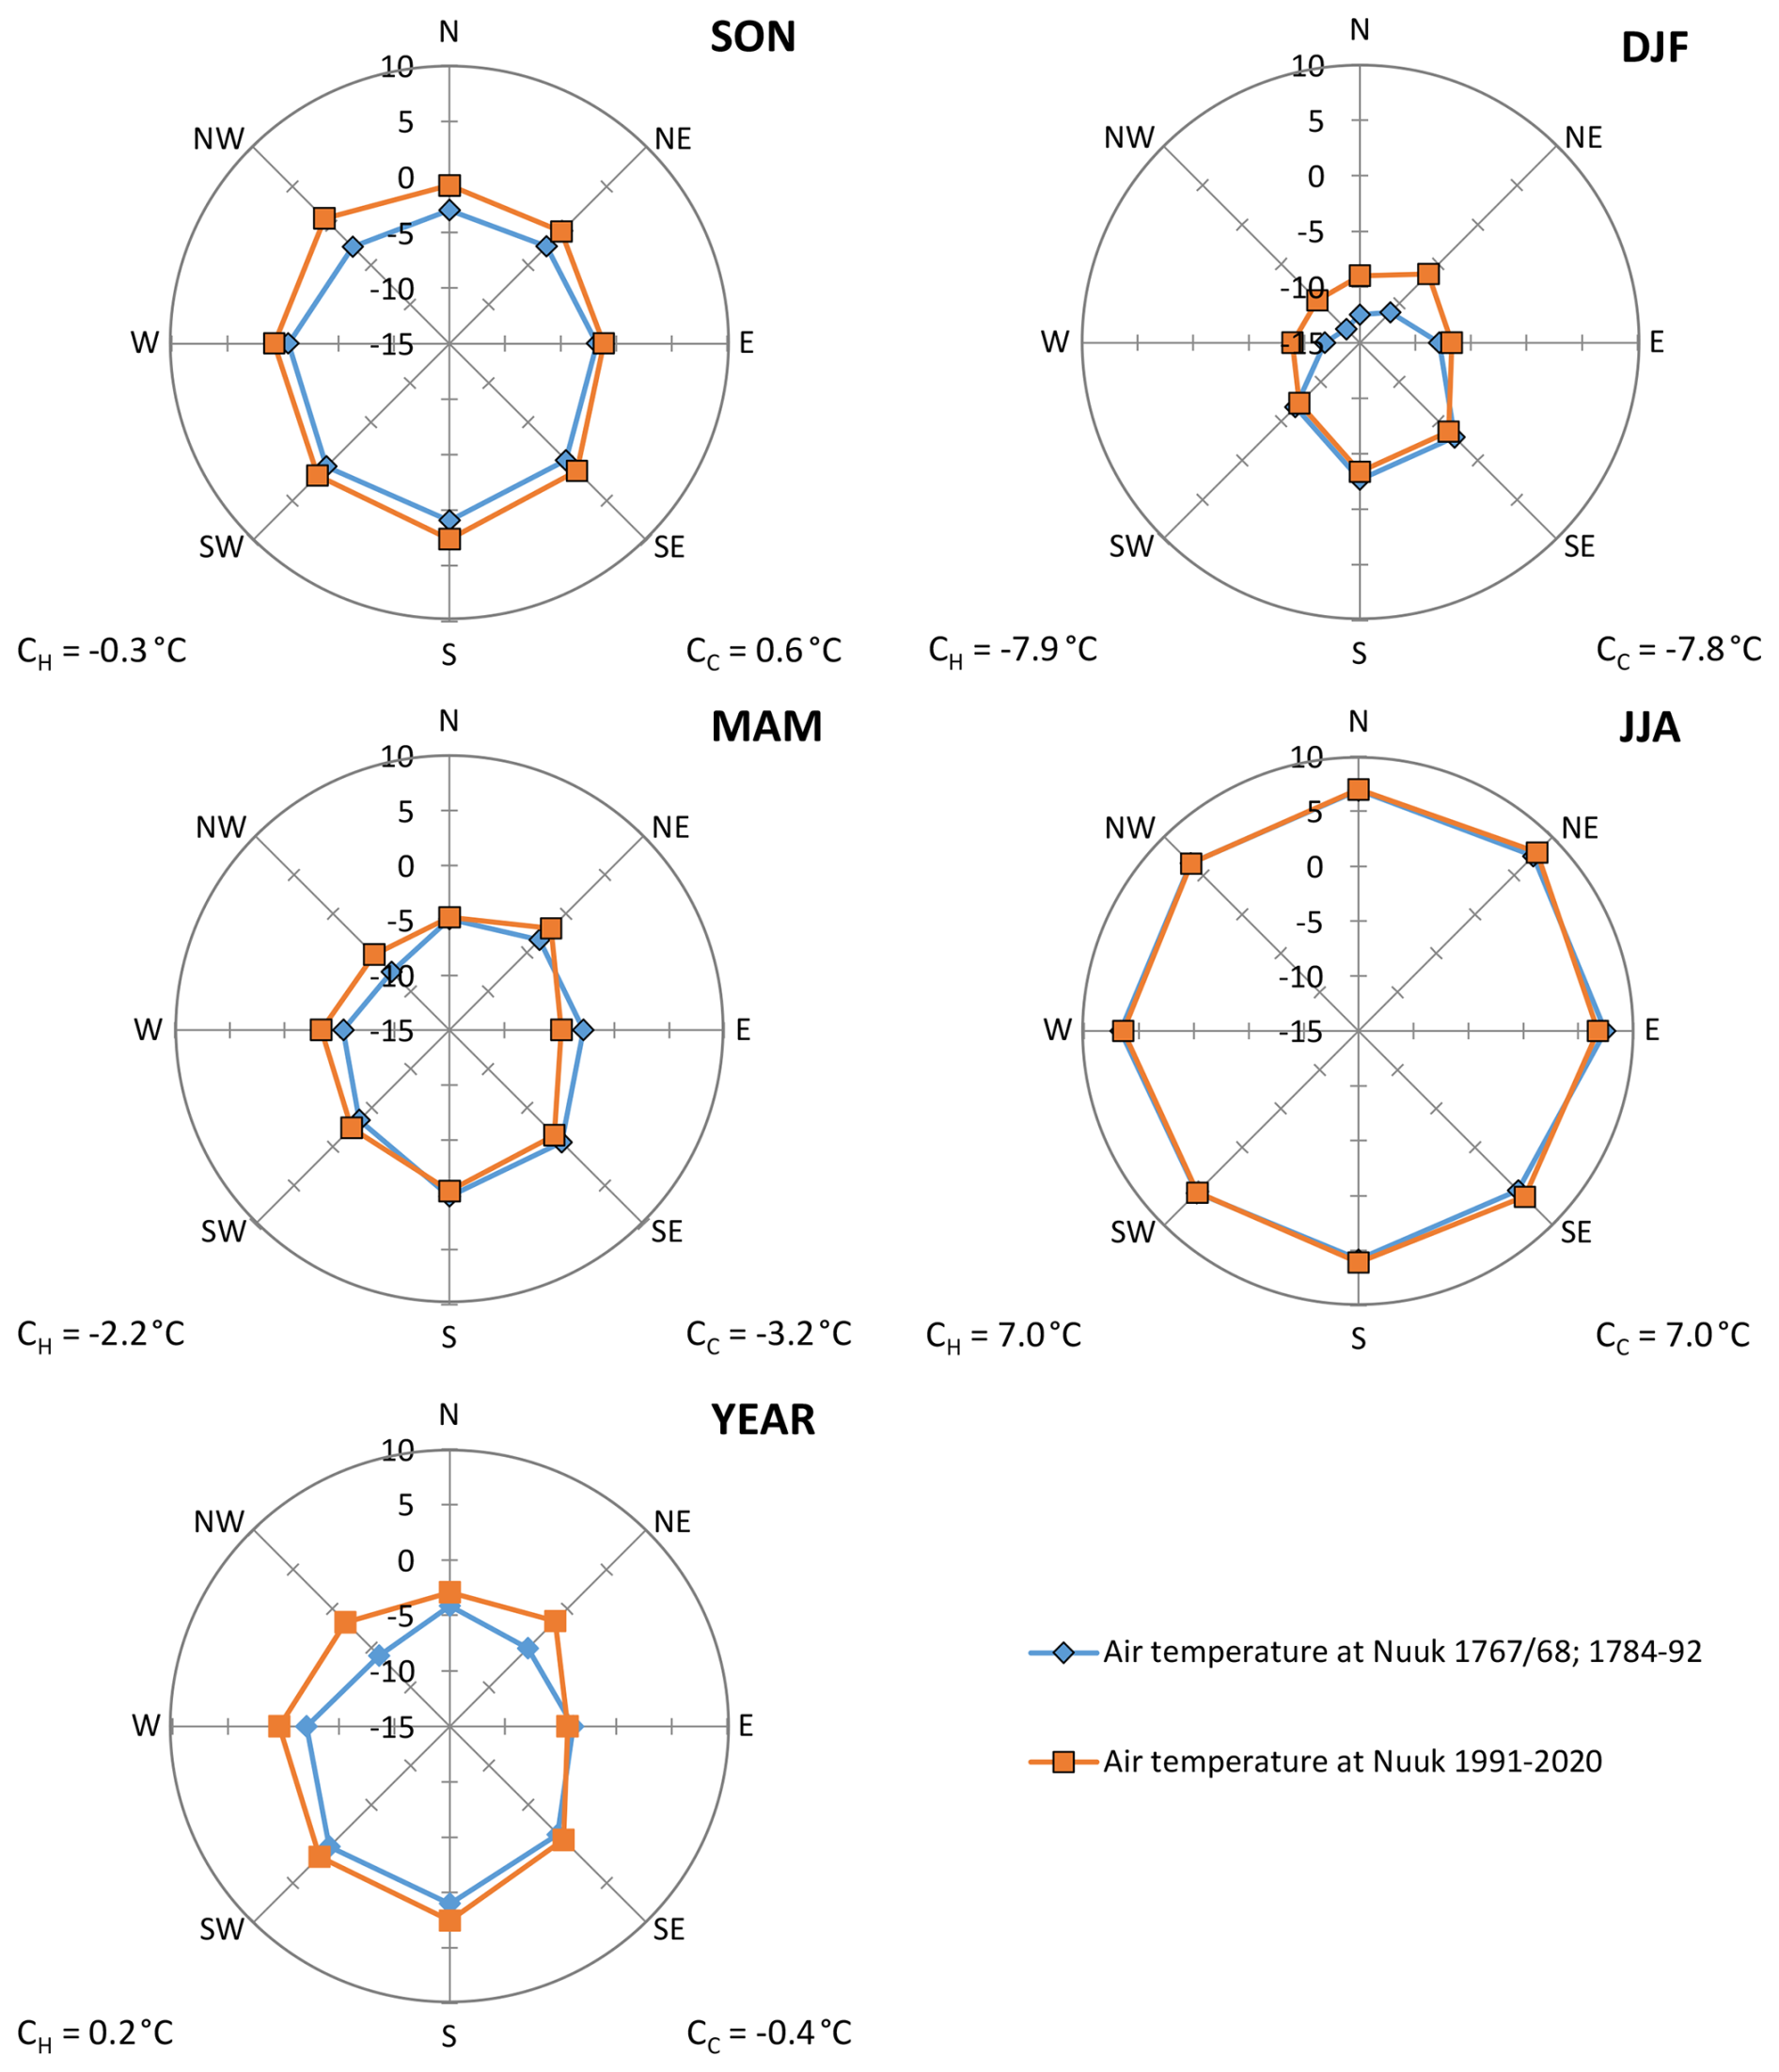
Figure 8Seasonal (SON, DJF, MAM, JJA) and annual (YEAR) average values of air temperature (in v) according to different directions at Nuuk in historical (1767/68; 1784–1792) and contemporary (1991–2020) periods.
Considering this pattern from a seasonal perspective (in the historical period), the lowest air temperatures in the autumn, winter and spring seasons were associated with winds from the north and north-east. The highest temperatures in these seasons were recorded during winds from the south and south-east (and, in autumn, additionally from the south-west). In summer, this pattern reverses, with winds from the northern sector bringing the highest temperatures, while winds from the southern sector bring the lowest. In the summer season, the change in air temperature depending on wind direction is not significant, averaging up to 2 °C. The greatest differences are observed in the winter season, when, depending on wind direction, temperatures vary by up to 10 °C (Fig. 8, Table S7).
Comparing the seasons of the historical period with those of the three-decade contemporary period 1991–2020, the relationship between wind direction and air temperature is the same. From autumn to spring, average air temperatures are lowest during winds from the west through the north to the east, whereas the warmest are observed during southerly winds. As in the historical period, the summer air temperature is lowest during winds from the south and highest during winds from the north-east (Fig. 8, Table S7).
3.2.4 Wind direction vs. atmospheric pressure
Thanks to the meteorological observations conducted in Nuuk in the 18th century (1767/68; 1784–1792), it is possible to correlate wind direction with prevailing atmospheric pressure (Fig. 9). The mean atmospheric pressure during the historical period was 1000.0 hPa. The lowest values (995.2 hPa) were achieved during south-easterlies (SE). The highest values occurred during calm (C) (1002.3 hPa), and slightly lower values were associated with south-westerly (SW) and northerly (N) winds (Fig. 9, Table S8). In the contemporary period (1991–2020), the lowest atmospheric pressure was associated with easterly (E) winds, whereas the highest values were associated with south-westerly and southerly (SW-S) winds. The average atmospheric pressure was 7.0 hPa lower in the historical period than in the reference period. This may be due to imprecise instrumentation, but it should not affect the accuracy of the relationships described above.
Looking at the relationship between atmospheric pressure and wind direction during the historical period, south-easterly (SE) winds were associated with some of the lowest barometric readings in all seasons except summer. The situation was similar for westerly (W) winds, but only in autumn and spring. For the highest atmospheric pressure values, the situation was more complex – the highest atmospheric pressure values were associated with a different wind direction (Fig. 9, Table S8).
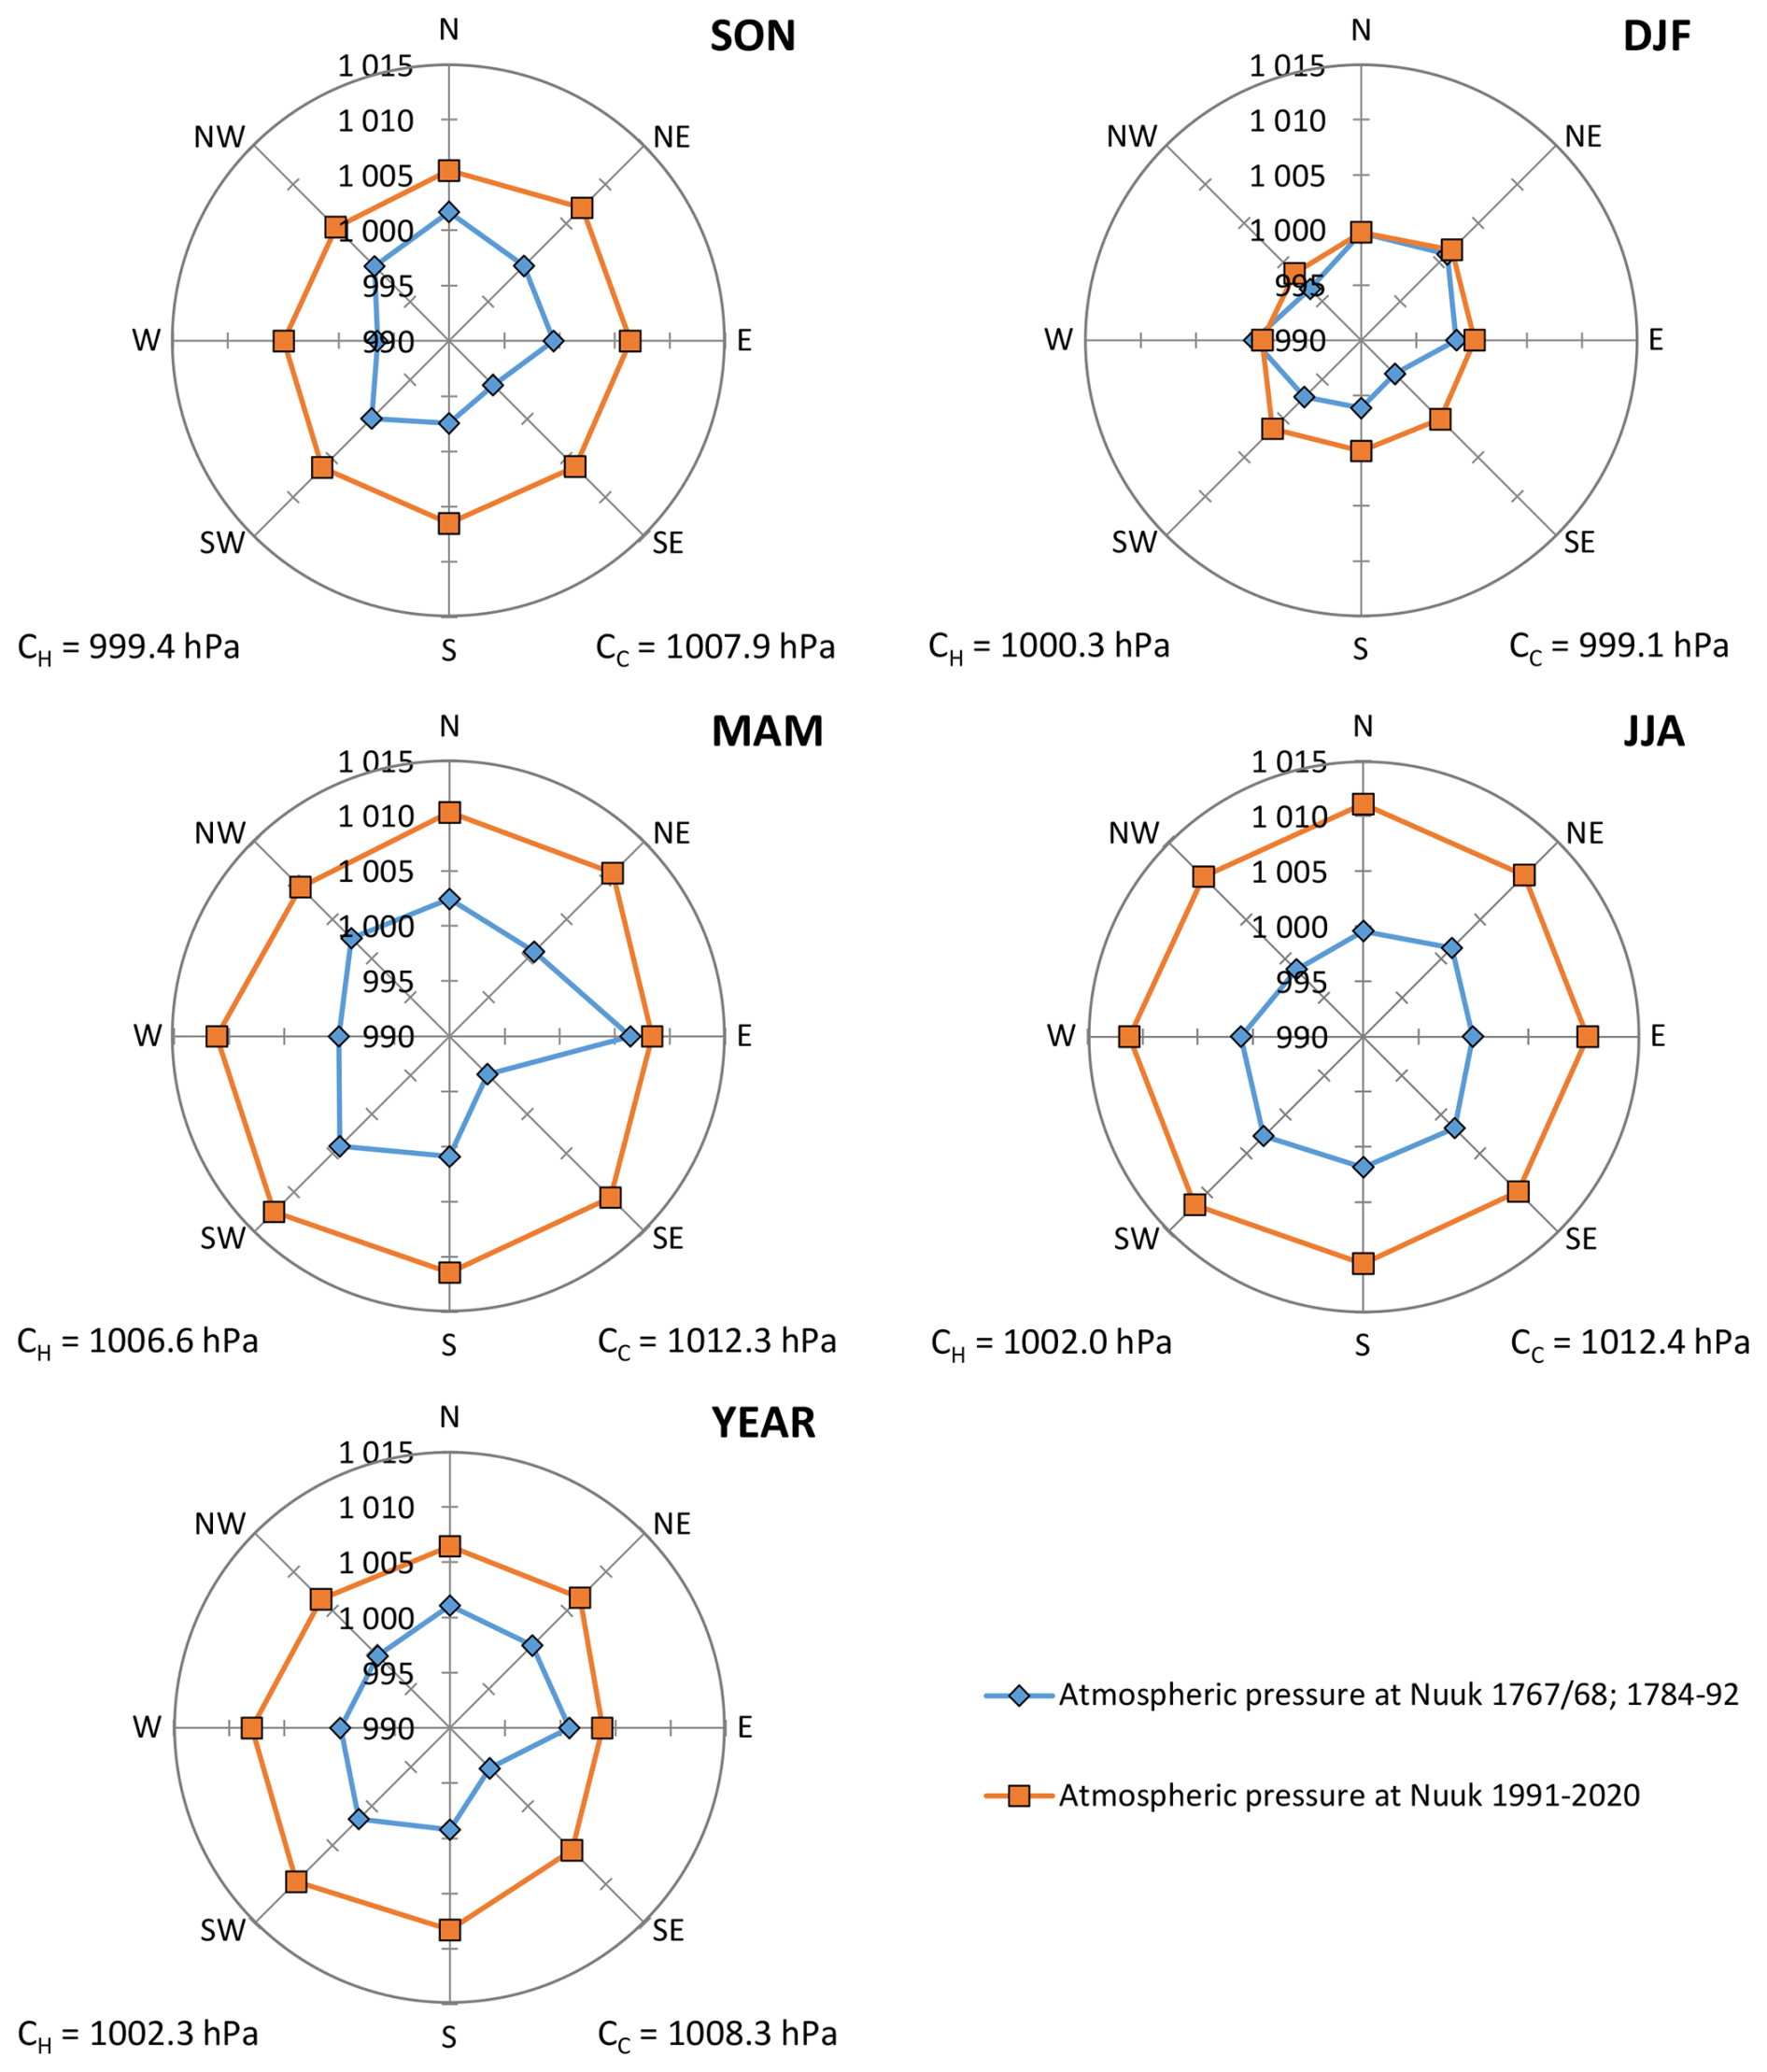
Figure 9Seasonal (SON, DJF, MAM, JJA) and annual (YEAR) average values of air pressure (in hPa) according to wind direction at Nuuk in historical (1767/68; 1784–1792) and contemporary (1991–2020) periods.
During the contemporary period, some of the lowest atmospheric pressure values occurred during north-westerly (NW) wind. It is noteworthy that this is the only relationship that did not change even during the summer season. South-westerly (SW) winds often occur in conjunction with the highest values, but this relationship does not occur during the autumn season. For the remaining wind directions, atmospheric pressure is (somewhat similarly to the historical period) characterised by values that are so divergent that it is difficult to identify a specific relationship (Fig. 9, Table S8).
Long-term series of measurements of atmospheric conditions are necessary to determine the climate prevailing in a given place. The further back in time we go, the harder it is to obtain such data; it becomes especially difficult to find measurements made using meteorological instruments and to find observations made in places that are difficult to access or not very friendly to humans. These impediments all pertain to the Arctic area in the second half of the 18th century. The Arctic has only had good coverage with meteorological stations since the mid-20th century (Przybylak, 2000), and its climate can definitely be described as making human settlement difficult. Such data would allow for a detailed analysis of the climate of this region, as well as more precise reanalyses. For this reason, the main goal of the present work was to describe the climatic conditions prevailing in the historical period (1767/68; 1784–1792) on the south-western coast of Greenland (the city of Nuuk). Because the air temperature results have already been published (Przybylak et al., 2024), this article focuses on the course of atmospheric pressure values and anemological conditions. The data used are extremely valuable because they are the oldest available instrumental measurements in this region of the world. However, for this very reason, the absence of other works describing climatic conditions in a similar time and space makes comparison of the results difficult.
In the Arctic (defined herein as the area north of the 62nd parallel in the Northern Hemisphere), a statistically insignificant decrease in atmospheric pressure was observed between 1880 and 2000 (Polyakov et al., 2003; Przybylak, 2007). However, this decrease is not permanent, given that, during this 120-year period, there was a period of increasing pressure (1920–60) followed by a significant decrease between 1960 and 2000, primarily due to changes in the winter season. Other studies confirm this trend (Walsh et al., 1996; Cullather and Lynch, 2003).
Along with the decrease in atmospheric pressure, cyclonic activity began to increase proportionally, resulting in more frequent occurrences of both cyclones and anticyclones (Serreze et al., 1993, 1997). Turner et al. (2007) also noted changes in the strength of nearby major pressure centres. In the second half of the 20th century, there was a noticeable decrease in mean atmospheric pressure within the Icelandic Low and Aleutian Low, while there was an increase in the Siberian High. The results of the research by Panagiotopoulos et al. (2005) contradict this thesis; they indicate that, in the first half of the 20th century, there was indeed an increase in atmospheric pressure in the Siberian High, but that, since the 1970s, there has been a sharp decline in the value.
Atmospheric pressure around Greenland appears to increase with increasing latitude, although this increase is uneven, with higher values recorded on its eastern coast. Atmospheric pressure in the southern part of the island reaches comparable values to neighbouring areas at this latitude, while in the northern part of the island these values are higher than in other regions at this latitude (Putnins, 1970; Wang and Ikeda, 2000; Cassou et al., 2004).
The daily variation in atmospheric pressure typically reaches its maximum in winter and its minimum in summer (Putnins 1970). This is confirmed by a study published by Petersen (1935), in which he analysed atmospheric pressure at Angmagssalik, among other places. The winter maximum was 10 hPa, and the summer minimum was 3.7–4.3 hPa. In the case of Nuuk described in this article, which is located slightly further south of Angmagssalik but on the opposite side of the island, the greatest mean daily variability of atmospheric pressure occurred from December to March. During this period, on average, ∼20 % of the day-to-day variations exceeded 12.0 hPa. The lowest differences were recorded in July and August, when in most cases they were below 4.0 hPa, which is consistent with the above studies.
Wind in Greenland is strongly dependent on terrain. In general, air in the troposphere moves from west to east over the island, which is the result of the global energy balance determined by the inflow of solar radiation being greater at lower latitudes. However, topography plays a decisive role closer to the ground surface. Wind is often channelled into the flow in fjords, where katabatic flow from the interior of the island dominates (due to the extensive ice sheet in the centre), whereas over the sea, winds flow parallel to the coast (Putnins, 1970; Cappelen and Drost Jensen, 2021; Koch, 2023). In summer, winds often blow from the sea along the fjord toward the inland centre, whereas in winter, they blow in the opposite direction. Despite Nuuk being located at the mouth of the fjord, this relationship is still evident. The station located on the south-western coast, both in the historical and contemporary periods, witnesses winds predominantly from the north-east sector (N-NE-E) in winter, whereas in summer, winds from the south intensify. South-easterly and westerly directions play only a marginal role throughout the year. Putnins (1970) provides an example comparing two stations on the south coast. The sheltered town of Ivigtut (now Ivittut) is characterised by frequent atmospheric calms (which translates into a bigger air temperature amplitude), almost half the wind speed, and significantly fewer fog days, as compared to the exposed location of the nearby Nanortalik. Further examples supporting the thesis of the strong role of topography on the local climate around specific stations are observations conducted at the Danmarkshavn, Nord and Brønlund Fjord stations (Putnins, 1970).
Putnins (1970) also analysed wind direction for Greenland. One station was Godthaab (now Nuuk) for the years 1931–1956. From his work we learn that, in Nuuk, from October to April, easterly or north-easterly winds predominated. In the remaining months (except May), south-westerly winds dominated, although atmospheric calms were also common. In the combined period 1767/68 and 1784–1792 and in 1991–2020 alike, outside the summer season, the wind also most often blew from the north and north-east. The summer season, however, was characterised by winds from the south and south-west, although in the historical period, summer winds were also frequently observed from the north and north-east. Calm periods were almost non-existent in the contemporary period, but, in the historical period, they most frequently occurred in the summer season, accounting for 15 % of all observations. These differences are probably attributable to the low accuracy of wind force estimates in the historical period.
In Greenland, coastal and central inland weather conditions generally differ, unless a very strong high-pressure system is present over the island (Baumann, 1933). Loewe (1936) wrote about the unfavourable weather conditions that frequently occur in the centre of the island. As atmospheric pressure dropped in the regions around Greenland, a strong katabatic wind from the centre of the island toward the coast was observed. It is clearly visible on the steep slopes of the sheet (Loewe, 1935). It reaches its highest speeds in November and February. However, in summer, the contrast between the interior of the ice sheet and the zone bordering the mainland is smallest, resulting in a weakening of wind speeds.
Putnins (1970) also notes that extremely strong winds are not uncommon in the coastal zone, where wind speeds reaching “several dozen” m s−1 are recorded. The example of Nuuk, analysed in this article, seems to confirm this. During the historical period, wind speeds exceeding 30 m s−1 were repeatedly observed. However, observational data in coastal regions are not easy to analyse due to the specific variability of climatic conditions depending on the station location. Measurement points located close together but in areas that differ orographically can exhibit greater differences in measurements than those located farther apart but in areas that are similar in terrain (Petersen, 1935).
Møller and Helgason (2021) described the meteorological conditions in the years 2007–2016 in the four largest cities of Greenland's south-western coast. They showed that, in the southern part of the island, the climate is warmer and more humid, whereas further north, relative air humidity, precipitation and air temperature all decrease, especially in winter. Moreover, Nuuk, compared to the other three large cities (which are located relatively close to each other and, like Nuuk, on the coast) has higher wind speeds, with monthly average values ranging from less than 5 m s−1 in the summer months to more than 6 or even 6.5 m s−1 from November to April. These values are very close to the average from the longer series used in this article (1991–2020); however, they differ slightly from the historical period (1767/68; 1786–1792), when the recorded wind speed was similar in winter but when values in June and July were almost 1 m s−1 higher.
The study by Putnins (1970) also provides insight into anemological conditions prevailing in the mid-20th century (1931–1956). At Nuuk (formerly known as Godthaab), monthly mean wind speeds range from 2.1–2.2 m s−1 in the summer months to 3.0–3.3 m s−1 in the winter months, with an annual mean of 2.7 m s−1. These values are significantly lower than those presented in this study and others describing conditions in both the recent and the more distant past.
Anemological conditions in the Arctic, including Godthåb station (now the city of Nuuk) dating back to the 19th century and deriving from the 1st International Polar Year 1882/83 were analysed by Wyszyński (2011). These data cover the period from August 1882 to August 1883. This is almost 100 years after the period described in this work, and the average monthly wind speed ranged from 5.8 m s−1 in August to 10.7 m s−1 in February, with an annual average of 8.0 m s−1. In the case of the annual average, this speed is almost 2 m s−1 greater than the values for the combined period of 1767/68 and 1786–1792. However, it should be borne in mind that the work of Wyszyński (2011) only analysed 1 year, which is less representative than using data from several years, which, as we know, averages the obtained results. Differences between periods can also be seen in the case of wind directions. In the year 1882/83, only one direction was dominant in the individual months. From April to September, the most frequently observed wind was southerly and south-easterly, whereas from October to January, it was north-easterly. In the combined period of 1767/68 and 1784–1792 in this work, the frequencies of wind from individual directions in the autumn and winter months are similar to those of 100 years later. However, in the warm season, there is often no dominant direction, and the wind blows equally from the north and south.
Araźny et al. (2026) also provide wind speeds describing the bioclimatic conditions prevailing in Nuuk in 1767/68 and 1790–1792. The values in that paper are not comparable to those presented in this paper, because they come only from measurements around noon and were reduced to a speed at height of 1.2 m above ground level, which is about 66 % of the value from 10 m above ground level.
The main conclusions from this study can be presented as follows:
-
In both the historical and contemporary periods, the lowest atmospheric pressure values were recorded in January and February. The highest values occurred from March to May and, in the contemporary period, also in June.
-
In both the historical (long-term average) and the modern period, day-to-day changes in atmospheric pressure of “weak” (≤4.0 hPa) strength accounted for over 50 % in autumn and winter and for over 80 % in summer. The highest frequency of strong (8.1–12.0 hPa) and very strong (>12.0 hPa) changes occurred in the autumn and winter seasons. In the historical period, very strong changes almost never occurred in the summer season, whereas, in the modern period, this minimum has shifted to the transition of spring to summer.
-
The multi-year average annual wind speed in the historical and contemporary periods was 6.1 m s−1. However, a difference was visible in their annual courses. In the historical period, compared to the contemporary, wind speeds were lower in the winter months and early spring, and higher in the latter part of spring and in the summer.
-
In the historical period, the most frequent wind directions at the Nuuk station were N-NE-E, whereas in the contemporary period they were NW-N-NE. These were the dominant directions almost all year round, except for summer, when (in both periods) the wind from the south showed increased activity.
-
In both the historical and contemporary periods, the wind from the north-west and north (W-NW-N-NW) was associated with lower air temperatures than were winds from other directions. The exception was the summer season, when the wind from the north (NW-N-NE) brought with it (slight) warming.
-
Barometer measurements indicate a much lower atmospheric pressure prevailing in the historical period. However, this may be the result of the device's incorrect calibration. In this work, however, the relationship between wind direction and atmospheric pressure difference is of greater importance and can still be investigated. In the historical period, the lowest atmospheric pressure values corresponded to winds from the north-west and south-east (NW and SE). In the contemporary period, the lowest pressure values were observed for easterly directions (NE-E-SE).
This work significantly addresses the gaps in the historical data series currently available for Greenland for the 18th century. Further work on historical data is necessary due to their uniqueness and potential to enhance our understanding of current climate changes.
Datasets for this research were derived from the following public domain resources: Repository for Open Data (RepOD), Nicolaus Copernicus University Centre for Climate Change Research collection: https://doi.org/10.18150/XGCONO (Chmist et al., 2025a). Danish Meteorological Institute (DMI): https://www.dmi.dk/publikationer/ (last access: 15 October 2025).
The supplement related to this article is available online at https://doi.org/10.5194/cp-22-1441-2026-supplement.
Konrad Chmist: Conceptualisation, Methodology, Investigation, Data curation, Formal analysis, Software, Visualisation, Interpretation of results, Writing – original draft, review and editing. Garima Singh: Conceptualisation, Methodology, Investigation, Data curation, Formal analysis, Software, Visualisation, Interpretation of results, Writing – original draft. Andrzej Araźny: Conceptualisation, Methodology, Investigation, Data collection and selection, Formal analysis, Validation – original draft and review, Supervision, Interpretation of results. Rajmund Przybylak: Conceptualisation, Data collection and selection, Validation – original draft and review, Funding acquisition, Project administration. Przemysław Wyszyński: Conceptualisation, Data collection and selection, Open data repository curation, Validation – original draft and review.
The contact author has declared that none of the authors has any competing interests.
Publisher's note: Copernicus Publications remains neutral with regard to jurisdictional claims made in the text, published maps, institutional affiliations, or any other geographical representation in this paper. The authors bear the ultimate responsibility for providing appropriate place names. Views expressed in the text are those of the authors and do not necessarily reflect the views of the publisher.
We express our gratitude to the local Inuit communities in Nuuk, who welcomed Moravian missionaries to their lands in the 19th century, and to the Polish National Science Center (grant no. 2020/39/B/ST10/00653) for financial support of our research. We would also like to thank the Danish Meteorological Institute (DMI) for using the contemporary meteorological database (https://www.dmi.dk, last access: 15 July 2026). We thank two anonymous reviewers for their constructive comments, which significantly helped improve our article.
This research has been supported by the Narodowe Centrum Nauki (grant no. 2020/39/B/ST10/00653).
This paper was edited by Julie Loisel and reviewed by two anonymous referees.
Araźny, A.: Temporal and spatial variability of thermal and humidity stimuli in the Hornsund area (Svalbard), Pol. Polar Res., 40, 29–53, https://doi.org/10.24425/ppr.2019.126346, 2019.
Araźny, A., Chmist, K., Przybylak, R., Wyszyński, P., and Singh, G.: Comparative study of bioclimatic conditions in southwestern Greenland between the late 18th century and the present, Int. J. Biometeorol., 70, 82, https://doi.org/10.1007/s00484-026-03132-5, 2026.
Baumann, G. H.: Grönlad-Flug von Gronau 1931, in: Beiträge zur Meteorologie des Luftweges über Grönland (Arch. Deut. Seewarte), edited by: Becker, R. and Baumann, G. H., 52, 31–48, https://digitale-bibliothek.bsh.bund.de/viewer/image/141501/190/ (last access: 15 July 2026), 1933.
Borm, J., Kodzik, J., and Charbit, S.: Producing and communicating natural history in the long 18th century: Moravian observations concerning greenland's climate in unpublished sources, Polar Rec., 57, e23, 1–10, https://doi.org/10.1017/S0032247421000218, 2021.
Cappelen, J.: DMI monthly climate data collection 1768–2008, Denmark, The Faroe Islands and Greenland, Technical Report 09-05, Dan. Meteorol. Inst., https://www.dmi.dk/fileadmin/Rapporter/TR/tr09-05.pdf (last access: 15 July 2026), 2009.
Cappelen, J. and Drost Jensen, C.: Climatological Standard Normals 1991–2020 – Greenland, DMI Report 21-12, Dan. Meteorol. Inst., https://www.dmi.dk/fileadmin/Rapporter/2021/DMI_report_21_12_Greenland.pdf (last access: 15 July 2026), 2021.
Cassou, C., Terray, L., Hurrell, J. W., and Deser, C.: North Atlantic Winter Climate Regimes: Spatial Asymmetry, Stationarity with Time, and Oceanic Forcing, J. Climate, 17, 1055–1068, https://doi.org/10.1175/1520-0442(2004)017<1055:NAWCRS>2.0.CO;2, 2004.
Chmist, K., Singh, G., Araźny, A., Przybylak, R., and Wyszyński, P.: Subdaily records of atmospheric pressure, wind speed and direction, and air temperature in southwest Greenland during the latter half of the 18th century, RepOD, V1 [data set], https://doi.org/10.18150/XGCONO, 2025a.
Chmist, K., Araźny, A., Przybylak, R., Wyszyński, P., and Singh, G.: Changes in bioclimatic conditions on the coast of the Labrador Peninsula in the second half of the 18th century, Clim. Change, 178, 46, https://doi.org/10.1007/s10584-025-03883-x, 2025b.
Cullather, R. I. and Lynch, A. H.: The annual cycle and interannual variability of atmospheric pressure in the vicinity of the North Pole, Int. J. Clim., 23, 1161–1183, https://doi.org/10.1002/joc.942, 2003.
Demarée, G. R. and Ogilvie, A. E. J.: The Moravian missionaries at the Labrador coast and their centuries-long contribution to instrumental meteorological observations, Clim. Change, 91, 423–450, https://doi.org/10.1007/s10584-008-9420-2, 2008.
Demarée, G. R. and Ogilvie, A. E. J.: Missionary activity in Greenland and in Labrador: the context for early meteorological observations, in: Legacies of David Cranz's `Historie von Grönland' (1765), Christianity in the Trans-Atlantic World, edited by: Jensz, F. and Petterson, C., Springer, 141–164, https://doi.org/10.1007/978-3-030-63998-37, 2021.
Demarée, G. R., Ogilvie, A. E. J, and Mailier, P.: Early meteorological observations in Greenland and Labrador in the 18th century: a contribution of the Moravian Brethren, in: Proceedings of the 35th international symposium on the Okhotsk sea and Polar oceans, Mombetsu, Japan, 16–19 February 2020, 35–38 pp., 2020.
García-Herrera, R., Prieto, L., Gallego, D., Hernández, E., Gimeno, L., Können, G. P., Koek, F. B., Wheeler, D. A., Wilkinson, C., Prieto, M. R., Báez, C., and Woodruff, S.: CLIWOC multilingual meteorological dictionary, EU contract EVK2-CT-2000-00090, 2003.
IPCC: Climate Change: The physical science basis, in: Contribution of working group I to the Sixth assessment report of the intergovernmental panel on climate change, edited by: Masson-Delmotte, V., Zhai, P., Pirani, A., Connors, S. L., Péan, C., Berger, S., Caud, N., Chen, Y., Goldfarb, L., Gomis, M. I., Huang, M., Leitzell, K., Lonnoy, E., Matthews, J. B. R., Maycock, T. K., Waterfield, T., Yelekçi, O., Yu, R., and Zhou, B., Cambridge University Press, Cambridge and New York, 2391, https://doi.org/10.1017/9781009157896, 2021.
Jeffries, M. O., Overland, J. E., and Perovich, D. K.: The Arctic shifts to a new normal, Phys. Today, 66, 35–40, https://doi.org/10.1063/PT.3.2147, 2013.
Koch, N. E.: Greenland, Rowman & Littlefield, https://books.google.pl/books?id=RXfREAAAQBAJ&lpg=PA5&ots=UnIX5BGssi&dq=Koch%2C%20N.%20E.%3A%20Greenland%2C%20Rowman%20%26%20Littlefield%2C%202023.&lr&hl=pl&pg=PA5#v=onepage&q&f=false (last access: 15 July 2026), 2023.
Können, G. P., Zaiki, M., Baede, A. P. M., Mikami, T., Jones, P. D., and Tsukahara, T.: Pre-1872 extension of the Japanese instrumental meteorological observation series back to 1819, J. Clim., 16, 118–131, https://doi.org/10.1175/1520-0442(2003)016<0118:PEOTJI>2.0.CO;2, 2003.
Kottek, M., Grieser, J., Beck, C., Rudolf, B., and Rubel, F.: World map of the Köppen-Geiger climate classification updated, Meteorol. Z., 15, 259–263, 2006.
Lamb, H. H.: Ancient units used by the pioneers of meteorological measurements, Weather, 41, 230–233, 1986.
Loewe, F.: Das Klima des Grönlandischen Inlandeises, Handbuch der Klimatologie, 2(K), 67–101, 1935.
Loewe, F.: The Greenland ice cap as seen by a meteorologist, Quart. J. Roy. Meteorol. Soc., 62, 359–377, 1936.
Miller, G. H., Brigham-Grette, J., Alley, R. B., Anderson, L., Bauch, H. A., Douglas, M. S. V., Edwards, M. E., Elias, S. A., Finney, B. P., Fitzpatrick, J. J., Funder, S. V., Herbert, T. D., Hinzman, L. D., Kaufman, D. S., MacDonald, G. M., Polyak, L., Robock, A., Serreze, M. C., Smol, J. P., Spielhagen, R., White, J. W. C., Wolfe, A. P., and Wolff, E. W.: Temperature and precipitation history of the Arctic, Quat. Sci. Rev., 29, 1679–1715, https://doi.org/10.1016/j.quascirev.2010.03.001, 2010.
Møller, E. B. and Helgason, J.: Weather and indoor climate in Greenland, J. Phys. Conference Series, 2069, 012073, https://doi.org/10.1088/1742-6596/2069/1/012073, 2021.
Nordli, Ø., Przybylak, R., Ogilvie, A. E. J., and Isaksen, K.: Long term temperature trends and variability on Spitsbergen: the extended Svalbard Airport temperature series, 1898–2012, Polar Res., 33, 21349, https://doi.org/10.3402/polar.v33.21349, 2014.
Nordli, Ø., Wyszyński, P., Gjelten, H. M., Isaksen, K., Łupikasza, E., Niedźwiedź, T., and Przybylak, R.: Revisiting the extended Svalbard Airport monthly temperature series, and the compiled corresponding daily series 1898–2018, Polar Res., 39, 3614, https://doi.org/10.33265/polar.v39.3614, 2020.
Panagiotopoulos, F., Shahgedanova, M., Hannachi, A., and Stephenson, D.B.: Observed Trends and Teleconnections of the Siberian High: A Recently Declining Center of Action, J. Clim., 18, 1411–1422, https://doi.org/10.1175/JCLI3352.1, 2005.
Petersen, H.: Das Klima der Küsten von Grönland, Handbuch der Klimatologie, 2(K), 33–65, 1935.
Polyakov, I. V., Bekryaev, R. V., Alekseev, G. V., Bhatt, U. S., Colony, R. L., Johnson, M. A., Maskshtas, A. P., and Walsh, D.: Variability and Trends of Air Temperature and Pressure in the Maritime Arctic, 1875–2000, J. Clim., 16, 2067–2077, https://doi.org/10.1175/1520-0442(2003)016<2067:VATOAT>2.0.CO;2, 2003.
Przybylak, R.: Temporal and spatial variation of air temperature over the period of instrumental observations in the Arctic, Int. J. Climatol., 20, 587–614, https://doi.org/10.1002/(SICI)1097-0088(200005)20:6<587::AID-JOC480>3.0.CO;2-H, 2000.
Przybylak, R.: Contemporary climate change in the Arctic, in: Climate change in the Arctic and Antarctic in the last fifty years of the 20th century and their environmental implications, edited by: Marsz, A. and Styszyńska, A., Maritime Univ. Publ. House, Gdynia, 93–110, https://klimatolodzy.pl/images/attachements/Arktyka-Antarktyka/04-Przybylak_aa2007.pdf (last access: 15 July 2026), 2007.
Przybylak, R. and Vízi, Z.: Air temperature changes in the Canadian Arctic from the early instrumental period to modern times, Int. J. Climatol., 25, 1507–1522, https://doi.org/10.1002/joc.1213, 2005.
Przybylak, R. and Wyszyński, P.: Air temperature in Novaya Zemlya Archipelago and Vaygach Island from 1832 to 1920 in the light of early instrumental data, Int. J. Climatol., 37, 3491–3508, https://doi.org/10.1002/joc.4934, 2017.
Przybylak, R. and Wyszyński, P.: Air temperature changes in the Arctic in the period 1951–2015 in the light of observational and reanalysis data, Theoret. Appl. Climatol., 139, 75–94, https://doi.org/10.1007/s00704-019-02952-3, 2020.
Przybylak, R., Vizi, Z., and Wyszyński, P.: Air temperature changes in the Arctic from 1801 to 1920, Int. J. Climatol., 30, 791–812, https://doi.org/10.1002/joc.1918, 2010.
Przybylak, R., Wyszyński, P., Vizi, Z., and Jankowska, J.: Atmospheric pressure changes in the Arctic, from 1801 to 1920, Int. J. Climatol., 33, 1730–1760, https://doi.org/10.1002/joc.3546, 2013.
Przybylak, R., Wyszyński, P., Nordli, Ø., and Strzyżewski, T.: Air temperature changes in Svalbard and the surrounding seas from 1865 to 1920, Int. J. Climatol., 36, 2899–2916, https://doi.org/10.1002/joc.4527, 2016.
Przybylak, R., Wyszyński, P., and Araźny, A.: Comparison of Early Twentieth Century Arctic Warming and Contemporary Arctic Warming in the light of daily and sub-daily data, J. Climate, 35, 2269–2290, https://doi.org/10.1175/JCLI-D-21-0162.1, 2022.
Przybylak, R., Singh, G., Wyszyński, P., Araźny, A., and Chmist, K.: Air temperature changes in SW Greenland in the second half of the 18th century, Clim. Past, 20, 1451–1470, https://doi.org/10.5194/cp-20-1451-2024, 2024.
Putnins, P.: The climate of Greenland, in: Climates of the Polar Regions, World Survey of Climatology, edited by: Orvig, S., Elsevier Pobl. Comp., Amsterdam–Londyn–New York, 14, 3–128, https://klimatolodzy.pl/images/attachements/Arktyka-Antarkt (last access: 15 July 2026), 1970.
Serreze, M. C., Box, J. E., Barry, R. G., and Walsh, J. E.: Characteristics of Arctic synoptic activity, 1952–1989, Meteorol. Atmos. Phys., 51, 147–164, https://doi.org/10.1007/BF01030491, 1993.
Serreze, M. C., Carse, F., Barry, R. G., and Rogers, J. C.: Icelandic Low Cyclone Activity: Climatological Features, Linkages with the NAO, and Relationships with Recent Changes in the Northern Hemisphere Circulation, J. Climate, 10, 453–464, https://doi.org/10.1175/1520-0442(1997)010<0453:ILCACF>2.0.CO;2, 1997.
Singh, G., Przybylak, R., Wyszyński, P., Araźny, A., and Chmist, K.: Thermal conditions on the coast of Labrador during the late 18th century, Clim. Past, 21, 877–895, https://doi.org/10.5194/cp-21-877-2025, 2025.
Turner, J., Overland, J. E., and Walsh, J. E.: An Arctic and Antarctic perspective on recent climate change, Int. J. Clim., 27, 277–293, https://doi.org/10.1002/joc.1406, 2007.
Vinther, B. M., Andersen, K. K., Jones, P. D., Briffa, K. R., and Cappelen, J.: Extending Greenland temperature records into the late eighteenth century, J. Geophys. Res., 111, D11105, https://doi.org/10.1029/2005JD006810, 2006.
Vizi, Z.: Variability of the American Arctic climate in the 19th century, PhD thesis, Nicolaus Copernicus University in Toruń, 2008.
Walsh, J. E., Chapman, W. L., and Shy, T. L.: Recent Decrease of Sea Level Pressure in the Central Arctic, J. Climate, 9, 480–486, https://doi.org/10.1175/1520-0442(1996)009<0480:RDOSLP>2.0.CO;2, 1996.
Walsh, J. E., Overland, J. E., Groisman, P. Y., and Rudolf, B.: Ongoing climate change in the arctic, Ambio, 40, 6–16, https://doi.org/10.1007/s13280-011-0211-z, 2011.
Wang, J. and Ikeda, M.: Arctic oscillation and Arctic sea-ice oscillation, Geophys. Res. Lett., 27, 1287–1290, https://doi.org/10.1029/1999GL002389, 2000.
Wood, K. R. and Overland, J. E.: Accounts from 19th-century Canadian Arctic explorers' logs reflect present climate conditions, EOS, 84, 410–412, 2003.
Wood, K. R. and Overland, J. E.: Climate lessons from the first International Polar Year, Bull. Am. Meteorol. Soc., 87, 1685–1697, https://doi.org/10.1175/BAMS-87-12-1685, 2006.
Wood, K. R. and Overland, J. E.: Early 20th century Arctic warming in retrospect, Int. J. Climatol., 30, 1269–1279, https://doi.org/10.1002/joc.1973, 2010.
Wyszyński, P.: Meteorological conditions in the Arctic during the first International Polar Year1882/1883 and their comparison with present conditions, PhD thesis, Nicolaus Copernicus University in Toruń, 2011.