
the Creative Commons Attribution 4.0 License.
the Creative Commons Attribution 4.0 License.
 | 29 Jul 2026
Holocene temperatures in southwestern Greenland controlled by topography, ice sheet proximity, and oceanic conditions
Allison A. Cluett
Amy L. Grogan
Jason P. Briner
Isla S. Castañeda
Elizabeth K. Thomas
The Holocene Thermal Maximum (HTM), a period during the Early and Middle Holocene when Greenland experienced a warmer climate than pre-industrial times, provides an ideal opportunity to test the sensitivity of the Greenland Ice Sheet to prolonged warmth. However, available climate reconstructions from Greenland and surrounding regions provide a contrasting picture of the HTM – several reconstructions show an earlier HTM between the Early- to Middle-Holocene, while others show a delayed HTM between the Middle- to Late-Holocene. This discrepancy may be due to either seasonal sensitivity of the proxies or to spatio-temporal climate variations. Here we generate five new Holocene timeseries of branched glycerol dialkyl glycerol tetraether (brGDGT)-inferred mean air temperature for months above freezing from lakes along a latitudinal transect in southwestern Greenland, yielding a total of seven Holocene brGDGT-inferred time series in this region. Lake model sensitivity tests indicate minimal intra-lake variation in both the seasonal production window of brGDGT and the sensitivity to air temperature changes. Moreover, higher caldarchaeol-to-crenarchaeol ratios during the Early Holocene indicate anoxic or suboxic conditions in all lakes; however, these conditions do not show a consistent relationship with reconstructed temperatures, indicating that regional climate is the primary driver of the reconstructed temperature time series. Six of the brGDGT time series suggest a temperature maximum between approx. 7.5 and 5 ka, following peak summer insolation and in agreement with many regional reconstructions. A site far from both the coast and the Greenland Ice Sheet suggests peak warmth in the Early Holocene. These results, based on a single proxy, suggest that southwestern Greenland experienced similar Holocene summer temperature trends, with local temperature variations caused by proximity to the ice sheet and the ocean. Further investigations quantifying seasonal sensitivity between proxies and local effects (e.g., site-specific systematics and proximity to the ice sheet and the ocean) may help reconcile differences and refine Holocene climate reconstructions.
- Article
(7016 KB) - Full-text XML
-
Supplement
(8610 KB) - BibTeX
- EndNote


Arctic warming has profound and far-reaching impacts on the region's environment (Druckenmiller et al., 2025; Rantanen et al., 2022). For example, the Greenland Ice Sheet has been melting at an increasing rate, causing sea-level rise (Dutton et al., 2015; Frederikse et al., 2020). Ocean circulation and biogeochemical cycles have also undergone significant changes (Vihma et al., 2016; Wrona et al., 2016). Nutrient inputs to lakes have increased due to permafrost thaw (Reyes and Lougheed, 2015), leading to summer stratification and enhanced microbial respiration (Antoniades et al., 2024; Jane et al., 2023; Klanten et al., 2023; Prowse et al., 2011). These changes raise serious concerns about the future of the Arctic environment as global warming continues. However, available climate model projections show inter-model differences (IPCC, 2021; Seneviratne and Hauser, 2020), making it difficult to accurately predict the future. To improve our understanding of the sensitivity of the Arctic system, glaciers, and the water cycle to future climate change and to improve climate model capability, a long-term perspective on past climate changes and causal mechanisms is required (Axford et al., 2021; Briner et al., 2016).
The Holocene epoch (11.7 thousand years before present [ka] to 0 ka) on Greenland is characterized by millennia of relatively warm climate during the Early to Middle Holocene, likely warmer than preindustrial, and subsequent gradual cooling until 1850 CE, generally tracking boreal summer insolation (Axford et al., 2021; Briner et al., 2016; Kaufman et al., 2020). During the Early and Middle Holocene, Greenland and surrounding regions experienced major environmental changes: mountain glaciers were either smaller or entirely absent (Larocca et al., 2020; Larocca and Axford, 2022; Larsen et al., 2017; Schweinsberg et al., 2017, 2019) and the Greenland Ice Sheet was smaller compared to its current extent (Briner et al., 2020; Larsen et al., 2015; Leger et al., 2024), potentially causing changes in atmospheric circulation (Masson-Delmotte et al., 2005; Thomas et al., 2016, 2023). However, there is no consensus regarding the patterns of Holocene climate change in Greenland (Axford et al., 2021; Briner et al., 2016). This is in part due to site-specific climate, proxy-to-proxy, and proxy-model disagreement (Axford et al., 2021; Briner et al., 2016; Liu et al., 2014; Martin et al., 2024). Therefore, quantifying temperature variations throughout Greenland during this epoch is of particular interest.
The Southwestern Greenland Ice Sheet (defined herein as the region from Nuussuaq to Cape Farewell, Fig. 1) is highly sensitive to Holocene climate and environmental perturbations, due to its proximity to Atlantic Ocean deepwater formation, with attendant variability in heat and moisture transport (Downs et al., 2020; Lazier et al., 2002; Lesnek et al., 2020; Yang et al., 2016; Young et al., 2020). The Holocene temperature time series from ice-free areas in this region are mainly derived from lacustrine proxies, including pollen, chironomids, and biomarkers (Axford et al., 2021; Briner et al., 2016; Gajewski, 2015; Kaufman, 2004). Although most of the existing time series show gradual cooling throughout the Late Holocene, they disagree on the timing and magnitude of the temperature maximum, with evidence for an earlier and larger temperature maximum farther north, but with differences between archives and proxies (Axford et al., 2021; Briner et al., 2016; Gajewski, 2015; Kaufman, 2004; Larocca and Axford, 2022).
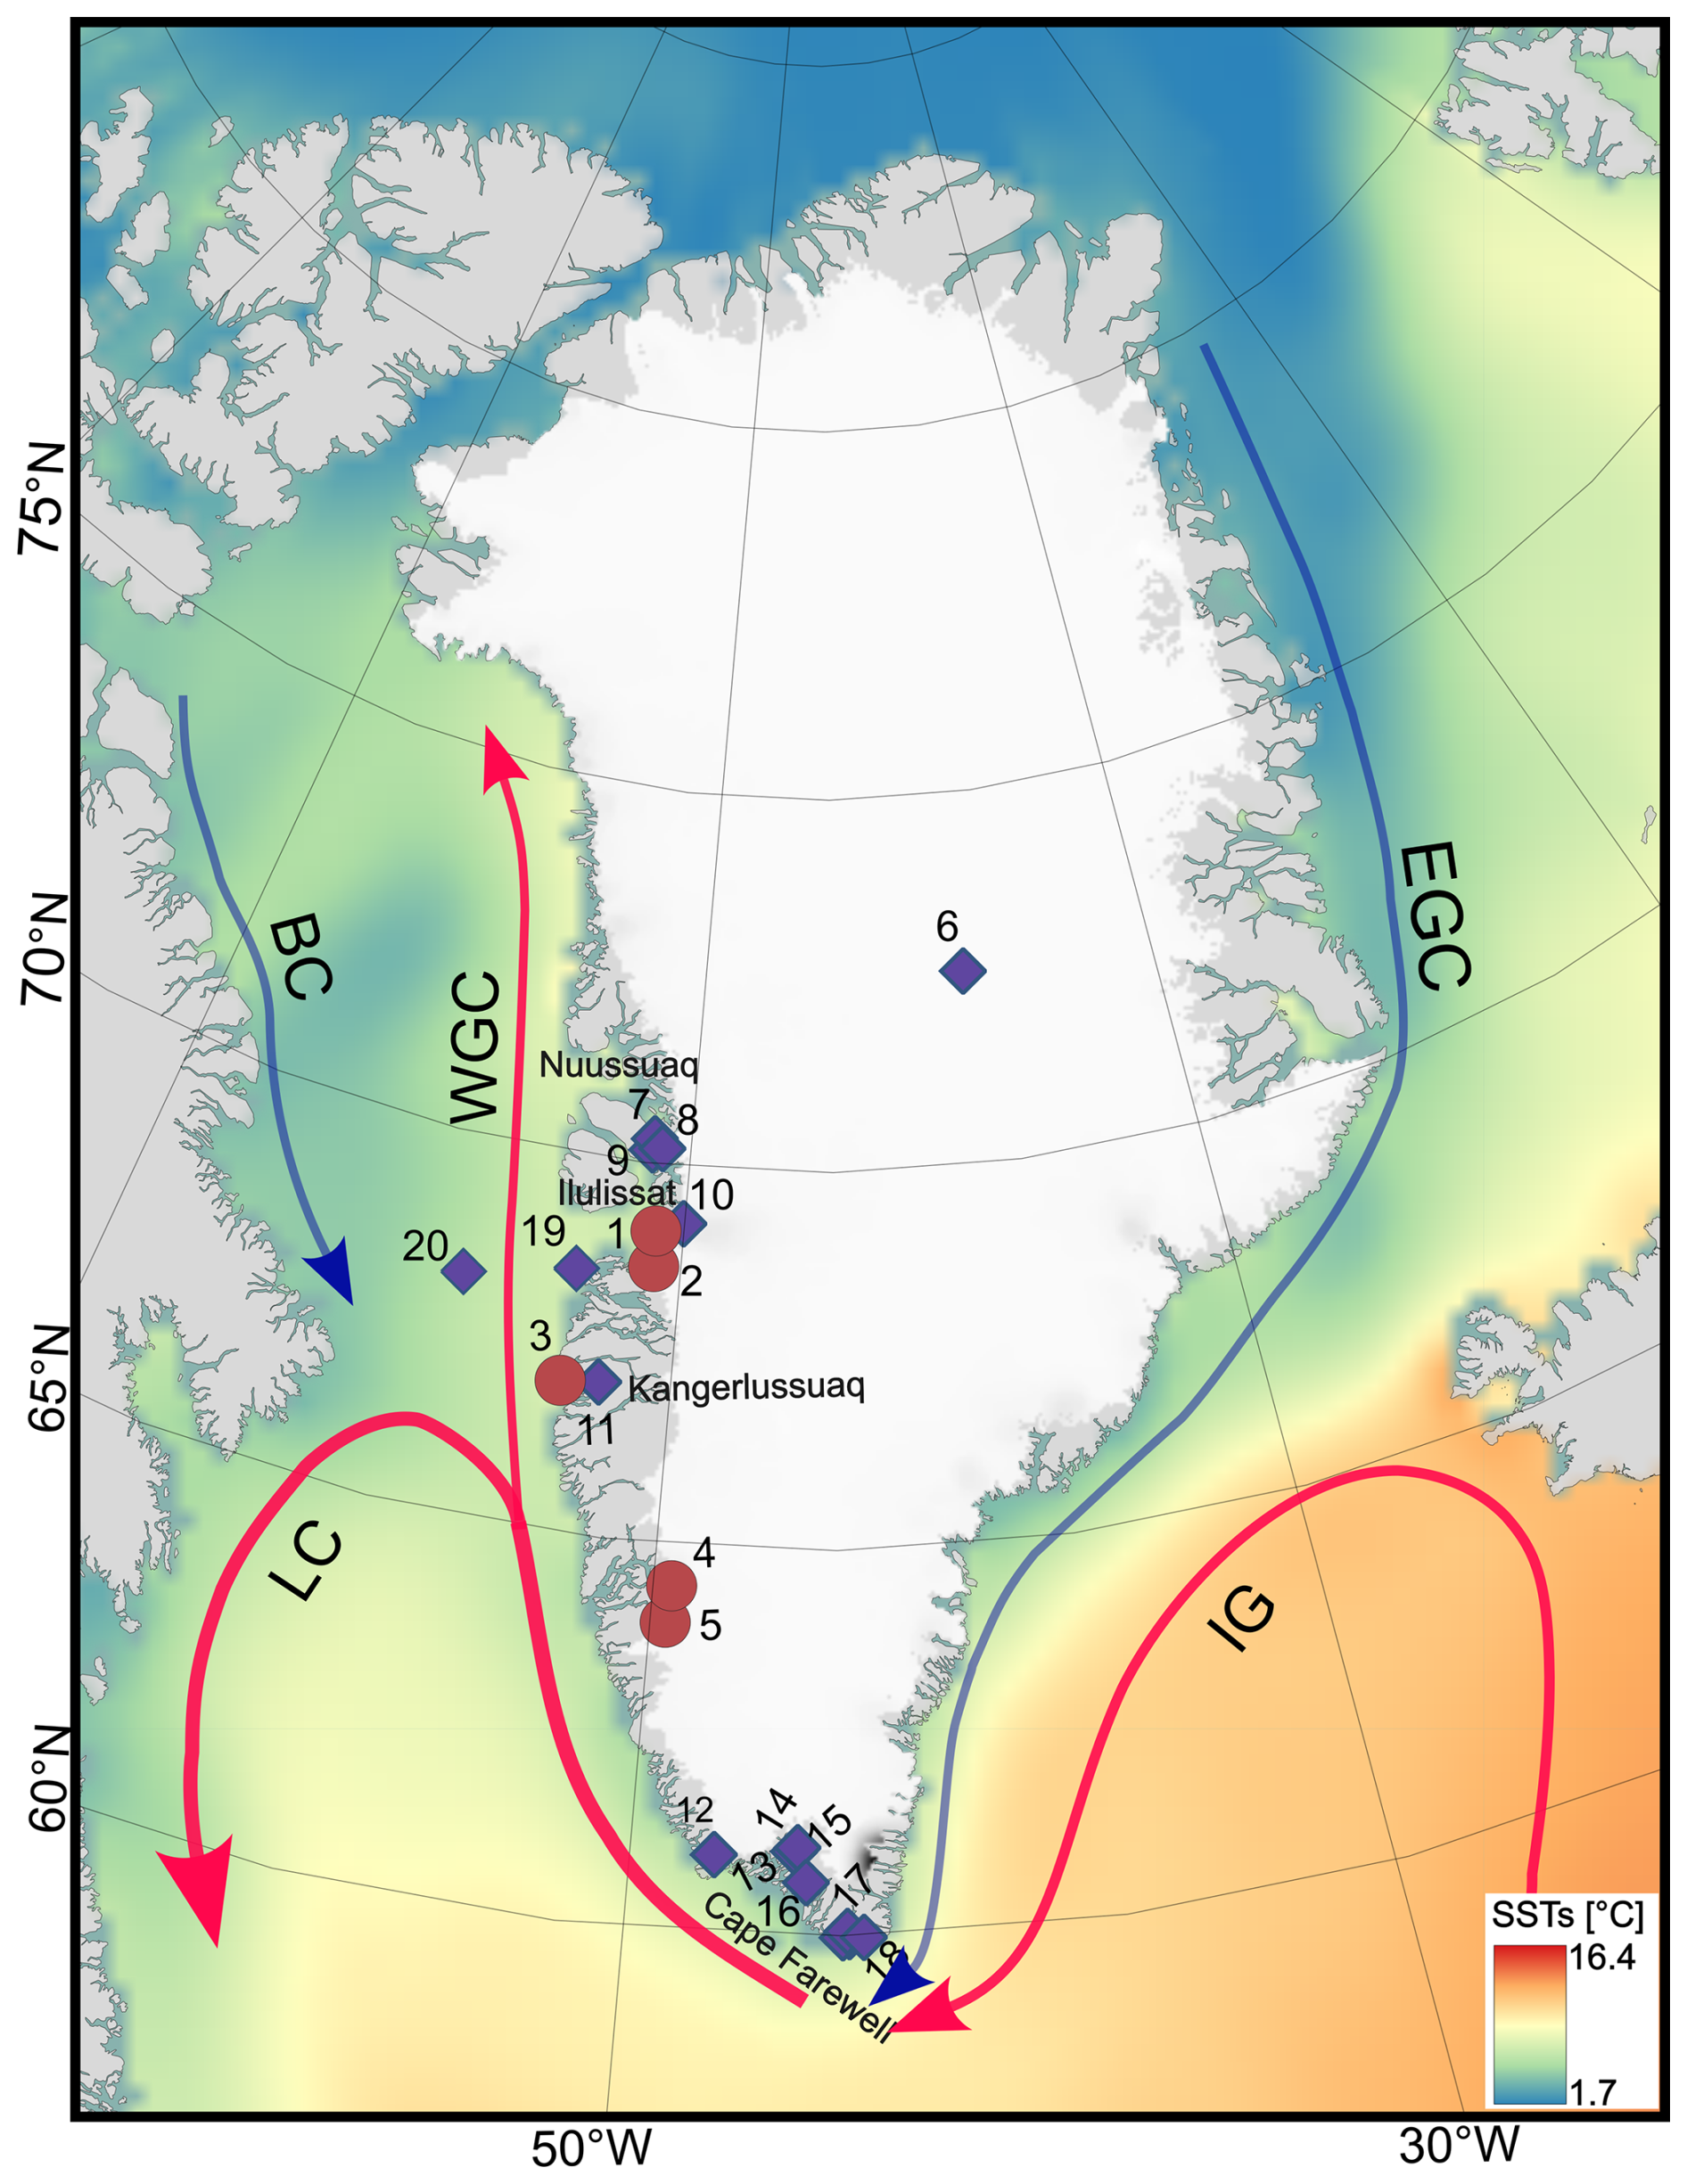
Figure 1Map of Greenland and surrounding area showing study lakes in red circles (1–5), sites mentioned in the text in blue diamonds (6–20) and ocean currents; WGC: West Greenland, EGC: East Greenland, IG: Irminger, BC: Baffin, and LC: Labrador currents. Site numbered as follows: (1) Pluto, (2) N3, (3) Rosaea, (4) Marshall, (5) Bullet, (6) GISP2 (Kobashi et al., 2017), (7) Sermikassak, (8) Qangattaq ice cap, (9) Saqqap Tasersua (Schweinsberg et al., 2017, 2019), (10) North Lake (Axford et al., 2013), (11) Lake Gus (Cluett et al., 2023), (12) Qipisarqo (Frechette and de Vernal, 2009; Kaplan et al., 2002), (13) Lake 578 (Schneider et al., 2024), (14) Spongilla Sø (Fredskild, 1973; Gajewski, 2015), (15) Alakariqssoq glaciers (Larocca et al., 2020), (16) Comarum Sø (Fredskild, 1973; Gajewski, 2015), (17) N14 (Andresen et al., 2004), (18) Quvnerit glaciers (Larocca et al., 2020), and marine sediment cores (19) MSM343300 (Ouellet-Bernier et al., 2014) and (20) CC70 (Gibb et al., 2015). Ocean colour represents modern summer sea surface temperatures (SSTs) (Fisher et al., 2023; Moon et al., 2023).
Reconstructions of Greenland Ice Sheet margin positions between Ilulissat and Kangerlussuaq suggest rapid retreat and warmest summers between ∼10.4 and 9.1 ka (Lesnek et al., 2020), a time period not covered by many other terrestrial archives. An annual temperature reconstruction based on argon and nitrogen isotopes from the Greenland Ice Sheet Project (GISP2) ice core reveals a Holocene thermal maximum (HTM) at ∼7.9 to 6 ka, or 10 to 7.5 ka when considering possible elevation changes, with temperature ∼3 to 5 °C warmer than the recent decades (Axford et al., 2021; Kobashi et al., 2017) (Fig. 1; point 6). Chironomid-inferred July air temperatures from North Lake near Ilulissat (Fig. 1, point 10) show the warmest period of the past 7 ka between ∼6 and 4 ka, with temperatures ∼2 to 3 °C higher than preindustrial (Axford et al., 2013). A branched glycerol dialkyl glycerol tetraether (brGDGT)-inferred summer lake water temperature time series from Lake Gus between Kangerlussuaq and Sisimiut reveals maximum temperature of the past 9 ka from 9 to 6 ka (Cluett et al., 2023) (Fig. 1, point 11), whereas brGDGTs from Lake 578 in southern Greenland reveals the warmest period in the past 11 ka from ∼7.5 to 4.5 ka, with ice-free season temperature ∼4 to 6 °C higher than preindustrial in both timeseries (Schneider et al., 2024) (Fig. 1, point 14). Alpine glaciers in southern Greenland reached their smallest extent between ∼7.3 and 7.1 ka, implying the warmest temperature in the past ∼10.5 ka, with air temperature only ∼1 to 2 °C above present (Larocca et al., 2020) (Fig. 1; points 15, 18). Pollen-based reconstructions from Lake Qipisarqo suggest that the thermal maximum of the past 8.5 ka occurred between ∼7 and 5 ka, with summer air temperatures up to ∼5 °C higher than pre-industrial (Frechette and de Vernal, 2009) (Fig. 1; point 12). In contrast, nearby pollen-based reconstructions from Spongilla Sø and Comarum Sø imply the warmest summers of the past 10.5 ka occurred after 5.2 ka, with temperatures ∼1 to 2 °C higher than present (Fredskild, 1973; Gajewski, 2015) (Fig. 1; points 14 and 16). Additionally, marine reconstructions indicate the HTM between ∼6 and 2 ka, with summer sea surface temperatures (SST) up to ∼5 °C higher than present (Axford et al., 2021; Hansen et al., 2020; Ouellet-Bernier et al., 2014).
Several mechanisms have been called upon to explain differences in timing and magnitude of peak warmth: differing seasonal sensitivities of proxies, ice-sheet meltwater delaying warmth in marine archives, and vegetation lags causing delays in pollen records (Axford et al., 2021; Briner et al., 2016). Some of these mechanisms can be tested by generating time series from the same proxy in similar archives along a spatial gradient, thus avoiding possible differences caused by the archive/proxy.
Here we developed five new time series of brGDGT-inferred mean air temperatures for months above freezing (MAF) from lakes along a latitudinal transect from 64 to 69° N in southwestern Greenland, spanning the past 9 ka (Fig. 1). BrGDGTs are membrane-spanning lipids of bacteria (Sinninghe Damsté et al., 2000), and they are well preserved in lake sediments (Castañeda and Schouten, 2011; Schouten et al., 2013). BrGDGT distributions are primarily influenced by temperature (Raberg et al., 2021), and therefore, this proxy has shown promise as a quantitative high-latitude terrestrial paleotemperature proxy (e.g., Cluett et al., 2023; Lindberg et al., 2022; Schneider et al., 2024; Thomas et al., 2018). However, the influence of site-specific factors such as sub-oxic conditions (van Bree et al., 2020; Raberg et al., 2025; Weber et al., 2018; Wu et al., 2021), lake ice cover duration (Shanahan et al., 2013), and microbial ecology (Liang et al., 2024) should also be taken into consideration before reconstructing temperature. To investigate the influence of site-specific variations such as mixing regimes that may cause sub-oxic conditions, duration of ice cover, and differing sensitivity of each lake to air temperature change, we ran the lake energy, hydrologic, and isotopic mass balance model developed by Dee et al. (2018) and Hostetler and Bartlein (1990) and updated by Morrill et al. (2019) and Topness et al. (2026) for each lake under modern and perturbed climate scenarios. Overall, we aim to investigate (1) Holocene temperature evolution in southwestern Greenland, and (2) Possible causes of temporal differences in temperature maxima.
2.1 Study area and coring
We studied five lakes in southwestern Greenland with informal names: Pluto, N3, Rosaea, Marshall, and Bullet (Fig. 1). None of the lakes currently receives ice-sheet meltwater. Table 1 has detailed geographical and morphological features of each lake. Lakes Pluto (69.109° N, 51.032° W, 190 m a.s.l.; Fig. 1; point 1) and N3 (68.636° N, 50.981° W, 59 m a.s.l.; Fig. 1; point 2) are situated south of Ilulissat in western Greenland. Watershed vegetation consists of dwarf shrub heath, dominated by Salix sp. and Betula sp. (Bennike, 2000). On 27 July 2010, during core collection, depth profiles of temperature, conductivity, salinity, pH and dissolved oxygen were measured in Lake N3 (Corcoran et al., 2021; Thomas et al., 2016). During the field expedition in July 2009 (Pluto Lake) and late July 2010 (N3), both lakes had small inflowing streams and active channelized outflows. For more details, see Thomas et al. (2016, 2020).
Table 1Geographical and morphological characteristics including site ID in Fig. 1, latitude (lat), longitude (lon), elevation (m a.s.l.), catchment area (km2), maximum depth (m), surface area (km2), and closest estimated distances from Ice Sheet and Ocean (km2) of study lakes (Pluto, N3, Rosaea, Marshall, and Bullet), Lake Gus (Cluett et al., 2023) and Lake 578 (Schneider et al., 2024).
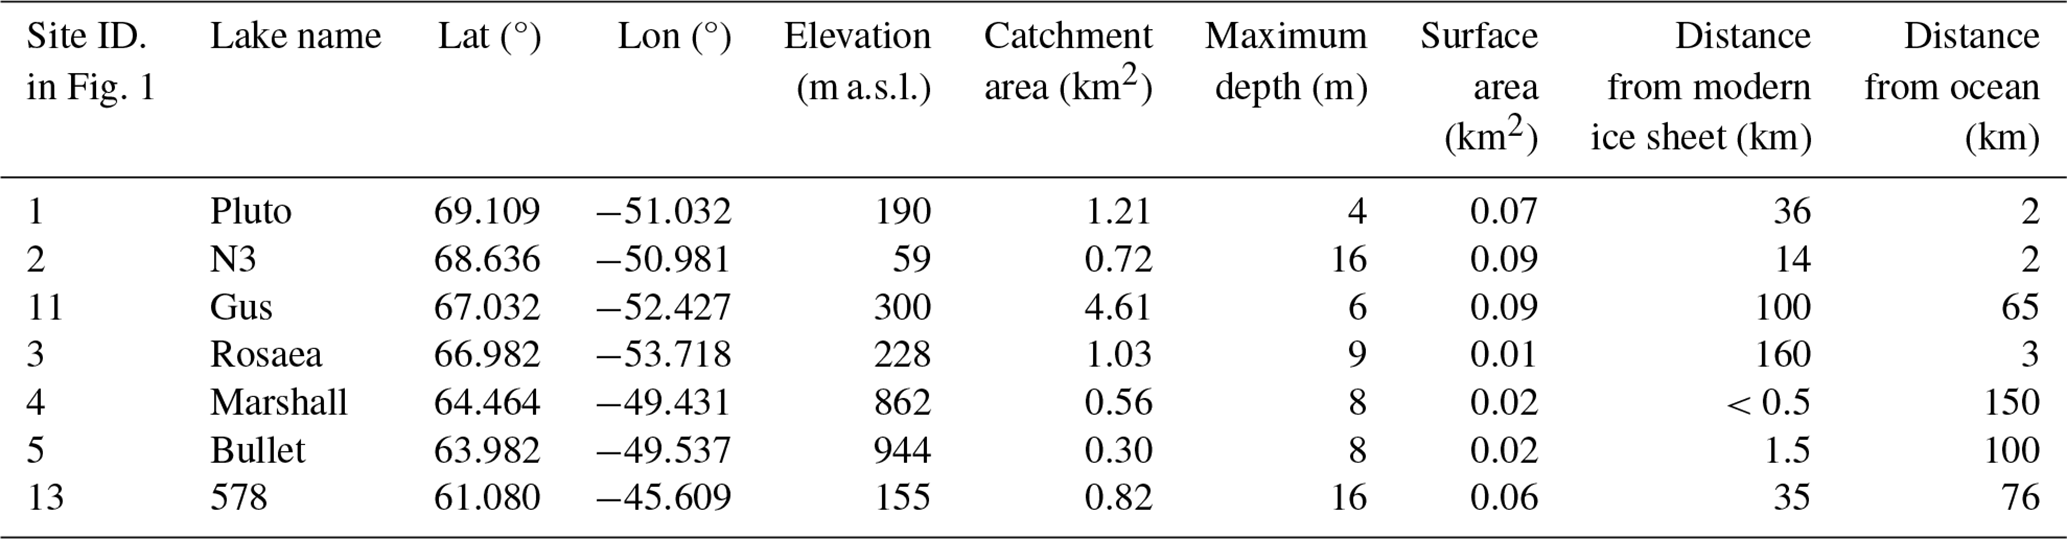
Lake Rosaea (66.982° N, 53.718° W; Fig. 1; point 3) is approx. 5 km north of Sisimiut in western Greenland and 3 km from the coastline of the Davis Strait. Watershed vegetation consists of shrubs, including S. glauca and S. herbacea on hill slopes, while Empetrum nigrum, Betula nana, and Rhododendron tomentosum are present on low-lying ground. Snowpack patches were observed around the lake and at higher elevations during the field expedition on 18–21 July 2018. Also, during that summer, the lake was fed by multiple active, channelized inflow streams and had an outflow stream.
Marshall (64.464° N, 49.431° W, 862 m a.s.l.; Fig. 1; point 4) and Bullet (63.982° N, 49.537° W, 944 m a.s.l.; Fig. 1; point 5) lakes are inland of Nuuk in southwestern Greenland. Marshall Lake is <2 km outboard of the modern ice sheet margin and received ice-sheet meltwater briefly during the historical maximum extent. Bullet Lake is located approx. 60 km south of Marshall Lake. Lake catchment vegetation includes Vaccinium uliginosum, E. nigrum, S. herbacea, and Sphagnum sp. Both Marshall and Bullet Lake catchments include shrubs and grasses on hillslopes and Eriophorum scheuchzeri, and Sphagnum sp. around the shoreline. Neither Marshall nor Bullet lakes had channelized inflow or outflow streams during the summer 2017 field season, although water flowed into and out of the lakes in rocky low-lying parts of the catchment.
The climate in coastal southwestern Greenland is influenced by atmospheric and oceanic conditions (Box et al., 2023; Westergaard-Nielsen et al., 2020). In the summer, moisture from North America contributes to the region, while in the winter, evaporation from proximal seas becomes the dominant moisture source (Cluett et al., 2021; Nusbaumer et al., 2019). Precipitation amounts are relatively high along the southernmost coast and decrease with increasing latitude (Cluett et al., 2021). From June to September, the temperature is above freezing, while in winter it drops well below freezing (Jensen et al., 2025). Temperature generally declines northward along the coast and with increasing elevation, where snow cover and radiative cooling are more pronounced (Jensen et al., 2025; Karami et al., 2017). The West Greenland coastal current carries warm water from the North Atlantic Ocean to Baffin Bay, and influences the climate in coastal southwestern Greenland (Westergaard-Nielsen et al., 2020), whereas the southernmost land on western Greenland is influenced by the East Greenland current, which carries cold Arctic water around the southern tip of the island (Fig. 1).
2.2 Sediment core chronology
14C-ages and age-depth models for the sediment cores from lakes N3 and Pluto are published by Thomas et al. (2016) and Thomas et al. (2020). Here, we updated the age-depth models for the lakes employing the IntCal20 calibration curve (Figs. S1 and S2 in the Supplement). Additionally, we developed age-depth models for Marshall, Bullet and Rosaea lakes (Figs. S3–S5 in the Supplement). The age-depth model for Marshall Lake is derived from 14C ages of seven aquatic moss macrofossils, and for Bullet and Rosaea Lakes from nine aquatic macrofossils (Tables S1–S3 in the Supplement). All age-depth models were calculated with rbacon in the GeoChronR package, using IntCal20 (Blaauw and Christen, 2011; McKay et al., 2021).
2.3 Biomarker analysis
We used the method described in Cluett et al. (2023) for the extraction and purification of GDGTs. Briefly, total lipids from homogenized 0.5 to 2 g of bulk sediment samples were extracted using a Dionex Accelerated Solvent Extractor 200 with 30 mL of dichloromethane (DCM) : methanol 9:1 (volume : volume, v:v). Afterwards, 0.1 µg of a C46 glycerol dialkyl glycerol tetraether was added to the total lipid extracts (TLE). TLEs were separated into neutral and acid fractions using aminopropyl silica gel columns eluted with DCM : isopropanol (2:1, v:v) and acids with 4 % acetic acid in DCM, respectively. Neutral fractions were further split into apolar, ketone, and polar fractions using alumina columns eluted with hexane : DCM (9:1, v:v), hexane : DCM (1:1, v:v), and DCM : MeOH (1:1, v:v), respectively. GDGTs contained in the polar fraction were filtered using 0.45 µm PTFE filters. GDGTs were analyzed on an Agilent 1260 Ultra High-Performance Liquid Chromatograph (UHPLC, Agilent 1260) coupled to an Agilent 6120 Mass Selective Detector (MSD) in selected ion monitoring (SIM) mode in the Biogeochemistry Laboratory at the University of Massachusetts Amherst. Two Waters BEH HILIC columns (2.1 mm×150 mm, 1.7 µm) were used in series. Chromatography was performed applying a three-phase isocratic solvent gradient using 100 % hexane (solvent A) and hexane : isopropanol (9:1, v:v, solvent B): (i) 18 % B, 25 min; (ii) ramp to 35 % B, 25 min; (iii) ramp to 100 % B; 30 min and system rinse. We followed the procedure described by Hopmans et al. (2016). Peak integration was done using the “chromatoPy” package in Python (Otiniano et al., 2025). We quantified GDGT concentration by calculating their response relative to the known amount of C46 internal standard added to each sample.
We analyzed 23 samples from Pluto Lake at ∼4 cm resolution, 69 samples from Lake N3 at ∼3 cm resolution, 44 samples from Rosaea Lake at ∼6 cm resolution, 23 samples from Marshall Lake at ∼4 cm resolution, and 22 samples from Bullet Lake at ∼7 cm resolution. All samples were from 0.5 cm-thick subsamples of sediment cores. The GDGT time series from Lake N3 is at 100-year-resolution for the past 8 ka. Those from lakes Pluto, Marshall, and Bullet provide 400-year-resolution, covering from 9 to 2 ka, 9 to 1 ka, and 9 to 1 ka, respectively. The GDGT time series from Lake Rosaea offers a 200-year-resolution, spanning from 9 to 1 ka.
2.4 Lake modelling
We ran sensitivity tests of the lake energy and water balance model developed by Dee et al., (2018) and Hostetler and Bartlein (1990) and modified by Morrill et al. (2019) and Topness et al. (2026). We used ERA5 climate data (air temperature, relative humidity, wind speed, incoming surface shortwave radiation, downward longwave radiation, surface pressure, and precipitation amount) averaged over the four grid boxes nearest each lake for 1 January 1994 to 31 December 2024, as meteorological input data (Muñoz Sabater, 2019). All meteorological inputs were at a 6-hourly timestep except total precipitation amount, which is hourly timesteps summed to a total 6-hourly precipitation amount. Lake surface areas were estimated using Google Earth, and catchment areas were estimated using the Arctic DEM in QGIS (Porter et al., 2022). Depth-area slices at a resolution of 1 m were estimated from bathymetry of each lake (Zhao et al., 2021), which was obtained either by sonar or by depth sounding with a weighted measuring tape. We ran the lake model for 30 years, with a 10-year spin-up period at the beginning using 1994 meteorological input data.
We calibrated and validated the lake model using observation data from Lake 578 in southwestern Greenland (Zhao et al., 2021). The lake has six-hourly temperature data for three years, from July 2016 to August 2019, collected from multiple depths, and is similar in geographic location and size to the lakes in our study, for which we have little to no observational data. To calibrate the model and identify the best-performing parameter for the lake's thermodynamic balance (snow albedo, slush albedo, shortwave extinction coefficient, neutral drag coefficient, sediment albedo, sediment conductivity, and sediment specific heat), we follow established methods (Cluett et al., 2023; Longo et al., 2020; Morrill et al., 2019; Topness et al., 2026). An ensemble of 1000 parameter sets was generated by simultaneously sampling each parameter from a uniform distribution using Latin Hypercube Sampling. Initial parameter distributions were wide but physically plausible ranges for natural lakes. The model was then run for each parameter set with ERA5 forcing data, and the resulting simulations were compared with observed lake temperature profiles from 2016 and 2017 (Fig. S6 in the Supplement). The 30 parameter sets that yielded the lowest root mean squared error (RMSE) were selected as the best-performing configurations.
We then conducted a validation step: we ran the lake model using the identified best-performing parameters and the ERA5 forcing data. The simulated lake temperatures were compared with Lake 578 temperature observations from 2018 and 2019 (Fig. S7 in the Supplement). While the model estimates a slight delay in spring warming relative to observations, it accurately reproduces observed ice-free season water temperatures at different depths (2.5, 5, 7.5, 10, and 14.5 m) (Fig. S7). Furthermore, the lake model successfully simulates the timing of ice-free season stratification in the lake from 2018 to 2019, albeit with an overestimated stratification duration (Fig. S8 in the Supplement). The model successfully simulates the lake being isothermal at the beginning and end of the ice-free season (Fig. S8). These results demonstrate that the model effectively simulates the thermodynamic processes, including temperature and stratification in Lake 578, despite a minor cold bias in spring. These results provide confidence that the subsequent sensitivity experiments examining lake surface temperature and ice-free-season stratification duration responses to prescribed changes in air temperature are reliable, although it should be noted that the ice-free-season isothermal duration might be underestimated in the model. In other words, the model is biased towards conditions that favor ice-free season stratification and thus bottom-water anoxic conditions, a key consideration for interpreting model results.
Next, we validated these parameters for Lake N3, the lake in our study with an ice-free-season temperature profile. We used the 30 best parameter sets identified in the calibration for Lake 578 and ERA5 data to simulate Lake N3 temperature for 30 years, including 2010, when we have temperature profile observations. There are minimal differences among parameter sets, and all agree well with observed lake temperatures, with root-mean-square error (RMSE) values of 0.7 °C at the surface, 1.0 °C at 5 m depth, and 3.5 °C at 10 m depth (Fig. S9 in the Supplement).
Given the similar size, morphometry, and climate conditions of Lake 578, Lake N3, and our other study lakes, we used the average of the 30 best-performing parameter values identified for Lake 578 to simulate all our study lakes. We used average parameter values rather than 30 individual parameter sets, as conducting sensitivity tests across all lakes using all 30 sets would be prohibitively computationally intensive. Furthermore, the changes forced by large climatological shifts dwarf the inter-parameter differences (Figs. S21–S23 in the Supplement). Thus, we have used the best available data, to our knowledge, to both calibrate and validate the model for lakes that are similar in size and geographic location to the study sites. We believe that the parameter values we use for sensitivity tests in our study lakes provide accurate estimates of their thermodynamic responses, including lake temperature and stratification. We acknowledge that using the same lake model parameters may lead to slight mismatches between absolute and modelled temperature values; however, for sensitivity tests at orbital scales, such changes can have only a minor impact (Figs. S21–S23). To evaluate the sensitivity of lakes to changes in air temperature, we perturbed the ERA5 input annual and summer (June to September) temperatures by ±10, ±6, ±4, and ±2 °C.
To evaluate the impact of shading on lake water temperature, we perturbed incoming short-wave radiation by ±10 %, ±25 %, and +50 %. We calculated shading from surrounding topography for each lake in Python using GDAL, with the Arctic DEM, for daytime (sunset to sunrise) at 15 min time steps every 10 d from April to September under modern insolation parameters. Wind direction at each lake was calculated using 6-hourly ERA5 climate data from 1 January 1994 to 31 December 2024.
3.1 Sources of brGDGTs and temperature implications
Total brGDGT concentration in these lake sediments from southwestern Greenland is about 6–10 times higher than total isoprenoid GDGT (isoGDGT), with both showing a similar downcore pattern across all lakes (Figs. S10–S14 in the Supplement). Caldarchaeol (GDGT-0) is the most abundant isoGDGT (Fig. S15a in the Supplement), followed by crenarchaeol (GDGT-4) and GDGT-1, whereas GDGT-2, GDGT-3, and the crenarchaeol isomer (GDGT-4′) were below detection limit in many samples, precluding TEX86-based temperature reconstruction (Schouten et al., 2002).
BrGDGTs in lake sediments can be allochthonous – produced in the catchment soil and transported to the lake via runoff erosion, and autochthonous – produced in the water column and/or surface sediment (Baxter et al., 2021; Tierney et al., 2012). BrGDGTs produced in these diverse environments can exhibit different responses to environmental conditions, thereby directly impacting temperature reconstruction (Acharya et al., 2023; Martin et al., 2020). Therefore, understanding the sources of brGDGTs is crucial before temperature reconstruction. We evaluated the sources of brGDGTs in southwestern Greenland lakes by comparing their distributions with those of high-latitude (>50° N) soil, peat, and lake sediment samples (Raberg et al., 2022). BrGDGTs from southwestern Greenland lakes have different fractional abundance of hexa-, penta-, and tetra-methylated brGDGTs than those in peat and soil samples but are similar to high-latitude lake surface sediment samples (Fig. S16 in the Supplement), suggesting lacustrine origin. Furthermore, brGDGT IIIa, which is produced in higher relative abundance in lake water than in soils (Weber et al., 2018), is abundant in the southwestern Greenland lake sediments, similar to high-latitude lake surface sediments, and greater than in high-latitude soils (Fig. S15b). This corroborates the autochthonous production of brGDGTs in southwestern Greenland lakes, although a minor contribution from the surrounding catchment cannot be ruled out.
While several lacustrine brGDGT–temperature calibrations are available globally (Martínez-Sosa et al., 2021; Raberg et al., 2021; Zhao et al., 2023), regionally (Bauersachs et al., 2023; Dang et al., 2018; Otiniano et al., 2023, 2024; Russell et al., 2018), and site-specifically (Bittner et al., 2022; Feng et al., 2019; Zhao et al., 2021), only Raberg et al. (2021), Zhao et al. (2021), and Otiniano et al. (2023, 2024) are based on the Hopmans et al. (2016) HPLC method separating GDGTs isomers and explicitly consider Arctic seasonal climate. The Raberg et al. (2021) and Otiniano et al. (2023, 2024) calibrations estimate mean air temperature for the months above freezing (MAF-T), while Zhao et al. (2021) estimate epilimnion lake water temperature for the ice-free season (Ice-free season lake water temperature, IFS LWT) (Fig. S17 in the Supplement). Given that Eq. (9) in Otiniano et al. (2024) provides the most recent calibration for Arctic lakes, using the extensive datasets synthesized from Otiniano et al. (2023), Raberg et al. (2021), and Zhao et al. (2021) and having the lowest prediction error (RMSE=1.0 °C), we applied this calibration to estimate MAF-T in this study. This calibration yields a Holocene temperature range of 3.8–8.6 °C for the study lakes (Fig. 2). Although brGDGT distributions in Arctic lakes are primarily controlled by temperature (Otiniano et al., 2024; Raberg et al., 2021; Zhao et al., 2021), recent studies suggest they can also be influenced by site-specific factors, e.g., production period of brGDGTs and oxygenation (Harning et al., 2025; Raberg et al., 2025). We discuss the potential impact of these site-specific factors on reconstructed temperatures in Sect. 3.3.
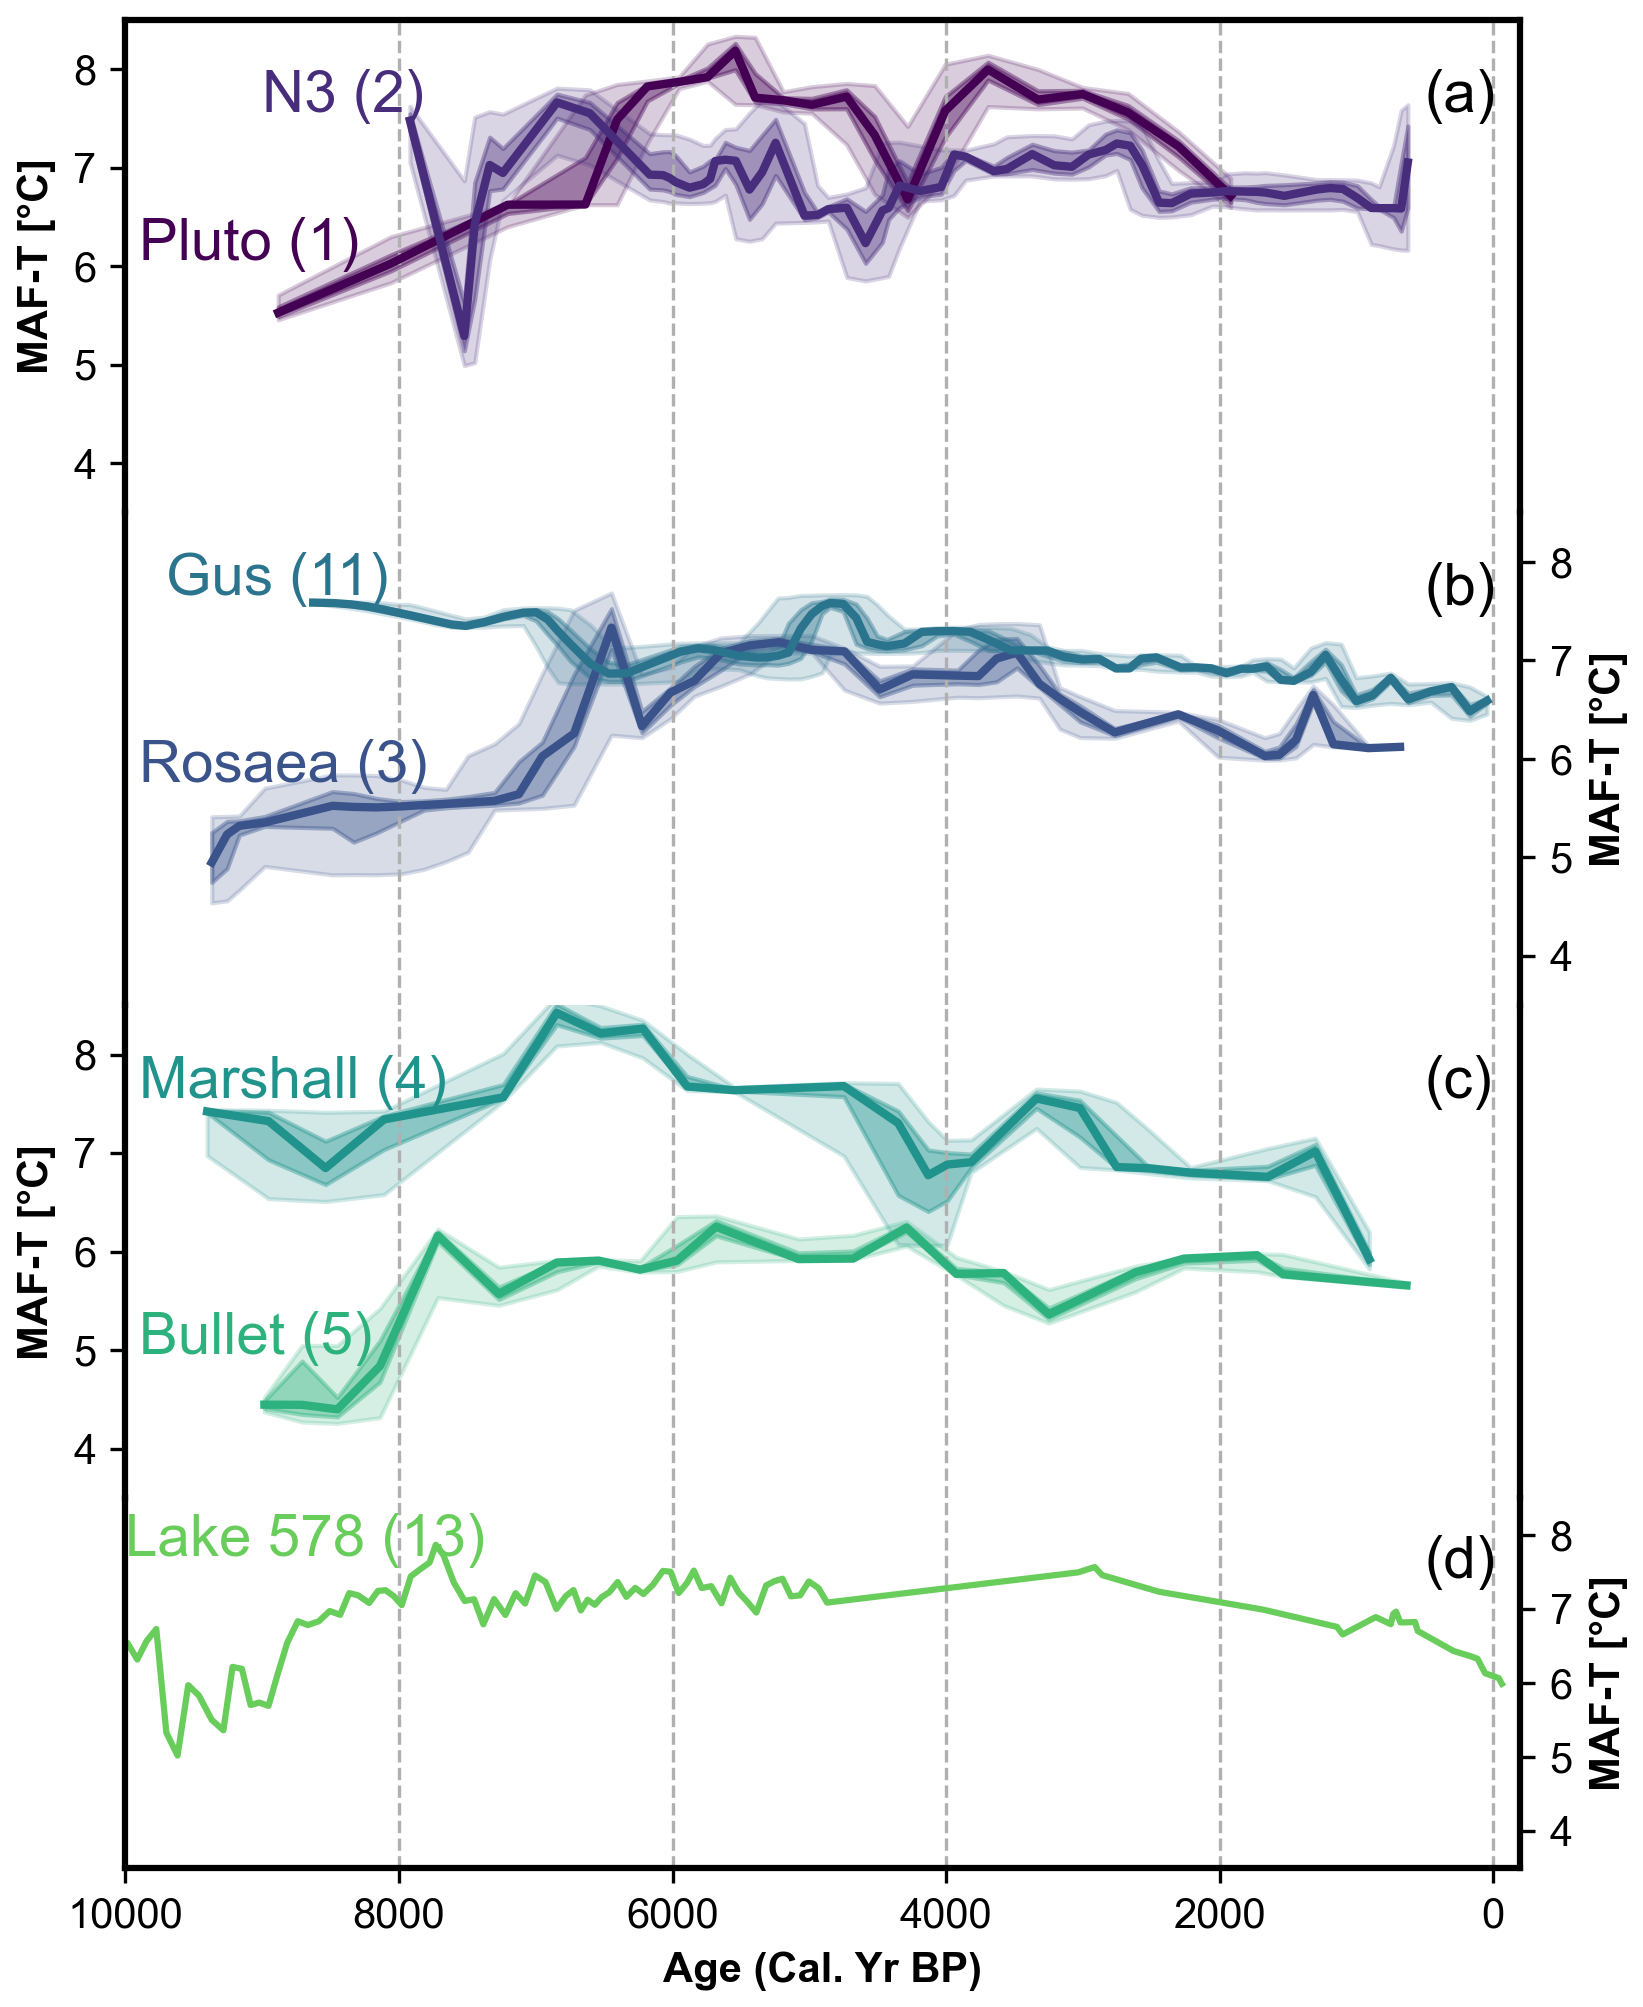
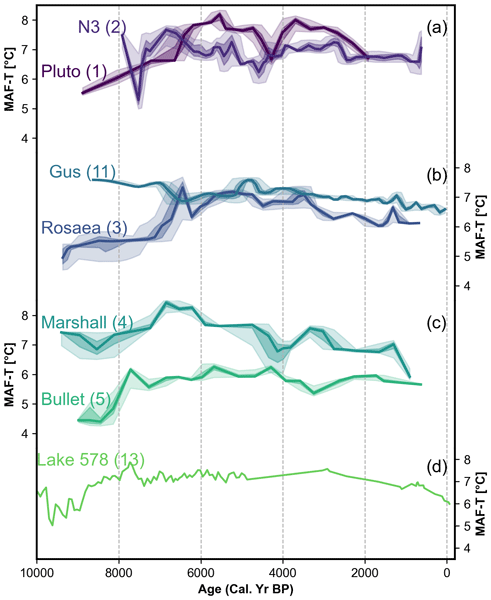
Figure 2Reconstructed mean air temperatures of the months above freezing (MAF-T) based on Otiniano et al. (2024) calibration for (a) Lakes N3 and Pluto at 69° N, (b) Lakes Gus (Cluett et al., 2023) and Rosaea at 67° N, (c) Lakes Marshall and Bullet at 64° N, and (d) Lake 578 at 61° N (Schneider et al., 2024). For timeseries in (a)–(c), the bold line indicates the median modelled age, and the light and dark shading represent the 95th percentile and interquartile age uncertainty, respectively. Numbers in parentheses next to site names refer to site IDs shown in Fig. 1. The Otiniano et al. (2024) calibration has a root mean square error of 1.0 °C.
The isomer ratio of 5- to 6-methyl brGDGTs (IR6Me) ranges from 0.13 to 0.51 across all study lakes (Figs. S10–S14). Previously, a non-thermal effect on lacustrine brGDGTs has been identified when IR6Me exceeds 0.4 (Bauersachs et al., 2023; Novak et al., 2025). In Lake Pluto, two Early Holocene samples have IR6Me>0.4; in Lake Bullet, the bottom sample has IR6Me>0.4 (Figs. S10–S14). Consequently, all samples with IR6Me>0.4 were excluded from the temperature reconstructions.
3.2 Holocene temperature variability
Reconstructed MAF-T shows both similarities and differences between time series, with differences not following a latitudinal gradient. Reconstructed MAF-T varies from 5.5 to 8.3 °C for Pluto, 5.0 to 7.8 °C for N3, 4.5 to 7.7 °C for Rosaea, 5.8 to 8.6 °C for Marshall, and 3.8 to 6.4 °C for Bullet, respectively (Fig. 2). In lakes Marshall and Rosaea, the temperature time series begin from approx. 9.5 ka, with relatively warm conditions indicated in Marshall Lake, while cold conditions prevail in Lake Rosaea (Fig. 2b and c). In Marshall Lake, the temperature decreased around 8.5 ka and then increased, peaking at approx. 7 ka. In lakes Pluto and Bullet, the temperature time series begins at approx. 9 ka and shows a trend towards warmer conditions, peaking at Pluto at 6 ka and at Bullet at 7.8 ka (Fig. 2). In Lake N3, the temperature time series begins at 8 ka with relatively warm conditions. In lakes N3, Marshall, and Pluto, the maximum temperature occurred between 7.5 and 5 ka (Fig. 2). Immediately following the peak warmth, MAF-T in these three lakes reveals a gradual cooling trend until approx. 4.5 ka, followed by warm conditions until 3 ka, then gradual cooling. In Rosaea, the temperature maximum began at the same time as at these other sites, around 7.5 ka, but lasted longer until 4 ka, followed by cooling until 1 ka. In Bullet Lake, the maximum temperature occurred between 7.8 and 4 ka, followed by cooling until 3 ka, a warming at 2 ka, and then cooling towards the present (Fig. 2c).
Overall, the pattern of reconstructed MAF-T in our study lakes, spanning 5° latitude in southwestern Greenland, is similar to the brGDGTs-inferred MAF-T timeseries from Lake Gus (Cluett et al., 2023) and Lake 578 (Schneider et al., 2024), although the timeseries from Lake Gus reveals a peak warmth two millennia earlier (from 9 to 7 ka) than other timeseries (7.5 to 5 ka) (Figs. 2 and 6). Next, we discuss the potential influence of site-specific factors on the seven brGDGT-inferred temperature time series in the region.
3.3 Possible influence of site-specific factors on reconstructed temperatures
BrGDGT-inferred MAF-T timeseries from southwestern Greenland show a lower absolute value at Lake Bullet. Moreover, the magnitude of the Holocene temperature change is lower at lakes N3, Gus, and Bullet, and higher at Rosaea than at Pluto, Lake 578, and Marshall. Additionally, the MAF-T time series from Lake Gus shows peak warmth two millennia earlier than those from other study lakes. To interpret these variations and explore the potential impact of site-specific factors on reconstructed temperatures, we examined possible mechanisms that could influence the brGDGT-inferred temperature time series from the seven lakes in southwestern Greenland.
3.3.1 Production period of brGDGTs
Lake ice regulates the availability of nutrients, light, and oxygen, thereby influencing the production period of bacteria producing brGDGTs. Therefore, the duration and timing of the ice-free season can influence the production period of brGDGTs (Loomis et al., 2014; Miller et al., 2018) and, consequently, reconstructed temperatures. Simulations of seven southwestern Greenland lakes under 30 years of modern climate suggest that all lakes exhibit <2 week inter-lake variation in the timing of the onset of the ice-free season (Fig. 3a). The duration of the ice-free season is approx. <20 d shorter in lakes Bullet and Marshall, likely due to their higher elevation and colder temperatures, and approx. 20 d longer in Lake 578, due to the lower elevation and higher temperature compared to lakes Pluto, N3, Gus, and Rosaea (Fig. 3a). Additionally, both the onset date and duration of the ice-free season respond similarly in all seven lakes to perturbations in annual air temperature (Fig. 3b and c). Annual ice-free season and JJAS surface water temperature of all the lakes vary similarly with changes in duration of the ice-free season (Fig. 3f–h). These results suggest that the temperature responses of the studied lakes to the same forcing are similar; therefore, if brGDGTs are produced during the ice-free season, their temperature responses should be similar among lakes if atmospheric temperature change is similar.
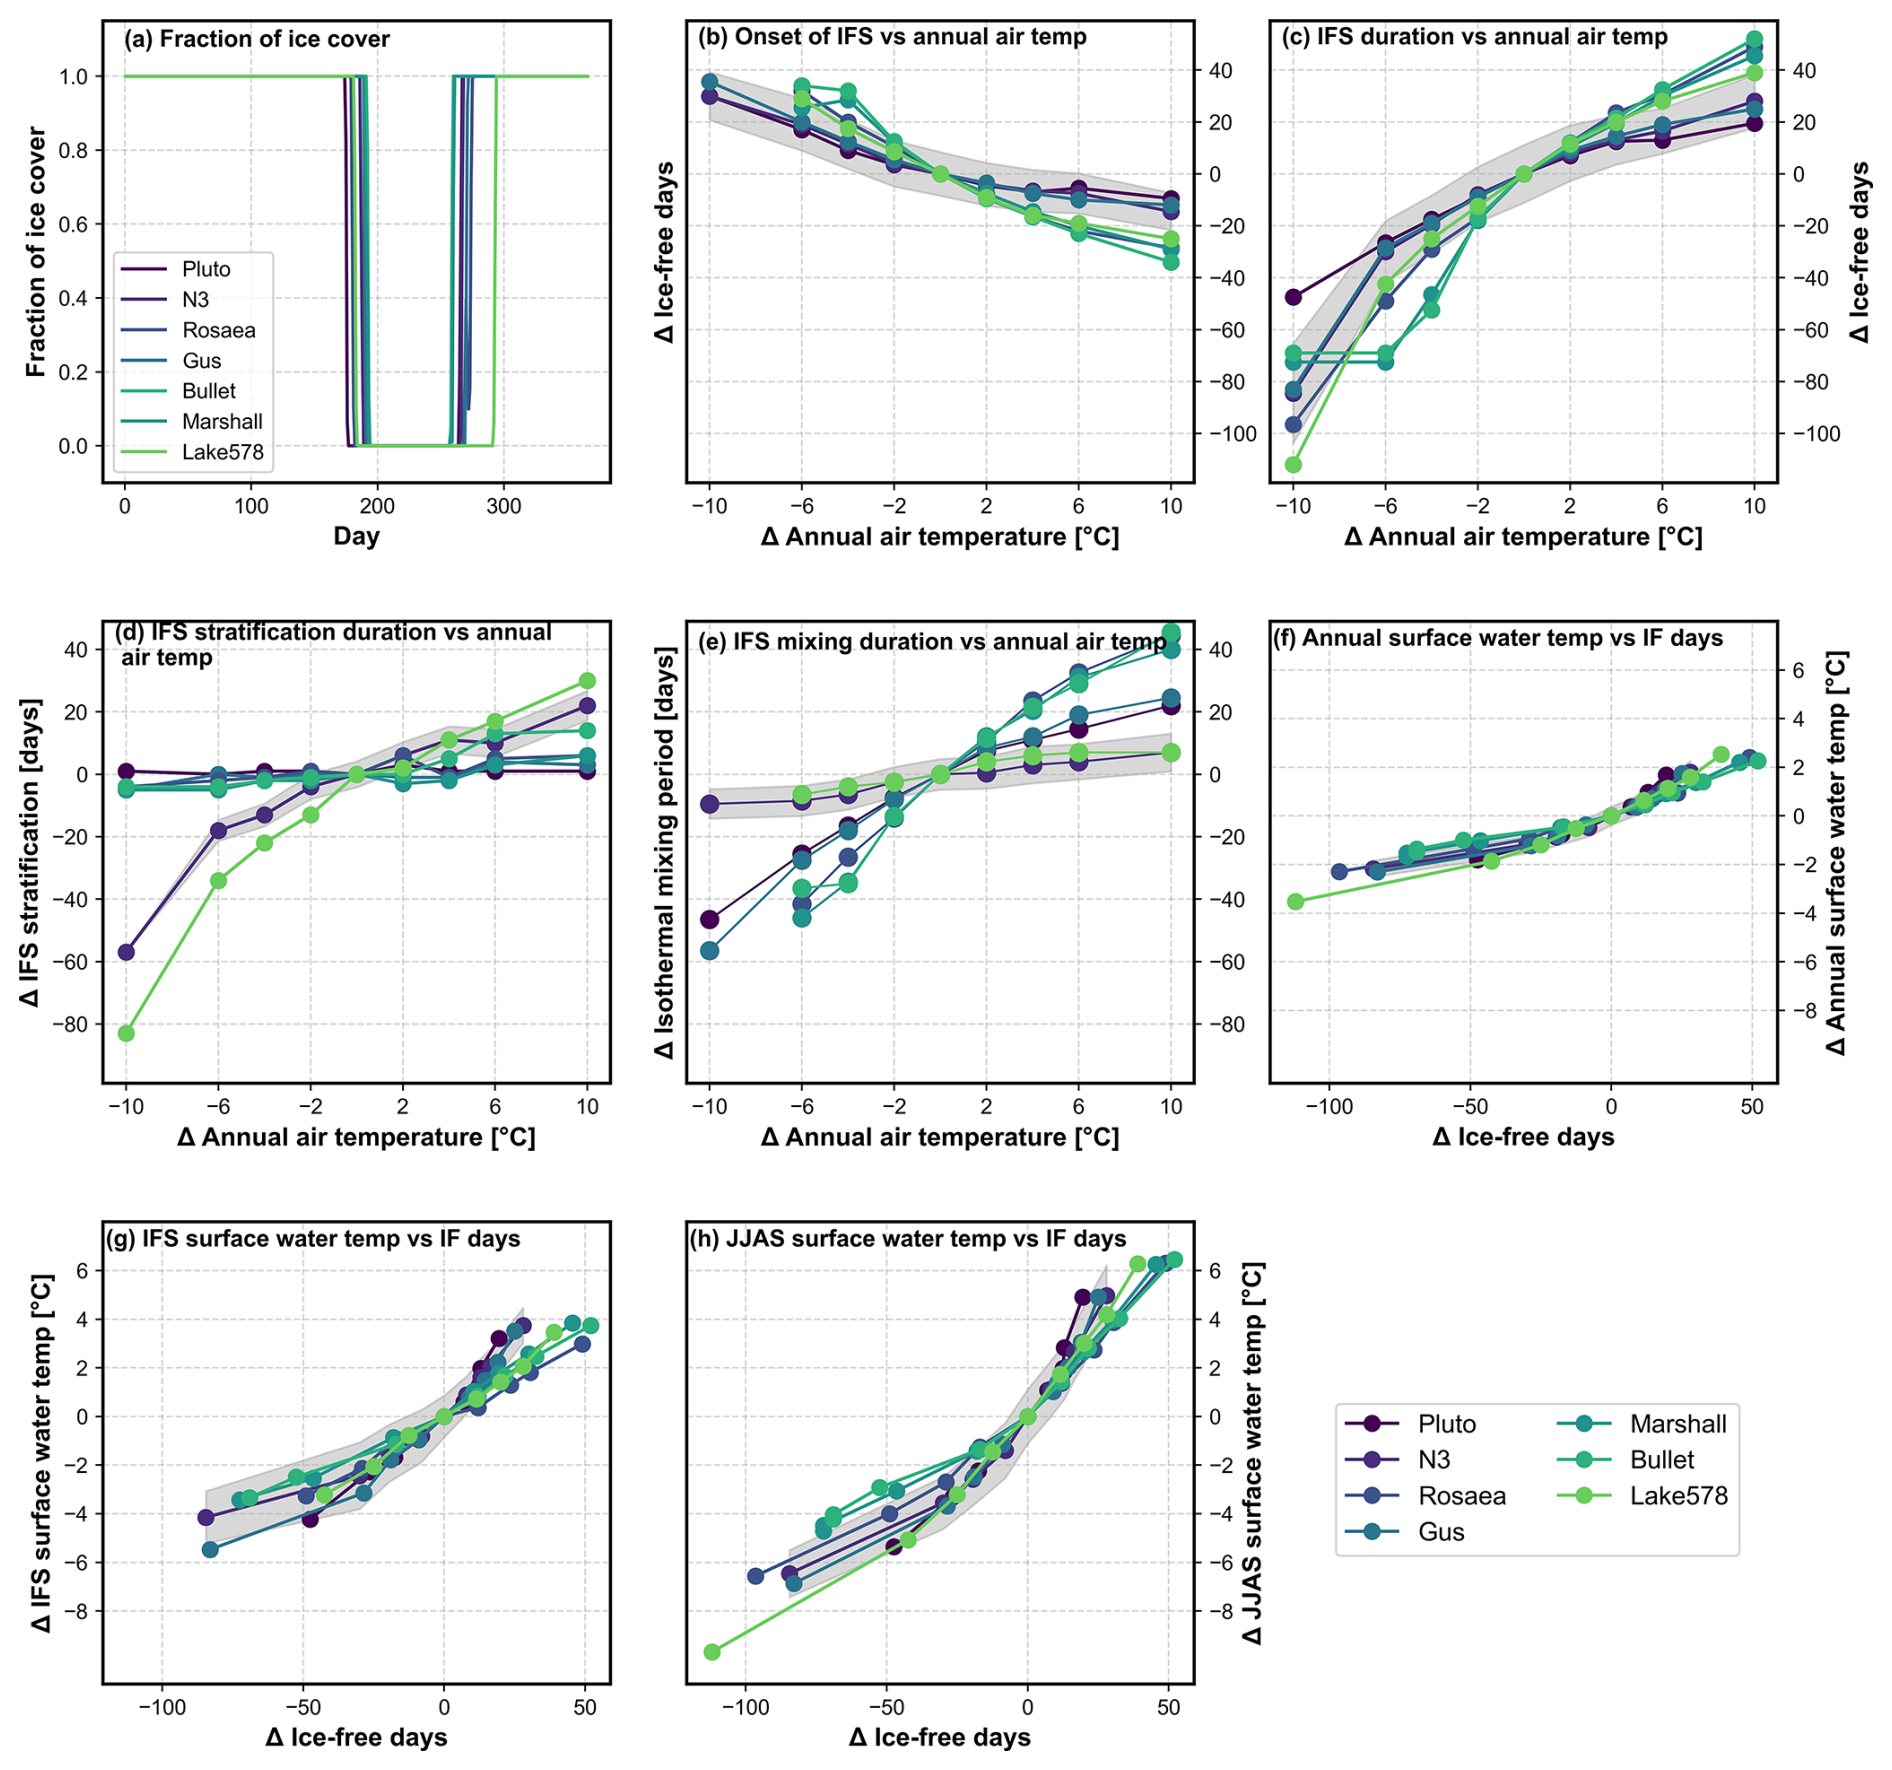
Figure 3Simulations of fraction of ice cover, duration of ice-free season (IFS), surface water temperature, IFS stratification, and IFS mixing period. (a) Simulations of the fraction of the lake covered by ice in study lakes. Line is the median value from the 30-year simulation under the modern climate. (b–h) Sensitivity tests where annual temperature is changed, shown as anomalies relative to the simulation under modern climate. Each point denotes the median value of the 30-year simulation. Grey shading represents the standard deviation for the 30 years simulated for Lake N3. Standard deviation is on the same order as for other lakes. (b–e) Response of lake ice-cover and mixing dynamics to changes in annual air temperature. (b) Onset date of ice-free conditions. (c) IFS duration. (d) IFS stratification duration (stratification defined as mixing depth less than 75 % of maximum lake depth). (e) IFS isothermal mixing duration (defined as mixing depth greater than 75 % of maximum lake depth). (f–h) Relationship between IFS duration and lake surface water temperature averaged across (f) the entire year (g) the IFS and (h) JJAS. For some lakes, simulations with temperature changes 10 °C lower than modern resulted in year-round ice cover; therefore, these simulations were not plotted.
3.3.2 Sensitivity of the lake system to air temperature change
The sensitivity of the study lakes to air temperature may vary due to differences in morphological characteristics and thermodynamics, potentially leading to variations in the reconstructed Holocene MAF-T (Dokulil et al., 2021; Kettle et al., 2004; Piccolroaz et al., 2020). However, lake model simulations indicate that the annual, IFS, and JJAS surface water temperatures of the seven lakes show similar responses to changes in annual air temperature (Fig. 4). The lake model also demonstrates a comparable, but slightly muted, response to JJAS air temperature perturbations (Fig. S20 in the Supplement). These findings suggest that, despite morphological differences, the surface water temperatures of the studied lakes are equally sensitive to variations in air temperature. The lake model sensitivity tests conducted here indicate a lake temperature response of approx. 0.4 to 0.6 °C for every 1 °C change in annual or JJAS air temperature, aligning with observations in Arctic lakes (Dokulil et al., 2021; Kettle et al., 2004; Piccolroaz et al., 2020). Since brGDGTs in lakes can be produced in surface waters, water columns, or sediment (Buckles et al., 2014; Yao et al., 2020; Zhao et al., 2021), we also examined the response of the average depth profile temperature of the lakes to perturbations in annual and JJAS air temperature (Figs. 4d–f and S20d–f). Similar to surface temperature, all lakes display comparable responses, except lakes N3 and 578, which show a slightly muted response, especially in the JJAS temperature profile, likely due to their greater maximum depths. Therefore, the increased depth of lakes N3 and 578 may have resulted in a slightly lower amplitude (roughly <0.5 °C) of Holocene temperature variations compared to the other lakes (Fig. 2). Nonetheless, about 1.5 °C lower absolute temperatures in Bullet Lake, and an earlier thermal maximum in Lake Gus compared to the other lakes cannot be attributed to sensitivity to air temperature forcing.
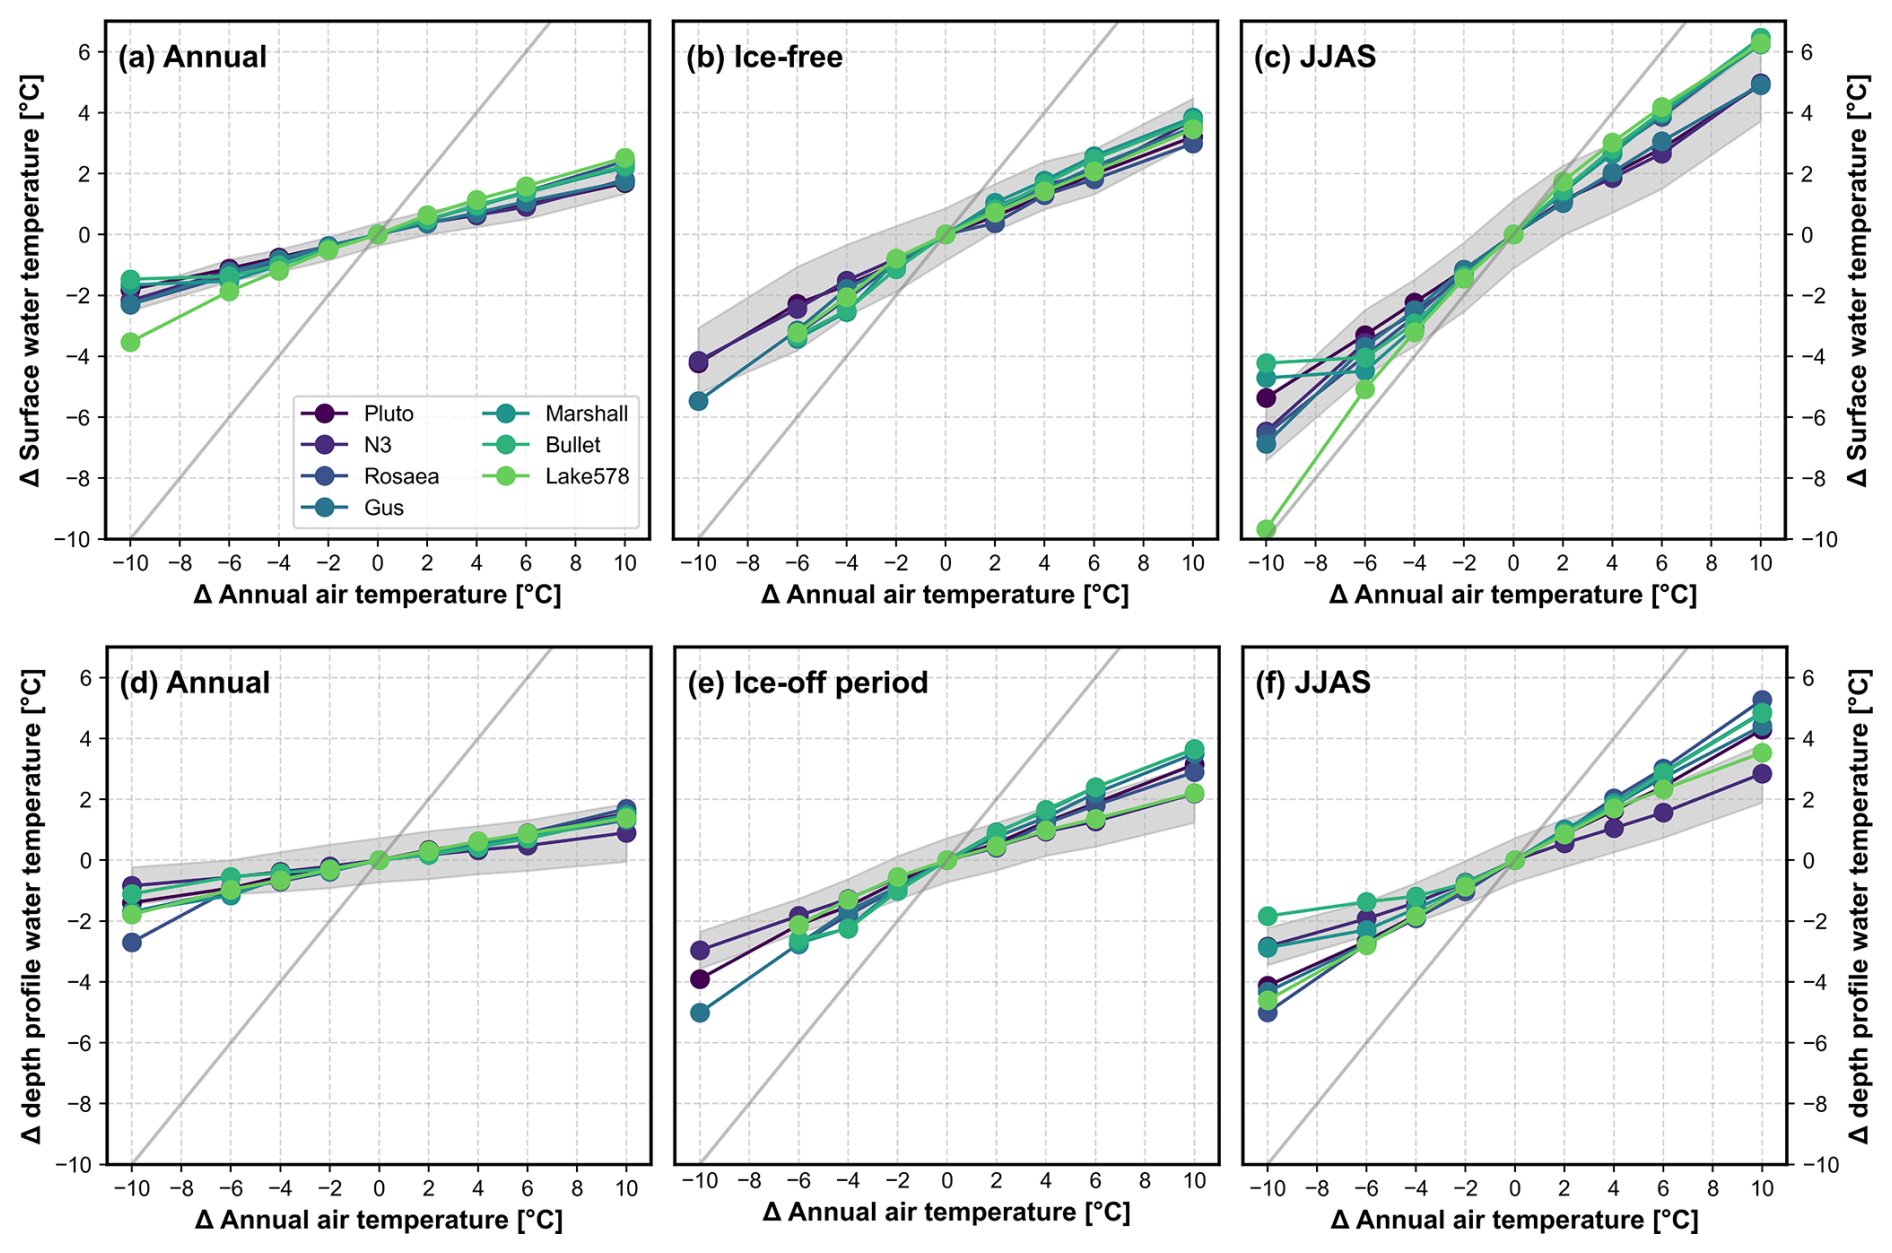
Figure 4Sensitivity of surface water (a–c) and average depth profile temperatures (d–f) to changes in annual air temperature. (a, d) annual, (b, e) IFS, (c, f) JJAS water temperature [°C]. Each point denotes the median value of the 30-year simulation. The grey line is the 1:1 line. Grey shading represents the standard deviation for the 30 years simulated for Lake N3. Standard deviation is on the same order as for other lakes. For some lakes, simulations under 10 °C lower magnitude of temperature change than modern resulted in year-round ice cover; therefore, these simulations were not plotted.
3.3.3 Anoxia
Aquatically produced brGDGTs in lakes may be influenced by anoxic or suboxic conditions, potentially biasing temperature reconstructions (Acharya et al., 2023; Harning et al., 2025; Raberg et al., 2025). Modern observations from Lake N3 indicate that stratification occurs early in the ice-free season, a pattern also supported by model simulations (Fig. S9). Consequently, changes in stratification dynamics throughout the Holocene may have affected brGDGT production and distribution in the study lakes. To assess this potential impact, we used the caldarchaeol-to-crenarchaeal ratio (CaldCren), a proxy for suboxic conditions in the water column and/or lake sediments where caldarchaeol is produced (Baxter et al., 2021; Blaga et al., 2009; Sinninghe Damsté et al., 2022). The CaldCren ratio ranged from 1 to 857 in all study lakes, with generally low values in lakes Marshall, and Rosaea and high values in lakes Bullet, N3, and Pluto (Fig. 5). The ratio was higher from 10 to 7 ka in lakes Rosaea, Bullet, Marshall, and Pluto suggesting reduced oxygen availability, while afterwards, it was lower, indicating higher oxygen availability. Similarly, the CaldCren ratio was higher in Lake N3 from 8 to 5 ka, suggesting lower oxygen availability, before decreasing to low levels. While anoxic or suboxic conditions are suggested by CaldCren, the lake model sensitivity tests under Holocene climate conditions (±5 °C) indicate that stratification occurs early in the ice-free season in all study lakes but does not persist throughout the entire ice-free period, meaning that oxygenated water is mixed to the lake bottom in late summer under all climate scenarios (Figs. 3 and S18 in the Supplement). This indicates that low-oxygen conditions are most likely to occur during the winter, when stratification lasts ∼7–8 months in the warmest model scenarios, but could also occur during the early ice-free season, when stratification lasts up to ∼3 months in the warmest simulations. Further, as the ice-free season duration increases, the duration of isothermal mixing increases, while the duration of stratification remains constant in relatively shallower (Pluto, Gus, Rosaea, Marshall, and Bullet) and increases in deeper study lakes (N3 and 578). This is due to the relatively shallow depths and low dissolved-solids concentrations in these lakes, which make them prone to mixing by solar heating and wind. Such mixing during summer is observed today in Arctic lakes with similar size and chemical composition (Antoniades et al., 2024; Klanten et al., 2023, 2024; Lindborg et al., 2016).
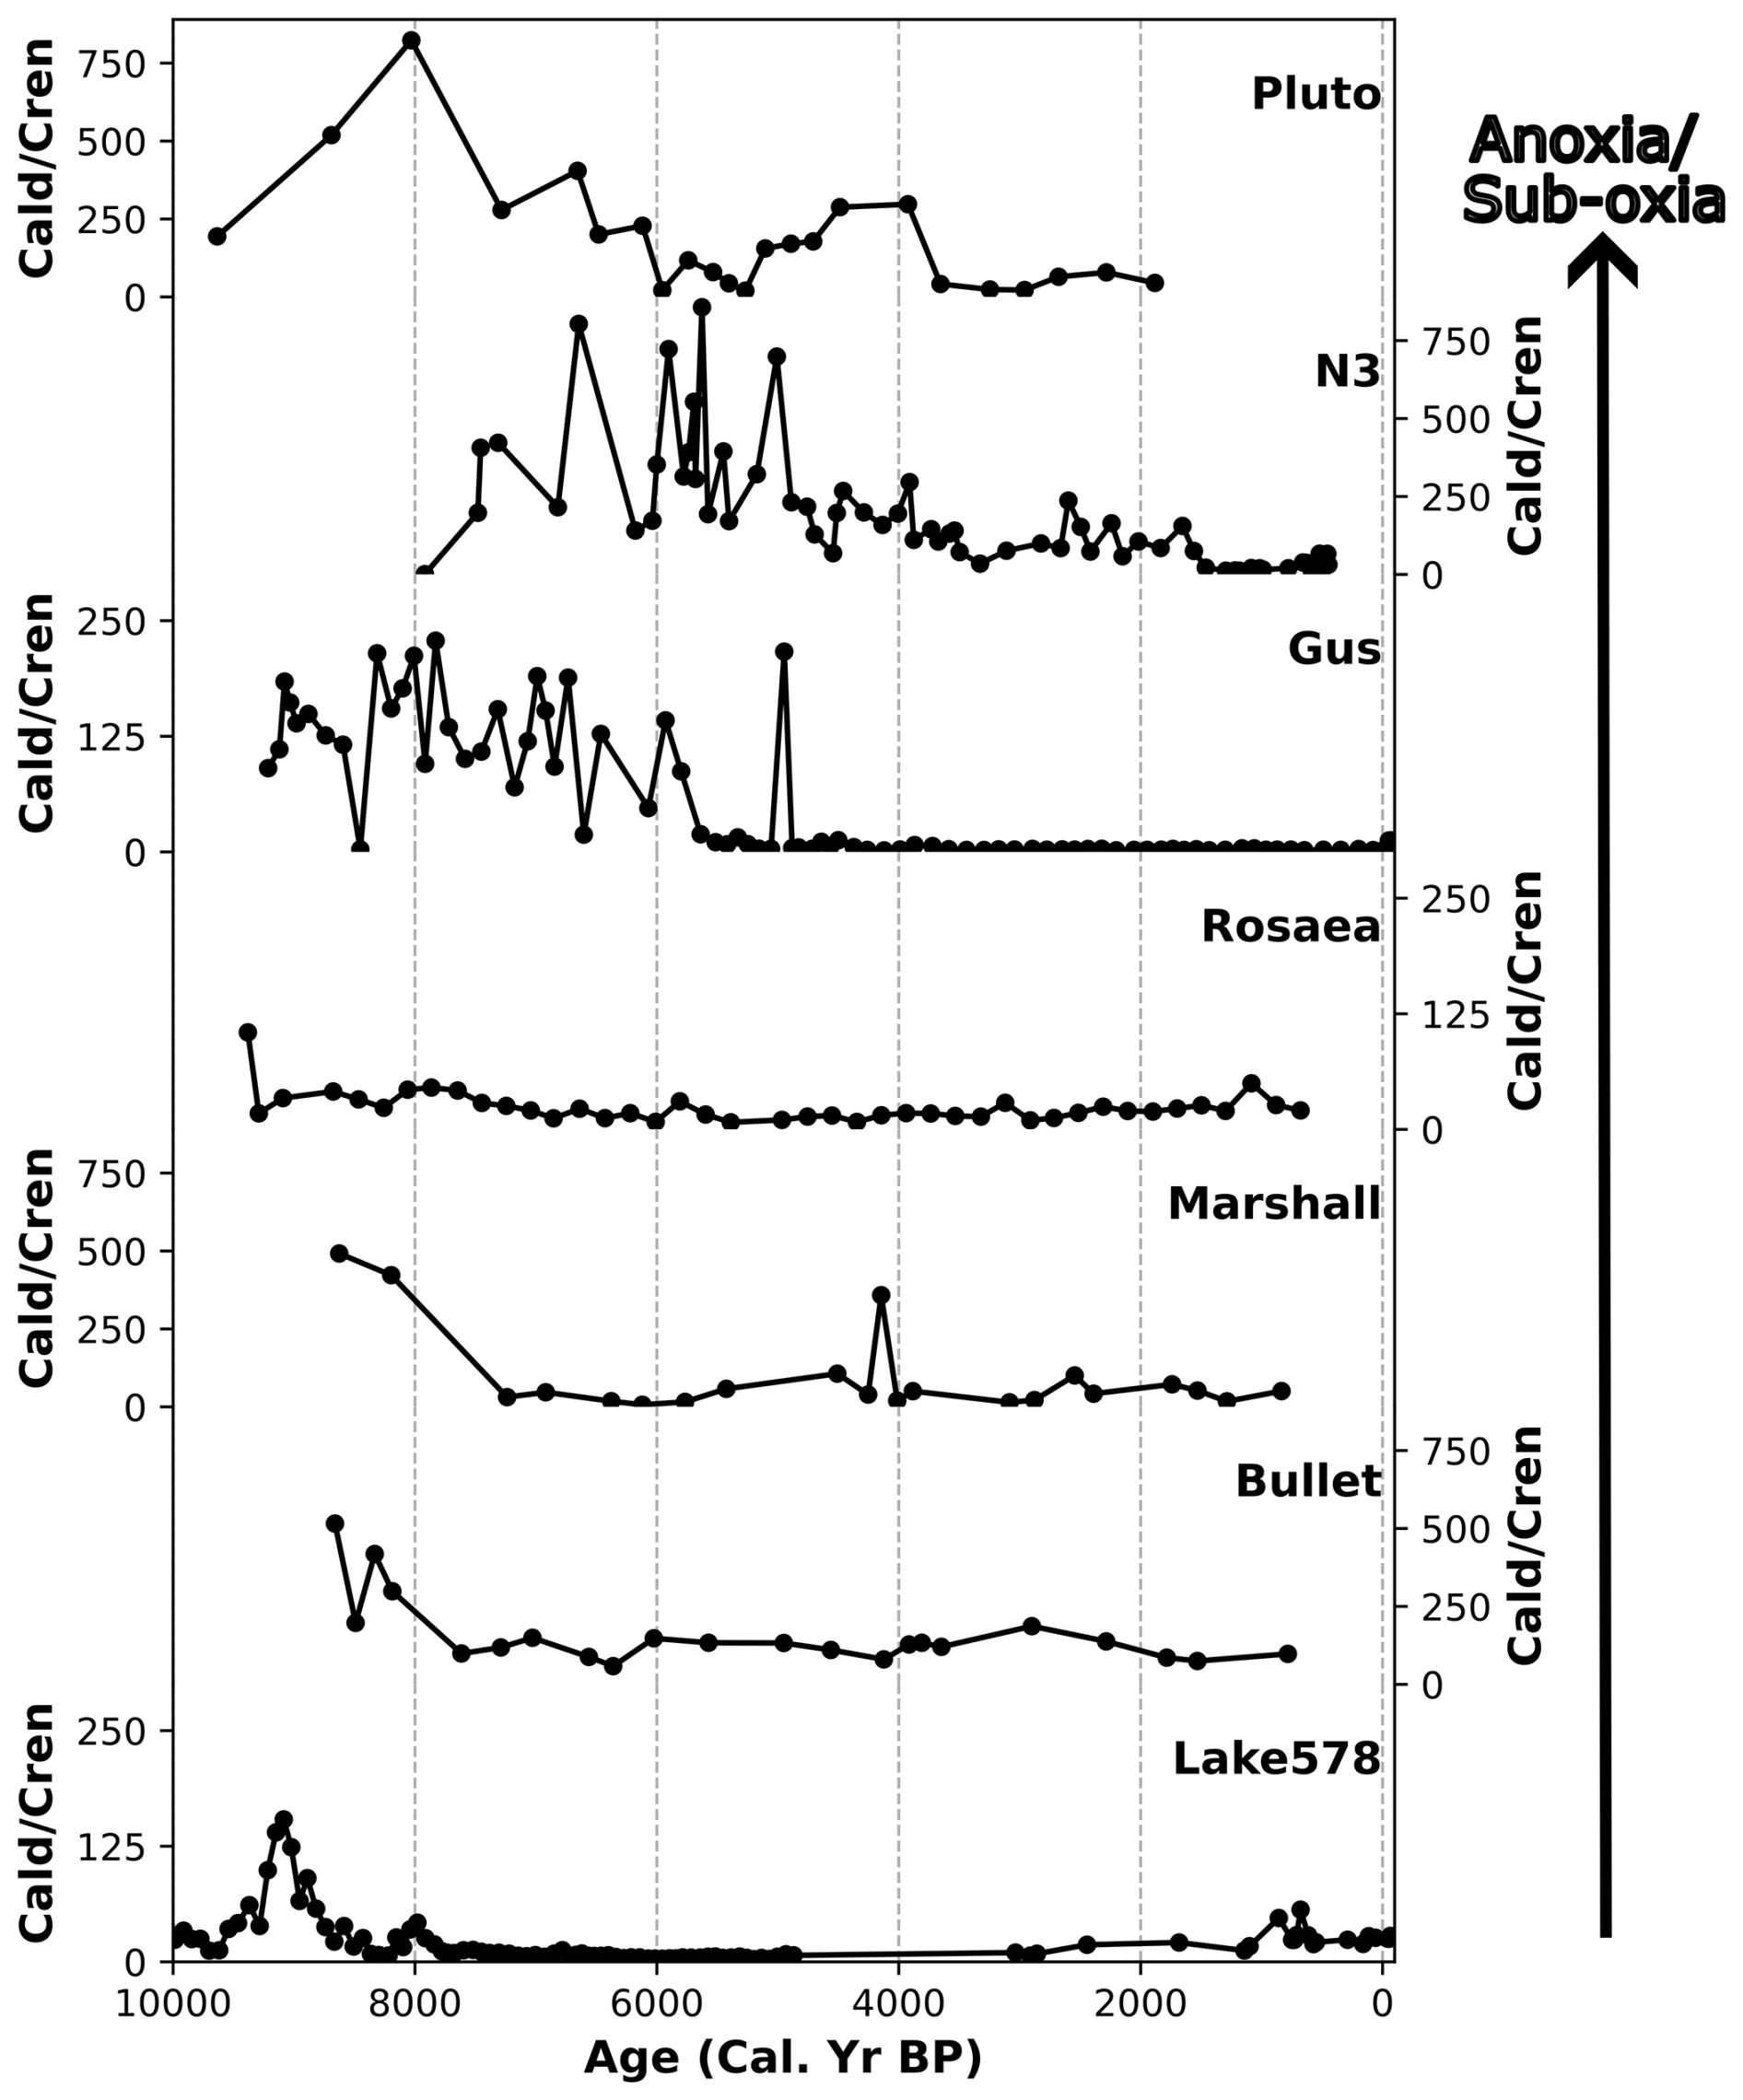
Figure 5Variations of the ratio of caldarchaeol to crenarchaeol (CaldCren) in the study lakes (Cluett et al., 2023; Schneider et al., 2024).
Correlations between CaldCren and reconstructed temperatures were weak or non-significant in Lakes N3 and Marshall throughout the Holocene (Table S4 in the Supplement), indicating climate as a primary mechanism controlling reconstructed temperature patterns. In contrast, significant negative correlations were present in Lakes Rosaea, Bullet, and Pluto (Table S4), suggesting potential redox-related effects on reconstructed temperatures during periods of inferred suboxia (10–7 ka). In Lake Gus, reconstructed temperatures were significantly correlated with CaldCren values (Table S4). However, samples with elevated CaldCren ratios also contained less than 30 % hexa-methylated brGDGTs, which was interpreted as indicating a shift in brGDGT sources rather than a direct redox effect on temperature calibration (Cluett et al., 2023). These samples were therefore excluded from the temperature reconstructions (Cluett et al., 2023). Similar to our study sites, Lake 578 exhibits high CaldCren values during the Early Holocene, and CaldCren values show a significant negative correlation with reconstructed temperature over the Holocene (Table S4) (Schneider et al., 2024). These high caldcren values were interpreted to indicate anoxia during the ice-covered period and/or early in the ice-free season, and likely did not influence the brGDGT-inferred temperatures due to mixing during the ice-free season (Schneider et al., 2024). Observations show that Lake 578 experiences isothermal mixing, which carries oxygenated water to the lake bottom, for at least half of the ice-free season. Lake 578 is similar to, or deeper than, the lakes in this study, and therefore likely experiences longer periods of ice-free-season isothermal mixing. Moreover, lake-model sensitivity tests suggest that all study lakes experience ≥1 month of isothermal mixing during the ice-free season, even under the warmest conditions. While we cannot completely rule out the effects of anoxia/suboxia and possible cold-bias on MAF-T in our study lakes during the period of high CaldCren from 10 to 7 ka, the fact that these lakes experience the most prolonged stratification in winter and significant isothermal mixing during the ice-free season suggests that the impact of anoxia/suboxia on brGDGT-inferred MAF-T is minimal.
We next examine brGDGT compounds that have been interpreted in some settings as indicating suboxic conditions. Although the ratio of 5-methyl hexa-methylated and penta-methylated brGDGTs with no cyclopentane rings (HP5) index and the fractional abundance of brGDGT IIIa (%IIIa) are suggested as indicators of anoxia in large and permanently stratified lakes (Weber et al., 2018; Yao et al., 2020), both 5-methyl hexa-methylated and penta-methylated brGDGTs exhibit a strong temperature dependence in Arctic lakes (Martínez-Sosa et al., 2021; Otiniano et al., 2023, 2024; Raberg et al., 2021) and can also be influenced by soil-derived input (Acharya et al., 2023; Martin et al., 2019). In Bullet Lake, CaldCren showed a non-significant correlation with both HP5 and %IIIa (Table S4). In Lake Rosaea, significant positive correlations were observed between CaldCren and both HP5 and %IIIa (Table S4). In Marshall and Pluto lakes, CaldCren was significantly positively correlated with HP5 but not with %IIIa. In Lake N3, no significant correlation was found with HP5, whereas a significant negative correlation was observed with %IIIa. As isoGDGTs and brGDGTs are produced by different microbial communities – brGDGTs by bacteria and isoGDGTs by archaea – these variable relationships may reflect seasonal and/or spatial differences in the niche of these microbial communities, which are subject to future study. Notably, across all our study lakes, both HP5 and %IIIa show a significant negative relationship with reconstructed temperature, consistent with previous studies indicating that these proxies have a strong temperature dependence in Arctic settings (Martínez-Sosa et al., 2021; Otiniano et al., 2023, 2024; Raberg et al., 2021).
Similarly, brGDGT IIIa′′ has been suggested to be influenced by anoxia in a permanently stratified lake (Weber et al., 2015, 2018), but it shows no significant correlation with oxygen in Arctic lakes (Raberg et al., 2025). Moreover, brGDGT IIIa′′ is present only in lakes Bullet and Rosaea, and the Holocene trends between brGDGT IIIa′′ and CaldCren in these lakes are decoupled (Figs. S12 and S14). This evidence suggests that brGDGT IIIa′′ is also not a reliable indicator of anoxia, or at least is produced under different conditions than the anoxia-sensitive isoGDGTs, in these lakes.
3.3.4 North-South pattern in timing of temperature maxima
A north–south gradient in the magnitude and timing of the Holocene thermal maximum has been suggested in Greenland, with a greater magnitude and earlier thermal maximum in the north and a lower magnitude and later thermal maximum in the south, caused by Arctic Amplification (Axford et al., 2021; Briner et al., 2016; Kaufman, 2004). If this pattern holds true in southwestern Greenland, the lakes at the highest latitudes in our study transect (Pluto and N3) should exhibit higher magnitudes and earlier temperature maxima than lakes at lower latitudes (Rosaea and Gus, 67° N; Marshall and Bullet, 64° N; and 578, 61° N). However, the timing of the temperature maximum at the southernmost site, Lake 578 (8 to 5 ka), is slightly earlier or within age uncertainty of that of N3 and Pluto at 69° N and Lake Marshall at 64° N, occurring between ca. 7.5 to 5 ka (Fig. 2). Moreover, Lake Bullet, situated at a similar latitude to that of Lake Marshall, exhibits a prolonged temperature maximum between ca. 7.8 to 4 ka. The timeseries showing an earlier temperature maximum between 9 and 6 ka occurs in the middle of the transect, at Lake Gus (67° N). This earlier timing in temperature maximum at Lake Gus is not observed in the timeseries from Lake Rosaea, at the same latitude, where peak temperatures occurred between ca. 7.5 and 3 ka (Cluett et al., 2023). A similar timing of the thermal maximum among six of the seven brGDGT time series from southwestern Greenland suggests that Arctic Amplification was likely not the primary mechanism setting the timing of peak warmth in this region.
3.3.5 Ice sheet and ocean proximity
Lakes Bullet and Marshall are <2 km from the margin of the modern Greenland Ice Sheet, whereas lakes N3, 578, and Pluto are >10 km, and lakes Gus and Rosaea are >100 km away (Table 1). Deglaciation from lakes Gus, Rosaea, Marshall, Bullet, and 578 occurred before 10 ka (Leger et al., 2024). The margin of the Greenland Ice Sheet was relatively stable from 9 to 6 ka near lakes Marshall, Bullet, and 578, while it was receding inland from lakes Rosaea and Gus. Since 9 ka, the margin of the ice sheet was always at least 50 km inland from lakes Rosaea and Gus. By contrast, lakes N3 and Pluto deglaciated at ∼8 ka (Leger et al., 2024; Young et al., 2013), and the margin of the Greenland Ice Sheet was <3 km aerial distance from these lakes until 7.5 ka. The margin of the southwestern Greenland Ice Sheet retreated inland of its present-day margin around 6 ka and returned to its present margin around 1850 AD (Leger et al., 2024), although the little available evidence suggests the retreat was <10 km (Briner et al., 2014; Cronauer et al., 2016; Lesnek et al., 2020). This suggests that lakes Bullet, Marshall, Pluto, and N3 could have been significantly influenced by the proximity of the ice sheet during the Holocene, while Lakes Rosaea and Gus are minimally influenced, and Lake 578 might be moderately influenced. Thus, the fact that peak warmth occurred after 8 ka, following ice sheet retreat from Lakes Marshall, Bullet, N3, and Pluto, suggests that the ice sheet may have kept local conditions cold. In contrast, peak warmth at Lake Gus occurred earlier, consistent with its more distal position relative to the ice margin. Lake Rosaea, however, shows a later thermal maximum than at Lake Gus, despite its distal position relative to the ice margin, indicating that additional regional factors contributed to relatively cold conditions between ∼9 and 7.5 ka.
Ocean conditions influence coastal climate by affecting ocean-atmosphere heat transfer (Bashmachnikov et al., 2023). A warmer ocean releases heat into the atmosphere, resulting in warmer coastal climates; conversely, a colder ocean leads to cooler coastal climates. Lakes Bullet and Marshall are ≥100 km, and lakes 578 and Gus are >60 km from the open ocean (Table 1). Thus, the ocean influence on these lakes is likely minimal. Lakes N3, Pluto, and Rosaea are situated near the ocean (<3 km). Modern wind directions at Lake Rosaea are predominantly southerly, meaning that most air masses at Lake Rosaea come directly from the Labrador Sea and Davis Strait (Fig. 6a). About 20 % of winds at Lake Rosaea are northerly, meaning they pass over Baffin Bay prior to arriving at Lake Rosaea. In contrast, at lakes Pluto and N3, wind direction is more variable, meaning that half of the air masses originate from land and half from Disko Bugt (Fig. 6a). This suggests that Lake Rosaea is strongly influenced by the influenced by oceanic conditions via ocean-atmosphere heat exchange, while lakes N3 and Pluto are moderately influenced. During the Early Holocene, summer sea surface temperatures (SST) in Disko Bugt and Baffin Bay (Fig. 7j and k), as well as other North Atlantic SST time series, were cold, likely due to meltwater from the rapidly retreating Greenland Ice Sheet and a weaker western Greenland Current (Gibb et al., 2015; Hansen et al., 2020). SSTs rose during the Middle Holocene due to decreased meltwater from the Greenland Ice Sheet and increased influence of warm Atlantic water masses (Ouellet-Bernier et al., 2014; Perner et al., 2013). The pattern of reconstructed MAF-T in Lake Rosaea is similar to the SST time series from Disko Bugt and Baffin Bay. This suggests that cold SSTs in the region likely led to cold conditions in Lake Rosaea from 10 to 7.5 ka.
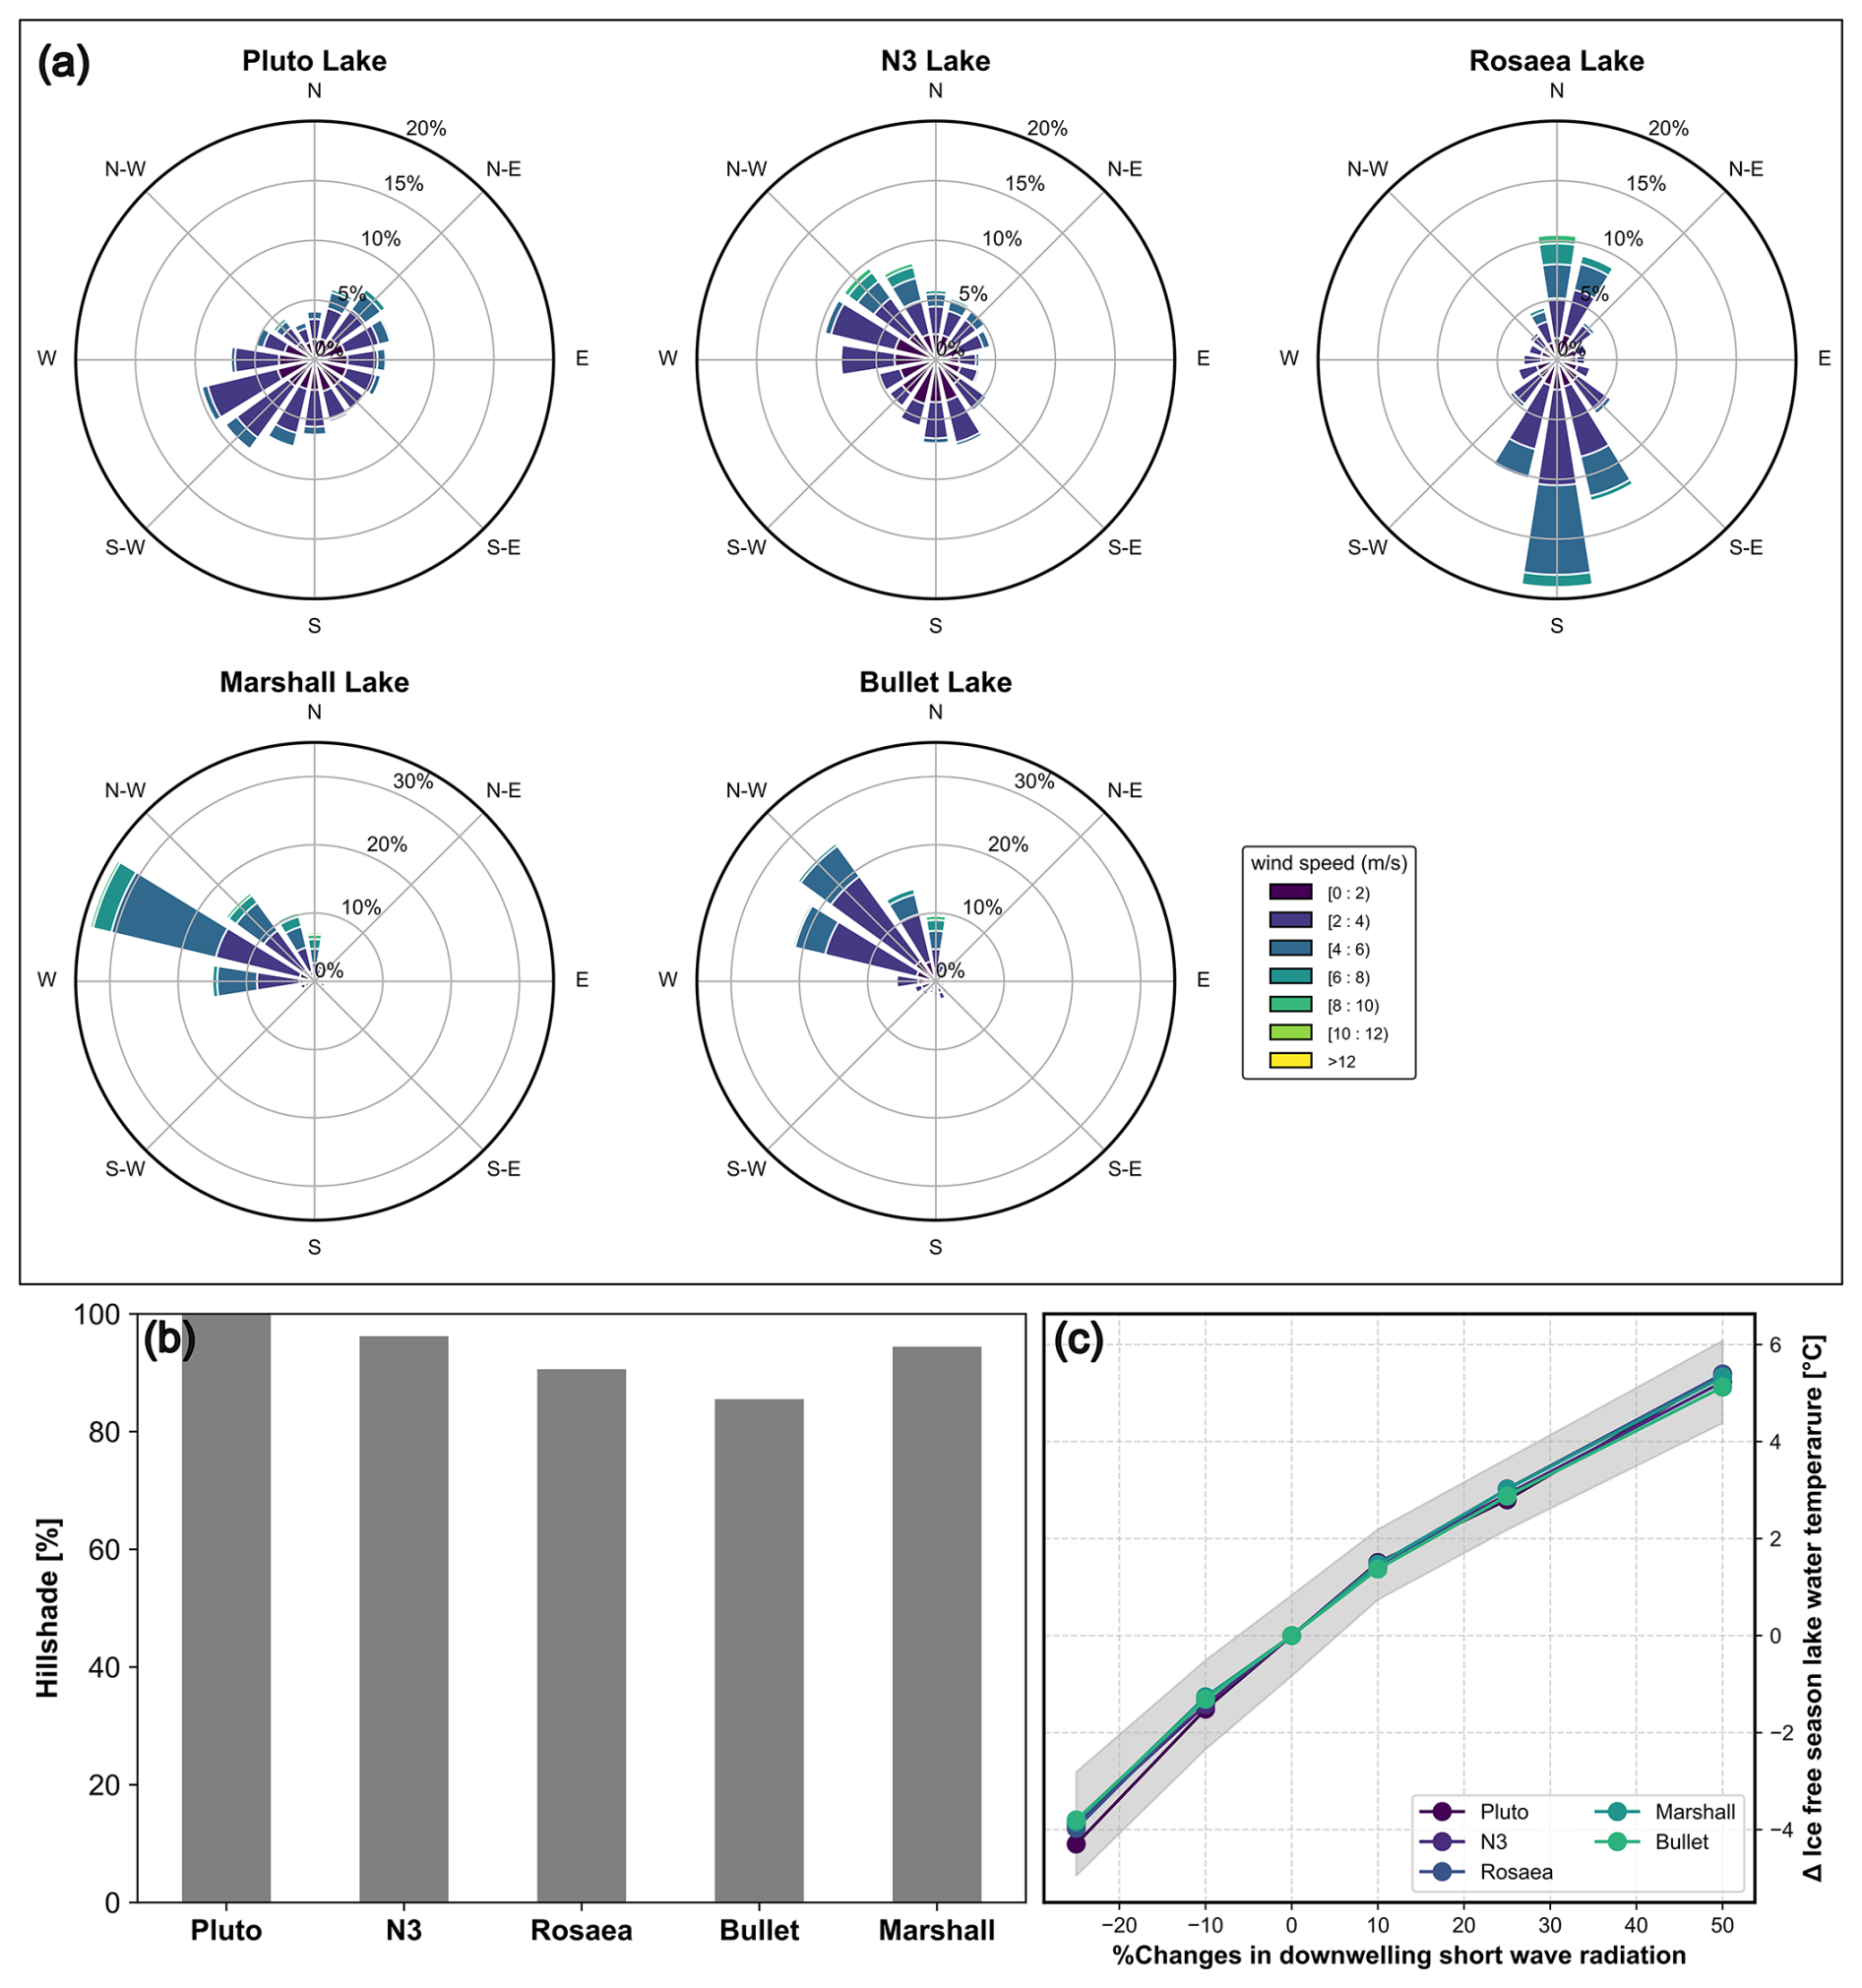
Figure 6(a) Wind strength and direction at the study lakes from April to September, based on six-hourly ERA5 data from 1994 to 2024. (b) Percentage change in average summer (April to September) direct radiation on study lakes relative to Pluto Lake, which is the least shaded of the five. (c) Sensitivity of average surface water temperature to changes in incoming shortwave radiation. Each point denotes the median value of the 30-year simulation. Grey shading represents the standard deviation for the 30 years simulated for Lake N3. Standard deviation is on the same order as for other lakes.
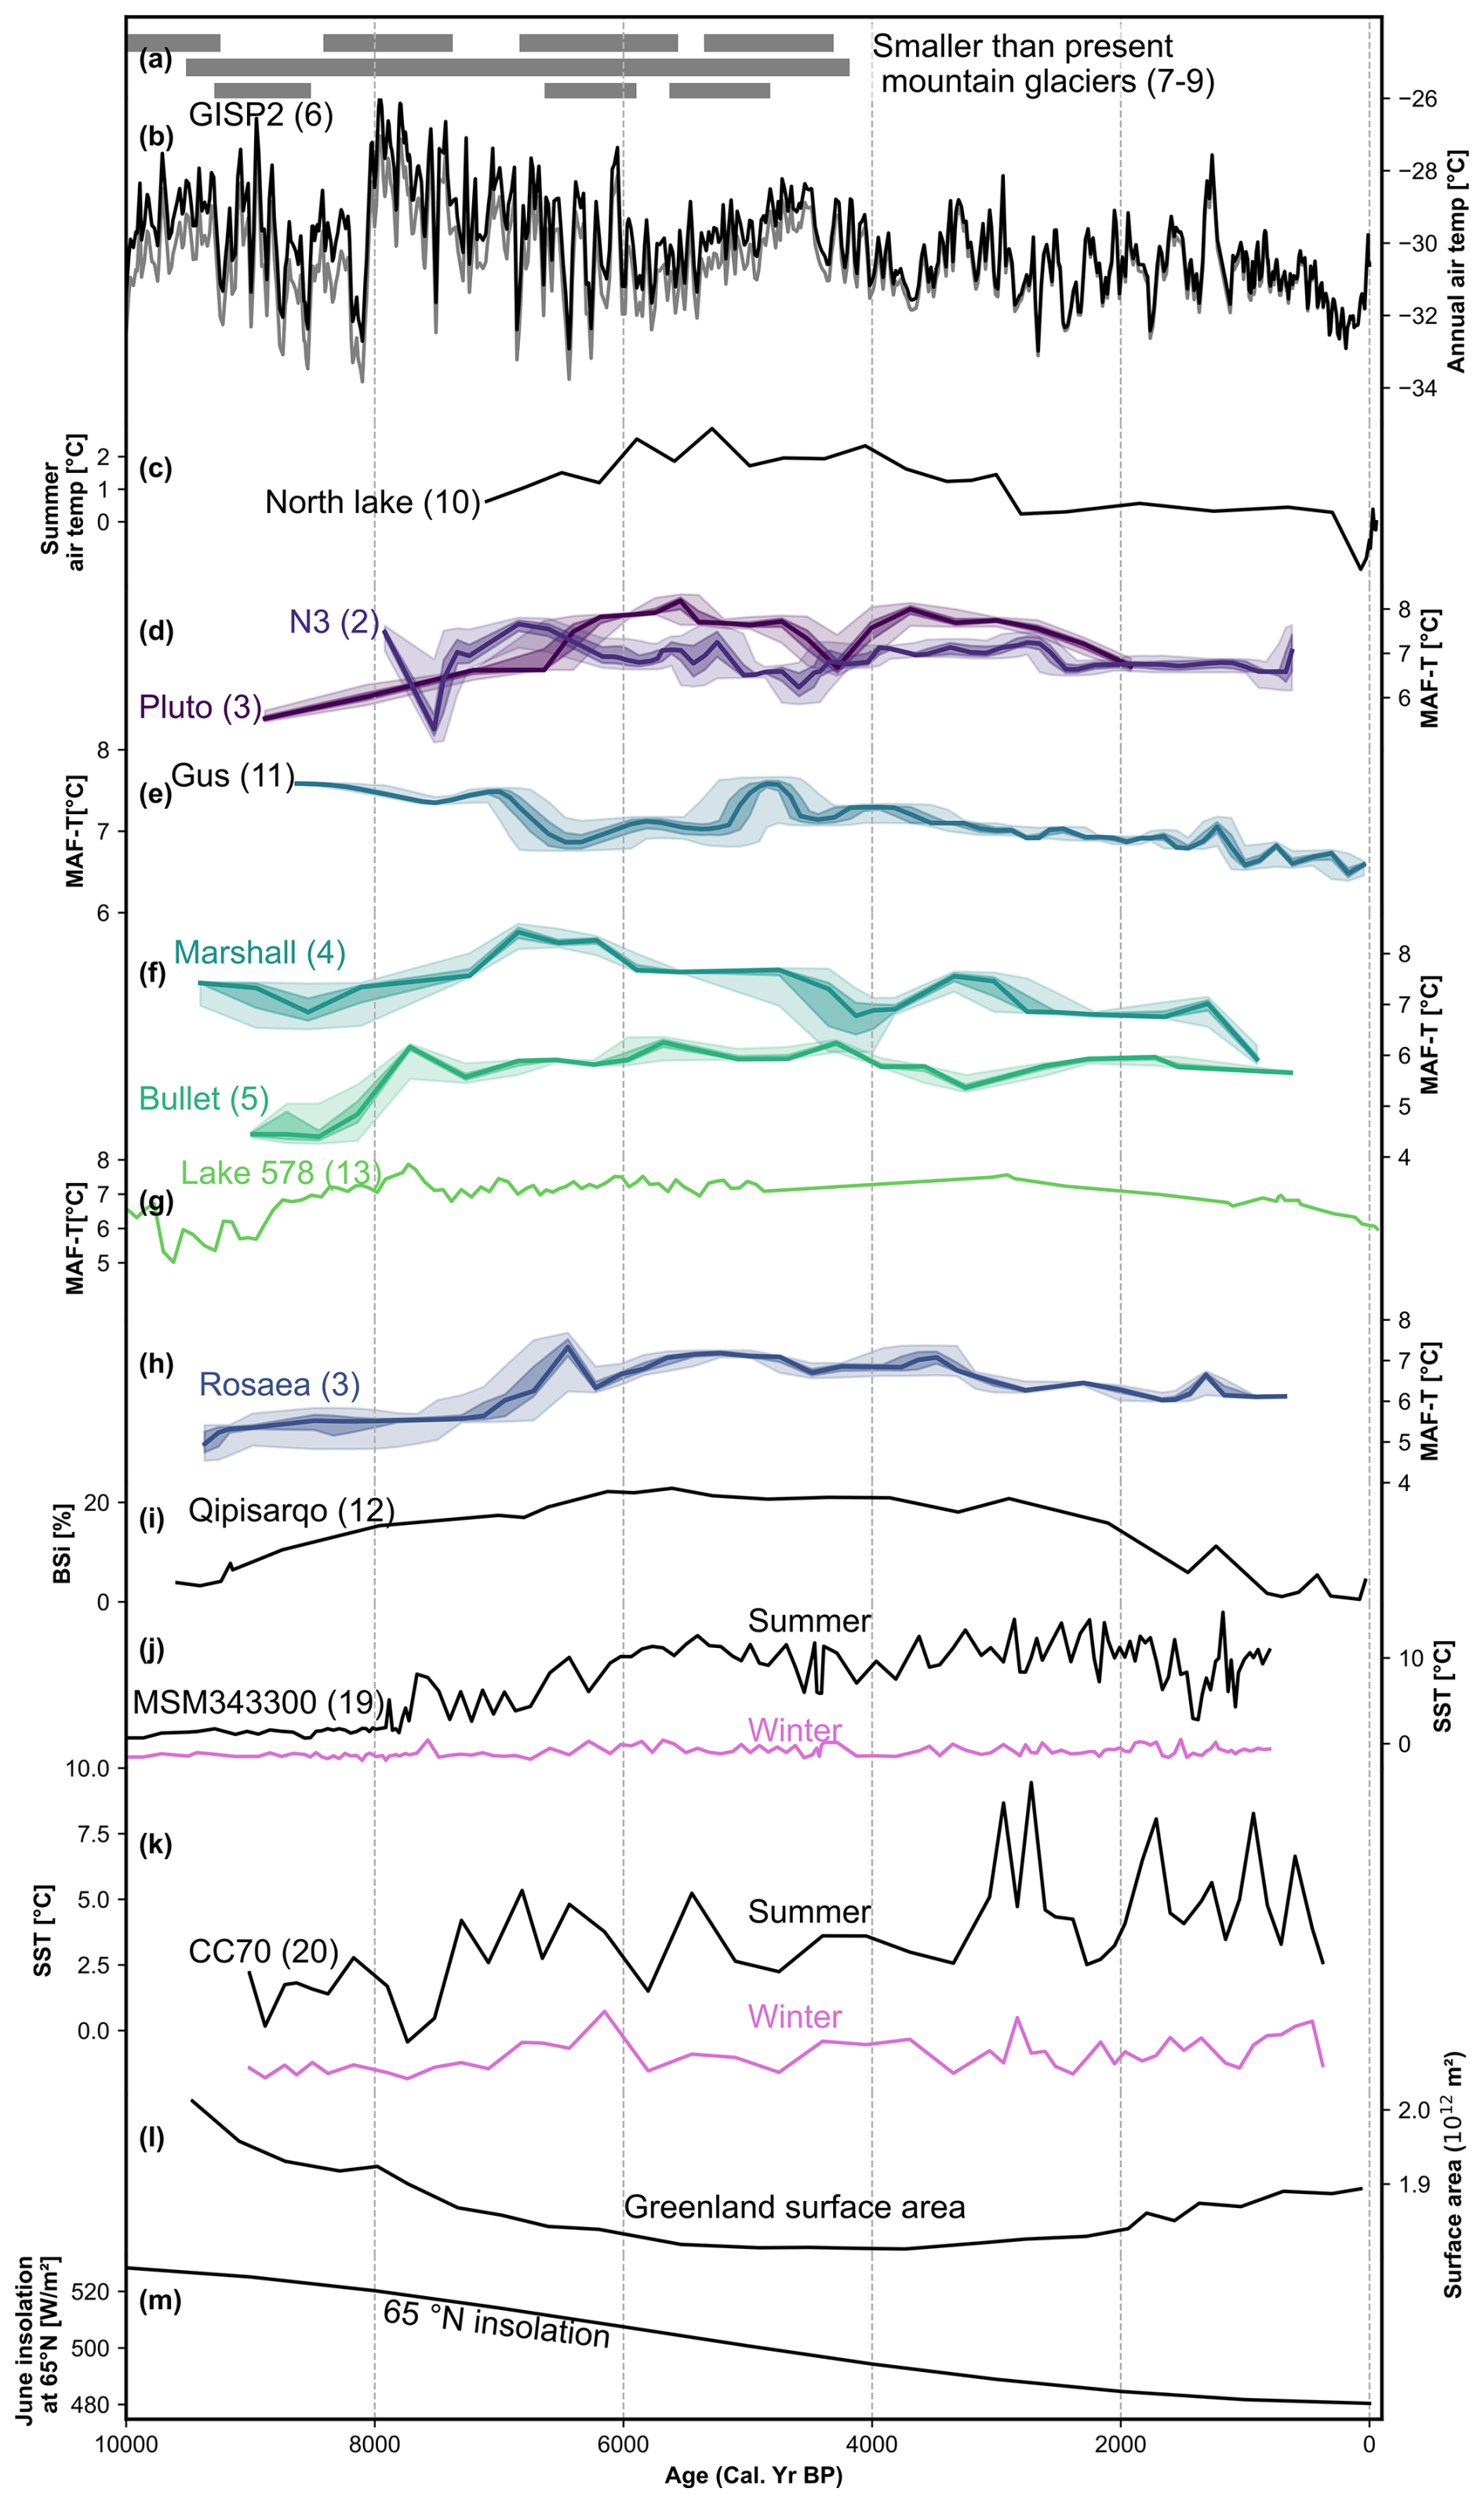
Figure 7Holocene temperature history from southwestern Greenland. (a) Smaller-than-present mountain glaciers (Schweinsberg et al., 2017, 2019), (b) Annual air temperature [°C] inferred from gas fractionation from Greenland Ice Sheet Project 2 ice core, with the black line indicating elevation-corrected values and the grey line indicating elevation-uncorrected values. (Axford et al., 2021; Kobashi et al., 2017), (c) chironomid-inferred July air temperature [°C] from North Lake (Axford et al., 2013), brGDGT-inferred mean air temperatures for months above freezing (MAF-T) [°C] from (d) lakes N3 and Pluto (This study), (e) Lake Gus (Cluett et al., 2023), (f) lakes Marshall and Bullet (This study), brGDGT-inferred MAF-T [°C] from (g) Lake 578 (Schneider et al., 2024), (h) Lake Rosaea (This study), (i) Biogenic silica as an indicator of temperature from Lake Qipisarqo (Kaplan et al., 2002), Dinocyst-inferred sea surface temperatures (SST) [°C] from (j) Disko Bugt core MSM343300 (Ouellet-Bernier et al., 2014), and (k) Baffin Bay core CC70 (Gibb et al., 2015) (l) Greenland Ice Sheet surface area (×1012) [m2] (Larsen et al., 2015) and (m) 21 June insolation at 65° N [W m−2] (Laskar et al., 2004). For timeseries in (d), (e), (f), and (h) the bold line indicates the median modelled age, and the light and dark shading represent the 95th percentile and interquartile age uncertainty, respectively. Numbers in parentheses next to the site name refer to the site IDs shown in Fig. 1.
3.3.6 Topographic conditions
Steep topography surrounding a lake can shade the lake, influencing the direct short-wave radiation reaching lake surface, thereby regulating the lake surface water temperature. To investigate the mechanisms for the differences in absolute temperature and magnitude of Holocene temperature variations in the five study lakes, we examined the topographic conditions around each lake. Shading calculations show that of the five lakes, Pluto Lake is the least shaded by surrounding topography and Bullet Lake is the most shaded (15 % less direct shortwave radiation than Pluto Lake) (Fig. 6b). Lakes N3 and Marshall are approx. 5 % more shaded than Pluto Lake, whereas Lake Rosaea is 10 % more shaded than Pluto Lake (Fig. 6b). This means that the topography surrounding lakes N3, Marshall, Rosaea, and Bullet causes them to receive correspondingly less solar radiation compared to Pluto, with Bullet receiving the least. We assess the impact of shading on lake water thermodynamics by perturbing the magnitude of incoming shortwave radiation in the lake model. These simulations suggest that a 10 % decrease in incoming shortwave radiation can suppress the mean lake surface temperature during the ice-free season by approx. 1.5 °C and a 25 % decrease by 4 °C (Fig. 7c). Therefore, we suggest that the approx. 2 °C lower absolute temperature and approx. 0.5 °C lower magnitude of temperature change in Bullet Lake may be due to the lowest incoming shortwave radiation, compared to the other study lakes.
The majority of brGDGT-inferred MAF-T timeseries from southwestern Greenland (N3, Pluto, Marshall, Bullet, Rosaea, and 578) document peak warmth in the Middle Holocene, between ca. 7.5 and 5 ka, following maximum summer insolation (Laskar et al., 2004). The timeseries from Lake Marshall shows warmth at ca. 9 ka, followed by cooling at ca. 8.5 ka and subsequent warming, similar to the regional ice-sheet retreat rate reconstructions (Lesnek et al., 2020), suggesting this timeseries captured Early Holocene warm conditions not captured in most lake records, since they start later. Immediately after peak warmth, reconstructed temperature in all these lakes shows a gradual cooling trend towards the Late Holocene. Overall, the pattern of reconstructed MAF-T from these lakes in southwestern Greenland is similar to the annual temperature reconstruction from the Greenland Ice Sheet Project 2 ice core (Fig. 7b), albeit with differences likely due to spatio-temporal variation and the resolution of the timeseries (Kobashi et al., 2017). Furthermore, the pattern of temperature change documented in southwestern Greenland can also be inferred from alpine glacier reconstructions throughout southwestern Greenland, which experienced high retreat rates or completely disappeared during the Early Holocene and reappeared during the Late Holocene (Fig. 7a) (Larocca et al., 2020; Larsen et al., 2017; Lasher et al., 2020; Schweinsberg et al., 2017, 2019). Holocene vegetation in southwestern Greenland indicates the warmest summer conditions in the Holocene between 7.2 and 6.3 ka, followed by cooling (Fredskild, 1983), a pattern similar to timeseries from lakes N3, Pluto, Rosaea, Marshall, Bullet, and 578 (Schneider et al., 2024). Similarly, the occurrence of warmth-demanding ostracodes in lake sediments at the head of Kangerlussuaq (inland from Lake Gus) indicates peak Holocene summer temperatures from c. 7.0 to 6.5 ka (Bennike et al., 2010). The Early Holocene peak warmth and the subsequent cooler Late Holocene documented by the most of these new brGDGTs-derived time series and other summer-sensitive proxy time series in southwestern Greenland align with the temperature pattern observed in many proxy time series from Greenland and Arctic Canada, albeit with spatial and temporal variability (Axford et al., 2021; Briner et al., 2016; Kaufman, 2004; Larocca and Axford, 2022). Similarly, the biogenic silica (BSi) record from Lake Qipisarqo reveals a thermal maximum between 7 and 3 ka, akin to the brGDGTs-inferred MAF-T timeseries from southwestern Greenland (Andresen et al., 2004). Although the reconstructed temperatures indicate peak warmth from 7.5 to 5 ka, GDGT concentrations were high during the Early Holocene in lakes Pluto, Rosaea, Marshall, and Bullet, suggesting that microbial activity was highest prior to peak temperaure (Figs. 2 and S10–S14). High microbial activity in the Early Holocene was likely due to enhanced nutrient inputs associated with recently deglaciated catchments. GDGT concentrations declined over the Holocene in lakes Rosaea, Marshall, and Bullet, suggesting reduced microbial activity, likely due to reduced nutrient input from gradual vegetation expansion and a stable catchment. In Pluto Lake, GDGT concentrations increased during the Late Holocene, likely driven by increased nutrient inputs resulting from catchment destabilization. In Lake N3, high GDGT concentrations between 7.5 and 5 ka coincide with peak temperaure (Fig. S11), suggesting a temperature-driven increase in microbial activity.
The brGDGT-inferred MAF-T time series from Lake Gus reveals a peak in warmth between ca. 9 and 6 ka, earlier than in many other time series. An earlier deglaciation at Lake Gus (before ca. 10 ka) and minimal influence from the Greenland Ice Sheet and coast during the Holocene likely caused earlier warmth. However, ∼25 samples from the Early Holocene in Lake Gus were removed due to evidence of high input of soil-derived brGDGTs (Cluett et al., 2023), so it is possible that other samples in that section exerted a minor influence on the inferred MAF-T. Although deglaciation at Lake Rosaea also occurred earlier (before 10 ka), the MAF-T reconstruction from Lake Rosaea does not show the Early Holocene warm signal observed at Lake Gus. This is likely due to a strong marine influence at Lake Rosaea, where air masses arrive directly from the Labrador Sea and Davis Strait, which experienced cold SST during 10 to 7 ka (Gibb et al., 2015; Ouellet-Bernier et al., 2014). In contrast to brGDGT-inferred MAF-T timeseries from southwestern Greenland, pollen-based reconstructions from lakes Comarum Cø and Kløft Sø in southern Greenland show a delayed thermal maximum after 6 ka (Fredskild, 1973; Gajewski, 2015). This could be due to marine influence and/or vegetation lags (Axford et al., 2021).
The magnitude of peak warmth in brGDGT-inferred MAF-T shows both similarities and differences between time series. BrGDGT-inferred MAF-T timeseries from lakes Pluto, N3, and 578 each show, on average, 1.4 ± 1.0 °C higher temperatures during the peak warmth (from 7.5 to 5 ka) relative to 1994–2024. Although the timing of peak warmth in Lake Gus occurred earlier (from 9 to 6 ka), the magnitude of warming was similar to that observed at lakes Pluto, N3, and 578 (1.4 °C). Peak warmth at Rosaea, Bullet, and Marshall was approx.0.5 ± 1.0, 2 ± 1.0, and 4 ± 1.0 °C, respectively, higher than from lakes Pluto, N3, and 578. Higher temperatures in Lake Rosaea are likely due to ocean influence, while in Lakes Marshall and Bullet, they are likely due to their higher elevations, which would have led to a higher rate of warming (Pepin et al., 2015). However, it is also possible that modern temperatures at these lakes are not well represented, as no direct observations are available. We therefore relied on ERA5 reanalysis data, which have a relatively coarse grid resolution () and may not fully capture local conditions due to Greenland's complex topography. Overall, the magnitude of peak warmth in lakes Pluto, N3, and 578 is similar to the ice sheet elevation change corrected annual air temperature [°C] inferred from gas fractionation from the GISP2 ice core, demonstrating ∼1–2 °C warmer conditions from 7.5 to 5 ka relative to the averages of 1988–2015 (Axford et al., 2021; Kobashi et al., 2017). Moreover, the magnitude of peak warmth in lakes Pluto, N3, and 578 is lower than the chironomid-inferred July air temperature from North Lake, indicating 2–3 °C warmer conditions between 7 and 5 ka relative to the present (Axford et al., 2013). This difference in magnitude is likely related to the seasonality of reconstructed temperature (July for Chironomids, months above freezing for brGDGTs) (Eggermont and Heiri, 2012). The strongest solar radiation in July led to a greater magnitude of warming than in the MAF-T. Further investigation of proxy time series that account for temperature seasonality and cover a wider spatial range across Greenland may help reconcile these differences.
Although there are differences in timing and magnitude of peak warmth in brGDGT-inferred MAF-T timeseries for southwestern Greenland, these timeseries do not follow a latitudinal pattern. This is surprising, considering the pronounced warming in higher latitudes compared to low latitudes due to local feedbacks and remote teleconnections observed during the past century (England et al., 2021; Sweeney et al., 2023) and during the Holocene (Axford et al., 2021; Briner et al., 2016; Kaufman, 2004). The absence of Arctic Amplification in southwestern Greenland brGDGT-inferred from MAF-T timeseries in the past 9 ka could be because of several factors: (1) the latitudinal gradient across the study sites may be too small to observe temperature differences using this proxy; (2) the temporal resolution of the time series may be too coarse to detect subtle shifts in the timing of the thermal maximum; or (3) other local or regional influences, including strong ocean and atmosphere northward heat transport (Dufour et al., 2016) and the absence of Holocene summer sea ice in this region (Gibb et al., 2015), which may have overprinted the expected signal from Arctic amplification. Future high-resolution proxy timeseries covering a larger latitudinal range and using the same proxy, reflecting similar seasonality, could help test this hypothesis.
We generated five new (from Pluto, N3, Rosaea, Marshall, and Bullet Lake) and compiled two published (from Gus Lake and Lake 578) brGDGT-inferred MAF-T time series spanning the past 9 ka from southwestern Greenland. Lake model sensitivity tests suggest minimal intra-lake variation in both the seasonal production window of brGDGTs and the sensitivity of the studied lakes to air temperature changes. Further, although we cannot rule them out, anoxic/suboxic conditions likely had a minimal impact on the brGDGT distributions in these lakes. These results suggest that regional temperature is the primary mechanism influencing these time series. The time series from all the lakes except Gus showed a temperature maxima between ca. 7.5 and 5 ka, followed by gradual cooling towards the Late Holocene, similar to many other regional time series, lagging maximum annual insolation at 65° N. In addition, the time series from Lake Marshall suggests a warm Early Holocene, cooling around 8.5 ka, and subsequent warming, which is similar to the few available proxy records of Early Holocene temperature at the ice-free margins of Greenland (Lesnek et al., 2020). The timeseries from Lake Gus revealed peak warmth between ca. 9 and 6 ka, earlier than many other time series, likely due to minimal influence of the ocean and the Greenland Ice Sheet, as it is far from both. Although Lake Rosaea was minimally affected by the Greenland Ice Sheet margin during the Holocene, the MAF-T reconstruction from the lake does not show the thermal maximum between 9 and 6 ka, as observed at Lake Gus, but rather indicates that peak warmth occurred between 7.5 and 5 ka. This is likely due to a strong marine influence at Lake Rosaea, where air masses arrive directly from the Labrador Sea and Baffin Bay, which experienced low SSTs during 10 to 7 ka.
The peak warmth in lakes Pluto, N3, Gus, and 578 was approx. 1.4 ± 1.0 °C warmer than in 1994–2024. In lakes Rosaea, Bullet, and Marshall, it was approx. 2 ± 1.0, 3 ± 1.0, and 5 ± 1.0 °C warmer than in 1994–2024, respectively. The higher magnitude of peak warmth in lakes Bullet and Marshall is likely related to their higher elevation, whereas the magnitude of temperature change at Lake Rosaea may be influenced by its proximity to the ocean.
Overall, our results highlight that the majority of temperature time series from southwestern Greenland exhibit a similar pattern over the Holocene, albeit with local variations in magnitude and timing caused by topography and proximity to the ice sheet and the ocean. Further, the seasonality (e.g., MAF, summer, annual) of reconstructed temperatures seems important when comparing the magnitude of Holocene temperature change across time series derived from different proxies. Therefore, further investigation of proxy time series to quantify seasonal variability and the impact of local factors (e.g., site-specific, topographic, ice-sheet proximity, and oceanic conditions) will likely reveal broad similarities among proxy time series, helping to reconcile differences and refine Holocene climate reconstructions.
Data generated in this study are available at https://doi.org/10.25921/dk6a-xe77 (Acharya et al., 2026).
The supplement related to this article is available online at https://doi.org/10.5194/cp-22-1401-2026-supplement.
We thank the people of Greenland for providing access to their land. The study was conceptualized by SA and EKT. JPB and EKT obtained funding and led field seasons. AAC, ALG, and ISC conducted the laboratory analysis. SA and EKT prepared the manuscript with contributions from all co-authors.
The contact author has declared that none of the authors has any competing interests.
Publisher's note: Copernicus Publications remains neutral with regard to jurisdictional claims made in the text, published maps, institutional affiliations, or any other geographical representation in this paper. The authors bear the ultimate responsibility for providing appropriate place names. Views expressed in the text are those of the authors and do not necessarily reflect the views of the publisher.
We thank John Ryan-Henry, Kayla Hollister, Owen Cowling, Nancy Leon, and Jeff Salacup for their help in lipid biomarker analysis. We gratefully acknowledge Dr. Gerard A. Otiniano and Dr. Samuel Mark for discussions.
This research was funded by National Science Foundation grant OPP-1504267 and OPP-2106971 to EKT and JPB, EAR-IF 1652274 to EKT, and NSF Graduate Research Fellowship 1645677 to AAC.
This paper was edited by Francesco Muschitiello and reviewed by two anonymous referees.
Acharya, S., Zech, R., Strobel, P., Bliedtner, M., Prochnow, M., and De Jonge, C.: Environmental controls on the distribution of GDGT molecules in Lake Höglwörth, Southern Germany, Org. Geochem., 186, 104689, https://doi.org/10.1016/j.orggeochem.2023.104689, 2023.
Acharya, S., Cluett, A. A., Grogan, A. L., Briner, J. P., Castañeda, I. S., and Thomas, E. K.: Greenland Lake Water Temperature Reconstructions and GDGT Data during the Holocene, NOAA [data set], https://doi.org/10.25921/dk6a-xe77, 2026.
Andresen, C. S., Björck, S., Bennike, O., and Bond, G.: Holocene climate changes in southern Greenland: evidence from lake sediments, J. Quaternary Sci., 19, 783–795, https://doi.org/10.1002/jqs.886, 2004.
Antoniades, D., Klanten, Y., Cameron, E., Garcia-Oteyza, J., Oliva, M., and Vincent, W. F.: Evidence of summer thermal stratification in extreme northern lakes, Arctic Science, 10, 225–232, https://doi.org/10.1139/as-2023-0037, 2024.
Axford, Y., Losee, S., Briner, J. P., Francis, D. R., Langdon, P. G., and Walker, I. R.: Holocene temperature history at the western Greenland Ice Sheet margin reconstructed from lake sediments, Quaternary Sci. Rev., 59, 87–100, https://doi.org/10.1016/j.quascirev.2012.10.024, 2013.
Axford, Y., De Vernal, A., and Osterberg, E. C.: Past Warmth and Its Impacts During the Holocene Thermal Maximum in Greenland, Annu. Rev. Earth Pl. Sc., 49, 279–307, https://doi.org/10.1146/annurev-earth-081420-063858, 2021.
Bashmachnikov, I. L., Raj, R. P., Golubkin, P., and Kozlov, I. E.: Heat Transport by Mesoscale Eddies in the Norwegian and Greenland Seas, J. Geophys. Res.-Oceans, 128, e2022JC018987, https://doi.org/10.1029/2022JC018987, 2023.
Bauersachs, T., Schubert, C. J., Mayr, C., Gilli, A., and Schwark, L.: Branched GDGT-based temperature calibrations from Central European lakes, Sci. Total Environ., 167724, https://doi.org/10.1016/j.scitotenv.2023.167724, 2023.
Baxter, A. J., van Bree, L. G. J., Peterse, F., Hopmans, E. C., Villanueva, L., Verschuren, D., and Sinninghe Damsté, J. S.: Seasonal and multi-annual variation in the abundance of isoprenoid GDGT membrane lipids and their producers in the water column of a meromictic equatorial crater lake (Lake Chala, East Africa), Quaternary Sci. Rev., 273, https://doi.org/10.1016/j.quascirev.2021.107263, 2021.
Bennike, O.: Palaeoecological studies of Holocene lake sediments from west Greenland, Palaeogeogr. Palaeoclim., 155, 285–304, https://doi.org/10.1016/S0031-0182(99)00121-2, 2000.
Bennike, O., Anderson, N. J., and McGowan, S.: Holocene palaeoecology of southwest Greenland inferred from macrofossils in sediments of an oligosaline lake, J. Paleolimnol., 43, 787–798, https://doi.org/10.1007/s10933-009-9368-x, 2010.
Bittner, L., De Jonge, C., Gil-Romera, G., Lamb, H. F., Russell, J. M., and Zech, M.: A Holocene temperature (brGDGT) record from Garba Guracha, a high-altitude lake in Ethiopia, Biogeosciences, 19, 5357–5374, https://doi.org/10.5194/bg-19-5357-2022, 2022.
Blaauw, M. and Christen, J. A.: Flexible Paleoclimate Age-Depth Models Using an Autoregressive Gamma Process, Bayesian Anal., 6, 457–474, https://doi.org/10.1214/ba/1339616472, 2011.
Blaga, C. I., Reichart, G.-J., Heiri, O., and Sinninghe Damsté, J. S.: Tetraether membrane lipid distributions in water-column particulate matter and sediments: a study of 47 European lakes along a north–south transect, J. Paleolimnol., 41, 523–540, https://doi.org/10.1007/s10933-008-9242-2, 2009.
Box, J. E., Nielsen, K. P., Yang, X., Niwano, M., Wehrlé, A., van As, D., Fettweis, X., Køltzow, M. A. Ø., Palmason, B., Fausto, R. S., van den Broeke, M. R., Huai, B., Ahlstrøm, A. P., Langley, K., Dachauer, A., and Noël, B.: Greenland ice sheet rainfall climatology, extremes and atmospheric river rapids, Meteorol. Appl., 30, e2134, https://doi.org/10.1002/met.2134, 2023.
Briner, J. P., Kaufman, D. S., Bennike, O., and Kosnik, M. A.: Amino acid ratios in reworked marine bivalve shells constrain Greenland Ice Sheet history during the Holocene, Geology, 42, 75–78, https://doi.org/10.1130/G34843.1, 2014.
Briner, J. P., McKay, N. P., Axford, Y., Bennike, O., Bradley, R. S., De Vernal, A., Fisher, D., Francus, P., Fréchette, B., Gajewski, K., Jennings, A., Kaufman, D. S., Miller, G., Rouston, C., and Wagner, B.: Holocene climate change in Arctic Canada and Greenland, Quaternary Sci. Rev., 147, 340–364, https://doi.org/10.1016/j.quascirev.2016.02.010, 2016.
Briner, J. P., Cuzzone, J. K., Badgeley, J. A., Young, N. E., Steig, E. J., Morlighem, M., Schlegel, N.-J., Hakim, G. J., Schaefer, J. M., Johnson, J. V., Lesnek, A. J., Thomas, E. K., Allan, E., Bennike, O., Cluett, A. A., Csatho, B., De Vernal, A., Downs, J., Larour, E., and Nowicki, S.: Rate of mass loss from the Greenland Ice Sheet will exceed Holocene values this century, Nature, 586, 70–74, https://doi.org/10.1038/s41586-020-2742-6, 2020.
Buckles, L. K., Weijers, J. W. H., Verschuren, D., and Sinninghe Damsté, J. S.: Sources of core and intact branched tetraether membrane lipids in the lacustrine environment: Anatomy of Lake Challa and its catchment, equatorial East Africa, Geochim. Cosmochim. Ac., 140, 106–126, https://doi.org/10.1016/j.gca.2014.04.042, 2014.
Castañeda, I. S. and Schouten, S.: A review of molecular organic proxies for examining modern and ancient lacustrine environments, Quaternary Sci. Rev., 30, 2851–2891, https://doi.org/10.1016/j.quascirev.2011.07.009, 2011.
Cluett, A. A., Thomas, E. K., Evans, S. M., and Keys, P. W.: Seasonal Variations in Moisture Origin Explain Spatial Contrast in Precipitation Isotope Seasonality on Coastal Western Greenland, J. Geophys. Res.-Atmos., 126, e2020JD033543, https://doi.org/10.1029/2020JD033543, 2021.
Cluett, A. A., Thomas, E. K., McKay, N. P., Cowling, O. C., Castañeda, I. S., and Morrill, C.: Lake Dynamics Modulate the Air Temperature Variability Recorded by Sedimentary Aquatic Biomarkers: A Holocene Case Study From Western Greenland, J. Geophys. Res.-Biogeo., 128, e2022JG007106, https://doi.org/10.1029/2022JG007106, 2023.
Corcoran, M. C., Thomas, E. K., and Morrill, C.: Using a Paired Chironomid δ18O and Aquatic Leaf Wax δ2H Approach to Reconstruct Seasonality on Western Greenland During the Holocene, Paleoceanog. Paleoclimatol., 36, e2020PA004169, https://doi.org/10.1029/2020PA004169, 2021.
Cronauer, S. L., Briner, J. P., Kelley, S. E., Zimmerman, S. R. H., and Morlighem, M.: 10Be dating reveals early-middle Holocene age of the Drygalski Moraines in central West Greenland, Quaternary Sci. Rev., 147, 59–68, https://doi.org/10.1016/j.quascirev.2015.08.034, 2016.
Dang, X., Ding, W., Yang, H., Pancost, R. D., Naafs, B. D. A., Xue, J., Lin, X., Lu, J., and Xie, S.: Different temperature dependence of the bacterial brGDGT isomers in 35 Chinese lake sediments compared to that in soils, Org. Geochem., 119, 72–79, https://doi.org/10.1016/j.orggeochem.2018.02.008, 2018.
Dee, S. G., Russell, J. M., Morrill, C., Chen, Z., and Neary, A.: PRYSM v2.0: A Proxy System Model for Lacustrine Archives, Paleoceanog. Paleoclimatol., 33, 1250–1269, https://doi.org/10.1029/2018PA003413, 2018.
Dokulil, M. T., de Eyto, E., Maberly, S. C., May, L., Weyhenmeyer, G. A., and Woolway, R. I.: Increasing maximum lake surface temperature under climate change, Climatic Change, 165, 56, https://doi.org/10.1007/s10584-021-03085-1, 2021.
Downs, J., Johnson, J., Briner, J., Young, N., Lesnek, A., and Cuzzone, J.: Western Greenland ice sheet retreat history reveals elevated precipitation during the Holocene thermal maximum, The Cryosphere, 14, 1121–1137, https://doi.org/10.5194/tc-14-1121-2020, 2020.
Druckenmiller, M. L., Thoman, R. L., and Moon, T. A.: NOAA Arctic Report Card 2025, https://doi.org/10.25923/nrzf-j897, 2025.
Dufour, A., Zolina, O., and Gulev, S. K.: Atmospheric Moisture Transport to the Arctic: Assessment of Reanalyses and Analysis of Transport Components, J. Climate, 29, 5061–5081, https://doi.org/10.1175/JCLI-D-15-0559.1, 2016.
Dutton, A., Carlson, A. E., Long, A. J., Milne, G. A., Clark, P. U., DeConto, R., Horton, B. P., Rahmstorf, S., and Raymo, M. E.: Sea-level rise due to polar ice-sheet mass loss during past warm periods, Science, 349, aaa4019, https://doi.org/10.1126/science.aaa4019, 2015.
Eggermont, H. and Heiri, O.: The chironomid-temperature relationship: expression in nature and palaeoenvironmental implications, Biol. Rev., 87, 430–456, https://doi.org/10.1111/j.1469-185X.2011.00206.x, 2012.
England, M. R., Eisenman, I., Lutsko, N. J., and Wagner, T. J. W.: The Recent Emergence of Arctic Amplification, Geophys. Res. Lett., 48, e2021GL094086, https://doi.org/10.1029/2021GL094086, 2021.
Feng, X., Zhao, C., D'Andrea, W. J., Liang, J., Zhou, A., and Shen, J.: Temperature fluctuations during the Common Era in subtropical southwestern China inferred from brGDGTs in a remote alpine lake, Earth Planet. Sc. Lett., 510, 26–36, https://doi.org/10.1016/j.epsl.2018.12.028, 2019.
Fisher, M., Stafford, T., Moon, T., and Thurber, A.: QGreenland, Zenodo, https://doi.org/10.5281/zenodo.8326507, 2023.
Fréchette, B. and de Vernal, A.: Relationship between Holocene climate variations over southern Greenland and eastern Baffin Island and synoptic circulation pattern, Clim. Past, 5, 347–359, https://doi.org/10.5194/cp-5-347-2009, 2009.
Frederikse, T., Landerer, F., Caron, L., Adhikari, S., Parkes, D., Humphrey, V. W., Dangendorf, S., Hogarth, P., Zanna, L., Cheng, L., and Wu, Y.-H.: The causes of sea-level rise since 1900, Nature, 584, 393–397, https://doi.org/10.1038/s41586-020-2591-3, 2020.
Fredskild, B.: Studies in the Vegetational History of Greenland, Palaeobotanical Investigations of some Holocene Lake and Bog deposits, Meddr. Grønland, 198, https://doi.org/10.7146/mog.v198.147748, 1973.
Fredskild, B.: The Holocene vegetational development of the Godthåbsfjord area, West Greenland, Meddelelser om Grønland. Geoscience, 10, 28 pp., https://doi.org/10.7146/moggeosci.v10i.140322, 1983.
Gajewski, K.: Quantitative reconstruction of Holocene temperatures across the Canadian Arctic and Greenland, Global Planet. Change, 128, 14–23, https://doi.org/10.1016/j.gloplacha.2015.02.003, 2015.
Gibb, O. T., Steinhauer, S., Fréchette, B., de Vernal, A., and Hillaire-Marcel, C.: Diachronous evolution of sea surface conditions in the Labrador Sea and Baffin Bay since the last deglaciation, The Holocene, 25, 1882–1897, https://doi.org/10.1177/0959683615591352, 2015.
Hansen, K. E., Giraudeau, J., Wacker, L., Pearce, C., and Seidenkrantz, M.-S.: Reconstruction of Holocene oceanographic conditions in eastern Baffin Bay, Clim. Past, 16, 1075–1095, https://doi.org/10.5194/cp-16-1075-2020, 2020.
Harning, D. J., Sacco, S., Raberg, J. H., Ardenghi, N., Sepúlveda, J., Shapiro, B., Miller, G. H., and Geirsdóttir, Á.: Both redox potential and climate control molecular proxies in Icelandic Holocene lake sediments, Commun. Earth Environ., 6, 763, https://doi.org/10.1038/s43247-025-02701-7, 2025.
Hopmans, E. C., Schouten, S., and Sinninghe Damsté, J. S.: The effect of improved chromatography on GDGT-based palaeoproxies, Org. Geochem., 93, 1–6, https://doi.org/10.1016/j.orggeochem.2015.12.006, 2016.
Hostetler, S. W. and Bartlein, P. J.: Simulation of lake evaporation with application to modeling lake level variations of Harney-Malheur Lake, Oregon, Water Resour. Res., 26, 2603–2612, https://doi.org/10.1029/WR026i010p02603, 1990.
IPCC: AR6 Climate Change 2021: The Physical Science Basis, Intergovernmental pannel on climate change, Geneva, https://doi.org/10.1017/9781009157896, 2021.
Jane, S. F., Mincer, J. L., Lau, M. P., Lewis, A. S. L., Stetler, J. T., and Rose, K. C.: Longer duration of seasonal stratification contributes to widespread increases in lake hypoxia and anoxia, Global Change Biol., 29, 1009–1023, https://doi.org/10.1111/gcb.16525, 2023.
Jensen, C. D., Jørgensen, B. V., Kern-Hansen, C., Laursen, E. V., Cappelen, J., Boas, L., Carstensen, L. S., and Wang, P. G.: Weather Observations from Greenland 1958–2024, 2025.
Kaplan, M. R., Wolfe, A. P., and Miller, G. H.: Holocene Environmental Variability in Southern Greenland Inferred from Lake Sediments, Quaternary Res., 58, 149–159, https://doi.org/10.1006/qres.2002.2352, 2002.
Karami, M., Hansen, B. U., Westergaard-Nielsen, A., Abermann, J., Lund, M., Schmidt, N. M., and Elberling, B.: Vegetation phenology gradients along the west and east coasts of Greenland from 2001 to 2015, Ambio, 46, 94–105, https://doi.org/10.1007/s13280-016-0866-6, 2017.
Kaufman, D.: Holocene thermal maximum in the western Arctic (0–180° W), Quaternary Sci. Rev., 23, 529–560, https://doi.org/10.1016/j.quascirev.2003.09.007, 2004.
Kaufman, D., McKay, N., Routson, C., Erb, M., Dätwyler, C., Sommer, P. S., Heiri, O., and Davis, B.: Holocene global mean surface temperature, a multi-method reconstruction approach, Sci. Data, 7, 201, https://doi.org/10.1038/s41597-020-0530-7, 2020.
Kettle, H., Thompson, R., Anderson, N. J., and Livingstone, D. M.: Empirical modeling of summer lake surface temperatures in southwest Greenland, Limnol. Oceanogr., 49, 271–282, https://doi.org/10.4319/lo.2004.49.1.0271, 2004.
Klanten, Y., Couture, R.-M., Christoffersen, K. S., Vincent, W. F., and Antoniades, D.: Oxygen Depletion in Arctic Lakes: Circumpolar Trends, Biogeochemical Processes, and Implications of Climate Change, Global Biogeochem. Cy., 37, e2022GB007616, https://doi.org/10.1029/2022GB007616, 2023.
Klanten, Y., MacIntyre, S., Fitzpatrick, C., Vincent, W. F., and Antoniades, D.: Regime Shifts in Lake Oxygen and Temperature in the Rapidly Warming High Arctic, Geophys. Res. Lett., 51, e2023GL106985, https://doi.org/10.1029/2023GL106985, 2024.
Kobashi, T., Menviel, L., Jeltsch-Thömmes, A., Vinther, B. M., Box, J. E., Muscheler, R., Nakaegawa, T., Pfister, P. L., Döring, M., Leuenberger, M., Wanner, H., and Ohmura, A.: Volcanic influence on centennial to millennial Holocene Greenland temperature change, Sci. Rep.-UK, 7, 1441, https://doi.org/10.1038/s41598-017-01451-7, 2017.
Larocca, L. J. and Axford, Y.: Arctic glaciers and ice caps through the Holocene:a circumpolar synthesis of lake-based reconstructions, Clim. Past, 18, 579–606, https://doi.org/10.5194/cp-18-579-2022, 2022.
Larocca, L. J., Axford, Y., Bjørk, A. A., Lasher, G. E., and Brooks, J. P.: Local glaciers record delayed peak Holocene warmth in south Greenland, Quaternary Sci. Rev., 241, 106421, https://doi.org/10.1016/j.quascirev.2020.106421, 2020.
Larsen, N. K., Kjær, K. H., Lecavalier, B., Bjørk, A. A., Colding, S., Huybrechts, P., Jakobsen, K. E., Kjeldsen, K. K., Knudsen, K.-L., Odgaard, B. V., and Olsen, J.: The response of the southern Greenland ice sheet to the Holocene thermal maximum, Geology, 43, 291–294, https://doi.org/10.1130/G36476.1, 2015.
Larsen, N. K., Strunk, A., Levy, L. B., Olsen, J., Bjørk, A., Lauridsen, T. L., Jeppesen, E., and Davidson, T. A.: Strong altitudinal control on the response of local glaciers to Holocene climate change in southwest Greenland, Quaternary Sci. Rev., 168, 69–78, https://doi.org/10.1016/j.quascirev.2017.05.008, 2017.
Lasher, G. E., Axford, Y., Masterson, A. L., Berman, K., and Larocca, L. J.: Holocene temperature and landscape history of southwest Greenland inferred from isotope and geochemical lake sediment proxies, Quaternary Sci. Rev., 239, 106358, https://doi.org/10.1016/j.quascirev.2020.106358, 2020.
Laskar, J., Robutel, P., Joutel, F., Gastineau, M., Correia, A. C. M., and Levrard, B.: A long-term numerical solution for the insolation quantities of the Earth, Astron. Astrophys., 428, 261–285, https://doi.org/10.1051/0004-6361:20041335, 2004.
Lazier, J., Hendry, R., Clarke, A., Yashayaev, I., and Rhines, P.: Convection and restratification in the Labrador Sea, 1990–2000, Deep-Sea Res. Pt I, 49, 1819–1835, https://doi.org/10.1016/S0967-0637(02)00064-X, 2002.
Leger, T. P. M., Clark, C. D., Huynh, C., Jones, S., Ely, J. C., Bradley, S. L., Diemont, C., and Hughes, A. L. C.: A Greenland-wide empirical reconstruction of paleo ice sheet retreat informed by ice extent markers: PaleoGrIS version 1.0, Clim. Past, 20, 701–755, https://doi.org/10.5194/cp-20-701-2024, 2024.
Lesnek, A. J., Briner, J. P., Young, N. E., and Cuzzone, J. K.: Maximum Southwest Greenland Ice Sheet Recession in the Early Holocene, Geophys. Res. Lett., 47, e2019GL083164, https://doi.org/10.1029/2019GL083164, 2020.
Liang, J., Chevalier, M., Liu, K., Perfumo, A., Wang, M., Xie, H., Hou, J., Herzschuh, U., and Chen, F.: Discrepancies in lacustrine bacterial lipid temperature reconstructions explained by microbial ecology, Commun. Earth Environ., 5, 1–14, https://doi.org/10.1038/s43247-024-01925-3, 2024.
Lindberg, K. R., Daniels, W. C., Castañeda, I. S., and Brigham-Grette, J.: Biomarker proxy records of Arctic climate change during the Mid-Pleistocene transition from Lake El'gygytgyn (Far East Russia), Clim. Past, 18, 559–577, https://doi.org/10.5194/cp-18-559-2022, 2022.
Lindborg, T., Rydberg, J., Tröjbom, M., Berglund, S., Johansson, E., Löfgren, A., Saetre, P., Nordén, S., Sohlenius, G., Andersson, E., Petrone, J., Borgiel, M., Kautsky, U., and Laudon, H.: Biogeochemical data from terrestrial and aquatic ecosystems in a periglacial catchment, West Greenland, Earth Syst. Sci. Data, 8, 439–459, https://doi.org/10.5194/essd-8-439-2016, 2016.
Liu, Z., Zhu, J., Rosenthal, Y., Zhang, X., Otto-Bliesner, B. L., Timmermann, A., Smith, R. S., Lohmann, G., Zheng, W., and Elison Timm, O.: The Holocene temperature conundrum, P. Natl. Acad. Sci. USA, 111, E3501-5, https://doi.org/10.1073/pnas.1407229111, 2014.
Longo, W. M., Huang, Y., Russell, J. M., Morrill, C., Daniels, W. C., Giblin, A. E., and Crowther, J.: Insolation and greenhouse gases drove Holocene winter and spring warming in Arctic Alaska, Quaternary Sci. Rev., 242, 106438, https://doi.org/10.1016/j.quascirev.2020.106438, 2020.
Loomis, S. E., Russell, J. M., Eggermont, H., Verschuren, D., and Sinninghe Damsté, J. S.: Effects of temperature, pH and nutrient concentration on branched GDGT distributions in East African lakes: Implications for paleoenvironmental reconstruction, Org. Geochem., 66, 25–37, https://doi.org/10.1016/j.orggeochem.2013.10.012, 2014.
Martin, C., Ménot, G., Thouveny, N., Davtian, N., Andrieu-Ponel, V., Reille, M., and Bard, E.: Impact of human activities and vegetation changes on the tetraether sources in Lake St Front (Massif Central, France), Org. Geochem., 135, 38–52, https://doi.org/10.1016/j.orggeochem.2019.06.005, 2019.
Martin, C., Ménot, G., Thouveny, N., Peyron, O., Andrieu-Ponel, V., Montade, V., Davtian, N., Reille, M., and Bard, E.: Early Holocene Thermal Maximum recorded by branched tetraethers and pollen in Western Europe (Massif Central, France), Quaternary Sci. Rev., 228, https://doi.org/10.1016/j.quascirev.2019.106109, 2020.
Martin, K. C., Buizert, C., Brook, E., Williams, O. L., Edwards, J. S., Riddell-Young, B., Fudge, T. J., Mederbel, F., Beaudette, R., Severinghaus, J., Oyabu, I., Kawamura, K., Kirk, M., Koldtoft, I., Steffensen, J. P., and Blunier, T.: Greenland Ice Cores Reveal a South-To-North Difference in Holocene Thermal Maximum Timings, Geophys. Res. Lett., 51, e2024GL111405, https://doi.org/10.1029/2024GL111405, 2024.
Martínez-Sosa, P., Tierney, J. E., Stefanescu, I. C., Dearing Crampton-Flood, E., Shuman, B. N., and Routson, C.: A global Bayesian temperature calibration for lacustrine brGDGTs, Geochim. Cosmochim. Ac., 305, 87–105, https://doi.org/10.1016/j.gca.2021.04.038, 2021.
Masson-Delmotte, V., Landais, A., Stievenard, M., Cattani, O., Falourd, S., Jouzel, J., Johnsen, S. J., Dahl-Jensen, D., Sveinsbjornsdottir, A., White, J. W. C., Popp, T., and Fischer, H.: Holocene climatic changes in Greenland: Different deuterium excess signals at Greenland Ice Core Project (GRIP) and NorthGRIP, J. Geophys. Res.-Atmos., 110, https://doi.org/10.1029/2004JD005575, 2005.
McKay, N. P., Emile-Geay, J., and Khider, D.: geoChronR – an R package to model, analyze, and visualize age-uncertain data, Geochronology, 3, 149–169, https://doi.org/10.5194/gchron-3-149-2021, 2021.
Miller, D. R., Habicht, M. H., Keisling, B. A., Castañeda, I. S., and Bradley, R. S.: A 900-year New England temperature reconstruction from in situ seasonally produced branched glycerol dialkyl glycerol tetraethers (brGDGTs), Clim. Past, 14, 1653–1667, https://doi.org/10.5194/cp-14-1653-2018, 2018.
Moon, T., Fisher, M., Stafford, T., and Harden, L.: QGreenland (3.0.0), https://doi.org/10.5281/zenodo.12823307, 2023.
Morrill, C., Meador, E., Livneh, B., Liefert, D. T., and Shuman, B. N.: Quantitative model-data comparison of mid-Holocene lake-level change in the central Rocky Mountains, Clim. Dynam., 53, 1077–1094, https://doi.org/10.1007/s00382-019-04633-3, 2019.
Muñoz Sabater, J.: ERA5-Land hourly data from 1950 to present, Copernicus Climate Change Service (C3S) Climate Data Store (CDS), https://doi.org/10.24381/cds.e2161bac, 2019.
Novak, J. B., Russell, J. M., Lindemuth, E. R., Prokopenko, A. A., Pérez-Angel, L., Zhao, B., Swann, G. E. A., and Polissar, P. J.: The Branched GDGT Isomer Ratio Refines Lacustrine Paleotemperature Estimates, Geochem. Geophy. Geosy., 26, e2024GC012069, https://doi.org/10.1029/2024GC012069, 2025.
Nusbaumer, J., Alexander, P. M., LeGrande, A. N., and Tedesco, M.: Spatial Shift of Greenland Moisture Sources Related to Enhanced Arctic Warming, Geophys. Res. Lett., 46, 14723–14731, https://doi.org/10.1029/2019GL084633, 2019.
Otiniano, G. A., Porter, T. J., Buceta, R. E., Bergman, M. E., and Phillips, M. A.: Climatic and environmentally driven variability in lacustrine brGDGT distributions at local to regional scales in Alaska and northwestern Canada, Org. Geochem., 181, https://doi.org/10.1016/j.orggeochem.2023.104604, 2023.
Otiniano, G. A., Porter, T. J., Phillips, M. A., Juutinen, S., Weckström, J. B., and Heikkilä, M. P.: Reconstructing warm-season temperatures using brGDGTs and assessing biases in Holocene temperature records in northern Fennoscandia, Quaternary Sci. Rev., 329, 108555, https://doi.org/10.1016/j.quascirev.2024.108555, 2024.
Otiniano, G. A., Thomas, E. K., Castañeda, I. S., Acharya, S., Sharma, Y., and Mark, S. Z.: chromatoPy: An Open-Source Tool for Chromatographic Peak Deconvolution and Integration Applied to Glycerol Dialkyl Glycerol Tetraethers, Paleoceanography and Paleoclimatology, 40, e2025PA005316, https://doi.org/10.1029/2025PA005316, 2025.
Ouellet-Bernier, M.-M., De Vernal, A., Hillaire-Marcel, C., and Moros, M.: Paleoceanographic changes in the Disko Bugt area, West Greenland, during the Holocene, The Holocene, 24, 1573–1583, https://doi.org/10.1177/0959683614544060, 2014.
Pepin, N., Bradley, R. S., Diaz, H. F., Baraer, M., Caceres, E. B., Forsythe, N., Fowler, H., Greenwood, G., Hashmi, M. Z., Liu, X. D., Miller, J. R., Ning, L., Ohmura, A., Palazzi, E., Rangwala, I., Schoner, W., Severskiy, I., Shahgedanova, M., Wang, M. B., Williamson, S. N., Yang, D. Q., and Mt Res Initiative EDW Working Grp: Elevation-dependent warming in mountain regions of the world, Nat. Clim. Change, 5, 424–430, https://doi.org/10.1038/Nclimate2563, 2015.
Perner, K., Moros, M., Jennings, A., Lloyd, J., and Knudsen, K.: Holocene palaeoceanographic evolution off West Greenland, The Holocene, 23, 374–387, https://doi.org/10.1177/0959683612460785, 2013.
Piccolroaz, S., Woolway, R. I., and Merchant, C. J.: Global reconstruction of twentieth century lake surface water temperature reveals different warming trends depending on the climatic zone, Climatic Change, 160, 427–442, https://doi.org/10.1007/s10584-020-02663-z, 2020.
Porter, C., Howat, I., Noh, M.-J., Husby, E., Khuvis, S., Danish, E., Tomko, K., Gardiner, J., Negrete, A., Yadav, B., Klassen, J., Kelleher, C., Cloutier, M., Bakker, J., Enos, J., Arnold, G., Bauer, G., and Morin, P.: ArcticDEM – Strips, Version 4.1 (V1), https://doi.org/10.7910/DVN/C98DVS, 2022.
Prowse, T., Alfredsen, K., Beltaos, S., Bonsal, B., Duguay, C., Korhola, A., McNamara, J., Pienitz, R., Vincent, W. F., Vuglinsky, V., and Weyhenmeyer, G. A.: Past and Future Changes in Arctic Lake and River Ice, Ambio, 40, 53–62, https://doi.org/10.1007/s13280-011-0216-7, 2011.
Raberg, J. H., Harning, D. J., Crump, S. E., de Wet, G., Blumm, A., Kopf, S., Geirsdóttir, Á., Miller, G. H., and Sepúlveda, J.: Revised fractional abundances and warm-season temperatures substantially improve brGDGT calibrations in lake sediments, Biogeosciences, 18, 3579–3603, https://doi.org/10.5194/bg-18-3579-2021, 2021.
Raberg, J. H., Miller, G. H., Geirsdóttir, Á., and Sepúlveda, J.: Near-universal trends in brGDGT lipid distributions in nature, Science Advances, 8, eabm7625, https://doi.org/10.1126/sciadv.abm7625, 2022.
Raberg, J. H., de Wet, G. A., Geirsdóttir, Á., Sepúlveda, J., and Miller, G. H.: Oxygen Depletion in Lake Waters May Skew brGDGT-Inferred Temperatures by More Than 10 °C, Geophys. Res. Lett., 52, e2024GL113562, https://doi.org/10.1029/2024GL113562, 2025.
Rantanen, M., Karpechko, A. Yu., Lipponen, A., Nordling, K., Hyvärinen, O., Ruosteenoja, K., Vihma, T., and Laaksonen, A.: The Arctic has warmed nearly four times faster than the globe since 1979, Commun. Earth Environ., 3, 168, https://doi.org/10.1038/s43247-022-00498-3, 2022.
Reyes, F. R. and Lougheed, V. L.: Rapid Nutrient Release from Permafrost Thaw in Arctic Aquatic Ecosystems, Arct. Antarct. Alp. Res., 47, 35–48, https://doi.org/10.1657/AAAR0013-099, 2015.
Russell, J. M., Hopmans, E. C., Loomis, S. E., Liang, J., and Sinninghe Damsté, J. S.: Distributions of 5- and 6-methyl branched glycerol dialkyl glycerol tetraethers (brGDGTs) in East African lake sediment: Effects of temperature, pH, and new lacustrine paleotemperature calibrations, Org. Geochem., 117, 56–69, https://doi.org/10.1016/j.orggeochem.2017.12.003, 2018.
Schneider, T., Castañeda, I. S., Zhao, B., Krüger, S., Salacup, J. M., and Bradley, R. S.: Tracing Holocene temperatures and human impact in a Greenlandic Lake: Novel insights from hyperspectral imaging and lipid biomarkers, Quaternary Sci. Rev., 339, 108851, https://doi.org/10.1016/j.quascirev.2024.108851, 2024.
Schouten, S., Hopmans, E. C., Schefuß, E., and Damste, J. S. S.: Distributional variations in marine crenarchaeotal membrane lipids: a new tool for reconstructing ancient sea water temperatures?, Earth Planet. Sc. Lett., 204, 265–274, 2002.
Schouten, S., Hopmans, E. C., and Damste, J. S. S.: The organic geochemistry of glycerol dialkyl glycerol tetraether lipids: A review, Org. Geochem., 54, 19–61, https://doi.org/10.1016/j.orggeochem.2012.09.006, 2013.
Schweinsberg, A. D., Briner, J. P., Miller, G. H., Bennike, O., and Thomas, E. K.: Local glaciation in West Greenland linked to North Atlantic Ocean circulation during the Holocene, Geology, 45, 195–198, https://doi.org/10.1130/G38114.1, 2017.
Schweinsberg, A. D., Briner, J. P., Licciardi, J. M., Bennike, O., Lifton, N. A., Graham, B. L., Young, N. E., Schaefer, J. M., and Zimmerman, S. H.: Multiple independent records of local glacier variability on Nuussuaq, West Greenland, during the Holocene, Quaternary Sci. Rev., 215, 253–271, https://doi.org/10.1016/j.quascirev.2019.05.007, 2019.
Seneviratne, S. I. and Hauser, M.: Regional Climate Sensitivity of Climate Extremes in CMIP6 Versus CMIP5 Multimodel Ensembles, Earths Future, 8, e2019EF001474, https://doi.org/10.1029/2019EF001474, 2020.
Shanahan, T. M., Hughen, K. A., and Van Mooy, B. A. S.: Temperature sensitivity of branched and isoprenoid GDGTs in Arctic lakes, Org. Geochem., 64, 119–128, https://doi.org/10.1016/j.orggeochem.2013.09.010, 2013.
Sinninghe Damsté, J. S., Hopmans, E. C., Pancost, R. D., Schouten, S., and Geenevasen, J. A.: Newly discovered non-isoprenoid glycerol dialkyl glycerol tetraether lipids in sediments, Chem. Commun., 1683–1684, https://doi.org/10.1039/B004517I, 2000.
Sinninghe Damsté, J. S., Weber, Y., Zopfi, J., Lehmann, M. F., and Niemann, H.: Distributions and sources of isoprenoidal GDGTs in Lake Lugano and other central European (peri-)alpine lakes: Lessons for their use as paleotemperature proxies, Quaternary Sci. Rev., 277, https://doi.org/10.1016/j.quascirev.2021.107352, 2022.
Sweeney, A. J., Fu, Q., Po-Chedley, S., Wang, H., and Wang, M.: Internal Variability Increased Arctic Amplification During 1980–2022, Geophys. Res. Lett., 50, e2023GL106060, https://doi.org/10.1029/2023GL106060, 2023.
Thomas, E. K., Briner, J. P., Ryan-Henry, J. J., and Huang, Y.: A major increase in winter snowfall during the middle Holocene on western Greenland caused by reduced sea ice in Baffin Bay and the Labrador Sea, Geophys. Res. Lett., 43, 5302–5308, https://doi.org/10.1002/2016GL068513, 2016.
Thomas, E. K., Castañeda, I. S., McKay, N. P., Briner, J. P., Salacup, J. M., Nguyen, K. Q., and Schweinsberg, A. D.: A Wetter Arctic Coincident With Hemispheric Warming 8,000 Years Ago, Geophys. Res. Lett., 45, https://doi.org/10.1029/2018GL079517, 2018.
Thomas, E. K., Hollister, K. V., Cluett, A. A., and Corcoran, M. C.: Reconstructing Arctic Precipitation Seasonality Using Aquatic Leaf Wax δ2H in Lakes With Contrasting Residence Times, Paleoceanogr. Paleoclimatology, 35, e2020PA003886, https://doi.org/10.1029/2020PA003886, 2020.
Thomas, E. K., Cluett, A. A., Erb, M. P., McKay, N. P., Briner, J. P., Castañeda, I. S., Corcoran, M. C., Cowling, O. C., Gorbey, D. B., Lindberg, K. R., Prince, K. K., and Salacup, J.: Early Holocene Laurentide Ice Sheet Retreat Influenced Summer Atmospheric Circulation in Baffin Bay, Geophys. Res. Lett., 50, https://doi.org/10.1029/2023gl103428, 2023.
Tierney, J. E., Schouten, S., Pitcher, A., Hopmans, E. C., and Sinninghe Damsté, J. S.: Core and intact polar glycerol dialkyl glycerol tetraethers (GDGTs) in Sand Pond, Warwick, Rhode Island (USA): Insights into the origin of lacustrine GDGTs, Geochim. Cosmochim. Ac., 77, 561–581, https://doi.org/10.1016/j.gca.2011.10.018, 2012.
Topness, R. G., Thomas, E. K., Fendrock, M., and Otiniano, G. A.: Calibration guidelines and a runoff-isotope module for lake proxy system modeling (PRYSM v2.0), EGUsphere [preprint], https://doi.org/10.5194/egusphere-2026-2322, 2026.
van Bree, L. G. J., Peterse, F., Baxter, A. J., De Crop, W., van Grinsven, S., Villanueva, L., Verschuren, D., and Sinninghe Damsté, J. S.: Seasonal variability and sources of in situ brGDGT production in a permanently stratified African crater lake, Biogeosciences, 17, 5443–5463, https://doi.org/10.5194/bg-17-5443-2020, 2020.
Vihma, T., Screen, J., Tjernström, M., Newton, B., Zhang, X., Popova, V., Deser, C., Holland, M., and Prowse, T.: The atmospheric role in the Arctic water cycle: A review on processes, past and future changes, and their impacts, J. Geophys. Res.-Biogeo., 121, 586–620, https://doi.org/10.1002/2015JG003132, 2016.
Weber, Y., De Jonge, C., Rijpstra, W. I. C., Hopmans, E. C., Stadnitskaia, A., Schubert, C. J., Lehmann, M. F., Sinninghe Damsté, J. S., and Niemann, H.: Identification and carbon isotope composition of a novel branched GDGT isomer in lake sediments: Evidence for lacustrine branched GDGT production, Geochim. Cosmochim. Ac., 154, 118–129, https://doi.org/10.1016/j.gca.2015.01.032, 2015.
Weber, Y., Sinninghe Damste, J. S., Zopfi, J., De Jonge, C., Gilli, A., Schubert, C. J., Lepori, F., Lehmann, M. F., and Niemann, H.: Redox-dependent niche differentiation provides evidence for multiple bacterial sources of glycerol tetraether lipids in lakes, P. Natl. Acad. Sci. USA, 115, 10926–10931, https://doi.org/10.1073/pnas.1805186115, 2018.
Westergaard-Nielsen, A., Hansen, B. U., Elberling, B., and Abermann, J.: Greenland Climates, in: Encyclopedia of the World's Biomes, edited by: Goldstein, M. I. and DellaSala, D. A., Elsevier, Oxford, 539–550, https://doi.org/10.1016/B978-0-12-409548-9.11750-6, 2020.
Wrona, F. J., Johansson, M., Culp, J. M., Jenkins, A., Mård, J., Myers-Smith, I. H., Prowse, T. D., Vincent, W. F., and Wookey, P. A.: Transitions in Arctic ecosystems: Ecological implications of a changing hydrological regime, J. Geophys. Res.-Biogeo., 121, 650–674, https://doi.org/10.1002/2015JG003133, 2016.
Wu, J., Yang, H., Pancost, R. D., Naafs, B. D. A., Qian, S., Dang, X., Sun, H., Pei, H., Wang, R., Zhao, S., and Xie, S.: Variations in dissolved O2 in a Chinese lake drive changes in microbial communities and impact sedimentary GDGT distributions, Chem. Geol., 579, https://doi.org/10.1016/j.chemgeo.2021.120348, 2021.
Yang, Q., Dixon, T. H., Myers, P. G., Bonin, J., Chambers, D., van den Broeke, M. R., Ribergaard, M. H., and Mortensen, J.: Recent increases in Arctic freshwater flux affects Labrador Sea convection and Atlantic overturning circulation, Nat. Commun., 7, 10525, https://doi.org/10.1038/ncomms10525, 2016.
Yao, Y., Zhao, J., Vachula, R. S., Werne, J. P., Wu, J., Song, X., and Huang, Y.: Correlation between the ratio of 5-methyl hexamethylated to pentamethylated branched GDGTs (HP5) and water depth reflects redox variations in stratified lakes, Org. Geochem., 147, https://doi.org/10.1016/j.orggeochem.2020.104076, 2020.
Young, N. E., Briner, J. P., Rood, D. H., Finkel, R. C., Corbett, L. B., and Bierman, P. R.: Age of the Fjord Stade moraines in the Disko Bugt region, western Greenland, and the 9.3 and 8.2 ka cooling events, Quaternary Sci. Rev., 60, 76–90, https://doi.org/10.1016/j.quascirev.2012.09.028, 2013.
Young, N. E., Briner, J. P., Miller, G. H., Lesnek, A. J., Crump, S. E., Thomas, E. K., Pendleton, S. L., Cuzzone, J., Lamp, J., Zimmerman, S., Caffee, M., and Schaefer, J. M.: Deglaciation of the Greenland and Laurentide ice sheets interrupted by glacier advance during abrupt coolings, Quaternary Sci. Rev., 229, 106091, https://doi.org/10.1016/j.quascirev.2019.106091, 2020.
Zhao, B., Castañeda, I. S., Bradley, R. S., Salacup, J. M., De Wet, G. A., Daniels, W. C., and Schneider, T.: Development of an in situ branched GDGT calibration in Lake 578, southern Greenland, Org. Geochem., 152, 104168, https://doi.org/10.1016/j.orggeochem.2020.104168, 2021.
Zhao, B., Russell, J. M., Tsai, V. C., Blaus, A., Parish, M. C., Liang, J., Wilk, A., Du, X., and Bush, M. B.: Evaluating global temperature calibrations for lacustrine branched GDGTs: Seasonal variability, paleoclimate implications, and future directions, Quaternary Sci. Rev., 310, 108124, https://doi.org/10.1016/j.quascirev.2023.108124, 2023.
We generated five new and compiled previously published Holocene temperature timeseries from southwestern Greenland. We found temperature maxima between 7500 and 5000 years ago, with temperatures approx. 2–5 °C higher than 1994–2024. Afterward, temperatures gradually cooled towards the present, following maximum summer insolation. Local variations in the magnitude and timing of the thermal maximum are related to topography and proximity to the ice sheet and the ocean.
We generated five new and compiled previously published Holocene temperature timeseries from...