
the Creative Commons Attribution 4.0 License.
the Creative Commons Attribution 4.0 License.
 | 14 Jul 2026

Ice core nitrogen isotopes archive dramatic changes in West Antarctic Ice Sheet thinning
Thomas K. Bauska
Amaëlle Landais
Carlos Martín
Eric W. Wolff
The behaviour of ice sheets during ice mass loss is currently not well constrained and is a major limiting factor in accurate predictions of ice sheet behaviour in our warming climate. Proxies from ice cores can record the history of ice mass loss at exceptional temporal resolution and unrivalled chronological accuracy. A recent record of Total Air Content (TAC) and ice core chemistry from Skytrain Ice Rise resolved a 450 m drop in ice sheet elevation at the site in the Weddell Sea Sector of the Antarctic Ice Sheet 8000 years ago, an event which occurred over just 200 years. The event is thought to represent an ungrounding and removal of the buttressing effect on the ice sheet in the region. However, proxy records for ice elevation, TAC, can show unexpected signals which indicates an imperfect understanding of how such gas records are captured in ice cores during rapid changes in ice sheet conditions, inhibiting expansion of such studies to other sites. Here we use ice core nitrogen isotope measurements to elucidate the dynamic evolution of the firn column, where such gas records are gradually trapped, during the 8 ka rapid ice mass loss. The horizontal divergence imparted on the ice rise during the event dramatically thinned the firn column to the extent that dynamic thinning of the firn is the dominating factor in how nitrogen isotopes are captured. As a result, the recorded signal of nitrogen isotopes directly opposes the signal predicted by current firn models which do not include such ice dynamics, suggesting that it is a critical factor to include in firn modelling studies of sites susceptible to rapid ice mass changes. Our findings allow us to tightly constrain where reliable elevation signals, not disrupted by changing ice dynamics, are available in ice core records. Moreover, our study demonstrates that the combination of TAC and nitrogen isotopes can be a powerful tool in constraining ice sheet dynamics at a site, thus helping to inform the physics of ice sheet models.
- Article
(3535 KB) - Full-text XML
-
Supplement
(1003 KB) - BibTeX
- EndNote


Uncertainty in ice sheet processes is identified as one of the major limiting factors in accurately predicting future sea level rise under current emissions pathways (IPCC, 2023). Under all current scenarios, the West Antarctic Ice Sheet (WAIS) is shown to be one of the most decisive climate tipping elements due to its high sensitivity to temperature increases and subsequent effects on sea level (Rosser et al., 2024). It is thus critical that we improve our understanding of both the timing of, and mechanisms behind, ice mass loss in this region. An effective way to do this is to obtain high resolution records of past ice sheet behaviour, which can be used to inform the models that predict future ice mass changes.
Ice cores provide exceptional records of past ice sheet behaviour, capturing direct samples of the ice properties and the atmosphere at the time the ice formed. A recent study from an ice core drilled at Skytrain Ice Rise (SIR) (Grieman et al., 2024) (Fig. 1) combined multiple ice-core climate proxies to elucidate ice sheet changes in the Weddell Sea region throughout the Holocene deglaciation. The study observed a rapid decline in ice mass at the ice core site approximately 8000 years ago (8 ka), with a 450 m reduction in ice sheet elevation over just 200 years, imposed on a background of more gradual ice mass decline. The event was followed by substantial ice shelf retreat in front of the ice rise. The proposed mechanism behind such a rapid ice mass loss was ungrounding of the ice sheet at the ice/ocean margin, with ocean water encroaching underneath the ice sheet. The sudden loss of the buttressing effect of the grounded ice that would otherwise have constrained outward flow of the ice sheet drove a rapid thinning upstream of the grounding line and SIR experienced a drop in elevation. This is one of the best resolved, direct paleoclimate records of such a rapid, centennial scale ice-loss event, and it raises important questions as to the potential for such events to occur in present day regions where ice is grounded on retrograde slopes – most notably the Amundsen Sea region and Thwaites Glacier in the WAIS, and examples such as the Wilkes Sub Glacial Basin in East Antarctica. We would thus look to repeat such studies in other ice core records throughout the region and indeed more widely through the ice sheet to help improve the spatial and temporal resolution of our picture of such rapid ice mass loss. However, a key record used to reconstruct the past elevation of the ice sheet in the study, the Total Air Content (TAC) of ice core samples, showed a complex oscillating signal throughout the period of rapid ice mass loss (Fig. 1) which cannot be directly attributed to elevation change (Grieman et al., 2024) and which extends over a longer period than the 200 yr ice elevation loss. It is, however, a real signal recorded in the ice well above the threshold of the high-accuracy TAC analytical method (Nehrbass-Ahles et al., 2022). An improved understanding of the parameters affecting the TAC signal, and more widely the capture of gases in ice core samples during rapid ice sheet changes, is required before the study of elevation change in the Holocene can be expanded to other ice cores.
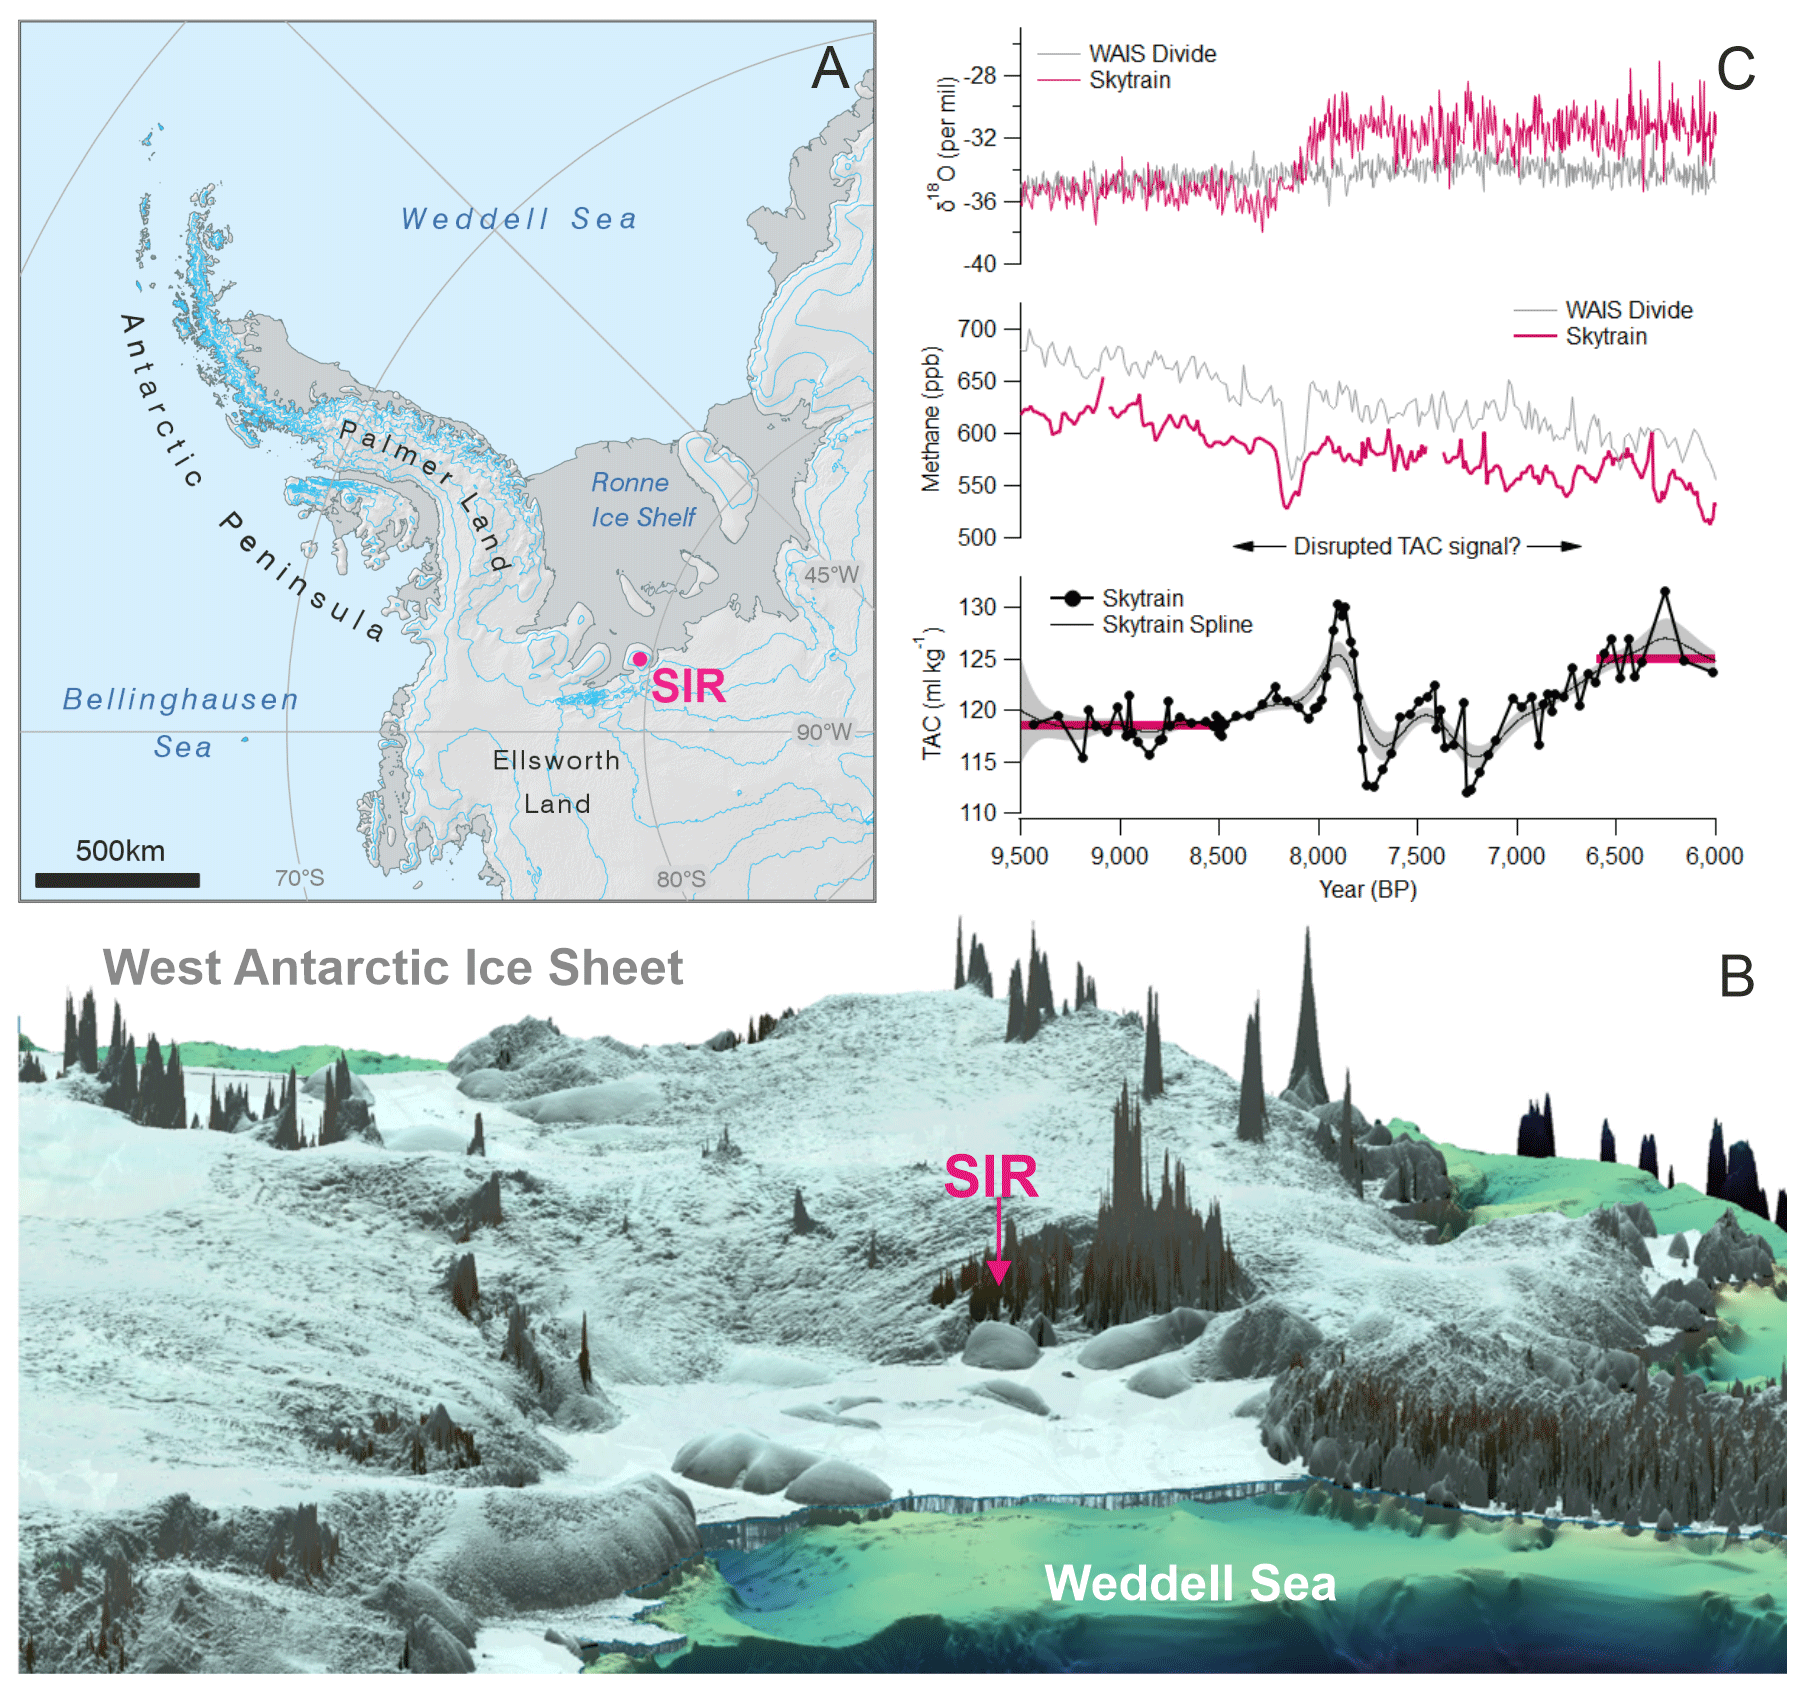
Figure 1Present day location map of Skytrain Ice Rise (panel A, “SIR”) and shown in a 3D topographic context (panel B, Greene et al., 2017; Morlighem et al., 2020) with SIR sitting at the interface between the floating Ronne Ice Shelf and the outward flowing continental ice sheet of West Antarctica. Panel C highlights the elevation loss event, over ∼200 years at ∼8 ka, observed in the Skytrain ice core records, with a significant jump in water isotopes (presented on the ST22 ice age scale) caused by ice elevation loss and subsequent temperature increase at the site (Grieman et al., 2024). Comparatively, records from the central WAIS, indicated by the WAIS Divide ice core record (Fudge et al., 2013), remain relatively stable. The TAC record from Skytrain (presented on the ST22 gas age scale), which is expected to indicate elevation at SIR during the ice mass change, shows a complex oscillating signal after 8 ka which is too great to be an elevation signal, and does not re-stabilise until significantly later, ∼6.5 ka. Also shown are the CH4 record from Skytrain (on the ST22 gas age scale) and WAIS Divide (Rhodes et al., 2015; Buizert et al., 2015). Note that the vertical scaling is exaggerated in panel (B), but for reference, at time of ice core drilling, SIR was ∼784 m elevation above sea level and ∼688 km from the ice shelf edge.
One underexplored process is the effect of ice sheet thinning on gas record preservation. In the case of TAC, physical properties of the firn column (the upper snow layers where compaction from snow to ice is in process and has not fully isolated the air bubbles from the overlying surface air) such as temperature and pore volume (the space available between snow grains in the firn column) affect the total amount of gas captured (Martinerie et al., 1992). Changes in the firnification processes thus have the potential to greatly impact TAC and other gas record capture. Thinning, or horizontal divergence, is often ignored in firn studies and infrequently discussed as a possible driver of variability in gas-phase proxies, with the notable exception of thinning changing the firn temperature gradient at South Pole (Morgan et al., 2022). This stems from the fact that most ice cores are drilled into some of the thickest areas of the ice sheet (>3000 m depth) and thus thinning in the firn (the uppermost 50–100 m) is relatively minor. In contrast, SIR is only 650 m thick with a firn column of at least 50 m. Additionally, as SIR is frozen to the bed, the ice flow in the lowermost hundred meters or so is very slow and thus most of the thinning occurs in a relatively short column of the uppermost ice. Furthermore, we typically drill ice cores on thick, stable domes or divides that do not record any major flow disturbances or changes in ice thickness. Even a record like WAIS Divide, an ice core drilled in central West Antarctica, has probably only experienced modest changes in elevation during the last deglaciation, on the order of few hundred meters, which is relativity minor compared to total ice thickness (∼10 % of a total of ∼3450 m). In contrast, SIR is currently 650 m thick but may have been up to 1300 m thick prior to the rapid ice loss at 8 ka. The ice thinned by up to 650 m (most likely value being 450 m) (Grieman et al., 2024), meaning that potentially the whole column thinned by up to 50 % within just a few hundred years.
Secondarily, accumulation-induced thinning driven simply by the vertical motion of ice is relatively minor at most sites. For example, a typical core in East Antarctica might have an accumulation rate of 0.05 m a−1 over a thickness of 3000 m, which gives a whole column horizontal divergence, which we are using with a definition of vertical strain rate in the absence of densification, of , where horizontal divergence is approximately equal to accumulation divided by ice thickness (see Eq. 3). Meanwhile, SIR, with a higher accumulation at 0.14 m a−1 and ice thickness of only 650 m, experiences nearly an order of magnitude faster rates of thinning ().
In this study we use nitrogen isotopes to determine the changing properties of the firn column during rapid loss of ice sheet elevation at SIR. The ratio between nitrogen isotopes 15N and 14N relative to its standard, the atmosphere (expressed herein as δ15N) is constant in the atmosphere over the timescales we consider here, and so any change in the ratio is due to fractionation processes in the firn column (Severinghaus et al., 2003). These may be preferential gravitational settling of the heavy isotope, telling us the thickness of the firn column, or preference of the heavier isotope toward cold temperatures, which tells us about the temperature fluctuations within the firn column. Events of rapid change in δ15N have been seen in the Holocene records from other coastal domes across the WAIS, hinting at significant changes in the firn column at these sites under multiple possible drivers (see later discussion). We combine these measurements with firn modelling techniques to show how δ15N can tell us about dramatic changes in ice sheet thickness. We also identify potential missing processes in our current understanding of the firnification process at the ice core site. We conclude by proposing the mechanisms behind the disrupted TAC gas archive in Skytrain ice core and add to the picture of the processes occurring in the ice sheet at SIR during rapid ice mass loss.
2.1 Skytrain Ice Core Sampling
The 651 m Skytrain ice core was drilled at SIR during the field season 2018–2019 (Mulvaney et al., 2021). Samples for nitrogen isotope analysis were selected based on the previously developed ST22 age scale (Hoffmann et al., 2022; Mulvaney et al., 2023). To align with previously published TAC data, sample ages are presented on the ST22-WD2014 version of the gas age scale, where age alignment has been optimised to the WD2014 age scale. Sampling in this study covers the period of disrupted TAC signal around the 8 ka elevation change as well as a period of relative TAC stability on either side. A total of 60 samples were taken between 352.0–403.35 m, representing an age range of 5.84–8.54 ka, and giving an average age resolution of 46 years. Samples of 5 cm length were taken from a pre-cut ice strip of 3.2 cm×3.2 cm, from which the previously measured TAC samples had also been taken. Samples for nitrogen isotopes were taken proximally (or as close to, dependent on avoiding features such as cracks) to where TAC samples had been taken to allow for close replication. Samples were prepared in the −25 °C cold laboratories at the British Antarctic Survey, Cambridge, UK, and transported to the analytical laboratory in Paris, France, in insulated boxes and using specialist cold chain shipping which retains sample temperature at −25 °C.
While our measured data is presented on the gas age scale, some of our investigation compares to previous data presented on the ice age scale, for example existing records of water isotopes. The age scales for each record are given in each relevant figure caption. Specific phasing between records is subject to error; gas-age to ice-age offset, or delta age, is ∼400 years before the 8 ka event and ∼300 years following, while dating errors on the ice age scale within this region of the Holocene is at least a century, as a conservative estimate (Mulvaney et al., 2023). Alongside varying uncertainties and age resolution of different datasets, the specific signal of the “8 ka event” between records may appear as slight offsets in the initiation of change between factors in our model runs, but in reality such changes, for example between increasing temperature and decreasing altitude of the site, would be occurring simultaneously.
2.2 Nitrogen Isotope Analysis
Nitrogen isotopes, alongside argon isotopes and the ratio of O2 N2, were measured at LSCE, Paris. After removing 2–3 mm of the exterior part of the ice samples, air was extracted from the ice samples using a semi-automatic melt-refreeze line. Three duplicate samples can be processed each day together with two samples of outside air used for daily calibration. In short, the samples are placed into glass vessels which are evacuated before the ice is melted, enabling air to escape from the bubbles. The melt water is then refrozen, and the extracted air is cryogenically trapped in tubes filled with silica gel and immersed in liquid nitrogen. After 3 h at 30 °C, allowing air desorption from the silica gel, the air is introduced into the bellows of an isotopic ratio mass spectrometer (Thermo® Delta Q). The isotopic and elemental measurements are performed by dual inlet, i.e. by successive introduction of a small amount of the sample and the measurements standard (dry air without CO2). Two sequences of 16 dual inlet measurements are performed, usually leading to a 1σ uncertainty of 0.007 ‰ and 0.6 ‰ respectively for δ15N and , based on the standard deviation of the replicate samples for each depth level. For the Skytrain samples, the values for the 1σ uncertainty were larger (0.014 ‰ for δ15N and 1.8 ‰ for O2 N2) suggesting variability at short spatial scale in this record. It is not clear why the uncertainties are higher, however one reason may be that we are comparing to measurements from clathrate ice for example EPICA Dome C, whereas the Skytrain samples are bubble ice. Alternatively, it may be because we had small sample sizes so the replicate samples were sometimes the minimum amount of ice for analysis, and we were not able to trim the samples substantially to account for any gas loss by diffusion in the outer layers.
Although less precise than with other techniques using purification of the gas (Morgan et al., 2022; Servettaz et al., 2022; Severinghaus et al., 2003), δ40Ar can also be measured with this configuration of the Delta Q mass spectrometer. There was a 1σ uncertainty of 0.06 ‰ for δ40Ar on this series of measurements. We note here that the analytical method used was optimised for analysis of δ15N, and δ40Ar and O2 N2 were also measured but not fully optimised. These later became of interest to investigate due to the somewhat unexpected results of the δ15N analysis (reduced values over the 8 ka event, as opposed to increased). This may also have resulted in slightly higher variability in the data for δ40Ar and O2 N2.
Final values of δ15N and δ40Ar preserved in the ice core are products of both thermal and gravitation fractionation within the firn column. Following Severinghaus et al. (2003) the difference in mass dependent gravitation fractionation between the two, which is four times greater for δ40Ar, can be used to isolate the thermal component of the signal, δ15Nexcess (herein Nexcess). For Nexcess, the uncertainty is 0.03 ‰.
A negative N excess value implies that the top of the firn column was colder than the base, and a positive Nexcess implies the top of the firn column was warmer than the base. Using the thermal sensitivities of N (ΩN, 0.0145 ‰ °C−1) and Ar (ΩAr, 0.036 ‰ °C−1) we can deduce the temperature difference in the firn, ΔT.
2.3 Sample Gas Fractionation
Loss of gases from ice core samples can cause distortion of the captured gas records. Gas fractionation processes can occur during bubble formation or due to post-coring factors (Bender et al., 1995). Smaller gas molecules can more easily diffuse out of the ice compared to larger molecules, thus gas fractionation can be indicated using the ratio of O2, the smaller molecule, to N2, the larger molecule in the ice core samples. The record of O2 N2 for Skytrain shows some variability, which may be indicative of a small amount of gas loss and a possible explanation for the variability shown in our δ40Ar and Nexcess records, however there is no visible change above the background variability of the O2 N2 record in the period of reduced δ15N specifically, indicating that this is a “real” feature in the δ15N gas record (Fig. S1 in the Supplement).
2.4 Community Firn Model
We employed the Community Firn Model (CFM) (Stevens et al., 2020) as a heuristic guide to understand the processes driving the δ15N variability we observe, as well as a quantitative method to explore possible histories of temperature, accumulation and ice sheet thinning that reconcile our δ15N data. The CFM is an open-source firn model designed to simulate the evolution of physical firn properties such as temperature, density, porosity, and associated firn air parameters including profiles of δ15N and δ40Ar (thus Nexcess is modelled). Here we present results that were run exclusively in the standard physics setup which enables a transient evolution of the Herron and Langway (1980) empirical model (“HLdynamic”) with ice conductivity based on Calonne et al. (2019). The CFM model parameters used are summarised in Table 1.
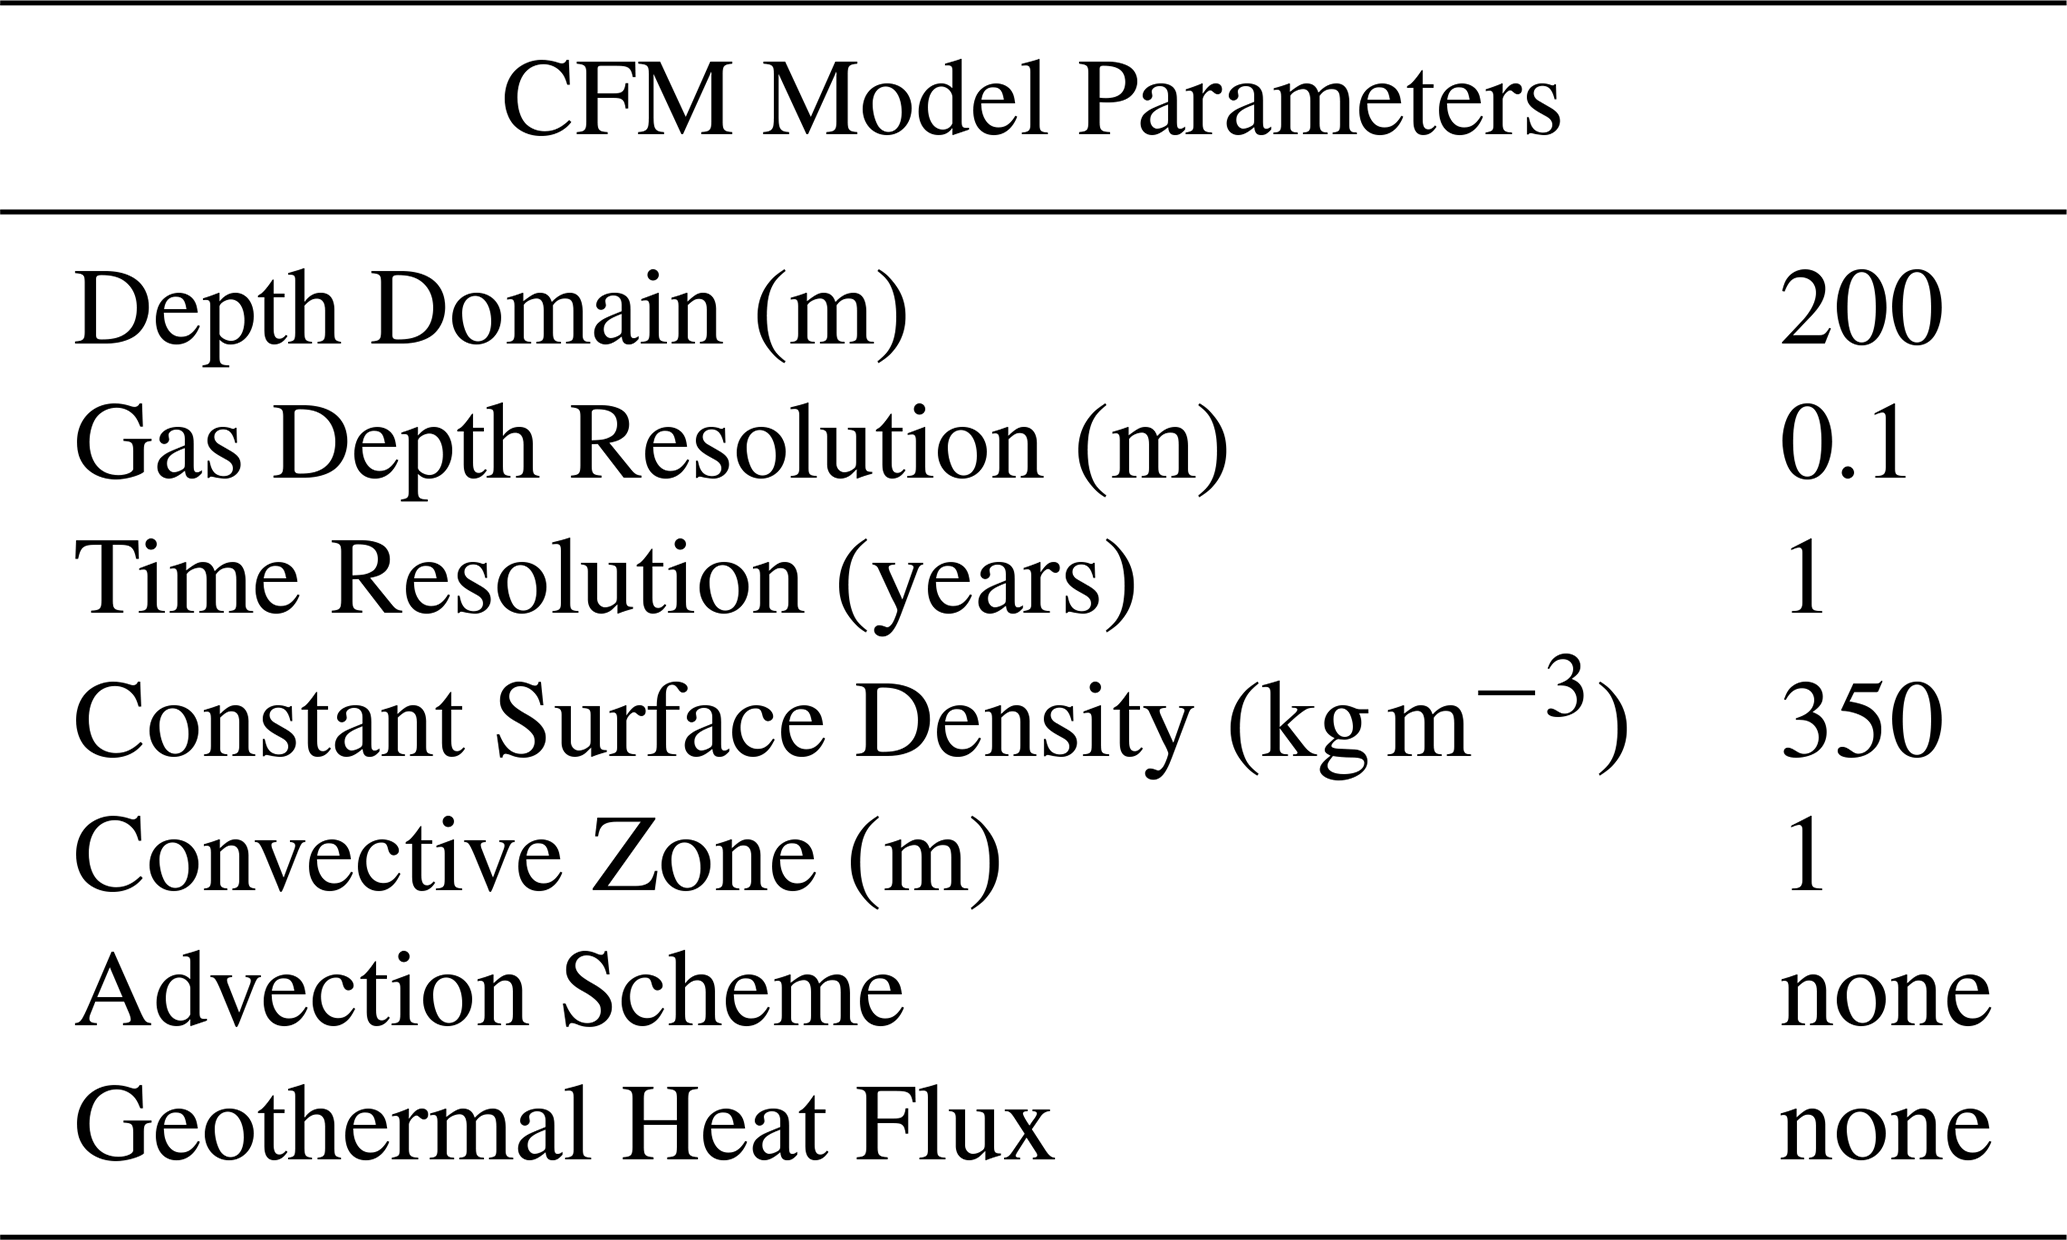
Additionally, we use the recently developed horizontal divergence scheme in the CFM (Horlings et al., 2021) whereby a parcel (in a Lagrangian framework) is first compressed due to densification and then further thinned due to a prescribed horizontal divergence rate. Throughout this manuscript where we use the term horizontal divergence, we are referring to vertical strain in the absence of densification. In our case, we impose a total horizontal divergence rate (a−1). To calculate the total horizontal divergence, we sum the divergence imparted from accumulation a (m a−1) and rate of change in ice sheet thickness (m a−1):
By dividing the vertical velocity induced by both accumulation and change in ice sheet thickness by the ice sheet thickness itself (H) we are assuming that ice is incompressible, and more importantly that the vertical strain is uniform in the ice column. The uniform strain is an oversimplification, but a conservative one. If the ice sheet is frozen to the bed, as is the case with SIR, the vertical velocity slows dramatically near the base of the ice sheet, which is different to cores that experience basal melting, for example WAIS Divide and EPICA Dome C. Typically, this is at least one hundred meters off the bed and thus the effective value of H one might consider to calculate horizontal divergence is some fraction of the true thickness. A more accurate method using a Lliboutry vertical profile (Lliboutry, 1979) is employed in our 1-D borehole model, but to first order our approximation is sufficient for our heuristic purposes. A more detailed presentation of these different approaches to strain in modelling our ice core site, and how the comparative strains evolve through the 8 ka event, is given in Fig. S3.
Another crucial assumption of our model is that the material properties of the firn do not change with the imposed thinning. For example, there is no further change in density nor any feedback into the densification rate itself such as strain-induced softening (Oraschewski and Grinsted, 2022) – a set of assumptions that may require further study. The net effect of enhanced horizontal divergence is a shoaling of the close-off depth, as has been shown to be important in fast-flowing ice regimes, not unlike SIR during a rapid thinning event.
To drive the CFM in all the heuristic experiments (Fig. 3), we use the stable water isotopes records to first derive a plausible surface temperature history of the site using an isotope-to-temperature conversion of 0.8±0.2 ‰ per mil per deg C (as in Grieman et al., 2024) with a modern temperature (last 250 years) of −25 °C. To roughly estimate an accumulation history we then use a temperature-dependent accumulation rate conversion of 0.0075±0.0025 ‰ m ice equivalent per deg C (about 3 %–7 % per deg C) with a modern accumulation of 0.15 m ice equivalent. This choice of sensitivity places the accumulation rate increase at 8 ka between the prior and posterior histories from the Skytrain chronology (Fig. S6). Additionally, this sensitivity is within bounds but at the lower end of model- and data-based constraints on the Antarctic-wide accumulation-to-temperature relationship (Nicola et al., 2023).
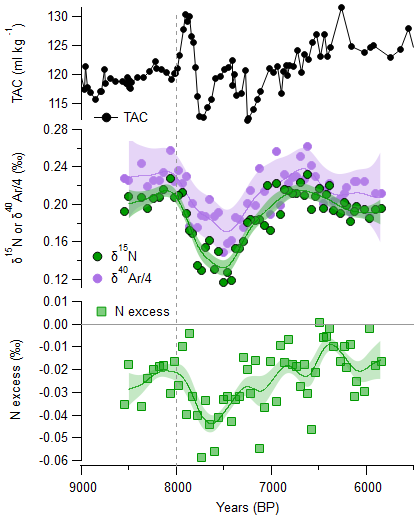
Figure 2Values of δ15N and δ40Ar from the Skytrain ice core (middle panel) throughout the rapid elevation change at the site ∼8 ka (dashed line), plotted against the previously published TAC data (top panel) (Grieman et al., 2024). Smoothing splines are also presented (see methods), with uncertainty bands becoming large at the ends of the dataset due to a lack of constraining data points beyond here. Also shown is the calculated Nexcess. All records are presented on the ST22 gas age scale.
As a first pass constraining a possible thinning history, we extracted the ice thickness history at SIR from a single experiment with the Parallel Ice Sheet Model (PISM) model and calculated the thinning-induced divergence rate. The particular transient experiment comes from the deglacial scenario presented in Kingslake et al. (2018) which indicated a widespread retreat of the grounding line starting around 12 500 years before present that extended further inland than the present-day grounding line before readvancing in the early Holocene. The absolute timing, rate of change and magnitude of this response in the model have been shown to be dependent on model boundary conditions and parameterization – in particular model resolution and bed topography (Albrecht et al., 2020b, a). For consistency with previous work (Grieman et al., 2024) we use this particular model and align the elevation drop with the initial rise in water isotopes at 8 ka by shifting the modelled time forward by 4500 years. We stress that this model run is only a guide to the possible divergence rates and that the detailed history of WAIS retreat remains highly under-constrained from models alone.
2.5 Smoothing Splines
Smoothed splines of datasets are generated using the methods presented in King et al. (2024). Briefly, the method applies a random sampling with replacement bootstrap over 10 000 iterations with the smoothing function generating a spline and uncertainty bands based on the smoothing parameter. This parameter is tuned to the time-resolution and length of the input data. Spline parameters used for each dataset can be found in Table S1 in the Supplement.
3.1 δ15N and from the Skytrain ice core
We present the measurements of δ15N and from the Skytrain ice core alongside the existing TAC record and calculated Nexcess from our measurements in Fig. 2. The main feature in both our records of δ15N and is a significant dip from initial values, before 8 ka, towards more negative values beginning at approximately 8 ka, followed by a recovery to initial values. The entire excursion to negative values occurs over a duration of approximately 1500 years. This duration matches the period of disruption previously observed in the Skytrain TAC record. The measured values of δ15N and result in a corresponding dip in Nexcess values, to more negative values, over the same period, however the Nexcess data has high variability. The data is discussed in more detail below, however, to enable a more interpretive discussion on what these results tell us alongside their presentation, we first model the possible scenarios driving our changing isotope records.
3.2 Modelling drivers of δ15N change
As a first step, we use the CFM to break down the possible drivers of δ15N change at SIR into constituent parts in a series of factorial experiments. These experiments should not be considered perfect reconstructions of individual factors as the forcings (temperature, accumulation and thinning) are not known a priori, but rather illustrations to guide us. First, holding all other variables stable, we change surface temperature (Fig. 3, Scenario 1), increasing it by about 4 °C which roughly reflects the lapse-rate impact of the reconstructed decrease in elevation at 8 ka. The result is an initial increase in δ15N as a strong temperature gradient is briefly established in the firn and the thermal fractionation dominates, followed by a shift toward slightly lower values as the firn densification adjusts to the warmer temperature and the close-off depth shoals. In the second experiment, Scenario 2, we change only accumulation, increasing it as would be expected from an ice core site experiencing warmer, more moist, more coastal conditions. Here the close-off depth increases along-side the δ15N. In the third experiment, Scenario 3, we combine both temperature and accumulation and see how competing effects of temperature and accumulation on close-off depth largely cancel each out and the thermal effect (the peak in δ15N) dominates the signal. At the same time, the bubble close-off depth becomes slightly shallower, from ∼58 to ∼52 m. The result is a predicted peak at ∼8.0 ka, with increases in both δ15N and Nexcess (Fig. S2) of ∼0.04 ‰ and ∼0.02 ‰ respectively, which decay away by ∼7.8 ka.
This suggests that under our assumptions of what the δ18O increase represents we would expect to see a peak in δ15N across the 8 ka event. We note that these peaks are relatively small in comparison to the uncertainty of our data. However, as we will see, even with this taken into account, these predictions are significantly different to our measured data. To explore a new scenario, in the fourth experiment (Scenario 4) we model just changes in horizontal divergence as modelled in the PISM simulation (see methods) combined with a small, constant divergence induced by the relatively high accumulation in a short ice column. The increased divergence causes the close-off depth to shoal and the δ15N decreases strongly as the gravitational effect dominates the signal. We thus have a competing effect from thinning that could potentially drive the δ15N signal.
3.3 Comparing δ15N model predictions and measured data
We now compare our predictions to the measured data (Fig. 2). Comparing δ15N, where each of our temperature and accumulation scenarios predict a peak in values, we observe a similar small initial peak, from a spline-based value of 0.20±0.01 ‰ at 8.4 ka to 0.22±0.006 ‰ at 8.1 ka. However, this is followed by a large decrease in δ15N to a minimum of 0.13±0.008 at ∼7.4 ka. The minimum is reached approximately 500 years after the initiation of ice mass changes as suggested by the water isotope record at SIR, with a slow recovery in values lasting until ∼6.6 ka with values of 0.22±0.007 ‰, and with an apparent slow reduction and “re-stabilisation” of values to 0.19±0.007 ‰ by ∼6 ka. This indicates that after an initial as-predicted reaction to increasing temperature and accumulation at the site as elevation lowered, the horizontal divergence factor takes over with a striking dominating effect on the firn signal of δ15N. The dynamic ice changes at SIR appear to last up to a duration of 1500 years following the start of the initial rapid 200 year event of ice elevation loss as observed in Grieman et al. (2024).
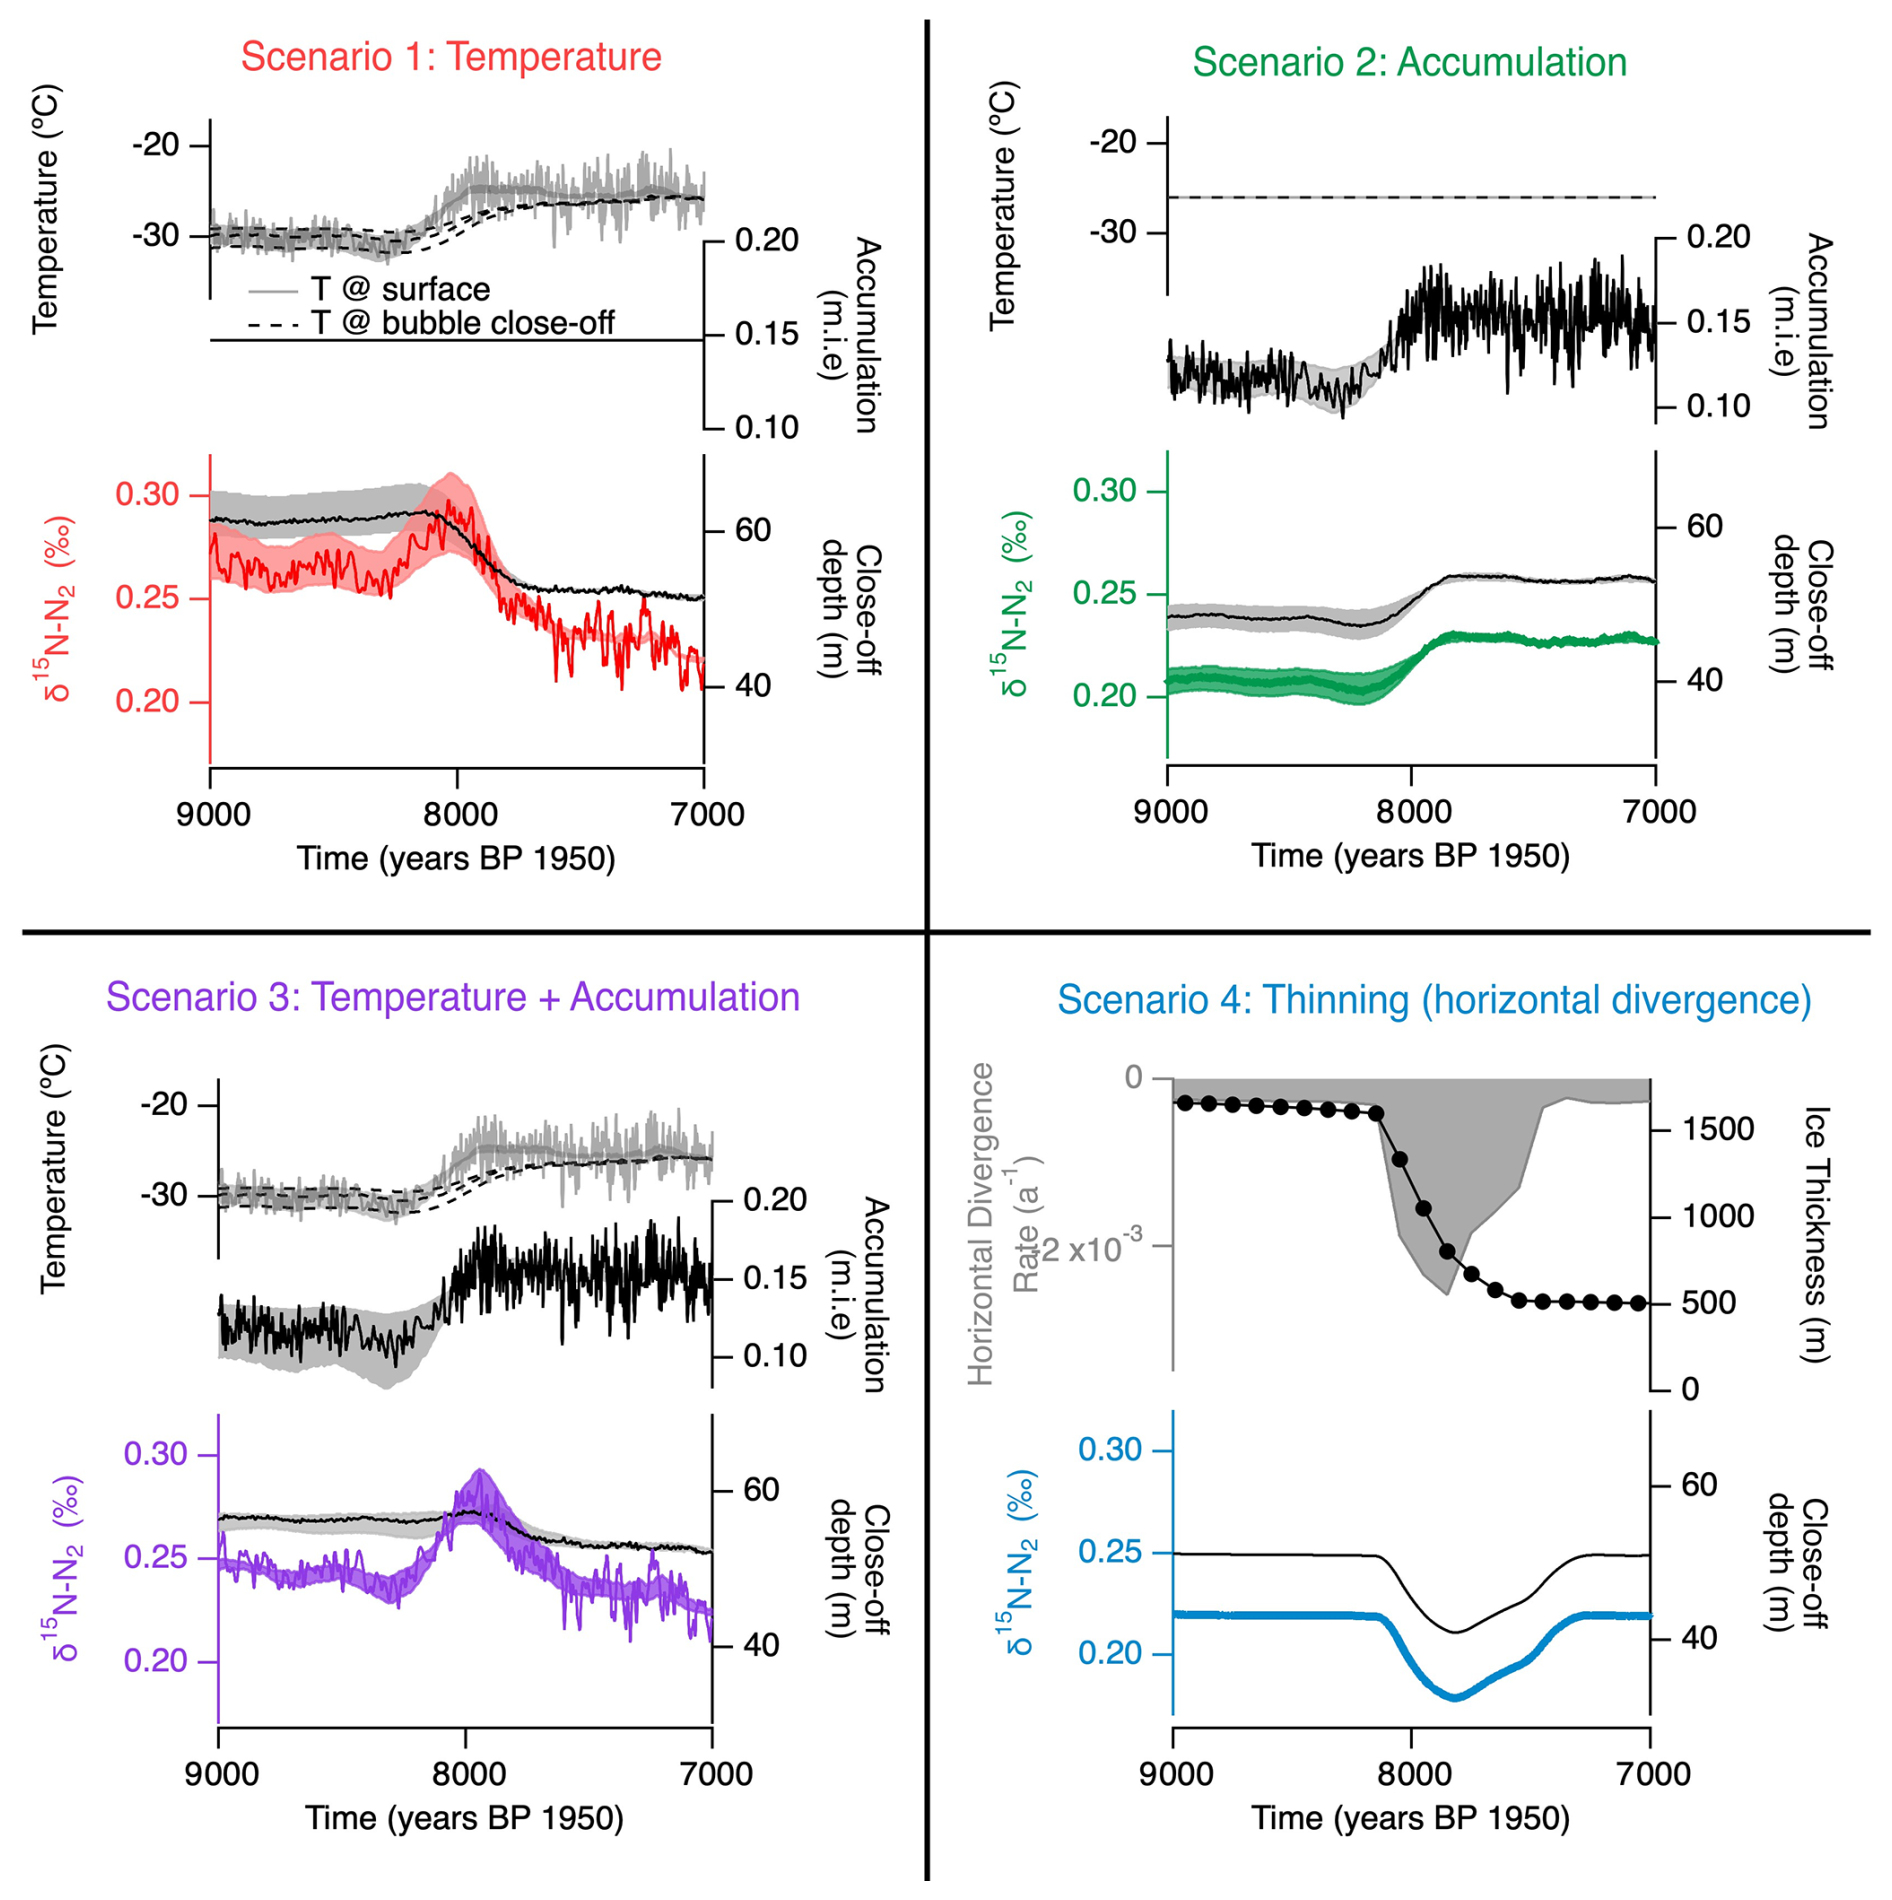
Figure 3Factorial Experiments using the CFM to disentangle the potential drivers of δ15N variability at SIR. Panels show changes in temperature-only (red), accumulation-only (green) and a combination of temperature and accumulation (purple) with the two forcings of surface temperature (light grey) and accumulation (solid black). Also shown in these panels are the predicted temperature at bubble close-off (dashed black), the close-off depth (solid black) and the δ15N (coloured coded to the given experiment). Panel 4 shows the prediction using just the horizontal divergence calculated from PISM plus constant accumulation rate (filled in grey).
Predicted values of Nexcess (Fig. S4) are also contradicted by the measured data. Again, a small increase in Nexcess is predicted in all scenarios at the initiation of ice mass change 8 ka, returning to stable values shortly thereafter. Despite a large scattering, our results suggest that values first increased to a spline-based value of at ∼8 ka from at ∼8.4 ka, and then reduced to as low as at ∼7.5 ka. Measured Nexcess data shows that values remain negative throughout, with a reduction towards more negative values occurring throughout the same period as the reduced δ15N.
Comparing both δ15N and Nexcess to the TAC signal (Fig. 2), the disruption to the signals, with lowering of values and recovery, spans the full duration of the oscillating TAC signal, with a minimum duration of ∼1500 years.
3.4 Optimising model-data agreement
So far we have considered the importance of individual factors in explaining our nitrogen isotope records. We now attempt to “tune” the model output to the best fit for our measured δ15N and explore some plausible scenarios that may best explain our measured record (Fig. 4). The most realistic starting point from our factorial experiments is a combination of Scenarios 3 and 4, including the changes in temperature, accumulation rate and horizontal divergence. While this combination comes close to explaining our δ15N record, it predicts absolute values of δ15N which are slightly higher than the measured data both preceding and during the drop in δ15N, and a drop and recovery in δ15N values which is slightly shorter in duration than suggested by the measured data (Fig. 4, “Combined Scenario”).
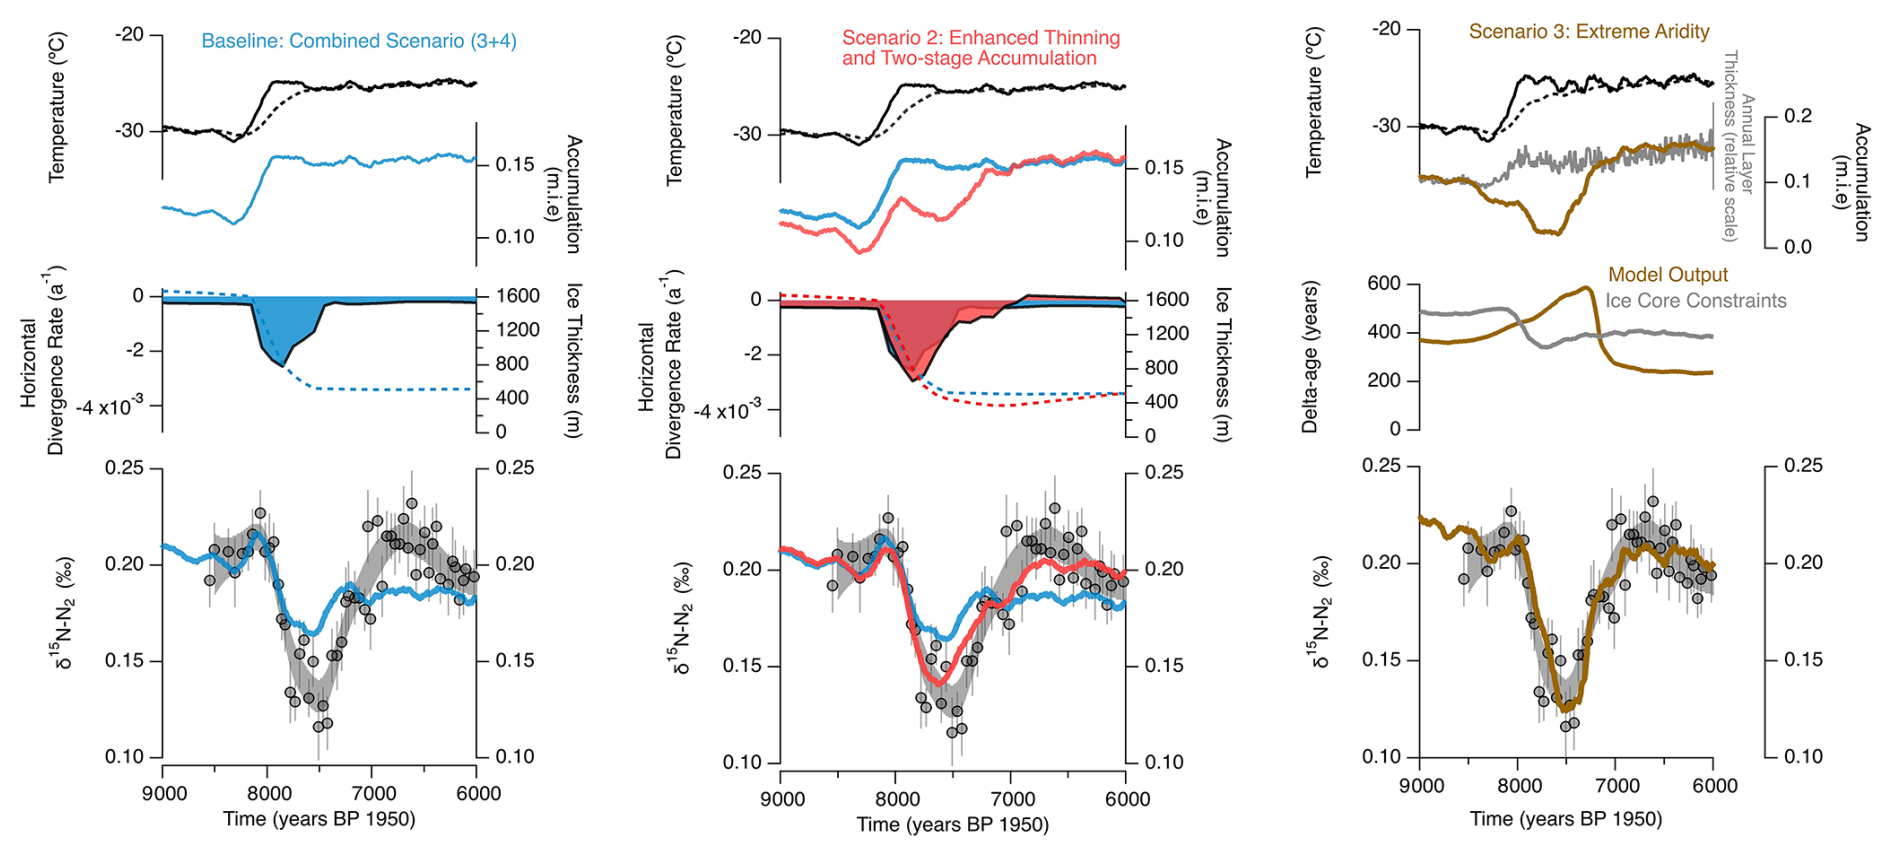
Figure 4Optimising the model parameters to best fit data, where temperature, accumulation (top plot in each panel) and horizontal divergence rates (middle plot) are adjusted so that the model output of the absolute values of δ15N and duration of the reduction in δ15N more closely match the measured data (lower plot in all panels). The left panel shows our “baseline” scenario, that of the temperature, accumulation, and horizontal divergence previous suggested by out measured datasets, from which to build. The middle panel introduces a two stage change in accumulation and enhances the horizontal divergence rate and duration, and the right panel presents a scenario of extreme aridity to demonstrate a period of net ablation.
One possibility to align absolute values of the δ15N is to consider a stronger, two-phase increase in accumulation following the water isotope increase. Grieman et al. (2024) argued that delays in the Na increase relative to the water isotope increase reflects that thinning preceded ice shelf breakup. The proposed breakup phase centres around 7.5 ka, which aligns with an increase in δ15N not captured in our idealized scenario. Following ice shelf breakup SIR would be approximately 270 km closer to local sources of moisture, which could have increased accumulation. In the optimized scenario we include a second increase in accumulation after 7.5 ka which drives a stronger, sharper increase in δ15N as the thinning returns to steady-state. This larger increase in accumulation before and after the jump with an effective sensitivity-to-temperature of approximately 6 % also improves the δ15N match before and after the jump – which are nearly equal in the data.
Additionally, our idealized scenario assumes uniform strain throughout the ice column whereas, in reality, thinning rates will be higher in the upper sections. To better fit the shape of the drop in the measured δ15N, we require the firn column to be thinned for a longer duration than that suggested by the current model and with a marginally higher divergence rate. Although this is a subjective process, we increase the duration over which the horizontal divergence is acting on the firn in the model and increase the divergence rate to within a reasonable fit of the measured data to give a suggestion of the magnitude of change required. This is not intended to be quantitative but does suggest that the ice thinning at SIR in the PISM model may be underestimated in both duration and magnitude. Further quantification would require extracting the thinning rates from a 3D thermo-mechanical ice sheet model, but in principle this demonstrates that ice core nitrogen isotopes can inform the physics of the ice sheet models.
3.5 Nexcess as a temperature signal at Skytrain
Is our Nexcess record a signal of firn column temperature? If we take the Nexcess as a true indication of firn column temperature, then our data rather surprisingly suggests that the top of the firn column cooled relative to the base of the firn column, ΔT, by up to −4 °C (Fig. S2). Given the likely rise in site temperature and accumulation rate following surface lowering of the ice sheet, as suggested by the water isotope record, this is unexpected. The pre-existing gradient of warming down the borehole at SIR (shown on Fig. S5) comes from the geothermal gradient of the ice at the site (Mulvaney et al., 2021). An increasingly negative Nexcess signal would require a relative cooling of the surface air at the site or a relative warming of the base of the firn column. In the case of the former, we already know that the surface elevation lowered, and surface temperature would subsequently increase. A possible mechanism for warming the base of the firn column exists where thinning of the ice sheet occurs at a site where a geothermal gradient warms the base of the ice sheet upwards, or where the geothermal heat flux itself increases. The latter we rule out over the timescales and magnitude of temperature change required here. Considering the former, at the Skytrain ice core site, the measured borehole temperature profile shows an increase in temperature down through the depth of the ice sheet due to the geothermal gradient, from a modern surface temperature of −26 °C to a basal temperature of −15 °C, a −11 °C change over the 654 m ice thickness. Though a potential mechanism to warm the base of the firn column, this would be combined with warming surface temperatures, reducing the temperature gradient in the firn column. While the required temperature gradients for our Nexcess data seem unlikely in these scenarios, we briefly test these assumptions employing a 1D borehole thermal model (see Supplement). Given the known physical properties at the site, the model confirms that an inversion of temperature gradient to more negative values at the top of the firn column did not occur (Fig. S5).
We did not use the most optimised methodology for measurement of δ40Ar on these samples as the main target was δ15N. This introduces a limit on how far we can interpret the δ40Ar and as such the Nexcess signals, alongside the higher 1σ uncertainty of the samples suggesting short term variability in the Skytrain record. A possible mechanism to explain an unexpectedly low Nexcess was presented by Morgan et al. (2022), a “seasonal rectifier”. Here, winter temperatures are thought to be preferentially stored in the ice core record. A strong temperature inversion in the firn due to very cold surface temperatures may cause an unstable air-density profile in the firn which convects colder temperatures lower into the firn column, something which is not “averaged out” to the annual mean, as expected, with summer temperatures convecting more shallowly. However, we emphasise again that our Nexcess record cannot be interpreted as a temperature signal with certainty.
3.6 Comparison to other ice core records
Features of abrupt change in the δ15N record have been observed in several coastal cores from the WAIS during the Holocene. Here we compare these features and their hypothesised causes to that which is seen in our Skytrain record.
Geographically closest to Skytrain, the Berkner ice core was retrieved from Berkner Island, an isolated ice rise sitting at the front of the Ronne Ice Shelf. The nitrogen isotope record shows a considerably disrupted record of δ15N, with multiple features of lowering and recovering values over the period ∼20–∼7 ka (Capron et al., 2013) (Fig. 5). The authors could not reconcile the δ15N record with expectations from modelled values based on temperature and accumulation driven firnification alone, concluding that independent processes were affecting firn structure. The features of low δ15N are of similar magnitude to that seen in Skytrain but are variable in their shape and duration. Sitting closer to the front of the ice shelf, the site may be more susceptible to dynamic changes as ice retreated, compared to those sites at the back of the shelf, resulting in the repeated δ15N excursions through the Holocene record. Further investigation is needed to confirm this, with measurements of TAC planned.
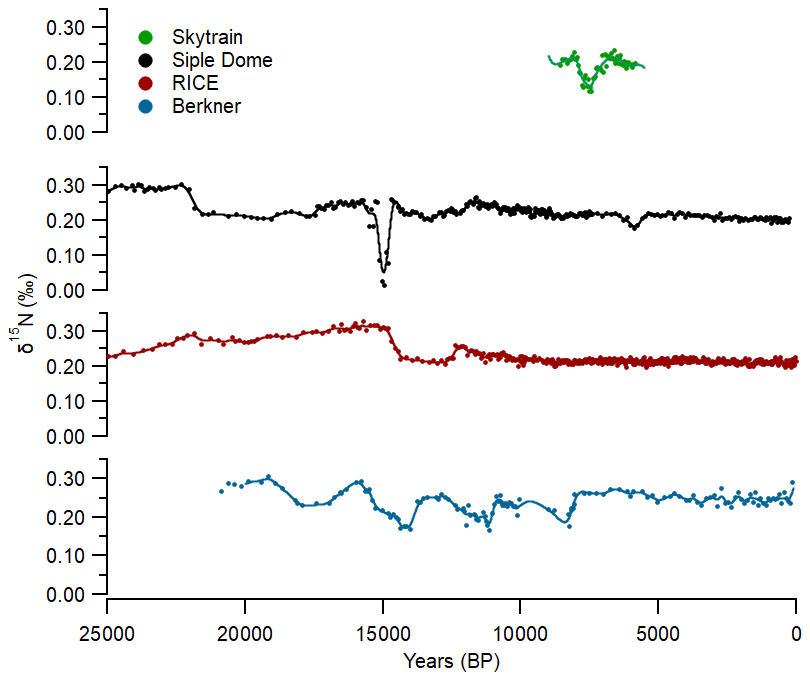
Figure 5δ15N profiles from previously measured coastal WAIS ice cores, Skytrain (this study), Siple Dome (as published in Morgan et al., 2022), RICE (as published in Lee et al., 2020) and Berkner (as published in Capron et al., 2013).
The RICE core was drilled on Roosevelt Island, sitting similarly to Berkner at the front of the ice shelf in the opposing Ross Sea sector of WAIS. Here the δ15N record is more stable throughout the Holocene but has a distinct drop in the record at ∼15 ka (Lee et al., 2020). In contrast to our Skytrain record, the RICE δ15N does not rapidly recover to higher values, remaining at largely stable, lower values of δ15N in a step-wise change. The authors interpret the event as a drop in accumulation rate, caused by changes in atmospheric patterns and potentially extent of the Ross Ice Shelf. They prefer this to a change in ice thickness, given that their high-resolution record of TAC does not support this. However, there is also geological evidence of ice sheet thinning and retreat in the Ross Sea region in the mid-Holocene (Anderson et al., 2014; Bart and Kratochvil, 2022) suggesting that multiple factors could occur simultaneously.
Siple Dome sits at the interface between the ice shelf and ice sheet, akin to Skytrain Ice Rise, but in the opposing sector of the Ross Sea. Two significant events in the δ15N record occur, at ∼21 and ∼15 kyr. At 21 kyr, a step-wise decrease in δ15N values has been interpreted as a temperature increase at the site, also seen in the water isotope record, and an accumulation decrease which reduced the firn column height (Severinghaus et al., 2003), driven by thinning of the ice sheet. As with the RICE example, this step-wise change is different in shape to the drop and recovery seen in our Skytrain record, and agrees more with the step-wise changes in δ15N predicted by our model where only temperature and/or accumulation change (Fig. 3).
The event at ∼15 ka in Siple Dome corresponds closely in timing to the RICE event, but is different in shape: a very rapid drop to values even lower than at Skytrain, and equally rapid recovery. Such low values of δ15N imply a diffusive column height of almost zero. Although a similar shape to Skytrain, it seems unlikely that dynamic ice sheet thinning alone could reduce the firn column height to almost zero and then recover again over such a short amount of time. The authors hypothesised that ablation could act on the firn over either a sustained period, removing most of the firn column (thought this is unlikely to be able to remove the required amount over the short timescales the record suggests) or over a short time, removing low permeability upper layers and allowing convective mixing of the whole firn column. For Skytrain, we have assessed the possibility of extreme aridity (Fig. 4) explaining our δ15N signal. While it is possible to closely match the δ15N profile under this extreme scenario to our record, the delta age required to do this does not agree with our ice core constraints on the suggested conditions at the time, likely making this an unrealistic scenario. A caveat here is that the ice core constraints on delta age are in themselves modelled, so this experiment becomes somewhat circular and difficult to explore with more certainty.
We may also consider the idea of crevassing driving an extremely low δ15N signal in the ice core record. The horizontal divergence rates we infer from both the PISM model and our data range between . This is at the very lower limit of observations that constrain the critical strain rate for crevassing in ice less than −25 °C (Vaughan, 1993, also see Colgan et al., 2016; for calculation of strain rate) that are observed in somewhat unique environments such as the Dry Valleys (e.g. Meserve Glacier). In fact, most observations from possible analogous locations along the Ross and Ronne ice shelf and the Siple Coast indicate a critical strain rate between 10−2 and and thus at least one order of magnitude greater than we infer. The diffusive column height at Skytrain was reduced to ∼40 m based on the measured δ15N, from an initial 50 m, so crevassing would need to penetrate in the order of 10 m. All considered, it appears unlikely that we have the strain required to crevasse to such depths.
Clearly, the signal of δ15N at each ice core site may be driven by different or a number of contributing factors, which are currently understudied. Analysis of multiple factors of the record appears important for pulling apart the story of physical ice sheet changes, alongside high-resolution records of the climatological changes in the region at the time. Future expansion to other coastal ice cores with a full suite of analysis is important to unravel this further.
3.7 Does ice sheet thinning explain the Skytrain TAC signal?
We now revisit how this new understanding of physical firn column changes can help with our interpretation of the TAC record observed in the Skytrain ice core. Our isotope records show that the TAC record is disrupted throughout the same time interval that the firn column is being affected by dynamic changes in firn column thickness. This extends beyond the actual period of change in elevation of the ice sheet at the ice core site. A reliable elevation record from TAC is thus only available where physical firn column processes are also stable. Based on this study, we define this period of disruption for the Skytrain ice core record as between ∼8.2 ka, before the initial small upward inflection which corresponds to the beginning of the elevation change, and ∼6.5 ka, where the δ15N data values re-stabilise and align with model predictions not including horizontal divergence, suggesting stabilisation of firnification processes at the site. This supports the decision of Grieman et al. (2024) to compare only the stable values from 9.5–8.5 ka (before the disruption) and those from 6.6–5.0 ka (after the disruption) to assess the net change in elevation.
The specifics behind the oscillating signal of TAC during dynamic thinning of the firn column are not explained by our isotope data. At the time of bubble close-off, the atmospheric pressure, from which we calculate elevation, is reconstructed from TAC, temperature, and pore volume (Martinerie et al., 1992). The temperature history at the site which affects the amount of air per-volume that is captured, as in the ideal gas law, is calculated using the water isotope record from Skytrain and thus is relatively well constrained (see methods). We must consider the other major influence on TAC, pore volume, to explain TAC variability. The nitrogen isotope record presents a consistent drop and then recovery of values over the period of ∼1.5 kyr, without the oscillations of the TAC record, indicating that the impact on the TAC signal of the thinning of the firn column is not a simple, linear response to a single factor that could be driven by the dynamic thinning, for example an artificial decrease in pore volume driven by mechanical deformation of the snow grain structure.
Pore volume has been shown to be controlled by a complex interplay between the gas and physical ice properties of a firn column at each ice core site based on varying rates of temperature change, accumulation rate and densification profiles. However, the fine scale controls on TAC are currently under-studied. Epifanio et al. (2023) observed a strong correlation between accumulation rate and TAC at the low accumulation South Pole ice core site. They propose that snow grain metamorphism is behind this link, with low accumulation rate allowing grains to grow proportionally larger as they remain on or close-to the snow surface for longer, as well as growing towards more spherical shapes that promote higher gas diffusivity and lower TAC. This agrees with Gregory et al. (2014), who found that low accumulation sites in Antarctica close-off at lower open porosity with higher gas diffusivity, compared to higher accumulation sites with finer grain sizes. They suggest that layering in the firn column may also control TAC changes, with layers capturing relic microstructures controlled by accumulation at the time that layer was at the snow surface, which could be a mechanism to control TAC variations over short timescales. Contrastingly, in a central Greenland core, Eicher et al. (2016) found that higher accumulation may lower TAC. With TAC being controlled at the point of bubble close-off, higher accumulation would increase the load on the snow surface and increase densification rates, inhibiting formation of spherical grains and reducing pore volume. This effect could alter the TAC signal for several hundreds of years following the accumulation increase. However, the study focussed on TAC changes during Dansgaard–Oeschger (D–O) events, where background climatic conditions changed significantly and rapidly, thus the changing firn properties could result from a complex interplay of multiple accumulation and temperature effects. Indeed, none of these sites match the physical ice properties and meteorological conditions of the Skytrain ice core. However, these examples do show how strongly TAC may be affected by differing controls on pore volume within a firn column, with such changes being plausible over a rapid ice mass reduction with dynamic firn column changes.
The oscillating TAC at Skytrain is likely to be a complex interplay of some or all of the above processes as the ice elevation loss and dynamic thinning cause disequilibrium of the firnification process. Future work is planned for physical properties analysis of Skytrain ice core samples throughout the Holocene TAC record which may help to elucidate the microstructure changes occurring during the oscillation. We suggest that paired measurements of high-accuracy TAC and inert gas isotopes could be a powerful tool for constraining the history of ice dynamics at ice core sites – particularly at those sites that are sensitive to rapid changes in ice sheet configurations. Neither proxy stands on their own as a perfect archive of ice sheet thickness, with one proxy being obscured or over printed by other processes that are, at least partially, constrained by the other.
Nitrogen isotope measurements from the Skytrain ice core identify a period of dramatic firn column thinning during a rapid ice elevation loss at about 8 ka, a process which apparently disrupts the capture of the TAC signal due to the disequilibrium of the firnification process. As ice mass decreased in the Weddell sector of the WAIS through the Holocene deglaciation, ungrounding of the ice at the ice margin and removal of the buttressing effect resulted in horizontal divergence in the ice at Skytrain Ice Rise, thinning the firn column. Such thinning significantly reduces the gravitational fractionation of nitrogen isotopes in the firn column, dominating the physical factors that influence the isotope signal (temperature, accumulation rate) and resulting in a drop in δ15N values (Fig. 6). As far as we are aware from existing literature, this is the first time such a mechanism has been proposed using nitrogen isotope analysis in ice cores. Similar features are present in existing ice core nitrogen isotope records throughout the coastal WAIS, and an array of potential mechanisms driving firn column change exists to explain each different profile, but these hint at the possibility that rapid, dynamic ice sheet changes are at play in other coastal ice rises/domes at different times during the last deglaciation.
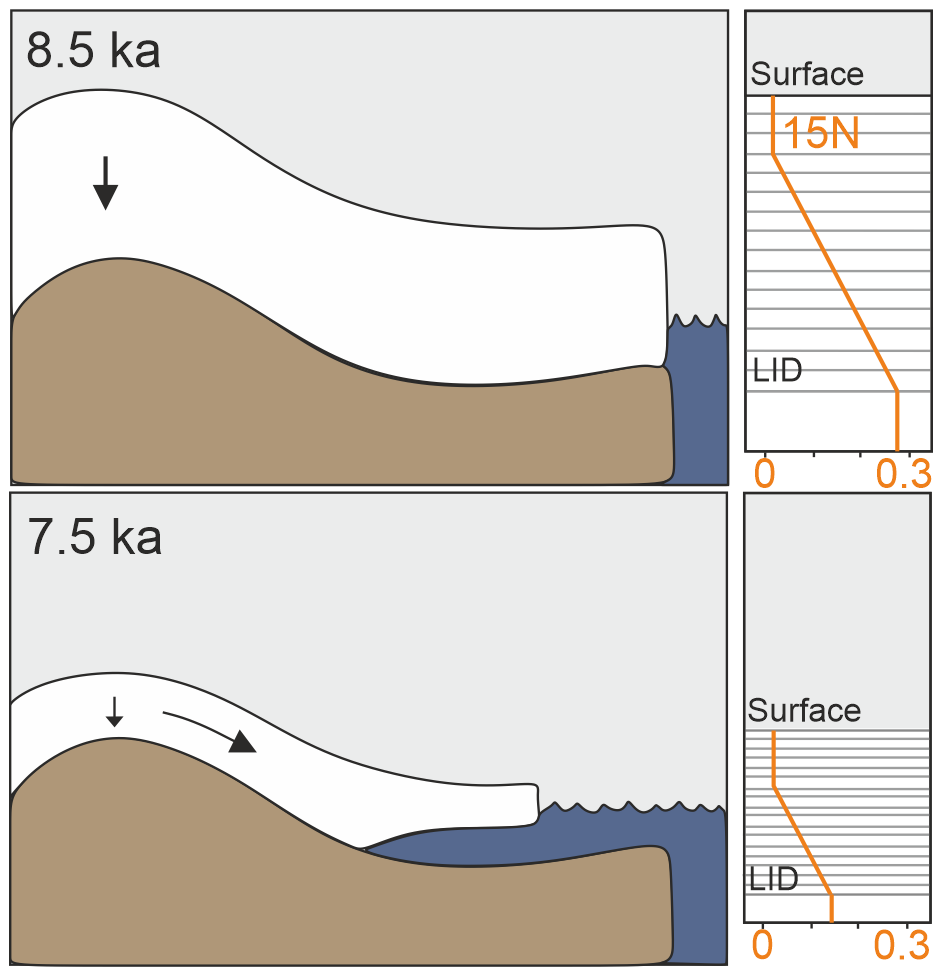
Figure 6Schematic of the physical ice changes at Skytrain Ice Rise throughout the 8 ka elevation change alongside the effects on the δ15N values shown as profiles through the respective firn column for each scenario of ice thickness. Where ice dynamics are stable at 8.5 ka, δ15N increases down the firn column from the ice surface to bubble lock-in depth (LID) due to gravitational fractionation. Where ice thickness is reduced and layers dynamically thinned due to horizontal divergence at 7.5 ka, there is less gravitation fractionation through the thinned firn-column, resulting in lower values of captured δ15N at bubble LID. Values of δ15N shown here are indicative only.
We previously had two proxies for ice sheet elevation, water isotopes and TAC, neither of which are perfect but have worked together in an initial approach. Now we have a third in the form of δ15N, which reflects the rate of thinning, and thus can use a more comprehensive approach when identifying past periods of rapid ice sheet destabilisation. Where de-stabilisation of the firnification process exists, the large magnitude oscillating TAC record measured in Skytrain ice core is not a true elevation signal. However, the nitrogen isotope record can be used to precisely identify the disrupted portion of the TAC record, helping to resolve the true elevation signal. Nitrogen isotopes are thus important to measure in future studies where TAC is being applied, particularly in regions such as coastal ice-rises where more rapid changes in ice mass are possible. TAC is still a powerful tool for relative elevation change estimates over rapid ice mass changes where disrupted records can be precisely identified and avoided, and indeed the combination with nitrogen isotopes opens the potential to constrain dynamic ice changes, subsequently informing model physics. Future work is planned for ice grain microstructure analysis to further investigate causes of the oscillations in the TAC signal, which is likely driven by an interplay of controls affecting pore volume in the firn column during bubble close-off.
All data are available at https://doi.org/10.1594/PANGAEA.995773 (King et al., 2026).
The supplement related to this article is available online at https://doi.org/10.5194/cp-22-1291-2026-supplement.
ACFK: Project concept, sample preparation, data interpretation, wrote manuscript, revised manuscript. TKB: data interpretation, wrote manuscript, revised manuscript, funded sample analysis. AL: Sample analysis, data interpretation, revised manuscript. CM: Data interpretation, revised manuscript. EWW Collected and supplied samples, revised manuscript.
The authors have the following competing interests: At least one of the (co-)authors is a member of the editorial board of Climate of the Past. The peer-review process was guided by an independent editor, and the authors also have no other competing interests to declare.
This material reflects only the authors' views, and the Commission is not liable for any use that may be made of the information contained therein.
Publisher's note: Copernicus Publications remains neutral with regard to jurisdictional claims made in the text, published maps, institutional affiliations, or any other geographical representation in this paper. The authors bear the ultimate responsibility for providing appropriate place names. Views expressed in the text are those of the authors and do not necessarily reflect the views of the publisher.
The authors would like to thank Frédéric Prié and Elodie Brugère for their contribution to the measurements of the ice core samples at the lab in LSCE, Paris and all those involved in the Skytrain Ice Core project.
This project has received funding from the European Research Council under the EU Horizon 2020 research and innovation programme (grant agreement no. 742224, WACSWAIN, held by Eric W. Wolff). The work was additionally supported by Royal Society Grants URF\R1\180366 and RGF\EA\181047held by Thomas K. Bauska.
This paper was edited by Alessio Rovere and reviewed by two anonymous referees.
Albrecht, T., Winkelmann, R., and Levermann, A.: Glacial-cycle simulations of the Antarctic Ice Sheet with the Parallel Ice Sheet Model (PISM) – Part 1: Boundary conditions and climatic forcing, The Cryosphere, 14, 599–632, https://doi.org/10.5194/tc-14-599-2020, 2020a.
Albrecht, T., Winkelmann, R., and Levermann, A.: Glacial-cycle simulations of the Antarctic Ice Sheet with the Parallel Ice Sheet Model (PISM) – Part 2: Parameter ensemble analysis, The Cryosphere, 14, 633–656, https://doi.org/10.5194/tc-14-633-2020, 2020b.
Anderson, J. B., Conway, H., Bart, P. J., Witus, A. E., Greenwood, S. L., McKay, R. M., Hall, B. L., Ackert, R. P., Licht, K., Jakobsson, M., and Stone, J. O.: Ross Sea paleo-ice sheet drainage and deglacial history during and since the LGM, Quaternary Sci. Rev., 100, 31–54, https://doi.org/10.1016/j.quascirev.2013.08.020, 2014.
Bart, P. J. and Kratochvil, M.: A paleo-perspective on West Antarctic Ice Sheet retreat, Sci. Rep., 12, https://doi.org/10.1038/s41598-022-22450-3, 2022.
Bender, M., Sowers, T., and Lipenkov, V.: On the concentrations of O2, N2, and Ar in trapped gases from ice cores, J. Geophys. Res., 100, https://doi.org/10.1029/94jd02212, 1995.
Buizert, C., Adrian, B., Ahn, J., Albert, M., Alley, R. B., Baggenstos, D., Bauska, T. K., Bay, R. C., Bencivengo, B. B., Bentley, C. R., Brook, E. J., Chellman, N. J., Clow, G. D., Cole-Dai, J., Conway, H., Cravens, E., Cuffey, K. M., Dunbar, N. W., Edwards, J. S., Fegyveresi, J. M., Ferris, D. G., Fitzpatrick, J. J., Fudge, T. J., Gibson, C. J., Gkinis, V., Goetz, J. J., Gregory, S., Hargreaves, G. M., Iverson, N., Johnson, J. A., Jones, T. R., Kalk, M. L., Kippenhan, M. J., Koffman, B. G., Kreutz, K., Kuhl, T. W., Lebar, D. A., Lee, J. E., Marcott, S. A., Markle, B. R., Maselli, O. J., McConnell, J. R., McGwire, K. C., Mitchell, L. E., Mortensen, N. B., Neff, P. D., Nishiizumi, K., Nunn, R. M., Orsi, A. J., Pasteris, D. R., Pedro, J. B., Pettit, E. C., Price, P. B., Priscu, J. C., Rhodes, R. H., Rosen, J. L., Schauer, A. J., Schoenemann, S. W., Sendelbach, P. J., Severinghaus, J. P., Shturmakov, A. J., Sigl, M., Slawny, K. R., Souney, J. M., Sowers, T. A., Spencer, M. K., Steig, E. J., Taylor, K. C., Twickler, M. S., Vaughn, B. H., Voigt, D. E., Waddington, E. D., Welten, K. C., Wendricks, A. W., White, J. W. C., Winstrup, M., Wong, G. J., and Woodruff, T. E.: Precise interpolar phasing of abrupt climate change during the last ice age, Nature, 520, 661–665, https://doi.org/10.1038/nature14401, 2015.
Calonne, N., Milliancourt, L., Burr, A., Philip, A., Martin, C. L., Flin, F., and Geindreau, C.: Thermal Conductivity of Snow, Firn, and Porous Ice From 3-D Image-Based Computations, Geophys. Res. Lett., 46, 13079–13089, https://doi.org/10.1029/2019GL085228, 2019.
Capron, E., Landais, A., Buiron, D., Cauquoin, A., Chappellaz, J., Debret, M., Jouzel, J., Leuenberger, M., Martinerie, P., Masson-Delmotte, V., Mulvaney, R., Parrenin, F., and Prié, F.: Glacial–interglacial dynamics of Antarctic firn columns: Comparison between simulations and ice core air-δ15N measurements, Climate of the Past, 9, 983–999, https://doi.org/10.5194/cp-9-983-2013, 2013.
Colgan, W., H. Rajaram, W. Abdalati,C. McCutchan, R. Mottram, M. S. Moussavi, and Grigsby, S.: Glacier crevasses:Observations, models, and mass balance implications, Rev. Geophys., 54, 119–161, https://doi.org/10.1002/2015RG000504, 2016.
Eicher, O., Baumgartner, M., Schilt, A., Schmitt, J., Schwander, J., Stocker, T. F., and Fischer, H.: Climatic and insolation control on the high-resolution total air content in the NGRIP ice core, Clim. Past, 12, 1979–1993, https://doi.org/10.5194/cp-12-1979-2016, 2016.
Epifanio, J. A., Brook, E. J., Buizert, C., Pettit, E. C., Edwards, J. S., Fegyveresi, J. M., Sowers, T. A., Severinghaus, J. P., and Kahle, E. C.: Millennial and orbital-scale variability in a 54 000-year record of total air content from the South Pole ice core, The Cryosphere, 17, 4837–4851, https://doi.org/10.5194/tc-17-4837-2023, 2023.
Fudge, T. J., Steig, E. J., Markle, B. R., Schoenemann, S. W., Ding, Q., Taylor, K. C., McConnell, J. R., Brook, E. J., Sowers, T., White, J. W. C., Alley, R. B., Cheng, H., Clow, G. D., Cole-Dai, J., Conway, H., Cuffey, K. M., Edwards, J. S., Lawrence Edwards, R., Edwards, R., Fegyveresi, J. M., Ferris, D., Fitzpatrick, J. J., Johnson, J., Hargreaves, G., Lee, J. E., Maselli, O. J., Mason, W., McGwire, K. C., Mitchell, L. E., Mortensen, N., Neff, P., Orsi, A. J., Popp, T. J., Schauer, A. J., Severinghaus, J. P., Sigl, M., Spencer, M. K., Vaughn, B. H., Voigt, D. E., Waddington, E. D., Wang, X., and Wong, G. J.: Onset of deglacial warming in West Antarctica driven by local orbital forcing, Nature, 500, 440–444, https://doi.org/10.1038/nature12376, 2013.
Greene, C. A., Gwyther, D. E., and Blankenship, D. D.: Antarctic Mapping Tools for MATLAB, Comput. Geosci., 104, 151–157, https://doi.org/10.1016/j.cageo.2016.08.003, 2017.
Gregory, S. A., Albert, M. R., and Baker, I.: Impact of physical properties and accumulation rate on pore close-off in layered firn, The Cryosphere, 8, 91–105, https://doi.org/10.5194/tc-8-91-2014, 2014.
Grieman, M. M., Nehrbass-Ahles, C., Hoffmann, H. M., Bauska, T. K., King, A. C. F., Mulvaney, R., Rhodes, R. H., Rowell, I. F., Thomas, E. R., and Wolff, E. W.: Abrupt Holocene ice loss due to thinning and ungrounding in the Weddell Sea Embayment, Nat. Geosci., 17, 227–232, https://doi.org/10.1038/s41561-024-01375-8, 2024.
Herron, M. M. and Langway, C. C.: Firn Densification: An Empirical Model, J. Glaciol., 25, 373–385, https://doi.org/10.3189/s0022143000015239, 1980.
Hoffmann, H. M., Grieman, M. M., King, A. C. F., Epifanio, J. A., Martin, K., Vladimirova, D., Pryer, H. V., Doyle, E., Schmidt, A., Humby, J. D., Rowell, I. F., Nehrbass-Ahles, C., Thomas, E. R., Mulvaney, R., and Wolff, E. W.: The ST22 chronology for the Skytrain Ice Rise ice core – Part 1: A stratigraphic chronology of the last 2000 years, Clim. Past, 18, 1831–1847, https://doi.org/10.5194/cp-18-1831-2022, 2022.
Horlings, A. N., Christianson, K., Holschuh, N., Stevens, C. M., and Waddington, E. D.: Effect of horizontal divergence on estimates of firn-air content, J. Glaciol., 67, 287–296, https://doi.org/10.1017/jog.2020.105, 2021.
IPCC: Sections, in: Climate Change 2023: Synthesis Report, Contribution of Working Groups I, II and III to the Sixth Assessment Report of the Intergovernmental Panel on Climate Change, edited by: Core Writing Team, Lee, H., and Romero, J., IPCC, Geneva, Switzerland, 35–115, https://doi.org/10.59327/IPCC/AR6-9789291691647, 2023.
King, A. C. F., Bauska, T. K., Brook, E. J., Kalk, M., Nehrbass-Ahles, C., Wolff, E. W., Strawson, I., Rhodes, R. H., and Osman, M. B.: Reconciling ice core CO2 and land-use change following New World-Old World contact, Nat. Commun., 15, https://doi.org/10.1038/s41467-024-45894-9, 2024.
King, A. C. F., Bauska, T. K., Landais, A., and Wolff, E. W.: Nitrogen isotope measurements from Skytrain Ice Core from 5.8–8.5 ka, PANGAEA [data set], https://doi.org/10.1594/PANGAEA.995773, 2026.
Kingslake, J., Scherer, R. P., Albrecht, T., Coenen, J., Powell, R. D., Reese, R., Stansell, N. D., Tulaczyk, S., Wearing, M. G., and Whitehouse, P. L.: Extensive retreat and re-advance of the West Antarctic Ice Sheet during the Holocene, Nature, 558, 430–434, https://doi.org/10.1038/s41586-018-0208-x, 2018.
Lee, J. E., Brook, E. J., Bertler, N. A. N., Buizert, C., Baisden, T., Blunier, T., Ciobanu, V. G., Conway, H., Dahl-Jensen, D., Fudge, T. J., Hindmarsh, R., Keller, E. D., Parrenin, F., Severinghaus, J. P., Vallelonga, P., Waddington, E. D., and Winstrup, M.: An 83 000-year-old ice core from Roosevelt Island, Ross Sea, Antarctica, Clim. Past, 16, 1691–1713, https://doi.org/10.5194/cp-16-1691-2020, 2020.
Lliboutry, L.: A critical review of analytical approximate solutions for steady state velocities and temperatures in cold ice sheets, Z. Gletscherkde. Glazialgeol., 15, 135–148, 1979.
Martinerie, P., Raynaud, D., Etheridge, D. M., Barnola, J. M., and Mazaudier, D.: Physical and climatic parameters which influence the air content in polar ice, Earth Planet. Sc. Lett., 112, 1–13, https://doi.org/10.1016/0012-821X(92)90002-D, 1992.
Morgan, J. D., Buizert, C., Fudge, T. J., Kawamura, K., Severinghaus, J. P., and Trudinger, C. M.: Gas isotope thermometry in the South Pole and Dome Fuji ice cores provides evidence for seasonal rectification of ice core gas records, The Cryosphere, 16, 2947–2966, https://doi.org/10.5194/tc-16-2947-2022, 2022.
Morlighem, M., Rignot, E., Binder, T., Blankenship, D., Drews, R., Eagles, G., Eisen, O., Ferraccioli, F., Forsberg, R., Fretwell, P., Goel, V., Greenbaum, J. S., Gudmundsson, H., Guo, J., Helm, V., Hofstede, C., Howat, I., Humbert, A., Jokat, W., Karlsson, N. B., Lee, W. S., Matsuoka, K., Millan, R., Mouginot, J., Paden, J., Pattyn, F., Roberts, J., Rosier, S., Ruppel, A., Seroussi, H., Smith, E. C., Steinhage, D., Sun, B., Broeke, M. R. van den, Ommen, T. D. van, Wessem, M. van, and Young, D. A.: Deep glacial troughs and stabilizing ridges unveiled beneath the margins of the Antarctic ice sheet, Nat. Geosci., 13, 132–137, https://doi.org/10.1038/s41561-019-0510-8, 2020.
Mulvaney, R., Rix, J., Polfrey, S., Grieman, M., Martìn, C., Nehrbass-Ahles, C., Rowell, I., Tuckwell, R., and Wolff, E.: Ice drilling on Skytrain Ice Rise and Sherman Island, Antarctica, Ann. Glaciol., 62, 311–323, https://doi.org/10.1017/aog.2021.7, 2021.
Mulvaney, R., Wolff, E. W., Grieman, M. M., Hoffmann, H. H., Humby, J. D., Nehrbass-Ahles, C., Rhodes, R. H., Rowell, I. F., Parrenin, F., Schmidely, L., Fischer, H., Stocker, T. F., Christl, M., Muscheler, R., Landais, A., and Prié, F.: The ST22 chronology for the Skytrain Ice Rise ice core – Part 2: An age model to the last interglacial and disturbed deep stratigraphy, Clim. Past, 19, 851–864, https://doi.org/10.5194/cp-19-851-2023, 2023.
Nehrbass-Ahles, C., King, A., Hoffmann, H., Grieman, M., Rowell, I., Humby, J., Miller, S., Thomas, E., Bauska, T., Schmitt, 449 J., Mulvaney, R., and Wolff, E.: A high-accuracy Total Air Content setup: System performance and first results from Skytrain 450 Ice Rise, Antarctica, EGU General Assembly 2022, Vienna, Austria, 23–27 May 2022, EGU22-9210, 451 https://doi.org/10.5194/egusphere-egu22-9210, 2022.
Nicola, L., Notz, D., and Winkelmann, R.: Revisiting temperature sensitivity: how does Antarctic precipitation change with temperature?, The Cryosphere, 17, 2563–2583, https://doi.org/10.5194/tc-17-2563-2023, 2023.
Oraschewski, F. M. and Grinsted, A.: Modeling enhanced firn densification due to strain softening, The Cryosphere, 16, 2683–2700, https://doi.org/10.5194/tc-16-2683-2022, 2022.
Rhodes, R. H., Brook, E. J., Chiang, J. C. H., Blunier, T., Maselli, O. J., McConnell, J. R., Romanini, D., and Severinghaus, J. P.: Enhanced tropical methane production in response to iceberg discharge in the North Atlantic, Science, 348, 1016–1019, https://doi.org/10.1126/science.1262005, 2015.
Rosser, J. P., Winkelmann, R., and Wunderling, N.: Polar ice sheets are decisive contributors to uncertainty in climate tipping projections, Commun. Earth Environ., 5, https://doi.org/10.1038/s43247-024-01799-5, 2024.
Servettaz, A. P. M., Orsi, A. J., Curran, M. A. J., Moy, A. D., Landais, A., McConnell, J. R., Popp, T. J., Le Meur, E., Faïn, X., and Chappellaz, J.: A 2000-year temperature reconstruction on the East Antarctic plateau from argon–nitrogen and water stable isotopes in the Aurora Basin North ice core, Clim. Past, 19, 1125–1152, https://doi.org/10.5194/cp-19-1125-2023, 2023.
Severinghaus, J. P., Grachev, A., Luz, B., and Caillon, N.: A method for precise measurement of argon 40/36 and krypton/argon ratios in trapped air in polar ice with applications to past firn thickness and abrupt climate change in Greenland and at Siple Dome, Antarctica, Geochim. Cosmochim. Ac., 67, 325–343, https://doi.org/10.1016/S0016-7037(02)00965-1, 2003.
Stevens, C. M., Verjans, V., Lundin, J. M. D., Kahle, E. C., Horlings, A. N., Horlings, B. I., and Waddington, E. D.: The Community Firn Model (CFM) v1.0, Geosci. Model Dev., 13, 4355–4377, https://doi.org/10.5194/gmd-13-4355-2020, 2020.
Vaughan, D. G.: Relating the occurrence of crevasses to surface strain rates, J. Glaciol., 39, 255–266, https://doi.org/10.3189/s0022143000015926, 1993.