the Creative Commons Attribution 4.0 License.
the Creative Commons Attribution 4.0 License.
 | 02 Jul 2026
South Atlantic lipid biomarkers support synchronous Plio-Pleistocene global cooling: revising the ODP Site 1090 sea surface temperature record
Brianna Hoegler
Timothy D. Herbert
Jamie Pahigian
Understanding Pliocene (5.33–2.58 Ma) climate evolution is critical to establishing the conditions that enabled large ice sheets to form in the Arctic region during the intensification of Northern Hemisphere Glaciation (iNHG) around 2.72 Ma. The causes of iNHG remain unclear, with hypotheses ranging from tectonic changes to CO2 reductions. An anomalous, pre-iNHG cooling signal was recorded in a previously published alkenone-based sea surface temperature (SST) record from Ocean Drilling Program (ODP) Site 1090, located in the southeastern Atlantic Ocean. This record has been used to posit that late Pliocene cooling of the already-glaciated Southern Hemisphere could have driven planetwide cooling and the intensification of Northern Hemisphere Glaciation. Here, we expand the SST record of Site 1090 using the same proxy but with higher resolution and improved laboratory protocols. Our revisited record substantially revises conclusions based on prior work. We find that SST at ODP Site 1090 follows similar cooling trends to those found of equatorial and high latitude Northern Hemisphere sites, suggesting that a global forcing, such as a reduction in atmospheric CO2, prompted iNHG, as opposed to an early cooling of the Southern Hemisphere.
- Article
(3867 KB) - Full-text XML
-
Supplement
(1531 KB) - BibTeX
- EndNote


1.1 Pliocene Climate and the Intensification of Northern Hemisphere Glaciation
The Pliocene epoch (5.33–2.58 million years ago, Ma) is an interval with particular relevance to understanding Earth's modern climate, as it is the most recent time in Earth's history that the atmospheric carbon dioxide (CO2) concentration (pCO2) has been comparable to today's (>400 parts per million, ppm) (NOAA Global Monitoring Laboratory, 2025). Because of the Pliocene's elevated CO2 levels and its similar continental configuration to today's Earth, this epoch, and especially the Mid-Piacenzian Warm Period (mPWP, ∼3.3–3.0 Ma), is often considered to be a paleo-analog for near-future climate conditions under moderate warming scenarios (Burke et al., 2018). During this time, mean annual surface temperatures were 2–4 °C warmer, sea levels were elevated, and ice sheet extent was reduced compared to preindustrial conditions, particularly in the northern hemisphere (Haywood et al., 2013).
Better constraining Pliocene climate is additionally important to strengthening our understanding of the conditions that allowed large, continental-scale ice sheets grow in the Arctic region at the very end of the Pliocene. Over the past ∼50 Myr since the early Eocene Climatic Optimum, Earth has experienced a long-term cooling trend and transitioned from a warm greenhouse climate state to an icehouse, in which the high latitudes are covered by large ice sheets. Although Antarctica experienced continental-scale glaciation since the early Oligocene (ca. 34 Ma) (Lear et al., 2008; Zachos et al., 2001), large ice sheets did not start to grow in the northern high latitudes until the intensification of Northern Hemisphere glaciation (iNHG) ca. 2.72 Ma, as evidenced by the appearance of ice-rafted debris (IRD) in North Atlantic marine sediments (Blake-Mizen et al., 2019; Flesche Kleiven et al., 2002; Jansen et al., 2000; Thiede et al., 2011).
Attempts to identify the primary driver(s) of the intensification of Northern Hemisphere glaciation have generated several plausible hypotheses. Some researchers have postulated that tectonic processes, like the closure of the Panama Seaway, could have led to glaciation by intensifying the Gulf Stream, increasing moisture transport to the high latitude north, and strengthening the formation of North Atlantic Deep Water (NADW) (Haug and Tiedemann, 1998; Lunt et al., 2008b). However, tectonic processes were likely too slow to cause iNHG, and models have found that the closure of the seaway likely was not a major forcing mechanism for late Pliocene glaciation; instead, models suggest that a decrease in atmospheric CO2 concentrations to 280 ppm was needed to drive glaciation on Greenland (Lunt et al., 2008a, b; Tan et al., 2017).
This hypothesis – that a reduction in greenhouse forcing lowered global temperatures and drove the iNHG – is supported by a growing body of literature. Paleoclimatic proxy data suggests that atmospheric CO2 decline coincided with late Pliocene glaciation (Rae et al., 2021; de la Vega et al., 2020) and that global cooling was occurring in all ocean areas other than the Indo-Pacific warm pool (IPWP) around 4 Ma and continuing through the iNHG (Clark et al., 2024). This global cooling signal is consistent with climate models, which have shown that reducing CO2 levels in the atmosphere would result in cooling across both the northern and southern hemispheres (Broccoli and Manabe, 1987; Stap et al., 2018).
One other prominent hypothesis exists to explain the primary driver of iNHG: that regional climate change in the Southern Hemisphere ultimately drove ice sheet growth in the north. In this scenario, growth of the Antarctic ice sheet would fuel the positive ice-albedo feedback effect, leading to regional cooling concentrated around the high-latitude Southern Hemisphere (McKay et al., 2012). Past a certain threshold, ice sheet expansion could have altered global ocean and atmospheric circulation, culminating in global temperature reductions large enough to lead to Northern Hemisphere glaciation (Woodard et al., 2014).
The alkenone-based reconstruction of Ocean Drilling Program (ODP) Site 1090's sea surface temperature (SST) of Martínez-Garcia et al. (2010a, b) is a critical piece of evidence informing this hypothesis (Fig. 1). This record features cooling over parts of the late Pliocene that outpace much of the rest of the world, a possible indication of high-latitude Southern Hemisphere climate cooling leading up to iNHG, and it has been utilized in several studies positing that regional forcing could have played a significant role in driving iNHG (McClymont et al., 2023; Woodard et al., 2014; Burton et al., 2024).
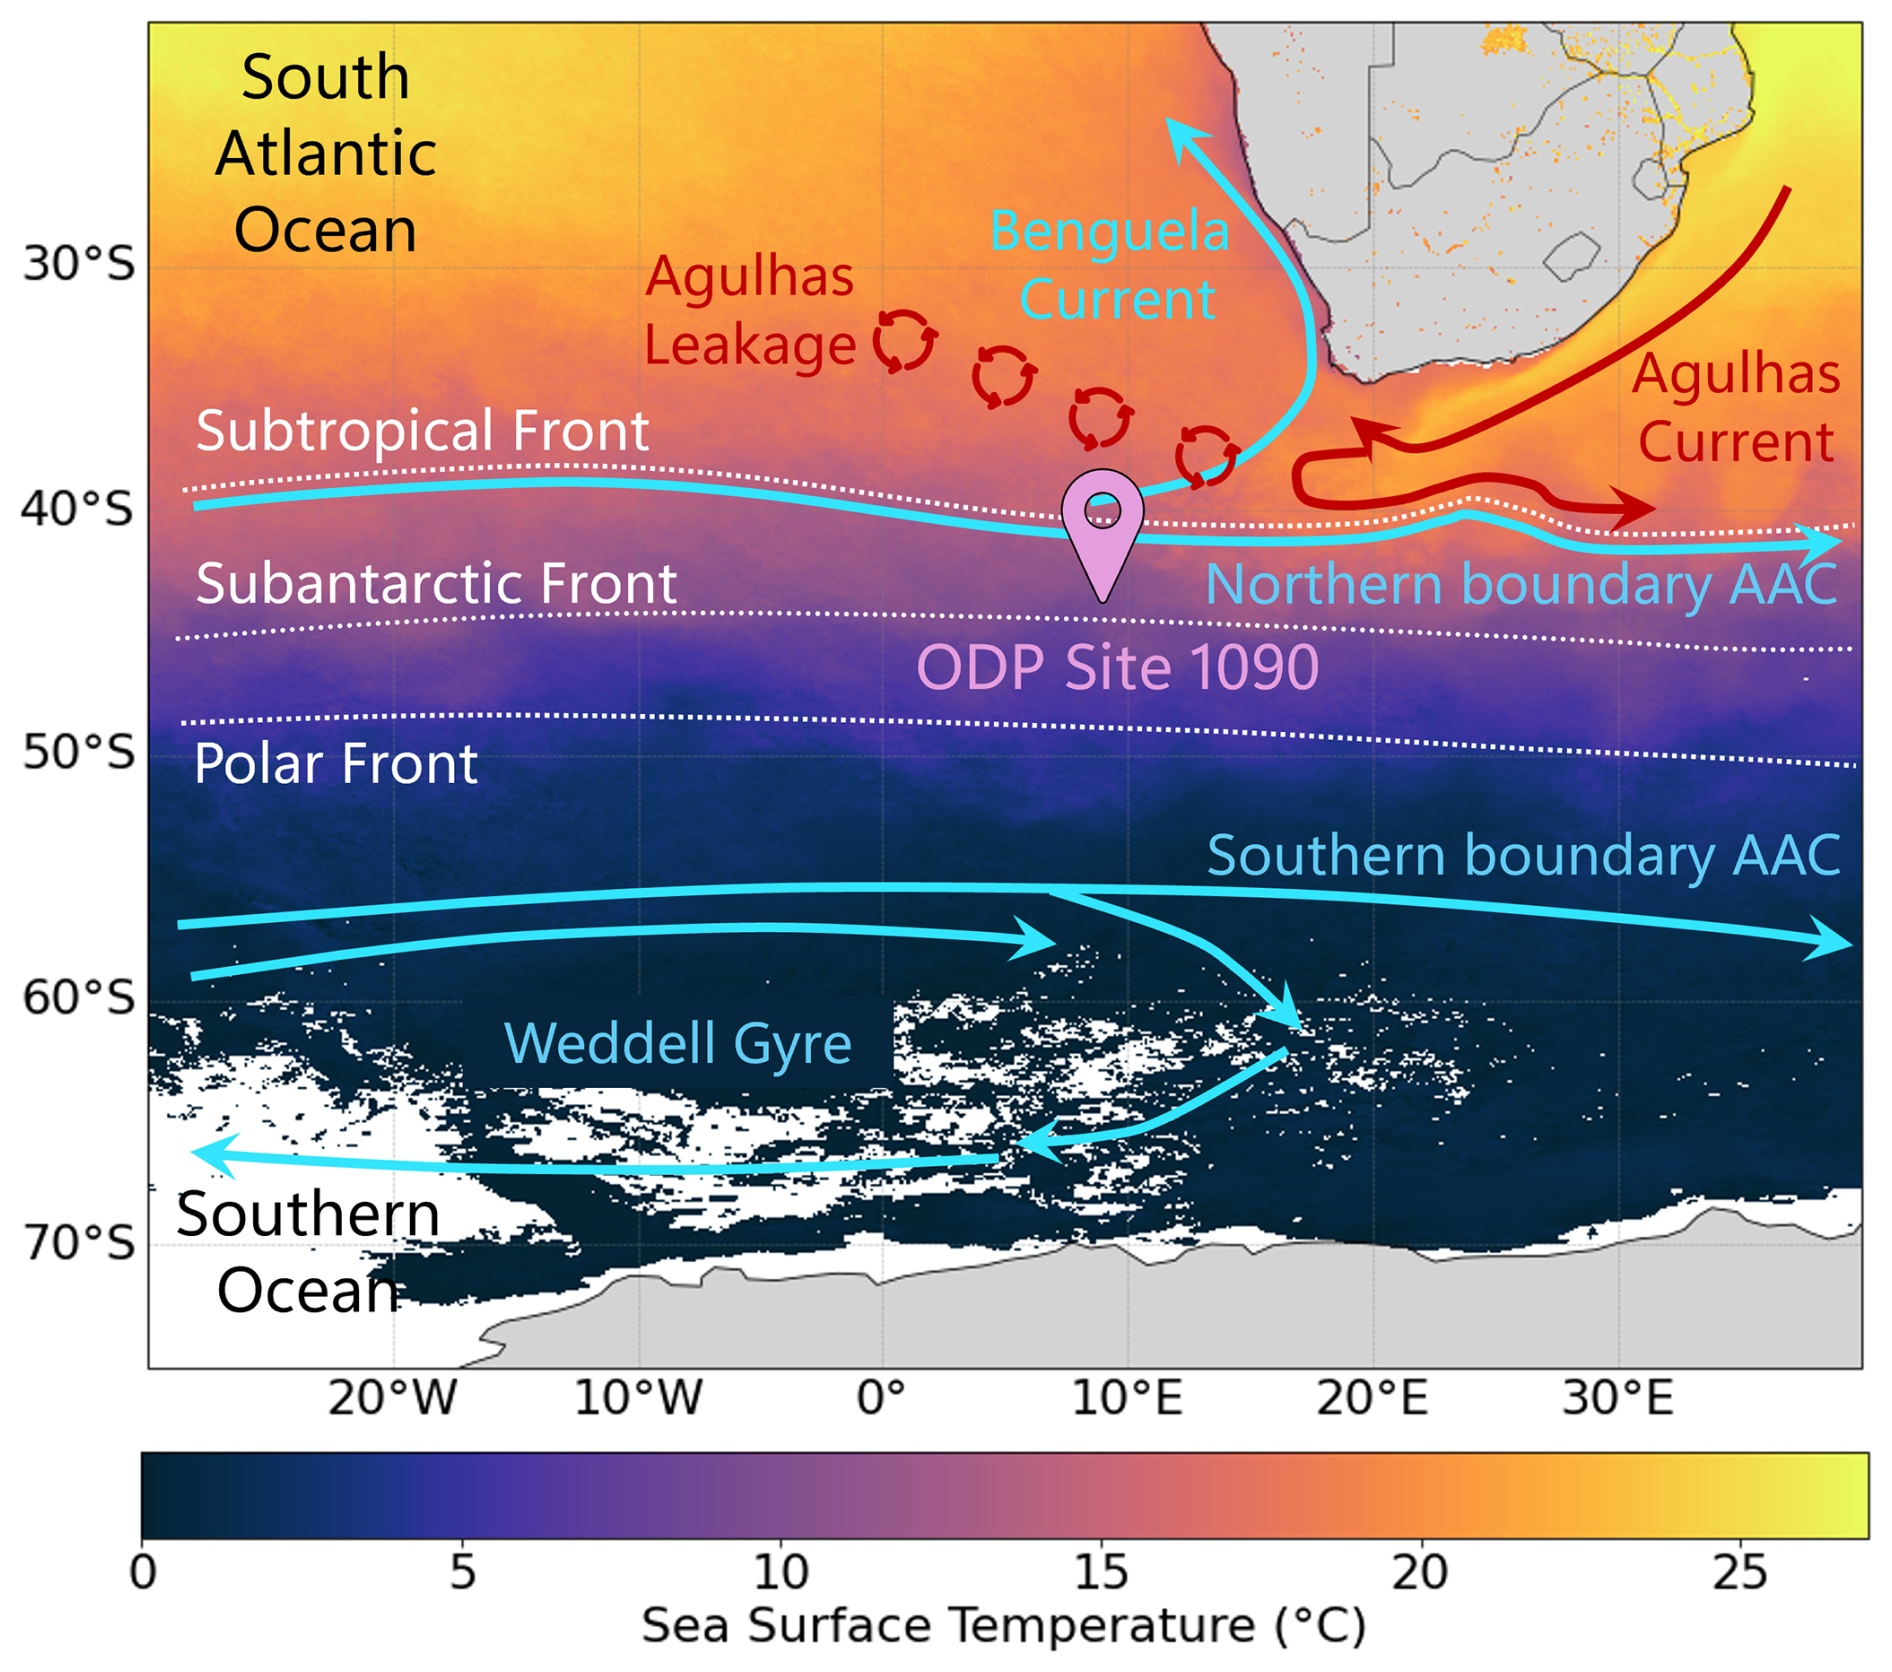
Figure 1Map of the eastern South Atlantic Ocean and Southern Ocean, centred on ODP Site 1090. Solid lines depict the major ocean currents in the study area. Blue and red lines represent cold and warm currents, respectively. The three dashed lines show the approximate position of the three fronts of the Antarctic Circumpolar Current. Modern SST data was provided by NASA's Aqua-MODIS satellite (NASA/JPL, 2020).
Two aspects of the Martínez-Garcia data set appear anomalous, necessitating a re-examination of this alkenone-based SST record. The first of these is the offset between this record and an alkenone-based record produced by Etourneau et al. (2010a, b), also at Site 1090, during the 800 ka leading up to iNHG, with the Etourneau record indicating SSTs up to 5 °C warmer than Martínez-Garcia et al. (2010a) (Fig. 2). The second aspect is the unusually high C37:4 content reported by Martínez-Garcia et al. (2010a). While the C37:4 alkenone is associated with the presence of sea ice (Liao et al., 2023b; Wang et al., 2021), the Martínez-Garcia et al. (2010a) reconstruction reveals only moderate (>7 °C) temperatures in the Pliocene, suggesting the need for an investigation to explain this anomalous result. We show below that improved analytical methods lead to significantly different results from data published by Martínez-Garcia et al. (2010a).
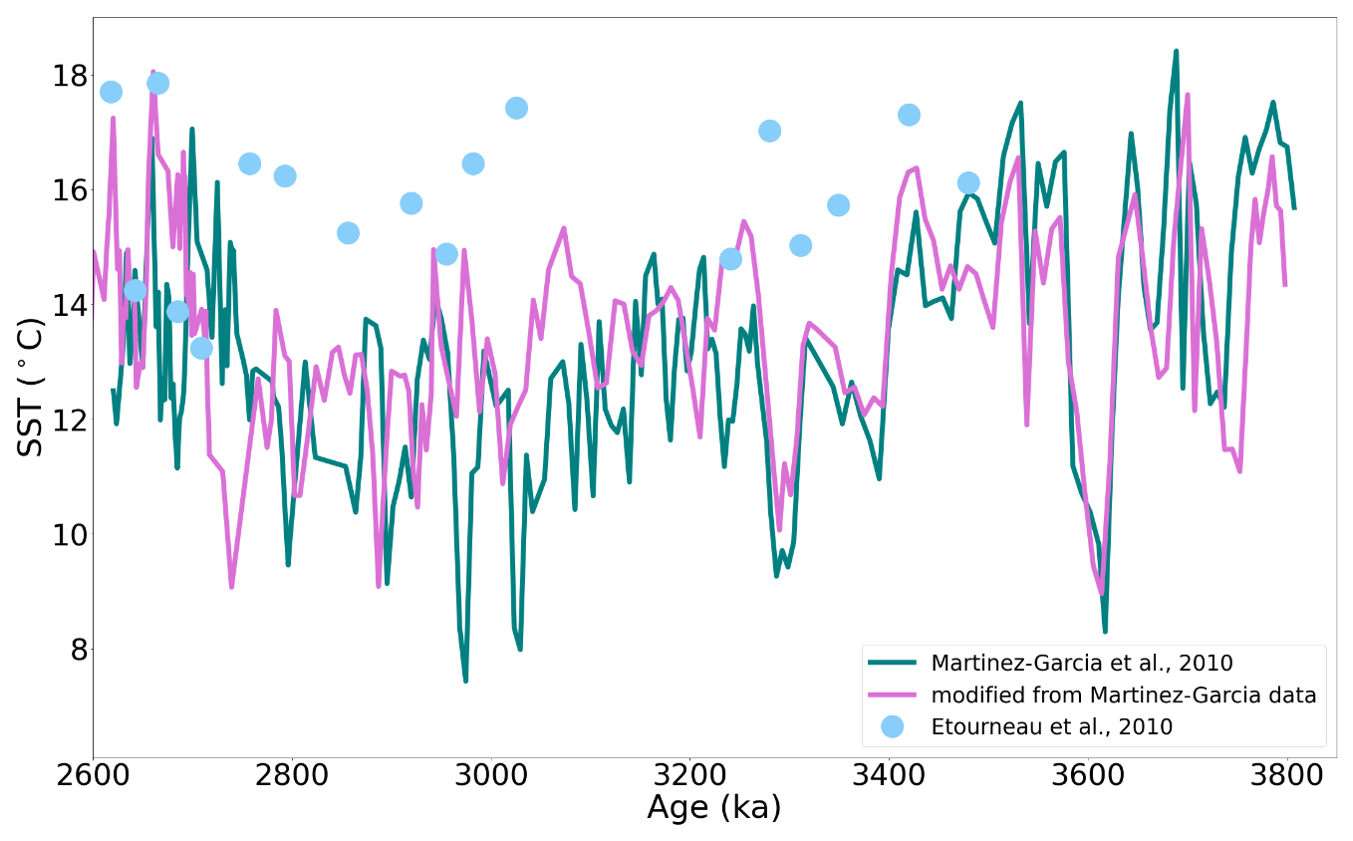
Figure 2Previously published alkenone-based SST estimates from ODP Site 1090. The teal line denotes the original -based SST Martínez-Garcia (2010a) estimates plotted with their 2011 age model, while the pink line indicates our estimate of -based SST using their data, plotted according to our new age-depth model. The blue dots show low-resolution SST estimates published by Etourneau et al. (2010b).
1.2 ODP Site 1090 and the Paleo-Temperature Record of the Southern Atlantic Ocean
The location of ODP Site 1090 (42°54.5′ S, 8°54.0′ E, Fig. 1) is optimal for studying a variety of oceanographic and climatic phenomena through time, including Antarctic ice-sheet development, Antarctic Circumpolar Current (ACC) frontal boundary movements, and changes in the contribution of NADW to the Southern Ocean (Shipboard Scientific Party, 1999). Located on the southern flank of the Agulhas Ridge at a water depth of 3702 m, ODP Site 1090 contains one of the most southerly records recovered of late Pliocene/early Pleistocene climate. Today, the site sits within the sub-Antarctic Zone of the ACC, between the Subantarctic Front (SAF) and Subtropical Front (STF), and north of the southernmost Polar Front (PF) (Reid, 1989). The SST of Site 1090 has been strongly influenced by meridional shifts in the ACC, driven by the northward migration of the PF, SAF, and STF. Biomarker, isotope, and microfossil data suggests these fronts may have migrated anywhere from ∼5° equatorward during the Mid-Pleistocene Transition (de Castro et al., 2025) to upwards of 7° latitude during cold stadials in the Pleistocene, resulting in SST changes of up to 6 °C between glacial/interglacial periods (Bard and Rickaby, 2009; Becquey and Gersonde, 2002).
Five holes were drilled at ODP Site 1090. The composite of the cores drilled from these holes produces a continuous stratigraphic section to ∼4 Ma, preceded by a late Miocene/early Pliocene hiatus (Shipboard Scientific Party, 1999, Billups et al., 2004). Sedimentation rates estimated by the Shipboard Scientific Party ranged from 10–35 m Myr−1 prior to the late Miocene/early Pliocene hiatus (1999).
To produce the most robust stratigraphy possible, we improved upon the existing shipboard composite depth estimations (Shipboard Scientific Party, 1999). Using our SST to enhance the shipboard magnetic susceptibility and cryomagnetic inclination data, we were able to establish a more accurate composite of ODP Site 1090 Holes D and E by correlating the two holes' properties (Fig. S4 and Table S2 in the Supplement). Our revised composite section spans from around 55 to 71 MCD. Using this revised composite, we spliced together our Hole D and Hole E SST records to produce one continuous record (see data availability statement for information regarding data access). An abrupt change in magnetic susceptibility data locates the Miocene/early Pliocene hiatus at ∼70 MCD, consistent with shipboard biostratigraphy.
We used biostratigraphic and magnetostratigraphic data to establish initial age constraints for our age model (Shipboard Scientific Party, 1999). We found the magnetostratigraphic data to provide reliable age-depth ties from 3.04 to 3.594 Ma; however, we found it to be an unreliable indicator deeper in the core (MCD >67, as measurements neared the hiatus), as putative polarity shifts could not be correlated between offset holes in the magnetic susceptibility framework. To more precisely assign ages to the Site 1090 SST data, we tuned the 1090 SST data as a function of composite depth to Lisiecki and Raymo's (2005) “LR04” δ18Obenthic record (Fig. S5 and Table S3), which allowed for finer age assignments than the biostratigraphic and magnetostratigraphic data alone while remaining consistent with the age estimates yielded from those data. Our age-depth model suggests that our SST record spans approximately 2.63–4.18 Ma.
3.1 Biomarker Extraction
Alkenone paleothermometry is a well-calibrated and reliable paleo-proxy for open-ocean SST (Herbert, 2003; Müller et al., 1998). Alkenones – lipid biomarkers produced by certain species in haptophyte class Prymnesiophyceae – are 37-, 38-, and 39-carbon chained (C37, C38, C39) ketones (Marlowe et al., 1984). The relative unsaturation of the C37 ketone, represented by the and indices (Table S1), linearly decreases with increasing temperature in all but the warmest (>24 °C) ocean waters (Müller et al., 1998; Tierney and Tingley, 2018). Because of this relationship, the global distribution of alkenones, and the exceptionally high preservation potential of alkenones, they are one of the most highly utilized proxy biomarkers for near-surface temperatures in the past open ocean (Prahl et al., 1988; Sikes et al., 1991). In this study, we utilize the global core-top based calibration of Müller et al. (1998) to derive SST. Because residuals between core-top -SST and satellite mean annual SST are miniscule in the southeast Atlantic, we expect to act as a proxy of mean annual temperature at ODP 1090 (Tierney and Tingley, 2018).
We sampled the sediment core from ODP Site 1090 approximately every 5 cm, beginning at ∼50 m below the seafloor (MBSF, hole D), corresponding to about 55.3 m composite depth (MCD), and ending at ∼61 MBSF This sample range and resolution was selected to overlap with and extend the Martínez-Garcia et al. (2010a) late Pliocene SST record, spanning from the end of the Pliocene ca. 2.58 Ma to the hiatus in the sediment core at an estimated 4.3 Ma which prematurely ends the Pliocene record.
Sediment samples were frozen overnight and freeze-dried for 24 h prior to homogenization using a mortar and pestle. Approximately 8–10 g of sediment were mixed with sand (previously baked to prevent contamination by organic compounds) to improve solvent flow and packed into 34 mL cells with glass fiber filters. Alkenones were extracted from samples using 100 % Dichloromethane (DCM) in an Accelerated Solvent Extraction system (Dionex ASE 350). Every round of 24 samples extracted on the ASE included one blank extraction of pre-combusted sand to check that no contamination was introduced during the extraction process.
Although the calibration equations chosen for both studies are nearly identical (Tables 1 and S1), they differ in one key aspect: Martínez-Garcia et al. (2010a, b) utilized the alkenone unsaturation index (Brassell et al., 1986), which includes the tetra-unsaturated alkenone (C37:4):
However, Etourneau et al. (2010a) used the index (Prahl et al., 1988), which excludes C37:4:
Sites where C37:4 is present in the largest quantities experience at least seasonal sea ice cover – unlike ODP Site 1090 – leading some to suggest this ketone may have utility as a sea ice proxy but perhaps should not be included as a temperature proxy specifically (Liao et al., 2023b; Wang et al., 2021).
Table 1Summary of new and published alkenone-derived SST data utilized in this study.
Note. Abbreviations as follows: N = number of samples, MCD = meters composite depth, AUI = alkenone unsaturation index, ASE = accelerated solvent extractor, MSE = microwave solvent extraction, MDGC = multidimensional gas chromatography, GC-FID = gas chromatograph-flame ionization detector, HPLC = high pressure liquid chromatography, GC/TOF-MS = Gas Chromatography – Time-of-Flight Mass Spectrometry.
3.2 Sample Purification and Preparation for Analysis
Extracted samples were dried in a TurboVap blowdown evaporator at 35 °C under constant flow of N2. Samples were rehydrated in DCM and glass pipetted into 4 mL vials. After initial gas chromatography with flame ionization detection (GC-FID) results conducted on the total lipid extract yielded chromatograms with noisy baselines, likely due to other organic residues that can co-elute with the ketones we seek to measure, we conducted compound purification. First, we conducted polar-apolar fractionation via flash column silica gel chromatography using hexanes and DCM as solvents. This was followed by a silver nitrate-impregnated silica gel column chromatographic procedure for unsaturation-saturation separation, which utilized DCM and ethyl acetate as solvents (D'Andrea et al., 2007). Example chromatograms showing GC-FID analysis before and after this cleanup procedure can be found in the Supplement (Fig. S1). After cleanup, samples were again dried at 35 °C under a mini evaporator before being spiked with 210 µL of an internal lab standard (hexatriacontane [C36 alkane] and heptatriacontane [C37 alkane], 2 µg mL−1 in toluene). 50 µL of each sample extract was transferred to its own 2 mL glass vial with a 300 µL insert. Samples were capped and kept refrigerated until ready for alkenone measurement.
3.3 Alkenone Measurements
There are multiple challenges that must be considered to ensure reliable analyses at ODP Site 1090: low biomarker concentrations and a complex sediment matrix. While total C37 alkenone concentrations (C37total) are highly variable throughout the global ocean, it is often present in concentrations >0.1 µg g−1 sediment; at sites with very low C37total, such as ODP Site 1090 (where our average C37total was ∼0.02 µg g−1 sediment), it can prove difficult to differentiate the biomarker signal from coeluting compounds and baseline noise resulting from other matrix components present in the sediment extract using the typical GC-FID method. Therefore, there is a need to not only attempt to reproduce Martínez-Garcia et al. (2010a)'s SST record, but also to unambiguously assess whether the C37:4 ketone is present in measurable quantities at ODP Site 1090. To ensure the precision and accuracy of our results, we not only measured alkenone concentrations using traditional gas chromatography (GC) techniques but also confirmed our findings using high performance liquid chromatography (HPLC). Sixteen samples were randomly selected to undergo both GC-FID and HPLC analysis.
3.3.1 Gas Chromatography
Samples were primarily analysed using GC-FID. Most samples were transported through a DB-1 column (Agilent; length =60 m, diameter =0.320 mm, film =0.10 µm), though some initial analyses were conducted using an RTX-200 column (Restek; length =110 m, diameter =0.25 mm, film =0.25 µm). Due to low alkenone concentrations yielding small chromatographic peak areas (area <10), we elected to increase the injection volume from our lab's standard 1 to 10 µL. The GC-FID utilized is outfitted with a programmable temperature vaporizer (PTV) inlet. The PTV inlet was programmed to first inject the sample in solvent vent mode at 110 °C for 0.85 min; next, the vent closed and the temperature was ramped to 290 °C and held for 5 min; then, the temperature increased to 320 °C and held for 2 min; finally, the temperature was decreased to 260 °C with a hold time of 0 min. The GC-FID program was as follows: the oven was set to an initial temperature of 90 °C with a hold time of 2 min; the oven increased in temperature at a rate of 40 °C min−1 until it reached 255 °C; then, the oven would increase by 1 °C min−1 until a temperature of 300 °C was reached; finally, the oven increased in temperature by 10 °C min−1 until 320 °C was reached, and the oven held this temperature for 11 min. An alkenone-containing lab standard and a previously run sample were run every 7 samples to ensure data quality.
A MATLAB-based Chromatography Graphics User Interface (GUI) was utilized for data integration (Dillon, 2023). After adjusting the baseline, the peaks corresponding to our target ketones were selected manually on two lab standard chromatograms; then, the GUI automatically picked the peaks in the remaining chromatograms. All chromatograms were then checked visually to ensure the accuracy of peak area assignments.
3.3.2 HPLC-MS
While GC-FID provides robust and reproducible quantitative measurements, response on the detector is not compound-specific. In complex matrices where the analytes of interest are at low concentrations in relation to potential coeluting compounds, errors in peak identification or incorrect assumptions regarding peak purity can lead to erroneous compound quantification. To demonstrate the reliability of peak assignments and to determine whether the less common C37:4 ketone was indeed present in our samples, we optimized a reversed-phase High-performance liquid chromatography-mass spectrometry (HPLC-MS) method originally described by Liao et al. (2023a). This method provided excellent resolution, selectivity, linearity, and sensitivity for alkenones in complex matrix of Site 1090 samples. Crucially, we were able to unambiguously determine the quantity of the C37:4 ketone by calibration of the HPLC response to a purified extract of Greenland lake sample (D'Andrea and Huang, 2005). Samples where the SST estimate derives from HPLC are denoted in both Table S4 and our final SST reconstruction, available on PANGAEA.
3.3.3 SST Calibration
To derive temperature from our measured ketones, we utilized the unsaturation index (Prahl et al., 1988). SSTs were calculated using the Müller et al. (1998) global core top calibration:
Although other calibrations of -SST have been established, we elected to utilize the Müller et al. (1998) equation, which differs negligibly from other calibrations, both linear and non-linear, in the range appropriate to Site 1090 data (Conte et al., 2006; Tierney and Tingley, 2018).
3.4 Quality Control Measures
Each collected datum was individually checked for quality control in three ways. The total measured concentration of the C37 ketone (C37 total) was found for each sample; data from samples with undetectable or especially low C37 total (<0.0012, ) were removed from the final SST record. We calculated the height to area ratio of the GC peaks, as large (>10 %) deviations from the peak area-based index can indicate co-elution of ketones with other compounds, and samples found to have large height deviations from area were also removed. Finally, we compared the area to the (the 38-carbon chain-length methyl-ketone based unsaturation index) area, which follow a linear relationship in modern sediments (Novak et al., 2022) as a final check to identify anomalous analyses. In total, seven samples were rejected from the final SST reconstruction, which consists of 352 samples.
3.5 Examination of Potential Bias Caused by Cleanup Methods
Previous work by Martin et al. (2024) has found that silver-nitrate purification may modify the C37 alkenone distribution and thus the unsaturation indices, especially the index, by preferentially retaining alkenones with more double bonds. We conducted additional analyses to determine whether and to what extent our column chromatography-based cleanup methods may be biasing our measurements of 37-, 38-, and 39-carbon chained ketones. Approximately 1 mL of our in-house alkenone standard was pipetted into eight 4 mL vials and evaporated under a constant N2 stream on a hot plate set to 35 °C. Six vials of this standard were reconstituted in 1 mL of hexane before undergoing the previously described cleanup procedures; the additional two vials were left as a control. This procedure was also repeated using the Greenland standard (D'Andrea and Huang, 2005), which, unlike the in-house standard, contains a large quantity of C37:4 methyl-ketones.
Experimental evaluation showed little to no evidence of cleanup biasing our results. The average SST of all experimental samples (N=13) – our typical lab standard (n=5), the evaporated and re-constituted standard (n=2), and the cleaned standards (n=6) – were within a few hundredths of a degree of each other, both using our typical DB-1 method and utilizing the 10 µL sample volume required by ODP Site 1090 alkenone measurements (Fig. S2). Our experimental results using the Greenland standard yielded similar results, with negligible change in our derived SSTs following silica gel and silver nitrate cleanup (Fig. S3). We performed a paired t test (two-tailed) to formally evaluate whether SST estimates before and after the cleanup procedure differ significantly and confirmed that there is no significant difference: our in-house standard samples produced a p value of 0.68, and the Greenland standard yielded a result of 0.93. While this experiment was conducted using standards and is not a direct comparison to the sediment's chemical environment, the consistent behaviour of the alkenones across both standards suggests that, when executed correctly, the cleanup procedures are unlikely to significantly impact the alkenone unsaturation index of our samples.
3.6 Back-calculation of from and %C37:4
In their study, Martínez-Garcia et al. (2010a, b) elected to utilize the culture-based temperature- calibration of Prahl and Wakeham (1987):
To establish a more direct comparison between our data, we estimated the approximate SST Martínez-Garcia et al. (2010a) would have reported had they utilized the simplified unsaturation index (). We first inferred their from their SST data, and then we used their reported %C37:4 to estimate :
Then, we applied the SST calibration of Müller et al. (1998; Eq. 3) to reconstruct temperature from our estimated values of .
Our age-depth model shows similarities to Martínez-Garcia et al. (2011)'s age-depth model for ODP 1090, with model agreement being strongest around 3.27 Ma (Figs. 3 and S6). Nevertheless, there are differences: our age-depth model produced mean estimated ages that were ∼42 ka younger compared to the Martínez-Garcia et al. (2011) estimates. Peak age model disagreement occurred around 58.81 MCD, where our age estimates differed by ∼122 kyr. In addition to adjusting the ODP 1090 age-depth assignments, our ∼5 m extension of alkenone measurements downcore allowed us to add an additional ∼380 ka to the prior SST reconstruction.
In contrast to results reported in Martínez-Garcia et al. (2010a), we observed minimal concentrations of the C37:4 ketone. Using GC-FID, the detection limit of C37 alkenones is approximately 0.6–1 ng g−1 sediment (see supplement for methods and data). While we often observed a small peak in the chromatograms at the elution time when we would expect to see the tetra-unsaturated C37 methyl-ketone, this peak was rarely taller than the surrounding baseline noise – too small to yield reliable results, let alone comparable %C37:4 values to the Martínez-Garcia et al. (2010a) record. Our GC-FID chromatograms yielded results indicating an average of 3.02 % of the total C37 ketones could correspond to the C37:4 ketone (or coeluting compounds) in our ODP Site 1090 Pliocene sediments. Based on these results, we conclude that quantities of the C37:4 ketone are sufficiently low to utilize the -based SST calibration.
Our HPLC measurements (N=16) both confirm our GC-FID results and verify that there is little to no C37:4 present in Pliocene ODP Site 1090 sediments (Table S4). The HPLC results show similar C37:2 and C37:3 concentrations and ratios compared to our established methodology using GC-FID. The mean difference between SSTs estimated using GC-FID and HPLC is 0.47 °C, and the mean absolute difference between these analytical methods' estimated SSTs is 0.85 °C. This less than 1 °C difference between methods indicates that the GC-FID peaks predominantly represent the target alkenones and that any remaining co-elution has minimal influence on reconstructed SSTs. The C37:4 ketone is present in only small quantities, with %C37:4 ranging from below detection limits to a maximum of 3.78 %; the average was 0.41 %. The similar results produced by both the GC-FID and HPLC methods validate the quality of our alkenone measurements and interpretation of paleo-temperatures. We therefore conclude that the high concentrations of the C37:4 ketone previously reported were most likely an analytical artifact.
The SST estimates generated from our biomarker measurements are typically warmer than those produced by Martínez-Garcia et al. (2010a). On average, our SST estimates were 1.22 °C warmer during the Pliocene interval for which we both have data, corresponding to ∼55.4–65.1 MCD. The mean SST from our reconstruction in this interval was 14.32 °C (minimum =10.04 °C, maximum =18.68 °C, standard deviation =1.50 °C), while in the Martínez-Garcia et al. (2010a) record it was 13.11 °C (minimum =7.43 °C, maximum =18.41 °C, standard deviation =2.15 °C). To determine if there is a significant difference between our Pliocene SST record and that of Martínez-Garcia et al. (2010a), we conducted Welch's t test, comparing SST estimates of the same depth interval. An alpha of 0.05 was used to determine significance. The resulting p value was <0.05, indicating a significant difference between the SST records. Critically, the cold intervals in the Martínez-Garcia et al. (2010a) record between 2.8–3.05 Ma are not observed in our revised record, and our record provides no indication of anomalously strong directional cooling in that time interval.
To visualize and contrast the underlying low-frequency trends embedded within our new record and the original Martínez-Garcia et al. (2010a) SST reconstruction, we applied 100 and 400 kyr moving averages to both records (Fig. 3). Both smoothing windows show that our SST estimates tended to fall above those of the previous record after 3.6 Ma. They also consistently show that the Martínez-Garcia et al. (2010a) reconstruction diverges from our own during the interval we identified as having SST estimates considerably lower than those of Etourneau et al. (201b0), with our SST estimates tending to fall between those of these two previously published records. Strongest divergence between our SST record and that of Martínez-Garcia et al. (2010a) occurs ∼3.0 Ma.
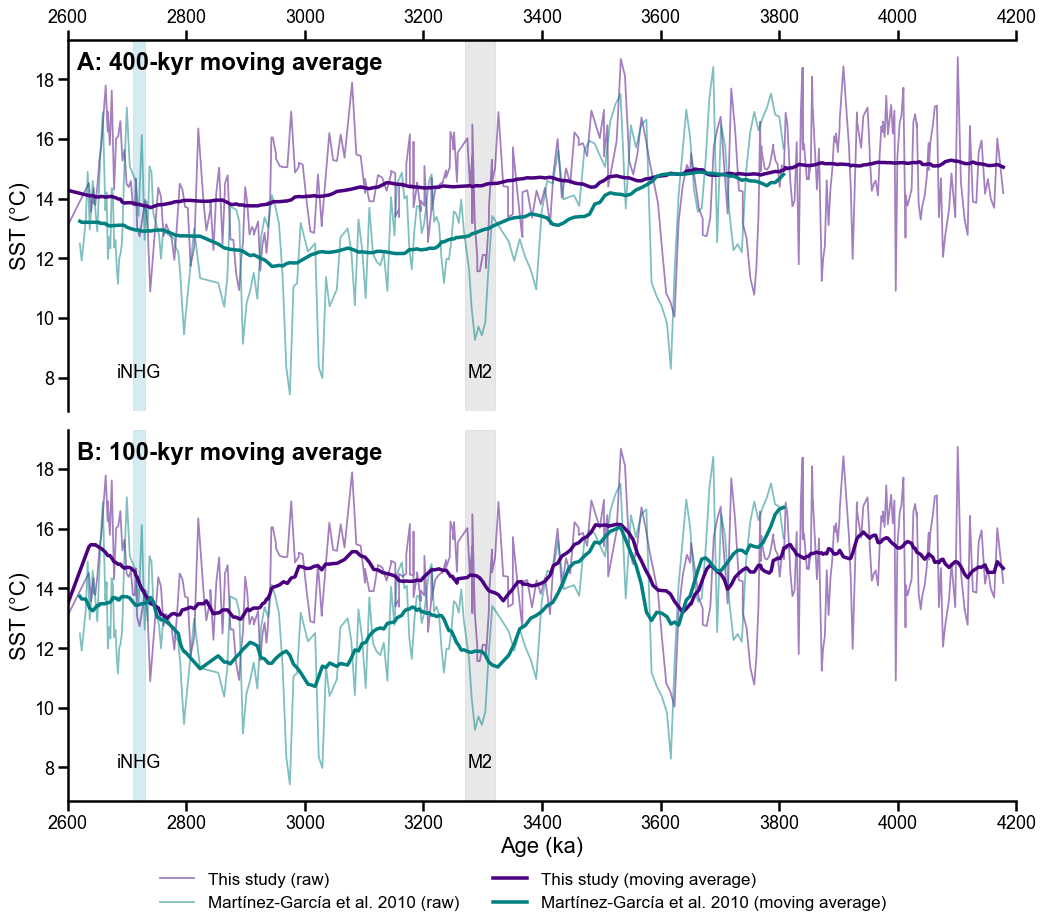
Figure 3A comparison of our alkenone-based SST estimates from ODP Site 1090 and that of Martínez-Garcia et al. (2010a). The teal line denotes the original -based SST Martínez-Garcia et al. (2010a) estimates plotted using their age-depth model (Martínez-Garcia et al., 2011), while the SST record constructed during this study is plotted in indigo using our new age-depth model. The approximate beginning of iNHG (∼2.72 Ma) is highlighted in blue, and the MIS M2 glacial event is highlighted in gray. Panel (A) shows the full high-resolution records overlaid by a 400 kyr moving average, and panel (B) displays the same records with a 100 kyr moving average. In both cases, our new record shows elevated temperature estimates in the interval between MIS M2 and iNHG, where we noted an offset between the Martínez-Garcia et al. (2010a) data and other published records.
In addition, to investigate the potential of long-term directional cooling revealed in either our record or the Martínez-Garcia et al. (2010a) record, we found the least-squares linear regression of the data from the overlapping interval between records: (R2=0.0241) for our reconstruction and (R2=0.0979) for that of Martínez-Garcia et al. (2010a). The linear trend (R2) of both records is small, likely due to the large degree of orbital variability superimposed on any trend. This small R2 and small slope likely also result from the non-monotonic nature of the cooling observed. The p values of the regression for both records are <0.05. The least-squares linear regression of the data spanning our entire record is similar, with a slightly more positive slope: (R2=0.0708).
5.1 A revised, alkenone-based SST record of the late Pliocene subantarctic East Atlantic
Compared to the SST record of Martínez-Garcia et al. (2010a), our SST estimates record only a gentle cooling trend leading up to iNHG (Fig. 3), made apparent by the gentler cooling and warmer SSTs evident in the 400 kyr moving average of our reconstruction, in addition to the gentler slope of our linear regression. In addition, both our new high-resolution dataset and the lower-resolution SST data of Etourneau et al. (2010b) indicate that SSTs were on average 1.22 °C warmer during the late Pliocene at ODP Site 1090 than Martínez-Garcia et al. (2010a) estimate. Minimum temperatures in the interval spanning ca. 2.8–3.2 Ma are often 1–2 °C warmer in our record, but some differences were even greater – at one comparable depth interval, the SST difference between records exceed 6 °C. These larger sample-specific differences suggest that the offset between our records cannot be attributed solely to calibration uncertainty or inter-laboratory effects, and that the observed SST differences are analytically meaningful. There is little to no indication of anomalously cold events at ODP Site 1090 uniquely preceding iNHG (Figs. 3 and 4). We believe that most of the differences between data sets result from the very difficult sample matrix presented by Site 1090 and the optimization of sample purification and strategic use of HPLC in the present study.
Figure 4Alkenone-derived SST estimates from ODP Site 1090 (A; this study), ODP Site 846 (B; Kimble et al., 2024 and Herbert et al., 2020), and IODP Site U1313 (C; Naafs et al., 2020). Also displayed is the LR04 benthic oxygen isotope stack (panel D) from 2600–4280 ka. The interval preceding the iNHG following the MIS M2 cooling event is shaded in all panels, and the mean SST of the plotted interval for all records is denoted by a dotted black line. When comparing our Site 1090 record to those from other regions (here, eastern equatorial Pacific [ODP 846] and the northeast Atlantic [IODP U1313]) we observe little evidence of early cooling in the high latitude southern hemisphere compared to the rest of the world. Notice the similar, slightly negative cooling trend at all three sites, indicative of cooling occurring synchronously across the globe; in fact, ODP Site 1090 displays a less negative cooling trend throughout the late Pliocene than at ODP Site 846 or IODP Site U1313.
Both our GC-FID and HPLC results indicate that C37:4 was not present in reliably measurable quantities in ODP Site 1090 sediments. As C37:4 is present only in low concentrations in most marine sediments, including those of Site 1090, its measurement is subject to disproportionate risk of overestimation due to co-eluting compounds and baseline noise (Brassell et al., 1986). The overutilization of less abundant compounds, such as the tetra-unsaturated alkenone, in proxy calibrations can dampen trends and obscure important relationships, risking the introduction of bias in analyses (Raberg et al., 2021). Therefore, it is advisable to positively identify measurable C37:4 in marine sediments before utilizing the index in preference to the index.
5.2 Implications of revising the record: synchronous cooling across hemispheres leading up to the iNHG
Our record of late Pliocene ODP Site 1090 SSTs does not show a cooling trend indistinguishable from those at other open ocean sites, including those in the Northern Hemisphere and low latitudes (Fig. 4). In fact, when comparing the Site 1090 SST record with those of ODP Site 846 (eastern equatorial Pacific; Kimble et al., 2024; Herbert et al., 2020) and IODP Site U1313 (northern Atlantic; Naafs et al., 2020), the cooling trend is the most gradual at ODP Site 1090; while the slopes of the best fit lines of SSTs from ODP 846 and IODP U1313 are 0.0011 and 0.0019 °C kyr−1, respectively, it is only 0.0009 °C kyr−1 at ODP Site 1090. This more gradual cooling trend is likely influenced by the more variable SSTs observed at ODP Site 1090, particularly prior to 3600 ka, which dampens the expression of long-term trends, especially in SST reconstructions where we expect, and observe, non-monotonic cooling. Notably, the cooling trend observed at IODP Site U1313, in the North Atlantic, is approximately double that of the other sites – a possible indication that more Northern Hemisphere cooling preceded iNHG, which challenges the hypothesis that Southern Hemisphere cooling was a primary driver of northern glaciation (McKay et al., 2012; McClymont et al., 2023; Woodard et al., 2014).
In addition, the relatively muted cooling at Site 1090 likely reflects regional oceanographic controls, rather than a simple response to large-scale cooling, as its location within a frontal transition zone makes it particularly sensitive to changes in ocean circulation. Site 1090 (∼43° S) lies between the SAF and STF, where SSTs are highly sensitive to frontal migration, wind-driven circulation, and water-mass mixing. Latitudinal shifts in Southern Ocean fronts associated with changes in westerly winds and meridional temperature gradients during the late Pliocene (e.g., Martínez-Garcia et al., 2010b; Hillenbrand et al., 2009) could cause the site to experience alternating influence of subtropical and subantarctic waters. Such variability would act to buffer or modulate the local expression of global cooling, producing a more gradual and variable SST trend compared to regions more directly coupled to large-scale radiative and thermocline forcing. Furthermore, Site 1090 is located just north of the SAF in the modern ocean (Fig. 1); had the location of this front been more poleward in the warmer-than-modern Pliocene (Hillenbrand et al., 2009; McClymont et al., 2016), Site 1090 may still have been located in the envelope between the SAF and STF throughout this transition period, potentially buffering regional SSTs from the global trend.
The SST record of ODP Site 1090 shares orbital-scale features with records from other regions of the global ocean, highlighting its relevance within the broader context of global climatic patterns (Fig. 4). To further explore these shared characteristics, spectral analyses were conducted using the multitaper method Fourier transform. This analysis identifies the dominant periods of variability in the SST records of ODP Site 1090, ODP Site 846, and IODP Site U1313, enabling assessment of the commonality of these orbital-scale features at the 95 % confidence interval (Fig. 5). Our spectral analysis reveals that all three sites had dominant periodicities in the obliquity band (41 kyr cycles). Both ODP 846 and 1090 showed significant power in the precession bands (23 kyr cycles), but no site showed power in the eccentricity band (100 kyr cycles) that reached the 95 % significance threshold. Coherence between the SST records of each site and the average eccentricity, obliquity (tilt) and precession (ETP) is strongest in the obliquity band for all sites (Fig. 5). This demonstrates that Earth's changes in obliquity acted as a significant control on temperature globally during the late Pliocene.
Figure 5Astronomical power spectra (solid lines, above) and coherence analyses (dotted lines, below) relative to ETP (eccentricity, tilt [obliquity], precession) of ODP Site 1090, IODP Site U1313, and ODP Site 846. SST data from 2.60–4.15 Ma were normalized, detrended, and linearly interpolated to an age scale with equal <3 kyr time steps. The thresholds for 95 % confidence intervals are plotted over the power spectra as dashed lines. To analyse spectral power, a multitaper method Fourier transform was utilized (Meyers et al., 2021). To calculate coherency, we utilized the gsignal package in R. The vertical bars denote the frequency of each ETP component.
The revised SST record of ODP Site 1090 supports the hypothesis that global SST records displayed only a modest long-term cooling trend throughout the late Pliocene. Intriguingly, interglacial SST values of the late Pliocene were almost as high as in the preceding million years (Fig. 3). This contrasts with the suggestion that asynchronous global cooling, caused by a regional temperature forcing like the ice-albedo feedback in the Antarctic, led to the iNHG (e.g., McKay et al., 2012; McClymont et al., 2023; Woodard et al., 2014). Had an orbitally paced, regional forcing caused the expansion of the Antarctic ice sheet and driven global cooling leading to the iNHG, we would expect to see cooling signals unique to the ODP 1090 record compared to more northerly sites. However, all sites' SST reconstructions reveal similarly paced warm- and cool-intervals (Fig. 4), hinting that a global mechanism drove this variability in temperature.
Our results are consistent with a significant body of compelling research supporting the hypothesis that synchronous cooling, driven by decreasing atmospheric carbon dioxide concentrations, allowed for Northern Hemisphere ice sheets to grow under favorable orbital configurations. Earth system models have demonstrated that lowered atmospheric CO2 would have led to synchronous global cooling (Lunt et al., 2008a; Willeit et al., 2015). Similarly, a recent synthesis of global paleo-temperature records showed that changes in long-term cooling and variability during the past 4.5 million years is likely paced by geologically driven changes in Earth's carbon cycle (Clark et al., 2024). DeConto et al. (2008) utilized isotope-capable global climate/ice-sheet models to show that the atmospheric CO2 threshold below which glaciation occurs is higher (∼750 ppm) in the Southern Hemisphere compared to the high latitude north (∼280 ppm). Other researchers similarly found that lowering atmospheric CO2 concentrations to 280 ppm controlled the late Pliocene glaciation of Greenland in a fully coupled atmosphere–ocean general circulation model and an ice-sheet model (Lunt et al., 2008a). Proxy data confirms that this carbon dioxide threshold likely was not crossed until the late Pliocene, ∼2.7–2.8 Ma, and that decreasing levels of atmospheric CO2 in the late Pliocene likely corresponded with cooling global temperatures (Bartoli et al., 2011; de la Vega et al., 2020; Stap et al., 2018). Similarly, recent analyses of global temperature change during the past 4.5 million years by Clark et al. (2024) show that no region of the ocean displays an accelerated degree of cooling from the mean global cooling trend occurring throughout the Pliocene; this pattern is apparent even with the inclusion of the previously published, likely erroneously cold SST estimates from ODP 1090 (Martinez-Garcia et al., 2010b).
Analyses using models from Phase 2 of the Pliocene Model Intercomparison Project (PlioMIP2) and paleoclimate proxy data from the PlioVAR working group conducted by Burton et al. (2024) indicate that at most sites, late-Pliocene SST changes were forced by CO2. Although they also utilize the SST record by Martínez-Garcia et al. (2010a), they nevertheless found that changes in SST at ODP 1090 were found to be primarily driven by CO2 forcings, and non-CO2 forcings were dominant only at North Atlantic sites. However, the researchers also note that there is a significant, negative relationship between FCO2 (the proportion of the total Pliocene minus preindustrial climate change that is due to CO2 forcing; Burton et al., 2023) and data-model agreement at ODP 1090, with this agreement ranging from 0.35 °C (CESM2) to −2.98 °C (NorESM1-F) with a multi-model mean of −1.63 °C, indicating that the paleo-record suggested temperatures were on average colder than the model output (Burton et al., 2024). Using our revised SST estimates, which are on average ∼0.8 °C warmer than the Martínez-Garcia et al. (2010a) record over MIS KM5c (3.205±0.01 Ma), reduces, but does not eliminate, the data–model discrepancy at this site. The magnitude of disagreement would be approximately halved relative to that reported by Burton et al. (2024). We emphasize, however, that Site 1090 is located in a region strongly influenced by Southern Ocean frontal dynamics and latitudinal shifts of the Antarctic Circumpolar Current. Such processes are unlikely to be fully resolved in model simulations and could contribute to both the relatively high variability in the proxy record and persistent model–data offsets. Nevertheless, our results highlight the importance of accurately constrained regional proxy records for evaluating model performance in dynamically complex settings.
Why might atmospheric CO2 concentrations have fallen to levels that allowed brief Northern Hemisphere glaciations throughout the Pliocene, and later the extensive growth of Northern Hemisphere ice sheets? Changes in high-latitude oceanographic processes tied to the global carbon cycle may have driven both global temperature changes and glaciation (Herbert et al., 2010). Reconstructions of neodymium isotope ratios and carbonate ion saturation indicate that ocean circulation shifted in the late Pliocene, providing more water to the Pacific sourced from the Southern Ocean. They also suggest that respired carbon storage into the deep Pacific increased during the late Pliocene, possibly due to strengthened deep-water formation and biological-pump efficiency in the Southern Ocean due to the expansion of sea-ice (Jian et al., 2023). Continued proxy-studies regarding carbon sequestration, carbonate production, and the biologic pump in the late Pliocene may help to further explain how atmospheric CO2 levels changed leading to iNHG.
We presented here a revised record of alkenone-derived sea surface temperatures (SSTs) from ODP Site 1090, a mid-latitude, open ocean site located in the subpolar southeast Atlantic Ocean. Rigorous extract cleanup and analytical methods, use of the unsaturation index, and improved stratigraphy produced a robust SST reconstruction from the late Pliocene. Our experimental investigation into the potential bias caused by our cleanup methods confirmed that when performed correctly, the procedures are unlikely to significantly impact the alkenone signal. Future work could build on this foundation by conducting parallel analyses of ODP 1090 samples before and after purification, as well as systematically testing different GC conditions to better evaluate the influence of co-eluting compounds. This expanded approach would offer further validation and contribute to improved methodological confidence in studies of chemically complex sediments.
Our revised record suggests that sea surface temperatures at ODP Site 1090 were warmer than previously estimated, challenging the hypothesis that cooling and ice sheet expansion in the high-latitude Southern Hemisphere was the primary driver of iNHG (McKay et al., 2012). Our spectral analysis shows that both SST and the global benthic δ18O stack (LR04) exhibit increased variance at the obliquity band during the late Pliocene, expressed as larger-amplitude oscillations relative to earlier intervals. This agreement suggests that the same forcing may have controlled both the local SST and the controls on δ18Obenthic (global ice volume and deepwater temperature), and it is consistent with the hypothesis that a global driver, such as deceasing atmospheric carbon dioxide concentrations, may have led to the intensification of Northern Hemisphere Glaciation (iNHG) in the late Pliocene.
All utilized datasets are available via the PANGAEA online repository; they can be accessed through the citations given in Table 1, with full references provided below. All biomarker data presented in this study are available in the PANGAEA database: https://doi.org/10.1594/PANGAEA.988391 (Hoegler et al., 2026).
The supplement related to this article is available online at https://doi.org/10.5194/cp-22-1241-2026-supplement.
BH: methodology, GC-FID and HPLC-MS alkenone analyses, investigation, writing (original draft, review, and editing), data visualization. TDH: conceptualization, writing (review and editing), supervision, funding acquisition. JP: HPLC-MS methodology and alkenone analyses.
The contact author has declared that none of the authors has any competing interests.
Publisher's note: Copernicus Publications remains neutral with regard to jurisdictional claims made in the text, published maps, institutional affiliations, or any other geographical representation in this paper. The authors bear the ultimate responsibility for providing appropriate place names. Views expressed in the text are those of the authors and do not necessarily reflect the views of the publisher.
Thanks are owed to the IODP curators and staff for their work in maintaining the sediment archive and providing samples for this study, Xiangming Zhao and Naomi Hudis for conducting prior ODP 1090 analyses utilized in this study, and the crew and scientists of ODP Leg 177. Foundational work for this project was funded by NSF Grants OCE-1459280 and OCE-1545859.
This research has been supported by the Directorate for Geosciences (grant nos. OCE-1459280 and OCE-1545859).
This paper was edited by Shiling Yang and reviewed by two anonymous referees.
Bard, E. and Rickaby, R. E. M.: Migration of the subtropical front as a modulator of glacial climate, Nature, 460, 380–383, https://doi.org/10.1038/nature08189, 2009.
Bartoli, G., Hönisch, B., and Zeebe, R. E.: Atmospheric CO2 decline during the Pliocene intensification of Northern Hemisphere glaciations, Paleoceanography, 26, PA4213, https://doi.org/10.1029/2010PA002055, 2011.
Becquey, S. and Gersonde, R.: Past hydrographic and climatic changes in the Subantarctic Zone of the South Atlantic – The Pleistocene record from ODP Site 1090, Palaeogeogr. Palaeocl., 182, 221–239, https://doi.org/10.1016/S0031-0182(01)00497-7, 2002.
Billups, K., Pälike, H., Channell, J. E. T., Zachos, J. C., and Shackleton, N. J.: Astronomic calibration of the late Oligocene through early Miocene geomagnetic polarity time scale, Earth Planet. Sc. Lett., 224, 33–44, https://doi.org/10.1016/j.epsl.2004.05.004, 2004.
Blake-Mizen, K., Hatfield, R. G., Stoner, J. S., Carlson, A. E., Xuan, C., Walczak, M., Lawrence, K. T., Channell, J. E. T., and Bailey, I.: Southern Greenland glaciation and Western Boundary Undercurrent evolution recorded on Eirik Drift during the late Pliocene intensification of Northern Hemisphere glaciation, Quaternary Sci. Rev., 209, 40–51, https://doi.org/10.1016/j.quascirev.2019.01.015, 2019.
Brassell, S. C., Eglinton, G., Marlowe, I. T., Pflaumann, U., and Sarnthein, M.: Molecular stratigraphy: A new tool for climatic assessment, Nature, 320, 129–133, https://doi.org/10.1038/320129a0, 1986.
Broccoli, A. J. and Manabe, S.: The influence of continental ice, atmospheric CO2, and land albedo on the climate of the last glacial maximum, Clim. Dynam., 1, 87–99, https://doi.org/10.1007/BF01054478, 1987.
Burke, K. D., Williams, J. W., Chandler, M. A., Haywood, A. M., Lunt, D. J., and Otto-Bliesner, B. L.: Pliocene and Eocene provide best analogs for near-future climates, P. Natl. Acad. Sci. USA, 115, 13288–13293, https://doi.org/10.1073/pnas.1809600115, 2018.
Burton, L. E., Haywood, A. M., Tindall, J. C., Dolan, A. M., Hill, D. J., Abe-Ouchi, A., Chan, W.-L., Chandan, D., Feng, R., Hunter, S. J., Li, X., Peltier, W. R., Tan, N., Stepanek, C., and Zhang, Z.: On the climatic influence of CO2 forcing in the Pliocene, Clim. Past, 19, 747–764, https://doi.org/10.5194/cp-19-747-2023, 2023.
Burton, L. E., Haywood, A. M., Tindall, J. C., Dolan, A. M., Hill, D. J., McClymont, E. L., Ho, S. L., and Ford, H. L.: The role of atmospheric CO2 in controlling sea surface temperature change during the Pliocene, Clim. Past, 20, 1177–1194, https://doi.org/10.5194/cp-20-1177-2024, 2024.
Clark, P. U., Shakun, J. D., Rosenthal, Y., Köhler, P., and Bartlein, P. J.: Global and regional temperature change over the past 4.5 million years, Science, 383, 884–890, https://doi.org/10.1126/science.adi1908, 2024.
Conte, M. H., Sicre, M.-A., Rühlemann, C., Weber, J. C., Schulte, S., Schulz-Bull, D., and Blanz, T.: Global temperature calibration of the alkenone unsaturation index () in surface waters and comparison with surface sediments, Geochem. Geophy. Geosy., 7, Q02005, https://doi.org/10.1029/2005GC001054, 2006.
D'Andrea, W. J. and Huang, Y.: Long chain alkenones in Greenland lake sediments: Low δ13C values and exceptional abundance, Org. Geochem., 36, 1234–1241, https://doi.org/10.1016/j.orggeochem.2005.05.001, 2005.
D'Andrea, W. J., Liu, Z., Alexandre, M. D. R., Wattley, S., Herbert, T. D., and Huang, Y.: An efficient method for isolating individual long-chain alkenones for compound-specific hydrogen isotope analysis, Anal. Chem., 79, 3430–3435, https://doi.org/10.1021/ac062067w, 2007.
de Castro, M. J., Venancio, I. M., Santos, T. P., Lessa, D. V. O., Ballalai, J. M., Albuquerque, A. L. S., and IODP Expedition 383 Shipboard Scientists: Migration of oceanic fronts in the Pacific Southern Ocean during the Mid-Pleistocene transition, Mar. Micropaleontol., 200, 102501, https://doi.org/10.1016/j.marmicro.2025.102501, 2025.
DeConto, R. M., Pollard, D., Wilson, P. A., Pälike, H., Lear, C. H., and Pagani, M.: Thresholds for Cenozoic bipolar glaciation, Nature, 455, 652–656, https://doi.org/10.1038/nature07337, 2008.
de la Vega, E., Chalk, T. B., Wilson, P. A., Bysani, R. P., and Foster, G. L.: Atmospheric CO2 during the Mid-Piacenzian Warm Period and the M2 glaciation, Sci. Rep.-UK, 10, 11002, https://doi.org/10.1038/s41598-020-67154-8, 2020.
Dillon, J.: Chemplexity/chromatography-gui, MATLAB software, https://github.com/chemplexity/chromatography-gui (last access: 2017), 2023.
Etourneau, J., Schneider, R. R., Blanz, T., and Martinez, P.: Intensification of the Walker and Hadley atmospheric circulations during the Pliocene–Pleistocene climate transition, Earth Planet. Sc. Lett., 297, 103–110, https://doi.org/10.1016/j.epsl.2010.06.010, 2010a.
Etourneau, J., Schneider, R. R., Blanz, T., and Martinez, P.: index and sea surface temperature reconstruction of ODP Hole 177-1090D, PANGAEA, https://doi.org/10.1594/PANGAEA.786700, 2010b.
Felden, J., Möller, L., Schindler, U., Huber, R., Schumacher, S., Koppe, R., Diepenbroek, M., and Glöckner, F. O.: PANGAEA – Data Publisher for Earth and Environmental Science, Sci. Data, 10, 347, https://doi.org/10.1038/s41597-023-02269-x, 2023.
Flesche Kleiven, H., Jansen, E., Fronval, T., and Smith, T. M.: Intensification of Northern Hemisphere glaciations in the circum Atlantic region (3.5–2.4 Ma) – ice-rafted detritus evidence, Palaeogeogr. Palaeocl., 184, 213–223, https://doi.org/10.1016/S0031-0182(01)00407-2, 2002.
Haug, G. H. and Tiedemann, R.: Effect of the formation of the Isthmus of Panama on Atlantic Ocean thermohaline circulation, Nature, 393, 673–676, https://doi.org/10.1038/31447, 1998.
Haywood, A. M., Hill, D. J., Dolan, A. M., Otto-Bliesner, B. L., Bragg, F., Chan, W.-L., Chandler, M. A., Contoux, C., Dowsett, H. J., Jost, A., Kamae, Y., Lohmann, G., Lunt, D. J., Abe-Ouchi, A., Pickering, S. J., Ramstein, G., Rosenbloom, N. A., Salzmann, U., Sohl, L., Stepanek, C., Ueda, H., Yan, Q., and Zhang, Z.: Large-scale features of Pliocene climate: results from the Pliocene Model Intercomparison Project, Clim. Past, 9, 191–209, https://doi.org/10.5194/cp-9-191-2013, 2013.
Herbert, T. D.: Alkenone paleotemperature determinations, in: Treatise on Geochemistry, Elsevier, 391–432, https://doi.org/10.1016/B0-08-043751-6/06115-6, 2003.
Herbert, T. D., Peterson, L. C., Lawrence, K. T., and Liu, Z.: Tropical ocean temperatures over the past 3.5 million years, Science, 328, 1530–1534, https://doi.org/10.1126/science.1185435, 2010.
Herbert, T. D., Caballero-Gill, R. P., and Novak, J. B.: Revised sea surface temperature (SST) and alkenone data for the late Pliocene composite section from ODP Site 138-846, PANGAEA, https://doi.org/10.1594/PANGAEA.912758, 2020.
Hillenbrand, C.-D., Kuhn, G., and Frederichs, T.: Record of a Mid-Pleistocene depositional anomaly in West Antarctic continental margin sediments: an indicator for ice-sheet collapse?, Quaternary Sci. Rev., 28, 1147–1159, https://doi.org/10.1016/j.quascirev.2008.12.010, 2009.
Hoegler, B., Herbert, T. D., and Pahigian, J.: Age model and alkenone-based sea surface temperature record of ODP Site 177-1090, PANGAEA [data set], https://doi.org/10.1594/PANGAEA.988391, 2026.
Jansen, E., Fronval, T., Rack, F., and Channell, J. E. T.: Pliocene–Pleistocene ice rafting history and cyclicity in the Nordic Seas during the last 3.5 Myr, Paleoceanography, 15, 709–721, https://doi.org/10.1029/1999PA000435, 2000.
Jian, Z., Dang, H., Yu, J., Wu, Q., Gong, X., Stepanek, C., Colin, C., Hu, L., Lohmann, G., Zhou, X., and Wan, S.: Changes in deep Pacific circulation and carbon storage during the Pliocene–Pleistocene transition, Earth Planet. Sc. Lett., 605, 118020, https://doi.org/10.1016/j.epsl.2023.118020, 2023.
Kimble, K., Herbert, T. D., and Jones, C.: Sea surface temperature from ODP Site 138-846, PANGAEA, https://doi.org/10.1594/PANGAEA.962707, 2024.
Lear, C. H., Bailey, T. R., Pearson, P. N., Coxall, H. K., and Rosenthal, Y.: Cooling and ice growth across the Eocene–Oligocene transition, Geology, 36, 251–254, https://doi.org/10.1130/G24584A.1, 2008.
Liao, S., Liu, X.-L., Manz, K. E., Pennell, K. D., Novak, J., Santos, E., and Huang, Y.: Comprehensive analysis of alkenones by reversed-phase HPLC-MS with unprecedented selectivity, linearity and sensitivity, Talanta, 260, 124653, https://doi.org/10.1016/j.talanta.2023.124653, 2023a.
Liao, S., Wang, K. J., and Huang, Y.: Unusually high production of C37:4 alkenone by an Arctic Gephyrocapsa huxleyi strain, Org. Geochem., 177, 104539, https://doi.org/10.1016/j.orggeochem.2022.104539, 2023b.
Lisiecki, L. E. and Raymo, M. E.: A Pliocene–Pleistocene stack of 57 globally distributed benthic δ18O records, Paleoceanography, 20, PA1003, https://doi.org/10.1029/2004PA001071, 2005.
Lunt, D. J., Foster, G. L., Haywood, A. M., and Stone, E. J.: Late Pliocene Greenland glaciation controlled by a decline in atmospheric CO2 levels, Nature, 454, 1102–1105, https://doi.org/10.1038/nature07223, 2008a.
Lunt, D. J., Valdes, P. J., Haywood, A., and Rutt, I. C.: Closure of the Panama Seaway during the Pliocene: Implications for climate and Northern Hemisphere glaciation, Clim. Dynam., 30, 1–18, https://doi.org/10.1007/s00382-007-0265-6, 2008b.
Marlowe, I. T., Green, J. C., Neal, A. C., Brassell, S. C., Eglinton, G., and Course, P. A.: Long-chain (n-C37–C39) alkenones in the Prymnesiophyceae, Brit. Phycol. J., 19, 203–216, https://doi.org/10.1080/00071618400650221, 1984.
Martin, C., Richter, N., Lloren, R., and Dubois, N.: Impact of saponification and silver-nitrate purification on lacustrine alkenone distributions, J. Chromatogr. A, 1715, 464576, https://doi.org/10.1016/j.chroma.2023.464576, 2024.
Martínez-García, A., Rosell-Melé, A., McClymont, E. L., Gersonde, R., and Haug, G. H.: Sea surface temperature and relative abundance of C37:4 alkenone in ODP Site 177-1090 (Table S2), PANGAEA, https://doi.org/10.1594/PANGAEA.771706, 2010a.
Martínez-Garcia, A., Rosell-Melé, A., McClymont, E. L., Gersonde, R., and Haug, G. H.: Subpolar link to the emergence of the modern equatorial Pacific cold tongue, Science, 328, 1550–1553, https://doi.org/10.1126/science.1184480, 2010b.
Martínez-Garcia, A., Rosell-Melé, A., Jaccard, S. L., Geibert, W., Sigman, D. M., and Haug, G. H.: Southern Ocean dust–climate coupling over the past four million years, Nature, 476, 312–315, https://doi.org/10.1038/nature10310, 2011.
McClymont, E. L., Elmore, A. C., Kender, S., Leng, M. J., Greaves, M., and Elderfield, H.: Pliocene–Pleistocene evolution of sea surface and intermediate water temperatures from the southwest Pacific, Paleoceanography, 31, 895–913, https://doi.org/10.1002/2016PA002954, 2016.
McClymont, E. L., Ho, S. L., Ford, H. L., Bailey, I., Berke, M. A., Bolton, C. T., De Schepper, S., Grant, G. R., Groeneveld, J., Inglis, G. N., Karas, C., Patterson, M. O., Swann, G. E. A., Thirumalai, K., White, S. M., Alonso-Garcia, M., Anand, P., Hoogakker, B. A. A., Littler, K., Petrick, B. F., Risebrobakken, B., Abell, J. T., Crocker, A. J., de Graaf, F., Feakins, S. J., Hargreaves, J. C., Jones, C. L., Markowska, M., Ratnayake, A. S., Stepanek, C., and Tangunan, D.: Climate evolution through the onset and intensification of Northern Hemisphere glaciation, Rev. Geophys., 61, e2022RG000793, https://doi.org/10.1029/2022RG000793, 2023.
McKay, R., Naish, T., Carter, L., Riesselman, C., Dunbar, R., Sjunneskog, C., Winter, D., Sangiorgi, F., Warren, C., Pagani, M., Schouten, S., Willmott, V., Levy, R., DeConto, R., and Powell, R. D.: Antarctic and Southern Ocean influences on Late Pliocene global cooling, P. Natl. Acad. Sci. USA, 109, 6423–6428, https://doi.org/10.1073/pnas.1112248109, 2012.
Meyers, S., Malinverno, A., Hinnov, L., Zeeden, C., Liu, H., and Moron, V.: Astrochron: A computational tool for astrochronology, https://cran.r-project.org/package=astrochron (last acccess: 23 June 2026), 2021.
Müller, P. J., Kirst, G., Ruhland, G., von Storch, I., and Rosell-Melé, A.: Calibration of the alkenone paleotemperature index U, Geochim. Cosmochim. Ac., 62, 1757–1772, https://doi.org/10.1016/S0016-7037(98)00097-0, 1998.
Naafs, B. D. A., Voelker, A. H. L., Karas, C., Andersen, N., and Sierro, F. J.: Age reconstruction from alkenone unsaturation index (UK37') of IODP Site 306-U1313, PANGAEA, https://doi.org/10.1594/PANGAEA.911566, 2020.
NASA/JPL: MODIS Aqua Level 3 sea surface temperature (SST) thermal IR 8 d 4 km nighttime V2019.0, NASA Physical Oceanography Distributed Active Archive Center (PO.DAAC) [data set], https://doi.org/10.5067/MODSA-8D4N9, 2020.
NOAA Global Monitoring Laboratory: Trends in atmospheric carbon dioxide, https://gml.noaa.gov/ccgg/trends/ (last access: 1 November 2025), 2025.
Novak, J., McGrath, S. M., Wang, K. J., Liao, S., Clemens, S. C., Kuhnt, W., and Huang, Y.: expands the linear dynamic range of the alkenone SST proxy, Geochim. Cosmochim. Ac., 328, 207–220, https://doi.org/10.1016/j.gca.2022.04.021, 2022.
Prahl, F. G. and Wakeham, S. G.: Calibration of unsaturation patterns in long-chain ketone compositions, Nature, 330, 367–369, https://doi.org/10.1038/330367a0, 1987.
Prahl, F. G., Muehlhausen, L. A., and Zahnle, D. L.: Further evaluation of long-chain alkenones as indicators of paleoceanographic conditions, Geochim. Cosmochim. Ac., 52, 2303–2310, https://doi.org/10.1016/0016-7037(88)90132-9, 1988.
Raberg, J. H., Harning, D. J., Crump, S. E., de Wet, G., Blumm, A., Kopf, S., Geirsdóttir, Á., Miller, G. H., and Sepúlveda, J.: Revised fractional abundances and warm-season temperatures substantially improve brGDGT calibrations in lake sediments, Biogeosciences, 18, 3579–3603, https://doi.org/10.5194/bg-18-3579-2021, 2021.
Rae, J. W. B., Zhang, Y. G., Liu, X., Foster, G. L., Stoll, H. M., and Whiteford, R. D. M.: Atmospheric CO2 over the past 66 million years from marine archives, Annu. Rev. Earth Pl. Sc., 49, 609–641, https://doi.org/10.1146/annurev-earth-082420-063026, 2021.
Reid, J. L.: On the total geostrophic circulation of the South Atlantic Ocean, Prog. Oceanogr., 23, 149–244, https://doi.org/10.1016/0079-6611(89)90001-3, 1989.
Shipboard Scientific Party: Proceedings of the Ocean Drilling Program, Initial Reports, Ocean Drilling Program, https://doi.org/10.2973/odp.proc.ir.161.1996, 1999.
Sikes, E. L., Farrington, J. W., and Keigwin, L. D.: Use of the alkenone unsaturation ratio to determine past SST, Earth Planet. Sc. Lett., 104, 36–47, https://doi.org/10.1016/0012-821X(91)90235-A, 1991.
Stap, L. B., van de Wal, R. S. W., de Boer, B., Köhler, P., Hoencamp, J. H., Lohmann, G., Tuenter, E., and Lourens, L. J.: Modeled influence of land ice and CO2 on polar amplification, Paleoceanography and Paleoclimatology, 33, 381–394, https://doi.org/10.1002/2017PA003313, 2018.
Tan, N., Ramstein, G., Dumas, C., Contoux, C., Ladant, J., Sepulchre, P., Zhang, Z., and De Schepper, S.: Exploring the MIS M2 glaciation during a warm Pliocene climate, Earth Planet. Sc. Lett., 472, 266–276, https://doi.org/10.1016/j.epsl.2017.04.050, 2017.
Thiede, J.,Jessen, C., Knutz, P., Kuijpers, A., Mikkelsen, N., Nørgaard-Pedersen, N., and Spielhagen, R. F.: Millions of years of Greenland Ice Sheet history recorded in ocean sediments, Polarforschung, hdl:10013/epic.38391.d001, 2011.
Tierney, J. E. and Tingley, M. P.: BAYSPLINE: A new calibration for the alkenone paleothermometer, Paleoceanography and Paleoclimatology, 33, 281–301, https://doi.org/10.1002/2017PA003201, 2018.
Wang, K. J., Huang, Y., Majaneva, M., Belt, S. T., Liao, S., Novak, J., Kartzinel, T. R., Herbert, T., D., Richter, N., and Cabedo-Sanz, P.: Group 2i Isochrysidales produce characteristic alkenones reflecting sea ice distribution, Nat. Commun., 12, 15, https://doi.org/10.1038/s41467-020-20187-z, 2021.
Willeit, M., Ganopolski, A., Calov, R., Robinson, A., and Maslin, M.: The role of CO2 decline for the onset of Northern Hemisphere glaciation, Quaternary Sci. Rev., 119, 22–34, https://doi.org/10.1016/j.quascirev.2015.04.015, 2015.
Woodard, S. C., Rosenthal, Y., Miller, K. G., Wright, J. D., Chiu, B. K., and Lawrence, K. T.: Antarctic role in Northern Hemisphere glaciation, Science, 346, 847–851, https://doi.org/10.1126/science.1255586, 2014.
Zachos, J., Pagani, M., Sloan, L., Thomas, E., and Billups, K.: Trends, rhythms, and aberrations in global climate 65 Ma to present, Science, 292, 686–693, https://doi.org/10.1126/science.1059412, 2001.