the Creative Commons Attribution 4.0 License.
the Creative Commons Attribution 4.0 License.
 | 15 Sep 2025
Perspective on ice age terminations from absolute chronologies provided by global speleothem records
Carlos Pérez-Mejías
Heather M. Stoll
Glacial terminations represent the largest-amplitude global climate changes of the last few million years. Several possible orbital-insolation triggers have been described to initiate and sustain glacial terminations. Because of the availability of radiocarbon dating, the most recent termination (TI) has been extensively characterized. Yet, it is widely discussed as to whether the sequence of millennial events, their climate feedbacks and rates of change seen in TI is recurrent over previous terminations. Beyond the limit of radiocarbon dating, records from the speleothem archive provide absolute age control through uranium–thorium dating and high-resolution proxy measurements. The PAGES SISALv3 global speleothem database allows us to synthesize the available speleothem records covering terminations. However, speleothem climate signals are encoded in a number of proxies, and unlike proxies in other archives like polar ice cores or marine core benthic foraminiferal oxygen isotope records, the climatic interpretation of a given proxy can vary quite significantly among different regions. In this study, we do the following:
-
synthesize the available speleothem records providing climate information for terminations TII, TIIIA, TIII, TIV and TV;
-
present the records based on the aspect of climate encoded in the available records;
-
examine the effects of different ice volume corrections on the final climate proxy record;
-
evaluate whether there are leads and lags in the manifestation of terminations across different aspects of the climate systems and different regions;
-
suggest directions for future speleothem research covering terminations, speculate on suitable tuning targets among marine and ice core proxies, and discuss what model outputs may be most suitable for comparison.
We find that TII has the greatest number of globally distributed records followed by TIIIA and TIII. The records covering TIV and TV are largely restricted to the East Asian and Southeast Asian monsoon regions. Modelling and data–model comparison studies have greatly increased our understanding of the interpretation of oxygen isotope records across terminations. Ice volume corrections have the most significant impact on European speleothem records, with moisture sourced directly from the North Atlantic region. Within each termination, a sequence of events can be established between a subset of events, and this sequence stays largely consistent across terminations. However, improvements in dating and age-model uncertainties, higher-resolution records and multi-proxy approaches are required to establish sequences within each subset of events. Beyond further research on targeted speleothem records, our recommendations for future directions include focusing on TII as a useful next target to understand climate dynamics, isotope-enabled transient simulations for better characterization of the other terminations and development of marine proxy records with signals common to speleothems to further improve the chronology of terminations.
- Article
(5359 KB) - Full-text XML
-
Supplement
(1487 KB) - BibTeX
- EndNote


Glacial terminations represent the largest-amplitude climate changes of the last several million years (Brook and Buizert, 2018; Cheng et al., 2009, 2016a). Over a ∼10 kyr (10 kiloyears or 10 000 years) timescale, large Northern Hemisphere ice sheets retreat (e.g. Carlson and Winsor, 2012), sea level rises (e.g. Gallup et al., 2002), and atmospheric CO2 (Fischer et al., 1999) and global temperatures make a full transition from glacial to interglacial levels (e.g. Caillon et al., 2003). Many possible orbital-insolation triggers have been described to initiate and sustain glacial terminations, and feedbacks between ice sheet retreat, ocean circulation and ocean carbon storage are invoked to explain the unstoppable progression (Mitsui et al., 2022; Bengtson et al., 2021; Capron et al., 2019, and references therein). Because of the availability of radiocarbon dating and the abundance of paleoclimate records from archives such as marine and ice cores, the most recent termination (TI) has been the most extensively characterized (e.g. Stern and Lisiecki, 2014; Lamy et al., 2007; Denton et al., 2010; Lea et al., 2003; Barker and Knorr, 2021). Yet, it is widely discussed as to whether this sequence of millennial events, their climate feedbacks and rates of change is recurrent over previous terminations or is unique (e.g. Cheng et al., 2009; Barker and Knorr, 2021). Beyond the limit of radiocarbon dating, the chronologies of climate records from ice cores, deep ocean and lake sediments are often developed by tuning to orbital parameters, which limits their use in understanding climate dynamics, particularly the response of the climate system to orbital forcing and the rates of response in the climate system (e.g. Lisiecki and Raymo, 2007; Raymo et al., 2006; Kawamura et al., 2007).
Speleothems provide absolute age control and high-resolution proxy measurements, with speleothems from a few cave regions covering multiple terminations (e.g. Cheng et al., 2009, 2016a). In addition, the emerging field of band-counting speleothem confocal layers provides precise estimates of rates and durations in some settings (e.g. Stoll et al., 2022; Dong et al., 2022). The speleothem archive therefore provides unique records of climate change across terminations and, additionally, may provide the opportunity to tune the chronology of ice and marine core archives. In order to do this, proxies for a common climate parameter or forcing have to be identified in both the speleothem and the marine/ice core records. For example, over TII, previous efforts have proposed a common regional sea surface temperature signal in marine records and a rainfall amount signal in speleothem δ18O in western Italy (Drysdale et al., 2009) or a common surface ocean freshwater signal in surface ocean δ18O or and speleothem δ18O (Grant et al., 2012; Stoll et al., 2022). Long-distance correlations between North Atlantic ice-rafted debris events and δ18O anomalies in East Asian speleothem records have been proposed to tune North Atlantic marine records (e.g. Lisiecki and Stern, 2016; Hobart et al., 2023). While such tuning approaches are promising, confidently applying speleothem chronologies to multiple terminations and millennial events during terminations requires robust proxy interpretations across multiple archives. Ideally, modelling studies would point to common drivers of proxy variability.
A challenge in speleothem records is that unlike proxies in other archives like marine core benthic foraminiferal oxygen isotopes or polar ice cores, the climatic interpretation of a given proxy can vary quite significantly among different regions. δ18O is the most ubiquitously measured and interpreted proxy in speleothems. In addition to δ18O, speleothem climate signals are encoded in a number of other proxies like δ13C and trace element ratios of and . Speleothem δ18O records a very diverse set of climate influences in different environments, including freshening of adjacent water bodies constituting the moisture source in the North Iberian and Black Sea regions (e.g. Stoll et al., 2022; Badertscher et al., 2011), change in the dominant source of moisture in Northern Europe and North America (e.g. Cheng et al., 2016b, 2019), and change in temperatures in high-altitude sites of Northern Europe and North America (e.g. Koltai et al., 2017; Lachniet et al., 2014), as well as aspects of the hydrological cycle including monsoon processes in Asia and South America (e.g. Cheng et al., 2013; Kathayat et al., 2016). Speleothem carbon isotopes are measured together with oxygen isotopes but are published less often and can have ambiguous interpretations but, in non-water-limited mid-latitude regions, may dominantly reflect temperature (Genty et al., 2001; Lechleitner et al., 2021; Stoll et al., 2023). In addition, the speleothem trace element proxy “tool-box” has seen rapid evolution over the last two decades and provides valuable ways of independently reconstructing past climate and environmental parameters, as well as increasing our understanding of the signals encoded in the measured oxygen and carbon isotopes (Fairchild and Treble, 2009). For example, speleothem δ13C values can further be impacted by the process of “degassing” in the karst voids and the cave environment prior to the drip precipitating on the surface of the stalagmite (Fairchild et al., 2000). This is called prior calcite precipitation, and the speleothem trace element proxy can be used to estimate the impact of prior calcite precipitation on speleothem δ13C to reconstruct the temperature-sensitive “initial” (“corrected”) δ13C of dripwaters (Stoll et al., 2023).
There has been an ongoing discussion in the community that speleothem records with their chronological powers and ubiquitously measured high-resolution δ18O proxy measurements would be able to provide a more evolved understanding of the manifestation of terminations in terrestrial regions that are not covered by the more typical termination records from marine and ice cores. In addition, the strength of the speleothem chronology could be extended to the marine and ice core records to better track forcings and responses during terminations across the global climate system. However, so far, there has not been a systematic review of which speleothem records are available, their age control or our current understanding of their climatic interpretations. There has also not been a targeted identification of gaps or most fruitful directions of future research to increase our understanding of terminations using this speleothem-based approach. The Past Global Changes – Speleothem Isotope Synthesis and AnaLysis, i.e. PAGES-SISAL, global speleothem database versions developed by the PAGES-SISAL working group (Atsawawaranunt et al., 2018a, b, 2019; Comas-Bru et al., 2019, 2020b, a; Kaushal et al., 2024b, a) allow us to easily, and more objectively, perform such a review.
In this review paper we identify how currently available speleothem records constrain the timing of climate events across different regions within a given termination and describe the similarities and differences in the sequences of a processes across different terminations. We focus on the available speleothem records providing high-resolution climate information for terminations TII, TIIIA, TIII, TIV and TV. We first describe the aspect of the climate system encoded in records from different regions and systems. For some records in which the ice volume effect on seawater δ18O is a significant portion of the signal, we examine the options and effects of different ice volume corrections on the final climate proxy record. Then, for each termination, we evaluate whether there are consistent leads and lags in the manifestation of terminations across different aspects of the climate systems and different regions as tracked by speleothem proxy records. We briefly compare the sequence of events across the different terminations. And finally, considering the most up-to-date interpretation of what climate signals are encoded by speleothem proxies in different regions, we propose future directions for speleothem records covering terminations, briefly speculate on suitable tuning targets among marine and ice core proxies, and discuss what model outputs may be most suitable for comparison.
2.1 Criteria and compilation of records
Nearly all the speleothem records for this study have been taken from the latest PAGES-SISAL database version 3, i.e. the SISALv3 database (Kaushal et al., 2024a, b). Since this terminations project was undertaken parallel to building the SISALv3 database, a special effort was made to ensure that records covering terminations have been added to the database from publications and repositories. Only single speleothem records have been used. We have not used any composite records in the main analysis, although we show these records in the Supplement. Composite records and stacks have been known to increase the robustness of records by strengthening regional signals versus drip-site specific noise and by expanding chronological control (e.g. Bajo et al., 2020; Fohlmeister, 2012; Koltai et al., 2017). We elected to use single records for analysis because they gave us more information on age control and measured δ18O values, without having to account for modifications made to either during the process of creating composites.
Once SISALv3 was built, a search was made of SISALv3 for records covering the periods of interest, which generally follow past work on terminations by Cheng et al. (2009) and Cheng et al. (2016a), encompassing TII (140 to 120 kyr BP (where kyr stands for kiloyears or 1000 years)), TIIIA (230 to 210 kyr BP), TIII (258 to 238 kyr BP), TIV (350 to 330 kyr BP) and TV (440 to 420 kyr BP).
In representing records graphically, we first illustrate the caloric summer half-year insolation for each termination following (Tzedakis et al., 2017), and then we arrange the speleothem records in a series of geographical regions, namely, South Europe, North Europe, North America, Central Asia, Indian Summer Monsoon (ISM), East Asian Summer Monsoon (EASM), Southeast Asian Monsoon (SE Asia) and South American Monsoon. Rather than strict latitude-longitude boundaries, these geographical regions have been divided based on the dominant control on speleothem oxygen isotopes within loose latitude–longitude boundaries. South Europe (and the Middle East) includes records with the δ18O signal dominated by surface ocean δ18O or the hydrological balance, contrasting with North Europe, which mainly includes the alpine records with strong temperature dependency of meteoric precipitation on oxygen isotopes. North American Lehman cave oxygen isotopes similarly record temperature dependency of meteoric precipitation, while the Buckeye Creek cave records encode information on the dominant season (source) of precipitation that varies between glacial and interglacial times. The Central Asian records are located far inland and are influenced by the Westerlies and record supra-regional atmospheric circulation changes. The monsoon records in the ISM, EASM, SE Asian and South American regions are largely driven by Rayleigh distillation effects. Section 3 covers the interpretation of oxygen isotopes in further detail. For European records, for which robust carbon isotope interpretations are available and provide additional information on terminations, we also discuss the δ13C and records. While δ18O and δ13C provide information on the timing of temperature changes, absolute temperature change can only be reconstructed from other proxies such as fluid inclusion δ2H, calcite–water δ18O with fluid inclusion and calcite δ18O, TEX86, and (dual) clumped isotopes. Such proxy records are few in number, of lower resolution and not yet included in the SISAL database versions. These records are only briefly summarized in Sect. 3.3.
All records covering the periods of interest and within each geographical region were plotted and examined. Sub-aqueous speleothems have not been considered further due to several additional complexities including the added uncertainty in their U–Th age control stemming from higher chronological errors and low resolution resulting from slow growth rates, which do not meet the resolution criteria we applied for record selection (namely the Devil's Hole records and one of the Corchia cave records). Among the remaining records, the main paper map (Fig. 1), time series plots (Fig. 2) and table (Table 1) prioritize the records that cover the longest time period, with the highest sampling resolution, with the largest number of U–Th dates and with the lowest errors in age–depth models covering the period of interest. The different criteria listed above have been taken on balance, and records that may be nearly as good have been given in the figures and table in the Supplement. Remaining records that very partially cover the period of interest and/or are of very low resolution in a way that they give no additional information on the termination have not been considered further within the main paper, although a few records have been plotted in the Supplement (Fig. S1 and Table S1). Where author-generated age–depth models have uncertainty measurements, these have been preferred. Where author-generated age–depth model uncertainties are not available in SISALv3, then SISAL generated age–depth models in COPRA/Bchron/Bacon (in that order) have been used. Composite records such as Soreq_composite and PEK_composite do not have individual stalagmite information and author-generated age–depth model uncertainties in SISALv3, and these cannot be generated by automated scripts typically used by the SISAL working group. Such composite records have been shown in the figures in the Supplement. Although the SISAL working group has made an effort to provide standardized age–depth chronologies for all speleothems in the database, not all speleothems produced realizations for all age–depth models (further details can be found in the related publications; see Amirnezhad-Mozhdehi and Comas-Bru, 2019; Comas-Bru et al., 2020b; Rehfeld et al., 2020; Rehfeld and Bühler, 2024). In one case, the SE Asian Green Cathedral cave record (namely Meckler et al., 2012), the age-depth model has been requested directly from the author, since this record proved to be challenging for dating, does not have author-generated age uncertainties in SISALv3 and is not amenable for standardized age–depth model creation. The SE Asian Abadi cave record was published after the SISALv3 database was closed for submissions and has been added directly to this study. The Sanbao cave SB11 record δ18O data points between 228–226 kyr BP have been added from NCEI-NOAA; the remaining data points are taken from SISALv3. All speleothems considered in this study, other than the Crovassa Azzurra record, are composed of calcite. Crovassa Azzurra has a mixed mineralogy (dominantly composed of aragonite), where the mineralogy of each oxygen isotopic sub-sample has been provided in SISALv3, the stalagmite from this cave has been plotted in the Supplement and no change has been made to the oxygen isotopic measurement in response to the change in mineralogy. Under equilibrium conditions, aragonite is calculated to have δ18O values that are 0.8 ‰ more enriched than calcite at 25 °C (Fohlmeister et al., 2018; Kim et al., 2007).
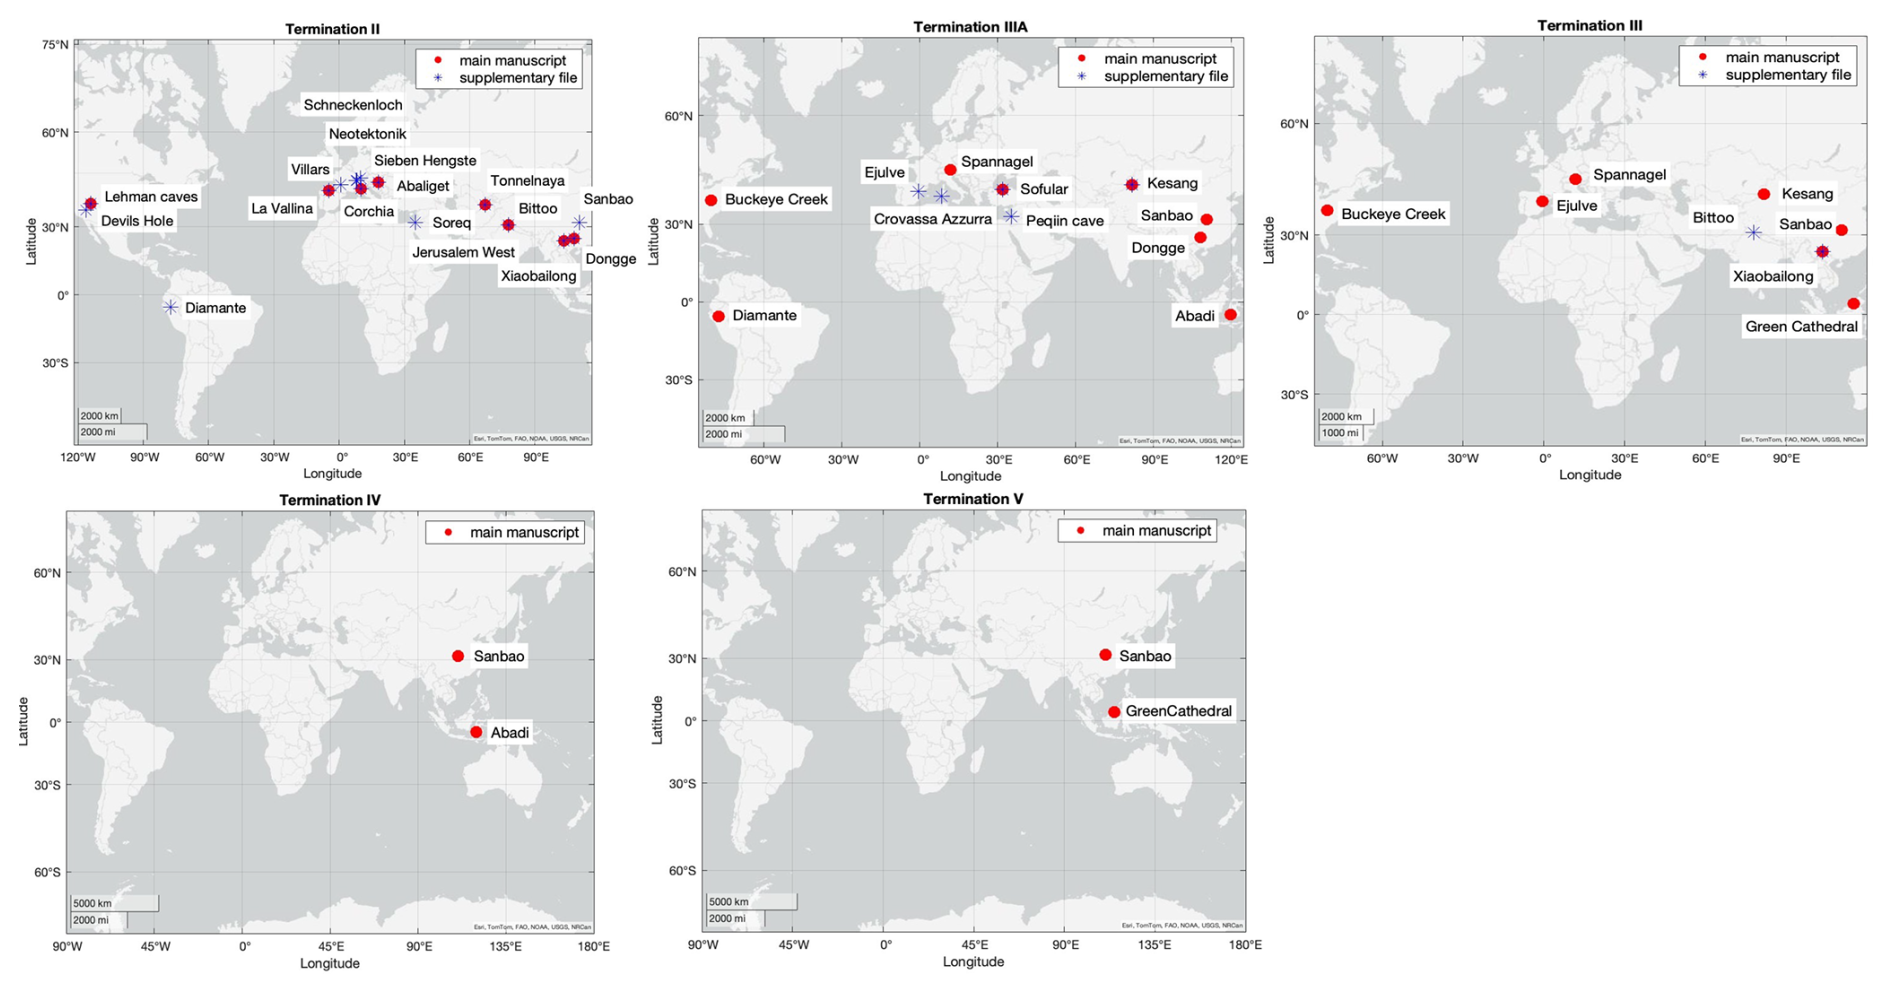
Figure 1Maps showing locations of cave sites with speleothem records covering terminations II, IIIA, III, IV and V respectively. Map created using Natural Earth. Cave locations whose entities have been predominantly referred to in the main paper are marked with red markers and are described further in Table 1, and their time series have been plotted in Fig. 2. Entities that were not analysed as a part of the main paper since they only partially cover terminations or have lower resolution or U–Th dates with larger errors than the records used in the main paper are plotted with blue asterisks and shown in Fig. S1, and time series are plotted in Fig. S2.
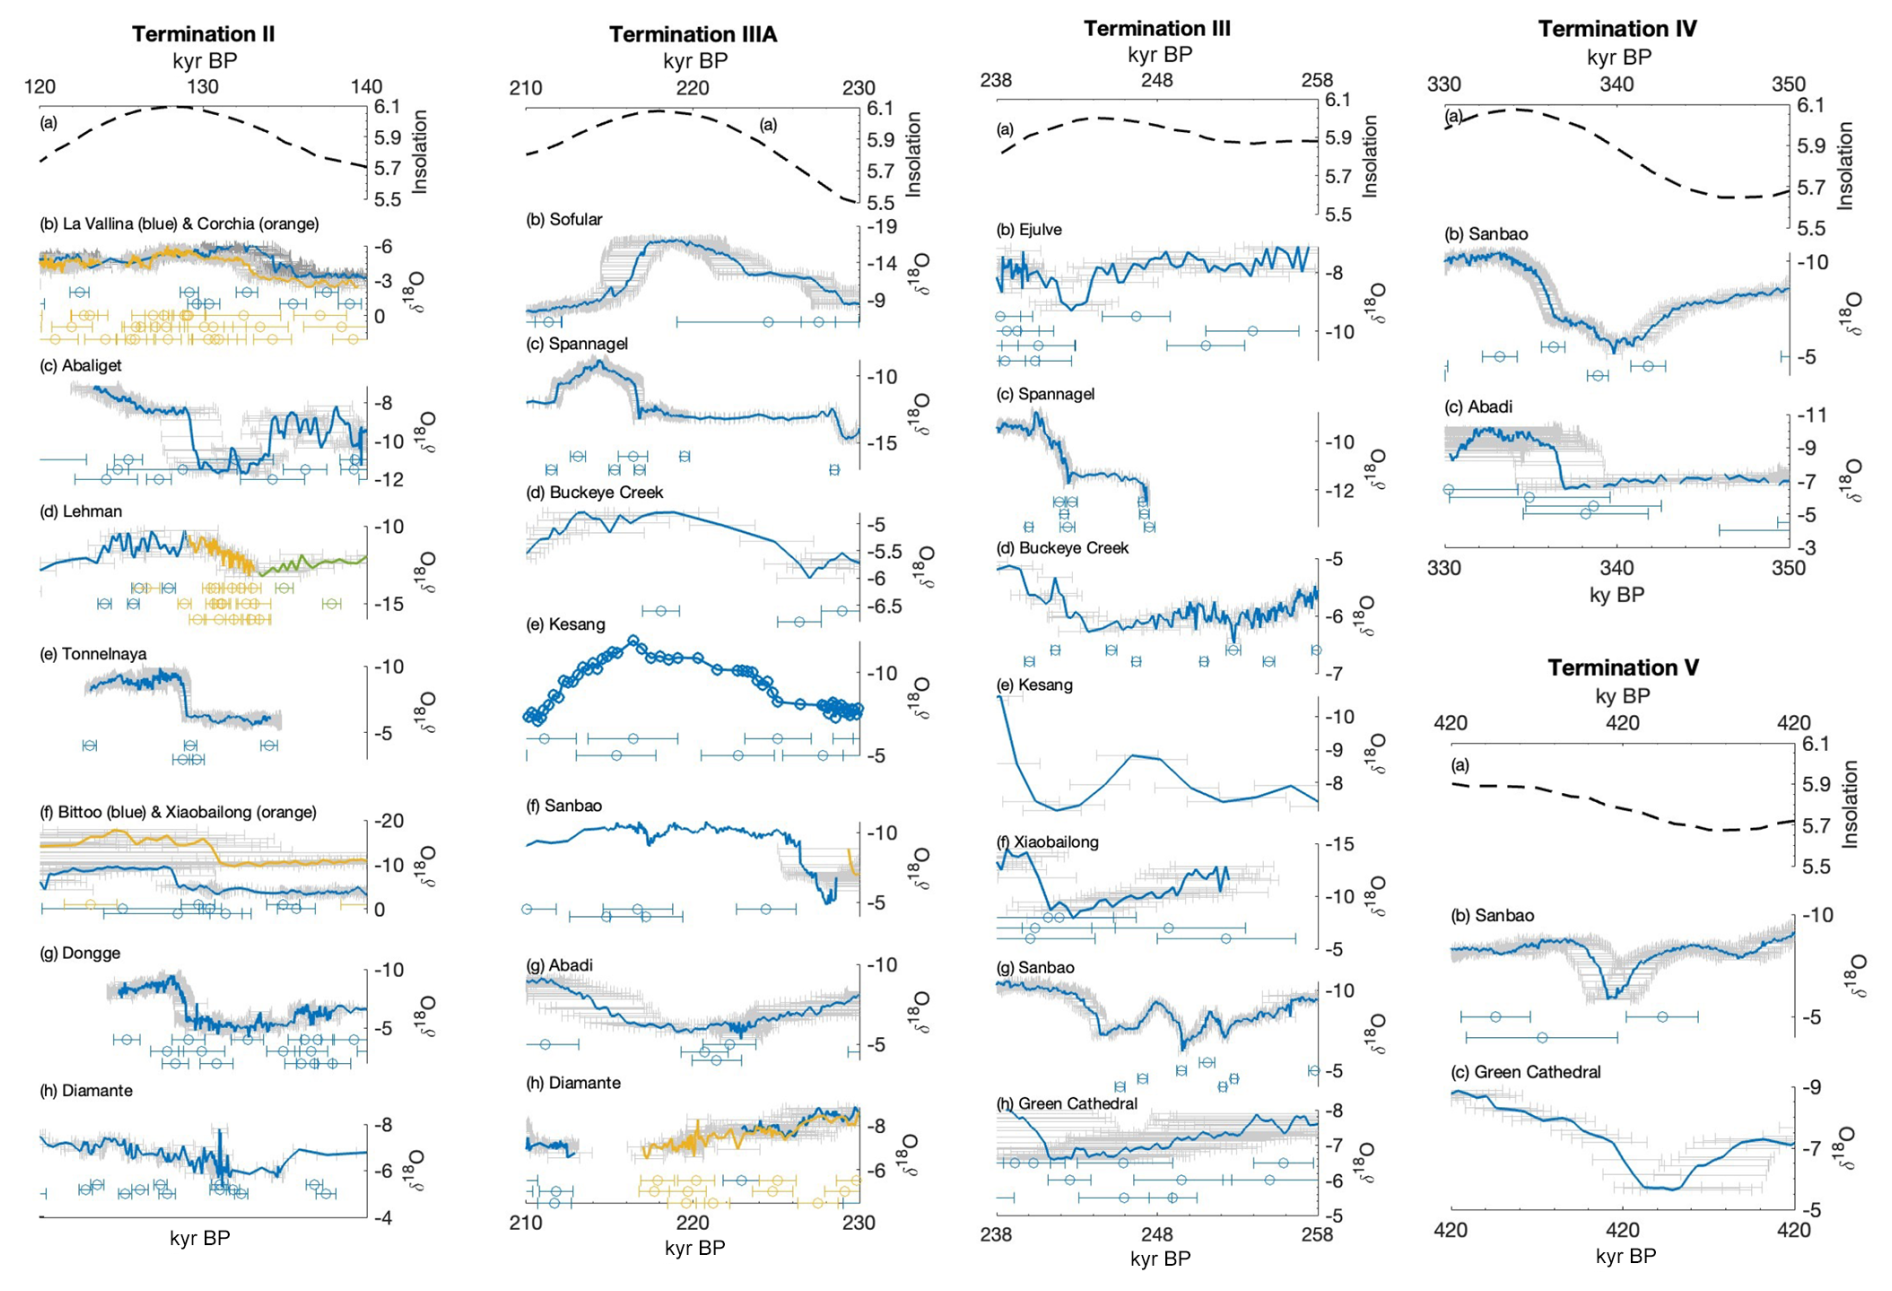
Figure 2Ages covering terminations in kiloyears before 1950 (kyr BP) are plotted against oxygen isotopic measurements (in ‰). The direction of the y axis for each figure has been selected so that up points to warmer or wetter climates. Age–depth model uncertainties where available are plotted as grey shading on the proxy plots. U–Th dates and dating uncertainties have been plotted below the proxy plots. Insolation curves in W m−2 are plotted in subfigures (a) of each of the termination figures and are the summer half-year caloric insolation as provided in Tzedakis et al. (2017). This metric for insolation was selected because it accounts for the effect of both precession and obliquity on northern latitude insolation. Cave sites are shown in maps in Fig. 1 and further record information can be found in Table 1. The climatic signals encoded in the proxies are summarized here: Termination II (b) La Vallina: South Europe freshening, Corchia: Europe precipitation, (c) Abaliget: Europe temperature, (d) Lehman: North American temperature, (e) Tonnelnaya: Central Asian Westerlies-driven winter precipitation, (f) Bittoo and Xiaobailong: Indian summer monsoon, (g) Dongge: East Asian summer monsoon, (h) Diamante: South American monsoon; Termination IIIA (b) Sofular: Black Sea freshening, (c) Spannagel: Europe temperature, (d) Buckeye Creek: North American precipitation season, (e) Kesang: Central Asian Westerlies summer precipitation, (f) Dongge and Sanbao: East Asian summer monsoon, (g) Abadi: Southeast Asian monsoon, (h) Diamante: South American monsoon; Termination III (b) Ejulve: South Europe temperature, (c) Spannagel: North Europe temperature, (d) Buckeye Creek: North American precipitation season, (e) Kesang: Central Asian Westerlies summer precipitation, (f) Xiaobailong: Indian summer monsoon, (g) Sanbao: East Asian summer monsoon, (h) Green Cathedral: Southeast Asian monsoon; Termination IV (b) Sanbao: East Asian summer monsoon, (c) Abadi: Southeast Asian monsoon; Termination V (b) Sanbao: East Asian summer monsoon, (c) Green Cathedral: Southeast Asian monsoon. Entities that were not analysed as a part of the main paper since they only partially cover terminations or have lower resolution or U–Th dates with larger errors than the records used in the main paper are shown in Fig. S2.
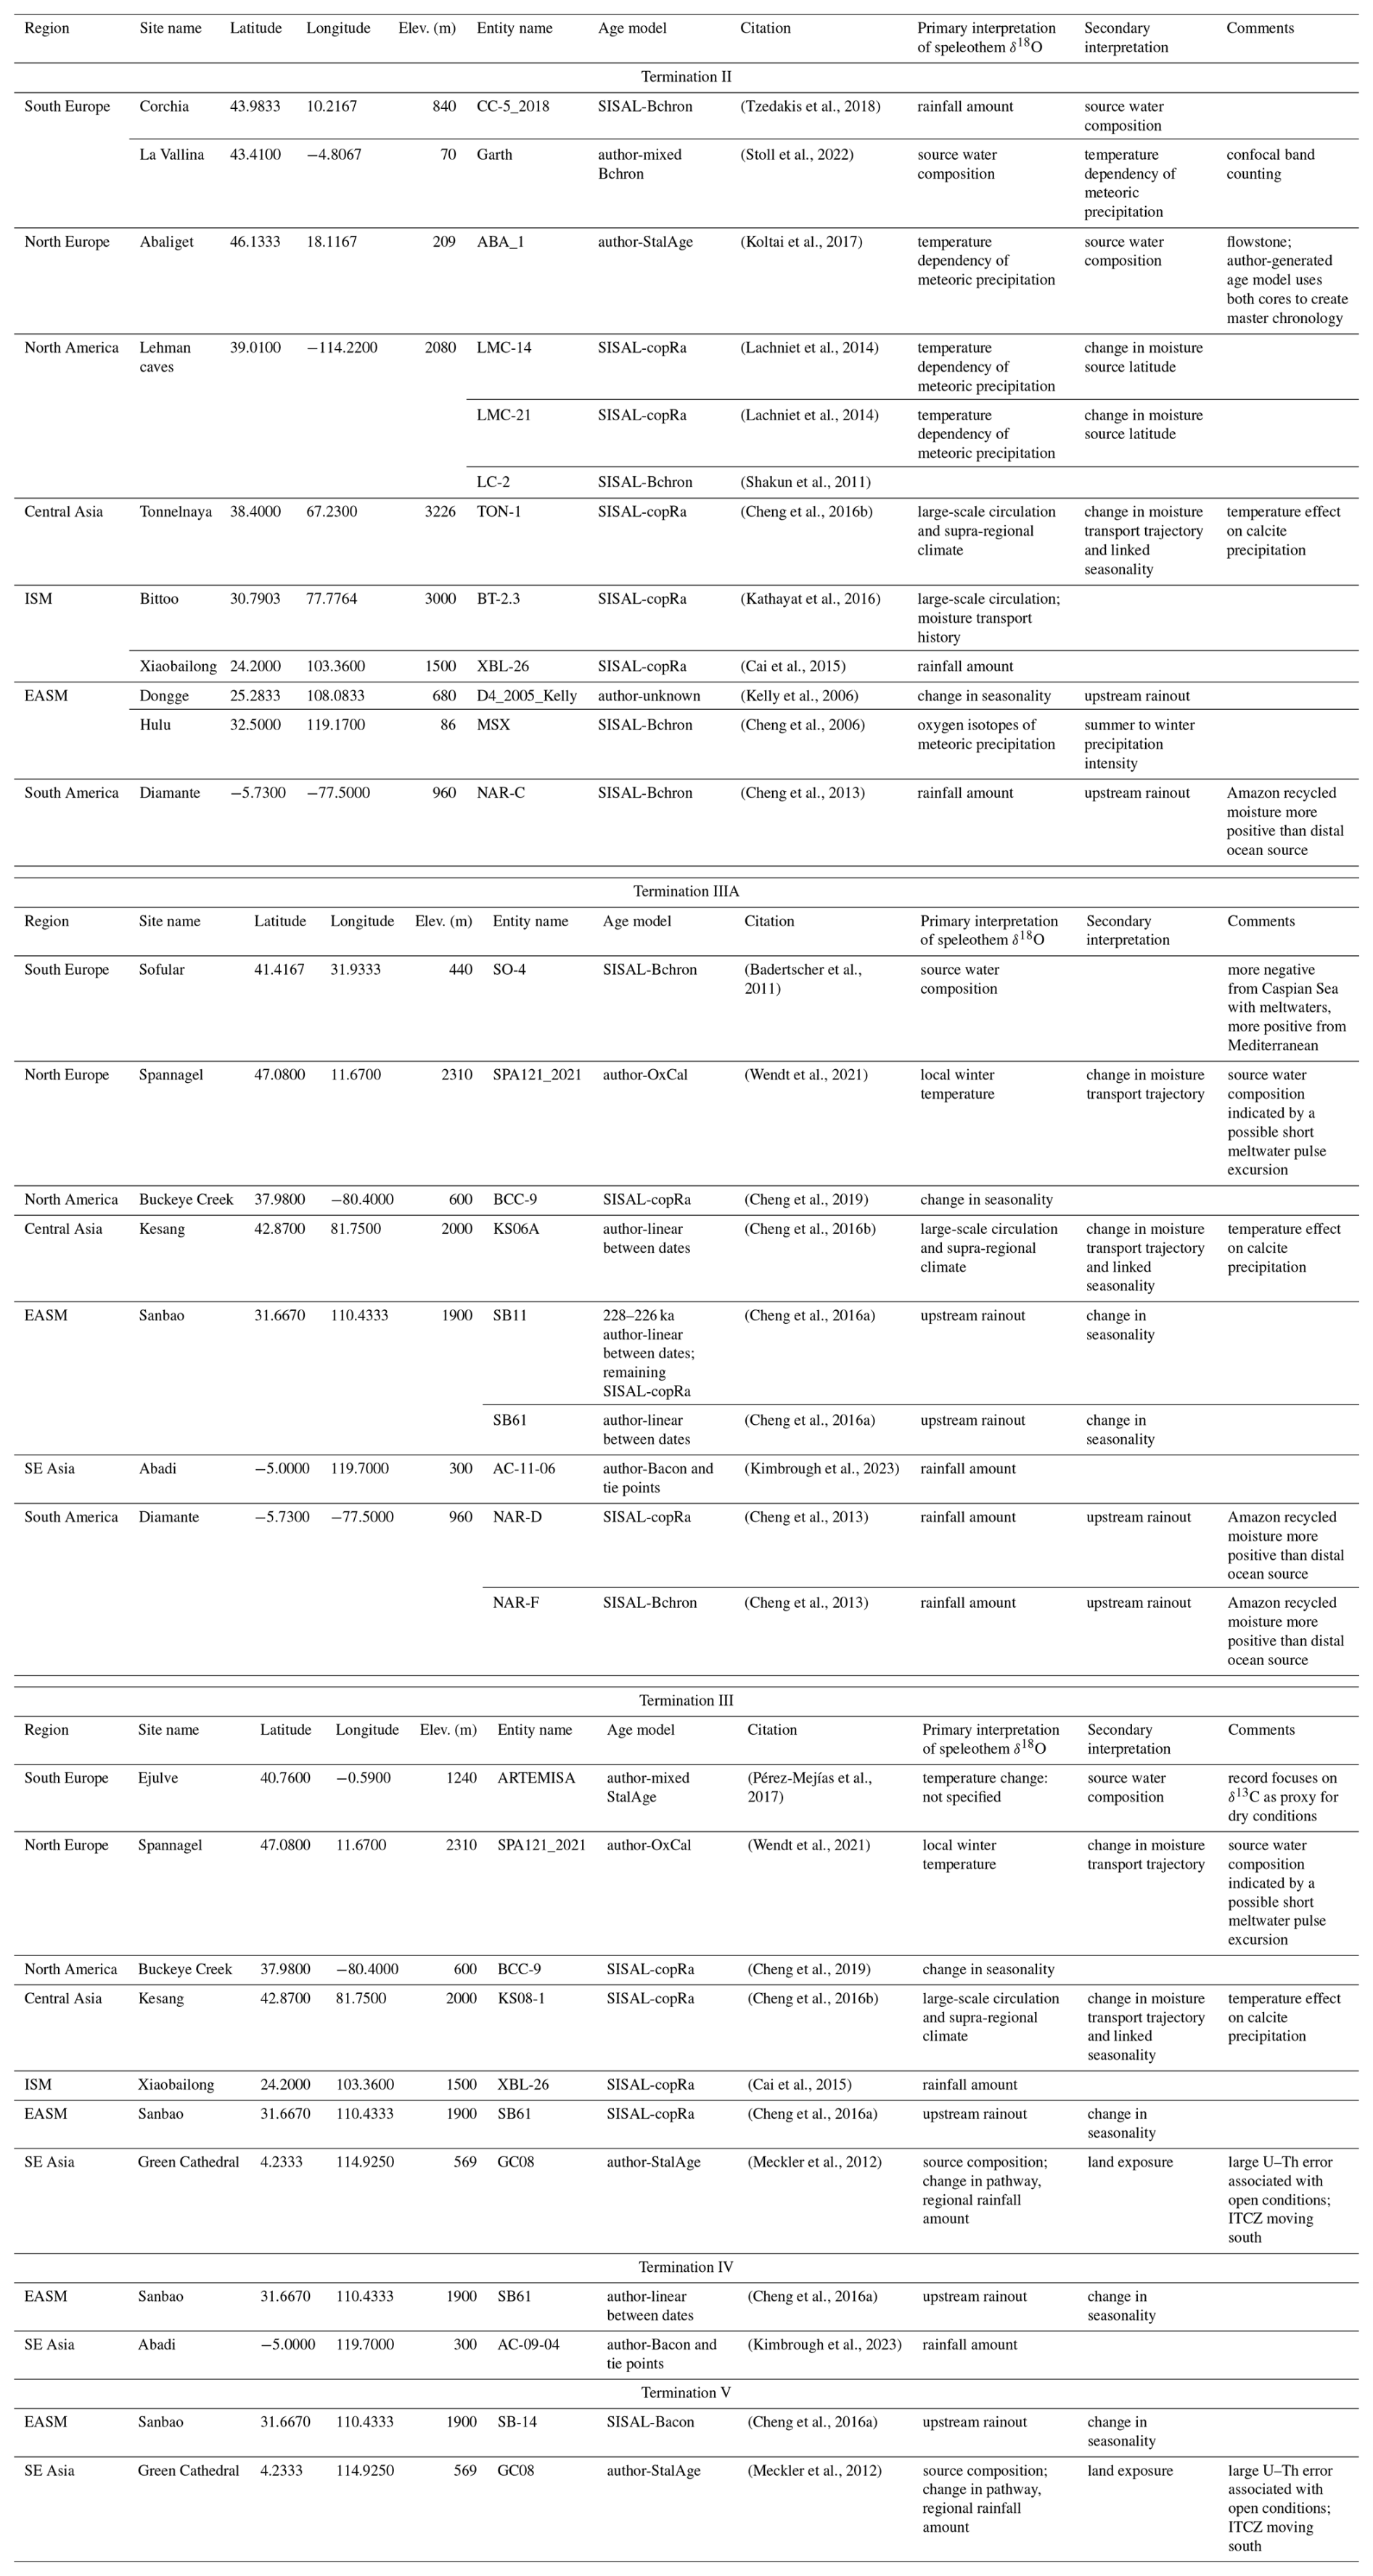
Table 1Information of speleothem entities primarily referring to speleothem δ18O that are plotted in Fig. 1 (maps) and Fig. 2 (time series). Information of entities that only partially cover terminations or have lower resolution or U–Th dates with larger errors than the records used in the main paper is provided in Table S1 and corresponding figures (Figs. S2 and S3).
The timing of change has been given based on the age value of the last measured sample point before the change occurs. The duration has been measured as the difference between the age values of two such sample points marking changes. The amplitude of change has been approximated as the peak anomaly on the proxy axis from a baseline proxy value, which is the value prior to the start of the termination event.
2.2 Accounting for ice volume effects in speleothem oxygen isotope records
The shrinking of global ice sheets across glacial terminations leads to the release of the isotopically negative freshwater in ice sheets back into the ocean, leading to a negative shift in the average estimated at 1 ‰–1.3 ‰ (Adkins et al., 2002; Duplessy et al., 2002; Schrag et al., 1996, 2002). Most of the glacial meltwater during terminations is released by North Atlantic ice sheets directly into the surface North Atlantic Ocean and adjacent marginal seas and is subsequently mixed into the deep North Atlantic by convection and circulated throughout the global surface and deep ocean (Jackson and Wood, 2018). Radiocarbon tracers and modelling of the last deglaciation suggest the deglacial signal reaches the deep and surface Pacific Ocean with a 1–3 kyr lag (Duplessy et al., 1991).
Because the surface ocean is the ultimate source for all water precipitated on land and infiltrating in caves, this change in the initial isotopic composition of the surface ocean during glacial terminations is transferred to the dripwater and precipitated stalagmites (e.g. Stoll et al., 2022). In some regions, other sources of δ18O variability significantly exceed the magnitude of the global ice volume effect, and it can be neglected for interpretation. However, the ice volume component can be a significant component of the δ18O variation in some speleothem records, and it can be helpful to isolate the non-ice-volume components to clarify interpretations. Therefore, we explore the consequences and uncertainties surrounding the ice volume correction.
In order to examine the effects of this ice volume change on speleothem δ18O termination records, a value of 0.00833 ‰ m−1 of relative sea level has been used to calculate the global average change in with the progressive melting of ice sheets (Adkins et al., 2002; Elderfield et al., 2012; Shakun et al., 2015). For TII through TV, past sea level estimations are used from two types of sources. In one source type, the sea level component has been estimated from benthic δ18O, and its chronology is based on orbital tuning; for this type, we employ the long-duration curve of Spratt and Lisiecki (2016) for all terminations. The Spratt and Lisiecki solution is proposed to have an uncertainty of 4 kyr in the Late Pleistocene. As a second source type, we also employ a sea level curve derived from the sensitivity of Red Sea salinity to the water depth at the sill where inflow occurs. The Red Sea sea level features a chronology tuned by correlating millennial dust events in the Red Sea to δ18O anomalies in East Asian monsoon speleothem records (Grant et al., 2014). These two records exhibit some differences in the amplitude and timing of sea level rise during glacial terminations (Fig. S2 in the Supplement). A further benthic δ18O-derived curve (Waelbroeck et al., 2002) has a lower resolution than the other curves and is shown in Fig. S2 but not used for correction of the speleothem records. We employ the uncertainties from the original authors, which define a range of sea levels for a given age. Thus, “ice-volume-corrected” speleothem δ18O records have an additional uncertainty in the isotope trend due to the uncertainties of the chronology from the ice volume curve.
In addition to the globally distributed ice volume effect, changes in regional hydrological balance of evaporation over precipitation may generate additional increases or decreases in the of the surface ocean. For example, over the last glacial termination, paired and measurements indicate that the of the surface North Atlantic Ocean experienced a larger-amplitude change than the global average ocean (Waelbroeck et al., 2014). Additionally, during the early stages of deglaciation the of the North Atlantic changes much more than the global surface ocean because the North Atlantic directly receives meltwater from Northern Hemisphere ice sheets. For inland European speleothems in which the δ18O signal is interpreted as the temperature record, and for which precipitation has a North Atlantic moisture source, it is ideal to correct for the full regional change in source water in order to deconvolve this effect from the temperature signal. At present this is possible for TII by subtracting the δ18O from a coastal North Iberian Speleothem Archive (NISA) record, whose signal is dominated by the regional evolution of of the North Atlantic (see Stoll et al., 2022). In other regions, paired foraminiferal and measurements indicate that variation in the may be larger or smaller than the globally averaged ice volume effect (Waelbroeck et al., 2014), depending on factors such as the Intertropical Convergence Zone (ITCZ) position. We do not explicitly adjust for these variations since they generally amplify, rather than obscure, the hydrological signal present in the stalagmite δ18O.
Wherever correction for changing is implemented, the speleothem data have been binned to 1, 0.250 and 0.125 kyr respectively to accommodate uncertainties in chronology (Fig. S3 in the Supplement). The change in as a result of freshening has simply been subtracted from the speleothem δ18O in these bins. Since the uncertainty on sea level curves is much greater than the uncertainty on speleothem age–depth models, only the uncertainty on sea level curves has been considered in these plots. The “ice-volume-corrected” Termination II Abaliget (ABA_1), Sieben Hengste (7H-12), Schneckenloch (SCH-5) and Corchia (CC-5_2018) cave records have been used for further interpretation in the main paper, and the corrected records are indicated by the y-axis label “” in the figures. The absence of an equivalent absolute dated record of North Atlantic evolution in prior terminations precludes regional correction of temperature equivalent European records in TIII or older at this time; instead the global ice volume correction has been applied to these records (Fig. S3).
2.3 Degassing corrections for speleothem-carbon-isotope-based temperature records
The speleothem δ13C record from some mid-latitude regions can also be used for temperature reconstructions (e.g. Held et al., 2024). The temperature sensitivity is well documented over TI, where in coastal Northwest Iberia the NISA δ13C records vary inversely with regional temperature records from marine archives (Stoll et al., 2023). Multiproxy process modelling suggests that the correlation arises because higher temperatures increase vegetation productivity in this region, enhancing soil CO2 production as well as an oversupply of CO2 to karst waters, both of which result in more negative speleothem δ13C values (Lechleitner et al., 2021; Stoll et al., 2022, 2023). Speleothem δ13C values can further be impacted by the process of “degassing” in the karst and the cave environment prior to the drip precipitating on the surface of the stalagmite (Johnson et al., 2006; Lechleitner et al., 2021). This is called prior calcite precipitation (PCP) (Fairchild et al., 2000). Variations in the extent of PCP during the growth of a speleothem can alter the trends in the speleothem δ13C. Fortunately, the speleothem ratio can be used to quantify changes in the fraction of dripwater Ca which has been lost to PCP within a given speleothem. For example, intervals of high ratio imply a more significant Ca loss and PCP, entailing a positive shift in the speleothem δ13C. Using speleothem , it is now possible to quantitatively remove the impact of variable PCP on speleothem δ13C time series to reconstruct the temperature-sensitive initial variations in δ13C of dripwaters (Stoll et al., 2023). Since the δ13C of dripwater acquired through the equilibration of rainwater with soil gas and bedrock dissolution is what encodes the temperature signal and is of primary interest to us, here we “correct” for the additional karst and in-cave influence of degassing and PCP on the δ13C value by plotting the for select records (Genty et al., 2003, 2006) (Fig. S4 in the Supplement). Further method details can be found in Stoll et al. (2023). The Termination II La Vallina cave Garth speleothem record and the Termination III Ejulve cave ARTEMISA speleothem record δ13C records have been discussed in the paper. These are indicated by the y-axis label “” in the figures.
We review the climatic processes which are encoded in oxygen isotopic ratios of speleothems from different regions.
3.1 Records of surface ocean freshening
Changes in the of the moisture source for caves and dripwaters may be the dominant signal in speleothem δ18O in some settings. The δ18O in speleothems from coastal caves in Northwest Spain (NISA) is dominantly controlled by the of the eastern North Atlantic, as documented in comparison with independently dated records from foraminifera over TI (Stoll et al., 2022). Rainfall monitoring at this cave location shows that the slight decrease in rainfall δ18O with decreasing temperature appears to be of similar magnitude but opposite in sign to the temperature-dependent fractionation between dripwater and calcite, leaving the of the North Atlantic Ocean as the main signal expressed by the speleothems (Stoll et al., 2015, 2022). Because of its proximity to the source of meltwater release, the of the surface ocean in the North Atlantic experiences a higher-amplitude change in across a glacial cycle and may record transient millennial-scale events in the . Over TII, NISA speleothems provide a record of the timing of deglacial freshening of the eastern North Atlantic with a δ18O amplitude of ∼2.5 ‰. Other coastal caves on the Atlantic margin, such as Villars Cave (Fig. S1), may also be dominated by the change in isotopic composition of the North Atlantic.
Similarly, the δ18O in speleothems from Sofular Cave, bordering the Black Sea in northern Türkiye, is inferred to be most strongly influenced by the of the Black Sea surface waters. The Black Sea is proposed to receive direct meltwater runoff from the Southern Margin of the Eurasian ice sheet, leading to depleted surface water δ18O during periods of Eurasian ice sheet retreat with up to 10 ‰ freshening signal in the surface of the Black Sea (Held et al., 2024; Wegwerth et al., 2019).
In addition to ice volume meltwater effects, in some settings, changes in rainfall patterns may also lead to changes in the of the surface ocean moisture source. Increased local or regional precipitation relative to evaporation may lead to freshening and more negative of surface waters. This effect may potentially augment the tendency for hydrological fractionation to generate more negative rainfall δ18O with higher rainfall amounts (e.g. Breitenbach et al., 2010).
3.2 Temperature-sensitive records from speleothem carbonate oxygen and carbon isotopes
The δ18O of precipitation decreases appreciably by Rayleigh distillation with progressive rainout as moisture-laden air masses move inland and to higher altitudes (Alley and Cuffey, 2018; Dansgaard, 1954, 1964). Colder temperatures both increase the fractionation and accelerate rainout, so colder temperatures lead to decrease in the precipitation δ18O at inland, high-altitude and high-latitude locations in regions with mean annual temperatures lower than about 10 °C (Denton et al., 2005; Harmon et al., 1979; Rozanski et al., 2013). Speleothem δ18O records from these regions provide information on the timing of temperature change but not absolute temperatures.
In the European Alps and Iberian Range, this temperature control on Rayleigh distillation leads to a dominant temperature effect on speleothem δ18O producing anomalies of ∼3 ‰. Consequently, records from central Europe (Sieben Hengste, Schneckenloch, Schafsloch, Holloch im Mahdtal, Abaliget, Spannagel) and the Iberian Range (Ejulve) exhibit the lowest δ18O during coldest temperatures. At the same time, since the North Atlantic is a dominant moisture source for most central European caves (Affolter et al., 2020), the magnitude of regional North Atlantic change over terminations is also imprinted on these records. For TII, we illustrate the signal when this regional component is subtracted from these records using the NISA coastal Iberian record (Fig. S3). In contrast to the original δ18O, which featured an apparent warm signal during TII, then cooling prior to late deglacial warming, the corrected Abaliget record features a stable cold glacial period until the final deglacial warming. The early deglacial warming in the Schneckenloch record is amplified by this correction. We further refer to these regional source-corrected trends in Sect. 4.1. The temperature-sensitive La Vallina cave Garth record from the NISA coastal Iberian record supports a two-step warming (135 and 129 ka respectively), where the older warming step has no corresponding data from the corrected Abaliget record, but the younger warming step lines up with the Abaliget record (Fig. 4). The absence of an equivalent absolute dated record of North Atlantic evolution in prior terminations precludes regional correction of temperature equivalent European records in TIII or older at this time; instead the global ice volume correction has been applied to these records. Similar to TII, the TIII Ejulve cave temperature-sensitive record from the Iberian region extends the available temperature data for this termination from Europe (Fig. 4). Where multiple ocean moisture sources with different rainout extents contribute to precipitation over a cave site, changes in the relative significance of the two moisture sources may influence the δ18O of precipitation in addition to the temperature control. This has been proposed for the joint Mediterranean and Atlantic sources to the Iberian Range cave systems (Pérez-Mejías et al., 2017).
In western North America, the δ18O record of Lehman caves (Nevada) is also most sensitive to regional temperatures producing a δ18O anomaly of ∼2 ‰ (Fig. 4). Isotope-enabled general circulation model (GCM) simulations of precipitation δ18O at the Last Glacial Maximum (LGM) and the preindustrial period reveal a net decrease in inland at the LGM, compensating for higher glacial δ18O of surface seawater. This is dominantly due to greater rainout from stronger uplift and cooling, with a secondary effect of greater cool-season precipitation influenced by ice sheet topography and cooling of Pacific sea surface temperatures (Tabor et al., 2021). Given the Pacific moisture source, the global ice volume correction is the relevant one for accounting for isotopic changes in the ocean moisture source region, but this correction has minimal effect on the trends.
3.3 Other temperature records
Fluid inclusion hydrogen and oxygen isotopes; clumped isotope thermometry; ratios of glycerol dialkyl glycerol tetraethers (GDGTs), such as TEX86; noble gas content; and homogenization of fluid inclusions all have been employed for temperature reconstructions. Calibrations to absolute temperature exist for these methods based on modern observations. However, the larger sample sizes and/or more challenging analytical routines mean fewer data points can be measured, which often additionally have reasonably large errors, and the data from these proxies are not yet available in the SISAL speleothem database versions. Consequently, these records have been synthesized in a map (Fig. 3) and a table (Table 2) rather than plotting on time series axes.
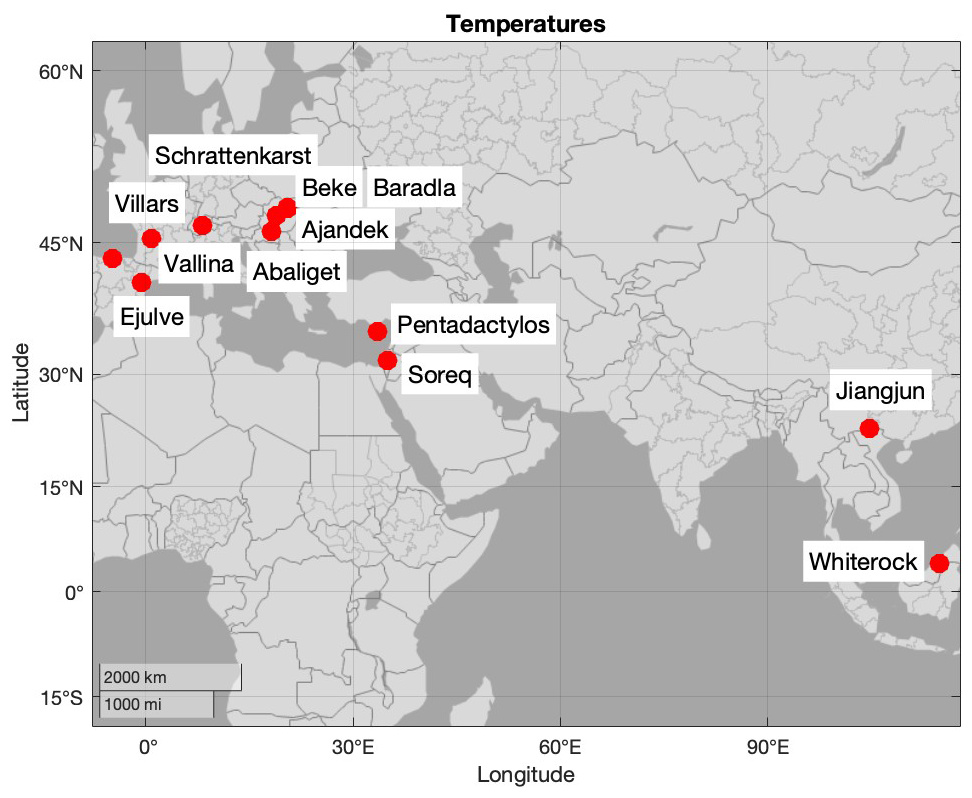
Figure 3Map showing locations of cave sites with speleothem temperature records covering terminations using methods such as degassing corrected δ13C; fluid inclusion hydrogen and oxygen isotopes; clumped isotope thermometry; ratios of glycerol dialkyl glycerol tetraethers (GDGTs) such as TEX86; noble gas content; and homogenization of fluid inclusions. Further record information can be found in Table 2.
Table 2Table giving information on speleothem temperature records covering terminations using methods such as fluid inclusion hydrogen and oxygen isotopes; clumped isotope thermometry; ratios of glycerol dialkyl glycerol tetraethers (GDGTs), such as TEX86; noble gas content; and homogenization of fluid inclusions. Cave locations are shown in Fig. 3.
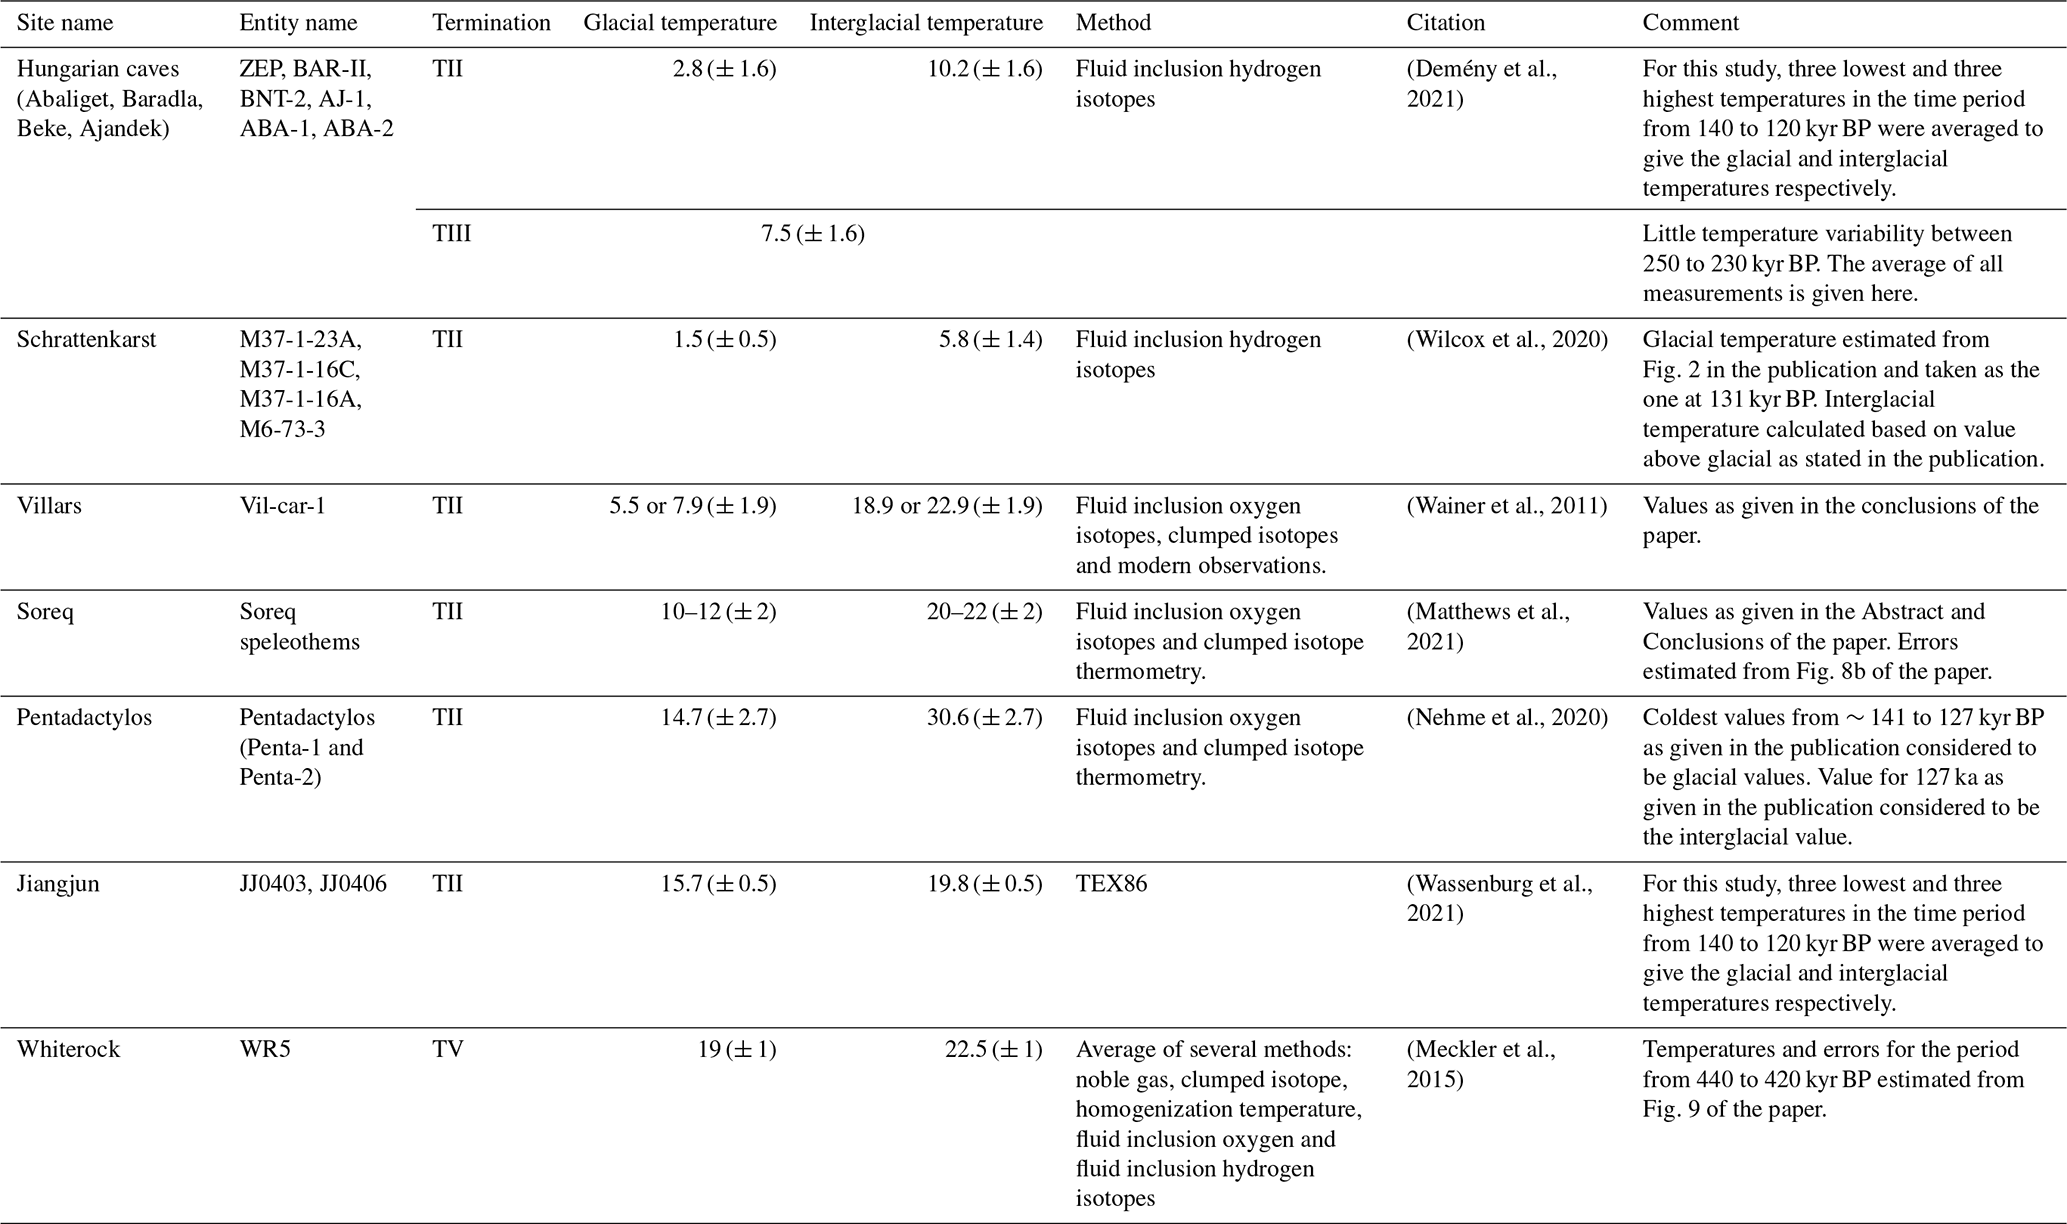
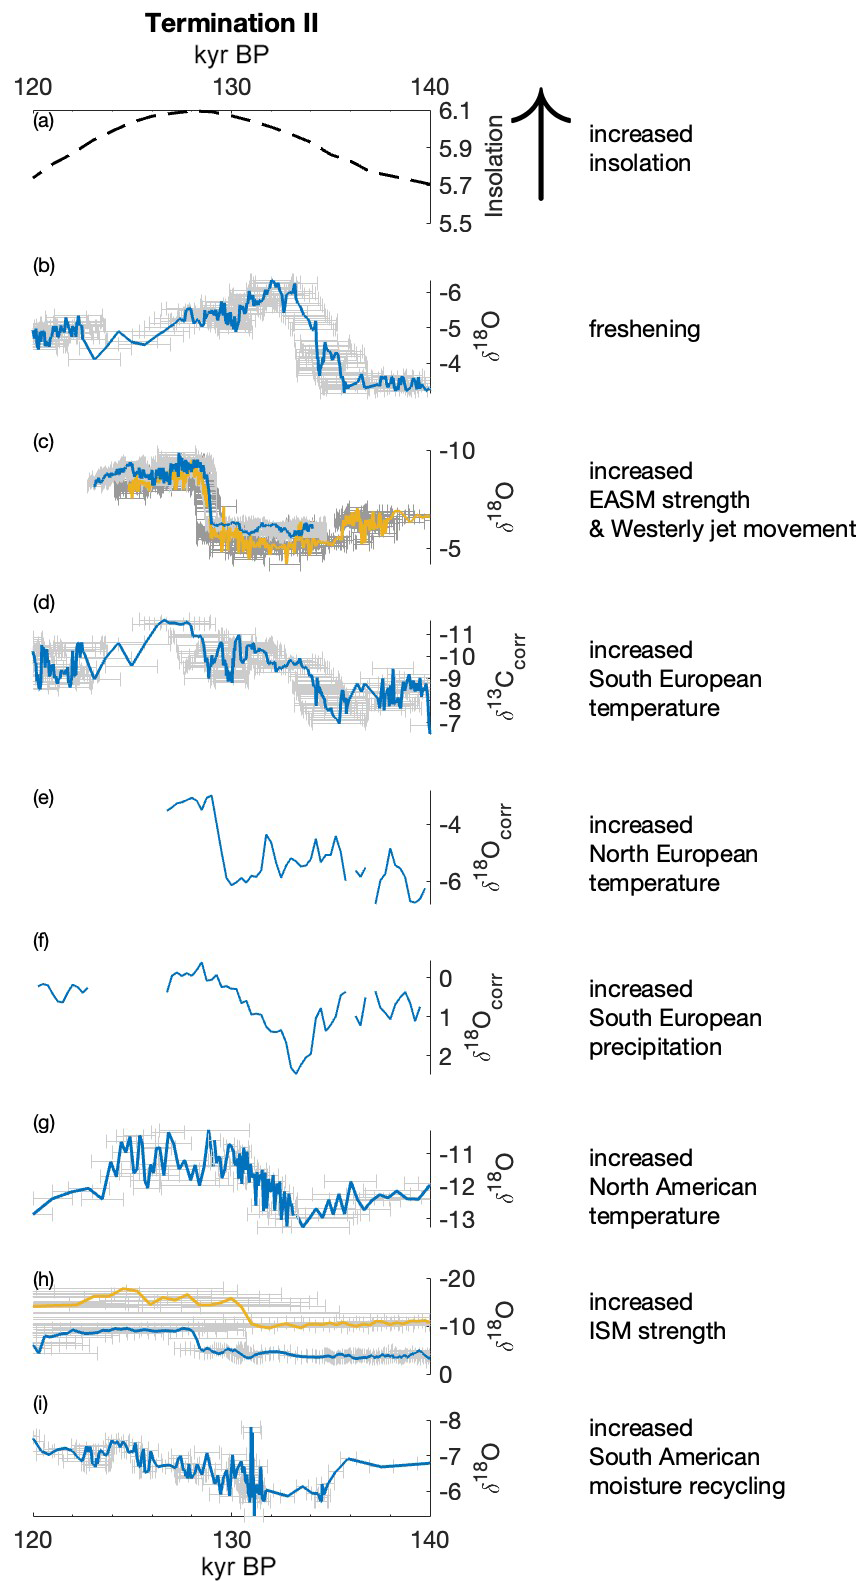
Figure 4Ages covering Termination II in kiloyears before 1950 (kyr BP) are plotted against proxy measurements to discuss the sequence of events. The direction of the y axis for each figure has been selected so that up points to warmer or wetter climates. Age–depth model uncertainties where available are plotted as grey shading on the proxy plots. refers to the record which has been previously corrected using the regional ice volume correction (see Sect. 2.2). refers to a record which has been previously corrected for degassing (see Sect. 2.3). Since these corrections involve binning data, no age–depth model uncertainties have been plotted for these records. (a) Insolation curve in W m−2 is the summer half-year caloric insolation as provided in Tzedakis et al. (2017). This metric for insolation was selected because it accounts for the effect of both precession and obliquity on northern latitude insolation. (b) La Vallina, (c) Dongge (orange) and Tonnelnaya (blue), (d) La Vallina, (e) Abaliget, (f) Corchia, (g) Lehman, (h) Bittoo (blue) and Xiaobailong (orange), and (i) Diamante cave records have been plotted. Interpretations of these records have been summarized beside each subplot. Further information on the records can be found in Table 1. Cave site locations have been plotted in Fig. 1.
While multiple parameters are sensitive to temperature, because they capture the signal in different parts of the atmosphere–land surface and cave system, they may record different seasons and therefore potentially also different amplitudes of temperature change. Cave temperatures, which in most settings reflect mean annual temperature, are recorded by TEX86 (Matthews et al., 2021; Nehme et al., 2020; Wainer et al., 2011) and fluid inclusion micro-thermometry (Meckler et al., 2015). Oxygen isotopes measured in calcite or fluid inclusions and hydrogen isotopes in fluid inclusions will reflect the temperature influence on atmospheric processes but biased to the season contributing most to dripwater infiltration, which will vary by setting. For example, the Hungarian cave study by Demény et al. (2021) uses winter half-year rainfall δ2H–temperature relationship for reconstruction while using similar δ2H methods, the Wilcox et al. (2020) study from the Swiss Alps uses an annual rainfall δ2H–temperature relationship. The initial carbon isotopic ratio set by soil and vegetation processes may be recorded with seasonal bias if stalagmite deposition has a seasonal bias. Despite their lower temporal resolution, one advantage of fluid inclusion δ18O measurements is that unlike δ18O calcite records, the interpretation of fluid inclusion δ18O does not require assumption of constant δ18O water–calcite fractionation. The reliability of fluid inclusion analytical methods is improving with techniques to correct for analytical evaporation effects (Fernandez et al., 2023).
Over TII, these records include the Schrattenkarst (Wilcox et al., 2020) and the Hungarian cave temperature reconstruction (Demény et al., 2021) using fluid inclusion hydrogen isotopes, which suggests a temperature increase of 4.8 (± 1.9) and 7.4 (± 1.6) °C respectively. The Villars cave record, which is located much closer to the coast, suggests a higher temperature increase of 15 (± 1.9) °C using a combination of fluid inclusion oxygen isotopes and clumped isotope thermometry (Wainer et al., 2011). The South Europe, Soreq (Matthews et al., 2021) and Pentadactylos (Nehme et al., 2020) temperature records have similarly been reconstructed using fluid inclusion oxygen isotopes and clumped isotope thermometry and show similarly higher temperature increases of 10 (± 2) and 15 °C (± 2.7) respectively over TII. The Jiangjun cave record from the EASM region has been reconstructed using TEX86 and shows a moderate temperature increase of 4.1 (± 0.5) °C (Wassenburg et al., 2021). For this termination, the records suggest that temperature increase is highest in speleothem records along the Atlantic and Mediterranean coasts, and the temperature progressively decreases into the Alps and into the EASM region.
For the older terminations, very few such speleothem temperature records are available. The Hungarian cave study (Demény et al., 2021) suggests that unlike TII, there was limited temperature variability during TIII. The SE Asian Whiterock cave temperature study (Meckler et al., 2015) compares a number of different reconstruction methods (see Table 2) to provide a moderate temperature increase of 3.5 (± 1) °C over TV.
3.4 Records of hydroclimate
3.4.1 Monsoon regions
The oxygen isotopic composition of speleothems from the monsoon regions (ISM, EASM, SE Asian and South American) provides a powerful indicator of monsoon variability at orbital timescales (e.g. Cheng et al., 2009; Kathayat et al., 2016; Carolin et al., 2016). Monsoon regions have yielded many speleothems, with high-amplitude oxygen isotopic anomalies (2 ‰–5 ‰) and excellent age control. Where the signal amplitude is small, ∼2 ‰, for example in the case of South American and SE Asian monsoon records, the impact of ice volume correction on speleothem δ18O decreases the glacial–interglacial hydrological signal magnitude by ∼0.5 ‰–1 ‰ (Fig. S3).
While large-amplitude orbital changes in δ18O precipitation can be confidently inferred in many monsoon systems, relating the δ18O variability to specific climatic parameters such as rainfall amount, rainfall seasonality, or moisture source in the different monsoon regions has been more complicated. Multiple processes may affect the δ18O of rainfall and dripwater, including the ocean moisture source isotopic ratio, and the temperature and humidity in the moisture source region, the degree of moisture recycling over land (re-evaporation) and mixing (Gat, 1996; Maher, 2008), Rayleigh distillation during progressive rainout between the source and the cave location where the moisture carrying capacity of air parcels is dependent on temperature (Dansgaard, 1964), seasonality of precipitation (e.g. Chiang et al., 2020) and the intensity of deep convection (Risi et al., 2008).
In the ISM and EASM systems, the high-amplitude oxygen isotopic anomalies suggest that the main driving factor is changes in the isotopic composition of rainfall, rather than glacial–interglacial cave temperature changes. This has been confirmed in examples where oxygen isotope ratio or hydrogen isotope ratio of fluid inclusions have been measured directly, removing the influence of temperature which affects the speleothem calcite δ18O (Meckler et al., 2015; Wassenburg et al., 2021). At the eastern extremity of ISM region, fluid inclusions indicate that dripwater decreased in δ18O by 4 ‰–5 ‰ over the deglaciation of TII as a consequence of the hydrological factors discussed above (Wassenburg et al., 2021), and independent measurements confirm temperatures shifts contributed only ∼1 ‰ change in oxygen isotopic variability of the speleothems. In the large-amplitude ISM and EASM termination signals, the ice volume correction is a very small fraction of the signal.
To first order, the lower speleothem δ18O values in EASM and ISM during interglacials reflect higher temperatures in interglacial times, which increases the moisture carrying capacity of air parcels and resulting increase in rainout upstream of the cave region and in the cave region itself (Liu et al., 2014), enhanced by changing internal monsoon dynamics (Sinha et al., 2015). Over the Holocene, both the ISM and the EASM show a lagged response to increasing insolation, which is thought to be due to the presence of ice sheets in the Early Holocene (Zhang et al., 2019). Isotope-enabled general circulation simulations suggest that persistence of wet conditions reflect the role of land surface and ocean feedbacks in sustaining regional monsoons (e.g. Dallmeyer et al., 2010; Zhao and Harrison, 2012). Parker et al. (2021) observe a similar lagged response and persistent wetness across TI. Similarly over TI, Pausata et al. (2011) and He et al. (2021) suggest that the more negative interglacial in the ISM domain is dominantly driven by the isotope amount effect of enhanced deep convection. In contrast, the dominant driver of the more negative EASM is the increased rainout along the moisture pathway between the Indian Ocean and the EASM region. In models, the coherent pattern of lower interglacial speleothem δ18O in the ISM and EASM regions is reflective of continental-scale hydroclimate response marked not by uniform increase in amount of precipitation but rather by intensified convection and rainfall over the ISM and a northward-shifted Westerly jet, leading to increased rainfall in the northern EASM but reduced rainfall in the southern EASM (He et al., 2021). Models also suggest that periods of weakened Atlantic Meridional Overturning Circulation (AMOC) cause a coherent positive δ18O anomaly across the ISM and EASM region due to decreased convection over the ISM and decreased rainout between the Indian Ocean and the EASM domain with a southward shifted Westerly jet.
Similar to the ISM region and the northern EASM region, the SE Asian speleothem records shift to more negative δ18O values, which are representative of wetter conditions and circulation changes during interglacials (Kimbrough et al., 2023; Meckler et al., 2012; Parker et al., 2021). These records are from small islands near the Equator. In this setting, the glacial–interglacial temperature changes have been found to be in the range of 4–5 °C (Meckler et al., 2015), which, given a 2 ‰ change in speleothem δ18O, suggests only about a 1 ‰ change in dripwater (and fluid inclusion) δ18O. The depleted values during glacial times may partially result from increased land exposure counteracting the impact of more positive seawater δ18O values from glacial enrichment at source (Meckler et al., 2012). Since the Green Cathedral cave records are located ∼5° north of the Equator while the Abadi cave records are located ∼5° south of the Equator, the records suggest that during glacial times, the tropical rain belt was shifted even further below 5° south and/or that there was a significant reduction in convection over the Indo-Pacific Warm Pool (IPWP) in turn driven by changes in land mass configurations (Di Nezio et al., 2016; DiNezio and Tierney, 2013; Du et al., 2021). During Heinrich Stadial 1, for example, the slowdown of the AMOC resulted in drying over the IPWP (Buckingham et al., 2022). Some modelling results show a reduction in rainfall in the mid-Holocene, but this is less than would have been expected in the absence of Indian Ocean feedback. This region may be sensitive to sea surface temperatures (SSTs) in the Indian Ocean and South China Sea regions, which are in turn modulated by Northern Hemisphere winter temperatures (Zhao and Harrison, 2012).
In South America, the moisture at the Diamante cave site is sourced from the tropical Atlantic. The air parcels travel over the Amazon, incorporating recycled moisture, while travelling westward toward the Andes (Cheng et al., 2013). The west Amazon Diamante cave record shows a smaller-amplitude change (∼2 ‰) to increased δ18O thought to reflect a shift from relatively wet to moderately dry conditions during the interglacial. The impact of ice volume correction on speleothem δ18O dampens the glacial anomaly, resulting in a decreased glacial–interglacial hydrological signal magnitude by ∼0.5 ‰–1 ‰. The dominant moisture delivered to the west Amazonian site is thought to be recycled transpiration water from the Amazon basin (25 %–60 % based on different moisture-tagging studies), which is a non-fractionating process, so that the actual rainfall decrease at the west Amazonian site may be even lesser than suggested by the δ18O change (Cheng et al., 2013).
3.4.2 Non-monsoon regions
Hydroclimate is also inferred to be the dominant control on speleothem δ18O variability in non-monsoon regions in Central Asia, parts of southern European and the Middle East. The oxygen isotope variability of Central Asian records is controlled by the north–south movement of the Westerly Jet, which controls moisture source location with warm periods corresponding to longer transport pathways and lighter δ18O values (Liu et al., 2015).
In western Italy, warmer sea surface and air temperatures during interglacials are believed to promote greater rainfall, leading to more depleted speleothem δ18O values, reflected by a δ18O anomaly of ∼3 ‰ (Drysdale et al., 2009). Over terminations, the western Italy Corchia cave record is also affected by changes in the of the North Atlantic as well as western Mediterranean, which are the dominant moisture sources. Over TII, the removal of the regional eastern North Atlantic δ18O variation (from NISA Garth record) provides a pattern of enhanced interglacial rainfall compared to glacial reflected by a δ18O anomaly of ∼3 ‰ but a notable millennial-scale anomaly of 2 ‰, suggesting a transient period of extreme aridity at the onset of the termination (Fig. 4).
The Middle Eastern stalagmite δ18O records from Soreq, Jerusalem West and Peqiin caves (Fig. S1) reflect changes in precipitation amount and more depleted δ18O values, suggesting increased precipitation during interglacial times (Bar-Matthews et al., 2003, and references therein). An additional source water composition effect has also been suggested, with evaporation in the semi-closed Mediterranean amplifying the meltwater signal (Frumkin et al., 1999).
In eastern North America, the δ18O record of Buckeye Creek Cave is thought to reflect the annual balance of moisture between Gulf of Mexico or continent-sourced heavier during the summer and Pacific-sourced lighter during the winter. A similar mechanism is thought to play out on longer glacial–interglacial timescales, with glacial times of more light δ18Oprecip Pacific moisture transport and interglacial timescales of more heavy Gulf of Mexico/continental moisture transport (Cheng et al., 2019; Hardt et al., 2010). The amplitude of the signal is small, ∼1 ‰–2 ‰, and the signal is further dampened by ice volume corrections. The ice-volume-corrected Buckeye Creek record suggests an earlier and more continuous return to glacial conditions at the end of TIIIA.
The diverse aspects of climate recorded by available speleothem records allow us to evaluate if such aspects of the climate system change simultaneously or in succession across the termination given the uncertainty in the individual speleothem chronologies. In cases where the ice volume effects have minimal impact on the timing of events (as previously detailed in Sect. 3), the original records without ice volume correction have been plotted in order to preserve the high resolution of the original records, which are relevant to discussing the timing and sequence of events over the terminations.
4.1 Termination II
Insolation begins rising around 137 kyr BP (Fig. 4). The first manifestation of TII in speleothems is the freshening in the North Atlantic from the NISA (La Vallina cave – Garth record) record at 135.6 (± 1.2) kyr BP, synchronous with a positive shift in the EASM δ18O by 135.6 () kyr BP. Such a positive shift in the EASM is conventionally interpreted as the onset of a “weak monsoon interval” (Cheng et al., 2016a), potentially reflecting a southward shift of the Westerly jet reflected by the Central Asian winter-precipitation-driven Tonnelnaya record (Cheng et al., 2016b) and often attributed to reduction in AMOC, consistent with models of TI (He et al., 2021). The sequence confirms with absolute chronology that the first deglacial freshening may trigger synchronous response in the EASM system including on the millennial scale, as hypothesized previously. The available ISM records do not resolve this millennial structure. This trend to higher δ18O in the EASM records is interrupted by a centennial scale strengthening of the monsoon at 134.7 kyr BP that is clearly seen in the Hulu cave record.
An early warming step is detected in the South European NISA record at 135.4 (± 1.4) kyr BP within error of the North European Schneckenloch record at 134.5 (± 1.7) kyr BP. When comparing records across different systems, the absolute chronological uncertainties suggest that the freshening and initial onset of warming in South Europe may be within error of each other. However, when comparing in a single stalagmite the freshening signal derived from the δ18O proxy and the temperature signal derived from the δ13C and proxies (NISA – La Vallina cave – Garth record), there is some confidence that the first freshening preceded the warming step in the NISA record and in fact coincided with a transient temperature minimum, which may reflect AMOC reduction. Thereafter, the gradual warming trend in central North America begins at 133.6 (± 2.4) kyr BP, with a progressive increase in rainfall in West Italy (Corchia cave) following a sharp aridity event at this location. The gradual warming in central North America may reflect rising greenhouse gas concentrations as well as regional lowering of albedo with ice sheet retreat.
The final climate response is the abrupt shift in the East Asian monsoon record, classically interpreted as the onset of strong monsoon at 129.0 (± 0.7) kyr BP. Within the chronological uncertainties this event is simultaneous in the Central Asian and the ISM, as well as the final step of abrupt warming in coastal and Northern Europe as recorded in Abaliget, Sieben Hengste and NISA temperature records. These changes occur toward the end of the freshening signal observed in the NISA record and, according to tuning of marine and NISA speleothem archives, may coincide with the recovery after the final collapse of the Labrador ice dome (Stoll et al., 2022).
4.2 Termination IIIA
The onset of increased insolation is seen by 229.0 kyr BP (Fig. 5). The first manifestation of TIIIA in available speleothem records is the gradual freshening in the Black Sea region tracked by the Sofular cave speleothem record at 229.1 () ka BP. A positive δ18O anomaly in the EASM Sanbao record starting at 228.6 kyr BP coincides with the onset of freshening and may reflect weakened intensity of the ISM and decreased rainout. An early warming step in the European Alps (Spannagel) is seen nearly synchronously with the onset of the Sofular freshening event at 229.1 (± 0.2) kyr BP. Subsequently the southeastern North American record suggests the onset of a gradual Gulf of Mexico warming (Buckeye Creek) at 227.0 (± 2.1) kyr BP. Shortly thereafter (or synchronously given the errors), there is continued intensification of the ISM centre convection, manifest as progressive depletion of EASM δ18O, reaching typical interglacial values by 225.8 () kyr BP. There is also an increase in Westerlies driven by summer precipitation in the Central Asian Kesang cave at 225.1 kyr BP.
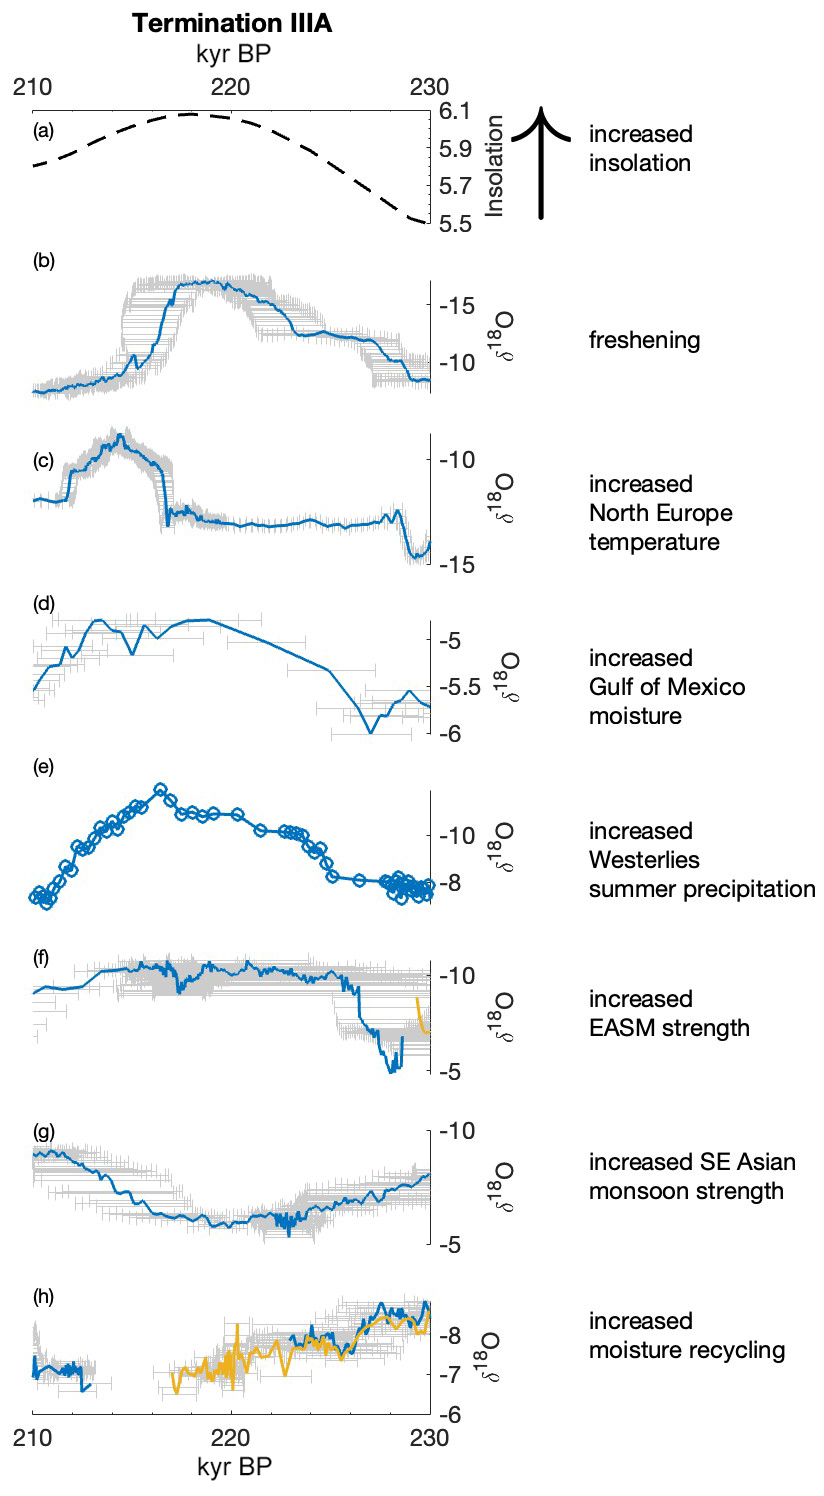
Figure 5Ages covering Termination IIIA in kiloyears before 1950 (kyr BP) are plotted against proxy measurements to discuss the sequence of events. The direction of the y axis for each figure has been selected so that up points to warmer or wetter climates. Age–depth model uncertainties where available are plotted as grey shading on the proxy plots. (a) Insolation curve in W m−2 is the summer half-year caloric insolation as provided in Tzedakis et al. (2017). This metric for insolation was selected because it accounts for the effect of both precession and obliquity on northern latitude insolation. (b) Sofular, (c) Spannagel, (d) Buckeye Creek, (e) Kesang, (f) Sanbao, (g) Abadi and (h) Diamante cave records have been plotted. Interpretations of these records have been summarized beside each subplot. Further information on the records can be found in Table 1. Cave site locations have been plotted in Fig. 1.
The SE Asian Abadi cave record (located at 5° S) shows a gradual reduction in monsoon strength between 229.8 (± 2.4) and 219.2 (± 1.1) kyr BP during the rise in insolation and the Sofular freshening event. In western tropical South America, this time period is marked by an increase in moisture recycling (less upstream rainout) recorded in Diamante Cave. While the Central Asian Kesang and Tonnelnaya cave δ18O records are coherent when examined on longer timescales and are similar to EASM records during TII, over TIIIA, the Kesang record does not manifest a positive δ18O shift in response to North Atlantic freshening, as seen in the Tonnelnaya and Dongge records from TII. The EASM records show a low-amplitude anomaly signal for TIIIA in comparison to TII. One distinct though still low-amplitude signal is a period of reduced monsoon strength from 221.2 (± 0.9) to 218.7 (± 0.6) kyr BP.
The final, strong North Europe warming coincides with the end of the Sofular freshening signal at 217.3 (± 2.0) kyr BP. The SE Asian monsoon strength (Abadi Cave) begins to increase at this time, together with a parallel reduction in Westerlies-driven summer precipitation (Kesang). The EASM experiences a transient positive δ18O anomaly at 218.3 (± 1.7) kyr BP, and the abrupt recovery at 217.4 (± 1.3) kyr BP is coincident with final North Europe warming.
214.3 (± 0.4) kyr BP marks the end of the warming event in the European Alps, with a decrease in Gulf of Mexico temperatures indicated by the Buckeye Creek cave in North America. The South American Diamante cave does not show a return to pre-termination conditions by this time.
4.3 Termination III
The onset of increased insolation is seen by 253.0 kyr BP (Fig. 6). No freshening records are available for TIII. A brief transient positive shift in the EASM δ18O centred at 252.2 kyr BP suggests weakened convection intensity and decreased rainout between Indian Ocean and EASM region. This period is also seen as a departure to more positive δ18O values in the ISM and SE Asian monsoon (Green Cathedral (5° N)) cave records, which reflect decreased regional precipitation and changes to circulation. A longer transient positive shift in the EASM record is seen from 248.2 to 243.2 kyr BP. The European Ejulve cave record shows gradual warming beginning at 248.6 ka BP interrupted by shorter cooling events centred at 243.9 and 241.7 ka BP respectively. A prominent warming step is seen in the Alpine Spannagel cave record, which only partially covers TIII at 242.5 (± 0.3) ka BP.
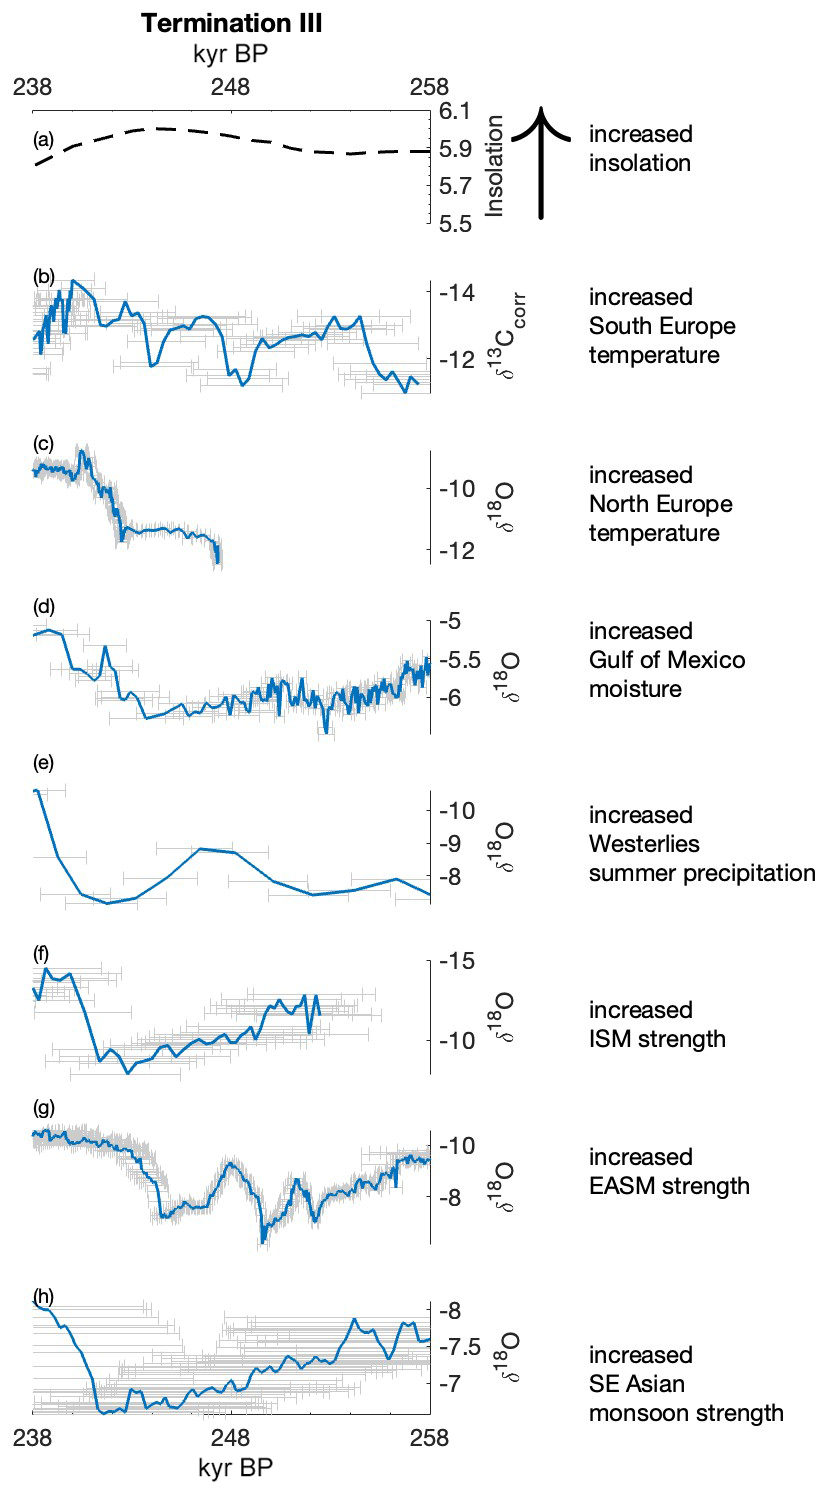
Figure 6Ages covering Termination III in kiloyears before 1950 (kyr BP) are plotted against proxy measurements to discuss the sequence of events. The direction of the y axis for each figure has been selected so that up points to warmer or wetter climates. Age–depth model uncertainties where available are plotted as grey shading on the proxy plots. refers to a record which has been previously corrected for degassing (see Sect. 2.3). (a) Insolation curve in W m−2 is the summer half-year caloric insolation as provided in Tzedakis et al. (2017). This metric for insolation was selected because it accounts for the effect of both precession and obliquity on northern latitude insolation. (b) Ejulve, (c) Spannagel, (d) Buckeye Creek, (e) Kesang, (f) Xiaobailong, (g) Sanbao and (h) Green Cathedral cave records have been plotted. Interpretations of these records have been summarized beside each subplot. Further information on the records can be found in Table 1. Cave site locations have been plotted in Fig. 1.
Similar to the TII Central Asian Tonnelnaya record, and unlike the TIIIA Central Asian Kesang cave record, the Central Asian Kesang cave record for TIII shows some decrease in Westerlies-driven summer precipitation, though this record has a very low resolution. At the same time, and again conversely to TIIIA, the Southeastern North American record from Buckeye Creek cave suggests a drop in Gulf of Mexico temperatures. However, the signal amplitude for the Buckeye Creek records is less than 1 ‰.
Coinciding with the prominent warming step seen in the European cave records ∼242.0 ka BP, there is an increase in EASM monsoon strength at 243.2 (± 0.5) ka BP. The ISM and SE Asian monsoon strength also change around the same time period but have large chronological errors, which precludes further discussion on their place in the sequence of events. Similarly, the changes to a warmer Gulf of Mexico and linked precipitation season in the Buckeye Creek cave and Westerlies season in the Kesang cave all lie within errors of the monsoon change in the EASM region and the temperature change in the Alps.
4.4 TIV and TV
Speleothem records of TIV and TV are only available from the EASM region (Sanbao cave) and the SE Asian monsoon region (Abadi and Green Cathedral caves respectively). No freshening records are available for these terminations. Similar to TII and TIII, the EASM records indicate weak monsoon periods at the onset of insolation increase. Both EASM and SE Asian monsoon records recover around the same time near peak insolation.
5.1 Similarities and differences in components of the climate response among terminations
Records of different terminations from different speleothems belonging to the same cave and region are largely similar in direction of signal and magnitude (with few exceptions) but can vary significantly in internal structure (including the rate of change).
Both the NISA and Sofular δ18O are inferred to track the release of isotopically light meltwater from Northern Hemisphere ice sheets, albeit in different regions, and in both TII and TIIIA, meltwater release happens similarly early in the termination prior to the warming in North Europe and recovery of the EASM. The differences in magnitude of the δ18O signals in NISA and Sofular are a manifestation of the different sources of moisture for the two records rather than a reflection of the differences between terminations, since the NISA records the ∼2 ‰ freshening of the North Atlantic as having altered the source composition by ∼2 ‰ (Stoll et al., 2022), whereas a combination of factors including the inflow of isotopically depleted Caspian Sea waters resulting from Eurasian ice sheet melt, diversion of rivers, higher river runoff coefficients and reduced evaporation to the Black Sea during terminations contributes to the strongly depleted δ18O values of the Sofular cave record (Badertscher et al., 2011, and references therein).
European temperature records are available from Abaliget and NISA for TII, Spannagel for TIIIA, and Ejulve and partially Spannagel for TIII. Once the ice volume correction from the NISA record has been applied to the Abaliget record, the structure of the record is similar to the δ13C-based temperature record from NISA (Fig. 4). Currently, no similar North Atlantic specific correction can be made for the Spannagel δ18O record from TIIIA and TIII or Ejulve in TIII; in the measured records, times of meltwater arrival in the North Atlantic could mask early warming steps during the times of apparently stable δ18O between 228 and 215 ka BP in TIIIA and 242 to 247 ka BP in TIII. For TIII, the Ejulve cave δ13C-based temperature record provides this information instead, with a two-step temperature increase at 248.6 and 242.5 ka BP respectively. While these records provide excellent information on the timing of temperature change, they can provide only a limited estimate of change in absolute temperature. For this we must look to other speleothem records such as fluid inclusions instead. The Hungarian cave fluid inclusion records (see Sect. 3.3) are roughly from the same region and elevation as the Abaliget record at (∼450 and 200 m a.s.l. respectively) and suggest a temperature change of 7.4 °C. The Schrattenkarst fluid inclusion record for TII is available from a similar region and elevation (∼2000 m) as the Spannagel cave record and suggests a temperature change of 4.8 °C. Only the Hungarian cave fluid inclusion record is available for TIII and suggests very limited temperature variation at least in this region and at this elevation. This is unlike what is suggested by the Spannagel cave δ18O record.
The EASM records from Sanbao and Dongge together cover all terminations, with Sanbao records in particular available for all terminations. To some extent, the speleothem records reflect insolation changes, with TII, TIIIA and TIV showing the most distinct δ18O anomalies. TII shows the most abrupt change in δ18O and lasts for ∼6.9 kyr from the initial weak monsoon event to monsoon recovery. TIV is similar to TII in structure and lasts for ∼7.1 kyr. The peak weak monsoon event for TV seems to last only 2.2 kyr. TII, TIIIA and TIII show prominent millennial event structures during terminations. Although from the same region, the records are from different stalagmites with different sampling resolutions and age uncertainties; nevertheless, they provide an opportunity to examine why the terminations may have different structures in the same region (Cheng et al., 2009).
The SE Asian monsoon records from Green Cathedral and Abadi caves are another group of records from the same monsoon region that can be compared across different terminations. The records from TIIIA, TIII and TV are similar to each other, showing gentle weakening and recovery signals across thousands of years. The TIV Abadi cave record, in contrast, shows a sharp recovery lasting only a few 100 years.
5.2 Similarities and differences in the sequence and duration of events during terminations
The detailed analysis of available speleothem records covering terminations in this study allows us to provide a more structured interpretation of the sequence of events (Fig. 7). The three terminations, namely, TII, TIIIA and TIII, show a common sequence among some events. In all these terminations, there are two groups of events which are largely out of age uncertainty of the other. The first group of global sequence of climatic events is represented by the onset of insolation increase, onset of freshening, weakening of the Asian monsoon, and the initial increase in temperatures in Europe and North America. This is followed by a second group of global sequence of climatic events of the end of freshening, near peak insolation, including monsoon recovery and the final step of temperature increase in Europe and North America. Within the groups, the individual climatic events can have overlapping uncertainties. Where events within a group have no overlap, it is possible to identify the sequence of events with finer detail. These records provide promising targets for understanding climate dynamics and for modelling studies. A notable example of such a target includes the onset and time period of warming versus freshening in the North Atlantic region from the NISA δ18O and δ13C records available for TII.
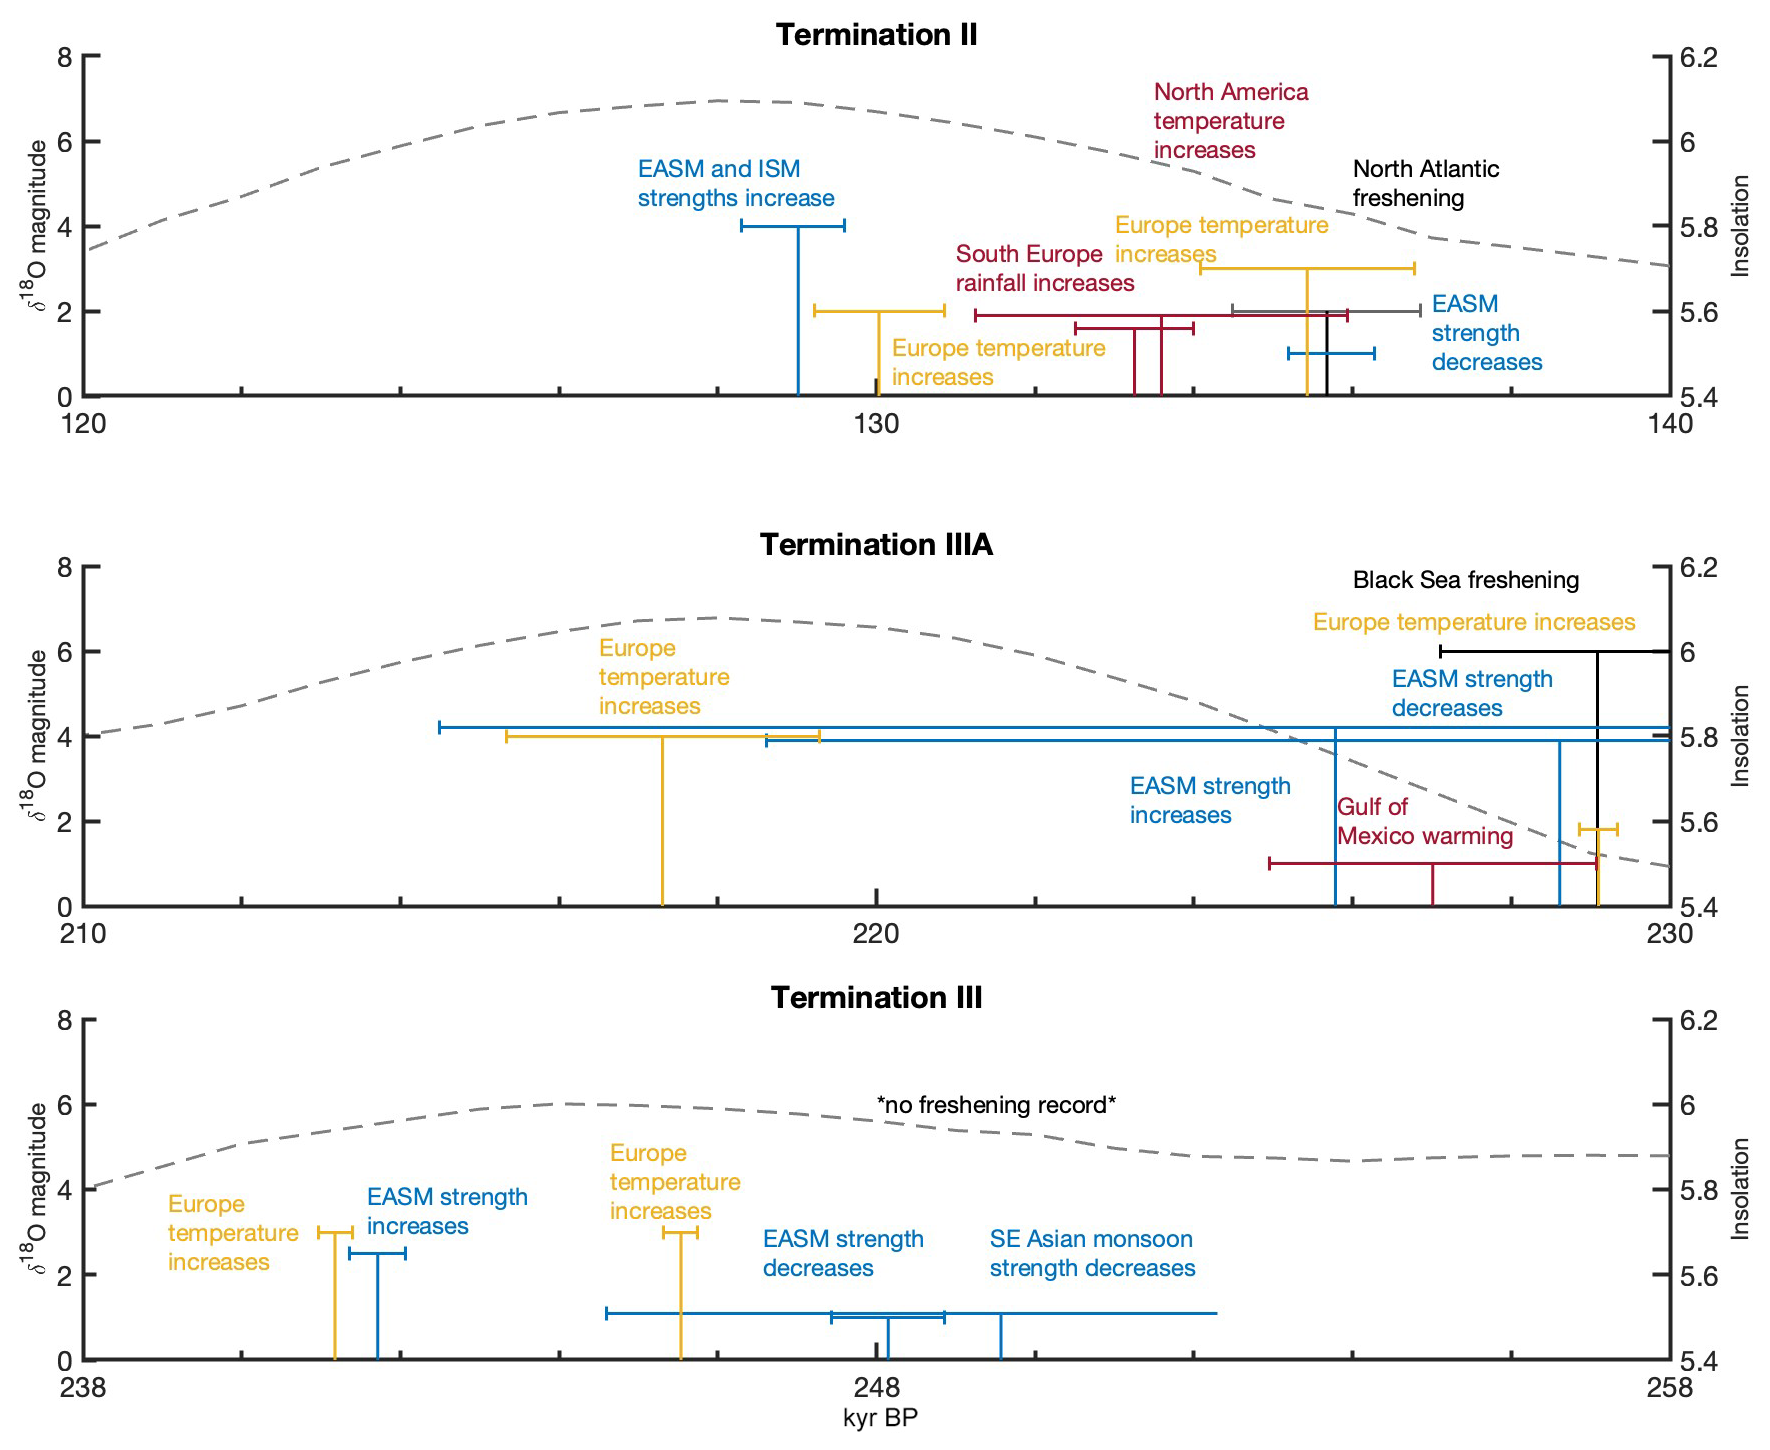
Figure 7Sequence of global climatic events over terminations. Ages and chronological uncertainties are represented on the x axes. The amplitude of insolation change and the oxygen isotope changes that reflect the climatic events in speleothem records are plotted on the y axes. Amplitudes are taken from Figs. 4–6 for the respective terminations, though only selected climate changes from these figures have been represented here to avoid clutter and to aid discussion. Insolation is given with a black dashed line. Insolation curve in W m−2 is the summer half-year caloric insolation as provided in Tzedakis et al. (2017). This metric for insolation was selected because it accounts for the effect of both precession and obliquity on northern latitude insolation. Europe temperature changes are in orange, Asian monsoon changes are in blue and all other climatic changes are in maroon.
The sequence of events, if bookended by weakening and recovery of the monsoon, seems to cover ∼8.0 kyr. However, because the different terminations feature speleothems from different regions, it is currently not possible to precisely evaluate variations in the duration of the different terminations or processes that contribute to such variations.
5.3 Potential use of speleothems for tuning other records – targets
Several approaches have been employed to transfer speleothem chronologies to marine sediment records by tuning marine proxies to regionally relevant speleothem δ18O records. Tzedakis et al. (2018) match the relative abundance of temperate pollen in marine sediment records on the Iberian Margin pollen with Corchia (Italy) speleothem δ18O, assuming a common rainfall amount signal dominates both records (Fig. 8). This provides an independent, speleothem-tuned chronology for other proxies recorded in the Iberian Margin sequence, such as the benthic δ18O, and reveals how the chronology of events in the marine sediment core would be shifted earlier by several thousand years compared to a marine age model based on tuning benthic δ18O to stacks (e.g. Spratt and Lisiecki, 2016).
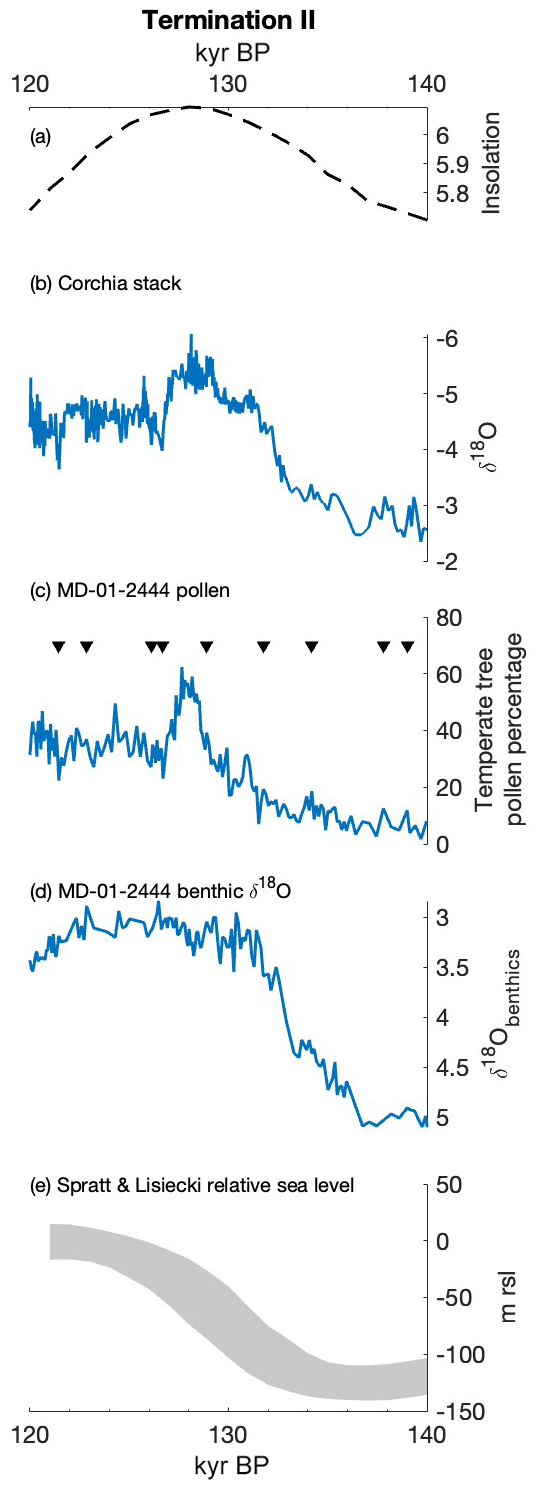
Figure 8Transferring the Corchia speleothem chronology to an Iberian Margin marine sediment record by tuning the marine pollen record to the speleothem δ18O record. (a) Insolation curve in W m−2 is the summer half-year caloric insolation as provided in Tzedakis et al. (2017). This metric for insolation was selected because it accounts for the effect of both precession and obliquity on northern latitude insolation. (b) The Corchia stack δ18O, (c) MD-01-2444 marine core pollen record tuned to the Corchia stack chronology indicated by tie points in black triangle markers, (d) MD-01-2444 marine core benthic δ18O on the Corchia stack timescale as given in Tzedakis et al. (2018), and (e) the relative sea level curve developed from a global benthic δ18O stack as given by Spratt and Lisiecki (2016).
Tuning of surface ocean δ18O to speleothem records is also widespread. Grant et al. (2012) tune planktonic δ18O from the eastern Mediterranean region to speleothem δ18O records from Israel, assuming the signal of Mediterranean seawater δ18O dominates both records. In the North Atlantic region, the NISA speleothem records of eastern North Atlantic surface ocean δ18O have been used to tune Iberian Margin marine records of derived from paired and oxygen isotope measurements of planktic foraminifera (Stoll et al., 2022). Caballero-Gill et al. (2012) tune planktonic δ18O from the South China Sea (SCS) to the East Asian Summer monsoon δ18O, assuming that fresher conditions in the SCS correspond to monsoon regimes reflected in lower speleothem δ18O. This chronology has been applied to evaluate the synchronicity of changes in precipitation isotopes across a the East Asian Monsoon domain, by comparing the speleothem records with leaf wax hydrogen isotope records from same core, since the leaf waxes integrate the signal from the Pearl River catchment area (Thomas et al., 2014). This exercise explores whether monsoon changes result from direct insolation forcing or additionally from SST and ice volume changes, a comparison not possible when marine record chronology of ice volume is derived from tuning to a specific insolation target. In other settings, closely located records of leaf wax hydrogen isotopes and speleothem δ18O, which can be assumed to receive similar isotopic signals in precipitation, may provide further opportunities to tune marine sediment cores. Leaf wax δ2H data are available in SE Asian (Sumatra), EASM and South European (Mediterranean) regions. Finally, emerging records of fluid inclusion thermometry covering terminations also provide an opportunity to improve chronologies for nearby marine records by tuning the SST indicators from marine cores to speleothem temperature records.
In some cases, speleothem chronology has been applied to more distant archives inferred to feature common forcing. Grant et al. (2014) tune millennial dust peaks in sediment records from the Red Sea with millennial “weak monsoon” positive anomalies in speleothem δ18O records from the Asian monsoon region, inferring synchronous phases of aridity, in order to apply absolute chronology to the Red Sea sea level record. Sinnl et al. (2023) have tuned polar ice core chronology over the last glacial to speleothem chronology using common radionuclide production signals. The potential for precise global speleothem chronologies to tune Heinrich events in both Greenland and Antarctic ice cores on the basis of major atmospheric circulation reorganizations has been proposed (Dong et al., 2022). Over orbital timescales, EASM δ18O variations have been used to validate the ice core age model, assuming EASM δ18O correlated with tropical rainfall and NH tropical wetland extent, which would be reflected in the ice core methane concentrations (Suwa and Bender, 2008). Yet even when such distant correlation is based on strong common drivers of distal signals, regional climate processes which are independent of the common processes may add additional variability to each record which complicates robust tuning. As more absolute dated speleothem records emerge, it will be possible to more rigorously evaluate the fidelity of these long-distance teleconnections on varying timescales. More widespread, well-dated speleothem records of terminations beyond TII are required, and development of marine proxy records with signals common to the speleothem records will continue to improve the chronology of terminations.
5.4 Suitable modelling outputs to understand climate dynamics
The speleothem record of the sequence of climate events over terminations can be used to evaluate the skill of climate models in simulating teleconnections and feedbacks (Cheng et al., 2009; Denton et al., 2010; He et al., 2021; Obase et al., 2021). However, to date, few transient simulations covering terminations exist (e.g. Liu et al., 2009; Ivanovic et al., 2016; Obase et al., 2021; Menviel et al., 2019; Caley et al., 2014), and most of them extend back only to TI. Model outputs can vary based on initial conditions; for example, the manifestation of millennial events surrounding terminations in model simulations varies based on the sensitivity of different models to different background conditions and the treatment of deglacial meltwater input to the ocean. Some models are also better at simulating certain regions compared to other models, making a multi-model comparison more valuable (Bong et al., 2024).
Isotope-enabled model simulations allow direct comparison of rainwater δ18O simulated by models to calculated rainwater δ18O from speleothems δ18O and are run by ECHAM5-wiso (e.g. Comas-Bru et al., 2019), iLOVECLIM (e.g. Caley et al., 2014), iTRACE (e.g. He et al., 2021), iCESM (e.g. Sinha et al., 2024) and GISS (e.g. Tierney et al., 2011). For example, the isotope-enabled models have confirmed that synchronous isotope anomalies in the Asian monsoon region reflect a coherent response to large-scale reorganization of atmospheric circulation, even when there are disparate regional responses to precipitation amount (Caley et al., 2014; He et al., 2021). Further, if models confirm, for example, that isotope anomalies in the Asian monsoon region are synchronous with the expansion and contraction of Northern Hemisphere tropical wetlands, this would provide strengthened support for tuning ice core methane records to the EASM speleothem chronology. By clarifying the processes responsible for the isotopic signal in speleothems, isotope models foster more robust comparison between speleothem records and suitable climate variables simulated by the larger group of non-isotope-enabled climate models.
Since there is a protocol for isotope-enabled model comparison for TII (Menviel et al., 2019), and investigation by the current review paper has shown that there are a number of speleothem proxy records from around the globe covering this termination, TII can be a useful future target to understand climate dynamics using data–model comparison approaches.
Based on this study, we can now provide strategic future research directions for speleothem research covering terminations:
-
The NISA records provide the best data on freshening events in the North Atlantic and temperature changes in Southern Europe. Since multiple proxies from the same speleothems provide information on both temperature change and freshening, they provide critical chronological control on these two events. Further, since at least some speleothems from this region allow for confocal layer counting, it greatly increases our confidence in the duration of events in this critical source region.
-
Speleothem δ13C proxy records, particularly from temperate regions, are showing great promise in reconstructing past changes in temperature and rainfall when coupled with other proxies such as and calcium isotopes. Such records from the particularly data-dense Northern temperate regions would add great value to research on terminations.
-
The Central Asian Tonnel'naya record provides the clearest manifestation of changes to the Westerlies during TII, which are also relevant to the coupling between (or forcing of) the North Atlantic and EASM regions. It would be useful to have further records of Westerlies to track changes across other terminations.
-
The EASM region with its rich record of well-dated highly resolved speleothems provides the best opportunity to understand the difference in the internal structure of termination events in speleothem δ18O records across all examined terminations. Comparison of different insolation metrics and isotope-enabled modelling studies possibly provides future directions to understanding the variable internal structures, in turn providing a hint at the differences in the forcings of different terminations.
-
Current available studies suggest that South American speleothems provide our best opportunity of finding well-dated records across terminations from the Southern Hemisphere. At the moment, the South American records from the SISAL database cover only TII and TIIIA. Karst regions in the low latitudes in the Southern Hemisphere of the African continent remain under-explored.
-
The North American Lehman cave record provides the best data for temperature changes in this region. However, the Lehman caves record only provides information for TII. The Devils Hole cave records obtained from sub-aqueous speleothems are more likely to cover the older terminations. However, these sub-aqueous records initially generated debate on their chronological control, which has since been resolved (see Moseley et al., 2015, and references therein). However, there continues to be debate on travel time of the climatic signal at the surface to the site of the sub-aqueous record. Further karst modelling studies can provide this information.
-
SE Asian speleothem records not only provide critical information on changes over the Equator but possibly also have some of the best understood fluid inclusion records. These are particularly vital since they can be an important tuning target with marine records given their location in the Indo-Pacific Warm Pool.
-
Many speleothem records that have been plotted in this study were not initially measured targeting terminations. Further, speleothem U–Th dating capabilities and techniques such as confocal microscopy can provide further age control in some of the older records. In such cases, it may be worth undertaking a concentrated effort to improve the parts of the records that cover terminations, particularly targeting for example, NISA, Northern Europe and EASM records that are within uncertainty of each other.
-
Where multiple records are available for a given region, we can evaluate the scale of local to regional coherency in the proxy interpretation. Regional speleothem age models that encompass the strengths and uncertainties from uranium–thorium dates from multiple overlapping speleothems from the same and nearby caves can be attempted.
-
More advanced time series methods such as change point analysis can be used which consider full age uncertainty ensembles.
-
Records from other speleothem proxies such as trace element and δ234U measurements are increasing in number and provide information on regional hydroclimate and vegetation changes, providing a more complete picture of changing climate and environmental conditions in response to termination events.
-
Lastly, we can examine the expression of millennial and more abrupt events during terminations.
Data used in this study are available in the SISALv3 database at https://doi.org/10.5194/essd-16-1933-2024 (Kaushal et al., 2024a).
The supplement related to this article is available online at https://doi.org/10.5194/cp-21-1633-2025-supplement.
NK curated the data and worked on data visualization. HMS conceptualized and supervised this project. Both NK and HMS performed formal analysis, wrote the original draft and acquired funding for this project. NK, CPM and HMS were responsible for validation and reviewing and editing the paper.
The contact author has declared that none of the authors has any competing interests.
Publisher's note: Copernicus Publications remains neutral with regard to jurisdictional claims made in the text, published maps, institutional affiliations, or any other geographical representation in this paper. While Copernicus Publications makes every effort to include appropriate place names, the final responsibility lies with the authors.
This study includes data compiled by SISAL (Speleothem Isotopes Synthesis and AnaLysis), a Working Group of the Past Global Changes (PAGES) project. PAGES received support from the Swiss Academy of Sciences and the Chinese Academy of Sciences. The authors of this study are grateful to the SISAL Working Group for compiling the speleothem database.
Nikita Kaushal was funded by the Swiss Government Excellence Scholarship. Carlos Pérez-Mejías was funded by the National Nature Science Foundation of China (NSFC), grant nos. 42472244 and 42050410317.
This paper was edited by Russell Drysdale and reviewed by Jasper Wassenburg and one anonymous referee.
Adkins, J. F., McIntyre, K., and Schrag, D. P.: The Salinity, Temperature, and δ18O of the Glacial Deep Ocean, Science, 298, 1769–1773, https://doi.org/10.1126/science.1076252, 2002.
Affolter, S., Steinmann, P., Aemisegger, F., Purtschert, R., and Leuenberger, M.: Origin and percolation times of Milandre Cave drip water determined by tritium time series and beryllium-7 data from Switzerland, J. Environ. Radioactiv., 222, 106346, https://doi.org/10.1016/j.jenvrad.2020.106346, 2020.
Alley, R. B. and Cuffey, K. M.: 9. Oxygen- and Hydrogen-Isotopic Ratios of Water in Precipitation: Beyond Paleothermometry, in: 9. Oxygen- and Hydrogen-Isotopic Ratios of Water in Precipitation: Beyond Paleothermometry, De Gruyter, 527–554, https://doi.org/10.1515/9781501508745-012, 2018.
Amirnezhad-Mozhdehi, S. and Comas-Bru, L.: MATLAB scripts to produce OxCal chronologies for SISAL database (scripts V1), Zenodo [code], https://doi.org/10.5281/zenodo.3586280, 2019.
Atsawawaranunt, K., Comas-Bru, L., Amirnezhad Mozhdehi, S., Deininger, M., Harrison, S. P., Baker, A., Boyd, M., Kaushal, N., Ahmad, S. M., Ait Brahim, Y., Arienzo, M., Bajo, P., Braun, K., Burstyn, Y., Chawchai, S., Duan, W., Hatvani, I. G., Hu, J., Kern, Z., Labuhn, I., Lachniet, M., Lechleitner, F. A., Lorrey, A., Pérez-Mejías, C., Pickering, R., Scroxton, N., and SISAL Working Group Members: The SISAL database: a global resource to document oxygen and carbon isotope records from speleothems, Earth Syst. Sci. Data, 10, 1687–1713, https://doi.org/10.5194/essd-10-1687-2018, 2018a.
Atsawawaranunt, K., Harrison, S., and Comas Bru, L.: SISAL (Speleothem Isotopes Synthesis and AnaLysis Working Group) database Version 1.0, University of Reading repository CentAUR [data set], https://doi.org/10.17864/1947.147, 2018b.
Atsawawaranunt, K., Harrison, S., and Comas-Bru, L.: SISAL (Speleothem Isotopes Synthesis and AnaLysis Working Group) database version 1b, University of Reading repository CentAUR [data set], https://doi.org/10.17864/1947.189, 2019.
Badertscher, S., Fleitmann, D., Cheng, H., Edwards, R. L., Göktürk, O. M., Zumbühl, A., Leuenberger, M., and Tüysüz, O.: Pleistocene water intrusions from the Mediterranean and Caspian seas into the Black Sea, Nat. Geosci., 4, 236–239, https://doi.org/10.1038/ngeo1106, 2011.
Bajo, P., Drysdale, R. N., Woodhead, J. D., Hellstrom, J. C., Hodell, D., Ferretti, P., Voelker, A. H. L., Zanchetta, G., Rodrigues, T., Wolff, E., Tyler, J., Frisia, S., Spötl, C., and Fallick, A. E.: Persistent influence of obliquity on ice age terminations since the Middle Pleistocene transition, Science, 367, 1235–1239, https://doi.org/10.1126/science.aaw1114, 2020.
Barker, S. and Knorr, G.: Millennial scale feedbacks determine the shape and rapidity of glacial termination, Nat. Commun., 12, 2273, https://doi.org/10.1038/s41467-021-22388-6, 2021.
Bar-Matthews, M., Ayalon, A., Gilmour, M., Matthews, A., and Hawkesworth, C. J.: Sea–land oxygen isotopic relationships from planktonic foraminifera and speleothems in the Eastern Mediterranean region and their implication for paleorainfall during interglacial intervals, Geochim. Cosmochim. Ac., 67, 3181–3199, https://doi.org/10.1016/S0016-7037(02)01031-1, 2003.
Bengtson, S. A., Menviel, L. C., Meissner, K. J., Missiaen, L., Peterson, C. D., Lisiecki, L. E., and Joos, F.: Lower oceanic δ13C during the last interglacial period compared to the Holocene, Clim. Past, 17, 507–528, https://doi.org/10.5194/cp-17-507-2021, 2021.
Bong, H., Cauquoin, A., Okazaki, A., Chang, E.-C., Werner, M., Wei, Z., Yeo, N., and Yoshimura, K.: Process-Based Intercomparison of Water Isotope-Enabled Models and Reanalysis Nudging Effects, J. Geophys. Res.-Atmos., 129, e2023JD038719, https://doi.org/10.1029/2023JD038719, 2024.
Breitenbach, S. F. M., Adkins, J. F., Meyer, H., Marwan, N., Kumar, K. K., and Haug, G. H.: Strong influence of water vapor source dynamics on stable isotopes in precipitation observed in Southern Meghalaya, NE India, Earth Planet. Sc. Lett., 292, 212–220, https://doi.org/10.1016/j.epsl.2010.01.038, 2010.
Brook, E. J. and Buizert, C.: Antarctic and global climate history viewed from ice cores, Nature, 558, 200–208, https://doi.org/10.1038/s41586-018-0172-5, 2018.
Buckingham, F. L., Carolin, S. A., Partin, J. W., Adkins, J. F., Cobb, K. M., Day, C. C., Ding, Q., He, C., Liu, Z., Otto-Bliesner, B., Roberts, W. H. G., Lejau, S., and Malang, J.: Termination 1 Millennial-Scale Rainfall Events Over the Sunda Shelf, Geophys. Res. Lett., 49, e2021GL096937, https://doi.org/10.1029/2021GL096937, 2022.
Caballero-Gill, R. P., Clemens, S. C., and Prell, W. L.: Direct correlation of Chinese speleothem δ18O and South China Sea planktonic δ18O: Transferring a speleothem chronology to the benthic marine chronology, Paleoceanography, 27, https://doi.org/10.1029/2011PA002268, 2012.
Cai, Y., Fung, I. Y., Edwards, R. L., An, Z., Cheng, H., Lee, J.-E., Tan, L., Shen, C.-C., Wang, X., Day, J. A., Zhou, W., Kelly, M. J., and Chiang, J. C. H.: Variability of stalagmite-inferred Indian monsoon precipitation over the past 252 000 yr, P. Natl. Acad. Sci. USA, 112, 2954–2959, https://doi.org/10.1073/pnas.1424035112, 2015.
Caillon, N., Severinghaus, J. P., Jouzel, J., Barnola, J.-M., Kang, J., and Lipenkov, V. Y.: Timing of Atmospheric CO2 and Antarctic Temperature Changes Across Termination III, Science, 299, 1728–1731, https://doi.org/10.1126/science.1078758, 2003.
Caley, T., Roche, D. M., Waelbroeck, C., and Michel, E.: Oxygen stable isotopes during the Last Glacial Maximum climate: perspectives from data–model (iLOVECLIM) comparison, Clim. Past, 10, 1939–1955, https://doi.org/10.5194/cp-10-1939-2014, 2014.
Capron, E., Rovere, A., Austermann, J., Axford, Y., Barlow, N. L. M., Carlson, A. E., de Vernal, A., Dutton, A., Kopp, R. E., McManus, J. F., Menviel, L., Otto-Bliesner, B. L., Robinson, A., Shakun, J. D., Tzedakis, P. C., and Wolff, E. W.: Challenges and research priorities to understand interactions between climate, ice sheets and global mean sea level during past interglacials, Quaternary Sci. Rev., 219, 308–311, https://doi.org/10.1016/j.quascirev.2019.06.030, 2019.
Carlson, A. E. and Winsor, K.: Northern Hemisphere ice-sheet responses to past climate warming, Nat. Geosci., 5, 607–613, https://doi.org/10.1038/ngeo1528, 2012.
Carolin, S. A., Cobb, K. M., Lynch-Stieglitz, J., Moerman, J. W., Partin, J. W., Lejau, S., Malang, J., Clark, B., Tuen, A. A., and Adkins, J. F.: Northern Borneo stalagmite records reveal West Pacific hydroclimate across MIS 5 and 6, Earth Planet. Sc. Lett., 439, 182–193, https://doi.org/10.1016/j.epsl.2016.01.028, 2016.
Cheng, H., Edwards, R. L., Wang, Y., Kong, X., Ming, Y., Kelly, M. J., Wang, X., Gallup, C. D., and Liu, W.: A penultimate glacial monsoon record from Hulu Cave and two-phase glacial terminations, Geology, 34, 217–220, https://doi.org/10.1130/G22289.1, 2006.
Cheng, H., Edwards, R. L., Broecker, W. S., Denton, G. H., Kong, X., Wang, Y., Zhang, R., and Wang, X.: Ice Age Terminations, Science, 326, 248–252, https://doi.org/10.1126/science.1177840, 2009.
Cheng, H., Sinha, A., Cruz, F. W., Wang, X., Edwards, R. L., d'Horta, F. M., Ribas, C. C., Vuille, M., Stott, L. D., and Auler, A. S.: Climate change patterns in Amazonia and biodiversity, Nat. Commun., 4, 1411, https://doi.org/10.1038/ncomms2415, 2013.
Cheng, H., Edwards, R. L., Sinha, A., Spötl, C., Yi, L., Chen, S., Kelly, M., Kathayat, G., Wang, X., Li, X., Kong, X., Wang, Y., Ning, Y., and Zhang, H.: The Asian monsoon over the past 640 000 years and ice age terminations, Nature, 534, 640–646, https://doi.org/10.1038/nature18591, 2016a.
Cheng, H., Spötl, C., Breitenbach, S. F. M., Sinha, A., Wassenburg, J. A., Jochum, K. P., Scholz, D., Li, X., Yi, L., Peng, Y., Lv, Y., Zhang, P., Votintseva, A., Loginov, V., Ning, Y., Kathayat, G., and Edwards, R. L.: Climate variations of Central Asia on orbital to millennial timescales, Sci. Rep.-UK, 6, 36975, https://doi.org/10.1038/srep36975, 2016b.
Cheng, H., Springer, G. S., Sinha, A., Hardt, B. F., Yi, L., Li, H., Tian, Y., Li, X., Rowe, H. D., Kathayat, G., Ning, Y., and Edwards, R. L.: Eastern North American climate in phase with fall insolation throughout the last three glacial-interglacial cycles, Earth Planet. Sc. Lett., 522, 125–134, https://doi.org/10.1016/j.epsl.2019.06.029, 2019.
Chiang, J. C. H., Herman, M. J., Yoshimura, K., and Fung, I. Y.: Enriched East Asian oxygen isotope of precipitation indicates reduced summer seasonality in regional climate and westerlies, P. Natl. Acad. Sci. USA, 117, 14745–14750, https://doi.org/10.1073/pnas.1922602117, 2020.
Comas-Bru, L., Harrison, S. P., Werner, M., Rehfeld, K., Scroxton, N., Veiga-Pires, C., and SISAL working group members: Evaluating model outputs using integrated global speleothem records of climate change since the last glacial, Clim. Past, 15, 1557–1579, https://doi.org/10.5194/cp-15-1557-2019, 2019.
Comas-Bru, L., Atsawawaranunt, K., Harrison, S., and PAGES SISAL working group members: SISAL (Speleothem Isotopes Synthesis and AnaLysis Working Group) database version 2.0, University of Reading repository CentAUR [data set], https://doi.org/10.17864/1947.256, 2020a.
Comas-Bru, L., Rehfeld, K., Roesch, C., Amirnezhad-Mozhdehi, S., Harrison, S. P., Atsawawaranunt, K., Ahmad, S. M., Brahim, Y. A., Baker, A., Bosomworth, M., Breitenbach, S. F. M., Burstyn, Y., Columbu, A., Deininger, M., Demény, A., Dixon, B., Fohlmeister, J., Hatvani, I. G., Hu, J., Kaushal, N., Kern, Z., Labuhn, I., Lechleitner, F. A., Lorrey, A., Martrat, B., Novello, V. F., Oster, J., Pérez-Mejías, C., Scholz, D., Scroxton, N., Sinha, N., Ward, B. M., Warken, S., Zhang, H., and SISAL Working Group members: SISALv2: a comprehensive speleothem isotope database with multiple age–depth models, Earth Syst. Sci. Data, 12, 2579–2606, https://doi.org/10.5194/essd-12-2579-2020, 2020b.
Dallmeyer, A., Claussen, M., and Otto, J.: Contribution of oceanic and vegetation feedbacks to Holocene climate change in monsoonal Asia, Clim. Past, 6, 195–218, https://doi.org/10.5194/cp-6-195-2010, 2010.
Dansgaard, W.: The O18-abundance in fresh water, Geochim. Cosmochim. Ac., 6, 241–260, https://doi.org/10.1016/0016-7037(54)90003-4, 1954.
Dansgaard, W.: Stable isotopes in precipitation, Tellus, 16, 436–468, https://doi.org/10.3402/tellusa.v16i4.8993, 1964.
Demény, A., Rinyu, L., Kern, Z., Hatvani, I. G., Czuppon, G., Surányi, G., Leél-Őssy, S., Shen, C.-C., and Koltai, G.: Paleotemperature reconstructions using speleothem fluid inclusion analyses from Hungary, Chem. Geol., 563, 120051, https://doi.org/10.1016/j.chemgeo.2020.120051, 2021.
Denton, G. H., Alley, R. B., Comer, G. C., and Broecker, W. S.: The role of seasonality in abrupt climate change, Quaternary Sci. Rev., 24, 1159–1182, https://doi.org/10.1016/j.quascirev.2004.12.002, 2005.
Denton, G. H., Anderson, R. F., Toggweiler, J. R., Edwards, R. L., Schaefer, J. M., and Putnam, A. E.: The Last Glacial Termination, Science, 328, 1652–1656, https://doi.org/10.1126/science.1184119, 2010.
DiNezio, P. N. and Tierney, J. E.: The effect of sea level on glacial Indo-Pacific climate, Nat. Geosci., 6, 485–491, https://doi.org/10.1038/ngeo1823, 2013.
Di Nezio, P. N., Timmermann, A., Tierney, J. E., Jin, F.-F., Otto-Bliesner, B., Rosenbloom, N., Mapes, B., Neale, R., Ivanovic, R. F., and Montenegro, A.: The climate response of the Indo-Pacific warm pool to glacial sea level, Paleoceanography, 31, 866–894, https://doi.org/10.1002/2015PA002890, 2016.
Dong, X., Kathayat, G., Rasmussen, S. O., Svensson, A., Severinghaus, J. P., Li, H., Sinha, A., Xu, Y., Zhang, H., Shi, Z., Cai, Y., Pérez-Mejías, C., Baker, J., Zhao, J., Spötl, C., Columbu, A., Ning, Y., Stríkis, N. M., Chen, S., Wang, X., Gupta, A. K., Dutt, S., Zhang, F., Cruz, F. W., An, Z., Lawrence Edwards, R., and Cheng, H.: Coupled atmosphere-ice-ocean dynamics during Heinrich Stadial 2, Nat. Commun., 13, 5867, https://doi.org/10.1038/s41467-022-33583-4, 2022.
Drysdale, R. N., Hellstrom, J. C., Zanchetta, G., Fallick, A. E., Sánchez Goñi, M. F., Couchoud, I., McDonald, J., Maas, R., Lohmann, G., and Isola, I.: Evidence for Obliquity Forcing of Glacial Termination II, Science, 325, 1527–1531, https://doi.org/10.1126/science.1170371, 2009.
Du, X., Russell, J. M., Liu, Z., Otto-Bliesner, B. L., Gao, Y., Zhu, C., Oppo, D. W., Mohtadi, M., Yan, Y., Galy, V. V., and He, C.: Deglacial trends in Indo-Pacific warm pool hydroclimate in an isotope-enabled Earth system model and implications for isotope-based paleoclimate reconstructions, Quaternary Sci. Rev., 270, 107188, https://doi.org/10.1016/j.quascirev.2021.107188, 2021.
Duplessy, J. C., Bard, E., Arnold, M., Shackleton, N. J., Duprat, J., and Labeyrie, L.: How fast did the ocean – atmosphere system run during the last deglaciation?, Earth Planet. Sc. Lett., 103, 27–40, https://doi.org/10.1016/0012-821X(91)90147-A, 1991.
Duplessy, J.-C., Labeyrie, L., and Waelbroeck, C.: Constraints on the ocean oxygen isotopic enrichment between the Last Glacial Maximum and the Holocene: Paleoceanographic implications, Quaternary Sci. Rev., 21, 315–330, https://doi.org/10.1016/S0277-3791(01)00107-X, 2002.
Elderfield, H., Ferretti, P., Greaves, M., Crowhurst, S., McCave, I. N., Hodell, D., and Piotrowski, A. M.: Evolution of Ocean Temperature and Ice Volume Through the Mid-Pleistocene Climate Transition, Science, 337, 704–709, https://doi.org/10.1126/science.1221294, 2012.
Fairchild, I. J. and Treble, P. C.: Trace elements in speleothems as recorders of environmental change, Quaternary Sci. Rev., 28, 449–468, https://doi.org/10.1016/j.quascirev.2008.11.007, 2009.
Fairchild, I. J., Borsato, A., Tooth, A. F., Frisia, S., Hawkesworth, C. J., Huang, Y., McDermott, F., and Spiro, B.: Controls on trace element (Sr–Mg) compositions of carbonate cave waters: implications for speleothem climatic records, Chem. Geol., 166, 255–269, https://doi.org/10.1016/S0009-2541(99)00216-8, 2000.
Fernandez, A., Løland, M. H., Maccali, J., Krüger, Y., Vonhof, H. B., Sodemann, H., and Meckler, A. N.: Characterization and Correction of Evaporative Artifacts in Speleothem Fluid Inclusion Isotope Analyses as Applied to a Stalagmite From Borneo, Geochem. Geophy. Geosy., 24, e2023GC010857, https://doi.org/10.1029/2023GC010857, 2023.
Fischer, H., Wahlen, M., Smith, J., Mastroianni, D., and Deck, B.: Ice Core Records of Atmospheric CO2 Around the Last Three Glacial Terminations, Science, 283, 1712–1714, https://doi.org/10.1126/science.283.5408.1712, 1999.
Fohlmeister, J.: A statistical approach to construct composite climate records of dated archives, Quat. Geochronol., 14, 48–56, https://doi.org/10.1016/j.quageo.2012.06.007, 2012.
Fohlmeister, J., Arps, J., Spötl, C., Schröder-Ritzrau, A., Plessen, B., Günter, C., Frank, N., and Trüssel, M.: Carbon and oxygen isotope fractionation in the water-calcite-aragonite system, Geochim. Cosmochim. Ac., 235, 127–139, https://doi.org/10.1016/j.gca.2018.05.022, 2018.
Frumkin, A., Ford, D. C., and Schwarcz, H. P.: Continental Oxygen Isotopic Record of the Last 170 000 Years in Jerusalem, Quaternary Res., 51, 317–327, https://doi.org/10.1006/qres.1998.2031, 1999.
Gallup, C. D., Cheng, H., Taylor, F. W., and Edwards, R. L.: Direct Determination of the Timing of Sea Level Change During Termination II, Science, 295, 310–313, https://doi.org/10.1126/science.1065494, 2002.
Gat, J. R.: Oxygen and Hydrogen Isotopes in the Hydrologic Cycle, Annu. Rev. Earth Pl. Sc., 24, 225–262, https://doi.org/10.1146/annurev.earth.24.1.225, 1996.
Genty, D., Baker, A., Massault, M., Proctor, C., Gilmour, M., Pons-Branchu, E., and Hamelin, B.: Dead carbon in stalagmites: carbonate bedrock paleodissolution vs. ageing of soil organic matter. Implications for 13C variations in speleothems, Geochim. Cosmochim. Ac., 65, 3443–3457, https://doi.org/10.1016/S0016-7037(01)00697-4, 2001.
Genty, D., Blamart, D., Ouahdi, R., Gilmour, M., Baker, A., Jouzel, J., and Van-Exter, S.: Precise dating of Dansgaard–Oeschger climate oscillations in western Europe from stalagmite data, Nature, 421, 833–837, https://doi.org/10.1038/nature01391, 2003.
Genty, D., Blamart, D., Ghaleb, B., Plagnes, V., Causse, Ch., Bakalowicz, M., Zouari, K., Chkir, N., Hellstrom, J., Wainer, K., and Bourges, F.: Timing and dynamics of the last deglaciation from European and North African δ13C stalagmite profiles – comparison with Chinese and South Hemisphere stalagmites, Quaternary Sci. Rev., 25, 2118–2142, https://doi.org/10.1016/j.quascirev.2006.01.030, 2006.
Grant, K. M., Rohling, E. J., Bar-Matthews, M., Ayalon, A., Medina-Elizalde, M., Ramsey, C. B., Satow, C., and Roberts, A. P.: Rapid coupling between ice volume and polar temperature over the past 150 000 years, Nature, 491, 744–747, https://doi.org/10.1038/nature11593, 2012.
Grant, K. M., Rohling, E. J., Ramsey, C. B., Cheng, H., Edwards, R. L., Florindo, F., Heslop, D., Marra, F., Roberts, A. P., Tamisiea, M. E., and Williams, F.: Sea-level variability over five glacial cycles, Nat. Commun., 5, 5076, https://doi.org/10.1038/ncomms6076, 2014.
Hardt, B., Rowe, H. D., Springer, G. S., Cheng, H., and Edwards, R. L.: The seasonality of east central North American precipitation based on three coeval Holocene speleothems from southern West Virginia, Earth Planet. Sc. Lett., 295, 342–348, https://doi.org/10.1016/j.epsl.2010.04.002, 2010.
Harmon, R. S., Schwarcz, H. P., and O'Neil, J. R.: D/H ratios in speleothem fluid inclusions: A guide to variations in the isotopic composition of meteoric precipitation?, Earth Planet. Sc. Lett., 42, 254–266, https://doi.org/10.1016/0012-821X(79)90033-5, 1979.
He, C., Liu, Z., Otto-Bliesner, B. L., Brady, E. C., Zhu, C., Tomas, R., Clark, P. U., Zhu, J., Jahn, A., Gu, S., Zhang, J., Nusbaumer, J., Noone, D., Cheng, H., Wang, Y., Yan, M., and Bao, Y.: Hydroclimate footprint of pan-Asian monsoon water isotope during the last deglaciation, Sci. Adv., 7, eabe2611, https://doi.org/10.1126/sciadv.abe2611, 2021.
Held, F., Cheng, H., Edwards, R. L., Tüysüz, O., Koç, K., and Fleitmann, D.: Dansgaard-Oeschger cycles of the penultimate and last glacial period recorded in stalagmites from Türkiye, Nat. Commun., 15, 1183, https://doi.org/10.1038/s41467-024-45507-5, 2024.
Hobart, B., Lisiecki, L. E., Rand, D., Lee, T., and Lawrence, C. E.: Late Pleistocene 100 kyr glacial cycles paced by precession forcing of summer insolation, Nat. Geosci., 16, 717–722, https://doi.org/10.1038/s41561-023-01235-x, 2023.
Ivanovic, R. F., Gregoire, L. J., Kageyama, M., Roche, D. M., Valdes, P. J., Burke, A., Drummond, R., Peltier, W. R., and Tarasov, L.: Transient climate simulations of the deglaciation 21–9 thousand years before present (version 1) – PMIP4 Core experiment design and boundary conditions, Geosci. Model Dev., 9, 2563–2587, https://doi.org/10.5194/gmd-9-2563-2016, 2016.
Jackson, L. C. and Wood, R. A.: Timescales of AMOC decline in response to fresh water forcing, Clim. Dynam., 51, 1333–1350, https://doi.org/10.1007/s00382-017-3957-6, 2018.
Johnson, K. R., Hu, C., Belshaw, N. S., and Henderson, G. M.: Seasonal trace-element and stable-isotope variations in a Chinese speleothem: The potential for high-resolution paleomonsoon reconstruction, Earth Planet. Sc. Lett., 244, 394–407, https://doi.org/10.1016/j.epsl.2006.01.064, 2006.
Kathayat, G., Cheng, H., Sinha, A., Spötl, C., Edwards, R. L., Zhang, H., Li, X., Yi, L., Ning, Y., Cai, Y., Lui, W. L., and Breitenbach, S. F. M.: Indian monsoon variability on millennial-orbital timescales, Sci. Rep.-UK, 6, 24374, https://doi.org/10.1038/srep24374, 2016.
Kaushal, N., Lechleitner, F. A., Wilhelm, M., Azennoud, K., Bühler, J. C., Braun, K., Ait Brahim, Y., Baker, A., Burstyn, Y., Comas-Bru, L., Fohlmeister, J., Goldsmith, Y., Harrison, S. P., Hatvani, I. G., Rehfeld, K., Ritzau, M., Skiba, V., Stoll, H. M., Szűcs, J. G., Tanos, P., Treble, P. C., Azevedo, V., Baker, J. L., Borsato, A., Chawchai, S., Columbu, A., Endres, L., Hu, J., Kern, Z., Kimbrough, A., Koç, K., Markowska, M., Martrat, B., Masood Ahmad, S., Nehme, C., Novello, V. F., Pérez-Mejías, C., Ruan, J., Sekhon, N., Sinha, N., Tadros, C. V., Tiger, B. H., Warken, S., Wolf, A., Zhang, H., and SISAL Working Group members: SISALv3: a global speleothem stable isotope and trace element database, Earth Syst. Sci. Data, 16, 1933–1963, https://doi.org/10.5194/essd-16-1933-2024, 2024a.
Kaushal, N., Lechleitner, F. A., Wilhelm, M., and PAGES SISAL working group members: SISALv3: Speleothem Isotopes Synthesis and AnaLysis database version 3.0, Oxford University Research Archive (ORA) [data set], https://doi.org/10.5287/ora-2nanwp4rk, 2024b.
Kawamura, K., Parrenin, F., Lisiecki, L., Uemura, R., Vimeux, F., Severinghaus, J. P., Hutterli, M. A., Nakazawa, T., Aoki, S., Jouzel, J., Raymo, M. E., Matsumoto, K., Nakata, H., Motoyama, H., Fujita, S., Goto-Azuma, K., Fujii, Y., and Watanabe, O.: Northern Hemisphere forcing of climatic cycles in Antarctica over the past 360 000 years, Nature, 448, 912–916, https://doi.org/10.1038/nature06015, 2007.
Kelly, M. J., Edwards, R. L., Cheng, H., Yuan, D., Cai, Y., Zhang, M., Lin, Y., and An, Z.: High resolution characterization of the Asian Monsoon between 146 000 and 99 000 years B. P. from Dongge Cave, China and global correlation of events surrounding Termination II, Palaeogeogr. Palaeocl., 236, 20–38, https://doi.org/10.1016/j.palaeo.2005.11.042, 2006.
Kim, S.-T., Mucci, A., and Taylor, B. E.: Phosphoric acid fractionation factors for calcite and aragonite between 25 and 75 °C: Revisited, Chem. Geol., 246, 135–146, https://doi.org/10.1016/j.chemgeo.2007.08.005, 2007.
Kimbrough, A. K., Gagan, M. K., Dunbar, G. B., Hantoro, W. S., Shen, C.-C., Hu, H.-M., Cheng, H., Edwards, R. L., Rifai, H., and Suwargadi, B. W.: Multi-proxy validation of glacial-interglacial rainfall variations in southwest Sulawesi, Commun. Earth Environ., 4, 1–13, https://doi.org/10.1038/s43247-023-00873-8, 2023.
Koltai, G., Spötl, C., Shen, C.-C., Wu, C.-C., Rao, Z., Palcsu, L., Kele, S., Surányi, G., and Bárány-Kevei, I.: A penultimate glacial climate record from southern Hungary, J. Quaternary Sci., 32, 946–956, https://doi.org/10.1002/jqs.2968, 2017.
Lachniet, M. S., Denniston, R. F., Asmerom, Y., and Polyak, V. J.: Orbital control of western North America atmospheric circulation and climate over two glacial cycles, Nat. Commun., 5, 3805, https://doi.org/10.1038/ncomms4805, 2014.
Lamy, F., Kaiser, J., Arz, H. W., Hebbeln, D., Ninnemann, U., Timm, O., Timmermann, A., and Toggweiler, J. R.: Modulation of the bipolar seesaw in the Southeast Pacific during Termination 1, Earth Planet. Sc. Lett., 259, 400–413, https://doi.org/10.1016/j.epsl.2007.04.040, 2007.
Lea, D. W., Pak, D. K., Peterson, L. C., and Hughen, K. A.: Synchroneity of Tropical and High-Latitude Atlantic Temperatures over the Last Glacial Termination, Science, 301, 1361–1364, https://doi.org/10.1126/science.1088470, 2003.
Lechleitner, F. A., Day, C. C., Kost, O., Wilhelm, M., Haghipour, N., Henderson, G. M., and Stoll, H. M.: Stalagmite carbon isotopes suggest deglacial increase in soil respiration in western Europe driven by temperature change, Clim. Past, 17, 1903–1918, https://doi.org/10.5194/cp-17-1903-2021, 2021.
Lisiecki, L. E. and Raymo, M. E.: Plio–Pleistocene climate evolution: trends and transitions in glacial cycle dynamics, Quaternary Sci. Rev., 26, 56–69, https://doi.org/10.1016/j.quascirev.2006.09.005, 2007.
Lisiecki, L. E. and Stern, J. V.: Regional and global benthic δ18O stacks for the last glacial cycle, Paleoceanography, 31, https://doi.org/10.1002/2016PA003002, 2016.
Liu, X., Rao, Z., Zhang, X., Huang, W., Chen, J., and Chen, F.: Variations in the oxygen isotopic composition of precipitation in the Tianshan Mountains region and their significance for the Westerly circulation, J. Geogr. Sci., 25, 801–816, https://doi.org/10.1007/s11442-015-1203-x, 2015.
Liu, Z., Otto-Bliesner, B. L., He, F., Brady, E. C., Tomas, R., Clark, P. U., Carlson, A. E., Lynch-Stieglitz, J., Curry, W., Brook, E., Erickson, D., Jacob, R., Kutzbach, J., and Cheng, J.: Transient Simulation of Last Deglaciation with a New Mechanism for Bølling-Allerød Warming, Science, 325, 310–314, https://doi.org/10.1126/science.1171041, 2009.
Liu, Z., Wen, X., Brady, E. C., Otto-Bliesner, B., Yu, G., Lu, H., Cheng, H., Wang, Y., Zheng, W., Ding, Y., Edwards, R. L., Cheng, J., Liu, W., and Yang, H.: Chinese cave records and the East Asia Summer Monsoon, Quaternary Sci. Rev., 83, 115–128, https://doi.org/10.1016/j.quascirev.2013.10.021, 2014.
Maher, B. A.: Holocene variability of the East Asian summer monsoon from Chinese cave records: a re-assessment, The Holocene, 18, 861–866, https://doi.org/10.1177/0959683608095569, 2008.
Matthews, A., Affek, H. P., Ayalon, A., Vonhof, H. B., and Bar-Matthews, M.: Eastern Mediterranean climate change deduced from the Soreq Cave fluid inclusion stable isotopes and carbonate clumped isotopes record of the last 160 ka, Quaternary Sci. Rev., 272, 107223, https://doi.org/10.1016/j.quascirev.2021.107223, 2021.
Meckler, A. N., Clarkson, M. O., Cobb, K. M., Sodemann, H., and Adkins, J. F.: Interglacial Hydroclimate in the Tropical West Pacific Through the Late Pleistocene, Science, 336, 1301–1304, https://doi.org/10.1126/science.1218340, 2012.
Meckler, A. N., Affolter, S., Dublyansky, Y. V., Krüger, Y., Vogel, N., Bernasconi, S. M., Frenz, M., Kipfer, R., Leuenberger, M., Spötl, C., Carolin, S., Cobb, K. M., Moerman, J., Adkins, J. F., and Fleitmann, D.: Glacial–interglacial temperature change in the tropical West Pacific: A comparison of stalagmite-based paleo-thermometers, Quaternary Sci. Rev., 127, 90–116, https://doi.org/10.1016/j.quascirev.2015.06.015, 2015.
Menviel, L., Capron, E., Govin, A., Dutton, A., Tarasov, L., Abe-Ouchi, A., Drysdale, R. N., Gibbard, P. L., Gregoire, L., He, F., Ivanovic, R. F., Kageyama, M., Kawamura, K., Landais, A., Otto-Bliesner, B. L., Oyabu, I., Tzedakis, P. C., Wolff, E., and Zhang, X.: The penultimate deglaciation: protocol for Paleoclimate Modelling Intercomparison Project (PMIP) phase 4 transient numerical simulations between 140 and 127 ka, version 1.0, Geosci. Model Dev., 12, 3649–3685, https://doi.org/10.5194/gmd-12-3649-2019, 2019.
Mitsui, T., Tzedakis, P. C., and Wolff, E. W.: Insolation evolution and ice volume legacies determine interglacial and glacial intensity, Clim. Past, 18, 1983–1996, https://doi.org/10.5194/cp-18-1983-2022, 2022.
Moseley, G. E., Spötl, C., Cheng, H., Boch, R., Min, A., and Edwards, R. L.: Termination-II interstadial/stadial climate change recorded in two stalagmites from the north European Alps, Quaternary Sci. Rev., 127, 229–239, https://doi.org/10.1016/j.quascirev.2015.07.012, 2015.
Nehme, C., Kluge, T., Verheyden, S., Nader, F., Charalambidou, I., Weissbach, T., Gucel, S., Cheng, H., Edwards, R. L., Satterfield, L., Eiche, E., and Claeys, P.: Speleothem record from Pentadactylos cave (Cyprus): new insights into climatic variations during MIS 6 and MIS 5 in the Eastern Mediterranean, Quaternary Sci. Rev., 250, 106663, https://doi.org/10.1016/j.quascirev.2020.106663, 2020.
Obase, T., Abe-Ouchi, A., and Saito, F.: Abrupt climate changes in the last two deglaciations simulated with different Northern ice sheet discharge and insolation, Sci. Rep.-UK, 11, 22359, https://doi.org/10.1038/s41598-021-01651-2, 2021.
Parker, S. E., Harrison, S. P., Comas-Bru, L., Kaushal, N., LeGrande, A. N., and Werner, M.: A data–model approach to interpreting speleothem oxygen isotope records from monsoon regions, Clim. Past, 17, 1119–1138, https://doi.org/10.5194/cp-17-1119-2021, 2021.
Pausata, F. S. R., Battisti, D. S., Nisancioglu, K. H., and Bitz, C. M.: Chinese stalagmite δ18O controlled by changes in the Indian monsoon during a simulated Heinrich event, Nat. Geosci., 4, 474–480, https://doi.org/10.1038/ngeo1169, 2011.
Pérez-Mejías, C., Moreno, A., Sancho, C., Bartolomé, M., Stoll, H., Cacho, I., Cheng, H., and Edwards, R. L.: Abrupt climate changes during Termination III in Southern Europe, P. Natl. Acad. Sci. USA, 114, 10047–10052, https://doi.org/10.1073/pnas.1619615114, 2017.
Raymo, M. E., Lisiecki, L. E., and Nisancioglu, K. H.: Plio-Pleistocene Ice Volume, Antarctic Climate, and the Global δ18O Record, Science, 313, 492–495, https://doi.org/10.1126/science.1123296, 2006.
Rehfeld, K. and Bühler, J.: Age-depth model ensembles for SISAL v3 speleothem records, Zenodo [data set], https://doi.org/10.5281/zenodo.10726619, 2024.
Rehfeld, K., Roesch, C., Comas-Bru, L., and Amirnezhad-Mozhdehi, S.: Age-depth model ensembles for SISAL v2 speleothem records (1.0), Zenodo [data set], https://doi.org/10.5281/zenodo.3816804, 2020.
Risi, C., Bony, S., and Vimeux, F.: Influence of convective processes on the isotopic composition (δ18O and δD) of precipitation and water vapor in the tropics: 2. Physical interpretation of the amount effect, J. Geophys. Res.-Atmos., 113, D19, https://doi.org/10.1029/2008JD009943, 2008.
Rozanski, K., Araguás-Araguás, L., and Gonfiantini, R.: Isotopic Patterns in Modern Global Precipitation, in: Geophysical Monograph Series, edited by: Swart, P. K., Lohmann, K. C., Mckenzie, J., and Savin, S., American Geophysical Union, Washington, D. C., 1–36, https://doi.org/10.1029/GM078p0001, 2013.
Schrag, D. P., Hampt, G., and Murray, D. W.: Pore Fluid Constraints on the Temperature and Oxygen Isotopic Composition of the Glacial Ocean, Science, 272, 1930–1932, https://doi.org/10.1126/science.272.5270.1930, 1996.
Schrag, D. P., Adkins, J. F., McIntyre, K., Alexander, J. L., Hodell, D. A., Charles, C. D., and McManus, J. F.: The oxygen isotopic composition of seawater during the Last Glacial Maximum, Quaternary Sci. Rev., 21, 331–342, https://doi.org/10.1016/S0277-3791(01)00110-X, 2002.
Shakun, J. D., Burns, S. J., Clark, P. U., Cheng, H., and Edwards, R. L.: Milankovitch-paced Termination II in a Nevada speleothem?, Geophys. Res. Lett., 38, 18, https://doi.org/10.1029/2011GL048560, 2011.
Shakun, J. D., Lea, D. W., Lisiecki, L. E., and Raymo, M. E.: An 800 kyr record of global surface ocean δ18O and implications for ice volume-temperature coupling, Earth Planet. Sc. Lett., 426, 58–68, https://doi.org/10.1016/j.epsl.2015.05.042, 2015.
Sinha, A., Kathayat, G., Cheng, H., Breitenbach, S. F. M., Berkelhammer, M., Mudelsee, M., Biswas, J., and Edwards, R. L.: Trends and oscillations in the Indian summer monsoon rainfall over the last two millennia, Nat. Commun., 6, 6309, https://doi.org/10.1038/ncomms7309, 2015.
Sinha, N., Timmermann, A., Lee, S.-S., Jo, K.-N., Wassenburg, J., Cleary, D., and Yun, K.-S.: Orbital-scale Dynamics of the Eastern Asian Summer Monsoon, Research square [preprint], https://doi.org/10.21203/rs.3.rs-3691295/v1, 3 April 2024.
Sinnl, G., Adolphi, F., Christl, M., Welten, K. C., Woodruff, T., Caffee, M., Svensson, A., Muscheler, R., and Rasmussen, S. O.: Synchronizing ice-core and U / Th timescales in the Last Glacial Maximum using Hulu Cave 14C and new 10Be measurements from Greenland and Antarctica, Clim. Past, 19, 1153–1175, https://doi.org/10.5194/cp-19-1153-2023, 2023.
Spratt, R. M. and Lisiecki, L. E.: A Late Pleistocene sea level stack, Clim. Past, 12, 1079–1092, https://doi.org/10.5194/cp-12-1079-2016, 2016.
Stern, J. V. and Lisiecki, L. E.: Termination 1 timing in radiocarbon-dated regional benthic δ18O stacks, Paleoceanography, 29, 1127–1142, https://doi.org/10.1002/2014PA002700, 2014.
Stoll, H., Mendez-Vicente, A., Gonzalez-Lemos, S., Moreno, A., Cacho, I., Cheng, H., and Edwards, R. L.: Interpretation of orbital scale variability in mid-latitude speleothem δ18O: Significance of growth rate controlled kinetic fractionation effects, Quaternary Sci. Rev., 127, 215–228, https://doi.org/10.1016/j.quascirev.2015.08.025, 2015.
Stoll, H. M., Cacho, I., Gasson, E., Sliwinski, J., Kost, O., Moreno, A., Iglesias, M., Torner, J., Perez-Mejias, C., Haghipour, N., Cheng, H., and Edwards, R. L.: Rapid northern hemisphere ice sheet melting during the penultimate deglaciation, Nat. Commun., 13, 3819, https://doi.org/10.1038/s41467-022-31619-3, 2022.
Stoll, H. M., Day, C., Lechleitner, F., Kost, O., Endres, L., Sliwinski, J., Pérez-Mejías, C., Cheng, H., and Scholz, D.: Distinguishing the combined vegetation and soil component of δ13C variation in speleothem records from subsequent degassing and prior calcite precipitation effects, Clim. Past, 19, 2423–2444, https://doi.org/10.5194/cp-19-2423-2023, 2023.
Suwa, M. and Bender, M. L.: Chronology of the Vostok ice core constrained by ratios of occluded air, and its implication for the Vostok climate records, Quaternary Sci. Rev., 27, 1093–1106, https://doi.org/10.1016/j.quascirev.2008.02.017, 2008.
Tabor, C., Lofverstrom, M., Oster, J., Wortham, B., de Wet, C., Montañez, I., Rhoades, A., Zarzycki, C., He, C., and Liu, Z.: A mechanistic understanding of oxygen isotopic changes in the Western United States at the Last Glacial Maximum, Quaternary Sci. Rev., 274, 107255, https://doi.org/10.1016/j.quascirev.2021.107255, 2021.
Thomas, E. K., Clemens, S. C., Prell, W. L., Herbert, T. D., Huang, Y., Liu, Z., Sinninghe Damsté, J. S., Sun, Y., and Wen, X.: Temperature and leaf wax δ2H records demonstrate seasonal and regional controls on Asian monsoon proxies, Geology, 42, 1075–1078, https://doi.org/10.1130/G36289.1, 2014.
Tierney, J. E., Lewis, S. C., Cook, B. I., LeGrande, A. N., and Schmidt, G. A.: Model, proxy and isotopic perspectives on the East African Humid Period, Earth Planet. Sc. Lett., 307, 103–112, https://doi.org/10.1016/j.epsl.2011.04.038, 2011.
Tzedakis, P. C., Crucifix, M., Mitsui, T., and Wolff, E. W.: A simple rule to determine which insolation cycles lead to interglacials, Nature, 542, 427–432, https://doi.org/10.1038/nature21364, 2017.
Tzedakis, P. C., Drysdale, R. N., Margari, V., Skinner, L. C., Menviel, L., Rhodes, R. H., Taschetto, A. S., Hodell, D. A., Crowhurst, S. J., Hellstrom, J. C., Fallick, A. E., Grimalt, J. O., McManus, J. F., Martrat, B., Mokeddem, Z., Parrenin, F., Regattieri, E., Roe, K., and Zanchetta, G.: Enhanced climate instability in the North Atlantic and southern Europe during the Last Interglacial, Nat. Commun., 9, 4235, https://doi.org/10.1038/s41467-018-06683-3, 2018.
Waelbroeck, C., Labeyrie, L., Michel, E., Duplessy, J. C., McManus, J. F., Lambeck, K., Balbon, E., and Labracherie, M.: Sea-level and deep water temperature changes derived from benthic foraminifera isotopic records, Quaternary Sci. Rev., 21, 295–305, https://doi.org/10.1016/S0277-3791(01)00101-9, 2002.
Waelbroeck, C., Kiefer, T., Dokken, T., Chen, M.-T., Spero, H. J., Jung, S., Weinelt, M., Kucera, M., and Paul, A.: Constraints on surface seawater oxygen isotope change between the Last Glacial Maximum and the Late Holocene, Quaternary Sci. Rev., 105, 102–111, https://doi.org/10.1016/j.quascirev.2014.09.020, 2014.
Wainer, K., Genty, D., Blamart, D., Daëron, M., Bar-Matthews, M., Vonhof, H., Dublyansky, Y., Pons-Branchu, E., Thomas, L., van Calsteren, P., Quinif, Y., and Caillon, N.: Speleothem record of the last 180 ka in Villars cave (SW France): Investigation of a large δ18O shift between MIS6 and MIS5, Quaternary Sci. Rev., 30, 130–146, https://doi.org/10.1016/j.quascirev.2010.07.004, 2011.
Wassenburg, J. A., Vonhof, H. B., Cheng, H., Martínez-García, A., Ebner, P.-R., Li, X., Zhang, H., Sha, L., Tian, Y., Edwards, R. L., Fiebig, J., and Haug, G. H.: Penultimate deglaciation Asian monsoon response to North Atlantic circulation collapse, Nat. Geosci., 14, 937–941, https://doi.org/10.1038/s41561-021-00851-9, 2021.
Wegwerth, A., Dellwig, O., Wulf, S., Plessen, B., Kleinhanns, I. C., Nowaczyk, N. R., Jiabo, L., and Arz, H. W.: Major hydrological shifts in the Black Sea “Lake” in response to ice sheet collapses during MIS 6 (130–184 ka BP), Quaternary Sci. Rev., 219, 126–144, https://doi.org/10.1016/j.quascirev.2019.07.008, 2019.
Wendt, K. A., Li, X., Edwards, R. L., Cheng, H., and Spötl, C.: Precise timing of MIS 7 substages from the Austrian Alps, Clim. Past, 17, 1443–1454, https://doi.org/10.5194/cp-17-1443-2021, 2021.
Wilcox, P. S., Honiat, C., Trüssel, M., Edwards, R. L., and Spötl, C.: Exceptional warmth and climate instability occurred in the European Alps during the Last Interglacial period, Commun. Earth Environ., 1, 1–6, https://doi.org/10.1038/s43247-020-00063-w, 2020.
Zhang, H., Ait Brahim, Y., Li, H., Zhao, J., Kathayat, G., Tian, Y., Baker, J., Wang, J., Zhang, F., Ning, Y., Edwards, R. L., and Cheng, H.: The Asian Summer Monsoon: Teleconnections and Forcing Mechanisms – A Review from Chinese Speleothem δ18O Records, Quaternary, 2, 26, https://doi.org/10.3390/quat2030026, 2019.
Zhao, Y. and Harrison, S. P.: Mid-Holocene monsoons: a multi-model analysis of the inter-hemispheric differences in the responses to orbital forcing and ocean feedbacks, Clim. Dynam., 39, 1457–1487, https://doi.org/10.1007/s00382-011-1193-z, 2012.
- Abstract
- Introduction
- Stalagmite records and data processing
- Speleothem records of diverse climate aspects over terminations
- Sequence of climate changes during terminations as tracked by speleothem records
- Discussion
- Further work
- Data availability
- Author contributions
- Competing interests
- Disclaimer
- Acknowledgements
- Financial support
- Review statement
- References
- Supplement