the Creative Commons Attribution 4.0 License.
the Creative Commons Attribution 4.0 License.
A new 1500-year-long varve thickness record from Labrador, Canada, uncovers significant insights into large-scale climate variability in the Atlantic
François Lapointe
Antoine Gagnon-Poiré
Patrick Lajeunesse
Clarence Gagnon
Grand Lake, located in Labrador, at the northeastern margin of North America, is a deep lacustrine basin that contains a well-preserved annual laminations record spanning the interval 493 to 2016 CE (1524 years). The chronology of this new varved sequence is established from layer counting of high-resolution images of thin sections. Radiometric dating (137Cs and 14C) validates the reliability of the varve chronology. Varve thickness is significantly correlated (r = 0.38) with the total precipitation recorded at the nearest weather station Goose A. The varve thickness series reveals high values during the 1050–1225 CE period, which corresponds to the Medieval Climate Anomaly, whereas the 15th–19th centuries, related to the Little Ice Age, shows low values. The teleconnections between several Goose A instrumental data series and some modes of climate variability such as the winter Greenland Blocking (negative North-Atlantic Oscillation) and the significant correlations between our varve thickness record and three other Northern Hemisphere high-resolution proxy records suggest that the Grand Lake record tracks North-Western Atlantic large-scale modes of hydroclimate variability over the past ∼ 1500 years.
- Article
(12075 KB) - Full-text XML
-
Supplement
(3811 KB) - BibTeX
- EndNote
Northeastern Canada experiences significant interannual to multidecadal climate variability driven by large-scale atmospheric and oceanic patterns, such as the North Atlantic Oscillation (NAO) and the Atlantic Multidecadal Variability (AMV) (Banfield and Jacobs, 1998; Boucher et al., 2017; Chartrand and Pausata, 2020; D'Arrigo et al., 2003; Dinis et al., 2019; Durkalec et al., 2016; Finnis and Bell, 2015; Way and Viau, 2015). This makes the region crucial for studying the Western North Atlantic hydroclimate system. However, the hydrological response to multidecadal climate variability remains poorly understood in northern Atlantic regions (Linderholm et al., 2018; Ljungqvist et al., 2016; IPCC, 2013). This gap is particularly evident in eastern Canada, where only two annually resolved hydrological reconstructions of boreal catchments exist, covering the last two centuries: one based on tree-ring datasets (Boucher et al., 2011; Dinis et al., 2019; Nasri et al., 2020; Nicault et al., 2014), and another derived from a short varve sediment sequence from Grand Lake (Gagnon-Poiré et al., 2021). Given that hydroelectricity is the primary energy source in eastern Canada, understanding the long-term evolution and mechanisms influencing hydroclimatic regimes is essential for sustainable planning. The short varve record at Grand Lake covering the 1856–2016 period demonstrated great potential for hydrological reconstruction (Gagnon-Poiré et al., 2021). Longer proxy-based reconstructions are still required for improving our knowledge of long-term regional hydrological variability. Developing longer annually resolved palaeohydrological records remains, however, a challenge due to the lifespan of trees, which rarely exceeds 300 years and because lakes containing well defined and continuous long annually laminated sequences are rare in boreal regions (Ramisch et al., 2020).
In this study, we present a new varve record from Grand Lake, Labrador that spans the last 1500 years. A new core located in the distal part of the sedimentary basin allows extending the Grand Lake varve dataset to the millennium scale. By using this new long Grand Lake varved sequence, this paper aims to produce the first reconstruction with annual resolution covering the last fifteen centuries at the western fringe of the Atlantic Ocean, allowing to improve our knowledge of the Western North Atlantic large-scale mode of climate variability.
Grand Lake, Labrador, is a 245 m-deep and 55 km-long fjord lake (Fig. 1) deglaciated ca. 8000 years ago (Dalton et al., 2020; Fulton and Hodgson, 1979; Occhietti et al., 2011; Trottier et al., 2020). The lake is located at the eastern margin of North America in the high boreal forest ecoregion, one of the most temperate climates in Labrador. This region is influenced by temperate continental westerly and southwesterly winds and maritime conditions from the Labrador Sea and Labrador Current. Winter temperatures can fall well below freezing, with average lows between −10 and −20 °C. In contrast, summers are cool, with average temperatures ranging from 10 to 15 °C. Yet, the region experiences strong seasonal variability, with long, harsh winters and short, temperate summers. Labrador's climate is moist, receiving ample annual precipitation, primarily from snow during the long winter months and rain in the summer. Annual precipitation totals are between 800 and 1200 mm, depending on proximity to the coast, with the heaviest amounts near the Labrador Sea due to maritime influences. Freeze-up of local lakes occurs in late fall, and ice break-up happens from late spring to early summer. Ice coverage on the lake is significant due to the cold air and water masses associated with the Labrador Current, which prolongs the winter-like conditions and results in snow cover persisting from late October to early May. Hence, sediment deposition can occur only from early May to late November through snow melt and summer rain events.
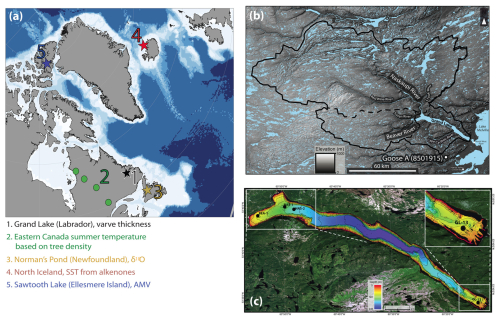
Figure 1(a) Location map of the site and the records mentioned in the paper. (b) Grand Lake watershed (black line) and its main tributaries. The Goose A weather station (8501915) is represented by the white dot. (c) High-resolution swath bathymetry (3 m resolution) of Grand Lake (Trottier et al., 2020) coupled with a Landsat image (USGS) and coring site locations. Isobath (30 m). Cores BEA-1 NAS-1 et NAS-2 are short proximal cores from Gagnon-Poiré et al. (2021); GL-13 points to the location of the cores from this study. Modified from Gagnon-Poiré et al. (2021).
The lake is fed by two large rivers located at its western end (Fig. 1b) that transport a substantial amount of sediments. The Naskaupi River supplies ∼ 70 km3 a−1 of freshwater (Kamula et al., 2017) into Grand Lake and is the second largest river in Labrador. The Beaver River is the second main tributary of the lake. Regional streamflow regime is classified as nival (snowmelt dominated) (Bonsal et al., 2019). Grand Lake flows into a small tidal lake (Little Lake) and subsequently towards Lake Melville by the small town of North West River.
3.1 Sediment coring and analysis
Sediment cores were collected at four sites in Grand Lake (Fig. 1c). During winter 2017, cores BEA-1, NAS-1 and NAS-2 (30 to 120 cm-long) were collected near Grand Lake's main tributaries using a UWITEC percussion corer (Gagnon-Poiré et al., 2021) at depths of 90 to 165 m. Proximal sites BEA-1, NAS-1 and NAS-2 and their 160 year-long (1856–2016 CE) varve sequences were previously presented and discussed in Gagnon-Poiré et al. (2021). These cores were used to reconstruct the average discharge (Q-mean) of the Naskaupi River.
Core GL17-13A (320 cm-long) was collected in 2017 using a Rossfelder Corp. submersible vibracorer at a site near the lake outlet at a depth of 75 m, ∼ 45 km downstream from the lake head (Fig. 1c). This site has a lower sedimentation rate allowing for reaching older sediments. The aluminum core tube was cut in the field in three sections to ease its transport. Since the upper 10 cm of the vibracore GL17-13A were not well preserved, two other cores (GL20-13A and GL20-13B) were collected during winter 2020 from the same site using a UWITEC percussion corer to obtain a better quality upper sedimentary sequence.
The cores were first scanned using a Siemens SOMATOM Definition AS+ 128 medical CT-Scanner for previsualization and identification of laminated facies. The cores were then opened, described and photographed with a high-resolution line-scan camera mounted on an ITRAX core scanner (RGB colour images; 50 µm-pixel size). Geochemical X-ray microfluorescence (µXRF) analysis was performed on the core half (30 kV and 30 mA) using the same instrument at a down-core resolution of 100 µm and an exposure time of 5 s. µXRF element profiles were used to visualize varves boundaries (Croudace et al., 2006; Cuven et al., 2010; Kylander et al., 2011).
Thirty-seven overlapping thin sections were made to cover the entire GL-13 sedimentary sequence following the protocol described in detail by Normandeau et al. (2019), that includes sediment blocks subsampling and embedding in resin. Digital images of the thin sections were obtained using a transparency flatbed scanner at 2400 dpi resolution (1 pixel = 10.6 µm) using two polarized filters at 90°, sandwiching the thin section between the filters to produce crossed- polarized light. Thin sections were also observed using a Zeiss EVO 50 Scanning Electron Microscope (SEM) in backscattered mode using the custom-made Analyse Image software (Francus and Nobert, 2007) to obtain a continuous profile of high-resolution images (pixel size = 1 µm) (Lapointe et al., 2012).
3.2 Chronology
3.2.1 Counting and measuring laminations
A composite laminated sediment sequence was assembled from the overlapping thin sections, starting with GL20-13B that better preserved surface sediments (Fig. 2a). Correlation between the two cores was made using marker beds clearly visible in both cores. The laminations were counted twice on the crossed-polarized images (pixel size = 10.6 µm) of the thin sections by two independent observers (Antoine Gagnon-Poiré (AGP) and Clarence Gagnon (CG)) using Analyse Image software (Francus and Nobert, 2007). The counts and the position of the varve boundaries were validated using SEM images in backscattered mode (Fig. 2d) that allow a better view of the sediment structure thanks to a strong contrast between the matrix and the grains (Francus, 1998). In areas where the two initial counts were not similar, two complementary counts were made using the PeakCounter software (Marshall et al., 2012) that uses the µXRF profiles as additional information. An error estimate was calculated based on the difference in the number of laminations counted.
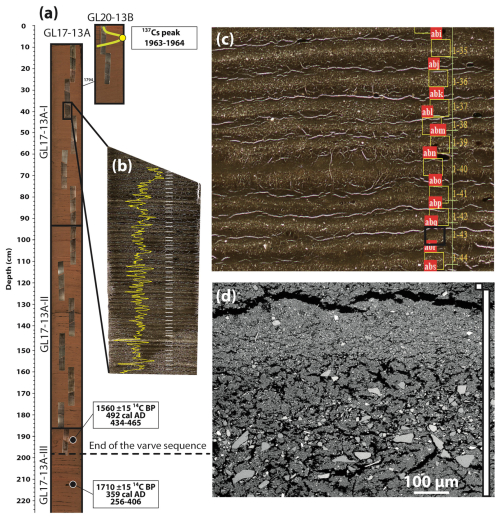
Figure 2(a) Photograph of core GL17-13A and GL20-13B overlain by thin section images constituting the composite sequence. Black horizontal lines indicate the core cuts. (b) Photograph of a thin section showing the distal varve facies from site GL-13. Thin sections are overlain by iron relative intensities obtained using µXRF (yellow line) and by horizontal white bars marking the varve boundaries. (c) Close-up of a thin-section scan, with the varve boundaries marked by the horizontal yellow bars and the location of SEM images marked by yellow boxes with their red ID (abi to abs). (d) SEM backscattered image of a varve, with the vertical white boxes showing the varve extent; shown here is a view of the abr yellow box delimited in black on panel (c).
3.2.2 Radiometric dating
Two wood fragments located on CT scan radial images were handpicked from core GL17-13A for radiocarbon dating. Samples were sent to the Radiochronology Laboratory of the Centre d'Études Nordiques (Université Laval, Québec) for a HCl-NaOH-HCl pre-treatment and graphitization. The dating was performed by accelerator mass spectrometry (AMS) at the Earth System Science Department Keck Carbon Cycle AMS Facility at the University of California at Irvine. The dates obtained were calibrated with Calib 7.1 (Stuiver and Reimer, 1993) using the IntCal20 database (Reimer et al., 2020). Age-depth model based on radiocarbon dating was performed with the ClamR software version 2.2 (Blaauw, 2010) using a linear interpolation for the site GL-13 with 95 % confidence interval.
Two-cm thick subsamples from the GL20-13B surface sediment cores were measured for Cesium-137 (137Cs) activity (Ritchie and McHenry, 1990) using a high-resolution germanium diode gamma detector and multichannel analyzer gamma counter. The 137Cs activity was used to identify layers deposited during the 1963–1964 peak of nuclear tests.
3.3 Correlation of Grand Lake varve record with paleoclimatic time series
The annually resolved paleoclimatic series data were smoothed using a 21-year running mean to emphasize multi-decadal variability. This smoothing introduced strong temporal autocorrelation, which affects the validity of standard parametric tests that assume independent observations. To address this, a moving block bootstrap procedure was employed to provide robust inference on the significance of correlations between varve thickness (VT) at Grand Lake and each climate index. Bootstrap samples were generated by randomly sampling contiguous blocks of 21 years with replacement to preserve the autocorrelation structure. For each of the 1000-bootstraps replication, Pearson correlation coefficients and corresponding p-values between VT and each climate index were recalculated. The empirical distribution of these bootstrap p-values was then used to estimate robust mean p-values, reflecting the uncertainty in correlation significance under temporal dependence. This approach accounted for the reduced effective sample size and autocorrelation induced by smoothing, yielding more reliable estimates of correlation significance compared to conventional parametric methods.
3.4 Spectral analysis
To detect dominant periodicities in the varve thickness time series, we conducted a classical spectral analysis using the spec.pgram() function from base R. A linear trend was first removed to emphasize cyclic variability over long-term trends. Frequencies were converted to periods (1 per frequency) to aid interpretation in terms of years. From the resulting spectrum, we extracted the ten highest spectral density peaks, corresponding to the most energetic and statistically significant periodic signals. To assess statistical significance, we estimated 95 % and 99 % confidence levels for spectral power under the null hypothesis of red noise (autoregressive AR(1) background). These thresholds were computed based on the lag-1 autocorrelation of the input time series and overlaid on the periodogram to identify peaks that significantly exceeded expected background variability.
Wavelet analysis was conducted using the package WaveletComp in R (R Core Team, 2025). The analysis outlines the > 95 % confidence levels. Statistical significance was assessed using 100 Monte Carlo simulations that were performed to estimate the distribution of wavelet power under a red-noise (AR(1)) null model.
3.5 Spatial correlation
Correlation maps of instrumental climate data were prepared using the Climate Explorer tool that is managed by the Royal Netherlands Meteorological Institute (van Oldenborgh and Burgers, 2005). Atmospheric pressure data are from ERA-Interim reanalysis (Dee et al., 2011), sea surface temperature data are the Extended SST v5 from NOAA (National Oceanic and Atmospheric Administration) (Huang et al., 2022), and precipitation anomalies from the NCEP/NCAR (National Centers for Environmental Prediction/National Center for Atmospheric Research Reanalysis) (Kalnay et al., 1996).
4.1 Sediment facies
Sediments retrieved at site GL-13 near the lake outlet consist of laminated minerogenic material (Fig. 2). The upper section of the core (0–200 cm) comprises clear and distinct thin laminations having an average thickness of 1.26 mm (Fig. 2b, c). The observed laminations are horizontal and continuous over this entire interval. The laminations are made of 2 layers. The base layer is a silty-clay sediment matrix containing angular and rounded grains ranging from very fine sands to fine silts (Fig. 2c, d). The upper layer of the lamination consists of a clay cap rich in Fe (Fig. 2b, c, d).
Below 200 cm depth, these thin laminations disappear, marking a clear stratigraphic transition.
4.2 Chronology
Core GL20-13B was used to build the upper part of the chronology, as it was not disturbed. The first complete lamination below the sediment surface was considered to represent 2017 CE, as two additional laminations were visible in the parallel disturbed core (i.e., GL20-13A). The upper laminated sequence chronology is consistent with the Cesium-137 main peaks found at 5 cm depth in core GL20-13B (Fig. 2a and Fig. S1 in the Supplement), which confirm the varved nature of the distal laminations. Varve counts made between thick (coarse) distinctive laminations present in both cores GL17-13A and GL20-13B were identical, providing confidence that a composite sequence can be established (Fig. S1). The composite sequence count starts at the surface of the core GL20-13B (2017 CE) and switches to core GL17-13A at a marker bed dated 1794 CE in the varve chronology (Figs. 2a and S1). Three years were added at each of the two cuts made on the core GL17-13A. A 5.6 mm thick non-erosive rapidly deposited layer (RDL), dated CE 1392 was removed from the sequence.
For the composite core GL-13, the two counts using Analyse Image software show a very low counting error (±0.13 %), with a difference of only 4 laminations between them (Fig. 3). Sediment accumulation rates (or age depth model, Fig. 3) indicate that the input of clastic sediment at this site was relatively steady throughout the past 1500 years.
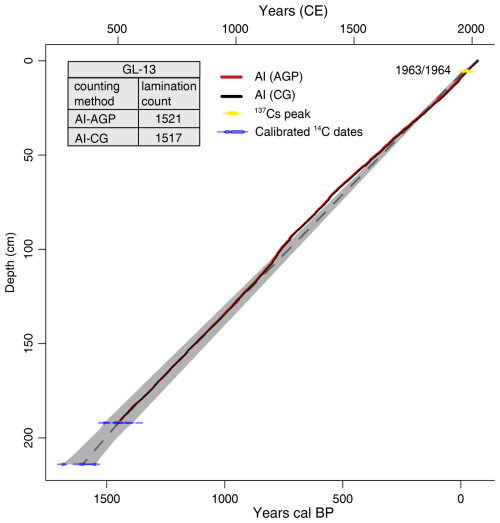
Figure 3Comparison of age-depth models for sites GL-13 based on two individual lamination counts (A.G.P. and C.G.) from thin sections using Image Analysis and from 137Cs and AMS 14C dating.
The base of the varve chronology in core GL-13 at 190.9 cm depth is 594 CE, in continuity with 2 radiocarbon dates (Table 1) that are 492 CE (192 cm depth) and 359 CE (214 cm depth).
4.3 The varve thickness record
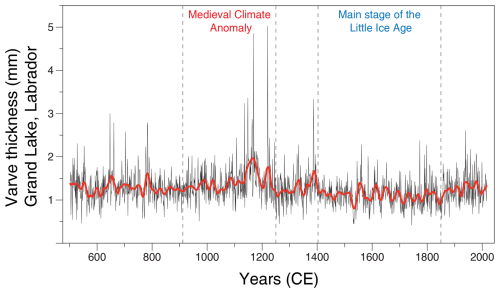
The raw varve lamination thickness time series of cores GL-13 is presented in Fig. 4. Log normal time-series were also produced for comparisons with other records (Figs. 7 and 8). Varves are thicker than the average between 1050 and 1225 CE. This interval corresponds to Medieval Climate Anomaly (900 to 1250 CE as defined by Mann et al., 2009), with the thickest varves occurring 1164, 1383, 1215, 1143, 1141 and 1132 CE. The values declined during the mid-1200s and remained reduced for several decades into the early 1300s, likely in response to the major volcanic eruption of Samalas in 1257 CE which cooled the climate and contributed to glacier expansion in the Canadian Arctic (Miller et al., 2012). Varves became consistently thinner than average during the 1400–1850 CE period, corresponding to the interval commonly referred to as the Little Ice Age (∼ 1400–1800 CE; Mann et al., 2009; Lapointe and Bradley, 2021). The recent decrease of varve thickness (Fig. 4) is within the limits of the variability of the last 1500 years. There is pronounced multidecadal variability throughout much of the record, particularly noticeable between ∼ 1100 and 1225 CE, as well as from 1500 to 1800 CE.
4.4 Spectral content
Figure 5a presents the spectral analysis of the VT time series, revealing multiple significant spectral peaks that exceed the 95 % confidence threshold. Among these are prominent cycles (> 99 % CL) at ∼ 7, 15, and 48 years, suggesting the presence of statistically robust periodic signals within the record. Complementing this, Fig. 5b displays the wavelet power spectrum of the 1500-year varve thickness record. The wavelet analysis highlights intermittent but recurring short-term periodicities, particularly in the 7–8-year range. These cycles are especially pronounced during three key intervals: 600–800 CE, ∼ 1100–1380 CE, and the later phase of the Little Ice Age (∼ 1600–1850 CE). Longer-term cycles, ranging from approximately 30 to 70 years, are also evident between 1050 and 1850 CE. These multi-decadal oscillations are particularly prominent during the 1500–1850 CE interval, suggesting a sustained influence of low-frequency climate variability during the latter part of the Little Ice Age.
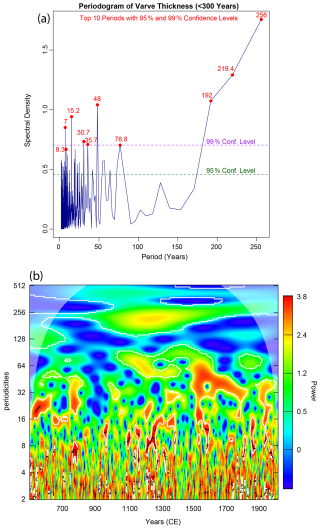
Figure 5(a) Periodogram of the varve thickness record. The top 10 periods with > 95 % confidence levels are indicated in red. (b) Wavelet analysis of the varve thickness record. White contours delimit areas of > 95 % confidence levels. The black dots represent a grid cell where the observed power exceeds the significance threshold; they are helpful for visually spotting localized significant features within the broader white contour region.
5.1 Varve formation
The laminations in the distal site GL-13 are clastic varves following the classification of Zolitschka et al. (2015). The fine component of the basal layer is interpreted as the settling of the very distal fluvial plume flowing from the Naskaupi and Beaver Rivers floods that are travelling across the lake as overflow. The continuousness of these hypopycnal flows across Grand Lake is favoured by the water column stratification (Gagnon-Poiré, 2023). These currents seem capable of transporting large quantities of sediment as evidenced by high sediment accumulation rates at the mouth of the outlet of the lake, i.e., the North-West River (Kamula et al., 2017), and by satellite images of Grand Lake showing plumes reaching the distal site GL-13 during spring discharges (Fig. S2). Other potential sources of sediment are Rapidly Deposited Layers (RDL) that are commonly found in deep fjord lakes (St-Onge et al., 2004). The RDLs are sporadic events that can yield a large amount of sediment in the water column from many potential locations all around the lake, but are usually coarse-grained and expressed as hyperpycnal flows. Three trigger mechanisms could be responsible for the RDL deposition (St-Onge et al., 2004): floods, landslides initiated by overloading or oversteepening, and earthquakes. The latter are unlikely, since the closest seismic zone is the Saguenay fjord area that is 900 km away. Only one RDL was found in our distal sequence, most probably because the coring site is located on a relatively shallow location in the lake that is less likely reached by hyperpycnal flows. The isolated silt and sand grains (Fig. 2d) are thought to be ice-rafted for the angular ones, and, for the rounded ones, sourced from the several minor streams proximal to the coring site. The clay cap forms in winter under lake ice, as it is the case for all clastic varves and constitutes the main criteria for identifying a year of sedimentation (Zolitschka et al., 2015).
5.2 Varve thickness based time-series and local instrumental records
We now investigate the relationship between the longest instrumental record in the region, provided by the Goose A weather station (Fig. 1b), and both the proximal NAS site (Gagnon-Poiré et al., 2021), and this newly developed distal VT record GL17-13A (Fig. 1c). The analysis reveals significant positive correlations between both the proximal and distal VT sites and the total precipitation recorded at Goose A, with correlation coefficients of r = 0.39 (p < 0.001) and r = 0.38 (p < 0.001), respectively (Fig. 6a, b). A significant correlation is also observed between distal VT and snow precipitation at Goose A (r = 0.31, p = 0.006) (Fig. 6c), whereas no significant correlation is found between VT and rainfall amounts at this distal site (r = 0.15, p = 0.19). These results suggest that snow precipitation is the primary driver of the VT record. It can also be seen that both datasets (VT and precipitations) exhibit a marked decline in precipitation signals around the late 1980s, with a particularly pronounced reduction in snow precipitation during this period.
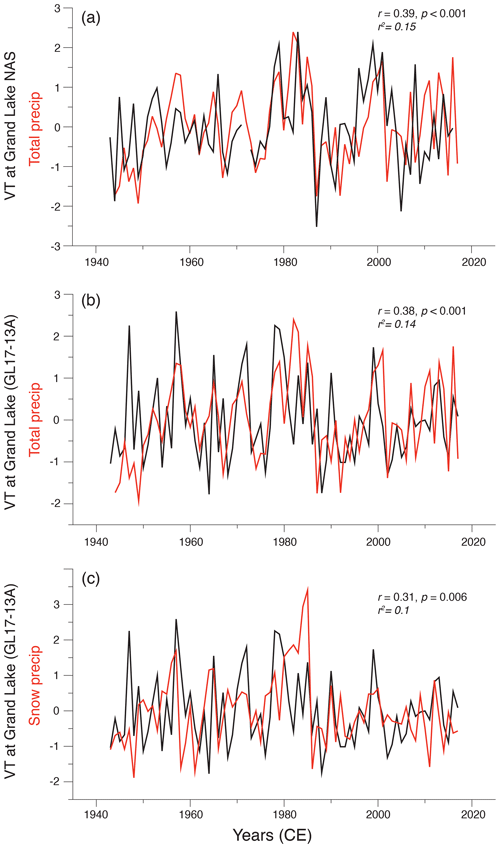
Figure 6Comparison between Goose A precipitation records and varve thickness (all records being normalized relative to the mean and standard deviation). (a) Total precipitation at Goose A and VT at proximal cores NAS. (b) Total precipitation at Goose A and VT at GL17-13A. (c) Snow precipitation at Goose A and VT at GL17-13A.
5.3 Hydroclimate influence on varve properties
Gagnon-Poiré et al. (2021) already demonstrated that Grand Lake proximal varves are strongly linked with spring discharge conditions: varve thickness and particle size measurements show a significant positive correlation with observed Naskaupi River nival runoff (April to July) (r = 0.58, p = < 0.0001). The discharge record is strongly influenced by the amount of snow accumulating during the cold season in this region when temperatures rise above zero in April (Fig. S3). Snowmelt is not the only factor controlling river discharge: rain also becomes a significant contributor to precipitation in April, with relatively high values in May and June, which coincides with the maximum discharge of the Naskaupi River (Fig. S4). This combined influence is illustrated by the correlation between the total precipitation recorded at Goose A and the VT records at the proximal site (Fig. 6a) and at the distal site (Fig. 6b) (r = 0.38, p = < 0.001). No memory or autocorrelation effects common in fluvial systems (Lamoureux, 2002) were detected (Fig. S5).
5.4 Grand Lake varve record comparison with regional proxy data
Our new 1500-year VT record from Grand Lake provides a valuable opportunity to explore regional long-term hydroclimatic changes by comparing it with other high-resolution records. The log-normal transformed VT series is correlated to the maximum latewood density (MXD) from a tree network in Eastern Canada over the past ∼ 1200 years (Wang et al., 2023, Fig. 7a). MXD is a proxy for summer (May to August) temperatures, suggesting that temperature somehow influences the Grand Lake's VT record. A highly resolved sea surface temperature (SST) reconstruction off North Iceland, based on alkenones with a four-year resolution (Sicre et al., 2008) also aligns with the Grand Lake record (Fig. 7b), particularly during the Medieval Climate Anomaly (MCA) when warmer conditions are evident in both datasets. In contrast, a new δ18O from Norman's Pond in Newfoundland 570 km south of GL, Finkenbinder et al. (2022) shows warmer conditions only during the later stages of the MCA, with anomalously cold conditions around 1000 CE that are less pronounced in the Grand Lake record. Despite these differences, there is a notable correlation between the two-time series (Fig. 7c) for the last 1500 years (r = 0.30), with a better correlation during the last millennium (r = 0.46; not shown in the figure).
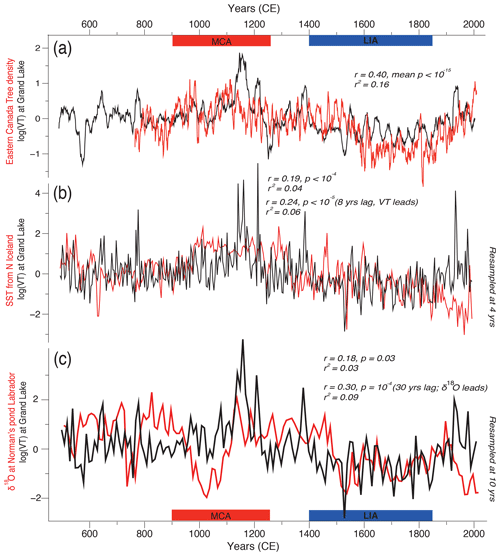
Figure 7Comparison of the Grand Lake log-transformed varve thickness (VT) series with regional proxy data. (a) VT at Grand Lake compared to Eastern Canadian tree-ring density (Wang et al., 2023). Panels (b) and (c) show the same comparison as panel (a), but with sea surface temperatures (SST) from north Iceland (Sicre et al., 2008) (b) and δ18O from Norman's Pond in Newfoundland (Finkenbinder et al., 2022) (c). In panel (a), the records are smoothed using a 21-year running mean for clarity, while in panels (b) and (c), the records are resampled to match the lowest time resolution (4 and 10 years, respectively).
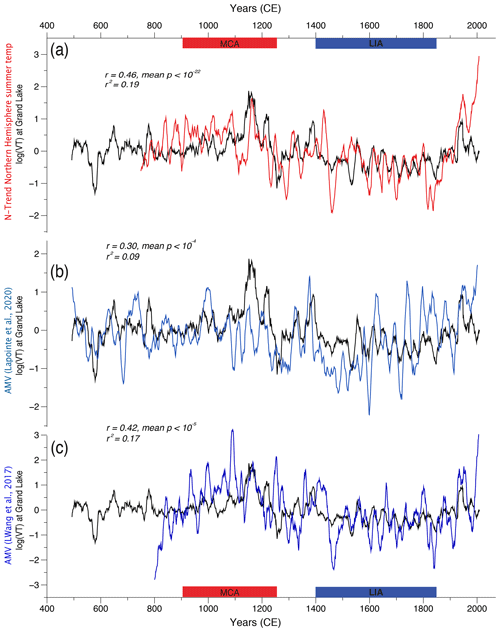
Figure 8Comparison between the log-transformed VT record at Grand Lake and Northern Hemisphere high-resolution proxy records (Wilson et al., 2016) (a) spanning the past ∼ 1500 years. (b, c) Same as panel (a) but showing two reconstructed AMV (Lapointe et al., 2020; Wang et al., 2017). Time series are filtered by a 21-year running mean.
One of the most notable features in the Grand lake varve thickness series is the pronounced peak between the 1150s and 1170s CE, which reflects a period of increased precipitation as well as likely warmer conditions, as supported by independent paleoenvironmental evidence. Indeed, this warm anomaly is also evident in the reconstructed summer Northern Hemisphere temperatures based on tree rings (Fig. 8a) and the δ18O record from Norman's Pond (Fig. 7c). Additionally, two reconstructed Atlantic Multidecadal Variability (AMV; Lapointe et al., 2020; Wang et al., 2017) records show a significant correlation with our VT record (Fig. 8b, c), underscoring the strong influence of SST anomalies in the North Atlantic on the Grand Lake region. Another prominent feature in the Grand Lake record is the sharp decline in values between 1520–1530s CE, which is also reflected in the SST reconstruction from North Iceland (Fig. 7b), both AMV reconstructions (Fig. 8b, c), and the δ18O record from Norman's Pond (Fig. 7c). However, this decline is not reflected in the summer temperature reconstruction from the MXD network in Eastern Canada, nor in the summer Northern Hemisphere temperature reconstruction, suggesting that SST was the primary driver of this ∼ 1530s decline. Overall, these reconstructions exhibit similar patterns, with a warm Medieval Climate Anomaly (MCA) followed by the cooler conditions of the Little Ice Age (LIA).
The two warm peaks during the late 1300s, as observed in several highly resolved marine records from the Labrador Sea (Lapointe and Bradley, 2021), are also evident in the varve thickness record (Fig. 8b). This shows that this warm episode extended across a broad region, from the western to the eastern portions of the Labrador Sea, a pattern consistent with a persistent negative phase of the NAO. Similar to the reconstructed AMV (Lapointe et al., 2020), varve thickness at Grand Lake progressively declines following this late 1300s warm event. These parallels suggest that the Labrador region is strongly influenced by ocean-atmosphere interactions across the North Atlantic and that the Grand Lake varve record has captured significant climate variability driven by negative NAO phases over the past ∼ 1500 years.
5.5 Teleconnection influencing temperature and precipitation
Investigating possible large-scale teleconnections in the Grand Lake region, we find a positive spatial correlation between Goose A winter temperatures (JFM) and the atmospheric pressure at 500 hPa (z500 hPa) related to an anticyclonic system developed over Greenland and the Canadian Arctic. We also find a negative correlation with lower atmospheric pressure dominating the latitude band 30–40° N in the Atlantic (Fig. 9a). This pattern is reminiscent of the positive Greenland Blocking index (GBI), defined as the mean z500 hPa over Greenland (Hanna et al., 2016) (Fig. 9b). We observe that this atmospheric pattern persists across all seasons, though it is less pronounced during the summer. The correlation between winter GBI and Goose A temperatures (r = 0.83, p < 0.001) (Fig. S6) and the NAO (r = −0.77, p < 0.001 – not shown) confirms that the site is influenced by the GBI.
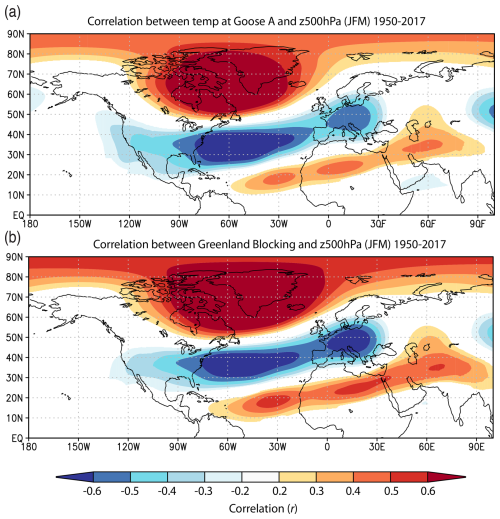
Figure 9(a) Spatial correlation between Goose A and 500 hPa geopotential height anomaly (Dee et al., 2011). (b) Same as above but for the Greenland Blocking and 500 hPa.
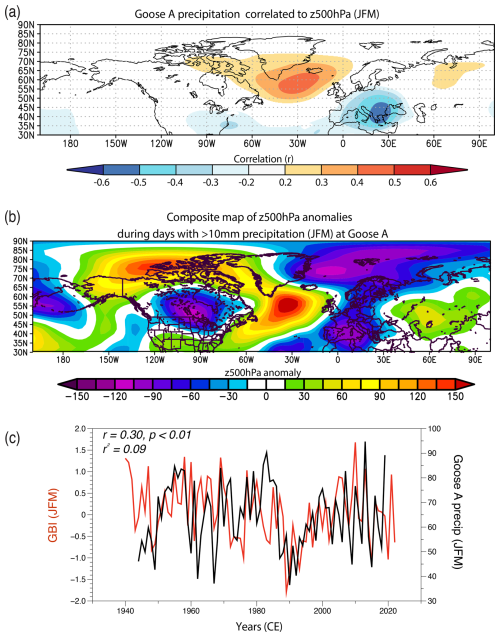
Figure 10(a) Spatial correlation between winter (JFM) precipitation at Goose A from the Global Historical Climatology Network and 500 hPa geopotential height from Era-Interim (Dee et al., 2011). (b) Composite map of extreme winter precipitation (> 10 mm d−1) at Goose A. (c) Goose A winter precipitations compared to Greenland Blocking index.
Periods with high winter precipitation at Goose A tend to coincide with high atmospheric pressure over Greenland and south of Iceland (Fig. 10a). The composite map of daily precipitation > 10 mm also captures this atmospheric anomaly and an overall high-pressure over much of the Canadian Arctic and west Greenland, a pattern reminiscent of the negative phase of the NAO (Fig. 10b). This is supported by a significant correlation between GBI (or NAO) and Goose A precipitations in winter (Fig. 10c).
The blocking pattern over the North Atlantic observed with a spatial correlation between Goose A winter precipitation and atmospheric pressure (500 hPa) (Fig. 10a, b) supports the idea that snowfall in the Grand Lake area is, to some extent, influenced by GBI (and NAO). The positive phase of the GBI (negative phase of the NAO) is associated with warmer temperatures in Labrador (Shabbar et al., 1997) and higher than normal winter precipitation (Bonsal and Shabbar, 2008). During GBI+ and NAO−, a high-pressure anticyclonic system prevails over the southeast tip of Greenland and is associated with weaker westerlies and an increase in meandering of the jet stream (Shabbar et al., 2001). These blocking patterns allow a north-easterly shift in the eastern Canada storm track toward the study region and higher occurrence of cyclones (storms) and more precipitation over south and central Labrador (Chartrand and Pausata, 2020). This change in the preferred path of storms exerts an influence on Labrador's climate, particularly during the cold season, leading to an increase in snow accumulation and consequently to higher river discharge in the region. Since Grand Lake varves are sensitive to snow, i.e., warm and snowy winters are reflected by thicker varves, it is logical to observe a relation between GBI (NAO) and precipitation reconstructed by our annually resolved sedimentary record.
While annually resolved GBI reconstructions extending beyond the instrumental period are still lacking, numerous reconstructions of the NAO have been developed. However, these reconstructions often show limited agreement with one another prior to the instrumental era (Pinto and Raible, 2012). A key reason for this inconsistency may lie in the proxies used: many NAO reconstructions rely heavily on tree-ring records, which primarily reflect summer temperature variability. In contrast, the NAO is fundamentally a winter-season climate mode, meaning such reconstructions may not adequately capture its full seasonal dynamics – particularly its winter expression, which drives much of the interannual and decadal variability in North Atlantic climate. This seasonal mismatch could help explain why our record shows weak correlation with the existing reconstructed NAO indices.
It has been established that the frequency and persistence of Greenland atmospheric blocking tend to increase during the positive phase of the AMV (Hahn et al., 2018; Häkkinen et al., 2011; Peings and Magnusdottir, 2014). The AMV modulates conditions over the Labrador region by enhancing the transfer of heat from a warmer ocean to the cold overlying atmosphere during the cold season, leading to increased snowfall. The strong similarities between the reconstructed AMV phases and the proxy data presented in this study suggest an atmospheric teleconnection, which we propose is primarily driven by NAO variability modulated by the underlying state of the AMV. However, due to the limitations of existing NAO reconstructions – particularly their seasonal bias and low agreement before the instrumental period – our record may be capturing wintertime atmospheric processes that are not well represented in the predominantly summer-based NAO reconstructions. The short-term ∼ 7-year periodicities observed in the varve record (Fig. 5) also appear in the well-established winter NAO reconstruction by Cook et al. (2002), supporting that the Grand Lake record contains a cyclic component associated with the NAO.
In sum, given its sensitivity to wintertime atmospheric circulation, our record thus holds strong potential to complement and enhance future efforts to reconstruct the NAO, particularly by contributing to a more seasonally representative (winter-focused) reconstruction network.
5.6 Recent history of the NAO in the context of the last 1500 years
As Arctic sea ice is projected to decrease in the coming decades, three circulation patterns are expected to become more frequent under low sea ice conditions: Scandinavian, Ural, and Greenland Blocking patterns (Crasemann et al., 2017; Lapointe et al., 2024; Tedesco and Fettweis, 2020). Since 2005, the intensification of summer Greenland Blocking has played a significant role in accelerating surface melting over the Greenland Ice Sheet and reducing Arctic sea ice extent. However, it is important to consider seasonal differences in Greenland Blocking and NAO behaviour. During winter, the positive phase of the NAO has shown a marked increase since the late 1980s and early 1990s (Fig. S7), leading to stronger westerly winds. This shift coincides with a reduction in sediment influx at Grand Lake, which is also reflected in precipitation data from nearby weather stations (Fig. 6). A decreasing trend can be observed in the Grand Lake varve thickness record over the past 50 years, but it is not unusual in the context of the past 1500 years. Importantly, the trend in winter for the NAO time series is toward more positive values (Fig. S7), and climate models generally predict an increase in the winter NAO index under future high-emission scenarios (Gillett and Fyfe, 2013; McKenna and Maycock, 2022; Lee et al., 2021). In addition, with the anticipated increase in melt from the Greenland Ice Sheet and other high-latitude glaciers, the influx of freshwater into the North Atlantic is expected to maintain a positive NAO in winter (Oltmanns et al., 2020), which in turn would lead to a reduction of the snowpack in the area. According to the information from our long-term record, the positive trends (NAO+), if continued, will likely act to reduce winter precipitation in the region of Grand Lake, with potential implications for hydroelectricity. Future research should focus on these modes of variability and the mechanisms driving their evolution, highlighting the need for more proxy records that capture these dynamics.
In this paper we present a new hydroclimatic record at annual resolution in eastern North America and the first millennial reconstruction based on varved sediments from a deep fjord lake on the western fringe of the Atlantic Ocean. The annual character of the 1523 year-long lamination sequence from the distal core GL-13 has been confirmed. The Medieval Climate Anomaly (∼ 1050–1225 CE) is characterized by thicker varves indicative of higher total precipitation, while the Little Ice Age (1400–1875 CE) recorded thinner varves indicative of a dryer climate. Present-day teleconnection highlights that the precipitation in the region is in part modulated by the GBI+ (or negative NAO), which is mediated by oceanic-atmospheric processes associated with the AMV. The similarities between our record and others suggest that the teleconnection, specifically the negative phase of the NAO, has been a persistent feature of regional hydroclimate over the past 1000+ years. This positions the Grand Lake record as a promising candidate for future NAO/AMV reconstructions. Importantly, the decreasing trend in the Grand Lake varve thickness over the past 50 years is not unusual when viewed within the context of the last 1500 years. However, it highlights that if the winter NAO continues its positive trend in the future, it could have major implications for hydroelectricity production in this region.
Varve thickness dataset will be uploaded on 12 September 2025 to the Varved Sediments Database (VARDA), https://varve.gfz-potsdam.de/, last access: 12 March 2025.
The supplement related to this article is available online at https://doi.org/10.5194/cp-21-1595-2025-supplement.
FL: Conceptualization; Formal analysis; Investigation; Validation; Visualization; Writing – original draft; Writing – review & editing. AGP: Conceptualization; Methodology; Formal analysis; Investigation; Validation; Data curation; Writing – original draft; Writing – review & editing; Visualization. PF: Conceptualization; Data curation; Methodology; Ressources; Writing – review & editing; Visualization; Supervision; Project administration; Funding acquisition; PL: Conceptualization; Ressources; Writing – review & editing. CG: Formal analysis; Investigation.
At least one of the (co-)authors is a member of the editorial board of Climate of the Past. The peer-review process was guided by an independent editor, and the authors also have no other competing interests to declare.
Publisher's note: Copernicus Publications remains neutral with regard to jurisdictional claims made in the text, published maps, institutional affiliations, or any other geographical representation in this paper. While Copernicus Publications makes every effort to include appropriate place names, the final responsibility lies with the authors. Also, please note that this paper has not received English language copy-editing.
The authors are grateful to Arnaud De Coninck, David Deligny, David Fortin and Louis-Frédéric Daigle for their participation during fieldwork and in the laboratory. We greatly thank Wanda and Dave Blake from North West River for their guiding experience and accommodation at Grand Lake. We thank the Labrador Institute at North West River for the use of their facility during fieldwork, and Raymond Bradley for lending the vibracoring equipment. We want to thank Stéphane Ferré from the Micro-Geoarchaeology Laboratory of the Centre d'Études Nordiques (CEN) in Québec, QC, Canada, for the production of high-quality thin sections used in this study. Finally, many thanks to Monique Gagnon and Charles Smith for reviewing the English of an earlier version of the paper.
This work was supported by an NSERC Discovery grants (RGPIN-2014-05810 and RGPIN-2019-06593 awarded to Pierre Francus, and by a US National Science Foundation grant from the P4Climate program (NSF # 2402628) awarded to François Lapointe.
This research has been supported by the Natural Sciences and Engineering Research Council of Canada (grant nos. RGPIN-2014-05810 and RGPIN-2019-06593) and the National Science Foundation (grant no. 2402628).
This paper was edited by Julie Loisel and reviewed by Cecile Blanchet and one anonymous referee.
Banfield, C. E. and Jacobs, J. D.: Regional patterns of temperature and precipitation for Newfoundland and Labrador during the past century, Can. Geogr.–Geogr. Can., 42, 354–364, https://doi.org/10.1111/j.1541-0064.1998.tb01351.x, 1998.
Blaauw, M.: Methods and code for “classical” age-modelling of radiocarbon sequences, Quat. Geochronol., 5, 512–518, https://doi.org/10.1016/j.quageo.2010.01.002, 2010.
Bonsal, B. and Shabbar, A.: Impacts of Large-Scale Circulation Variability on Low Streamflows over Canada: A Review, Can. Water Resour. J., 33, 137–154, https://doi.org/10.4296/cwrj3302137, 2008.
Bonsal, B. R., Peters, D. L., Seglenieks, F., Rivera, A., and Berg, A.: Changes in freshwater availability across Canada, Chap. 6 in Canada's Changing Climate Report, edited by: Bush, E. and Lemmen, D. S., Government of Canada, Ottawa, Ontario, 261–342, https://natural-resources.canada.ca/sites/www.nrcan.gc.ca/files/energy/Climate-change/pdf/CCCR-Chapter6-ChangesInFreshwaterAvailabilityAcrossCanada.pdf, 2019.
Boucher, E., Nicault, A., Arseneault, D., Begin, Y., and Karami, M. P.: Decadal Variations in Eastern Canada's Taiga Wood Biomass Production Forced by Ocean-Atmosphere Interactions, Sci. Rep., 7, 2457, https://doi.org/10.1038/s41598-017-02580-9, 2017.
Boucher, É. T., Ouarda, T. B. M. J., Bégin, Y., and Nicault, A.: Spring flood reconstruction from continuous and discrete tree ring series, Water Resour. Res., 47, W07516, https://doi.org/10.1029/2010WR010131, 2011.
Chartrand, J. and Pausata, F. S. R.: Impacts of the North Atlantic Oscillation on winter precipitations and storm track variability in southeast Canada and the northeast United States, Weather Clim. Dynam., 1, 731–744, https://doi.org/10.5194/wcd-1-731-2020, 2020.
Cook, E. R., D'Arrigo, R. D., and Mann, M. E.: A well-verified, multiproxy reconstruction of the winter North Atlantic Oscillation index since AD 1400, J. Climate, 15, 1754–1764, https://doi.org/10.1175/1520-0442(2002)015<1754:AWVMRO>2.0.CO;2, 2002.
Crasemann, B., Handorf, D., Jaiser, R., Dethloff, K., Nakamura, T., Ukita, J., and Yamazaki, K.: Can preferred atmospheric circulation patterns over the North-Atlantic-Eurasian region be associated with arctic sea ice loss?, Polar Sci., 14, 9–20, https://doi.org/10.1016/j.polar.2017.09.002, 2017.
Croudace, I. W., Rindby, A., and Rothwell, R. G.: ITRAX: Description and evaluation of a new multi-function X-ray core scanner, in: New Techniques in Sediment Core Analysis, edited by: Rothwell, R. G., Geol. Soc. Spec. Publ., 51–63, https://doi.org/10.1144/GSL.SP.2006.267.01.04, 2006.
Cuven, S., Francus, P., and Lamoureux, S. F.: Estimation of grain size variability with micro X-ray fluorescence in laminated lacustrine sediments, Cape Bounty, Canadian High Arctic, J. Paleolimnol., 44, 803–817, https://doi.org/10.1007/s10933-010-9453-1, 2010.
Dalton, A. S., Margold, M., Stokes, C. R., Tarasov, L., Dyke, A. S., Adams, R. S., Allard, S., Arends, H. E., Atkinson, N., Attig, J. W., Barnett, P. J., Barnett, R. L., Batterson, M., Bernatchez, P., Borns, H. W., Breckenridge, A., Briner, J. P., Brouard, E., Campbell, J. E., Carlson, A. E., Clague, J. J., Curry, B. B., Daigneault, R.-A., Dubé-Loubert, H., Easterbrook, D. J., Franzi, D. A., Friedrich, H. G., Funder, S., Gauthier, M. S., Gowan, A. S., Harris, K. L., Hétu, B., Hooyer, T. S., Jennings, C. E., Johnson, M. D., Kehew, A. E., Kelley, S. E., Kerr, D., King, E. L., Kjeldsen, K. K., Knaeble, A. R., Lajeunesse, P., Lakeman, T. R., Lamothe, M., Larson, P., Lavoie, M., Loope, H. M., Lowell, T. V., Lusardi, B. A., Manz, L., McMartin, I., Nixon, F. C., Occhietti, S., Parkhill, M. A., Piper, D. J. W., Pronk, A. G., Richard, P. J. H., Ridge, J. C., Ross, M., Roy, M., Seaman, A., Shaw, J., Stea, R. R., Teller, J. T., Thompson, W. B., Thorleifson, L. H., Utting, D. J., Veillette, J. J., Ward, B. C., Weddle, T. K., and Wright, H. E.: An updated radiocarbon-based ice margin chronology for the last deglaciation of the North American Ice Sheet Complex, Quaternary Sci. Rev., 234, 106223, https://doi.org/10.1016/j.quascirev.2020.106223, 2020.
D'Arrigo, R., Buckley, B., Kaplan, S., and Woollett, J.: Interannual to multidecadal modes of Labrador climate variability inferred from tree rings, Clim. Dynam., 20, 219–228, https://doi.org/10.1007/s00382-002-0275-3, 2003.
Dee, D. P., Uppala, S. M., Simmons, A. J., Berrisford, P., Poli, P., Kobayashi, S., Andrae, U., Balmaseda, M. A., Balsamo, G., Bauer, P., Bechtold, P., Beljaars, A. C. M., van de Berg, L., Bidlot, J., Bormann, N., Delsol, C., Dragani, R., Fuentes, M., Geer, A. J., Haimberger, L., Healy, S. B., Hersbach, H., Hólm, E. V., Isaksen, L., Kållberg, P., Köhler, M., Matricardi, M., McNally, A. P., Monge-Sanz, B. M., Morcrette, J.-J., Park, B.-K., Peubey, C., de Rosnay, P., Tavolato, C., Thépaut, J.-N., and Vitart, F.: The ERA-Interim reanalysis: configuration and performance of the data assimilation system, Q. J. Roy. Meteor. Soc., 137, 553–597, https://doi.org/10.1002/qj.828, 2011.
Dinis, L., Bégin, C., Savard, M. M., Marion, J., Brigode, P., and Alvarez, C.: Tree-ring stable isotopes for regional discharge reconstruction in eastern Labrador and teleconnection with the Arctic Oscillation, Clim. Dynam., 53, 3625–3640, https://doi.org/10.1007/s00382-019-04731-2, 2019.
Durkalec, A., Sheldon, T., and Bell, T.: Lake Melville: Avativut, Kanuittailinnivut (Our Environment, Our Health), Scientific Report, Nain, NL, Nunatsiavut Government, 80 pp., https://www.muskratfallsinquiry.ca/files/P-01684.pdf, 2016.
Finkenbinder, M. S., Steinman, B. A., Bird, B. W., Heilman, E. C., Aspey, A. R., Mark, S. Z., Stansell, N. D., Fernandez, A., Halsor, S. P., and Abbott, M. B.: A 5000-year lacustrine sediment oxygen isotope record of late Holocene climate change in Newfoundland, Canada, Quaternary Sci. Rev., 278, 107376, https://doi.org/10.1016/j.quascirev.2022.107376, 2022.
Finnis, J. and Bell, T.: An analysis of recent observed climate trends and variability in Labrador, Can. Geogr.–Géogr. Can., 59, 151–166, https://doi.org/10.1111/cag.12155, 2015.
Francus, P.: An image-analysis technique to measure grain-size variation in thin sections of soft clastic sediments, Sediment. Geol., 121, 289–298, https://doi.org/10.1016/S0037-0738(98)00078-5, 1998.
Francus, P. and Nobert, P.: An integrated computer system to acquire, process, measure and store images of laminated sediments, 4th International limnogeology congress, Barcelona, 11–14 July 2007, SAT-P04, 2007.
Fulton, R. J. and Hodgson, D. A., H.: Wisconsin glacial retreat, southern Labrador, Current Research, Part C, Geological Survey of Canada, Paper, 79, 17–21, https://doi.org/10.4095/124066, 1979.
Gagnon-Poiré, A.: Reconstitution hydrologique millénaire dans la forêt boréale du Labrador à partir des sédiments varvés de Grand Lake, PhD thesis, Centre Eau Terre Environnement, Institut national de la recherche scientifique, Québec, 197 pp., https://espace.inrs.ca/id/eprint/15601, 2023.
Gagnon-Poiré, A., Brigode, P., Francus, P., Fortin, D., Lajeunesse, P., Dorion, H., and Trottier, A.-P.: Reconstructing past hydrology of eastern Canadian boreal catchments using clastic varved sediments and hydro-climatic modelling: 160 years of fluvial inflows, Clim. Past, 17, 653–673, https://doi.org/10.5194/cp-17-653-2021, 2021.
Gillett, N. P. and Fyfe, J. C.: Annular mode changes in the CMIP5 simulations, Geophys. Res. Lett., 40, 1189–1193, https://doi.org/10.1002/grl.50249, 2013.
Hahn, L., Ummenhofer, C. C., and Kwon, Y.-O.: North Atlantic Natural Variability Modulates Emergence of Widespread Greenland Melt in a Warming Climate, Geophys. Res. Lett., 45, 9171–9178, https://doi.org/10.1029/2018GL079682, 2018.
Häkkinen, S., Rhines, P. B., and Worthen, D. L.: Atmospheric Blocking and Atlantic Multidecadal Ocean Variability, Science, 334, 655–659, https://doi.org/10.1126/science.1205683, 2011.
Hanna, E., Cropper, T. E., Hall, R. J., and Cappelen, J.: Greenland Blocking Index 1851–2015: a regional climate change signal, Int. J. Climatol., 36, 4847–4861, https://doi.org/10.1002/joc.4673, 2016.
Huang, B., Thorne, P., Banzon, V., Boyer, T., Chepurin, G., Lawrimore, J., Menne, M., Smith, T., Vose, R., and Zhang, H. M.,: NOAA Extended Reconstructed Sea Surface Temperature (ERSST), Version 5, https://doi.org/10.7289/V5T72FNM, 2022.
IPCC: Climate change 2013: the physical science basis of Working Group I contribution to the fifth assessment report of the Intergovernmental Panel on Climate Change, edited by: Stocker, T. F., Qin, D., Plattner, G.-K., Tignor, M., Allen, S. K., Boschung, J., Nauels, A., Xia, Y., Bex, V., and Midgley, P. M., Cambridge University Press, Cambridge, United Kingdom and New York, NY, USA, 1535 pp., https://www.cambridge.org/9781107661820, 2013.
Kalnay, E., Kanamitsu, M., Kistler, R., Collins, W., Deaven, D., Gandin, L., Iredell, M., Saha, S., White, G., Woollen, J., Zhu, Y., Chelliah, M., Ebisuzaki, W., Higgins, W., Janowiak, J., Mo, K. C., Ropelewski, C., Wang, J., Leetmaa, A., Reynolds, R., Jenne, R., and Joseph, D.: The NCEP/NCAR 40-Year Reanalysis Project, B. Am. Meteorol. Soc., 77, 437–472, https://doi.org/10.1175/1520-0477(1996)077<0437:TNYRP>2.0.CO;2, 1996.
Kamula, C. M., Kuzyk, Z. Z. A., Lobb, D. A., and Macdonald, R. W.: Sources and accumulation of sediment and particulate organic carbon in a subarctic fjard estuary: 210Pb, 137Cs, and δ13C records from Lake Melville, Labrador, Can. J. Earth Sci., 54, 993–1006, https://doi.org/10.1139/cjes-2016-0167, 2017.
Kylander, M. E., Ampel, L., Wohlfarth, B., and Veres, D.: High-resolution X-ray fluorescence core scanning analysis of Les Echets (France) sedimentary sequence: new insights from chemical proxies, J. Quaternary Sci., 26, 109–117, https://doi.org/10.1002/jqs.1438, 2011.
Lamoureux, S.: Temporal patterns of suspended sediment yield following moderate to extreme hydrological events recorded in varved lacustrine sediments, Earth Surf. Proc. Land., 27, 10, 1107–1124, 2002.
Lapointe, F. and Bradley, R. S.: Little Ice Age abruptly triggered by intrusion of Atlantic waters into the Nordic Seas, Sci. Adv., 7, eabi8230, https://doi.org/10.1126/sciadv.abi8230, 2021.
Lapointe, F., Francus, P., Lamoureux, S., Saïd, M., and Cuven, S.: 1750 years of large rainfall events inferred from particle size at East Lake, Cape Bounty, Melville Island, Canada, J. Paleolimnol., 48, 159–173, https://doi.org/10.1007/s10933-012-9611-8, 2012.
Lapointe, F., Bradley, R. S., Francus, P., Balascio, N. L., Abbott, M. B., Stoner, J. S., St-Onge, G., De Coninck, A., and Labarre, T.: Annually resolved Atlantic sea surface temperature variability over the past 2,900 y, P. Natl. Acad. Sci. USA, 117, 27171–27178, https://doi.org/10.1073/pnas.2014166117, 2020.
Lapointe, F., Karmalkar, A. V., Bradley, R. S., Retelle, M. J., and Wang, F.: Climate extremes in Svalbard over the last two millennia are linked to atmospheric blocking, Nat. Commun., 15, 4432, https://doi.org/10.1038/s41467-024-48603-8, 2024.
Lee, J.-Y., Marotzke, J., Bala, G., Cao, L., Corti, S., Dunne, J. P., Engelbrecht, F., Fischer, E., Fyfe, J. C., Jones, C., Maycock, A., Mutemi, J., Ndiaye, O., Panickal, S., and Zhou, T.: Future Global Climate: Scenario-based Projections and Near-term Information, in: Climate Change 2021 – The Physical Science Basis: Working Group I Contribution to the Sixth Assessment Report of the Intergovernmental Panel on Climate Change, edited by: Masson-Delmotte, V., Zhai, P., Pirani, A., Connors, S. L., Péan, C., Berger, S., Caud, N., Chen, Y., Goldfarb, L., Gomis, M. I., Huang, M., Leitzell, K., Lonnoy, E., Matthews, J. B. R., Maycock, T. K., Waterfield, T., Yelekçi, O., Yu, R., and Zhou, B., Cambridge University Press, Cambridge, United Kingdom and New York, USA, 553–672, https://doi.org/10.1017/9781009157896.006, 2021.
Linderholm, H. W., Nicolle, M., Francus, P., Gajewski, K., Helama, S., Korhola, A., Solomina, O., Yu, Z., Zhang, P., D'Andrea, W. J., Debret, M., Divine, D. V., Gunnarson, B. E., Loader, N. J., Massei, N., Seftigen, K., Thomas, E. K., Werner, J., Andersson, S., Berntsson, A., Luoto, T. P., Nevalainen, L., Saarni, S., and Väliranta, M.: Arctic hydroclimate variability during the last 2000 years: current understanding and research challenges, Clim. Past, 14, 473–514, https://doi.org/10.5194/cp-14-473-2018, 2018.
Ljungqvist, F. C., Krusic, P. J., Sundqvist, H. S., Zorita, E., Brattström, G., and Frank, D.: Northern Hemisphere hydroclimate variability over the past twelve centuries, Nature, 532, 94–98, https://doi.org/10.1038/nature17418, 2016.
Mann, M. E., Zhang, Z., Rutherford, S., Bradley, R. S., Hughes, M. K., Shindell, D., Ammann, C., Faluvegi, G., and Ni, F.: Global Signatures and Dynamical Origins of the Little Ice Age and Medieval Climate Anomaly, Science, 326, 1256–1260, https://doi.org/10.1126/science.1177303, 2009.
Marshall, M., Schlolaut, G., Nakagawa, T., Lamb, H., Brauer, A., Staff, R., Ramsey, C. B., Tarasov, P., Gotanda, K., Haraguchi, T., Yokoyama, Y., Yonenobu, H., and Tada, R.: A novel approach to varve counting using µXRF and X-radiography in combination with thin-section microscopy, applied to the Late Glacial chronology from Lake Suigetsu, Japan, Quat. Geochronol., 13, 70–80, https://doi.org/10.1016/j.quageo.2012.06.002, 2012.
McKenna, C. M. and Maycock, A. C.: The Role of the North Atlantic Oscillation for Projections of Winter Mean Precipitation in Europe, Geophys. Res. Lett., 49, e2022GL099083, https://doi.org/10.1029/2022GL099083, 2022.
Miller, G. H., Geirsdóttir, Á., Zhong, Y., Larsen, D. J., Otto-Bliesner, B. L., Holland, M. M., Bailey, D. A., Refsnider, K. A., Lehman, S. J., Southon, J. R., and Anderson, C.: Abrupt onset of the Little Ice Age triggered by volcanism and sustained by sea-ice/ocean feedbacks, Geophys. Res. Lett, 39, https://doi.org/10.1029/2011GL050168, 2012.
Nasri, B. R., Boucher, E., Perreault, L., Remillard, B. N., Huard, D., Nicault, A., and Projects, A.-P.: Modeling Hydrological Inflow Persistence Using Paleoclimate Reconstructions on the Quebec-Labrador (Canada) Peninsula, Water Res. Res., 56, e2019WR025122, https://doi.org/10.1029/2019WR025122, 2020.
Nicault, A., Boucher, E., Bégin, C., Guiot, J., Marion, J., Perreault, L., Roy, R., Savard, M. M., and Bégin, Y.: Hydrological reconstruction from tree-ring multi-proxies over the last two centuries at the Caniapiscau Reservoir, northern Québec, Canada, J. Hydrol., 513, 435–445, https://doi.org/10.1016/j.jhydrol.2014.03.054, 2014.
Normandeau, A., Brown, O., Jarrett, K. A., Francus, P., and De Coninck, A.: Epoxy impregnation of unconsolidated marine sediment core subsamples for the preparation of thin sections at the Geological Survey of Canada (Atlantic), Geological Survey of Canada, Technical Note, 10, 10, https://doi.org/10.4095/313055, 2019.
Occhietti, S., Parent, M., Lajeunesse, P., Robert, F., and Govare, É.: Chapter 47 – Late Pleistocene–Early Holocene Decay of the Laurentide Ice Sheet in Québec–Labrador, in: Developments in Quaternary Sciences, edited by: Ehlers, J., Gibbard, P. L., and Hughes, P. D., Elsevier, 601–630, https://doi.org/10.1016/B978-0-444-53447-7.00047-7, 2011.
Oltmanns, M., Karstensen, J., Moore, G. W. K., and Josey, S. A.: Rapid Cooling and Increased Storminess Triggered by Freshwater in the North Atlantic, Geophys. Res. Lett., 47, e2020GL087207, https://doi.org/10.1029/2020GL087207, 2020.
Peings, Y. and Magnusdottir, G.: Response of the Wintertime Northern Hemisphere Atmospheric Circulation to Current and Projected Arctic Sea Ice Decline: A Numerical Study with CAM5, J. Climate, 27, 244–264, https://doi.org/10.1175/JCLI-D-13-00272.1, 2014.
Pinto, J. G. and Raible, C. C.: Past and recent changes in the North Atlantic oscillation, Wires Clim. Change, 3, 79–90, https://doi.org/10.1002/wcc.150, 2012.
Ramisch, A., Brauser, A., Dorn, M., Blanchet, C., Brademann, B., Köppl, M., Mingram, J., Neugebauer, I., Nowaczyk, N., Ott, F., Pinkerneil, S., Plessen, B., Schwab, M. J., Tjallingii, R., and Brauer, A.: VARDA (VARved sediments DAtabase) – providing and connecting proxy data from annually laminated lake sediments, Earth Syst. Sci. Data, 12, 2311–2332, https://doi.org/10.5194/essd-12-2311-2020, 2020.
R Core Team: A Language and Environment for Statistical Computing, R Foundation for Statistical Computing, Vienna, Austria, http://www.R-project.org (last access: 9 April 2025), 2025.
Reimer, P. J., Austin, W. E. N., Bard, E., Bayliss, A., Blackwell, P. G., Bronk Ramsey, C., Butzin, M., Cheng, H., Edwards, R. L., Friedrich, M., Grootes, P. M., Guilderson, T. P., Hajdas, I., Heaton, T. J., Hogg, A. G., Hughen, K. A., Kromer, B., Manning, S. W., Muscheler, R., Palmer, J. G., Pearson, C., van der Plicht, J., Reimer, R. W., Richards, D. A., Scott, E. M., Southon, J. R., Turney, C. S. M., Wacker, L., Adolphi, F., Büntgen, U., Capano, M., Fahrni, S. M., Fogtmann-Schulz, A., Friedrich, R., Köhler, P., Kudsk, S., Miyake, F., Olsen, J., Reinig, F., Sakamoto, M., Sookdeo, A., and Talamo, S.: The IntCal20 Northern Hemisphere Radiocarbon Age Calibration Curve (0–55 cal kBP), Radiocarbon, 62, 725–757, https://doi.org/10.1017/RDC.2020.41, 2020.
Ritchie, J. C. and McHenry, J. R.: Application of Radioactive Fallout Cesium-137 for Measuring Soil Erosion and Sediment Accumulation Rates and Patterns: A Review, J. Environ. Qual., 19, 215–233, https://doi.org/10.2134/jeq1990.00472425001900020006x, 1990.
Shabbar, A., Higuchi, K., Skinner, W., and Knox, J. L.: The association between the BWA index and winter surface temperature variability over eastern Canada and west Greenland, Int. J. Climatol, 17, 1195–1210, https://doi.org/10.1002/(SICI)1097-0088(199709)17:11<1195::AID-JOC190>3.0.CO;2-U, 1997.
Shabbar, A., Huang, J., and Higuchi, K.: The relationship between the wintertime north Atlantic oscillation and blocking episodes in the north Atlantic, Int. J. Climatol, 21, 355–369, https://doi.org/10.1002/joc.612, 2001.
Sicre, M.-A., Yiou, P., Eiríksson, J., Ezat, U., Guimbaut, E., Dahhaoui, I., Knudsen, K.-L., Jansen, E., and Turon, J.-L.: A 4500-year reconstruction of sea surface temperature variability at decadal time-scales off North Iceland, Quaternary Sci. Rev., 27, 2041–2047, https://doi.org/10.1016/j.quascirev.2008.08.009, 2008.
St-Onge, G., Mulder, T., Piper, D. J. W., Hillaire-Marcel, C., and Stoner, J. S.: Earthquake and flood-induced turbidites in the Saguenay Fjord (Québec): a Holocene paleoseismicity record, Quaternary Sci. Rev., 23, 283–294, https://doi.org/10.1016/j.quascirev.2003.03.001, 2004.
Stuiver, M., and Reimer, P. J. : CALIB rev. 8, Radiocarbon, 35, 215-230, http://calib.org (last access: 9 April 2025), 1993.
Tedesco, M. and Fettweis, X.: Unprecedented atmospheric conditions (1948–2019) drive the 2019 exceptional melting season over the Greenland ice sheet, The Cryosphere, 14, 1209–1223, https://doi.org/10.5194/tc-14-1209-2020, 2020.
Trottier, A.-P., Lajeunesse, P., Gagnon-Poiré, A., and Francus, P.: Morphological signatures of deglaciation and postglacial sedimentary processes in a deep fjord-lake (Grand Lake, Labrador), Earth Surf. Proc. Land., 45, 928–947, https://doi.org/10.1002/esp.4786, 2020.
van Oldenborgh, G. J. and Burgers, G.: Searching for decadal variations in ENSO precipitation teleconnections, Geophys. Res. Lett. 32, https://doi.org/10.1029/2005GL023110, 2005.
Wang, F., Arseneault, D., Boucher, É., Gennaretti, F., Lapointe, F., Yu, S., and Francus, P.: Volcanic Imprints in Last-Millennium Land Summer Temperatures in the Circum–North Atlantic Area, J. Climate, 36, 5923–5939, https://doi.org/10.1175/jcli-d-23-0107.1, 2023.
Wang, J., Yang, B., Ljungqvist, F. C., Luterbacher, J., Osborn, Timothy J., Briffa, K. R., and Zorita, E.: Internal and external forcing of multidecadal Atlantic climate variability over the past 1,200 years, Nat. Geosci., 10, 512–517, https://doi.org/10.1038/ngeo2962, 2017.
Way, R. G. and Viau, A. E.: Natural and forced air temperature variability in the Labrador region of Canada during the past century, Theor. Appl. Climatol., 121, 413–424, https://doi.org/10.1007/s00704-014-1248-2, 2015.
Wilson, R., Anchukaitis, K., Briffa, K. R., Büntgen, U., Cook, E., D'Arrigo, R., Davi, N., Esper, J., Frank, D., Gunnarson, B., Hegerl, G., Helama, S., Klesse, S., Krusic, P. J., Linderholm, H. W., Myglan, V., Osborn, T. J., Rydval, M., Schneider, L., Schurer, A., Wiles, G., Zhang, P., and Zorita, E.: Last millennium northern hemisphere summer temperatures from tree rings: Part I: The long term context, Quaternary Sci. Rev., 134, 1–18, https://doi.org/10.1016/j.quascirev.2015.12.005, 2016.
Zolitschka, B., Francus, P., Ojala, A. E. K., and Schimmelmann, A.: Varves in lake sediments – a review, Quaternary Sci. Rev., 117, 1–41, https://doi.org/10.1016/j.quascirev.2015.03.019, 2015.


