the Creative Commons Attribution 4.0 License.
the Creative Commons Attribution 4.0 License.
 | 08 Sep 2025
Speleothem evidence for Late Miocene extreme Arctic amplification – an analogue for near-future anthropogenic climate change?
Stuart Umbo
Franziska Lechleitner
Thomas Opel
Sevasti Modestou
Tobias Braun
Anton Vaks
Gideon Henderson
Pete Scott
Alexander Osintzev
Alexandr Kononov
Irina Adrian
Yuri Dublyansky
Alena Giesche
Sebastian F. M. Breitenbach
The Miocene provides an excellent climatic analogue for near-future runaway anthropogenic warming, with atmospheric CO2 concentrations and global average temperatures similar to those projected for the coming century under extreme-emissions scenarios. However, the magnitude of Miocene Arctic warming remains unclear due to the scarcity of reliable proxy data. Here we use stable oxygen isotope and trace element analyses, alongside clumped isotope and fluid inclusion palaeothermometry of speleothems to reconstruct palaeo-environmental conditions near the Siberian Arctic coast during the Tortonian (8.68 ± 0.09 Ma). Stable oxygen isotope records suggest warmer-than-present temperatures. This is supported by temperature estimates based on clumped isotopes and fluid inclusions giving mean annual air temperatures between +6.6 and +11.1 °C, compared with −12.3 °C today. Trace elements records reveal a highly seasonal hydrological environment.
Our estimate of > 18 °C of Arctic warming supports the wider consensus of a warmer-than-present Miocene and provides a rare palaeo-analogue for future Arctic amplification under high-emissions scenarios. The reconstructed increase in mean surface temperature far exceeds temperatures projected in fully coupled global climate models, even under extreme-emissions scenarios. Given that climate models have consistently underestimated the extent of recent Arctic amplification, our proxy data suggest Arctic warming may exceed current projections.
- Article
(2054 KB) - Full-text XML
-
Supplement
(7984 KB) - BibTeX
- EndNote


The Arctic and sub-Arctic regions have warmed nearly 4 times faster than the global average since 1979 (Rantanen et al., 2022), and this disproportionate warming is expected to continue over the coming decades (Ma et al., 2022). Climate models have consistently underestimated the magnitude of this so-called Arctic amplification (Chylek et al., 2022; Rantanen et al., 2022) and show considerable discrepancies in its predicted magnitude (Smith et al., 2020; Taylor et al., 2022). Uncertainty in Arctic temperature projections is greater than for any other region on the planet (Taylor et al., 2022).
Improving Arctic climatic projections is imperative for informing local adaptation efforts. Warming is driving permafrost thaw and ice retreat and impacting ecosystems, infrastructure, and access to food, whilst weather-related changes are increasing natural hazards (Ford et al., 2015). Localized warming could have global impacts. The Arctic is home to most of the planet's permafrost, a possible climate tipping element (McKay et al., 2022; Nitzbon et al., 2024). Permafrost is the Earth's largest terrestrial carbon pool (Strauss et al., 2024), and its future thaw will play a major role in potential climate trajectories. Furthermore, modelling studies suggest Greenland Ice Sheet mass loss, driven by Arctic warming, will be a major contributor to 21st century sea level rise, with the potential to significantly weaken the Atlantic Meridional Overturning Circulation (Hofer et al., 2020).
Detailed palaeoclimate records present an excellent opportunity to verify climate models and improve future projections. Whilst past warm intervals represent imperfect analogues for near-future climate because of differences in climate forcing, these periods can provide important examples of planetary response to atmospheric warming. Recently, Steinthorsdottir et al. (2021b) proposed the Miocene (23.03–5.33 Ma) as a suitable palaeo-analogue for future anthropogenic climate change. The distribution of continental landmasses was similar to the present day, and atmospheric pCO2 concentrations were close to modern levels. Reconstructions generally agree on atmospheric pCO2 values between 400 and 600 ppm throughout the Miocene (Steinthorsdottir et al., 2021a). Whilst some estimates suggest this may have reached as high as 800–1000 ppm during the Miocene Climatic Optimum (MCO) (Rae et al., 2021), most studies suggest it was considerably lower, likely between 430 and 630 ppm (Sosdian et al., 2018; Super et al., 2018). Subsequent cooling of ca. 6 °C was coincident with a ca. 125 ppm decline in atmospheric CO2 (Super et al., 2018). By the Late Miocene (ca. 7–5.4 Ma), multiple reconstructions converge on atmospheric carbon dioxide concentrations between 300 and 500 ppm (Rae et al., 2021; Sosdian et al., 2018; Super et al., 2018), close to modern-day levels (ca. 420 ppm), with the upper estimate similar to temperatures projected for the coming decades at current emission rates (IPCC, 2021).
Burls et al. (2021) synthesized available proxy temperature reconstructions to deduce a global mean surface temperature of 21.21 ± 0.56 °C for the Early Miocene. Temperatures declined rapidly following the MCO, particularly in the high latitudes, where cooling up to 8 °C is observed in marine records (Herbert et al., 2016). By the Late Miocene, global mean sea surface temperature (SST) was ca. 6 °C higher than the present day (Herbert et al., 2016), and mean terrestrial surface temperature was ca. 4.5 °C above the modern day (Pound et al., 2011). Proxy reconstructions suggest a much-reduced latitudinal temperature gradient, which saw Arctic mean annual temperature (MAT) 11–19 °C warmer than present during the Middle Miocene (Steinthorsdottir et al., 2021b, and references therein), declining to between 5 and 6 °C above the pre-industrial level by the Late Miocene (Pound et al., 2012). Whilst this period saw the establishment of a stable Antarctic ice sheet (Miller et al., 2020), biomarker evidence suggests that ice-free summers in the Arctic persisted (Stein et al., 2016).
Modelling reconstructions, driven by inferred Miocene atmospheric CO2 concentrations, have consistently failed to reconstruct the high temperatures and reduced latitudinal temperature gradient seen in the Miocene proxy records (Goldner et al., 2014). It is unclear whether this discrepancy arises due to missing climatic feedbacks within climate models or consistent under-/over-estimation of atmospheric CO2 concentrations and temperatures in proxy reconstructions, but resolving it is of importance for estimation of future warming. Here we present a multi-proxy analysis of four speleothems (cave carbonate deposits) from the Siberian Arctic to infer environmental conditions during the Tortonian Stage of the Late Miocene Sub-epoch. We use isotope measurements of speleothem fluid inclusions and clumped isotope analyses to estimate multi-annual mean surface air palaeotemperatures and stable oxygen isotope and trace element data to reconstruct palaeo-hydrology and seasonality, providing a new, high-precision dataset to understand Miocene climate sensitivity.
2.1 Study site
Samples were collected from the Taba Ba'astakh cliffs (72.27° N, 126.94° E), which rise ca. 140 m above the eastern riverbank near the entrance of the Lena River delta, ca. 100 km northwest of Tiksi, Sakha Republic, Russian Federation (Fig. 1). The cliffs are composed of Carboniferous-aged carbonates (Mikhaltsov et al., 2018). Lower strata (up to ca. 50 m above current river level) comprise fine quartzitic sandstone, siltstone, sandy dolomite, and dolomitic limestone with sparse fossil coral and ostracod and foraminifera assemblages broadly linked to the Tournaisian (358.9–346.7 Ma) (Izokh and Yazikov, 2017). Above, ca. 50 m from the riverbank, bioclastic carbonate, calcareous siliciclastics, and carbonates form a subsiding platform. Continuous permafrost, 400–600 m thick, is found in this region, with an active-layer thaw depth between 0.6 and 0.4 m (Boike et al., 2019). All caves encountered during the expedition contained significant ice deposits, rendering modern speleothem formation impossible. Modern tundra vegetation is sparse, consisting mostly of grasses, mosses, and lichens, with a small number of bushes (mainly polar willow). Trees are not found above the caves today.
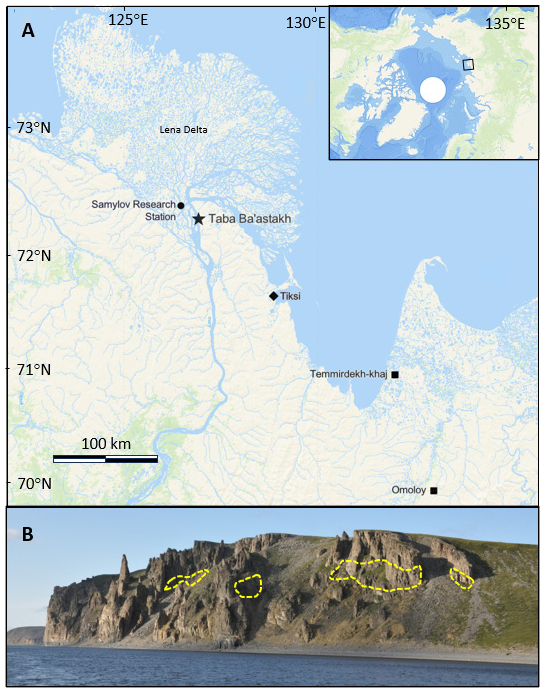
Figure 1(a) Location of Taba Ba'astakh sampling site, Samoylov Research Station, and relevant Miocene palaeoclimate reconstruction sites: Temmirdekh-khaj and Omoloy (Popova et al., 2012). The green shading shows forested areas (map created in Esri ArcGIS). (b) Photograph of the Taba Ba'astakh cliffs (height ca. 120–140 m) with cave locations outlined with yellow dashed lines (adapted from Vaks et al., 2025).
Meteorological data recorded at the Samoylov Island Research Station in the central Lena River Delta (72.37° N, 126.48° E), ca. 20 km northwest of our study area, indicate a polar tundra climate (ET according to the Köppen–Geiger classification; Peel et al., 2007), with a mean annual air temperature (MAAT) of −12.3 °C, July average of +9.5 °C, and February average of −32.7 °C (all temperature data averaged between 1998 and 2017) (Boike et al., 2019). The closest available mean annual rainfall estimate is 309 mm (1980–2018), measured at the Tiksi meteorological station 90 km southeast of Taba Ba'astakh (Buchwal et al., 2023).
2.2 Sample description
Fourteen speleothem samples were collected from the base of the Taba Ba'astakh cliffs, on the bank of the Lena River in 2014. The modern caves are ice filled and inaccessible after a few metres, but erosion of the cliff face has exposed the interior of relic caves, with speleothems observed along the cliff walls. Observations of ongoing weathering of cave walls suggest that these samples originated from the cliff face 70–120 m above the sampling site where some in situ speleothems were also found. All 14 samples have been dated to the Tortonian Stage (Vaks et al., 2025) using U–Pb dating following a modified method described in Vaks et al. (2020) and Mason et al. (2022). The 235U–207Pb–208Pb/207Pb isochron age of all samples yielded an age of 8.68 ± 0.09 Ma, with a mean square weighted deviation of 1.2 (Vaks et al., 2025). Overlapping uncertainties of top and bottom ages only allow the construction of relative age–depth models along the growth profile of individual samples.
Four samples, STBB I – 1, STBB II – 7, STBB 4 – 2, and STBB 4 – 3 (Fig. 2), were selected for this study, as their high-precision dates and large size make them amenable for coupled reconstruction of temperature and climate conditions at their time of deposition. All samples are composed of calcite (Vaks et al., 2025).
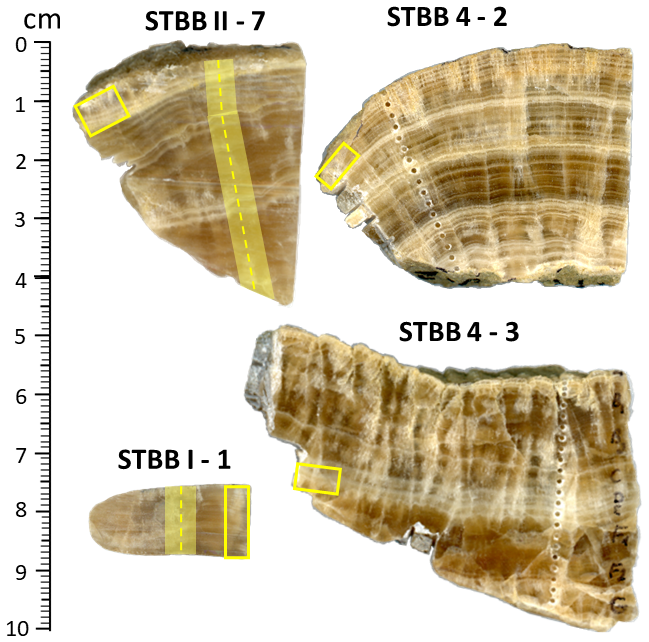
Figure 2Speleothem samples used in this study. Thick translucent tracks, overlain with dashed lines, show the positions of stable isotope and trace element sampling profiles, respectively (STBB I – 1 and STBB II – 7 only). Boxes indicate clumped isotope sampling positions.
3.1 Clumped isotope geothermometry
Clumped isotope analyses for estimating speleothem formation temperatures were performed on subsamples of all four speleothems. Measurements were conducted at Northumbria University using a Nu Instruments Perspective dual-inlet isotope ratio mass spectrometer coupled with an automated NuCarb preparation system. Samples were drilled from layers with well-constrained ages and 325 ± 25 µg of powder loaded into sample vials, which were then evacuated and reacted with concentrated orthophosphoric acid at 70 °C. The reactant gas was dehydrated and cleaned using standard procedures (Petersen et al., 2015). Briefly, samples were dehydrated using two liquid nitrogen cryotraps, cooled to −80 °C, and scrubbed of contaminants by passing them through a 1 cm static trap filled with a Porapak™ Q (Waters Corporation) absorbent material, cooled to −30 °C. Each replicate digestion was measured 40 times in dual-inlet mode (total measurement time ca. 40 min). No pressure baseline correction was required.
Final clumped isotope (Δ47) values were calculated using the software Easotope (http://www.easotope.org, last access: 15 June 2023; John and Bowen, 2016) and the D47crunch Python package (Daëron, 2021). Both methodologies used the International Union of Applied Chemistry (IUPAC) parameters for 17O correction and isotopic ratios for Vienna Pee Dee Belemnite (VPDB) and Vienna Standard Mean Ocean Water (VSMOW) (Bernasconi et al., 2018; Brand et al., 2010; Daëron et al., 2016). Application of both methods allowed Δ47 values to be inputted into both our in-house calibration, derived using Easotope, and the composite calibration of Anderson et al. (2021), which is derived using D47crunch.
For the Easotope method, sample Δ47 values were projected onto carbon dioxide equilibrium space (I-CDES-90) following the methodology of Dennis et al. (2011), using standards ETH1, ETH2, and ETH3, and I-CDES Intercarb Δ47 values from Bernasconi et al. (2021). Long-term instrument performance was monitored with an internal standard, Pol-2 (a natural cave pool rim deposit), giving a long-term Δ47 external standard deviation of 0.032 ‰ (Δ47 = 0.656 ± 0.003 ‰ I-CDES-90, = 2.4 ± 1.0 °C, N = 65).
Replicates were measured across multiple runs over a long period of time, similar to the sliding-window approach employed by, for example, Meinicke et al. (2020) and described by Daëron and Gray (2023). Stable isotope and Δ47 outliers (> ± 2σ), alongside samples with elevated Δ48, indicative of contamination (Eiler and Schauble, 2004), were discarded from final Δ47 calculations (Table S4 in the Supplement). After pruning, a minimum of 14 replicate analyses were made for each sample such that Δ47 95 % confidence intervals of ≤ 0.015 ‰ were achieved (i.e. ≤ 0.007 ‰ standard error). All Δ47 uncertainties are quoted as standard errors and 95 % confidence intervals, according to best practices outlined by Fernandez et al. (2017).
For the D47crunch method, contaminated samples were pruned (identified by elevated Δ48 and Δ49), alongside outlier ETH3 replicates (> ± 2σ for δ45–δ47) from each run. A linear drift correction was calculated for δ45–δ47 using ETH3, which was then applied to all sample and standard data. Outlier measurements of ETH1, ETH2, and ETH3 (> ± 2σ for δ45–δ47) were then pruned from each run before being input into D47crunch to calculate I-CDES-90 Δ47 values. Stable isotope and Δ47 outliers (> ± 2σ) were pruned from the replicate data before final Δ47 calculations.
Clumped isotope temperatures () were calculated by inputting D47crunch-derived Δ47 values into the composite regression of Anderson et al. (2021) and Easotope-derived Δ47 values into an internal laboratory calibration calculated from 17 natural inorganic calcite samples precipitated at known temperatures (Fig. S1 in the Supplement, Tables S1 and S2). The derived regression equation, calculated using the York least-squares method (York et al., 2004) in the R geostats package, is
Bracketed numbers denote 1 standard error. This in-house regression has a slightly lower gradient and higher intercept than the composite regression derived by Anderson et al. (2021) (gradient = 0.0391 ± 0.0004, intercept = 0.154 ± 0.004). Measurement and calibration uncertainties were propagated together to calculate temperature uncertainty following the methods of Huntington et al. (2009).
3.2 Fluid inclusion analysis for temperature estimation
Fluid inclusion analyses were conducted on STBB I – 1 and STBB II – 7, where microscopic inspection confirmed the presence of fluid inclusions. Measurements were performed at the University of Innsbruck, Austria, following the method of Dublyansky and Spötl (2009). An aliquot of 1.5 g of carbonate was crushed in a heated crusher under He flow. The released fluid inclusion water was cryo-trapped and then admitted into the TC/EA analyser (Thermo Scientific). After pyrolysis on contact with glassy carbon at 1400 °C, the evolved H2 and CO were separated in the GC column and admitted to a Delta V Advantage mass spectrometer (Thermo Scientific). Calibration was performed by measuring various amounts of reference waters with isotopic compositions bracketing the expected compositions of the sample. Fluid inclusion isotope data are reported with respect to VSMOW. Accuracy of the measurement is 1.5 ‰ for δ2H and 0.2 ‰ for δ18O.
Temperatures from fluid inclusions were calculated using the calibrations of Tremaine et al. (2011) and Coplen (2007) for water–calcite oxygen isotope fractionation.
3.3 Stable oxygen isotopes
Samples STBB I – 1 and STBB II – 7 were micromilled at 50 µm resolution along their growth length using a Sherline micromill, following the methodology outlined in Lechleitner et al. (2020), producing a total of 225 and 823 subsamples, respectively.
Stable isotope analysis was conducted at Northumbria University using a method adapted from Spötl and Vennemann (2003). 110 ± 10 µg of the sample was loaded into a 12 mL borosilicate exetainer tube, flushed with helium, and reacted with concentrated orthophosphoric acid at 70 °C. Liberated CO2 was dried using a Gasbench II and analysed for carbon and oxygen isotope ratios. All samples were measured on a ThermoScientific Delta V Isotope Ratio Mass Spectrometer coupled with a ConFlo IV. We used an in-house laboratory carbonate standard (Plessen), alongside international standards NBS18 and IAEA603, measured every 10 samples to evaluate the runs. An in-house carbonate standard (Pol-2) was used to evaluate long-term external standard deviation, achieving < 0.1 ‰ for δ18O. All carbonate-derived stable isotope data are reported on the VPDB scale.
3.4 Trace element analysis
Trace element to calcium () ratios of 24 trace elements (Tables S7 and S8) were measured along the stable isotope sampling profiles of STBB I – 1 and STBB II – 7 at 2.6 µm resolution, using laser ablation inductively coupled plasma mass spectrometry (LA-ICP-MS) at the University of Western Australia following the methods outlined in Finestone et al. (2022).
We prioritized elements regularly utilized as hydrological proxies including Mg, Sr, and Ba (Stoll et al., 2012; Treble et al., 2015), alongside a vegetation proxy (P), indicators for detrital input (Al, Th) and heavy metals (Fe, Mn) associated with organic matter binding (Hartland et al., 2012). See Tables S7 and S8 for a full list of elements analysed. The stable isotope record was aligned to the trace element record using multiple visual markers such as prominent growth layers and surface blemishes.
Principal component analysis (PCA) was utilized to identify common variability in the Taba Ba'astakh trace element records (Orland et al., 2014). A Gaussian kernel smoothing was applied to trace element records to remove missing data and minimize noise artefacts, before log transformation and z-score normalization to account for the PCA's sensitivity to variable scaling. The PCA was performed using the FactoMineR package in R. We applied spectral analysis to smoothed trace element and isotope records to reveal periodicities and dominant frequencies along the speleothem growth length.
4.1 Clumped isotope temperature estimates
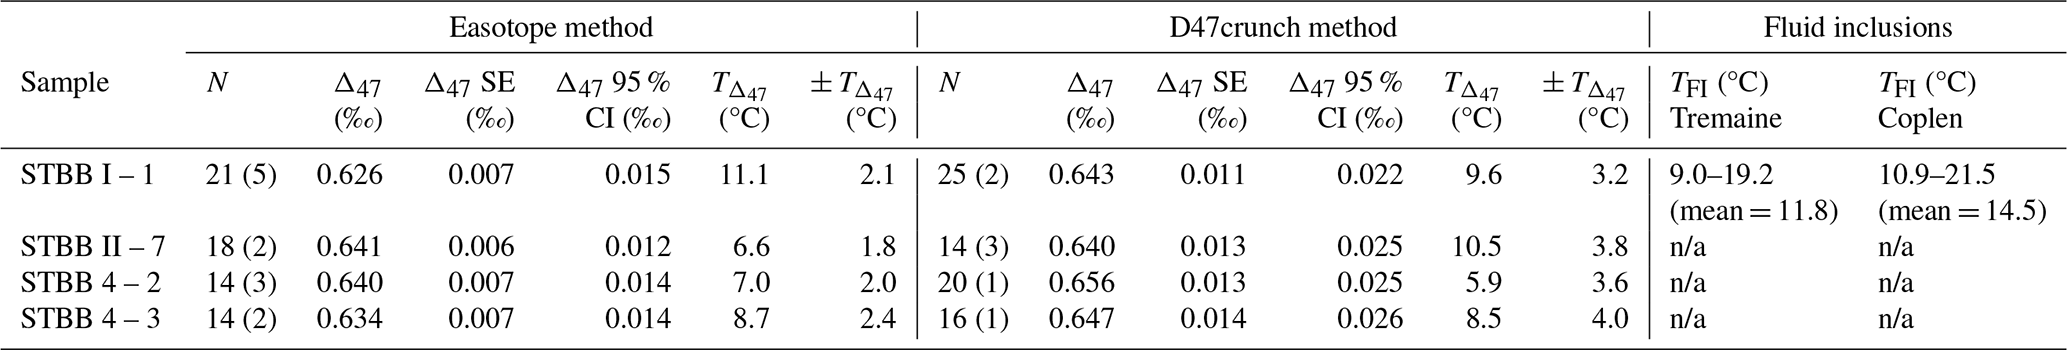
Clumped isotope results are summarized in Table 1. The Δ47 values of our samples range from 0.626 to 0.641 for the Easotope method and 0.640 to 0.656 for the D47crunch method, returning clumped isotope temperature () estimates between 6.6 and 11.1 °C, using our in-house calibration () and 5.9 and 10.5 °C for the D47crunch method and Anderson et al. (2021) regression (). Uncertainty in Δ47 is larger using the D47crunch method (standard error between 0.11 ‰ and 0.14 ‰, 95 % confidence limits between 0.022 ‰ and 0.026 ‰) than the Easotope method (standard error between 0.06 ‰ and 0.07 ‰, 95 % confidence limits between 0.012 ‰ and 0.015 ‰). This is expected given that D47crunch additionally propagates the uncertainty associated with the normalization standards (Daëron, 2021). This uncertainty is not accounted for using Easotope. Both Easotope and D47crunch produce temperatures within uncertainty of each other, with higher uncertainty in the D47crunch method due to larger Δ47 standard errors and the differing methods used to propagate calibration uncertainties (Sect. 3.1).
Table 1Clumped isotope data and temperature estimates from Taba Ba'astakh samples. N = number of replicate Δ47 measurements included in final Δ47 calculations, with the number of excluded samples in parentheses. The number of sample replicates varies between methods due to different outlier exclusion methodologies and the exclusion of replicates with insufficient standard bracketing from the Easotope method calculations. All Δ47 values are reported on I-CDES90. The fluid inclusion temperature (TFI) from STBB I – 1 temperature range is presented for comparison with the mean in parentheses. Replicate measurement data are presented in Table S3. n/a: not applicable.
4.2 Fluid inclusion temperature estimate
Sample STBB I – 1 yielded 0.11 µL of fossil water with a δ18O value of −17.5 ‰ VSMOW and a δD value of −127.7 ‰ VSMOW, giving a deuterium excess value (d-excess) of 12.3 ‰. This value lies within uncertainty of the modern Global Meteoric Water Line (GMWL) (Craig, 1961) and ca. +9 ‰ in δ2H above the modern Local Meteoric Water Line (LMWL) from the Samoylov Island Research Station (Spors, 2018) (Fig. S2). Since large sample volumes are required for fluid inclusion measurements, our δ18O value is obtained from a speleothem section incorporating the entire growth length, representing an average of the entire speleothem. Thus, we applied a constant δ18O value of −17.5 ‰ (VSMOW) for dripwater (δ18Odw) across the entire calcite δ18O record to obtain minimum and maximum temperature estimates. Sample STBB II – 7 failed to yield sufficient inclusion water for analysis, and thus no temperature estimate could be derived from this sample. The lower end of the STBB I – 1 fluid-inclusion-derived temperature estimate (TFI = 9.0–19.2 °C) overlaps with the independently derived estimate ( = 11.1).
4.3 Stable oxygen isotopes
Speleothem δ18O ranges between −17.5 ‰ and −14.6 ‰ VPDB, with mean values of −15.6 ‰ and −16.9 ‰ for STBB II – 7 and STBB I – 1, respectively (Fig. 3). STBB I – 1 δ18O exhibits an initial decline, reaching a minimum around 4 mm where the trend reverses. A sharp increase is observed around 7 mm where the record peaks and remains relatively constant thereafter. The STBB II – 7 δ18O record exhibits a similar initial decline of ca. 1 ‰ until ca. 20 mm, where this trend reverses. At ca. 37 mm δ18O declines by ca. 1 ‰ in the final ca. 4 mm of the record.
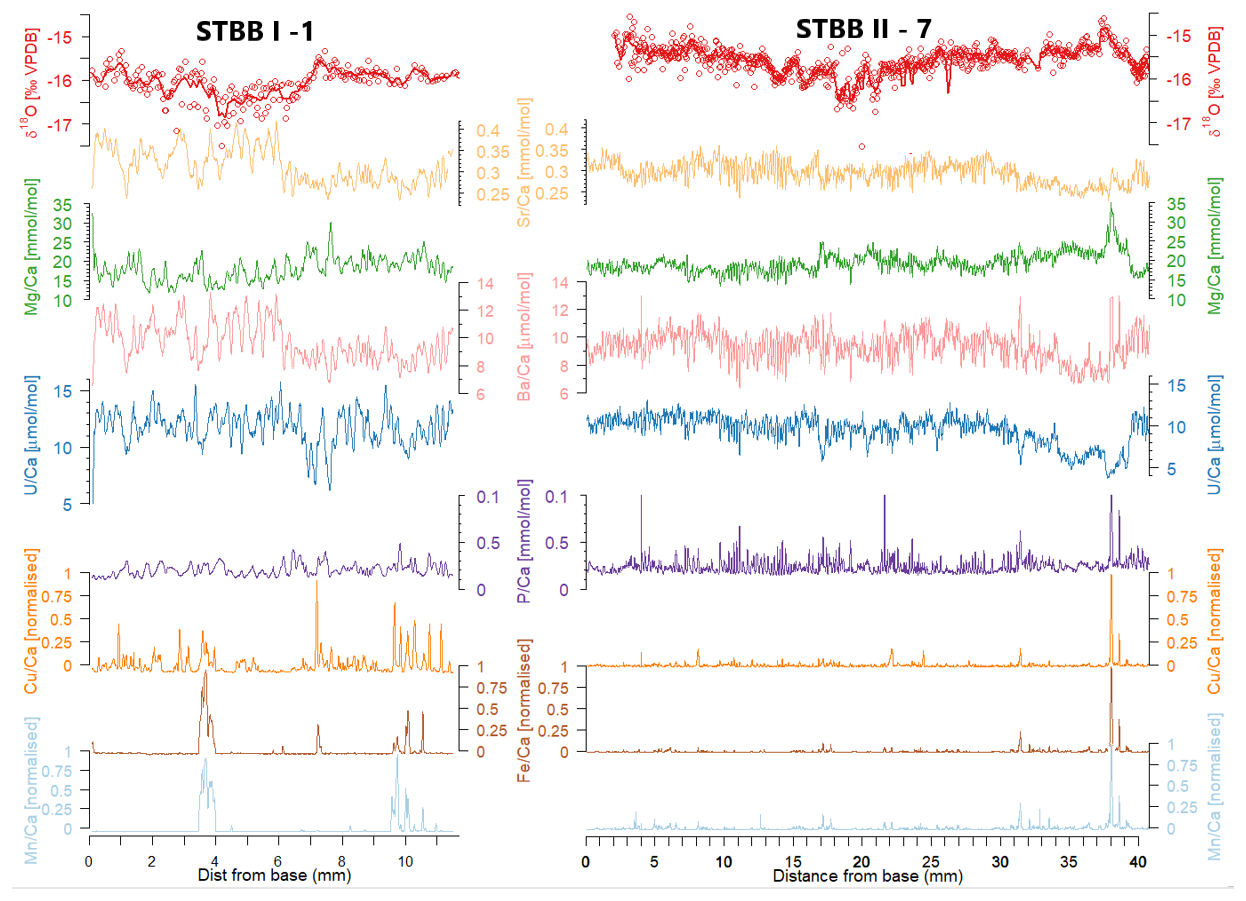
Figure 3δ18O and selected trace element records for STBB I – 1 and STBB II – 7. δ18O data are shown with a 0.25 mm rolling window smoothing (thick lines). Trace elements are smoothed to 0.01 mm rolling window. . , and ratios have been mean normalized for easier comparison between the two samples.
4.4 Trace elements
Our analysis focuses on 18 elements, predominantly cation substitutes Ba, Mg, Sr, and U and metals Cu, Co, Fe, and Mn. Concentrations of Y, La, Ce, Nd, Yb, and Th were below the detection limit, and thus these elements were removed from subsequent analysis.
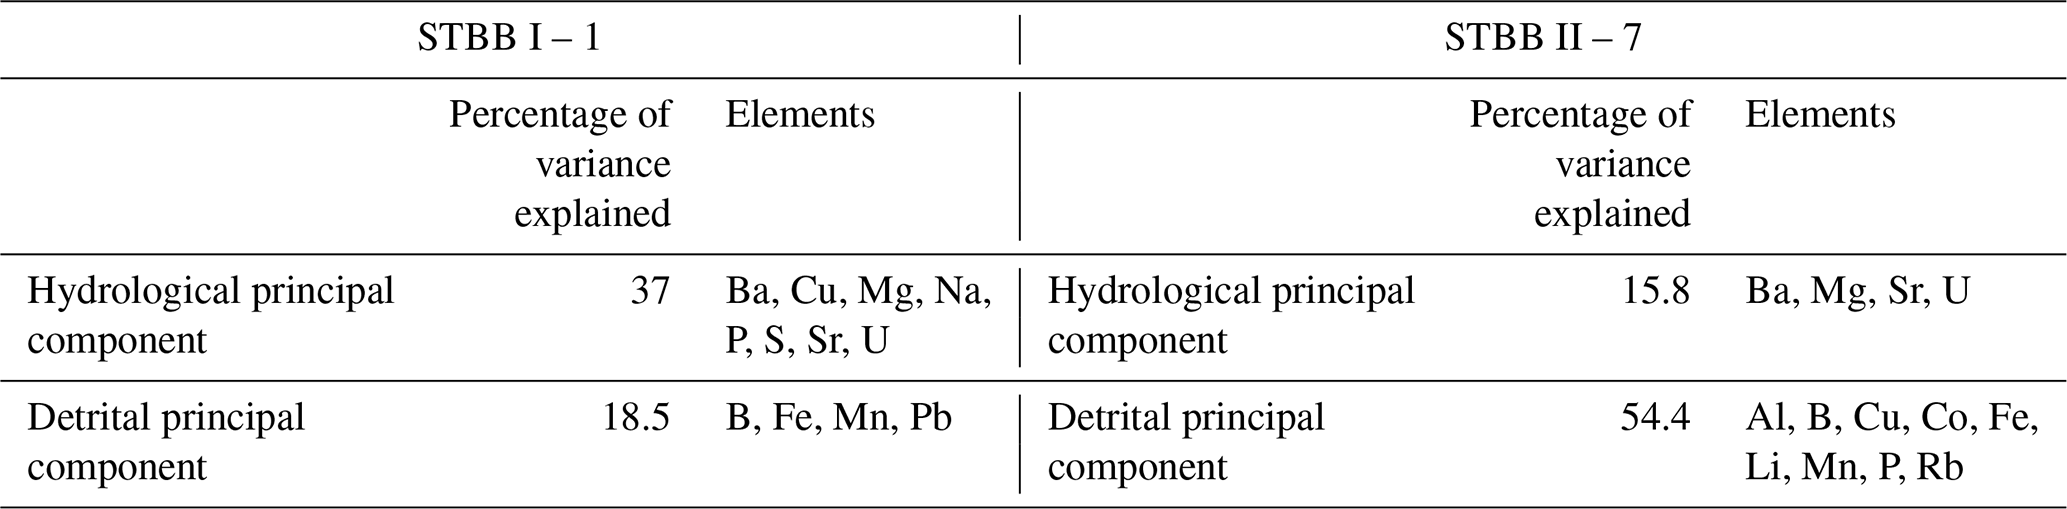
We identify two dominant principal components (PCs) in each sample, accounting for 55.5 % and 70.2 % of the variance in STBB I – 1 and STBB II – 7, respectively (Table 2, Fig. S4). The first PC correlates with Ba, Sr, Mg, and U and accounts for 37 % of the variance in STBB I – 1 and 15.8 % in STBB II – 7. These elements are commonly utilized as hydrological proxies in speleothems (Tooth and Fairchild, 2003; Treble et al., 2015), and we therefore refer to this PC as the hydrological PC. This PC also correlates with Na, P, and S in STBB I – 1. The second PC correlates with B, Fe, Mn, and Pb in both samples (Al, Cu, Co, Li, P, and Rb are also included in STBB II – 7) and accounts for 18.5 % of the variance in STBB I – 1 and 54.4 % in STBB II – 7. These elements are commonly associated with detrital input via flushing (Hartland et al., 2012), and we therefore refer to this PC as the detrital PC herein.
Table 2Results of multivariate principal component analysis on Taba Ba'astakh speleothem samples. Two major elemental groupings are highlighted: the hydrological principal component, generally defined by elements Ba, Mg, P, Sr, and U, and the detrital principal component, defined by elements Al, B, Cu, Co, Fe, Mn, Rb, and Pb.
Spectral analysis revealed strong cyclicity in the hydrological PC elemental ratios (Ba, Mg, Sr, and U) in both samples, with dominant wavelengths at ∼ 0.3 and 0.5 mm in STBB I – 1 and 0.2 mm in the STBB II – 7 (Fig. S3). We also observe cyclicity in P (∼ 0.3 and 0.5 mm in STBB I – 1, ∼ 0.2–0.25 mm in STBB II – 7) and Cu (∼ 0.2 mm, in STBB I – 1 only). Detrital PC metals remain relatively constant with sporadic spikes (Fig. 3).
The Late Miocene climate is widely accepted to have been several degrees warmer than today. Global SSTs were ca. 6 °C warmer than present (Herbert et al., 2016), and mean global surface temperature was ca. 4.5 °C above modern (1870–1900) (Pound et al., 2011). Most temperature estimates for the Miocene stem from marine sediments, and terrestrial data from high northern latitudes are exceedingly sparse (e.g. Popova et al., 2012). Our speleothem records give a rare insight into terrestrial high-latitude environmental changes, including temperature and hydrological conditions during this period.
Taba Ba'astakh lies deep within the modern continuous permafrost zone with a MAAT of −12.3 °C. We infer a mean annual ground temperature (MAGT) of −8.4 °C, which we calculate by averaging temperature along a 27 m borehole at the Samoylov Island Research Station (Boike et al., 2013). Since speleothem growth depends on liquid water supply, their presence at Taba Ba'astakh indicates a much warmer climate at the time of their formation (8.68 ± 0.09 Ma).
5.1 Quantitative Tortonian temperature estimates
For comparison we calculated our clumped isotope temperatures using both the Easotope software and our in-house calibration and the D47crunch data reduction algorithm with the composite calibration of Anderson et al. (2021). Both methods produce temperatures within uncertainty, giving confidence in our reconstructions. uncertainty is greater for the D47crunch method due to propagation of the uncertainty in normalization standards and the different method used to calculate calibration uncertainty (Sect. 3.1). We also provide a direct comparison between clumped isotope and fluid inclusion-based temperature estimates on one sample (STBB I – 1), with the estimates ( = 9.6 ± 6.0 °C and = 11.1 ± 2.1 °C) overlapping with the TFI estimates of both Tremaine et al. (2011) (9.0–19.2 °C, mean = 11.8 °C) (Table 1) and Coplen (2007) (10.9–21.5 °C, mean = 14.5 °C) calibrations (Table 1). A full discussion of temperature reconstruction uncertainties is given in the Supplement. Herein we limit our discussion to temperatures derived using the Easotope method and our in-house calibration since it is derived solely from subaqueous cave carbonates precipitated at temperatures similar to our samples. Both methods give similar mean temperatures across all four samples (mean = +8.4 °C compared with mean = +8.6 °C).
The large sample sizes required for clumped isotope analysis (ca. 4 mg) make sampling of individual growth layers impossible, and thus our temperature estimates derive multi-annual means. The long-held assumption that cave temperature corresponds to mean surface temperature (e.g. Wigley and Brown, 1976) has been questioned (e.g. Domínguez-Villar et al., 2013). Cave temperature is impacted by numerous factors including ventilation (Pflitsch and Piasecki, 2003), thermal conductivity rates through the overburden (Domínguez-Villar et al., 2013), and vegetation and snow cover (Domínguez-Villar et al., 2013; Töchterle et al., 2024), which can all act to produce offsets of several degrees between the surface and the cave environment.
Since erosion has mostly removed the Miocene overburden and brought our samples to the surface, it is impossible to know the full impact that ventilation and conduction of heat may have had on the Taba Ba'astakh cave temperatures. We suggest the insulating effects of winter snow and shading from summer vegetation likely counteracted each other with minimal overall effect. For instance, in cold regions, snow acts to insulate the ground, reducing heat loss to the atmosphere (Molnar, 2022). This insulating effect has been shown to lead to cave temperatures 5–7 °C higher than surface air temperatures in cold regions with persistent (ca. 233 d yr−1) snow cover (Töchterle et al., 2024). Our reconstructions between 6.6 and 11.1 °C suggest a mean annual surface temperature between modern-day Stockholm (Moberg, 2021) and London (Met Office, 2024), which experience significantly less than 233 d yr−1 of snow cover. We therefore envisage a limited effect of snow insulation at Taba Ba'astakh. In addition, there is palynological evidence that the Miocene treeline stretched as far north as 80° N (Steinthorsdottir et al., 2021b), and thus it is reasonable to assume a degree of forest cover at Taba Ba'astakh during that time. Monitoring studies in Eagle Cave, Spain, showed that the transition from shrubland to forest resulted in a reduction in cave temperature up to 2 °C due to changes in insolation and modification of soil properties (Domínguez-Villar et al., 2013). Given the higher latitude of Taba Ba'astakh, it would be reasonable to assume a reduced impact from insolation shielding compared with Eagle Cave; however, a small offset (< ± 2 °C) is possible between our cave reconstructions and surface temperatures. Given global average sea levels ca. 10 m higher during the Late Miocene compared with modern levels (Miller et al., 2005), Taba Ba'astakh might have occupied a more coastal position than the present day. In the modern Arctic, lingering summer sea ice can act to reduce coastal air temperatures compared with inland locations at the same elevation (e.g. Tuktoyaktuk and Inuvik in the Canadian Arctic; Hammar, 2022) through increased albedo and latent heat effects (Vihma, 2014). Miocene Arctic Sea ice was quite reduced compared to the modern day (Stein et al., 2016), suggesting this effect may be limited. Nearby cold month temperature reconstructions from the coastal site Temmirdekh-khaj (Fig. 1) of between −2.8 and +1.1 °C (Popova et al., 2012), considerably warmer than modern levels, support this notion, although we cannot rule out the possibility of lingering cold-season sea ice reducing temperatures more than equivalent latitude inland locations.
To our knowledge, the Taba Ba'astakh temperature reconstructions are the most northerly terrestrial Tortonian MAAT estimates to date and support the consensus of a reduced latitudinal temperature gradient during the Late Miocene (Burls et al., 2021; Gaskell et al., 2022). Our temperature estimates agree well with independent high-latitude temperature reconstructions (Fig. 4). Late Miocene fossil pollen assemblages from nearby sites Temmirdekh-khaj (71° N, 132° E) and Omoloy (70° N, 133° E) (Fig. 1) yield MAAT estimates between 7.3 and 16.1 °C (Popova et al., 2012). The same authors infer a Late Miocene MAAT of 9.7 °C for the whole of eastern Siberia. Exceptionally high summer SSTs between 10 and 16 °C have been reconstructed for the Arctic Ocean at the Lomonosov Ridge (88.5° N) (Stein et al., 2016). Our temperature reconstructions provide new evidence of terrestrial MAAT ca. 18 to 23 °C warmer than present in the Siberian Arctic during the Tortonian. This is far in excess of negative temperatures simulated by models of the Alaskan Arctic during the Middle Miocene (Goldner et al., 2014) and the ca. 3.5 °C above present-day zonal mean estimated in general circulation modelling of the Tortonian (Micheels et al., 2007). Thus, our findings confirm the long-established discrepancy between model simulations and proxy reconstructions with the most northerly terrestrial Miocene proxy temperature record to date and suggest that Miocene Arctic amplification is not accurately captured by general circulation models.
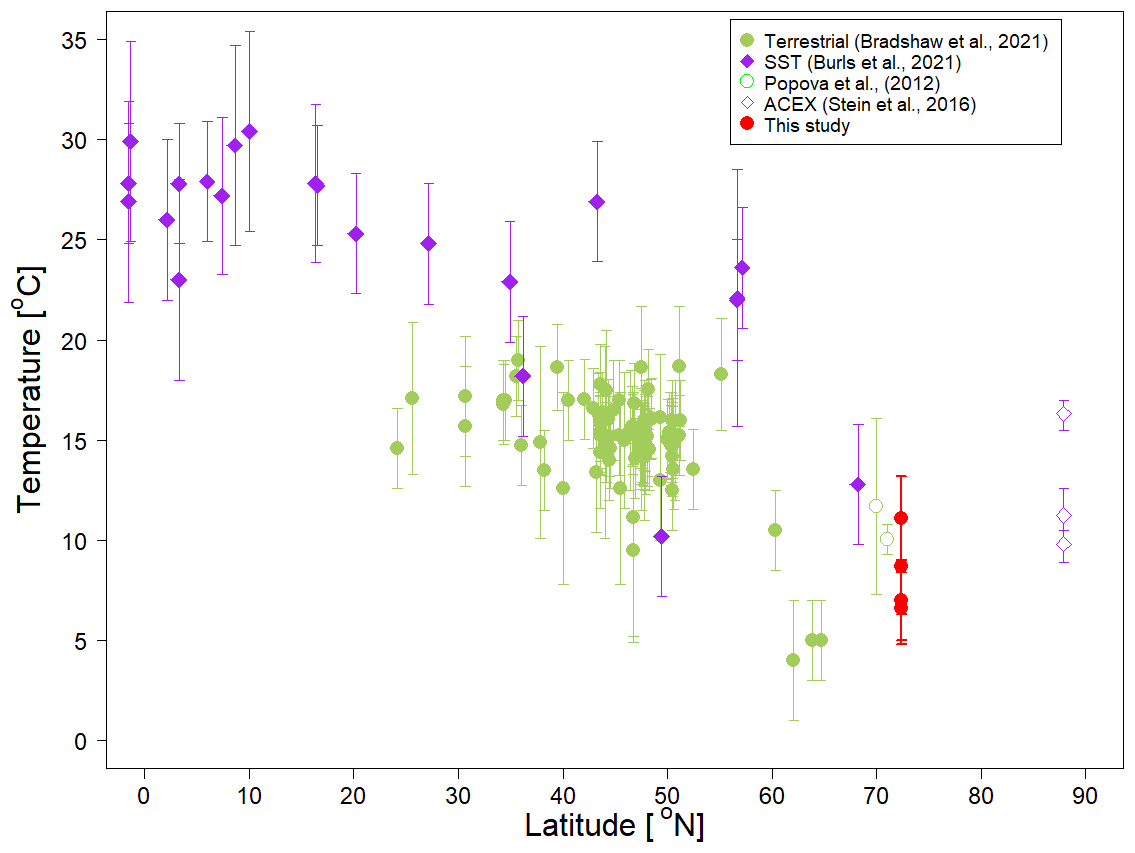
Figure 4Compiled Northern Hemisphere Late Miocene temperature reconstructions. Green filled circles are Tortonian terrestrial mean annual temperatures reconstructions from the Bradshaw et al. (2012) database, with additional sites Temmirdekh-khaj and Omoloy from Popova et al. (2012) shown unfilled. Error bars for terrestrial reconstructions show minimum and maximum estimates. The Late Miocene SST dataset from Burls et al. (2021) is shown as purple diamonds, with error bars showing uncertainty in reconstruction estimate. Additional SST estimates from the ACEX borehole are shown as unfilled purple diamonds (Stein et al., 2016). ACEX borehole temperatures show the average of the four different alkenone-derived temperature calibrations quoted in Stein et al. (2016), with error bars showing the maximum and minimum values. Both terrestrial and SST datasets have been filtered to show only data with age uncertainties overlapping our Taba Ba'astakh estimates. The red circles are the four Taba Ba'astakh clumped isotope temperature reconstructions from this study.
Since a Tortonian global mean surface temperature of 4.5 °C above modern day (Pound et al., 2011) was similar to the 2–5 °C above pre-industrial predicted for the end-of-century projections under high-emissions scenarios (IPCC, 2021), our findings provide estimates for end-of-century Arctic temperature amplification under extreme levels of anthropogenic warming. Our estimates are considerably higher than the ca. 10–12 °C of Arctic warming by the end of the century projected in modelling studies (Nazarenko et al., 2022; Xie et al., 2022) and exceed reconstructions for the Middle Pliocene Warm Period (3.3–3.0 Ma), which suggested Arctic surface air temperature warming of 7.2 °C given global mean temperatures 3.2 °C above the pre-industrial level (de Nooijer et al., 2020).
Our estimates provide useful constraints on near-future Arctic warming, but we emphasize that different planetary-scale boundary conditions in the Miocene compared with today mean our deep-time reconstructions provide imperfect analogues for anthropogenic warming. Whilst the Miocene marked a large-scale expansion of global ice sheets, both Northern and Southern Hemisphere ice sheets were highly dynamic, particularly in Greenland, which was likely only partially glaciated (Steinthorsdottir et al., 2021b). Evidence from ice-wedge pseudomorphs suggests the onset of high-latitude Northern Hemisphere permafrost formation occurred in the Late Pliocene (∼ 3 Ma) (Opel et al., 2025), and it is very likely that the Northern Hemisphere was permafrost-free during the Tortonian (Vaks et al., 2025). These, and other, slow planetary-scale feedbacks will have played a major role in the Miocene global energy budget that are unlikely to be of similar significance in driving near-future temperatures.
5.2 Stable oxygen isotope records
Both Taba Ba'astakh speleothem δ18O records show very negative values (means: −15.6 ‰ and −16.9 ‰). Modern studies have shown that dripwater δ18O (δ18Odw) predominantly reflects changes in δ18O of precipitation (δ18Op) above a cave (Baker et al., 2019), which, at high latitudes, is largely driven by temperature (Dansgaard, 1964). Monthly mean values of δ18Op from both the Samoylov Island Research Station (2013–2017) and Tiksi (2004–2017) are highly correlated to mean monthly air temperatures (Spors, 2018). Thus, we interpret δ18Op, and in turn δ18Odw and speleothem δ18O, as indicative of temperature variations at Taba Ba'astakh.
Similarly negative δ18O values (ca. −16 ‰ to −11 ‰) are found in Greenland speleothems that formed during Marine Isotope Stage (MIS) 15a–14 (Moseley et al., 2021), a Middle Pleistocene period of unusually warm and prolonged interglacials (Rodrigues et al., 2011; Hao et al., 2015). Holocene Arctic speleothem reconstructions are absent from the literature; however, the Taba Ba'astakh isotope records agree well with modern Holocene values found in central Siberia, 15–20° latitude farther south at Botovskaya Cave (55° N), Okhotnichya Cave (52° N) (ca. −18 ‰ to −13 ‰) (Lechleitner et al., 2020), and Kinderlinskaya Cave (54° N) (ca. −14 ‰ to −11 ‰) (Baker et al., 2017). We note that the more negative δ18O of the Miocene Ocean may have compounded a shift to more negative δ18O values (Westerhold et al., 2020), but this would have been somewhat offset by reduced continentality at Taba Ba'astakh (generally associated with positive shifts in δ18O) given the ca. 10 m higher global sea level (Miller et al., 2005). Given these competing influences, we do not propose any firm assertions on the impact of source values of δ18O compared with the modern day on the δ18O signal. Thus, we assume that the stable oxygen isotope records from Taba Ba'astakh support the independent temperature estimates of a much higher MAAT during the Tortonian than at present.
5.3 δ18O signal of palaeo-dripwater
We estimate δ18Odw using our clumped-isotope-derived temperatures in the temperature-dependent water–calcite oxygen isotopic fractionation relationship from Tremaine et al. (2011) (Table 3). Given the control of δ18Op on δ18Odw, the latter provides an estimate for δ18Op. Due to the large sample sizes required for clumped isotope analysis, the samples integrate multiple growth layers, and therefore δ18Odw values reflect multi-annual means.
Table 3Dripwater isotopic composition estimates for the four Taba Ba'astakh speleothems. δ18Occ is the δ18O of calcium carbonate. δ18Occ uncertainties are standard errors. δ18Odw uncertainty is calculated from propagation of and δ18Occ uncertainties.
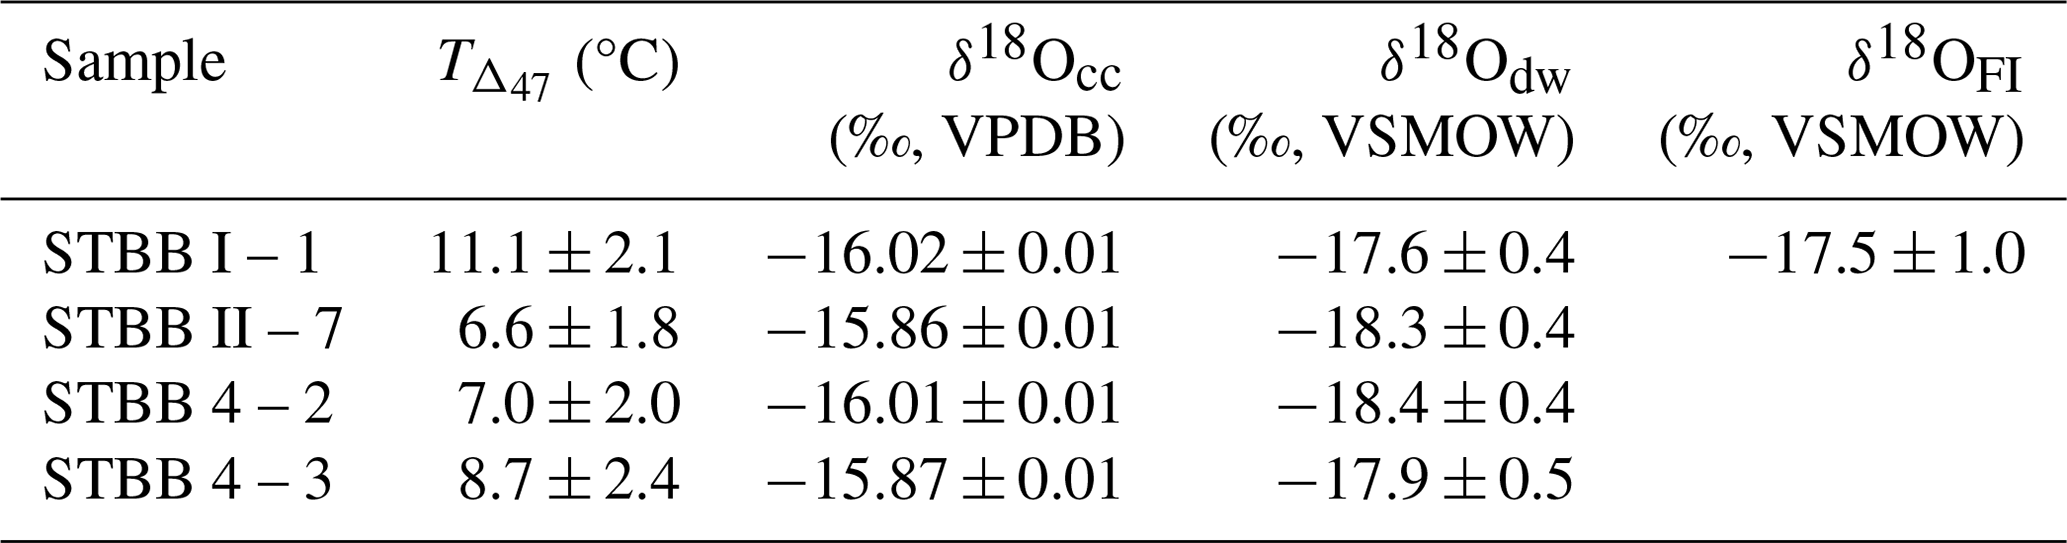
δ18Odw ranges between −17.6 ± 0.4 ‰ and −18.4 ± 0.4 ‰ (VSMOW), within error of the fluid inclusion measurement from STBB I – 1 (−17.5 ± 1.0 ‰). Agreement between these two independent δ18Odw derivations provides additional confidence in our estimate. We stress that this assessment does not consider the influence of additional post-precipitation evaporative processes that complicate isolation of a pure precipitation signal from speleothem fluid inclusions (Lachniet, 2009).
Assuming δ18Odw reflects δ18Op, our reconstructed values for the Tortonian suggest a mean annual precipitation regime between the modern summer (−15.9 ‰) and autumnal regimes (−19.1 ‰) (modern annual mean = −21.6 ‰) (Bonne et al., 2020).
5.4 Seasonal hydrological regime
We propose that the cyclical behaviour of trace elements is driven by a strong seasonal hydrological regime at the time of speleothem deposition. The identified hydrological PC groups in both STBB I – 1 (PC1) and STBB II – 7 (PC2) are associated with element ratios widely utilized as hydrological proxies: most commonly , , and (e.g. Tooth and Fairchild, 2003; Treble et al., 2015). These alkali metals are transported via dripwaters and substituted into the carbonate lattice during speleothem deposition. In periods of low throughflow, Ca is preferentially removed from dripwaters through prior carbonate precipitation (PCP), increasing relative concentrations of Mg, Sr, and Ba.
Correlation of Sr and Mg is often used as an indicator of PCP from infiltration waters before they reach the speleothem formation site (Wassenburg et al., 2020). and exhibit no consistent relationship in either Taba Ba'astakh sample, with periods of high correlation interspersed with periods of no correlation (Fig. S5). Deviation from constant vs. ratios can arise from growth rate variability (Sliwinski et al., 2023) and changing mixing ratios of dripwater solutions derived from multiple geological endmembers (Tremaine and Froelich, 2013). Dating constraints hinder identification of growth rate variability in the Taba Ba'astakh records; however, and decoupling could arise from periods of hydrological rerouting or changing endmember dissolution rates between the carbonate and the overlying dolomitic limestone (Izokh and Yazikov, 2017) altering concentration input.
Tremaine and Froelich (2013) showed that in order to diagnose and as reliable “wet vs. dry” proxies, must remain constant along the entire sampling profile. Whilst this is not the case in the Taba Ba'astakh records, is remarkably highly correlated with (r = 0.98, p value < 0.01 in STBB I – 1 and r = 0.55, p value < 0.01 in STBB II – 7) and (r = 0.59, p value < 0.01 in STBB II – 7 and r = 0.83, p value < 0.01 in STBB II – 7) along the entire growth length of both Taba Ba'astakh samples (Figs. S3 and S4). has been extensively utilized as a PCP proxy (e.g. Stoll et al., 2012) and might constitute a more robust PCP proxy that is less likely affected by host rock composition at Taba Ba'astakh. Few studies have considered a potential indicator of infiltration changes. Dripwater U is derived from bedrock dissolution and is readily incorporated into the calcite lattice (Oster et al., 2023). The strong correlation of U with both Sr and Ba in the Taba Ba'astakh records suggests that may also reflect changes in PCP in the Taba Ba'astakh records. Finally, is also included in the hydrological principal component in STBB I – 1 and is strongly anticorrelated with Sr, Ba, and U. P is scavenged from infiltration water during calcite precipitation, thus decreasing in dripwater during periods of elevated PCP (Johnson et al., 2006) – as is observed in the Taba Ba'astakh records (indicated by elevated , and , Fig. 5).
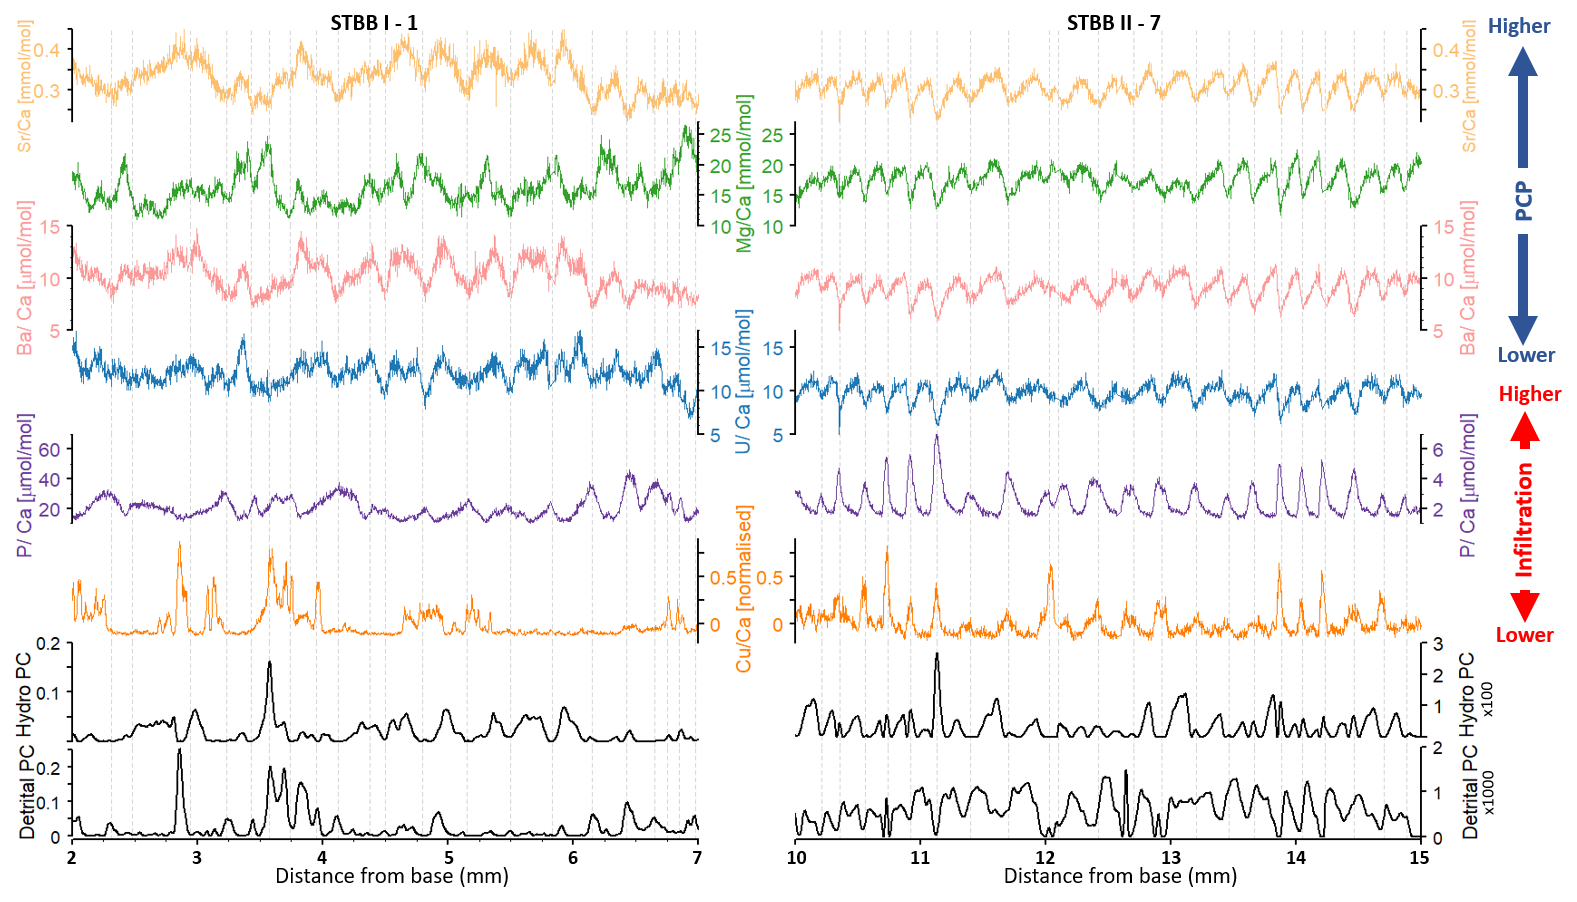
Figure 5High-resolution trace element concentrations and major principal components along the STBB I – 1 and STBB II – 7 sampling profiles. The ratio has been mean-normalized for easier comparison between the two samples. Grey dashed vertical lines mark the positions of troughs.
The detrital principal component is characterized by metals which are commonly associated with organic matter flux into the cave (Hartland et al., 2012). These metals are poorly soluble and colloidally transported through organic matter binding during soil infiltration (Hartland et al., 2012). Hartland et al. (2012) demonstrated Cu and Co organic binding by showing speleothem vs. ratios in line with those predicted based on n1 NICA-Donnan humic and fulvic binding affinity ratios (Milne et al., 2003). We repeat this calculation for our records and find that the measured vs. ratios show good agreement with predicted ratios in STBB II – 7 (Fig. S6), confirming these metals are indeed derived from organic binding in this sample. There is poor agreement between predicted and measured ratios in STBB I – 1, suggesting detrital metals in this sample are not associated with organic binding. Phosphorus is also included in the detrital principal component in STBB II – 7. P supply has been linked with vegetative leaching during storm events (Pionke et al., 1997), with maximum linked to elevated infiltration rates (Borsato et al., 2007). Thus, the strong positive correlation observed between P and organically bound metals provides further evidence that these element variations reflect infiltration rates in STBB II – 7.
We present a subsection of the trace element records in Fig. 5, where correlation between Mg and other hydrological proxies is highest to illustrate the relationship between hydrological and detrital proxies. In STBB II – 7, maxima in PCP controlled elements Sr, Mg, Ba, and U coincide with minima in the infiltration-controlled elements P and Cu. Thus, wet seasons are identified as maxima in infiltration proxies ( and ) and minima in the PCP proxies Sr, Mg, Ba, and U. The opposite is true for dry seasons. The relationship between detrital infiltration and PCP proxies is less apparent in STBB I – 1 (Fig. 5), where we have demonstrated that detrital proxies are not controlled by organic matter influx (Fig. S6). However, strong cyclicity is observed in all PCP proxies, as well as P, which shows a similar anticorrelation with PCP proxies to that in STBB II – 7.
Spectral analysis reveals dominant cycles corresponding to distances of 0.3 and 0.5 and 0.2 mm in STBB I – 1 and STBB II – 7, respectively (Fig. S3). Our assertion that these cycles are annual is supported by the observed alignment of the record with annual banding in STBB II – 7 (Fig. S7), identified by changes in the visual greyscale. We use free ImageJ software to extract grey values (the intensity of light carried in a single pixel) along the growth length of a high-resolution composite image STBB II – 7 thin sections (Breitenbach and Marwan, 2023). In this way, annual growth bands were identified. peaks coincide with greyscale peaks (brighter layers). Thus, our trace element periods reflect growth rates of 200 µm yr−1 (STBB II – 7) and 300 µm yr−1 (STBB I – 1), similar to those observed in modern temperate regions (Johnson et al., 2006; Sherwin and Baldini, 2011).
We compare Miocene and modern-day hydrological seasonality using a 20-year instrumental record of rainfall from the nearby Samoylov Island Research Station. We combined common hydrological proxies , , , , and to obtain a single representative proxy-stack-average time series and aligned it to the instrumental record using dynamic time warping (Berndt and Clifford, 1994) (see Fig. S8 in the Supplement for details). While this methodology does not eliminate the considerable challenges of comparing palaeoseasonal proxy data to modern seasonality, it yields a pseudo-seasonal time axis that allows us to estimate precipitation seasonality in a comparable fashion for both sets of records. We compared the aligned modern and Miocene hydrological seasons using a spectral seasonality measure. Precipitation seasonality is quantified by the total spectral power |P|s summed over the spectral band that closely encapsulates the seasonal peak (Fig. S9). Higher power in the seasonal band is interpreted as a more pronounced/stable seasonal signal. Detailed methodology is given in the Supplement.
The combined hydrological proxy records suggest a stronger seasonal precipitation regime during the Tortonian (i.e. a more pronounced seasonal cycle) compared with modern-day conditions (Fig. 6). This is true of both samples, with significantly higher median spectral power in the seasonal band in the Miocene compared with the modern level. We recognize the limitations in the modern record, which, whilst it is the closest available modern precipitation time series, measures only the liquid fraction and not snowfall, which constitutes ca. 30 % total precipitation at the Samoylov Research Station (Boike et al., 2013). However, exclusion of the winter snow component within the modern record will create an apparent stronger seasonal contrast. Given that our Tortonian hydrological proxy record exhibits a stronger seasonality measure than this modern rainfall record, we argue this reinforces our finding of a more seasonal hydrological regime in the Tortonian.
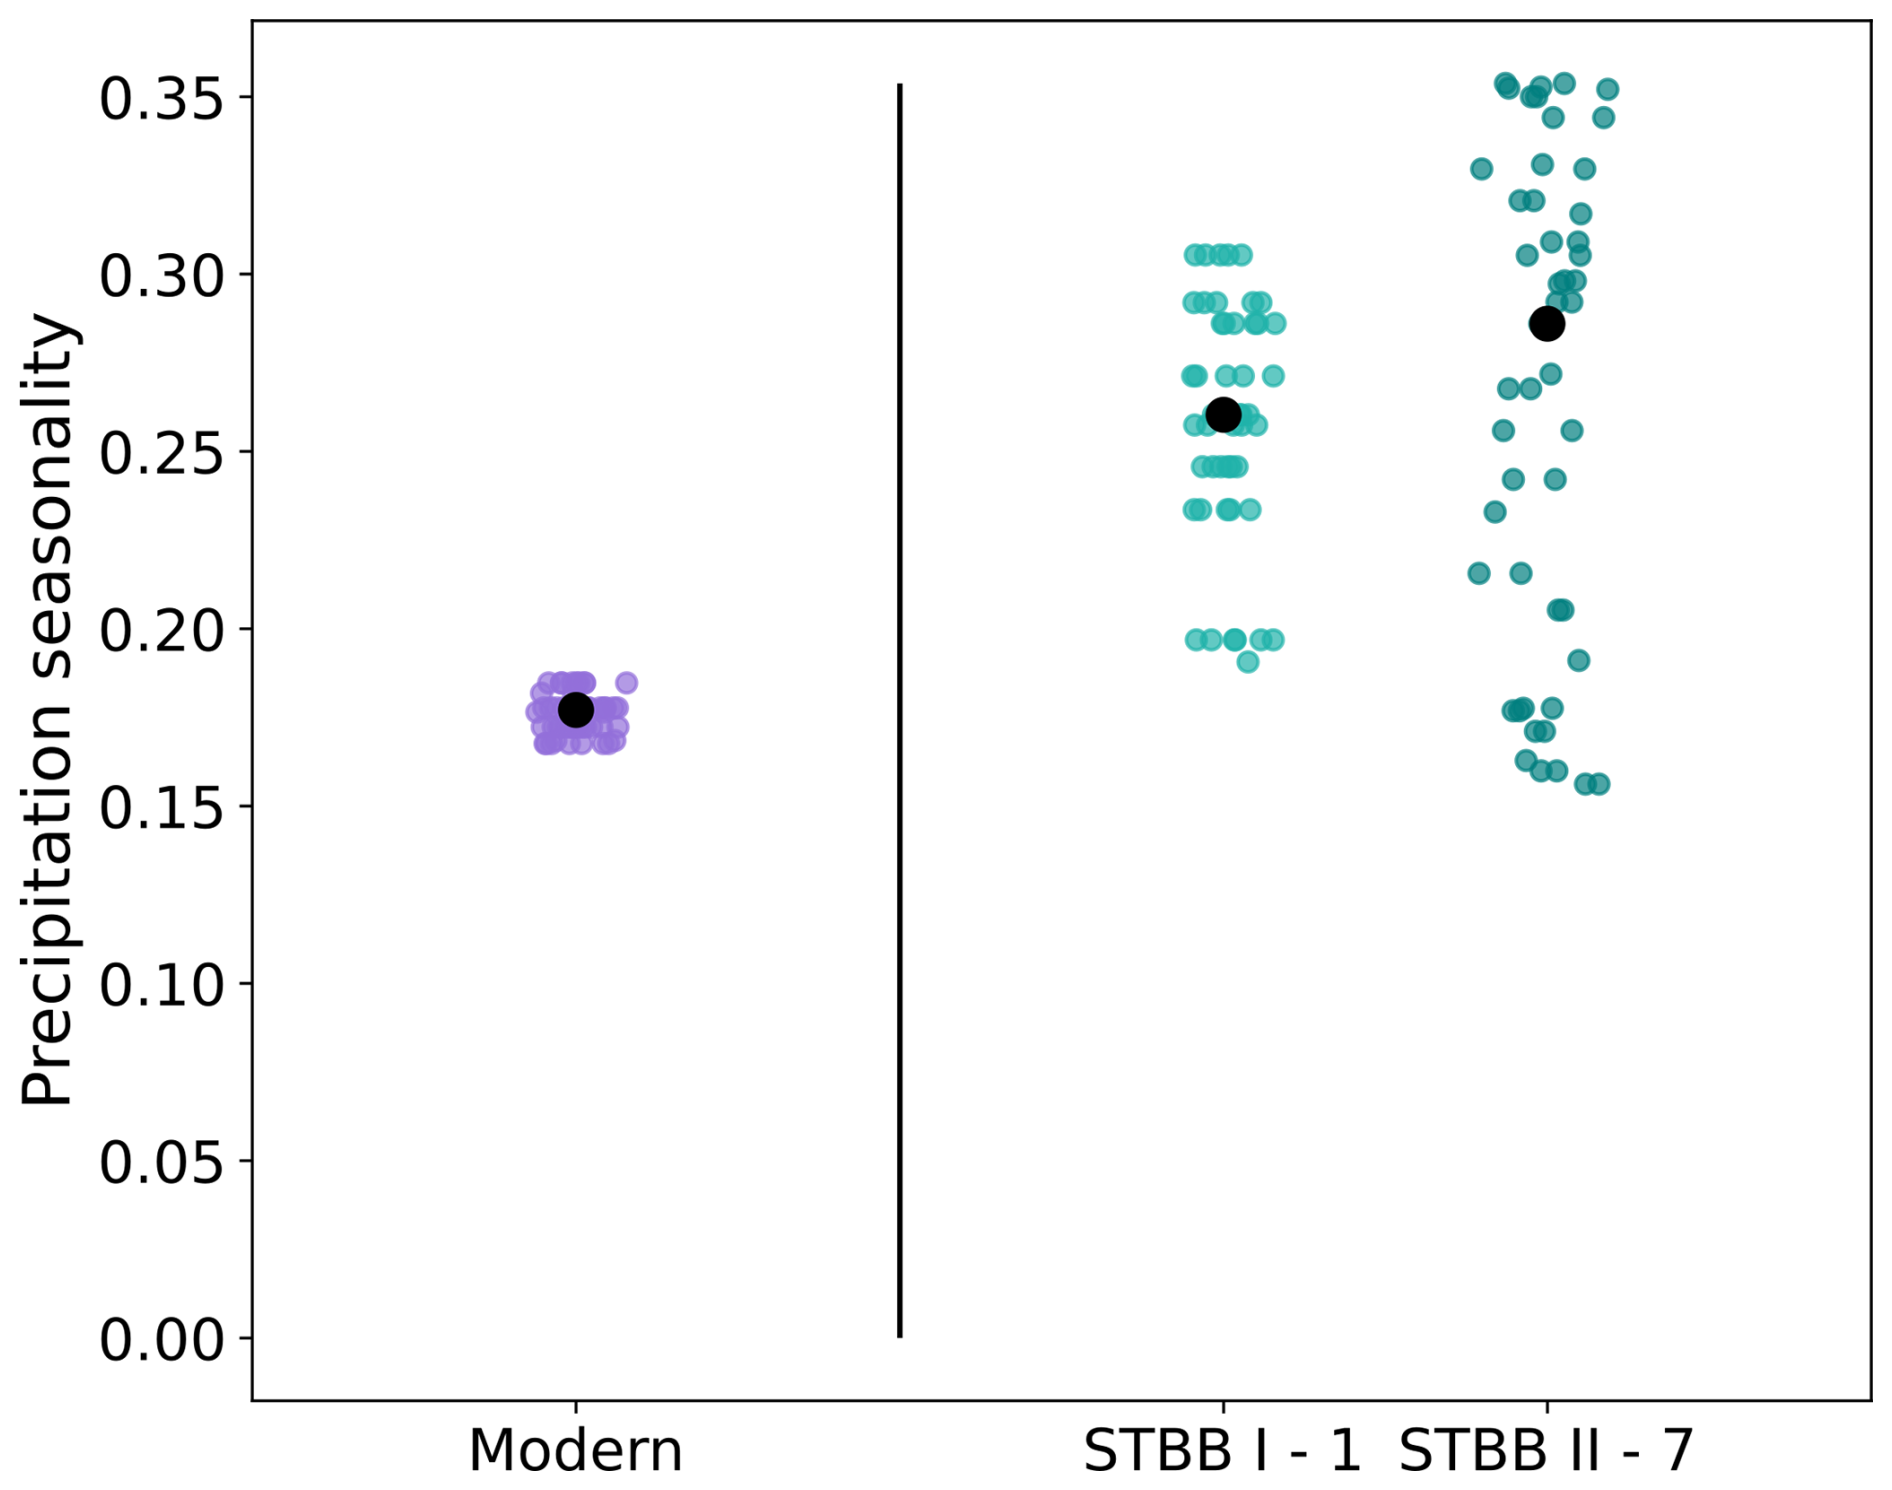
Figure 6Reconstructed precipitation seasonality (|P|s summed over the seasonal peak spectral band) in Tortonian samples STBB I – 1 and STBB II – 7, compared with the modern day. An alignment procedure based on dynamic time warping allows for their comparison. Coloured points show seasonality values for different widths of the seasonal band between 0.2 (0.9–1.1) and 0.5 (0.75–1.25). Black points show the median over all values. Both samples show overall enhanced seasonality in the Miocene compared with the modern day.
Numerous studies have suggested the Miocene was a time of enhanced seasonality in the mid latitudes with warm–wet, cold–dry seasonal cycles reconstructed in central Europe (Bruch et al., 2011; Harzhauser et al., 2011). At high latitudes, the picture is less conclusive. Carpological reconstructions from eastern Siberia suggest the Late Miocene marks the onset of modern atmospheric circulation patterns and the establishment of today's wet summer/dry winter regime, albeit with considerably higher total precipitation between 700 and 900 mm yr−1 (Popova et al., 2012). At Temmirdekh-khaj and Omoloy, Miocene carpological reconstructions suggest the mean annual range in precipitation (the difference between wet and dry season amplitude) was 70–80 and 110–130 mm, respectively. This seems large compared with today's mean summer precipitation of 169 mm and annual precipitation of 309 mm but should be viewed in context of a wetter Tortonian regime given higher moisture availability from a summer ice-free Arctic (Stein et al., 2016). Analysis of fossil wood δ13C from Cherskiy (67.7° N, 161.6° E) in northeastern Siberia shows a high variability in precipitation, with the wet season alternating between summer and winter (Schubert et al., 2017). In contrast, our Taba Ba'astakh records suggest an enhanced seasonal precipitation regime compared with the modern day. We propose this likely arose from differing moisture availability from the nearby Arctic Ocean, which was largely sea-ice-covered during the Tortonian winter and ice-free during Tortonian summers (Stein et al., 2016). This would have led to enhanced evaporation and moisture transport into northern Siberia in the summer, compared with winter. This effect appears to outweigh any impact of reduced continentality given global average sea levels ca. 10 m higher during the Late Miocene compared with modern levels (Miller et al., 2005). A likely return to similar ice coverage over the coming century (Sigmond et al., 2018) may drive a shift to more enhanced seasonal precipitation regimes similar to those we infer for the Tortonian.
We present the first speleothem-derived temperature and precipitation seasonality records from Arctic Siberia during the Tortonian (11.63–7.246 Ma). Our findings offer insight into high-latitude climate during a period when the global mean surface temperature was similar to that projected over the coming decades under high-emissions scenarios.
Apparent hydrologically driven element cycles suggest a more seasonal precipitation regime compared with the modern day, likely driven by fluctuations in Arctic Sea ice extent. Given probable reductions in summer Arctic ice extent over the coming decades, a return to more volatile precipitation regimes seems likely, with increased summer precipitation driving permafrost thaw and impacting local infrastructure.
We use two independent methodologies to reconstruct the most northerly terrestrial Tortonian temperatures between 6.6 and 11.1 °C from high-latitude central Siberia. These findings provide much needed estimates for future Arctic amplification, implying Arctic MAAT increases of 18.9–23.4 °C above modern levels, given global mean temperature rises of ca. 4.5 °C above the present day. This is in good agreement with previous estimates from the region and supports the consensus of a substantially warmer Late Miocene climate compared with the modern day. Our findings confirm the long-established discrepancy between model simulations and proxy reconstructions, producing considerably higher estimates for Tortonian Arctic amplification than models.
All data are included in the Supplement. Trace element, stable, and clumped isotope data are archived in the Zenodo database at https://doi.org/10.5281/zenodo.16965894 (Umbo, 2025).
The supplement related to this article is available online at https://doi.org/10.5194/cp-21-1533-2025-supplement.
SU and SFMB conceptualized the study. AV, OS, AK, IA, and SFMB were responsible for sample collection. AV and GH provided U–Pb dating of samples. SU and SM performed clumped isotope analysis. FL and SU milled samples and performed stable isotope analysis. PS performed trace element analysis. YD performed fluid inclusion measurements. TB and AG contributed to interpretation of the dataset, with TB providing the comparison between Miocene and modern seasonal cycles (and production of Figs. 6, S8 and S9). SU oversaw writing of the manuscript and figure preparation, with significant input from FL, TO, SFMB, and AG. All authors contributed to the review and editing of the manuscript.
The contact author has declared that none of the authors has any competing interests.
Any use of trade, firm, or product names is for descriptive purposes only and does not imply endorsement by the U.S. government.
Publisher's note: Copernicus Publications remains neutral with regard to jurisdictional claims made in the text, published maps, institutional affiliations, or any other geographical representation in this paper. While Copernicus Publications makes every effort to include appropriate place names, the final responsibility lies with the authors.
We thank Julian Murton at the University of Sussex, Arthur Oldeman at Utrecht University, and an anonymous reviewer for their constructive reviews and helpful comments, alongside Paul Dennis and Norbert Marwan, for acting as independent reviewers of the draft manuscript, and Alberto Reyes for his role as journal editor. We thank Birgit Schröder at GFZ Potsdam for providing the Plessen internal standard used in our stable isotope measurements. Tobias Braun acknowledges fruitful discussions with Norbert Marwan.
This research has been supported by the Leverhulme Trust (grant no. RPG-2020-334), the Natural Environment Research Council (grant no. NE/KE005057/1), and the Schweizerischer Nationalfonds zur Förderung der Wissenschaftlichen Forschung (grant no. P2EZP2_172213).
This paper was edited by Alberto Reyes and reviewed by Julian Murton and one anonymous referee.
Anderson, N. T., Kelson, J. R., Kele, S., Daëron, M., Bonifacie, M., Horita, J., Mackey, T. J., John, C. M., Kluge, T., Petschnig, P., Jost, A. B., Huntington, K. W., Bernasconi, S. M., and Bergmann, K. D.: A Unified Clumped Isotope Thermometer Calibration (0.5–1,100 °C) Using Carbonate-Based Standardization, Geophys. Res. Lett., 48, e2020GL092069, https://doi.org/10.1029/2020GL092069, 2021.
Baker, A., Hartmann, A., Duan, W., Hankin, S., Comas-Bru, L., Cuthbert, M. O., Treble, P. C., Banner, J., Genty, D., Baldini, L. M., Bartolomé, M., Moreno, A., Pérez-Mejías, C., and Werner, M.: Global analysis reveals climatic controls on the oxygen isotope composition of cave drip water, Nat. Commun., 10, 2984, https://doi.org/10.1038/s41467-019-11027-w, 2019.
Baker, J. L., Lachniet, M. S., Chervyatsova, O., Asmerom, Y., and Polyak, V. J.: Holocene warming in western continental Eurasia driven by glacial retreat and greenhouse forcing, Nat. Geosci., 10, 430–435, https://doi.org/10.1038/ngeo2953, 2017.
Bernasconi, S. M., Müller, I. A., Bergmann, K. D., and Breitenbach, S. F. M.: Reducing Uncertainties in Carbonate Clumped Isotope Analysis Through Consistent Carbonate-Based Standardization, Geochem. Geophy. Geosy., 2895–2914, https://doi.org/10.1029/2017GC007385, 2018.
Bernasconi, S. M., Daëron, M., Bergmann, K. D., Bonifacie, M., Meckler, A. N., Affek, H. P., Anderson, N., Bajnai, D., Barkan, E., Beverly, E., Blamart, D., Burgener, L., Calmels, D., Chaduteau, C., Clog, M., Davidheiser-Kroll, B., Davies, A., Dux, F., Eiler, J., Elliott, B., Fetrow, A. C., Fiebig, J., Goldberg, S., Hermoso, M., Huntington, K. W., Hyland, E., Ingalls, M., Jaggi, M., John, C. M., Jost, A. B., Katz, S., Kelson, J., Kluge, T., Kocken, I. J., Laskar, A., Leutert, T. J., Liang, D., Lucarelli, J., Mackey, T. J., Mangenot, X., Meinicke, N., Modestou, S. E., Müller, I. A., Murray, S., Neary, A., Packard, N., Passey, B. H., Pelletier, E., Petersen, S., Piasecki, A., Schauer, A., Snell, K. E., Swart, P. K., Tripati, A., Upadhyay, D., Vennemann, T., Winkelstern, I., Yarian, D., Yoshida, N., Zhang, N., and Ziegler, M.: InterCarb: A Community Effort to Improve Interlaboratory Standardization of the Carbonate Clumped Isotope Thermometer Using Carbonate Standards, Geochem. Geophy. Geosy., 22, e2020GC009588, https://doi.org/10.1029/2020GC009588, 2021.
Berndt, D. J. and Clifford, J.: Using dynamic time warping to find patterns in time series, in: Proceedings of the 3rd International Conference on Knowledge Discovery and Data Mining (AAAIWS'94), AAAI Press, 359–370, 1994.
Boike, J., Kattenstroth, B., Abramova, K., Bornemann, N., Chetverova, A., Fedorova, I., Fröb, K., Grigoriev, M., Grüber, M., Kutzbach, L., Langer, M., Minke, M., Muster, S., Piel, K., Pfeiffer, E.-M., Stoof, G., Westermann, S., Wischnewski, K., Wille, C., and Hubberten, H.-W.: Baseline characteristics of climate, permafrost and land cover from a new permafrost observatory in the Lena River Delta, Siberia (1998–2011), Biogeosciences, 10, 2105–2128, https://doi.org/10.5194/bg-10-2105-2013, 2013.
Boike, J., Nitzbon, J., Anders, K., Grigoriev, M., Bolshiyanov, D., Langer, M., Lange, S., Bornemann, N., Morgenstern, A., Schreiber, P., Wille, C., Chadburn, S., Gouttevin, I., Burke, E., and Kutzbach, L.: A 16-year record (2002–2017) of permafrost, active-layer, and meteorological conditions at the Samoylov Island Arctic permafrost research site, Lena River delta, northern Siberia: an opportunity to validate remote-sensing data and land surface, snow, and permafrost models, Earth Syst. Sci. Data, 11, 261–299, https://doi.org/10.5194/essd-11-261-2019, 2019.
Bonne, J.-L., Meyer, H., Behrens, M., Boike, J., Kipfstuhl, S., Rabe, B., Schmidt, T., Schönicke, L., Steen-Larsen, H. C., and Werner, M.: Moisture origin as a driver of temporal variabilities of the water vapour isotopic composition in the Lena River Delta, Siberia, Atmos. Chem. Phys., 20, 10493–10511, https://doi.org/10.5194/acp-20-10493-2020, 2020.
Borsato, A., Frisia, S., Fairchild, I. J., Somogyi, A., and Susini, J.: Trace element distribution in annual stalagmite laminae mapped by micrometer-resolution X-ray fluorescence: Implications for incorporation of environmentally significant species, Geochim. Cosmochim. Ac., 71, 1494–1512, https://doi.org/10.1016/j.gca.2006.12.016, 2007.
Bradshaw, C. D., Lunt, D. J., Flecker, R., Salzmann, U., Pound, M. J., Haywood, A. M., and Eronen, J. T.: The relative roles of CO2 and palaeogeography in determining late Miocene climate: results from a terrestrial model–data comparison, Clim. Past, 8, 1257–1285, https://doi.org/10.5194/cp-8-1257-2012, 2012.
Brand, W. A., Assonov, S. S., and Coplen, T. B.: Correction for the 17O interference in δ(13C) measurements when analyzing CO2 with stable isotope mass spectrometry (IUPAC Technical Report), Pure Appl. Chem., 82, 1719–1733, https://doi.org/10.1351/PAC-REP-09-01-05, 2010.
Breitenbach, S. F. M. and Marwan, N.: Acquisition and analysis of greyscale data from stalagmites using ImageJ software, Cave and Karst Science, 50, 69–78, https://publications.pik-potsdam.de/pubman/item/item_28523 (last access: 27 August 2025), 2023.
Bruch, A. A., Utescher, T., and Mosbrugger, V.: Precipitation patterns in the Miocene of Central Europe and the development of continentality, Palaeogeogr. Palaeocl., 304, 202–211, https://doi.org/10.1016/j.palaeo.2010.10.002, 2011.
Buchwal, A., Rachlewicz, G., Heim, B., and Juhls, B.: Trees on the tundra: warmer climate might not favor prostrate Larix tree but Betula nana shrub growth in Siberian tundra (Lena River Delta), Agr. Forest Meteorol., 339, 109543, https://doi.org/10.1016/j.agrformet.2023.109543, 2023.
Burls, N. J., Bradshaw, C. D., De Boer, A. M., Herold, N., Huber, M., Pound, M., Donnadieu, Y., Farnsworth, A., Frigola, A., Gasson, E., von der Heydt, A. S., Hutchinson, D. K., Knorr, G., Lawrence, K. T., Lear, C. H., Li, X., Lohmann, G., Lunt, D. J., Marzocchi, A., Prange, M., Riihimaki, C. A., Sarr, A. C., Siler, N., and Zhang, Z.: Simulating Miocene Warmth: Insights From an Opportunistic Multi-Model Ensemble (MioMIP1), Paleoceanogr. Paleoclimatol., 36, e2020PA004054, https://doi.org/10.1029/2020PA004054, 2021.
Chylek, P., Folland, C., Klett, J. D., Wang, M., Hengartner, N., Lesins, G., and Dubey, M. K.: Annual Mean Arctic Amplification 1970–2020: Observed and Simulated by CMIP6 Climate Models, Geophys. Res. Lett., 49, e2022GL099371, https://doi.org/10.1029/2022GL099371, 2022.
Coplen, T. B.: Calibration of the calcite–water oxygen-isotope geothermometer at Devils Hole, Nevada, a natural laboratory, Geochim. Cosmochim. Ac., 71, 3948–3957, https://doi.org/10.1016/j.gca.2007.05.028, 2007.
Craig, H.: Isotopic variations in meteoric waters, Science, 133, 1702–1703, https://doi.org/10.1126/science.133.3465.1702, 1961.
Daëron, M.: Full Propagation of Analytical Uncertainties in Δ47 Measurements, Geochem. Geophy. Geosy., 22, e2020GC009592, https://doi.org/10.1029/2020GC009592, 2021.
Daëron, M. and Gray, W. R.: Revisiting Oxygen-18 and Clumped Isotopes in Planktic and Benthic Foraminifera, Paleoceanogr. Paleoclimatol., 38, e2023PA004660, https://doi.org/10.1029/2023PA004660, 2023.
Daëron, M., Blamart, D., Peral, M., and Affek, H. P.: Absolute isotopic abundance ratios and the accuracy of Δ47 measurements, Chem. Geol., 442, 83–96, https://doi.org/10.1016/j.chemgeo.2016.08.014, 2016.
Dansgaard, W.: Stable isotopes in precipitation, Tellus, 16, 436–468, https://doi.org/10.3402/tellusa.v16i4.8993, 1964.
de Nooijer, W., Zhang, Q., Li, Q., Zhang, Q., Li, X., Zhang, Z., Guo, C., Nisancioglu, K. H., Haywood, A. M., Tindall, J. C., Hunter, S. J., Dowsett, H. J., Stepanek, C., Lohmann, G., Otto-Bliesner, B. L., Feng, R., Sohl, L. E., Chandler, M. A., Tan, N., Contoux, C., Ramstein, G., Baatsen, M. L. J., von der Heydt, A. S., Chandan, D., Peltier, W. R., Abe-Ouchi, A., Chan, W.-L., Kamae, Y., and Brierley, C. M.: Evaluation of Arctic warming in mid-Pliocene climate simulations, Clim. Past, 16, 2325–2341, https://doi.org/10.5194/cp-16-2325-2020, 2020.
Dennis, K. J., Affek, H. P., Passey, B. H., Schrag, D. P., and Eiler, J. M.: Defining an absolute reference frame for `clumped' isotope studies of CO2, Geochim. Cosmochim. Ac., 75, 7117–7131, https://doi.org/10.1016/j.gca.2011.09.025, 2011.
Domínguez-Villar, D., Fairchild, I. J., Baker, A., Carrasco, R. M., and Pedraza, J.: Reconstruction of cave air temperature based on surface atmosphere temperature and vegetation changes: Implications for speleothem palaeoclimate records, Earth Planet. Sc. Lett., 369–370, 158–168, https://doi.org/10.1016/j.epsl.2013.03.017, 2013.
Dublyansky, Y. V. and Spötl, C.: Hydrogen and oxygen isotopes of water from inclusions in minerals: Design of a new crushing system and on-line continous-flow isotope ratio mass spectrometric analysis, Rapid Commun. Mass Sp., 23, 2605–2613, https://doi.org/10.1002/rcm.4155, 2009.
Eiler, J. M. and Schauble, E.: 18O13C16O in Earth's atmosphere, Geochim. Cosmochim. Ac., 68, 4767–4777, https://doi.org/10.1016/j.gca.2004.05.035, 2004.
Fernandez, A., Müller, I. A., Rodríguez-Sanz, L., van Dijk, J., Looser, N., and Bernasconi, S. M.: A Reassessment of the Precision of Carbonate Clumped Isotope Measurements: Implications for Calibrations and Paleoclimate Reconstructions, Geochem. Geophy. Geosy., 18, 4375–4386, https://doi.org/10.1002/2017GC007106, 2017.
Finestone, E. M., Breeze, P. S., Breitenbach, S. F. M., Drake, N., Bergmann, L., Maksudov, F., Muhammadiyev, A., Scott, P., Cai, Y., Khatsenovich, A. M., Rybin, E. P., Nehrke, G., Boivin, N., and Petraglia, M.: Paleolithic occupation of arid Central Asia in the Middle Pleistocene, PLoS ONE, 17, e0273984, https://doi.org/10.1371/journal.pone.0273984, 2022.
Ford, J. D., McDowell, G., and Pearce, T.: The adaptation challenge in the Arctic, Nat. Clim. Change, 5, 1046–1053, https://doi.org/10.1038/nclimate2723, 2015.
Gaskell, D. E., Huber, M., O'brien, C. L., Inglis, G. N., Acosta, R. P., Poulsen, C. J., and Hull, P. M.: The latitudinal temperature gradient and its climate dependence as inferred from foraminiferal δ18O over the past 95 million years, P. Natl. Acad. Sci. USA, 119, e2111332119, https://doi.org/10.1073/pnas.2111332119, 2022.
Goldner, A., Herold, N., and Huber, M.: The challenge of simulating the warmth of the mid-Miocene climatic optimum in CESM1, Clim. Past, 10, 523–536, https://doi.org/10.5194/cp-10-523-2014, 2014.
Hammar, J.: Drivers of permafrost degradation along the Inuvik to Tuktoyaktuk Highway (ITH), University of Potsdam, https://hdl.handle.net/10013/epic.0b40007f-099e-413f-b510-6bfb6feafa53 (last access: 28 October 2024), 2022.
Hao, Q., Wang, L., Oldfield, F., and Guo, Z.: Extra-long interglacial in Northern Hemisphere during MISs 15–13 arising from limited extent of Arctic ice sheets in glacial MIS 14, Sci. Rep.-UK, 5, 12103, https://doi.org/10.1038/srep12103, 2015.
Hartland, A., Fairchild, I. J., Lead, J. R., Borsato, A., Baker, A., Frisia, S., and Baalousha, M.: From soil to cave: Transport of trace metals by natural organic matter in karst dripwaters, Chem. Geol., 304–305, 68–82, https://doi.org/10.1016/j.chemgeo.2012.01.032, 2012.
Harzhauser, M., Piller, W. E., Müllegger, S., Grunert, P., and Micheels, A.: Changing seasonality patterns in Central Europe from Miocene Climate Optimum to Miocene Climate Transition deduced from the Crassostrea isotope archive, Global Planet. Change, 76, 77–84, https://doi.org/10.1016/j.gloplacha.2010.12.003, 2011.
Herbert, T. D., Lawrence, K. T., Tzanova, A., Peterson, L. C., Caballero-Gill, R., and Kelly, C. S.: Late Miocene global cooling and the rise of modern ecosystems, Nat. Geosci., 9, 843–847, https://doi.org/10.1038/ngeo2813, 2016.
Hofer, S., Lang, C., Amory, C., Kittel, C., Delhasse, A., Tedstone, A., and Fettweis, X.: Greater Greenland Ice Sheet contribution to global sea level rise in CMIP6, Nat. Commun., 11, 6289, https://doi.org/10.1038/s41467-020-20011-8, 2020.
Huntington, K. W., Eiler, J. M., Affek, H. P., Guo, W., Bonifacie, M., Yeung, L. Y., Thiagarajan, N., Passey, B., Tripati, A., Daëron, M., and Came, R.: Methods and limitations of “clumped” CO2 isotope (Δ47) analysis by gas-source isotope ratiomass spectrometry, J. Mass Spectrom., 44, 1318–1329, https://doi.org/10.1002/jms.1614, 2009.
IPCC: Climate Change 2021: The Physical Science Basis. Contribution of Working Group I to the Sixth Assessment Report of the Intergovernmental Panel on Climate Change, edited by: Masson-Delmotte, V., Zhai, P., Pirani, A., Connors, S. L., Péan, C., Berger, S., Caud, N., Chen, Y., Goldfarb, L., Gomis, M. I., Huang, M., Leitzell, K., Lonnoy, E., Matthews, J. B. R., Maycock, T. K., Waterfield, T., Yelekçi, O., Yu, R., and Zhou, B., Cambridge University Press, Cambridge, United Kingdom and New York, NY, USA, 2391 pp. https://doi.org/10.1017/9781009157896, 2021.
Izokh, N. and Yazikov, A.: Discovery of Early Carboniferous conodonts in Northern Kharaulakh Ranges (lower reaches of the Lena River, northeastern Siberia, Arctic Russia), Revue de Micropaleontologie, 60, 213–232, https://doi.org/10.1016/j.revmic.2017.03.001, 2017.
John, C. M. and Bowen, D.: Community software for challenging isotope analysis: First applications of `Easotope' to clumped isotopes, Rapid Commun. Mass Sp., 30, 2285–2300, https://doi.org/10.1002/rcm.7720, 2016.
Johnson, K. R., Hu, C., Belshaw, N. S., and Henderson, G. M.: Seasonal trace-element and stable-isotope variations in a Chinese speleothem: The potential for high-resolution paleomonsoon reconstruction, Earth Planet. Sc. Lett., 244, 394–407, https://doi.org/10.1016/j.epsl.2006.01.064, 2006.
Lachniet, M. S.: Climatic and environmental controls on speleothem oxygen-isotope values, Quaternary Sci. Rev., 28, 412–432, https://doi.org/10.1016/j.quascirev.2008.10.021, 2009.
Lechleitner, F. A., Mason, A. J., Breitenbach, S. F. M., Vaks, A., Haghipour, N., and Henderson, G. M.: Permafrost-related hiatuses in stalagmites: Evaluating the potential for reconstruction of carbon cycle dynamics, Quat. Geochronol., 56, 101037, https://doi.org/10.1016/j.quageo.2019.101037, 2020.
Ma, N., Jiang, J. H., Hou, K., Lin, Y., Vu, T., Rosen, P. E., Gu, Y., and Fahy, K. A.: 21st Century Global and Regional Surface Temperature Projections, Earth Space Sci., 9, e2022EA002662, https://doi.org/10.1029/2022EA002662, 2022.
Mason, A. J., Vaks, A., Breitenbach, S. F. M., Hooker, J. N., and Henderson, G. M.: A simplified isotope dilution approach for the U–Pb dating of speleogenic and other low-232Th carbonates by multi-collector ICP-MS, Geochronology, 4, 33–54, https://doi.org/10.5194/gchron-4-33-2022, 2022.
McKay, D. I. A., Staal, A., Abrams, J. F., Winkelmann, R., Sakschewski, B., Loriani, S., Fetzer, I., Cornell, S. E., Rockström, J., and Lenton, T. M.: Exceeding 1.5 °C global warming could trigger multiple climate tipping points, Science, 377, eabn7950, https://doi.org/10.1126/science.abn7950, 2022.
Meinicke, N., Ho, S. L., Hannisdal, B., Nürnberg, D., Tripati, A., Schiebel, R., and Meckler, A. N.: A robust calibration of the clumped isotopes to temperature relationship for foraminifers, Geochim. Cosmochim. Ac., 270, 160–183, https://doi.org/10.1016/j.gca.2019.11.022, 2020.
Met Office: Heathrow climatic averages 1991–2000, https://www.metoffice.gov.uk/research/climate/maps-and-data/uk-climate-averages/gcpsvg3nc (last access: 22 October 2024).
Micheels, A., Bruch, A. A., Uhl, D., Utescher, T., and Mosbrugger, V.: A Late Miocene climate model simulation with ECHAM4/ML and its quantitative validation with terrestrial proxy data, Palaeogeogr. Palaeocl., 253, 251–270, https://doi.org/10.1016/j.palaeo.2007.03.042, 2007.
Mikhaltsov, N., Izokh, N., Sennikov, N., Pudrikov, P., Radevitch, A., Alekseev, I., and Avdeev, D.: Russian-German Cooperation: Expeditions to Siberia in 2017, edited by: Strauss, J., Alfred-Wegener Institute, 725, 90–107, https://doi.org/10.2312/BzPM_0725_2018, 2018.
Miller, K. G., Browning, J. V, Schmelz, W. J., Kopp, R. E., Mountain, G. S., and Wright, J. D.: The Phanerozoic Record of Global Sea-Level Change, Science, 310, 1293–1298, https://doi.org/10.1126/science.1116412, 2005.
Miller, K. G., Browning, J. V, Schmelz, W. J., Kopp, R. E., Mountain, G. S., and Wright, J. D.: Cenozoic sea-level and cryospheric evolution from deep-sea geochemical and continental margin records, Sci. Adv., 6, https://doi.org/10.1126/sciadv.aaz1346, 2020.
Milne, C. J., Kinniburgh, D. G., Van Riemsdijk, W. H., and Tipping, E.: Generic NICA – Donnan model parameters for metal-ion binding by humic substances, Environ. Sci. Technol., 37, 958–971, https://doi.org/10.1021/es0258879, 2003.
Moberg, A.: Stockholm Historical Weather Observations – Monthly mean air temperatures since 1756, Dataset version 3, Bolin Centre Database, https://doi.org/10.17043/stockholm-historical-monthly-temperature-3, 2021.
Molnar, P.: Differences between soil and air temperatures: Implications for geological reconstructions of past climate, Geosphere, 18, 800–824, https://doi.org/10.1130/GES02448.1, 2022.
Moseley, G. E., Edwards, R. L., Lord, N. S., Spötl, C., and Cheng, H.: Speleothem record of mild and wet mid-Pleistocene climate in northeast Greenland, Sci. Adv, 2021.
Nazarenko, L. S., Tausnev, N., Russell, G. L., Rind, D., Miller, R. L., Schmidt, G. A., Bauer, S. E., Kelley, M., Ruedy, R., Ackerman, A. S., Aleinov, I., Bauer, M., Bleck, R., Canuto, V., Cesana, G., Cheng, Y., Clune, T. L., Cook, B. I., Cruz, C. A., Del Genio, A. D., Elsaesser, G. S., Faluvegi, G., Kiang, N. Y., Kim, D., Lacis, A. A., Leboissetier, A., LeGrande, A. N., Lo, K. K., Marshall, J., Matthews, E. E., McDermid, S., Mezuman, K., Murray, L. T., Oinas, V., Orbe, C., García-Pando, C. P., Perlwitz, J. P., Puma, M. J., Romanou, A., Shindell, D. T., Sun, S., Tsigaridis, K., Tselioudis, G., Weng, E., Wu, J., and Yao, M. S.: Future Climate Change Under SSP Emission Scenarios With GISS-E2.1, J. Adv. Model Earth Sy., 14, e2021MS002871, https://doi.org/10.1029/2021MS002871, 2022.
Nitzbon, J., Schneider von Deimling, T., Aliyeva, M., Chadburn, S. E., Grosse, G., Laboor, S., Lee, H., Lohmann, G., Steinert, N. J., Stuenzi, S. M., Werner, M., Westermann, S., and Langer, M.: No respite from permafrost-thaw impacts in the absence of a global tipping point, Nat. Clim. Change, 14, 573–585, https://doi.org/10.1038/s41558-024-02011-4, 2024.
Opel, T., Bertran, P., Grosse, G., Jones, M., Luetscher, M., Schirrmeister, L., Stadelmaier, K. H., and Veremeeva, A.: Ancient permafrost and past permafrost in the Northern Hemisphere, in: Encyclopedia of Quaternary Science, 3rd edition, vol. 5, edited by: Elias, S.pp. 16-33, Elsevier, UK, https://doi.org/10.1016/B978-0-323-99931-1.00258-0, 2025.
Orland, I. J., Burstyn, Y., Bar-Matthews, M., Kozdon, R., Ayalon, A., Matthews, A., and Valley, J. W.: Seasonal climate signals (1990-2008) in a modern Soreq Cave stalagmite as revealed by high-resolution geochemical analysis, Chem. Geol., 363, 322–333, https://doi.org/10.1016/j.chemgeo.2013.11.011, 2014.
Oster, J. L., Ronay, E. R., Sharp, W. D., Breitenbach, S. F. M., and Furbish, D. J.: Controls on Speleothem Initial Ratios in a Monsoon Climate, Geochem. Geophy. Geosy., 24, e2023GC010899, https://doi.org/10.1029/2023GC010899, 2023.
Peel, M. C., Finlayson, B. L., and McMahon, T. A.: Updated world map of the Köppen-Geiger climate classification, Hydrol. Earth Syst. Sci., 11, 1633–1644, https://doi.org/10.5194/hess-11-1633-2007, 2007.
Petersen, S. V., Winkelstern, I. Z., Lohmann, K. C., and Meyer, K. W.: The effects of Porapak(™) trap temperature on δ18O, δ13C, and Δ47 values in preparing samples for clumped isotope analysis, Rapid Commun. Mass Sp., 30, 1–10, https://doi.org/10.1002/rcm.7438, 2015.
Pflitsch, A. and Piasecki, J.: Detection of an airflow system in Niedzwiedzia (Bear) Cave, Kletno, Poland, J. Cave Karst Stud., 65, 160–173, 2003.
Pionke, H. B., Gburek, W. J., Sharpley, A. N., and Zollweg, J. A.: Hydrological and chemical controls on phosphorus loss from catchments, in: Phosphorus Loss From Soil to Water, CAB International, Wallingford, 225–242, 1997.
Popova, S., Utescher, T., Gromyko, D., Bruch, A. A., and Mosbrugger, V.: Palaeoclimate evolution in Siberia and the Russian far east from the Oligocene to Pliocene – evidence from fruit and seed floras, Turk. J. Earth Sci., 21, 315–334, https://doi.org/10.3906/yer-1005-6, 2012.
Pound, M. J., Haywood, A. M., Salzmann, U., Riding, J. B., Lunt, D. J., and Hunter, S. J.: A Tortonian (Late Miocene, 11.61–7.25 Ma) global vegetation reconstruction, Palaeogeogr. Palaeocl., 300, 29–45, https://doi.org/10.1016/j.palaeo.2010.11.029, 2011.
Pound, M. J., Haywood, A. M., Salzmann, U., and Riding, J. B.: Global vegetation dynamics and latitudinal temperature gradients during the Mid to Late Miocene (15.97–5.33 Ma), Earth-Sci. Rev., 112, 1–22, https://doi.org/10.1016/j.earscirev.2012.02.005, 2012.
Rae, J. W. B., Zhang, Y. G., Liu, X., Foster, G. L., Stoll, H. M., and Whiteford, R. D. M.: Atmospheric CO2 over the Past 66 Million Years from Marine Archives, Annu. Rev. Earth Pl. Sc., 49, 609–650, https://doi.org/10.1146/annurev-earth-082420-063026, 2021.
Rantanen, M., Karpechko, A. Y., Lipponen, A., Nordling, K., Hyvärinen, O., Ruosteenoja, K., Vihma, T., and Laaksonen, A.: The Arctic has warmed nearly four times faster than the globe since 1979, Commun. Earth Environ., 3, 168, https://doi.org/10.1038/s43247-022-00498-3, 2022.
Rodrigues, T., Voelker, A. H. L., Grimalt, J. O., Abrantes, F., and Naughton, F.: Iberian Margin sea surface temperature during MIS 15 to 9 (580–300 ka): Glacial suborbital variability versus interglacial stability, Paleoceanography, 26, PA1204, https://doi.org/10.1029/2010PA001927, 2011.
Schubert, B. A., Jahren, A. H., Davydov, S. P., and Warny, S.: The transitional climate of the late Miocene Arctic: Winter dominated precipitation with high seasonal variability, Geology, 45, 447–450, https://doi.org/10.1130/G38746.1, 2017.
Sherwin, C. M. and Baldini, J. U. L.: Cave air and hydrological controls on prior calcite precipitation and stalagmite growth rates: Implications for palaeoclimate reconstructions using speleothems, Geochim. Cosmochim. Ac., 75, 3915–3929, https://doi.org/10.1016/j.gca.2011.04.020, 2011.
Sigmond, M., Fyfe, J. C., and Swart, N. C.: Ice-free Arctic projections under the Paris Agreement, Nat. Clim. Change, 8, 404–408, https://doi.org/10.1038/s41558-018-0124-y, 2018.
Sliwinski, J. T., Kost, O., Endres, L., Iglesias, M., Haghipour, N., González-Lemos, S., and Stoll, H. M.: Exploring soluble and colloidally transported trace elements in stalagmites: The strontium-yttrium connection, Geochim. Cosmochim. Ac., 343, 64–83, https://doi.org/10.1016/j.gca.2022.12.023, 2023.
Smith, D. M., Scaife, A. A., Eade, R., Athanasiadis, P., Bellucci, A., Bethke, I., Bilbao, R., Borchert, L. F., Caron, L. P., Counillon, F., Danabasoglu, G., Delworth, T., Doblas-Reyes, F. J., Dunstone, N. J., Estella-Perez, V., Flavoni, S., Hermanson, L., Keenlyside, N., Kharin, V., Kimoto, M., Merryfield, W. J., Mignot, J., Mochizuki, T., Modali, K., Monerie, P. A., Müller, W. A., Nicolí, D., Ortega, P., Pankatz, K., Pohlmann, H., Robson, J., Ruggieri, P., Sospedra-Alfonso, R., Swingedouw, D., Wang, Y., Wild, S., Yeager, S., Yang, X., and Zhang, L.: North Atlantic climate far more predictable than models imply, Nature, 583, 796–800, https://doi.org/10.1038/s41586-020-2525-0, 2020.
Sosdian, S. M., Greenop, R., Hain, M. P., Foster, G. L., Pearson, P. N., and Lear, C. H.: Constraining the evolution of Neogene ocean carbonate chemistry using the boron isotope pH proxy, Earth Planet. Sc. Lett., 498, 362–376, https://doi.org/10.1016/j.epsl.2018.06.017, 2018.
Spors, S.: Stable Water Isotope Characteristics of Recent Precipitation from Tiksi and Samoylov Island-Calibration of a Geoscientific Proxy for Northern Siberia, Bachelors thesis, Institut für Erd- und Umweltwissenschaften, Universität Potsdam, Potsdam, https://epic.awi.de/id/eprint/49213/ (last access: 31 July 2024), 2018.
Spótl, C. and Vennemann, T. W.: Continuous-flow isotope ratio mass spectrometric analysis of carbonate minerals, Rapid Commun. Mass Sp., 17, 1004–1006, https://doi.org/10.1002/rcm.1010, 2003.
Stein, R., Fahl, K., Schreck, M., Knorr, G., Niessen, F., Forwick, M., Gebhardt, C., Jensen, L., Kaminski, M., Kopf, A., Matthiessen, J., Jokat, W., and Lohmann, G.: Evidence for ice-free summers in the late Miocene central Arctic Ocean, Nat. Commun., 7, 11148, https://doi.org/10.1038/ncomms11148, 2016.
Steinthorsdottir, M., Jardine, P. E., and Rember, W. C.: Near-Future pCO2 During the Hot Miocene Climatic Optimum, Paleoceanogr. Paleoclimatol., 36, e2020PA003900, https://doi.org/10.1029/2020PA003900, 2021a.
Steinthorsdottir, M., Coxall, H. K., de Boer, A. M., Huber, M., Barbolini, N., Bradshaw, C. D., Burls, N. J., Feakins, S. J., Gasson, E., Henderiks, J., Holbourn, A. E., Kiel, S., Kohn, M. J., Knorr, G., Kürschner, W. M., Lear, C. H., Liebrand, D., Lunt, D. J., Mörs, T., Pearson, P. N., Pound, M. J., Stoll, H., and Strömberg, C. A. E.: The Miocene: The Future of the Past, Paleoceanogr. Paleoclimatol., 36, e2020PA004037, https://doi.org/10.1029/2020PA004037, 2021b.
Stoll, H. M., Müller, W., and Prieto, M.: I-STAL, a model for interpretation of , and variations in speleothems and its forward and inverse application on seasonal to millennial scales, Geochem. Geophy. Geosy., 13, Q09004, https://doi.org/10.1029/2012GC004183, 2012.
Strauss, J., Fuchs, M., Hugelius, G., Miesner, F., Nitze, I., Opfergelt, S., Schuur, E., Treat, C., Turetsky, M., Yang, Y., and Grosse, G.: Organic matter storage and vulnerability in the permafrost domain, in: Reference Module in Earth Systems and Environmental Sciences, Elsevier, https://doi.org/10.1016/B978-0-323-99931-1.00164-1, 2024.
Super, J. R., Thomas, E., Pagani, M., Huber, M., O'Brien, C., and Hull, P. M.: North Atlantic temperature and pCO2 coupling in the early-middle Miocene, Geology, 46, 519–522, https://doi.org/10.1130/G40228.1, 2018.
Taylor, P. C., Boeke, R. C., Boisvert, L. N., Feldl, N., Henry, M., Huang, Y., Langen, P. L., Liu, W., Pithan, F., Sejas, S. A., and Tan, I.: Process Drivers, Inter-Model Spread, and the Path Forward: A Review of Amplified Arctic Warming, Frontiers in Earth Science, 9, 758361, https://doi.org/10.3389/feart.2021.758361, 2022.
Töchterle, P., Baldo, A., Murton, J. B., Schenk, F., Edwards, R. L., Koltai, G., and Moseley, G. E.: Reconstructing Younger Dryas ground temperature and snow thickness from cave deposits, Clim. Past, 20, 1521–1535, https://doi.org/10.5194/cp-20-1521-2024, 2024.
Tooth, A. F. and Fairchild, I. J.: Soil and karst aquifer hydrological controls on the geochemical evolution of speleothem-forming drip waters, Crag Cave, southwest Ireland, J. Hydrol., 273, 51–68, https://doi.org/10.1016/S0022-1694(02)00349-9, 2003.
Treble, P. C., Fairchild, I. J., Griffiths, A., Baker, A., Meredith, K. T., Wood, A., and McGuire, E.: Impacts of cave air ventilation and in-cave prior calcite precipitation on Golgotha Cave dripwater chemistry, southwest Australia, Quaternary Sci. Rev., 127, 61–72, https://doi.org/10.1016/j.quascirev.2015.06.001, 2015.
Tremaine, D. M. and Froelich, P. N.: Speleothem trace element signatures: A hydrologic geochemical study of modern cave dripwaters and farmed calcite, Geochim. Cosmochim. Ac., 121, 522–545, https://doi.org/10.1016/j.gca.2013.07.026, 2013.
Tremaine, D. M., Froelich, P. N., and Wang, Y.: Speleothem calcite farmed in situ: Modern calibration of δ18O and δ13C paleoclimate proxies in a continuously-monitored natural cave system, Geochim. Cosmochim. Ac., 75, 4929–4950, https://doi.org/10.1016/j.gca.2011.06.005, 2011.
Umbo, S.: Accompanying datasets to Umbo et al., Speleothem evidence for late Micocene extreme Arctic amplification, Zenodo [data set], https://doi.org/10.5281/zenodo.16965894, 2025.
Vaks, A., Mason, A. J., Breitenbach, S. F. M., Kononov, A. M., Osinzev, A. V., Rosensaft, M., Borshevsky, A., Gutareva, O. S., and Henderson, G. M.: Palaeoclimate evidence of vulnerable permafrost during times of low sea ice, Nature, 577, 221–225, https://doi.org/10.1038/s41586-019-1880-1, 2020.
Vaks, A., Mason, A., Breitenbach, S. F. M., Giesche, A., Osinzev, A., Adrian, I., Kononov, A., Umbo, S., Lechleitner, F. A., Rosensaft, M., and Henderson, G. M.: Arctic speleothems reveal nearly permafrost-free Northern Hemisphere in the late Miocene, Nat Commun., 16, 5483, https://doi.org/10.1038/s41467-025-60381-5, 2025.
Vihma, T.: Effects of Arctic Sea Ice Decline on Weather and Climate: A Review, Surv. Geophys., 35, 1175–1214, https://doi.org/10.1007/s10712-014-9284-0, 2014.
Wassenburg, J. A., Riechelmann, S., Schröder-Ritzrau, A., Riechelmann, D. F. C., Richter, D. K., Immenhauser, A., Terente, M., Constantin, S., Hachenberg, A., Hansen, M., and Scholz, D.: Calcite Mg and Sr partition coefficients in cave environments: Implications for interpreting prior calcite precipitation in speleothems, Geochim. Cosmochim. Ac., 269, 581–596, https://doi.org/10.1016/j.gca.2019.11.011, 2020.
Westerhold, T., Marwan, N., Drury, A. J., Liebrand, D., Agnini, C., Anagnostou, E., Barnet, J. S. K., Bohaty, S. M., De Vleeschouwer, D., Florindo, F., Frederichs, T., Hodell, D. A., Holbourn, A. E., Kroon, D., Lauretano, V., Littler, K., Lourens, L. J., Lyle, M., Pälike, H., Röhl, U., Tian, J., Wilkens, R. H., Wilson, P. A., and Zachos, J. C.: An astronomically dated record of Earth's climate and its predictability over the last 66 million years, Science (1979), 369, 1383–1388, https://doi.org/10.1126/SCIENCE.ABA6853, 2020.
Wigley, T. M. L. and Brown, M. C.: The physics of caves, in: The Science of Speleology, edited by: Ford, T. D. and Cullingford, C. H. D., Academic Press, London, 329–358, https://doi.org/10.1017/S0016756800044873, 1976.
Xie, A., Zhu, J., Kang, S., Qin, X., Xu, B., and Wang, Y.: Polar amplification comparison among Earth's three poles under different socioeconomic scenarios from CMIP6 surface air temperature, Sci. Rep.-UK, 12, 16548, https://doi.org/10.1038/s41598-022-21060-3, 2022.
York, D., Evensen, N. M., Martınez, M. L., and De Basabe Delgado, J.: Unified equations for the slope, intercept, and standard errors of the best straight line, Am. J. Phys., 72, 367–375, https://doi.org/10.1119/1.1632486, 2004.