the Creative Commons Attribution 4.0 License.
the Creative Commons Attribution 4.0 License.
 | 31 Jul 2025
Characterization of the 1966 Camp Century subglacial core: a multiscale analysis
Catherine M. Collins
Nicolas Perdrial
Pierre-Henri Blard
Nynke Keulen
William C. Mahaney
Halley Mastro
Juliana Souza
Donna M. Rizzo
Yves Marrocchi
Paul C. Knutz
In 1966, drilling at Camp Century, Greenland, recovered 3.44 m of subglacial material from beneath 1350 m of ice. Although prior analysis of this material showed that the core includes glacial sediment, ice, and sediment deposited during an interglacial period, the subglacial material had never been thoroughly studied. To better characterize this material, we analyzed 26 of the 30 core samples remaining in the archive. We performed a multiscale analysis including X-ray diffraction (XRD), micro-computed tomography (μCT), and scanning electron microscopy (SEM) to delineate stratigraphic units and assign facies based on inferred depositional processes.
At the macroscale, quantitative X-ray diffraction revealed that quartz and feldspar dominated the sediment and that there was minimal variation in relative mineral abundance between samples. Mesoscale evaluation of the frozen material, using μCT scans, showed clear variations in the stratigraphy of the core characterized by the presence of bedding, grading, and sorting. Microscale grain size and shape analysis, conducted using scanning electron microscopy, showed an abundance of fine-grained materials in the lower part of the core and no correspondence between grain shape parameters and sedimentary structures. These multiscale data define five distinct stratigraphic units within the core based on sedimentary process; k-means clustering analysis supports this unit delineation. Our observations suggest that ice retreat uncovered the Camp Century region, exposing weathered basal till (Unit 1), now covered by a remnant of basal ice or firn (Unit 2). Continued ice-free conditions led to till disruption by liquid water causing a mass movement (Unit 3) and deposition of water-worked sediment (units 4–5).
Analysis of the Camp Century subglacial material reveals a diverse stratigraphy preserved below the ice that recorded episodes of glaciated and deglaciated conditions in northwestern Greenland. Our physical, geochemical, and mineralogic analyses illuminate the history of deposition, weathering, and sediment transport preserved under the ice and show the promise of subglacial materials to increase our knowledge of past ice sheet behavior over time.
- Article
(12075 KB) - Full-text XML
- BibTeX
- EndNote


Understanding past ice-free times in Greenland provides additional understanding of the Greenland Ice Sheet's (GrIS's) response to warming (Gemery and López-Quirós, 2024). This goal, deciphering Greenland's paleoclimate and past ice sheet stability and instability, has driven the ice core collection efforts since the 1950s (Bader, 1962). Deep ice coring in Greenland began in 1960 at Camp Century, a military camp in northwestern Greenland, ∼ 200 km inland from the ice margin (Langway, 2008) (Fig. 1).
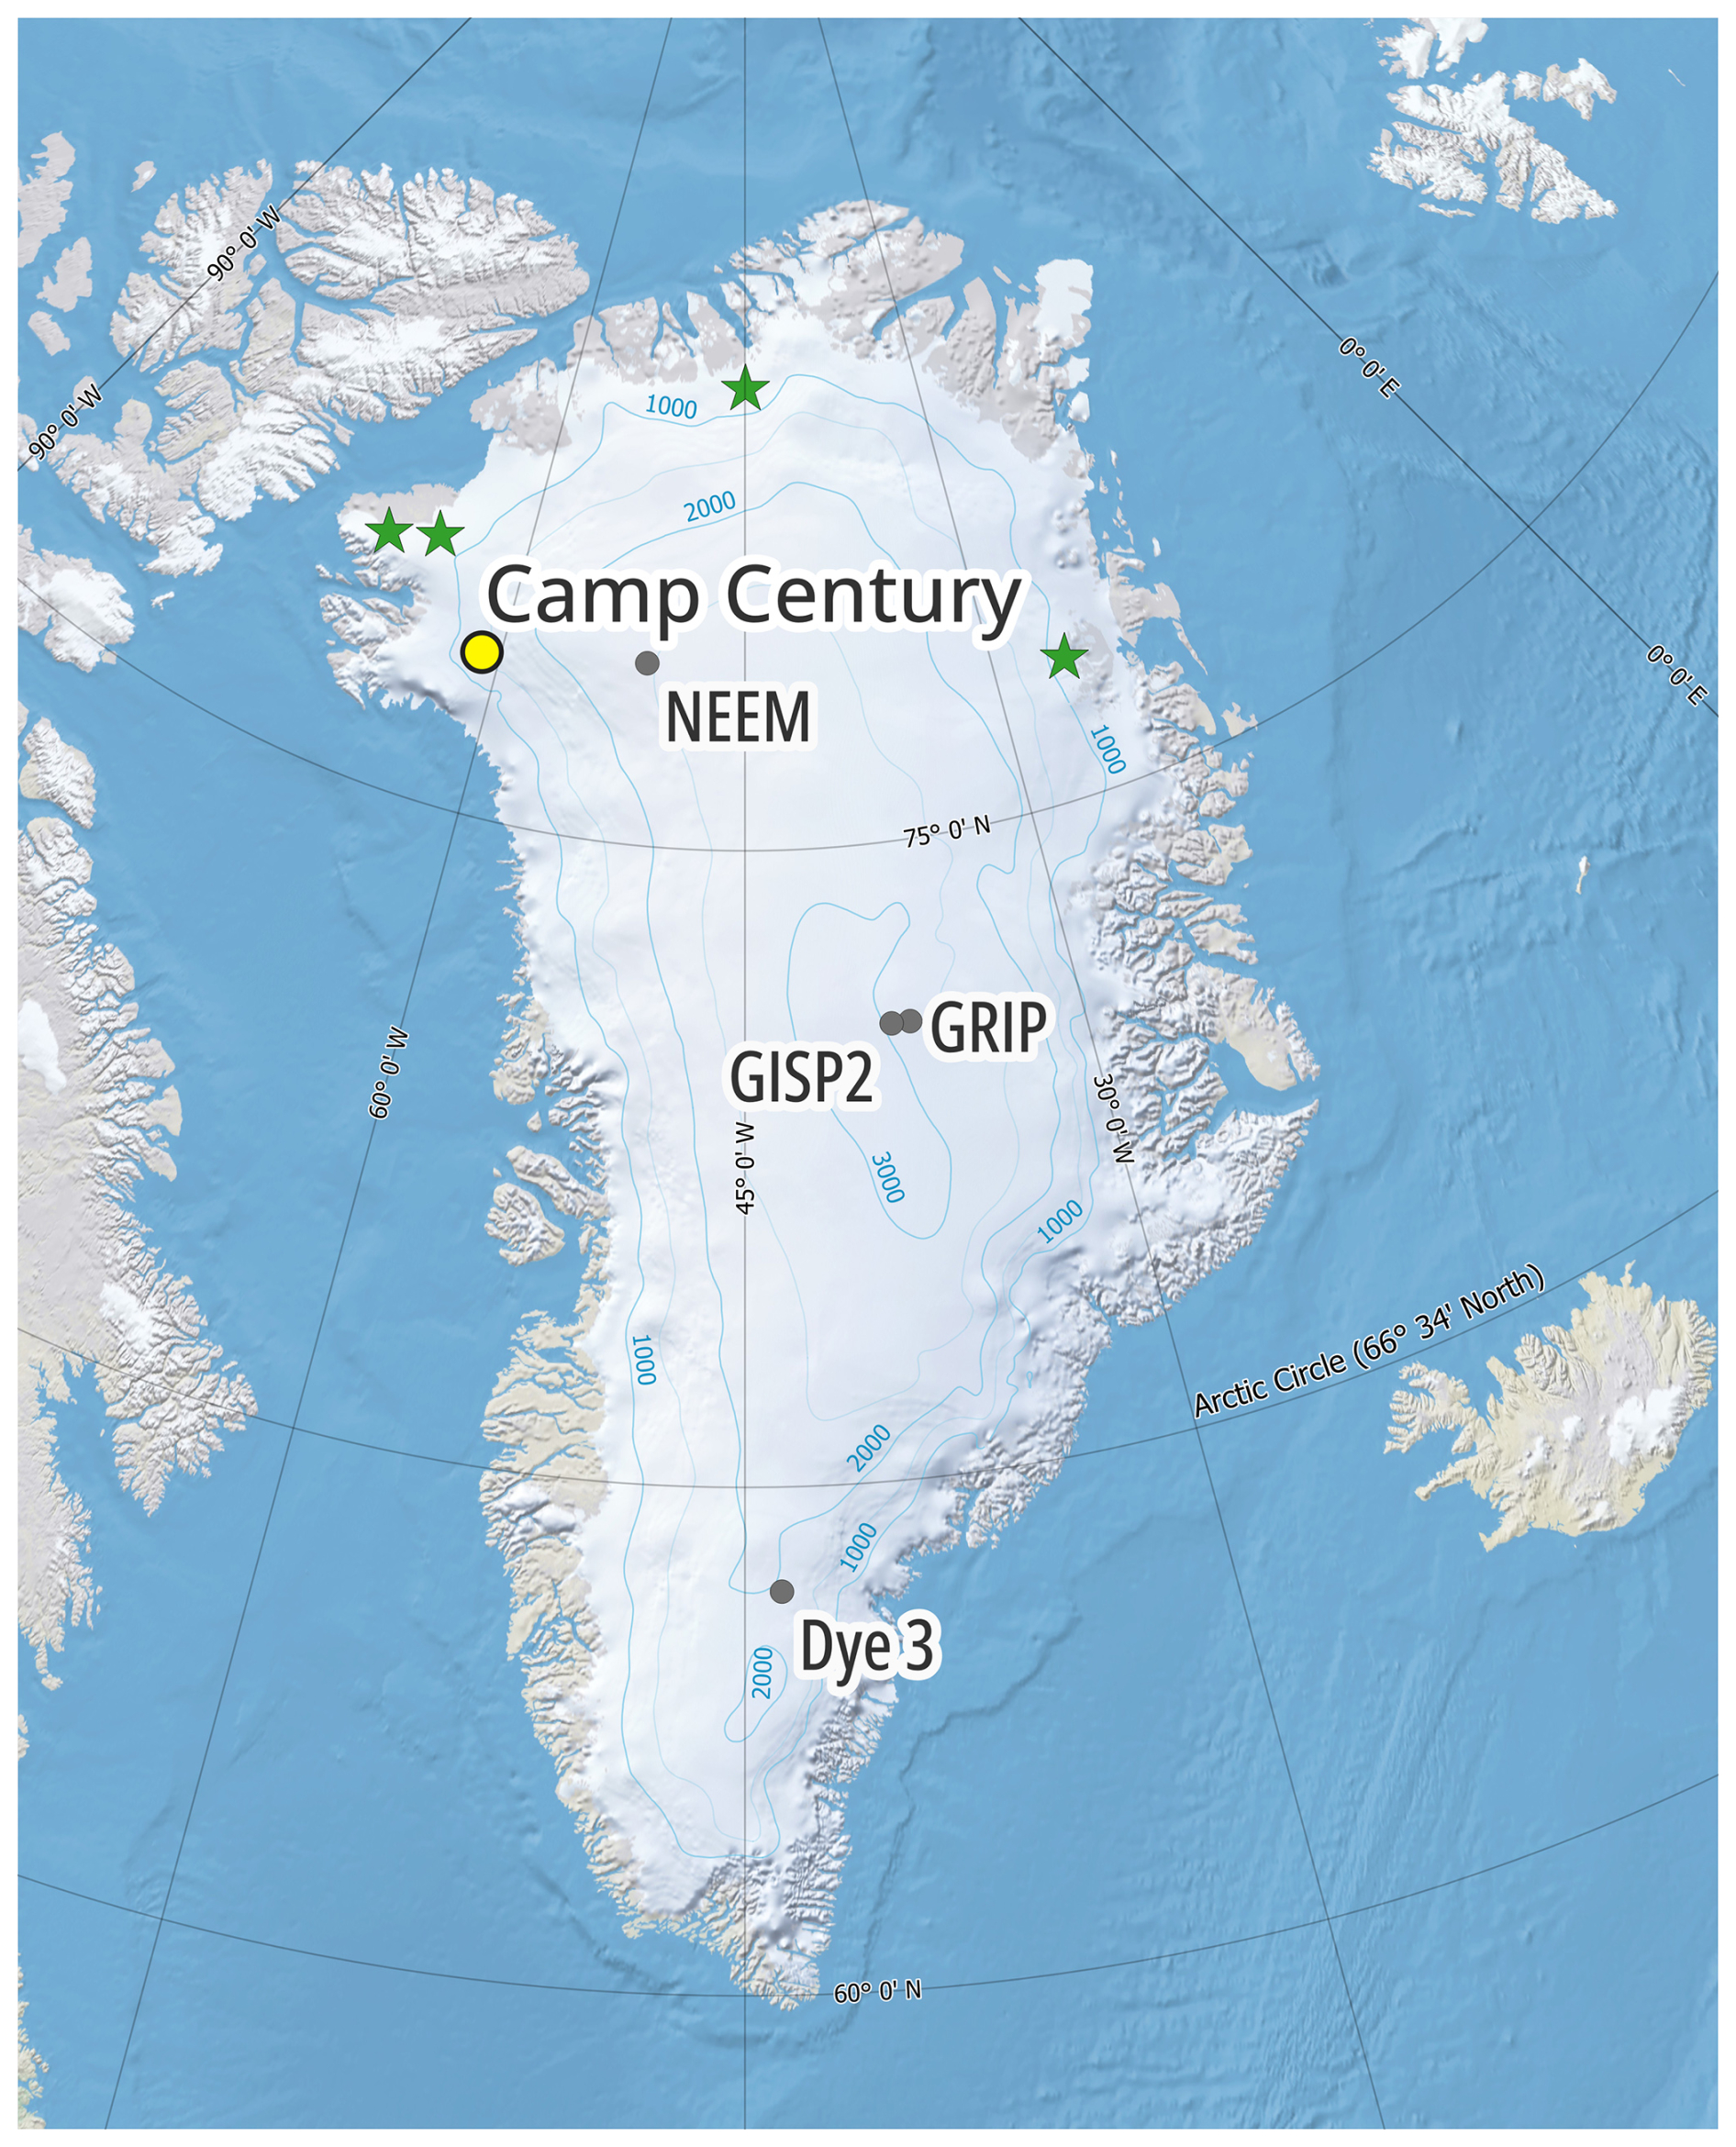
Figure 1Map of Greenland (Harrison et al., 2011; Moon et al., 2023) showing drilling locations where subglacial or basal material has been retrieved. Drilling locations for the ongoing GreenDrill project (Prudhoe Land, Hiawatha Margin, Victoria Fjord, and Dronning Louise Land from west to east) are marked by a green star (Briner et al., 2022).
At Camp Century (77.2° N, 61.1° W), the US Army drilled the first deep ice core that entirely penetrated the ice sheet. Below the ice, they collected 3.44 m of subglacial material, which would remain the longest subglacial archive for the next 6 decades (Balter-Kennedy et al., 2023; Langway, 2008). Ice from this core was studied extensively (e.g., Hansen and Langway, 1966; Johnsen et al., 1972; Langway and Hansen, 1970; Dansgaard et al., 1969), but the subglacial material was left relatively unstudied (Fountain et al., 1981; Harwood, 1986; Whalley and Langway, 1980). The subglacial material did not move to the US Ice Core Repository with the rest of the Camp Century core in the mid-1990s, and it was thought by US researchers to have been lost. Its rediscovery in freezers of the Niels Bohr Institute at the University of Copenhagen sparked new interest in analyzing this unique archive (Bierman et al., 2024a; Voosen, 2019).
The Camp Century subglacial core is made up of several units, with the deepest containing sediment last exposed to sunlight before 1.5 and buried no longer than 3.2 Myr (Bierman et al., 2024a; Christ et al., 2021). Data show that the top of the subglacial core was exposed at the surface 416 000 ± 38 000 years ago, which places its last exposure during the Marine Isotope Stage (MIS) 11 deglaciation (Christ et al., 2023). MIS 11 (374 to 424 ka) was both a long and warm interglacial with a peak atmospheric CO2 concentration similar to pre-industrial levels (Dutton et al., 2015). This makes MIS 11 an important but imperfect analog by which to study the effects of future warming and GrIS stability (Dutton et al., 2015; Jouzel et al., 2007; Lisiecki and Raymo, 2005; Lüthi et al., 2008; Robinson et al., 2017). The presence of plant and invertebrate fossils in the Camp Century subglacial core mandates the site was not covered by ice for some part of MIS 11 and indicates the maximum limit for ice extent at that time (Christ et al., 2021, 2023).
In this study, we used multiple physical, geochemical, and mineralogic techniques to characterize 26 of the 30 extant samples cut from the 3.44 m Camp Century subglacial core (Bierman et al., 2024a). We employed a multiscale technique to define the lithological succession and analyze sedimentary facies to infer what environments were present when this sediment and ice were deposited. At the macroscale, we conducted a mineralogical survey using X-ray diffraction (XRD) to quantify relative mineral assemblages. At the mesoscale, we used non-destructive micro-computed tomography (μCT) of the frozen sediment to make detailed stratigraphic observations at the scale of tens of microns. We also used scanning electron microscopy (SEM) and associated geochemical mapping to analyze grain coatings, textures, and shapes at the micron scale. Using non-destructive μCT in tandem with other methods (XRD, SEM) allowed us to maximize data output when working with a volumetrically limited archive. Characterizing this unique subglacial core offers the opportunity to expand our knowledge of Greenland's climatic history, interglacial surface processes, and subglacial processes in addition to demonstrating the potential for subglacial materials to inform our understanding of ice sheet behavior over time.
With the fundamental core stratigraphy now defined (Bierman et al., 2024a) and prior work suggesting the composition of rocks in the core (Fountain et al., 1981), as well as the presence of fossil material and the timing of interglacial exposure (Christ et al., 2021, 2023; Harwood, 1986; Whalley and Langway, 1980), the goal of this paper is to understand and document better the mineralogy of the sediment, the sedimentary sequence, the cryostructures, and the history and processes reflected by characteristics of the subglacial material.
Subglacial material is a valuable source of both paleoclimate and glacial process information (e.g., Bierman et al., 2014; Schaefer et al., 2016). Sediment preserved beneath the ice and in basal ice can reveal crucial information about ice-free events, their duration, and surface processes (Bierman et al., 2024a; Christ et al., 2021, 2023). Basal materials are particularly important because they contain in situ physical evidence for past events that are not recorded in glacier ice (Bender et al., 2010; Bierman et al., 2014; Blard et al., 2023; Christ et al., 2021, 2023; Gow and Meese, 1996; Marschalek et al., 2024; Schaefer et al., 2016; Suwa et al., 2006; Yau et al., 2016).
2.1 Basal ice
Nearly every deep ice core from the GrIS (Camp Century, Dye 3, Greenland Ice Sheet Project – GISP2; Greenland Ice Core Project – GRIP; North Eemian Project – NEEM; East Greenland Ice Core Project – East GRIP) has retrieved meters of deformed ice containing bed material, referred to as silty ice or basal ice (Bender et al., 2010; Blard et al., 2023; Christ et al., 2021; Gow and Meese, 1996; Hansen and Langway, 1966; Herron et al., 1979; Souchez et al., 1998; Suwa et al., 2006; Voosen, 2025). The basal ice layers (BILs), found above the ice–bed interface, are influenced by processes operating at and near the bed, including deformation, reglaciation, and, in some cases, melting. This limits the interpretability of the climate record in the deepest ice, but the bed sediments entrained in the basal ice can reflect aspects of glacial and subglacial processes and paleoenvironmental conditions during ice-free episodes (Knight, 1997).
Initial analyses of debris in the Camp Century BIL confirmed, using SEM and XRD analysis, that the sediment originated from the frozen material below (Herron et al., 1979). In other locations, investigation of ancient biomolecules in Dye 3 and GRIP silty ice found evidence that a boreal forest once existed at Dye 3, which necessitates warming and extensive ice sheet retreat from southern Greenland (65.2° N), but such retreat did not appear to reach as far north as GRIP (72.5° N) (Willerslev et al., 2007). Stable water isotope composition of the BIL in the GRIP core, corroborated by a comparative study between the debris found there and at GISP2 (72.5° N), indicates that the GRIP BIL originated as ground ice before incorporation into the larger growing ice sheet and has since deformed (Gow et al., 1997; Gow and Meese, 1996; Souchez et al., 1994, 1995; Tison et al., 1994). A multiproxy analytical approach applied to sediment in the BIL from the NEEM core (77.5° N) (Blard et al., 2023) found evidence of a sequence of glacial retreat and advance possibly like that which has been identified in the Camp Century subglacial material (Christ et al., 2021, 2023).
2.2 Subglacial material
In Greenland, coring activities at Camp Century, GISP2, and GreenDrill retrieved subglacial material from beneath the ice–bed interface (Balter-Kennedy et al., 2023; Christ et al., 2021; Gow and Meese, 1996; Souchez et al., 1994, 1998). At GISP2, drillers extracted 48 cm of till (mostly boulders, only 8–10 cm of fine grain material) and 1.07 m of underlying rock (Gow et al., 1997). Cosmogenic isotopic analysis of the underlying rock and till and of an overlying boulder shows that the land surface at GISP2 was deglaciated for extended periods of time during at least one Pleistocene interglacial (or possibly many) after the Mid-Pleistocene Transition, ∼ 1.1 Ma (Bierman et al., 2024b; Schaefer et al., 2016).
Grain texture analysis of Camp Century sediments (Whalley and Langway, 1980) revealed two populations of grains mixed subglacially: angular grains, attributed to glacial crushing, and rounded grains, attributed to eolian transport. Whalley and Langway (1980) infer that the eolian fraction must have been produced before the ice advanced, mandating prior ice-free conditions. A petrographic investigation of 17 clasts in the Camp Century subglacial core revealed that they were compositionally like those cropping out at the ice sheet margin (Fountain et al., 1981).
Extraction of freshwater diatoms from the bottom of the Camp Century BIL and the upper part of the sub-ice core indicates that the ice retreated far enough to expose the Camp Century drill site at least once during the Pleistocene (Harwood, 1986). Cosmogenic and luminescence dating of the upper- and lowermost subglacial samples show that the 3.44 m of material records at least two glaciations separated by ice-free conditions during MIS 11 (Christ et al., 2021, 2023; Woznick, 2024). The currently active northern Greenland drilling project, GreenDrill, has successfully retrieved 3 m of silt to cobble-sized sediment in basal ice atop 4.5 m of gneissic bedrock (Balter-Kennedy et al., 2023; Briner et al., 2022).
2.3 Computed tomography stratigraphy
Computed tomography (CT), a technology widely used in the medical field, is also a powerful tool for examining sediment cores non-destructively (Renter, 1989). CT scans produce greyscale images based on the intensity of the attenuated X-ray beam and are reconstructed to produce three-dimensional (3D) models of the scanned object (Razi et al., 2014). CT scans have been used to characterize quantitative facies by comparing density plots that suggest environmental changes (Emmanouilidis et al., 2020; Lee et al., 2021). Used in studying marine sediment cores, CT scans aid in calculating bulk density and its spatial variation vertically and laterally (Orsi et al., 1994). CT scans also provide detailed visualizations of sediment structures, grain distribution, and material densities (Mena et al., 2015).
CT scanning technologies are effective in studying frozen permafrost cores. Some studies characterized the sediment properties, cryostructures, and ground ice content of permafrost but did not find CT successful as a proxy for identifying ground ice origin (Calmels and Allard, 2008; Lapalme et al., 2017). μCT, a refinement of this technology, provides micron-scale resolution (typically between 1–150 µm voxels, which is the 3D equivalent to a pixel) for more detailed studies and has been used to make pore-scale observations (Lei et al., 2018, 2022). Three-dimensional microstructure analysis in permafrost allows the quantification of physical properties, including the spatial density of ice inclusions, which can be useful in estimates of thermal conductivity (Nitzbon et al., 2022). The same authors suggest that microstructure analysis from μCT scans, in combination with other measurements, allows reliable inference of depositional processes (Nitzbon et al., 2022).
2.4 Microscale grain characteristics
Grain characteristics have been used routinely to inform sedimentological studies (Naqshband and McElroy, 2016). Grain size distribution can be an indicator of transport energy, as higher-energy fluids can transport larger/heavier grains, or of source material characteristics, or both (Gresina et al., 2023; Hjulström, 1935; Malusà et al., 2016). Specific grain morphology, including roundness and circularity, is related to transport energy, transport distance, mode of transport, source material, and conditions at the site of deposition (Krumbein, 1941).
Recently, studies of grain morphology have used automated image analysis (Gresina et al., 2023; Szmańda and Witkowski, 2021; Tafesse et al., 2013) to infer transport mechanisms. For example, properties of particle shape, investigated using this method, correlate circularity and roundness with transport distance and energy, respectively (Gresina et al., 2023). Image analysis of sediment grains from coastal dunes shows that roundness and patterns in size and shape indicate various and specific modes of transport in eolian sediments (van Hateren et al., 2020). Quartz morphology, including roundness assessments and microstructures, has revealed evidence of past storm frequency and has been used to reconstruct sediment provenance and transport during the Last Glacial Maximum (Kalińska-Nartiša et al., 2018; Woronko et al., 2015). Grain size analyses of loess deposits identify episodes of rapid climate change, which mimic rapid climate fluctuations during the last glacial period (Dansgaard–Oeschger events), have been found in ice cores (Vandenberghe and Nugteren, 2001). Applied to glacially derived sediments, Lepp et al. (2024) recently showed that glacial and fluvial surface textures are retained on silt-sized quartz grains and can be used to evaluate sediment transport processes.
Grain coating abundance and distribution can also provide information of source conditions, erosional processes, original transport mechanism, and post-depositional pedogenic processes. Coatings on grain surfaces indicate post-depositional weathering and pore fluid transport of solids and solutes in both temperate and Arctic regions (Dixon et al., 2002). In contrast, the absence of grain coatings may signal an active transport environment (Musselman and Tarbox, 2013). Glacial flour is common in till and glacial lacustrine deposits and is characterized by agglomerates of clay- to silt-sized angular particles (Pesch et al., 2022) and small particles adhered to grain surfaces that have features consistent with glacial grinding (Mahaney, 2002; Whalley and Langway, 1980).
2.5 Cryostratigraphy
Cryostratigraphy describes the shape, amount, and distribution of ice and sediment in frozen ground (Gilbert et al., 2016; Murton and French, 1994). Cryofacies are defined by distinct patterns of ice lenses, volumetric ice content, and layering of ice and sediment. Cryostratigraphy is used to infer permafrost formation mechanisms as either epigenetic, permafrost that forms after sediment deposition, or syngenetic, permafrost that forms as material is deposited (French and Shur, 2010). Ground ice includes pore ice and segregated ice but typically excludes buried ice (French and Shur, 2010; Murton and French, 1994). Pore ice works as cement, holding the sediment together. Segregated ice forms as ice accumulates along the freezing plane, the boundary between conditions supporting liquid water and ice, and can be millimeters to tens of meters thick (French and Shur, 2010). Organized lenticular and layered cryostructures are common in syngenetic permafrost and tend to be short, thin, and highly abundant (French and Shur, 2010; Murton and French, 1994). Epigenetic permafrost is typically ice-poor, contains pore-filled cryostructures (Gilbert et al., 2016; Stephani et al., 2014), and is characterized by reticulate cryostructures that reflect shrinking as sediment freezes and moisture migrates toward the freezing front, a phenomenon most common in fine-grained materials (French and Shur, 2010). Thaw unconformities occur and are shown by the presence of epigenetic structures bordering diagnostic syngenetic features (French and Shur, 2010). CT scan images have been used successfully to identify cryostructures in permafrost from the McMurdo Dry Valleys of Antarctica (Lapalme et al., 2017). However, the small diameter of cores makes the identification of cryostructures uncertain due to their scale dependence (Gilbert et al., 2016).
We employed standard geologic practices to study the stratigraphy and mineralogy of the subglacial materials. We used frozen samples for μCT, and, after thawing at 4 °C, we used bulk sediment for XRD and SEM analysis on a total of 26 samples from the archive. There is scant information about the storage and transportation of the samples between their collection in 1966 and resampling in 2019 (Bierman, 2024; Bierman et al., 2024a; Christ et al., 2021; Voosen, 2019). The initial orientation of the core has not been preserved.
3.1 Micro-computed tomography (μCT)
We created a digital archive of the (a) and (b) sub-samples (sub-sampling described in Bierman et al., 2024a), 49 in total, by collecting a series of μCT scans. We used a source voltage of 100 kV, a source current of 62 µA, and an exposure time of 550 ms. Correction for beam hardening was performed on a scan-by-scan basis. We scanned both sub-samples from each core section using a Bruker SkyScan1173 μCT scanner fit for use in a cold room at −10 °C at the Cold Regions Research and Engineering Laboratory (CRREL) in Hanover, NH. Each of the ∼ 10 cm tall samples were scanned in two overlapping 7.9 cm tall sections at a resolution of 71 µm per voxel to capture the entire length of the sample.
We completed reconstructions for each scan using the Bruker NRecon software. This resulted in 84 partial sample scans, 7 full sample scans, and 8 zoomed scans. Two scans resulted in failed reconstructions due to difficulty with the scanning procedure (sample 1063-4). We performed the same post-reconstruction manipulation for all samples in ImageJ (FIJI) (Schindelin et al., 2012): (a) we stitched the bottom and top portions of the scans (except the non-overlapping sample 1062-4) using manual calibration; (b) we resliced the scans across the z axis for visualization; and (c) we generated a 3D rendering of the stitched scans using a “brightest-point” projection, 0 % opacity, surface depth cues at 100 %, and interior depth cues at 50 %. The raw data are archived with the Arctic Data Center (Perdrial et al., 2024). 3D visualization of all scanned samples is available for viewing and download at this online public repository: https://www.morphosource.org/concern/cultural_heritage_objects/000583438 (last access: 22 July 2025).
Qualitative assessment and 3D visualization of the partial scans, using Bruker's CTVox software and ImageJ, allowed us to investigate contacts, layering, sorting, lineations, and ice layers in each sample. The 3D nature of the CT scans allows us to examine internal structures by slicing into the models laterally. While no cross-sample calibration was performed, we were able to filter the intensity of the beam response to only display the denser suspended particles to look for other structures, such as layering and particle alignment. The angularity of larger grains was also assessed visually with a classification scheme that defines grains with sharp edges as angular and grains with smooth, curved sides as rounded, along with a range of intermediate shapes (Janoo, 1998).
3.2 X-ray diffraction
We analyzed the crystalline composition of a representative group of 15 samples from various sections of the subglacial core (Table 1) by XRD using a Rigaku MiniFlex II, equipped with a Cu X-ray tube. Following qualitative diffractogram analysis, we quantified mineral percentages using the Rietveld Full Pattern Profile Fit algorithm included in the PDXL-2 software (PDXL, Rigaku Corp). We used approximately 0.2 g of bulk sediment from each sample and ground it manually with a mortar and pestle. The ground sediment was mounted on a zero-background plate in random-orientation mounts and analyzed in 2theta-theta geometry between 3 and 70 °2θ with a dwell time of 1° min−1 and 0.02 °2θ resolution for a total run time of 67 min. Although limited, the background plate contributed some background signal at low angles in the diffractogram.
Table 1Summary of samples and physical, geochemical, and mineralogic analyses performed. Asterisks denote samples analyzed in work performed and reported by Christ et al. (2021).
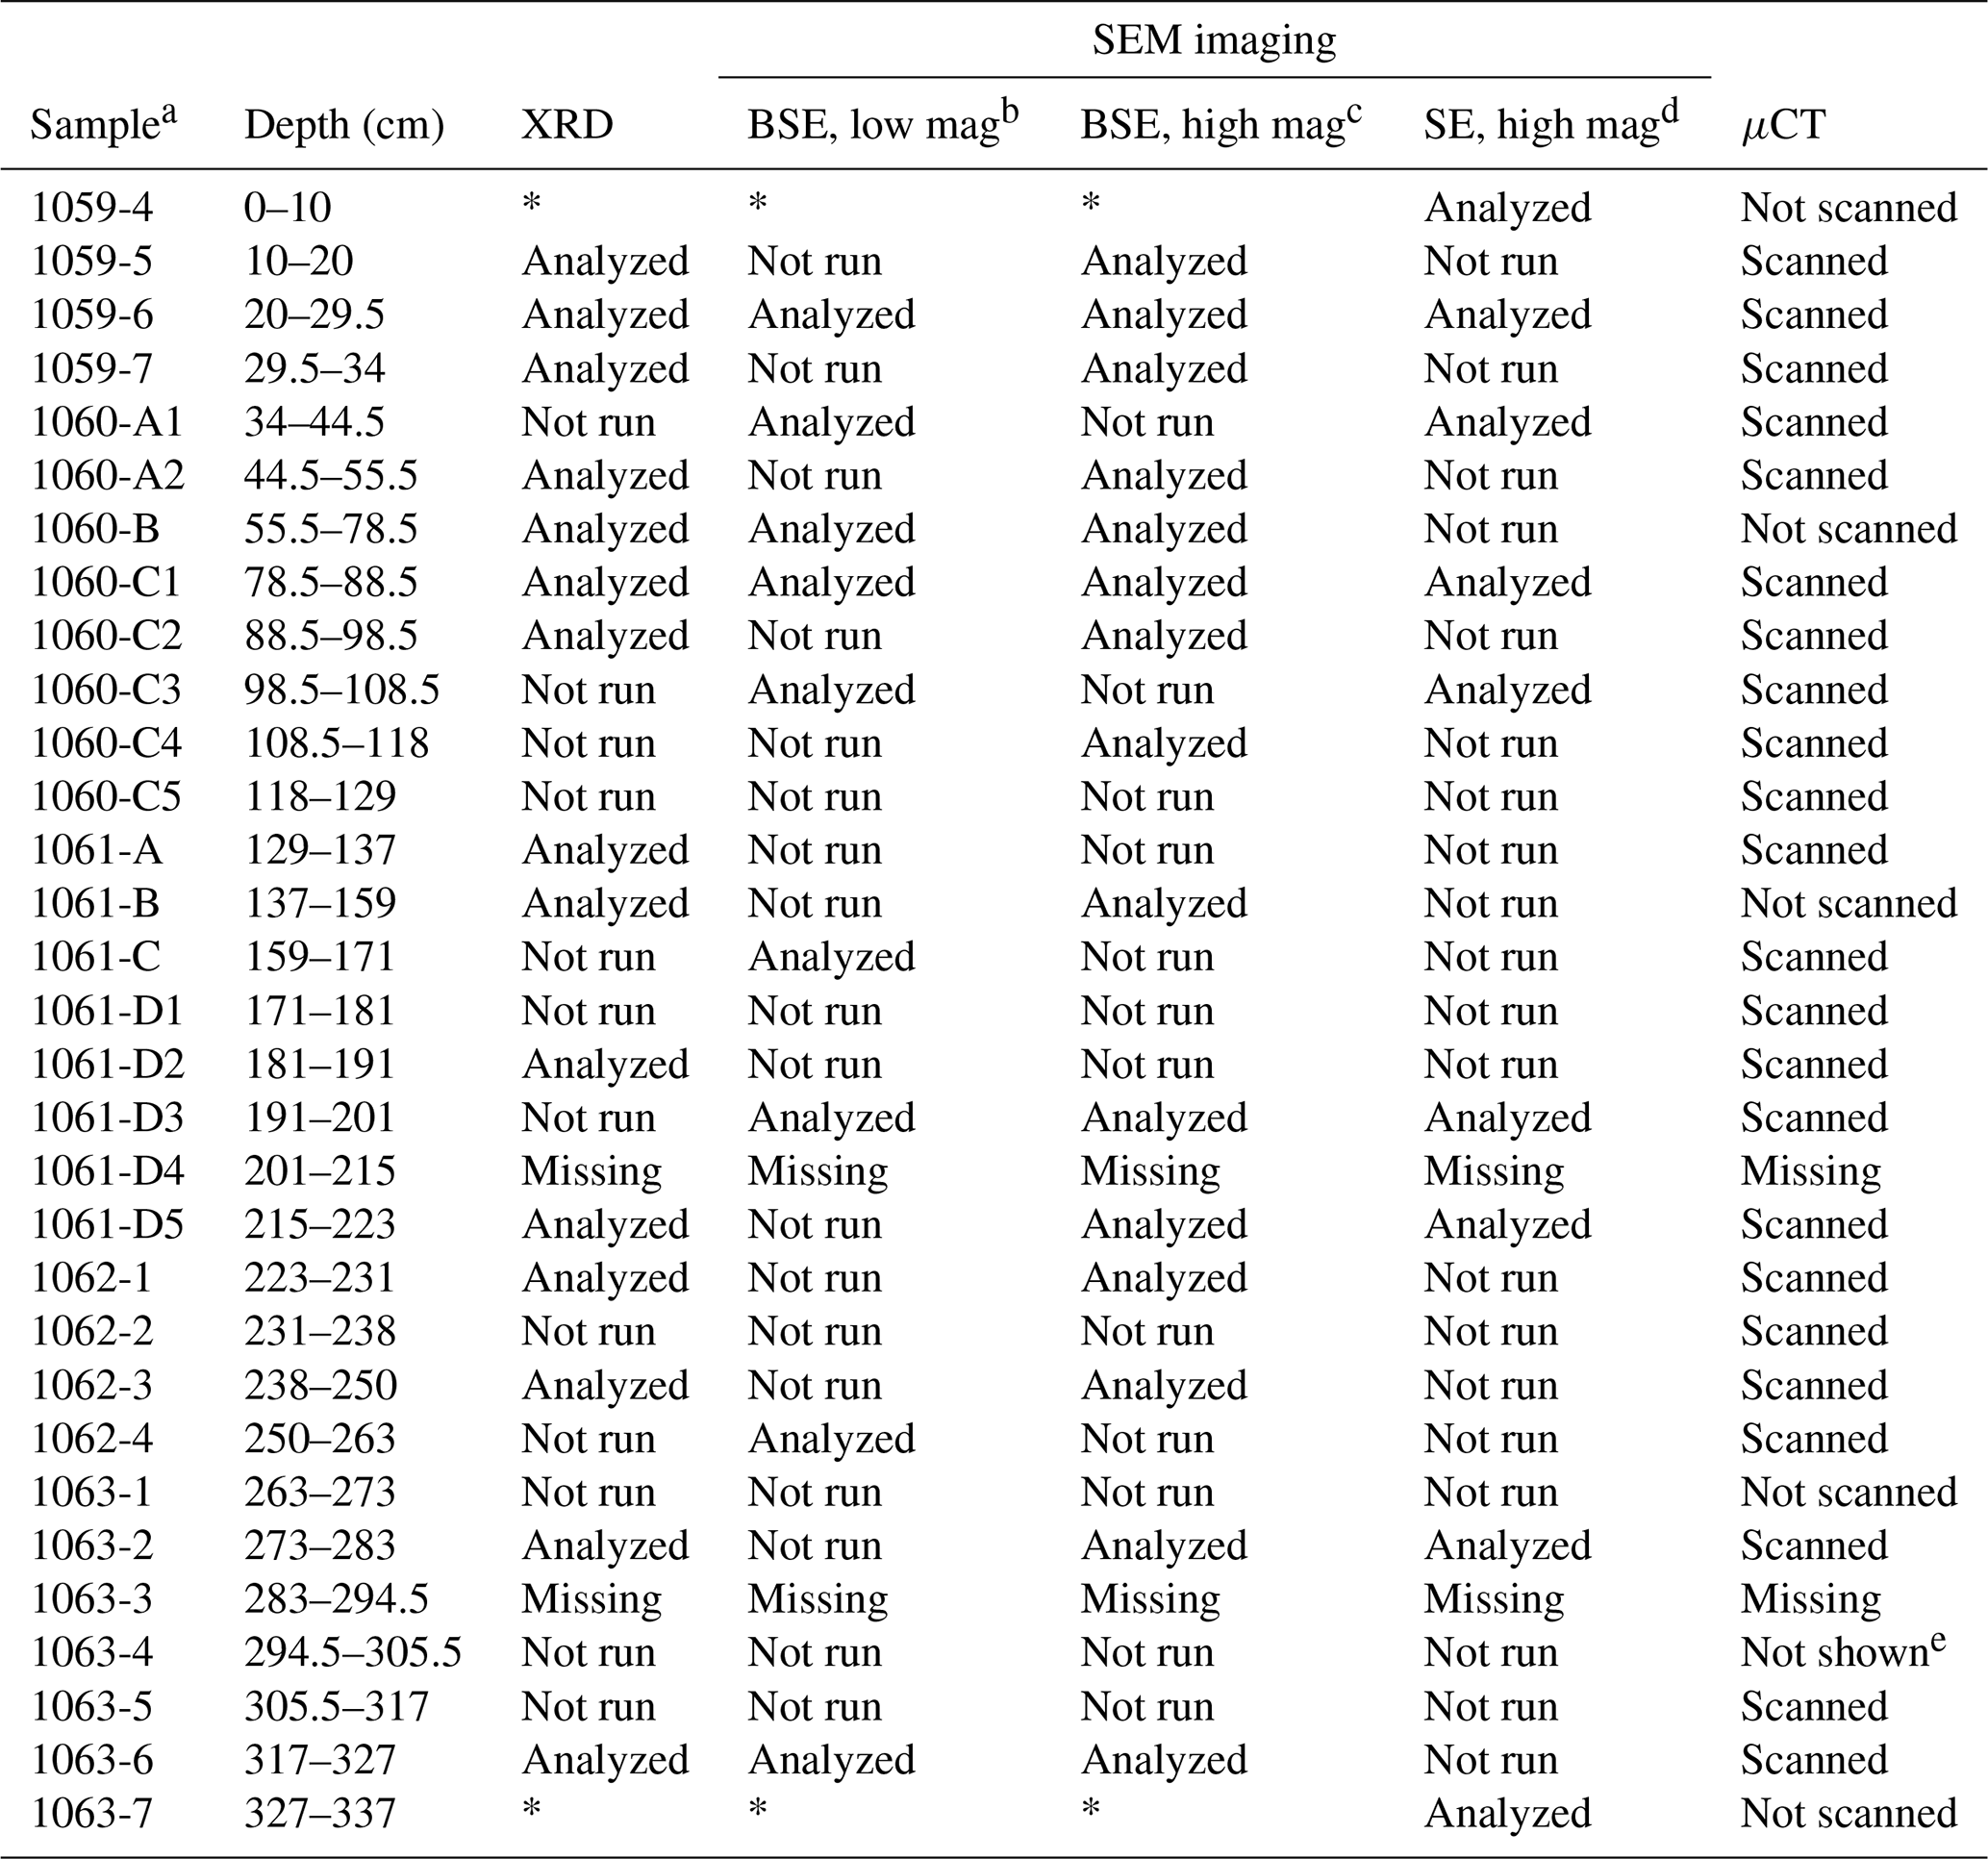
a Sample name notation described in Bierman et al. (2024a). b “BSE, low mag” denotes samples analyzed in backscattered mode on polished mount, used for the morphology analysis on all particles with lower magnification. c “BSE, high mag” denotes samples analyzed in backscattered mode on polished mount used in coating estimates (with a higher magnification), PCA, and k-mean clustering. d “SE, high mag” denotes samples analyzed in secondary electron mode used for grain texture analysis. e Not shown: poor-quality CT scans.
We characterized mineralogy using databases from the International Center for Diffraction Data 2.0 and Crystallography Open Database for peak matching. Subsequently, we performed quantitative analysis of the X-ray diffractograms using a semi-automatic Rietveld approach (Rietveld, 1969). To refine our results, we varied the values for scale factor, cell parameters (within 0.2 Å), shape parameters, selected minerals (clays and amphiboles), and the March–Dollase preferred orientation parameter, similarly to the method described in Mackowiak and Perdrial (2023). Untreated diffractograms are archived with the Arctic Data Center (Perdrial et al., 2024).
3.3 Scanning electron microscopy imaging and energy dispersive X-ray micro-mapping
We performed two different types of SEM analysis: SEM imaging and elemental mapping of polished mineral surfaces and SEM high-resolution microphotography of grain textures and shapes (Table 1). We embedded thawed bulk sediments in epoxy resin (EPO-TEK 301). After curing for at least 24 h, we micro-polished the resulting epoxy puck using a decreasing grit size to 0.05 µm. The mounts were carbon sputter-coated prior to analysis in backscattered electron (BSE) mode using a TESCAN VEGA3 scanning electron microscope coupled with an Oxford Instruments Aztec Elemental Mapping Energy Dispersive X-ray Spectrometer (EDS) in the Geology Department at Middlebury College (Vermont, USA). We acquired BSE images and EDS maps at 20 keV for a minimum of 20 frames totaling 10 min elapsed time for each multi-elemental map. Then, we generated multi- and tricolor maps using the Gatan digital micrograph 3.1 software. We imaged 15 samples with the SEM and analyzed with sites on each mount (except sample 1059-6, which was imaged only at one site), resulting in 29 individual images archived with the Arctic Data Center (Perdrial et al., 2024).
We conducted grain coating evaluation of all 29 images. To do so, we used the EDS maps to evaluate each grain and placed it, based on our visual assessment of grain coating abundance, into the following five unique categories: grains dominated by coating (> 50 % coverage), grains with moderate coating (< 50 % and > 25 % coverage), grains with little to no coating (< 25 % coating), grains with coating only in cracks, and fine-particle aggregates. Observations from two sites of the same samples were merged so that there was one summed evaluation per sample, and five samples were counted by two different observers to ensure consistency. Counts were converted to percentages to normalize data between samples. We created the category “High Abundance”, which includes the dominated and moderate coating categories to communicate abundance vs. depth more succinctly.
At the Geological Survey of Denmark and Greenland, we acquired another set of SEM images in BSE at a lower resolution for grain size and shape analysis of all mineral compositions. Images at the lower magnification were collected for nine samples throughout the core. The nine samples were mounted in epoxy and coated with 10 nm carbon to make them conductive. Backscattered electron (BSE) contrast images were generated at the ZEISS Sigma 300 VP equipped with a field emission gun, using the ZEISS Mineralogic™ software platform. A mosaic of BSE frames of a representative part of the sample was taken. Further details on the software and applied method can be found in Keulen et al. (2020). Analyses were performed with acceleration voltages of 15 keV using a 120 µm2 aperture.
We analyzed unpolished grains from the 125 to 800 µm fractions in secondary electron mode at high resolution with SEM to observe grain micro-textures. This was done at the Service Commun de Microscopie Électronique et de Microanalyse X (GeoResources, Nancy, France) using a JEOL 7600F with a 1 nA primary beam operating at 15 keV. Before the collection of SEM images, grains were rinsed in Milli-Q water. The grains were dried and attached to adhesive paper before carbon coating. We used these high-resolution images to examine textural features at the grain surface (e.g., Cailleux and Tricart, 1959; Mahaney, 2002). We analyzed nine samples (Table 1) and report the key observations here.
3.4 Image analysis
We post-processed the EDS images of high-magnification polished grain data to determine grain size and grain shape parameters of quartz grains only. To isolate quartz grains, we used multi-element color maps created with Gatan's Digital Micrograph, and we performed a color threshold to select the Si–O-only phases (quartz). We then performed particle analysis on the Fiji platform (Schindelin et al., 2012; Vandel et al., 2020). For this set of images, the lower limit of size for a particle to be measured was set at 150 pixels corresponding to 50 µm2 at the 3 pixels µm−1 resolution we used. This minimum size is adequate for surface area and shape estimates (Francus and Pirard, 2005).
We measured three grain size/shape parameters (area, roundness, and circularity) and stored the average and standard deviation for each parameter. Fiji calculates circularity as 4π(Area Perimeter2), which returns values between 0–1, where a value of 1.0 indicates a perfect circle. Roundness is calculated as 4 × Area (π × major axis2), which returns values between 0–1, where larger values indicate increasing roundness. Areas measured by this method are lower than particle sizes obtained by physical methods (such as sieving) because the arbitrary cut surface angle and depth are unlikely to correspond to a two-dimensional (2D) projection of the particles as described in Sahagian and Proussevitch (1998).
We performed another image analysis on the set of SEM images acquired at a low magnification, allowing a larger dataset. For grain size and shape analysis, we included all grain compositions and set the lower limit of size for a particle to be measured at 1000 µm2. This resulted in a minimum size of 625 pixels for most images except for two lower-magnification images (1060-C1 and 1062-4), where the smallest size particle has an area of 2440 pixels. This minimum size ensures a robust measurement of all parameters (Francus and Pirard, 2005). Grain size, circularity, and roundness were measured using particle analysis in ImageJ, and a Tukey–Kramer honestly significant difference (HSD) pair-wise comparison was performed on the means for each sample in JMP® Pro 15.0.0 (JMP® Pro, 1989–2025). In all cases, the significance level (α) was set at 0.05. To represent significance between classes, we report differences using connecting letters where levels not connected by the same letter are significantly different. Despite the limitations of estimating the particle characteristics on polished thin sections, the use of a consistent minimum size threshold allows us to compare the parameters between samples using this method.
3.5 PCA and k-means clustering
Methods for reducing the dimensionality of a dataset, including principal component analysis (PCA) and k-means clustering, can be useful when interpreting physical grain characteristics and geochemical aspects (Jansson et al., 2022). To assess our unit assignments, we performed PCA and k-means clustering on data. The size and shape parameters (including standard deviations) from the low-magnification image analysis, combined with percent ice composition, percent fine-grained fraction composition, percent quartz composition, depth, and an ordinal evaluation of grain coatings varying from 0–2 (no coating, minimal coatings, and extensive coatings; determined visually), were used as input variables in a k-means clustering method on PCA variables. By integrating depth as a factor in the clustering, we follow traditional clustering stratigraphic models acknowledging depth dependency as a deterministic factor (Gill et al., 1993; Yabe et al., 2022). The dataset includes the 11 variables mentioned above, measured over a total of 29 observations from the 15 samples. The cluster centers were calculated using a “nearest-centroid-sorting” approach (Anderberg, 1973; JMP® Pro, 1989–2025). We performed a PCA for dimension reduction and then performed a k-means clustering in JMP® Pro 15 to assess the optimal number of clusters according to the cubic clustering criterion. Z scores, which normalize our input variables based on the feature mean and standard deviation, were calculated in R (R Core Team, 2022).
Our multiscale analysis supports, refines, updates, and provides more justification and detail regarding unit delineations proposed earlier (Bierman et al., 2024a; Christ et al., 2021, 2023; Fountain et al., 1981). PCA and subsequent k-means analysis quantitatively corroborate our understanding of these systems. Analysis of grain micro-textures shows that grains throughout the subglacial core material record different histories. We find at least 16 % very fine sand and silt-sized grains in all units (in some units the abundance of fines is over 90 %) and more variability in grain size in the lower part of the core. The abundance of grain coatings increases with depth, and coatings are largely absent in the upper two units (4 and 5). Grain shape analysis (roundness and circularity) does not vary systematically within or between units.
4.1 Micro-computed tomography
μCT scans show that the lowermost seven samples (1063-5 to 1061-D5) define a homogeneous unit (Unit 1; 327–223 cm depth below the ice–sediment interface), previously defined as a diamicton (Bierman et al., 2024a; Christ et al., 2021). CT analysis reveals a variety of cryostructures (Fig. 2a). These seven samples are characterized by variably sized clasts (ranging from angular to sub-rounded and spherical to elongated, from sand to cobble size) in a finer matrix without bedding. Throughout the unit, sub-horizontal ice lenses cut through the sediment in a braided lenticular pattern (see example in Figs. 2b and 3a). At the top of the diamicton, the CT scan of sample 1061-D5 (223–215 cm) captures a transition in the style of deposition. The upper part of the sample has a high ice content compared to the lower part of the sample, which is sediment-rich like the rest of Unit 1. The transition is not discrete, as the volume of ice increases upward within the fine-grained matrix material.
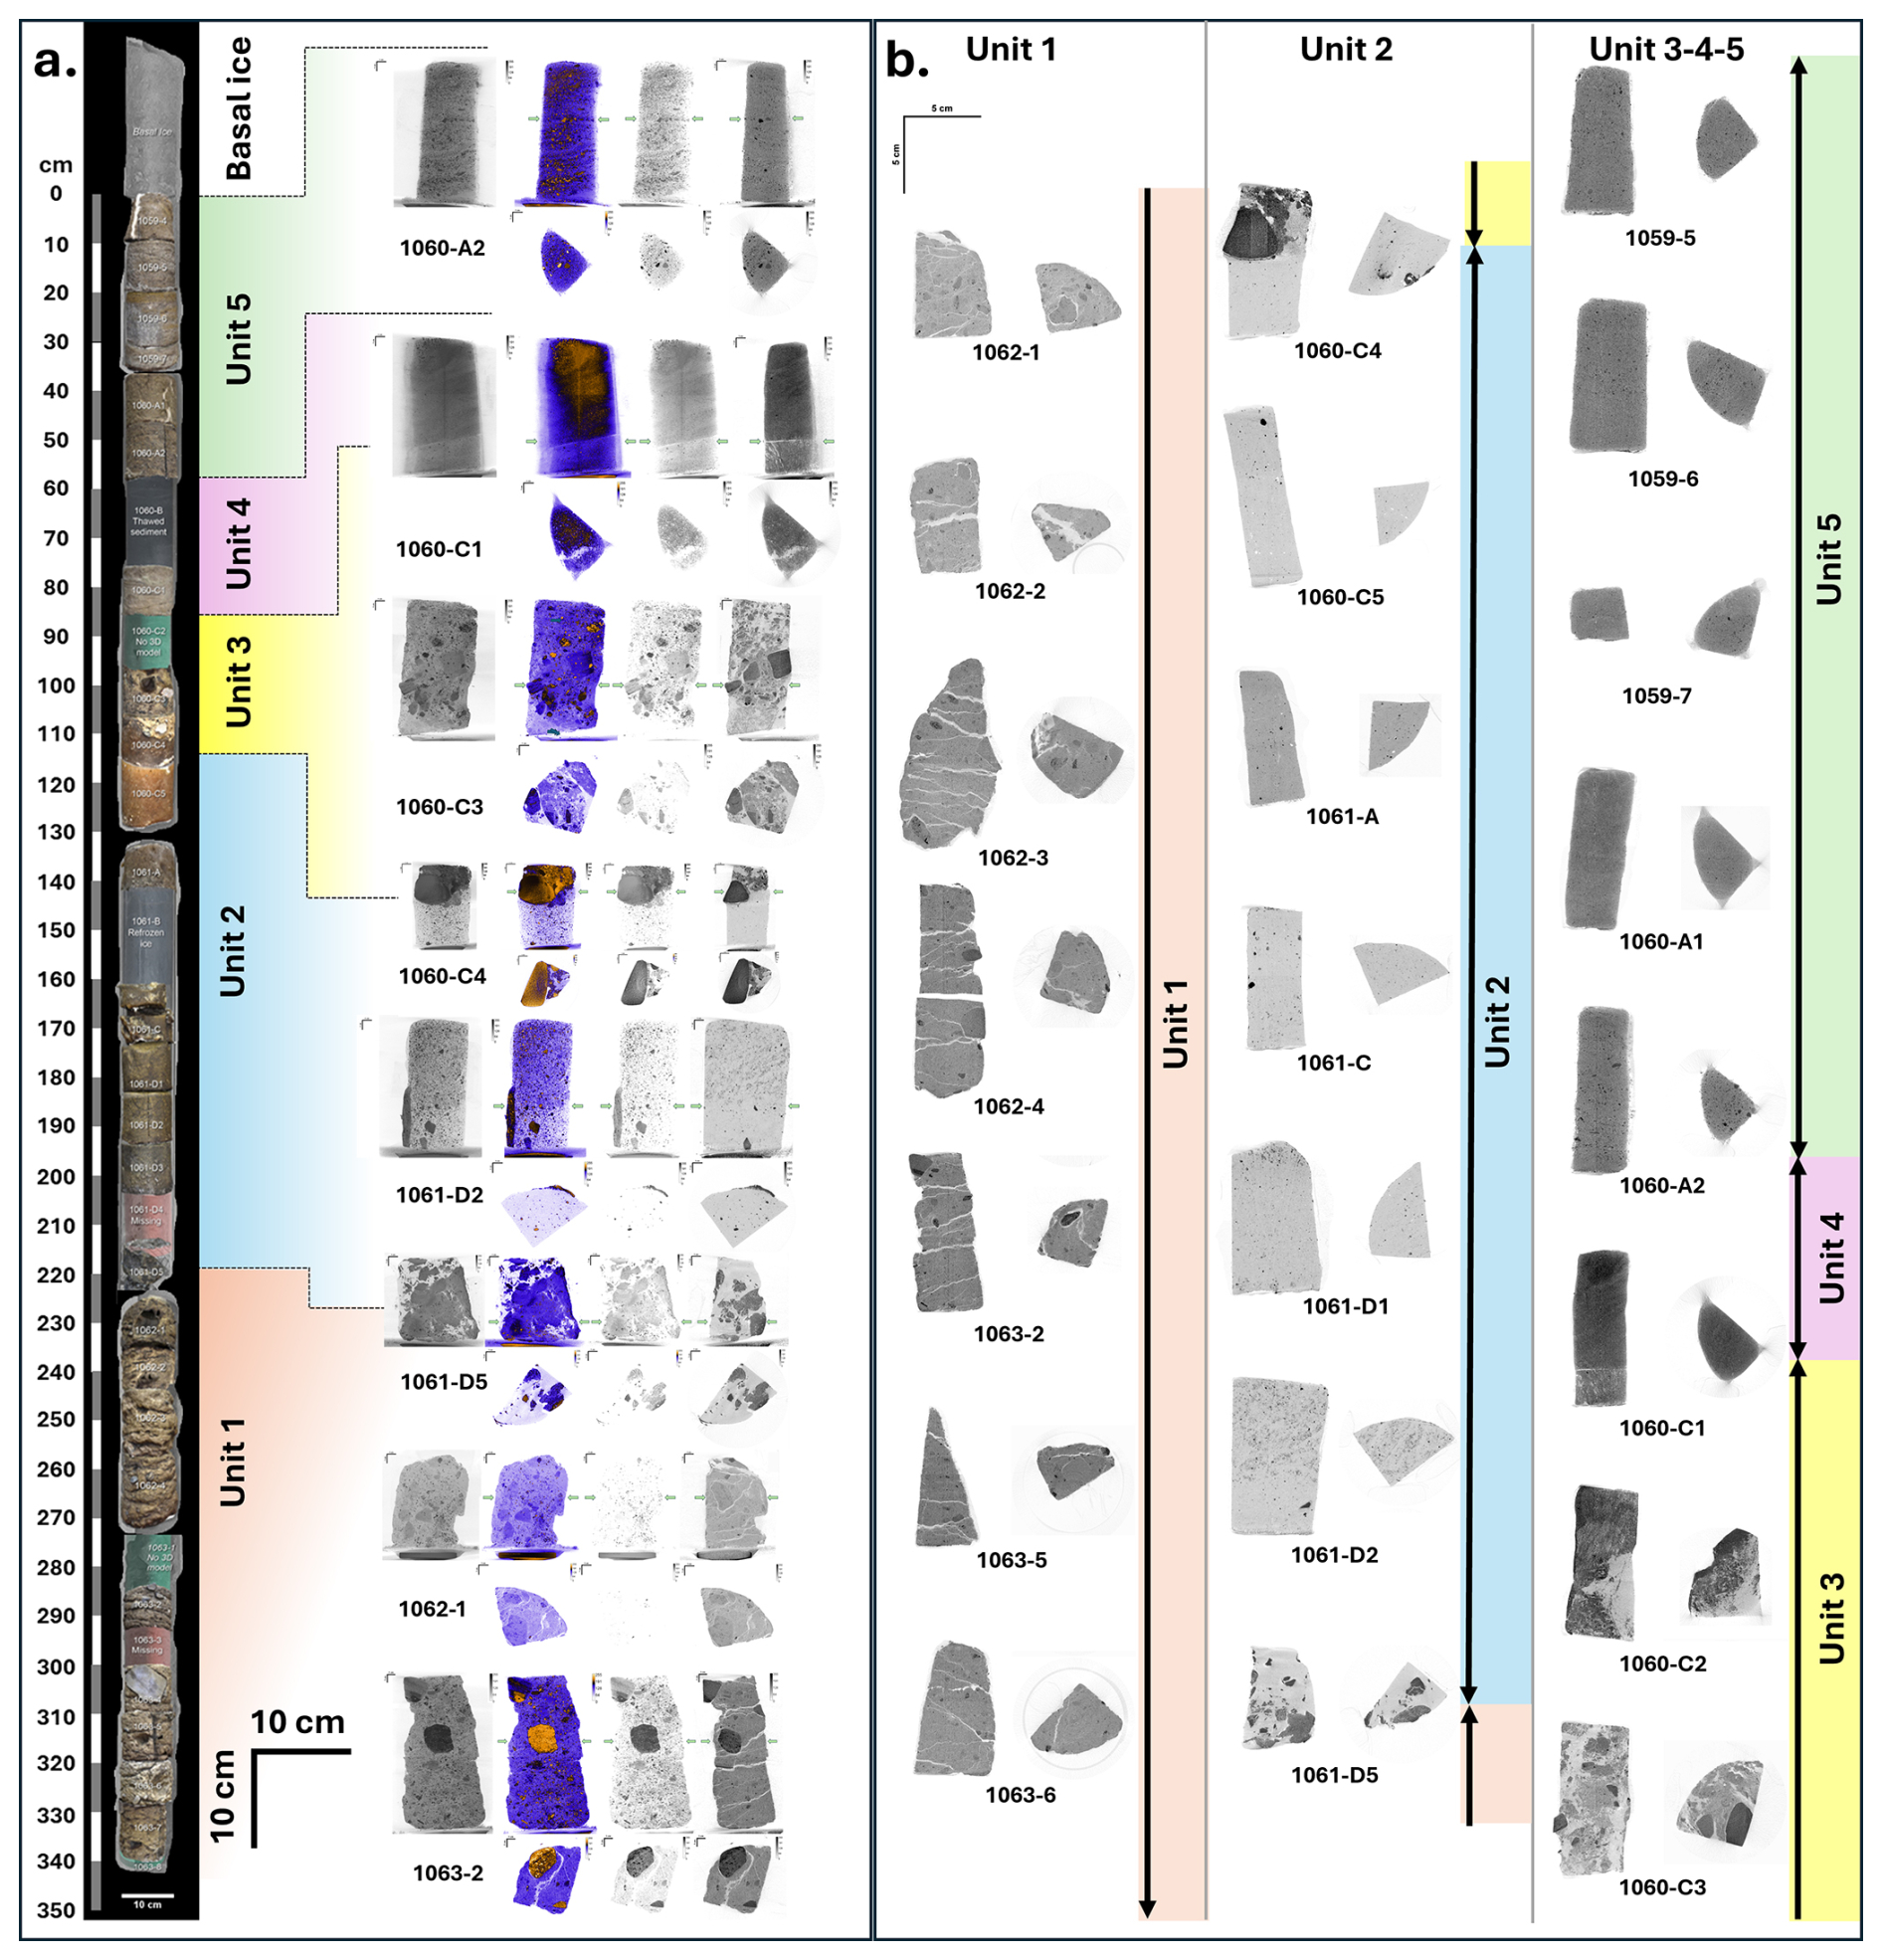
Figure 2(a) Visualizations of selected CT scans representative of the five units described in Bierman et al. (2024a). The 3D photogrammetric models are extracted from Bierman et al. (2024a). For each selected CT scan, we represent, in this order, a grayscale 3D rendering, a false-color 3D rendering, a half-histogram grayscale-filtered 3D rendering, and a selected z slice. Below these representations, selected xy slices corresponding to the green arrows are represented. All representations in panel (a) are scaled similarly. (b) Z slices and xy slices of all samples collected. For each sample, the z slice was taken exactly halfway through the scan and the xy slice was taken exactly mid-height of the sample. In panel (a), the selected samples represent both samples representative of the unit (1063-2 and 1062-1 for Unit 1, 1061-D2 for Unit 2, 1060-C3 for Unit 3, 1060-A2 for Unit 5) and samples capturing transitions between units (1061-D5 between units 1 and 2, 1060-C4 between units 2 and 3, 1060-C1 between units 3 and 4). Note that 1060-C1 is both characteristic of Unit 4 and highlights the transition with Unit 3.
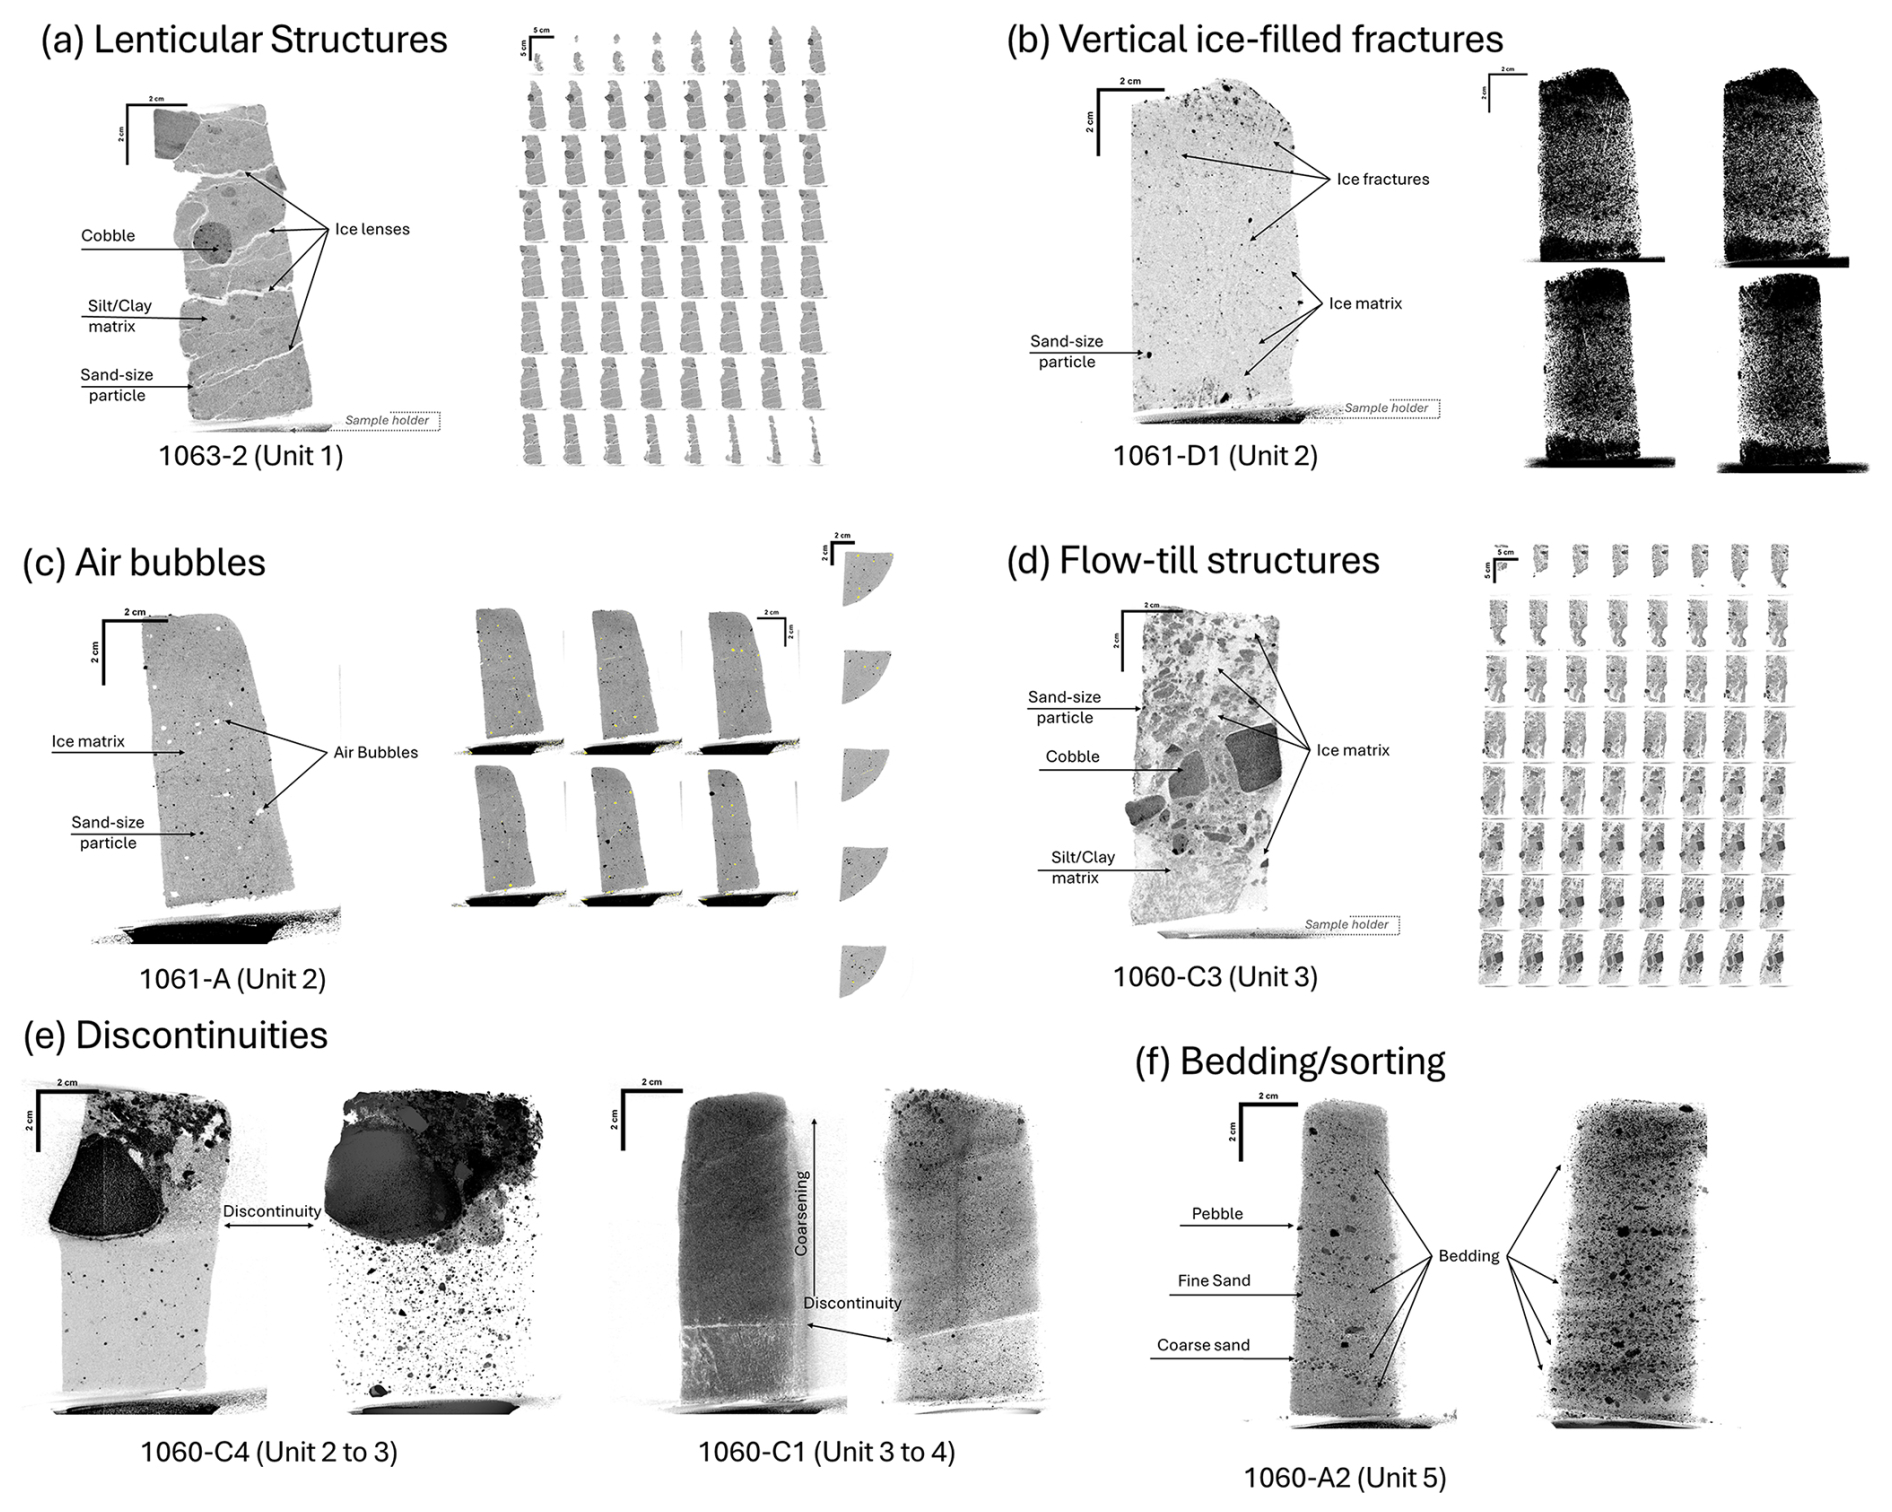
Figure 3Examples of characteristic features as observed by CT scan. (a) Example of sub-horizontal ice lenses in Unit 1, poorly sorted sediment. These lenses connect in a braided lenticular pattern in all Unit 1 samples. The ubiquity of these ice lenses is highlighted on the right montage as the lenses penetrate the entire sample. (b) Example of vertical ice-filled fracture in Unit 2. The right side of the image represents four different rotated views within a contrast-enhanced 3D reconstruction of the scan. Each view shows sub-vertical cracks at various angles within a matrix of sediment-rich ice. (c) Evidence of preserved air bubbles in Unit 2. The right side of the image represents six vertical slices and five horizontal slices through the sample with the air bubbles colored yellow for visualization. The slices used in visualization are regularly spaced through the sample. (d) Characteristics of Unit 3 sediments show a general lack of horizontal structure and poor sorting within an ice-rich layer. The apparent chaotic nature of the material in Unit 3 is suspected to be the result of a flow till event. (e) Evidence of discontinuity between units 2 and 3 (left) and 3 and 4 (right). The 2/3 discontinuity is marked by a change in ice content and sediment characteristics. The 3/4 discontinuity is marked by a change in layering and upward coarsening above the contact. (f) Evidence of sorted beds in Unit 5. Beds appear to be principally characterized by alternating beds of well-sorted fine and coarse sand.
The next 6.5 samples (1061-D2 to the lowest portion of 1060-C4) comprise Unit 2 (215–108.5 cm). They are characterized by low density (< 1.2 g cm−3) and high ice content (> 80 %; method described in Bierman et al., 2024a) with sediment interspersed throughout. The μCT scans show that sediment is generally fine-grained with few clasts and faint bedding tilted at an approximately 45° angle from horizontal. The tilted bedding is more apparent in some samples (1060-D2, 1061-D1, and 1060-C4). Vertical fractures filled with clear ice create intersecting planes in the sediment-laden ice (e.g., 1060-D1; Fig. 3b). Some samples also contain visible air bubbles (1061-C2, 1061-A, 1060-C5; Fig. 3c). The contact with the unit above (1060-C4) is a discontinuity marked by a sudden change in ice content (Fig. 3e).
Unit 3 (108.5–88.5 cm) is not stratified. The tops of sample 1060-C4 and sample 1060-C3 contain pebble-sized clasts in a silt-sized matrix with lower ice content (23 %) than other samples in Unit 3 (Bierman et al., 2024a). The presence of a large (3–4 cm in diameter) clast in 1060-C4 marks the transition from Unit 2 (Figs. 2 and 3d). As seen on the z slice of the CT scan, the contact between the clast and the ice-rich material below is characterized by a layer of cleaner ice close to the clast and a silty layer further away. It is unclear, though, if that structure developed syndepositionally or after deposition. Clast angularity ranges from sub-angular to sub-rounded. From the bottom of this unit (1060-C4) toward its transition to Unit 4 (1060-C1), the grain size appears to decrease. Sample 1060-C2 and the lower portion of 1060-C1 are characterized by the presence of a deformed fine-grained bedding with high ice content (49 %) (Bierman et al., 2024a). There is a very distinct unconformable contact in sample 1060-C1 (at an angle of 11°) with the upper sediments, distinguishable by μCT scans (Figs. 2 and 3e). Directly below the contact, bedding is nearly vertical and continues into 1060-C2 (Fig. 2b).
Both units above Unit 3 are similar in structure, containing well-sorted bedded fine sand (Figs. 2 and 3f). Unit 4 (88.5–55.5 cm) includes samples 1060-C1 (the part above the contact) and 1060-B (not scanned). Bedding in these samples is distinct, parallel, and sub-horizontal with a ∼ 15° dip. The well-sorted, fine-grained nature of the deposit defines this unit. Samples 1060-A2 to 1059-5 define Unit 5 (55.5–0 cm). These samples coarsen upward into gravelly sand from the fine-grained sands of Unit 4. Bedding is well defined in the lower samples in this unit (notably 1060-A2; Fig. 3f) and becomes harder to distinguish in the topmost sample scanned (1059-5). The layers also dip at 15°. There are some small pebble-sized clasts, which range from sub-rounded to sub-angular and form individual beds. Well-sorted, sand-sized grains that coarsen upward with well-formed bedding define the uppermost part of the core and the top of Unit 5 (Fig. 3).
4.2 X-ray diffraction
XRD analysis indicates little change in relative mineral abundance between units (Fig. 4, Table 2). Throughout the core, the mineralogy is dominated by quartz with lesser amounts of plagioclase and potassium feldspar (Table 2). The average quartz relative abundance is 63.6 % ± 3.9 % with a minimum of 49.6 % ± 0.7 % (1061-D5, Unit 1) and a maximum of 80.6 % ± 1.1 % (1061-A, Unit 2). We found plagioclase in all units with an average of 22.4 % ± 3.5 %, a minimum of 14.8 % ± 1.1 % (1061-A, Unit 2), and a maximum of 31.8 % ± 1.3 % (1060-A2, Unit 5). Potassium feldspar was detected in all samples except 1061-D5 (Unit 1); the average was 10.5 % ± 3.0 % with a minimum of 3.1 % ± 0.2 % (1060-C1, Unit 4) and a maximum of 19.4 % ± 0.8 % (1063-6, Unit 1). The relative amount of quartz increases from the bottom to the top of Unit 2, although we only have analyses of three samples. For all other units, the relative proportion of quartz compared to other minerals remains similar.
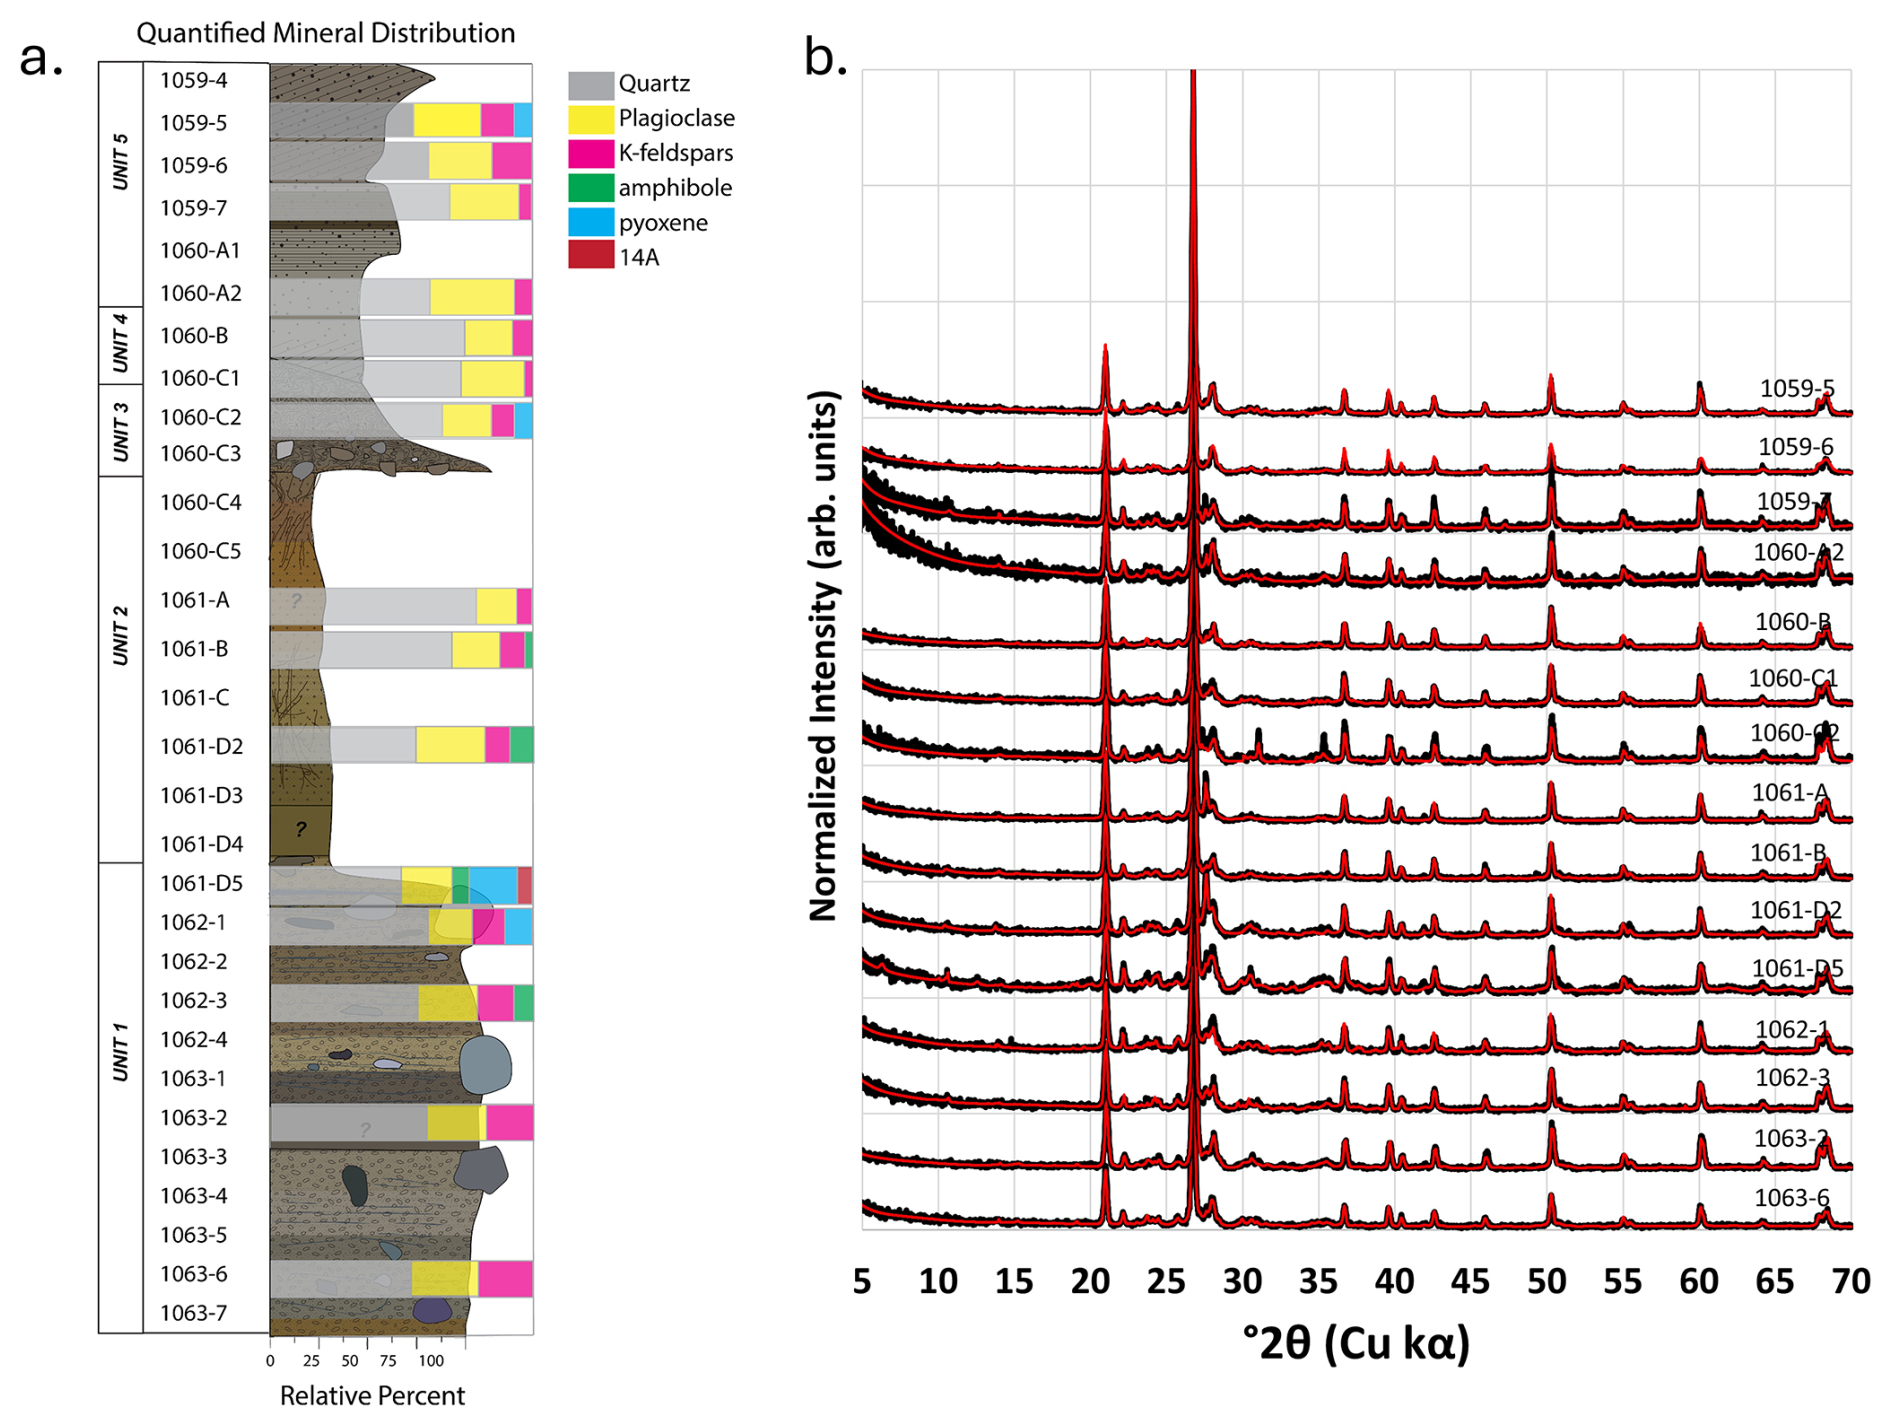
Figure 4(a) Relative mineral assemblage of 15 samples shown with corresponding color bars modeled using the Rietveld method (Rietveld, 1969). Stratigraphic column adapted from Bierman et al. (2024a). Results are given in Table 2. (b) Diffractograms of all 15 samples measured on the Rigaku MiniFlex II. Modeled diffractograms shown in red were calculated using the Rietveld algorithm included in PDXL-2: Integrated X-ray powder diffraction software. X-ray intensities are normalized to the quartz peak and are therefore represented in arbitrary units (arb. units). “14A” corresponds to a crystalline phase with a dominant 14A reflection, similar to clinochlore.
Table 2XRD quantification (in %) of bulk sediment from representative samples. Mineralogy reported by mineral group.
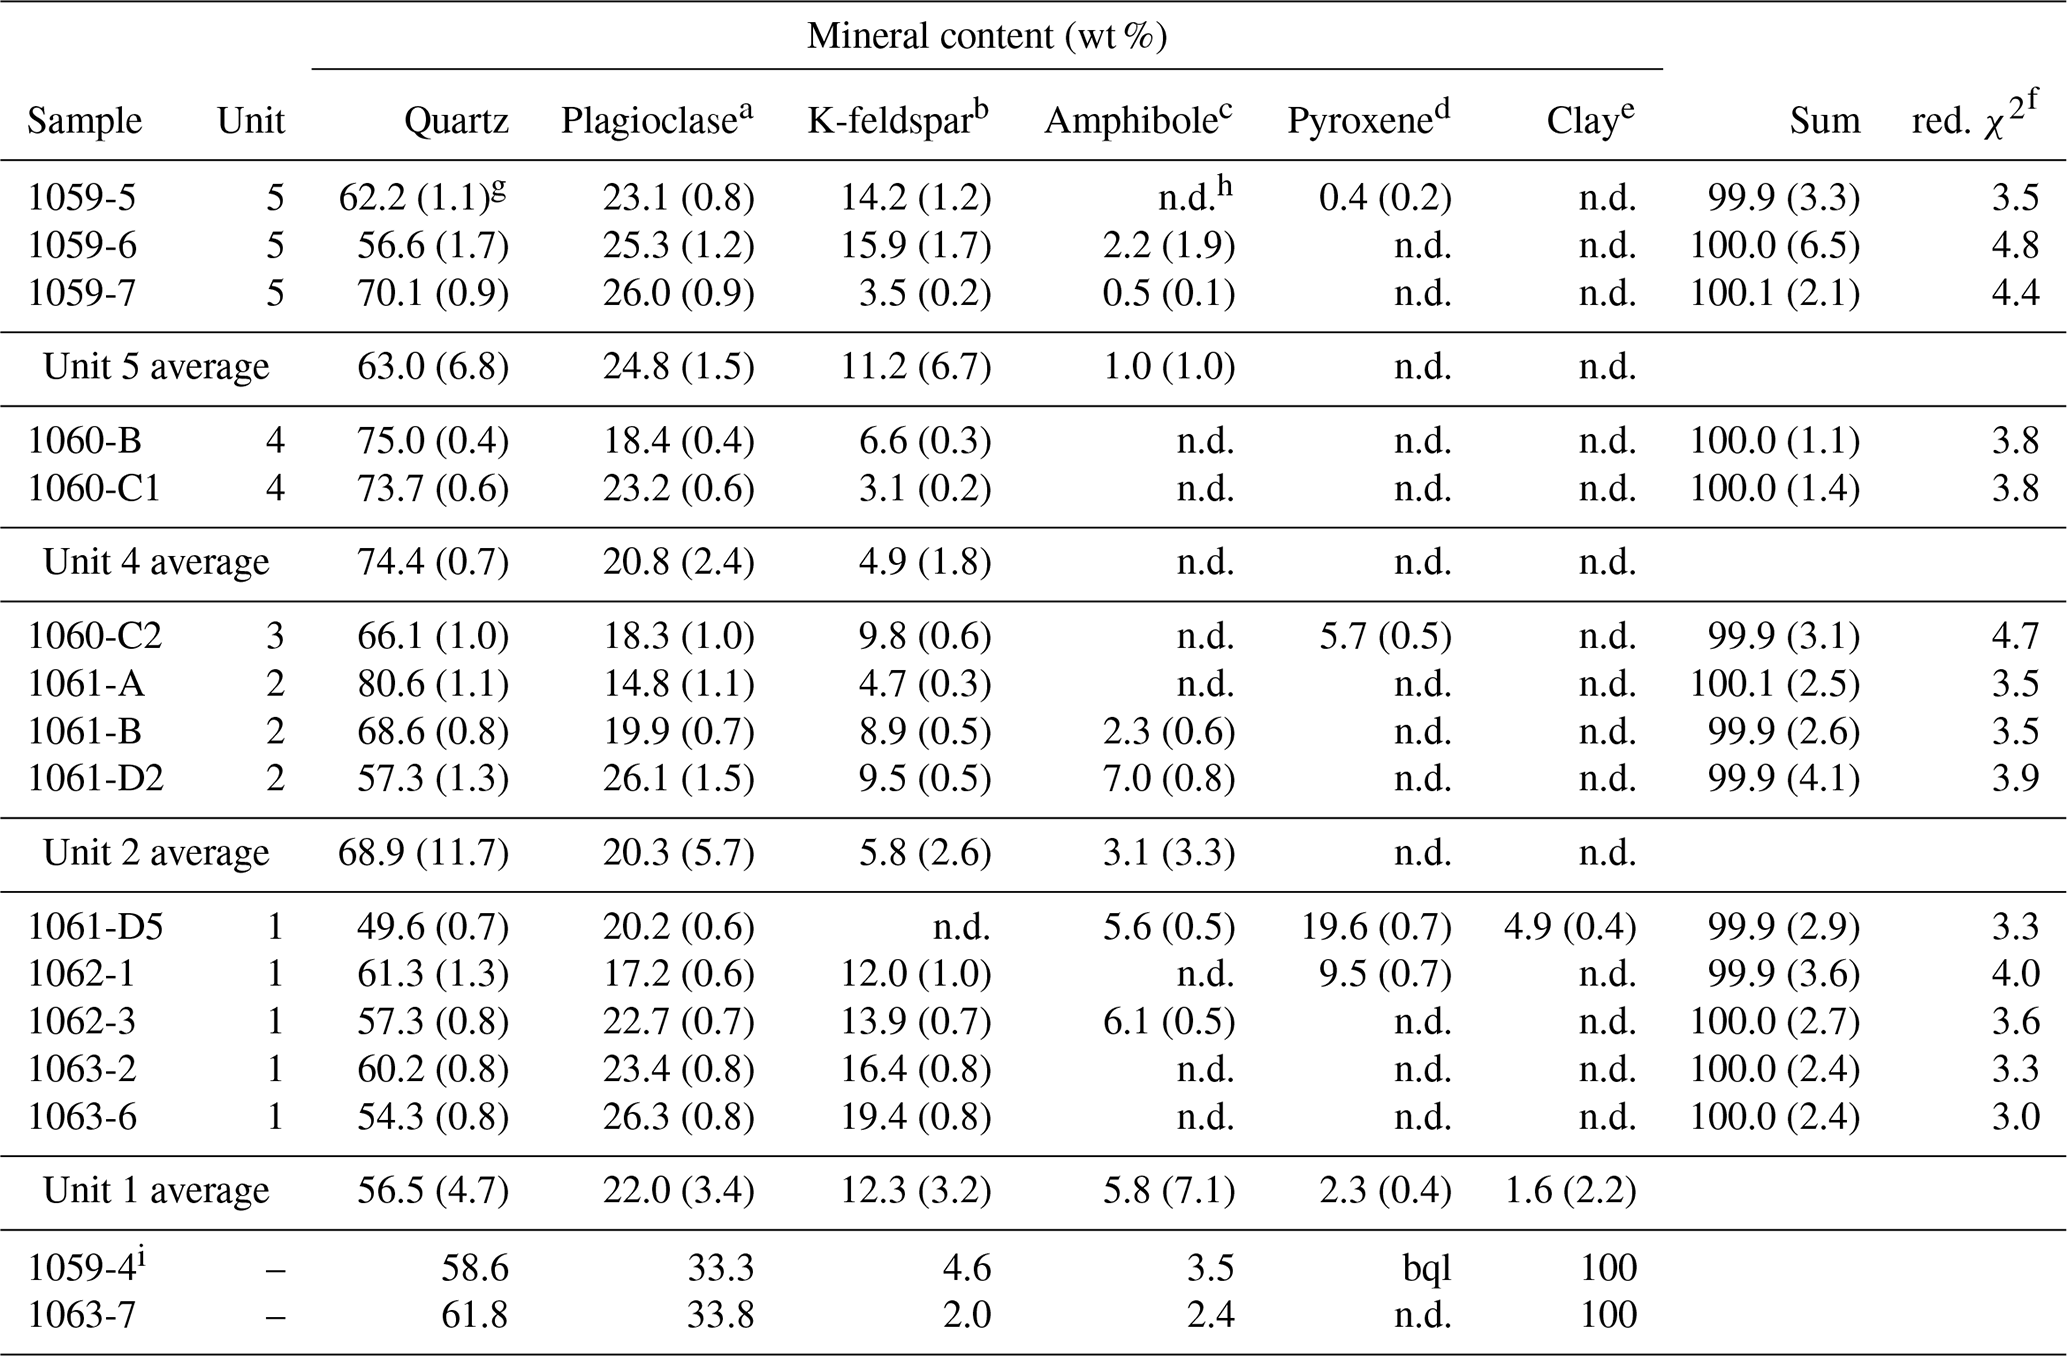
a Plagioclase includes all plagioclase detected (albite, oligoclase, andesine). b K-feldspar includes all K-feldspar detected (orthoclase, sanidine). c Amphibole includes all amphibole detected (cummingtonite, hornblende, ferrosilite). d Pyroxene includes all pyroxene detected (pigeonite). e Clay includes micas, kaolinite, and chlorite-like phases. f red. χ2 represents the goodness of fit and corresponds to , where I is the intensity, σ(Iobs) is the estimated error of the measure (fixed to 10 % of the counts), n is the number of points used for simulation, and p is the number of parameters estimated during the fit. g Error in parentheses is provided by PDXL and represents the standard error for individual phases. For averages, the error is 1 SD when n > 2 or as deviation from the mean when n = 2. h n.d. “not detected”. i Samples analyzed in Christ et al. (2021). Note that plagioclase and K-feldspars were summed as feldspar; no error or goodness of fit was provided. bql stands for below quantification limit, as clay minerals were detected in 1059-4 but not quantified.
4.3 Scanning electron microscopy imaging and energy dispersive X-ray micro-mapping
Fine-grained particles (section area < 2500 µm2) in plan-view (corresponding to a 60 µm circular equivalent diameter) are present in all samples, though the range of grain sizes differs per sample (Fig. 5a). Samples 1060-B and 1061-C contain 99.3 % to 90.3 % of particles with an area less than 2500 µm2, respectively. Samples 1059-6, 1060-C3, 1061-D3, and 1063-6 have on average 58 % ± 64 % fines (area < 2500 µm2), and 1060-A1, 1060-C1, and 1062-4 have an average of 19.5 % ± 2.3 % fines. Samples 1059-6, 1060-A1, and 1062-4 show a much wider distribution of grain sizes (Fig. 5a). Pair-wise statistical analysis of grain size distribution finds three sample groups different from each other by particle size: (A) 1059-6, 1060-A1, and 1061-D3; (D) 1060-B, 1061-C, and 1063-6; and (B) 1062-4.
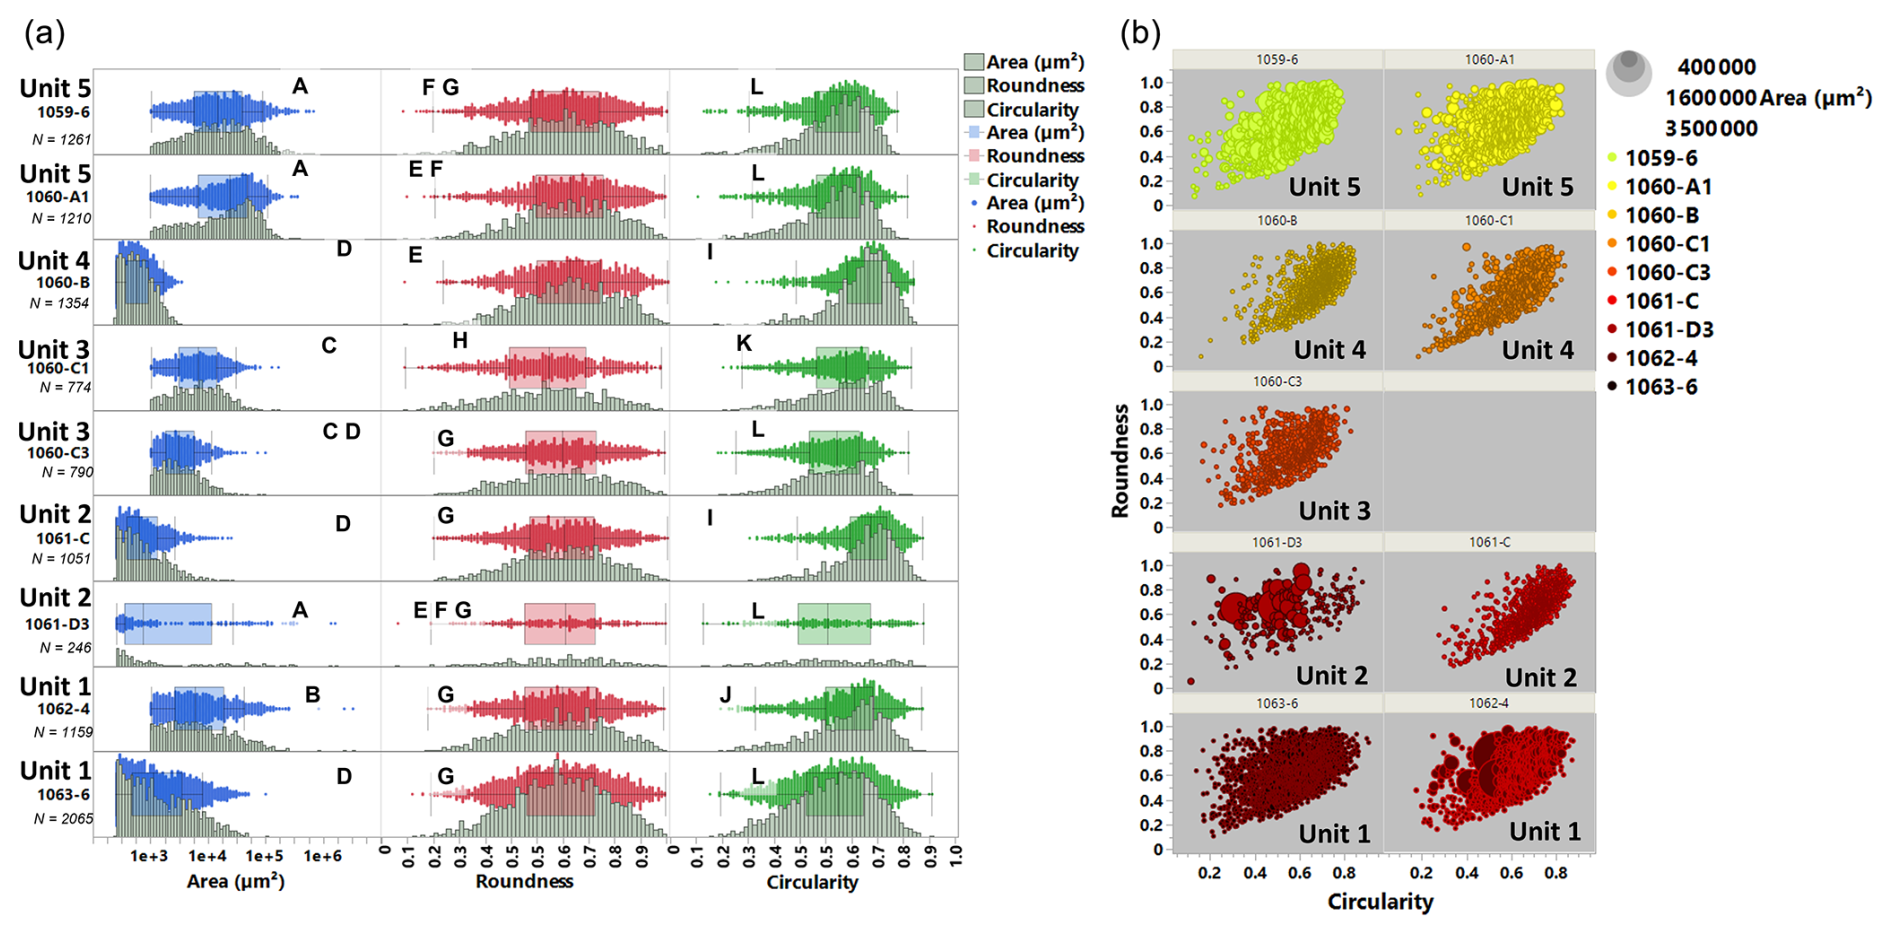
Figure 5Grain size and shape parameters extracted from low-magnification SEM backscattered images of selected core samples. (a) Distribution of grain size (area), roundness, and circularity for individual samples; N is number of particles examined. For simplification, the area is represented in log scale. Roundness and circularity parameters are defined in Sect. 3.4. The letters refer to the pairwise significance of means (described in Sect. 3.4). Samples assigned the same letters do not show a significant difference, and samples that do not share the same letter are significantly different. (b) Relationship between particle size, circularity, and roundness for selected individual samples. The size of each individual circle represents the relative area of individual grains.
Roundness has a mean value of 0.62 ± 0.01, with a maximum mean value of 0.65 ± 0.01 (1060-B) and a minimum mean value of 0.58 ± 0.01 (1060-C1), indicative of moderate roundness. While all distributions of roundness are symmetric and unimodal, Tukey–Kramer mean comparison tests show that the grains in sample 1060-C1 (H) are significantly different from those in other samples and that the grains in sample 1060-B are also significantly different from those in six of the nine samples (Fig. 5).
Circularity is consistently left-skewed and biased towards higher circularity values; all samples fail the Anderson–Darling test for normality. A Tukey–Kramer test splits the data into four distinct groups: (I) 1060-B and 1061-C; (J) 1062-4; (K) 1060-C1; and (L) 1059-6, 1060-A1, 1060-C3, 1061-D3, and 1063-6. These groups separate similarly to the grain size distribution except for sample 1060-C3. Comparing size, roundness, and circularity, larger grains tend to have a lower circularity and higher roundness (based on a significant negative and positive Pearson coefficient, respectively) (Fig. 5b).
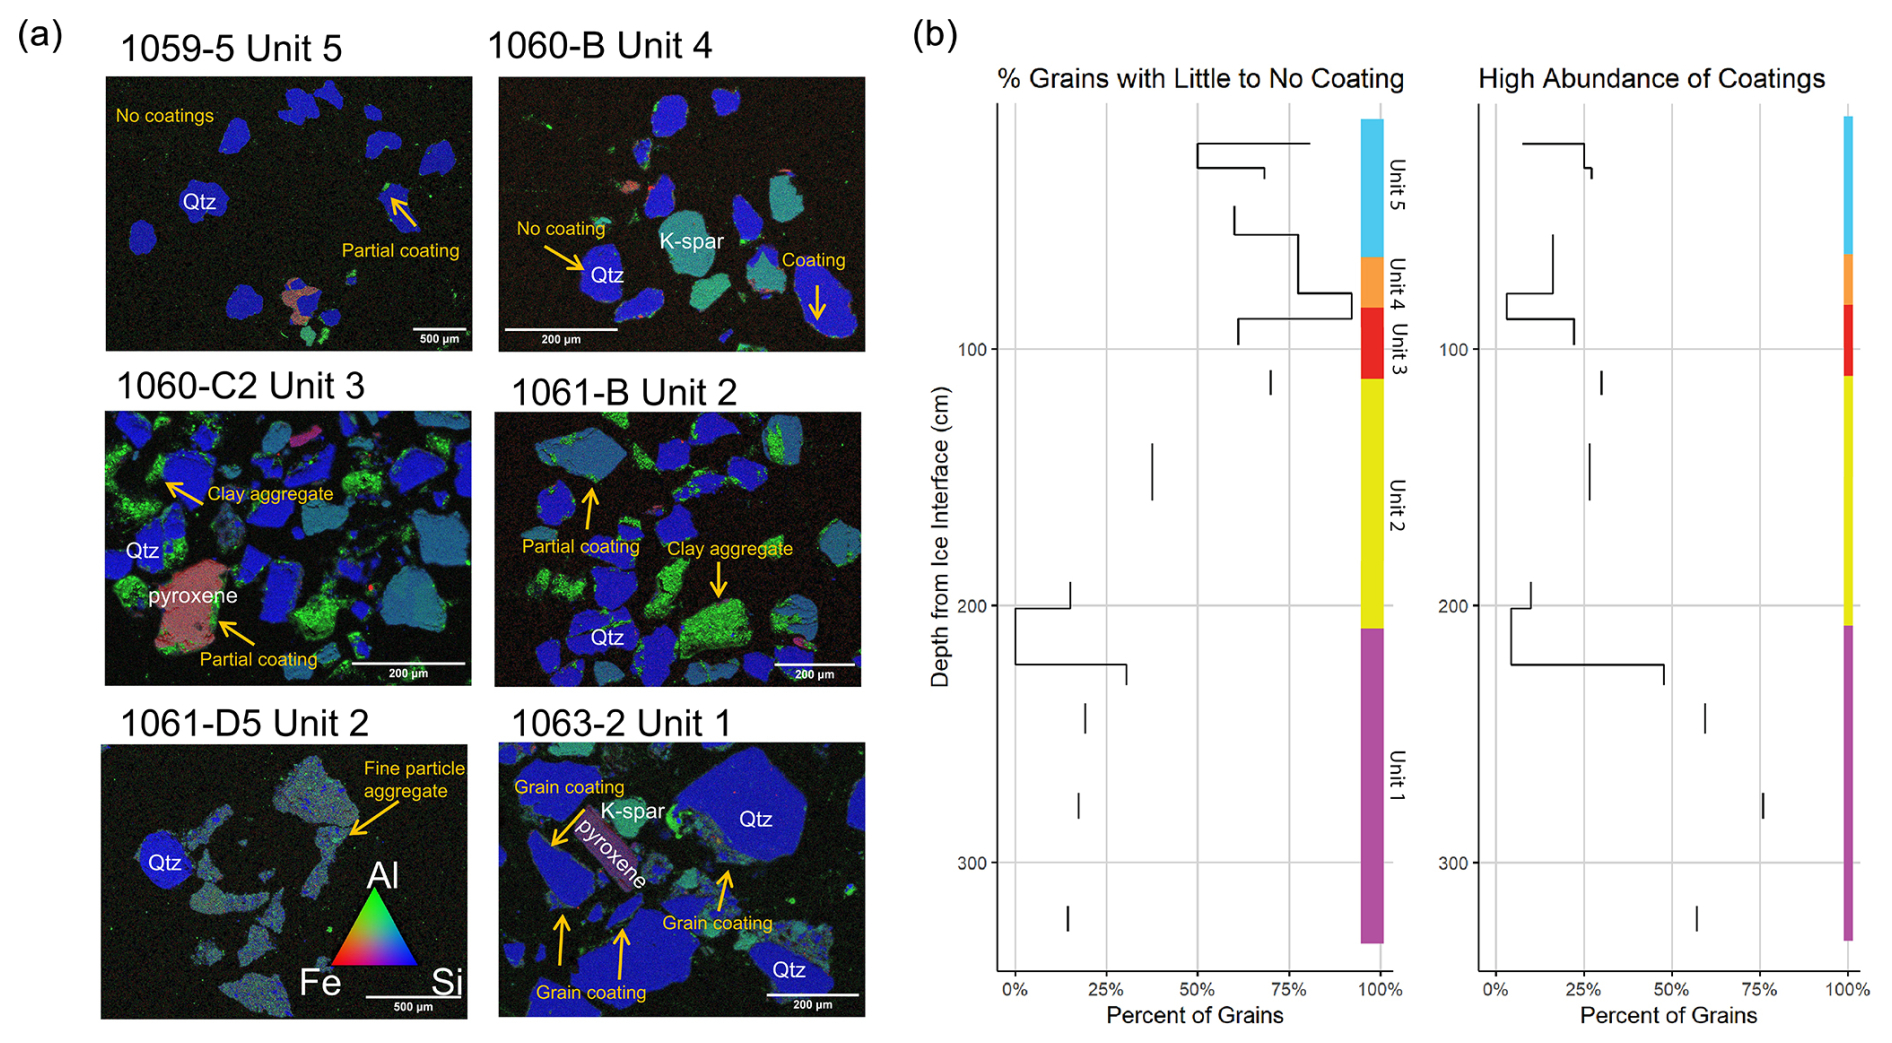
Figure 6(a) Scanning electron microscopy images showing mineral type and observed coatings. Blue indicates high silicon content (quartz), green is associated with aluminum (clays and feldspars), and red is associated with iron. (b) Abundance of grain coatings downcore showing percentage of grains with little to no coating and percentage of grains with a high abundance of coatings (dominated and moderate categories combined). The colored bar shows unit assignments with depth.
Elemental mapping analysis of SEM images by EDS reveals strong patterns between grain coatings and core depth. Grain coatings and fine-particle aggregates are most abundant in Unit 1 and are present in all Unit 1 samples (Fig. 6a, b), where they are composed of either individual clay minerals (Al-rich) or fine polymineralic fine aggregates (Si- and Al-rich). Unit 2 has a mix of fine-particle aggregates, grain coatings, and clay aggregates, but not all grains have coatings, and others are partially coated (Fig. 6a). In this unit, the coatings and aggregates are dominated by Al-rich, clay-like minerals. Unit 3 has clay aggregates and grains that are partially coated (Fig. 6a). Units 4 and 5 have fewer grains with coatings than the other units.
Mapping Si, Fe, and Al allows us to identify quartz (high Si), feldspar and clay (high Al), and Ca–Fe–Mg-rich pyroxene and amphibole (high Fe) (Fig. 6a). Quartz and feldspar, including plagioclase, dominate all samples. There is a positive correlation (correlation coefficient, 0.7) between the “high-abundance” grain coating category (grains with more than 25 % of grain coating around their perimeter) and core depth (Fig. 6b). Tukey–Kramer comparison by “high abundance” and unit reveals that Unit 1 is different from all other units and that Unit 3 has similarities with Unit 1 and all other units.
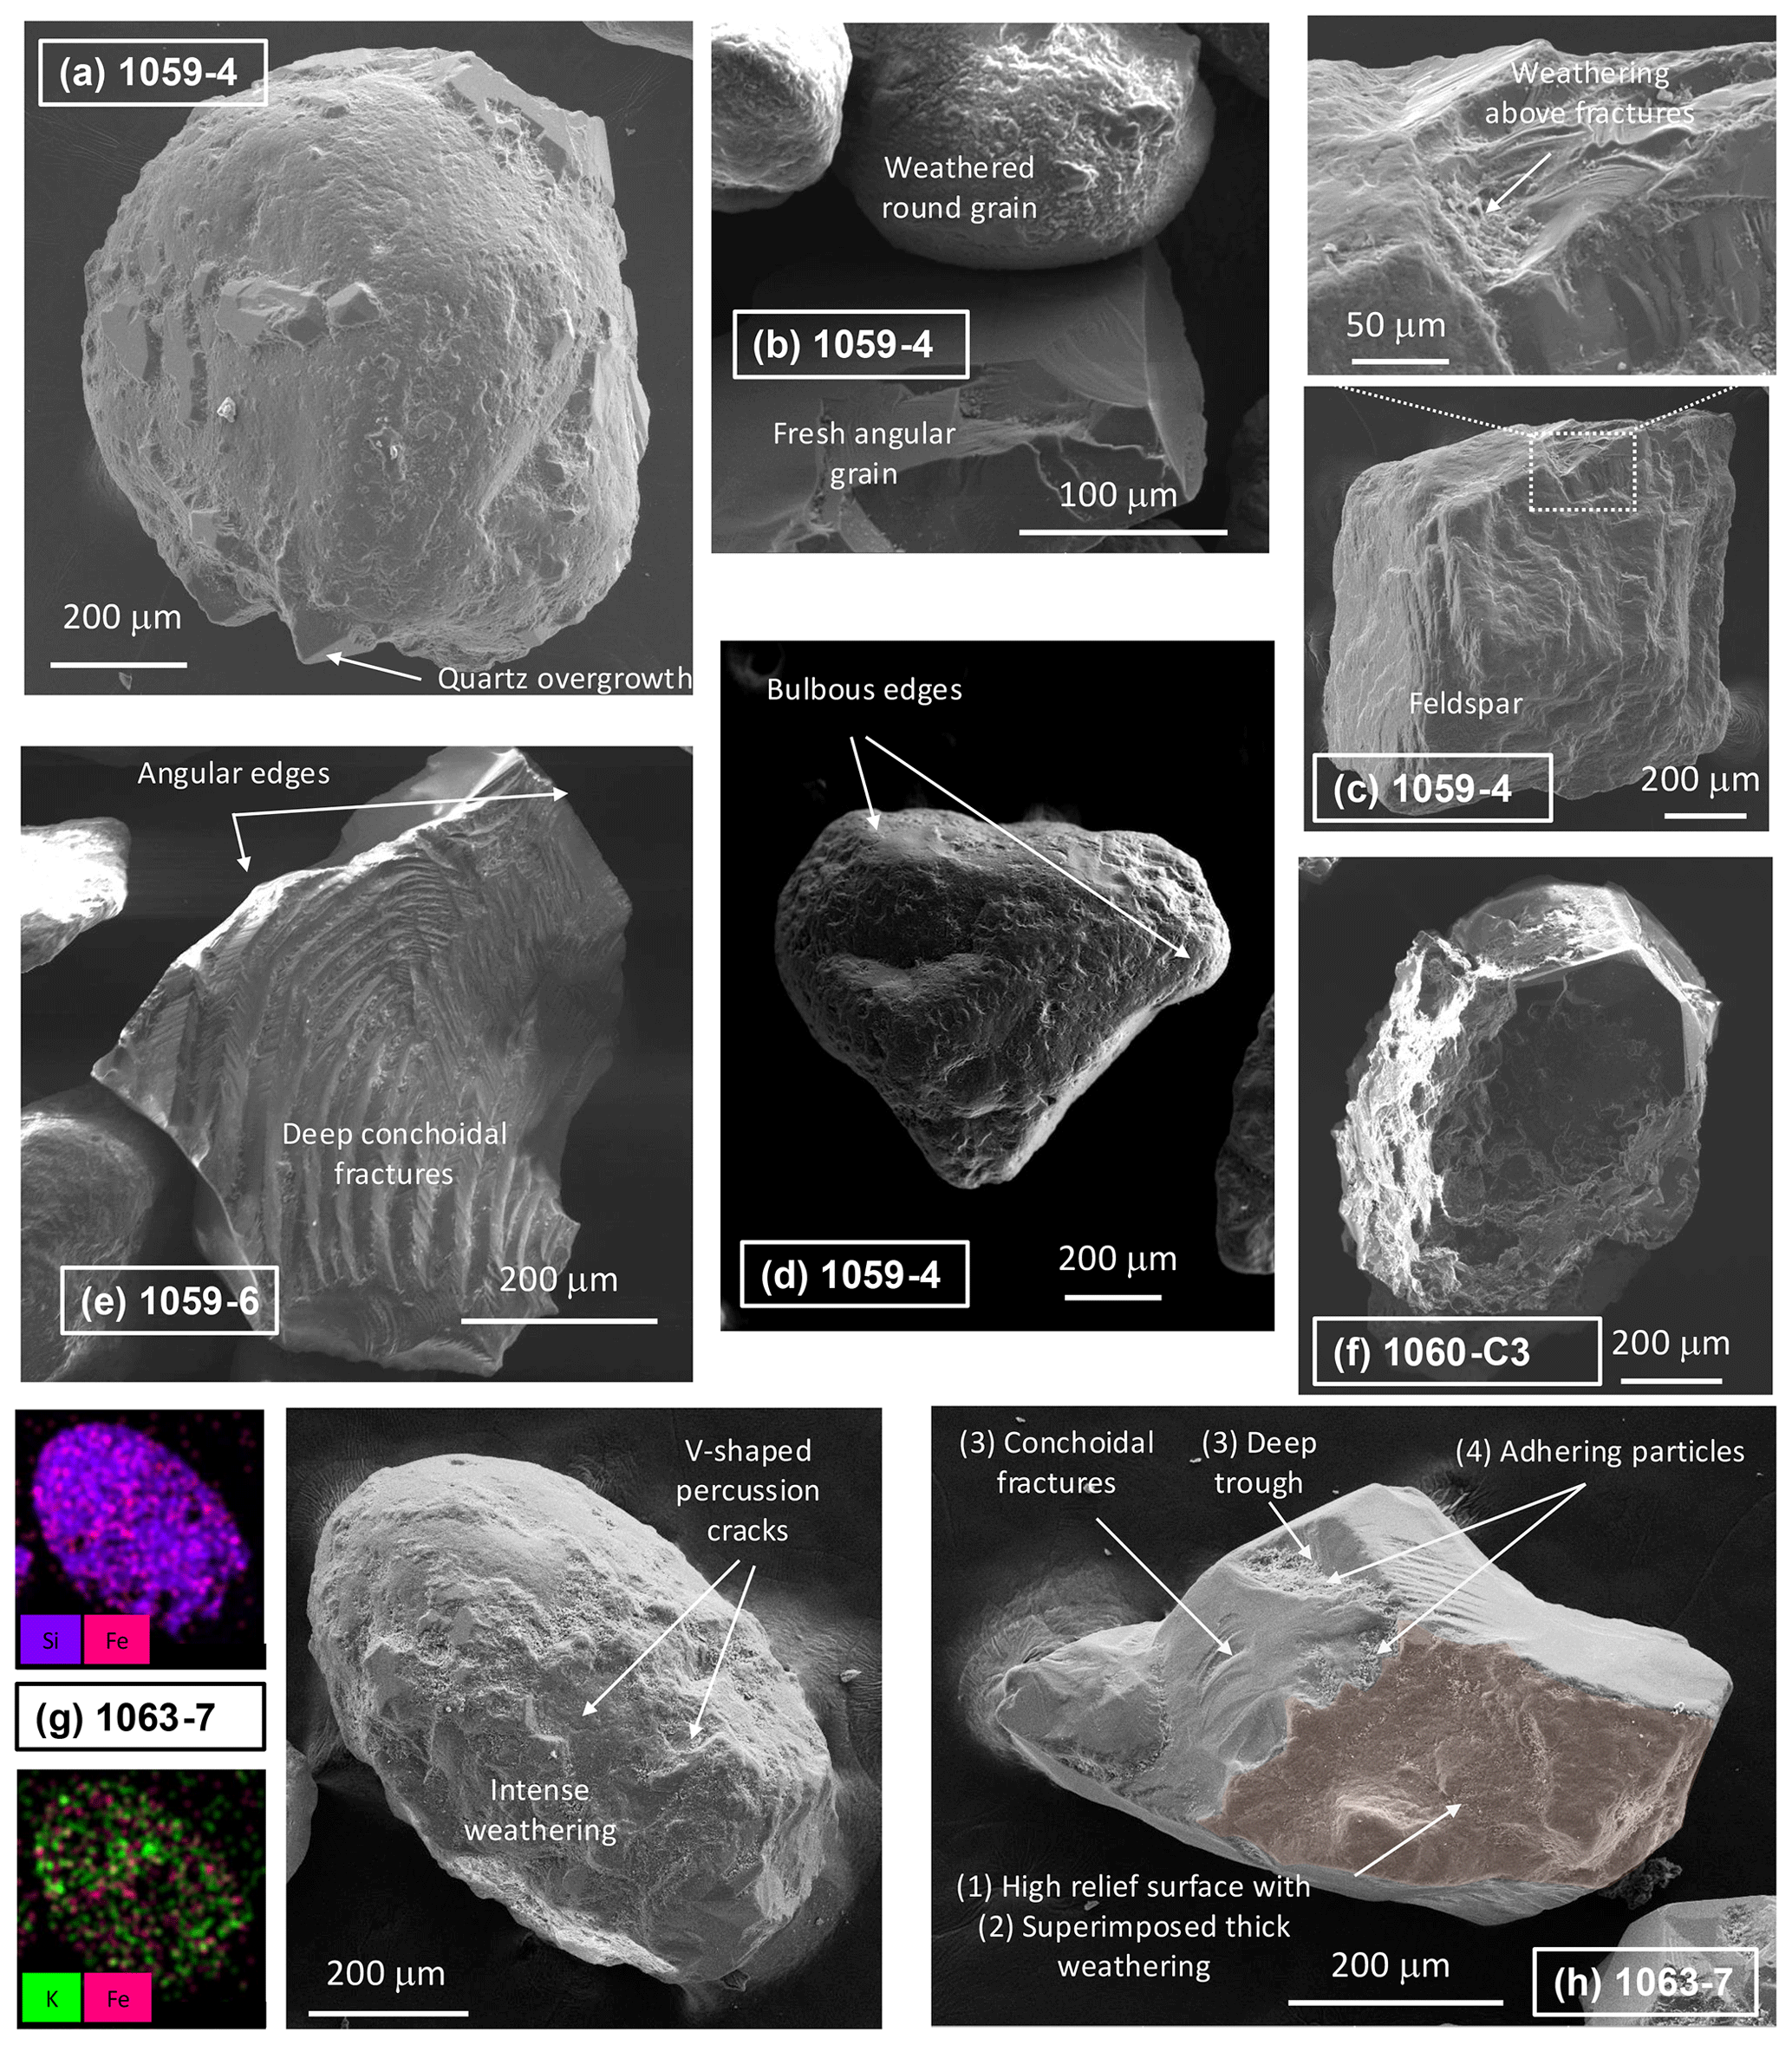
Figure 7SEM imagery from samples of Camp Century grains. (a) 1059-4: round quartz grain with deep grooves, multiple V-shaped percussion cracks, and quartz overgrowth; the latter appears younger. Water transport followed by minor eolian action. (b) 1059-4: upper grain is rounded quartz with significant weathering and solution pits. Lower grain is a fresh angular quartz grain, with features consistent with glacial crushing and adhered fine-grained particles. (c) 1059-4: K-feldspar angular grain with weathered surfaces. Top detail shows weathering features superimposed on pre-existing fresh fractures. (d) 1059-4: sub-angular quartz grain with multiple percussion cracks and bulbous edges. (e) 1059-6: angular quartz grain with two generations of conchoidal fractures, which are older on the top left, top right, and bottom and are fresher in the center. (f) 1060-C3: sub-rounded quartz grain with weathering dissolution features and quartz overgrowths. (g) 1063-7: oblong quartz grain with remnant V-shaped cracks, significant weathering/coating features, and fresher surfaces. Backscattered electron analysis shows the presence of Fe and K in the thick micrometric coating. (h) 1063-7: angular quartz grain with (1) an initial high-relief surface affected by (2) a thick weathering rind, then later (3) deep trough and conchoidal fractures covered by (4) adhering particles.
Grain surfaces display a variety of micro-textures. High-resolution SEM morphometric imagery of individual grains reveals that most quartz and feldspar grains have a variety of shapes, with two main endmembers: fresh angular grains with high relief; round and oblong grains. Some grains have intermediate shapes between these endmembers (Fig. 7). Round and nearly round grains are rarely pristine and display superimposition of different textures. We find that a considerable number of grains display high-relief features, including deep troughs, sharp angles, conchoidal fractures, and adhering particles (Fig. 7b: 1059-4; Fig. 7e: 1059-6; Fig. 7h: 1063-7). Some grains show V-shaped percussion cracks (Fig. 7a: 1059-4, Fig. 7g: 1063-7), and a few grains display bulbous edges (Fig. 7d: 1059-4). Many grains display dissolution pits (Fig. 7f: 1060-C3), multi-micron-thick coatings containing K and Fe (Fig. 7g: 1063-7; Fig. 7h: 1063-7), and quartz overgrowths (Fig. 7a: 1059-4; Fig. 7f: 1060-C3). We found that grains from most sedimentary units were homogeneous in terms of shape and texture, except for samples from Unit 1 that displayed more abundant weathering features than other units, in agreement with other SEM observations from polished grains (Fig. 6).
4.4 PCA and k-means clustering
k-means clustering analysis shows that optimal clustering occurs with five clusters (Fig. 8a, b). There are similarities with this clustering and our unit assignments based on physical stratigraphic observations; most notably, Unit 1 samples are clustered tightly together. There is a mixing of samples from units 3, 4, and 5 across clusters B and C. Unit 2 has samples within three different clusters: A, B, and D (Fig. 8b).
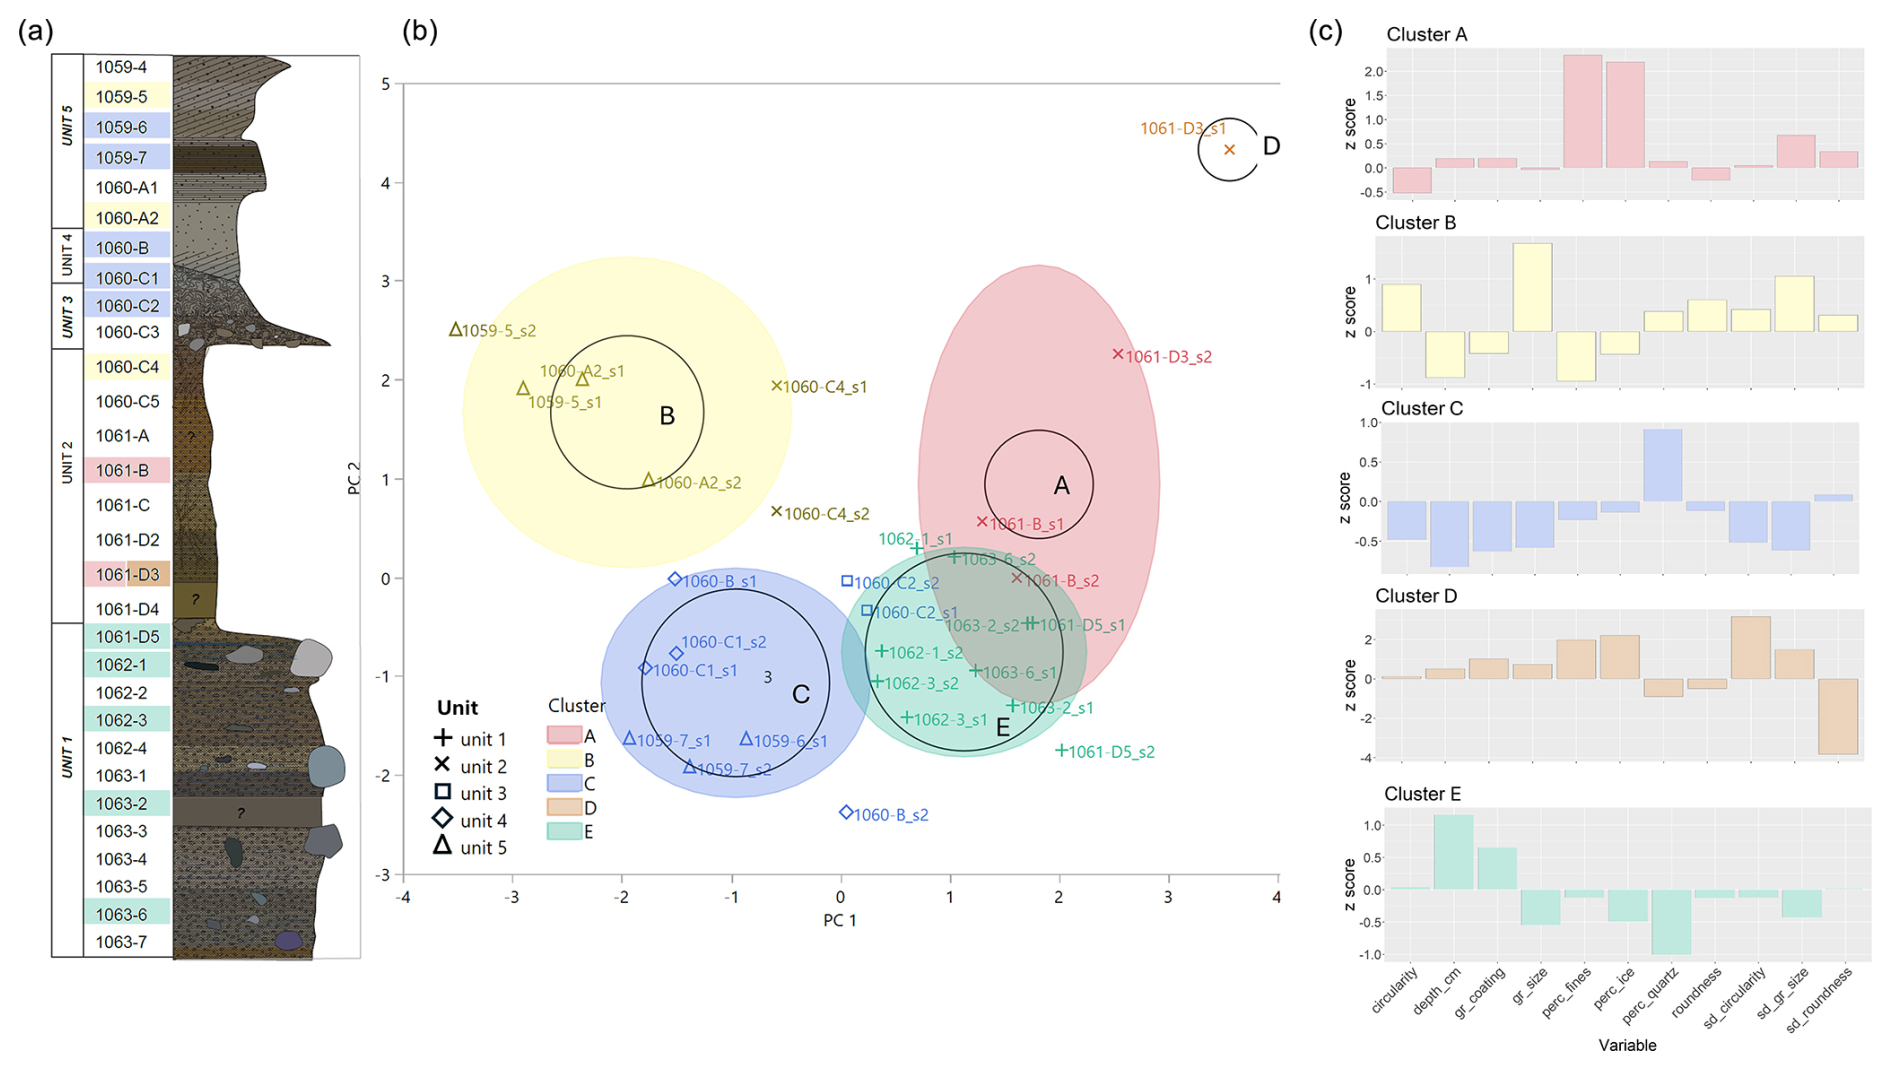
Figure 8(a) Stratigraphic column with samples highlighted according to the k-means clustering. (b) k-means clustering analysis on multiscale physical, mineralogical, and geochemical data. The data are plotted showing the first two principal components (PC 1 and 2) and are categorized into five clusters; clusters are color-coded and assigned a letter. Unit assignments are indicated by shape. (c) Z scores of each cluster are shown and indicate how many standard deviations (y axis) the mean of each variable in the cluster differs from the observed mean across all data. All z-score graphs have the same x-axis variables in the same order as shown with the Cluster E graph. The variables measured are circularity, depth_cm (depth from ice interface in centimeters), gr_coating (nominal evaluation of presence of grain coating), gr_size (grain size by area), perc_fines (percent fine-grained material), perc_quartz (percent quartz), roundness, SD_circularity (standard deviation of circularity measurement), SD_gr_size (standard deviation of grain size measurement), and SD_roundness (standard deviation of roundness measurement).
Significant variables associated with PC1 include depth, percent quartz, grain coating, and percent fines. As depth is relevant in stratigraphy and interpretations of stratigraphic deposits, we elected to retain depth as a variable to include as much information as possible in the algorithm. This principal component can be summarized as relating to transport processes, as percent fines and percent quartz often reflect sorting that occurs during transport, and grain coatings are stripped in part or entirely during transport processes. Significant variables associated with PC2 are grain size, standard deviation of grain size, standard deviation of circularity, and circularity to a lesser extent. This component represents aspects of grain morphology. According to PC1, transport process, there is a larger separation between clusters A and B than there is between clusters E and C (Fig. 8b). Along PC2, clusters A and B are separated from clusters C and E. Cluster D contains one sample belonging to Unit 2 (1061-D3), and it is positioned at extreme ends of both principal components, showing there is a strong difference between this sample and the rest of the data. The other observation associated with sample 1061-D3 (as two images were analyzed for this sample) is assigned to Cluster A but is positioned at high ends of both axes, as is the same for Cluster D.
The z scores help us interpret which variables are responsible for placing samples into a particular cluster and provide insight into why there may be disagreements between our unit assignments and the clusters (Fig. 8b, c). Z scores for Cluster A, made up of Unit 2 samples, show the most significant factors are percent fines and percent ice with positive z scores of 2.3 and 2.2, respectively (indicating the number of standard deviations that values for these variables are from the population mean in this cluster) (Fig. 8c). This means Cluster A samples (Unit 2) have more fine-grained particles and more ice on average than other samples. Cluster B samples (mainly Unit 5) have larger grain size with slightly more size variation and slightly higher values of circularity on average (grain size z score = 1.7, SD grain size z score = 1.1, and circularity z score = 0.9). Samples in Cluster C (units 3, 4, and 5) can be most succinctly described as having more quartz than samples in other clusters (percent quartz z score = 0.9). Cluster D (1061-D3, Unit 2) is quite different from the other clusters, as it has the largest z scores. This sample has low variability in rounding and high variability in circularity with high ice content (SD roundness z score = −3.8, SD circularity z score = 3.2, and percent ice z score = 2.2). Lastly, Cluster E (Unit 1) z scores show these samples are at a greater depth and have less quartz on average (depth z score = 1.2, percent quartz z score = −1).
The geochemical and physical analyses we have made of the sub-ice material indicate that cores taken from the bed of ice sheets have the potential to provide unique insight into past conditions extending deeper in time than records preserved in the glacial ice above. As Earth's average temperature rises quickly, such data are increasingly important because they are useful for understanding how ice sheets behaved in the past as climate changed (Gemery and López-Quirós, 2024).
5.1 Subglacial core stratigraphy: synthesis of physical, chemical, and mineralogic observations
The combination of geochemical, mineralogical, and physical data collected from the Camp Century subglacial materials across different spatial scales characterizes in detail five distinct stratigraphic units building on and refining the prior work of others (Bierman et al., 2024a; Christ et al., 2021, 2023; Harwood, 1986; Whalley and Langway, 1980). From these data, we infer that different surface processes deposited these materials during times when the land beneath Camp Century was glaciated and when it was not.
Our data demonstrate that, after deposition, Unit 1 was affected by weathering processes near Earth's surface. The unit has abundant grain coatings (Fig. 6b) formed by percolating liquid water during at least one interglacial period (Marschalek et al., 2024). Warm conditions facilitated the accumulation of grain coatings on the sediment grains before subsequent cooling occurred, burying Unit 1 beneath ice. The formation of permafrost halted the formation of grain coatings but preserved those already present in the sediment. The sub-horizontal, braided, lenticular cryostructures, consistent with syngenetic permafrost formation (French and Shur, 2010), suggest little influence of liquid water in Unit 1 after permafrost formation. However, without dating or contextual evidence, we cannot rule out that they developed in a subglacial setting or that cracking could have been related to stresses induced by overlying ice.
Unit 2, between units 1 and 3, marks a stark transition from the sediment-dominated till to an ice matrix with dispersed sediment. The sediment content of Unit 2 and the horizontal alignment of grains seen in samples 1061-D2, 1061-D1, and 1060-C are typical of BIL (Knight, 1997). The source of the sediment interspersed in the ice is likely the till below (Unit 1) because they share similar mineralogy (presence of pyroxene) and fine-particle aggregates, possibly glacial flour (Gresina et al., 2023; Knight, 1997). Other possible origins of Unit 2 include interglacial firn or basal ice from a later ice advance, which both allow deep weathering of Unit 1 (Hambreky et al., 1999).
The transition between Unit 2 and 3 occurs as a discontinuity marked by the presence of a cobble (ca. 3–4 cm in diameter) and pebbles. The position of both suggests gravitational deposition on top of a “soft” ice layer, as the cobble is lower than the pebble material. From the bottom of Unit 3 (1060-C4) toward its transition to Unit 4 (1060-C1), grain size decreases and no clear ice structure (layering or lenses) is visible. These observations imply that the deposition of Unit 3 occurred via mass movement in the presence of liquid water, depositing diamicton above Unit 2 before both froze (Brevik and Reid, 2000). The mechanism causing mass movement is unknown; it could be due to undercutting from a small stream or erosion of permafrost polygons.
The normal grading of Unit 3 likely resulted from sorting as the sediments flowed down gradient, which has been noted by others in flow till deposits (Brevik and Reid, 2000). The top of Unit 3 has distinct layering and an absence of large clasts which distinguishes it from the lower section of the unit. The layering in sample 1060-C2 and under the contact in 1060-C1 could be a marker of multiple flows or sorting within one flow (Fig. 2b). The lack of coarse clasts in the upper part of Unit 3 may reflect limited flow capacity capable of moving only smaller particles during these later flow events or of a change in source (Brevik and Reid, 2000). The paucity of grain coatings in Unit 3 compared to Unit 1 (Fig. 6) could indicate that mass movement disrupted grain coatings or mixed sediment from Unit 1 with sediment from the upper units, 4 and 5. In the absence of grain orientation and with the limited lateral context and size of the cores, other genetic origins for Unit 3 cannot be discarded, such as partial melt and reworking of nearby till by stream currents or the collapse of a subglacial stream bank. The presence of organic remains in all samples (Christ et al., 2023) indicates that at least some material in Unit 3 was sourced subaerially.
Unit 1, till, and Unit 3 (a mass movement deposit) have similar mineralogy and some similar characteristics in the μCT scans (Fig. 2). These similarities are seen in sample 1060-C3, the bottom of Unit 3, which is characterized by variably sized clasts in a fine-grained matrix with no evidence of bedding. The higher ice content and the difference in cryostructures between units 1 and 3 supports the hypothesis that Unit 3 was deposited in or by liquid water (Larson et al., 2016; Menzies and Reitner, 2016). The presence of Ca–Fe–Mg pyroxene in both Unit 1 and Unit 3 suggests that Unit 3 was derived from material compositionally similar to Unit 1. Pyroxenes readily weather from sediments (Goldich, 1938), so their inclusion in a sediment with high quartz content could reflect the source rock composition, limited weathering, or mixing with localized sources of different mineralogy. Overall, similar sedimentary structures and mineralogy suggest that Unit 3 was originally a part of the subglacial till (Unit 1) that was subject to mass movement resulting from saturation by liquid water during interglacial conditions. Micro-texture analysis (Fig. 7) from Unit 1 suggests the same succession of events deduced from meso- and macro-observations: initial glaciation and till deposition, then ice-free conditions allowing weathering and the development of grain coatings.
In units 4 and 5, sorting, minimal grain coatings, and the presence of bedding are indicative of fluvial sediment transport sufficient to abrade grain coatings followed by deposition from moving water (Fig. 2). Multiple lines of evidence suggest that sediment in units 4 and 5 was derived from the erosion of Unit 1 (glacial till) and transported by moving water. Grain textures shown in SEM imagery (Fig. 7) show that units 4 and 5 contain many grains with fresh surfaces, glacial crushing features, and sharp angles. This suggests that they originate from a proximal source of glacial sediment and were not transported over a long distance, probably less than a few kilometers (Mahaney, 2002). The fluvial system initially transported very fine grained sand (Unit 4) followed by larger grains representing an increase in system energy or a different sediment source (Unit 5). Grain morphology in these units is a mix of round and angular grains, with minimal change from Unit 4 to Unit 5 (Fig. 5).
Most of the more rounded grains in units 4 and 5 display significant weathering features and glacial crushing, implying that their oblong and round shapes were probably inherited from previous ice-free cycles (pre-Pleistocene sandstone deposits are observed in northern Greenland; Gregersen et al., 2022). Hence, fluvial transport may not be the only cause of grain rounding (Kuenen, 1959). Unique to units 4 and 5 are grains with coatings only in cracks or concave structures that protected the coatings from abrasion during transport, preserving evidence of past weathering (Fig. 6). This implies that these sediments originally had more substantial grain coatings that were stripped during fluvial transport – consistent with geochronologic data showing that minerals in Unit 1 and Unit 5 have similar cooling ages (Christ et al., 2023).
The lack of heavy minerals in the fluvial sediments could reflect hydraulic sorting, with the result that denser minerals, including pyroxene and amphibole, were deposited elsewhere, perhaps with larger grain size fractions (Malusà et al., 2016). This would explain the lack of heavy minerals in the finer grain size fraction (Unit 4) and the presence of pyroxene at the top of Unit 5 where coarser grain sizes are more common (Garzanti, 2017; Malusà et al., 2016).
Statistical analysis (PCA and k-means; Fig. 8) clearly separates materials based on glacial and non-glacial origin. PC1, relating to transport processes, separates the data between glacially influenced units 1 and 2 and fluvially driven processes characteristic of units 3, 4, and 5. Unit 3 samples overlap with Cluster E (Unit 1), which supports our interpretation that these two units both originate from the same till. PC2, relating to grain morphology, does not show any distinct trends relating to our unit assignments (Fig. 8). The grain morphology analysis shows a similar complexity (Fig. 5), which indicates intra-unit variability not seen on the meso- or macroscale.
Unit 2 is the most scattered across the PCA, which suggests that it has a different and more complex history and/or formation process. The SEM data for Unit 2 echo this complexity, as it has the most intra-unit variability. Despite the variation within the unit, some samples closely resemble other units at the microscale. Sample 1060-C4, at the top of Unit 2, is most similar to samples from Unit 5, as it has minimal grain coatings and above-average grain size (Fig. 6c). Conversely, sample 1061-B, near the middle of Unit 2, has aluminum-rich clay coatings which are also present in samples from Unit 3. On the PCA, 1061-B samples are situated near samples for units 1 and 3, corroborating the similarities seen at the microscale. Samples closer to the contact with Unit 1 (1061-D3) are characterized by small particle aggregates that are unique to this section of core. The 1061-D3 samples plot at the high end of PC 1 and 2, emphasizing their distinction from other parts of the core (Fig. 8b).
The spread of data from Unit 2 could be an indication of environmental changes represented by this ice unit or of mixing between units above and below (units 1 and 3). For example, we have characterized units 5 and 3 as having quite different transport mechanisms, and diagnostic characteristics of both these units are present in Unit 2. The inclusion of particles with characteristics like those in other units could imply that the changes seen throughout Unit 2 indicate variability in the source of particles and the mechanism of particle inclusion in the ice.
5.2 Proposed sequence of environmental changes at Camp Century
Camp Century subglacial materials preserve a sedimentary record of changing surface and subglacial processes. From our multiscale investigation of these materials, we present a sequence of ice retreat and advance events consistent with evidence including documented surface exposure during MIS 11 (Fig. 9) (Christ et al., 2023; Woznick, 2024) and abundant remains of vegetation across the entire core (Christ et al., 2021):
-
Initial conditions. The bottom part of the core (Unit 1) contains sediment transported and deposited by glacial ice. Glaciation in northwestern Greenland abraded materials beneath the ice, creating the basal till, including cobble-sized clasts and fine rock flour.
-
Retreat. Ice retreated, exposing the former bed of the ice sheet to surface processes (Christ et al., 2021, 2023). The till weathered, and grain coatings formed (Christ et al., 2021, 2023). Sometime after the till weathered, Unit 2 was deposited. Unit 2 may be preserved snow/firn from an interglacial or remanent basal ice from a later glaciation.
-
Water and vegetation. During interglacial conditions, the permafrost landscape was subject to freeze–thaw cycles as shown by the vertical lenses of clear ice in Unit 2. Till, saturated by water, flowed downslope and buried the ice, forming Unit 3. Interglacial conditions supported plant growth (Christ et al., 2023) and the development of a fluvial system that eroded the upper portion of the flow till deposit, stripping grain coatings but not changing grain shape. The fluvial system then deposited bedded sand, initially fine-grained and then coarser-grained material.
-
Readvance. When the climate cooled after MIS 11, ice covered the Camp Century core site (Christ et al., 2023). This ice is currently cold-based and non-erosive.
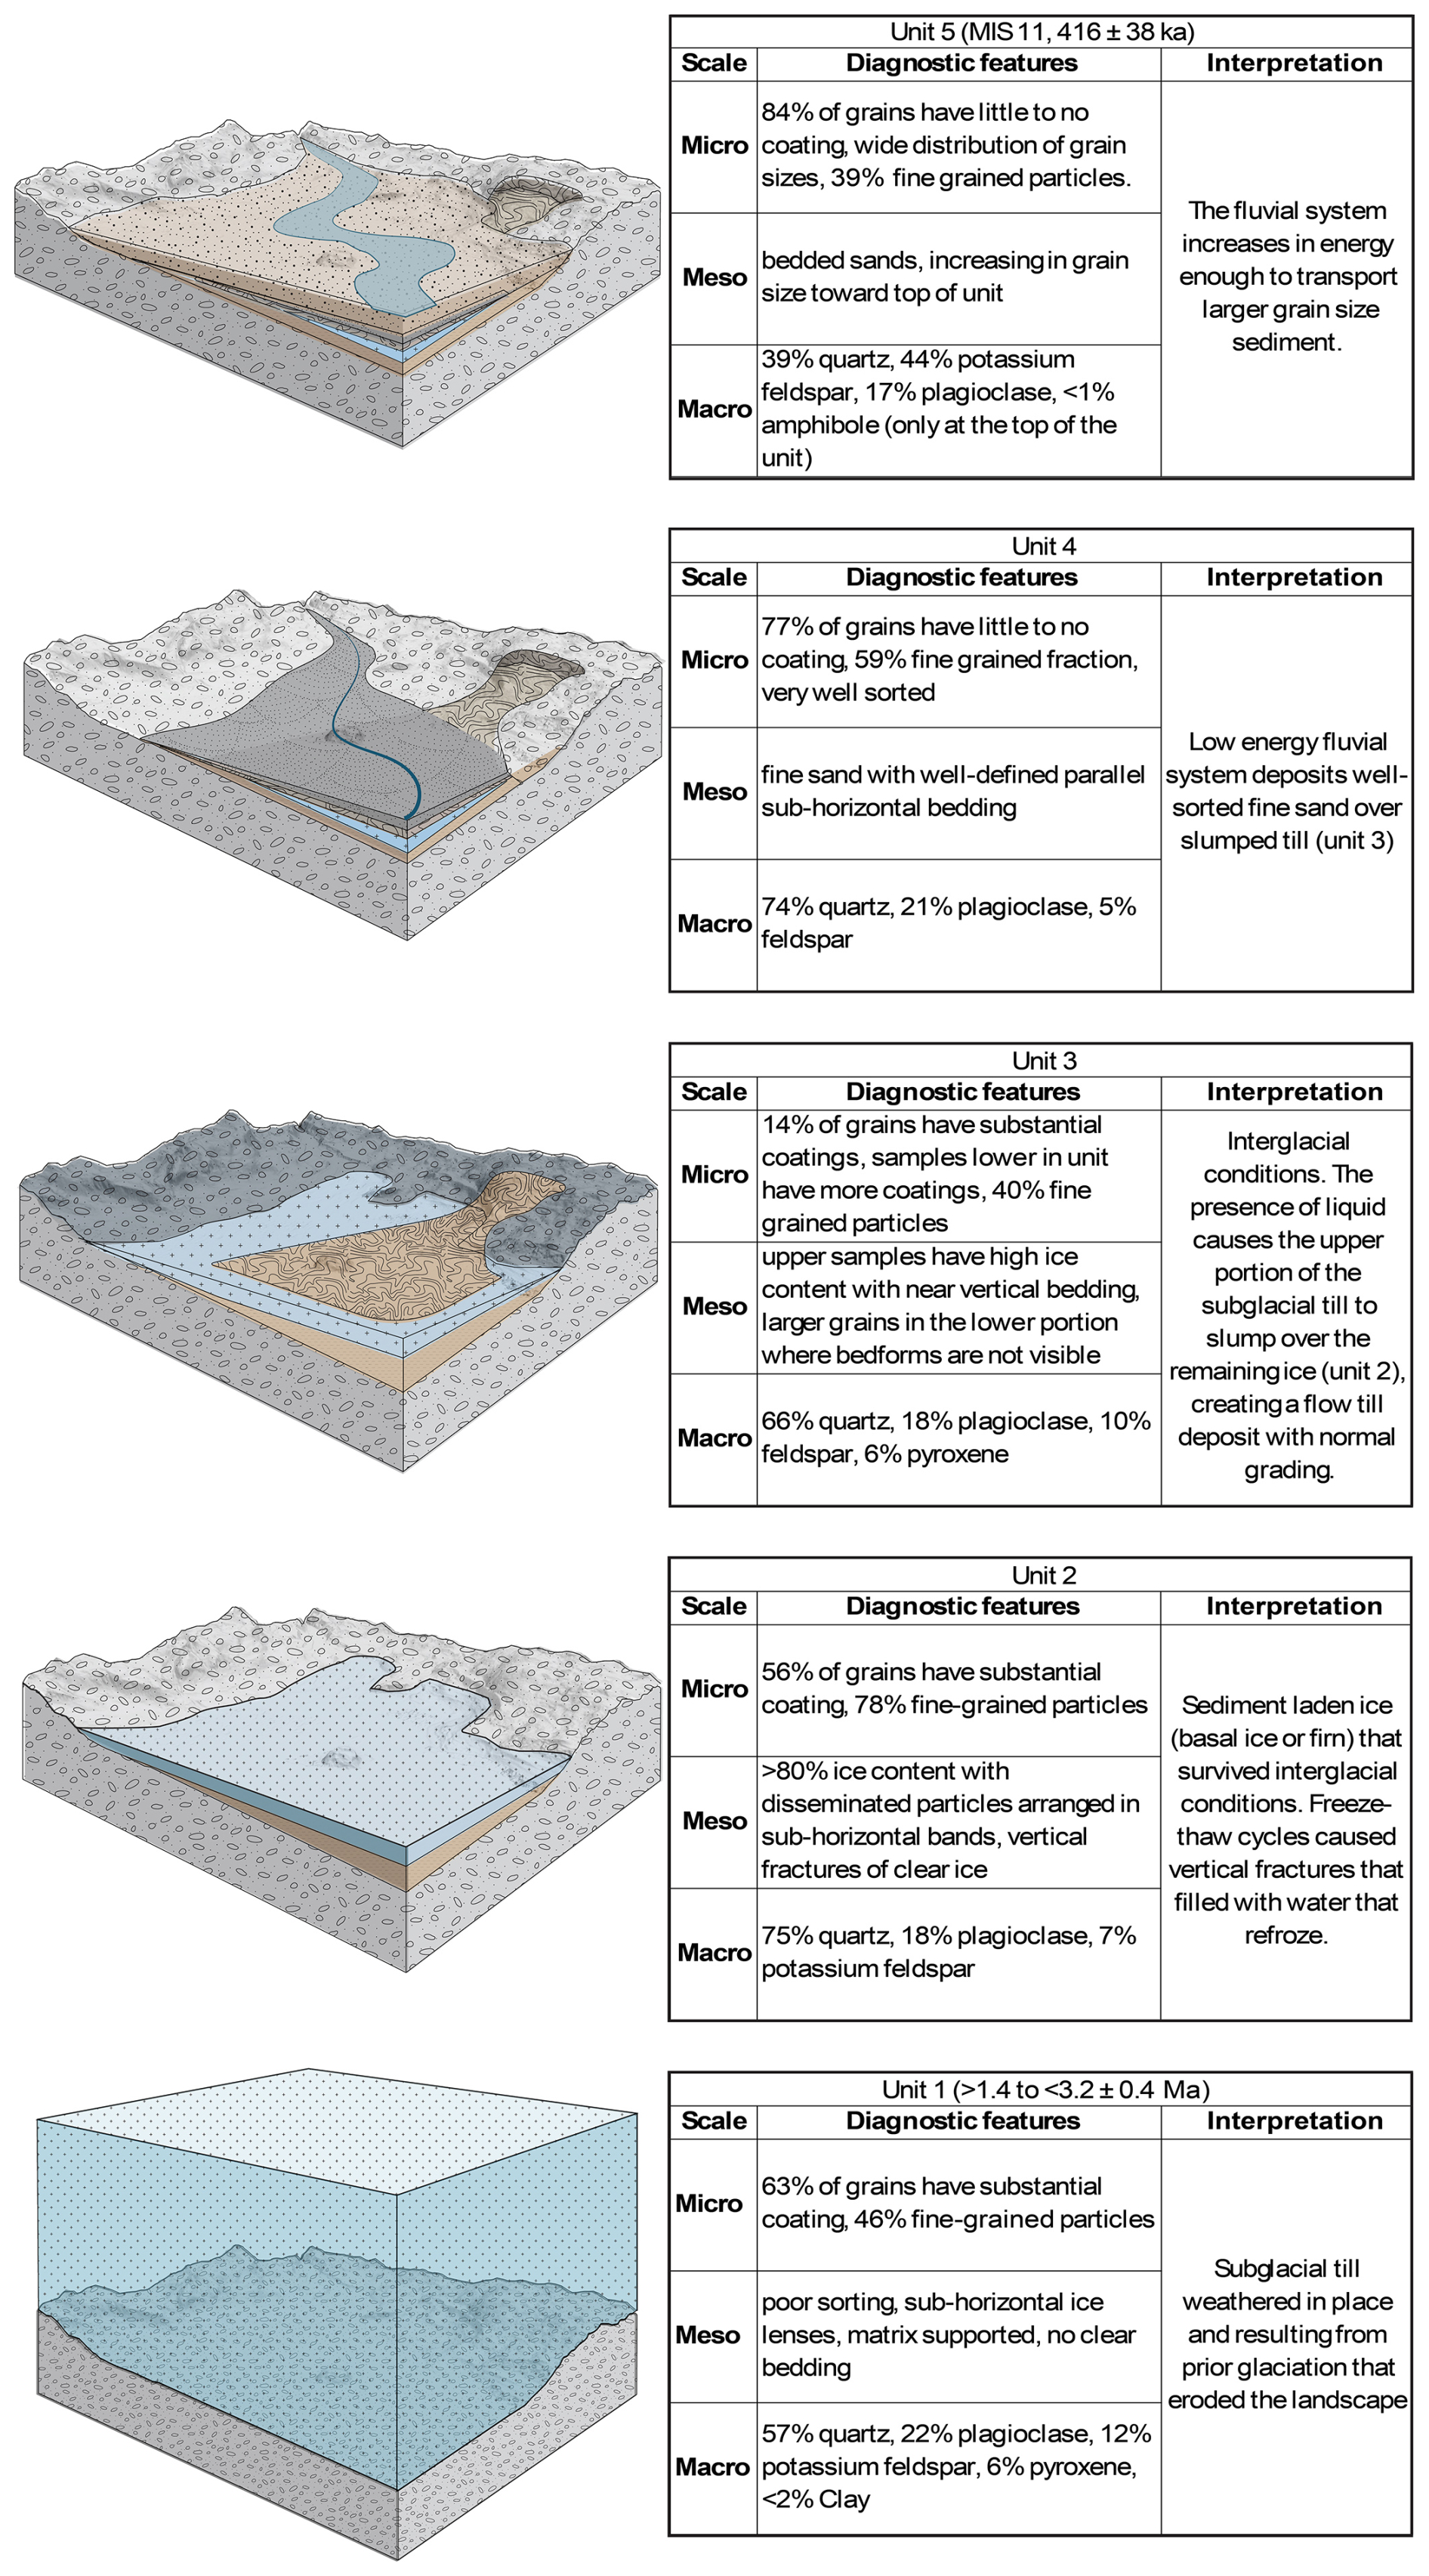
Figure 9Proposed sequence of events that led to the accumulation of the five units. Diagnostic features summarized by scale of observation. Time constraints based on past work (Christ et al., 2021, 2023).
5.3 Implications
Multiscale investigation of the Camp Century subglacial materials documents glacial and deglacial processes on the sub-ice surface of northwestern Greenland over time. Systematic use of CT scanning enhanced our ability to describe the sequence of environmental change archived in the subglacial material. Such mesoscale observations allow us to identify changing environmental conditions, observe internal sedimentary and cryogenic structures, and provide an archive of 3D models of the samples that no longer exist in their original state. Macroscale XRD mineralogic observations imply consistent sourcing of sedimentary material. Microscale data allow linkages of process-specific attributes to the mesoscale observations. Uncertainties remain regarding the explanation for intra-unit variability, the extent and duration of ice-free conditions, and the history and process of formation for Unit 2. Further investigation of the Camp Century sub-ice archive and future retrieval and analysis of subglacial materials have the potential refine the understanding of Greenland's paleoclimate and glacial history while further elucidating surface and weathering processes.
Raw data from this project are archived in the Arctic Database (https://doi.org/10.18739/A2QN5ZD22, Perdrial et al., 2025). 3D visualizations of the μCT scans are available for viewing and download in an online public repository: https://www.morphosource.org/concern/cultural_heritage_objects/000583438 (Collins et al., 2023).
CMC, NP, PRB, PHB, and NK: study design, data production, analysis, data interpretation, writing. CMC, NP, PHB, NK, and PCK: grain analysis, scanning electron microscopy data acquisition. PHB, WCM, and YM: unpolished microscale SEM data acquisition and interpretation. CMC, HM, JS: sample handling. CMC: computed tomography scan acquisition. PRB, PCK, NP: funding acquisition.
At least one of the (co-)authors is a guest member of the editorial board of Climate of the Past for the special issue “The Camp Century ice and sediment core: new science from a 1966 core that touched the base of the Greenland ice sheet (CP/TC inter-journal SI)”. The peer-review process was guided by an independent editor, and the authors also have no other competing interests to declare.
Publisher's note: Copernicus Publications remains neutral with regard to jurisdictional claims made in the text, published maps, institutional affiliations, or any other geographical representation in this paper. While Copernicus Publications makes every effort to include appropriate place names, the final responsibility lies with the authors.
This article is part of the special issue “The Camp Century ice and sediment core: new science from a 1966 core that touched the base of the Greenland ice sheet”. It is not associated with a conference.
We thank Zoe Courville, CRREL, for help with CT scan acquisition; Jody Smith, Middlebury College, and Sebastian N. Malkki (GEUS) for SEM and EDS assistance; Kristen Underwood, University of Vermont (UVM), for guidance with data processing and visualization; and MJ Moline (UVM) for assistance with creating CT scan visuals. We also acknowledge Andrew Christ for his work as part of the Camp Century team and for early guidance on this project. We thank the editor of Climate of the Past, reviewer Gifford H. Miller, and the two anonymous reviewers for invaluable insights in improving this article.
This research has been supported by the Office of Polar Programs (grant no. EAR-OPP-2114629), the Division of Earth Sciences (grant no. NSF-EAR-1735676 and 2300560), and the Geocenter Danmark (grant no. GC 3-2019).
This paper was edited by Denis-Didier Rousseau and reviewed by Gifford H. Miller and two anonymous referees.
Anderberg, M. R.: Cluster Analysis for Applications. A volume in Probability and Mathematical Statistics: A Series of Monographs and Textbooks, Academic Press, Elsevier, https://doi.org/10.1016/C2013-0-06161-0, 1973.
Bader, H.: Scope, Problems, and Potential Value of Deep Core Drilling in Ice Sheets, CRREL Special Report 58, 1–17, https://icedrill.org/sites/default/files/SR-58.pdf (last access: 28 July 2025), 1962.
Balter-Kennedy, A., Schaefer, J. M., Briner, J. P., Young, N. E., Walcott, C., Kuhl, T., Moravec, E., Keisling, B. A., Anandakrishnan, S., Stevens, N., and Brown, N.: First Results from GreenDrill: Exposure dating in sub-ice material from Prudhoe Dome, northwestern Greenland, in: AGU Fall Meeting 2023, San Francisco, CA, USA, 11–15 December 2023, Session: Cryosphere/Archives and Observations from Subice Environments II Oral, id. C14A-07, https://ui.adsabs.harvard.edu/abs/2023AGUFM.C14A..07B/abstract (last access: 28 July 2025), 2023.
Bender, M. L., Burgess, E., Alley, R. B., Barnett, B., and Clow, G. D.: On the nature of the dirty ice at the bottom of the GISP2 ice core, Earth Planet. Sc. Lett., 299, 466–473, https://doi.org/10.1016/J.EPSL.2010.09.033, 2010.
Bierman, P. R.: When the Ice Is Gone: What a Greenland Ice Core Reveals About Earth's Tumultuous History and Perilous Future, W. W. Norton & Company, ISBN 978-1-324-11030-9, 2024.
Bierman, P. R., Corbett, L. B., Graly, J. A., Neumann, T. A., Lini, A., Crosby, B. T., and Rood, D. H.: Preservation of a Preglacial Landscape Under the Center of the Greenland Ice Sheet, Science, 344, 402–405, https://doi.org/10.1126/science.1249047, 2014.
Bierman, P. R., Christ, A. J., Collins, C. M., Mastro, H. M., Souza, J., Blard, P.-H., Brachfeld, S., Courville, Z. R., Rittenour, T. M., Thomas, E. K., Tison, J.-L., and Fripiat, F.: Scientific history, sampling approach, and physical characterization of the Camp Century subglacial material, a rare archive from beneath the Greenland Ice Sheet, The Cryosphere, 18, 4029–4052, https://doi.org/10.5194/tc-18-4029-2024, 2024a.
Bierman, P. R, Mastro, H. M., Corbett., L. B., Steig, E. J., Halsted, C. T., Caffee, M. M., Hidy, A. J., Balco, G., Peteet, D. M., Bennike, O., and Rock, B.: Plants, insects, and fungi under Greenland's ice – evidence of ice-free times, P. Natl. Acad. Sci. USA, 121, e2407465121, https://doi.org/10.1073/pnas.2407465121, 2024b.
Blard, P. H., Protin, M., Tison, J. L., Fripiat, F., Dahl-Jensen, D., Steffensen, J. P., Mahaney, W. C., Bierman, P. R., Christ, A. J., Corbett, L. B., Debaille, V., Rigaudier, T., and Claeys, P.: Basal debris of the NEEM ice core, Greenland: a window into sub-ice-sheet geology, basal ice processes and ice-sheet oscillations, J. Glaciol., 69, 1011–1029, https://doi.org/10.1017/jog.2022.122, 2023.
Brevik, E. C. and Reid, J. R.: Differentiating Till and Debris Flow Deposits in Glacial Landscapes, Soil Horizons, 41, 83–90, https://doi.org/10.2136/sh2000.3.0083, 2000.
Briner, J. P., Walcott, C. K., Schaefer, J. M., Young, N. E., MacGregor, J. A., Poinar, K., Keisling, B. A., Anandakrishnan, S., Albert, M. R., Kuhl, T., and Boeckmann, G.: Drill-site selection for cosmogenic-nuclide exposure dating of the bed of the Greenland Ice Sheet, The Cryosphere, 16, 3933–3948, https://doi.org/10.5194/tc-16-3933-2022, 2022.
Cailleux, A. and Tricart, J.: Initiation à l'étude des sables et des galets, CDU, Paris, 1959.
Calmels, F. and Allard, M.: Segregated Ice Structures in Various Heaved Permafrost Landforms Through CT Scan, Earth Surf. Proc. Land., 33, 209–225, https://doi.org/10.1002/esp.1538, 2008.
Christ, A. J., Bierman, P. R., Schaefer, J. M., Dahl-Jensen, D., Steffensen, J. P., Corbett, L. B., Peteet, D. M., Thomas, E. K., Steig, E. J., Rittenour, T. M., Tison, J.-L., Blard, P.-H., Perdrial, N., Dethier, D. P., Lini, A., Hidy, A. J., Caffee, M. W., and Southon, J.: A multimillion-year-old record of Greenland vegetation and glacial history preserved in sediment beneath 1.4 km of ice at Camp Century, P. Natl. Acad. Sci. USA, 118, e2021442118, https://doi.org/10.1073/pnas.2021442118, 2021.
Christ, A. J., Rittenour, T. M., Bierman, P. R., Keisling, B. A., Knutz, P. C., Thomsen, T. B., Keulen, N., Fosdick, J. C., Hemming, S. R., Tison, J.-L., Blard, P.-H., Steffensen, J. P., Caffee, M. W., Corbett, L. B., Dahl-Jensen, D., Dethier, D. P., Hidy, A. J., Perdrial, N., Peteet, D. M., Steig, E. J., and Thomas, E. K.: Deglaciation of northwestern Greenland during Marine Isotope Stage 11, Science, 381, 330–335, https://doi.org/10.1126/science.ade4248, 2023.
Collins, C., Perdrial, N., and Bierman, P.: NBI:ICF Camp Century Sub Ice, Niels Bohr Institute Ice Core Storage Facility [data set], https://www.morphosource.org/concern/cultural_heritage_objects/000583438 (last access: 24 July 2025), 2023.
Dansgaard, W., Johnsen, S. J., Moller, J., and Langway, C. C.: One Thousand Centuries of Climatic Record from Camp Century on the Greenland Ice Sheet, Science, 166, 377–381, https://doi.org/10.1126/science.166.3903.377, 1969.
Dixon, J. C., Thorn, C. E., Darmody, R. G., and Campbell, S. W.: Weathering rinds and rock coatings from an Arctic alpine environment, northern Scandinavia, Geol. Soc. Am. Bull., 114, 226–238, https://doi.org/10.1130/0016-7606(2002)114<0226:WRARCF>2.0.CO;2, 2002.
Dutton, A., Carlson, A. E., Long, A. J., Milne, G. A., Clark, P. U., DeConto, R., Horton, B. P., Rahmstorf, S., and Raymo, M. E.: Sea-level rise due to polar ice-sheet mass loss during past warm periods, Science, 349, aaa4019, https://doi.org/10.1126/science.aaa4019, 2015.
Emmanouilidis, A., Messaris, G., Ntzanis, E., Zampakis, P., Prevedouros, I., Bassukas, D. A., and Avramidis, P.: CT scanning, X-ray fluorescence: Non-destructive techniques for the identification of sedimentary facies and structures, Revue de Micropaleontologie, 67, 100410, https://doi.org/10.1016/j.revmic.2020.100410, 2020.
Fountain, J., Usselman, T. M., Wooden, J., and Langway, C. C.: Evidence of the Bedrock Beneath the Greenland Ice Sheet Near Camp Century, Greenland, J. Glaciol., 27, 193–197, https://doi.org/10.3189/S0022143000011370, 1981.
Francus, P. and Pirard, E.: Testing for Sources of Errors in Quantitative Image Analysis, in: Image Analysis, Sediments and Paleoenvironments, vol. 7, Kluwer Academic Publishers, Dordrecht, 87–102, https://doi.org/10.1007/1-4020-2122-4_5, 2005.
French, H. and Shur, Y.: The principles of cryostratigraphy, Earth Sci. Rev., 101, 190–206, https://doi.org/10.1016/j.earscirev.2010.04.002, 2010.
Garzanti, E.: The Maturity Myth In Sedimentology and Provenance Analysis, J. Sediment. Res., 87, 353–365, https://doi.org/10.2110/jsr.2017.17, 2017.
Gemery, L. and López-Quirós, A.: Polar paleoenvironmental perspectives on modern climate change, PLOS Climate, 3, e0000333, https://doi.org/10.1371/journal.pclm.0000333, 2024.
Gilbert, G. L., Kanevskiy, M., and Murton, J. B.: Recent Advances (2008–2015) in the Study of Ground Ice and Cryostratigraphy, Permafr. Periglac. Process., 27, 377–389, https://doi.org/10.1002/ppp.1912, 2016.
Gill, D., Shomrony, A., and Fligelman, H.: Numerical Zonation of Log Suites and Logfacies Recognition by Multivariate Clustering, AAPG Bull., 10, 1781–1791, https://doi.org/10.1306/BDFF8F38-1718-11D7-8645000102C1865D, 1993.
Goldich, S. S.: A Study in Rock-Weathering, J. Geol., 46, 17–58, https://doi.org/10.1086/624619, 1938.
Gow, A. J. and Meese, D. A.: Nature of basal debris in the GISP2 and Byrd ice cores and its relevance to bed processes, Ann. Glaciol., 22, 134–140, https://doi.org/10.3189/1996AoG22-1-134-140, 1996.
Gow, A. J., Meese, D. A., Alley, R. B., Fitzpatrick, J. J., Anandakrishnan, S., Woods, G. A., and Elder, B. C.: Physical and structural properties of the Greenland Ice Sheet Project 2 ice core: A review, J. Geophys. Res.-Oceans, 102, 26559–26575, https://doi.org/10.1029/97JC00165, 1997.
Gregersen, U., Knutz, P. C., Pedersen, G. K., Nøhr-Hansen, H., Ineson, J. R., Larsen, L. M., Hopper, J. R., Bojesen-Koefoed, J. A., Dam, G., Funck, T., and Hovikoski, J.: Stratigraphy of the West Greenland Margin, in: Geological synthesis of Baffin Island (Nunavut) and the Labrador-Baffin Seaway, edited by: Dafoe, L. T. and Bingham-Koslowski, N. E., Geological Survey of Canada, Bulletin, Natural Resources Canada, 608, 247–309, https://doi.org/10.4095/321849, 2022.
Gresina, F., Farkas, B., Fábián, S. Á., Szalai, Z., and Varga, G.: Morphological analysis of mineral grains from different sedimentary environments using automated static image analysis, Sediment. Geol., 455, 106479, https://doi.org/10.1016/j.sedgeo.2023.106479, 2023.
Hambreky, M. J., Bennett, M. R., Dowdeswell, J. A., Glasser, N. F., and Huddart, D.: Debris entrainment and transfer in polythermal valley glaciers, J. Glaciol., 45, 69–86, https://doi.org/10.3189/S0022143000003051, 1999.
Hansen, B. L. and Langway, C. C.: Deep Core Drilling in Ice and Core Analysis at Camp Century, Greenland, 1961–1966, Antarct. J. US, 1, 207–208, 1966.
Harrison, J. C., St-Onge, M. R., Petrov, O. V, Strelnikov, S. I., Lopatin, B. G., Wilson, F. H., Tella, S., Paul, D., Lynds, T., Shokalsky, S. P., Hults, C. K., Bergman, S., Jepsen, H. F., and Solli, A.: Geological map of the Arctic, “A” Series Map, Geological Survey of Canada, https://doi.org/10.4095/287868, 2011.
Harwood, D. M.: Do Diatoms beneath the Greenland Ice Sheet Indicate Interglacials Warmer than Present?, Arctic, 39, 304–308, https://doi.org/10.14430/arctic2092, 1986.
Herron, S., Hoar, and Langway, C. C.: The Debris-Laden Ice at the Bottom of the Greenland Ice Sheet, J. Glaciol., 23, 193–207, https://doi.org/10.3189/s002214300002983x, 1979.
Hjulström, F.: Studies of the morphological activity of rivers as illustrated by the River Fyris, Bulletin of the Geological Institute University of Uppsala, 25, 221–527, 1935.
Janoo, V. C.: Quantification of Shape, Angularity, and Surface texture of Base Course Materials, US Transportation Collection, https://usace.contentdm.oclc.org/digital/collection/p266001coll1/id/6225/ (last access: 28 July 2025), 1998.
Jansson, N. F., Allen, R. L., Skogsmo, G., and Tavakoli, S.: Principal component analysis and k-means clustering as tools during exploration for Zn skarn deposits and industrial carbonates, Sala area, Sweden, J. Geochem. Explor., 233, 106909, https://doi.org/10.1016/j.gexplo.2021.106909, 2022.
JMP® Pro: Version 15.0.0, SAS Institute Inc., Cary, NC, 1989–2025.
Johnsen, S. J., Dansgaard, W., Clausen, H. B., and Lang Way, C. C.: Oxygen Isotope Profiles through the Antarctic and Greenland Ice Sheets, Nature, 235, 429–434, https://doi.org/10.1038/235429a0, 1972.
Jouzel, J., Masson-Delmotte, V., Cattani, O., Dreyfus, G., Falourd, S., Hoffmann, G., Minster, B., Nouet, J., Barnola, J. M., Chappellaz, J., Fischer, H., Gallet, J. C., Johnsen, S., Leuenberger, M., Loulergue, L., Luethi, D., Oerter, H., Parrenin, F., Raisbeck, G., Raynaud, D., Schilt, A., Schwander, J., Selmo, E., Souchez, R., Spahni, R., Stauffer, B., Steffensen, J. P., Stenni, B., Stocker, T. F., Tison, J. L., Werner, M., and Wolff, E. W.: Orbital and Millennial Antarctic Climate Variability over the Past 800 000 Years, Science, 317, 793–796, https://doi.org/10.1126/science.1141038, 2007.
Kalińska-Nartiša, E., Stivrins, N., and Grudzinska, I.: Quartz grains reveal sedimentary palaeoenvironment and past storm events: A case study from eastern Baltic, Estuar. Coast. Shelf Sci., 200, 359–370, https://doi.org/10.1016/j.ecss.2017.11.027, 2018.
Keulen, N., Malkki, S. N., and Graham, S.: Automated Quantitative Mineralogy Applied to Metamorphic Rocks, Minerals, 10, 47, https://doi.org/10.3390/min10010047, 2020.
Knight, P. G.: The basal ice layer of glaciers and ice sheets, Quaternary Sci. Rev., 16, 975–993, https://doi.org/10.1016/S0277-3791(97)00033-4, 1997.
Krumbein, W. C.: The Effects of Abrasion on the Size, Shape and Roundness of Rock Fragments, J. Geol., 49, 482–520, https://doi.org/10.1086/624985, 1941.
Kuenen, P. H.: Experimental abrasion; 3, Fluviatile action on sand, Am. J. Sci., 257, 172–190, https://doi.org/10.2475/ajs.257.3.172, 1959.
Langway, C. C.: The History of Early Polar Ice Cores, Cold Reg. Sci. Technol., 52, 101–117, https://doi.org/10.1016/j.coldregions.2008.01.001, 2008.
Langway, C. C. and Hansen, B. L.: Drilling Through the Ice Cap: Probing Climate for a Thousand Centuries, B. Atom. Sci., 26, 62–66, 1970.
Lapalme, C. M., Lacelle, D., Pollard, W., Fortier, D., Davila, A., and McKay, C. P.: Cryostratigraphy and the Sublimation Unconformity in Permafrost from an Ultraxerous Environment, University Valley, McMurdo Dry Valleys of Antarctica, Permafr. Periglac. Process., 28, 649–662, https://doi.org/10.1002/ppp.1948, 2017.
Larson, G. J., Menzies, J., Lawson, D. E., Evenson, E. B., and Hopkins, N. R.: Macro- and micro-sedimentology of a modern melt-out till – Matanuska Glacier, Alaska, USA, Boreas, 45, 235–251, https://doi.org/10.1111/bor.12149, 2016.
Lee, A. S., Enters, D., Titschack, J., and Zolitschka, B.: Facies characterisation of sediments from the East Frisian Wadden Sea (Germany): New insights from down-core scanning techniques, Neth. J. Geosci., 100, https://doi.org/10.1017/njg.2021.6, 2021.
Lei, L., Seol, Y., and Jarvis, K.: Pore-Scale Visualization of Methane Hydrate-Bearing Sediments With Micro-CT, Geophys. Res. Lett., 45, 5417–5426, https://doi.org/10.1029/2018GL078507, 2018.
Lei, L., Park, T., Jarvis, K., Pan, L., Tepecik, I., Zhao, Y., Ge, Z., Choi, J.-H., Gai, X., Galindo-Torres, S. A., Boswell, R., Dai, S., and Seol, Y.: Pore-scale observations of natural hydrate-bearing sediments via pressure core sub-coring and micro-CT scanning, Sci. Rep., 12, 3471, https://doi.org/10.1038/s41598-022-07184-6, 2022.
Lepp, A. P., Miller, L. E., Anderson, J. B., O'Regan, M., Winsborrow, M. C. M., Smith, J. A., Hillenbrand, C.-D., Wellner, J. S., Prothro, L. O., and Podolskiy, E. A.: Insights into glacial processes from micromorphology of silt-sized sediment, The Cryosphere, 18, 2297–2319, https://doi.org/10.5194/tc-18-2297-2024, 2024.
Lisiecki, L. E. and Raymo, M. E.: A Pliocene-Pleistocene stack of 57 globally distributed benthic δ18O records, Paleoceanography, 20, 1–17, https://doi.org/10.1029/2004PA001071, 2005.
Lüthi, D., Le Floch, M., Bereiter, B., Blunier, T., Barnola, J.-M., Siegenthaler, U., Raynaud, D., Jouzel, J., Fischer, H., Kawamura, K., and Stocker, T. F.: High-resolution carbon dioxide concentration record 650 000–800 000 years before present, Nature, 453, 379–382, https://doi.org/10.1038/nature06949, 2008.
Mackowiak, T. J. and Perdrial, N.: Monitoring of Suspended Sediment Mineralogy in Puerto-Rican Rivers: Effects of Flowrate and Lithology, Minerals, 13, 208, https://doi.org/10.3390/min13020208, 2023.
Mahaney, W. C.: Atlas of Sand Grain Surface Textures and Applications, Oxford University Press, ISBN 978-0195138122, 2002.
Malusà, M. G., Resentini, A., and Garzanti, E.: Hydraulic sorting and mineral fertility bias in detrital geochronology, Gondwana Res., 31, 1–19, https://doi.org/10.1016/j.gr.2015.09.002, 2016.
Marschalek, J. W., Blard, P.-H., Sarigulyan, E., Ehrmann, W., Hemming, S. R., Thomson, S. N., Hillenbrand, C. -D., Licht, K., Tison, J.-L., Ardoin, L., Fripiat, F., Allen, C. S., Marrocchi, Y., Siegert, M. J., and van de Flierdt, T.: Byrd Ice Core Debris Constrains the Sediment Provenance Signature of Central West Antarctica, Geophys. Res. Lett., 51, e2023GL106958, https://doi.org/10.1029/2023GL106958, 2024.
Mena, A., Francés, G., Pérez-Arlucea, M., Aguiar, P., Barreiro-Vázquez, J. D., Iglesias, A., and Barreiro-Lois, A.: A novel sedimentological method based on CT-scanning: Use for tomographic characterization of the Galicia Interior Basin, Sediment. Geol., 321, 123–138, https://doi.org/10.1016/j.sedgeo.2015.03.007, 2015.
Menzies, J. and Reitner, J. M.: Microsedimentology ice stream tills from the Eastern Alps, Austria – a new perspective on till microstructures, Boreas, 45, 804–827, https://doi.org/10.1111/bor.12189, 2016.
Moon, T. A., Fisher, M., Stafford, T., and Thurber, A.: QGreeland (v3.0.0), Zenodo [data set], https://doi.org/10.5281/zenodo.12823307, 2023.
Murton, J. B. and French, H. M.: Cryostructures in permafrost, Tuktoyaktuk coastlands, western arctic Canada, Can. J. Earth Sci., 31, 737–747, https://doi.org/10.1139/e94-067, 1994.
Musselman, Z. A. and Tarbox, A. M.: Downstream Trends in Grain Size, Angularity, and Sorting of Channel-Bed and Bank Deposits in a Coastal Plain Sand-Bed River: the Pascagoula River System, Mississippi, USA, Southeast Geogr., 53, 177–197, https://doi.org/10.1353/sgo.2013.0017, 2013.
Naqshband, S. and McElroy, B.: Sediment transport at grain scale: A review, future research and morphological implications, in: River Flow 2016: Iowa City, USA, 11–14 July 2016, edited by: Constantinescu, G., Garcia, M., and Hanes, D., 1st edn., CRC Press, https://doi.org/10.1201/9781315644479, 2016.
Nitzbon, J., Gadylyaev, D., Schlüter, S., Köhne, J. M., Grosse, G., and Boike, J.: Brief communication: Unravelling the composition and microstructure of a permafrost core using X-ray computed tomography, The Cryosphere, 16, 3507–3515, https://doi.org/10.5194/tc-16-3507-2022, 2022.
Orsi, T. H., Edwards, C. M., and Anderson, A. L.: X-Ray Computed Tomography: A Non-destructive Method for Quantitative Analysis of Sediment Cores, J. Sediment. Res., 64A, 690–693, 1994.
Perdrial, N., Collins, C. M., and Bierman, P. R.: New Analysis of the Camp Century Basal Sediment (Greenland): Mineralogy, Microscopy, Computer Tomography of the bottom 340 centimeter of the core divided in 26 subsamples, 2019–2025, Arctic Data Center [data set], https://doi.org/10.18739/A2QN5ZD22, 2025.
Pesch, C., Weber, P. L., Moldrup, P., de Jonge, L. W., Arthur, E., and Greve, M. H.: Physical characterization of glacial rock flours from fjord deposits in South Greenland–Toward soil amendment, Soil Sci. Soc. Am. J., 86, 407–422, https://doi.org/10.1002/saj2.20352, 2022.
Razi, T., Niknami, M., and Alavi Ghazani, F.: Relationship between Hounsfield Unit in CT Scan and Gray Scale in CBCT, J. Dent. Res. Dent. Clin. Dent. Prospects, 8, 107–10, https://doi.org/10.5681/joddd.2014.019, 2014.
R Core Team: R: A Language and Environment for Statistical Computing, R Foundation for Statistical Computing, Vienna, Austria, https://www.scirp.org/reference/referencespapers?referenceid=3456808 (last access: 28 July 2025), 2022.
Renter, J. A. M.: Applications of computerized tomography in sedimentology, Mar. Geotechnol., 8, 201–211, https://doi.org/10.1080/10641198909379868, 1989.
Rietveld, H. M.: A profile refinement method for nuclear and magnetic structures, J. Appl. Crystallogr., 2, 65–71, https://doi.org/10.1107/S0021889869006558, 1969.
Robinson, A., Alvarez-Solas, J., Calov, R., Ganopolski, A., and Montoya, M.: MIS-11 duration key to disappearance of the Greenland ice sheet, Nat. Commun., 8, 16008, https://doi.org/10.1038/ncomms16008, 2017.
Sahagian, D. L. and Proussevitch, A. A.: 3D particle size distributions from 2D observations: stereology for natural applications, J. Volcanol. Geoth. Res., 84, 173–196, https://doi.org/10.1016/S0377-0273(98)00043-2, 1998.
Schaefer, J. M., Finkel, R. C., Balco, G., Alley, R. B., Caffee, M. W., Briner, J. P., Young, N. E., Gow, A. J., and Schwartz, R.: Greenland was nearly ice-free for extended periods during the Pleistocene, Nature, 540, 252–255, https://doi.org/10.1038/nature20146, 2016.
Schindelin, J., Arganda-Carreras, I., Frise, E., Kaynig, V., Longair, M., Pietzsch, T., Preibisch, S., Rueden, C., Saalfeld, S., Schmid, B., Tinevez, J.-Y., White, D. J., Hartenstein, V., Eliceiri, K., Tomancak, P., and Cardona, A.: Fiji: an open-source platform for biological-image analysis, Nat. Methods, 9, 676–682, https://doi.org/10.1038/nmeth.2019, 2012.
Souchez, R., Tison, J. -L, Lorrain, R., Lemmens, M., Janssens, L., Stievenard, M., Jouzel, J., Sveinbjörnsdottir, A., and Johnsen, S. J.: Stable isotopes in the basal silty ice preserved in the Greenland Ice Sheet at summit; environmental implications, Geophys. Res. Lett., 21, 693–696, https://doi.org/10.1029/94GL00641, 1994.
Souchez, R., Janssens, L., Lemmens, M., and Stauffer, B.: Very low oxygen concentration in basal ice from Summit, central Greenland, Geophys. Res. Lett., 22, 2001–2004, https://doi.org/10.1029/95GL01995, 1995.
Souchez, R., Bouzette, A., Clausen, H. B., Johnsen, S. J., and Jouzel, J.: A stacked mixing sequence at the base of the Dye 3 core, Greenland, Geophys. Res. Lett., 25, 1943–1946, https://doi.org/10.1029/98gl01411, 1998.
Stephani, E., Fortier, D., Shur, Y., Fortier, R., and Doré, G.: A geosystems approach to permafrost investigations for engineering applications, an example from a road stabilization experiment, Beaver Creek, Yukon, Canada, Cold Reg. Sci. Technol., 100, 20–35, https://doi.org/10.1016/j.coldregions.2013.12.006, 2014.
Suwa, M., von Fischer, J. C., Bender, M. L., Landais, A., and Brook, E. J.: Chronology reconstruction for the disturbed bottom section of the GISP2 and the GRIP ice cores: Implications for Termination II in Greenland, J. Geophys. Res.-Atmos., 111, D02101, https://doi.org/10.1029/2005JD006032, 2006.
Szmańda, J. B. and Witkowski, K.: Morphometric Parameters of Krumbein Grain Shape Charts – A Critical Approach in Light of the Automatic Grain Shape Image Analysis, Minerals, 11, 937, https://doi.org/10.3390/min11090937, 2021.
Tafesse, S., Robison Fernlund, J. M., Sun, W., and Bergholm, F.: Evaluation of image analysis methods used for quantification of particle angularity, Sedimentology, 60, 1100–1110, https://doi.org/10.1111/j.1365-3091.2012.01367.x, 2013.
Tison, J., Thorsteinsson, T., and Lorrain, R.: EPSL Origin and development of textures and fabrics in basal ice at Summit, Central Greenland, Earth Planet. Sc. Lett., 125, 421–437, https://doi.org/10.1016/0012-821X(94)90230-5, 1994.
Vandel, E., Vaasma, T., and Sugita, S.: Application of image analysis technique for measurement of sand grains in sediments, MethodsX, 7, 100981, https://doi.org/10.1016/j.mex.2020.100981, 2020.
Vandenberghe, J. and Nugteren, G.: Rapid climatic changes recorded in loess successions, Glob. Planet. Change, 28, 1–9, https://doi.org/10.1016/S0921-8181(00)00060-6, 2001.
van Hateren, J. A., van Buuren, U., Arens, S. M., van Balen, R. T., and Prins, M. A.: Identifying sediment transport mechanisms from grain size–shape distributions, applied to aeolian sediments, Earth Surf. Dynam., 8, 527–553, https://doi.org/10.5194/esurf-8-527-2020, 2020.
Voosen, P.: Mud in storied ice core hints at a thawed Greenland, Science, 366, 556–557, https://doi.org/10.1126/science.366.6465.556, 2019.
Voosen, P.: Hole drilled into Greenland's heart reveals ice ready to slide into the sea, AAAS Articles DO Group, https://doi.org/10.1126/science.z7vpo43, 2025.
Whalley, W. B. and Langway, C. C.: A Scanning Electron Microscope Examination of Subglacial Quartz Grains from Camp Century Core, Greenland – A Preliminary Study, J. Glaciol., 25, 125–132, https://doi.org/10.3189/s0022143000010340, 1980.
Willerslev, E., Cappellini, E., Boomsma, W., Nielsen, R., Hebsgaard, M. B., Brand, T. B., Hofreiter, M., Bunce, M., Poinar, H. N., Dahl-Jensen, D., Johnsen, S., Steffensen, J. P., Bennike, O., Schwenninger, J.-L., Nathan, R., Armitage, S., de Hoog, C.-J., Alfimov, V., Christl, M., Beer, J., Muscheler, R., Barker, J., Sharp, M., Penkman, K. E. H., Haile, J., Taberlet, P., Gilbert, M. T. P., Casoli, A., Campani, E., and Collins, M. J.: Ancient Biomolecules from Deep Ice Cores Reveal a Forested Southern Greenland, Science, 317, 111–114, https://doi.org/10.1126/science.1141758, 2007.
Woronko, B., Pisarska-Jamroży, M., and van Loon, A. J.: Reconstruction of sediment provenance and transport processes from the surface textures of quartz grains from Late Pleistocene sandurs and an ice-marginal valley in NW Poland, Geologos, 21, 105–115, https://doi.org/10.1515/logos-2015-0007, 2015.
Woznick, H.: Shedding Light on Past Ice-Free Intervals in Northwest Greenland: Luminescence Dating of the Base of the Camp Century Ice Core, MSc thesis, Utah State University, https://doi.org/10.26076/fa75-82e1, 2024.
Yabe, S., Hamada, Y., Fukuchi, R., Nomura, S., Norio, S., Kiguchi, T., and Ueki, K.: Quantitative logging data clustering with hidden Markov model to assist log unit classification, Earth Planets Space, 74, 93, https://doi.org/10.1186/s40623-022-01651-0, 2022.
Yau, A. M., Bender, M. L., Blunier, T., and Jouzel, J.: Setting a chronology for the basal ice at Dye-3 and GRIP: Implications for the long-term stability of the Greenland Ice Sheet, Earth Planet. Sc. Lett., 451, 1–9, https://doi.org/10.1016/J.EPSL.2016.06.053, 2016.