the Creative Commons Attribution 4.0 License.
the Creative Commons Attribution 4.0 License.
 | 25 Jun 2025
Rapid communication: Nonlinear sensitivity of the El Niño–Southern Oscillation across climate states
Pedro L. da Silva Dias
Laurie Menviel
The El Niño–Southern Oscillation (ENSO) is the dominant mode of tropical climate variability. Understanding its sensitivity to climate states is of societal and ecosystem importance given the unabated global warming. Palaeoclimate archives and climate models suggest that ENSO activity depends on mean state conditions. However, a common mechanism that can predict ENSO variability under a range of background conditions remains elusive. Here we combine climate model simulations of past climates and future warming, performed under the Paleoclimate Modelling Intercomparison Project (PMIP) and the Coupled Model Intercomparison Project (CMIP), to evaluate ENSO activity throughout a wide range of climate states. We find that the sensitivity of ENSO to the background climate is nonlinear and tied to the climatological position of the tropical Pacific convection centres, namely the Intertropical Convergence Zone (ITCZ) and the South Pacific Convergence Zone (SPCZ). Simulations with atmospheric CO2 lower than today display a poleward shift in the convergence zones and weakened ENSO. Moderate equatorward shifts in the convergence zones occur under moderate CO2-induced warming increasing ENSO activity, while strong equatorward shifts reduce ENSO variability in extreme CO2 warming scenarios, resulting in a permanent El Niño-like mean state. Our results provide a comprehensive mechanism of how tropical Pacific mean state modulates ENSO activity.
- Article
(5131 KB) - Full-text XML
-
Supplement
(347 KB) - BibTeX
- EndNote


The El Niño–Southern Oscillation (ENSO) is a coupled ocean–atmosphere zonal oscillation sourced in the equatorial Pacific that results in either higher (El Niño) or lower (La Niña) sea surface temperatures (SSTs) in the central eastern Pacific (EP), with strong impacts worldwide (Ropelewski and Halpert, 1987). For this reason, the scientific community has concentrated efforts in identifying changes in ENSO variability and their drivers in past climates and future projections (Cai et al., 2021; Ford et al., 2015; Pontes et al., 2022b; Thirumalai et al., 2024; White and Ravelo, 2020).
The past ∼ 3 200 000 years (∼ 3200 kyr)) encompasses key periods that have been extensively studied, as they can improve our understanding of climate dynamics and help constrain future projections (Burke et al., 2018; Thirumalai et al., 2024). Firstly, the mid-Pliocene warm period (referred to as the mid-Pliocene, 3.205 ka) featured a global mean temperature 2–4 °C higher than pre-industrial and elevated atmospheric CO2 concentrations (∼ 400 ppmv) (Lunt et al., 2012). Over this period, proxy data do not provide a clear picture on ENSO changes and suggest the important role of the sensitivity of the equatorial thermocline in maintaining ENSO activity (Watanabe et al., 2011; White and Ravelo, 2020). Climate models, however, systematically indicate reduced variability driven by a northward shift in the Intertropical Convergence Zone (ITCZ) (Pontes et al., 2022b). Other periods of interest are the Last Interglacial (LIG; ∼ 129–116 kyr), which was the warmest interglacial of the past 800 kyr (PAGES working Group, 2016), and the Mid-Holocene Thermal Maximum (MHTM; ∼ 8–4 kyr). During both the LIG and the MHTM, atmospheric CO2 concentrations were slightly lower than pre-industrial (PI) levels, but boreal summer insolation in the Northern Hemisphere was higher (up to 70 and 25 W m−2, respectively). For both periods, most proxies and models agree on reduced ENSO activity (Brown et al., 2020; Emile-Geay et al., 2016), possibly related to weaker thermocline feedback (Chen et al., 2019), amplified by a stronger Walker circulation (Pausata et al., 2017). Lastly, during the Last Glacial Maximum (LGM; ∼ 21 ka), when CO2 concentrations were ∼ 190 ppmv (Marcott et al., 2014), a deeper equatorial mixed layer is suggested to have driven reduced ENSO variability (Ford et al., 2015; Thirumalai et al., 2024).
While palaeo-modelling studies indicate reduced ENSO variability, future projections suggest enhanced ENSO variability under anthropogenic warming for the 21st century, which is attributed to enhanced upper-ocean stratification (Cai et al., 2018). Nevertheless, extended simulations of the high-emissions scenario (SSP5-8.5) until 2300 and equilibrated long-term (over 1000 years) CO2-driven simulations (e.g. abrupt 4 and 8 times CO2) under the Long Run Model Intercomparison Project (LongRunMIP) show a robust decrease in ENSO (Callahan et al., 2021; Peng et al., 2024; Zheng et al., 2022). ENSO decline under these scenarios has been attributed to collapsed eastern Pacific upwelling and weakened zonal SST gradient.
Studies of specific time slices and scenarios led to significant advancements in the understanding of ENSO's dynamical processes. These studies usually suggest that changes in the equatorial Pacific mean state (e.g. upwelling, zonal SST gradient, and ITCZ) are responsible for changing ENSO activity, thus contributing to the hypothesis that ENSO is modulated by the background state. Under this hypothesis, a strong mean circulation (i.e. La Niña-like mean state) inhibits the development of wind and SST anomalies, effectively suppressing ENSO variability, while a weak mean circulation (i.e. El Niño-like mean state) favours the development of anomalies that can lead to ENSO events. However, the evaluation of a single scenario provides a limited view of the broader ENSO response across climate states. To comprehensively evaluate whether and how ENSO activity can be modulated by the mean state, a consistent framework that covers a wide range of background states is needed. In this context, we combine climate model output from the Coupled Intercomparison Project phase 6 (CMIP6) and Paleoclimate Modelling Intercomparison Project phase 4 (PMIP4), covering seven different scenarios, to investigate the role of the Pacific Ocean mean state in modulating ENSO variability.
Here, we analyse four past climate scenarios part of PMIP4: the mid-Pliocene (KM5c interglacial time slice; Haywood et al., 2020), the Last Interglacial (LIG, 127 ka; Otto-Bliesner et al., 2021), the Mid-Holocene Thermal Maximum (MHTM; 6 ka; Brierley et al., 2020), and the Last Glacial Maximum (LGM; 21 ka; Kageyama et al., 2021). In addition, we incorporate in our analysis extended future projections of the high- (SSP5-8.5) and low-emissions (SSP1-2.6) scenarios (O'Neill et al., 2016). In SSP5-8.5, anthropogenic radiative forcing continues to increase beyond the year 2100, reaching a level of ∼ 12 W m−2 in 2250 and stabilising afterwards. In SSP1-2.6, radiative forcing reaches 2.6 W m−2 in 2100 and then slowly declines, stabilising at around 2.0 W m−2 onwards from 2200. Finally, we also include the hypothetical scenario that abruptly increases atmospheric CO2 to 4 times pre-industrial levels (abrupt-4xCO2). These data total 83 simulations covering seven different scenarios (Table S1 in the Supplement). We use each model's pre-industrial (PI) control simulation (CO2 = 284 ppmv) as reference for all scenarios. For all palaeoclimate experiments (including abrupt4xCO2 and piControl), we use the last 100 years of each model's simulation. For the future scenarios, SSP5-8.5 and SSP1-2.6, we use the time slice from years 2251 to 2300 (referred to as SSP585-23 and SSP126-23, respectively) as representative of a near-equilibrium state.
Given that ENSO is a complex phenomenon of ocean–atmosphere interaction, not all climate models accurately simulate key processes of ENSO dynamics, resulting in poor ENSO simulations. To avoid being misled by results from models that do not capture ENSO dynamics properly, we apply a selection criterion based on the nonlinear convective feedback, which contributes to the observed positive skewness of SST anomalies in the eastern Pacific (Appendix A) (Dommenget et al., 2012). Here, we use data from the Global Precipitation Climatology Project (Adler et al., 2003) and the Hadley Centre Sea Surface Temperature (Rayner et al., 2003) datasets to calculate the strength of this feedback in observations. This results in 61 selected simulations of past climates and future scenarios (Table S1).
We use the standard deviation of SST anomalies in the Niño3 region (5° S–5° N, 150–90° W) as a measure of ENSO amplitude (Taschetto et al., 2014). SST time series were linearly detrended to remove possible model drift in all simulations. SST anomalies are computed by removing the mean annual cycle at a monthly resolution.
Lastly, we evaluate the nonlinear ENSO sensitivity to the background state through the nonlinear coefficient (a) of the quadratic regression model (), while the precision of the nonlinear relationship is assessed through the coefficient of determination (R2).
3.1 Mean state changes and ENSO activity
All three past warm climates (mid-Holocene, Last Interglacial, and mid-Pliocene) share similar conditions in the tropical Pacific Ocean, though for different reasons (Brierley et al., 2020; Otto-Bliesner et al., 2021; Pontes et al., 2020). Firstly, the ITCZ shifts northward in all warm palaeoclimate scenarios considered due to increased differences in inter-hemispheric warming. In the mid-Pliocene simulations, this is attributed to enhanced albedo feedback in the Northern Hemisphere due to large sea ice and land ice losses and enhanced vegetation area, while increased insolation in the Northern Hemisphere is the main driver in the MHTM and LIG (Brierley et al., 2020; Otto-Bliesner et al., 2021; Pontes et al., 2020). An ITCZ displaced northward allows intensified equatorial trade winds in the central western Pacific (Fig. 1a–c), which cause SSTs to be lower in the equatorial Pacific than in the surrounding area due to the wind–evaporation–SST feedback (Vimont et al., 2001), thus strengthening the equatorial upwelling (Fig. 1a–c). Such climatic anomalies resemble a La Niña-like mean state, associated with reduced ENSO variability (Fig. 1g; Table S1).
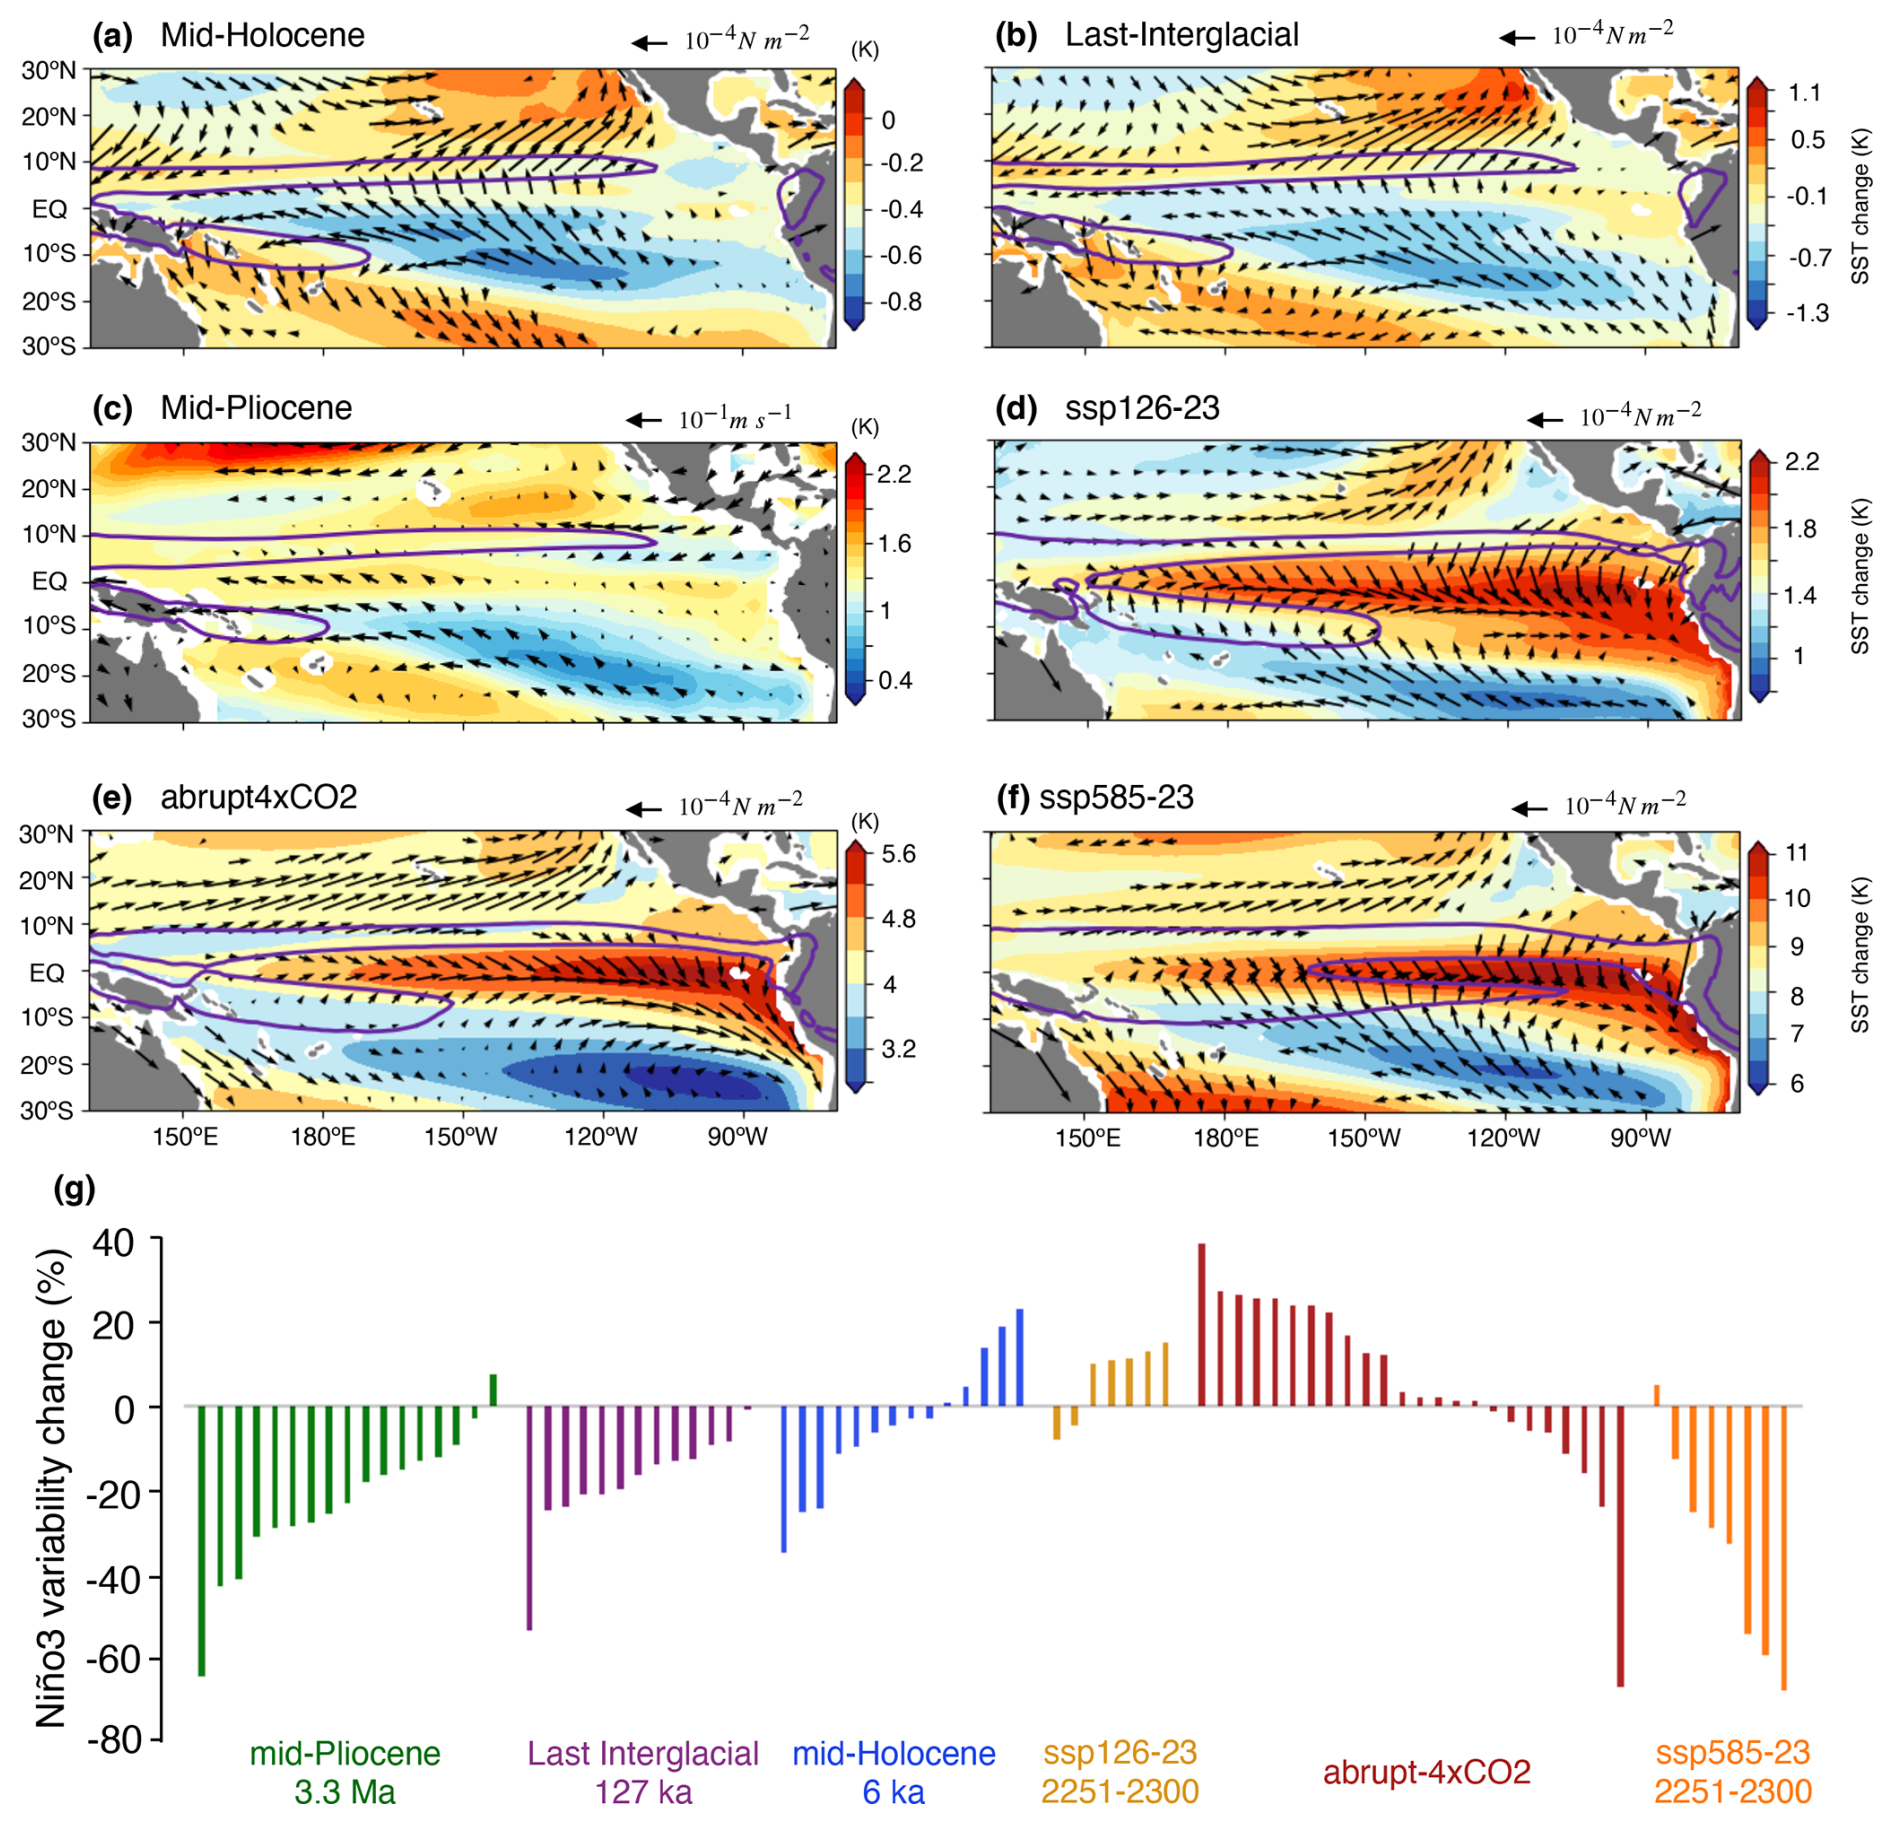
Figure 1Climate anomalies and ENSO variability change. Multi-model annual mean changes in SST and wind field for the mid-Holocene (a), Last Interglacial (b), mid-Pliocene (c), SSP126-23 (d), abrupt-4xCO2 (e), and SSP585-23 (f). The colour bar varies for each panel to highlight regions where SST changes are higher (warm colours) and lower (cold colours) than the mean tropical Pacific warming in each ensemble, making changes in SST gradients easily identifiable. Arrows represent changes in wind stress in all panels but panel (c), where they represent changes in surface winds due to data availability. Arrows are plotted where there is a significant change in either zonal or meridional component (70 % model agreement in the sign of the change). Purple lines indicate the multi-model mean 8 mm d−1 climatological rainfall contours for each time slice as an estimate of the ITCZ and SPCZ positions. (g) Change in Niño3 standard deviation for each simulation used in this study. The pre-industrial control simulation is used as reference when quantifying changes. Analyses shown in this figure include results from all models, with no selection criteria being applied. Values for each simulation can be found in Table S1. Maps in this figure were plotted using the Cartopy Python library.
In contrast, CO2-driven scenarios (SSP126-23, SSP585-23, and abrupt4xCO2) resemble an El Niño-like mean state (Fig. 1d). It is interesting to note that, as the SST warming intensifies, both the ITCZ and the South Pacific Convergence Zone (SPCZ) tend to move equatorward (Fig. 1d–f), progressively weakening the equatorial trades and eastern upwelling. In moderate CO2-driven warming scenarios (e.g. SSP126-23), these changes allow enhanced ENSO variability (Fig. 1g). Interestingly, however, ENSO variability tends to decrease under strong warming scenarios (e.g. SSP585-23), when the ITCZ and SPCZ are nearly collapsed at the Equator (Fig. 1e–g), thus resulting in a nonlinear ENSO response to the background state. As the position of the convergence zones can be directly modulated by changes in the atmospheric meridional heat transport (Pontes et al., 2020; Schneider et al., 2014), which provides a linkage between equatorial Pacific and large-scale changes (e.g. orbital forcing and ice sheets), we use them as a proxy for changes in the tropical Pacific mean state.
3.2 Role of the Pacific convergence zones
To evaluate the effect of the position of the convergence zones on ENSO activity, we develop an index that captures their combined displacement during the developing and mature ENSO phases (austral spring and summer) (Pontes et al., 2022a). The ITCZ and SPCZ positions are computed as the precipitation-weighted average over latitudes in which precipitation is greater than 70 % of the maximum zonally averaged precipitation in each hemisphere (0–20° N and 20–0° S). This methodology captures migrations of the ITCZ and the SPCZ independently from one another. As our objective is to quantify their overall displacement relative to the Equator (e.g. equatorward shift in the ITCZ and SPCZ represent an El Niño-like mean state), we consider their absolute values. The index D is obtained through quantifying their combined displacement relative to the model's pre-industrial position:
where the subscript “S” indicates the position of the ITCZ and SPCZ in the perturbation scenarios and the subscript “PI” denotes their position in their respective pre-industrial simulation. Hereafter, the index D is referred to as the convection centre index and is, by definition, positive for poleward displacements of the convergence zones. It is important noting that, in all scenarios, the Pacific ITCZ lies in the Northern Hemisphere; therefore a poleward movement reflects a northward shift, whereas, for the SPCZ, a poleward displacement reflects a southward shift.
It is important to note that double-ITCZ biases may affect the calculated SPCZ position. The double-ITCZ bias is an artificial feature produced by most climate models that overestimates the tropical precipitation south of the Equator in the central eastern Pacific. This biased precipitation artificially induces the index D to capture an apparent SPCZ displaced northwards. Nevertheless, although being an artificial feature, the double ITCZ dynamically influences the tropical Pacific climate through simulating weaker trade winds and warmer SSTs than in observations, thereby affecting the model's ENSO response. We thus do not differentiate between the southern branch of the double ITCZ and the SPCZ in our evaluation.
We find that the ENSO–convection centre relationship is nonlinear (Fig. 2 and Table S1). This relationship indicates that there are two mean states that tend to inhibit ENSO development and that there is an optimal distance at which the convection centres must be from the Equator to maximise ENSO variability. Overall, poleward (D > 0°) and strong equatorward (D < −8°) shifts in the convection centres, relative to their position in the PI climate, are associated with reduced ENSO variability, whereas moderate equatorward shifts (−8° < D < 0°) enhance ENSO activity. An analysis of how this relationship affects central Pacific (CP) and eastern Pacific ENSO types and the 21st-century transient ENSO response is included in Appendix B.
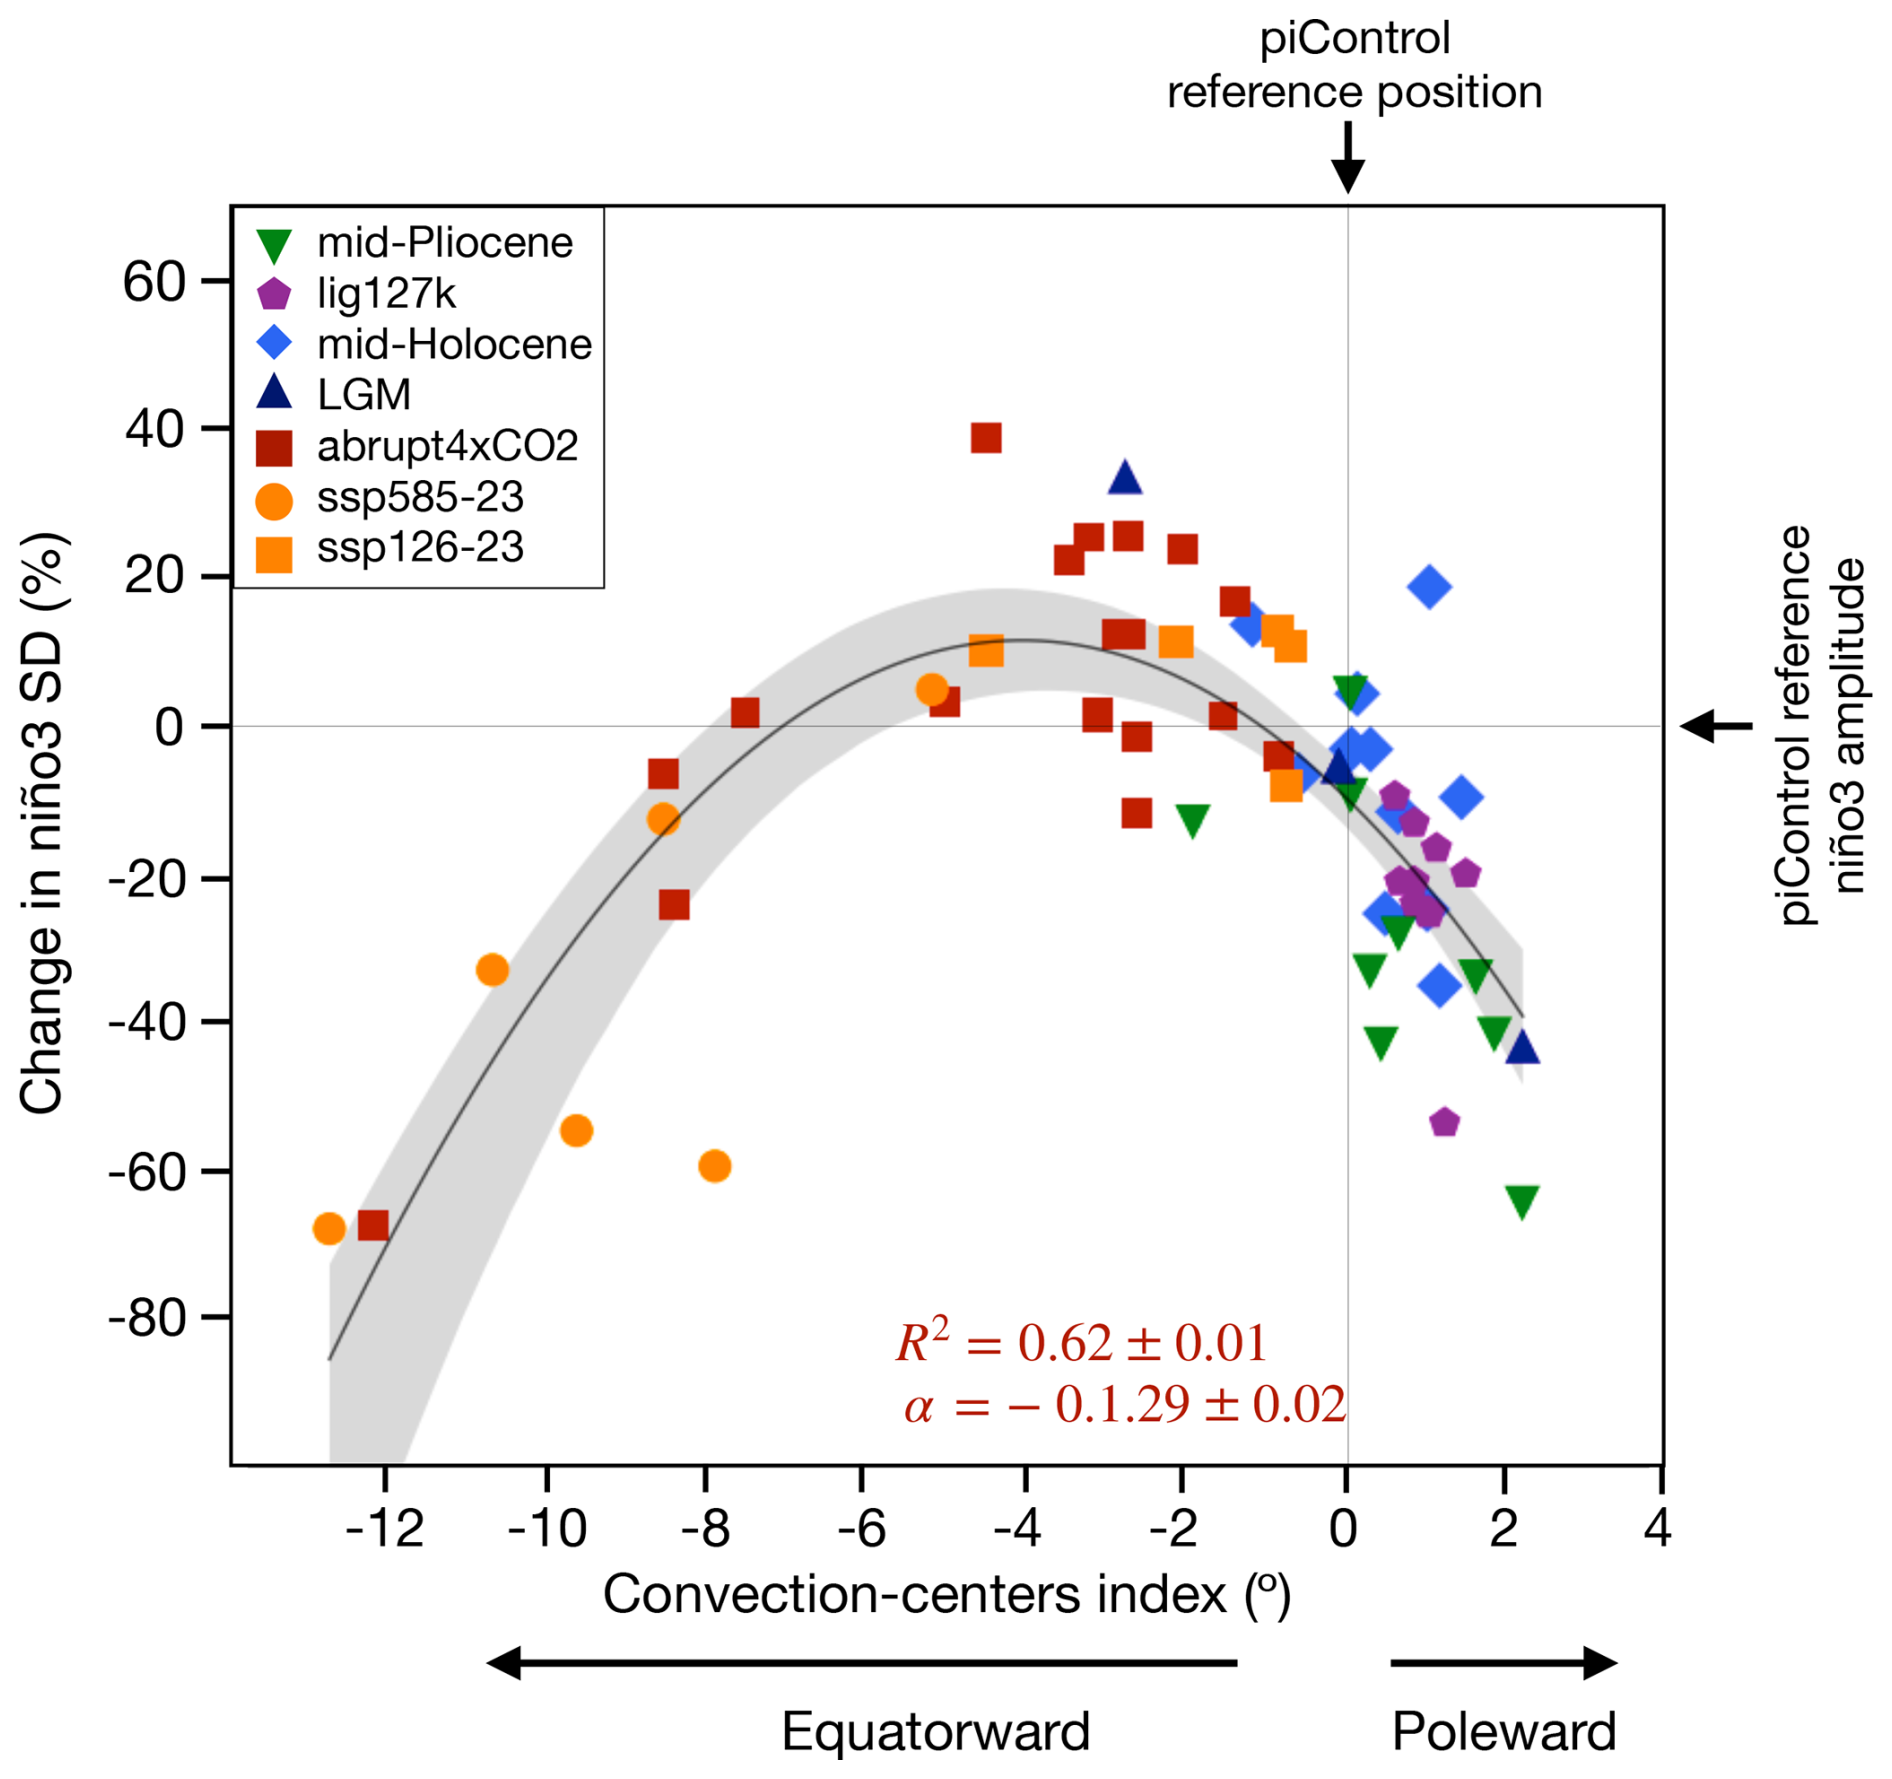
Figure 2Nonlinear ENSO sensitivity across climate states. Relationship between the convection centre index and the change in Niño3 amplitude, measured by its standard deviation (SD). The solid black line indicates the quadratic fit based on the least-squares method. Banding indicates the 95 % confidence interval based on a 1000-sample bootstrap. The mean displacement of the convection centres during boreal spring and summer is considered (i.e. encompassing developing and mature ENSO phases). R2 indicates the coefficient of determination, and a indicates the nonlinear coefficient of the quadratic regression model. Error estimates for R2 and a were calculated as 1 standard deviation based on 1000 bootstrap realisations. The convection centre index is, by definition, positive for poleward movements of the convergence zones referenced at each model's pre-industrial position. Values for each model are presented in Table S1.
In exploring the causes of the nonlinear sensitivity of ENSO to background state, we find that the position of the convergence zones modulates both atmospheric and oceanic processes important for ENSO development. Firstly, we investigate the rainfall response to the convection centre migration through evaluating the frequency of extreme rainfall events (> 5 mm d−1) in the eastern Pacific (Niño3 region) associated with the displacement of the convergence zones (Fig. 3a). We find that poleward shifts in the convergence zones reduce the frequency of extreme events from one event per 15.3 ± 7.5 years in the PI to one event per 26.9 ± 18.3 years, indicating suppressed convective feedback (Fig. 3a). The convective feedback is further suppressed as the convergence zones shift poleward until a full La Niña-like mean state is reached and no extreme El Niño events occur, which is illustrated by the CCSM4-Utrecht mid-Pliocene simulation (Fig. 3a; Table S1). Moderate equatorward shifts in the convection centres allow more intense convective feedback and increased frequency of extreme events (one event per 2.9 ± 0.4 years; Fig. 3a). This is consistent with studies which suggested that, as ENSO's frequency approaches the annual cycle frequency (represent here by one event per year), ENSO variability tends to increase (Liu, 2002; Timmermann et al., 2007), a process known as “ENSO frequency entrainment”. Strong equatorward displacements of the convection centres (−12° < D < −8°) result in more intense convective feedback, associated with reduced SST variability (Fig. 3a). In this case, ENSO frequency is nearly fully entrained in the annual cycle at 1.2 ± 0.06 events per year, thus making El Niño events more predictable. Finally, full equatorward shifts in the convergence zones (D < −12°) indicate a “permanent El Niño” situation, and ENSO's frequency is fully entrained into the annual cycle (one event per year), thus indicating these events are not related to intensified anomalous convective feedback but are due to the convergence zones being within the equatorial band.
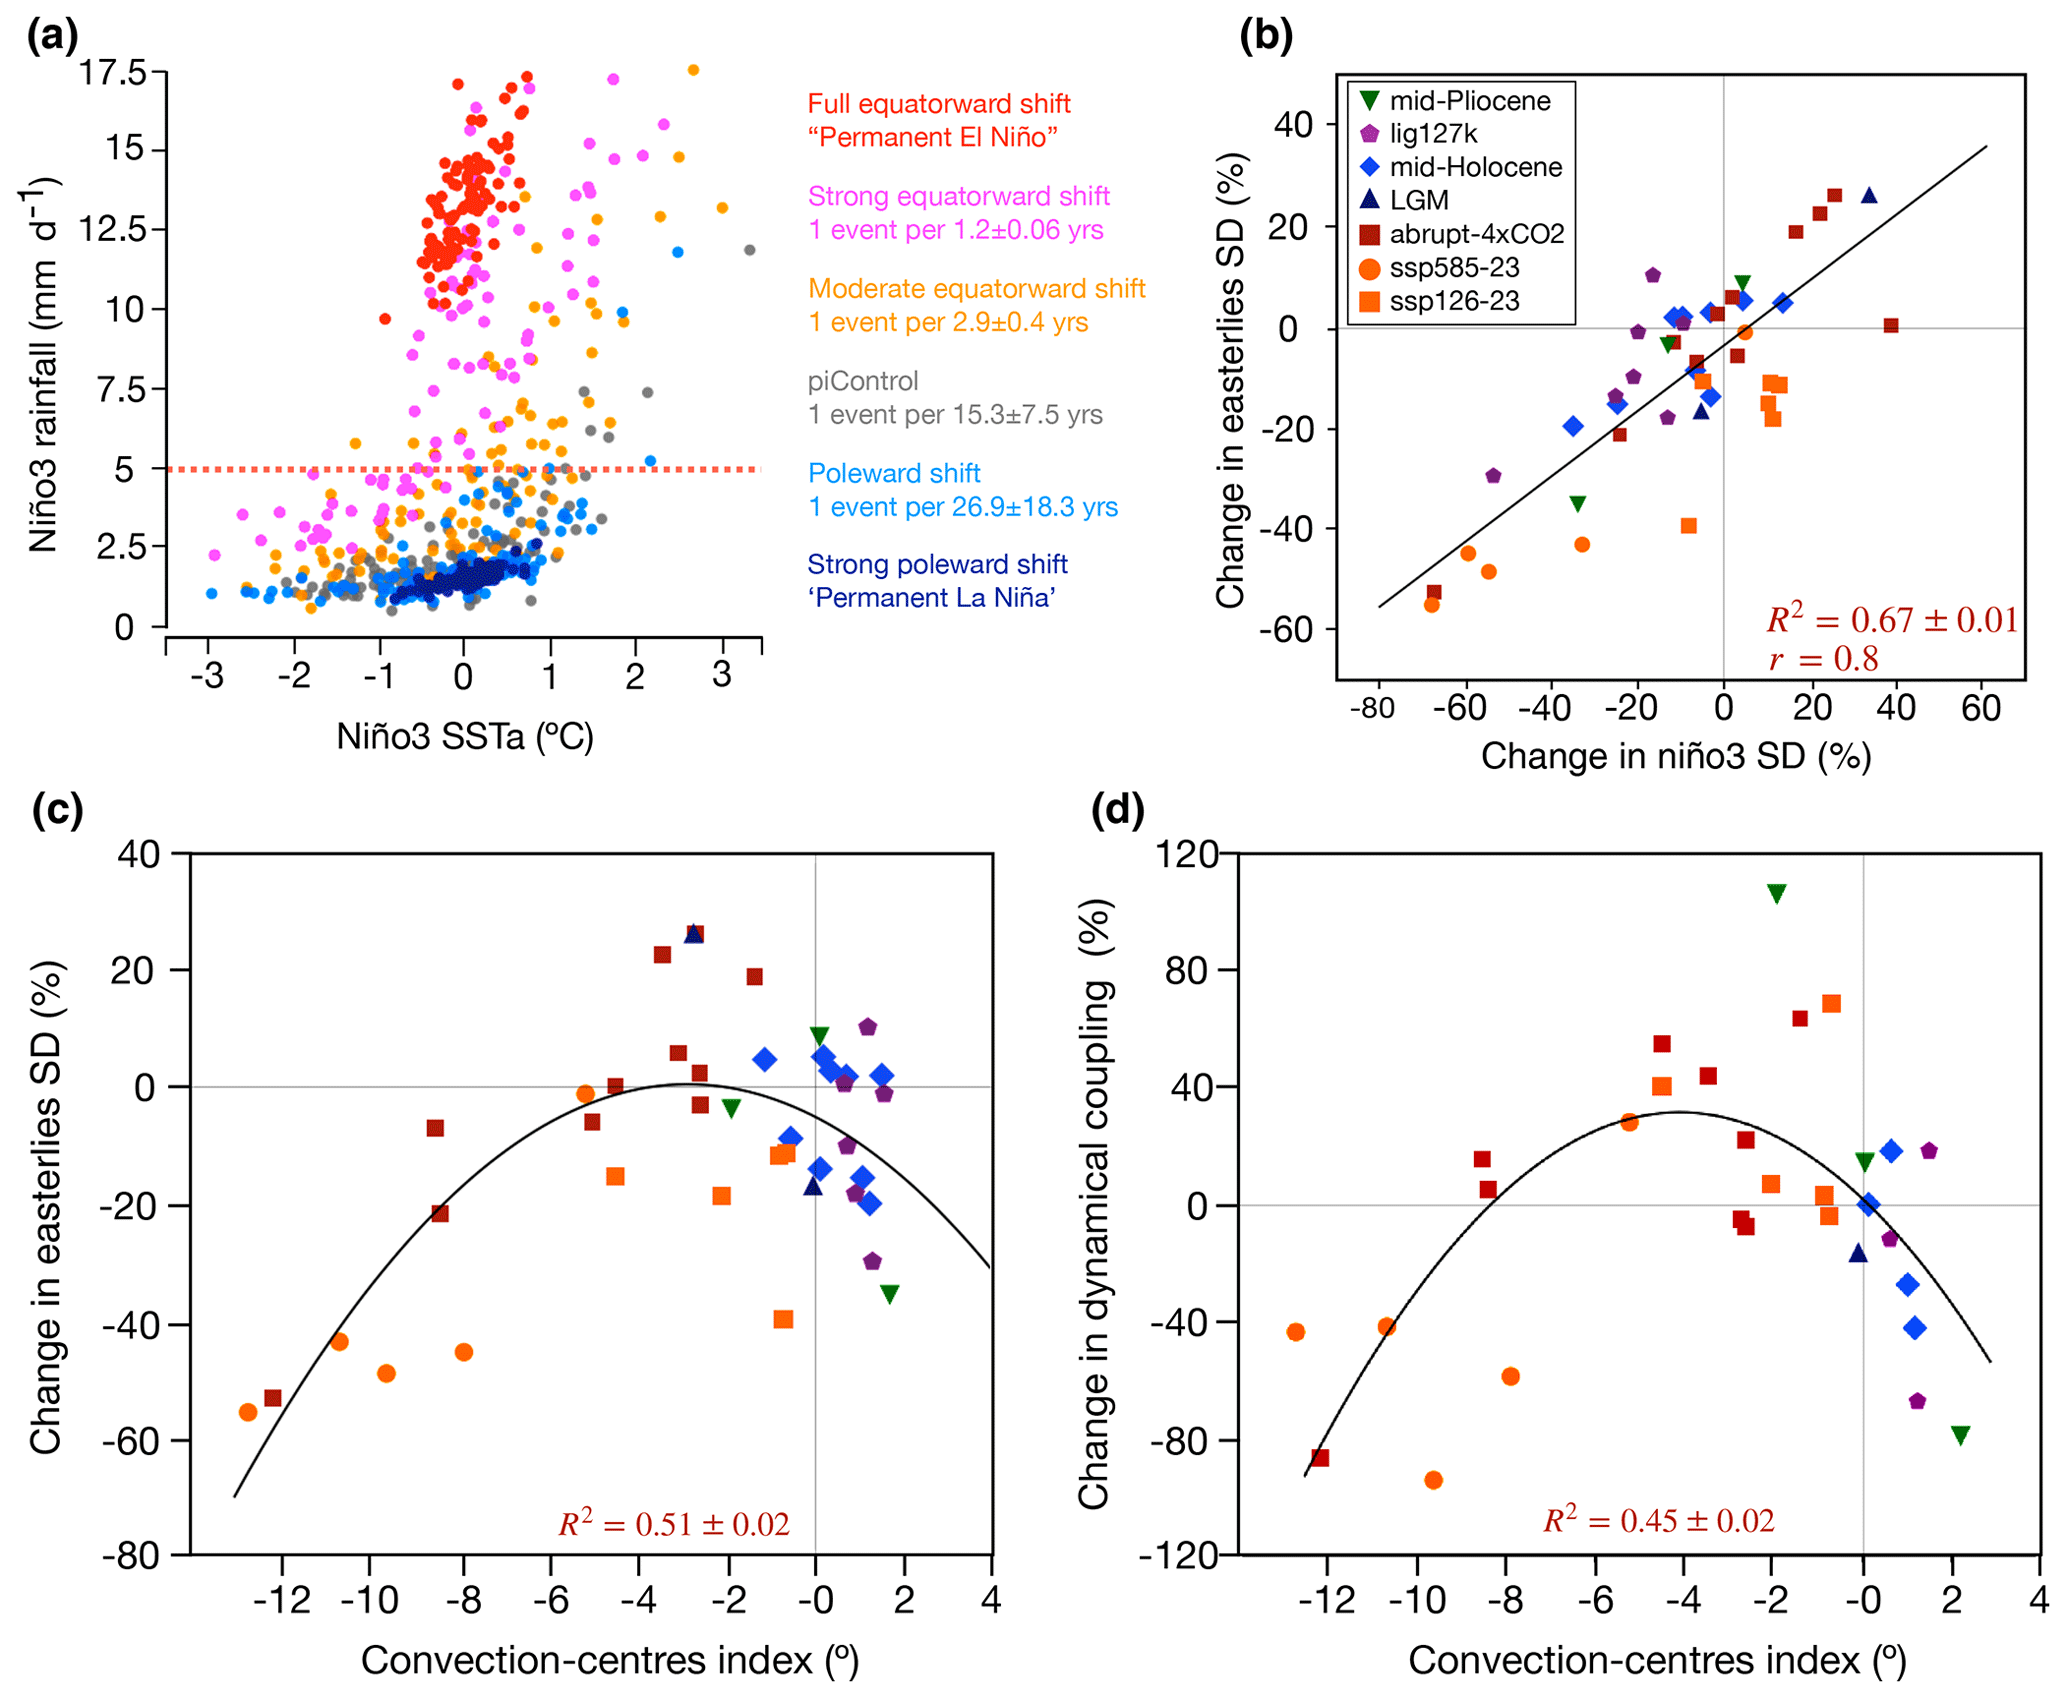
Figure 3Equatorial Pacific climate and ENSO feedbacks. (a) Nonlinear convective feedback: relationship between DJF Niño3 SST anomalies and DJF Niño3 rainfall. The first 100 years of 1000 bootstrap realisation is shown to illustrate the relationship in each group: pre-industrial control and moderate equatorward (−8° < D < 0°), strong equatorward (−12° < D < −8°), full equatorward (D < −12°), poleward (D > 0°), and strong poleward (represented by CCSM4-Utrecht mid-Pliocene simulation) displacements. The frequency of extreme events is indicated by the bootstrap mean frequency of events that exceeded 5 mm d−1 (dashed orange line) across all realisations. Error estimates are indicated by the standard deviation of the realisations. (b) Inter-model relationship between the convection centre index and the change in easterly wind variability in the western equatorial Pacific (5° S–5° N, 160–210° E). (c) Inter-model relationship between the convection centre index and the change in easterly wind variability. (d) Inter-model relationship between the convection centre index and the wind–thermocline coupling coefficient. R2 indicates the coefficient of determination of the quadratic regression model. Error estimates are given by the standard deviation of 1000 bootstrap realisations. Results shown in this figure were obtained through analyses of the subset models that best simulate the equatorial nonlinear convective feedback (Table S1).
Another important process in ENSO dynamics is the easterly wind variability in the western Pacific (Niño4 region: 160° E–150° W). The intensity of the winds in this region has been shown to determine the amplitude of their variability (Pontes et al., 2022b), which is related to the intensity and frequency of westerly wind bursts, important for ENSO initiation (Chen et al., 2015). In this context, we find that the position of the convection centres also modulates the wind variability through a quadratic relationship (R2 = 0.51; Fig. 3c). The two scenarios that show reduced wind variability are consistent with reduced ENSO activity. Poleward movement of the convection centres increases the horizontal scale of the wind flow that reaches the western Pacific, generating wind anomalies in the South Pacific Subtropical High region, indicating that this new regime is more geostrophic and therefore more linearly balanced and deterministic (Fig. 1a–c). On the other hand, strong equatorward shifts in the convection centres require weak horizontal wind intensity within the equatorial band, thus suppressing the development of wind anomalies (Fig. 3b). Despite the consistency between changes in easterly wind variability and the position of the convergence zones, changes in wind variability cannot solely explain the nonlinear sensitivity of ENSO across climate states (Fig. 3b). The relationship between changes in easterly wind variability and ENSO is linear and does not distinguish between mean states of reduced (e.g. palaeo) and amplified (e.g. future) equatorial warming.
Finally, to investigate the possible modulation of the position of the convergence zones on the ocean–atmosphere dynamical coupling, we analyse the response of the wind–thermocline coefficient (Appendix C) (Jin et al., 2006). This parameter measures the sensitivity of thermocline slope anomalies to wind stress anomalies, which, during El Niño events, result in eastward heat advection by downwelling equatorial Kelvin waves (Timmermann et al., 2018). Our results indicate that the displacement of the convection centres also modulates the wind–thermocline coefficient through a quadratic relationship (R2 = 0.45; Fig. 3d). Through affecting the horizontal wind field, the position of the convergence zones underpins the momentum transfer from the atmosphere, influencing oceanic stratification and the thermocline slope in the equatorial Pacific. As strong equatorward shifts in the convergence zones drive weak trades and collapsed eastern upwelling, they reduce the effectiveness of wind anomalies in generating swings of the thermocline. Furthermore, the propagation of Kelvin waves in a flat thermocline does not effectively promote oscillations between El Niño and La Niña anomalies. Poleward shifts in the convection centres increase the climatological thermocline slope, requiring stronger wind anomalies to promote thermocline oscillation and thus reducing the effectiveness of dynamical air–sea coupling.
Our findings suggest that meridional shifts in the convergence zones modulate key processes for ENSO development, such as equatorial convection, trade wind variability, and zonal thermocline oscillations. The interplay of these processes results in a nonlinear ENSO sensitivity to mean states, encompassing three distinct background conditions deviating from the pre-industrial climate (Fig. 4): (1) poleward migrations of the convection centres intensify the equatorial trades, weaken the convective feedback, increase momentum transfer to the upper ocean, reduce ocean stratification, and ultimately result in a weaker dynamical coupling, thus dampening ENSO variability and resembling a La Niña-like mean state (Fig. 4c); (2) moderate equatorward shifts in the convection centres (−8° < D < 0°) reduce the intensity of the equatorial trades and increase upper-ocean stratification, consequently amplifying the dynamical air–sea coupling and permitting equatorial trades and the thermocline slope to be rapidly reversed, thus enhancing ENSO activity and extreme rainfall events (Fig. 4b); (3) strong equatorward shifts in the convection centres create a permanent El Niño-like mean state in the eastern Pacific (Fig. 4a). The fact that the convection centres lie at the Equator does not allow momentum transfer to the ocean, resulting in a highly stratified ocean and dampened dynamical coupling. Nonetheless, this scenario is associated with intense warming in the eastern Pacific that enhances the climatological thermodynamical coupling, where climatological high SSTs allow continuous intense rainfall.
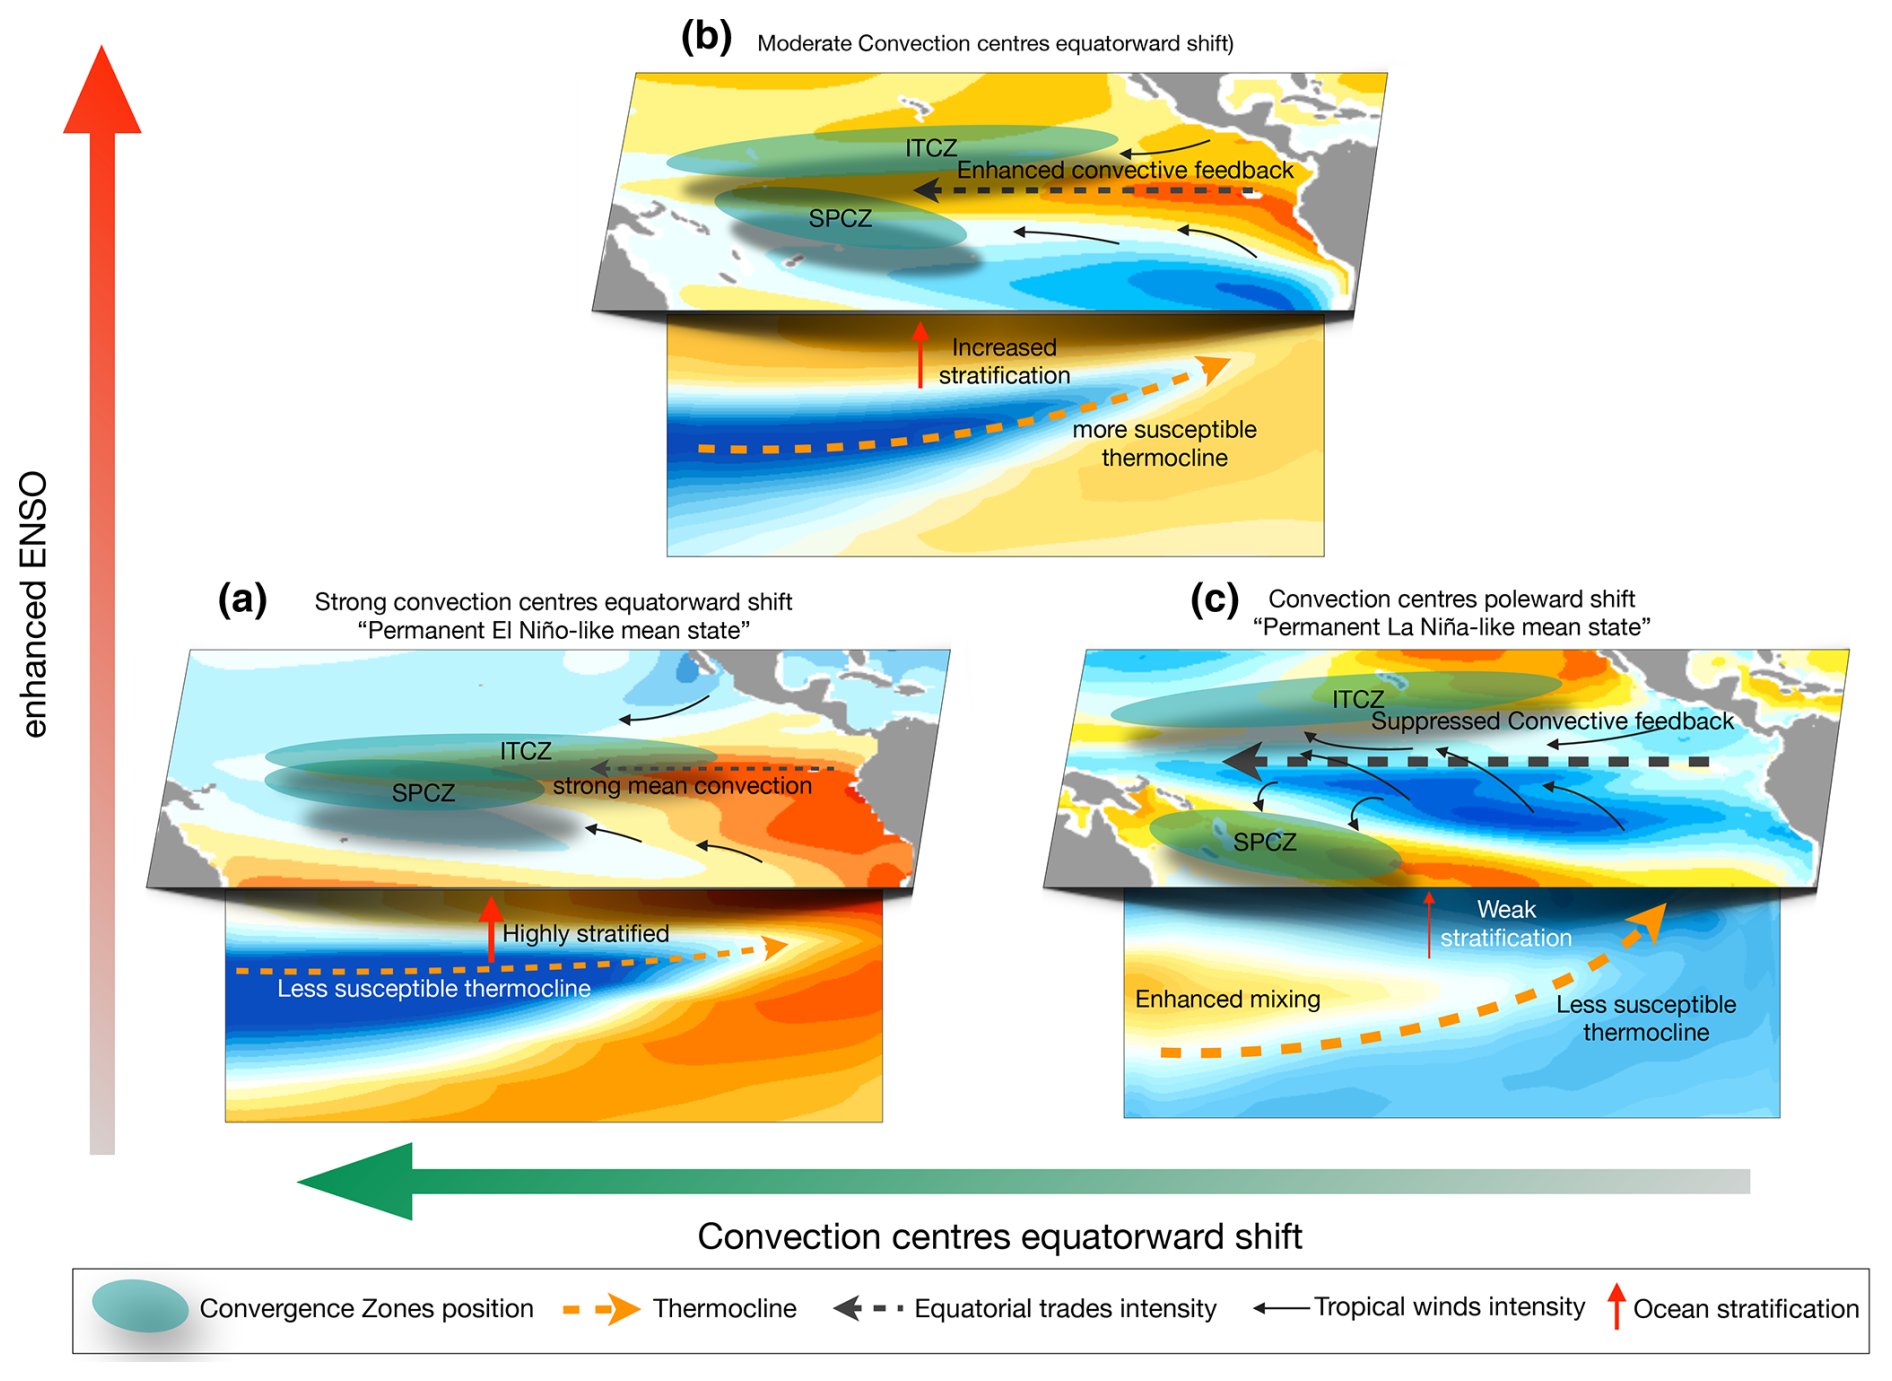
Figure 4Mechanisms for changes in ENSO activity across climate states. Schematic of mean state features associated with ENSO variability. (a) A strong equatorward shift in the convection centres results in a flat thermocline, a highly stratified upper ocean, and weak dynamical coupling, thus reducing ENSO activity. (b) A moderate equatorward shift in the convection centres weakens the equatorial coupled circulation and increases the dynamical coupling, increasing thermocline swings and ENSO variability. (c) A poleward shift in convection centres enhances equatorial coupled circulation and reduces the dynamical coupling and ENSO activity. All comparison statements are relative to the pre-industrial climate. Maps in this figure were plotted using the Cartopy Python library.
The proposed mechanism can reconcile divergences in ENSO responses in proxy data and modelling studies. Firstly, modelling results from the idealised abrupt4xCO2 simulations indicate inconsistent inter-model ENSO response. We showed that this is related to the sensitivity of ITCZ and SPCZ migrations in each model. This argument can be expanded for meltwater-induced AMOC weakening modelling studies and proxy data covering Heinrich stadials and the Younger Dryas, which often do not agree on the ENSO response (Glaubke et al., 2024; Liu, 2002; Timmermann et al., 2007). This could be related to the different responses of the Pacific convergence zones to the intensity and duration of meltwater pulses. Finally, our results provide novel insights into the relationship between ENSO frequency and the annual cycle (Liu, 2002), suggesting that a moderate equatorward shift in the convergence zones relaxes both mean horizontal and mean vertical circulations, allowing nonlinear interactions between the annual cycle and ENSO's frequency, thus increasing ENSO's frequency towards the annual cycle. Strong equatorward displacements of the convergence zones result in a strong annual cycle associated with an El Niño-like mean state, thus fully entraining ENSO's frequency into the annual cycle and reducing ENSO's interannual variance.
Our modelling assessment suggests that the projected increase in ENSO variability has likely not occurred in the past ∼ 3.3 Myr. While there are significant uncertainties in both palaeoclimate simulations and palaeo-proxy records, both tend to suggest reduced ENSO variability during the LGM, the LIG, and the mid- to late Holocene (Brown et al., 2020; Emile-Geay et al., 2016; Sachs et al., 2009). While these results agree with our understanding of past ITCZ changes (Sachs et al., 2018; Schneider et al., 2014), past dynamics of the SPCZ need to be better understood and constrained to enhance our ability to predict future ENSO behaviour.
The criteria used to select models that correctly capture the strength of the convective feedback are based on an essential definition of extreme ENSO-related rainfall events, which are defined as precipitation events greater than 5 mm d−1 in the Niño3 region. In observations, the 5 mm d−1 rainfall rate is achieved at an SST anomaly of 2 °C, which gives a convective feedback of 2.5 mm d−1 °C−1 (Fig. A1 and Table S1). To ensure that models capture the observed strength, they are required to simulate convective feedback greater than 2 mm d−1 °C−1 in their pre-industrial runs. Models that do not correctly simulate this feedback tend to simulate SSTs well below or above the convective threshold of 26–28 °C (Johnson and Xie, 2010), resulting in unrealistic convective feedback strength. The model's ability to properly simulate the convective skewness filters out models that systematically simulate overly wet (i.e. double ITCZs) or dry (i.e. overly strong cold tongue) conditions in the eastern equatorial Pacific.
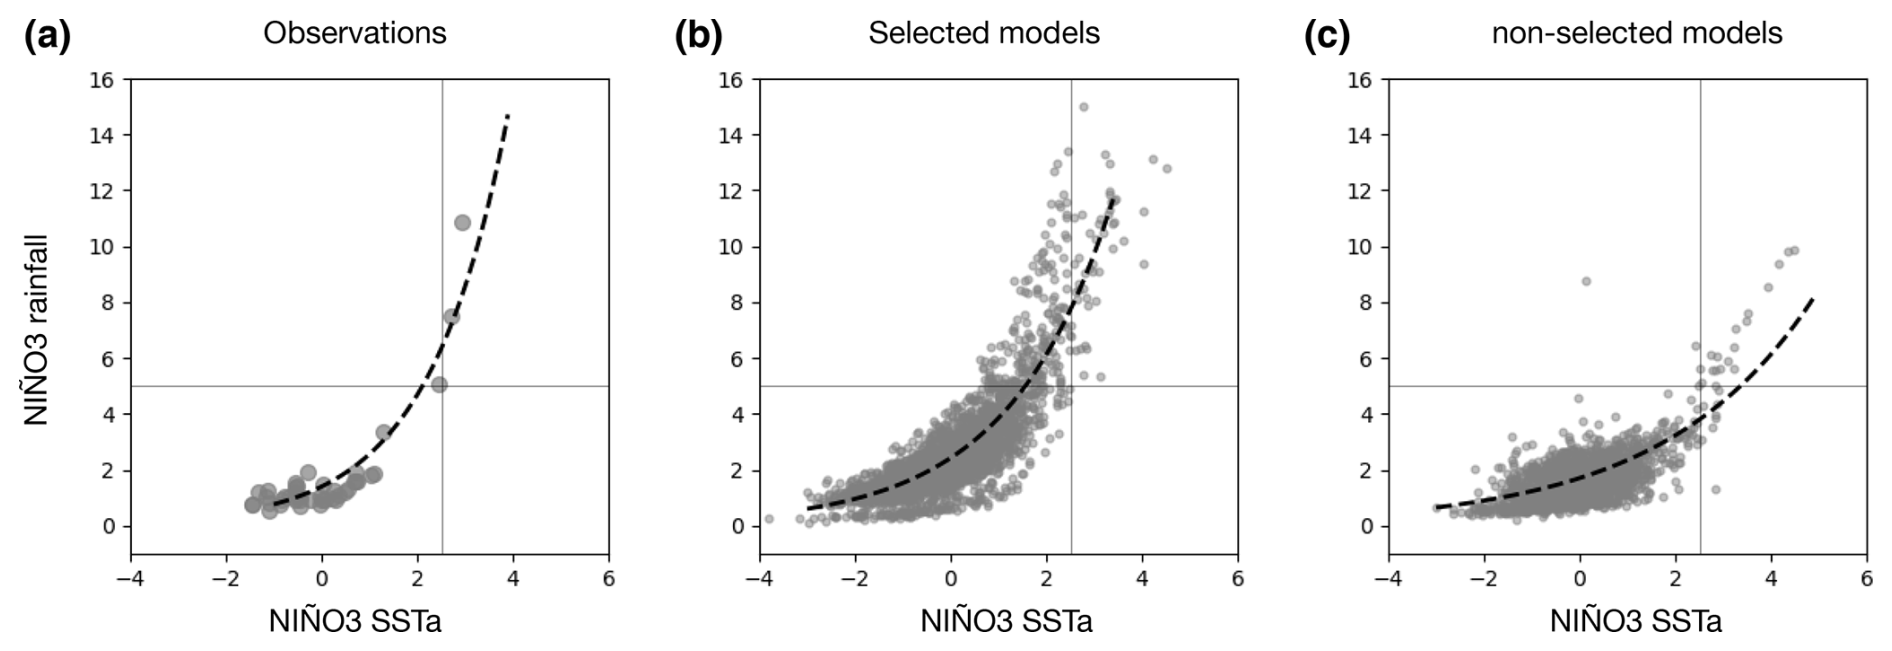
Figure A1Model selection criteria: convective feedback. Relationship between DJF Niño3 SST anomalies and DJF Niño3 rainfall in observations, selected models, and non-selected models. The nonlinear convective criterion is used to select models for the analyses shown in Figs. 2 and 3 in the main article.
To evaluate the transient response of ENSO activity to the position of the convergence zones during the 21st century, we use the SSP3-7.0 scenario. As we compare ENSO variability with the climatological position of the convergence zones, this scenario shows a less intense transient forcing than the SSP5-8.5, thus potentially making this comparison less inaccurate. To reduce this uncertainty, we use the time slice from 2051 to 2100. Results show that the climatological position of the convergence zones also modulates ENSO activity during a transient warming (Fig. B1). Future anthropogenic warming under the SSP3-7.0 scenario tends to displace the convection centres equatorward by up to 4.2°, lying in the group of “enhanced ENSO activity”. Consistently, all models but one simulate increased ENSO activity in the second half of the 21st century under the SSP3-7.0 scenario (Fig. B1).
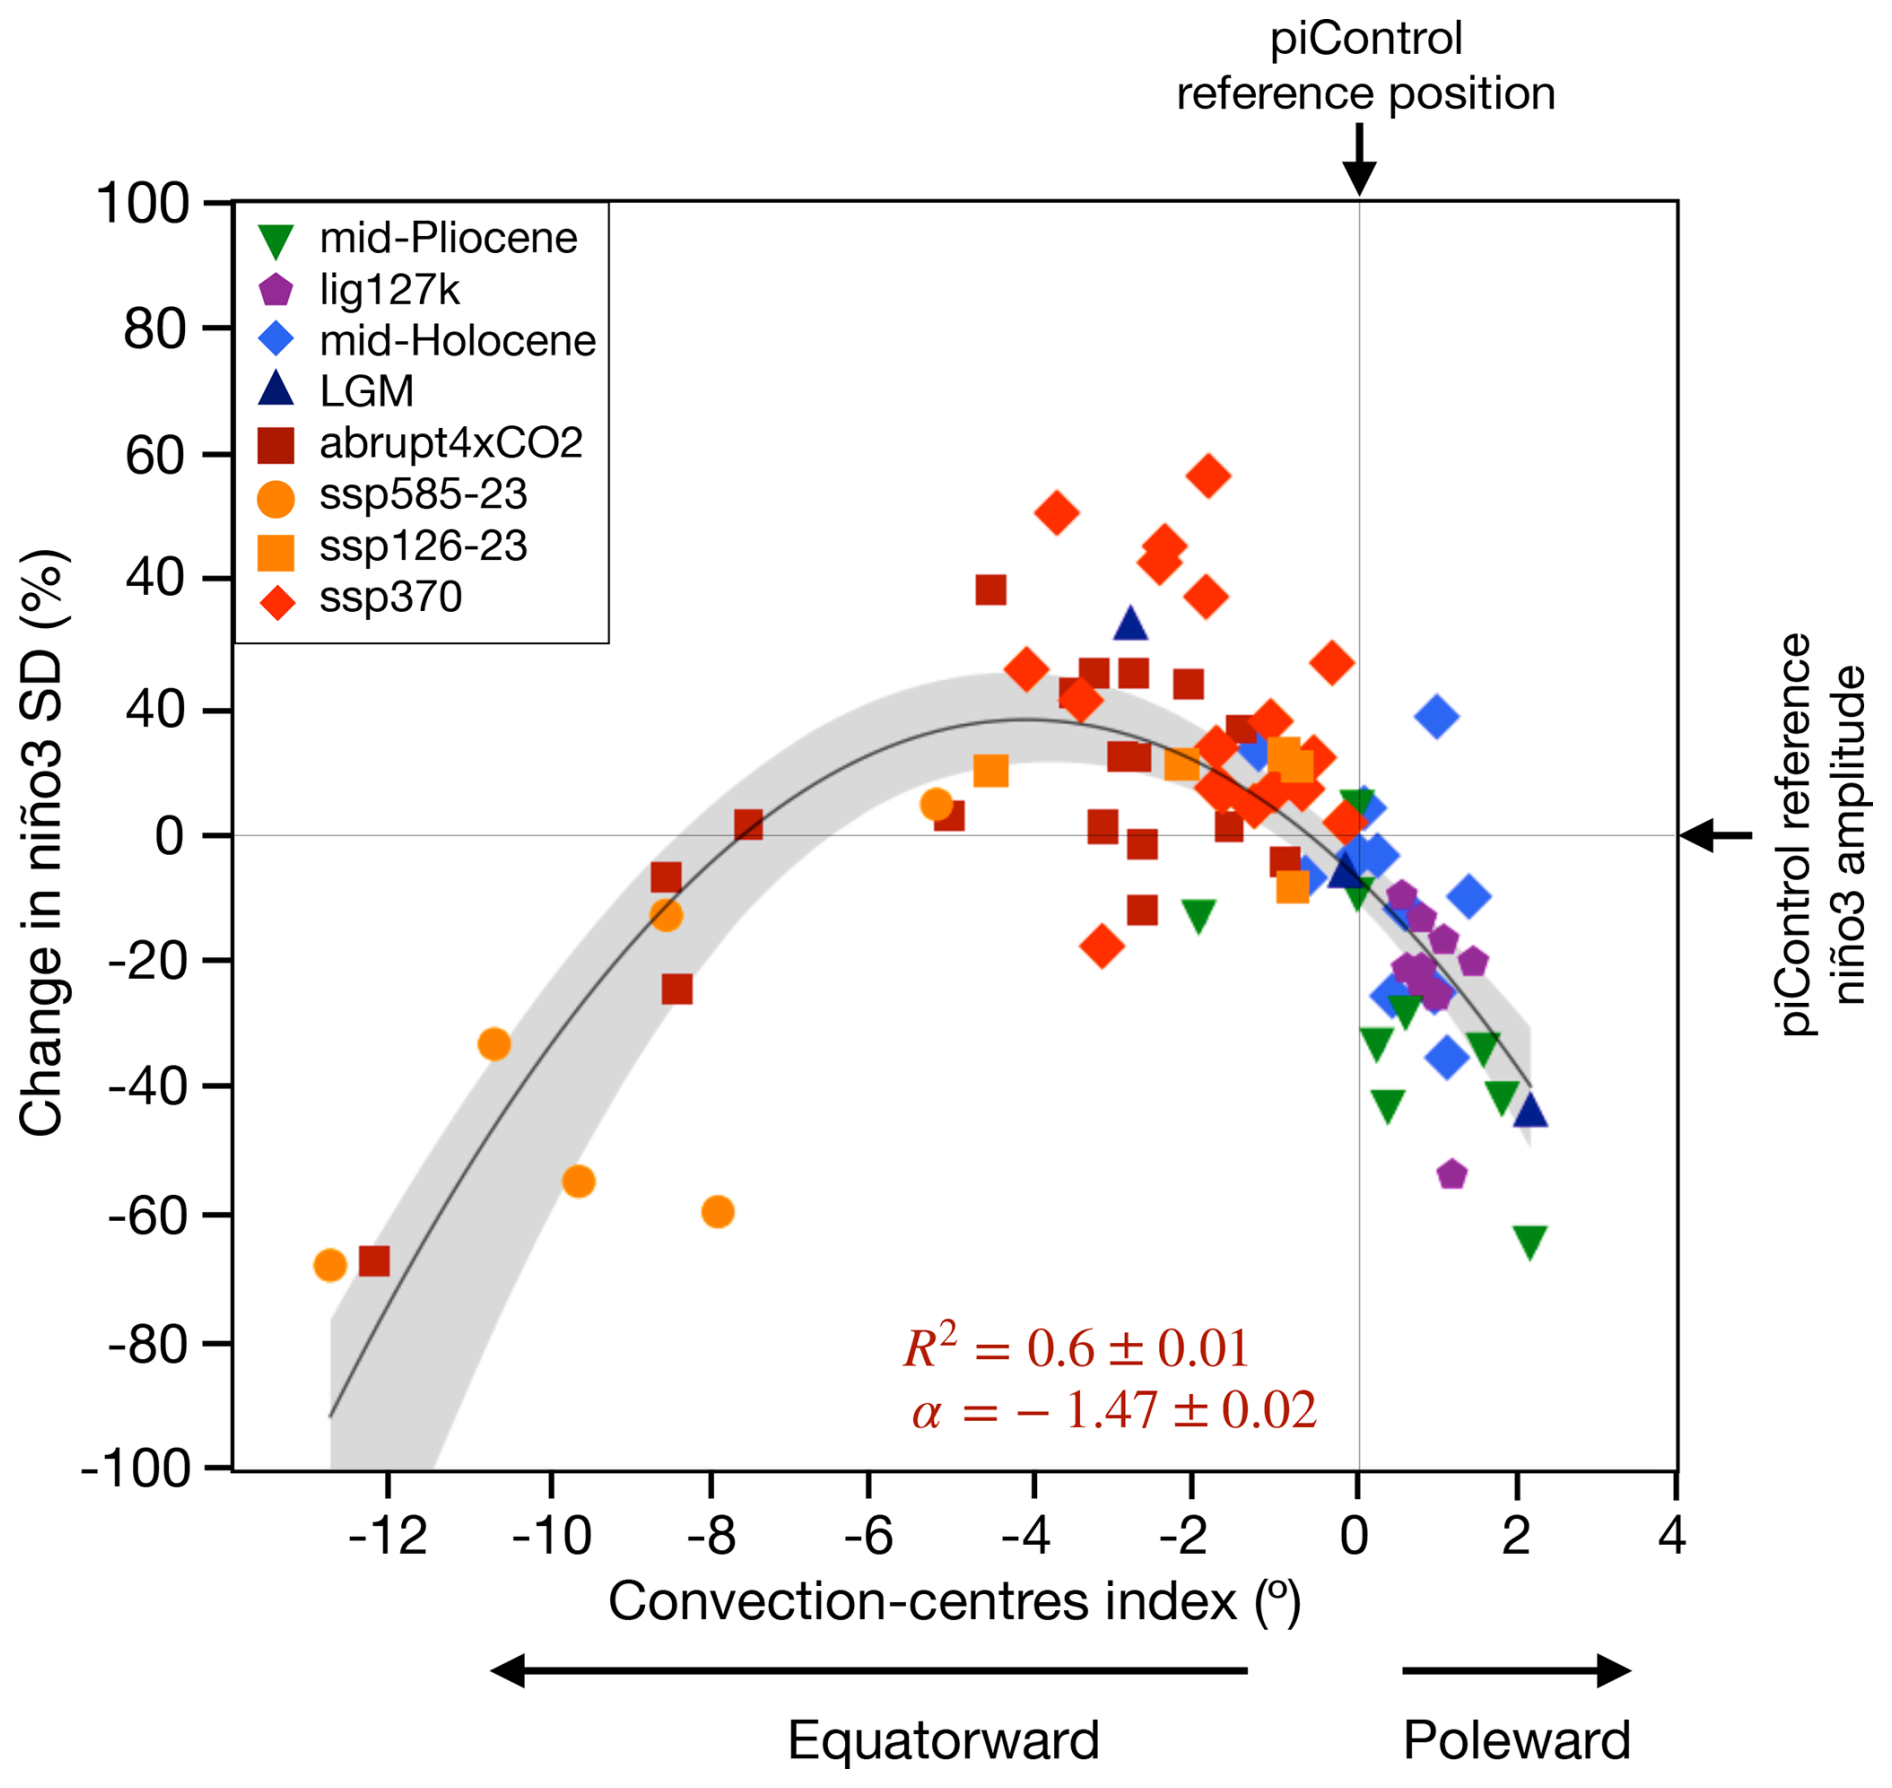
Figure B1Relationship between changes in ENSO variability and the convection centre index. The solid black line indicates the quadratic fit based on the least-squares method. Banding indicates the 95 % confidence interval based on a 1000-sample bootstrap. R2 indicates the coefficient of determination, and a indicates the nonlinear coefficient of the quadratic regression model. Error estimates for R2 and a are calculated as 1 standard deviation based on 1000 bootstrap realisations.
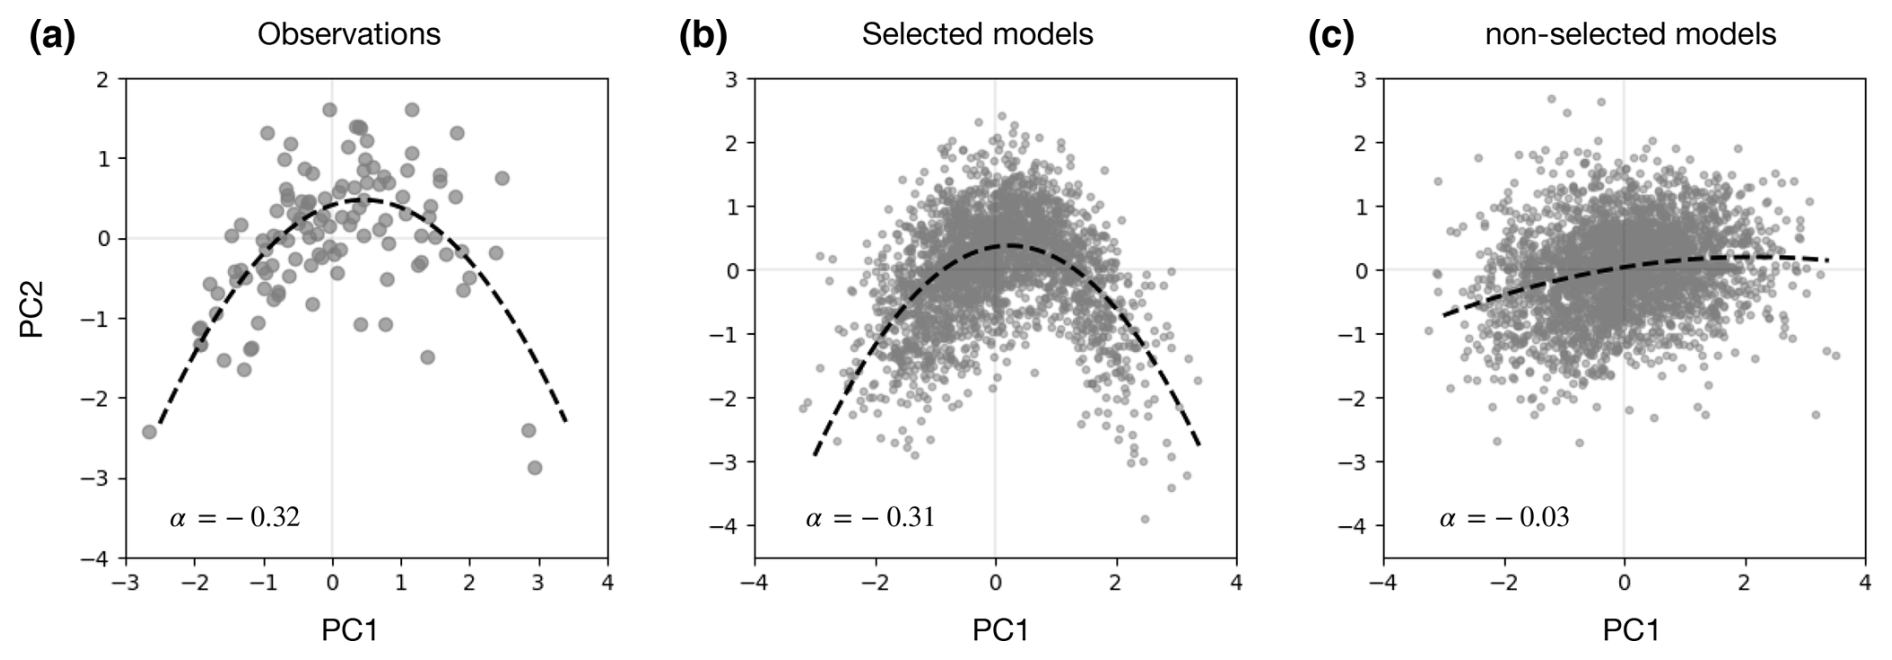
Figure B2Model selection criteria evaluation: Bjerknes feedback. Relationship between the first and second principal components of SST anomalies in the tropical Pacific in observation (a), selected (b), and non-selected (c) models. The nonlinear coefficient of the quadratic fitted model is indicated by a.
To account for ENSO complexity, we evaluate the central Pacific (CP) and eastern Pacific (EP) ENSO types (Takahashi et al., 2011), which have distinct anomaly centres in the equatorial Pacific and distinct impacts on remote areas. CP ENSO variability is characterised by low-intensity warming in the central western Pacific, while EP ENSO events are recognised by strong warming in the eastern Pacific. CP and EP types are distinguished by the degree of nonlinearity of SST advection from the western to eastern Pacific, where enhanced nonlinearity leads to the development of intense SST anomalies in the eastern Pacific, associated with EP events. Given this complexity, not all models are able to correctly simulate the two ENSO types due to weak nonlinear SST advection feedback (Takahashi et al., 2011). For this reason, in assessing the response of the CP and EP to the position of the convergence zones, in addition to applying the nonlinear convective feedback criterion for model selection, we also require models to be able to simulate the nonlinear SST advection feedback, known as “Bjerknes feedback”. The model's ability to simulate the Bjerknes feedback is assessed through the nonlinear relationship between the first two principal components of monthly SST anomalies in the tropical Pacific. Models are required to simulate the parameter a, given by the nonlinear coefficient of the fitted quadratic model, at greater than half of the observed value (aobs = 0.32, Fig. B2).
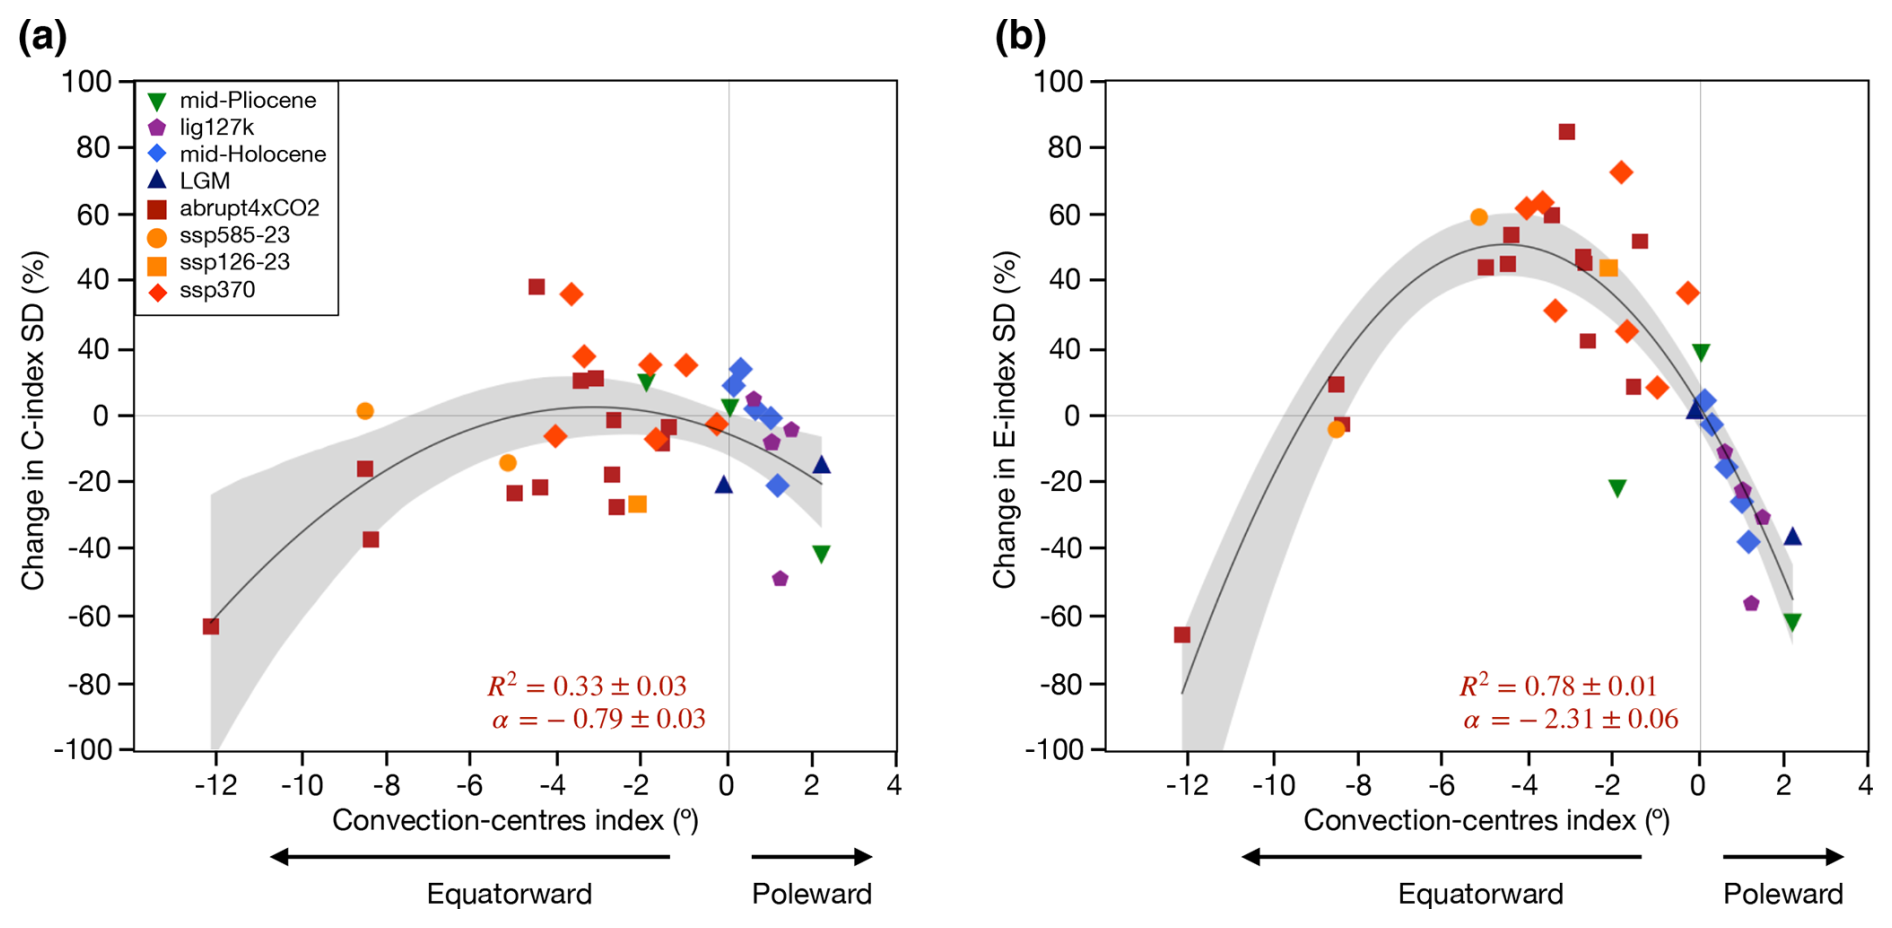
Figure B3Relationship between C (a) and E (b) indices and the convection centre index. The solid black line indicates the quadratic fit based on the least-squares method. Banding indicates the 95 % confidence interval based on 1000 bootstrap realisations. R2 indicates the coefficient of determination, and a is the nonlinear coefficient of the quadratic regression model. Error estimates for R2 and a were calculated as 1 standard deviation of 1000 bootstrap realisations.
As we evaluate ENSO dynamics in climate models, the simulated anomaly centres of CP and EP ENSO may vary across models. As such, indices for CP ENSO (C index) and EP ENSO (E index) were computed through combining the first two empirical orthogonal functions of SST anomalies in tropical Pacific (15° S–15° N, 140° E–80° W). The first two principal component time series are combined to obtain the E () and C () indices. The standard deviations of the principal component time series of both C and E indices are used as a proxy of their amplitudes.
The relationship between ENSO amplitude change and the displacement of the convection centres reveals important differences between CP and EP ENSO types. Firstly, CP ENSO activity is likely less sensitive to changes in the mean state, as indicated by a wider shape of the quadratic fit (Fig. B3a; a = −0.79) and a weaker relationship (R2 = 0.33) compared to EP ENSO (Fig. B3b; a = −2.31; R2 = 0.78). EP ENSO is strongly modulated by the position of the convection centres (R2 = 0.78) and exhibits a high nonlinear sensitivity to climate states (a = −2.31; Fig. B3b). According to this finding, the climate system supports a maximum increase in EP ENSO variance of approximately 55 %, which is achieved with an overall equatorward displacement in the position of the convection centres of ∼ 4.7° (Fig. B3b). It is important to note that the Niño3 index likely captures a combination of CP and EP ENSO variabilities, as its region encompasses both CP and EP anomalies (Takahashi et al., 2011).
The efficiency of the dynamical coupling between the ocean and the atmosphere is measured through the intensity of the wind–thermocline coupling coefficient (Jin et al., 2006). This coefficient measures the sensitivity of the tilt mode of thermocline slope anomalies to wind stress anomalies, which, during El Niño events, results in eastward temperature advection by downwelling equatorial Kelvin waves:
where h indicates the thermocline depth, βh indicates the wind–thermocline coupling coefficient, and τx indicates the zonal wind stress. Subscripts “E” and “W” denote the area average in the eastern (5° S–5° N, 150–90° W) and western (5° S–5° N, 160° E–150° W) equatorial Pacific, respectively. The thermocline depth is computed from the mean temperature profile in each of the boxes indicated above as the weighted average depth, based on depths in which the temperature gradients are greater than 70 % of its maximum (Pontes et al., 2022b). The wind–thermocline coefficient is computed from monthly anomalies, which capture the evolution of the thermocline slope within each single ENSO event.
Simulations from the pre-industrial control, the mid-Holocene, and the Last Interglacial; future emission scenarios (SSP1-2.6, SSP3-7.0, and SSP5-8.5); and simulations of the mid-Pliocene (CESM2, EC-Earth3-LR, NorESM1-F, IPSLCM6A, and GISS-E2-1-G) can be obtained directly through the Earth System Grid Federation (ESGF) repository (https://esgf-node.llnl.gov/search/cmip6/, Earth System Grid Federation, 2025). Other mid-Pliocene simulations are available upon request to Julia C. Tindall (j.c.tindall@leeds.ac.uk). Models used in each analysis were selected based on data availability in their respective databases. The last 100 years of each model's simulation are used. All climate periods (palaeoclimates and projections) are compared to the pre-industrial climate. Observed precipitation data from the Global Precipitation Climatology Project (Adler et al., 2003) are available at https://psl.noaa.gov/data/gridded/data.gpcp.html (NOAA PSL, 2024). Observed sea surface temperature data from the Hadley Centre (Rayner et al., 2003) are available at https://www.metoffice.gov.uk/hadobs/hadisst/ (Rayner, 2024). Data generated by the analyses presented in this paper are available at https://doi.org/10.5281/zenodo.15686134 (Pontes, 2025), along with a Python code for computing the convection-centres index.
The supplement related to this article is available online at https://doi.org/10.5194/cp-21-1079-2025-supplement.
GMP designed the study, conducted the analysis, prepared all figures, and wrote the original article. PLdSD and LM contributed with discussions and commented on and reviewed the article.
At least one of the (co-)authors is a member of the editorial board of Climate of the Past. The peer-review process was guided by an independent editor, and the authors also have no other competing interests to declare.
Publisher's note: Copernicus Publications remains neutral with regard to jurisdictional claims made in the text, published maps, institutional affiliations, or any other geographical representation in this paper. While Copernicus Publications makes every effort to include appropriate place names, the final responsibility lies with the authors.
For their roles in producing, coordinating, and making available CMIP6 and PMIP4 model output, we acknowledge the climate modelling groups (Table S1), the World Climate Research Programme's Working Group on Coupled Modelling, and the Global Organization of Earth System Science Portals. The authors acknowledge Francesco S. R. Pausata for providing his detailed feedback of this study. Gabriel M. Pontes and Pedro L. da Silva Dias acknowledge funding from the São Paulo Research Foundation (grant no. 2021/11035-6). This work is supported by the Australian Research Council Special Research Initiative, Australian Centre for Excellence in Antarctic Science (grant no. SR200100008).
This research has been supported by the Fundação de Amparo à Pesquisa do Estado de São Paulo (grant no. 2021/11035-6) and the Australian Research Council (grant no. SR200100008).
This paper was edited by Heather L. Ford and reviewed by three anonymous referees.
Adler, R. F., Huffman, G. J., Chang, A., Ferraro, R., Xie, P., Janowiak, J., Rudolf, B., Schneider, U., Curtis, S., Bolvin, D., Gruber, A., Susskind, J., and Arkin, P.: The Version 2 Global Precipitation Climatology Project (GPCP) Monthly Precipitation Analysis (1979–Present), J. Hydrometeor., 4, 1147–1167, 2003.
Brierley, C. M., Zhao, A., Harrison, S. P., Braconnot, P., Williams, C. J. R., Thornalley, D. J. R., Shi, X., Peterschmitt, J.-Y., Ohgaito, R., Kaufman, D. S., Kageyama, M., Hargreaves, J. C., Erb, M. P., Emile-Geay, J., D'Agostino, R., Chandan, D., Carré, M., Bartlein, P. J., Zheng, W., Zhang, Z., Zhang, Q., Yang, H., Volodin, E. M., Tomas, R. A., Routson, C., Peltier, W. R., Otto-Bliesner, B., Morozova, P. A., McKay, N. P., Lohmann, G., Legrande, A. N., Guo, C., Cao, J., Brady, E., Annan, J. D., and Abe-Ouchi, A.: Large-scale features and evaluation of the PMIP4-CMIP6 midHolocene simulations, Clim. Past, 16, 1847–1872, https://doi.org/10.5194/cp-16-1847-2020, 2020.
Brown, J. R., Brierley, C. M., An, S.-I., Guarino, M.-V., Stevenson, S., Williams, C. J. R., Zhang, Q., Zhao, A., Abe-Ouchi, A., Braconnot, P., Brady, E. C., Chandan, D., D'Agostino, R., Guo, C., LeGrande, A. N., Lohmann, G., Morozova, P. A., Ohgaito, R., O'ishi, R., Otto-Bliesner, B. L., Peltier, W. R., Shi, X., Sime, L., Volodin, E. M., Zhang, Z., and Zheng, W.: Comparison of past and future simulations of ENSO in CMIP5/PMIP3 and CMIP6/PMIP4 models, Clim. Past, 16, 1777–1805, https://doi.org/10.5194/cp-16-1777-2020, 2020.
Burke, K. D., Williams, J. W., Chandler, M. A., Haywood, A. M., Lunt, D. J., and Otto-Bliesner, B. L.: Pliocene and Eocene provide best analogs for near-future climates, P. Natl. Acad. Sci. USA, 115, 13288–13293, https://doi.org/10.1073/pnas.1809600115, 2018.
Cai, W., Wang, G., Dewitte, B., Wu, L., Santoso, A., Takahashi, K., Yang, Y., Carréric, A., and McPhaden, M. J.: Increased variability of eastern Pacific El Niño under greenhouse warming, Nature, 564, 201–206, https://doi.org/10.1038/s41586-018-0776-9, 2018.
Cai, W., Santoso, A., Collins, M., Dewitte, B., Karamperidou, C., Kug, J. S., Lengaigne, M., McPhaden, M. J., Stuecker, M. F., Taschetto, A. S., Timmermann, A., Wu, L., Yeh, S. W., Wang, G., Ng, B., Jia, F., Yang, Y., Ying, J., Zheng, X. T., Bayr, T., Brown, J. R., Capotondi, A., Cobb, K. M., Gan, B., Geng, T., Ham, Y. G., Jin, F. F., Jo, H. S., Li, X., Lin, X., McGregor, S., Park, J. H., Stein, K., Yang, K., Zhang, L., and Zhong, W.: Changing El Niño–Southern Oscillation in a warming climate, Nature Reviews Earth & Environment, 2, 628–644, https://doi.org/10.1038/s43017-021-00199-z, 2021.
Callahan, C. W., Chen, C., Rugenstein, M., Bloch-Johnson, J., Yang, S., and Moyer, E. J.: Robust decrease in El Niño/Southern Oscillation amplitude under long-term warming, Nat. Clim. Change, 11, 752–757, https://doi.org/10.1038/s41558-021-01099-2, 2021.
Chen, D., Lian, T., Fu, C., Cane, M. A., Tang, Y., Murtugudde, R., Song, X., Wu, Q., and Zhou, L.: Strong influence of westerly wind bursts on El Niño diversity, Nat. Geosci., 8, 339–345, https://doi.org/10.1038/ngeo2399, 2015.
Chen, L., Zheng, W., and Braconnot, P.: Towards understanding the suppressed ENSO activity during mid-Holocene in PMIP2 and PMIP3 simulations, Clim. Dynam., 53, 1095–1110, https://doi.org/10.1007/s00382-019-04637-z, 2019.
Dommenget, D., Bayr, T., and Frauen, C.: Analysis of the non-linearity in the pattern and time evolution of El Niño southern oscillation, Clim. Dynam., 40, 2825–2847, https://doi.org/10.1007/S00382-012-1475-0, 2012.
Earth System Grid Federation: ESGF MetaGrid, Earth System Grid Federation [data set], https://esgf-node.llnl.gov/search/cmip6/, last access: 30 January 2025.
Emile-Geay, J., Cobb, K. M., Carre, M., Braconnot, P., Leloup, J., Zhou, Y., Harrison, S. P., Corrège, T., McGregor, H. V., Collins, M., Driscoll, R., Elliot, M., Schneider, B., and Tudhope, A.: Links between tropical Pacific seasonal, interannual and orbital variability during the Holocene, Nat. Geosci., 9, 168–173, https://doi.org/10.1038/ngeo2608, 2016.
Ford, H. L., Ravelo, A. C., and Polissar, P. J.: Reduced El Niño-Southern Oscillation during the last glacial maximum, Science, 347, 255–258, https://doi.org/10.1126/science.1258437, 2015.
Glaubke, R. H., Schmidt, M. W., Hertzberg, J. E., Ward, L. G., Marcantonio, F., Schimmenti, D., and Thirumalai, K.: An Inconsistent ENSO Response to Northern Hemisphere Stadials Over the Last Deglaciation, Geophys. Res. Lett., 51, e2023GL107634, https://doi.org/10.1029/2023GL107634, 2024.
Haywood, A. M., Tindall, J. C., Dowsett, H. J., Dolan, A. M., Foley, K. M., Hunter, S. J., Hill, D. J., Chan, W.-L., Abe-Ouchi, A., Stepanek, C., Lohmann, G., Chandan, D., Peltier, W. R., Tan, N., Contoux, C., Ramstein, G., Li, X., Zhang, Z., Guo, C., Nisancioglu, K. H., Zhang, Q., Li, Q., Kamae, Y., Chandler, M. A., Sohl, L. E., Otto-Bliesner, B. L., Feng, R., Brady, E. C., von der Heydt, A. S., Baatsen, M. L. J., and Lunt, D. J.: The Pliocene Model Intercomparison Project Phase 2: large-scale climate features and climate sensitivity, Clim. Past, 16, 2095–2123, https://doi.org/10.5194/cp-16-2095-2020, 2020.
Jin, F. F., Kim, S. T., and Bejarano, L.: A coupled-stability index for ENSO, Geophys. Res. Lett., 33, L23708, https://doi.org/10.1029/2006GL027221, 2006.
Johnson, N. C. and Xie, S. P.: Changes in the sea surface temperature threshold for tropical convection, Nat. Geosci., 3, 842–845, https://doi.org/10.1038/ngeo1008, 2010.
Kageyama, M., Harrison, S. P., Kapsch, M.-L., Lofverstrom, M., Lora, J. M., Mikolajewicz, U., Sherriff-Tadano, S., Vadsaria, T., Abe-Ouchi, A., Bouttes, N., Chandan, D., Gregoire, L. J., Ivanovic, R. F., Izumi, K., LeGrande, A. N., Lhardy, F., Lohmann, G., Morozova, P. A., Ohgaito, R., Paul, A., Peltier, W. R., Poulsen, C. J., Quiquet, A., Roche, D. M., Shi, X., Tierney, J. E., Valdes, P. J., Volodin, E., and Zhu, J.: The PMIP4 Last Glacial Maximum experiments: preliminary results and comparison with the PMIP3 simulations, Clim. Past, 17, 1065–1089, https://doi.org/10.5194/cp-17-1065-2021, 2021.
Liu, Z.: A Simple Model Study of ENSO Suppression by External Periodic Forcing, J. Climate, 15, 1088–1098, https://doi.org/10.1175/1520-0442(2002)015<1088:ASMSOE>2.0.CO;2, 2002.
Lunt, D. J., Haywood, A. M., Schmidt, G. A., Salzmann, U., Valdes, P. J., Dowsett, H. J., and Loptson, C. A.: On the causes of mid-Pliocene warmth and polar amplification, Earth Planet. Sc. Lett., 321–322, 128–138, https://doi.org/10.1016/j.epsl.2011.12.042, 2012.
Marcott, S. A., Bauska, T. K., Buizert, C., Steig, E. J., Rosen, J. L., Cuffey, K. M., Fudge, T. J., Severinghaus, J. P., Ahn, J., Kalk, M. L., McConnell, J. R., Sowers, T., Taylor, K. C., White, J. W. C., and Brook, E. J.: Centennial-scale changes in the global carbon cycle during the last deglaciation, Nature, 514, 616–619, https://doi.org/10.1038/nature13799, 2014.
NOAA PSL: Global Precipitation Climatology Project (GPCP) Monthly Analysis Product, NOAA Physical Sciences Laboratory [data set], https://psl.noaa.gov/data/gridded/data.gpcp.html, last access: 20 February 2024.
O'Neill, B. C., Tebaldi, C., van Vuuren, D. P., Eyring, V., Friedlingstein, P., Hurtt, G., Knutti, R., Kriegler, E., Lamarque, J.-F., Lowe, J., Meehl, G. A., Moss, R., Riahi, K., and Sanderson, B. M.: The Scenario Model Intercomparison Project (ScenarioMIP) for CMIP6, Geosci. Model Dev., 9, 3461–3482, https://doi.org/10.5194/gmd-9-3461-2016, 2016.
Otto-Bliesner, B. L., Brady, E. C., Zhao, A., Brierley, C. M., Axford, Y., Capron, E., Govin, A., Hoffman, J. S., Isaacs, E., Kageyama, M., Scussolini, P., Tzedakis, P. C., Williams, C. J. R., Wolff, E., Abe-Ouchi, A., Braconnot, P., Ramos Buarque, S., Cao, J., de Vernal, A., Guarino, M. V., Guo, C., LeGrande, A. N., Lohmann, G., Meissner, K. J., Menviel, L., Morozova, P. A., Nisancioglu, K. H., O'ishi, R., Salas y Mélia, D., Shi, X., Sicard, M., Sime, L., Stepanek, C., Tomas, R., Volodin, E., Yeung, N. K. H., Zhang, Q., Zhang, Z., and Zheng, W.: Large-scale features of Last Interglacial climate: results from evaluating the lig127k simulations for the Coupled Model Intercomparison Project (CMIP6)–Paleoclimate Modeling Intercomparison Project (PMIP4), Clim. Past, 17, 63–94, https://doi.org/10.5194/cp-17-63-2021, 2021.
PAGES working Group: Interglacials of the last 800 000 years, Rev. Geophys., 54, 162–219, https://doi.org/10.1002/2015RG000482, 2016.
Pausata, F. S. R., Zhang, Q., Muschitiello, F., Lu, Z., Chafik, L., Niedermeyer, E. M., Stager, J. C., Cobb, K. M., and Liu, Z.: Greening of the Sahara suppressed ENSO activity during the mid-Holocene, Nat. Commun., 8, 16020, https://doi.org/10.1038/ncomms16020, 2017.
Peng, Q., Xie, S. P., and Deser, C.: Collapsed upwelling projected to weaken ENSO under sustained warming beyond the twenty-first century, Nat. Clim. Change, 14, 815–822, https://doi.org/10.1038/s41558-024-02061-8, 2024.
Pontes, G.: Dataset for “Rapid Communication: Nonlinear sensitivity of the El Niño-Southern Oscillation across climate states”, in: Rapid Communication: Nonlinear sensitivity of the El Niño-Southern Oscillation across climate states (Version v1), Zenodo [data set], https://doi.org/10.5281/zenodo.15686134, 2025.
Pontes, G. M., Wainer, I., Taschetto, A. S., Sen Gupta, A., Abe-Ouchi, A., Brady, E. C., Chan, W.-L., Chandan, D., Contoux, C., Feng, R., Hunter, S. J., Kame, Y., Lohmann, G., Otto-Bliesner, B. L., Peltier, W. R., Stepanek, C., Tindall, J., Tan, N., Zhang, Q., and Zhang, Z.: Drier tropical and subtropical Southern Hemisphere in the mid-Pliocene Warm Period, Sci. Rep., 10, 13458, https://doi.org/10.1038/s41598-020-68884-5, 2020.
Pontes, G., Dias, P. S., and Menviel, L.: Paleoclimate constrains future El Niño/Southern Oscillation increase, Research Square Preprint, version 1, https://doi.org/10.21203/RS.3.RS-2062789/V1, 2022a.
Pontes, G. M., Taschetto, A. S., Sen Gupta, A., Santoso, A., Wainer, I., Haywood, A. M., Chan, W.-L., Abe-Ouchi, A., Stepanek, C., Lohmann, G., Hunter, S. J., Tindall, J. C., Chandler, M. A., Sohl, L. E., Peltier, W. R., Chandan, D., Kamae, Y., Nisancioglu, K. H., Zhang, Z., Contoux, C., Tan, N., Zhang, Q., Otto-Bliesner, B. L., Brady, E. C., Feng, R., von der Heydt, A. S., Baatsen, M. L. J., and Oldeman, A. M.: Mid-Pliocene El Niño/Southern Oscillation suppressed by Pacific intertropical convergence zone shift, Nat. Geosci., 2022, 1–9, https://doi.org/10.1038/s41561-022-00999-y, 2022b.
Rayner, N.: Hadley Centre Sea Ice and Sea Surface Temperature data set (HadISST), Met Office Hadley Centre [data set], https://www.metoffice.gov.uk/hadobs/hadisst/, last access: 11 March 2024.
Rayner, N. A., Parker, D. E., Horton, E. B., Folland, C. K., Alexander, L. V., Rowell, D. P., Kent, E. C., and Kaplan, A.: Global analyses of sea surface temperature, sea ice, and night marine air temperature since the late nineteenth century, J. Geophys. Res., 108, 440710, https://doi.org/10.1029/2002JD002670, 2003.
Ropelewski, C. F. and Halpert, M. S.: Global and Regional Scale Precipitation Patterns Associated with the El Niño/Southern Oscillation, Mon. Weather Rev., 115, 1606–1626, https://doi.org/10.1175/1520-0493(1987)115<1606:GARSPP>2.0.CO;2, 1987.
Sachs, J. P., Sachse, D., Smittenberg, R. H., Zhang, Z., Battisti, D. S., and Golubic, S.: Southward movement of the Pacific intertropical convergence zone AD 1400–1850, Nat. Geosci., 2, 519–525, https://doi.org/10.1038/ngeo554, 2009.
Sachs, J. P., Blois, J. L., McGee, T., Wolhowe, M., Haberle, S., Clark, G., and Atahan, P.: Southward Shift of the Pacific ITCZ During the Holocene, Paleoceanogr. Paleoclimatol., 33, 1383–1395, https://doi.org/10.1029/2018PA003469, 2018.
Schneider, T., Bischoff, T., and Haug, G. H.: Migrations and dynamics of the intertropical convergence zone, Nature, 513, 45–53, https://doi.org/10.1038/nature13636, 2014.
Takahashi, K., Montecinos, A., Goubanova, K., and Dewitte, B.: ENSO regimes: Reinterpreting the canonical and Modoki El Niño, Geophys. Res. Lett., 38, 1–5, https://doi.org/10.1029/2011GL047364, 2011.
Taschetto, A. S., sen Gupta, A., Jourdain, N. C., Santoso, A., Ummenhofer, C. C., and England, M. H.: Cold Tongue and Warm Pool ENSO Events in CMIP5: Mean State and Future Projections, J. Climate, 27, 2861–2885, https://doi.org/10.1175/JCLI-D-13-00437.1, 2014.
Thirumalai, K., DiNezio, P. N., Partin, J. W., Liu, D., Costa, K., and Jacobel, A.: Future increase in extreme El Niño supported by past glacial changes, Nature, 634, 374–380, https://doi.org/10.1038/s41586-024-07984-y, 2024.
Timmermann, A., Okumura, Y., An, S. I., Clement, A., Dong, B., Guilyardi, E., Hu, A., Jungclaus, J. H., Renold, M., Stocker, T. F., Stouffer, R. J., Sutton, R., Xie, S. P., and Yin, J.: The Influence of a Weakening of the Atlantic Meridional Overturning Circulation on ENSO, J. Climate, 20, 4899–4919, https://doi.org/10.1175/JCLI4283.1, 2007.
Timmermann, A., An, S.-I., Kug, J. S., Jin, F. F., Cai, W., Capotondi, A., Cobb, K., Lengaigne, M., McPhaden, M. J., Stuecker, M. F., Stein, K., Wittenberg, A. T., Yun, K. S., Bayr, T., Chen, H. C., Chikamoto, Y., Dewitte, B., Dommenget, D., Grothe, P., Guilyardi, E., Ham, Y. G., Hayashi, M., Ineson, S., Kang, D., Kim, S., Kim, W. M., Lee, J. Y., Li, T., Luo, J. J., McGregor, S., Planton, Y., Power, S., Rashid, H., Ren, H. L., Santoso, A., Takahashi, K., Todd, A., Wang, G., Wang, G., Xie, R., Yang, W. H., Yeh, S. W., Yoon, J., Zeller, E., and Zhang, X.: El Niño–Southern Oscillation complexity, Nature, 559, 535–545, https://doi.org/10.1038/s41586-018-0252-6, 2018.
Vimont, D. J., Battisti, D. S., and Hirst, A. C.: Footprinting: A seasonal connection between the tropics and mid-latitudes, Geophys. Res. Lett., 28, 3923–3926, https://doi.org/10.1029/2001GL013435, 2001.
Watanabe, T., Suzuki, A., Minobe, S., Kawashima, T., Kameo, K., Minoshima, K., Aguilar, Y. M., Wani, R., Kawahata, H., Sowa, K., Nagai, T., and Kase, T.: Permanent El Niño during the Pliocene warm period not supported by coral evidence, Nature, 471, 209–211, https://doi.org/10.1038/nature09777, 2011.
White, S. M. and Ravelo, A. C.: Dampened El Niño in the Early Pliocene Warm Period, Geophys. Res. Lett., 47, e2019GL085504, https://doi.org/10.1029/2019GL085504, 2020.
Zheng, Y., Rugenstein, M., Pieper, P., Beobide-Arsuaga, G., and Baehr, J.: El Niño–Southern Oscillation (ENSO) predictability in equilibrated warmer climates, Earth Syst. Dynam., 13, 1611–1623, https://doi.org/10.5194/esd-13-1611-2022, 2022.