the Creative Commons Attribution 4.0 License.
the Creative Commons Attribution 4.0 License.
 | 22 Mar 2024
Weathering trends in the Norian through geochemical and rock magnetic analyses from the Pignola–Abriola section (Lagonegro Basin, Italy)
Matteo Maron
Tetsuji Onoue
Sara Satolli
Katsuhito Soda
Honami Sato
Giovanni Muttoni
Manuel Rigo
We investigated the geochemical and rock magnetic properties of the magnetostratigraphically calibrated Pignola–Abriola section (Italy) in order to understand the climatic perturbations that characterize the late Norian–early Rhaetian interval (Late Triassic). We performed experiments on anhysteretic and isothermal remanence (ARM and IRM) and on magnetic susceptibility (χ) to obtain the rock magnetic parameters necessary for our paleoclimatic investigation. An episode of increase in the relative quantity of hematite, suggesting the enhanced subaerial oxidation of iron minerals, was identified in the Norian from ∼ 217 Ma in the Alaunian up to ∼ 211 Ma in the early Sevatian, followed by a decline up to 207–206 Ma at the end of the Norian (late Sevatian). The results of geochemical and multivariate statistical analyses support a long-term increase and reduction in rock weathering, confirming and extending previous 87Sr 86Sr data from the Pizzo Mondello section (Italy). Possible causes of these long-term weathering trends are the multiphase uplifting of the Cimmerian orogen, occurring at mid-northern latitudes along the southern margin of Asia in the Late Triassic, and/or the northward motion of Pangea across the equatorial humid belt. Rapid excursions in oxidized iron minerals have also been observed across the Norian–Rhaetian boundary, the origin of which still has to be determined.
- Article
(8019 KB) - Full-text XML
- BibTeX
- EndNote


The late Norian–early Rhaetian interval (Late Triassic) is characterized by climatic perturbations associated with a biotic crisis (Rampino and Stothers, 1988; Wignall, 2001; Jones and Jenkyns, 2001; Paìlfy et al., 2001; Ward et al., 2004; Richoz et al., 2007; van de Schootbrugge et al., 2008; Jenkyns, 2010; Lucas, 2010; Tanner, 2010; Trotter et al., 2015; Clapham and Renne, 2018; Zaffani et al., 2017; Rigo et al., 2020). Sedimentary rocks can record the effects of climate change through variations in water chemistry and sedimentary input. Geochemistry is therefore widely applied, but rock magnetism can also effectively contribute to unveil paleoclimate variability (e.g., Bloemendal and DeMenocal, 1989; Thouveny et al., 1994; Vlag et al., 1997; Van der Post et al., 1997; Snowball et al., 1999; Vigliotti et al., 1999; Ortega et al., 2002; X. Wang et al., 2008; Lascu et al., 2012; Abrajevitch et al., 2013; Just et al., 2016; Chang et al., 2018; L. Wang et al., 2018; Rodelli et al., 2019). In order to obtain paleoclimatic information for the late Norian–early Rhaetian, we provide new geochemical and rock magnetic data from the Pignola–Abriola section (southern Apennines, Italy), which is a Global Stratigraphic Sections and Points candidate of the Rhaetian Stage (Rigo et al., 2016), already provided with biostratigraphy (Bazzucchi et al., 2005; Rigo et al., 2005, 2016; Bertinelli et al., 2016), carbon isotope data (Zaffani et al., 2017), and magnetostratigraphy (Maron et al., 2015). We also examined stratigraphic variations in major elements to trace changes in the degree of chemical weathering in hinterland regions and applied principal component analysis (PCA) to major element contents. The PCA results allowed the separation of signals from multiple source materials and the constraint of the degree of hinterland weathering (Soda and Onoue, 2019; Onoue et al., 2021, 2022).
The Pignola–Abriola section (40°33′23.5′′ N, 15°47′1.7′′ E) is located on the western side of Monte Crocetta, along road SP5 between the towns of Pignola and Abriola (Fig. 1). The section comprises 63 m of a basinal sequence belonging to the Calcari con Selce Formation deposited in the Lagonegro Basin, a branch of the western Tethys Ocean that has been active since the Permian (Scandone, 1967; Finetti, 1985; Amodeo et al., 1993; Amodeo, 1999; Ciarapica and Passeri, 2002, 2005; Argnani, 2005; Bazzucchi et al., 2005; Reggiani et al., 2005; Rigo et al., 2005, 2012, 2016; Giordano et al., 2010; Maron et al., 2015, 2017; Bertinelli et al., 2016; Zaffani et al., 2017). The studied interval covers the middle–upper Norian (Alaunian and Sevatian) and the lower Rhaetian portion of the Calcari con Selce Formation. The dominant lithology is represented by bedded cherty limestones, partially dolomitized in the lower part of the section, with sporadic centimeter-thick calcarenites due to turbiditic events or gravity flows (e.g., Amodeo, 1999; Giordano et al., 2010; Bertinelli et al., 2016). Shales, radiolarites, and marls become more abundant in the uppermost part of the Calcari con Selce at the transition with the overlying Scisti Silicei Formation, where the siliciclastic fraction and the biosiliceous sedimentation are dominant (e.g., Reggiani et al., 2005). Conodonts and radiolarians are the most common fossils in the Pignola–Abriola section (Amodeo, 1999; Bazzucchi et al., 2005; Rigo et al., 2005, 2012, 2016; Giordano et al., 2010). The first appearance datum of conodont Misikella posthernsteini s.s. marks the Norian–Rhaetian boundary (hereafter NRB) at meter 44.9 (Giordano et al., 2010; Maron et al., 2015; Rigo et al., 2016) and falls within the base of the Proparvicingula moniliformis radiolarian zone, which defines the Rhaetian Stage. The NRB is also marked by a δ13Corg negative excursion recorded in marine (e.g., Pignola–Abriola, Monte Volturino, and Madonna del Sirino in Italy, Wombat Basin in Australia, Kiritehere in New Zealand, Kennecott Point in Canada, New York Canyon in USA, and Kastelli in Greece; Maron et al., 2015, 2019; Rigo et al., 2016, 2020; Bertinelli et al., 2016; Zaffani et al., 2017) and terrestrial sections (e.g., Xujiahe in China; Jin et al., 2022). The magnetostratigraphy of Pignola–Abriola is represented by 10 magnetozones, 5 of normal polarity and 5 of reverse polarity and is coherent with the magnetostratigraphy of the main stratigraphic sections of late Norian–early Rhaetian age (Maron et al., 2015, 2019). The magnetostratigraphic correlation to the Newark Astrochronological Polarity Time Scale (Newark-APTS) assigned an age of 205.7 Ma to the Norian–Rhaetian boundary at Pignola–Abriola (Maron et al., 2015, 2019).
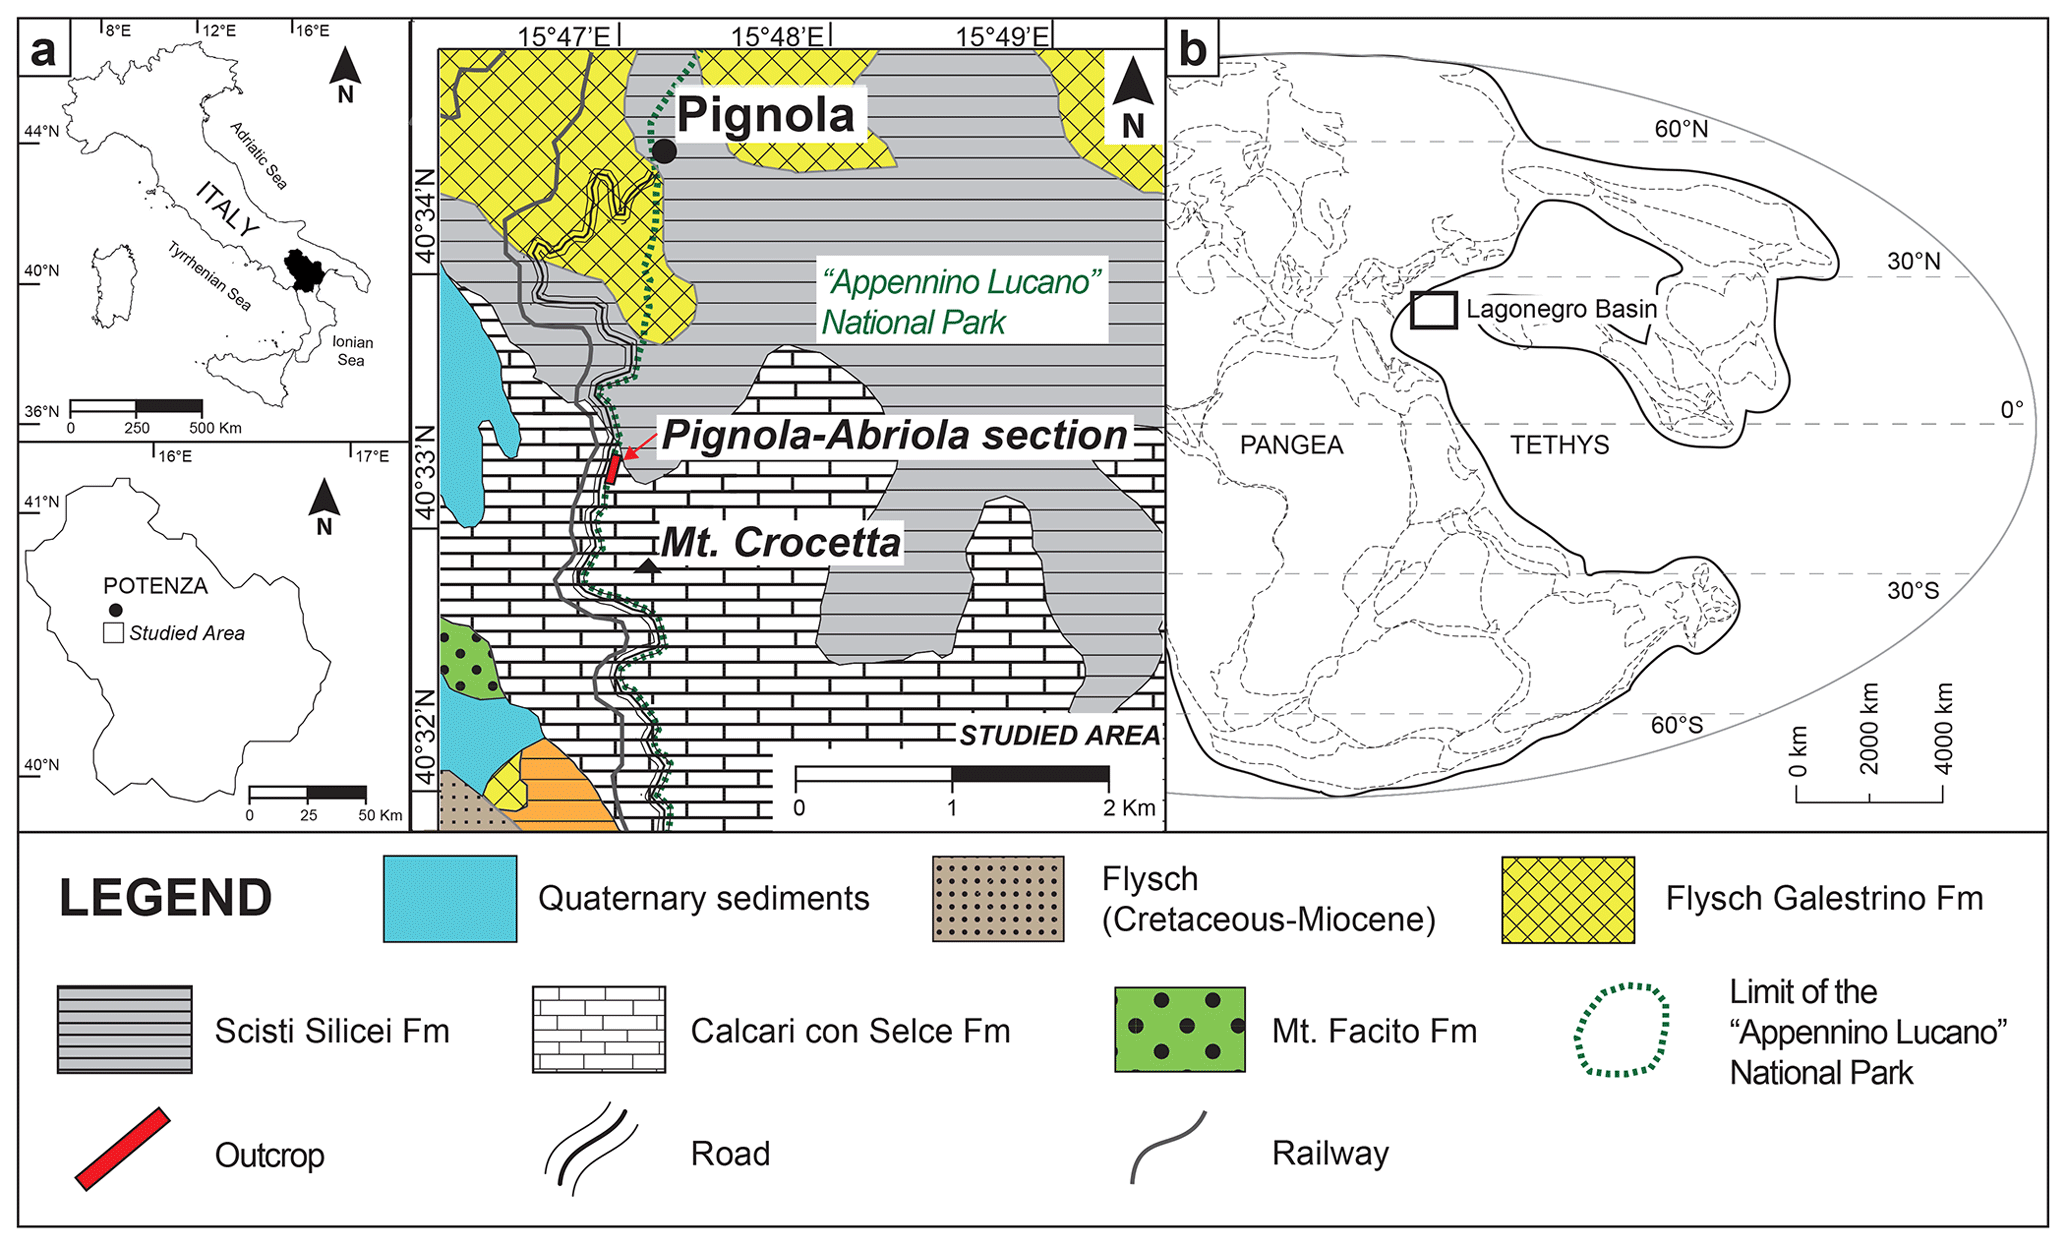
Figure 1(a) Location of the Pignola–Abriola section (40°33′23.5′′ N, 15°47′1.7′′ E) in the Lagonegro Basin (southern Apennines, Italy) and paleogeographic reconstruction of the area in the Late Triassic (modified from Maron et al., 2015). (b) Paleogeographic reconstruction of the Lagonegro Basin, located in the western Tethys during the Late Triassic.
3.1 Rock magnetism
Rock magnetism experiments have been performed on 136 non-oriented samples from the Pignola–Abriola section. Analyses of mass susceptibility (χ) has been performed with an AGICO MFK2-A on all samples, while temperature-dependent mass susceptibility (χ vs. T) was measured in a controlled atmosphere (argon) on 59 samples representative of the main lithologies and equally distributed along the section, using an AGICO CS4 furnace apparatus. An ASC Scientific D2000 AF demagnetizer has been used to apply an anhysteretic remanent magnetization (ARM) to the samples, using a bias DC field of 0.1 mT and an AC field of 100 mT. The acquisition of isothermal remanent magnetization (IRM) curves (maximum field is 1T) was performed with a Bussi pulse magnetizer. The unmixing of IRM acquisition curves has been performed with the MAX UnMix software (Maxbauer et al., 2016a). ARM and IRM were measured using an AGICO JR-6 spinner magnetometer (sensitivity is A m−1). The S ratio (Eq. 1),
and HIRM (hard IRM) (Eq. 2),
were calculated from IRM backfield data. To calculate the S ratio, we used the formula of Bloemendal et al. (1992), which better discriminates the contribution of high-coercivity antiferromagnetic minerals (Maxbauer et al., 2016b). Hysteresis curves on 43 samples have been acquired with the MicroSense EZ7 vibrating sample magnetometer. All analyses have been performed at the paleomagnetic laboratories CIMaN-ALP (Centro Interuniversitario di Magnetismo Naturale – Alpine Laboratory of Paleomagnetism; Peveragno) and LASA (Laboratorio Acceleratori e Superconduttività Applicata; Segrate), Italy. The stratigraphic curves of the rock magnetic parameters have been smoothed using local regression (LOESS) and using PAST software (Hammer et al., 2001).
3.2 Geochemistry
3.2.1 Major elements analysis
Samples for whole-rock geochemical analysis were collected from 56 beds in the Pignola–Abriola section. The shale-dominated samples were crushed in an agate mortar and washed with ultrapure water. After drying, the fragments were carefully hand-picked to avoid contamination by altered and weathered material. The hand-picked fragments were then pulverized in an agate mortar.
Major element concentrations of 47 samples were determined by X-ray fluorescence spectrometry (PANalytical Epsilon 3XLE with a Mo X-ray tube), using pressed powder pellets. Samples were calibrated using 19 standard rock samples issued by the Geological Survey of Japan. Reproducibility, based on the replicate analysis of four standards (JSd-1, JSd-2, JLs-1, and JDo-1), was better than ±0.5 % for MgO, Al2O3, SiO2, K2O, CaO, TiO2, and Fe2O3; better than ±1 % for Na2O and MnO; and better than ±10 % for P2O5 (see Table S1 in Maron et al., 2023).
The bulk chemical composition of nine samples was also determined by X-ray fluorescence spectroscopy (XRF) using a wavelength dispersive spectrometry (WDS) sequential Philips PW 2400 spectrometer equipped with a 3 kW Rh X-ray tube. The analyses, performed under vacuum conditions and using the SuperQ software from PANalytical, were based on calibrations calculated on geological reference standards (Govindaraju, 1994). The sample powders were first used to determine the loss on ignition (LOI) after heating them in a furnace at 860 °C for 20 min and then at 980 °C for 2 h. The calcined powders were then diluted with flux di-lithium tetraborate Li2B4O7 (1:10 ratio) and melted with a fluxer Claisse Fluxy (reaching a temperature of about 1150 °C) to obtain glass beads for XRF analyses. Instrumental precision (defined by several measurements performed on the same sample) is within 0.6 % relative to major elements. The XRF accuracy was checked by reference standards (Govindaraju, 1994) and was within 0.5 wt % for Si and lower than 3 % for other major elements. The lowest detection limits of XRF were within 0.02 wt % for Al2O3, MgO, and Na2O; within 0.4 wt % for SiO2; and within 0.005 wt % for TiO2, Fe2O3, MnO, CaO, K2O, and P2O5. The stratigraphic curves of the geochemical parameters have been smoothed using local regression (LOESS) and using PAST software (Hammer et al., 2001).
3.2.2 Principal component analysis
To extract paleoenvironmental changes from compositional data, principal component analysis (PCA) was applied to data of 10 major oxides (SiO2, TiO2, Al2O3, Fe2O3, MnO, MgO, CaO, Na2O, K2O, and P2O5). The data were normalized to the Ti contents and compared with those of upper continental crust (UCC; McLennan, 2001) in order to obtain enrichment factors as in the following Eq. (3):
where X and Ti are the weight concentrations of elements X and Ti, respectively.
PCA is an operation that synthesizes numerous observational variables into several orthogonalized components, increasing the respective variances. Before applying Q-mode PCA on the correlation coefficient matrix using singular value decomposition (Golub and Van Loan, 1989; Van Huffel and Vanderwalle, 1991; Albarède, 1995), the enrichment factors were converted into additive log ratios (alr's) to map the simplex sample space onto the Euclidean real sample space for a constant sum constraint of compositional data (Aitchison, 1982). This transformation has the advantage that most of the transformed compositional data follow multivariate normal distributions (Aitchison and Shen, 1980), which is a prerequisite for PCA (Atkinson et al., 2004). The detailed procedure of PCA for geochemical dataset is described in Soda and Onoue (2019) and Onoue et al. (2021).
Element concentration and PCA, plotted against stratigraphy, are reported in Fig. A1.
4.1 Rock magnetism
4.1.1 Stratigraphic trends
The complete set of rock magnetic data is reported in Table S2 (see the online dataset in Maron et al., 2023) and Fig. A1. Bulk susceptibility (χ) increases from ∼ to ∼ SI between 41 and 44 m and then it decreases around the NRB up to ∼ 46 m, only to increase again up to ∼ 48 m (Fig. 2a) and indicate an increase in more susceptible ferromagnetic minerals (likely magnetite). There are two major peaks in χ at ∼ 48, ∼ 44, and ∼ 30 m, with several minor peaks from 0 to 25 m (Fig. 2a). The mean values of IRM1T and ARM, respectively, and Am2 kg−1, suggest relatively small but detectable quantities of ferromagnetic minerals. The IRM1T curve shows a general increasing trend between 10 to 30 m and a further increase with two peaks at ∼ 40 and ∼ 47 m, close to the NRB (Fig. 2b).
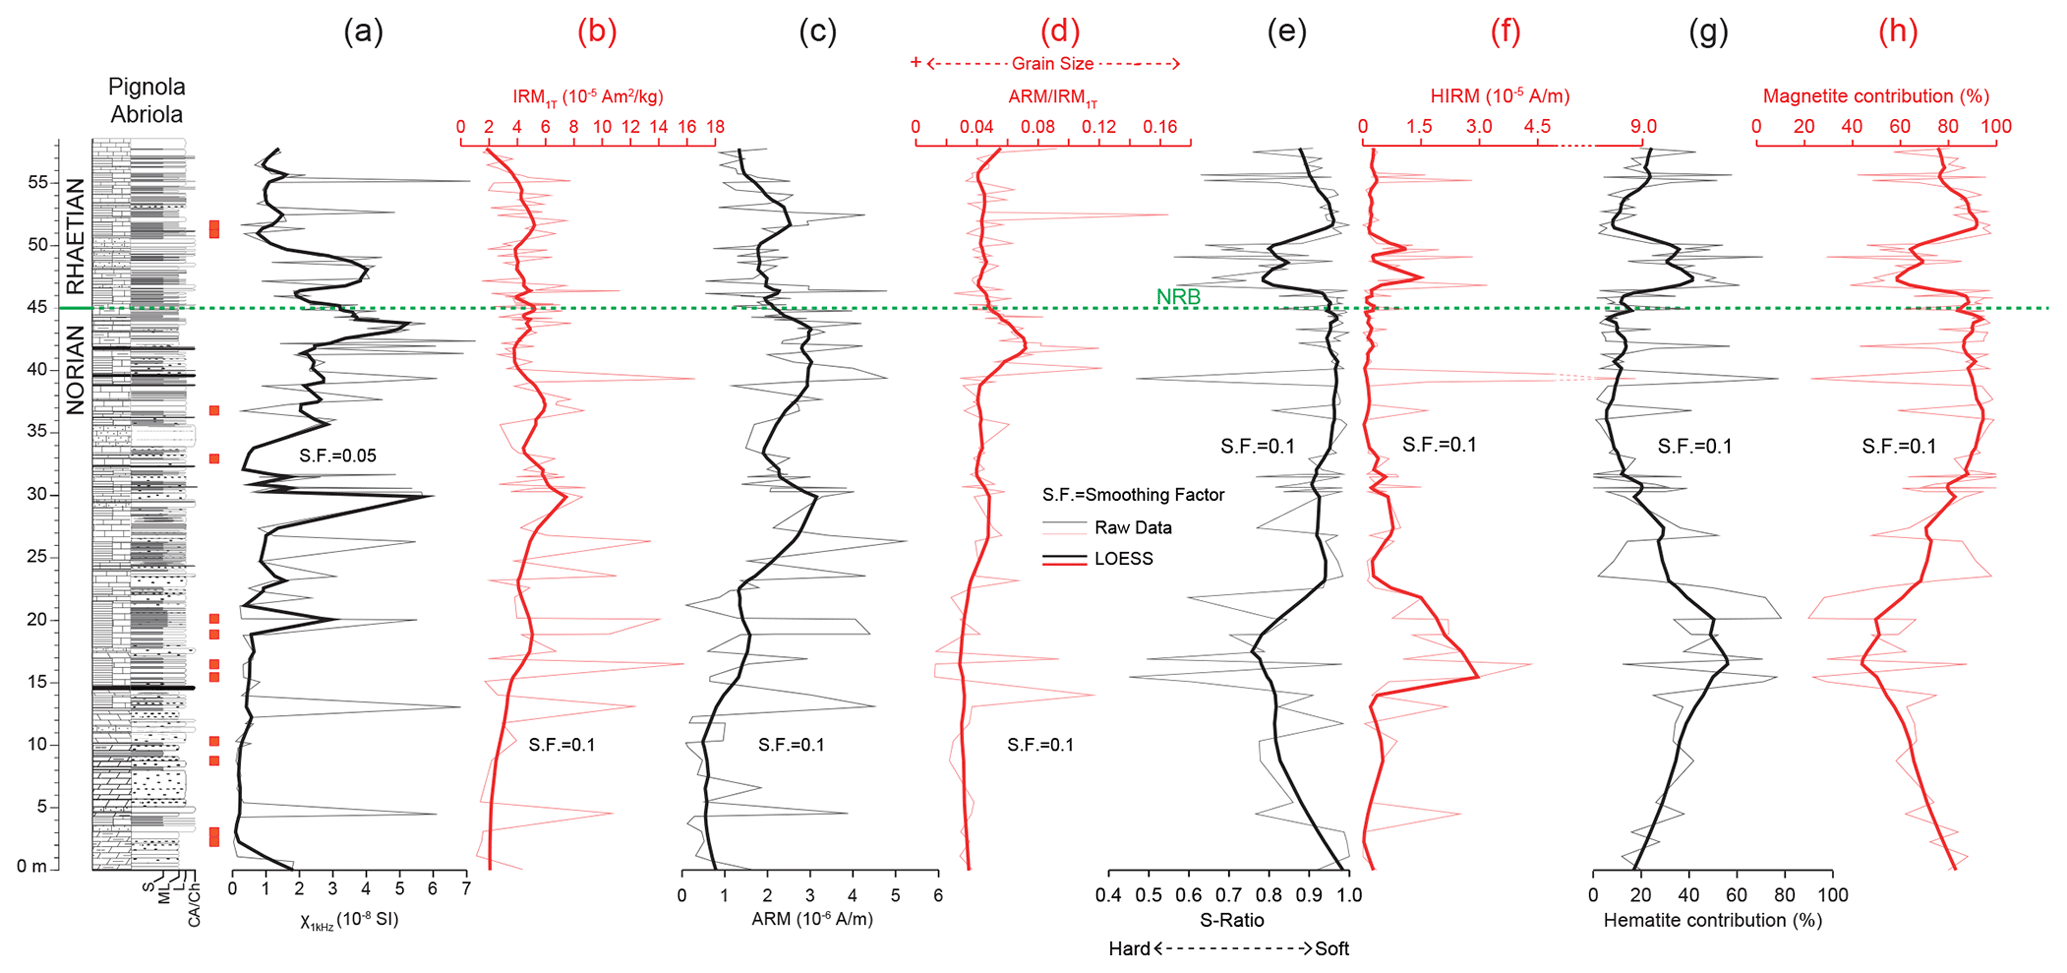
Figure 2Lithostratigraphy and rock magnetic parameters of the Pignola–Abriola section. (a) Low-field magnetic susceptibility χ at 1 kHz of frequency. (b) Saturation IRM at 1T. (c) ARM acquired with an AC field of 100 mT under a bias DC field of 0.1 mT. (d) ARM IRM1T ratio. (e) S ratio. (f) HIRM. (g) Hematite contribution from IRM unmixing. The thick black/red line shows local regression smoothing (LOESS). Greigite-bearing samples are marked as red squares alongside lithostratigraphy.
The ARM curve shows a similar trend in the lower part of the section (10–30 m) but higher values between 35 and 45 m that decrease while approaching the NRB (similar to the χ curve), showing peaks that mirror the IRM1T curve (Fig. 2c).
In the lower part of the section (up to 15–17 m), a relevant increase in high-coercivity phases is shown by the S ratio (Fig. 2e) and HIRM (Fig. 2f), correlative to an increase in the coercivity of remanence (Hcr; Fig. A1). Similarly, an increase in high-coercivity minerals is recognized a few meters above the NRB between ∼ 46 and ∼ 50 m (Fig. 2e, f). The presence of resedimented calcarenites in this interval suggests that the increased quantity of hard coercivity minerals could be due to enhanced detrital input.
4.1.2 Magnetic mineralogy
Previous analysis of the thermal demagnetization of a three-axis IRM (Maron et al., 2015) indicates that this high-coercivity fraction is hematite. The preserved magnetostratigraphic record in the Pignola–Abriola section (Maron et al., 2015) supports the primary origin of this hematite (together with magnetite). Moreover, the application of the elongation/inclination statistical method of Tauxe and Kent (2004) provided a flattening factor of 0.6 that is typical of detrital grains (Maron et al., 2015).
The χ vs. T diagrams performed in the Ar atmosphere show the presence of magnetite in both the heating and cooling curves (Curie temperature is TC ≈ 580 °C; Fig. 3) and the neoformation of magnetite, possibly from the conversion of mineral precursors (see below). Hematite is not clearly visible in our χ vs. T diagrams (possibly due to its very low χ), although it was observed in Pignola–Abriola samples using IRM thermal decay experiments (Maron et al., 2015).
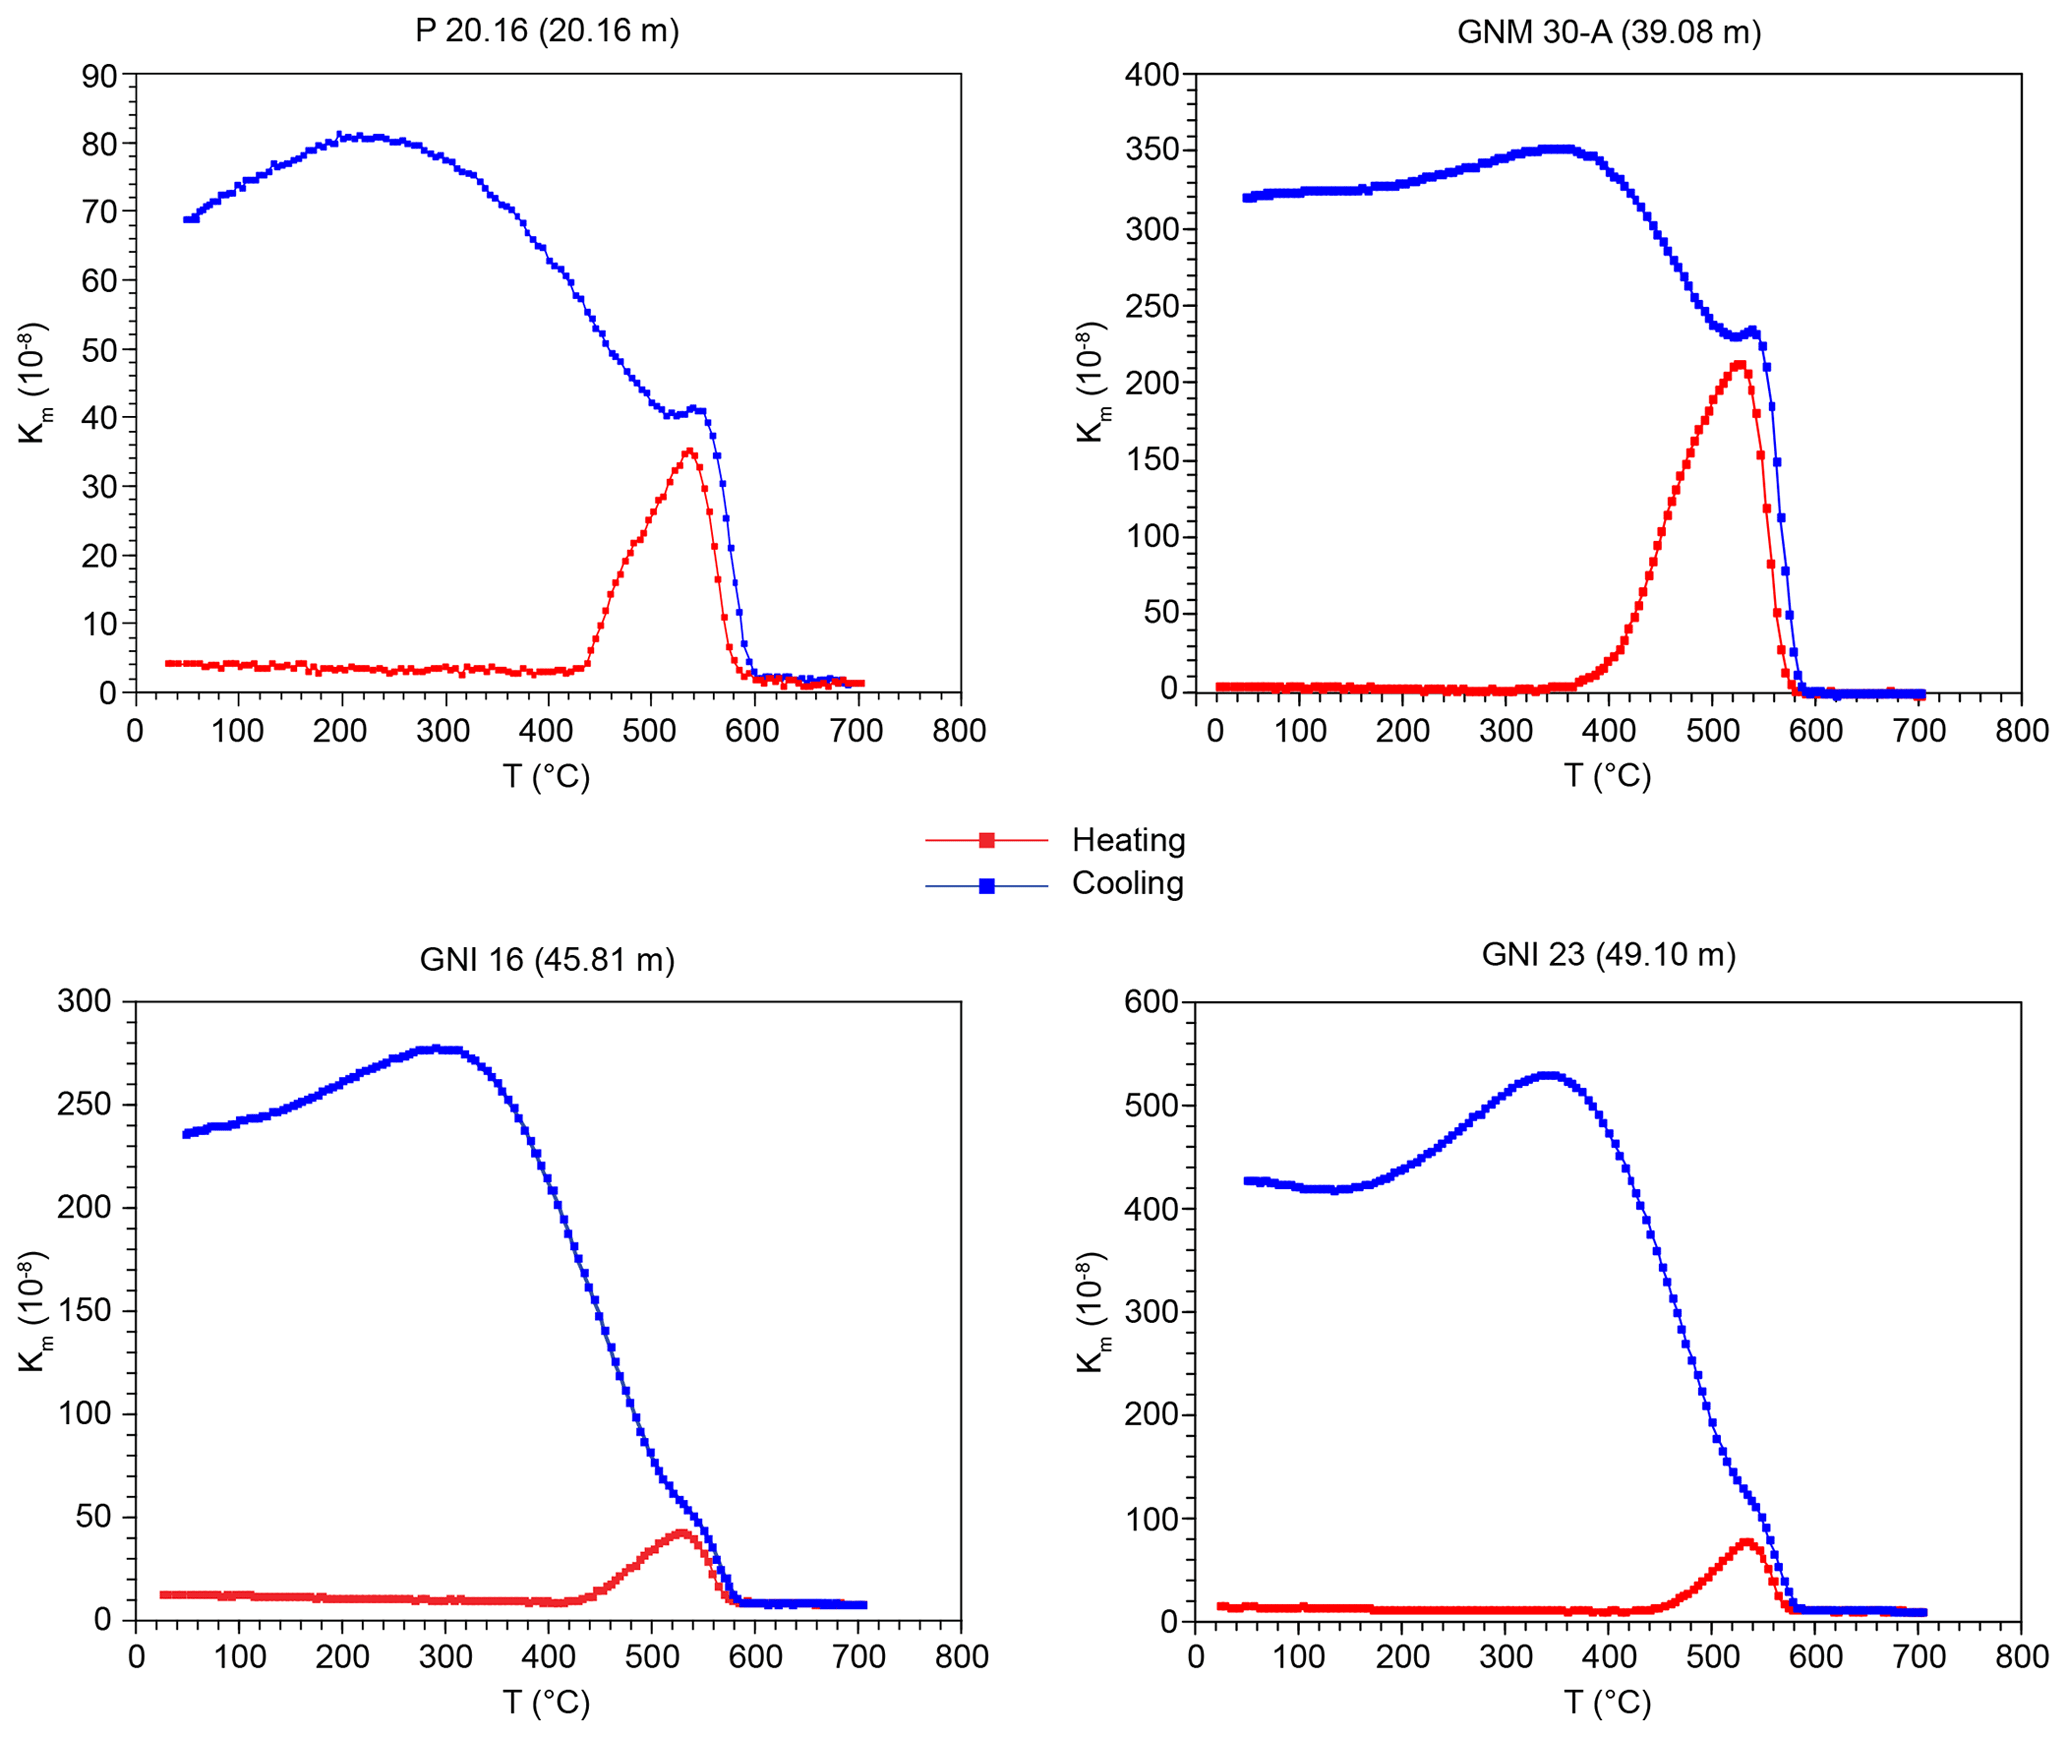
Figure 3Heating–cooling curves of susceptibility against temperature (χ vs. T) of representative samples from the Pignola–Abriola section (see text for discussion). Curves were obtained using Cureval software by AGICO.
A peak of susceptibility appearing between ∼ 400 and 500 °C in the heating curve (peak susceptibility [χH]/room temperature susceptibility [χR] ranging from 4 to 50) is interpreted due to the mineralogical transformation during heating rather than a Hopkinson peak (Hopkinson, 1889; Dunlop, 1974; King and Ranganai, 2001; Dunlop and Özdemir, 2007; Dunlop, 2014), where should not exceed 2.2 (e.g., Dunlop, 2014). The presence of pyritized radiolarians (Bazzucchi et al., 2005; Rigo et al., 2005; Giordano et al., 2010; Maron et al., 2015) indicate that pyrite could be the precursor mineral that alters into magnetite. Oxidation of iron sulfides is reported in both oxidizing (air) and inert (Ar) atmosphere (e.g., Li and Zhang, 2005; L. Wang et al., 2008), starting at ∼ 400 °C (Weaver et al., 2002). Ferromagnetic iron sulfides seem to be rare in the Pignola–Abriola section (see also Maron et al., 2015). The χ vs. IRM diagram (Larrasoaña et al., 2007) indicates that most of the samples are in the range of magnetite (IRM < 15 kA m−1), with only 10 samples apparently also containing greigite (Fig. 4). Iron-bearing clay minerals can also be involved in the formation of new magnetite through heating.
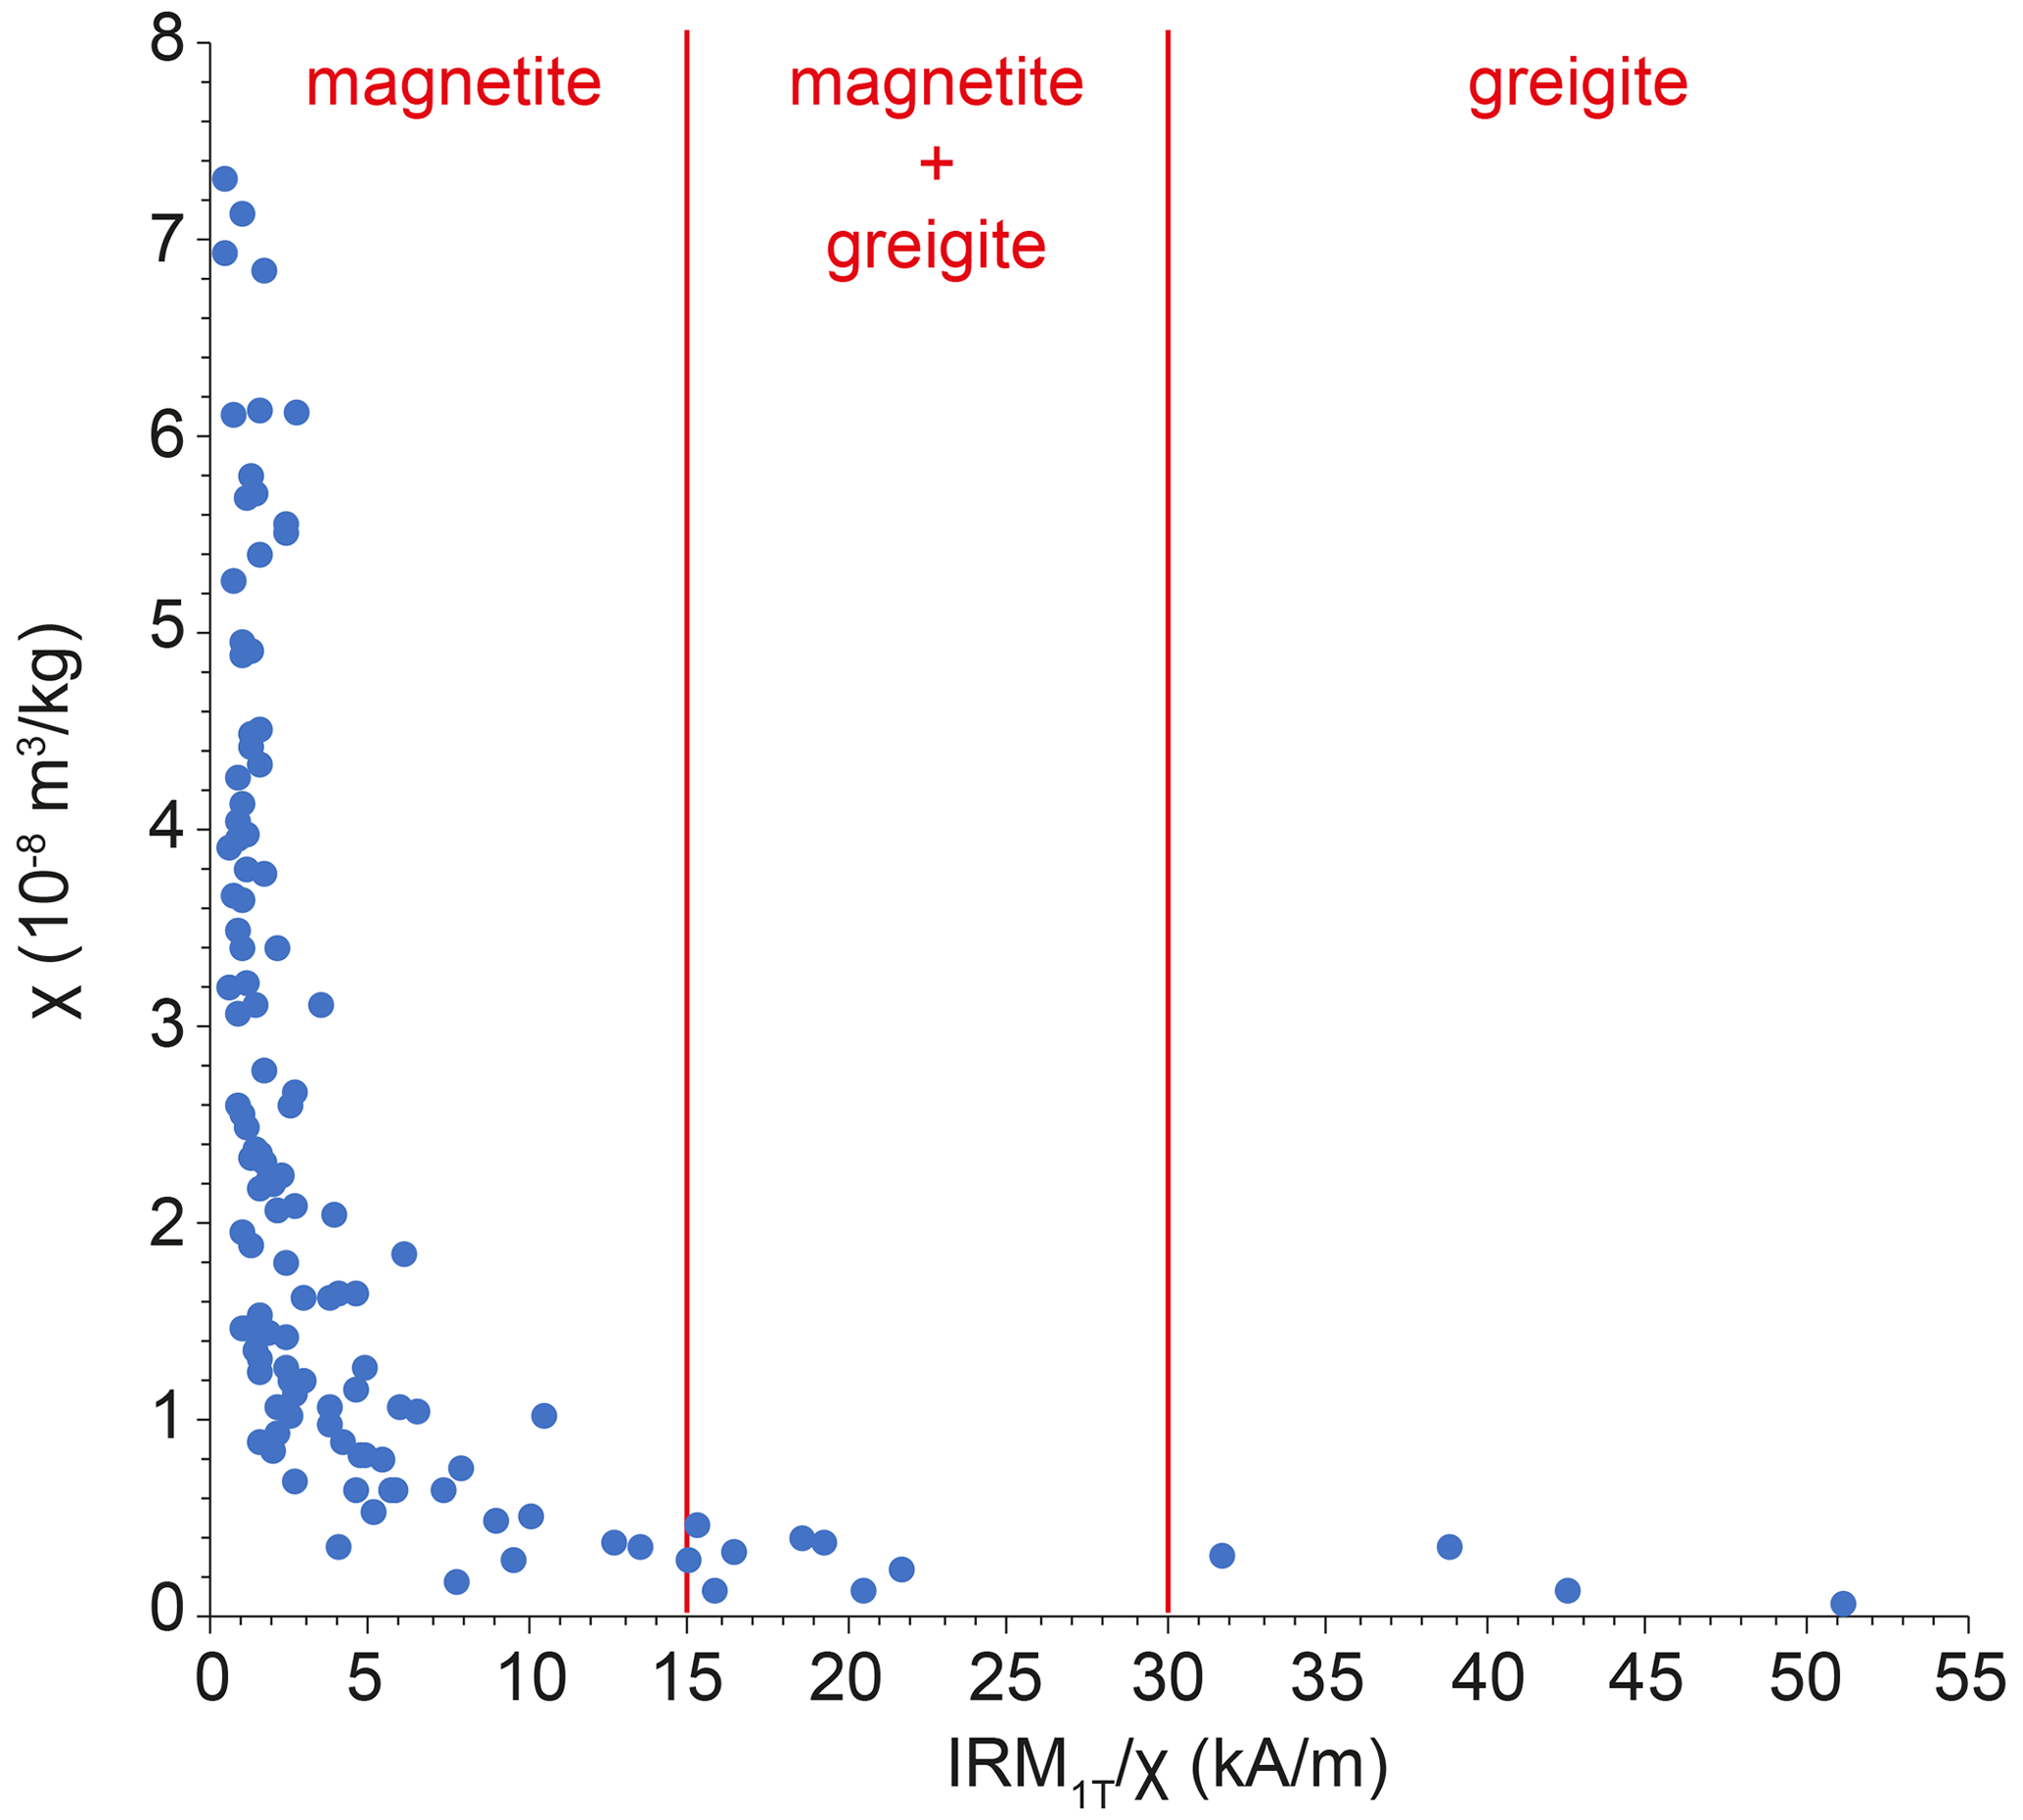
Figure 4The χ vs. IRM plot (Larrasoaña et al., 2007) indicates that almost the majority of the samples lack ferromagnetic iron sulfides (greigite), with a 10th of them showing dominant greigite or a mixture of magnetite and greigite.
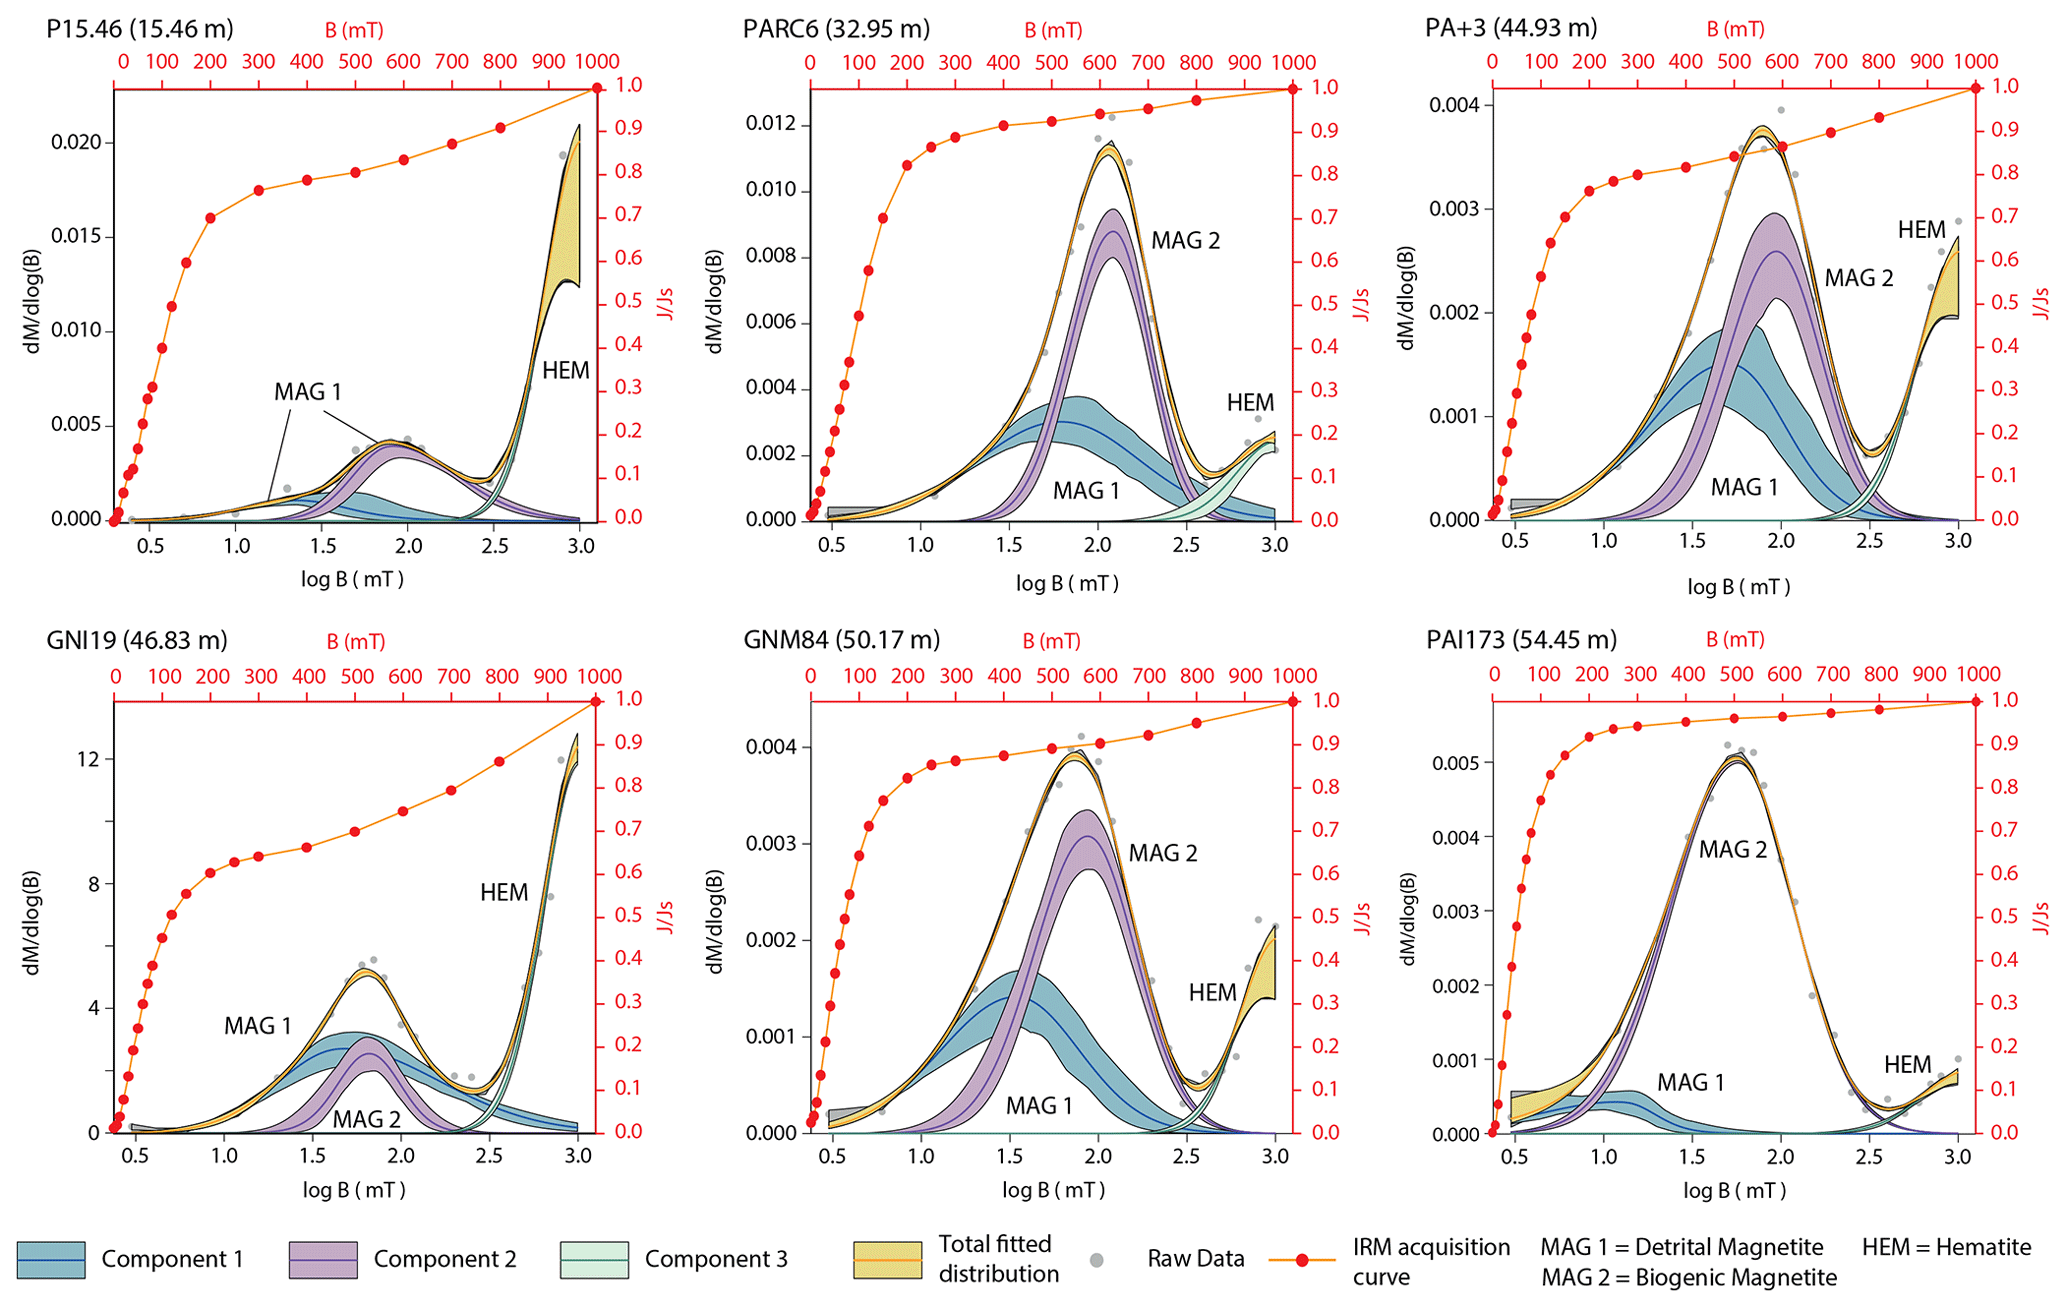
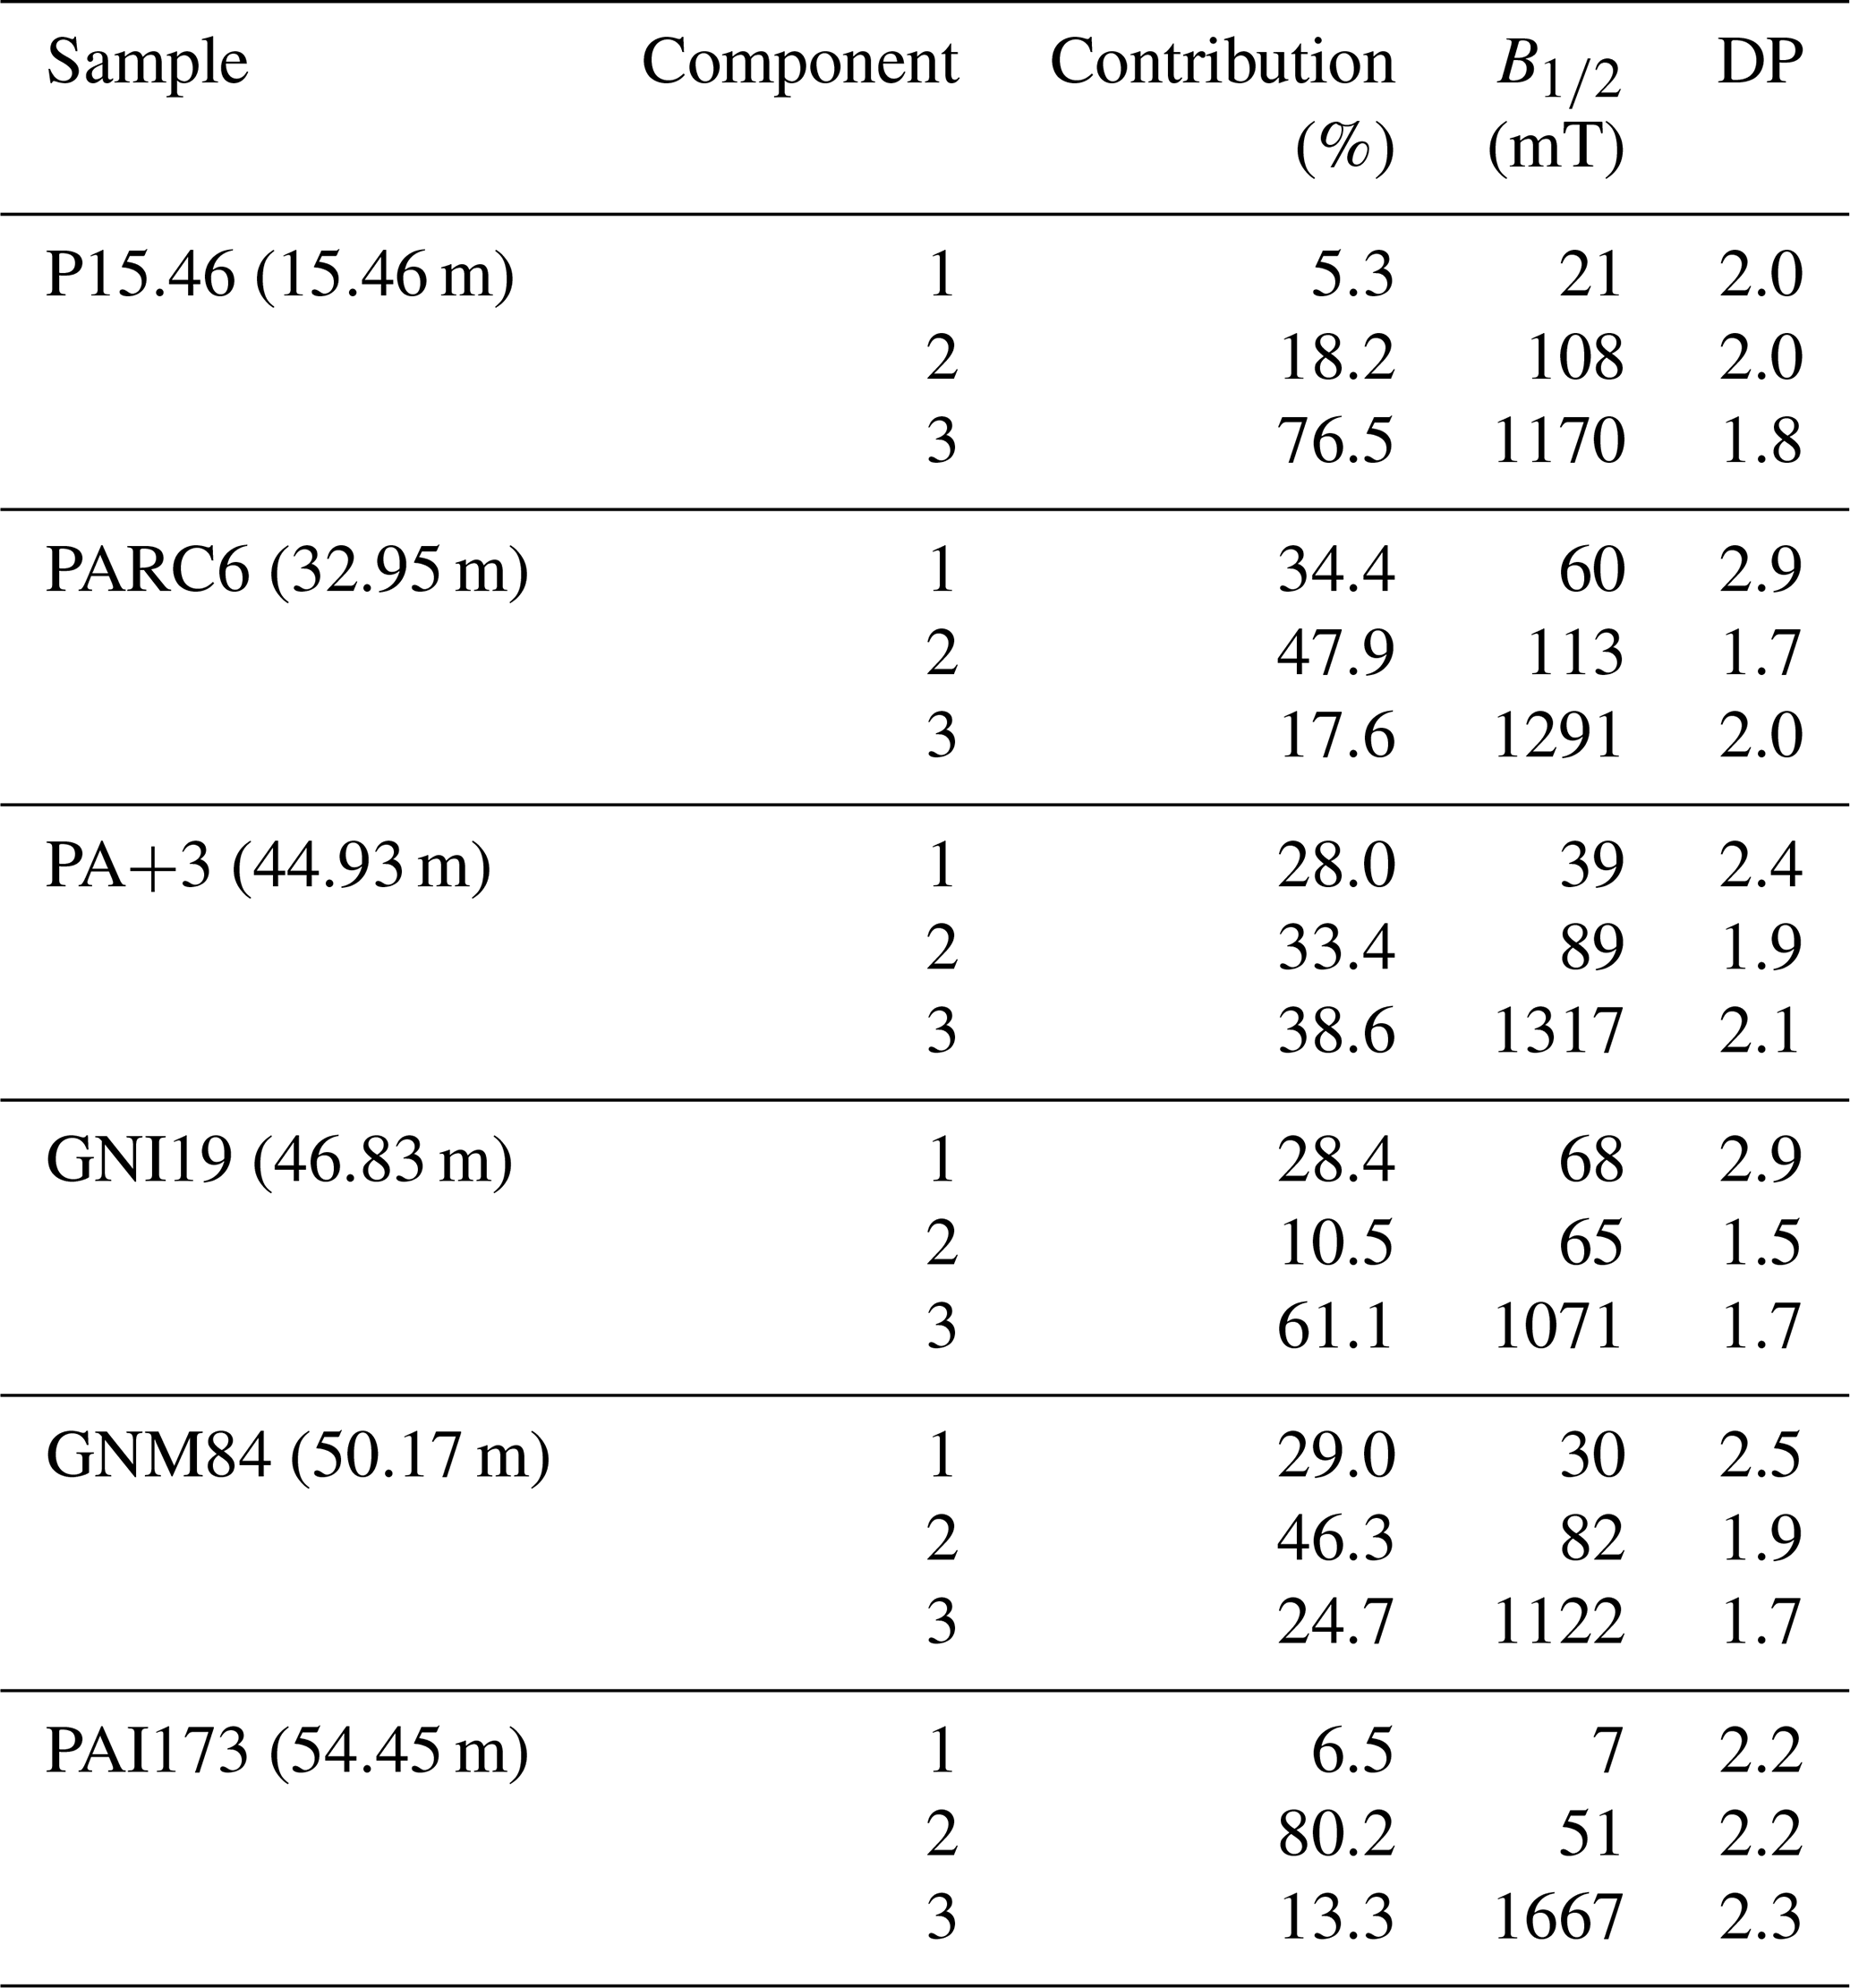
Figure 5IRM unmixing and acquisition curves of representative samples from the Pignola–Abriola section. Unmixing has been obtained using MAX Unmix online software (Maxbauer et al., 2016a).
The unmixing of IRM acquisition curves reveals at least two low-coercivity components that can be attributed to magnetite (Fig. 5; Table 1) and a high-coercivity component that can be attributed to hematite (Fig. 5; Table 1). The trend of hematite contribution, as presented in Fig. 2g, mirrors the HIRM and S-ratio curves. The total contribution of magnetite is higher between ∼ 25 and ∼ 40 m and decreases up-section, while fluctuating in a series of pulses (Fig. 2H). The unmixing of IRM acquisition curves reveals at least two low-coercivity components that can be attributed to magnetite (MAG-1 and MAG-2; Fig. 5; Table 1) and a high-coercivity component that can be attributed to hematite (Fig. 5; Table 1). The dispersion parameter (DP; Table 1), defined as the standard deviation of the coercivity distribution (Egli, 2004), can be used to discriminate roughly the detrital component of magnetite from the authigenic (i.e., biogenic) component. Usually, detrital magnetite has a larger DP than biogenic magnetite (Egli, 2004), although a threshold between detrital and biogenic is hard to define. Our preliminary interpretation of the two components considers MAG-1 detrital (larger DP) and MAG-2 biogenic (smaller DP) (Fig. 5). The presence of biogenic magnetite is also suggested by the central ridge visible in first‐order reversal curve (FORC) diagrams, in particular around the NRB (e.g., sample PA+55 at 45.45 m; Appendix Fig. A2). The averaged FORC diagram shows a well-defined central ridge dominated by low-coercivity phases (Fig. A3), possibly due to soft biogenic magnetite (Roberts et al., 2014). The samples containing greigite (Fig. 4) do not seem to be strictly related to a high concentration of magnetite, except in the upper part of the section, in the lower Rhaetian (Fig. 2).
4.1.3 Magnetic grain size
ARM values are generally higher in single-domain (SD) magnetite grains (Egli and Lowrie, 2002); thus, a decrease in ARM could be associated with an increase in magnetite granulometry but also to an increase in high-coercivity minerals less susceptible to ARM. The grain-size-sensitive parameter ARM IRM1T shows a decrease in grain size between ∼ 38 and ∼ 42 m just below the NRB (Fig. 2d). The trend of the ARM IRM1T curve mostly resembles the ARM curve, especially in the 35–45 m interval, suggesting that grain size plays a larger role in ARM intensity than mineralogy. To test the reliability of the ARM IRM1T parameter as a grain size indicator, we calculate the ARM IRM ratio with IRM acquired at the same field as ARM (100 mT) in order to exclude the influence of high-coercivity minerals from the ARM IRM ratio. The results show that the trend of ARM IRM100 mT is mostly similar to both the ARM IRM1T and ARM trends (Fig. A4). Thus, we can confidently use the ARM IRM1T as a grain size proxy.
The hysteresis curves, corrected for ubiquitous paramagnetic signals (Fig. 6a), yielded parameters that place most of the samples between the SD–MD and SP–SD mixing curves of magnetite on a modified Day et al. (1977) plot (Dunlop, 2002a, b) (Fig. 6b). We also plot in Fig. 6b the hematite + magnetite mixing line of Liu et al. (2019) and the SD–MD greigite mixing line of Roberts et al. (2011), none of which seem to describe the data distribution of our samples, which are characterized by a more complex magnetic mineralogy.
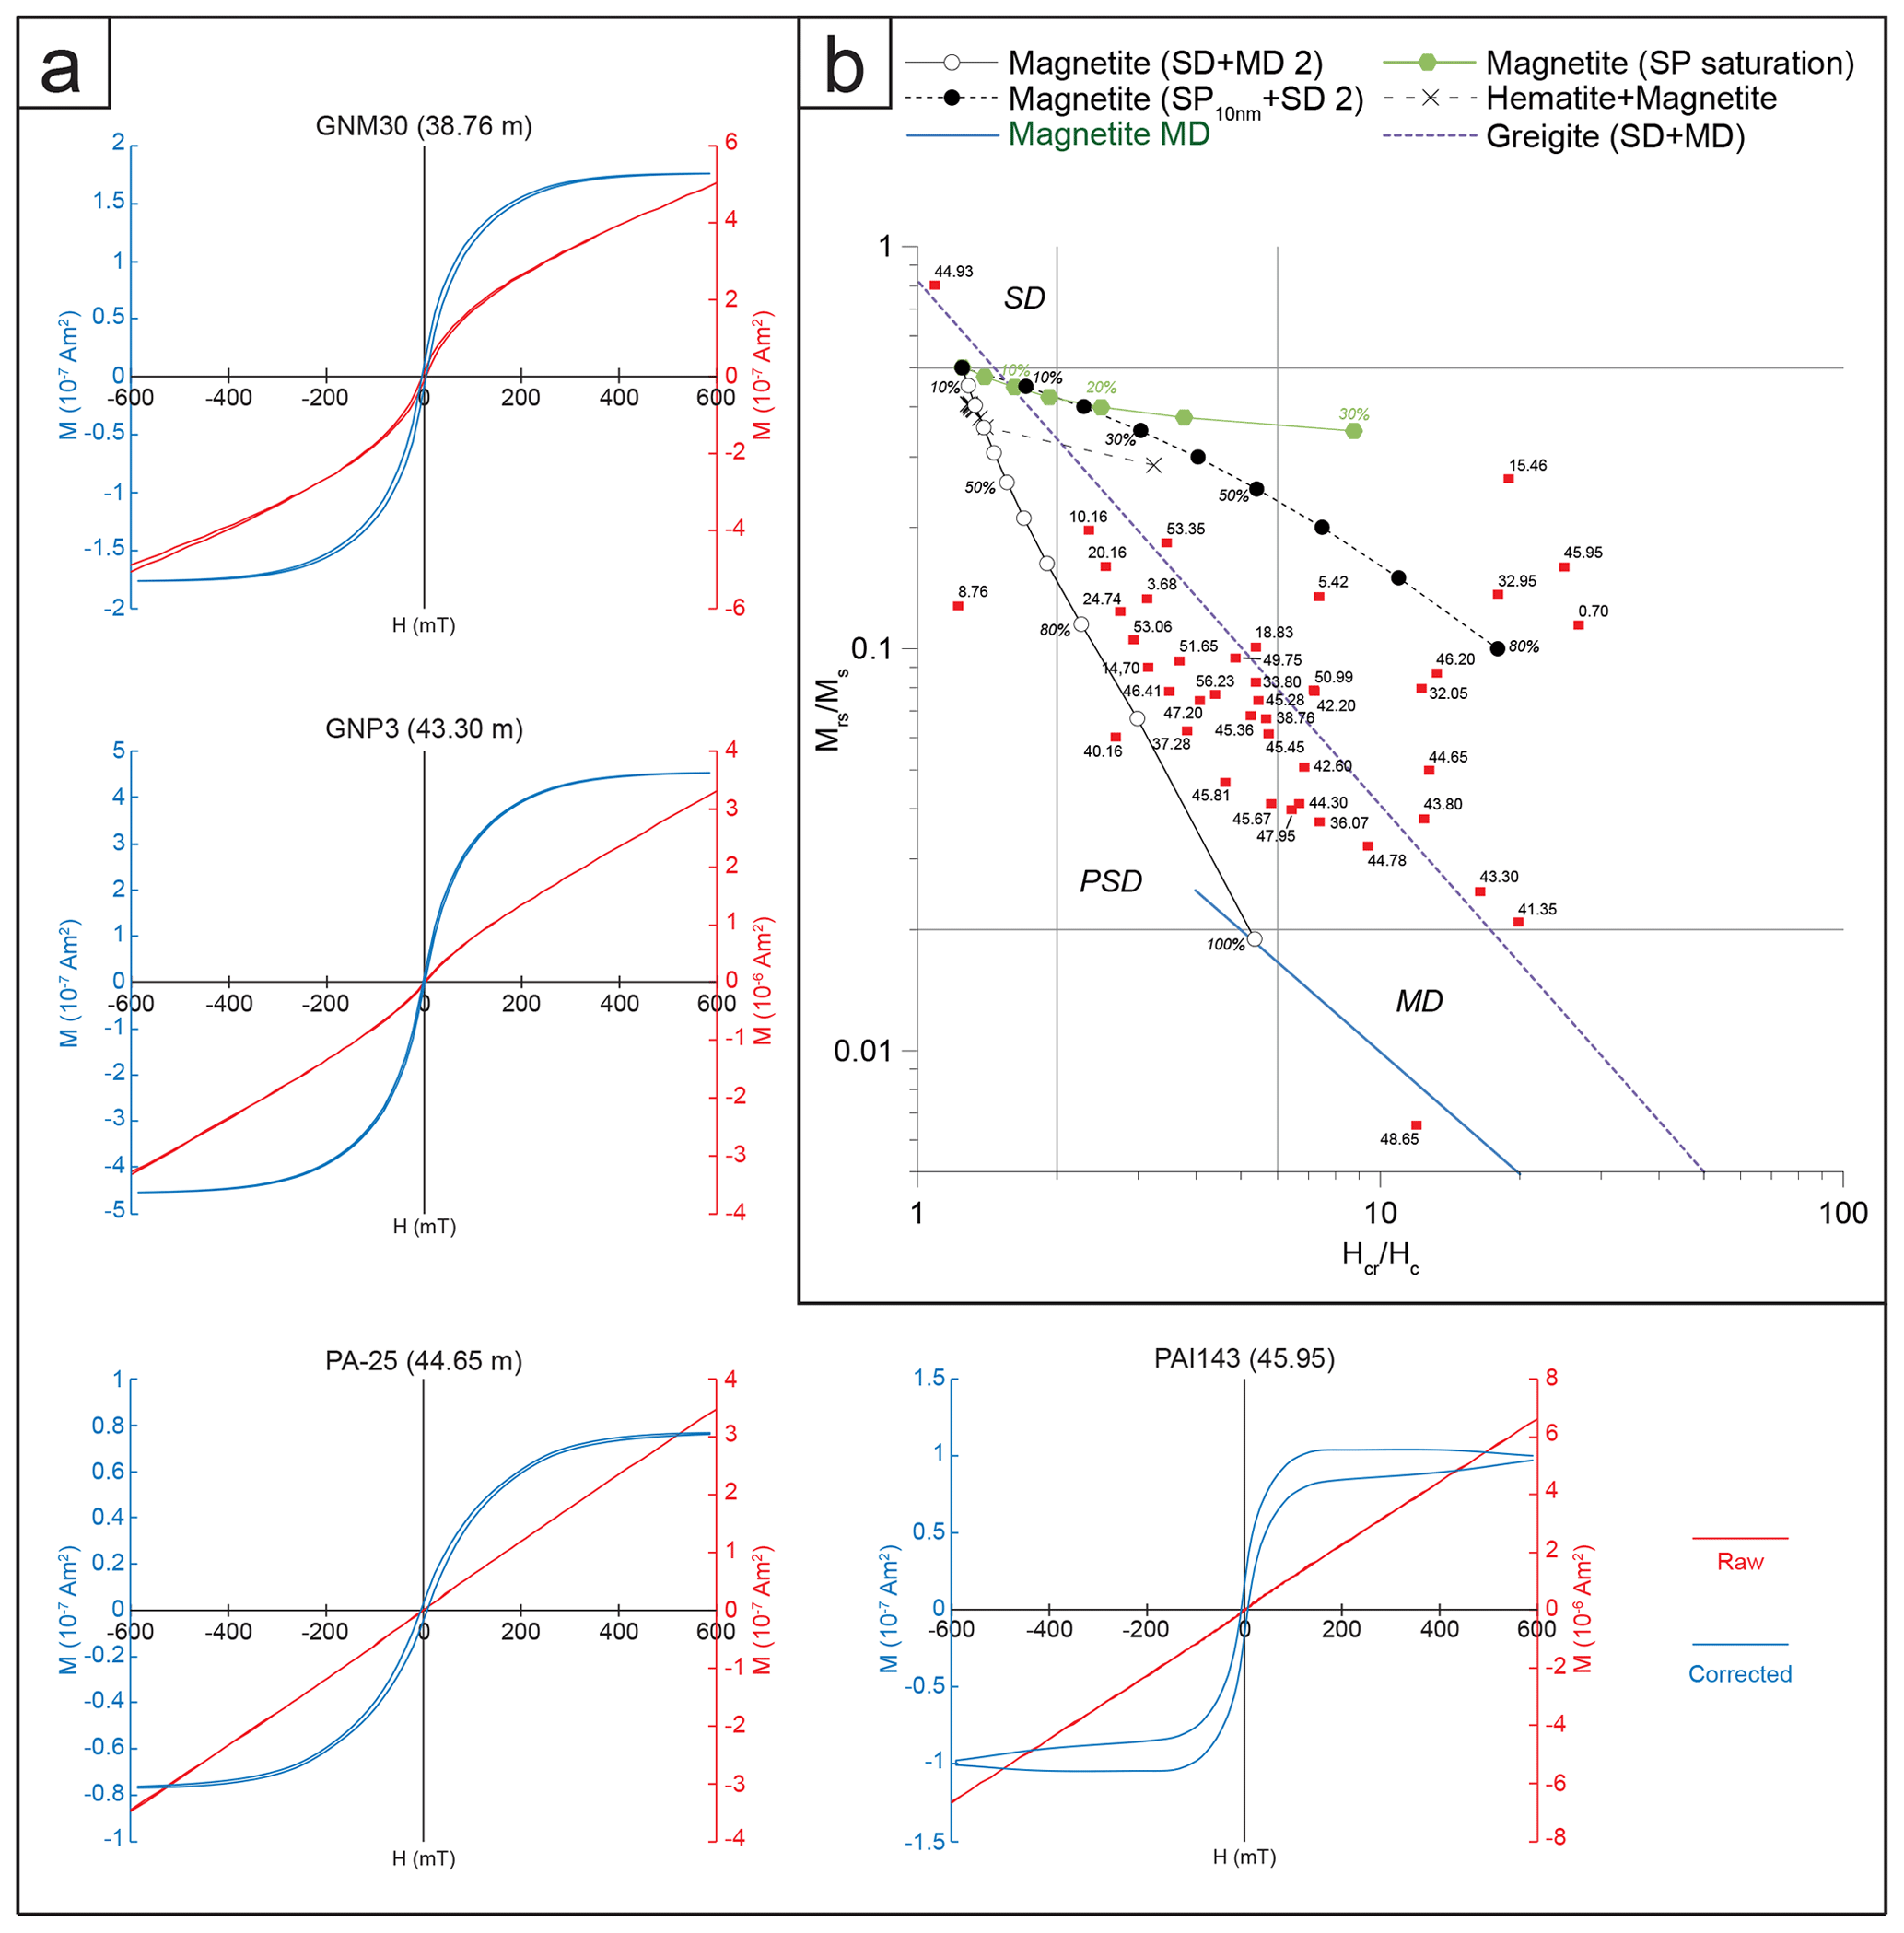
Figure 6Coercivity analysis from the Pignola–Abriola section. (a) Hysteresis loops of representative samples. (b) Day plot (Day et al., 1977; Dunlop et al., 2002a) indicating that most of the grains are located between the pseudo-single domain (PSD) and single domain-superparamagnetic (SD–SP) size. Magnetite SD+MD, SP+SD, MD, and SP mixing curves are from Dunlop (2002a). The hematite+magnetite mixing curve is from Liu et al. (2019). The greigite SD+MD mixing curve is from Roberts et al. (2011). The correction of hysteresis loops in panel (a) was made with HystLab (Paterson et al., 2018).
4.1.4 Summary
In summary, rock magnetism experiments indicate that magnetite and hematite are the main ferromagnetic minerals of the Pignola–Abriola sedimentary sequence, with a minor amount of iron sulfides, as possibly suggested by the χ vs. T curves (Fig. 3). In general, magnetite appears to be widespread, as suggested by the hysteresis data (Fig. 6). The amount of hematite appears to be quite variable along the section, showing a major increasing trend from 15 to 17 m followed by a decreasing trend up to 23 m and finally a set of rapid oscillations across the NRB between 39 and 50 m (Fig. 2e, f, h). As suggested by previous data (Maron et al., 2015), this hematite is detrital in origin. As indicated by the ARM IRM1T curve (Fig. 2d), the magnetite grain size is quite stable along the section, except for a slight increase in finer-grained magnetite between 38 and 42 m, possibly related to higher occurrence of authigenic (microbial?) magnetite.
4.2 Geochemistry
The major element data obtained for the 56 shale samples of the Pignola–Abriola section are listed in Table S3 (see the online dataset in Maron et al., 2023). In this study, we employed the chemical index of alteration (CIA; Nesbitt and Young, 1982) to measure degree of chemical weathering in hinterland from major oxides. Values of the CIA indicate the extent of decomposition of feldspar minerals, which are the most abundant mineral group in the UCC. Following the previous study (Casacci et al., 2016), we used a modified form of the CIA equation (Eq. 4) in which CaO is omitted from the denominator because of the high carbonate content of the study units, which makes it difficult to accurately determine the amount of non-carbonate CaO in each sample:
Stratigraphic variations in CIA* values are shown in Fig. 7. The CIA* values begin to increase from 40 m to the top of the section. The value reaches its maximum from 45 m at the NRB.
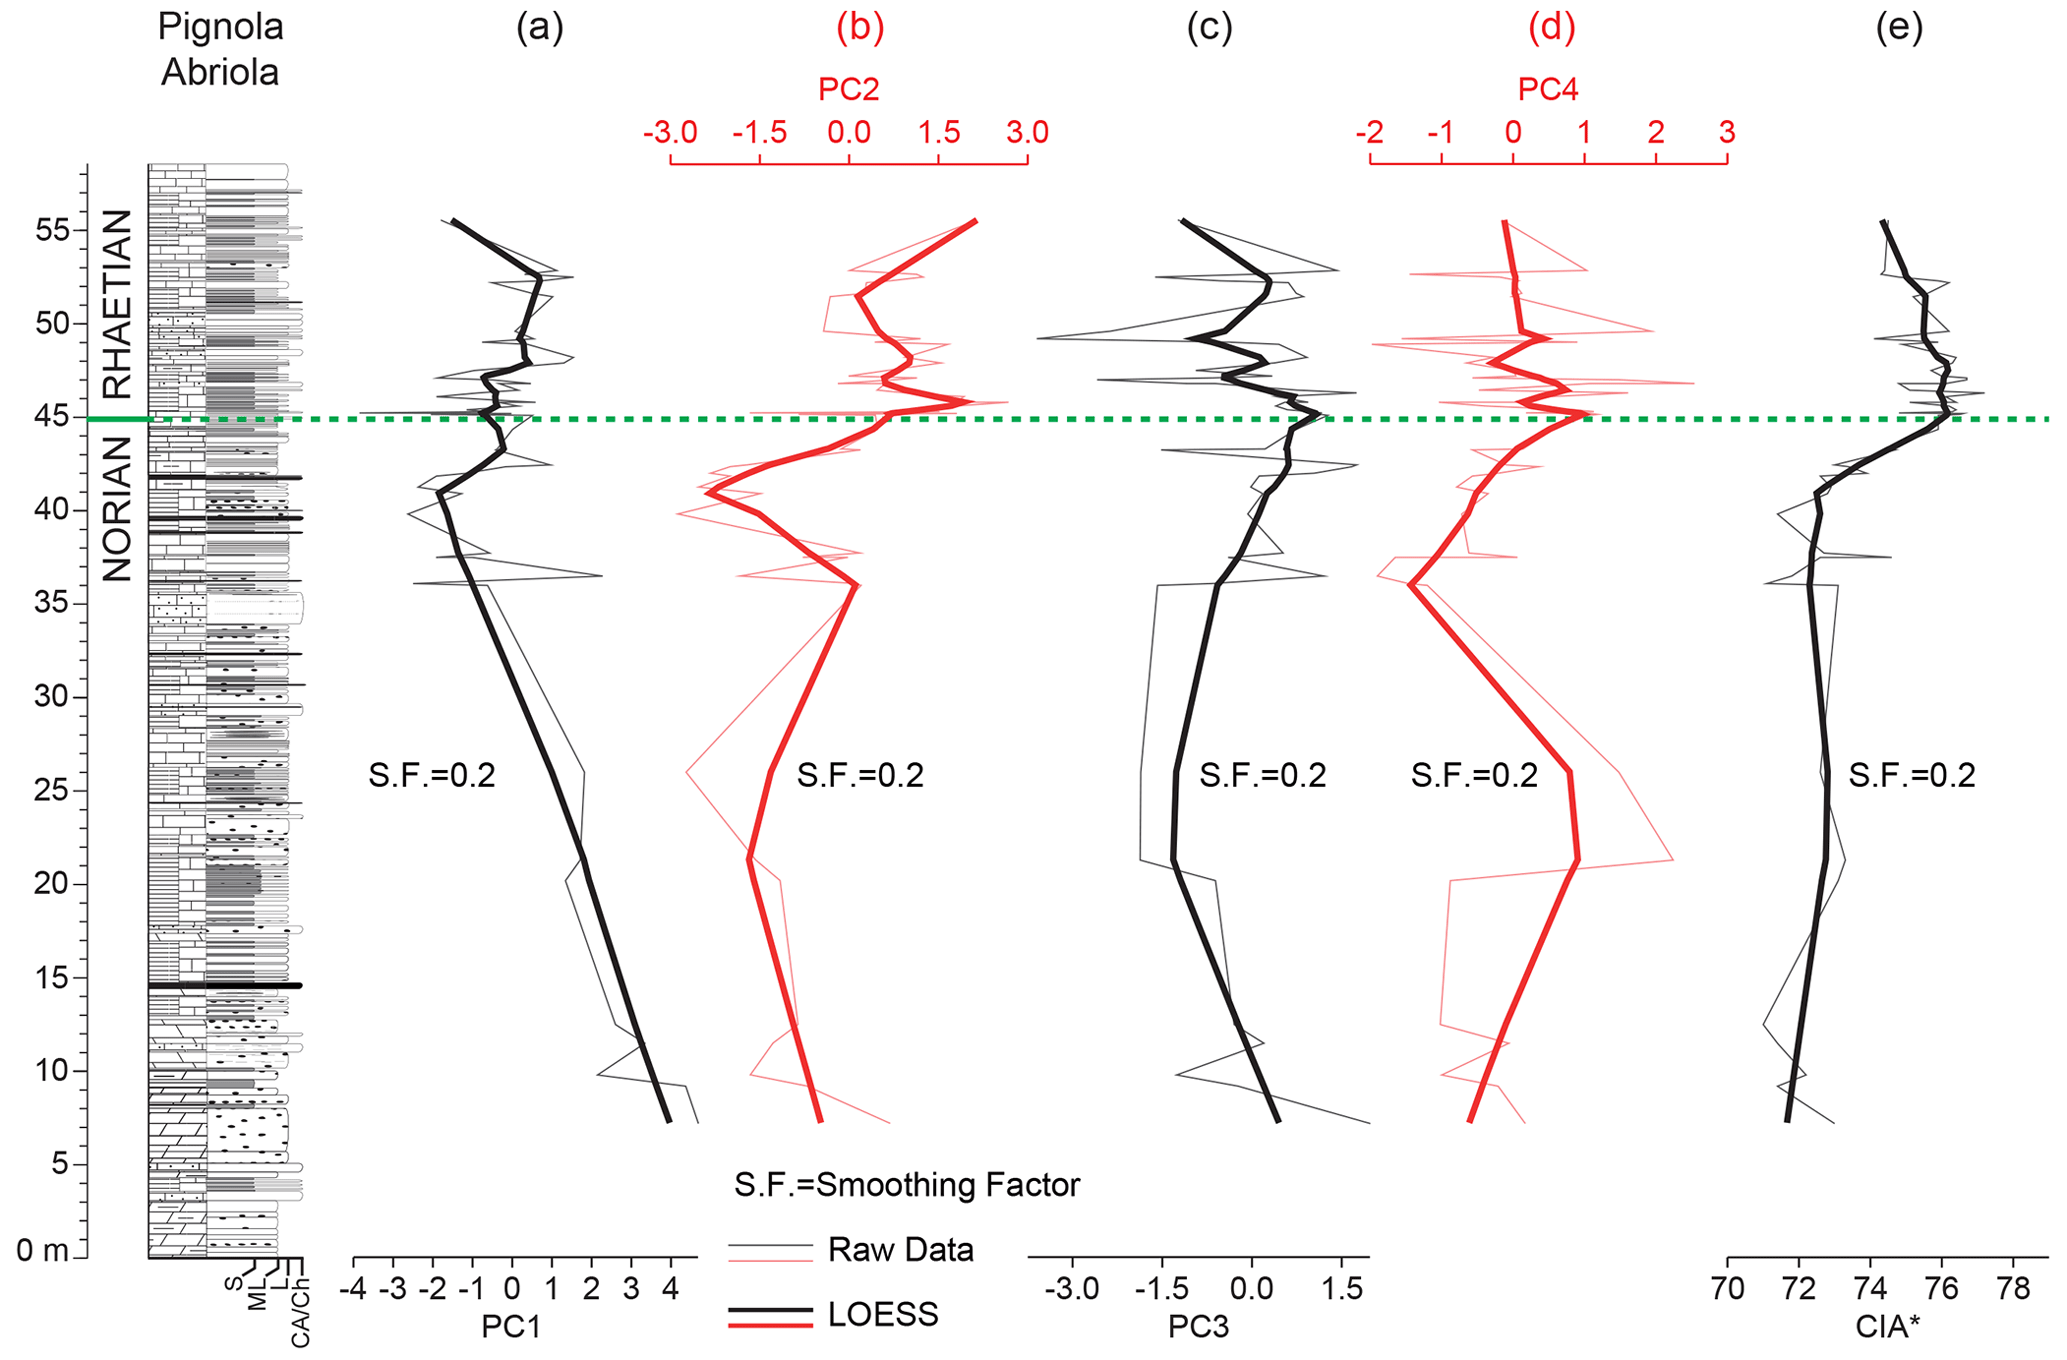
Figure 7tratigraphic variations in PC scores and CIA* (Casacci et al., 2016) in the Pignola–Abriola section. The thick black/red line is the local regression smoothing curve (LOESS).
4.3 Principal component analysis
Table 2 lists the component loadings for the studied samples. PCA showed that the first four principal components explain 79.8 % of the total variance in the dataset with their high eigenvalues (> 1.0). The loadings of PC1 show strong negative values (less than −0.80) for Si and Al, with subordinate negative values for Mg (−0.63), Na (−0.60), and Fe (−0.58). PC2 is characterized by high negative loadings for K (−0.80) and Mg (−0.57) and a high positive loading of Na (0.62). PC3 has a prominent negative loading for Ca (−0.90), with high negative loadings for P (−0.58) and Mn (−0.45). The loadings of PC4 displayed the opposite direction between Mn (−0.65) and P (0.67), compared to the low loadings of the others.
Table 2Principal component loadings calculated from the major element contents of the shales.
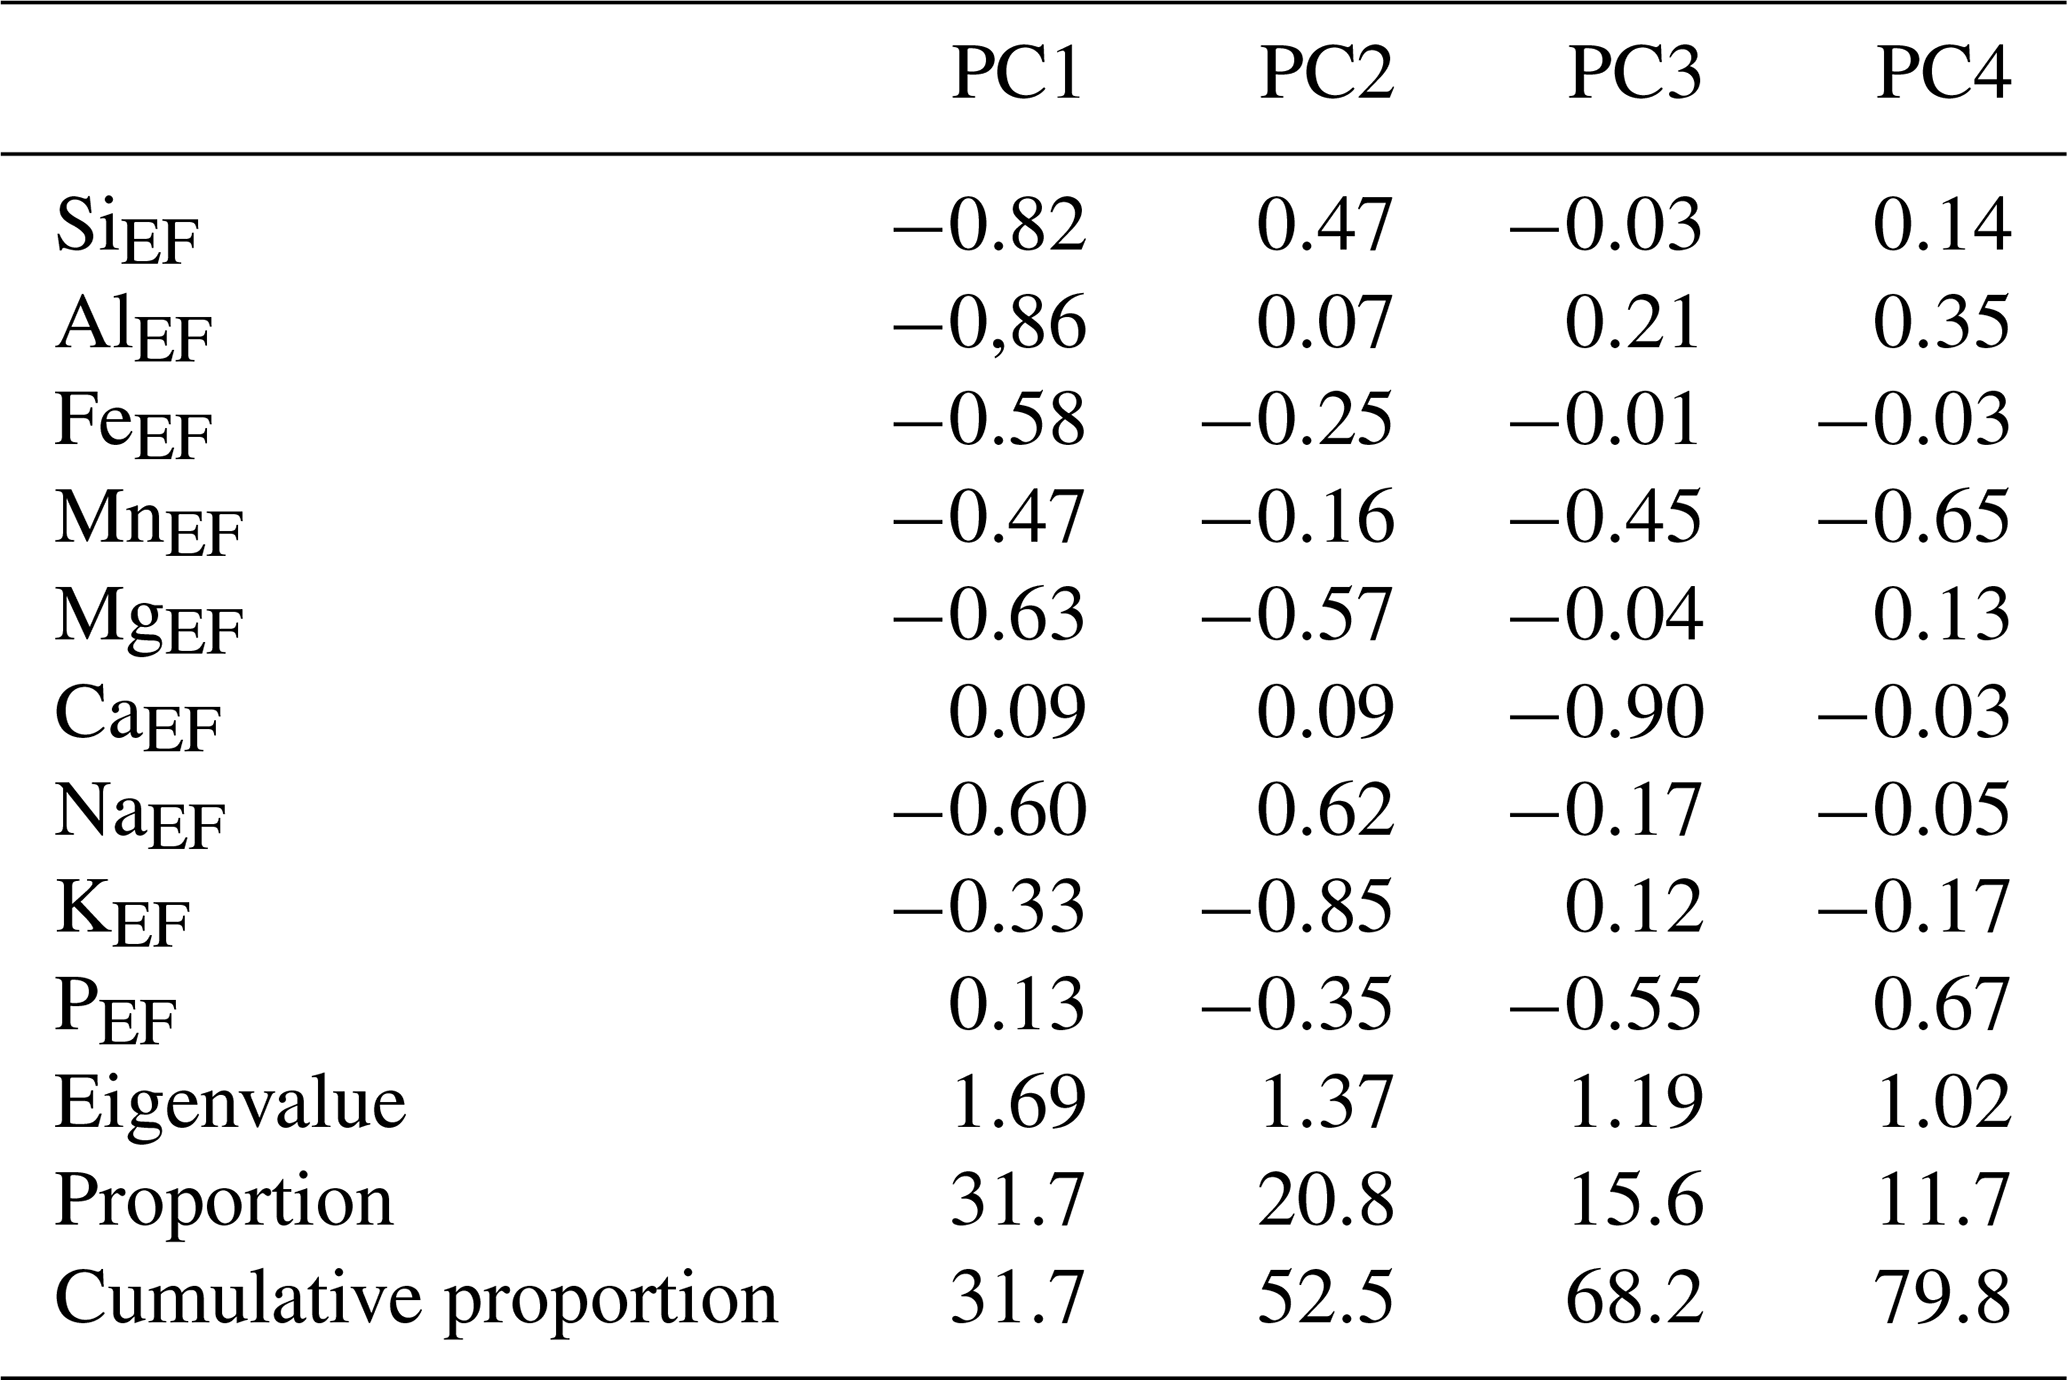
The PC1 scores represent the compositional variations associated with terrigenous detrital materials because of the same directions in the relatively strong loadings for Al, Si, Mg, Na, and Fe. The strong PC1 loadings in Al and Si relative to Mg, Na, and Fe (Fig. 8) reflect the typical order of element mobility during weathering (Goldich, 1938; Middelburg et al., 1988; Pokrovsky et al., 2005). These elemental behaviors in the PC1 axis indicate the intensity of chemical weathering. The PC3 axis explains the calcium carbonate accumulation because the loadings show that a prominent negative loading for Ca and the stratigraphic trend in PC3 is largely similar to those in CaEF (Fig. A1; see Table S3 in Maron et al., 2023). Similar negative loadings for Mn and P suggest that this relates to the precipitation of Mn and P into carbonate minerals at the time of deposition or during burial diagenesis (e.g., Price and Sellwood, 1994), as reported from a multivariate statistical analyses of a Rhaetian carbonate–clastic deposit in the northwestern Tethys (Onoue et al., 2022).
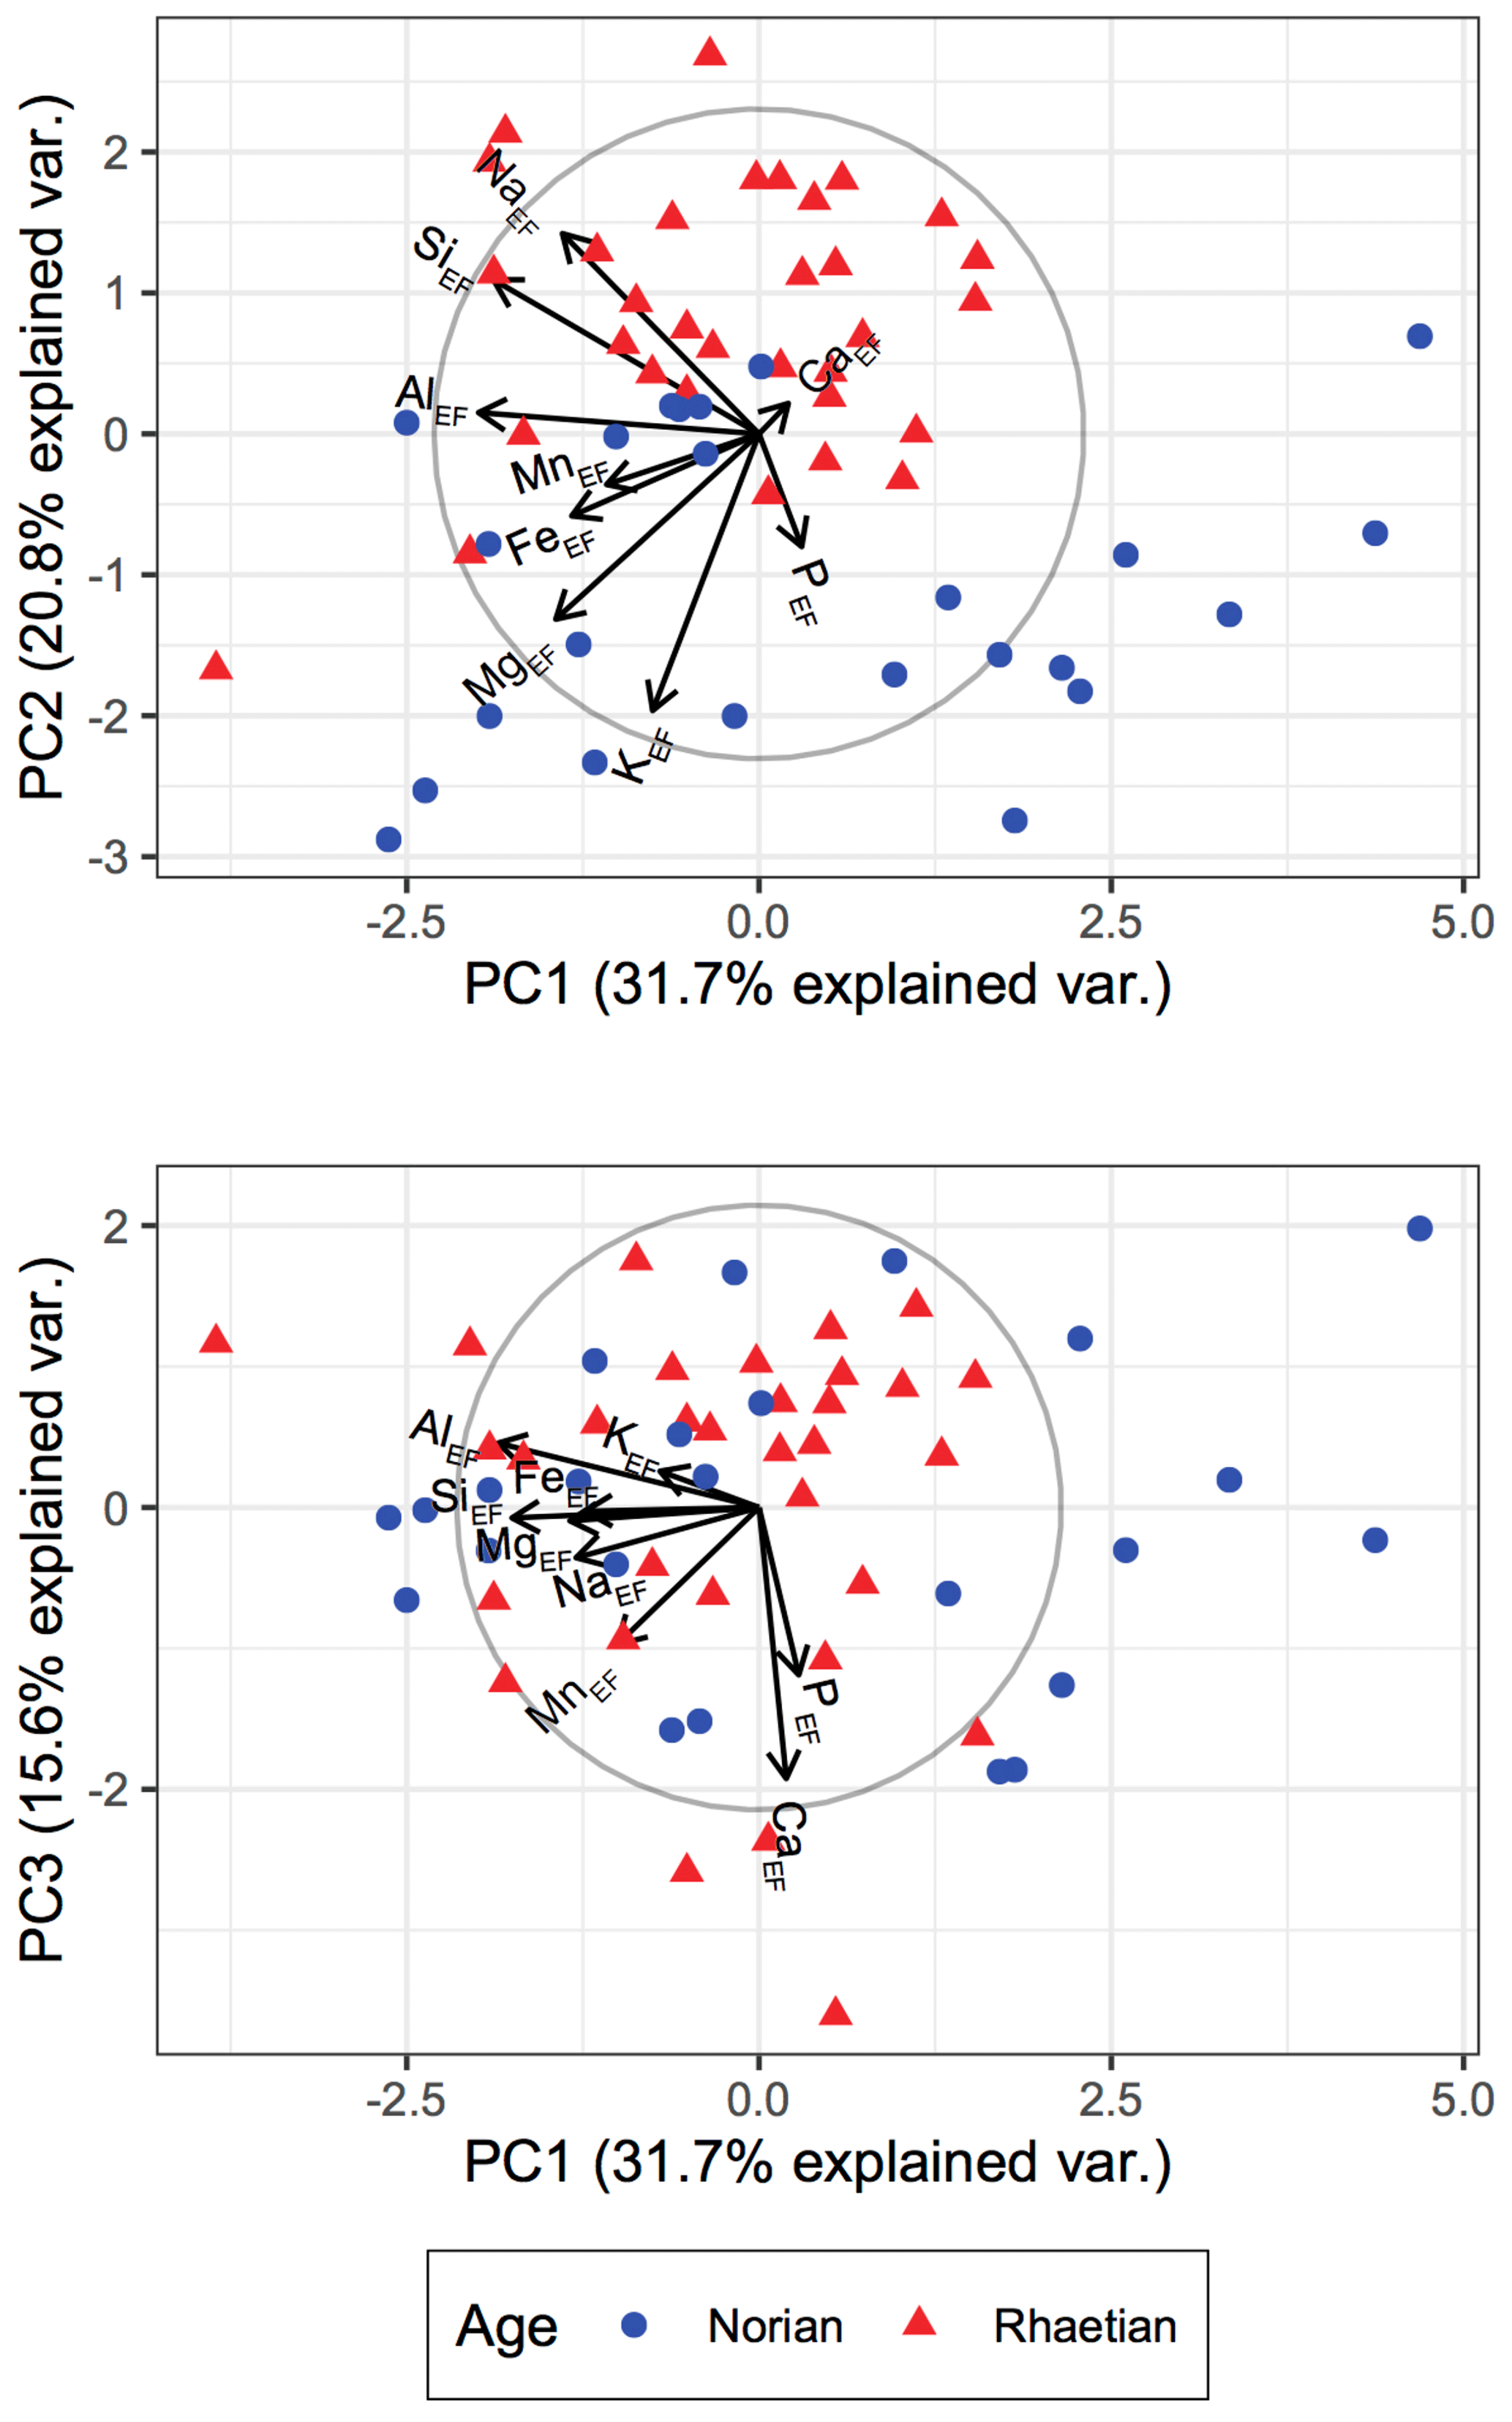
Figure 8Compositional biplots obtained from the major element contents of the shales in the Pignola–Abriola section. Relative directions and lengths of the arrows indicate loadings for the PC axes. Each variance (var.) is represented as a proportion in this dataset.
Although the interpretations for PC2 and PC4 need to be verified by mineralogical and organic geochemical data in future studies, the character of each loading might be interpreted as follows. The PC2 axis might indicate crystallographic structural changes in clay minerals between illite and smectite groups (Brigatti et al., 2006) because of the opposite direction between K and Mg (interlayer cations for illite and chlorite) and Na (exchangeable cation for smectite) (Fig. 8). The positive scores for PC4 could be explained by the preservation of organic matter under reducing conditions. Phosphorous is transferred to the sediment mainly as organically bound P, most of which is subsequently liberated through the re-mineralization of organic matter (Algeo and Ingall, 2007). Organic-bound P is expected to be preserved under suboxic conditions, where Mn is reduced to Mn(II) and forms soluble cations (Algeo and Li, 2020); this explains the opposite direction between P and Mn in PC4.
5.1 Long-term weathering trends
Rock magnetic data (Fig. 9a) show a long-term increasing trend of detrital hematite from at least ∼ 217 Ma in the Alaunian to ∼ 211 Ma in the middle Sevatian, followed by an ensuing long-term decreasing trend of detrital hematite up to ∼ 207–206 Ma in the latest Sevatian.
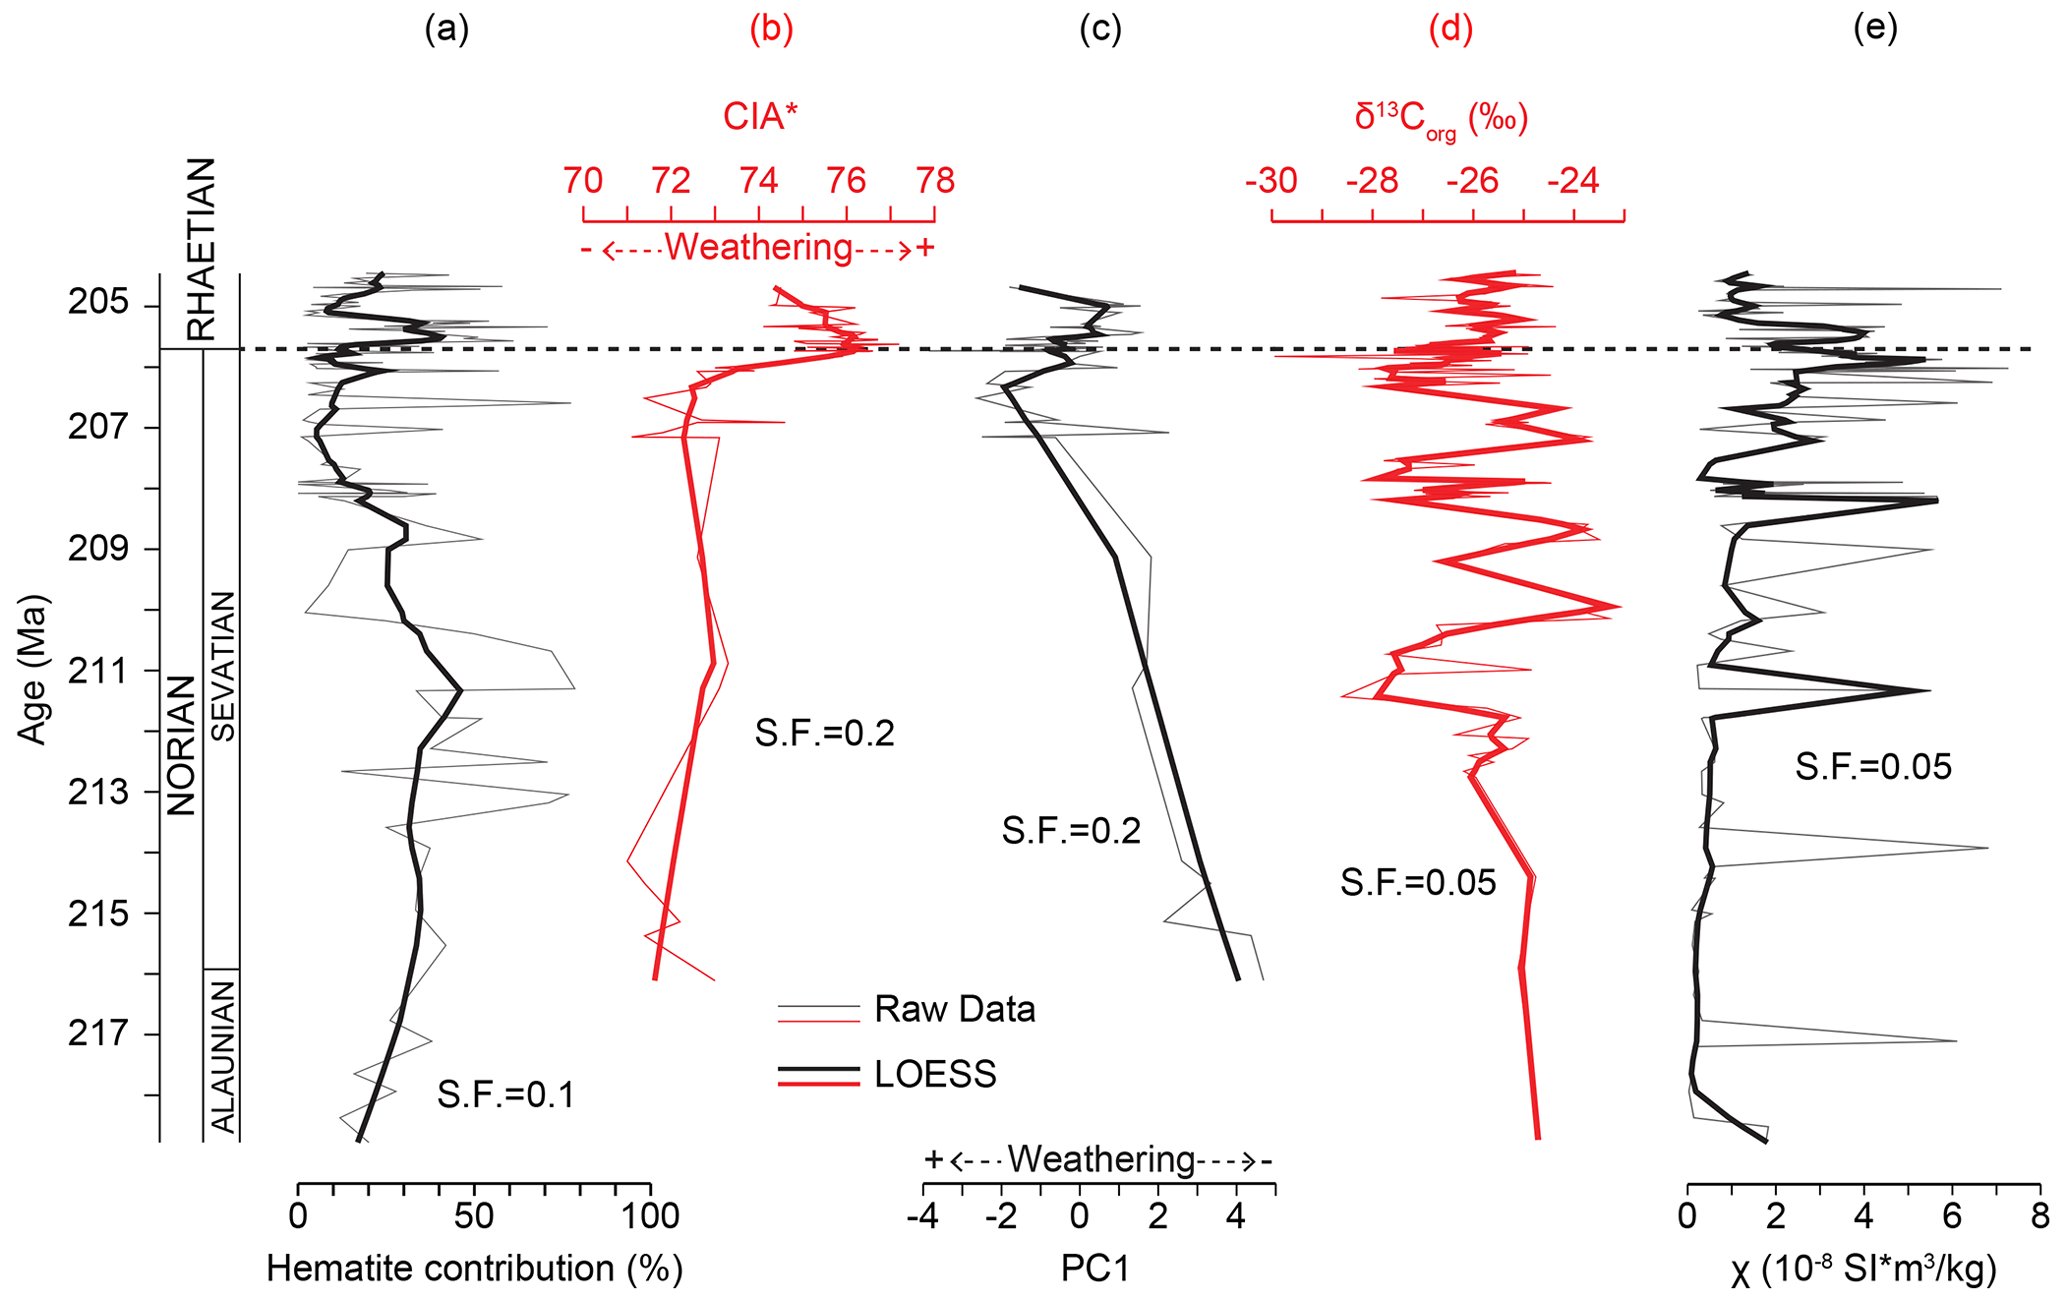
Figure 9Main rock magnetic and geochemical proxies for environmental interpretation. (a) Contribution of hematite (in percentage). (b) Chemical index of alteration (CIA*). (c) PC1 (weathering of silicates from PCA). (d) δ13Corg curve (from Zaffani et al., 2017). (e) Magnetic susceptibility (χ) curve. Vertical scale is in millions of years ago (Ma), following the age model for the Pignola–Abriola section of Maron et al. (2015). The thick black/red line is the local regression smoothing curve (LOESS).
As hematite is a relevant component of soils (e.g., Ambrosi et al., 1986; Hernández-Quiroz et al., 2012; Haldar, 2013; Best, 2015), relative increases/decreases in detrital hematite are interpreted here as indicating increases/decreases in weathering of silicates (also see Sect. 6.2).
5.2 Rapid weathering oscillations
Weathering again becomes more intense, although oscillatory, starting just below the NRB and continuing in the earliest Rhaetian, where hematite shows a rapid increase and PC1 and CIA* reach, respectively, their lowest and the highest values (Fig. 9a–c). A transient decrease in weathering occurs at the NRB close to a major negative excursion of δ13Corg (Fig. 9d) and to an increase in magnetic susceptibility (χ; Fig. 9e). Possible explanations for the susceptibility increase at the NRB could be the production of authigenic magnetite, in particular conditions of scarce oxygenation, as also suggested by the presence of Fe sulfides (greigite) in this interval (as described in Sect. 4.1.2). PC2 scores (Fig. 7b) may also support the interpretation that continental chemical weathering was accelerated at the NRB. The PC2 scores exhibit an abrupt increase in positive scores that begins in the latest Norian (Fig. 7b) and reaches its maximum in the earliest Rhaetian, which may represent a change in the major clay mineral composition from illite to smectite due to the increased precipitation around the hinterland areas. In fact, illite and chlorite are generally formed in the early stages of chemical weathering under dry and cold conditions, whereas smectite is formed under warm and humid conditions (e.g., Fürsich et al., 2005; Nakada et al., 2014).
6.1 Premises
Silicate weathering followed by carbonate deposition is regarded as the main negative feedback mechanism to stabilize pCO2 levels and conjoint surface temperatures (Walker et al., 1981). Typically, global CO2 input from volcanic degassing and metamorphic reactions and output from silicate weathering (and carbon burial) are in dynamic equilibrium, stabilizing the global climate (Walker et al., 1981). However, there are some mechanisms that can perturb this balance on various timescales. A large igneous province (LIP), if emplaced rapidly (e.g., within 1 Myr or shorter), can cause a transient extra CO2 input triggering rapid global warming that in turn accelerates global weathering to handle the extra CO2 input and returns the climate system to pre-stress conditions on relatively rapid timescales (∼ 105 years). When a mafic LIP and/or orogenically uplifted mafic rocks enter the equatorial belt of high humidity and temperature via plate tectonics, they are subject to enhanced weathering that may continue even though global pCO2 and temperatures decrease, temporarily muting the “Walker thermostat” and paving the way for global cooling (Kent and Muttoni, 2008, 2013, and references therein). Similarly, removing uplifted mafic rocks from the Equator may trigger climate to rebound toward warmer states (Kent and Muttoni, 2008, 2013). Conditions of enhanced weathering and global cooling may in theory occur also at mid-latitudes, provided, however, that an equatorial-type climate develops at least seasonally, as described, for example, by the dynamic theory of monsoons. These paleogeographic conditions that may perturb the CO2 input–output balance on timescales of 106 years are of course also dependent on factors such as the extent of mafic rocks that undergo weathering under equatorial or monsoonal climate, their composition (Ca-rich mafic rocks weather more efficiently than other igneous rocks), the degree of exposure due to uplifting/orogenesis/LIP topography, and the degree of burial under regolith cover, etc. (Kent and Muttoni, 2013, and references therein).
6.2 Interpretation
The increase in weathering (increase in hematite input) observed in the Alaunian–early Sevatian at Pignola–Abriola is in temporal agreement with the rise of 87Sr 86Sr observed in the Pizzo Mondello section and interpreted as being related to a phase of increasing (global) weathering in the Late Triassic (Onoue et al., 2018) (Fig. 10). We are not aware of any LIP that transited across the equatorial belt of Pangea in the Carnian–Norian. The Angayucham LIP, with an age of 214±7 Ma (Ernst and Buchan, 2001; Prokoph et al., 2013), is a possible candidate, but if it was part of Wrangellia, then it was located in the Southern Hemisphere in the Late Triassic (Kent and Irving, 2010). An alternative candidate for enhanced weathering is represented by the Cimmerian orogen that developed relatively rapidly in the Late Triassic along the southern margin of Eurasia at mid-northern latitudes (e.g., Muttoni et al., 2009), possibly under a monsoonal-type climate (Onoue et al., 2018). The uplift of the Cimmerian belt could have contributed establishing a monsoonal-type climate in the western Tethys, enhancing seasonal runoff and silicate weathering of mafic rocks (Onoue et al., 2018).
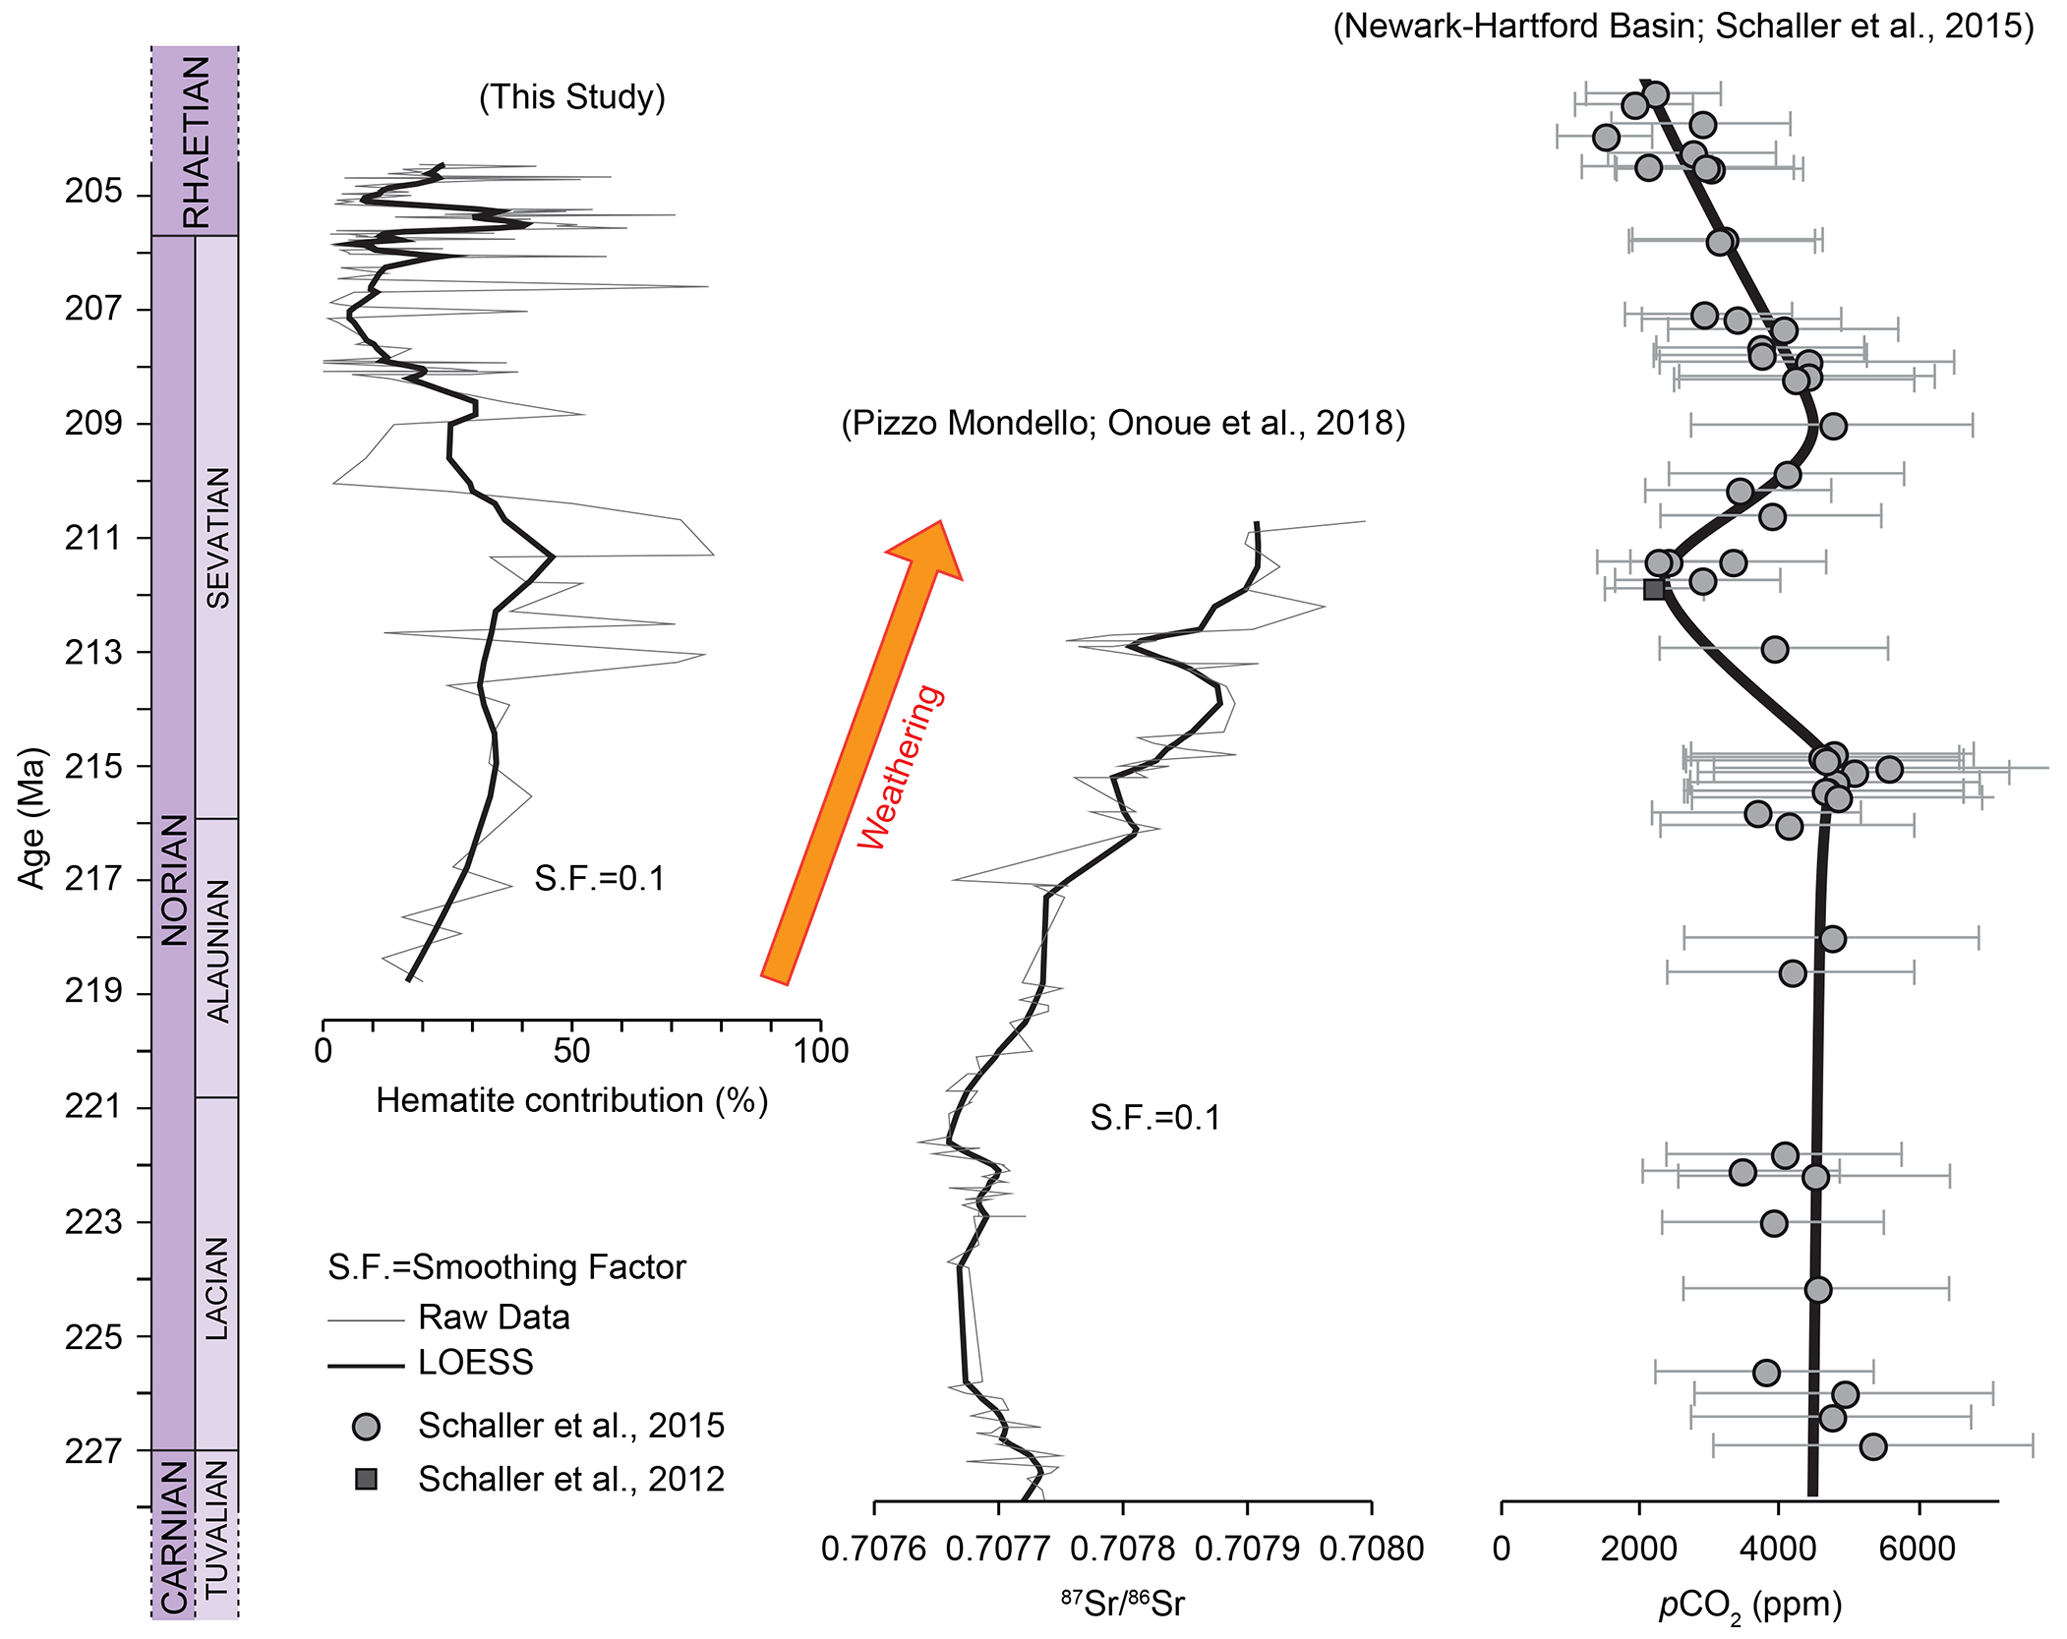
Figure 10Curve of hematite contribution from Pignola–Abriola compared to the 87Sr 86Sr curve from Pizzo Mondello (Onoue et al., 2018) and to the latest Carnian to early Rhaetian portion of the pCO2 curve from the Newark–Hartford Basin (Schaller et al., 2012, 2015). See the text for a discussion.
The Cimmerian is a multi-phase orogenetic event that occurred essentially in the Late Triassic and involved the accretion of different terranes with each other and ultimately with the Asian margin. Several slices of ultramafic rocks mark the complex Cimmerian suture from Pamir in the east to Türkiye in the west. For example, the Bashgumbaz Complex of Pamir, comprised of mafic–ultramafic lithologies, obducted during the collision between the central and southern Pamir terranes, resulting in the Cimmerian orogeny in this part of Asia (Zanchetta et al., 2018). Recent petrographic and detrital zircon U–Pb data indicate a coeval accretion of the central and southern Pamir terranes to northern Pamir (southern margin of Asia) by the end of the Triassic (Villareal et al., 2020). More to the west, geologic data indicate the onset of a collision of the Iran terrane (where mafic lithologies are documented, such as the Permian basalts of the central Alborz; Delavari et al., 2016), with Eurasia in the Middle–Late Triassic followed by a main Cimmerian uplift phase at around the Triassic–Jurassic boundary (Wilmsen et al., 2009). Moreover, the development of an extensional system in central Alborz of Iran during the Late Triassic led to the emplacement of alkaline volcanism with the formation of the Triassic alkaline basaltic rocks (TABRs) of the Kamarbon area, which overlie the Carnian massive dolomites and are beneath the Norian–Rhaetian sandstones of the Shemshak Formation (Doroozi et al., 2018). Further to the west, high-pressure metamorphic rocks in northwestern Türkiye are interpreted as part of a larger Triassic mafic complex (Nilüfer Unit) accreted during the latest Triassic to the active margin of Eurasia, resulting in Cimmerian orogeny in northern Türkiye (Okay et al., 2002). In summary, even though the geologic record is still discontinuous due to the complex geology of the Asian margin, there seems to be plenty of evidence for the accretion/obduction/uplift of crustal elements locally enriched in mafic (highly weatherable) lithologies during multiphase Cimmerian deformation in the Late Triassic that may in part justify the observed Alaunian–Sevatian increased weathering trend.
In Sevatian levels of the Newark–Hartford Basin of North America, Schaller et al. (2015) observed a drop in atmospheric pCO2 starting at ∼ 215 Ma (incidentally at the time of the Manicouagan impact at 215.40±0.16 Ma; Jaret et al., 2018), with a minimum centered at ∼ 212 Ma, followed by a rebound to higher pCO2 values at ∼ 209 Ma, and a second long-term pCO2 decreasing trend up to the Rhaetian (Fig. 10). According to Schaller et al. (2015), the cause of the ∼ 5 Myr Sevatian drop and rebound in pCO2 is unclear, while the general decrease of pCO2 from high Carnian–Norian levels to low Rhaetian levels was interpreted as being due to increased weathering of silicate rocks entering the tropical–equatorial belt during the northward displacement of Pangea in the Late Triassic (Goddéris et al., 2008; Schaller et al., 2015). We speculate that the ∼ 5 Myr Sevatian pCO2 drop and rebound could be related at least in part to the onset and demise of weathering of mafic lithologies exposed (and then buried under regolith?) during one or more of the several phases of obduction/uplift that characterized the multiphase Cimmerian orogeny, although we do not exclude the effects of the northward motion of Pangea sensu Goddéris et al. (2008) and Schaller et al. (2015).
The pCO2 curve of Schaller et al. (2015) shows an ensuing decreasing trend in late Sevatian–Rhaetian levels, although we notice that the record is discontinuous in the 207–205 Ma interval (Fig. 10). The Pignola–Abriola record shows fluctuating values of weathering in the latest Sevatian–earliest Rhaetian (Fig. 10). The origin of these high-frequency fluctuations is at present unclear, but tectonic processes involving plate motion (Cimmeria and Pangea) are ruled out, as they work on longer timescales. Further investigations (geochemical and rock magnetic) are required to expand the record of the weathering in the Rhaetian to unravel the meaning of this short-term increase in hematite.
Both rock magnetic and geochemical data from the Pignola–Abriola section, in particular the hematite contribution from IRM unmixing and S ratio, CIA*, and PC1, reveal trends in weathering rates. In particular:
-
We observed a long-term (∼ 6 Myr long) increase in chemical weathering during the Alaunian–Sevatian (from ∼ 217 to ∼ 211 Ma) broadly coeval with the Sr trend from Pizzo Mondello. This trend is followed by a long-term (∼ 5 Myr long) decrease in chemical weathering up to the latest Sevatian (∼ 207–206 Ma). These trends are broadly paralleled by a decrease and increase in pCO2 (Schaller et al., 2015). These conjointly observed trends were possibly controlled by the weathering of the Cimmerian orogeny at mid-latitudes, possibly under a monsoonal-type climate (Onoue et al., 2018), and/or by the northward drift of Pangea across the equatorial belt (Goddéris et al., 2008; Schaller et al., 2015).
-
We observed fluctuating but generally high values of weathering across the NRB (∼ 205.7 Ma), starting in the latest Sevatian (∼ 206.5 Ma) and ending in the earliest Rhaetian (∼ 205 Ma). The origin of these high-frequency oscillations still has to be determined.
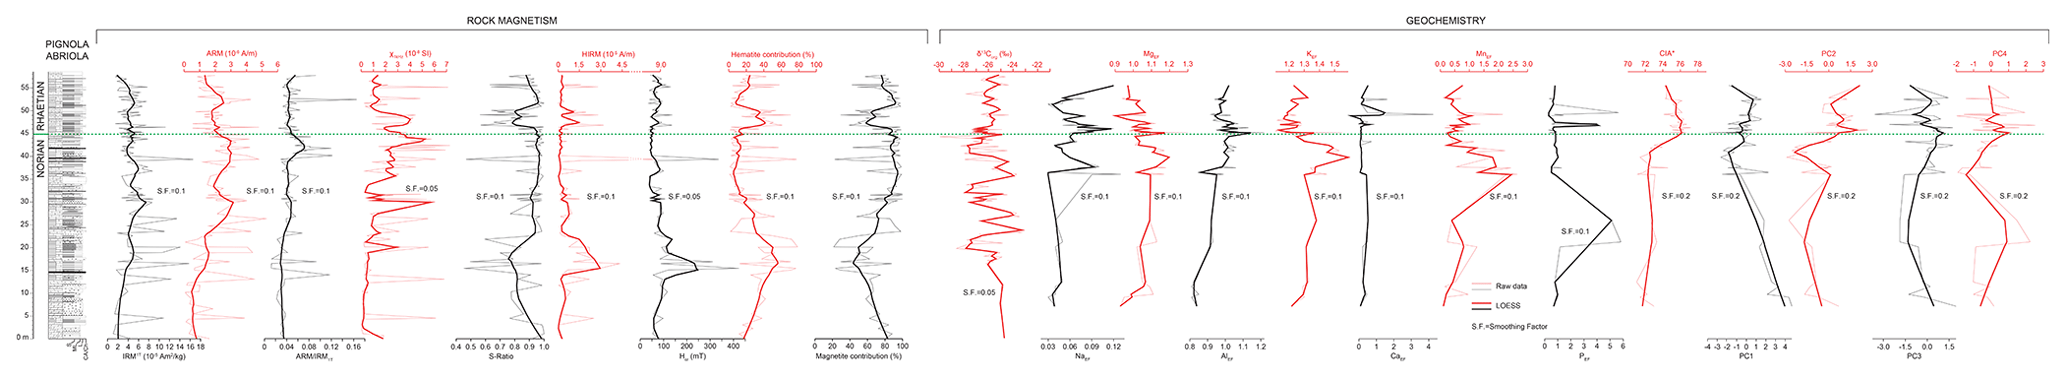
Figure A1Curves of all the rock magnetic and geochemical parameters used in this paper. A local regression smoothing curve (LOESS; thick black/red line) has been calculated for each parameter using PAST software (Hammer et al., 2001).
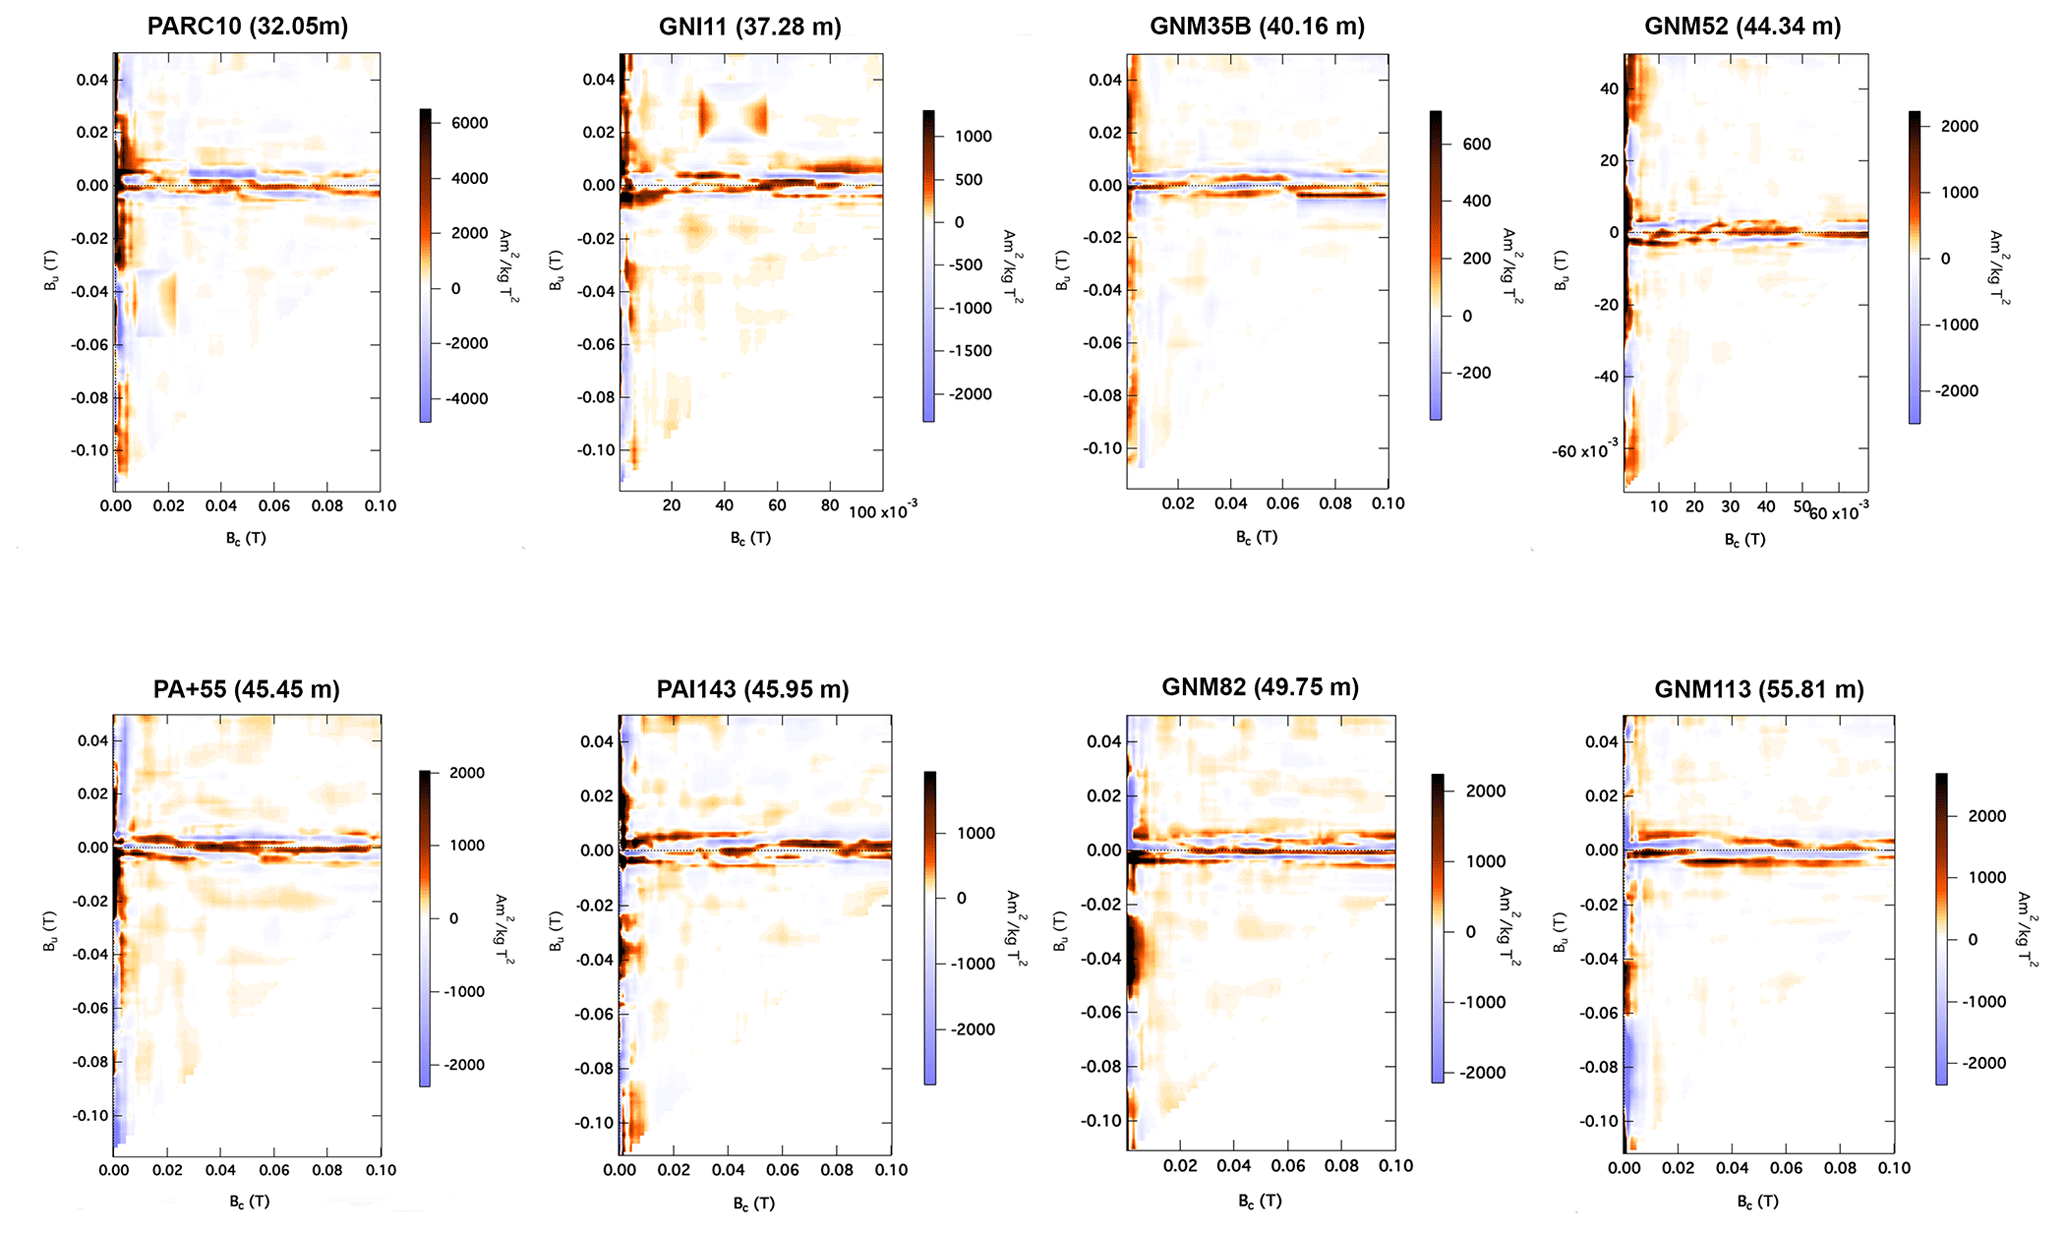
Figure A2First-order reversal curve (FORC) diagrams of eight selected samples of the Pignola–Abriola section. All the samples show a noisy signal, but a central ridge is visible nonetheless, suggesting the presence of magnetite of biogenic origin. The FORCs have been processed using FORCinel software (Harrison and Feinberg, 2008) using the VARIFORC (Egli, 2013) smoothing factor: Sc0 = 4, Sb0 = 3, Sc1 = 7, and Sb1 = 7.
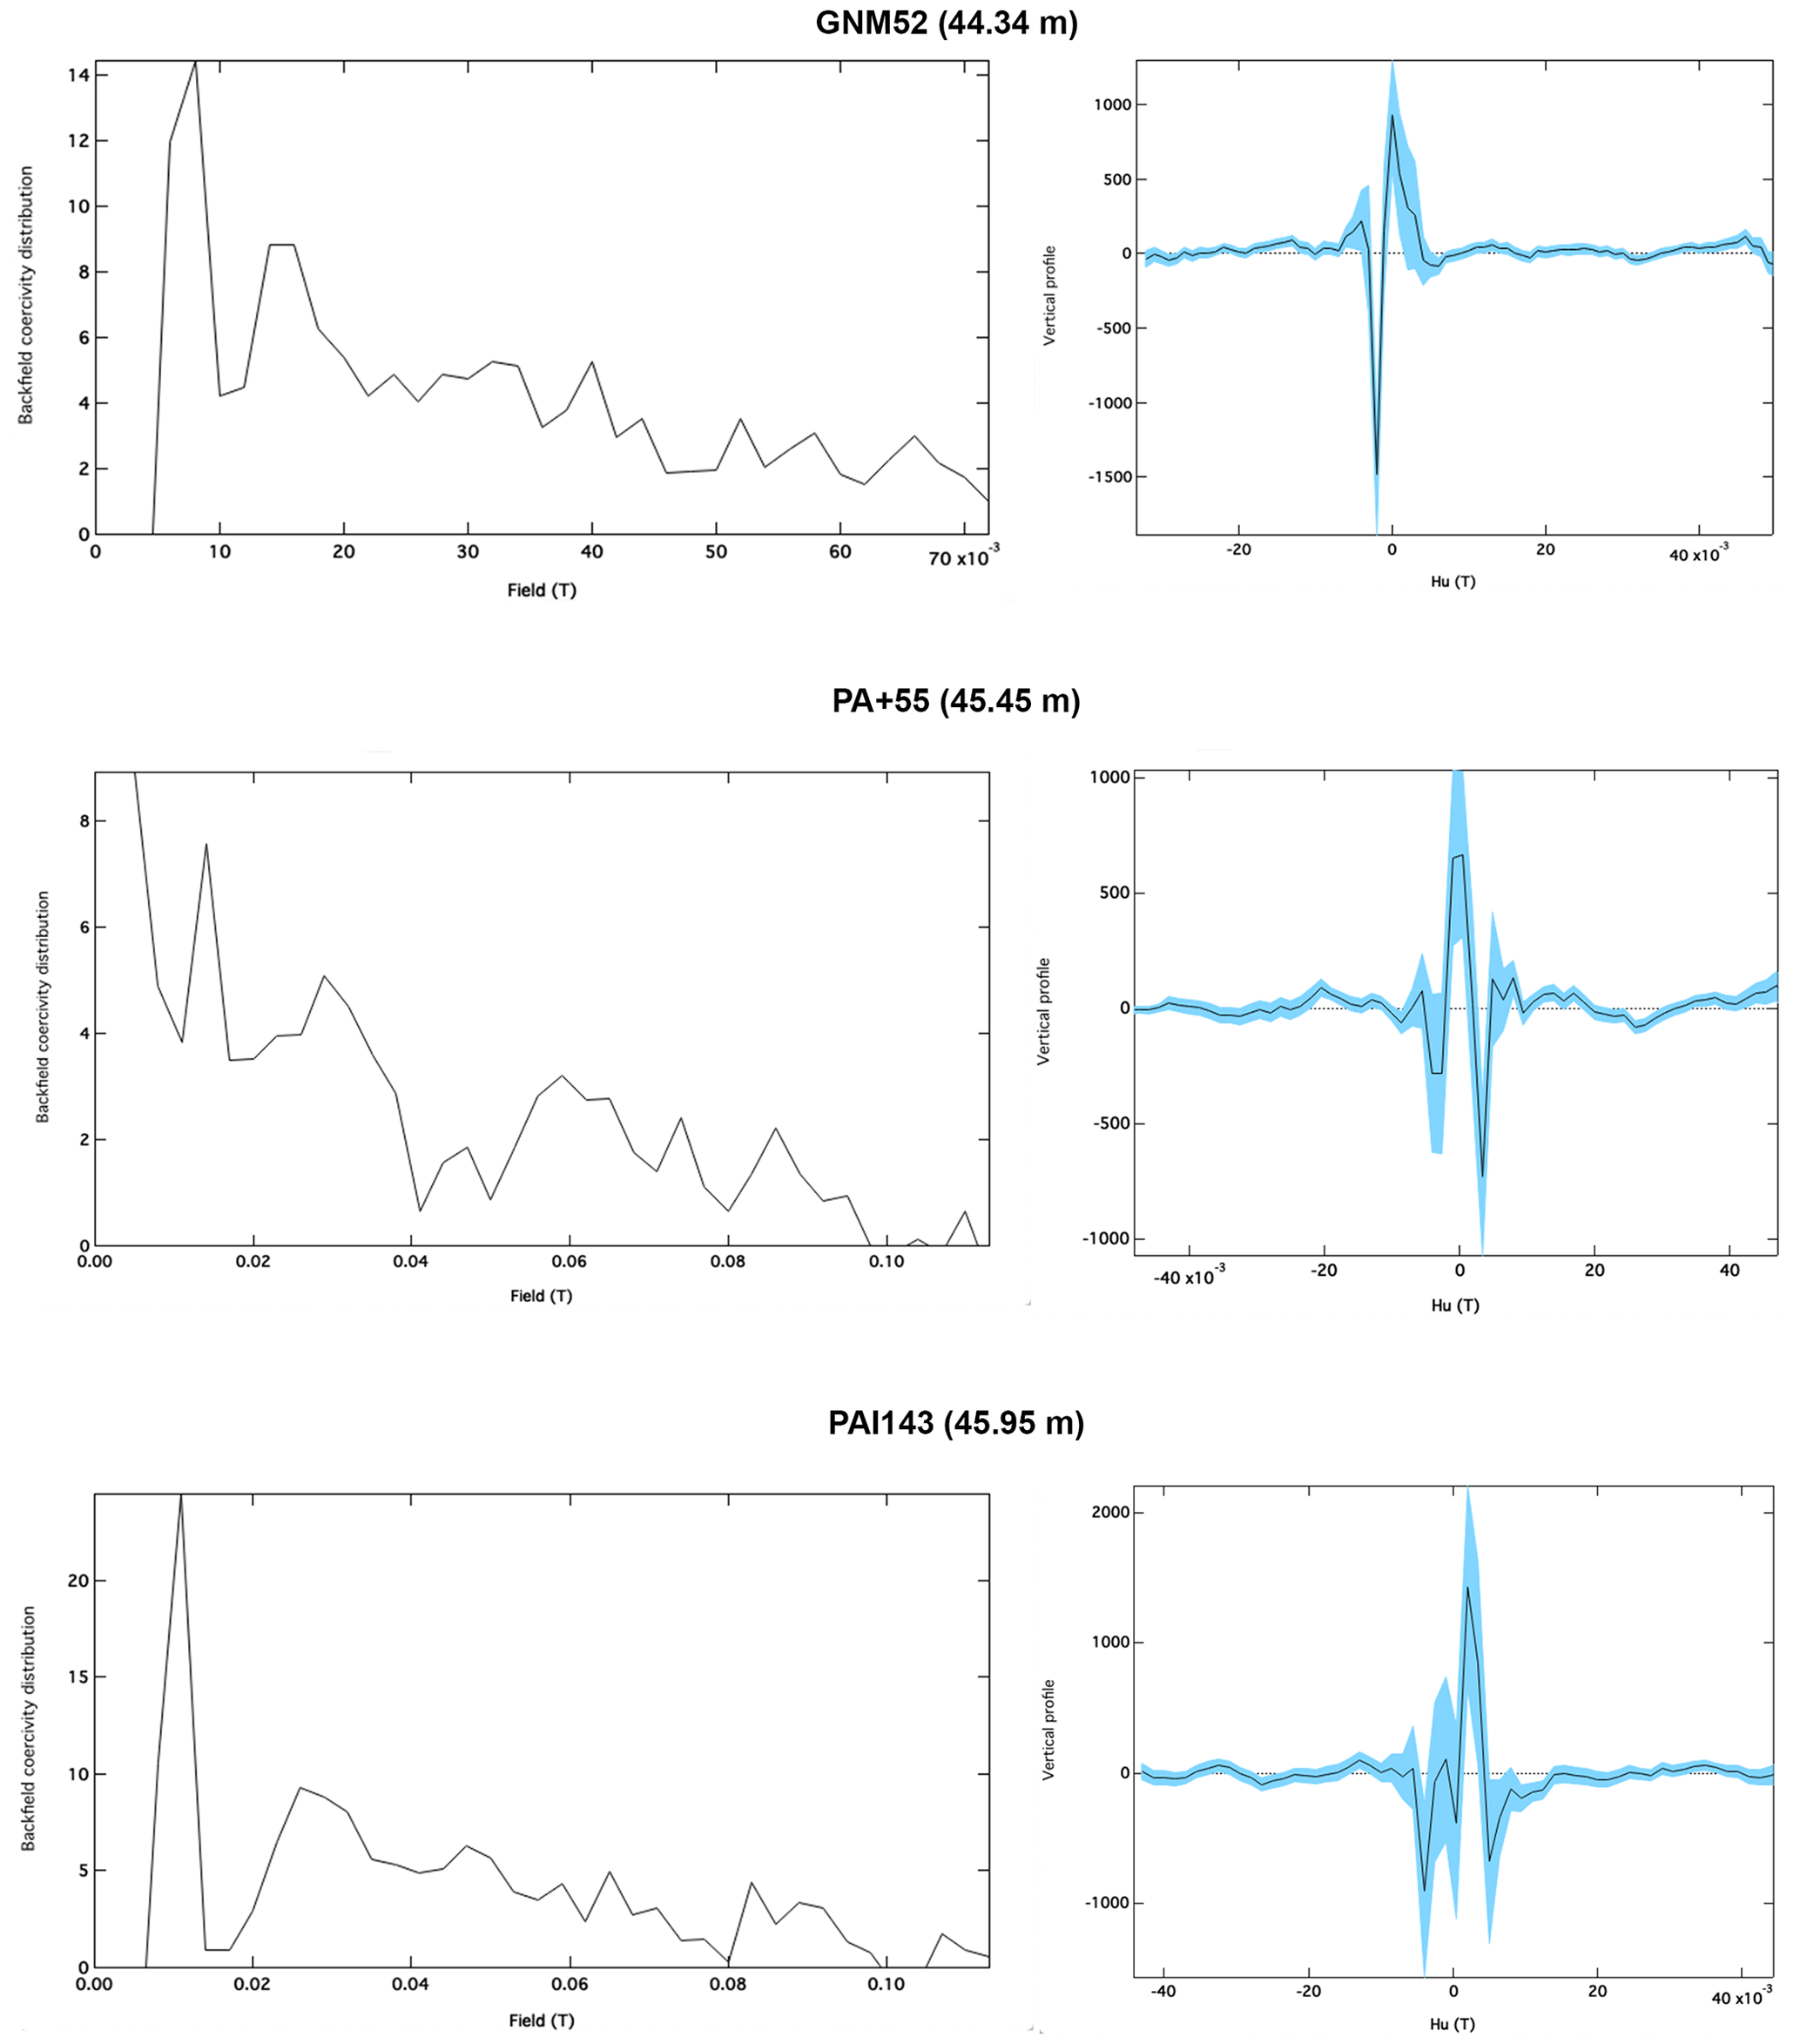
Figure A3Coercivity and vertical profiles derived from three FORC diagrams around the Norian–Rhaetian boundary.
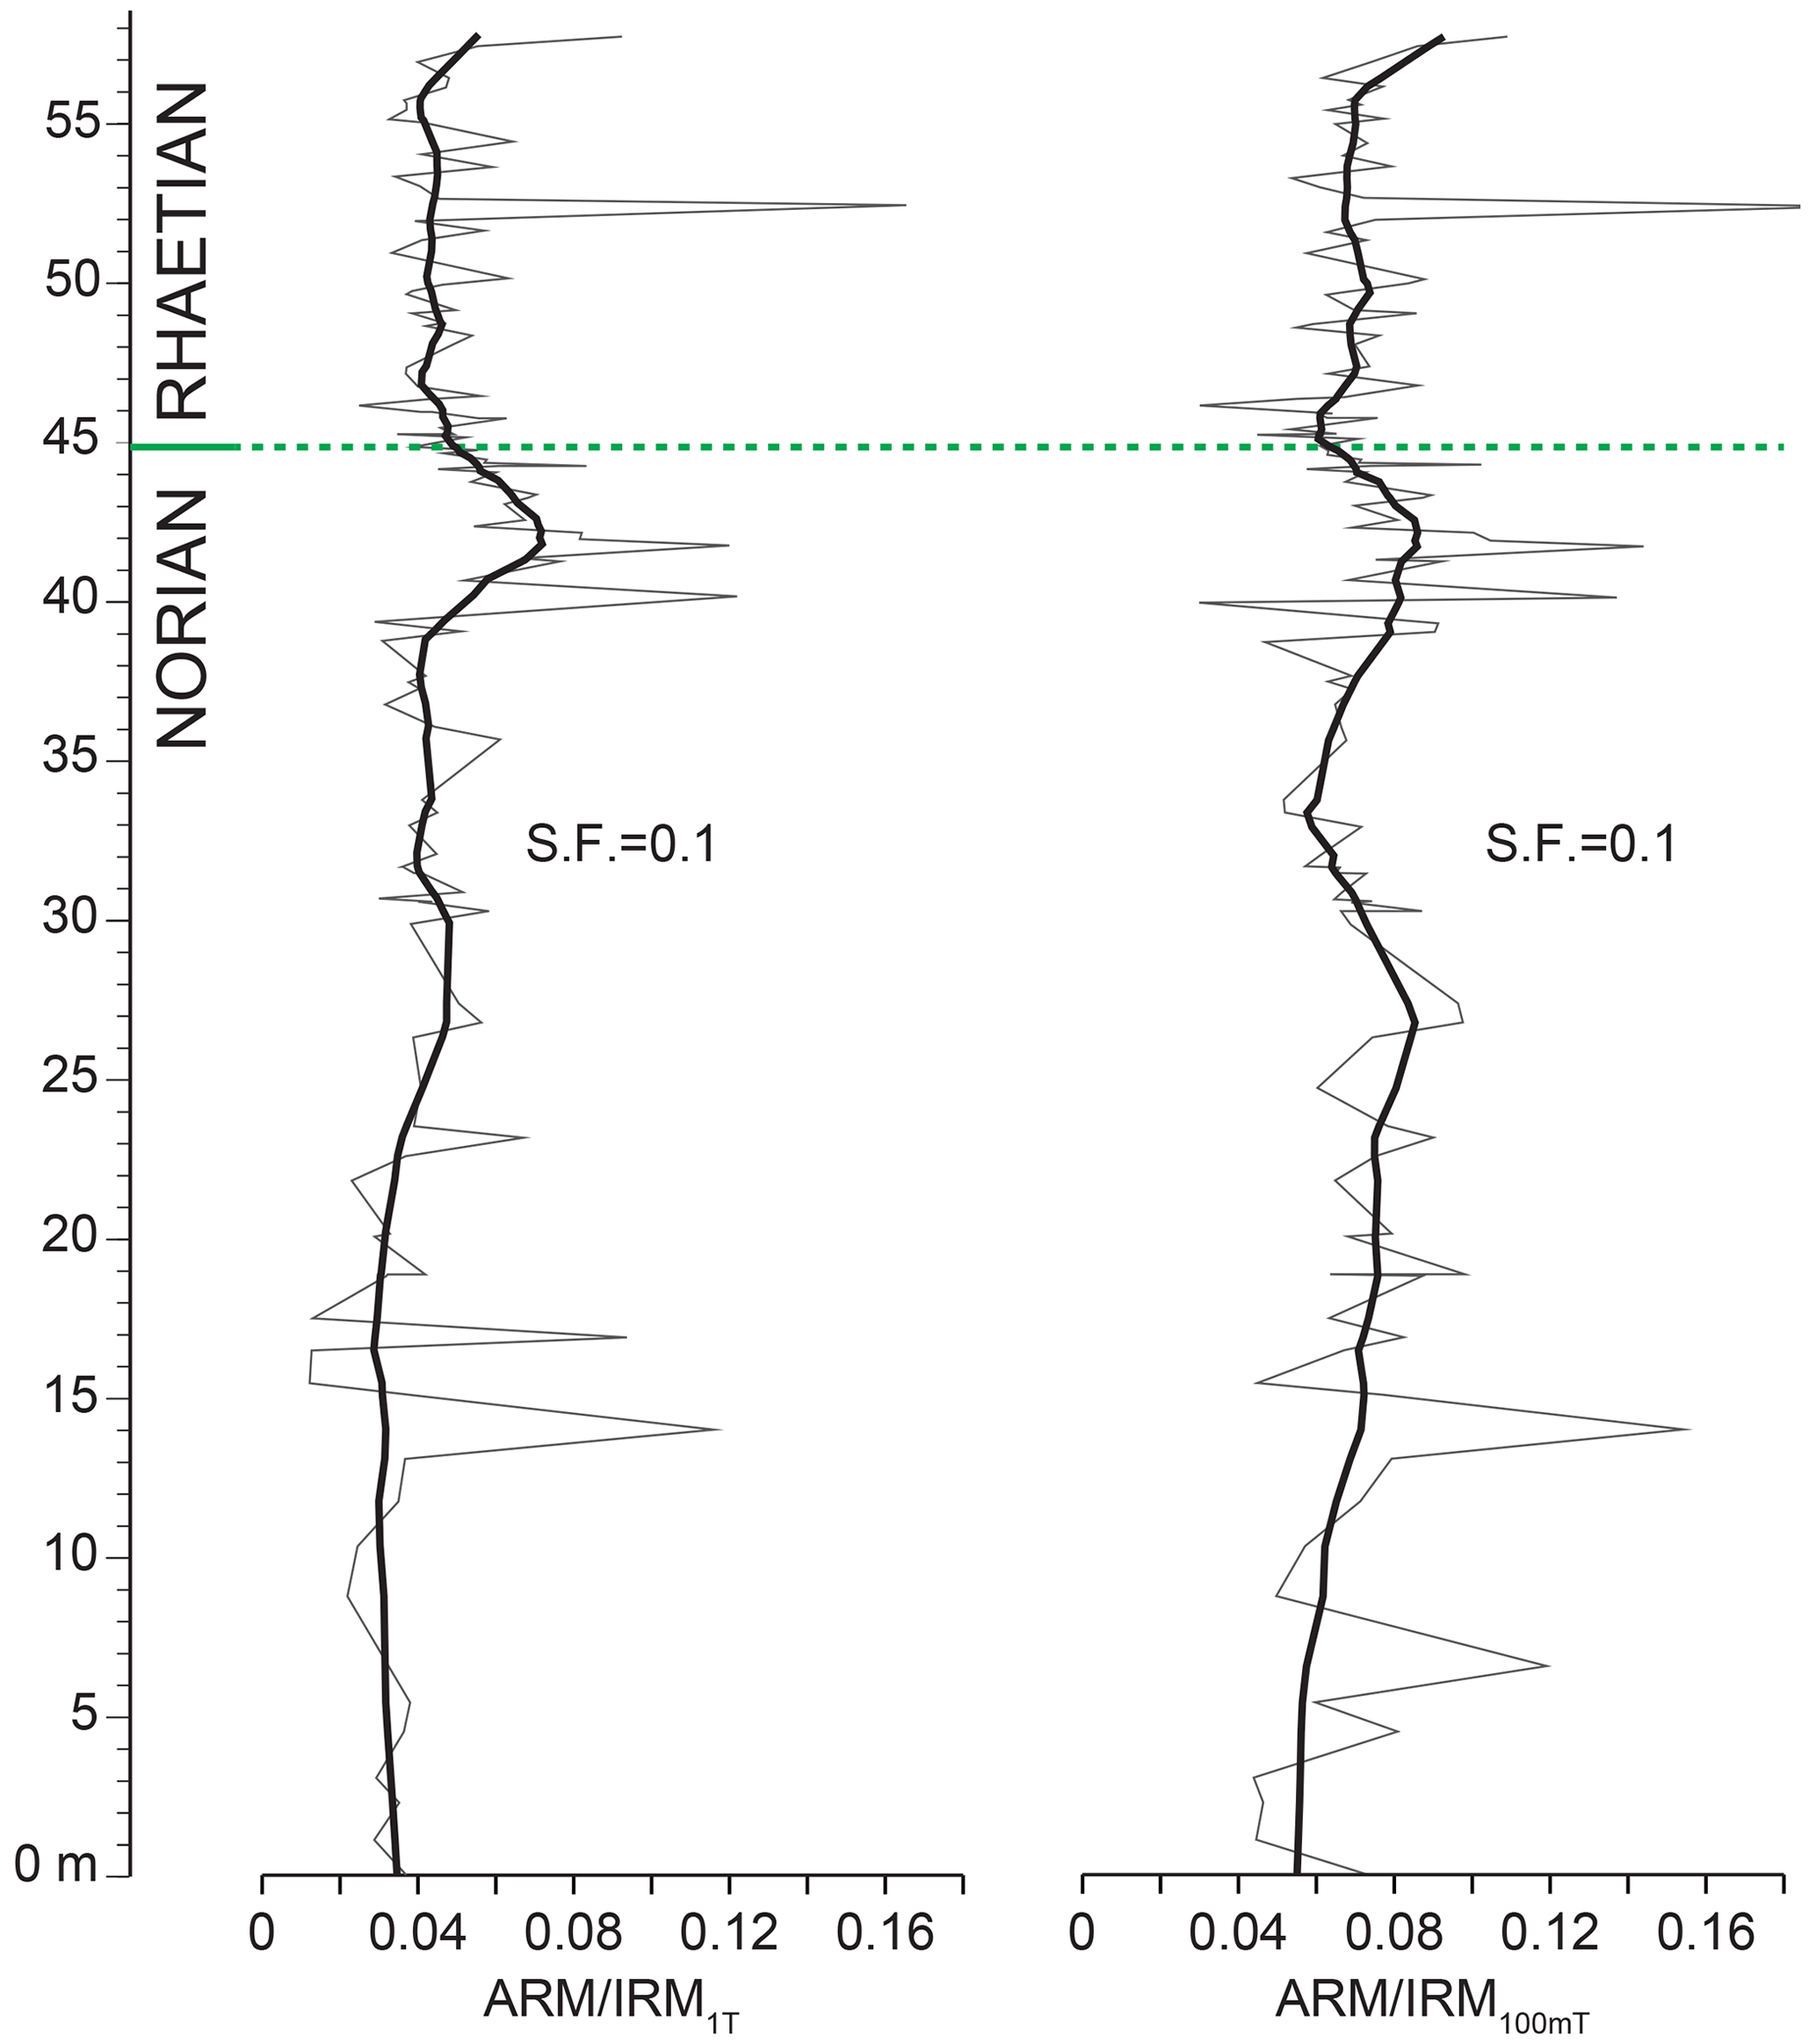
Figure A4Comparison of ARM IRM1T and ARM IRM100 mT curves as a test for the contribution of high coercivity phases and grain size on the ARM over IRM ratio. A local regression smoothing curve (LOESS; thick black line) has been calculated for both curves using PAST software (Hammer et al., 2001).
Rock magnetic and geochemical data are hosted on the Mendeley Data repository: https://doi.org/10.17632/bmbt8t2ywj.1 (Maron et al., 2023).
The authors declare that they contributed to the paper as follows: conceptualization by MM, SS, and MR; writing the original draft by MM; investigation by MM, TO, HS, GM, and MR; formal analysis by MM, TO, KS, HS, and MR; visualization by MM; resources by MM, TO, SS, GM, and MR; data curation by MM, TO, KS, HS, and MR; review and editing by TO, SS, KS, HS, GM, and MR; methodology by MM, TO, and KS; funding acquisition by TO, SS, and MR; supervision by SS; and project administration by SS and MR.
The contact author has declared that none of the authors has any competing interests.
Publisher’s note: Copernicus Publications remains neutral with regard to jurisdictional claims made in the text, published maps, institutional affiliations, or any other geographical representation in this paper. While Copernicus Publications makes every effort to include appropriate place names, the final responsibility lies with the authors.
We wish to thank the anonymous reviewer and Yves Godderis for their valuable comments and suggestions that improved this paper. We extend our special thanks to Richard J. Harrison for his suggestions to improve the FORC processing.
This study has benefited from financial support of Ministero dell'Università e della Ricerca (grant no. PRIN 2017W2MARE) to Manuel Rigo and Sara Satolli and of the Japan Society for the Promotion of Science (grants nos. JP19H00711 and JP20H00203) to Tetsuji Onoue.
This paper was edited by Yves Godderis and reviewed by one anonymous referee.
Abrajevitch, A., Hori, R. S., and Kodama, K.: Rock magnetic record of the Triassic-Jurassic transition in pelagic bedded chert of the Inuyama section, Japan, Geology, 41, 803–806, https://doi.org/10.1130/G34343.1, 2013.
Aitchison, J.: The statistical analysis of compositional data, J. Roy. Stat. Soc. B Met., 44, 139–160, https://doi.org/10.1111/j.2517-6161.1982.tb01195.x, 1982.
Aitchison, J. and Shen, S. M.: Logistic-normal distributions – Some properties and uses, Biometrika, 67, 261–272, https://doi.org/10.2307/2335470, 1980.
Albarède, F.: Introduction to geochemical modeling, Cambridge University Press, Cambridge, UK, 543 pp., ISBN 0521578043, 1995.
Algeo, T. J. and Ingall, E.: Sedimentary Corg: P ratios, paleocean ventilation, and Phanerozoic atmospheric pO2, Palaeogeogr. Palaeocl., 256, 130–155, https://doi.org/10.1016/j.palaeo.2007.02.029, 2007.
Algeo, T. J. and Li, C.: Redox classification and calibration of redox thresholds in sedimentary systems, Geochim. Cosmochim. Ac., 287, 8–26, https://doi.org/10.1016/j.gca.2020.01.055, 2020.
Ambrosi, J. P., Nahon, D., and Herbillon, A. J.: The epigenetic replacement of kaolinite by hematite in laterite – petrographic evidence and the mechanism involved, Geoderma, 37, 283–294, https://doi.org/10.1016/0016-7061(86)90030-3, 1986.
Amodeo, F.: Il Triassico terminale-Giurassico del Bacino Lagonegrese. Studi stratigrafici sugli Scisti Silicei della Basilicata (Italia meridionale), Mémoires de Géologie, Lausanne, Switzerland, 33, 1–123, 1999.
Amodeo, F., Molisso, F., Kozur, H., Marsella, E., and D'Argenio, B.: Age of transitional beds between Cherty Limestone (Calcari con Selce) and Radiolarites (Scisti Silicei) in the Lagonegro domain (Southern Italy). First evidence of Rhaetian Conodonts in Peninsular Italy, Boll. Serv. Geol. Ital., 110, 3–22, 1993.
Argnani, A.: Possible record of a Triassic ocean in the Southern Apennines, Boll. Soc. Geol. Ital., 124, 109–121, 2005.
Atkinson, A. C., Riani, M., and Cerioli, A.: Exploring Multivariate Data with the Forward Search, Springer–Verlag, New York, USA, 623 pp., https://doi.org/10.1007/978-0-387-21840-3, 2004.
Bazzucchi, P., Bertinelli, A., Ciarapica, G., Marcucci, M., Passeri, L., Rigo, M., and Roghi G.: The Late Triassic-Jurassic stratigraphic succession of Pignola (Lagonegro-Molise Basin, Southern Apennines, Italy), Boll. Soc. Geol. Ital., 124, 143–153, 2005.
Bertinelli, A., Casacci, M., Concheri, G., Gattolin, G., Godfrey, L., Katz, M. E., Maron, M., Mazza, M., Mietto, P., Muttoni, G., Rigo, M., Sprovieri, M., Stellin, F., and Zaffani, M.: The Norian/Rhaetian boundary interval at Pignola-Abriola section (Southern Apennines, Italy) as a GSSP candidate for the Rhaetian Stage: an update, Albertiana, 43, 5–18, 2016.
Best, M. E.: 11.15 Mineral Resources, in: Treatise on Geophysics, edited by: Schubert, G., Elsevier, Amsterdam, 525–556, https://doi.org/10.1016/B978-0-444-53802-4.00200-1, 2015.
Bloemendal, J. and DeMenocal, P.: Evidence for a change in the periodicity of tropical climate cycles at 2.4 Myr from whole-core magnetic susceptibility measurements, Nature, 342, 897–900, https://doi.org/10.1038/342897a0, 1989.
Bloemendal, J., King, J. W., Hall, F. R., and Doh, S.-J.: Rock magnetism of Late Neogene and Pleistocene deep-sea sediments: Relationship to sediment source, diagenetic processes, and sediment lithology, J. Geophys. Res.-Sol. Ea., 97, 4361–4375, https://doi.org/10.1029/91JB03068, 1992.
Brigatti, M. F., Galan, E., and Theng, B. K. G.: Structures and mineralogy of clay minerals, in: Handbook of clay science, edited by: Bergaya, F., Theng, B. K. G., and Lagaly, G., Elsevier, Amsterdam, 19–86, https://doi.org/10.1016/S1572-4352(05)01002-0, 2006.
Casacci, M., Bertinelli, A., Algeo, T. J., and Rigo, M.: Carbonate to biosilica transition at the Norian-Rhaetian boundary controlled by rift-related subsidence in the western Tethyan Lagonegro Basin (southern Italy), Palaeogeogr. Palaeocl., 456, 21–36, https://doi.org/10.1016/j.palaeo.2016.05.007, 2016.
Ciarapica, G. and Passeri, L.: The palaeogeographic duplicity of the Apennines, Boll. Soc. Geol. Ital., Vol. Spec., 1, 67–75, 2002.
Ciarapica, G. and Passeri, L.: Ionian Tethydes in the Southern Apennines, in: CROP Project, Deep Seismic Exploration of the Central Mediterranean and Italy, edited by: Finetti, I. R., Elsevier, Amsterdam, 209–224, ISBN 0-444-50693-4, 2005.
Chang, L., Harrison, R. J., Zeng, F., Berndt, T. A., Robert, A. P., Heslop, D., and Zhao, X.: Coupled microbial bloom and oxygenation decline recorded by magnetofossils during the Palaeocene-Eocene Thermal Maximum, Nat. Comm., 9, 4007, https://doi.org/10.1038/s41467-018-06472-y, 2018.
Clapham, M. E. and Renne, P. R.: Flood basalts and mass extinctions, Annu. Rev. Earth Pl. Sc., 47, 275–303, https://doi.org/10.1146/annurev-earth-053018-060136, 2018.
Day, R., Fuller, M., and Schmidt, V. A.: Hysteresis properties of titanomagnetites: grain-size and compositional dependence, Phys. Earth Planet. In., 13, 260–267, https://doi.org/10.1016/0031-9201(77)90108-X, 1977.
Delavari, M., Dolati, A., Mohammadi, A., and Rostami, F.: The Permian volcanics of Central Alborz: Implications for passive continental margin along the southern border of Paleotethys, Ofioliti, 41, 59–74, https://doi.org/10.4454/ofioliti.v41i2.442, 2016.
Doroozi, R., Vaccaro, C., Masoudi, F., and Petrini, R.: Petrogenesis and mantle source characteristics of Triassic alkaline basaltic rocks of North Kamarbon, Northern Central Alborz, Iran, Solid Earth Sciences, 3, 115–129, https://doi.org/10.1016/j.sesci.2018.06.001, 2018.
Dunlop, D. J.: Thermal enhancement of magnetic susceptibility, J. Geophys., 40, 439–451, 1974.
Dunlop, D. J.: Theory and application of the Day plot ( versus ) 1. Theoretical curves and tests using titanomagnetite data, J. Geophys. Res.-Sol. Ea., 107, 2056, https://doi.org/10.1029/2001JB000486, 2002a.
Dunlop, D. J.: Theory and application of the Day plot ( versus ) 2. Application to data for rocks, sediments, and soils, J. Geophys. Res.-Sol. Ea., 107, 2057, https://doi.org/10.1029/2001JB000487, 2002b.
Dunlop, D. J.: High-temperature susceptibility of magnetite: a new pseudo-single-domain effect, Geophys. J. Int., 199, 707–716, https://doi.org/10.1093/gji/ggu247, 2014.
Dunlop, D. J. and Özdemir, Ö.: Magnetization in Rocks and Minerals, in: Treatise on Geophysics, vol. 5 Geomagnetism, edited by: Schubert, G., Elsevier, Amsterdam, 277–336, https://doi.org/10.1016/B978-044452748-6.00093-6, 2007.
Egli, R.: Characterization of individual rock magnetic components by analysis of remanence curves, 1. Unmixing natural sediments, Stud. Geophys. Geod., 48, 391–446, https://doi.org/10.1023/B:SGEG.0000020839.45304.6d, 2004.
Egli, R.: VARIFORC: An optimized protocol for calculating non-regular first-order reversal curves (FORC) diagrams, Global Planet. Change, 110, 302–320, https://doi.org/10.1016/j.gloplacha.2013.08.003, 2013.
Egli, R. and Lowrie, W.: Anhysteretic remanent magnetization of fine magnetic particles, J. Geophys. Res.-Sol. Ea., 107, 2209, https://doi.org/10.1029/2001JB000671, 2002.
Ernst, R. E. and Buchan, K. L.: Large mafic magmatic events through time and links to mantle-plume heads, in: Mantle Plumes: Their Identification Through Time, edited by: Ernst, R. E. and Buchan, K. L., Geol. Soc. Am. Special Paper, 352, 483–575, https://doi.org/10.1130/0-8137-2352-3.483, 2001.
Finetti, I. R.: Structure and evolution of the Central Mediterranean (Pelagian and Ionian Sea), in: Geological evolution of the Mediterranean Basin, edited by: Stanley, D. J. and Wezel, F. C., Springer-Verlag, New York, 215–230, https://doi.org/10.1007/978-1-4613-8572-1_10, 1985.
Fürsich, F. T., Singh, I. B., Joachimski, M., Krumm, S., Schlirf, M., and Schlirf, S.: Palaeoclimate reconstructions of the Middle Jurassic of Kachchh (western India): an integrated approach based on palaeoecological, oxygen isotopic, and clay mineralogical data, Palaeogeogr. Palaeocl., 217, 289–309, https://doi.org/10.1016/j.palaeo.2004.11.026, 2005.
Giordano, N., Rigo, M., Ciarapica, G., and Bertinelli, A.: New biostratigraphical constraints for the Norian/Rhaetian boundary: Data from Lagonegro Basin, southern Apennines, Italy, Lethaia, 43, 573–586, https://doi.org/10.1111/j.1502-3931.2010.00219.x, 2010.
Goddéris, Y., Donnadieu, Y., de Vargas, C., Pierrehumbert, R. T., Dromart, G., and van de Schootbrugge, B.: Causal or causal link between the rise of nannoplankton calcification and a tectonically-driven massive decrease in Late Triassic atmospheric CO2?, Earth Planet. Sc. Lett., 267, 247–255, https://doi.org/10.1016/j.epsl.2007.11.051, 2008.
Goldich, S. S.: A study in rock-weathering, J. Geol., 46, 17–58, https://doi.org/10.1086/624619, 1938.
Golub, G. H. and Van Loan, C. F.: Matrix Computations, 2nd ed., Johns Hopkins University Press, Baltimore, USA, 756 pp., ISBN 978-1-4214-0794-4, 1989.
Govindaraju, K.: 1994 compilation of working values and sample description for 383 geostandards, Geostandard. Newslett., 18, 1–158, https://doi.org/10.1046/j.1365-2494.1998.53202081.x-i1, 1994.
Haldar, S. K.: Chapter 4 – Exploration Geochemistry, in: Mineral Exploration, edited by: Haldar, S. K., Elsevier, Amsterdam, 55–71, https://doi.org/10.1016/B978-0-12-416005-7.00004-0, 2013.
Hammer, Ø., Harper, D. A. T., and Ryan, P. D.: PAST: palaeontological statistics software package for education and data analysis, Palaeontol. Electron., 4, https://palaeo-electronica.org/2001_1/past/issue1_01.htm (last access: 14 March 2024), 2001.
Harrison, R. J., and Feinberg, J. M.: FORCinel: An improved algorithm for calculating first-order reversal curve distributions using locally weighted regression smoothing, Geochem. Geophy. Geosy., 9, Q05016, https://doi.org/10.1029/2008GC001987, 2008.
Hernández-Quiroz, M., Herre, A., Cram, S., Ponce de León, C., and Siebe, C.: Pedogenic, lithogenic – or anthropogenic origin of Cr, Ni and V in soils near a petrochemical facility in Southeast Mexico, Catena, 93, 49–57, https://doi.org/10.1016/j.catena.2012.01.005, 2012.
Hopkinson, J.: XIV. Magnetic and other physical properties of iron at a high temperature, Philos. T. R. Soc. A, 180, 443–465, https://doi.org/10.1098/rsta.1889.0014, 1889.
Kent, D. V. and Irving, E.: Influence of inclination error in sedimentary rocks on the Triassic and Jurassic apparent pole wander path for North America and implications for Cordilleran tectonics, J. Geophys. Res.-Sol. Ea., 115, B10103, https://doi.org/10.1029/2009JB007205, 2010.
Kent, D. V. and Muttoni, G.: Equatorial convergence of India and early Cenozoic climate trends, P. Natl. Acad. Sci. USA, 105, 16065–16070, https://doi.org/10.1073/pnas.0805382105, 2008.
Kent, D. V. and Muttoni, G.: Modulation of Late Cretaceous and Cenozoic climate by variable drawdown of atmospheric pCO2 from weathering of basaltic provinces on continents drifting through the equatorial humid belt, Clim. Past, 9, 525–546, https://doi.org/10.5194/cp-9-525-2013, 2013.
King, J. G. and Ranganai, R. T.: Determination of magnetite grain-size using the Hopkinson effect – examples from Botswana rocks, Botswana Journal of Earth Sciences, 5, 35–38, 2001.
Jaret, S. J., Hemming, S. R., Rasbury, E. T., Thompson, L. M., Glotch, T. D., Ramezani, J., and Spray, J. G.: Context matters – Ar–Ar results from in and around the Manicouagan Impact Structure, Canada: Implications for martian meteorite chronology, Earth Planet. Sc. Lett., 501, 78–89, https://doi.org/10.1016/j.epsl.2018.08.016, 2018.
Jenkyns, H. C.: Geochemistry of oceanic anoxic events, Geochem. Geophy. Geosy., 11, Q03004, https://doi.org/10.1029/2009GC002788, 2010.
Jin, X., Ogg, J. G., Lu, S., Shi, Z., Kemp, D. B., Hua, X., Onoue, T., and Rigo, M.: Terrestrial record of carbon-isotope shifts at the Norian/Rhaetian boundary: A high-resolution study from northwestern Sichuan Basin, South China, Global Planet. Change, 210, 103754, https://doi.org/10.1016/j.gloplacha.2022.103754, 2022.
Jones, C. E. and Jenkyns, H. C.: Seawater strontium isotopes, oceanic anoxic events, and seafloor hydrothermal activity in the Jurassic and Cretaceous, Am. J. Sci., 301, 112–149, https://doi.org/10.2475/ajs.301.2.112, 2001.
Just, J., Nowaczyk, N. R., Sagnotti, L., Francke, A., Vogel, H., Lacey, J. H., and Wagner, B.: Environmental control on the occurrence of high-coercivity magnetic minerals and formation of iron sulfides in a 640 ka sediment sequence from Lake Ohrid (Balkans), Biogeosciences, 13, 2093–2109, https://doi.org/10.5194/bg-13-2093-2016, 2016.
Larrasoaña, J. C., Roberts, A. P., Musgrave, R. J., Gràcia, E., Piñero, E., Vega, M., and Martínez-Ruiz, F.: Diagenetic formation of greigite and pyrrhotite in gas hydrate marine sedimentary systems, Earth Planet. Sc. Lett., 261, 350–366, https://doi.org/10.1016/j.epsl.2007.06.032, 2007.
Lascu, I., McLauchlan, K. K., Myrbo, A., Leavitt, P. R., and Banerjee, S. K.: Sediment-magnetic evidence for last millennium drought conditions at the prairie-forest ecotone of the northern United States, Palaeogeogr. Palaeocl., 337–338, 99–107, https://doi.org/10.1016/j.palaeo.2012.04.001, 2012.
Li, H.-Y. and Zhang, S.-H.: Detection of mineralogical changes in pyrite using measurements of temperature-dependence susceptibilities, Chinese J. Geophys., 48, 1454–1461, https://doi.org/10.1002/cjg2.794, 2005.
Liu, P., Hirt, A. M., Schüler, D., Uebe, R., Zhu, P., Liu, T., and Zhang, H.: Numerical unmixing of weakly and strongly magnetic minerals: examples with synthetic mixtures of magnetite and hematite, Geophys. J. Int., 217, 280–287, https://doi.org/10.1093/gji/ggz022, 2019.
Lucas, S. G.: The Triassic timescale based on nonmarine tetrapod biostratigraphy and biochronology, in: The Triassic timescale, edited by: Lucas, S. G., Geol. Soc. Spec. Publ., 334, 447–500, https://doi.org/10.1144/SP334.15, 2010.
Maron, M., Rigo, M., Bertinelli, A., Katz, M. E., Godfrey, L., Zaffani, M., and Muttoni, G.: Magnetostratigraphy, biostratigraphy and chemostratigraphy of the Pignola-Abriola section: new constraints for the Norian-Rhaetian boundary, Geol. Soc. Am. Bull., 127, 962–974, https://doi.org/10.1130/B31106.1, 2015.
Maron, M., Muttoni, G., Dekkers, M. J., Mazza, M., Roghi, G., Breda, A., Krijgsman, W., and Rigo, M.: Contribution to the magnetostratigraphy of the Carnian: new magneto-biostratigraphic constraints from Pignola-2 and Dibona marine sections, Italy, Newsl. Stratigr., 50, 187–203, https://doi.org/10.1127/nos/2017/0291, 2017.
Maron, M., Muttoni, G., Rigo, M., Gianolla, P., and Kent, D. V.: New magnetobiostratigraphic results from the Ladinian of the Dolomites and implications for the Triassic geomagnetic polarity timescale, Palaeogeogr. Palaeocl., 517, 52–73, https://doi.org/10.1016/j.palaeo.2018.11.024, 2019.
Maron, M., Onoue, T., Satolli, S., Soda, K., Sato, H., Muttoni, G., and Rigo, M.: Weathering trends in the Norian: geochemical and rock magnetic dataset from the Pignola-Abriola Section (Lagonegro Basin, Italy), V1, Mendeley Data [data set], https://doi.org/10.17632/bmbt8t2ywj.1, 2023.
Maxbauer, D. P., Feinberg, J. M., and Fox, D. L.: MAX UnMix: A web application for unmixing magnetic coercivity distribution, Comput. Geosci., 95, 140–145, https://doi.org/10.1016/j.cageo.2016.07.009, 2016a.
Maxbauer, D. P., Feinberg, J. M., and Fox, D. L.: Magnetic mineral assemblages in soils and paleosols as the basis for paleoprecipitation proxies: A review of magnetic methods and challenges, Earth Sci. Rev., 155, 28–48, https://doi.org/10.1016/j.earscirev.2016.01.014, 2016b.
McLennan, S. M.: Relationships between the trace element composition of sedimentary rocks and upper continental crust, Geochem. Geophy. Geosy., 2, 2000GC000109, https://doi.org/10.1029/2000gc000109, 2001.
Middelburg, J. J., van der Weijden, C. H., and Woittiez, J. R. W.: Chemical processes affecting the mobility of major, minor and trace elements during weathering of granitic rocks, Chem. Geol., 68, 253–273, https://doi.org/10.1016/0009-2541(88)90025-3, 1988.
Muttoni, G., Mattei, M., Balini, M., Zanchi, A., Gaetani, M., and Berra, F.: The drift history of Iran from the Ordovician to the Triassic, Geol. Soc. Spec. Publ., 312, 7–29, https://doi.org/10.1144/SP312.2, 2009.
Nakada, R., Ogawa, K., Suzuki, N., Takahashi, S., and Takahashi, Y.: Late Triassic compositional changes of aeolian dusts in the pelagic Panthalassa: Response to the continental climatic change, Palaeogeogr. Palaeocl., 393, 61–75, https://doi.org/10.1016/j.palaeo.2013.10.014, 2014.
Nesbitt, H. W. and Young, G. M.: Early Proterozoic climates and plate motions inferred from major element chemistry of lutites, Nature, 299, 715–717, https://doi.org/10.1038/299715a0, 1982.
Okay, A. I., Monod, O., and Monié, P.: Triassic blueschists and eclogites from northwest Turkey: vestiges of the Paleo-Tethyan subduction, Lithos, 64, 155–178, https://doi.org/10.1016/S0024-4937(02)00200-1, 2002.
Onoue, T., Yamashita, K., Fukuda, C., Soda, K., Tomimatsu, Y., Abate, B., and Rigo, M.: Sr isotope variations in the Upper Triassic succession at Pizzo Mondello, Sicily: Constraints on the timing of the Cimmerian Orogeny, Palaeogeogr. Palaeocl., 499, 131–137, https://doi.org/10.1016/j.palaeo.2018.03.025, 2018.
Onoue, T., Soda, K., and Isozaki, Y.: Development of Deep-Sea Anoxia in Panthalassa During the Lopingian (Late Permian): Insights from redox-sensitive elements and multivariate analysis, Front. Earth Sci., 8, 613126, https://doi.org/10.3389/feart.2020.613126, 2021.
Onoue, T., Michalík, J., Shirozu, H., Yamashita, M., Yamashita, K., Kusaka, S., and Soda, K.: Extreme continental weathering in the northwestern Tethys during the end-Triassic mass extinction, Palaeogeogr. Palaeocl., 593, 110934, https://doi.org/10.1016/j.palaeo.2022.110934, 2022.
Ortega, B., Caballero, C., Lozano, S., Israde, I., and Vilaclara, G.: 52000 years of environmental history in Zacapu basin, Michoacan, Mexico: the magnetic record, Earth Planet. Sc. Lett., 202, 663–675, https://doi.org/10.1016/S0012-821X(02)00802-6, 2002.
Paìlfy, J., Demény, A., Haas, J., Hetényi, M., Orchard, M. J., and Vetö, I.: Carbon isotope anomaly at the Triassic–Jurassic boundary from a marine section in Hungary, Geology, 29, 1047–1050, https://doi.org/10.1130/0091-7613(2001)029<1047:CIAAOG>2.0.CO;2, 2001.
Paterson, G. A., Zhao, X., Jackson, M., and Heslop, D.: Measuring, Processing, and Analyzing Hysteresis Data, Geochem. Geophy. Geosys., 19, 1925–1945, https://doi.org/10.1029/2018GC007620, 2018.
Pokrovsky, O. S., Schott, J., Kudryavtzev, D. I., and Dupré, B.: Basalt weathering in Central Siberia under permafrost conditions, Geochim. Cosmochim. Ac., 69, 5659–5680, https://doi.org/10.1016/j.gca.2005.07.018, 2005.
Price, G. D. and Sellwood, B. W.: Palaeotemperatures indicated by Upper Jurassic (Kimmeridgian-Tithonian) fossils from Mallorca determined by oxygen isotope composition, Palaeogeogr. Palaeocl., 110, 1–10, https://doi.org/10.1016/0031-0182(94)90106-6, 1994.
Prokoph, A., El Bilali, H., and Ernst, R.: Periodicities in the emplacement of large igneous provinces through the Phanerozoic: Relations to ocean chemistry and marine biodiversity evolution, Geosci. Front., 4, 263–276, https://doi.org/10.1016/j.gsf.2012.08.001, 2013.
Rampino, M. R. and Stothers, R. B.: Flood basalt volcanism during the past 250 million years, Science, 241, 663–668, https://doi.org/10.1126/science.241.4866.663, 1988.
Reggiani, L., Bertinelli, A., Ciarapica, G., Marcucci, M., Passeri, L., Ricci, C., and Rigo, M.: Triassic-Jurassic stratigraphy of the Madonna del Sirino succession (Lagonegro Basin, Southern Apennines, Italy), Boll. Soc. Geol. Ital., 124, 281–291, 2005.
Richoz, S., Krystyn, L., and Spötl, C.: Towards a carbon isotope reference curve of the Upper Triassic, New Mexico Museum of Natural History and Science Bulletin, 41, 366–367, 2007.
Rigo, M., De Zanche, V., Mietto, P., Preto, N., and Roghi, G.: Biostratigraphy of the Calcari con Selce formation, Boll. Soc. Geol. Ital., 124, 293–300, 2005.
Rigo, M., Preto, N., Franceschi, M., and Guaiumi, C.: Stratigraphy of the Carnian-Norian Calcari con Selce Formation in the Lagonegro Basin, southern Apennines, Riv. Ital. Paleontol. Stratigr, 118, 143–154, https://doi.org/10.13130/2039-4942/5995, 2012.
Rigo, M., Bertinelli, A., Concheri, G., Gattolin, G., Godfrey, L., Katz, M. E., Maron, M., Muttoni, G., Sprovieri, M., Stellin, F., and Zaffani, M.: The Pignola-Abriola section (southern Apennines, Italy): A new GSSP candidate for the base of the Rhaetian Stage, Lethaia, 49, 287–306, https://doi.org/10.1111/let.12145, 2016.
Rigo, M., Onoue, T., Tanner, L. H., Lucas, S. G., Godfrey, L., Katz, M. E., Zaffani, M., Grice, K., Cesar, J., Yamashita, D., Maron, M., Tackett, L. S., Campbell, H., Tateo, F., Concheri, F., Agnini, C., Chiari, M., and Bertinelli, A.: The Late Triassic Extinction at the Norian/Rhaetian boundary: Biotic evidence and geochemical signature, Earth Sci. Rev., 204, 103180, https://doi.org/10.1016/j.earscirev.2020.103180, 2020.
Roberts, A. P., Chang, L., Rowan, C. J., Horng, C.-S., and Florindo, F.: Magnetic properties of sedimentary greigite (Fe3S4): an update, Rev. Geophys., 49, RG1002, https://doi.org/10.1029/2010RG000336, 2011.
Roberts, A. P., Heslop, D., Zhao, X., and Pike, C. R.: Understanding fine magnetic particle systems through use of first-order reversal curve diagrams, Rev. Geophys., 52, 557–602, https://doi.org/10.1002/2014RG000462, 2014.
Rodelli, D., Jovane, L., Giorgioni, M., Rego, E. S., Cornaggia, F., Benites, M., Cedraz, P., Berbel, G. B. B., Braga, E. S., Ustra, A., Abreu, F., and Roberts, P.: Diagnenetic fate of biogenic soft and hard magnetite in chemically stratified sedimentary environments of Mamanguá Ría, Brazil, J. Geophys. Res.-Sol. Ea., 124, 2313–2330, https://doi.org/10.1029/2018JB016576, 2019.
Scandone, P.: Studi di geologia lucana: la serie calcareo-silico-marnosa, Bollettino Società Naturalisti Napoli, 76, 1–175, 1967.
Schaller, M. F., Wright, J. D., Kent, D. V., and Olsen, P. E.: Rapid emplacement of the Central Atlantic magmatic province as a net sink for CO2, Earth Planet. Sc. Lett., 323–324, 27–39, https://doi.org/10.1016/j.epsl.2011.12.028, 2012.
Schaller, M. F., Wright, J. D., and Kent, D. V.: A 30 Myr record of Late Triassic atmospheric pCO2 variation reflects a fundamental control of the carbon cycle by changes in continental weathering, Geol. Soc. Am. Bull., 127, 661–671, https://doi.org/10.1130/B31107.1, 2015.
Snowball, I., Sandgren P., and Petterson, G.: The mineral magnetic properties of an annually laminated Holocene lake-sediment sequence in northern Sweden, Holocene, 9, 353–362, https://doi.org/10.1191/095968399670520633, 1999.
Soda, K. and Onoue, T.: Multivariate analysis of geochemical compositions of bedded chert during the Middle Triassic (Anisian) oceanic anoxic events in the Panthalassic Ocean, Geochem. J., 53, 91–102, https://doi.org/10.2343/geochemj.2.0540, 2019.
Tanner, L. H.: The Triassic isotope record, in: The Triassic Timescale, edited by: Lucas, S. G., Geol. Soc. Spec. Publ., 334, 103–118, https://doi.org/10.1144/SP334.5, 2010.
Tauxe, L. and Kent, D. V.: A simplified statistical model for the geomagnetic field and the detection of shallow bias in paleomagnetic inclinations: Was the ancient magnetic field dipolar? In: Timescales of the Paleomagnetic field, edited by: Channel, J. E. T., Kent, D. V., Lowrie, W., and Meert J. G., AGU Geophysical Monograph Series, 145, 101–115, https://doi.org/10.1029/145GM08, 2004.
Thouveny, N., de Beaulieu, J.-L., Bonifay, E., Creer, K. M., Guiot, J., Icole, M., Johnsen, S., Jouzel, J., Reille, M., Williams, T., and Williamson, D.: Climate variations in Europe over the past 140 kyr deduced from rock magnetism, Nature, 371, 503–506, https://doi.org/10.1038/371503a0, 1994.
Trotter, A. J., Williams, S. I., Nicora, A., Mazza, M., and Rigo, M.: Long-term cycles of Triassic climate change: A new δ18O record from conodont apatite, Earth Planet. Sc. Lett., 415, 165–174, https://doi.org/10.1016/j.epsl.2015.01.038, 2015.
Van der Post, K. D., Oldfield, F., Haworth, E. Y., Crooks, P. R. J., and Appleby, P. G.: A record of accelerated erosion in the recent sediments of Blelham Tarn in the English Lake district, J. Paleolimnol., 18, 103–120, https://doi.org/10.1023/A:1007922129794, 1997.
van de Schootbrugge, B., Payne, J. L., Tomasovych, A., Pross, J., Fiebig, J., Benbrahim, M., Föllmi, K. B., and Quan, T. M.: Carbon cycle perturbation and stabilization in the wake of the Triassic-Jurassic boundary mass extinction event, Geochem. Geophy. Geosys., 9, 1–16, https://doi.org/10.1029/2007GC001914, 2008.
Van Huffel, S. and Vanderwalle, J.: The Total Least Squares Problem: Computational Aspects and Analysis, Society for Industrial and Applied Mathematics, Philadelphia, USA, 313 pp., ISBN 978-0-89871-275-9, 1991.
Vigliotti, L., Capotondi, L., and Torii, M.: Magnetic properties of sediment deposited in suboxic-anoxic environments: relationships with biological and geochemical proxies, in: Palaeomagnetism and Diagenesis in Sediments, edited by: Tarling, D. H. and Turner, P., Geol. Soc. Spec. Publ., 151, 71–83, https://doi.org/10.1144/GSL.SP.1999.151.01.08, 1999.
Villareal, D. P., Robinson, A. C., Carrapa, B., Worthington, J., Chapman, J. B., Oimahmadov, I., Gadoev, M., and MacDonald, B.: Evidence for Late Triassic crustal suturing of the Central and Southern Pamir, J. Asian Earth Sci.: X, 3, 100024, https://doi.org/10.1016/j.jaesx.2019.100024, 2020.
Vlag, P., Thouveny, N., Williamson, D., Andrieu, V., Icole, M., and van Velzen, A. J.: The rock magnetic signal of climate change in the maar lake sequence of Lac St Front (France), Geophys. J. Int., 131, 724–740, https://doi.org/10.1111/j.1365-246X.1997.tb06608.x, 1997.
Walker, J. C. G., Hays, P. B., and Kasting, J. F.: A negative feedback mechanism for the long-term stabilization of Earth's surface-temperature, J. Geophys. Res.-Oceans, 86, 9776–9782, https://doi.org/10.1029/JC086iC10p09776, 1981.
Wang, L., Pan, Y.-X., Li, J.-H., and Qin, H.-F.: Magnetic properties related to thermal treatment of pyrite, Sci. China Ser. D, 51, 1144–1153, https://doi.org/10.1007/s11430-008-0083-7, 2008.
Wang, L., Hu, S., Yu, G., Ma, M., Wang, Q., Zhang, Z., Liao, M., Gao, L., Ye, L., and Wang, X.: Magnetic characteristics of sediments from a radial sand ridge field in the South Yellow Sea, eastern China, and environmental implications during the mid- to late-Holocene, J. Asian Earth Sci., 163, 224–234, https://doi.org/10.1016/j.jseaes.2018.05.035, 2018.
Wang, X., Løvlie, R., Su, P., and Fan, X.: Magnetic signature of environmental change reflected by Pleistocene lacustrine sediments from the Nihewan Basin, North China, Palaeogeogr. Palaeocl., 260, 452–462, https://doi.org/10.1016/j.palaeo.2007.12.006, 2008.
Ward, P. D., Garrison, G. H., Haggart, J. W., Kring, D. A., and Beattie, M. J.: Isotopic evidence bearing on Late Triassic extinction events, Queen Charlotte Islands, British Columbia, and implications for the duration and cause of the Triassic/Jurassic mass extinction, Earth Planet. Sc. Lett., 224, 589–600, https://doi.org/10.1016/j.epsl.2004.04.034, 2004.
Weaver, R., Roberts, A. P., and Barker, A. J.: A late diagenetic (syn-folding) magnetization carried by pyrrhotite: implications for paleomagnetic studies from magnetic iron sulphides-bearing sediments, Earth Planet. Sc. Lett., 200, 371–386, https://doi.org/10.1016/S0012-821X(02)00652-0, 2002.
Wignall, P. B.: Large igneous provinces and mass extinctions, Earth Sci. Rev., 53, 1–33, https://doi.org/10.1016/S0012-8252(00)00037-4, 2001.
Wilmsen, M., Fürsich, F. T., Seyed-Emami, K., Majidifard, M. R., and Taheri, J.: The Cimmerian Orogeny in northern Iran: tectono-stratigraphic evidence from the foreland, Terra Nova, 21, 211–218, https://doi.org/10.1111/j.1365-3121.2009.00876.x, 2009.
Zanchetta, S., Worthington, J., Angiolini, L., Leven, E. J., Villa, I. M., and Zanchi, A.: The Bashgumbaz Complex (Tajikistan): Arc obduction in the Cimmerian orogeny of the Pamir, Gondwana Res., 57, 170–190, https://doi.org/10.1016/j.gr.2018.01.009, 2018.
Zaffani, M., Agnini, C., Concheri, G., Godfrey, L., Katz, M., Maron, M., and Rigo, M.: The Norian “chaotic carbon interval”: new clues from the δ13Corg record of the Lagonegro Basin (southern Italy), Geosphere, 13, 1133–1148, https://doi.org/10.1130/GES01459.1, 2017.