the Creative Commons Attribution 4.0 License.
the Creative Commons Attribution 4.0 License.
 | 30 Jan 2024
Accumulation rates over the past 260 years archived in Elbrus ice core, Caucasus
Vladimir Mikhalenko
Pavel Toropov
Michel Legrand
Sergey Sokratov
Gleb Chernyakov
Ivan Lavrentiev
Susanne Preunkert
Anna Kozachek
Mstislav Vorobiev
Aleksandra Khairedinova
Vladimir Lipenkov
In this study, we present a seasonally resolved accumulation record spanning from 1750 to 2009 Common Era (CE), based on a 181.8 m ice core obtained from the Elbrus Western Plateau in the Caucasus. We implemented various methods to account for uncertainties associated with glacier flow, layer thinning, and dating. Additionally, we applied a novel approach to calculate a seasonal calendar for meteorological data, enabling comparison with ice core records. The reconstructed accumulation data were compared with available meteorological data, gridded precipitation records, and paleo-reanalysis data. Reconstructed accumulation is representative for a large region south of the Eastern European plain and Black Sea region with summer precipitation being the primary driver of precipitation variability. We identified a statistically significant relationship between changes in regional precipitation and fluctuations in the North Atlantic Oscillation (NAO) index, which is, however, not stable over the entire period covered by the ice core.
- Article
(8059 KB) - Full-text XML
-
Supplement
(1940 KB) - BibTeX
- EndNote


Reconstructing past precipitation is a crucial aspect of understanding the earth's climate system, particularly with respect to its regional variability. Precipitation plays a critical role in shaping the environment, including water resources, vegetation, and ecosystems. Unlike for most key climate indicators, which show similar trends in most parts of the world, a strong regional variation in the sign of trend is observed for changes in precipitation amounts (IPCC, 2014). The spatial distribution of precipitation is much more variable compared with air temperature, and a denser network of observations is required to obtain homogeneous data. Particularly large variations at small spatial scales are observed in mountainous areas due to the complex interaction of circulation factors with the underlying surface. In situ precipitation measurements can be highly uncertain, especially for snowfall events. This is often due to gauge under-catch, which can lead to significant errors in the measurement of precipitation amounts (Rasmussen et al., 2012). Currently there are 30 gridded global precipitation datasets available, which include data based on gauge measurements, derived from satellites and reanalysis products (Sun et al., 2018). The discrepancies between these datasets highlights their limitation, and the general difficulty, in investigating long-term precipitation changes. In any case, a major drawback is their generally coarse spatial resolution, which is especially problematic in mountainous environments where orographic effects play an important role.
Precipitation variability in the pre-instrumental period is mainly obtained from proxy data and climate models (Bunde et al., 2013; Pauling et al., 2006; Valler et al., 2022). Spore-pollen data characterizing the change in plant communities can be used as indirect evidence of the oscillations of wet and dry periods (Barber et al., 2004; Borisova, 2019). They reproduce the qualitative pattern of climatic variability but generally suffer from a low temporal resolution (decades or centuries) and do not always allow quantitative reconstructions.
In contrast, tree rings have an annual resolution and can be calibrated using instrumental records. These data are widely used for reconstructions of aridity (Büntgen et al., 2021; Cook et al., 2015, 2020; Solomina et al., 2017) and precipitation (e.g. Touchan et al., 2007; Zhang et al., 2017). The relationship between tree ring parameters and precipitation strongly depends on the region. Tree ring width is often a good indirect source of precipitation data in arid conditions, while wood isotope composition can also be closely related to precipitation in some non-arid regions (Loader et al., 2020).
Unlike other proxy, glaciers contain a more direct precipitation signal. Annual layer thickness in ice cores depends on the total annual precipitation amount, although the amount of precipitation may not always be equal to net accumulation. Thus, the most accurate data can be obtained in areas where the loss of deposited snow mass due to melt, sublimation, and/or erosion and redistribution by wind and avalanches is minimal. Many polar ice cores were recovered in the central parts of the ice sheets near the ice divides where wind erosion and accumulation of snow is close to equilibrium. On mountain glaciers, the underestimation of wind-driven snow erosion can lead to significant errors (Bohleber et al., 2013).
To obtain past accumulation rates, the annual layer thickness has to be corrected for the cumulative effect of layer thinning with depth, which is caused by ice flow. With the processes of ice flow being well understood, a number of rather simple models and approaches for calculating the initial thickness of deposited annual layers have been developed over the past decades (e.g. Dansgaard and Johnsen, 1969; Nye, 1963; Paterson and Waddington, 1984; Schwerzmann et al., 2006).
In order to reconstruct accumulation from the determined thickness of annual layers, an ice flow model is required to correct for the amount of thinning with depth due to the flow of ice (e.g. Winski et al., 2017). This is particularity challenging for the deepest parts where bedrock topography can become an important factor (e.g. Licciulli et al., 2019). For these reasons detailed, ice core reconstructions of accumulation and precipitation are relatively rare both for polar (e.g. Dahl-Jensen et al., 1993; Goodwin et al., 2016; Pohjola et al., 2002; Winstrup et al., 2019) and high-elevation ice cores (Henderson et al., 2006; Herren et al., 2013; Mariani et al., 2014; Winski et al., 2017; Yao et al., 2008; Zhang et al., 2022) compared with other climate and environmental parameters.
In this paper, we present a high-resolution reconstruction of snow accumulation based on the ice core records from Mt. Elbrus, Caucasus, and interpretation of the obtained results.
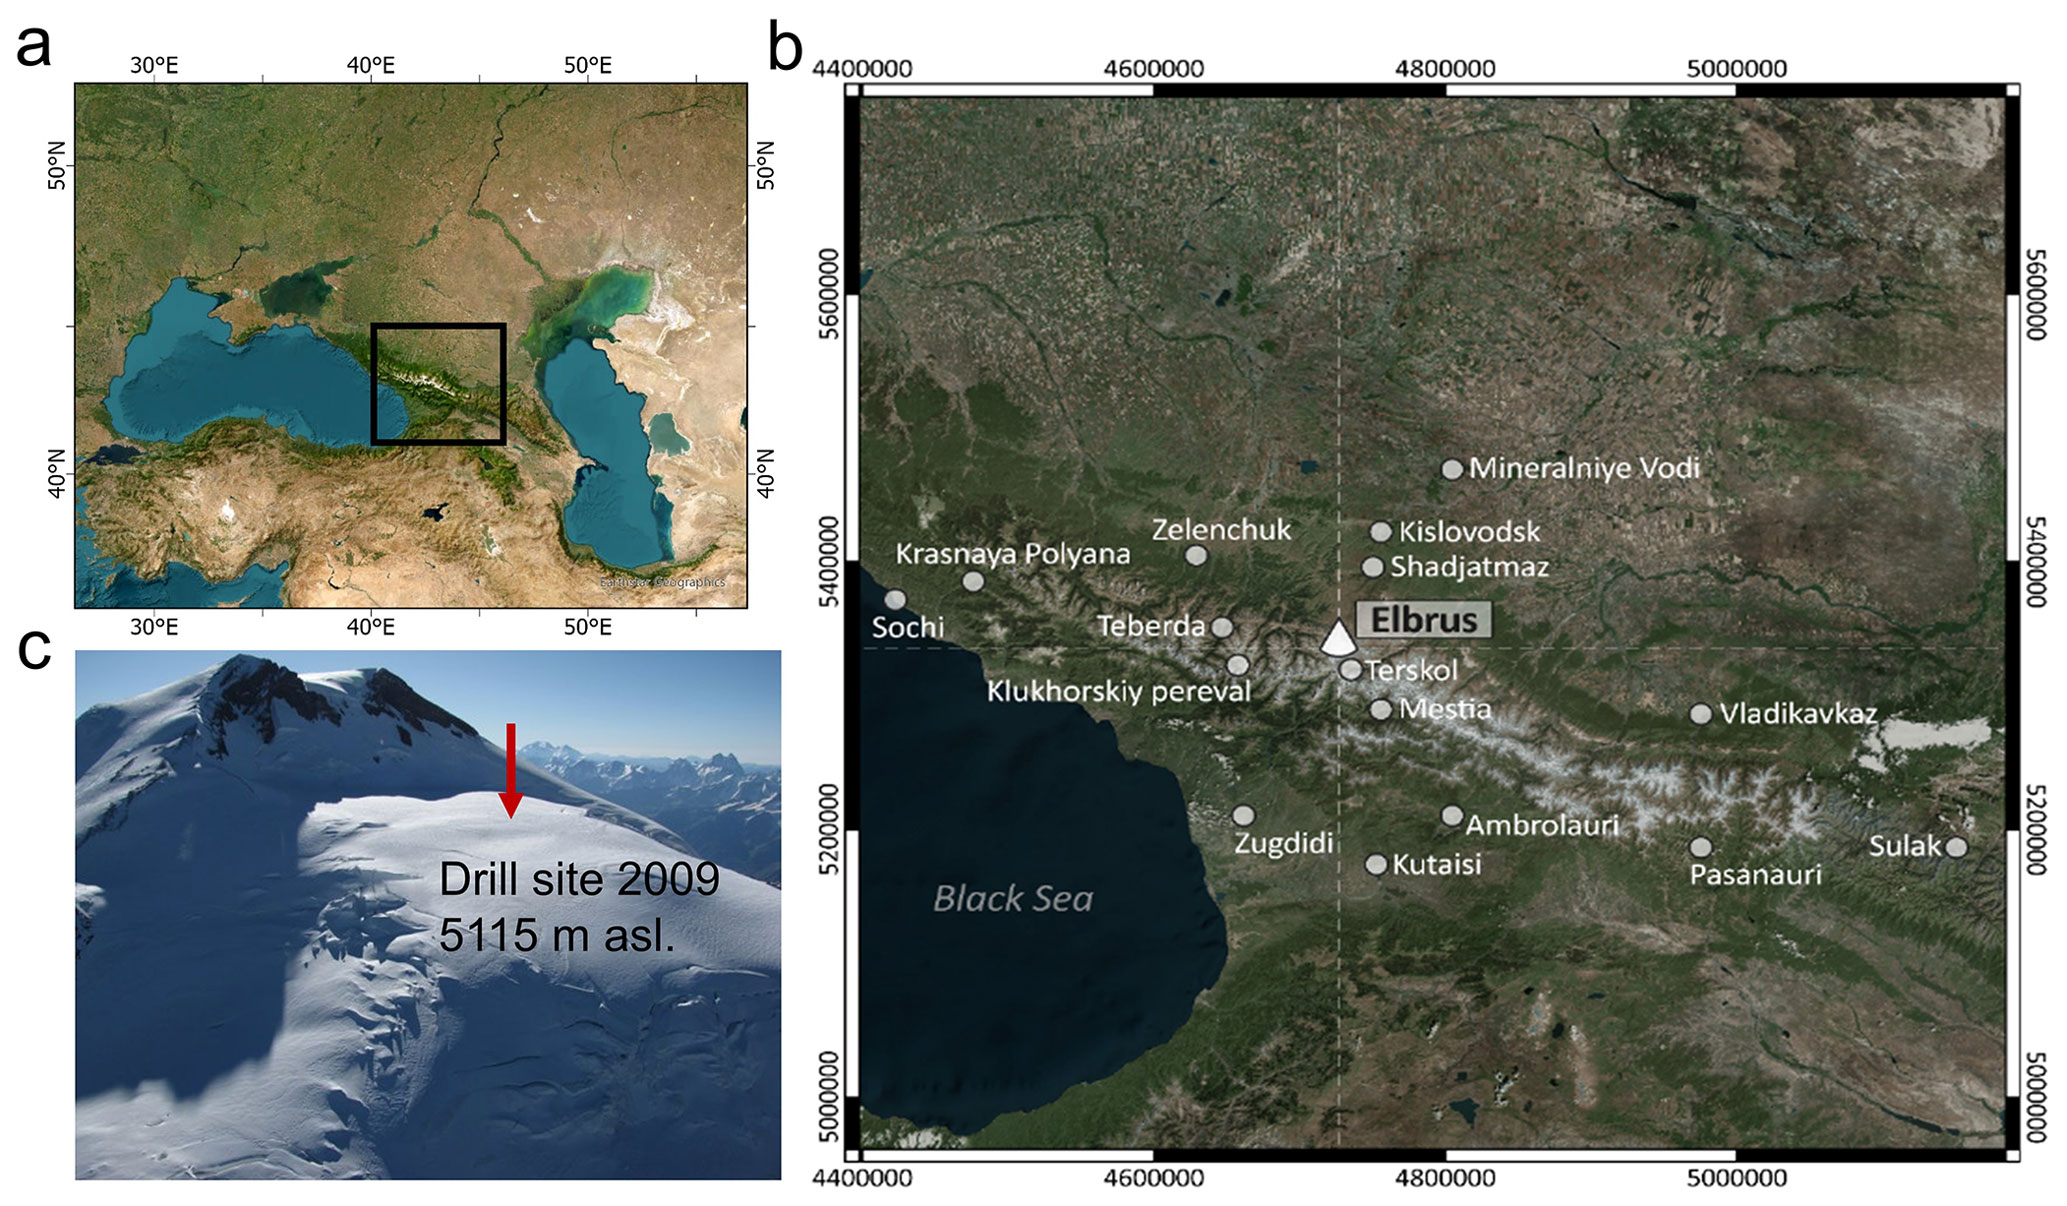
Figure 1Location of the Mt. Elbrus drilling site: (a) the Caucasus, (b) the Mt. Elbrus and meteorological stations, and (c) the western Elbrus plateau drill site (photos by I. Lavrentiev, September 2009). ArcGIS World Imagery Basemap used as the background. Source: DigitalGlobe.
2.1 Site description
The Caucasus mountain system is situated between the Black and the Caspian seas, and generally trend east–southeast, with the Greater Caucasus range often considered as the divide between Europe and Asia. The 2223 glaciers in the Caucasus cover an area of 1060.9 ± 33.6 km2 (Tielidze et al., 2022). The Elbrus Mountain glaciers contain about 10 % of the Caucasus ice volume and cover an area of 112.6 km2 (Fig. 1a) (Mikhalenko, 2020). Glaciers cover an altitudinal range from 2683 to 5642 m a.s.l. with the coldest conditions present above 5200 m a.s.l. where mean summer air temperature stays below 0 ∘C. The ice cores used for climate and environment reconstructions were recovered at two sites on Elbrus Mountain: Western Plateau (WP) at 5115 m a.s.l. and the glacier in the crater of the eastern summit of Elbrus at 5600 m a.s.l. (Mikhalenko et al., 2021). A 181.8 m ice core was recovered at the WP in August–September 2009 and a 96 m ice core was drilled in August 2020 at the eastern summit (Mikhalenko, 2020). Here we report the results of the WP ice core of 2009.
The WP area is ∼ 0.5 km2 and is surrounded by lava ridges to the south and southeast, and by a vertical wall of Mt. Elbrus to the east (Fig. 1b). Ice thickness according to a ground-based survey in 2004–2007 varies from 100 to 200 m with a maximum of 255 ± 8 m in the northeastern part of the plateau (Lavrentiev et al., 2010). The 10 m depth temperature is −17.3 ∘C (Mikhalenko et al., 2015).
The amount of precipitation can be determined as the difference between the measured accumulation layer and the loss caused by melting, sublimation, and wind-driven snow redistribution. Ice formation at the drilling site occurs predominantly in cold, dry conditions, and the thickness of the infiltration ice layers, which do not form every year, does not exceed 10 mm (Mikhalenko et al., 2015). The contribution of sublimation rate to glacier mass balance and snow cover balance is estimated to be between 5 % and 10 % (Bintanja, 1998; Palm et al., 2017) but can reach up to 30 % in certain climatic conditions (Pomeroy and Gray, 1995). On the WP in 2018, sublimation during the short season of possible surface melting was estimated to be 3 % of the accumulation layer or 45 (Mikhalenko, 2020). Wind-driven snow redistribution was measured by stakes on the plateau during three field seasons, showing a zero balance between erosion and accumulation of snow near the drilling site (Mikhalenko, 2020). An analysis of the fields of summer and winter accumulation on the plateau from 2015 to 2017 shows that snow accumulation in the summer period is evenly distributed over the plateau. The relocation of winter snow was observed leading to net loss in the southern and western parts of the plateau and net gain in the northern and eastern parts of the plateau limited by the northern ridge and the steep wall of the western summit of Elbrus (Lavrentiev et al., 2022). The drill site is roughly in between these two extremes and can thus be assumed to be in equilibrium also in winter. However, we cannot dismiss the possibility of snow accumulation losses driven by wind for winter layers in specific years at the drilling site.
2.2 Ice core analysis
The 2009 WP ice core was processed and analysed at the Institute of Environmental Geosciences in Grenoble (France) for major ions (K+, Na+, Ca2+, Mg2+, , , , Cl−, and F−), succinic acid (HOOCCH2COOH), dust concentration, and black carbon (Kutuzov et al., 2019; Lim et al., 2017; Preunkert et al., 2019). Stable isotopes (δ18O and δD) were analysed using Piccarro at the Arctic and Antarctic Research Institute in St. Petersburg, Russia (Kozachek et al., 2017). Determination of the tritium content was carried out at the University of Bern, Switzerland (Mikhalenko et al., 2015). A total of 3724 samples were analysed to 168.6 m depth. Sampling resolution was 10 cm for the upper part of the ice core and increased to 5 cm at 70 m depth and to 2 cm at 157 depth and below. Discrete sampling in the cold room was performed according to the clean sampling protocol (Preunkert and Legrand, 2013). Detailed results of ice core chemical records are given in Preunkert et al. (2019).
2.2.1 Ice core dating
The upper 168.6 m (131.6 ) depth of the ice core were first dated by annual layer counting primarily using pronounced seasonal variations in ammonium and succinate concentrations, both exhibiting well-marked winter minima (Mikhalenko et al., 2015; Preunkert et al., 2019). Specific thresholds were used to differentiate between winter and summer conditions in the upper ice layers, reaching to a depth of 75.6 m, corresponding to the year 1963 (Mikhalenko et al., 2015). These thresholds were set at 100 ppb for ammonium and 5 ppb for succinate concentrations. To account for the observed increase in ammonium concentrations during the industrial era, these criteria were adjusted. Specifically, between depths of 75.6 and 86.8 m, covering the period from 1950 to 1963, the ammonium winter criteria were modified to 50 ppb and further reduced to 30 ppb below that depth. In contrast, no substantial depth-related variation was observed for succinate, and the concentration limit of 5 ppb remained consistent in deeper layers. Layers were attributed to the winter season if at least one of the criteria was met and the value of the other was below or close to the limit (< 10 % above) for consecutive samples. Below a depth of approximately 150 m, winter layers often consist of only one or two samples, while summer layers consist of more than six samples, making the process of annual dating challenging (Preunkert et al., 2019).
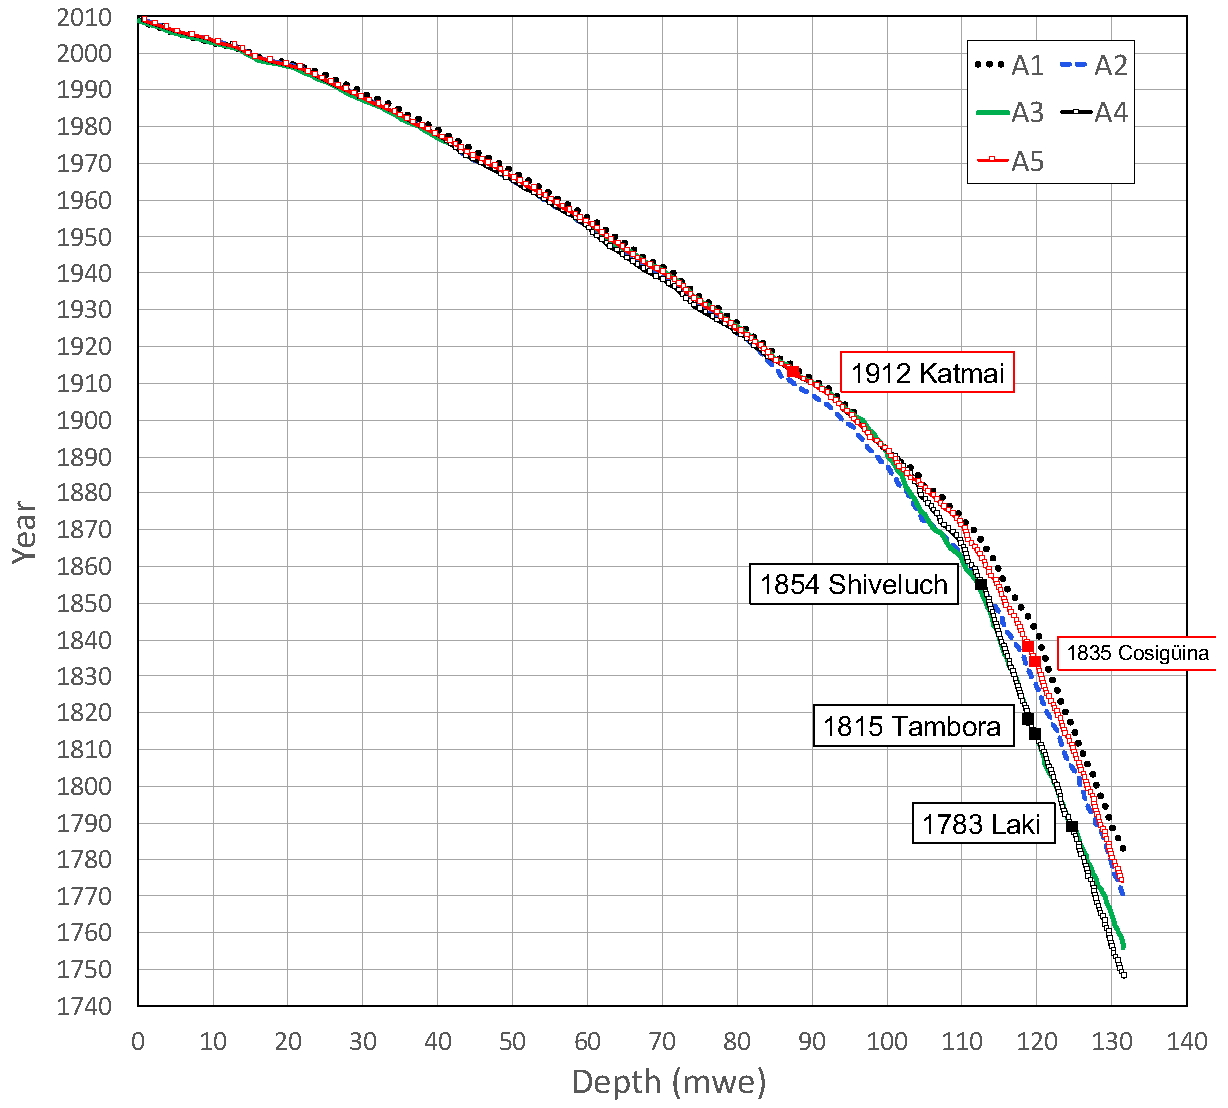
Figure 2Age–depth (in ) relation of the Elbrus ice core derived by annual layer counting achieved by four co-authors of the present paper (denoted A1–A4) and by Preunkert et al. (2019) (denoted A5).
The annual counting was found to be accurate (a 1-year uncertainty) over the past 100 years when anchored with the stratigraphy of the 1912 CE Katmai horizon located at 116.7 m (87.7 ) depth (Mikhalenko et al., 2015). Although several other volcanic horizons were suspected to be recorded, particularly below 139 m (106 ) depth, none of them were unambiguously attributed to a particular event. A series of sulfate spikes present between 152.6 and 154.9 m (118–120 ) depth dated at ∼ 1840–1833 CE (Table S1 in the Supplement), of which two were characterized by an increase in acidity (up to 7.8 µEq L−1), were, however, suspected of being possibly related to the 1835 CE Cosigüina eruption (Nicaragua) (volcanic explosivity index (VEI) of 5; Simkin and Siebert, 1994). It has to be emphasized that given the time period covered by the ice core (1774–2009 CE), surprisingly the layer corresponding to the large eruption of Tambora (1815 CE, VEI of 7; Simkin and Siebert, 1994) was not identified in previous dating of the Elbrus ice core. Uncertainty was not estimated for the dating below the 1912 CE Katmai horizon.
With the aim of estimating uncertainties in dating annual layers deposited prior to 1912 CE, we revisited the chemical profiles including sulfate and acidity. Dating using annual layer counting becomes more uncertain with depth because layers become thinner resulting from glacier ice flow and sufficient sampling resolution becomes critical to resolve the seasonal variations (e.g. Paterson and Waddington, 1984). To evaluate the subjective character of the annual layer counting method, four co-authors (denoted A1–A4) performed the annual layer counting using seasonal variation of ammonium and succinate concentrations without considering a strict criterion for winter. The results were compared to those (denoted A5) previously proposed by Preunkert et al. (2019). As seen in Fig. 2, the five chronologies are quite consistent until 131.5 m (100 ) depth dated at 1890 CE ± 3 years and 143.4 m (110 ) depth dated at 1866 CE ± 6 years. Below 149 m (115 ) depth, A3 and A4 independently counted more years than A1, A2, and A5 by attributing much more ammonium and succinate minima to winter layers (Fig. S1 in the Supplement). As a result, the layer at 154.9 m (120 ) is dated between 1828 and 1842 CE by A1, A2, and A5, whereas A3 and A4 dated it at 1813 or 1814 CE. At 168.6 m (131.6 ), A1, A2, and A5 proposed an age ranging between 1770 and 1783 CE (1776 CE ± 6 years), whereas A3 and A4 proposed an age of 1752 CE ± 4 years (i.e. a departure of ∼ 25 years).
Examination of the records of acidity and sulfate (Fig. S2) permitted to evaluate the extent to which the two chronologies (A1–A2–A5 versus A3–A4) are consistent with volcanic horizons and from that dating uncertainties. The A3–A4 dating attributed layer of increased acidity and sulfate located at 112.57 (peak c dated at 1851 CE) to the 1854 CE Shiveluch eruption (Kamchatka) (VEI was of 5; Simkin and Siebert, 1994). The spikes located between 118 and 120 (peaks d and f) were previously identified as possibly related to the 1835 CE Cosigüina eruption (A5) are now attributed by A3–A4 to the 1815 Tambora eruption (VEI of 7; Simkin and Siebert, 1994). The layer dated at 1789 CE (peak e) may be related to the 1783 CE Laki eruption. (See further discussions in the Supplement.)
In conclusion, the A1–A2–A3 and A3–A4 chronologies are consistent until 131.5 m (100 ) depth (i.e. 1890 CE ± 3 years) but differ by some 25 years at 131.6 (1752 CE ± 4 years instead of 1776 CE ± 6 years). The A3–A4 datings (1752 CE ± 4 years) are consistent with a Tambora layer located at 118.96 or 119.84 and possibly a Laki layer at 124.71 . Given the expected larger impact of the Tambora eruption compared with that of Cosigüina, we give more credit to the A3–A4 chronology. Note also that the use of the two possible datings (A1–A2–A5 and A3–A4) only slightly affects the general trends of the accumulation reconstruction (Fig. S4). In this study, the new dating will be used as the basis for the accumulation reconstruction.
2.3 Snow accumulation reconstruction
2.3.1 Thinning of annual layers due to ice flow
The accumulation rate history at Mt. Elbrus can be inferred from depth profiles of annual layer thicknesses in the WP ice core when corrected for thinning of ice layers due to ice flow. Density measurements, as reported by Mikhalenko et al. (2015), reveal kinks in the curves of the studied ice cores, corresponding to critical density values of 550 and 840 kg m−3 (Maeno and Ebinuma, 1983). The third critical density value of 730 kg m−3, which marks the transition of firn into ice by complete closure of air inclusions, is not clearly visible on the density curve. This indicates ice formation without meltwater involvement (Hörhold et al., 2011; Ligtenberg et al., 2011). The depth at which air bubbles separate from the surrounding ice matrix and pore closure occurs is approximately 55 m, with a measured density of about 840 kg m−3 (Mikhalenko et al., 2015).
To reconstruct initial accumulation values from the annual layers' water equivalents as observed in the ice core, we used a simple J. Nye flow model (Nye, 1963) incorporating mean accumulation rate and constant glacier thickness over the time span represented by an ice core (Dansgaard and Johnsen, 1969):
where hr and ho are recent and original depths of annual layer, respectively (m), A is age (in years), H is depth of glacier (157 m ice equivalent), and W is a Lambert W function.
Scaling of the best fit curve and the residuals of the raw data from the best fit curve (Fig. S3a) to the linear mean accumulation value (1.5 m ice equivalent) was considered as the representation of the variability in the “original” annual layers' depths (Fig. S3b).
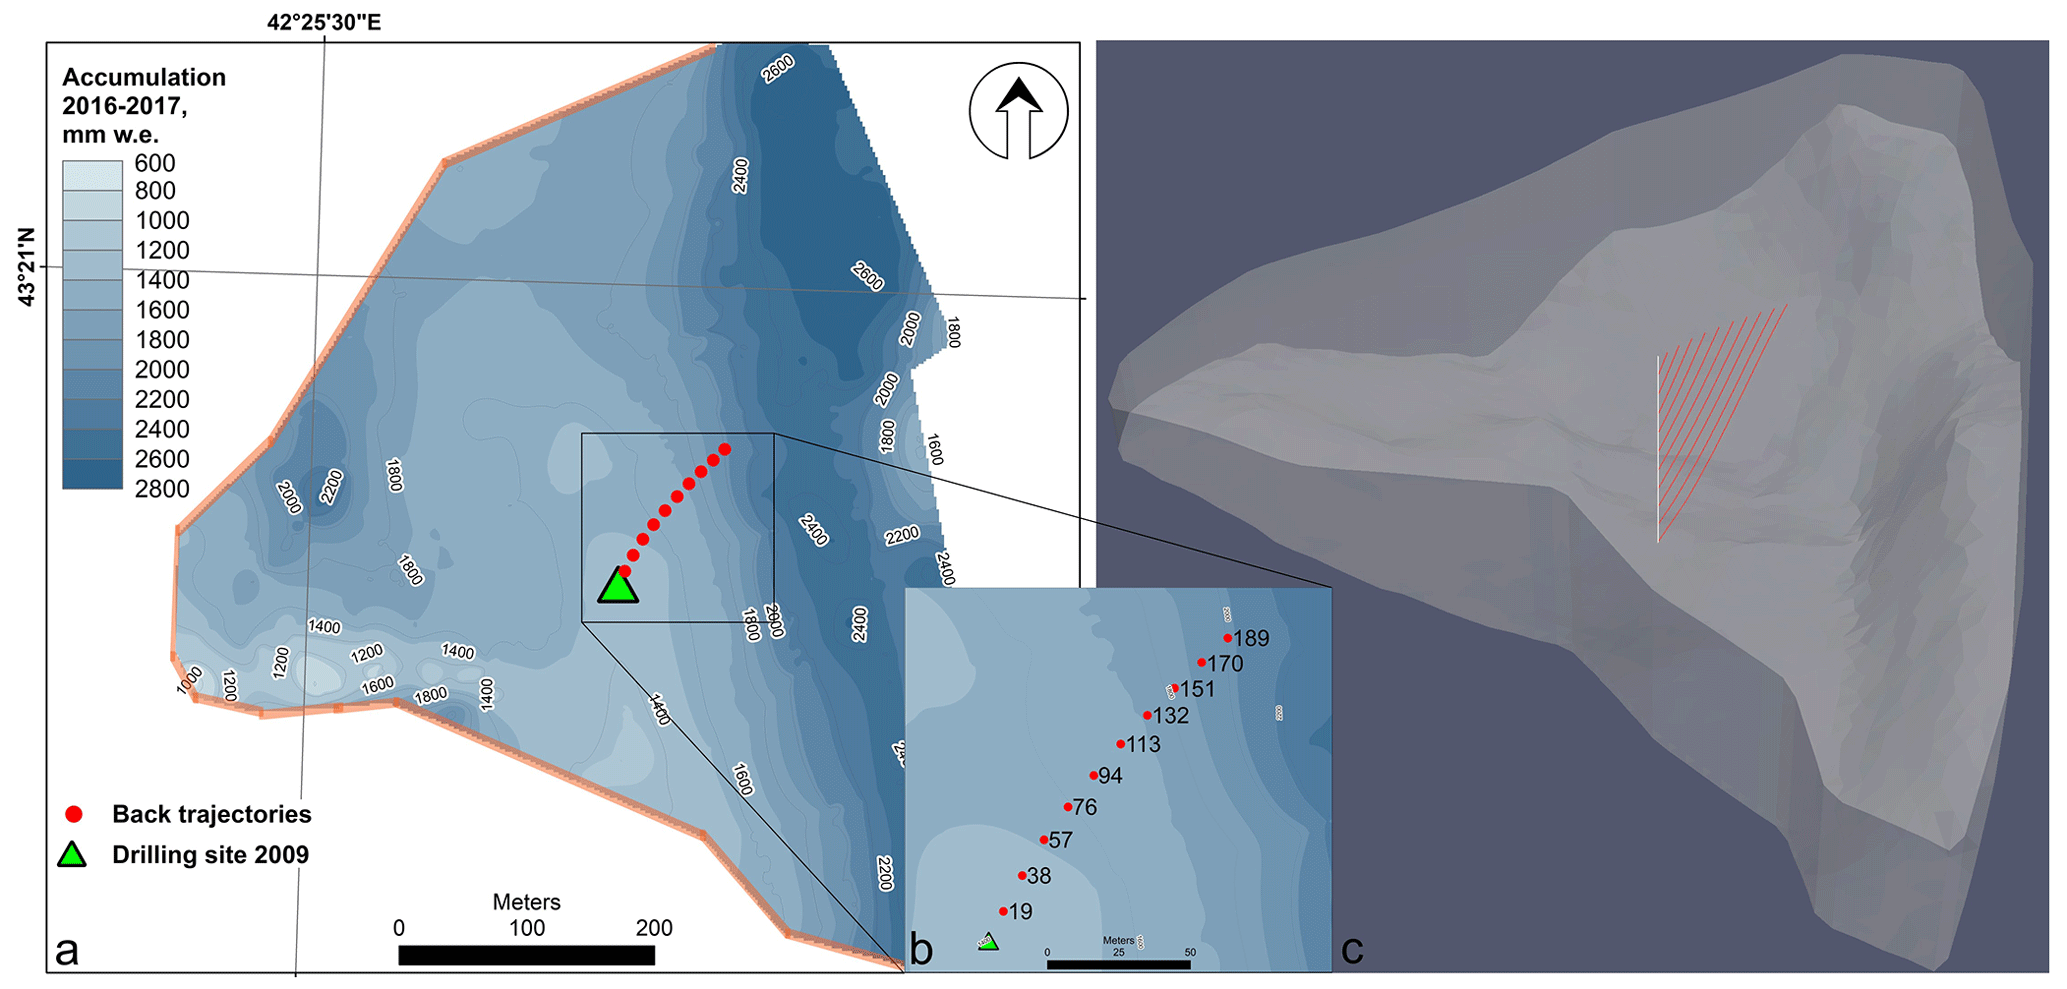
Figure 3Accumulation map for the western plateau of Elbrus in 2016–2017 CE (Lavrentiev et al., 2022) (a), the modelled catchment area for the 2009 CE ice core (b), and the computational domain with the borehole position (white line) and the calculated backward trajectories (red lines) (c). The orange line in (a) shows the outflow zone. The source points of the backward trajectories are marked with red dots (a). The corresponding borehole depths (rounded, in metres) according to DEM 2017 are given as dot labels (b). The green triangle in (a) indicates the position of the ice core (in 2009).
2.3.2 Correction for the upstream effect
Since the ice core includes layers that were deposited upstream of the drilling site, where annual snow accumulation conditions may differ from those at the drilling site, it is crucial to identify the ice core catchment area in order to investigate the connection between the ice core data and surface accumulation. To account for the upstream effect, we reconstructed the backward trajectories of the ice flow. To this end, we calculated the backward trajectories of the ice and firn particles positioned along a vertical line segment connecting the drill site and the bedrock (Fig. 3). In the post-processing step, the backward trajectories were calculated by utilizing the Runge–Kutta integrator implemented in the stream tracer of the ParaView visualization application, based on the modelled glacier velocity field. (Ahrens et al., 2005). The velocity field is simulated based on a 3-D full Stokes ice-flow model with the firn rheological law (Gagliardini and Meyssonnier, 1997). The model is implemented using the finite element software Elmer/Ice (Gagliardini et al., 2013). We performed a steady-state simulation with fixed glacier geometry.
The mathematical formulation of the ice-flow problem follows (Zwinger et al., 2007) with some simplifications and includes the Stokes and the volume balance evolution equations, the stress-free surface boundary condition, and the no-slip bedrock boundary condition. Unlike (Zwinger et al., 2007), we used only dynamical equations and did not consider thermo-mechanical coupling. Therefore, the flow rate factor in the firn rheological law is considered constant. The model utilizes a smoothed vertical profile of density inferred from the 2009 WP ice core (Mikhalenko et al., 2015). Model simulations show that the value of the flow rate has very little effect on the geometry of the backward trajectories and the position of their sources on the glacier surface. Therefore, the rate factor may be chosen arbitrarily from a wide range of values (from 4.82 to 14.46 in our computational experiments).
Since the digital elevation model data (Lavrentiev et al., 2022) covered only part of the glacier bedrock, the computational domain was restricted to this area and the lateral boundary connecting the surface and the bedrock boundaries was a fragment of a cylindrical surface (vertical wall) (Fig. 3c). As most of the lateral boundary was not a physical boundary in the glacier, the flow of ice and firn through it was possible. We considered two alternative boundary conditions for the lateral area: (i) no outflow (zero horizontal velocity) at the whole lateral boundary and (ii) constant nonzero outflow velocity at the western and southern parts of the lateral boundary and no outflow at the eastern side where a vertical wall of Mt. Elbrus is situated (Fig. 3a). In case (ii), the outflow velocity vectors extended outward from the computational domain perpendicular to its lateral surface. The outflow velocity value was considered constant in space and time.
Our simulation showed that the geometry and the length of the backward trajectories were influenced by the presence or absence of the outflow rather than the particular value of nonzero outflow velocity. Therefore, this velocity value was not an essential parameter in our modelling. Additionally, no field data on velocities were available.
In our model experiments, we obtained the backward trajectories of maximal length under the conditions in (ii). Since the maximum extent of the ice core catchment area was of interest in our study, we present the results of this model case. We used the flow rate factor B = 4.82 and the outflow velocity vout = 1 m yr−1 in the case illustrated in Fig. 3.
Based on our simulation, we have determined that the sources of the backward trajectories are located on the glacier surface, no more than 140 m northeast from the 2009 CE drill site. To estimate the correction factor for the difference in snow accumulation at the initial source location (Fig. S5), we utilized average accumulation distribution maps, which were generated using a combination of ice core data and a high-frequency radar survey (Lavrentiev et al., 2022). Snow accumulation increases linearly with distance from the drill site along the backward trajectory. Therefore, we applied the same linear relationship to calculate the accumulation correction percentage based on the age of the ice. The most significant correction of 30 % was applied to the oldest layers dating back to 1750 CE (Fig. S6).
Table 1Meteorological data used for analysis.
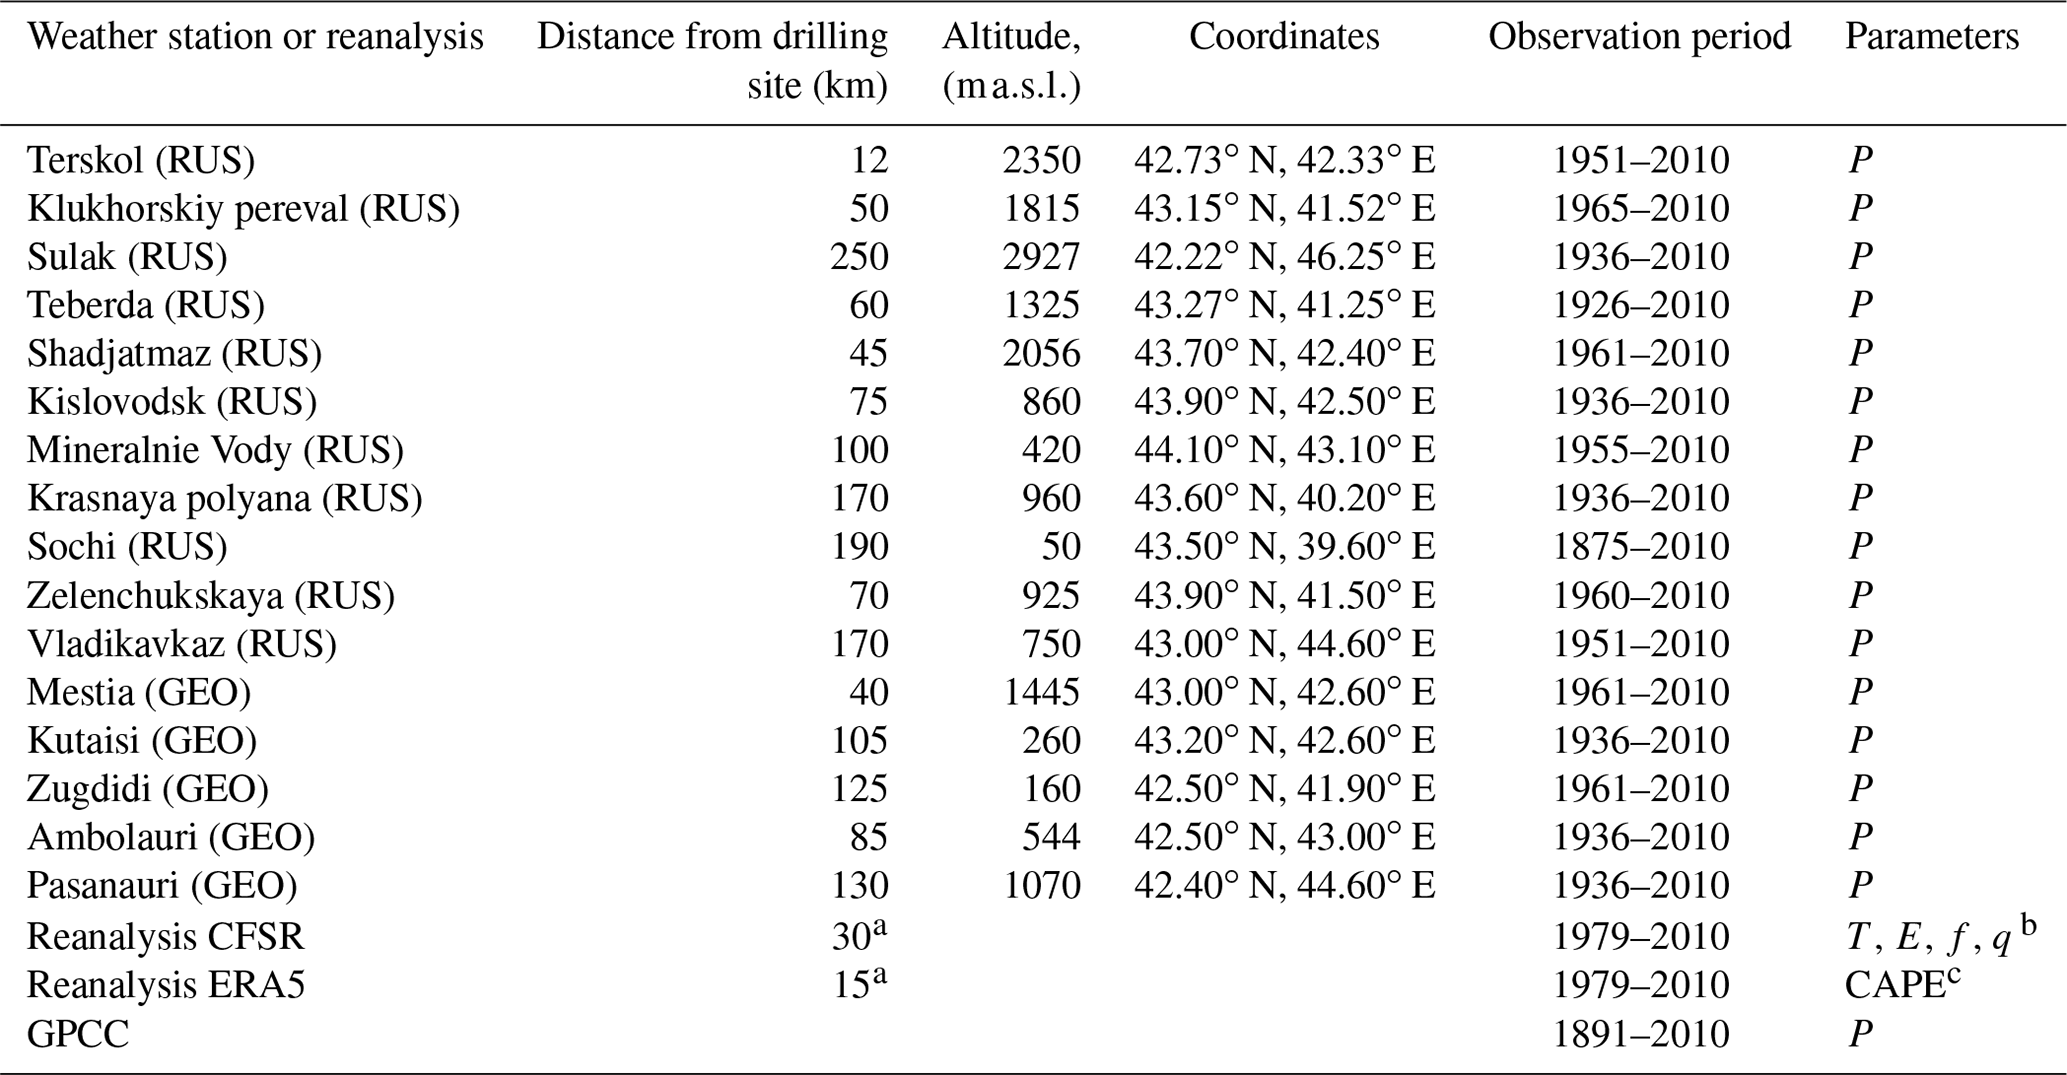
a The distance between the drilling site and the nearest node of the reanalysis grid. b P: precipitation, T: temperature, E: vapour saturation pressure, f: relative humidity, q: cloud air mixture ratio. c CAPE: convective available potential energy, RUS: Russia, GEO: Georgia.
2.4 Climate data
Data from 16 weather stations located in the foothills or mountainous regions of the Caucasus (Russia and Georgia) were used for the statistical estimates of the precipitation field in the North Caucasus, as well as for comparing the time series of precipitation with snow accumulation on the WP drilling site (Table 1). Most of the stations are located in lowland and foothill areas (less than 1000 ), 5 in the middle mountain zone, and 4 in high mountains (more than 2000 ). The convective available potential energy (CAPE) was calculated for separating summer and winter seasons using the ERA5 reanalysis data. We also used the Global Precipitation Climatology Centre (GPCC) v2020 0.25∘ monthly precipitation dataset, from 1891 to the present, calculated from global station data for field correlation analysis.
2.4.1 Seasonal calendar
A direct comparison of the ice core reconstructed net accumulation/precipitation records with precipitation amounts measured at meteorological stations contains seasonal and annual dating uncertainty. The boundaries of warm and cold seasons at meteorological stations can vary significantly depending on the geographical location and altitude. Seasonal variations in ammonium for which the main source is vegetation in the active phenological phase corresponding to the warm half of the year (April–September) were used for identification winter and summer layers in the WP ice core. Ammonium concentration in the ice core is maximum during the period of active convection and the accumulation sum over this period corresponds to precipitation of the warm half of the year.
As a seasonality predictor, we used the CAPE calculated from the ERA-Interim reanalysis data for 1979–2010 which has a pronounced seasonal variation and reflects convective movements in the atmosphere due to buoyancy forces. CAPE depends on the difference between the virtual temperature of the air particle (Ti) and the virtual temperature of the air surrounding the particle (T). Integrating this difference along the vertical (z) and multiplying it by the gravitational acceleration g, we obtain the convective instability energy (in J kg−1):
A number of studies (e.g. Chen et al., 2008; Markowski and Richardson, 2010) formulate gradations of CAPE that correspond to a particular level of convective atmospheric instability. Most of these studies are aimed at identifying the relationship between the recurrence of hazardous weather events of convective origin and the CAPE value. For example, in Markowski and Richardson (2010) it is shown that most of the weather hazards in the temperate USA climate zone occur when the CAPE is between 260 and 840 J kg−1. Under these conditions there is a high probability of deep convection development that can transport biogenic particles and chemical ions from the ground layer of the atmosphere to the 5000 m level. At Caucasus latitudes the CAPE may exceed the value of 300 J kg−1 even in the cold half of the year, on some exceptional days but not systematically. We therefore assume that a warm half-year in the North Caucasus begins when the CAPE exceeds 300 J kg−1 at least once every 5 d, i.e. during the natural synoptic period. Analysis of the annual variations in CAPE over the Caucasus (Fig. S7) shows CAPE is consistently less than 300 J kg−1 in summer in the region only under long and pronounced anticyclonic conditions corresponding to blocking. Blocking anticyclones are characteristic of more northern latitudes, with blocking developing much less frequently in the subtropics and in the southern temperate climate zone (Bardin et al., 2019). In addition to deep convection, the advection of ammonium ions to the WP level may be regulated by the mountain-valley circulation, which is also most active in the summer months and is indirectly related to the CAPE value.
The CAPE value depends on the heat content of the lower atmospheric layers and the intensity of heating of the underlying surface, so it has a pronounced seasonal variation. In spite of significant climate changes in the Caucasus, the CAPE value, which is one of the thermal characteristics of the atmosphere, did not show a statistically significant increase neither in the duration of the warm period (number of days) nor in the seasonal mean value. For the period covered by the reanalysis data (1979–2015), a calendar of warm and cold seasons was compiled (Table S2).
3.1 Net accumulation reconstruction
The graphical results of the accumulation reconstruction are presented in Fig. 4. The uncertainty range for the reconstructed accumulation values is determined by multiple factors. Dating uncertainty varies with time, providing a precision of ± 1 year for the 2009–1912 CE period, ± 2 years for the period 1912–1825 CE, and decreasing to ± 4 years for the period 1825–1750 CE. Additionally, the uncertainty linked to the upstream effect correction is challenging to estimate precisely, depending on factors such as initial spatial accumulation distribution uncertainty, assumptions regarding its temporal persistence, and uncertainty in back trajectory modelling. To address potential errors, we estimated the uncertainty of the applied linear regression. Furthermore, for winter accumulation, the uncertainty increases due to lower sampling resolution. In particular, we added an uncertainty of 30 % for winter accumulation values prior to 1865 CE, where the sampling resolution was insufficient, potentially leading to an underestimation of accumulation values.
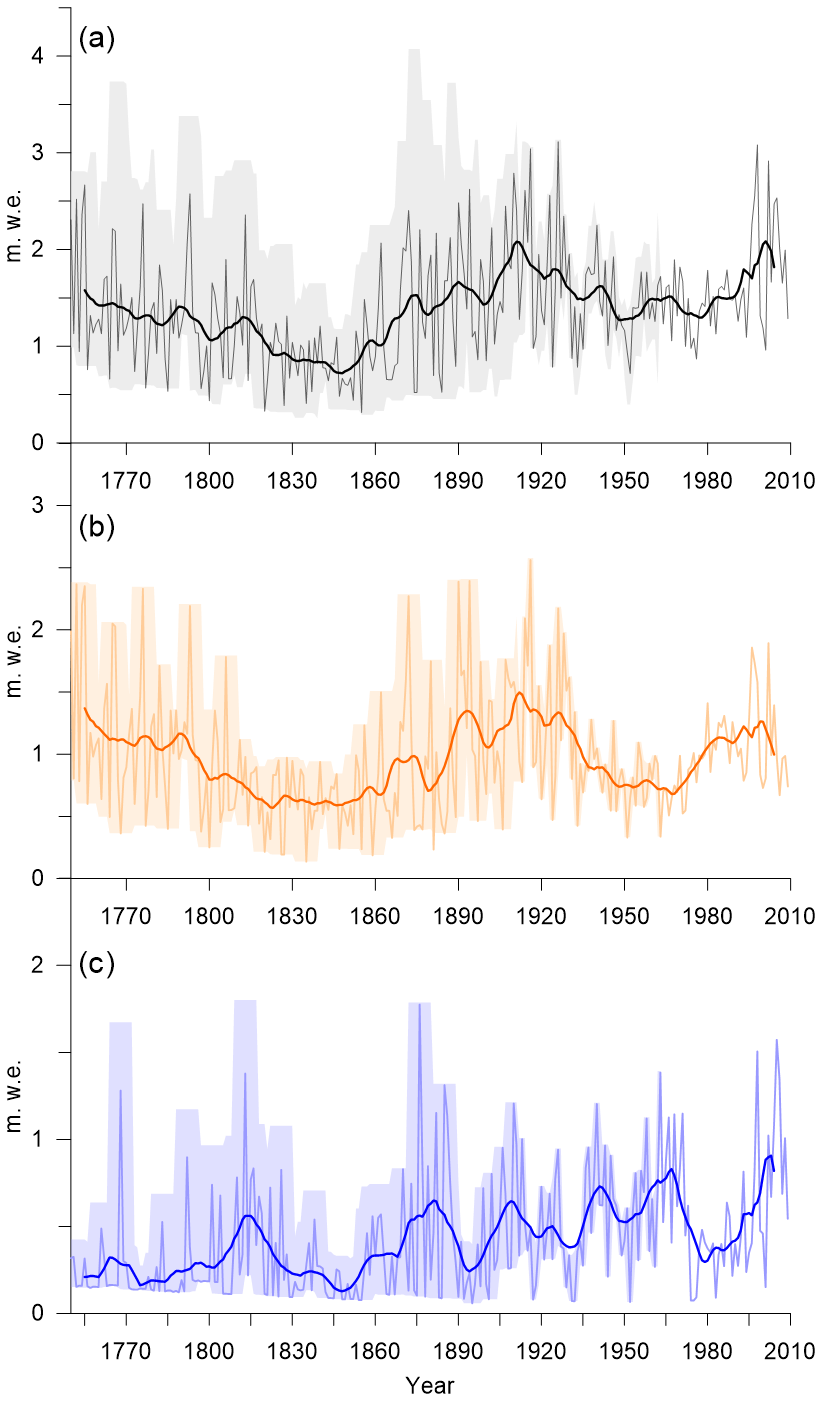
Figure 4Reconstructed annual (a), summer (b), and winter (c) snow accumulation at the WP. The 10-year moving averages are shown as thick lines. Uncertainties are shown as shaded areas.
The mean annual accumulation reconstructed at the WP from 1750 to 2009 CE is 1.2 During this same period, the mean summer and winter accumulations are 0.8 and 0.4 , respectively. Due to dating uncertainties, this record is suitable for investigations of decadal, multidecadal, and long-term regional precipitation variations, rather than interpretations of the accumulation for the exact years.
No statistically significant trends were observed in the 20th century in WP. The record can be classified into five major periods based on accumulation amount and year-to-year variability. The period before 1820 was characterized by relatively high accumulation and a high annual variability. This was followed by the relatively low summer and winter accumulation of the 1820–1860 CE period with less pronounced variations. From 1860 to 1935 CE, summer and winter accumulation increased by around a factor of two and strongly fluctuated. The period from 1935 to 1980 CE was again characterized by relatively low accumulation in summer and relatively high accumulation in winter. Since around 1980 CE, an increase in summer and winter accumulation has been observed.
The WP site exhibits a seasonal distribution of precipitation typical of the central Caucasus, with convective precipitation leading to a maximum in the summer months (Mikhalenko, 2020). As discussed above, winter accumulation before 1865 CE (110 ) is likely underestimated due to insufficient sampling resolution. The mean share of summer accumulation in the total annual accumulation was 66 % (SD = 18) over the course of 144 years (1865–2009 CE), which is consistent with current measured precipitation data at weather stations (Fig. S8). The lowest percentage of the summer component of the annual accumulation was observed to occur during 1935–1980 (57 %) and after 2004. This period was characterized by a prolonged negative anomaly of summer accumulation (Fig. 4b).
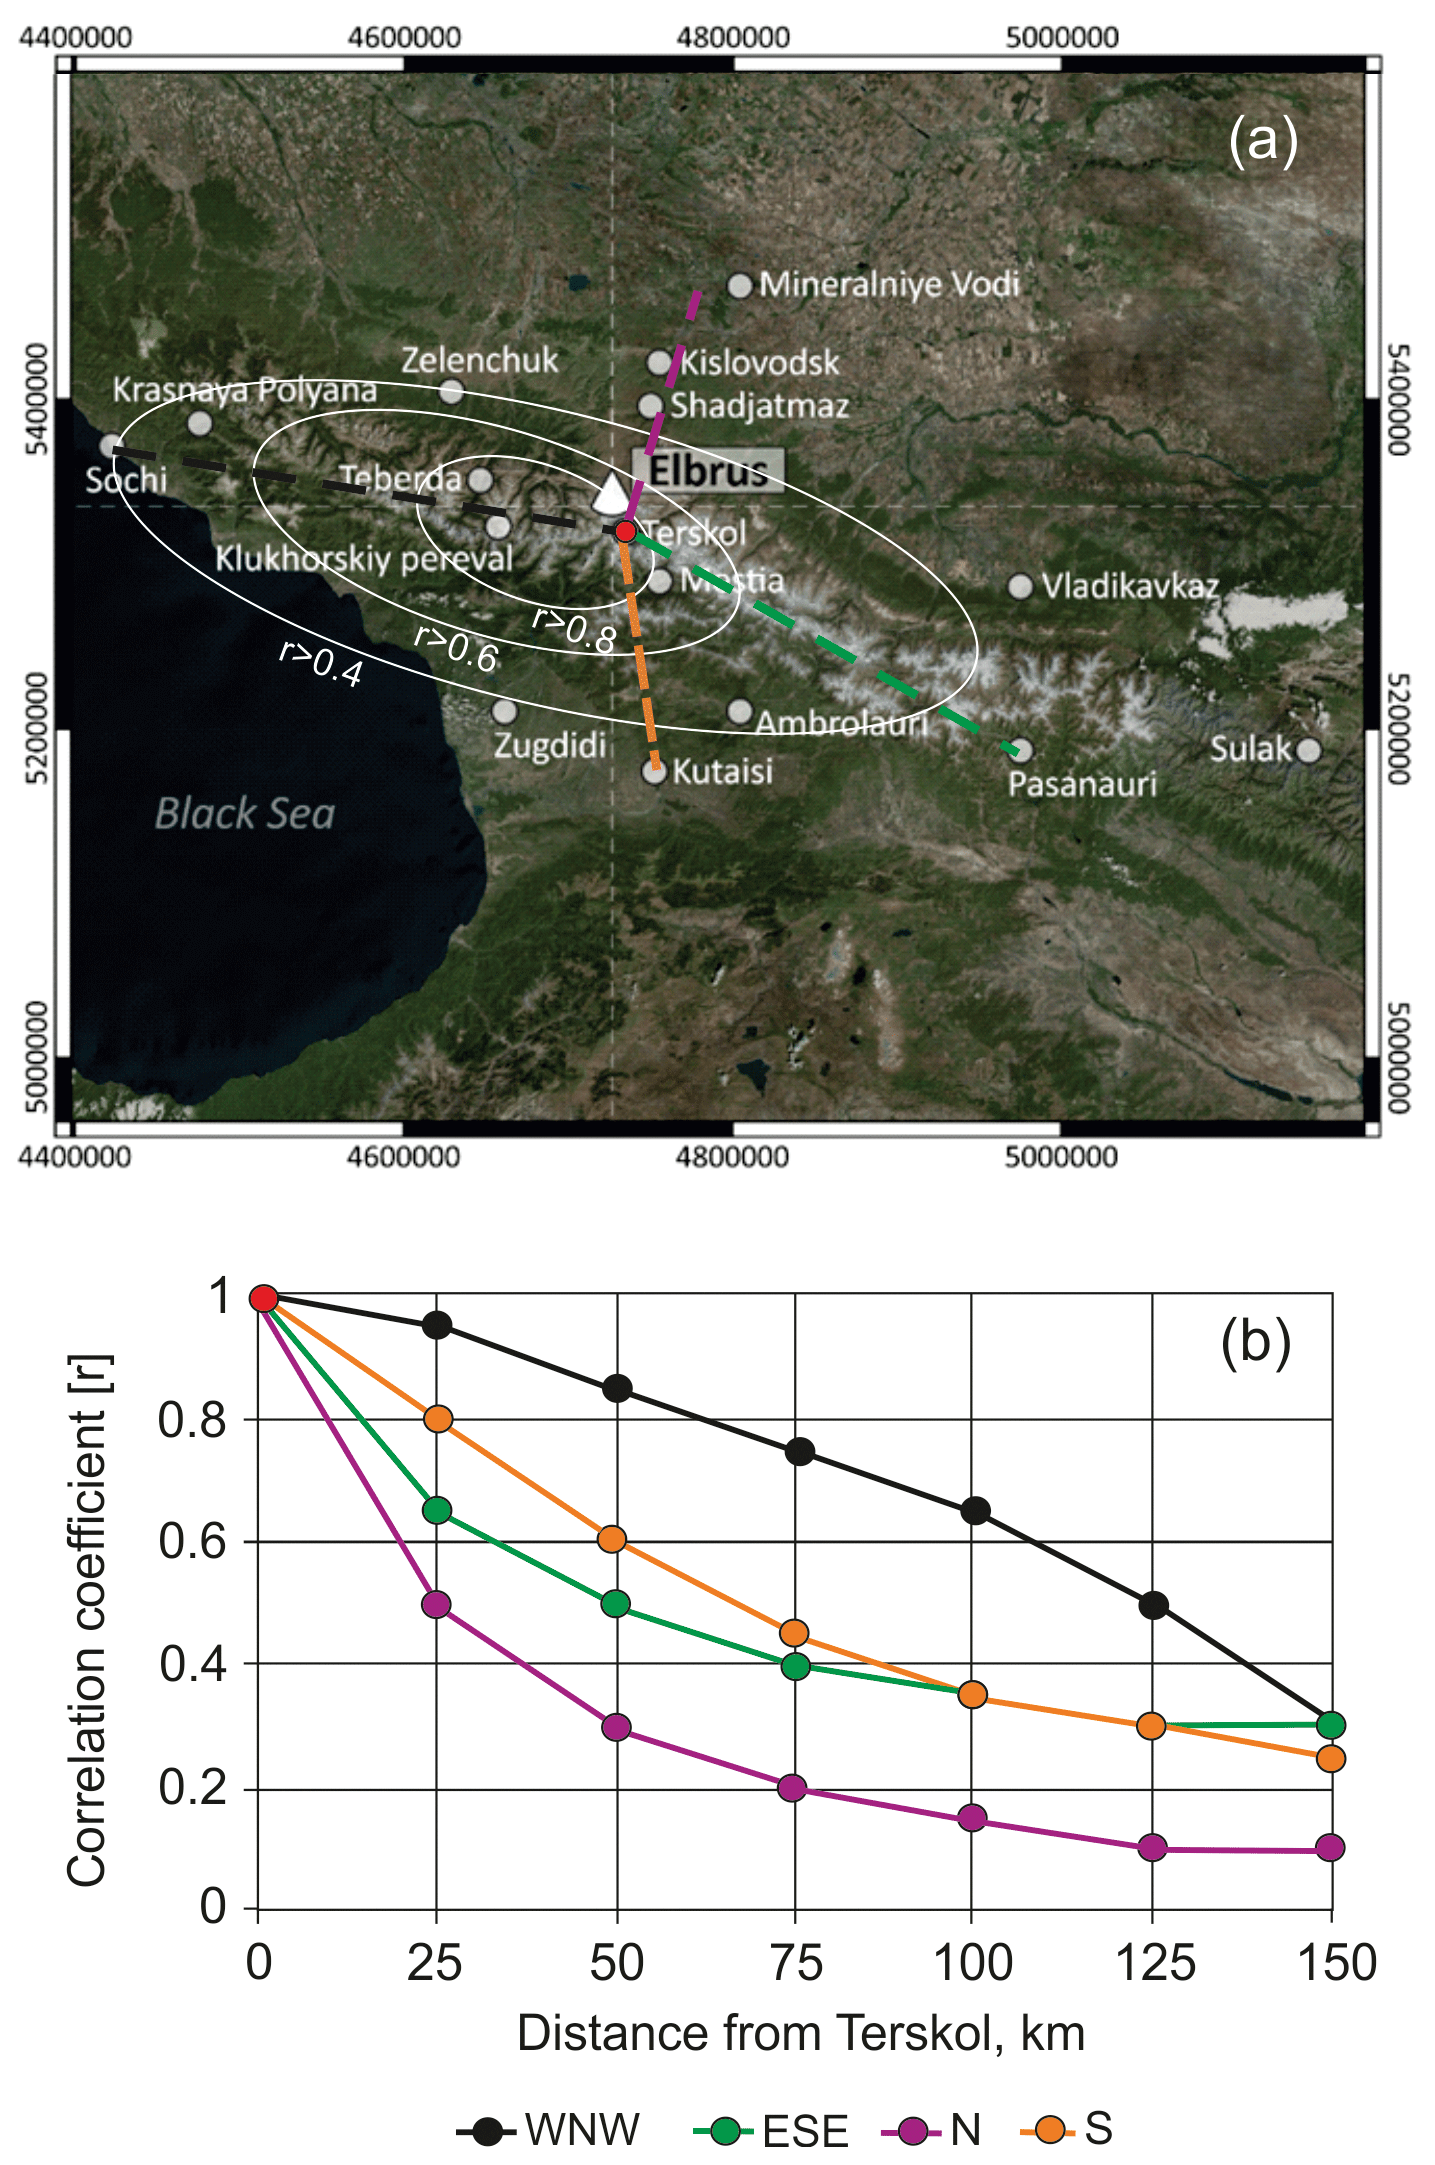
Figure 5Spatial correlation function of the annual precipitation calculated relative to the Terskol meteorological station (red dot) (a): isolines of correlation coefficients calculated according to Student's t test are given by white lines, and dashed lines indicate the profiles for which the correlation function was calculated. Correlation function values along these profiles are shown in (b). ArcGIS World Imagery Basemap used as the background. Source: DigitalGlobe.
3.2 Comparison with meteorological data
3.2.1 Spatial distribution of precipitation in the North Caucasus
The interpretation of the reconstruction of accumulation relies on a comparison with meteorological information gathered during the period of instrumental observations, utilizing weather station data, global precipitation datasets, and reanalyses. This comparison enables us to assess the accuracy of annual and seasonal accumulation amounts, as well as to determine the area where this reconstruction holds significance for different timescales. Additionally, we can establish the statistical and physical relationship between resulting accumulation and precipitation amounts while mitigating the potential impact of confounding factors such as wind drift, avalanche supply, evaporation, and sublimation rates.
The spatial correlation function for the observed annual precipitation amount was calculated relative to the Terskol meteorological station closest to the drilling site. The spatial distribution of the normalized correlation coefficients between the series of annual precipitation in Terskol and at other stations in the Caucasus is shown in Fig. 5.
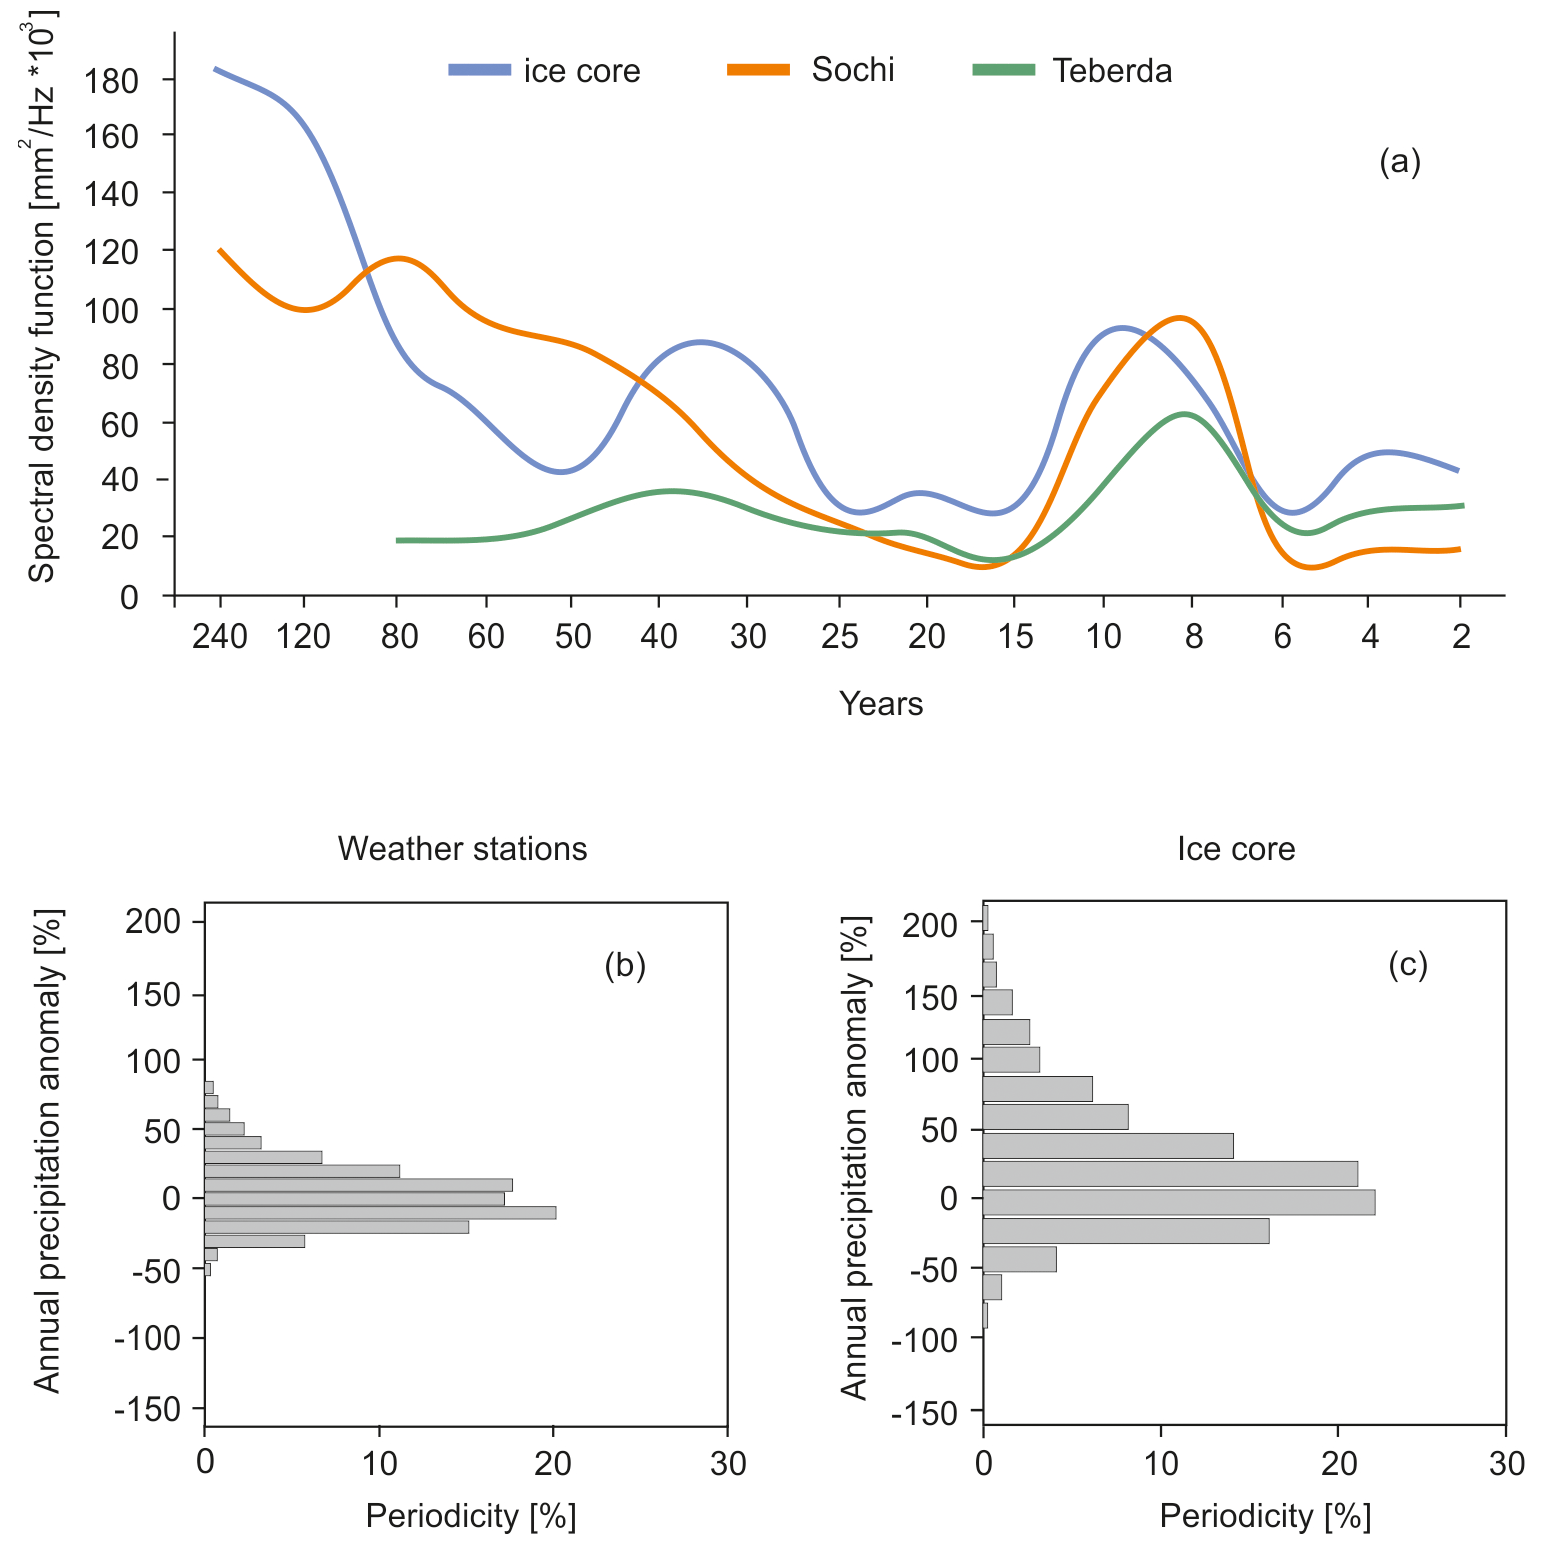
Figure 6Statistical analysis of the data time series on the longest-range weather stations and ice cores: (a) spectral analysis of the series; (b) empirical distribution function of annual precipitation anomalies compared with the period 1951–1980, averaged between data from the longest-row weather stations Sochi and Teberda; and (c) empirical distribution function of the annual precipitation anomaly on the western Elbrus plateau according to ice core data compared with the period 1951–1980
The significance of the normalized correlation coefficient was assessed using Student's t test with a threshold value of 0.4. Figure 5 demonstrates that the precipitation field in the Caucasus is significantly isotropic, with correlation coefficient isolines appearing as elliptical shapes stretching along the Greater Caucasus. The correlation radius is larger in the west–northwest direction owing to the influence of western air mass transport and the Black Sea, compared with the east–southeast, south, and north directions, as moisture-bearing air masses rarely reach the Greater Caucasus from the north. Consequently, annual year-to-year variability in precipitation in the northern foothills may differ from the precipitation in the high-mountain regions of the Caucasus. Despite the challenging orographic conditions, the radius of statistically significant correlation of annual precipitation (r > 0.4) measured at the weather stations encompasses the majority of the western and central Caucasus. Similar findings were reported by (Tashilova et al., 2019). The highest correlation (r ≥ 0.8) occurs within an area of 10–50 km.
Statistical analysis of long-term series of annual precipitation (at Sochi and Teberda) and reconstructed accumulation on WP reveal high similarity of empirical distribution functions (Fig. 6), which are asymmetric log-normal distributions (Fig. 6b and c) shifted towards positive anomalies and decreasing sharply towards negative ones. The median value corresponds to a positive anomaly of 10 %–15 %, which is typical for time series of precipitation. The root mean square (RMS) deviation of both precipitation and reconstructed accumulation is approximately 20 %, which is typical for annual precipitation in temperate climatic zones. The range of variability in precipitation anomalies, based on averaged weather station data, ranges from a decrease of 50 % to an increase of 80 %. Ice core records show slightly larger range of variability. This difference can be attributed to the length of the ice core data, which spans 260 years, significantly longer than the longest continuous meteorological records (since 1875 CE at Sochi). Consequently, the ice core data capture the full range of precipitation variability in the Caucasus.
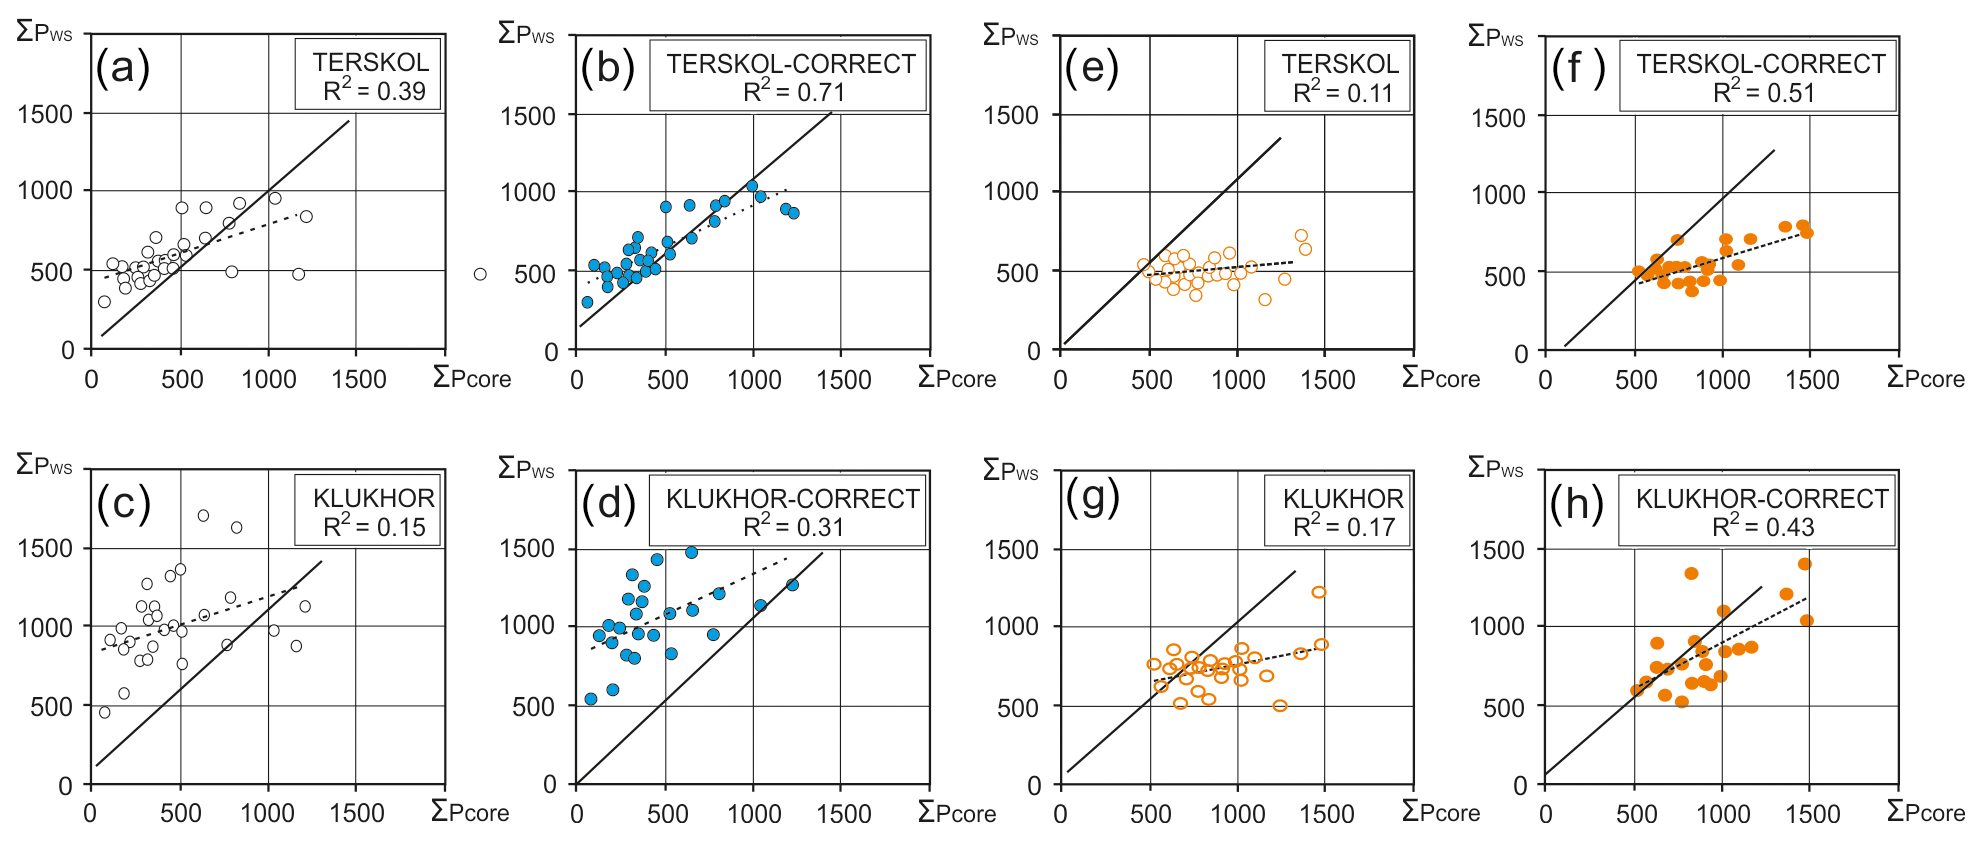
Figure 7Regression relationships between the accumulation layer on the western Elbrus plateau (∑ Pcore, in mm) and precipitation amounts at the nearest weather stations (∑ PWS, in mm) during 1979–2009: (a–d) for the cold season (a, c for October–March and b, d for the cold period highlighted by CAPE value thresholds); (e–h) for the warm season (e, f for April–September and g, h for the warm period highlighted by CAPE values).
Spectral analysis showed that according to the accumulation data and the results of meteorological observations, the statistically significant peak of the spectral density function for all data series (ice core, Sochi, and Teberda) falls on a period of 8–10 years and 30–40 years. The second period is close to the characteristic scale of the North Atlantic Oscillation (NAO) and Atlantic Multi-decadal Oscillation (AMO) index fluctuations. The similarity of the distribution functions and spectral density from the data of weather stations and ice core records indicates that accumulation at Elbrus is primarily related to precipitation and not significantly affected by post-depositional factors (melting, wind erosion, etc.). At least for temporal averages > 5 years, the reconstructed record is dominated by the precipitation signal.
3.2.2 Seasonal accumulation
Over the past 47 years, the period of summer identified by CAPE typically spans from 1 May to 10 October, which nearly aligns with the hydrological year. However, our calendar displays considerable interannual variability (Table S2). The earliest sustained transition through 300 J kg−1 occurred on 1 April 2008, while the latest was on 27 May 2003. The earliest transition to winter convective instability took place on 17 September 1986 and the latest on 1 November 2005. The minimum period with steady CAPE > 300 J kg−1 was 135 d (in 2010), the maximum was 200 d (in 1995 and 2005), and the average was 164 d. The distribution of the warm period's duration by CAPE is close to normal, but at the 2σ level, the deviation is ± 1 month. Therefore, accounting for this factor in determining seasonal precipitation amounts is critical. Figure 7 displays regression relations of the accumulation reconstructed from the core with precipitation amounts at the nearest weather stations before and after the use of the CAPE calendar.
It is well seen that the R2 in the relations between precipitation and accumulation in the ice core when considering CAPE dates increases and become statistically significant (more than 0.4; p < 0.001). This indicates that accounting for the role of free convection significantly improves the relationship between accumulation on the WP and precipitation measured at weather stations. The improvement is most significant for the winter season. This is due to the greater spatial homogeneity of the precipitation field in the cold half of the year, which is expressed in larger values of the radius of significant correlation. In summer, likely due to a significant contribution of local convective precipitation, the improvement is not so significant. To facilitate further analysis, we have defined the cold period as the period from October to March and the warm period as the period from April to September.
3.2.3 Comparison with gridded data
Spatial comparison with the gridded GPCC v2020 0.25 precipitation dataset revealed a statistically significant correlation for both seasons between ice core accumulation and precipitation estimates (Fig. 8). Summer accumulation moderately correlates with precipitation observations over Ukraine, southern Russia, and the Black Sea. Winter accumulation shows an even stronger correlation with gridded datasets over the entire Black Sea region and North Caucasus. We also found a strong correlation between winter snow accumulation at the WP and observed (GPCC) March precipitation over the North Caucasus, with the highest coefficients (0.5) concentrated close to Elbrus (Fig. S9). According to Terskol weather station data, around 30 % of the December–March precipitation falls in March, which is likely reflected in the higher share of March snow in cold season accumulation recorded at WP.
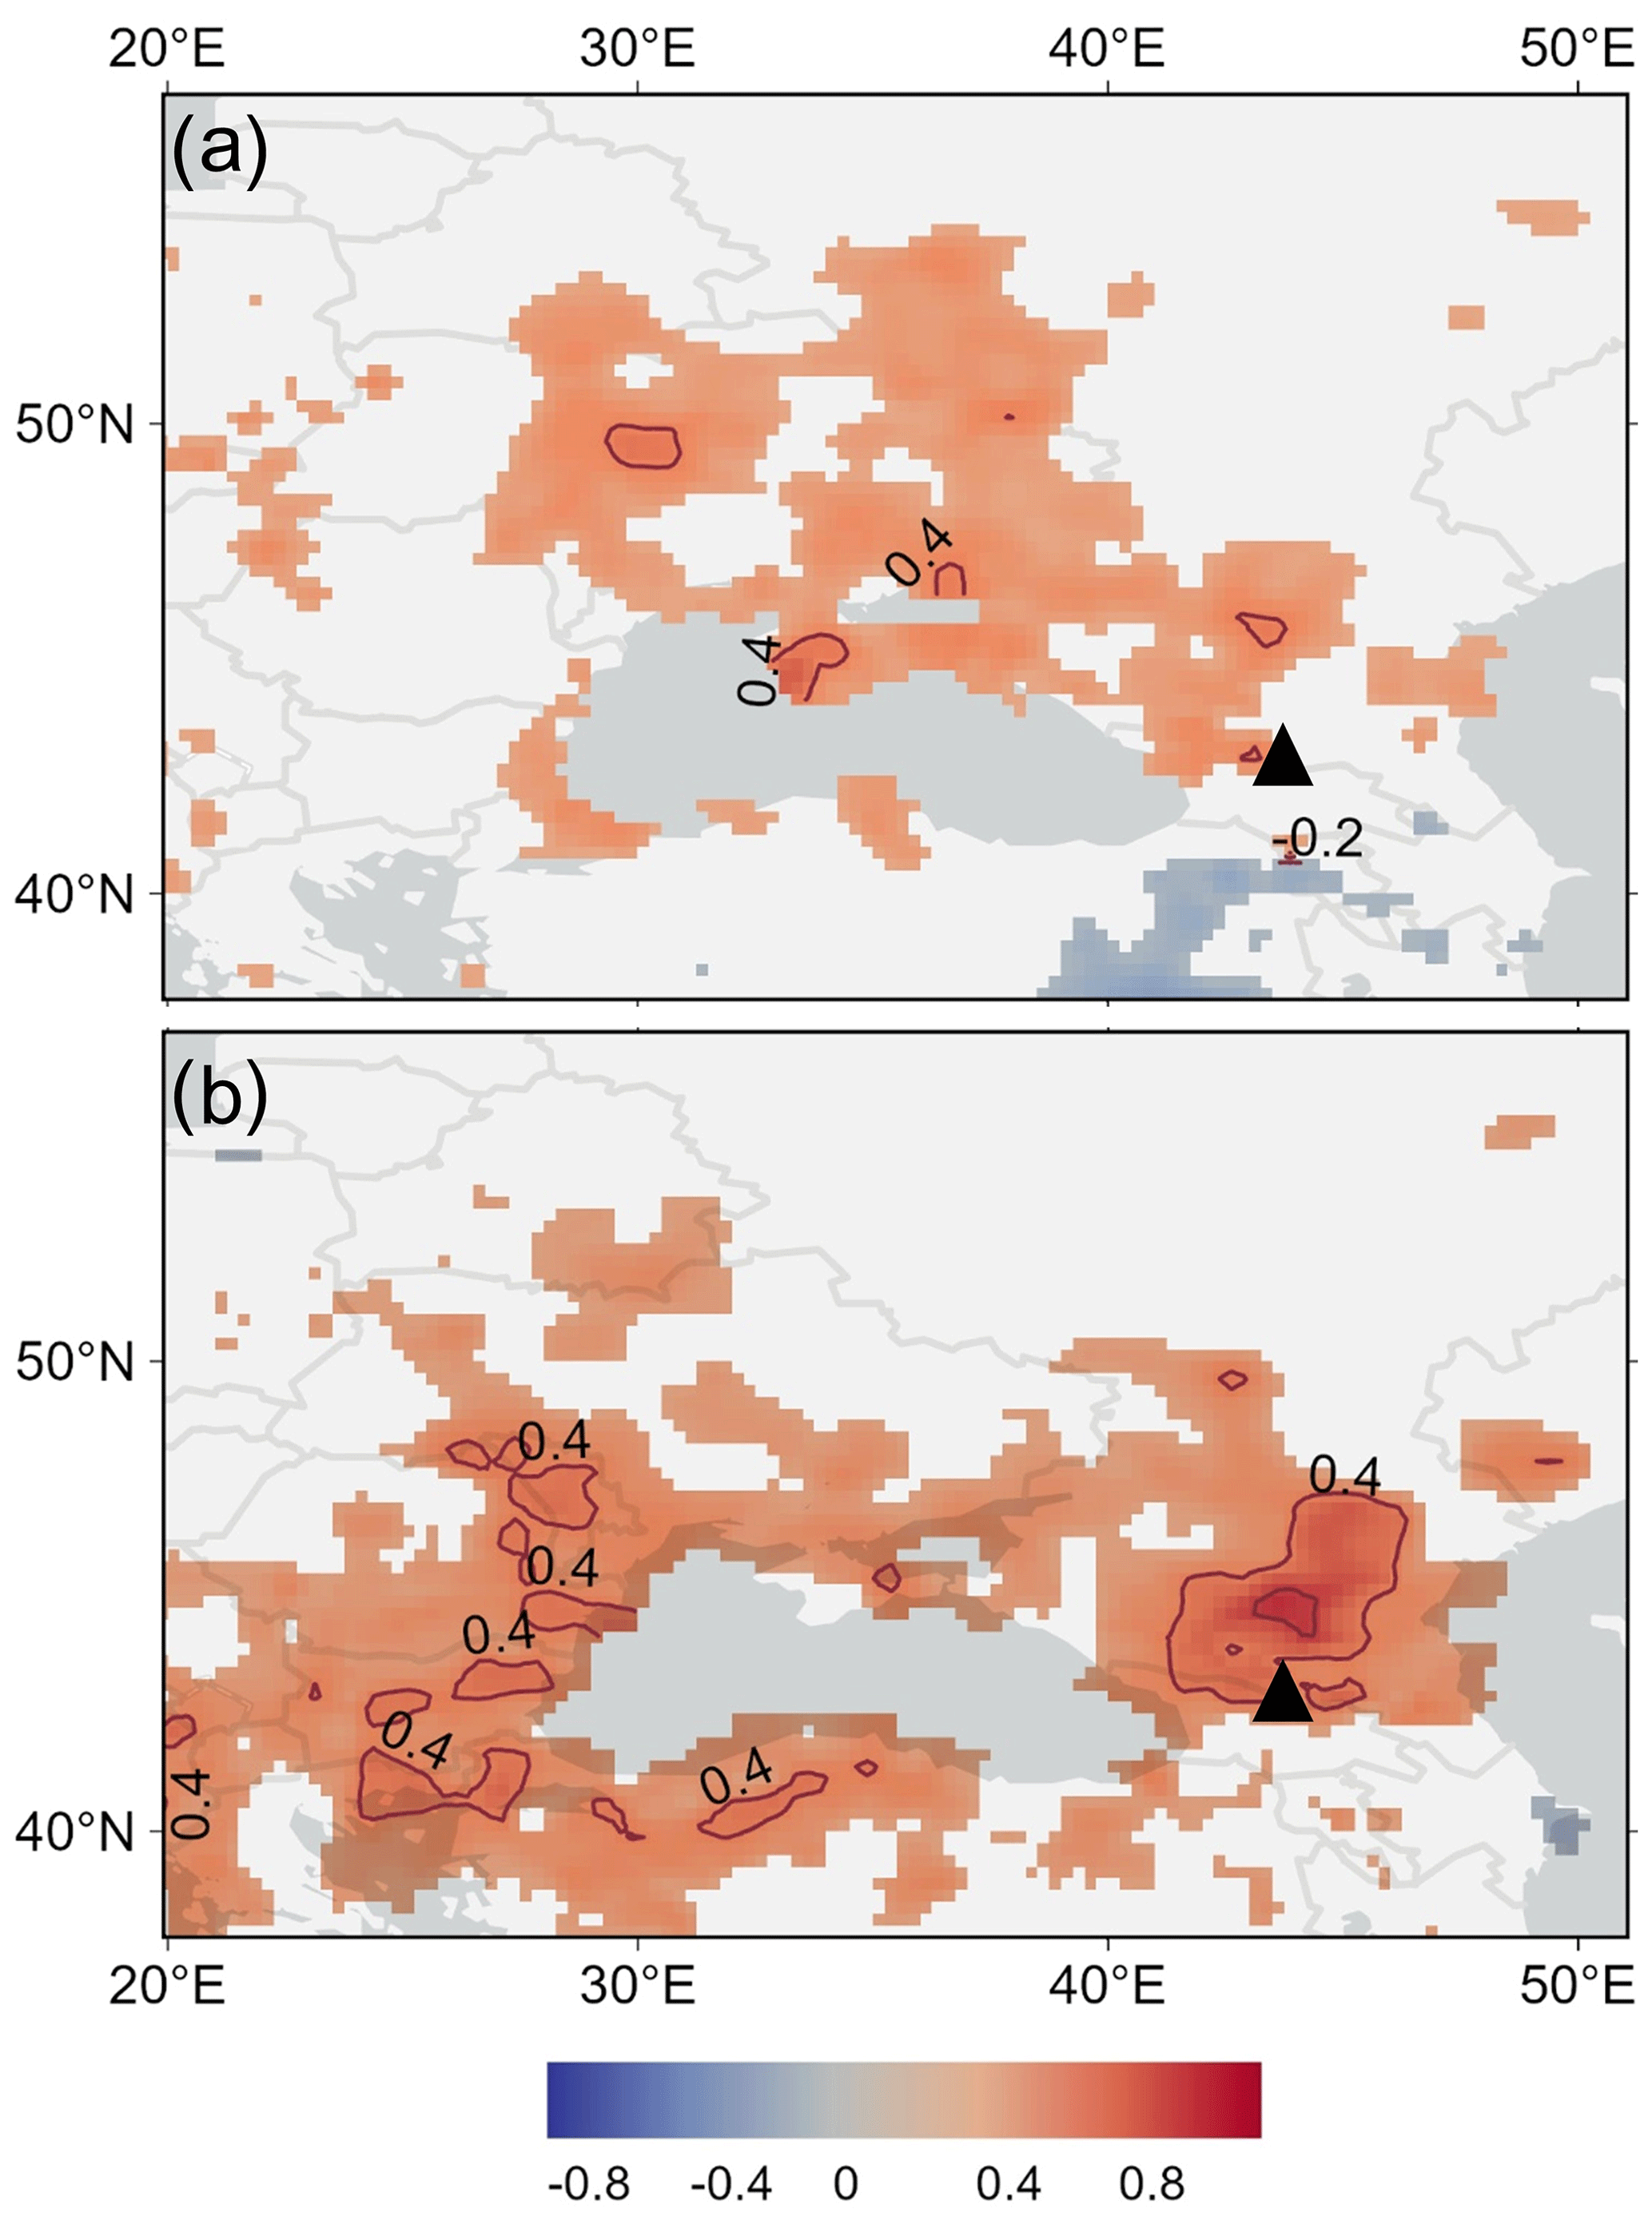
Figure 8Spatial correlation of the summer (a) (April–September) and winter (b) (October–March) accumulation with precipitation data from the GPCC v2020 dataset for 1950–2009. The location of Mt. Elbrus is shown by a black triangle.
The correlation between seasonal accumulation and gridded precipitation data GPCC v2020 0.25 remains below 0.4 for the majority of the territory. However, during the cold period in a substantial area of the North Caucasus steppe zone, the correlation significantly exceeds 0.4, reaching values ranging from 0.6 to 0.65.
Analysis of spatial correlation of gridded precipitation data and meteorological measurements at Terskol station further support our interpretation of the ice core record. Monthly correlation fields show that precipitation pattern is more homogeneous in autumn and winter, and area of correlation expands from Eastern Europe to Turkey and southern Russia. In summer (May–August) the average correlation radius is reduced to only 100–200 km. Ice core data captured these patterns. A plausible explanation for the strong correlation observed between winter accumulation on the WP and precipitation levels in the foothill areas of the North Caucasus could be attributed to the relatively frequent occurrence of orographic occlusion (Mikhalenko, 2020). This meteorological phenomenon arises when a wave of cold temperate or Arctic air interacts with the Caucasus Mountains. It commonly transpires in the rear sector of Mediterranean or Black Sea cyclones, or behind an Atlantic vortex that has shifted from Scandinavia to the Volga region. The presence of the Caucasus ridges impedes the progress of cold air, causing it to circumnavigate the mountains from the direction of the Black and Caspian seas, thereby saturating the Transcaucasus region. Consequently, the warm and moist air is forced upwards towards the mountains, leading to an extended release of moisture. During summer, this process often manifests in the formation of localized cumulonimbus clouds, while in winter, it results in substantial frontal precipitation across a significant expanse. These dynamics are most pronounced in the high mountain zone and the foothill areas of the central Caucasus, offering an explanation for the correlation observed between winter accumulation on the WP and precipitation in the steppe regions of the northern foothills.
3.3 Comparison with climate indexes
In many parts of Europe, quasi-decadal variations in atmospheric precipitation are associated with the internal nonlinear dynamics of the climate system. This is reflected in the interannual variability in indices such as NAO, AMO, East Atlantic/Western Russia teleconnection pattern (EA/RW), and others in temperate latitudes (e.g. Trigo et al., 2002; Hurrell and Deser, 2009; López-Moreno et al., 2011; Ionita, 2014; Fuentes-Franco et al., 2023).
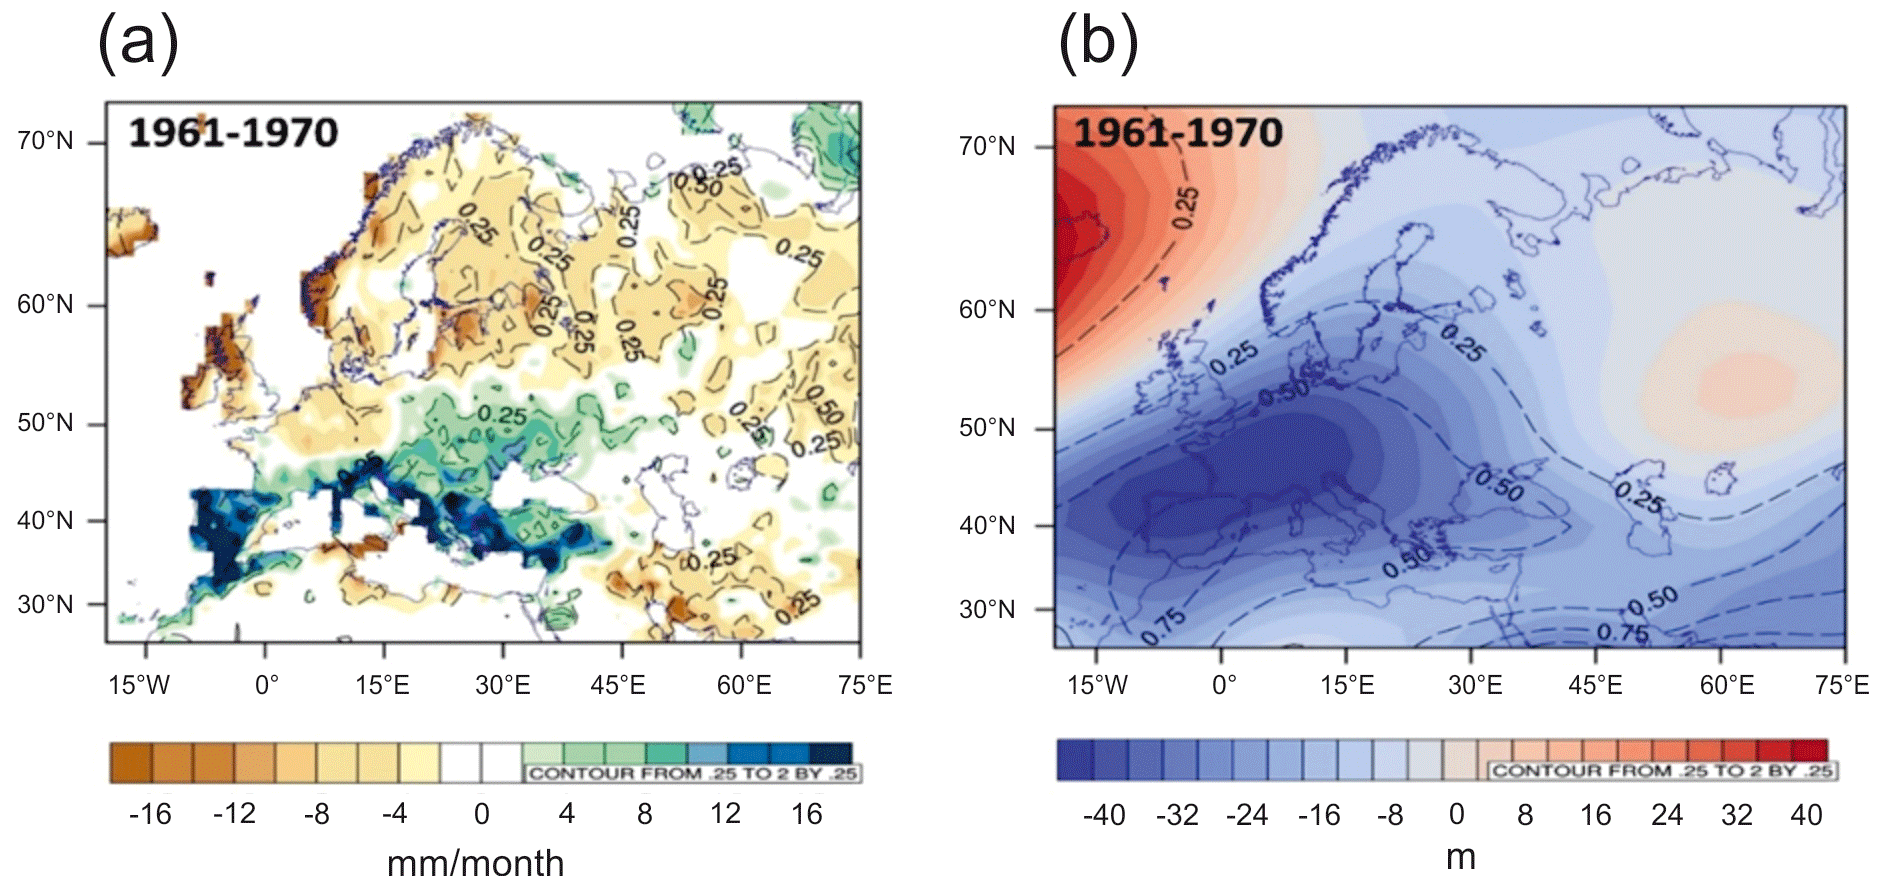
Figure 9Average winter precipitation anomalies of 1961–1970 (GPCC) compared with 1981–2010 (a) and average 500 hPa isobaric surface height anomalies (NCEP/NCAR) (b).
Negative NAO values often correspond to a weakening of cyclogenesis over Iceland and the formation of anticyclones over northern Europe, which is atypical for the North Atlantic. As a result, cyclogenesis at the polar front over the Mediterranean and Black seas becomes more active, leading to positive precipitation anomalies in the Caucasus. Such a large-scale circulation anomaly and the negative phase of the NAO and AMO prevailed during the cold seasons of 1960–1970. The positive winter precipitation anomaly recorded in the WP ice core reflects the large-scale pattern of precipitation anomalies. In 1960–1970, a pronounced region of statistically significant precipitation anomalies covered the whole of the Mediterranean and most of the southern part of Eastern Europe. The value of anomalies reached 15–20 mm per month or 20 %–30 % of the seasonal amount for the period October–March (Fig. 9a). They corresponded to predominantly negative geopotential anomalies in the middle troposphere, particularly over western Europe (Fig. 9b). Northern Europe experienced an extensive precipitation deficit due to a pronounced positive geopotential anomaly over the North Atlantic.
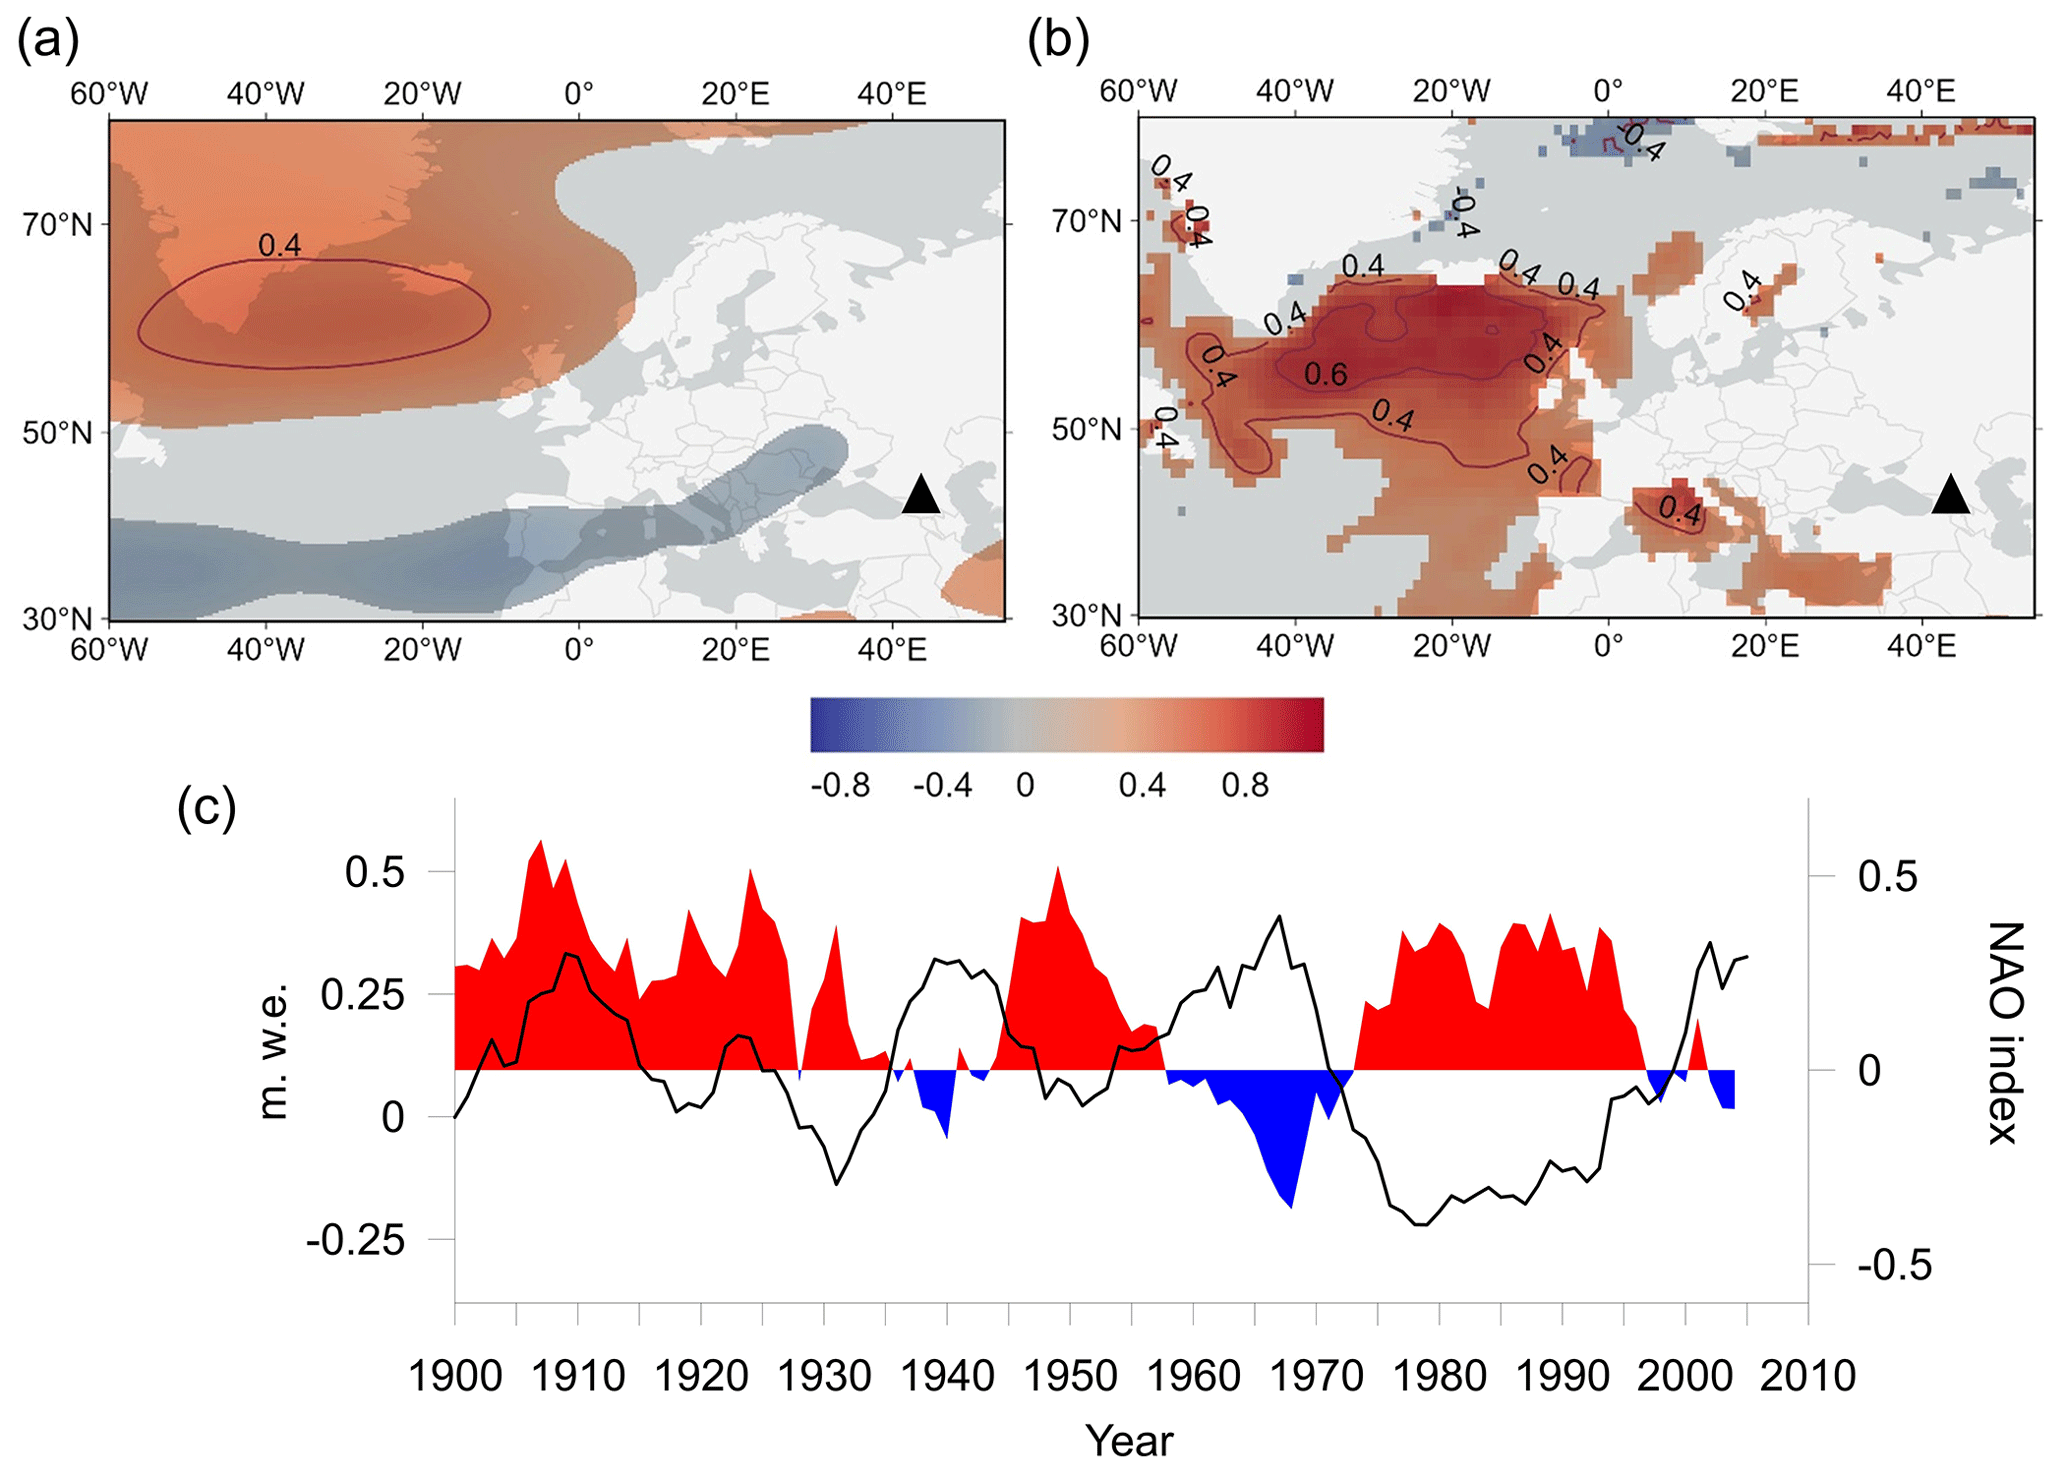
Figure 10Spatial correlation of the detrended winter (October–March) annual accumulation at WP with ERA5 500 mb geopotential height data (a) and sea surface temperature (HadlSST1) data of 1950–2009 (b). The 10-year moving average of winter NAO (October–March) and detrended ice core winter accumulation anomalies (c). The location of Mt. Elbrus is shown by a black triangle (a, b).
The influence of the North Atlantic circulation on the cold season precipitation over the region is highlighted by the correlation of the WP winter accumulation with the sea surface temperature and geopotential height anomalies over the North Atlantic (Fig. 10a and b). For the cold period (October–March) of 1925–2009, the 10-year moving averaged WP accumulation anomalies show a statistically significant negative correlation with the NAO index (r = −0.74, p < 0.001) (Fig. 10c).
A relationship between precipitation regime and the NAO index has been shown in previous studies (Deser et al., 2017; Vicente-Serrano and López-Moreno, 2008), particularly during winter months. Positive correlation coefficients between NAO and precipitation sums are characteristic for northern Europe, while negative correlations are observed for the Mediterranean region and southern Europe, which is also evident in our case. Furthermore, a statistically significant inverse relationship between winter precipitation and the NAO index in Turkey was revealed in the study by Türkeş and Erlat (2005), with a coefficient of −0.4 over a significant portion of the territory. The substantial role of NAO in shaping the precipitation regime of southern Europe and Turkey was also demonstrated using global circulation models for 15 mountainous areas in the Mediterranean in the work by (López-Moreno et al., 2011).
Opposite to the last ∼ 80 years where the correlation is negative, a moderate positive correlation between NAO and accumulation in the cold season was found for the earlier period from 1880 to 1925 (r = 0.6, p < 0.001). This period is also characterized by increased summer accumulation and generally high annual precipitation variability. The variation of the correlation between the reconstructed accumulation for Elbrus and the NAO index is in line with previous findings of instabilities in the connection of precipitation and large-scale atmospheric circulation at decadal timescales observed over southern and central Europe (Pauling et al., 2006).
We did not find any significant relationships between summer accumulation records and climate indexes. In summer, the NAO is significantly weaker due to the greater role of mesoscale processes in the formation of seasonal precipitation, as well as the proximity of the Black Sea. In particular, the increase in precipitation and the related rise in summer accumulation during 2000–2009 may be a response to the increase in sea surface temperature in the eastern part of the Black Sea which could be a cause of the observed precipitation increase in southern Russia (Aleshina et al., 2018). The role of positive sea surface temperature anomalies in the Black Sea in the formation of synoptic situations leading to extreme precipitation in the Western Caucasus is clearly demonstrated in the study by (Meredith et al., 2015). Additionally, the increase in summer accumulation in the first decade of the 21st century is generally consistent with the overall positive trend of convective precipitation (Chernokulsky et al., 2019).
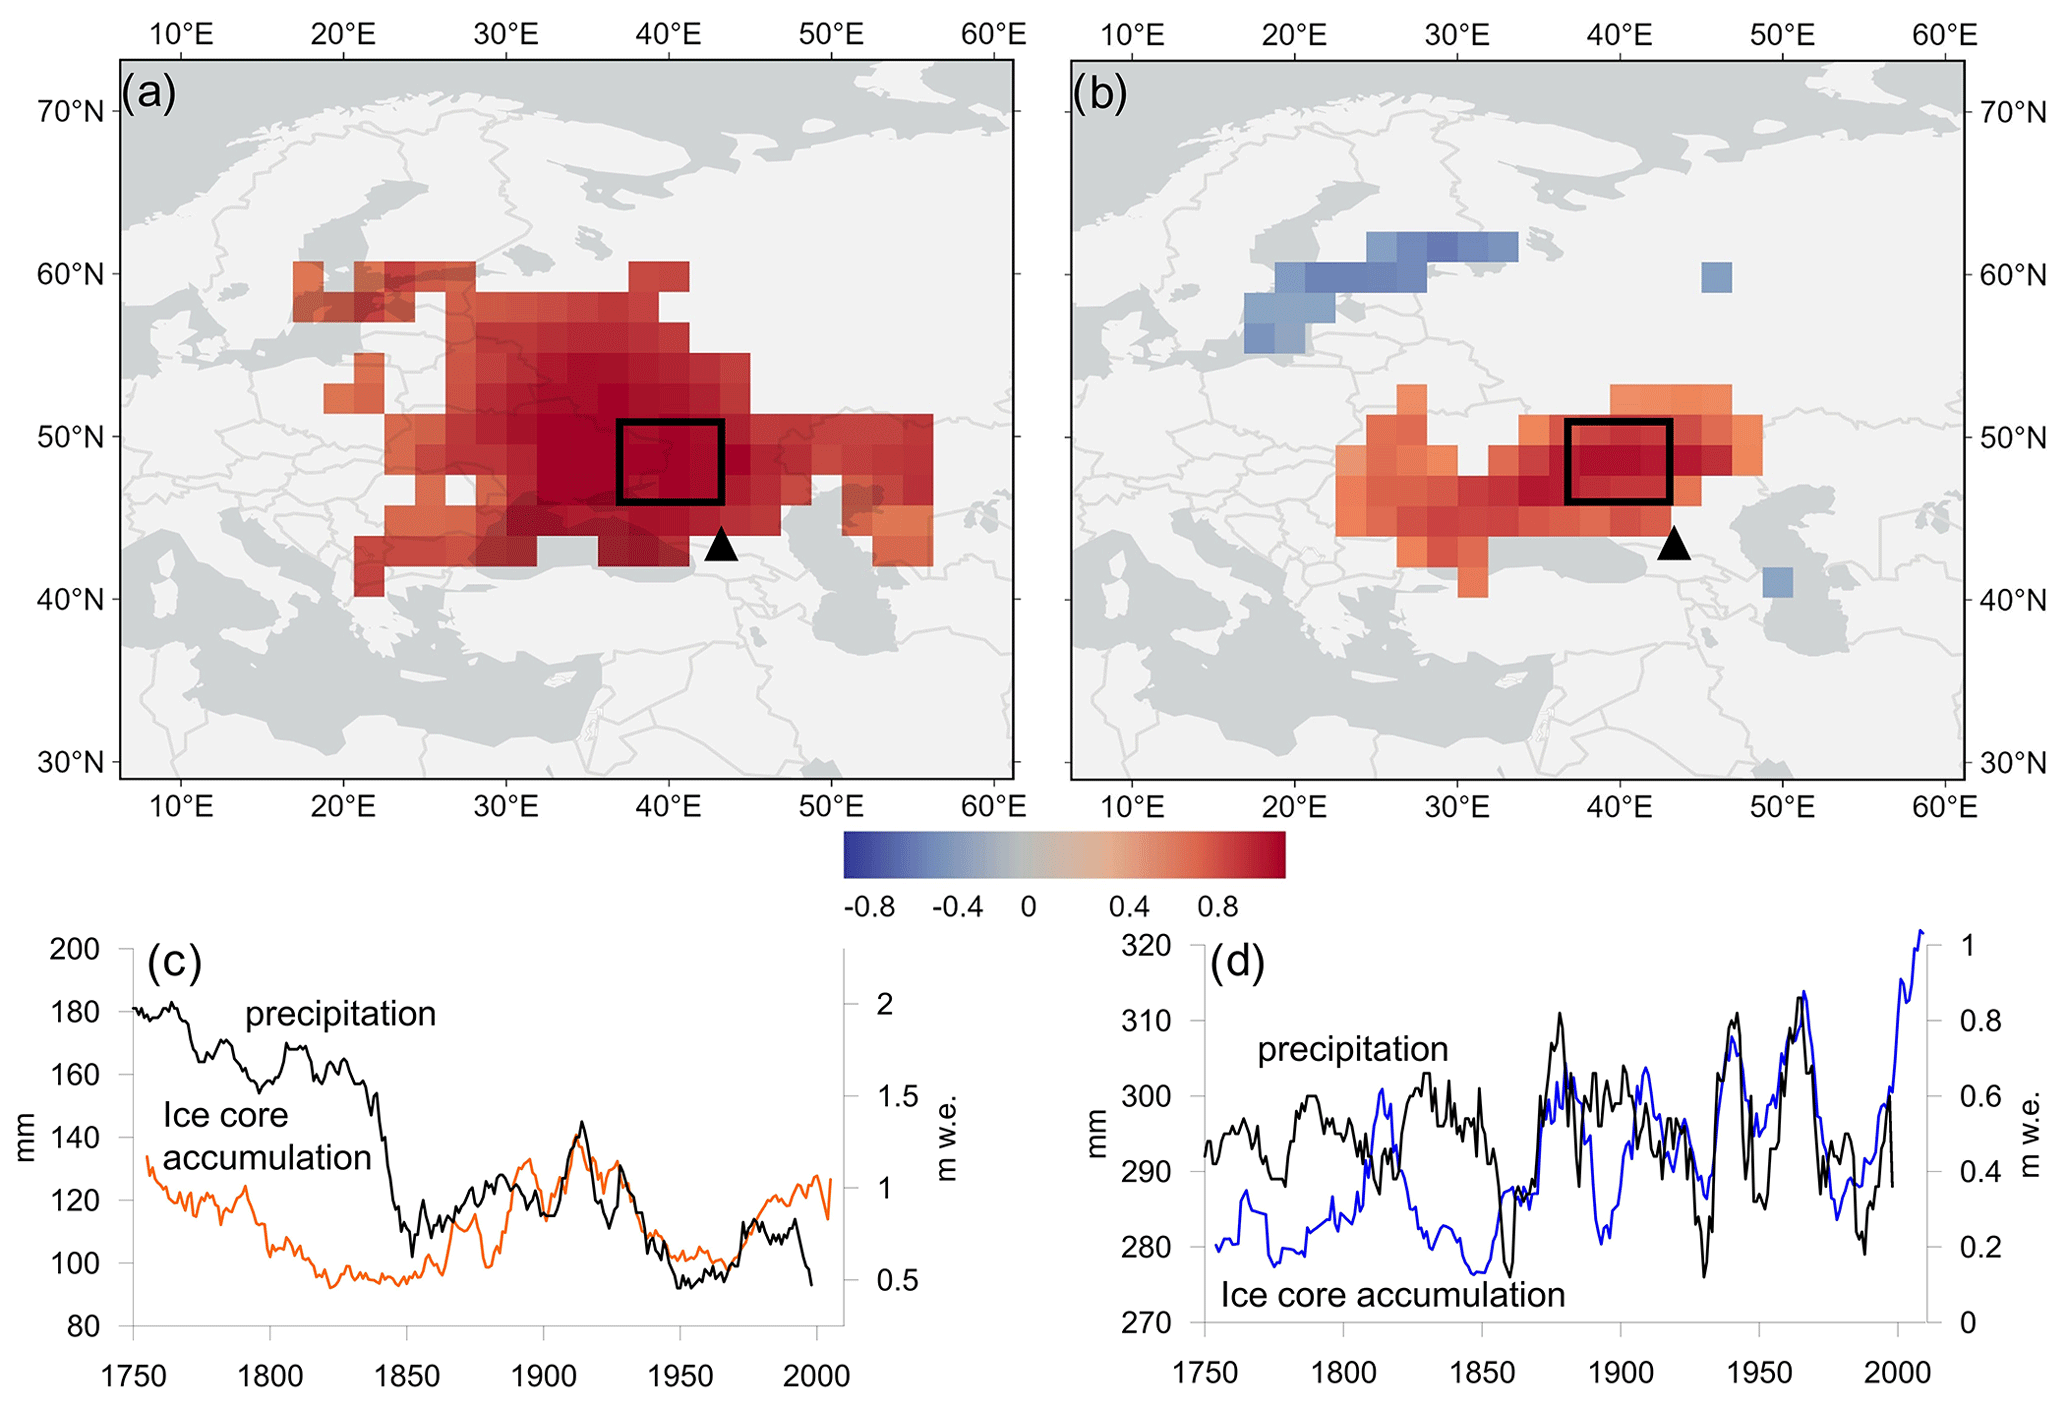
Figure 11Spatial correlation of the 10-year moving average of summer (a) (April–September) and winter (b) (October–March) WP accumulation with EK400v2 paleo-reanalysis ensemble mean precipitation data over 1900–2003. Time series of the precipitation data averaged over the area are indicated by the black box (a, b) for summer (c) and winter (d) shown together with WP accumulation data. The location of Mt. Elbrus is shown by a black triangle (a, b).
Our findings suggest that heat transport in the North Atlantic is of critical importance in determining the precipitation regime in cold season over the Black Sea and North Caucasus.
3.4 Comparison with paleo-records
Several estimates of past precipitation were published for the Caucasus region. Martin-Benito et al. (2016) reconstructed May–June precipitation in Transcaucasia since 1752 based on the tree ring width. Their reconstruction explains 51.2 % of the variability in instrumental data. Verhaegen et al. (2020) used this reconstruction to calculate the annual amount of precipitation in Terskol. The analysis of precipitation frequency, magnitude, and seasonality, as well as the source areas and trajectories of the air masses involved in the Colchis lowland and near Mt. Elbrus, reveals substantial differences in the precipitation regimes of these regions. Tree-ring-width-based reconstruction of spring (April–July) precipitation in Crimea over 1620–2002 was published (Solomina et al., 2005). The reconstruction accounts for 37 % of the variance in observed precipitation over 1896–1988, although the difference in season duration does not allow the direct comparison with WP accumulation record.
We compared WP accumulation reconstruction with the available monthly resolved paleo-reanalysis EKF400 version 2 with a 2∘ × 2∘ resolution, covering the period 1603–2003 (Valler et al., 2022). In the EKF400 version 2, the Kalman filtering technique was utilized to couple an ensemble of atmospheric general circulation models for assimilating early instrumental observations of temperature, surface pressure, and precipitation, in addition to temperature indices derived from historical documents and tree ring measurements that are sensitive to temperature and moisture.
We observed a robust correlation between 10-year averaged summer and winter accumulation data and precipitation data from the EKF400 version 2 (Fig. 11). The region exhibiting a stronger correlation is situated to the south of the Eastern European plain for both summer and winter seasons, which is consistent with the pattern observed for the spatial correlation analysis in Figs. 8 and S10. This correlation remains consistently strong throughout the instrumental observational period since 1850. However, prior to 1850, the datasets do not align. The summer paleo-precipitation records for the region display a strong negative trend, with a sharp decrease from 170 mm yr−1 (1750–1830) to ∼ 120 mm yr−1 (after 1830). Other records do not support such sharp change in precipitation and moisture neither in Eastern Europe (Nagavciuc et al., 2022) nor in the eastern Mediterranean (Touchan et al., 2005). Similarly, winter records before 1850 also display discrepancies. These discrepancies may be attributed to a higher uncertainty in the ice core winter accumulation record, as well as a reduction in the number of observations included in the EKF400 v.2 dataset. The WP accumulation record effectively captures the decadal and long-term variability for a larger region during both summer and winter seasons.
The most recent little ice age glaciation maximum was observed in the Caucasus in the middle of the 19th century and is well reflected in the dendrochronological data from this region. The general glacier retreat in the North Caucasus began in the late 1840s, which was interrupted four times during 1860–1880, as well as in the 1910s, 1920s, and 1970s–1980s (Solomina et al., 2016). According to our results, the period of glacier retreat was preceded by a long period of negative precipitation trend in summer, which was accompanied by an increase in summer temperature, reconstructed from the tree ring widths (Dolgova, 2016). The period of short re-advances at the end of the 19th century coincide with several intervals of increased summer and winter accumulation. The recent increase in both summer and winter accumulation, despite the continued rise in air temperature, caused the positioning of glacier fronts and their minor advance in the 1970s and 1980s (Solomina et al., 2016).
The primary driver of climatic changes during the late 18th and 19th centuries was the natural quasi-decadal variability in the thermohaline ocean circulation. The summer temperatures reconstructed for the Caucasus using tree rings are strongly correlated with AMO oscillations (Dolgova, 2016). Our findings support the role of North Atlantic oscillations, not only in temperature but also in precipitation levels in this region especially during winter seasons.
The ice core retrieved from Mt. Elbrus was dated back to 1750 using annual layer counting, with a focus on high-resolution oscillations of ammonium and succinic acid. A new depth–age scale was established by reference horizons associated with known volcanic eruptions. The high accumulation rate and sampling resolution of the ice core facilitated the identification of both annual and seasonal layers. The reconstructed accumulation with the process of layer thinning and the upstream effect accounted for allowed for a meaningful comparison with meteorological data.
To distinguish between winter and summer seasons in meteorological data, a method based on convective available potential energy was applied, resulting in a significant improvement in detecting annual and seasonal precipitation. Comparisons of the distribution functions and spectral density of annual precipitation between meteorological stations in the Caucasus and ice core records provided clear agreement, validating the reconstructed data as representative of precipitation.
The comparison between the obtained ice core accumulation record from WP and gridded precipitation datasets, as well as paleo-reanalysis data, revealed that the accumulation record represents the precipitation regime on decadal and long-term timescales in a larger region encompassing the North Caucasus, Black Sea, and southeastern Europe.
Variations in precipitation were identified with periodicities of 20 and 40 years, corresponding to the typical quasi-decadal variability associated with North Atlantic thermohaline circulation oscillations. Statistically significant relationship was observed between ice core accumulation pattern and fluctuations in the NAO. Similar variations were found in dendrochronological data on air temperature anomalies in the Caucasus, which aligned with the AMO index. This study supports the hypothesis that the quasi-decadal variations in the temperature–moisture regime in the Caucasus have an oceanic nature.
Accumulation reconstruction data are presented in the Supplement (Table S3) and can be accessed through the NOAA/WDS-Paleo archive (https://www.ncei.noaa.gov/access/paleo-search/study/38761, NCEI environmental Data Center, 2024).
Reanalysis ERA5 data are available at the European Centre for Medium-Range Weather Forecasts (ECMWF), Copernicus Climate Change Service (C3S) at Climate Data Store (CDS; https://cds.climate.copernicus.eu/cdsapp#!/home, CDS, 2024) and GPCC data are available at https://psl.noaa.gov/data/gridded/data.gpcc.html (NOAA, 2024). Ensemble Kalman Fitting Paleo-Reanalysis version 2.0 (Franke et al., 2020) is available at https://doi.org/10.26050/WDCC/EKF400_v2.0.
The supplement related to this article is available online at: https://doi.org/10.5194/cp-20-237-2024-supplement.
The paper was written by VM and SK with contributions from PT, ML, GC, and SeS. The ice core chemistry records were produced by SP and ML. The water isotope measurements were made by AK and VL. The layer-counted timescale was developed by ML, SP, SK, MV, and AK. Volcanic identification and synchronization to timescale were performed by ML and SP. Seasonal snow accumulation distribution was estimated by IL. GC calculated backward ice flow trajectories. SeS constructed the thinning function. Interpretation of the accumulation rate history was performed by SK, VM and PT. All the authors read and discussed the manuscript and contributed to improving the final paper.
The contact author has declared that none of the authors has any competing interests.
Publisher's note: Copernicus Publications remains neutral with regard to jurisdictional claims made in the text, published maps, institutional affiliations, or any other geographical representation in this paper. While Copernicus Publications makes every effort to include appropriate place names, the final responsibility lies with the authors.
This article is part of the special issue “Ice core science at the three poles (CP/TC inter-journal SI)”. It is a result of the IPICS 3rd Open Science Conference, Crans-Montana, Switzerland, 2–7 October 2022.
This work was carried out within the framework of the Russian Science Foundation project 17-17-01270. The study was completed in the laboratory created within Megagrant project (agreement no. 075-15-2021-599; 8 June 2021) with the support of the FMGE-2019-0004 project. We thank all the people who provided support at all stages of the work, participated in the field work, and carried out the sampling and analytical processing of the ice core. We are grateful to Vladimir Matskovsky for his help in interpreting dendrochronological data for the Caucasus.
This paper was edited by Margit Schwikowski and reviewed by two anonymous referees.
Ahrens, J., Geveci, B., and Law, C.: ParaView: An End-User Tool for Large-Data Visualization, in: Visualization Handbook, Elsevier, 717–731, https://doi.org/10.1016/B978-012387582-2/50038-1, 2005.
Aleshina, M. A., Toropov, P. A., and Semenov, V. A.: Temperature and Humidity Regime Changes on the Black Sea Coast in 1982–2014, Russ. Meteorol. Hydrol., 43, 235–244, https://doi.org/10.3103/S1068373918040040, 2018.
Barber, K., Zolitschka, B., Tarasov, P., and Lotter, A. F.: Atlantic to Urals – the Holocene climatic record of Mid-Latitude Europe, in: Past Climate Variability through Europe and Africa, Springer Netherlands, Dordrecht, 417–442, ISBN 978-1402021206, 2004.
Bardin, M. Y., Platova, T. V., and Samokhina, O. F.: Variability Of Anti-Cyclonic Activity In The Northern Extratropics, Fundam. Appl. Climatol., 3, 32–58, https://doi.org/10.21513/0207-2564-2019-3-32-58, 2019.
Bintanja, R.: The contribution of snowdrift sublimation to the surface mass balance of Antarctica, Ann. Glaciol., 27, 251–259, https://doi.org/10.3189/1998AoG27-1-251-259, 1998.
Bohleber, P., Wagenbach, D., Schöner, W., and Böhm, R.: To what extent do water isotope records from low accumulation Alpine ice cores reproduce instrumental temperature series?, Tellus B, 65, 1–17, https://doi.org/10.3402/tellusb.v65i0.20148, 2013.
Borisova, O.: Environmental and climatic conditions of human occupation in the central East European Plain during the Middle Holocene: Reconstruction from palaeofloristic data, Quatern. Int., 516, 42–57, https://doi.org/10.1016/j.quaint.2018.05.025, 2019.
Bunde, A., Büntgen, U., Ludescher, J., Luterbacher, J., and von Storch, H.: Is there memory in precipitation?, Nat. Clim. Change, 3, 174–175, https://doi.org/10.1038/nclimate1830, 2013.
Büntgen, U., Urban, O., Krusic, P. J., Rybníček, M., Kolář, T., Kyncl, T., Ač, A., Koňasová, E., Čáslavský, J., Esper, J., Wagner, S., Saurer, M., Tegel, W., Dobrovolný, P., Cherubini, P., Reinig, F., and Trnka, M.: Recent European drought extremes beyond Common Era background variability, Nat. Geosci., 14, 190–196, https://doi.org/10.1038/s41561-021-00698-0, 2021.
CDS – Copernicus Climate Change Service (C3S): ERA5: Fifth generation of ECMWF atmospheric reanalyses of the global climate, CDS – Copernicus Climate Change Service Climate Data Store, https://cds.climate.copernicus.eu/cdsapp#!/home (last access: 23 January 2024), 2024.
Chen, J., Del Genio, A. D., Carlson, B. E., and Bosilovich, M. G.: The spatiotemporal structure of twentieth-century climate variations in observations and reanalyses. Part I: Long-term trend, J. Climate, 21, 2611–2633, https://doi.org/10.1175/2007JCLI2011.1, 2008.
Chernokulsky, A., Kozlov, F., Zolina, O., Bulygina, O., Mokhov, I. I., and Semenov, V. A.: Observed changes in convective and stratiform precipitation in Northern Eurasia over the last five decades, Environ. Res. Lett., 14, 045001, https://doi.org/10.1088/1748-9326/aafb82, 2019.
Cook, E. R., Seager, R., Kushnir, Y., Briffa, K. R., Bu ntgen, U., Frank, D., Krusic, P. J., Tegel, W., van der Schrier, G., Andreu-Hayles, L., Baillie, M., Baittinger, C., Bleicher, N., Bonde, N., Brown, D., Carrer, M., Cooper, R., Cufar, K., Dittmar, C., Esper, J., Griggs, C., Gunnarson, B., Gu nther, B., Gutierrez, E., Haneca, K., Helama, S., Herzig, F., Heussner, K.-U., Hofmann, J., Janda, P., Kontic, R., Ko se, N., Kyncl, T., Levanic, T., Linderholm, H., Manning, S., Melvin, T. M., Miles, D., Neuwirth, B., Nicolussi, K., Nola, P., Panayotov, M., Popa, I., Rothe, A., Seftigen, K., Seim, A., Svarva, H., Svoboda, M., Thun, T., Timonen, M., Touchan, R., Trotsiuk, V., Trouet, V., Walder, F., Wazny, T., Wilson, R., and Zang, C.: Old World megadroughts and pluvials during the Common Era, Sci. Adv., 1, e1500561–e1500561, https://doi.org/10.1126/sciadv.1500561, 2015.
Cook, E. R., Solomina, O., Matskovsky, V., Cook, B. I., Agafonov, L., Berdnikova, A., Dolgova, E., Karpukhin, A., Knysh, N., Kulakova, M., Kuznetsova, V., Kyncl, T., Kyncl, J., Maximova, O., Panyushkina, I., Seim, A., Tishin, D., Ważny, T., and Yermokhin, M.: The European Russia Drought Atlas (1400–2016 CE), Clim. Dynam., 54, 2317–2335, https://doi.org/10.1007/s00382-019-05115-2, 2020.
Dahl-Jensen, D., Johnsen, S. J., Hammer, C. U., Clausen, H. B., and Jouzel, J.: Past Accumulation rates derived from observed annual layers in the GRIP ice core from Summit, Central Greenland, in: Ice in the Climate System, Springer, Berlin, Heidelberg, 517–532, https://doi.org/10.1007/978-3-642-85016-5_29, 1993.
Dansgaard, W. and Johnsen, S. J.: A Flow Model and a Time Scale for the Ice Core from Camp Century, Greenland, J. Glaciol., 8, 215–223, https://doi.org/10.3189/S0022143000031208, 1969.
Deser, C., Hurrell, J. W., and Phillips, A. S.: The role of the North Atlantic Oscillation in European climate projections, Clim. Dynam., 49, 3141–3157, https://doi.org/10.1007/s00382-016-3502-z, 2017.
Dolgova, E.: June–September temperature reconstruction in the Northern Caucasus based on blue intensity data, Dendrochronologia, 39, 17–23, https://doi.org/10.1016/j.dendro.2016.03.002, 2016.
Franke, J., Valler, V., Brugnara, Y., and Brönnimann, S.: Ensemble Kalman Fitting Paleo-Reanalysis Version 2 (EKF400_v2), World Data Center for Climate (WDCC) at DKRZ [data set], https://doi.org/10.26050/WDCC/EKF400_v2.0, 2020.
Fuentes-Franco, R., Docquier, D., Koenigk, T., Zimmermann, K., and Giorgi, F.: Winter heavy precipitation events over Northern Europe modulated by a weaker NAO variability by the end of the 21st century, npj Clim. Atmos. Sci., 6, 72, https://doi.org/10.1038/s41612-023-00396-1, 2023.
Gagliardini, O. and Meyssonnier, J.: Flow simulation of a firn-covered cold glacier, Ann. Glaciol., 24, 242–248, https://doi.org/10.3189/S0260305500012246, 1997.
Gagliardini, O., Zwinger, T., Gillet-Chaulet, F., Durand, G., Favier, L., de Fleurian, B., Greve, R., Malinen, M., Martín, C., Råback, P., Ruokolainen, J., Sacchettini, M., Schäfer, M., Seddik, H., and Thies, J.: Capabilities and performance of Elmer/Ice, a new-generation ice sheet model, Geosci. Model Dev., 6, 1299–1318, https://doi.org/10.5194/gmd-6-1299-2013, 2013.
Goodwin, B. P., Mosley-Thompson, E., Wilson, A. B., Porter, S. E., and Roxana Sierra-Hernandez, M.: Accumulation variability in the Antarctic Peninsula: The role of large-scale atmospheric oscillations and their interactions, J. Climate, 29, 2579–2596, https://doi.org/10.1175/JCLI-D-15-0354.1, 2016.
Henderson, K., Laube, A., Gäggeler, H. W., Olivier, S., Papina, T., and Schwikowski, M.: Temporal variations of accumulation and temperature during the past two centuries from Belukha ice core, Siberian Altai, J. Geophys. Res., 111, D03104, https://doi.org/10.1029/2005JD005819, 2006.
Herren, P.-A., Eichler, A., Machguth, H., Papina, T., Tobler, L., Zapf, A., and Schwikowski, M.: The onset of Neoglaciation 6000 years ago in western Mongolia revealed by an ice core from the Tsambagarav mountain range, Quaternary Sci. Rev., 69, 59–68, https://doi.org/10.1016/j.quascirev.2013.02.025, 2013.
Hörhold, M. W., Kipfstuhl, S., Wilhelms, F., Freitag, J., and Frenzel, A.: The densification of layered polar firn, J. Geophys. Res.-Earth, 116, F01001, https://doi.org/10.1029/2009JF001630, 2011.
Hurrell, J. W. and Deser, C.: North Atlantic climate variability: The role of the North Atlantic Oscillation, J. Marine Syst., 78, 28–41, https://doi.org/10.1016/j.jmarsys.2008.11.026, 2009.
Ionita, M.: The Impact of the East Atlantic/Western Russia Pattern on the Hydroclimatology of Europe from Mid-Winter to Late Spring, Climate, 2, 296–309, https://doi.org/10.3390/cli2040296, 2014.
IPCC: Climate Change 2013: The Physical Science Basis, Contribution of Working Group I to the Fifth Assessment Report of the Intergovernmental Panel on Climate Change, edited by: Stocker, T. F., Qin, D., Plattner, G.-K., Tignor, M., Allen, S. K., Boschung, J., Nauels, A., Xia, Y., Bex, V., and Midgley, P. M.., Intergovernmental Panel on Climate Change, Cambridge University Press, Cambridge, UK and New York, NY, USA, https://doi.org/10.1017/CBO9781107415324, 2014.
Kozachek, A., Mikhalenko, V., Masson-Delmotte, V., Ekaykin, A., Ginot, P., Kutuzov, S., Legrand, M., Lipenkov, V., and Preunkert, S.: Large-scale drivers of Caucasus climate variability in meteorological records and Mt El'brus ice cores, Clim. Past, 13, 473–489, https://doi.org/10.5194/cp-13-473-2017, 2017.
Kutuzov, S., Legrand, M., Preunkert, S., Ginot, P., Mikhalenko, V., Shukurov, K., Poliukhov, A., and Toropov, P.: The Elbrus (Caucasus, Russia) ice core record – Part 2: history of desert dust deposition, Atmos. Chem. Phys., 19, 14133–14148, https://doi.org/10.5194/acp-19-14133-2019, 2019.
Lavrentiev, I. I., Mikhalenko, V. N., and Kutuzov, S. S.: Ice thickness and subglacial relief of the Western ice plateau of Elbrus, Ice Snow, 2, 2–18, 2010.
Lavrentiev, I. I., Kutuzov, S. S., Mikhalenko, V. N., Sudakova, M. S., and Kozachek, A. V.: Spatial and Temporal Variations of Snow Accumulation on the Western Elbrus Plateau, the Central Caucasus, Water Resour., 49, S1–S11, https://doi.org/10.1134/S0097807822070090, 2022.
Licciulli, C., Bohleber, P., Lier, J., Gagliardini, O., Hoelzle, M., and Eisen, O.: A full Stokes ice-flow model to assist the interpretation of millennial-scale ice cores at the high-Alpine drilling site Colle Gnifetti, Swiss/Italian Alps, J. Glaciol., 66, 35–48, https://doi.org/10.1017/jog.2019.82, 2019.
Ligtenberg, S. R. M., Helsen, M. M., and van den Broeke, M. R.: An improved semi-empirical model for the densification of Antarctic firn, The Cryosphere, 5, 809–819, https://doi.org/10.5194/tc-5-809-2011, 2011.
Lim, S., Faïn, X., Ginot, P., Mikhalenko, V., Kutuzov, S., Paris, J.-D., Kozachek, A., and Laj, P.: Black carbon variability since preindustrial times in the eastern part of Europe reconstructed from Mt. Elbrus, Caucasus, ice cores, Atmos. Chem. Phys., 17, 3489–3505, https://doi.org/10.5194/acp-17-3489-2017, 2017.
Loader, N. J., Young, G. H. F., McCarroll, D., Davies, D., Miles, D., and Bronk Ramsey, C.: Summer precipitation for the England and Wales region, 1201–2000 CE, from stable oxygen isotopes in oak tree rings, J. Quaternary Sci., 35, 731–736, https://doi.org/10.1002/jqs.3226, 2020.
López-Moreno, J. I., Vicente-Serrano, S. M., Morán-Tejeda, E., Lorenzo-Lacruz, J., Kenawy, A., and Beniston, M.: Effects of the North Atlantic Oscillation (NAO) on combined temperature and precipitation winter modes in the Mediterranean mountains: Observed relationships and projections for the 21st century, Global Planet. Change, 77, 62–76, https://doi.org/10.1016/j.gloplacha.2011.03.003, 2011.
Maeno, N. and Ebinuma, T.: Pressure sintering of ice and its implication to the densification of snow at polar glaciers and ice sheets, J. Phys. Chem., 87, 4103–4110, https://doi.org/10.1021/j100244a023, 1983.
Mariani, I., Eichler, A., Jenk, T. M., Brönnimann, S., Auchmann, R., Leuenberger, M. C., and Schwikowski, M.: Temperature and precipitation signal in two Alpine ice cores over the period 1961–2001, Clim. Past, 10, 1093–1108, https://doi.org/10.5194/cp-10-1093-2014, 2014.
Markowski, P. and Richardson, Y.: Mesoscale Meteorology in Midlatitudes, Wiley, https://doi.org/10.1002/9780470682104, 2010.
Martin-Benito, D., Ummenhofer, C. C., Köse, N., Güner, H. T., and Pederson, N.: Tree-ring reconstructed May–June precipitation in the Caucasus since 1752 CE, Clim. Dynam., 47, 3011–3027, https://doi.org/10.1007/s00382-016-3010-1, 2016.
Meredith, E. P., Semenov, V. A., Maraun, D., Park, W., and Chernokulsky, A. V.: Crucial role of Black Sea warming in amplifying the 2012 Krymsk precipitation extreme, Nat. Geosci., 8, 615–619, https://doi.org/10.1038/ngeo2483, 2015.
Mikhalenko, V., Sokratov, S., Kutuzov, S., Ginot, P., Legrand, M., Preunkert, S., Lavrentiev, I., Kozachek, A., Ekaykin, A., Faïn, X., Lim, S., Schotterer, U., Lipenkov, V., and Toropov, P.: Investigation of a deep ice core from the Elbrus western plateau, the Caucasus, Russia, The Cryosphere, 9, 2253–2270, https://doi.org/10.5194/tc-9-2253-2015, 2015.
Mikhalenko, V. N. (Ed.): Elbrus Glaciers and Climate, Nestor-Historia Publications, Moscow-St. Petersburg, Russia, ISBN 978-5-4469-1671-9, 2020.
Mikhalenko, V. N., Kutuzov, S. S., Lavrentiev, I. I., Toropov, P. A., Vladimirova, D. O., Abramov, A. A., and Matskovsky, V. V.: Glacioclimatological investigations of the Institute of Geography, RAS, in the crater of Eastern Summit of Mt. Elbrus in 2020, Ice Snow, 61, 149–160, https://doi.org/10.31857/S2076673421010078, 2021.
Nagavciuc, V., Ionita, M., Kern, Z., McCarroll, D., and Popa, I.: A ∼ 700 years perspective on the 21st century drying in the eastern part of Europe based on δ18O in tree ring cellulose, Commun. Earth Environ., 3, 277, https://doi.org/10.1038/s43247-022-00605-4, 2022.
NCEI environmental Data Center: Elbrus Ice Core, Caucasus Accumulation Rate Data from 1750–2009 CE, NCEI environmental Data Center [data set], https://www.ncei.noaa.gov/access/paleo-search/study/38761 (last access: 23 January 2024), 2024.
NOAA: Global Precipitation Climatology Centre (GPCC), https://psl.noaa.gov/data/gridded/data.gpcc.html (last access: 25 January 2024), 2024.
Nye, J. F.: Correction Factor for Accumulation Measured by the Thickness of the Annual Layers in an Ice Sheet, J. Glaciol., 4, 785–788, https://doi.org/10.3189/S0022143000028367, 1963.
Palm, S. P., Kayetha, V., Yang, Y., and Pauly, R.: Blowing snow sublimation and transport over Antarctica from 11 years of CALIPSO observations, The Cryosphere, 11, 2555–2569, https://doi.org/10.5194/tc-11-2555-2017, 2017.
Paterson, W. S. B. and Waddington, E. D.: Past precipitation rates derived from ice core measurements: Methods and data analysis, Rev. Geophys., 22, 123–130, https://doi.org/10.1029/RG022i002p00123, 1984.
Pauling, A., Luterbacher, J., Casty, C., and Wanner, H.: Five hundred years of gridded high-resolution precipitation reconstructions over Europe and the connection to large-scale circulation, Clim. Dynam., 26, 387–405, https://doi.org/10.1007/s00382-005-0090-8, 2006.
Pohjola, V. A., Martma, T. A., Meijer, H. A. J., Moore, J. C., Isaksson, E., Vaikmäe, R., and van de Wal, R. S. W.: Reconstruction of three centuries of annual accumulation rates based on the record of stable isotopes of water from Lomonosovfonna, Svalbard, Ann. Glaciol., 35, 57–62, https://doi.org/10.3189/172756402781816753, 2002.
Pomeroy, J. W. and Gray, D. M.: Snowcover accumulation, relocation and management, National Hydrology Research Institute, Saskatoon, Saskatchewan, 1995.
Preunkert, S. and Legrand, M.: Towards a quasi-complete reconstruction of past atmospheric aerosol load and composition (organic and inorganic) over Europe since 1920 inferred from Alpine ice cores, Clim. Past, 9, 1403–1416, https://doi.org/10.5194/cp-9-1403-2013, 2013.
Preunkert, S., Legrand, M., Kutuzov, S., Ginot, P., Mikhalenko, V., and Friedrich, R.: The Elbrus (Caucasus, Russia) ice core record – Part 1: reconstruction of past anthropogenic sulfur emissions in south-eastern Europe, Atmos. Chem. Phys., 19, 14119–14132, https://doi.org/10.5194/acp-19-14119-2019, 2019.
Rasmussen, R., Baker, B., Kochendorfer, J., Meyers, T., Landolt, S., Fischer, A. P., Black, J., Thériault, J. M., Kucera, P., Gochis, D., Smith, C., Nitu, R., Hall, M., Ikeda, K., and Gutmann, E.: How well are we measuring snow: The NOAA/FAA/NCAR winter precipitation test bed, B. Am. Meteorol. Soc., 93, 811–829, https://doi.org/10.1175/BAMS-D-11-00052.1, 2012.
Schwerzmann, A., Funk, M., Blatter, H., Lüthi, M., Schwikowski, M. and Palmer, A.: A method to reconstruct past accumulation rates in alpine firn regions: A study on Fiescherhorn, Swiss Alps, J. Geophys. Res., 111, F01014, https://doi.org/10.1029/2005JF000283, 2006.
Simkin, T., and Siebert, L.: Volcanoes of the World, Geoscience Press, Inc., Tucson, Arizona, ISBN 9780520268777, 1994.
Solomina, O., Davi, N., D'Arrigo, R., and Jacoby, G.: Tree-ring reconstruction of Crimean drought and lake chronology correction, Geophys. Res. Lett., 32, L19704, https://doi.org/10.1029/2005GL023335, 2005.
Solomina, O., Bushueva, I., Dolgova, E., Jomelli, V., Alexandrin, M., Mikhalenko, V., and Matskovsky, V.: Glacier variations in the Northern Caucasus compared to climatic reconstructions over the past millennium, Global Planet. Change, 140, 28–58, https://doi.org/10.1016/j.gloplacha.2016.02.008, 2016.
Solomina, O. N., Bushueva, I. S., Dolgova, E. A., Zolotokrylin, A. N., Kuznetsova, V. V., Kuznetsova, T. O., Kukhta, A. E., Lazukova, L. I., Lomakin, N. A., Matskovsky, V. V., Matveev, S. M., Mikhailov, A. Y., Mikhalenko, V. N., Pozhidaeva, L. S., Rumyantsev, D. E., Sakulina, G. A., Semenov, V. A., Khasanov, B. F., Cherenkova, E. A., and Chernokulsky, A. V.: Droughts of the East European Plain according to hydrometeorological and tree-ring data, Nestor-Historia Publications, Moscow-St. Petersburg, Russia, ISBN 978-5-4469-1126-4, 2017.
Sun, Q., Miao, C., Duan, Q., Ashouri, H., Sorooshian, S., and Hsu, K.: A Review of Global Precipitation Data Sets: Data Sources, Estimation, and Intercomparisons, Rev. Geophys., 56, 79–107, https://doi.org/10.1002/2017RG000574, 2018.
Tashilova, A., Ashabokov, B., Kesheva, L., and Teunova, N.: Analysis of Climate Change in the Caucasus Region: End of the 20th–Beginning of the 21st Century, Climate, 7, 11, https://doi.org/10.3390/cli7010011, 2019.
Tielidze, L. G., Nosenko, G. A., Khromova, T. E., and Paul, F.: Strong acceleration of glacier area loss in the Greater Caucasus between 2000 and 2020, The Cryosphere, 16, 489–504, https://doi.org/10.5194/tc-16-489-2022, 2022.
Touchan, R., Xoplaki, E., Funkhouser, G., Luterbacher, J., Hughes, M. K., Erkan, N., Akkemik, Ü., and Stephan, J.: Reconstructions of spring/summer precipitation for the Eastern Mediterranean from tree-ring widths and its connection to large-scale atmospheric circulation, Clim. Dynam., 25, 75–98, https://doi.org/10.1007/s00382-005-0016-5, 2005.
Touchan, R., Akkemik, Ü., Hughes, M. K., and Erkan, N.: May–June precipitation reconstruction of southwestern Anatolia, Turkey during the last 900 years from tree rings, Quaternary Res., 68, 196–202, https://doi.org/10.1016/j.yqres.2007.07.001, 2007.
Trigo, R. M., Osborn, T. J. and Corte-Real, J. M.: The North Atlantic Oscillation influence on Europe: Climate impacts and associated physical mechanisms, Clim. Res., 20, 9–17, https://doi.org/10.3354/cr020009, 2002.
Türkeş, M. and Erlat, E.: Climatological responses of winter precipitation in Turkey to variability of the North Atlantic Oscillation during the period 1930–2001, Theor. Appl. Climatol., 81, 45–69, https://doi.org/10.1007/s00704-004-0084-1, 2005.
Valler, V., Franke, J., Brugnara, Y., and Brönnimann, S.: An updated global atmospheric paleo-reanalysis covering the last 400 years, Geosci. Data J., 9, 89–107, https://doi.org/10.1002/gdj3.121, 2022.
Verhaegen, Y., Huybrechts, P., Rybak, O., and Popovnin, V. V.: Modelling the evolution of Djankuat Glacier, North Caucasus, from 1752 until 2100 CE, The Cryosphere, 14, 4039–4061, https://doi.org/10.5194/tc-14-4039-2020, 2020.
Vicente-Serrano, S. M. and López-Moreno, J. I.: Nonstationary influence of the North Atlantic Oscillation on European precipitation, J. Geophys. Res., 113, D20120, https://doi.org/10.1029/2008JD010382, 2008.
Winski, D., Osterberg, E., Ferris, D., Kreutz, K., Wake, C., Campbell, S., Hawley, R., Roy, S., Birkel, S., Introne, D., and Handley, M.: Industrial-age doubling of snow accumulation in the Alaska Range linked to tropical ocean warming, Sci. Rep.-UK, 7, 17869, https://doi.org/10.1038/s41598-017-18022-5, 2017.
Winstrup, M., Vallelonga, P., Kjær, H. A., Fudge, T. J., Lee, J. E., Riis, M. H., Edwards, R., Bertler, N. A. N., Blunier, T., Brook, E. J., Buizert, C., Ciobanu, G., Conway, H., Dahl-Jensen, D., Ellis, A., Emanuelsson, B. D., Hindmarsh, R. C. A., Keller, E. D., Kurbatov, A. V., Mayewski, P. A., Neff, P. D., Pyne, R. L., Simonsen, M. F., Svensson, A., Tuohy, A., Waddington, E. D., and Wheatley, S.: A 2700-year annual timescale and accumulation history for an ice core from Roosevelt Island, West Antarctica, Clim. Past, 15, 751–779, https://doi.org/10.5194/cp-15-751-2019, 2019.
Yao, T., Duan, K., Xu, B., Wang, N., Guo, X., and Yang, X.: Precipitation record since AD 1600 from ice cores on the central Tibetan Plateau, Clim. Past, 4, 175–180, https://doi.org/10.5194/cp-4-175-2008, 2008.
Zhang, R., Shang, H., Yu, S., He, Q., Yuan, Y., Bolatov, K., and Mambetov, B. T.: Tree-ring-based precipitation reconstruction in southern Kazakhstan, reveals drought variability since A. D. 1770, Int. J. Climatol., 37, 741–750, https://doi.org/10.1002/joc.4736, 2017.
Zhang, W., Hou, S., Wu, S.-Y., Pang, H., Sneed, S. B., Korotkikh, E. V., Mayewski, P. A., Jenk, T. M., and Schwikowski, M.: A quantitative method of resolving annual precipitation for the past millennia from Tibetan ice cores, The Cryosphere, 16, 1997–2008, https://doi.org/10.5194/tc-16-1997-2022, 2022.
Zwinger, T., Greve, R., Gagliardini, O., Shiraiwa, T., and Lyly, M.: A full Stokes-flow thermo-mechanical model for firn and ice applied to the Gorshkov crater glacier, Kamchatka, Ann. Glaciol., 45, 29–37, https://doi.org/10.3189/172756407782282543, 2007.