the Creative Commons Attribution 4.0 License.
the Creative Commons Attribution 4.0 License.
 | 08 May 2023
Dansgaard–Oeschger events in climate models: review and baseline Marine Isotope Stage 3 (MIS3) protocol
Irene Malmierca-Vallet
Louise C. Sime
Dansgaard–Oeschger (D–O) events, millennial-scale climate oscillations between stadial and interstadial conditions (of up to 10–15 ∘C in amplitude at high northern latitudes), occurred throughout the Marine Isotope Stage 3 (MIS3; 27.8–59.4 ka) period. The climate modelling community up to now has not been able to answer the question of whether our climate models are too stable to simulate D–O events. To address this, this paper lays the ground-work for a MIS3 D–O protocol for general circulation models which are used in the International Panel for Climate Change (IPCC) assessments. We review the following: D–O terminology, community progress on simulating D–O events in these IPCC-class models (processes and published examples), and evidence about the boundary conditions under which D–O events occur. We find that no model exhibits D–O-like behaviour under pre-industrial conditions. Some, but not all, models exhibit D–O-like oscillations under MIS3 and/or full glacial conditions. Greenhouse gases and ice sheet configurations are crucial. However most models have not run simulations of long enough duration to be sure which models show D–O-like behaviour, under either MIS3 or full glacial states. We propose a MIS3 baseline protocol at 34 ka, which features low obliquity values, medium to low MIS3 greenhouse gas values, and the intermediate ice sheet configuration, which our review suggests are most conducive to D–O-like behaviour in models. We also provide a protocol for a second freshwater (Heinrich-event-preconditioned) experiment, since previous work suggests that this variant may be helpful in preconditioning a state in models which is conducive to D–O events. This review provides modelling groups investigating MIS3 D–O oscillations with a common framework, which is aimed at (1) maximising the chance of the occurrence of D–O-like events in the simulations, (2) allowing more precise model–data evaluation, and (3) providing an adequate central point for modellers to explore model stability.
- Article
(4318 KB) - Full-text XML
- BibTeX
- EndNote


During a Dansgaard–Oeschger (D–O) event, Greenland transitions between cold Greenland Stadial (GS) and warmer Greenland Interstadial (GI) conditions. The warming can occur within a decade (Kindler et al., 2014; Huber et al., 2006), whilst cooling occurs over a much longer period that is typically several centuries in length. During a warming phase, surface air temperatures over Greenland increase by 10–15 ∘C (Andersen et al., 2006; Kindler et al., 2014; Huber et al., 2006). D–O events are best documented during Marine Isotope Stage 3 (MIS3; between 27.8–59.4 kyr BP, hereafter ka; Goni and Harrison, 2010), including being recorded in several ice cores from Greenland (Fig. 1; Johnsen et al., 2001). Whilst the D–O events recorded in these cores are renowned, the events are global in nature (Voelker et al., 2002; Sanchez Goñi and Harrison, 2010; Sánchez Goñi et al., 2017), with known climate signatures including imprints in surface temperature and the hydrological cycle at high northern latitudes (Andersen et al., 2004; Thomas et al., 2009; Seierstad et al., 2014), in the tropics (Deplazes et al., 2013; Baumgartner et al., 2014; Adolphi et al., 2018), in Eurasia (Genty et al., 2003; Wang et al., 2008; Jacobel et al., 2017; Rousseau et al., 2017), and in North and South America (Wang et al., 2004; Wagner et al., 2010; Asmerom et al., 2010; Deplazes et al., 2013; Vanneste et al., 2015). While there are no Greenland ice core records of the previous glacial (MIS6 around 140–190 ka), speleothems and Antarctic ice cores indicate that it is extremely likely that D–O events also occurred during MIS6 and earlier glacial periods (Lang et al., 1999; Uriarte, 2019; Landais et al., 2004; Turner and Marshall, 2011; Barker et al., 2011; Lambert et al., 2012). This observational evidence shows that D–O events do not occur under interglacial or full Last Glacial Maximum conditions (Galaasen et al., 2014; Tzedakis et al., 2018; Galaasen et al., 2020).
In 2011, Valdes (2011) argued that climate models used in the assessments of the Intergovernmental Panel on Climate Change (IPCC) have not proved their ability to simulate D–O events. This has several implications for the delivery of accurate projections of climate change within the context of tipping points and abrupt climate change (Brovkin et al., 2021). Whilst in the intervening years a number of models have captured key features of D–O events through Atlantic Meridional Overturning Circulation (AMOC) hysteresis behaviour and/or produced D–O-type millennial-scale variability under a range of forcings (Brown and Galbraith, 2016; Galbraith and de Lavergne, 2019; Klockmann et al., 2018; Peltier et al., 2020; Armstrong et al., 2021; Zhang et al., 2021; Vettoretti et al., 2022), we still do not know if climate models are too stable because too few models have been run and led to the publication of an appropriate simulation. This deficiency is related to both the computational expense which prevents models from being run for the longer time periods needed for investigating D–O events and to the lack of an agreed appropriate experimental set-up. The limited knowledge of pre-Last Glacial Maximum (LGM) boundary conditions, in particular in the case of the ice sheet height and distribution, makes it challenging to generate an appropriate MIS3 experimental set-up.
An important question is whether model stability is caused by the model parameters and whether MIS3 conditions are such that the models are in a mono-stable state or in an oscillatory state or if the models exhibit bi-modality, where noise-induced transitions are not induced due to too-low model variability (Ditlevsen and Johnsen, 2010). Previous studies have questioned the significance of the periodic occurrence of D–O events in MIS3 (∼1470) (Ditlevsen et al., 2007). If the full glacial period is included, the distribution of waiting time between D–O events is consistent with a random process (Ditlevsen et al., 2005). Durations of stadials vs. interstadials indicate correlations with global ice volume and orbital parameters (Lohmann and Ditlevsen, 2018; Mitsui and Crucifix, 2017), thus underpinning the decision to focus on MIS3 boundary configurations.
Whether models can simulate abrupt changes is a crucial research question: if the current IPCC-class models are too stable to simulate D–O events, their ability to predict future abrupt transitions and their use in identifying tipping points are doubtful. For example, a tipping point may have been recently reached in the Arctic’s Barents Sea (Barton et al., 2018; Tesi et al., 2021); sea ice loss in the area is linked with enhanced heat transport via an intensified throughflow, or “Atlantification” (Årthun et al., 2012; Polyakov et al., 2017). In addition, future enhanced precipitation, decline in Arctic sea ice, and melting of glaciers and ice sheets could intensify the supply of freshwater to the North Atlantic and Arctic, which could lead to the reorganisation of the Atlantic circulation and tip the energy distribution between south and north in a similar way to that during D–O events (Lenton et al., 2008). If climate models do not reliably simulate past tipping events, it suggests that simulations of the coming century may be giving us a false sense of security.
The Coupled Model Intercomparison Project (CMIP) coordinates and designs climate model protocols for the past, present, and future climates and has become an indispensable tool to facilitate our understanding of climate change (IPCC, 2013; Eyring et al., 2016). The Paleoclimate Model Intercomparison Project 4 (PMIP4) is one of the individual model intercomparison projects which took part in CMIP6 (Kageyama et al., 2018). The design of a common MIS3 experimental protocol would allow the modelling community to address the questions posed above.
This paper compiles current information about unforced D–O-like oscillations in CMIP5/CMIP6 models and discusses the boundary conditions and mechanisms responsible for these oscillations. Given the nomenclature on D–O events varies throughout the literature, we first provide a framework for a more consistent terminology for use within this proposed MIS3 D–O protocol (Table 1 and Fig. 1). Secondly, we review the literature to ascertain whether models reproduce D–O-like events under MIS3 or other climate conditions. We then use this information to develop a protocol for the simulations of D–O events. This protocol focuses on Marine Isotope Stage 3 (MIS3) partly because of the excellent records of D–O events during this period (Schulz et al., 1999) but also because, as our synthesis shows, MIS3 conditions are also conducive to promoting D–O-like events in some models. Given that D–O events did not occur under full glacial conditions in the Last Glacial Period, the proposed modelling protocol is an important improvement on the use of an LGM PMIP protocol. It will undoubtedly help to shed light on the mechanism and processes involved in millennial-scale oscillations during MIS3. The common MIS3 climate modelling protocol is aimed at (1) maximising the chance of the occurrence of D–O-like events in the simulations, (2) improving model–data evaluation, and (3) providing an adequate central point for modellers to also explore model stability. In addition to the protocol for a baseline simulation, we also outline a protocol for a Heinrich-event-preconditioned (freshwater) experiment. These protocols provide a common framework for model experiments to explore cold-period instabilities using commonly specified greenhouse gas (GHG), ice sheet, insolation, and freshwater-related forcings.
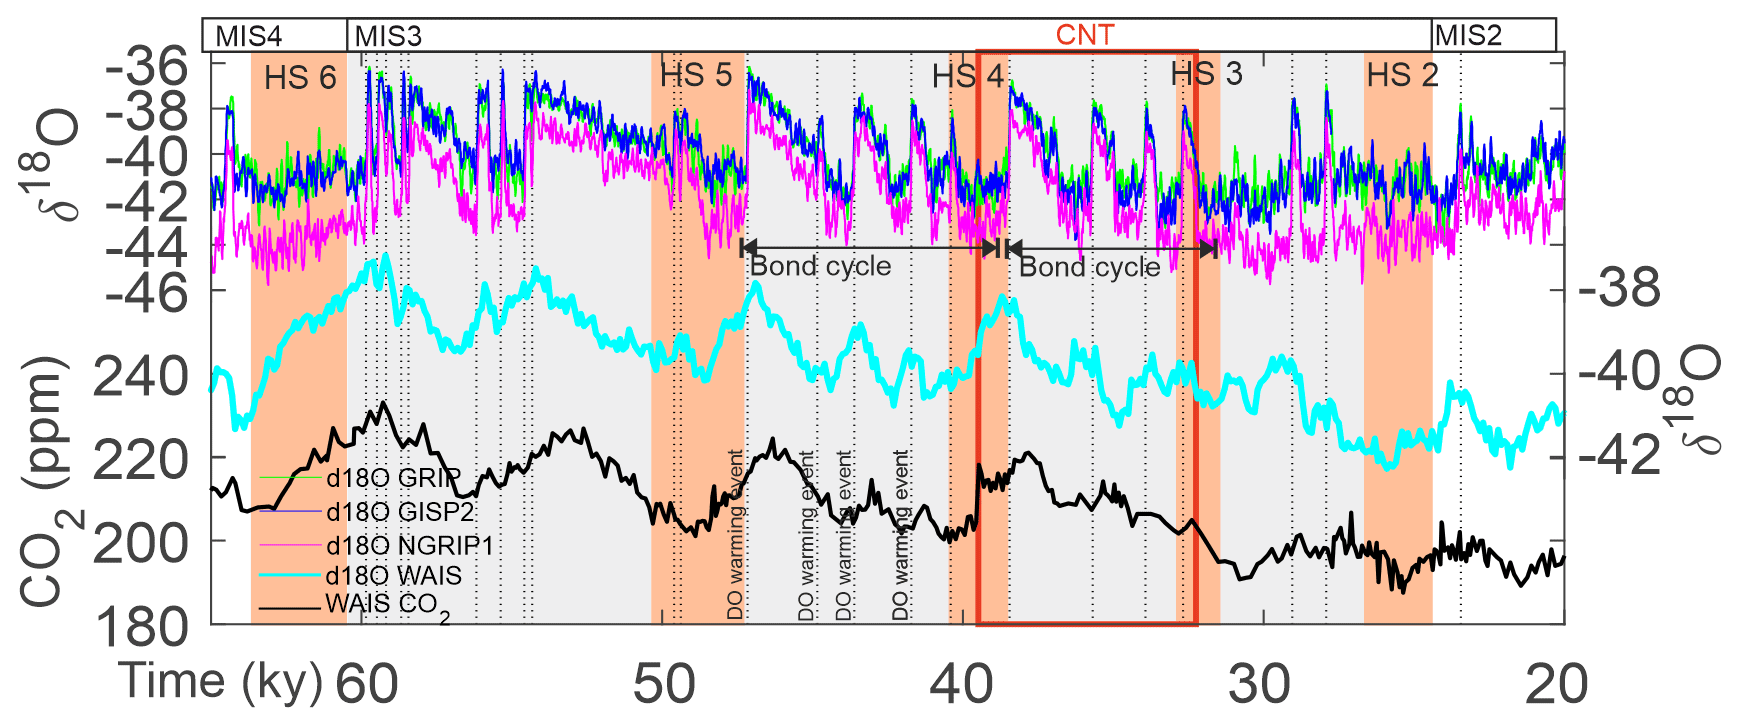
Figure 1MIS3 ice core records and nomenclature. Stable water isotope and CO2 measurements from Antarctic and Greenland ice cores (Bauska et al., 2021; NGRIP Project Members, 2004; Kindler et al., 2014). See also Table 1 for D–O nomenclature. The “cnt” red box indicates the period 38 to 32 ka proposed for the MIS3 baseline experiment.
We compile published evidence of long unforced quasi-oscillations (in the Atlantic Meridional Circulation; AMOC) in IPCC-class models under all climate states in Table A1, alongside glacial boundary condition simulations which do not show D–O-type oscillations. This permits us to explore the questions of what proportion of models exhibit D–O-like behaviour, which boundary conditions are most conducive to this, and what mechanisms are common to the modelled D–O behaviours. A number of pre-industrial (PI)/present-day model simulations exhibit spontaneous centennial-length cold events (Table A1); however, they do not appear to be D–O-like events. We deal with these first.
Under pre-industrial greenhouse gas (GHG) forcing and present-day ice sheets, spontaneous centennial-length cold events that last around 100–200 years occur in four IPCC-class models (Table A1). EC-Earth and Community Climate System Model version 4 (CCSM4) show high-atmospheric blocking over the eastern subpolar gyre that causes a cold event under pre-industrial boundary conditions (Drijfhout et al., 2013; Kleppin et al., 2015; Table A1). ECHAM6-FESOM also produces cooling events under pre-industrial conditions due to sudden reductions in deep-water convection and increase in sea ice cover in the Labrador Sea (Sidorenko et al., 2015). Changes in convection also occur in the Kiel Climate Model (KCM; Martin et al., 2015); however here centennial-scale variability in the AMOC is linked to variability in Southern Ocean convection. Unlike the CCSM4 and the EC-Earth models, the KCM and ECHAM6-FESOM studies do not indicate an active role of the atmosphere. Although these four models all show abrupt spontaneous cooling events under pre-industrial boundary conditions, these events do not have the typical sawtooth characteristics or longer timescales of D–O-type events.
Regular cycles of D–O-type quasi-oscillations are found in UofT-CCSM4 under LGM boundary conditions (Peltier and Vettoretti, 2014). The initiation of the abrupt D–O-type warming events is associated with the opening of a large polynya over the Irminger Sea (Vettoretti and Peltier, 2016) (Table A1). The AMOC spontaneously exhibits D–O-like quasi-oscillations (Peltier et al., 2020). The Peltier et al. (2020) salt oscillator is maintained by the salinity gradient between the subtropical gyre and the northern North Atlantic. Although UofT-CCSM4 is the only model to show long unforced quasi-oscillations in the AMOC under full glacial conditions, most of the other PMIP4 LGM simulations (Kageyama et al., 2021a) have not been run long enough to be sure that such oscillations would not arise if they were run for longer (see Table B1). Having said that, ideally models should not show oscillatory D–O-type behaviour when configured under a full glacial climate state, given that in reality D–O events do not occur under full glacial conditions (Huber et al., 2006; Galaasen et al., 2014; Kindler et al., 2014; Tzedakis et al., 2018).
D–O-type quasi-oscillations are also found in MIROC4m under mid-glacial conditions (Kuniyoshi et al., 2022). Some aspects of the D–O warming mechanism observed in the UofT-CCSM4, in particular the spatial location of the opening of a big polynya in the Irminger Sea, determining the stadial-interstadial transition, is also identified in MIROC4m (Kuniyoshi et al., 2022) (Table A1).
Under late-glacial conditions, at 30 ka, a quasi-oscillating AMOC is produced by the HadCM3 model (Armstrong et al., 2021) and results from a North Atlantic salt oscillator mechanism similar to that in UofT-CCSM4 (Peltier and Vettoretti, 2014; Vettoretti and Peltier, 2016; Peltier et al., 2020). The HadCM3 model also shows millennial-scale climate oscillations triggered by deglacial meltwater discharge in LGM simulations (Romé et al., 2022). Under intermediate glacial conditions (MIS3: 40–32 ka), the COSMOS model shows spontaneous millennial-scale climate oscillations triggered solely by orbitally driven insolation changes (Zhang et al., 2021). Variations in either obliquity or eccentricity-modulated precession lead to climate variations over the tropical and subpolar North Atlantic which exert opposite effects on AMOC strength and hence result in an oscillatory climate regime (Zhang et al., 2021). The CM2Mc model also produces somewhat smoothed quasi-oscillating AMOC under intermediate MIS3-like boundary conditions, with a present-day ice sheet distribution in combination with a CO2 concentration of 180 ppm and low obliquity (22∘) (Brown and Galbraith, 2016; Galbraith and de Lavergne, 2019) (Table A1). The MPI-ESM model exhibits more abrupt D–O-like quasi-oscillations with a present-day ice sheet distribution in combination with CO2 concentrations ranging between 190–217 ppm (Table A1; Klockmann et al., 2018, 2020).
In contrast to the above, neither NorESM nor CCSM3 produces D–O-type events or quasi-oscillations under MIS3 conditions (38 ka) (Guo et al., 2019b; Zhang and Prange, 2020). The NorESM – with a reasonably simulated AMOC and Arctic sea ice distribution in the PI and historical simulations (as documented by Guo et al., 2019a) – simulates a MIS3 climate that is in a stable regime with relatively strong convections in the Norwegian and Labrador seas. Indeed, NorESM sensitivity experiments including large reductions in atmospheric CO2 levels and Laurentide Ice Sheet heights, aimed at perturbing the system into a cold-stadial-like climate, indicate that the model state appears to be far from a possible threshold (Guo et al., 2019b). Zhang and Prange (2020) use the LGM ICE-5G ice sheet configuration (Peltier, 2004), with a high Laurentide Ice Sheet (at just over 4000 m), which may have contributed to a strong AMOC in the CCSM3 simulation, alongside its particular background climate.
In summary, IPCC-class models set up with pre-industrial or present-day conditions do not exhibit D–O-type warming events but can feature shorter centennial-length cooling and warming events. This model behaviour is consistent with observations, since millennial-timescale D–O events do not occur under interglacial conditions, but periods of centennial-scale AMOC variability are present throughout several interglacials (Galaasen et al., 2014; Tzedakis et al., 2018; Galaasen et al., 2020). Some models which are set up with more MIS3-like conditions exhibit D–O-type warming events, but some do not. Under full LGM conditions only 1 model (UofT-CCSM4) out of 10 (PMIP4 LGM simulations: Kageyama et al., 2021a) shows spontaneous D–O-type oscillations (Tables A1 and B1; Kageyama et al., 2021a; Peltier and Vettoretti, 2014).
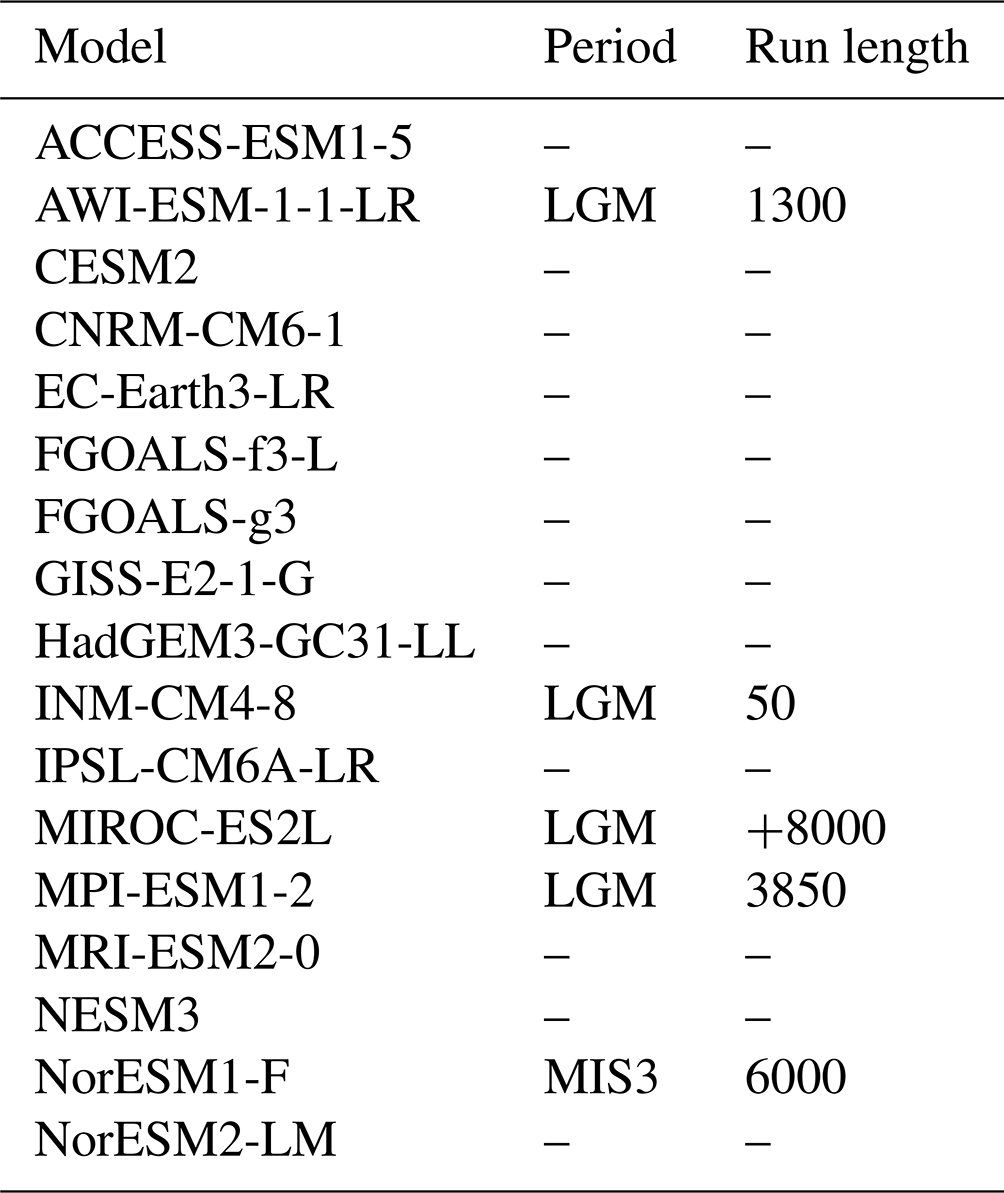
Since it can take some time for D–O-type oscillations to evolve, it is unclear if some models would develop such oscillations if they were run for longer (at least for 2000 model years). Of the 40 LGM-/MIS3-like simulations (Table B1; Kageyama et al., 2021a; Armstrong et al., 2021; Klockmann et al., 2018), 16 simulations have been run for less than 2000 years (Table B1), which makes it difficult to tell whether any of these simulations are capable of, or likely to, exhibit D–O-like behaviour under specific boundary conditions. In addition the duration of LGM/MIS3 simulations is currently inadequate; we note that the majority of CMIP6 models appear not to have performed any form of glacial period simulation (Table C1). Thus, it is difficult to ascertain what proportion of or indeed which models are capable of capturing D–O-like behaviour under any form of glacial period state (Table C1).
2.1 The role of ocean and sea ice feedbacks
Changes in the AMOC are crucial to the correct simulation of D–O events (Broecker and Peteet, 1985). The AMOC features stabilising positive feedbacks: a strong AMOC transports warm and salty water into the subpolar North Atlantic, thus weakening the stratification and also keeping the sea ice cover reduced (e.g. Rahmstorf, 2002; Clark et al., 2002). As a consequence, there is a large transport of heat northward across the hemispheres (e.g. Feulner et al., 2013; Buckley and Marshall, 2016), strong heat loss in the North Atlantic and Arctic, and active deep convection that sustains the strong AMOC. A weak AMOC, on the other hand, is associated with a weaker northward transport of salt and heat. This increases the stratification in the subpolar North Atlantic and thus favours the expansion of sea ice. The weak northward heat transport and the insulating effect of the sea ice keep the density gain due to heat loss small and the AMOC in a weak state (e.g. Klockmann et al., 2018). This weak AMOC state is stable when Antarctic Bottom Water becomes dense and salty enough to replace North Atlantic Deep Water (NADW) in the deep North Atlantic.
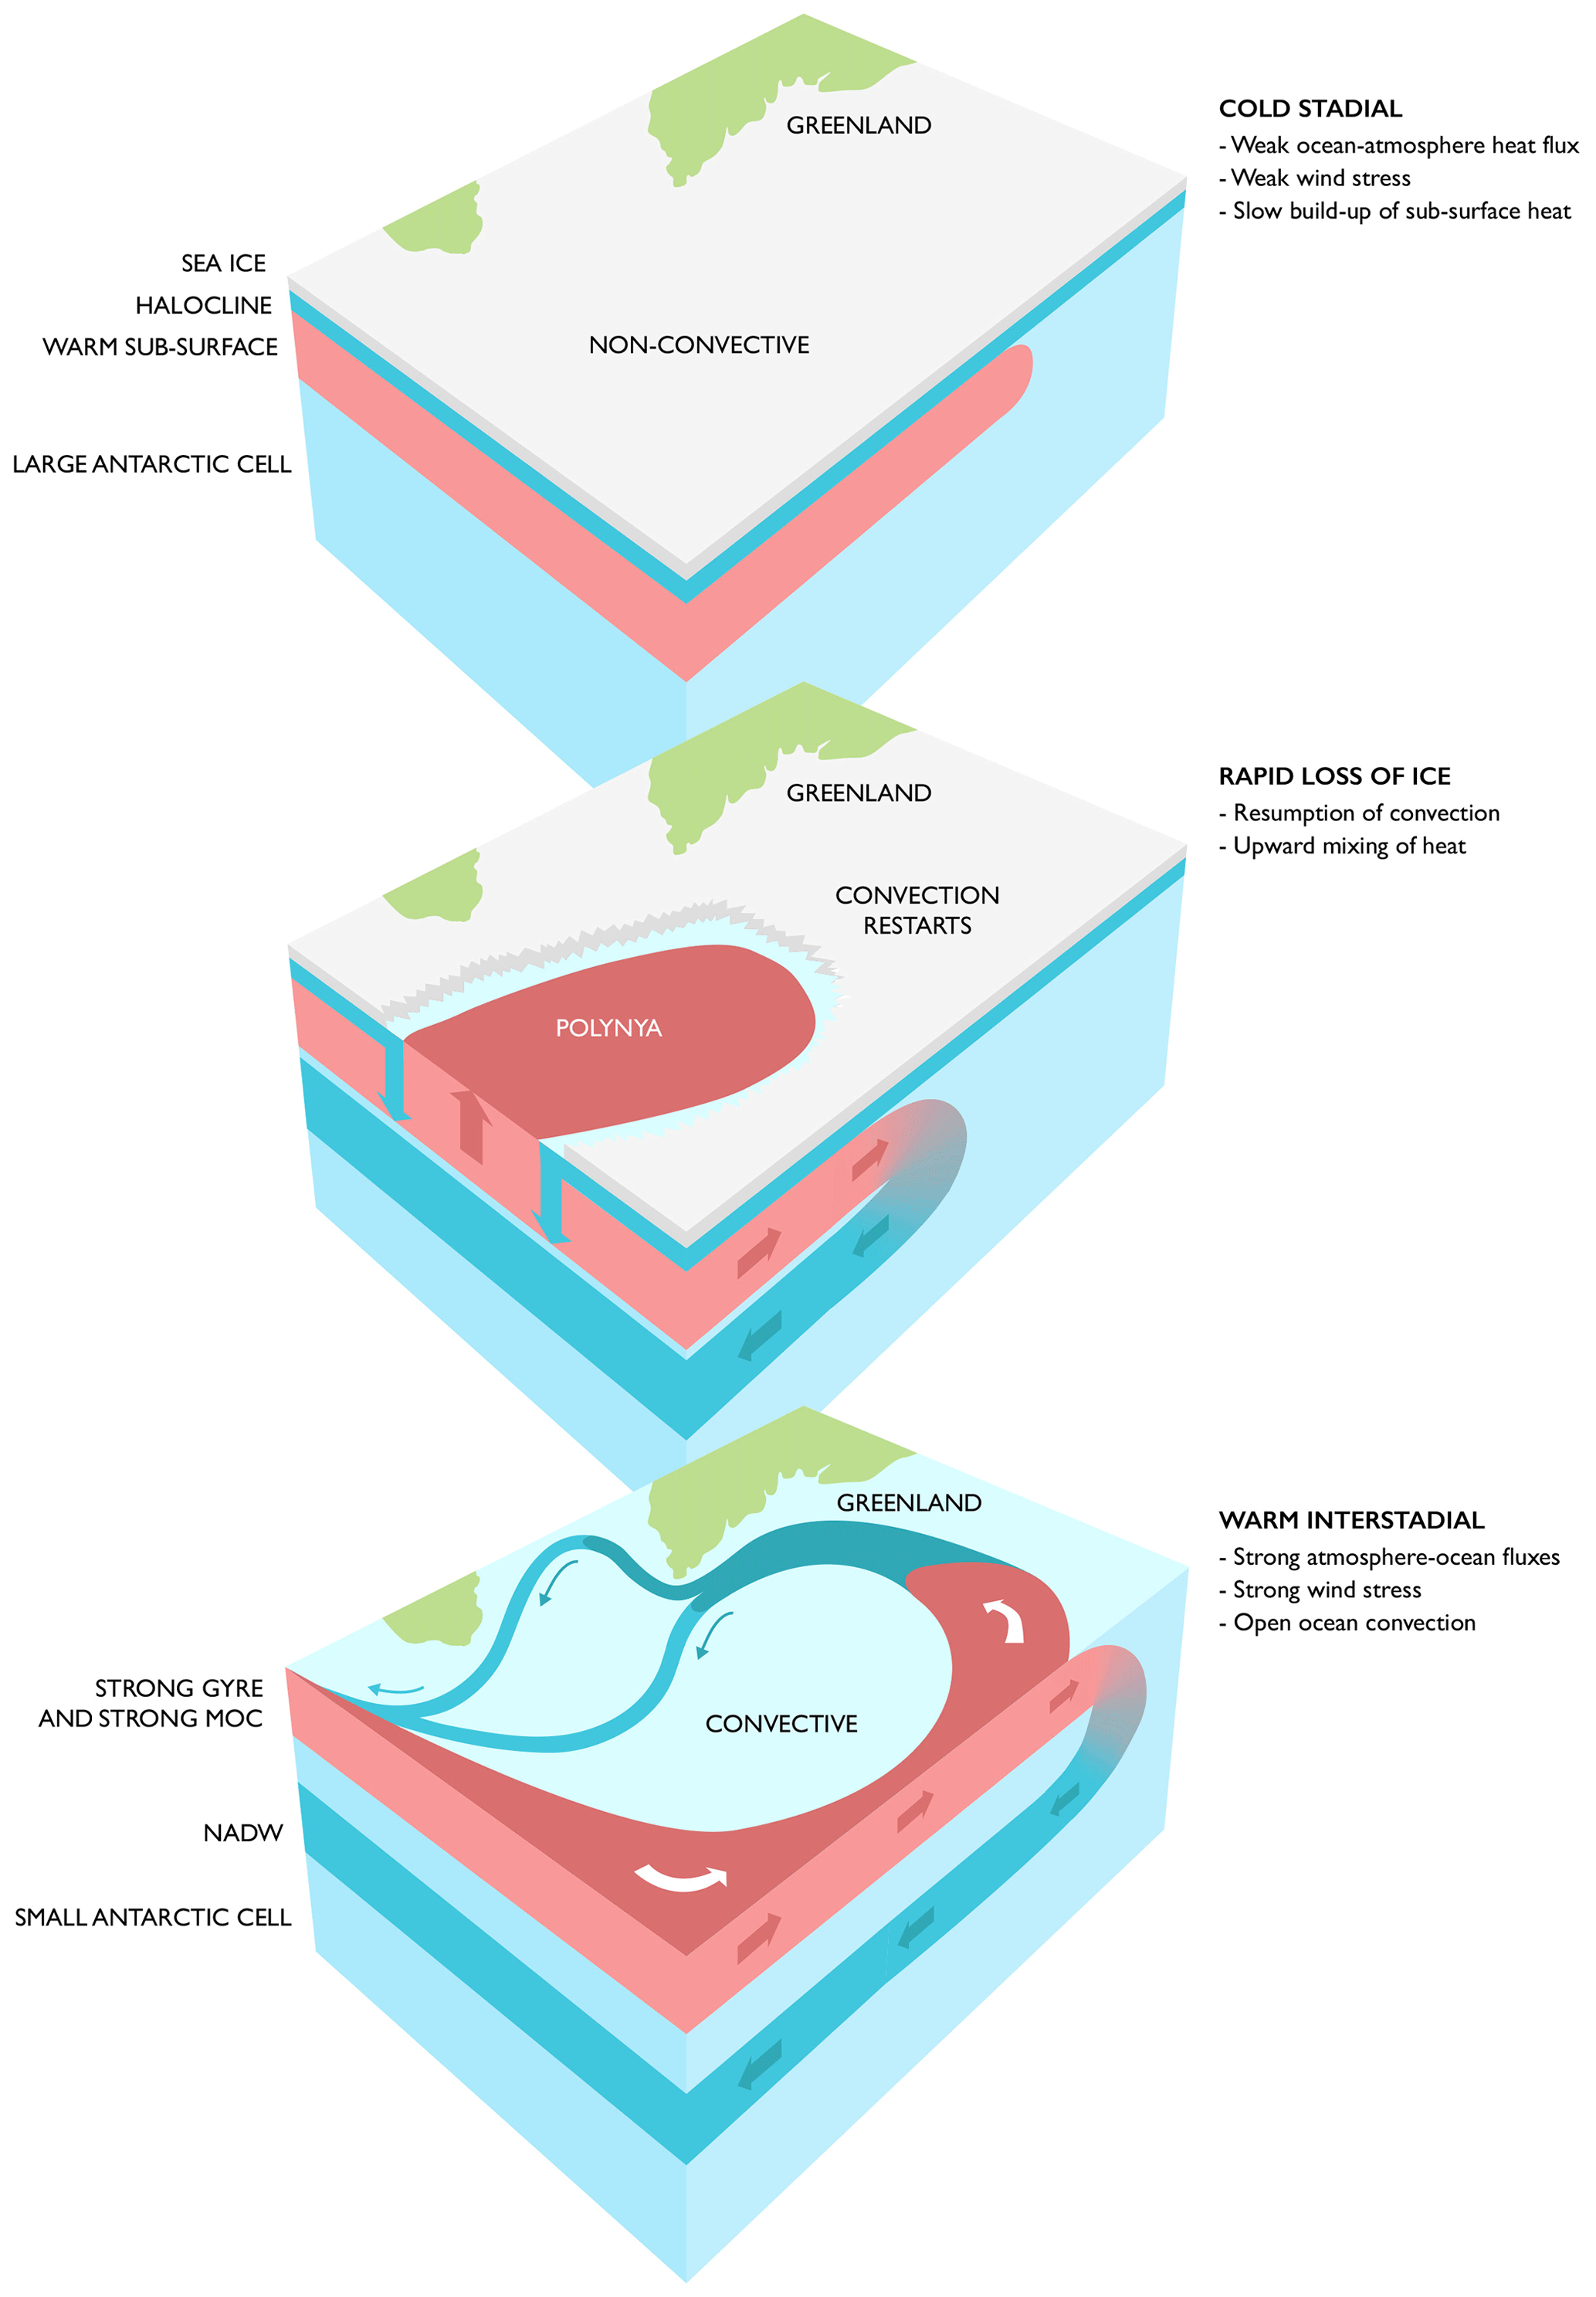
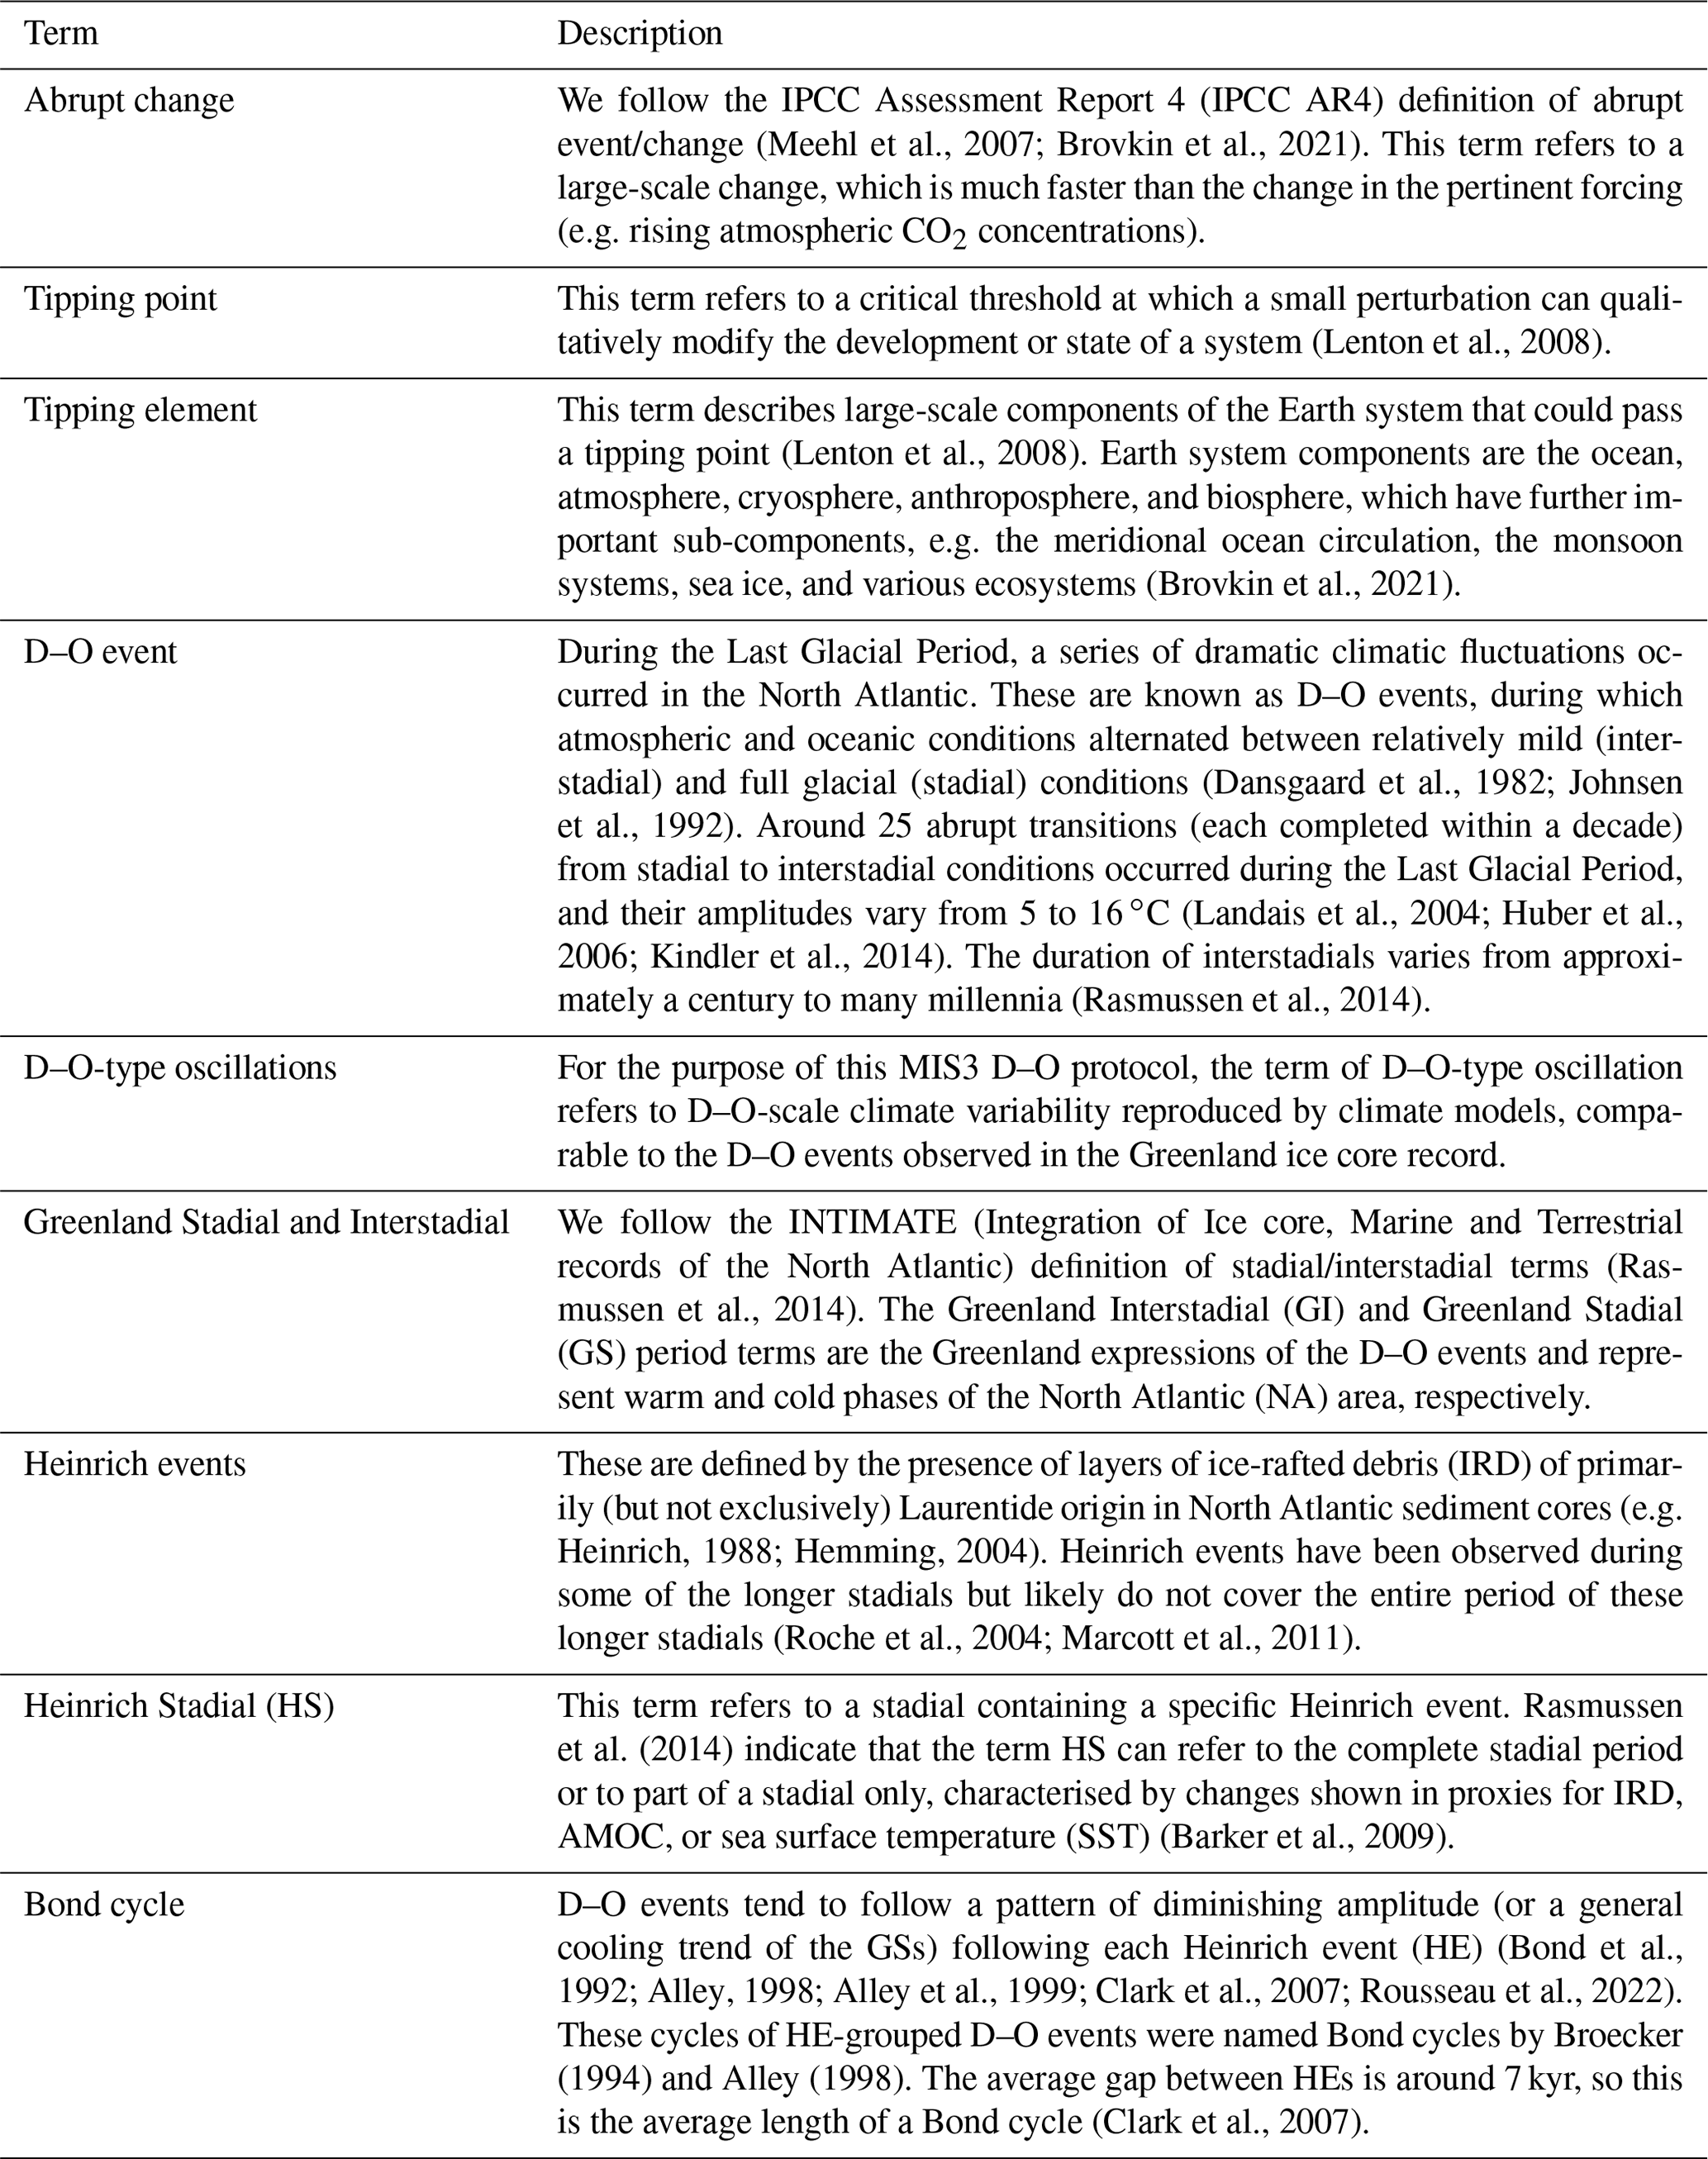
Figure 2Schematic depicting the transition from GS to GI conditions, i.e. a D–O warming event.
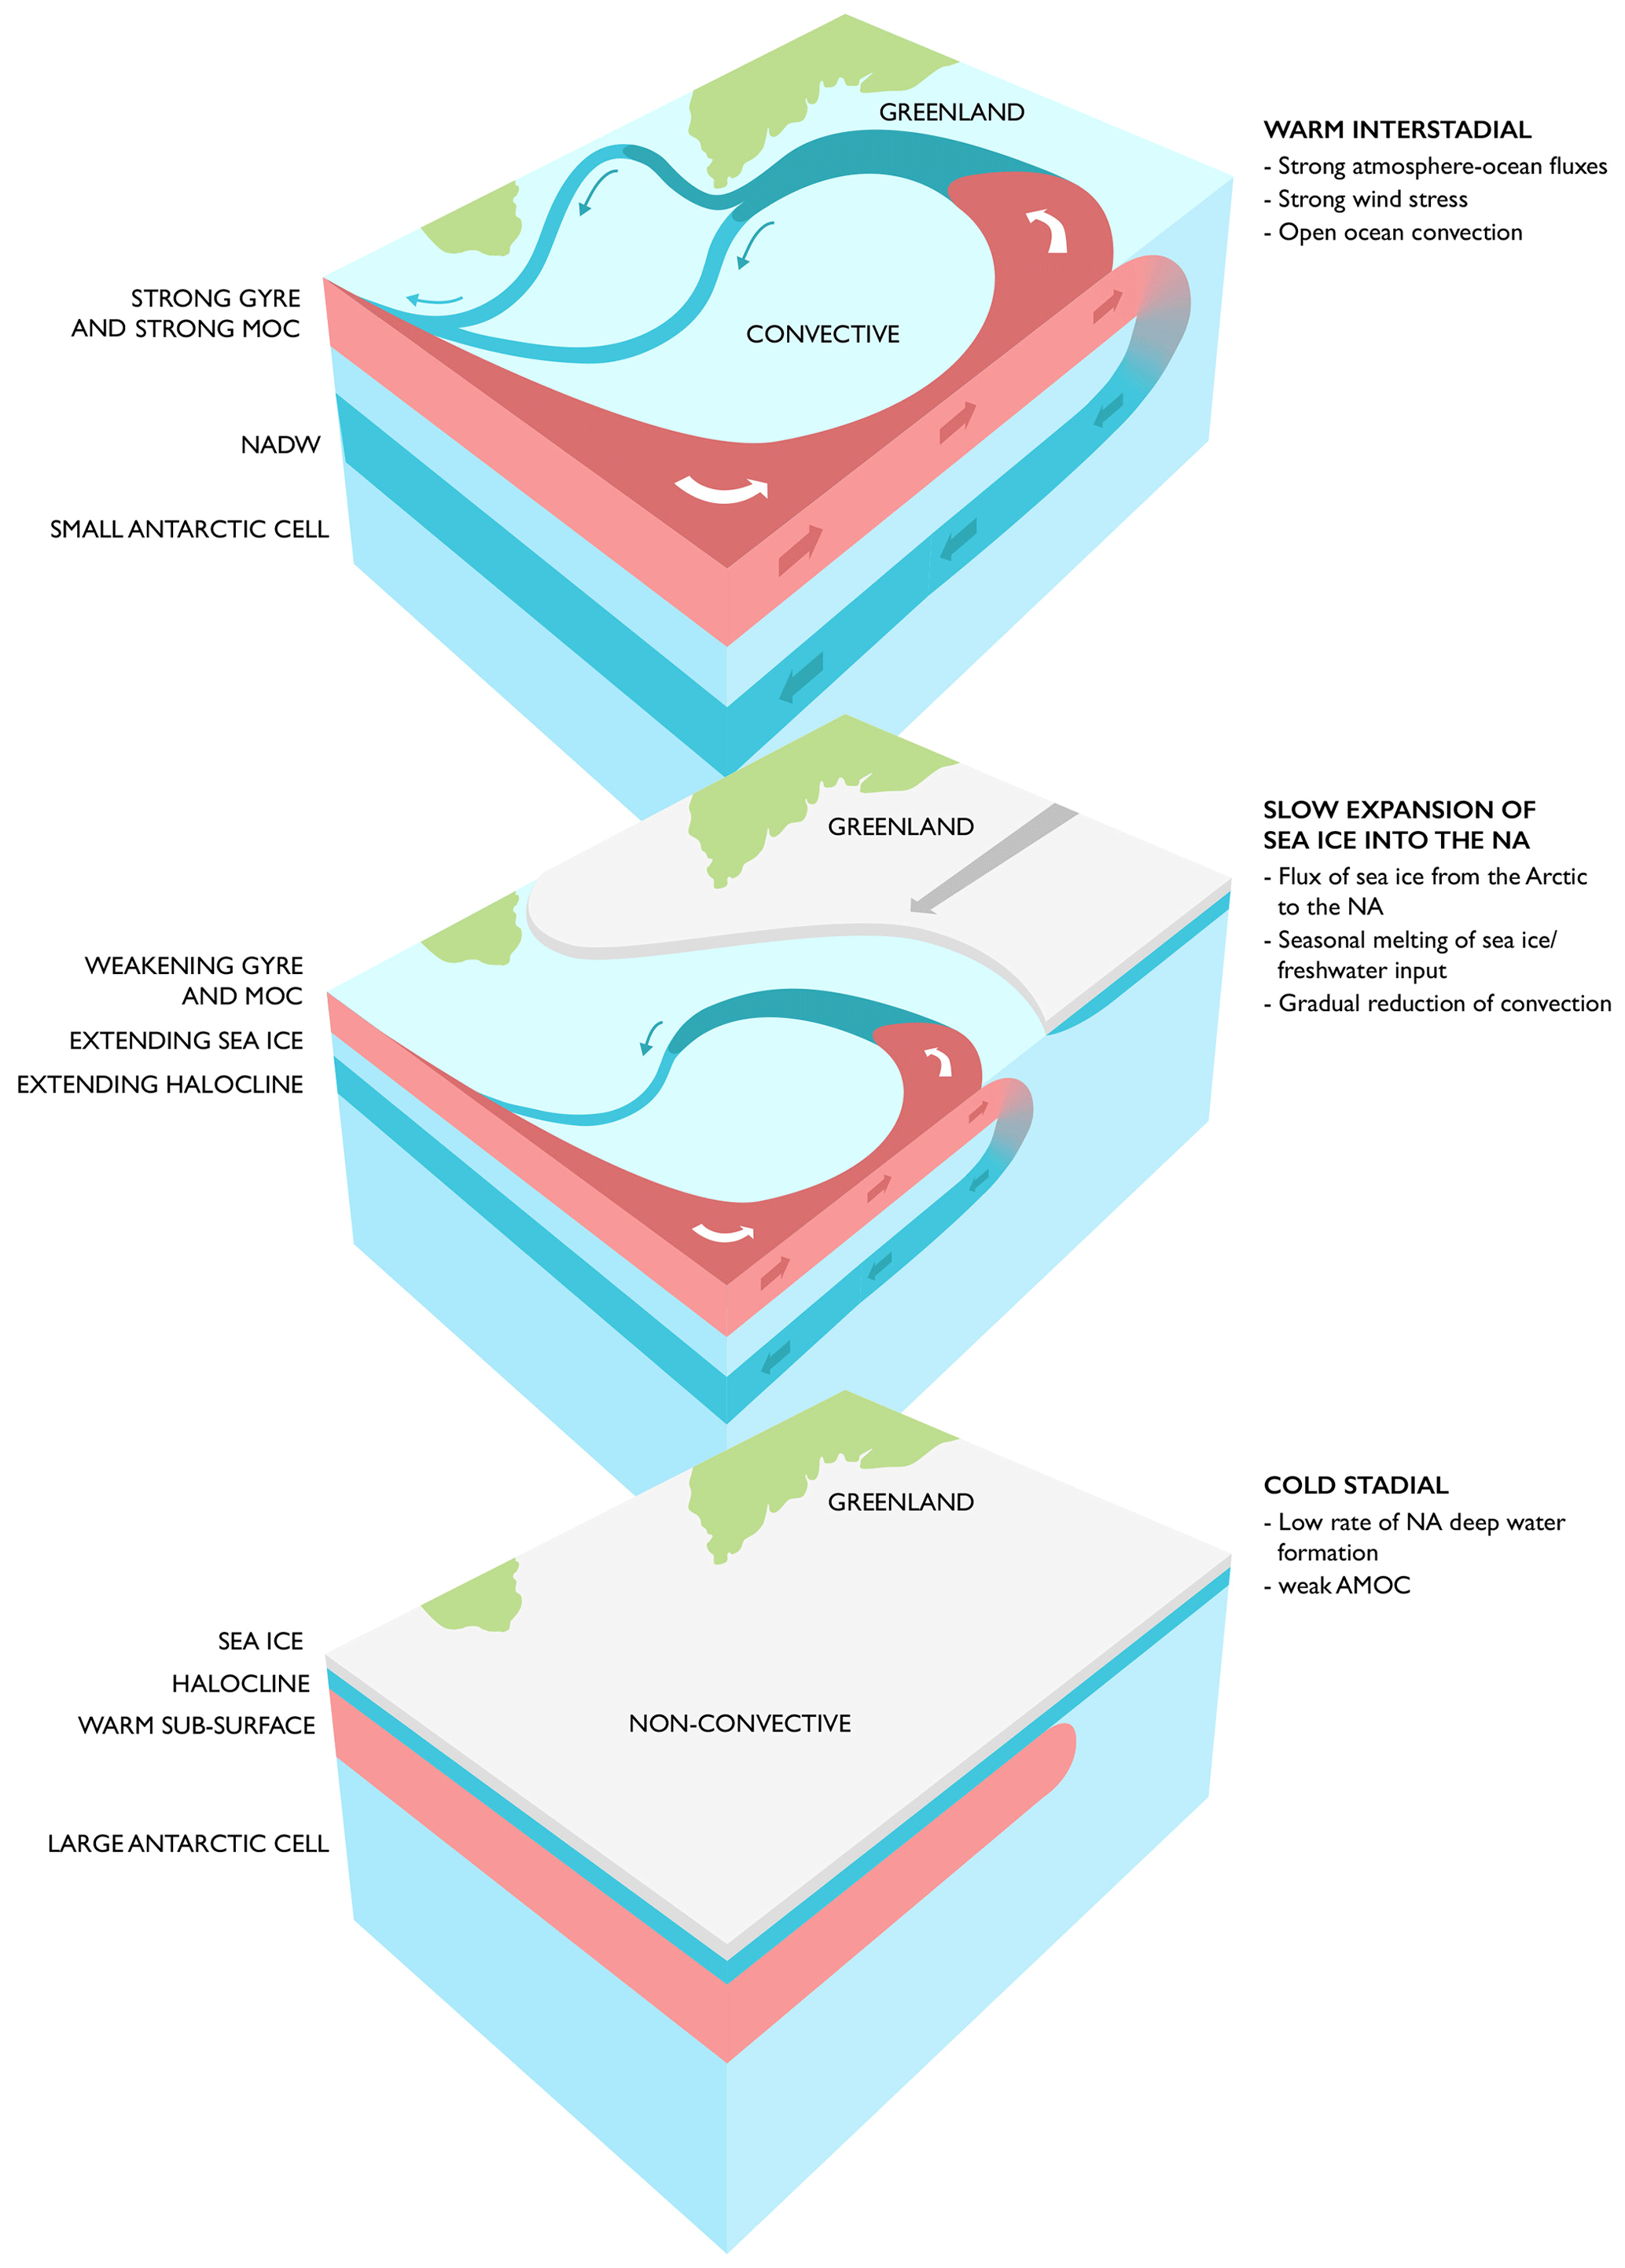
Figure 3Schematic depicting the transition from GI to GS conditions, i.e. a D–O cooling event.
Sea ice can act as both a slow and fast positive feedback on AMOC-induced changes in climate. Extensive stadial sea ice cover during a weak AMOC state cools Greenland and suppresses atmosphere–ocean exchange of heat and oceanic convection in the North Atlantic (Li et al., 2005, 2010). This also leads to a slow build-up of heat in the North Atlantic sub-surface. Foraminifera from marine sediment cores offer evidence to back up the fact that this sub-surface warming occurred before the onset of fast D–O warming events (Rasmussen and Thomsen, 2004; Singh et al., 2014; Dokken et al., 2013). This heat build-up sets up the conditions for subsequent fast losses of GS sea ice.
Wind-driven and AMOC- and sea-ice-linked salinity changes also play a crucial role in D–O positive and negative feedbacks. Indeed the net freshwater transport in the Atlantic Basin by the AMOC can be used to assess the stability regime of the AMOC (Rahmstorf, 1995; Huisman et al., 2010). The interaction of subpolar and tropical salinity anomalies at the surface and in the sub-surface (Jackson and Vellinga, 2013) and possible roles of the intertropical convergence zone and freshwater export through the Fram Strait are also important in D–O-related salinity feedbacks. Klockmann et al. (2018) note that if the subtropical gyre shifts northward, and the subpolar gyre contracts, an inflow of salty subtropical water extends over the entire Atlantic Basin east of the Mid-Atlantic Ridge. This inflow can supply salty water to the deep-convection sites in the Iceland Basin and Irminger Sea and help maintain continuous deep convection and a strong AMOC even at low CO2 concentrations (Brown and Galbraith, 2016; Klockmann et al., 2018; Guo et al., 2019b; Muglia and Schmittner, 2015; Sherriff-Tadano et al., 2018), thus preventing the initiation of GS-like conditions. Where the AMOC does enter a weak state for a prolonged period, and the climate enters a GS, a build-up of heat in sub-surface waters and salt in the tropical Atlantic can enable the very rapid resumption of the AMOC (Lynch-Stieglitz, 2017), with the upward mixing of heat from the sub-surface and importation of salt from the tropical Atlantic via gyre mechanisms (Peltier and Vettoretti, 2014).
The importance of vertical (diapycnal) mixing in the ocean for these long-timescale, D–O-type instabilities has long been recognised (Welander, 1982). However, we note that the different ocean and climate models (Table A1) parameterise diapycnal mixing in very different ways (e.g. Nilsson et al., 2003; de Lavergne et al., 2019). The lack of a single consistent parameterisation and differences in the strength of diapycnal mixing across climate models mean it is to be expected that some models will produce D–O-like oscillations “out of the box” under MIS3 boundary conditions, but others may require changes or tuning to their diapycnal mixing parameters. Even within the same model, a large range of diapycnal diffusivities may yield steady states that satisfy common plausibility constraints such as AMOC transport and sea ice distribution (see e.g. Holden et al., 2010). This is partly because wind-driven Southern Ocean upwelling plays a complementary role in diapycnal mixing in setting the steady-state overturning (Samelson, 2004) and partly because surface buoyancy forcing controls the relative strength of the upper (Atlantic) and lower (Antarctic) overturning cells (Oliver and Edwards, 2008). A realistic AMOC transport may be obtained due to compensating biases in these processes, which has serious implications for whether AMOC feedbacks (necessary for capturing D–O behaviour) are represented in an adequate manner within these models.
Figures 2 and 3 show some of the key states, processes, and ocean–sea ice feedbacks that enable D–O events. Following Lohmann and Ditlevsen (2019), D–O events can be broken down into four periods: (1) cold-stadial state (Fig. 2a), (2) rapid-warming phase governed by very-fast-timescale mechanisms (Fig. 2b), (3) warm-interstadial state (Figs. 2c and 3a), and (4) gradual-cooling phase (Fig. 3b) followed by a faster abrupt transition into a cold-stadial phase (Fig. 3c). For some of the D–O events, the magnitudes of the warming transitions are on the order of 10 ∘C in a decade, while the slow cooling in the interstadials is on the order of a few degrees in a millennium (the sawtooth shape) (Lohmann and Ditlevsen, 2019). This picture of rapid retreat of North Atlantic sea ice (Spolaor et al., 2016; Dokken et al., 2013) associated with the resumption of convection and the AMOC, alongside an upwards mixing of salt and heat, followed by a slower-cooling phase back into stadial conditions, matches accumulation, temperature, and water isotopes retrieved from Greenland ice core records of D–O warming events (Li et al., 2005, 2010; Sime et al., 2019).
2.2 The role of Northern Hemisphere ice sheets
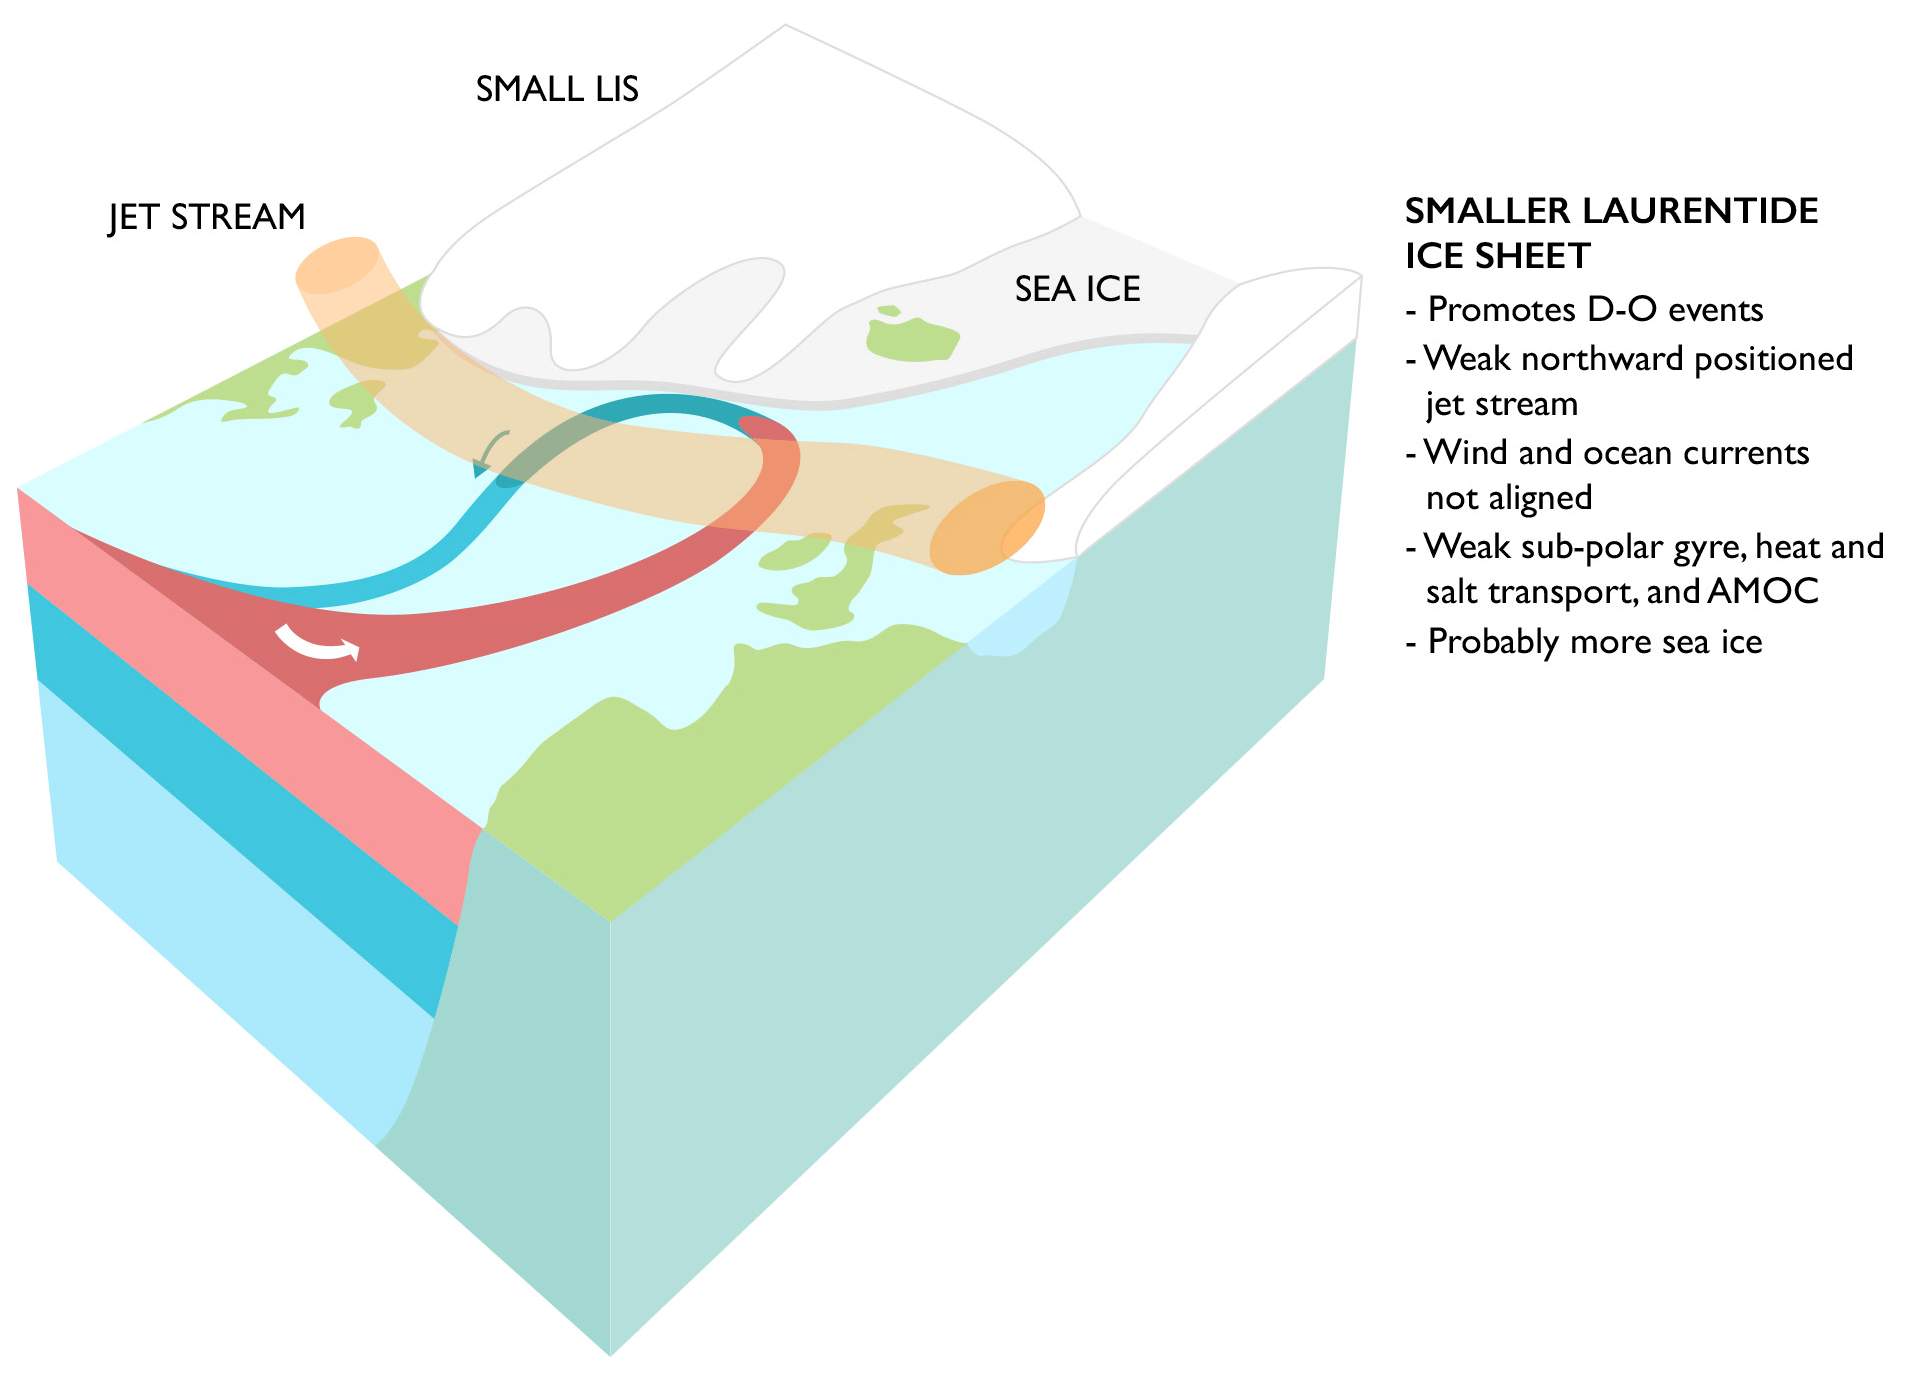
Section 2 and Table A1 suggest that large Northern Hemisphere ice sheets and the wind regime associated with these can contribute to a strong AMOC, which stabilises the North Atlantic and prevents D–O events. Thus ice sheets have a critical role to play in setting up the conditions for D–O events (Zhang et al., 2014; Klockmann et al., 2018; Brown and Galbraith, 2016; Muglia and Schmittner, 2015; Sherriff-Tadano et al., 2018). Figures 4 and 5 show some of the key mechanisms and feedbacks that are behind a state of reduced likelihood for D–O events and a potentially D–O-type oscillating state, respectively.
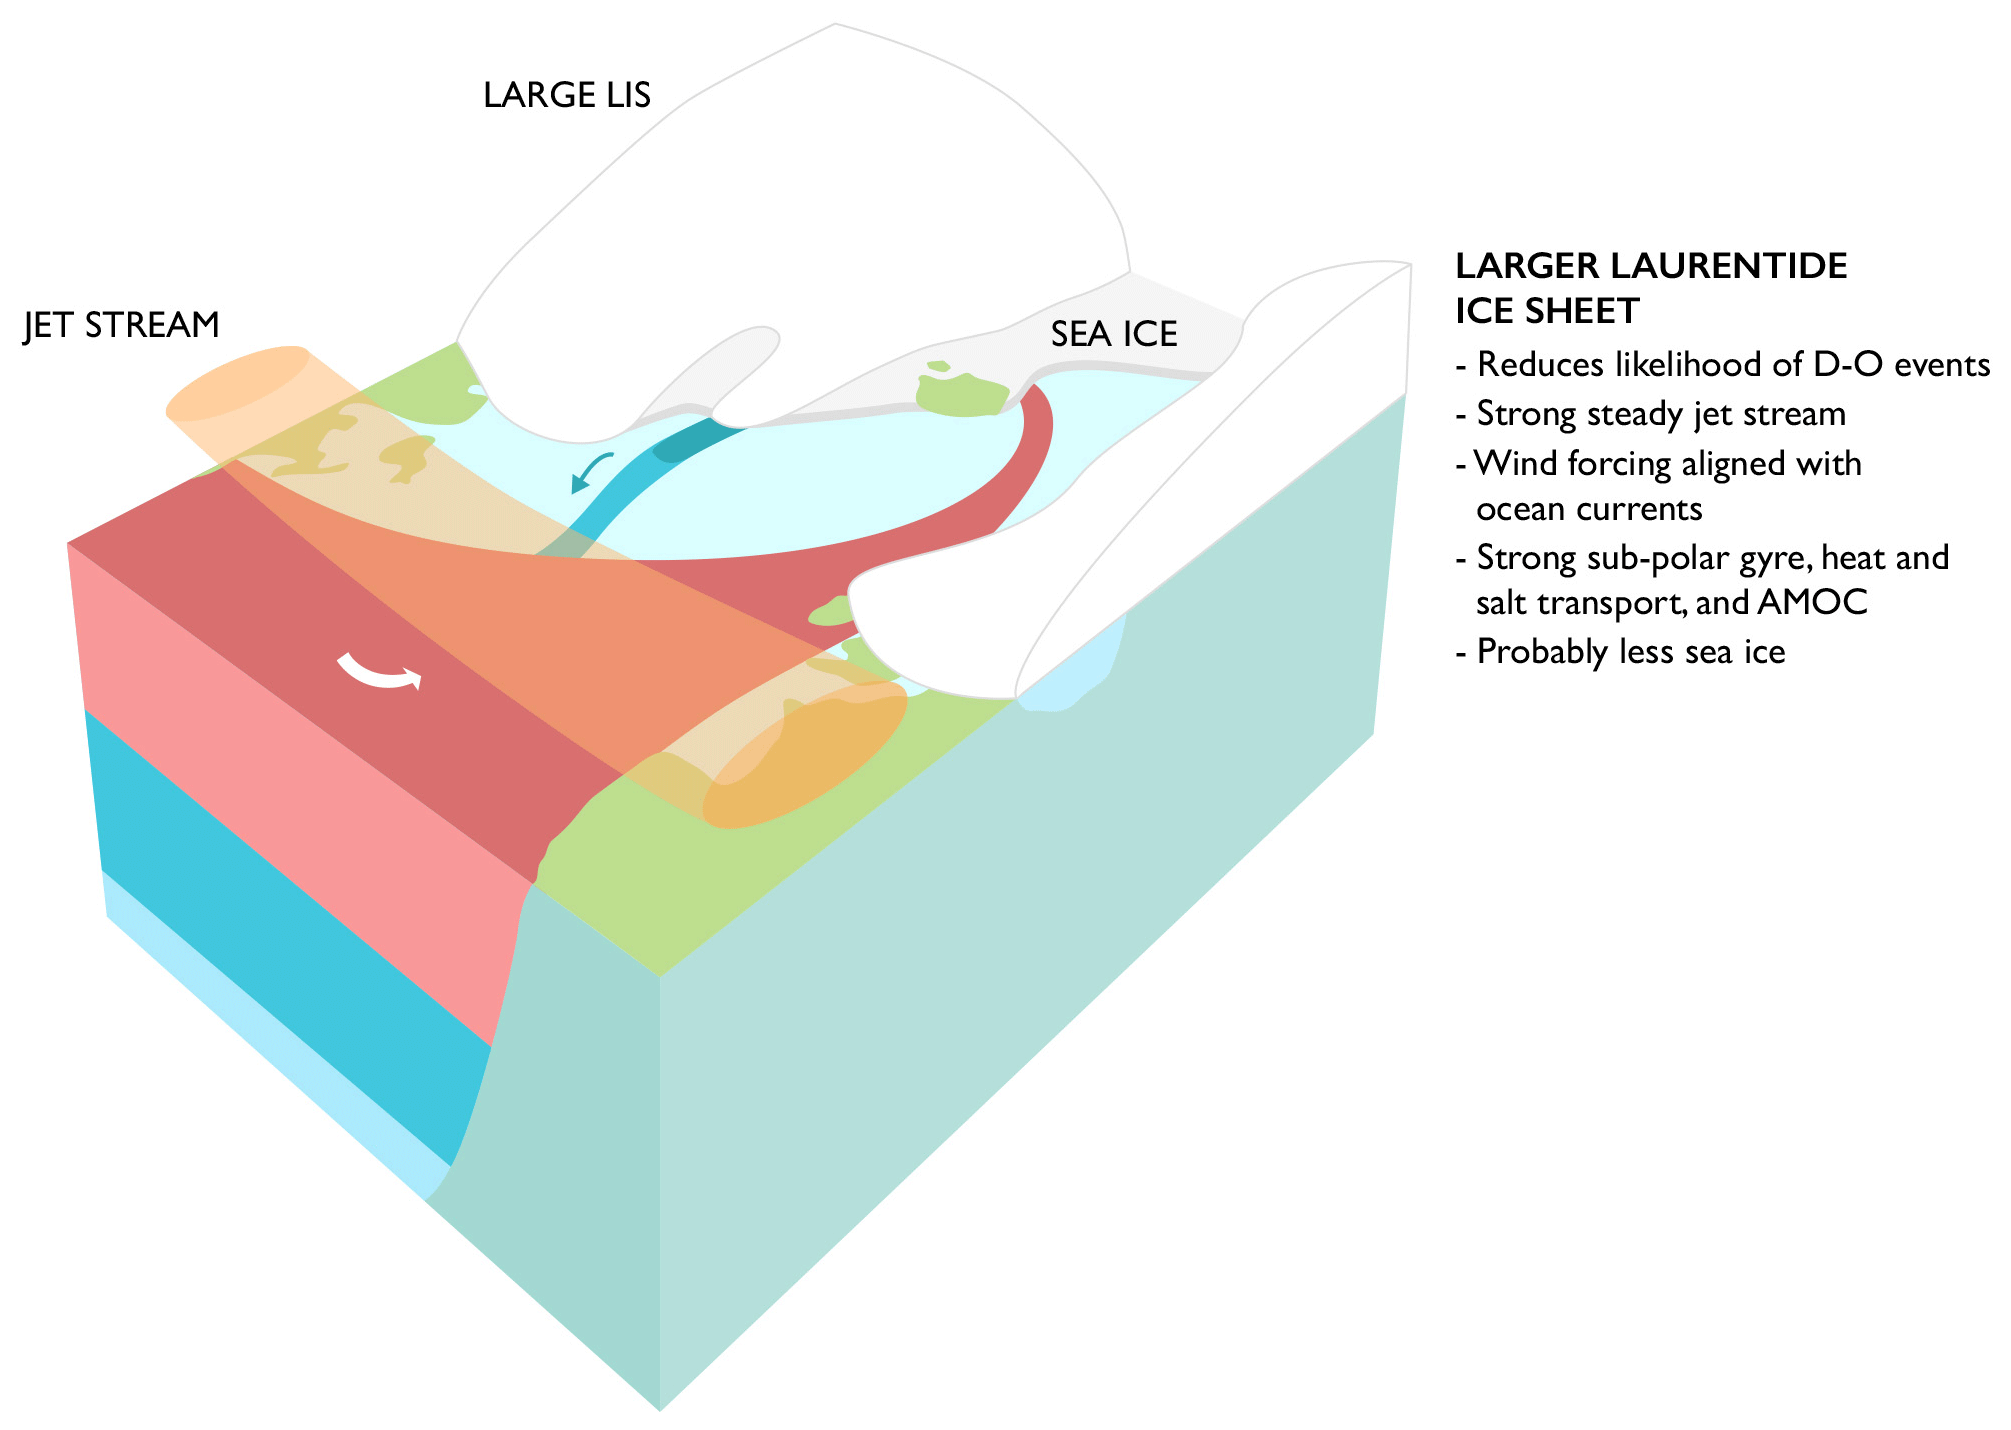
The Northern Hemisphere Eurasian ice sheet was most probably limited to mountainous areas during mid-MIS3 (Helmens, 2014; Hughes et al., 2016), and its impact on D–O dynamics was probably relatively small. However, the size and presence (or absence) of the Laurentide Ice Sheet (LIS), which has elevations reaching a maximum of approximately 3000 m (Abe-Ouchi et al., 2015) at the LGM, does appear to cause important and robust (across multiple models) changes to Northern Hemisphere atmospheric circulation and resultant wind forcing of the ocean. LIS-dependent wind changes influence the subpolar gyre and the stability of the atmosphere–ice–ocean coupled system (Li and Born, 2019; Zhang et al., 2014).
A larger LIS (especially its height) causes stronger Northern Hemisphere winds (Li and Battisti, 2008; Pausata et al., 2011; Hofer et al., 2012; Ullman et al., 2014; Löfverström et al., 2014; Merz et al., 2015) as well as an amplified stationary wave over North America (Manabe and Broccoli, 1985; Cook and Held, 1988), and it causes the North Atlantic glacial jet to be more stable due to differences in wave–mean flow feedbacks (Riviere et al., 2010) and alters variability in the large-scale atmospheric circulation, especially in the North Atlantic (Justino and Peltier, 2005; Pausata et al., 2009; Riviere et al., 2010). In addition, LIS height could control the sea ice coverage and gyre circulation by shifting the westerlies over the North Atlantic region (Zhang et al., 2014).
LIS altered winds that have wide implications for D–O-relevant tipping elements (Seager and Battisti, 2007; Wunsch, 2006). Li and Born (2019) note that, first, the presence of a large LGM-type LIS is linked to a strong, more zonal and equatorward-shifted North Atlantic jet, which weakens atmospheric heat transport into the North Atlantic (van der Schrier et al., 2010) and favours episodes of Greenland blocking (Madonna et al., 2017). Both could trigger the atmosphere–ice–ocean feedbacks that cause abrupt climate change in this area. Second, a steadier and stronger North Atlantic jet strengthens the wind-driven component of the subpolar gyre (Li and Born, 2019). Given that at latitudes north of about 45∘ N, the subpolar gyre, which is essentially wind-driven, plays a crucial role in the northward transport of heat and salt and is strongly linked to the AMOC (e.g. Jungclaus et al., 2013); wind-driven changes in this gyre have a strong impact on the density gain in the North Atlantic.
In many simulations with a large LIS (LGM-like ice sheets), the subtropical gyre can shift northward and cause an inflow of salty subtropical water over deep-convection sites, contributing to continuous deep convection and a strong AMOC even at low CO2 concentrations (Brown and Galbraith, 2016; Klockmann et al., 2018; Guo et al., 2019b; Muglia and Schmittner, 2015; Sherriff-Tadano et al., 2018; Zhang et al., 2014). Similarly, Zhang et al. (2014) note that a higher LIS can promote less South Labrador Sea ice export to the north-eastern North Atlantic (which reduces sea ice concentration) to permit deep convection and shift the core of westerlies northwards, strengthening subtropical gyre for heat and salt transport (Zhang et al., 2014).
For these reasons, large LGM-type ice sheets, particularly a large LIS, tend to lead to a density gain over the North Atlantic, and the northward salt transport is enhanced with respect to the PI ice sheet case. For many models, but not all, this tends to lead to more active convection in the North Atlantic and a strong AMOC (across a wide range of CO2 concentrations). That said, the AMOC in many LGM simulations is likely too strong (Klockmann et al., 2018; Kageyama et al., 2021b). Thus the AMOC is far away from a tipping point with LGM-size ice sheets for many models (Zhang et al., 2014; Klockmann et al., 2018; Guo et al., 2019b).
In some simulations with reduced ice sheets, the jet stream shifts northwards, leading to regional cooling and a rise in seasonal sea ice concentration over the subpolar gyre region (Armstrong et al., 2021). This freshens the area and lowers deep-water formation, which weakens the subpolar gyre, and as a result the simulations are more prone to enter a weak-convection, weak-AMOC mode which is conducive to D–O-type oscillations (Klockmann et al., 2018; Armstrong et al., 2021). Thus, with intermediate MIS3 LIS, i.e. reduced in its height compared to the LGM, multiple AMOC states are more likely (Zhang et al., 2014; Kawamura et al., 2017; Zhang and Prange, 2020; Armstrong et al., 2021; Klockmann et al., 2018).
Although the choice of a time within MIS3 for a D–O baseline experiment should be unimportant, given that in reality D–O events occurred during the whole of the MIS3, our analysis of existing simulations, boundary conditions, and mechanisms above suggests that there are periods which may be particularly conducive to D–O events occurring in models. Oscillatory D–O-type behaviour appears to be more likely but is not guaranteed (Guo et al., 2019b; Zhang and Prange, 2020) when models are run with intermediate or low MIS3 CO2 values and ice sheets, i.e. reduced in size compared to the LGM (Brown and Galbraith, 2016; Kawamura et al., 2017; Klockmann et al., 2018; Zhang and Prange, 2020; Galbraith and de Lavergne, 2019; Zhang et al., 2014; Vettoretti et al., 2022), and particularly without a high LIS.
The impact of orbital parameters has been investigated in less detail than the role of GHGs and ice sheets. Using the model COSMOS, Zhang et al. (2021) demonstrated that under intermediate glacial conditions, obliquity appears to play a significant role in the occurrence of D–O-type behaviour. In particular, the orbital parameters at 40 ka do not produce D–O-type behaviour, whilst at 34 ka lower obliquity (∼22.6∘) leads to D–O-type behaviour (see Fig. 2 from Zhang et al., 2021). Additionally, the MIROC4m model produces D–O-type oscillations (under mid-glacial conditions) and low obliquity (22.9∘) (Kuniyoshi et al., 2022). From these COSMOS and MIROC4m results, we deduce that low obliquity seems to be conducive to D–O behaviour in models.
These considerations suggest that the interval starting at 38 to 32 ka is a good choice for the proposed baseline experiment: it is characterised by (1) a rather regular sequence of D–O events (Fig. 1) and (2) has the ideal intermediate MIS3 ice sheet configuration conducive to generating D–O-type quasi-oscillations (Sect. 2).
A baseline simulation needs to be run for a sufficient duration to allow the strong positive feedbacks, together with long-timescale negative feedbacks, that enable D–O-type oscillations. The analysis of existing simulations (Sect. 2) suggests that this should be a minimum of 5000 years (Peltier and Vettoretti, 2014; Kleppin et al., 2015; Sidorenko et al., 2015; Brown and Galbraith, 2016; Klockmann et al., 2018, 2020). However, given computational constraints, a minimum duration of around 2000 years, with a spin-up period of 1000 years, may be a more practical minimum requirement for most modelling groups. It would, however, be important to examine and document key metrics for model drift (such as top-of-atmosphere radiation imbalance and deep-ocean or global-mean ocean temperature) during the initial spin-up. The exact length of spin-up is thus subject to discretion of each modelling group based on these key metrics.
There are two obvious possibilities for spinning up the MIS3 control experiment (MIS3-cnt). The baseline experiment could be initialised from the end of either a well-spun-up LGM or PI experiment. Other possibilities could be to spin up from a linear combination of LGM and PI states (as done in Klockmann et al., 2016, 2018) or spinning up from present-day observations (as done in Guo et al., 2019b). Modelling groups are encouraged to choose whichever option is more feasible/convenient for them. In the event that several spin-up options are available, short spin-ups with diagnosed top-of-atmosphere (TOA) imbalance or global-mean ocean temperature could help distinguish the faster spin-up option. It is worth noting that initial ocean state (i.e. Atlantic salinity stratification) does play a role in abrupt AMOC change and associated feedbacks (Zhang et al., 2013; Knorr et al., 2021), the impacts of which shall be considered and evaluated in the future.
We suggest performing a MIS3-cnt experiment centred at 34 ka using GHG and orbital conditions for 34 ka (Fig. 6) and an ice sheet configuration as outlined below (Sect. 3.1 and 3.2).
We acknowledge that some models might not oscillate under the proposed 34 ka baseline scenario. Indeed, this is expected for NorESM, which under 38 ka conditions is in a stable regime, and the model state seems to be far from a possible tipping point. In spite of that, standardised MIS3 simulations which do not show D–O-like behaviour are still highly valuable for exactly the same reasons that LGM simulations are relevant to the wider modelling community. These standardised MIS3 simulations could contribute to progress in the overarching CMIP6 questions 1 and 2 (Eyring et al., 2016): how the earth system responds to forcing and what the origins and consequences of systematic model biases are. With a larger number of standardised MIS3 simulations, we would be able to progress in the following research areas/questions:
-
Are state-of-the-art climate models capable of representing D–O events under more realistic MIS3 conditions? Benchmarking these simulations will deliver a measure of how well models simulate abrupt changes and tipping events.
-
Standardised MIS3 simulations can help explore the existence of a theoretical sweet spot for millennial activity in current climate models (Barker and Knorr, 2021). Being close to or within the sweet spot, the AMOC is characterised by high sensitivity to transient and/or noisy climatic forcing (Zhang et al., 2014; Lohmann and Ditlevsen, 2018) or by self-oscillating behaviours (Zhang et al., 2021).
-
If models are too stable to simulate abrupt transitions, what are the processes that contribute to relative levels of model stability?
-
In addition, a larger number of standardised MIS3 simulations could encourage the creation of new data sets, improving model–data evaluation.
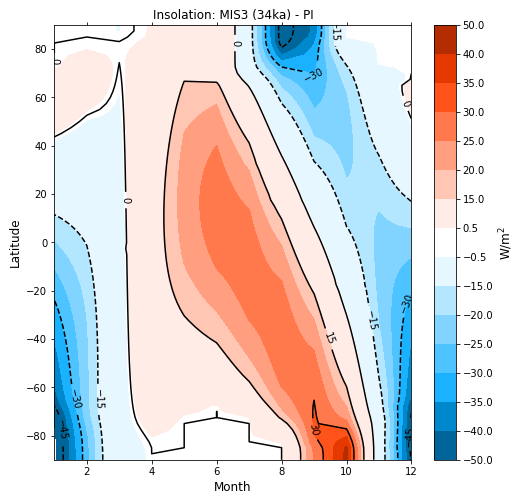
Figure 6Monthly zonal-mean MIS3 (34 ka)–PI anomalies of the top-of-atmosphere short-wave incoming radiation (W m−2).
3.1 Atmospheric trace gases
MIS3 atmospheric CO2 values varied between a maximum of ∼ 233 ppm and a minimum of ∼187.5 ppm (Table 2, Fig. 1; Bauska et al., 2021). Interestingly, increases of around 5 ppm happened during the abrupt warming of most D–O events, and increases of up to 10 ppm happened within some Heinrich stadials (Bauska et al., 2021). GHG forcing is critical to model stability. Low (LGM-like) to intermediate (MIS3) CO2 concentrations tend to be associated with abrupt D–O-type AMOC transitions in models (Sect. 2; Klockmann et al., 2018; Zhang et al., 2017, 2014; Brown and Galbraith, 2016; Vettoretti et al., 2022). We thus suggest performing the MIS3-cnt experiment using the GHGs values specified in Table 2 and keeping these values fixed for the whole duration of the simulation, including the spin-up.
3.2 Northern Hemisphere ice sheets
Constraining MIS3 ice sheet boundary conditions is a challenge. Scarcity and fragmentation of evidence (Kleman et al., 2010; Batchelor et al., 2019) are an issue. In particular, it is difficult to determine the size and shape of the ice sheets during MIS3 because subsequent larger LGM configurations have overridden and destroyed evidence of the position of the margins of these smaller ice sheets.
Global sea level fluctuations during the mid-MIS3 were driven nearly exclusively by the LIS (Gowan et al., 2021). Global-average sea level remained above − 55 m for the period between 30–55 ka. From glacial isostatic modelling and geological constraints, a global-mean sea level between − 30 and − 50 m is inferred (Dalton et al., 2022). For much of MIS3, since the Eurasian ice sheets and the Cordilleran Ice Sheet were likely restricted to mountain-based caps (Helmens, 2014; Hughes et al., 2016; Clague and Ward, 2011), the primary control on ice volume is assumed to be from the LIS. Recent work in the area of the Hudson Bay (Dalton et al., 2016, 2019; McMartin et al., 2019; Dalton et al., 2022) suggests that ice-free conditions may have occurred during mid-MIS3. This implies climatic conditions in this region similar to present (Dalton et al., 2017) and a LIS margin removed from the southern Hudson Bay. Similarly Tarasov et al. (2012) show a considerably lower and less extensive LIS compared to ICE-5G and ICE-6G (Peltier, 2004; Peltier et al., 2015) LGM ice sheet reconstructions. Pico et al. (2017) sea level curves are consistent with the estimated MIS3 ice sheet volumes from Batchelor et al. (2019). Using glacial isostatic adjustment modelling, Pico et al. (2017) also show that a small LIS can explain high MIS3 sea level estimates alongside the eastern coast of the United States. The synthesis of Batchelor et al. (2019) of numerical modelling results and empirical data provides additional support for a considerable reduction in the MIS3 LIS extent and very minimal European ice sheet.
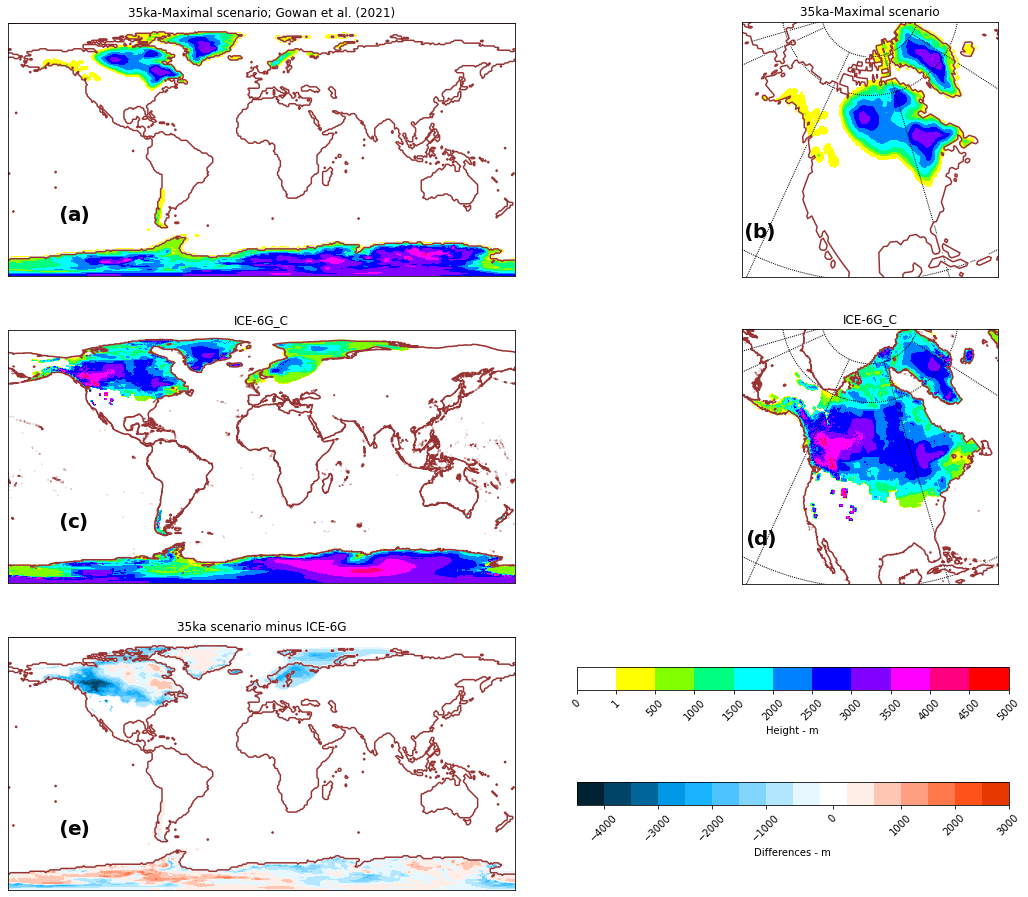
Figure 7MIS3 ice sheet reconstruction from (a, b) Gowan et al. (2021). Also shown for comparison is the (c, d) LGM ICE-6G ice sheet reconstruction from Peltier et al. (2015). The third row shows the differences between the MIS3 ice sheet reconstruction and the LGM ICE-6G reconstruction.
The recent MIS3 ice sheet reconstruction, PaleoMIST 1.0 (Paleo Margins, Ice Sheets, and Topography), was developed independently of far-field sea level records and indirect proxy records by Gowan et al. (2021). This reconstruction is based on trying to fit the evolution of ice flow indicators, as well as chronological constraints of ice-free conditions.
Gowan et al. (2021) provide a maximum and minimum MIS3 reconstruction, specifically for the Laurentide Ice Sheet. The maximum scenario is more consistent with recently discovered eastward-oriented, pre-LGM ice flow direction indicators found in south-eastern Manitoba (Gauthier and Hodder, 2020), so we currently consider it to be more likely. However, at 35 ka, the difference between the two scenarios is minor. The difference is primarily with the thickness (and therefore also topography) of the ice sheet, rather than extent, but it amounts to less than 1 m of sea level equivalent. The 35 ka time slice represents conditions after Heinrich Event 4 (Andrews and Voelker, 2018), and the ice margin in the Hudson Strait retreated by about 350 km from the edge of the continental shelf. The ice margin elsewhere for the Laurentide Ice Sheet is based on chronological constraints, most of which are documented in the compilation by Dalton et al. (2019). The Cordillera Ice Sheet extent is based on evidence of relatively restricted ice cover during MIS3 (Clague and Ward, 2011). The Greenland Ice Sheet margin is set to be between the LGM and present-day extent. The Eurasian ice extent at 35 ka includes an advance of ice into the Baltic Sea, which happened after Heinrich Event 4 (Hughes et al., 2016). For East Antarctica, the margin is set to be the same as present. In West Antarctica, the margin at 35 ka is close to the shelf edge, as the maximum extent may have been achieved by 30 ka (Larter et al., 2014).
Given its strong evidence basis, we thus suggest the use of the maximum 35 ka PaleoMIST ice sheet configuration (Gowan et al., 2021). We note that the LIS is considerably reduced in size compared to the ICE-6G LGM reconstruction in the south-eastern margin (Fig. 7a, d); the Eurasian ice sheet (EIS) is also significantly smaller (Fig. 7a, d).
(Bauska et al., 2021)(Loulergue et al., 2008)(Schilt et al., 2010)(Berger et al., 1998)(Berger et al., 1998)(Berger et al., 1998)(Gowan et al., 2021)Table 2Summary of the boundary conditions (BCs) and forcings for the MIS3-cnt experiment.

Whilst the implementation of the ice sheet will differ between models, the steps of Kageyama et al. (2017) describe how to implement a glacial-state ice sheet in the IPSL climate model. For consistency, we likewise recommend that the same steps should be followed as far as possible. Since a reduced sea level can modify river courses, Kageyama et al. (2017) recommend that as a minimum, rivers should reach the oceans. Also, the ocean should be initialised with a salinity 0.6 PSU higher than the PI experiment to account for the sea level difference between the MIS3 and PI experiment (freshwater stored as ice on land) (Guo et al., 2019b).
The single ice sheet reconstruction MIS3 set-up summarised above contrasts with the PMIP4 LGM protocol, which provides three different possible ice sheet configurations (PMIP3, ICE6G-C, and GLAC-1D) for the tier 1 LGM experiment (Kageyama et al., 2017). This partially reflects the more limited knowledge of ice sheets in pre-LGM periods. Exploration of the effect of MIS3 ice sheet reconstruction uncertainties on climate models, particularly on model stability, would be valuable. For this purpose, further additional 34 ky/MIS3 ice sheet reconstructions would be very valuable.
3.3 Heinrich-event-preconditioned option
The term Heinrich-event-like “kick” was initially introduced by Peltier and Vettoretti (2014) to invoke a “kicked” salt oscillator hypothesis (pseudo-Heinrich-type behaviour) to induce D–O-type oscillations in an LGM simulation performed with the UofT-CCSM4. During the first 1000 years of the simulation as the model is spun up, and the ocean cools to reach a state consistent with glacial boundary conditions, there are two thermal thresholds during which the strength of the AMOC rapidly reduces (see Fig. 2 in Peltier et al., 2020). These abrupt transitions in the AMOC coincide with abrupt reductions in surface temperatures in the North Atlantic and abrupt expansions of sea ice coverage. During the second of these events, the AMOC is reduced to approximately 12 Sv, about half its strength in the pre-industrial control (Peltier et al., 2020). This event may resemble the impact of a Heinrich-event-like kick to the AMOC, though no freshwater perturbation was imposed (Peltier et al., 2020).
In a more recent study, Pedro et al. (2022) examine the CCSM4 simulations that show unforced D–O-type oscillations (Peltier and Vettoretti, 2014; Vettoretti and Peltier, 2018), but with the addition of a (freshwater) Heinrich-like event. (Pedro et al., 2022). The freshwater flux (0.05 Sv injected into the NA for 500 years) leads to (1) a 5 Sv weaker AMOC compared to the one seen in the unforced model stadial and (2) a stronger D–O warming transition into the interstadial phase (Pedro et al., 2022). Thus this type of HE preconditioning can trigger abrupt reductions in the AMOC strength and in NA surface temperatures and sea ice coverage, and it may also help induce a stadial state in other models, which is more conducive to unforced (D–O-type) oscillations (Pedro et al., 2022).
Given the importance of HEs to starting Bond cycles of D–O events, an additional experiment to investigate how HE meltwater preconditioning impacts the simulation of D–O-like oscillations under MIS3 boundary conditions would be valuable. HE freshwater preconditioning may, as in reality, be more conducive to a (Bond-cycle-like) sequence of spontaneous D–O-type oscillations (see Table 1).
The freshwater delivered during Heinrich event iceberg discharge suppresses the AMOC, leading to accumulation of heat in the Southern Hemisphere and in the North Atlantic sub-surface waters (e.g. Stocker and Johnsen, 2003). Estimates of the meltwater input into the North Atlantic during Heinrich events range between 2 and 15 m of sea level equivalent ice volume (Hemming, 2004; Chappell, 2002; Rohling et al., 2004; Roche et al., 2004; Roberts et al., 2014b; Siddall et al., 2008; Grant et al., 2014). It is logical to presume that these freshwater events are important in preconditioning the climate system with respect to D–O behaviour (Peltier and Vettoretti, 2014; Peltier et al., 2020; Pedro et al., 2022). Freshwater perturbations can trigger changes between AMOC states (e.g. Ganopolski and Rahmstorf, 2001; Timmermann et al., 2003; Stouffer et al., 2006; Hu et al., 2008; Kageyama et al., 2013; Roberts et al., 2014a; Sime et al., 2019), and a relatively small freshwater flux applied over convection areas can lead to a shutdown of the AMOC (e.g. Roche et al., 2010). Studies have shown similarities between observed global features of abrupt D–O changes and the behaviour seen in freshwater forcing (FWF) experiments (Liu et al., 2009; Menviel et al., 2014). However, the sensitivity of the AMOC to a wide range of freshwater inputs varies according to model, where the meltwater is added, and the background climate state (Ganopolski and Rahmstorf, 2001; Timmermann et al., 2003; Stouffer et al., 2006; Hu et al., 2008; Kageyama et al., 2013; Roberts et al., 2014a; Zhang et al., 2014). Given these various uncertainties, we suggest that it would be useful to run an additional experiment to investigate how preconditioning through a Heinrich-like (freshwater) event impacts the simulation of D–O-like oscillations under MIS3 boundary conditions.
The range of Heinrich event volumes calculated using ice sheet models varies from 24.2 to 125×104 km3 (MacAyeal, 1993; Dowdeswell et al., 1995; Marshall and Clarke, 1997; Hulbe, 1997), whilst isotope-based estimates and a precipitation balance approach have yielded 86, 649, and 946×104 km3 of ice volume (Hemming, 2004; Roche et al., 2004; Levine and Bigg, 2008). Roberts et al. (2014b) and using a sediment modelling approach, estimated a discharge of 30 to 120×104 km3 of ice volume. Some of the spread in these estimates could be because the relationship between the oxygen isotope record, sea level, and meltwater volume is not constant when ice is lost from marine basins, such that the use of oxygen isotopes for calculating Heinrich event volumes may produce unrealistically high values (Gasson et al., 2016; Hemming, 2004; Roberts et al., 2014b). There is also some uncertainty about the duration of the Heinrich events, with some previous studies suggesting that they could be as short as 250 years (Hemming, 2004) and others suggesting that a duration of 500 years is more typical (Roberts et al., 2014b). These considerations suggest that it is possible to justify the use of anywhere between 0.02–0.6 Sv freshwater flux over 500 years or 0.04–1.2 Sv over 250 years. More recent estimates of Heinrich event magnitudes tend to favour the lower end of this range. If all forcings are set to MIS3-cnt values, and the Heinrich event freshwater flux is distributed across the North Atlantic, this could yield a range of stadial climates (Sime et al., 2019; Zhang and Prange, 2020). After 250–500 years this freshwater forcing should be switched off.
D–O events are abrupt, large climate changes that punctuated the Last Glacial Period. There is uncertainty whether current IPCC-class models can effectively represent the processes that cause D–O events. We have shown that reduced ice sheets relative to LGM, low obliquity values, and low to medium MIS3 CO2 values are more likely to lead to unforced quasi-oscillatory D–O-type behaviour. However, the simulations need to be run long enough to allow the strong positive AMOC feedbacks, along with negative feedbacks on long timescales, which can then lead to D–O-type oscillations. Around 40 % of the simulations set up with full LGM or more MIS3-like conditions have a run length of less than 2000 model years, which makes it difficult to tell whether any of these simulations are capable of or likely to exhibit D–O-like behaviour. In addition, the vast majority of PMIP4/CMIP6 models have not run LGM or MIS3-like simulations long enough to be sure which models have the capability to oscillate.
We have provided boundary conditions for a baseline MIS3-cnt simulation and a Heinrich-event-preconditioned variant (freshwater-forced experiment). The MIS3-cnt experiment is centred at 34 ka because it yields the ideal combination of intermediate ice sheets (smaller in size compared to LGM), low obliquity values, and medium to low GHG values conducive to oscillatory D–O-type behaviour in models. Ideally, the MIS3 baseline experiment should be run for 5000 years; however, given computational constraints a minimum duration of 2000 years together with a spin-up of at least 1000 years is a more practical minimum requirement. This baseline MIS3-cnt protocol provides a common framework to explore cold-period instabilities using particular GHG-, insolation-, freshwater-, and NH-ice-sheet-related forcings, together with diapycnal mixing. More model simulations run under the MIS3 D–O protocol proposed here together with analyses across models could provide better insights along the lines of atmospheric–ice–ocean feedbacks behind D–O events. These simulations will allow us to answer questions such as whether current climate models are able to reproduce D–O-type behaviour under more realistic MIS3 conditions, how well models simulate tipping events and abrupt changes, and what the mechanisms are that lead to relative levels of model stability. Moreover, a large number of standardised MIS3 simulations could encourage the creation of new data sets, improving model–data evaluation.
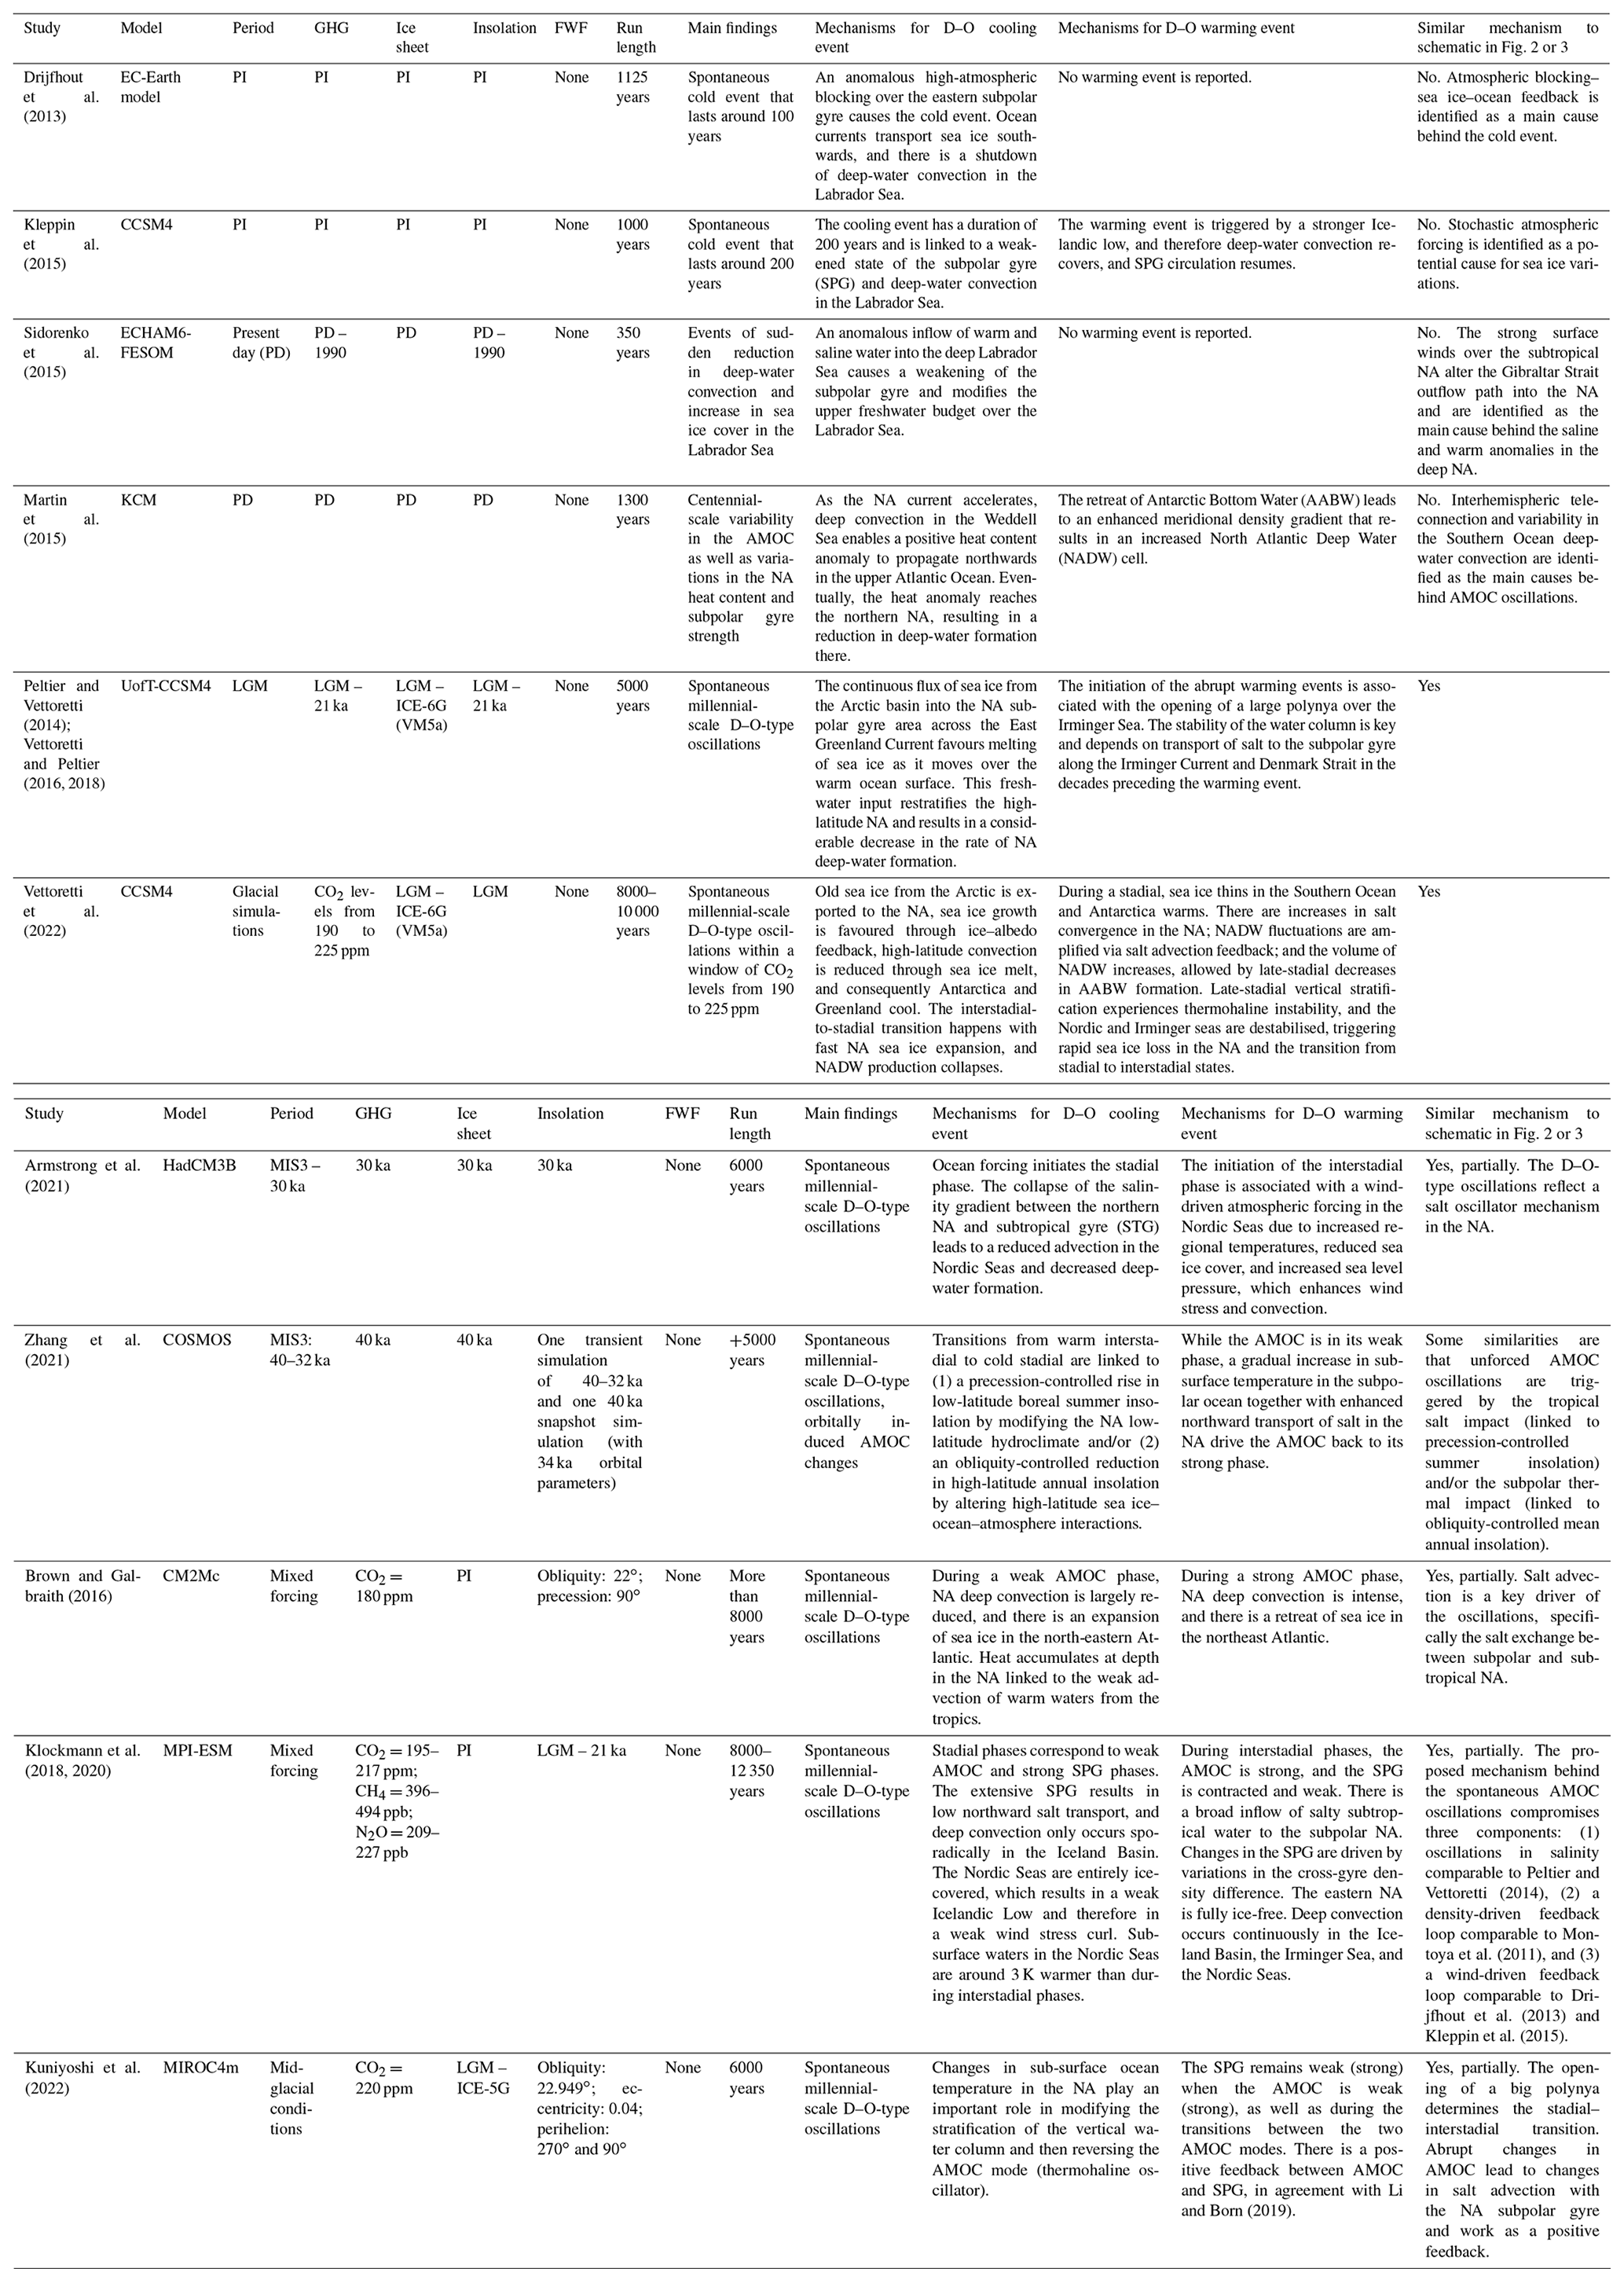
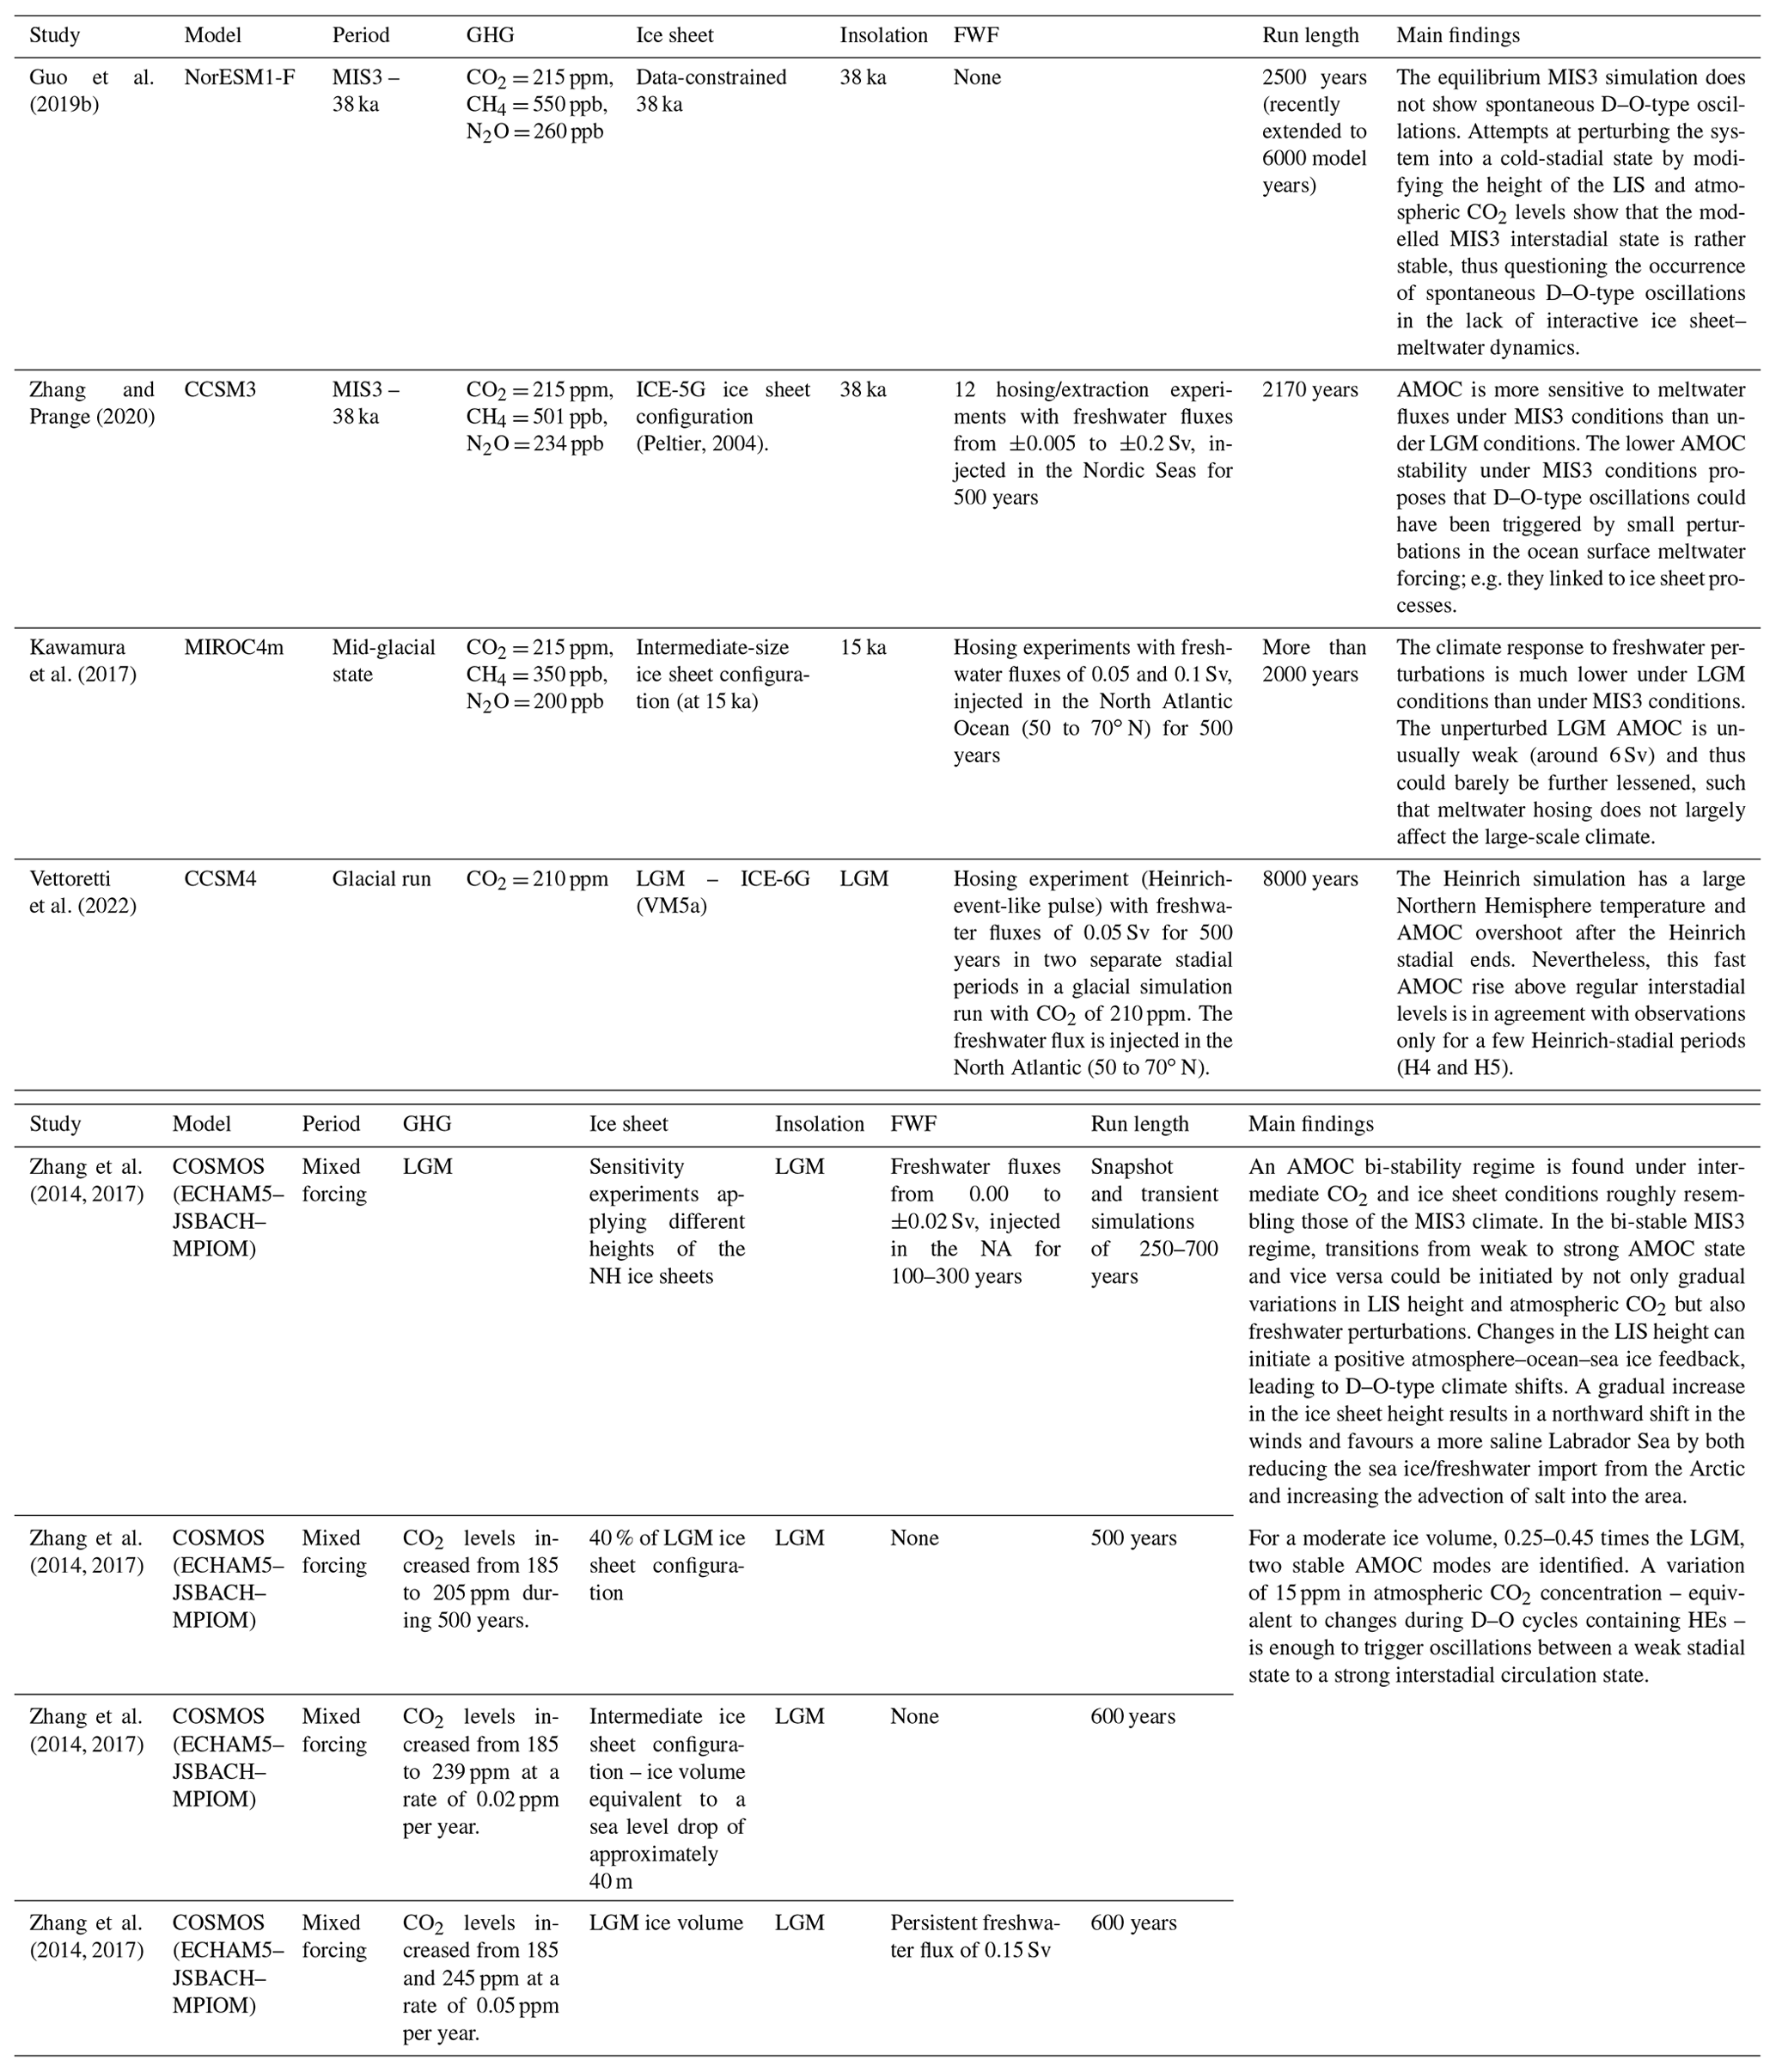
Table B1Summary of LGM-/MIS3-like simulations discussed in the text. Models that reproduce D–O-type oscillations are highlighted in bold.
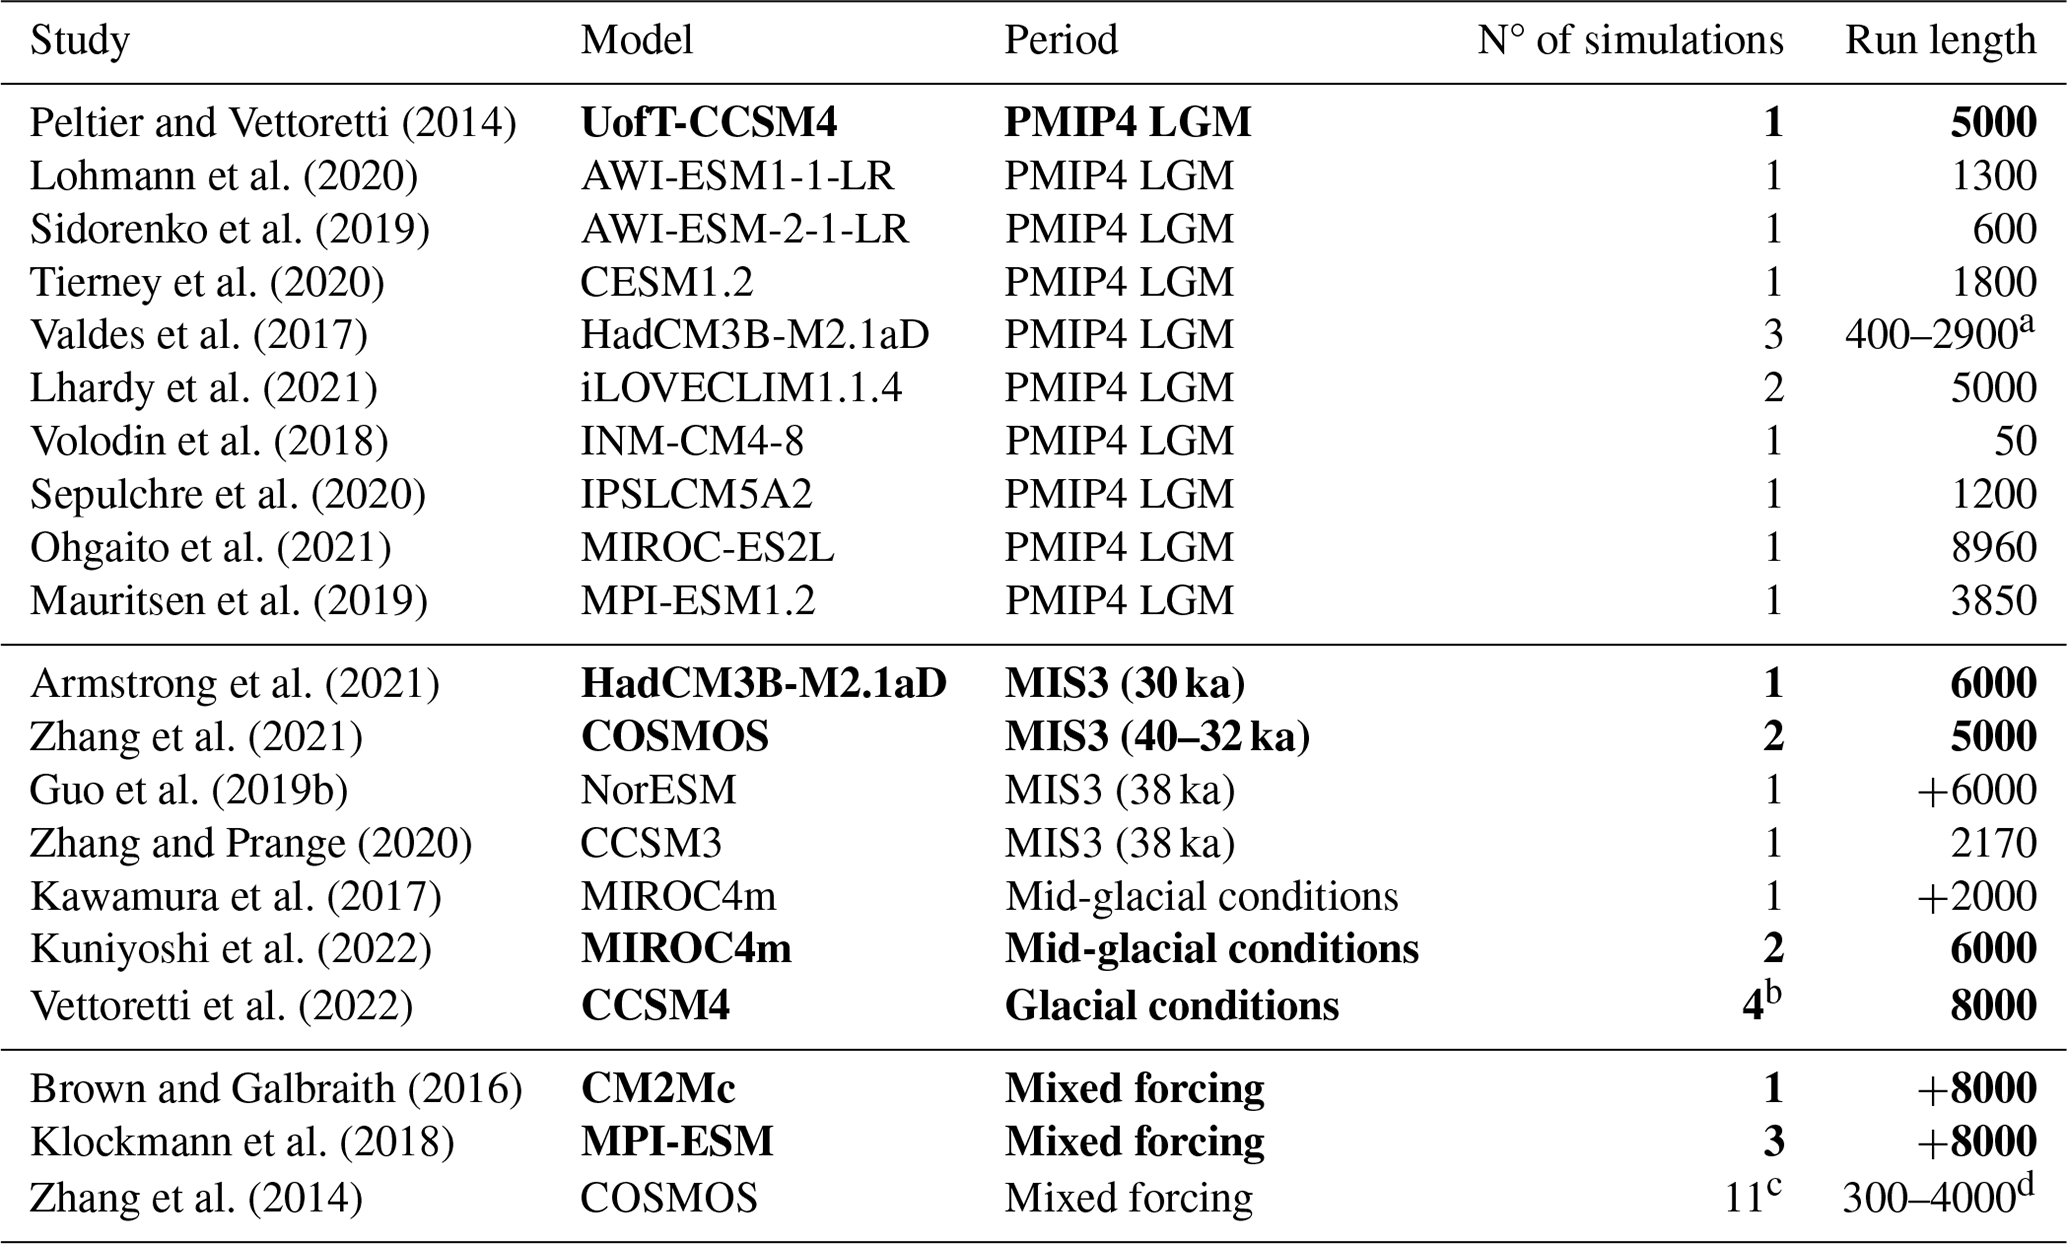
a Only one simulation run longer than 2000 model years. b Four simulations run with CO2 levels: 200, 210, 220, 225 ppm. c We do not consider FWF runs nor transient simulations forced with varying CO2 and/or NH ice sheet height. d Only two simulations with a duration of +2000 model years.
Table C1Contributing members to PMIP4/CMIP6 that have run simulations under LGM or MIS3 conditions.
Access to the Met Office Unified Model source code is available under licence from the Met Office at https://www.metoffice.gov.uk/research/approach/collaboration/unified-model/partnership (Met Office, 2023).
The climate model data (HadCM3) are available on request from http://www.bridge.bris.ac.uk/resources/simulations (Bristol Research Initiative for the Dynamic Global Environment, 2023).
PaleoMIST 1.0, which includes the ice sheet margin, paleotopography, and ice thickness datasets and Stokes coefficients used in this study are available on Pangaea (https://doi.org/10.1594/PANGAEA.905800, Gowan, 2019).
Ayako Abe-Ouchi (The University of Tokyo, Kashiwa, Japan), Andreas Born (University of Bergen, Bergen, Norway), Nathaelle Bouttes (Laboratoire des sciences du climat et de l’environnement, France), Peter Ditlevsen (Niels Bohr Institute, University of Copenhagen, Denmark), Michael P. Erb (School of Earth and Sustainability, Northern Arizona University, Flagstaff, AZ, USA), Georg Feulner (Potsdam Institute for Climate Impact Research, Germany), Evan J. Gowan (Department of Earth and Environmental Sciences, Kumamoto University, Japan), Lauren Gregoire (University of Leeds, UK), Chuncheng Guo (NORCE Norwegian Research Centre, Bjerknes Centre for Climate Research, Bergen, Norway), Sandy P. Harrison (University of Reading, UK), Heather Andres (Memorial University of Newfoundland and Labrador, Canada), Masa Kageyama (Laboratoire des sciences du climat et de l’environnement, France), Marlene Klockmann (Helmholtz-Zentrum Hereon, Germany), Fabrice Lambert (Pontifical Catholic University of Chile, Chile), Allegra N. LeGrande (Columbia University, NASA Goddard Institute for Space Studies), Ute Merkel (MARUM – Center for Marine Environmental Sciences, University of Bremen, 28359 Bremen, Germany), Larissa S. Nazarenko (Columbia University, NASA Goddard Institute for Space Studies), Kerim H. Nisancioglu (University of Bergen, Norway), Kevin Oliver (University of Southampton, UK), Bette Otto-Bliesner (Climate and Global Dynamics Laboratory, National Center for Atmospheric Research, Boulder, Colorado), William R. Peltier (University of Toronto, Canada), Matthias Prange (MARUM – Center for Marine Environmental Sciences, University of Bremen, 28359 Bremen, Germany), Kira Rehfeld (Department of Geosciences, Department of Physics, University of Tübingen, Germany, and Institute of Environmental Physics, Heidelberg University, Germany), Alexander J. Robinson (Complutense University of Madrid, Madrid, Spain, and Instituto de Geociencias, CSIC-UCM, Madrid, Spain), Lev Tarasov (Memorial University of Newfoundland and Labrador, Canada), Paul J. Valdes (University of Bristol, UK), Guido Vettoretti (Niels Bohr Institute, University of Copenhagen, Denmark), Nils Weitzel (Department of Geosciences, University of Tübingen, Germany, and Institute of Environmental Physics, Heidelberg University, Germany), Qiong Zhang (Stockholm University, Sweden), Xu Zhang (State Key Laboratory of Tibetan Plateau Earth System, Resources and Environment (TPESRE), Chinese Academy of Sciences (CAS), Beijing, China, and Alfred Wegener Institute Helmholtz Centre for Polar and Marine Research, Bremerhaven, Germany).
IMV compiled all tables. LCS and IMV wrote the first draft of this paper. LCS and IMV produced all figures. All authors contributed to the final draft.
The contact author has declared that none of the authors has any competing interests.
Publisher’s note: Copernicus Publications remains neutral with regard to jurisdictional claims in published maps and institutional affiliations.
Evan J. Gowan is funded by an international postdoctoral fellowship from the Japan Society for the Promotion of Science. Bette Otto-Bliesner acknowledges funding by the National Center for Atmospheric Research, which is a major facility sponsored by the National Science Foundation under cooperative agreement no. 1852977. Xu Zhang acknowledges funding from NSFC (no. 42075047). Matthias Prange and Ute Merkel acknowledge support from the PalMod project (http://www.palmod.de, last access: 14 April 2023; FKZ 01LP1916C), funded by the German Federal Ministry of Education and Research (BMBF). Kira Rehfeld and Nils Weitzel acknowledge funding by the Deutsche Forschungsgemeinschaft (DFG, German Research Foundation), project no. 395588486, and the PalMod project (https://www.palmod.de/, last access: 13 October 2022), subproject no. 01LP1926C. Chuncheng Guo acknowledges funding from the Research Council of Norway under grant no. 325333 (ABRUPT).
This project is TiPES contribution no. 123. It has received funding from the European Union’s Horizon 2020 research and innovation programme under grant agreement no. 820970.
This paper was edited by Dominik Fleitmann and reviewed by two anonymous referees.
Abe-Ouchi, A., Saito, F., Kageyama, M., Braconnot, P., Harrison, S. P., Lambeck, K., Otto-Bliesner, B. L., Peltier, W. R., Tarasov, L., Peterschmitt, J.-Y., and Takahashi, K.: Ice-sheet configuration in the CMIP5/PMIP3 Last Glacial Maximum experiments, Geosci. Model Dev., 8, 3621–3637, https://doi.org/10.5194/gmd-8-3621-2015, 2015. a
Adolphi, F., Bronk Ramsey, C., Erhardt, T., Edwards, R. L., Cheng, H., Turney, C. S. M., Cooper, A., Svensson, A., Rasmussen, S. O., Fischer, H., and Muscheler, R.: Connecting the Greenland ice-core and U Th timescales via cosmogenic radionuclides: testing the synchroneity of Dansgaard–Oeschger events, Clim. Past, 14, 1755–1781, https://doi.org/10.5194/cp-14-1755-2018, 2018. a
Alley, R., Clark, P., Keigwin, L., and Webb, R.: Making sense of millennial-scale climate change, Geophysical Monograph, American Geophysical Union, 112, 385–394, https://doi.org/10.1029/GM112p0385, 1999. a
Alley, R. B.: Icing the north Atlantic, Nature, 392, 335–337, 1998. a, b
Andersen, K. K., Azuma, N., Barnola, J.-M., Bigler, M., Biscaye, P., Caillon, N., Chappellaz, J., Clausen, H. B., Dahl-Jensen, D., Fischer, H., Flückiger, J., Fritzsche, D., Fujii, Y., Goto-Azuma, K., Grønvold, K., Gundestrup, N. S., Hansson, M., Huber, C., Hvidberg, C. S., Johnsen, S. J., Jonsell, U., Jouzel, J., Kipfstuhl, S., Landais, A., Leuenberger, M., Lorrain, R., Masson-Delmotte, V., Miller, H., Motoyama, H., Narita, H., Popp, T., Rasmussen, S. O., Raynaud, D., Rothlisberger, R., Ruth, U., Samyn, D., Schwander, J., Shoji, H., Siggard-Andersen, M.-L., Steffensen, J. P., Stocker, T., Sveinbjörnsdóttir, A. E., Svensson, A., Takata, M., Tison, J.-L., Thorsteinsson, Th., Watanabe, O., Wilhelms, F., and White, J. W. C.: High-resolution record of the Northern Hemisphere climate extending into the last interglacial period, Nature, 431, 147–151, 2004. a
Andersen, K. K., Svensson, A., Johnsen, S. J., Rasmussen, S. O., Bigler, M., Röthlisberger, R., Ruth, U., Siggaard-Andersen, M.-L., Steffensen, J. P., Dahl-Jensen, D., Vinther, B. M., and Clausen, H. B.: The Greenland ice core chronology 2005, 15–42 ka. Part 1: constructing the time scale, Quaternary Sci. Rev., 25, 3246–3257, 2006. a
Andrews, J. T. and Voelker, A. H.: “Heinrich events” (& sediments): A history of terminology and recommendations for future usage, Quaternary Sci. Rev., 187, 31–40, 2018. a
Armstrong, E., Izumi, K., and Valdes, P.: Identifying the Mechanisms of DO-scale Oscillations in a Gcm: a Salt Oscillator Triggered by the Laurentide Ice Sheet, https://doi.org/10.1007/s00382-022-06564-y, 2021. a, b, c, d, e, f, g, h
Årthun, M., Eldevik, T., Smedsrud, L., Skagseth, Ø., and Ingvaldsen, R.: Quantifying the influence of Atlantic heat on Barents Sea ice variability and retreat, J. Climate, 25, 4736–4743, 2012. a
Asmerom, Y., Polyak, V. J., and Burns, S. J.: Variable winter moisture in the southwestern United States linked to rapid glacial climate shifts, Nat. Geosci., 3, 114–117, 2010. a
Barker, S. and Knorr, G.: Millennial scale feedbacks determine the shape and rapidity of glacial termination, Nat. Commun., 12, 1–12, 2021. a
Barker, S., Diz, P., Vautravers, M. J., Pike, J., Knorr, G., Hall, I. R., and Broecker, W. S.: Interhemispheric Atlantic seesaw response during the last deglaciation, Nature, 457, 1097–1102, 2009. a
Barker, S., Knorr, G., Edwards, R. L., Parrenin, F., Putnam, A. E., Skinner, L. C., Wolff, E., and Ziegler, M.: 800,000 years of abrupt climate variability, Science, 334, 347–351, 2011. a
Barton, B. I., Lenn, Y.-D., and Lique, C.: Observed Atlantification of the Barents Sea causes the Polar Front to limit the expansion of winter sea ice, J. Phys. Oceanogr., 48, 1849–1866, 2018. a
Batchelor, C. L., Margold, M., Krapp, M., Murton, D. K., Dalton, A. S., Gibbard, P. L., Stokes, C. R., Murton, J. B., and Manica, A.: The configuration of Northern Hemisphere ice sheets through the Quaternary, Nat. Commun., 10, 1–10, 2019. a, b, c
Baumgartner, M., Kindler, P., Eicher, O., Floch, G., Schilt, A., Schwander, J., Spahni, R., Capron, E., Chappellaz, J., Leuenberger, M., Fischer, H., and Stocker, T. F.: NGRIP CH4 concentration from 120 to 10 kyr before present and its relation to a δ15N temperature reconstruction from the same ice core, Clim. Past, 10, 903–920, https://doi.org/10.5194/cp-10-903-2014, 2014. a
Bauska, T. K., Marcott, S. A., and Brook, E. J.: Abrupt changes in the global carbon cycle during the last glacial period, Nat. Geosci., 14, 91–96, 2021. a, b, c, d
Berger, A., Loutre, M.-F., and Gallée, H.: Sensitivity of the LLN climate model to the astronomical and CO2 forcings over the last 200 ky, Clim. Dynam., 14, 615–629, 1998. a, b, c
Bond, G., Heinrich, H., Broecker, W., Labeyrie, L., McManus, J., Andrews, J., Huon, S., Jantschik, R., Clasen, S., Simet, C., Tedesco, K., Klas, M., Bonani, G., and Ivy, S.: Evidence for massive discharges of icebergs into the North Atlantic ocean during the last glacial period, Nature, 360, 245–249, 1992. a
Bristol Research Initiative for the Dynamic Global Environment (BRIDGE): Earth Systems Modelling within Bridge. A Database of Model Simulations, https://www.paleo.bristol.ac.uk/resources/simulations/, last access: 12 April 2023. a
Broecker, W. and Peteet, D.: Does the ocean-atmosphere system have more than one stable mode of operation?, Nature, 315, 21–26, https://doi.org/10.1038/315021a0, 1985. a
Broecker, W. S.: Massive iceberg discharges as triggers for global climate change, Nature, 372, 421–424, 1994. a
Brovkin, V., Brook, E., Williams, J. W., Bathiany, S., Lenton, T. M., Barton, M., DeConto, R. M., Donges, J. F., Ganopolski, A., McManus, J., Praetorius, S., de Vernal, A., Abe-Ouchi, A., Cheng, H., Claussen, M., Crucifix, M., Gallopín, G., Iglesias, V., Kaufman, D. S., Kleinen, T., Lambert, F., van der Leeuw, S., Liddy, H., Loutre, M., McGee, D., Rehfeld, K., Rhodes, R., Seddon, A. W. R., Trauth, M. H., Vanderveken, L., and Yu, Z.: Past abrupt changes, tipping points and cascading impacts in the Earth system, Nat. Geosci., 14, 550–558, 2021. a, b, c
Brown, N. and Galbraith, E. D.: Hosed vs. unhosed: interruptions of the Atlantic Meridional Overturning Circulation in a global coupled model, with and without freshwater forcing, Clim. Past, 12, 1663–1679, https://doi.org/10.5194/cp-12-1663-2016, 2016. a, b, c, d, e, f, g, h, i, j
Brugger, J., Hofmann, M., Petri, S., and Feulner, G.: On the sensitivity of the Devonian climate to continental configuration, vegetation cover, orbital configuration, CO2 concentration, and insolation, Paleoceanography and Paleoclimatology, 34, 1375–1398, 2019.
Buckley, M. W. and Marshall, J.: Observations, inferences, and mechanisms of the Atlantic Meridional Overturning Circulation: A review, Rev. Geophys., 54, 5–63, 2016. a
Chappell, J.: Sea level changes forced ice breakouts in the Last Glacial cycle: new results from coral terraces, Quaternary Sci. Rev., 21, 1229–1240, 2002. a
Clague, J. J. and Ward, B.: Pleistocene Glaciation of British Columbia, in: Quaternary Glaciations – Extent and Chronology A Closer Look, edited by: Ehlers, J., Gibbard, P. L., and Hughes, P. D., vol. 15 of Developments in Quaternary Sciences, chap. 44, 563–573, Elsevier, https://doi.org/10.1016/B978-0-444-53447-7.00044-1, 2011. a, b
Clark, P. U., Pisias, N. G., Stocker, T. F., and Weaver, A. J.: The role of the thermohaline circulation in abrupt climate change, Nature, 415, 863–869, 2002. a
Clark, P. U., Hostetler, S. W., Pisias, N. G., Schmittner, A., and Meissner, K. J.: Mechanisms for an 7-kyr climate and sea-level oscillation during marine isotope stage 3, Geophysical Monograph, American Geophysical Union, 173, 209, https://doi.org/10.1029/173GM15, 2007. a, b
Cook, K. H. and Held, I. M.: Stationary waves of the ice age climate, J. Climate, 1, 807–819, 1988. a
Dalton, A. S., Finkelstein, S. A., Barnett, P. J., and Forman, S. L.: Constraining the Late Pleistocene history of the Laurentide Ice Sheet by dating the Missinaibi Formation, Hudson Bay Lowlands, Canada, Quaternary Sci. Rev., 146, 288–299, 2016. a
Dalton, A. S., Väliranta, M., Barnett, P. J., and Finkelstein, S. A.: Pollen and macrofossil-inferred palaeoclimate at the Ridge Site, Hudson Bay Lowlands, Canada: evidence for a dry climate and significant recession of the Laurentide Ice Sheet during Marine Isotope Stage 3, Boreas, 46, 388–401, 2017. a
Dalton, A. S., Finkelstein, S. A., Forman, S. L., Barnett, P. J., Pico, T., and Mitrovica, J. X.: Was the Laurentide ice sheet significantly reduced during marine isotope stage 3?, Geology, 47, 111–114, 2019. a, b
Dalton, A. S., Pico, T., Gowan, E. J., Clague, J. J., Forman, S. L., McMartin, I., Sarala, P., and Helmens, K. F.: The marine δ18O record overestimates continental ice volume during Marine Isotope Stage 3, Global Planet. Change, 103814, https://doi.org/10.1016/j.gloplacha.2022.103814, 2022. a, b
Dansgaard, W., Clausen, H. B., Gundestrup, N., Hammer, C., Johnsen, S., Kristinsdottir, P., and Reeh, N.: A new Greenland deep ice core, Science, 218, 1273–1277, 1982. a
de Lavergne, C., Falahat, S., Madec, G., Roquet, F., Nycander, J., and Vic, C.: Toward global maps of internal tide energy sinks, Ocean Modell., 137, 52–75, 2019. a
Deplazes, G., Lückge, A., Peterson, L. C., Timmermann, A., Hamann, Y., Hughen, K. A., Röhl, U., Laj, C., Cane, M. A., Sigman, D. M., and Haug, G. H: Links between tropical rainfall and North Atlantic climate during the last glacial period, Nat. Geosci., 6, 213–217, 2013. a, b
Ditlevsen, P. D. and Johnsen, S. J.: Tipping points: early warning and wishful thinking, Geophys. Res. Lett., 37, https://doi.org/10.1029/2010GL044486, 2010. a
Ditlevsen, P. D., Kristensen, M. S., and Andersen, K. K.: The recurrence time of Dansgaard-Oeschger events and limits on the possible periodic component, J. Climate, 18, 2594–2603, 2005. a
Ditlevsen, P. D., Andersen, K. K., and Svensson, A.: The DO-climate events are probably noise induced: statistical investigation of the claimed 1470 years cycle, Clim. Past, 3, 129–134, https://doi.org/10.5194/cp-3-129-2007, 2007. a
Dokken, T. M., Nisancioglu, K. H., Li, C., Battisti, D. S., and Kissel, C.: Dansgaard-Oeschger cycles: Interactions between ocean and sea ice intrinsic to the Nordic seas, Paleoceanography, 28, 491–502, 2013. a, b
Dowdeswell, J., Maslin, M., Andrews, J., and McCave, I.: Iceberg production, debris rafting, and the extent and thickness of Heinrich layers (H-1, H-2) in North Atlantic sediments, Geology, 23, 301–304, 1995. a
Drijfhout, S., Gleeson, E., Dijkstra, H. A., and Livina, V.: Spontaneous abrupt climate change due to an atmospheric blocking–sea-ice–ocean feedback in an unforced climate model simulation, P. Natl. Acad. Sci. USA, 110, 19713–19718, 2013. a, b, c
Eyring, V., Bony, S., Meehl, G. A., Senior, C. A., Stevens, B., Stouffer, R. J., and Taylor, K. E.: Overview of the Coupled Model Intercomparison Project Phase 6 (CMIP6) experimental design and organization, Geosci. Model Dev., 9, 1937–1958, https://doi.org/10.5194/gmd-9-1937-2016, 2016. a, b
Feulner, G., Rahmstorf, S., Levermann, A., and Volkwardt, S.: On the Origin of the Surface Air Temperature Difference between the Hemispheres in Earth's Present-Day Climate, J. Climate, 26, 7136–7150, https://doi.org/10.1175/JCLI-D-12-00636.1, 2013. a
Galaasen, E. V., Ninnemann, U. S., Irvalı, N., Kleiven, H. K. F., Rosenthal, Y., Kissel, C., and Hodell, D. A.: Rapid reductions in North Atlantic Deep Water during the peak of the last interglacial period, Science, 343, 1129–1132, 2014. a, b, c
Galaasen, E. V., Ninnemann, U. S., Kessler, A., Irvalı, N., Rosenthal, Y., Tjiputra, J., Bouttes, N., Roche, D. M., Kleiven, H. K. F., and Hodell, D. A.: Interglacial instability of North Atlantic deep water ventilation, Science, 367, 1485–1489, 2020. a, b
Galbraith, E. and de Lavergne, C.: Response of a comprehensive climate model to a broad range of external forcings: Relevance for deep ocean ventilation and the development of late Cenozoic ice ages, Clim. Dynam., 52, 653–679, 2019. a, b, c
Ganopolski, A. and Rahmstorf, S.: Rapid changes of glacial climate simulated in a coupled climate model, Nature, 409, 153–158, 2001. a, b
Gasson, E., DeConto, R. M., and Pollard, D.: Modeling the oxygen isotope composition of the Antarctic ice sheet and its significance to Pliocene sea level, Geology, 44, 827–830, 2016. a
Gauthier, M. S. and Hodder, T. J.: Surficial geology mapping from Manigotagan to Berens River, southeastern Manitoba (parts of NTS 62P1, 7, 8, 10, 15, 63A2, 7), Report of Activities 2020, Manitoba Agriculture and Resource Development, Manitoba Geological Survey, 41–46, https://www.manitoba.ca/iem/geo/field/roa20pdfs/GS2020-6.pdf (last access: 28 April 2023), 2020. a
Genty, D., Blamart, D., Ouahdi, R., Gilmour, M., Baker, A., Jouzel, J., and Van-Exter, S.: Precise dating of Dansgaard–Oeschger climate oscillations in western Europe from stalagmite data, Nature, 421, 833–837, 2003. a
Goni, M. F. S. and Harrison, S. P.: Millennial-scale climate variability and vegetation changes during the Last Glacial: Concepts and terminology, Quaternary Sci. Rev., 29, 2823–2827, 2010. a
Gowan, E. J.: Global ice sheet reconstruction for the past 80000 years, PANGAEA, https://doi.org/10.1594/PANGAEA.905800, 2019. a
Gowan, E. J., Zhang, X., Khosravi, S., Rovere, A., Stocchi, P., Hughes, A. L., Gyllencreutz, R., Mangerud, J., Svendsen, J.-I., and Lohmann, G.: A new global ice sheet reconstruction for the past 80 000 years, Nat. Commun., 12, 1–9, 2021. a, b, c, d, e, f
Grant, K., Rohling, E., Ramsey, C. B., Cheng, H., Edwards, R., Florindo, F., Heslop, D., Marra, F., Roberts, A., Tamisiea, M. E., and Williams, F.: Sea-level variability over five glacial cycles, Nat. Commun., 5, 1–9, 2014. a
Guo, C., Bentsen, M., Bethke, I., Ilicak, M., Tjiputra, J., Toniazzo, T., Schwinger, J., and Otterå, O. H.: Description and evaluation of NorESM1-F: a fast version of the Norwegian Earth System Model (NorESM), Geosci. Model Dev., 12, 343–362, https://doi.org/10.5194/gmd-12-343-2019, 2019a. a
Guo, C., Nisancioglu, K. H., Bentsen, M., Bethke, I., and Zhang, Z.: Equilibrium simulations of Marine Isotope Stage 3 climate, Clim. Past, 15, 1133–1151, https://doi.org/10.5194/cp-15-1133-2019, 2019b. a, b, c, d, e, f, g, h, i, j
Heinrich, H.: Origin and consequences of cyclic ice rafting in the northeast Atlantic Ocean during the past 130,000 years, Quaternary Res., 29, 142–152, 1988. a
Helmens, K. F.: The Last Interglacial–Glacial cycle (MIS 5–2) re-examined based on long proxy records from central and northern Europe, Quaternary Sci. Rev., 86, 115–143, 2014. a, b
Hemming, S. R.: Heinrich events: Massive late Pleistocene detritus layers of the North Atlantic and their global climate imprint, Rev. Geophys., 42, https://doi.org/10.1029/2003RG000128, 2004. a, b, c, d, e
Hofer, D., Raible, C. C., Dehnert, A., and Kuhlemann, J.: The impact of different glacial boundary conditions on atmospheric dynamics and precipitation in the North Atlantic region, Clim. Past, 8, 935–949, https://doi.org/10.5194/cp-8-935-2012, 2012. a
Holden, P. B., Edwards, N., Oliver, K., Lenton, T., and Wilkinson, R.: A probabilistic calibration of climate sensitivity and terrestrial carbon change in GENIE-1, Clim. Dynam., 35, 785–806, 2010. a
Hu, A., Otto-Bliesner, B. L., Meehl, G. A., Han, W., Morrill, C., Brady, E. C., and Briegleb, B.: Response of thermohaline circulation to freshwater forcing under present-day and LGM conditions, J. Climate, 21, 2239–2258, 2008. a, b
Huber, C., Leuenberger, M., Spahni, R., Flückiger, J., Schwander, J., Stocker, T. F., Johnsen, S., Landais, A., and Jouzel, J.: Isotope calibrated Greenland temperature record over Marine Isotope Stage 3 and its relation to CH4, Earth Planet. Sci. Lett., 243, 504–519, 2006. a, b, c, d
Hughes, A. L., Gyllencreutz, R., Lohne, Ø. S., Mangerud, J., and Svendsen, J. I.: The last Eurasian ice sheets–a chronological database and time-slice reconstruction, DATED-1, Boreas, 45, 1–45, 2016. a, b, c
Huisman, S. E., Den Toom, M., Dijkstra, H. A., and Drijfhout, S.: An indicator of the multiple equilibria regime of the Atlantic meridional overturning circulation, J. Phys. Oceanogr., 40, 551–567, 2010. a
Hulbe, C. L.: An ice shelf mechanism for Heinrich layer production, Paleoceanography, 12, 711–717, 1997. a
IPCC: Climate Change 2013: The Physical Science Basis. Contribution of Working Group I to the Fifth Assessment Report of the Intergovernmental Panel on Climate Change, edited by: Stocker, T. F., Qin, D., Plattner, G., Tignor, M., Allen, S. K., Boschung, J., Nauels, A., Xia, Y., Bex, V., and Midgley, P. M., Tech. Rep. 5, Intergovernmental Panel on Climate Change, Cambridge, United Kingdom and New York, NY, USA, https://doi.org/10.1017/CBO9781107415324, 2013. a
Jackson, L. and Vellinga, M.: Multidecadal to centennial variability of the AMOC: HadCM3 and a perturbed physics ensemble, J. Climate, 26, 2390–2407, 2013. a
Jacobel, A., McManus, J., Anderson, R., and Winckler, G.: Climate-related response of dust flux to the central equatorial Pacific over the past 150 kyr, Earth Planet. Sci. Lett., 457, 160–172, 2017. a
Johnsen, S., Clausen, H., Dansgaard, W., Fuhrer, K., Gundestrup, N., Hammer, C., Iversen, P., Jouzel, J., Stauffer, B., and Steffensen, J. P.: Irregular glacial interstadials recorded in a new Greenland ice core, Nature, 359, 311–313, 1992. a
Johnsen, S. J., Dahl-Jensen, D., Gundestrup, N., Steffensen, J. P., Clausen, H. B., Miller, H., Masson-Delmotte, V., Sveinbjörnsdottir, A. E., and White, J.: Oxygen isotope and palaeotemperature records from six Greenland ice-core stations: Camp Century, Dye-3, GRIP, GISP2, Renland and NorthGRIP, J. Quaternary Sci., 16, 299–307, 2001. a
Jungclaus, J., Fischer, N., Haak, H., Lohmann, K., Marotzke, J., Matei, D., Mikolajewicz, U., Notz, D., and Von Storch, J.: Characteristics of the ocean simulations in the Max Planck Institute Ocean Model (MPIOM) the ocean component of the MPI-Earth system model, J. Adv. Model. Earth Sy., 5, 422–446, 2013. a
Justino, F. and Peltier, W. R.: The glacial North Atlantic Oscillation, Geophys. Res. Lett., 32, https://doi.org/10.1029/2005GL023822, 2005. a
Kageyama, M., Merkel, U., Otto-Bliesner, B., Prange, M., Abe-Ouchi, A., Lohmann, G., Ohgaito, R., Roche, D. M., Singarayer, J., Swingedouw, D., and X Zhang: Climatic impacts of fresh water hosing under Last Glacial Maximum conditions: a multi-model study, Clim. Past, 9, 935–953, https://doi.org/10.5194/cp-9-935-2013, 2013. a, b
Kageyama, M., Albani, S., Braconnot, P., Harrison, S. P., Hopcroft, P. O., Ivanovic, R. F., Lambert, F., Marti, O., Peltier, W. R., Peterschmitt, J.-Y., Roche, D. M., Tarasov, L., Zhang, X., Brady, E. C., Haywood, A. M., LeGrande, A. N., Lunt, D. J., Mahowald, N. M., Mikolajewicz, U., Nisancioglu, K. H., Otto-Bliesner, B. L., Renssen, H., Tomas, R. A., Zhang, Q., Abe-Ouchi, A., Bartlein, P. J., Cao, J., Li, Q., Lohmann, G., Ohgaito, R., Shi, X., Volodin, E., Yoshida, K., Zhang, X., and Zheng, W.: The PMIP4 contribution to CMIP6 – Part 4: Scientific objectives and experimental design of the PMIP4-CMIP6 Last Glacial Maximum experiments and PMIP4 sensitivity experiments, Geosci. Model Dev., 10, 4035–4055, https://doi.org/10.5194/gmd-10-4035-2017, 2017. a, b, c
Kageyama, M., Braconnot, P., Harrison, S. P., Haywood, A. M., Jungclaus, J. H., Otto-Bliesner, B. L., Peterschmitt, J.-Y., Abe-Ouchi, A., Albani, S., Bartlein, P. J., Brierley, C., Crucifix, M., Dolan, A., Fernandez-Donado, L., Fischer, H., Hopcroft, P. O., Ivanovic, R. F., Lambert, F., Lunt, D. J., Mahowald, N. M., Peltier, W. R., Phipps, S. J., Roche, D. M., Schmidt, G. A., Tarasov, L., Valdes, P. J., Zhang, Q., and Zhou, T.: The PMIP4 contribution to CMIP6 – Part 1: Overview and over-arching analysis plan, Geosci. Model Dev., 11, 1033–1057, https://doi.org/10.5194/gmd-11-1033-2018, 2018. a
Kageyama, M., Harrison, S. P., Kapsch, M.-L., Lofverstrom, M., Lora, J. M., Mikolajewicz, U., Sherriff-Tadano, S., Vadsaria, T., Abe-Ouchi, A., Bouttes, N., Chandan, D., Gregoire, L. J., Ivanovic, R. F., Izumi, K., LeGrande, A. N., Lhardy, F., Lohmann, G., Morozova, P. A., Ohgaito, R., Paul, A., Peltier, W. R., Poulsen, C. J., Quiquet, A., Roche, D. M., Shi, X., Tierney, J. E., Valdes, P. J., Volodin, E., and Zhu, J.: The PMIP4 Last Glacial Maximum experiments: preliminary results and comparison with the PMIP3 simulations, Clim. Past, 17, 1065–1089, https://doi.org/10.5194/cp-17-1065-2021, 2021a. a, b, c, d
Kageyama, M., Sime, L. C., Sicard, M., Guarino, M.-V., de Vernal, A., Stein, R., Schroeder, D., Malmierca-Vallet, I., Abe-Ouchi, A., Bitz, C., Braconnot, P., Brady, E. C., Cao, J., Chamberlain, M. A., Feltham, D., Guo, C., LeGrande, A. N., Lohmann, G., Meissner, K. J., Menviel, L., Morozova, P., Nisancioglu, K. H., Otto-Bliesner, B. L., O'ishi, R., Ramos Buarque, S., Salas y Melia, D., Sherriff-Tadano, S., Stroeve, J., Shi, X., Sun, B., Tomas, R. A., Volodin, E., Yeung, N. K. H., Zhang, Q., Zhang, Z., Zheng, W., and Ziehn, T.: A multi-model CMIP6-PMIP4 study of Arctic sea ice at 127 ka: sea ice data compilation and model differences, Clim. Past, 17, 37–62, https://doi.org/10.5194/cp-17-37-2021, 2021b. a
Kawamura, K., Abe-Ouchi, A., Motoyama, H., Ageta, Y., Aoki, S., Azuma, N., Fujii, Y., Fujita, K., Fujita, S., Fukui, K., Furukawa, T., Furusaki, A., Goto-Azuma, K., Greve, R., Hirabayashi, M., Hondoh, T., Hori, A., Horikawa, S., Horiuchi, K., Igarashi, M., Iizuka, Y., Kameda, T., Kanda, H., Kohno, M., Kuramoto, T., Matsushi, Y., Miyahara, M., Miyake, T., Miyamoto, A., Nagashima, Y., Nakayama, Y., Nakazawa, T., Nakazawa, F., Nishio, F., Obinata, I., Ohgaito, R., Oka, A., Okuno, J., Okuyama, J., Oyabu, I., Parrenin, F., Pattyn, F., Saito, F., Saito, T., Saito, T., Sakurai, T., Sasa, K., Seddik, H., Shibata, Y., Shinbori, K., Suzuki, K., Suzuki, T., Takahashi, A., Takahashi, K., Takahashi, S., Takata, M., Tanaka, Y., Uemura, R., Watanabe, G., Watanabe, O., Yamasaki, T., Yokoyama, K., Yoshimori, M., and Yoshimoto, T.: State dependence of climatic instability over the past 720,000 years from Antarctic ice cores and climate modeling, Sci. Adv., 3, e1600446, https://doi.org/10.1126/sciadv.1600446, 2017. a, b, c, d
Kindler, P., Guillevic, M., Baumgartner, M., Schwander, J., Landais, A., and Leuenberger, M.: Temperature reconstruction from 10 to 120 kyr b2k from the NGRIP ice core, Clim. Past, 10, 887–902, https://doi.org/10.5194/cp-10-887-2014, 2014. a, b, c, d, e
Kleman, J., Jansson, K., De Angelis, H., Stroeven, A. P., Hättestrand, C., Alm, G., and Glasser, N.: North American ice sheet build-up during the last glacial cycle, 115–21 kyr, Quaternary Sci. Rev., 29, 2036–2051, 2010. a
Kleppin, H., Jochum, M., Otto-Bliesner, B., Shields, C. A., and Yeager, S.: Stochastic atmospheric forcing as a cause of Greenland climate transitions, J. Climate, 28, 7741–7763, 2015. a, b, c, d
Klockmann, M., Mikolajewicz, U., and Marotzke, J.: The effect of greenhouse gas concentrations and ice sheets on the glacial AMOC in a coupled climate model, Clim. Past, 12, 1829–1846, https://doi.org/10.5194/cp-12-1829-2016, 2016. a
Klockmann, M., Mikolajewicz, U., and Marotzke, J.: Two AMOC states in response to decreasing greenhouse gas concentrations in the coupled climate model MPI-ESM, J. Climate, 31, 7969–7984, 2018. a, b, c, d, e, f, g, h, i, j, k, l, m, n, o, p, q, r
Klockmann, M., Mikolajewicz, U., Kleppin, H., and Marotzke, J.: Coupling of the subpolar gyre and the overturning circulation during abrupt glacial climate transitions, Geophys. Res. Lett., 47, e2020GL090361, https://doi.org/10.1029/2020GL090361, 2020. a, b, c
Knorr, G., Barker, S., Zhang, X., Lohmann, G., Gong, X., Gierz, P., Stepanek, C., and Stap, L. B.: A salty deep ocean as a prerequisite for glacial termination, Nat. Geosci., 14, 930–936, 2021. a
Kuniyoshi, Y., Abe-Ouchi, A., Sherriff-Tadano, S., Chan, W.-L., and Saito, F.: Effect of Climatic Precession on Dansgaard-Oeschger-Like Oscillations, Geophys. Res. Lett., 49, e2021GL095695, https://doi.org/10.1029/2021GL095695, 2022. a, b, c, d, e
Lambert, F., Bigler, M., Steffensen, J. P., Hutterli, M., and Fischer, H.: Centennial mineral dust variability in high-resolution ice core data from Dome C, Antarctica, Clim. Past, 8, 609–623, https://doi.org/10.5194/cp-8-609-2012, 2012. a
Landais, A., Barnola, J., Masson-Delmotte, V., Jouzel, J., Chappellaz, J., Caillon, N., Huber, C., Leuenberger, M., and Johnsen, S.: A continuous record of temperature evolution over a sequence of Dansgaard-Oeschger events during Marine Isotopic Stage 4 (76 to 62 kyr BP), Geophys. Res. Lett., 31, https://doi.org/10.1029/2004GL021193, 2004. a, b
Lang, C., Leuenberger, M., Schwander, J., and Johnsen, S.: 16 ∘C rapid temperature variation in central Greenland 70,000 years ago, Science, 286, 934–937, 1999. a
Larter, R. D., Anderson, J. B., Graham, A. G., Gohl, K., Hillenbrand, C.-D., Jakobsson, M., Johnson, J. S., Kuhn, G., Nitsche, F. O., Smith, J. A., Witus, A. E., Bentley, M. J., Dowdeswell, J. A., Ehrmann, W., Klages, J. P., Lindow, J., Cofaigh, C. Ó, and Spiegel, C.: Reconstruction of changes in the Amundsen Sea and Bellingshausen sea sector of the West Antarctic ice sheet since the last glacial maximum, Quaternary Sci. Rev., 100, 55–86, 2014. a
Lenton, T. M., Held, H., Kriegler, E., Hall, J. W., Lucht, W., Rahmstorf, S., and Schellnhuber, H. J.: Tipping elements in the Earth's climate system, P. Natl. Acad. Sci. USA, 105, 1786–1793, 2008. a, b, c
Levine, R. C. and Bigg, G. R.: Sensitivity of the glacial ocean to Heinrich events from different iceberg sources, as modeled by a coupled atmosphere-iceberg-ocean model, Paleoceanography, 23, https://doi.org/10.1029/2008PA001613, 2008. a
Lhardy, F., Bouttes, N., Roche, D. M., Crosta, X., Waelbroeck, C., and Paillard, D.: Impact of Southern Ocean surface conditions on deep ocean circulation during the LGM: a model analysis, Clim. Past, 17, 1139–1159, https://doi.org/10.5194/cp-17-1139-2021, 2021. a
Li, C. and Battisti, D. S.: Reduced Atlantic storminess during Last Glacial Maximum: Evidence from a coupled climate model, J. Climate, 21, 3561–3579, 2008. a
Li, C. and Born, A.: Coupled atmosphere-ice-ocean dynamics in Dansgaard-Oeschger events, Quaternary Sci. Rev., 203, 1–20, 2019. a, b, c, d
Li, C., Battisti, D., Schrag, D., and Tziperman, E.: Abrupt climate shifts in greeland due to displacements of the sea ice edge, Geophys. Res. Lett., 32, L19702, https://doi.org/10.1029/2005GL023492, 2005. a, b
Li, C., Battisti, D., and Bitz, C.: Can North Atlantic sea ice anomalies account for Dansgaard-Oeschger climate signals?, J. Climate, 23, 5457–5475, https://doi.org/10.1175/2010JCLI3409.1, 2010. a, b
Liu, Z., Otto-Bliesner, B., He, F., Brady, E., Tomas, R., Clark, P., A.E., C., Lynch-Stieglitz, J., Curry, W., Brook, E., Erickson, D., Jacob, R., Kutzbach, J., and Cheng, J.: Transient simulation of last deglaciation with a new mechanism for Bolling-Allerod warming, Science, 325, 310–314, https://doi.org/10.1126/science.1171041, 2009. a
Löfverström, M., Caballero, R., Nilsson, J., and Kleman, J.: Evolution of the large-scale atmospheric circulation in response to changing ice sheets over the last glacial cycle, Clim. Past, 10, 1453–1471, https://doi.org/10.5194/cp-10-1453-2014, 2014. a
Lohmann, G., Butzin, M., Eissner, N., Shi, X., and Stepanek, C.: Abrupt climate and weather changes across time scales, Paleoceanography and Paleoclimatology, 35, e2019PA003782, https://doi.org/10.1029/2019PA003782, 2020. a
Lohmann, J. and Ditlevsen, P. D.: Random and externally controlled occurrences of Dansgaard–Oeschger events, Clim. Past, 14, 609–617, https://doi.org/10.5194/cp-14-609-2018, 2018. a, b
Lohmann, J. and Ditlevsen, P. D.: Objective extraction and analysis of statistical features of Dansgaard–Oeschger events, Clim. Past, 15, 1771–1792, https://doi.org/10.5194/cp-15-1771-2019, 2019. a, b
Loulergue, L., Schilt, A., Spahni, R., Masson-Delmotte, V., Blunier, T., Lemieux, B., Barnola, J.-M., Raynaud, D., Stocker, T. F., and Chappellaz, J.: Orbital and millennial-scale features of atmospheric CH4 over the past 800,000 years, Nature, 453, 383–386, 2008. a
Lynch-Stieglitz, J.: The Atlantic meridional overturning circulation and abrupt climate change, Annu. Rev. Mar. Sci., 9, 83–104, 2017. a
MacAyeal, D.: A low-order model of the Heinrich event cycle, Paleoceanography, 8, 767–773, 1993. a
Madonna, E., Li, C., Grams, C. M., and Woollings, T.: The link between eddy-driven jet variability and weather regimes in the North Atlantic-European sector, Q. J. Roy. Meteor. Soc., 143, 2960–2972, 2017. a
Manabe, S. and Broccoli, A.: The influence of continental ice sheets on the climate of an ice age, J. Geophys. Res.-Atmos., 90, 2167–2190, 1985. a
Marcott, S. A., Clark, P. U., Padman, L., Klinkhammer, G. P., Springer, S. R., Liu, Z., Otto-Bliesner, B. L., Carlson, A. E., Ungerer, A., Padman, J., He, F., Cheng, J., and Schmittner, A.: Ice-shelf collapse from subsurface warming as a trigger for Heinrich events, P. Natl. Acad. Sci. USA, 108, 13415–13419, 2011. a
Marshall, S. J. and Clarke, G. K.: A continuum mixture model of ice stream thermomechanics in the Laurentide Ice Sheet 2. Application to the Hudson Strait Ice Stream, J. Geophys. Res.-Sol. Ea., 102, 20615–20637, 1997. a
Martin, T., Park, W., and Latif, M.: Southern Ocean forcing of the North Atlantic at multi-centennial time scales in the Kiel Climate Model, Deep-Sea Res. Pt. II, 114, 39–48, 2015. a, b
Mauritsen, T., Bader, J., Becker, T., Behrens, J., Bittner, M., Brokopf, R., Brovkin, V., Claussen, M., Crueger, T., Esch, M., Fast, I., Fiedler, S., Fläschner, D., Gayler, V., Giorgetta, M., Goll, D. S., Haak, H., Hagemann, S., Hedemann, C., Hohenegger, C., Ilyina, T., Jahns, T., Jimenéz-de-la-Cuesta, D., Jungclaus, J., Kleinen, T., Kloster, S., Kracher, D., Kinne, S., Kleberg, D., Lasslop, G., Kornblueh, L., Marotzke, J., Matei, D., Meraner, K., Mikolajewicz, U., Modali, K., Möbis, B., Müller, W. A., Nabel, J. E. M. S., Nam, C. C. W., Notz, D., Nyawira, S.-S., Paulsen, H., Peters, K., Pincus, R., Pohlmann, H., Pongratz, J., Popp, M., Raddatz, T. J., Rast, S., Redler, R., Reick, C. H., Rohrschneider, T., Schemann, V., Schmidt, H., Schnur, R., Schulzweida, U., Six, K. D., Stein, L., Stemmler, I., Stevens, B., von Storch, J.-S. Tian, F., Voigt, A., Vrese, P., Wieners, K.-H., Wilkenskjeld, S., Winkler, A., and Roeckner, E.: Developments in the MPI-M Earth System Model version 1.2 (MPI-ESM1. 2) and its response to increasing CO2, J. Adv. Model. Earth Sy., 11, 998–1038, 2019. a
McMartin, I., Campbell, J. E., and Dredge, L. A.: Middle Wisconsinan marine shells near Repulse Bay, Nunavut, Canada: implications for Marine Isotope Stage 3 ice-free conditions and Laurentide Ice Sheet dynamics in north-west Hudson Bay, J. Quaternary Sci., 34, 64–75, 2019. a
Meehl, G. A., Stocker, T. F., Collins, W. D., Friedlingstein, P., Gaye, A. T., Gregory, J. M., Kitoh, A., Knutti, R., Murphy, J. M., Noda, A., Raper, S. C. B., Watterson, I. G., Weaver, A. J., and Zhao, Z.-C.: Global Climate Projections, in: Climate Change 2007: The Physical Science Basis. Contribution of Working Group I to the Fourth Assessment Report of the Intergovernmental Panel on Climate Change, edited by: Solomon, S., Qin, D., Manning, M., Chen, Z., Marquis, M., Averyt, K. B., Tignor, M., and Miller, H. L., Cambridge University Press, Cambridge, United Kingdom and New York, NY, USA, 2007. a
Menviel, L., Timmermann, A., Friedrich, T., and England, M. H.: Hindcasting the continuum of Dansgaard–Oeschger variability: mechanisms, patterns and timing, Clim. Past, 10, 63–77, https://doi.org/10.5194/cp-10-63-2014, 2014. a
Merz, N., Raible, C. C., and Woollings, T.: North Atlantic eddy-driven jet in interglacial and glacial winter climates, J. Climate, 28, 3977–3997, 2015. a
Met Office: Met Office Unified Model [code], https://www.metoffice.gov.uk/research/approach/collaboration/unified-model/partnership, last access: 12 April 2023. a
Mitsui, T. and Crucifix, M.: Influence of external forcings on abrupt millennial-scale climate changes: a statistical modelling study, Clim. Dynam., 48, 2729–2749, 2017. a
Montoya, M., Born, A., and Levermann, A.: Reversed North Atlantic gyre dynamics in present and glacial climates, Clim. Dynam., 36, 1107–1118, 2011. a
Muglia, J. and Schmittner, A.: Glacial Atlantic overturning increased by wind stress in climate models, Geophys. Res. Lett., 42, 9862–9868, 2015. a, b, c
NGRIP Project Members: High-resolution record of Northern Hemisphere climate extending into the last interglacial period, Nature, 431, 147–151, https://doi.org/10.1038/nature02805, 2004. a
Nilsson, J., Broström, G., and Walin, G.: The thermohaline circulation and vertical mixing: Does weaker density stratification give stronger overturning?, J. Phys. Oceanogr., 33, 2781–2795, 2003. a
Ohgaito, R., Yamamoto, A., Hajima, T., O'ishi, R., Abe, M., Tatebe, H., Abe-Ouchi, A., and Kawamiya, M.: PMIP4 experiments using MIROC-ES2L Earth system model, Geosci. Model Dev., 14, 1195–1217, https://doi.org/10.5194/gmd-14-1195-2021, 2021. a
Oliver, K. I. C. and Edwards, N. R.: Location of potential energy sources and the export of dense water from the Atlantic Ocean, Geophys. Res. Lett., 35, L22604, https://doi.org/10.1029/2008GL035537, 2008. a
Pausata, F. S. R., Li, C., Wettstein, J. J., Nisancioglu, K. H., and Battisti, D. S.: Changes in atmospheric variability in a glacial climate and the impacts on proxy data: a model intercomparison, Clim. Past, 5, 489–502, https://doi.org/10.5194/cp-5-489-2009, 2009. a
Pausata, F. S. R., Li, C., Wettstein, J. J., Kageyama, M., and Nisancioglu, K. H.: The key role of topography in altering North Atlantic atmospheric circulation during the last glacial period, Clim. Past, 7, 1089–1101, https://doi.org/10.5194/cp-7-1089-2011, 2011. a
Pedro, J., Andersson, C., Vettoretti, G., Voelker, A., Waelbroeck, C., Dokken, T. M., Jensen, M. F., Rasmussen, S., Sessford, E., Jochum, M., and Nisancioglu, K. H.: Dansgaard-Oeschger and Heinrich event temperature anomalies in the North Atlantic set by sea ice, frontal position and thermocline structure, Quaternary Sci. Rev., 289, 107599, https://doi.org/10.1016/j.quascirev.2022.107599, 2022. a, b, c, d, e
Peltier, W. R.: Global glacial isostasy and the surface of the ice-age Earth: the ICE-5G (VM2) model and GRACE, Annu. Rev. Earth Planet. Sci., 32, 111–149, 2004. a, b, c
Peltier, W. R. and Vettoretti, G.: Dansgaard-Oeschger oscillations predicted in a comprehensive model of glacial climate: A “kicked” salt oscillator in the Atlantic, Geophys. Res. Lett., 41, 7306–7313, 2014. a, b, c, d, e, f, g, h, i, j, k
Peltier, W. R., Argus, D., and Drummond, R.: Space geodesy constrains ice age terminal deglaciation: The global ICE-6G_C (VM5a) model, J. Geophys. Res.-Sol. Ea., 120, 450–487, 2015. a, b
Peltier, W. R., Ma, Y., and Chandan, D.: The KPP trigger of rapid AMOC intensification in the nonlinear Dansgaard-Oeschger relaxation oscillation, J. Geophys. Res.-Oceans, 125, e2019JC015557, https://doi.org/10.1029/2019JC015557, 2020. a, b, c, d, e, f, g, h
Pico, T., Creveling, J., and Mitrovica, J.: Sea-level records from the US mid-Atlantic constrain Laurentide Ice Sheet extent during Marine Isotope Stage 3, Nat. Commun., 8, 1–6, 2017. a, b
Polyakov, I. V., Pnyushkov, A. V., Alkire, M. B., Ashik, I. M., Baumann, T. M., Carmack, E. C., Goszczko, I., Guthrie, J., Ivanov, V. V., Kanzow, T., Krishfield, R., Kwok, R., Sundfjord, A., Morison, J., Rember, R., and Yulin, A.: Greater role for Atlantic inflows on sea-ice loss in the Eurasian Basin of the Arctic Ocean, Science, 356, 285–291, 2017. a
Rahmstorf, S.: Bifurcations of the Atlantic thermohaline circulation in response to changes in the hydrological cycle, Nature, 378, 145–149, 1995. a
Rahmstorf, S.: Ocean circulation and climate during the past 120,000 years, Nature, 419, 207–214, https://doi.org/10.1038/nature01090, 2002. a
Rasmussen, S. O., Bigler, M., Blockley, S. P., Blunier, T., Buchardt, S. L., Clausen, H. B., Cvijanovic, I., Dahl-Jensen, D., Johnsen, S. J., Fischer, H., Gkinis, V., Guillevic, M., Hoek, W. Z., Lowe, J. J. Pedro, J. B., Popp, T., Seierstad, I. K., Steffensen, J. P., Svensson, A. M., Vallelonga, P., Vinther, B. M., Walker, M. J. C., Wheatley, J. J., and Winstrup, M.: A stratigraphic framework for abrupt climatic changes during the Last Glacial period based on three synchronized Greenland ice-core records: refining and extending the INTIMATE event stratigraphy, Quaternary Sci. Rev., 106, 14–28, 2014. a, b, c
Rasmussen, T. L. and Thomsen, E.: The role of the North Atlantic Drift in the millennial timescale glacial climate fluctuations, Palaeogeogr. Palaeocl., 210, 101–116, 2004. a
Rind, D., Schmidt, G. A., Jonas, J., Miller, R., Nazarenko, L., Kelley, M., and Romanski, J.: Multicentury instability of the Atlantic meridional circulation in rapid warming simulations with GISS ModelE2, J. Geophys. Res.-Atmos., 123, 6331–6355, 2018.
Riviere, G., Laine, A., Lapeyre, G., Salas-Mélia, D., and Kageyama, M.: Links between Rossby wave breaking and the North Atlantic Oscillation–Arctic Oscillation in present-day and Last Glacial Maximum climate simulations, J. Climate, 23, 2987–3008, 2010. a, b
Roberts, W. H., Valdes, P. J., and Payne, A. J.: Topography's crucial role in Heinrich Events, P. Natl. Acad. Sci. USA, 111, 16688–16693, 2014a. a, b
Roberts, W. H., Valdes, P. J., and Payne, A. J.: A new constraint on the size of Heinrich Events from an iceberg/sediment model, Earth Planet. Sc. Lett., 386, 1–9, 2014b. a, b, c, d
Roche, D., Paillard, D., and Cortijo, E.: Constraints on the duration and freshwater release of Heinrich event 4 through isotope modelling, Nature, 432, 379–382, 2004. a, b, c
Roche, D. M., Wiersma, A. P., and Renssen, H.: A systematic study of the impact of freshwater pulses with respect to different geographical locations, Clim. Dynam., 34, 997–1013, 2010. a
Rohling, E. J., Marsh, R., Wells, N. C., Siddall, M., and Edwards, N. R.: Similar meltwater contributions to glacial sea level changes from Antarctic and northern ice sheets, Nature, 430, 1016–1021, 2004. a
Romé, Y. M., Ivanovic, R. F., Gregoire, L. J., Sherriff-Tadano, S., and Valdes, P. J.: Millennial-scale climate oscillations triggered by deglacial meltwater discharge in last glacial maximum simulations, Paleoceanography and Paleoclimatology, e2022PA004451, https://doi.org/10.1029/2022PA004451, 2022. a
Rousseau, D.-D., Boers, N., Sima, A., Svensson, A., Bigler, M., Lagroix, F., Taylor, S., and Antoine, P.: (MIS3 & 2) millennial oscillations in Greenland dust and Eurasian aeolian records–A paleosol perspective, Quaternary Sci. Rev., 169, 99–113, 2017. a
Rousseau, D.-D., Bagniewski, W., and Ghil, M.: Abrupt climate changes and the astronomical theory: are they related?, Clim. Past, 18, 249–271, https://doi.org/10.5194/cp-18-249-2022, 2022. a
Samelson, R.: Simple mechanistic models of middepth meridional overturning, J. Phys. Oceanogr., 34, 2096–2103, 2004. a
Sanchez Goñi, M. F. and Harrison, S. P.: Millennial-scale climate variability and vegetation changes during the Last Glacial: Concepts and terminology, Quaternary Sci. Rev., 29, 2823–2827, 2010. a
Sánchez Goñi, M. F., Desprat, S., Daniau, A.-L., Bassinot, F. C., Polanco-Martínez, J. M., Harrison, S. P., Allen, J. R. M., Anderson, R. S., Behling, H., Bonnefille, R., Burjachs, F., Carrión, J. S., Cheddadi, R., Clark, J. S., Combourieu-Nebout, N., Mustaphi, Colin. J. Courtney, Debusk, G. H., Dupont, L. M., Finch, J. M., Fletcher, W. J., Giardini, M., González, C., Gosling, W. D., Grigg, L. D., Grimm, E. C., Hayashi, R., Helmens, K., Heusser, L. E., Hill, T., Hope, G., Huntley, B., Igarashi, Y., Irino, T., Jacobs, B., Jiménez-Moreno, G., Kawai, S., Kershaw, A. P., Kumon, F., Lawson, I. T., Ledru, M.-P., Lézine, A.-M., Liew, P. M., Magri, D., Marchant, R., Margari, V., Mayle, F. E., McKenzie, G. M., Moss, P., Müller, S., Müller, U. C., Naughton, F., Newnham, R. M., Oba, T., Pérez-Obiol, R., Pini, R., Ravazzi, C., Roucoux, K. H., Rucina, S. M., Scott, L., Takahara, H., Tzedakis, P. C., Urrego, D. H., van Geel, B., Valencia, B. G., Vandergoes, M. J., Vincens, A., Whitlock, C. L., Willard, D. A., and Yamamoto, M.: The ACER pollen and charcoal database: a global resource to document vegetation and fire response to abrupt climate changes during the last glacial period, Earth Syst. Sci. Data, 9, 679–695, https://doi.org/10.5194/essd-9-679-2017, 2017. a
Schilt, A., Baumgartner, M., Schwander, J., Buiron, D., Capron, E., Chappellaz, J., Loulergue, L., Schüpbach, S., Spahni, R., Fischer, H., and Stocker, T. F.: Atmospheric nitrous oxide during the last 140,000 years, Earth Planet. Sc. Lett., 300, 33–43, 2010. a
Schulz, M., Berger, W. H., Sarnthein, M., and Grootes, P. M.: Amplitude variations of 1470-year climate oscillations during the last 100,000 years linked to fluctuations of continental ice mass, Geophys. Res. Lett., 26, 3385–3388, 1999. a
Seager, R. and Battisti, D. S.: Challenges to our understanding of the general circulation: Abrupt climate change, Global Circulation of the Atmosphere, 331–371, https://doi.org/10.1515/9780691236919-014, 2007. a
Seierstad, I. K., Abbott, P. M., Bigler, M., Blunier, T., Bourne, A. J., Brook, E., Buchardt, S. L., Buizert, C., Clausen, H. B., Cook, E., Dahl-Jensen, D., Davies, S. M., Guillevic, M., Johnsen, S. J., Pedersen, D. S., Popp, T. J., Rasmussen, S. O., Severinghaus, J. P., Svensson, A., and Vinther, B. M.: Consistently dated records from the Greenland GRIP, GISP2 and NGRIP ice cores for the past 104 ka reveal regional millennial-scale δ18O gradients with possible Heinrich event imprint, Quaternary Sci. Rev., 106, 29–46, 2014. a
Sepulchre, P., Caubel, A., Ladant, J.-B., Bopp, L., Boucher, O., Braconnot, P., Brockmann, P., Cozic, A., Donnadieu, Y., Dufresne, J.-L., Estella-Perez, V., Ethé, C., Fluteau, F., Foujols, M.-A., Gastineau, G., Ghattas, J., Hauglustaine, D., Hourdin, F., Kageyama, M., Khodri, M., Marti, O., Meurdesoif, Y., Mignot, J., Sarr, A.-C., Servonnat, J., Swingedouw, D., Szopa, S., and Tardif, D.: IPSL-CM5A2 – an Earth system model designed for multi-millennial climate simulations, Geosci. Model Dev., 13, 3011–3053, https://doi.org/10.5194/gmd-13-3011-2020, 2020. a
Sherriff-Tadano, S., Abe-Ouchi, A., Yoshimori, M., Oka, A., and Chan, W.-L.: Influence of glacial ice sheets on the Atlantic meridional overturning circulation through surface wind change, Clim. Dynam., 50, 2881–2903, 2018. a, b, c
Siddall, M., Rohling, E. J., Thompson, W. G., and Waelbroeck, C.: Marine isotope stage 3 sea level fluctuations: Data synthesis and new outlook, Rev. Geophys., 46, https://doi.org/10.1029/2007RG000226, 2008. a
Sidorenko, D., Rackow, T., Jung, T., Semmler, T., Barbi, D., Danilov, S., Dethloff, K., Dorn, W., Fieg, K., Gößling, H. F., Handorf, D., Harig, S., Hiller, W., Juricke, S., Losch, M., Schröter, J., Sein, D. V., and Wang, Q.: Towards multi-resolution global climate modeling with ECHAM6–FESOM. Part I: model formulation and mean climate, Clim. Dynam., 44, 757–780, 2015. a, b, c
Sidorenko, D., Goessling, H. F., Koldunov, N., Scholz, P., Danilov, S., Barbi, D., Cabos, W., Gurses, O., Harig, S., Hinrichs, C., Juricke, S., Lohmann, G., Losch, M., Mu, L., Rackow, T., Rakowsky, N., Sein, D., Semmler, T., Shi, X., Stepanek, C., Streffing, J., Wang, Q., Wekerle, C., Yang, H., and Jung T.: Evaluation of FESOM2. 0 coupled to ECHAM6. 3: preindustrial and HighResMIP simulations, J. Adv. Model. Earth Sy., 11, 3794–3815, 2019. a
Sime, L. C., Hopcroft, P. O., and Rhodes, R. H.: Impact of abrupt sea ice loss on Greenland water isotopes during the last glacial period, P. Natl. Acad. Sci. USA, 116, 4099–4104, https://doi.org/10.1073/pnas.1807261116, 2019. a, b, c
Singh, H. A., Battisti, D. S., and Bitz, C. M.: A heuristic model of Dansgaard–Oeschger cycles. Part I: Description, results, and sensitivity studies, J. Climate, 27, 4337–4358, 2014. a
Spolaor, A., Vallelonga, P., Turetta, C., Maffezzoli, N., Cozzi, G., Gabrieli, J., Barbante, C., Goto-Azuma, K., Saiz-Lopez, A., Cuevas, C. A., and Dahl-Jensen, D.: Canadian Arctic sea ice reconstructed from bromine in the Greenland NEEM ice core, Sci. Rep., 6, 33925, https://doi.org/10.1038/srep33925, 2016. a
Stocker, T. F. and Johnsen, S. J.: A minimum thermodynamic model for the bipolar seesaw, Paleoceanography, 18, https://doi.org/10.1029/2003PA000920, 2003. a
Stouffer, R. J., Yin, J., Gregory, J., Dixon, K., Spelman, M., Hurlin, W., Weaver, A., Eby, M., Flato, G., Hasumi, H., Hu, A., Jungclaus, J. H., Kamenkovich, I. V., Levermann, A., Montoya, M., Murakami, S., Nawrath, S., Oka, A., Peltier, W. R., Robitaille, D. Y., Sokolov, A., Vettoretti, G., and Weber, S. L.: Investigating the causes of the response of the thermohaline circulation to past and future climate changes, J. Climate, 19, 1365–1387, 2006. a, b
Tarasov, L., Dyke, A. S., Neal, R. M., and Peltier, W. R.: A data-calibrated distribution of deglacial chronologies for the North American ice complex from glaciological modeling, Earth Planet. Sci. Lett., 315, 30–40, 2012. a
Tesi, T., Muschitiello, F., Mollenhauer, G., Miserocchi, S., Langone, L., Ceccarelli, C., Panieri, G., Chiggiato, J., Nogarotto, A., Hefter, J., Ingrosso, G., Giglio, F., Giordano, P., and Capotondi, L.: Rapid Atlantification along the Fram Strait at the beginning of the 20th century, Sci. Adv., 7, eabj2946, https://doi.org/10.1126/sciadv.abj2946, 2021. a
Thomas, E. R., Wolff, E. W., Mulvaney, R., Johnsen, S. J., Steffensen, J. P., and Arrowsmith, C.: Anatomy of a Dansgaard-Oeschger warming transition: High-resolution analysis of the North Greenland Ice Core Project ice core, J. Geophys. Res.-Atmos., 114, https://doi.org/10.1029/2008JD011215, 2009. a
Tierney, J. E., Zhu, J., King, J., Malevich, S. B., Hakim, G. J., and Poulsen, C. J.: Glacial cooling and climate sensitivity revisited, Nature, 584, 569–573, 2020. a
Timmermann, A., Gildor, H., Schulz, M., and Tziperman, E.: Coherent resonant millennial-scale climate oscillations triggered by massive meltwater pulses, J. Climate, 16, 2569–2585, 2003. a, b
Turner, J. and Marshall, G. J.: Climate change in the polar regions, Cambridge University Press, https://doi.org/10.1017/CBO9780511975431, 2011. a
Tzedakis, P., Drysdale, R. N., Margari, V., Skinner, L. C., Menviel, L., Rhodes, R. H., Taschetto, A. S., Hodell, D. A., Crowhurst, S. J., Hellstrom, J. C., Fallick, A. E., Grimalt, J. O., McManus, J. F., Martrat, B., Mokeddem, Z., Parrenin, F., Regattieri, E., Roe, K., and Zanchetta, G.: Enhanced climate instability in the North Atlantic and southern Europe during the Last Interglacial, Nat. Commun., 9, 1–14, 2018. a, b, c
Ullman, D. J., LeGrande, A. N., Carlson, A. E., Anslow, F. S., and Licciardi, J. M.: Assessing the impact of Laurentide Ice Sheet topography on glacial climate, Clim. Past, 10, 487–507, https://doi.org/10.5194/cp-10-487-2014, 2014. a
Uriarte, A.: Historia del Clima de la Tierra. Servicio Central de Publicaciones del Gobierno Vasco, 2009, 306 p., ISBN 84-457-2079-1, 2019. a
Valdes, P.: Built for stability, Nat. Geosci., 4, 414–416, 2011. a
Valdes, P. J., Armstrong, E., Badger, M. P. S., Bradshaw, C. D., Bragg, F., Crucifix, M., Davies-Barnard, T., Day, J. J., Farnsworth, A., Gordon, C., Hopcroft, P. O., Kennedy, A. T., Lord, N. S., Lunt, D. J., Marzocchi, A., Parry, L. M., Pope, V., Roberts, W. H. G., Stone, E. J., Tourte, G. J. L., and Williams, J. H. T.: The BRIDGE HadCM3 family of climate models: HadCM3@Bristol v1.0, Geosci. Model Dev., 10, 3715–3743, https://doi.org/10.5194/gmd-10-3715-2017, 2017. a
van der Schrier, G., Drijfhout, S. S., Hazeleger, W., and Noulin, L.: Increasing the Atlantic subtropical jet cools the circum-North Atlantic region, Meteorol. Z., 16, 675e684, https://doi.org/10.1127/0941-2948/2007/0252, 2007. a
Vanneste, H., De Vleeschouwer, F., Martínez-Cortizas, A., Von Scheffer, C., Piotrowska, N., Coronato, A., and Le Roux, G.: Late-glacial elevated dust deposition linked to westerly wind shifts in southern South America, Sci. Rep., 5, 1–10, 2015. a
Vettoretti, G. and Peltier, W. R.: Thermohaline instability and the formation of glacial North Atlantic super polynyas at the onset of Dansgaard-Oeschger warming events, Geophys. Res. Lett., 43, 5336–5344, 2016. a, b, c
Vettoretti, G. and Peltier, W. R.: Fast physics and slow physics in the nonlinear Dansgaard–Oeschger relaxation oscillation, J. Climate, 31, 3423–3449, 2018. a, b
Vettoretti, G., Ditlevsen, P., Jochum, M., and Rasmussen, S. O.: Atmospheric CO2 control of spontaneous millennial-scale ice age climate oscillations, Nat. Geosci., 1–7, 15, https://doi.org/10.1038/s41561-022-00920-7, 2022. a, b, c, d, e, f
Voelker, A. H.: Global distribution of centennial-scale records for Marine Isotope Stage (MIS) 3: a database, Quaternary Sci. Rev., 21, 1185–1212, 2002. a
Volodin, E. M., Mortikov, E. V., Kostrykin, S. V., Galin, V. Y., Lykossov, V. N., Gritsun, A. S., Diansky, N. A., Gusev, A. V., Iakovlev, N. G., Shestakova, A. A., and Emelina, S. V.: Simulation of the modern climate using the INM-CM48 climate model, Russ. J. Numer. Anal. M., 33, 367–374, 2018. a
Wagner, J. D., Cole, J. E., Beck, J. W., Patchett, P. J., Henderson, G. M., and Barnett, H. R.: Moisture variability in the southwestern United States linked to abrupt glacial climate change, Nat. Geosci., 3, 110–113, 2010. a
Wang, X., Auler, A. S., Edwards, R. L., Cheng, H., Cristalli, P. S., Smart, P. L., Richards, D. A., and Shen, C.-C.: Wet periods in northeastern Brazil over the past 210 kyr linked to distant climate anomalies, Nature, 432, 740–743, 2004. a
Wang, Y., Cheng, H., Edwards, R. L., Kong, X., Shao, X., Chen, S., Wu, J., Jiang, X., Wang, X., and An, Z.: Millennial-and orbital-scale changes in the East Asian monsoon over the past 224,000 years, Nature, 451, 1090–1093, 2008. a
Welander, P.: A simple heat-salt oscillator, Dynamics of Atmospheres and Oceans, 6, 233–242, 1982. a
Wunsch, C.: Abrupt climate change: An alternative view, Quaternary Res., 65, 191–203, 2006. a
Zhang, X. and Prange, M.: Stability of the Atlantic overturning circulation under intermediate (MIS3) and full glacial (LGM) conditions and its relationship with Dansgaard-Oeschger climate variability, Quaternary Sci. Rev., 242, 106443, https://doi.org/10.1016/j.quascirev.2020.106443, 2020. a, b, c, d, e, f, g, h
Zhang, X., Lohmann, G., Knorr, G., and Xu, X.: Different ocean states and transient characteristics in Last Glacial Maximum simulations and implications for deglaciation, Clim. Past, 9, 2319–2333, https://doi.org/10.5194/cp-9-2319-2013, 2013. a
Zhang, X., Lohmann, G., Knorr, G., and Purcell, C.: Abrupt glacial climate shifts controlled by ice sheet changes, Nature, 512, 290–294, 2014. a, b, c, d, e, f, g, h, i, j, k, l, m, n, o, p, q
Zhang, X., Knorr, G., Lohmann, G., and Barker, S.: Abrupt North Atlantic circulation changes in response to gradual CO2 forcing in a glacial climate state, Nat. Geosci., 10, 518–523, 2017. a, b, c, d, e
Zhang, X., Barker, S., Knorr, G., Lohmann, G., Drysdale, R., Sun, Y., Hodell, D., and Chen, F.: Direct astronomical influence on abrupt climate variability, Nat. Geosci., 14, 819–826, 2021. a, b, c, d, e, f, g, h
- Abstract
- Introduction
- Review of spontaneous D–O-type quasi-oscillations in coupled climate models
- Contours of a baseline MIS3 experiment protocol
- Conclusions
- Appendix A
- Appendix B
- Appendix C
- Code availability
- Data availability
- Team list
- Author contributions
- Competing interests
- Disclaimer
- Acknowledgements
- Financial support
- Review statement
- References