the Creative Commons Attribution 4.0 License.
the Creative Commons Attribution 4.0 License.
 | 27 Apr 2023
The ST22 chronology for the Skytrain Ice Rise ice core – Part 2: An age model to the last interglacial and disturbed deep stratigraphy
Robert Mulvaney
Mackenzie M. Grieman
Helene H. Hoffmann
Jack D. Humby
Christoph Nehrbass-Ahles
Rachael H. Rhodes
Isobel F. Rowell
Frédéric Parrenin
Loïc Schmidely
Hubertus Fischer
Thomas F. Stocker
Marcus Christl
Raimund Muscheler
Amaelle Landais
Frédéric Prié
We present an age model for the 651 m deep ice core from Skytrain Ice Rise, situated inland of the Ronne Ice Shelf, Antarctica. The top 2000 years have previously been dated using age markers interpolated through annual layer counting. Below this, we align the Skytrain core to the AICC2012 age model using tie points in the ice and air phase, and we apply the Paleochrono program to obtain the best fit to the tie points and glaciological constraints. In the gas phase, ties are made using methane and, in critical sections, δ18Oair; in the ice phase ties are through 10Be across the Laschamps event and through ice chemistry related to long-range dust transport and deposition. This strategy provides a good outcome to about 108 ka (∼ 605 m). Beyond that there are signs of flow disturbance, with a section of ice probably repeated. Nonetheless values of CH4 and δ18Oair confirm that part of the last interglacial (LIG), from about 117–126 ka (617–627 m), is present and in chronological order. Below this there are clear signs of stratigraphic disturbance, with rapid oscillation of values in both the ice and gas phase at the base of the LIG section, below 628 m. Based on methane values, the warmest part of the LIG and the coldest part of the penultimate glacial are missing from our record. Ice below 631 m appears to be of age > 150 ka.
- Article
(4102 KB) - Full-text XML
- Companion paper
-
Supplement
(1076 KB) - BibTeX
- EndNote


There is currently intense interest in the role of the Antarctic Ice Sheet, and the West Antarctic Ice Sheet (WAIS) in particular, in future sea level rise (DeConto et al., 2021; Fox-Kemper et al., 2021). While modern studies of the behaviour of the WAIS are essential, studies aimed at assessing the past stability of the WAIS and its response to past climate change are required to constrain the operation of proposed feedbacks (such as the marine ice cliff instability mechanism) (Gilford et al., 2020). The last interglacial (LIG, Marine Isotope Stage (MIS) 5e, ∼ 130–110 kyr before present (BP), where present is defined as 1950) has been considered of particular interest because estimates of sea level during that period compared to the present (Dutton et al., 2015; Dyer et al., 2021) appear to require some contribution from retreat of the Antarctic Ice Sheet. In order to assess the sensitivity of the WAIS and its surroundings to climate change, it is also of interest to understand how the climate and the ice in the WAIS region responded to the coolings and warmings of the last glacial period and the warming into the Holocene.
While there are a number of Antarctic ice core records extending through at least one climate cycle and into the LIG from East Antarctica (e.g. Crotti et al., 2021; EPICA Community Members, 2004; Grootes et al., 2001; Kawamura et al., 2007), long records from West Antarctica are scarce. The WAIS Divide ice core (Fig. 1) provides an excellent and well-resolved record of the last 68 kyr (Buizert et al., 2015) but does not extend further back in time. The only other long core in the interior of the WAIS is the 2191 m long Byrd core, for which the oldest ages presented are 90 ka (Ahn and Brook, 2008). On the periphery of the WAIS, the Siple Dome core reached the bed at 1004 m, but again data have only been presented as far back as 100 ka (Brook et al., 2005; Saltzman et al., 2006; Severinghaus et al., 2009). At Roosevelt Island, situated within the Ross Ice Shelf, the ice could not yet be dated beyond 83 ka (Lee et al., 2020). Old ice might be available at the bottom of the Berkner Island (Mulvaney et al., 2007) and Fletcher Promontory (Mulvaney et al., 2014) cores, but there is no published age scale for these cores so far.
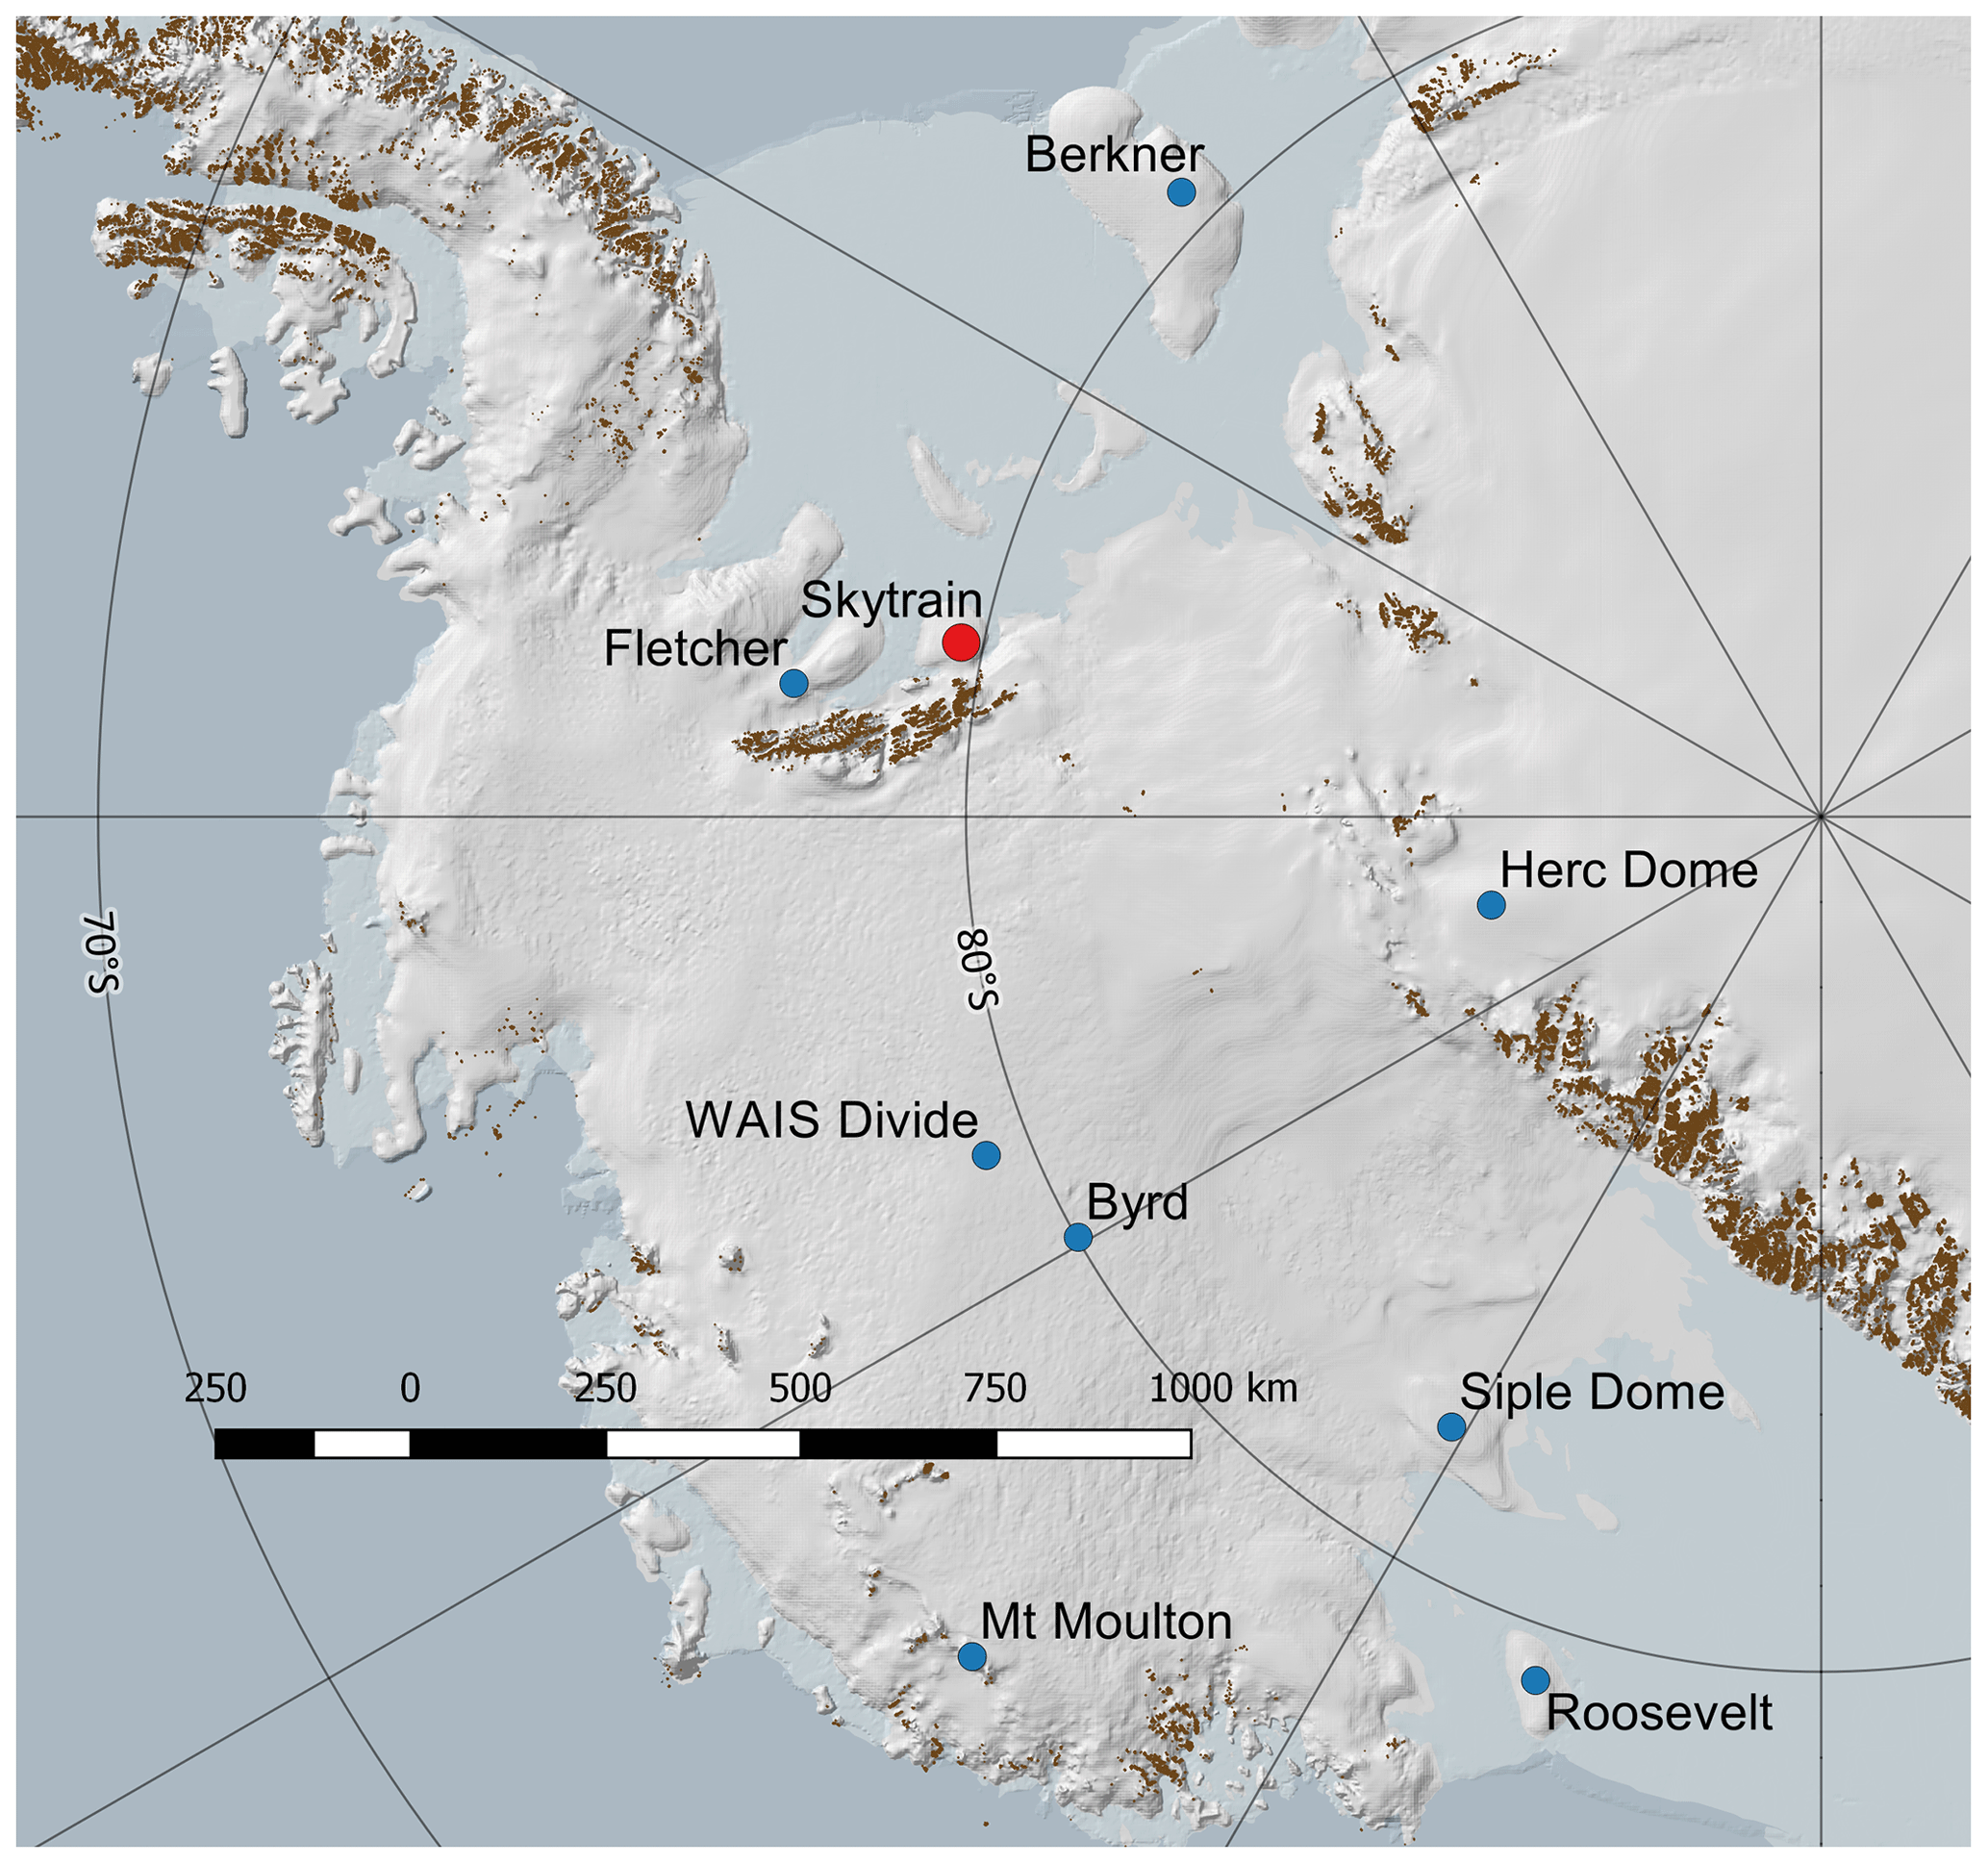
Figure 1Map showing ice core sites in West Antarctica that are mentioned in the text. Map generated using QGIS with the Quantarctica mapping environment (Matsuoka et al., 2021).
The only record that seems to unequivocally reach the LIG in West Antarctica to date is that from a horizontal ice trench in the blue ice area at Mount Moulton (Korotkikh et al., 2011). This appears to reach 135 ka, although the nature of the record makes it hard to assess its continuity. It is therefore a priority to find sites in the WAIS vicinity where a record extending to the LIG can be retrieved and fully analysed. One potential candidate site, near the boundary between the East Antarctic Ice Sheet and West Antarctic Ice Sheet, would be Hercules Dome (Jacobel et al., 2005), and drilling is expected there in the next few years. In this paper we present an age scale for an ice core drilled at Skytrain Ice Rise, at the boundary of the WAIS and the Ronne Ice Shelf.
The core at Skytrain Ice Rise was drilled to the bed at 651 m depth in 2018–2019 (Mulvaney et al., 2021). Skytrain Ice Rise (Fig. 2) is an independent ice rise (i.e. with its own flow regime) with a circular shape and a diameter of ∼ 80 km. It sits at an altitude of 784 m, has a 10 m temperature (representing mean annual temperature today) of −25.9 ∘C, and has a basal temperature of −14.9 ∘C. It represents an attractive target because its isotopic and chemical content should be sensitive to changes in the extent and altitude of the WAIS and also to the extent of the adjacent Ronne Ice Shelf. It is situated on a bed that is above sea level but surrounded almost entirely by ice shelf (including Constellation and Hercules inlets; see Fig. 2) that has a sea bed depth of at least 1000 m. On the WAIS side, it is protected by the Ellsworth Mountains. This combination ensures that Skytrain Ice Rise will almost certainly have remained as a separate ice dome and would never have been overridden by inland ice, whatever the size of the WAIS.
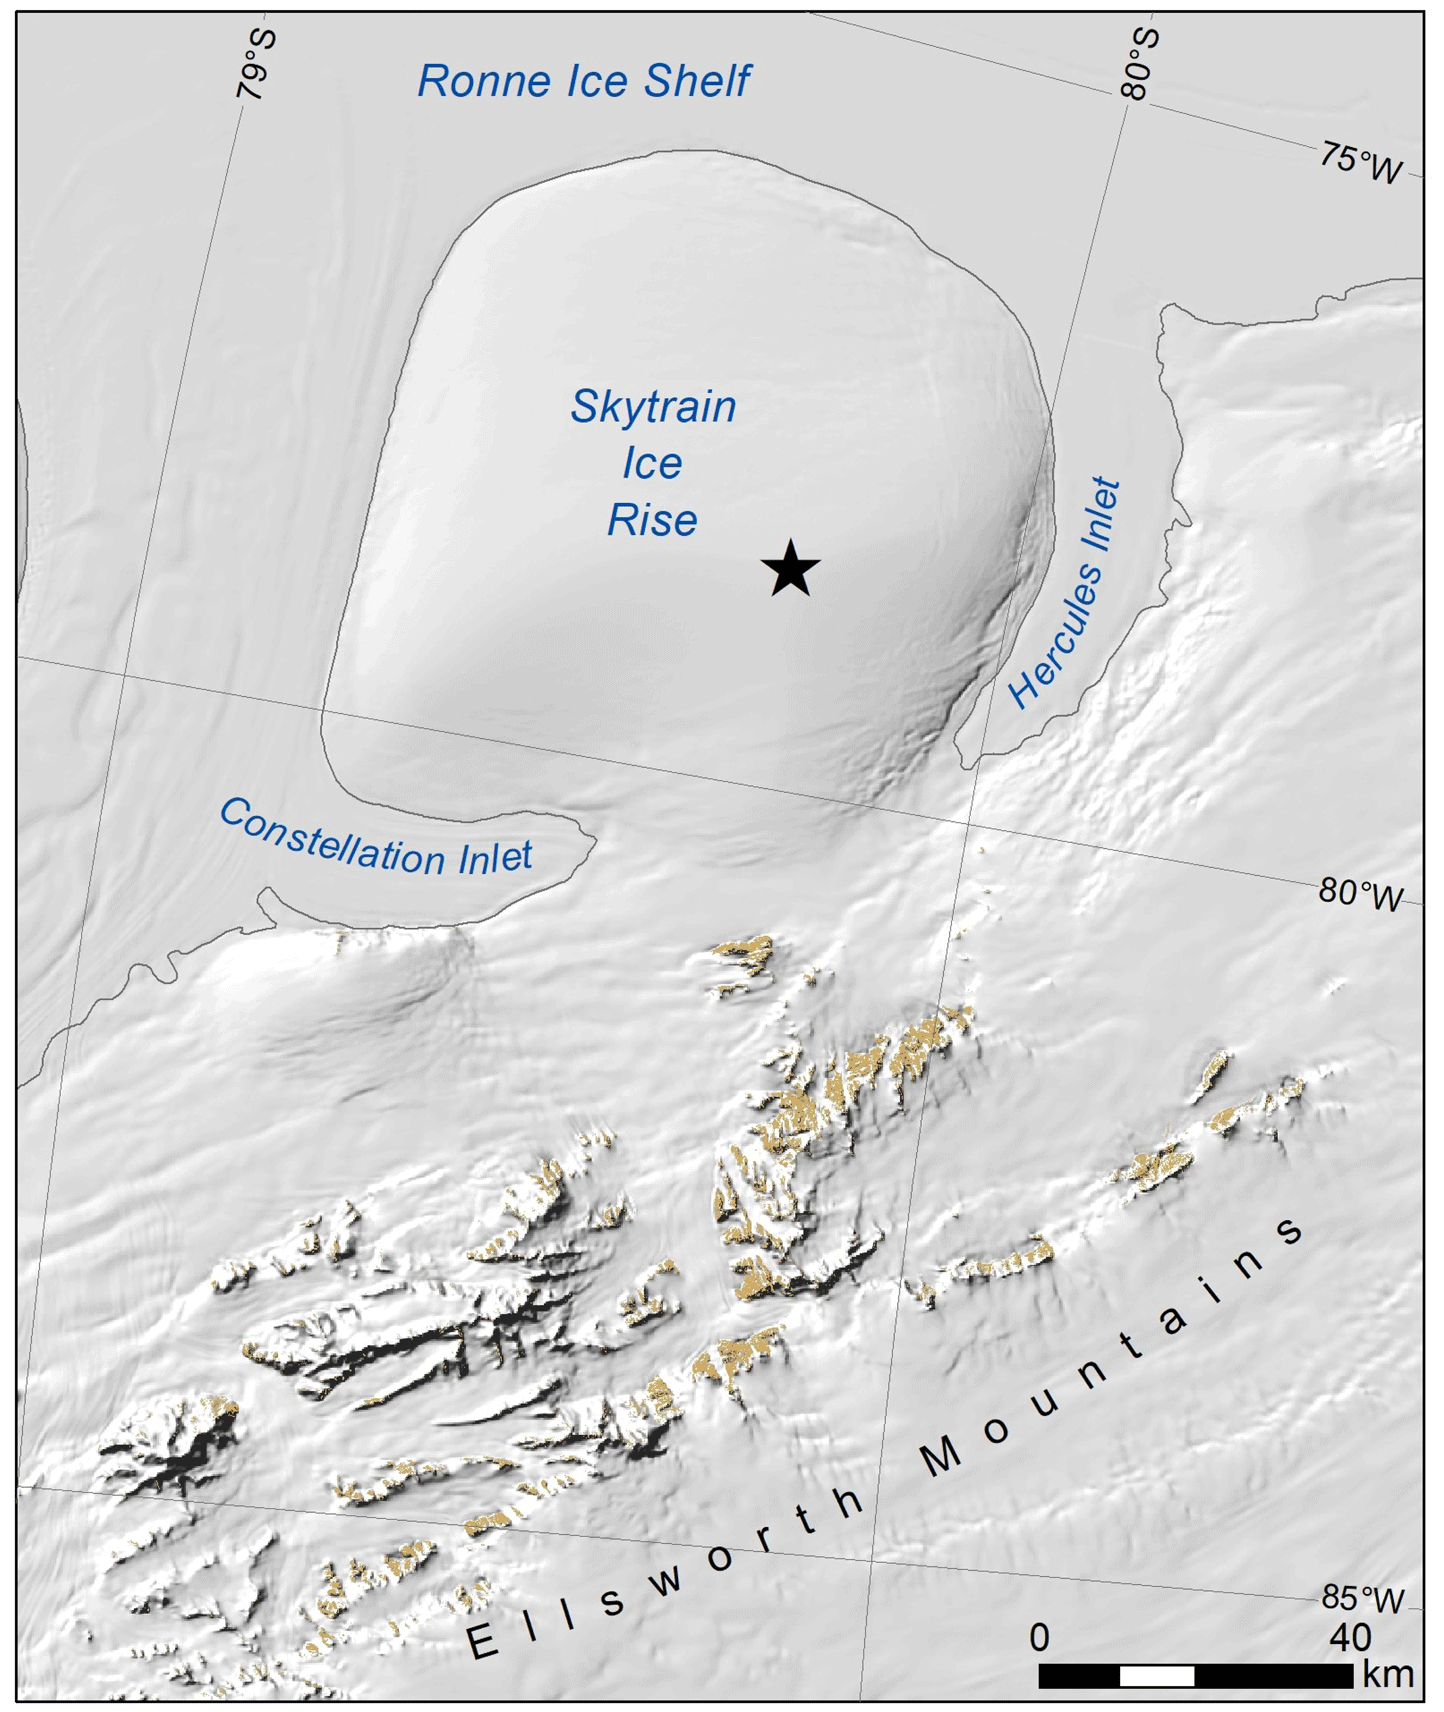
Figure 2Skytrain Ice Rise. The drill site is marked with a star. Figure reproduced from Mulvaney et al. (2021).
Radar data collected previously showed good layering almost to the bed (Mulvaney et al., 2021), with a pronounced Raymond arch. The drill site was chosen based on the radar layers to give old ice as far from the bed as possible.
In a companion paper to this one (Hoffmann et al., 2022) we have used a variety of age markers, interpolated through counting of annual layers in chemistry, to derive an age scale for the last 2000 years (∼ 200 m). In this paper we use a range of evidence to derive an age model for the rest of the core. In particular, we demonstrate that the core contains an intact record of the last glacial period and extends into the LIG. We also discuss the possible age of more disturbed ice found in the deepest 20 m of the core.
The strategy, as with other recent dating papers (Epifanio et al., 2020), is to tie the Skytrain Ice Rise core to a well-established age model. Since we expected our core to run well beyond the age of the WAIS Divide core, we have chosen to give our final derived ages as those of the AICC2012 age model (Bazin et al., 2013; Veres et al., 2013), which was developed for the EPICA ice cores but includes synchronised age scales for some of the major East Antarctic Ice Sheet deep ice cores (Talos Dome, Vostok) and which is synchronised to the Greenland NGRIP ice core in the upper 60 kyr. However, we recognise that the WD2014 age model (Buizert et al., 2015; Sigl et al., 2016), developed for the WAIS Divide ice core, is more accurate in absolute age over the last 68 kyr and that methane data are available at a much higher resolution in cores that have been tied to it. For that reason, in some cases we initially matched our core to WD2014 and then used a simple translation table to tie it to AICC2012. For convenience, our depth–age table in the Supplement provides both WD2014 and AICC2012 ages for the last 63 kyr. This is based on volcanic synchronisations (Buizert et al., 2018; Sigl et al., 2022) for the age of the ice.
In order to construct the age alignment and estimate uncertainty, we use the Paleochrono program which is a development of the IceChrono program (Parrenin et al., 2015). We include a number of stratigraphic alignments to AICC2012, based on the data in the companion paper for the uppermost 2000 years, and using CH4, δ18Oair, 10Be, and ice chemistry markers in deeper ice. Paleochrono was started with a prior for the accumulation rate (based on a simple relationship with water isotope ratios), air lock-in depth, and a simple ice-thinning function. Paleochrono minimises a cost function that measures the misfit of the model with respect to the prior and the observations (tie points).
2.1 Flow disturbance
In the deeper part of the ice core, between 628–635 m, we observe some discontinuities, with rapid and simultaneous changes in water isotopes and methane at the same depth. These will be discussed in more detail later, but they represent likely depths of flow disturbance or folding, as has been observed in other ice core records, including those of the LIG in Greenland (Chappellaz et al., 1997; NEEM Community Members, 2013; Yau et al., 2016). We also deduce that some disturbance may exist in a region between about 605 and 615 m depth. From 600 m downwards we therefore carefully examine individual data points (using paired values of CH4 and δ18Oatm matched against reference data) to reconstruct discrete ages for particular depths. This allows us to assess which sections are in order with well-constrained ages and which are disturbed in the deeper ice. We then use Paleochrono to derive a continuous age model to 628 m, making manual adjustments to the final age scale to avoid assigning spurious ages to data in the disturbed section.
In this section we describe the collection of the data used to make ties to other cores, both in the gas phase (air bubbles) and in the ice phase.
3.1 Continuous methane
Methane measurements are a particularly powerful way of aligning the gas ages of different ice cores because they exhibit large (from tens to 200 ppb) and abrupt changes of concentration across millennial-scale Dansgaard–Oeschger events that recur throughout the last glacial period (e.g. Epifanio et al., 2020). Using high-resolution continuous analysis it has also been shown that centennial and faster variability down to below 10 ppb amplitude is well reproduced between cores (Lee et al., 2020; Mitchell et al., 2013; Rhodes et al., 2017). As methane is well mixed in the Antarctic troposphere, not just the pattern but the absolute values should match with reference datasets within uncertainty. Our main dataset, from continuous flow analysis (CFA), is good at showing the high-resolution variability but has a large and unknown uncertainty in absolute values. We therefore supplement it with some discrete analyses (Sect. 3.2) that constrain the concentration tightly at key sections of ice.
We measured methane (CH4) continuously during the continuous flow analysis (CFA) campaign (Grieman et al., 2021). Briefly, the core was melted at a mean rate of 3.2 cm min−1 and the air was separated from residual water flow using a 3M Liqui-Cel MM-0.5x1 Series membrane contactor. The dried air was then directed to a Picarro G2301 CRDS for CH4 analysis. While the methane Picarro calibration could not be checked against external certified standards, comparison of our data produced by CFA with analysis of discrete samples analysed in Bern (Sect. 4.2), as well as comparison of our CFA data with reference data across the Holocene and glacial, suggests that the CFA methane reproduces the variability in methane at centennial scales. However, the absolute values are offset (mainly low) by an amount that varied by a few percentage points over the campaign, but the offset was typically below 10 %. This offset arises partly from dissolution of a small percentage of gas into the meltwater stream, as has been observed previously using CFA to measure methane (Rhodes et al., 2015). Continuous analyses started at 244 m depth and continued in all sections where the ice was of suitable quality to 649.4 m. A short section from 144.0–161.3 m was also analysed continuously for methane with an improved measurement setup which is discussed in the companion paper (Hoffmann et al., 2022).
Two significant issues affected the measurements. Firstly, a section of data between 534 and 545 m was affected by a leak of lab air at the membrane contactor. The absolute values in this section of ice are therefore substantially higher than the palaeoatmosphere, but the pattern of variability can still partly be used for wiggle matching after correction using discrete analyses (next section).
A second issue is that there were increasing numbers of breaks and cracks in the ice with depth, particularly below 450 m. Badly cracked sections were removed before the ice was placed on the melter, and breaks across the core were smoothed with a cleaned file to ensure that the contact between ice sections was as close as possible. With these precautions, such occurrences do not affect the ice phase chemical measurements and most do not affect CH4 either. Nonetheless some of the remaining cracks and transitions between different bags provide an opportunity for the ingress of lab air as the ice melts, leading to spikes in methane concentration. Major short peaks and troughs were identified manually and removed from the dataset. Above 500 m, ∼ 25 spikes that were at least a factor 2 higher or lower than the mean of the dataset were removed. Below 500 m, the data became much noisier and ∼ 100 deviations from the dataset were manually removed. Even after removal of the obvious spike artefacts, the data remain more noisy than the data that are unaffected by such artefacts, suggesting that positive artefacts arising from inclusion of modern air remain in the dataset. This makes it trickier to clearly align data with a reference dataset in the deeper ice. The dataset below 244 m is shown in Fig. 3.
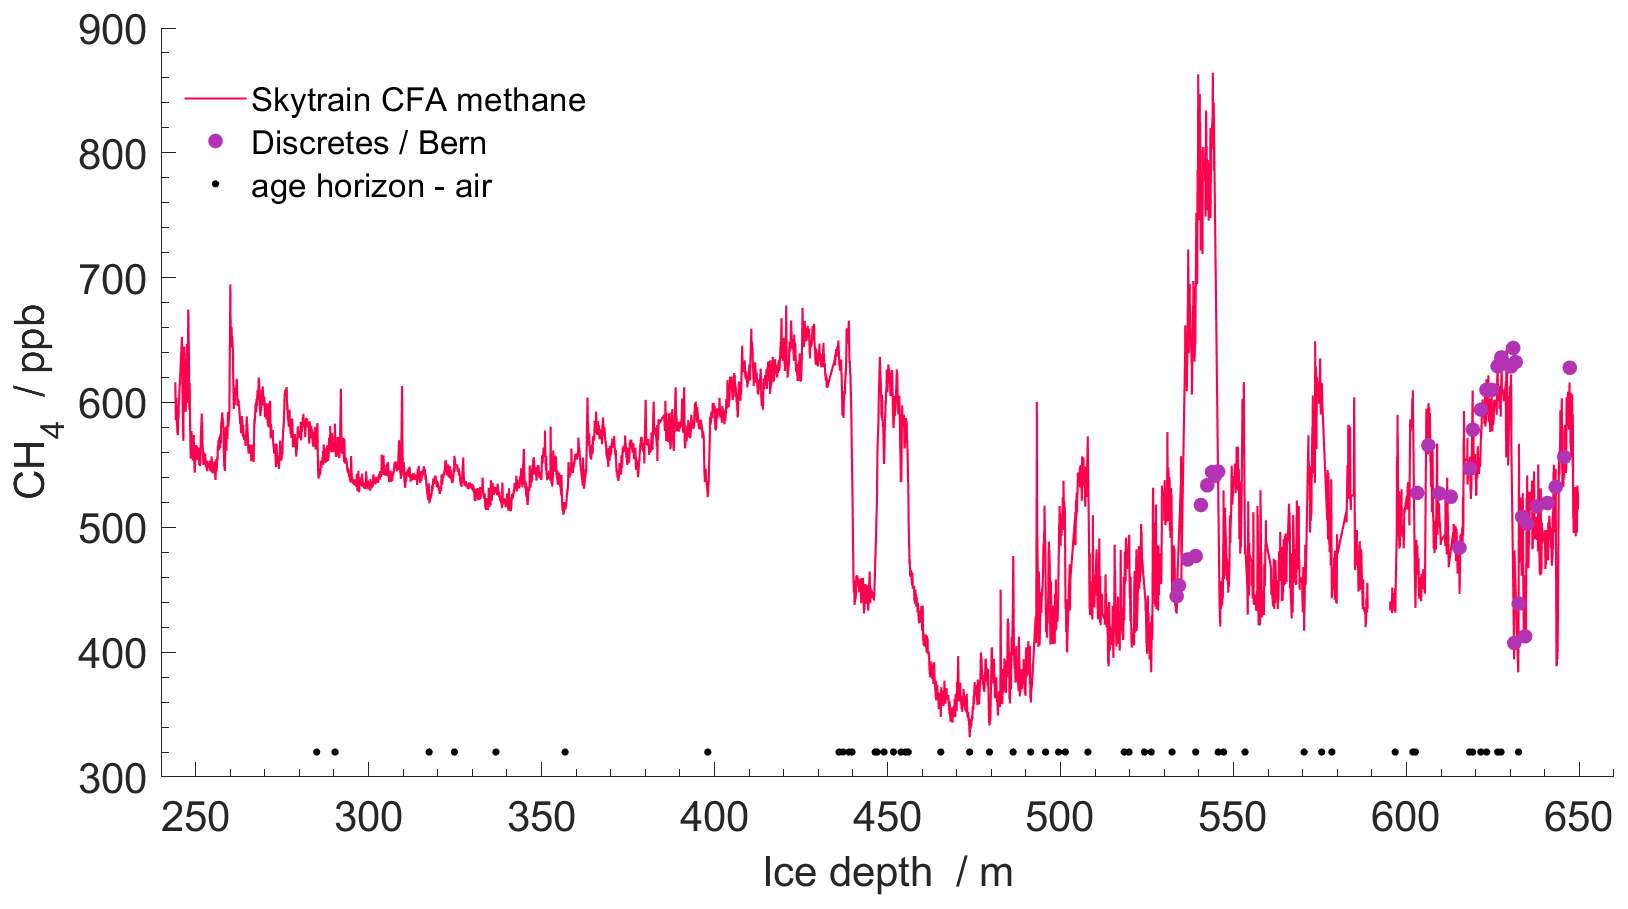
Figure 3Continuous (CFA) methane (red line), and data from discrete measurements (purple dots), after removal of occasional methane spikes as discussed in the text. The discrete data confirm that the continuous data between 534 and 545 m are offset and confirm that the uncalibrated values for the remaining continuous data are reasonable. Tie points used to construct the age scale are shown as black dots.
3.2 Discrete methane
To validate and control that the absolute levels of our continuous CH4 record are consistent within uncertainty with the absolute values in reference data, we obtained some well-calibrated discrete measurements (Fig. 3), particularly in the deep ice and in the section impacted by the air leak (Sect. 3.1). Ten discrete samples were therefore measured at the University of Bern between 533–546 m, and a further 25 samples were measured between 600 and 650 m depth. Details of the method have been published elsewhere (Schmidely et al., 2021). Concentrations ranged between 413 and 644 ppb, with an estimated precision (1σ) of 7 ppb (Table S1 in the Supplement). Note that the discrete data presented here have been corrected by −18 ppb (Schmidely et al., 2021) to align them with previously published CH4 records. These offsets are potentially due to different remnant solubility of CH4 in meltwater using different melt extraction methods in different labs. Taking the uncertainty of the correction into account, the total uncertainty is estimated at 12 ppb (Schmidely et al., 2021), while that of the reference data is estimated at 10 ppb (Loulergue et al., 2008). Combining these uncertainties suggests that when comparing absolute values of methane (discrete data) with reference datasets we should allow an uncertainty of 16 ppb (much higher offsets are possible for the data derived by CFA, and there we mainly look for similar patterns to those in the reference data). The discrete data measured in Bern are displayed along with the continuous data in Figs. 3 and S1. A number of discrete measurements were also made between 84 and 144 m at Oregon State University which are described in the companion paper (Hoffmann et al., 2022).
3.3 δ18O of O2 (δ18Oatm)
The isotopic ratio of oxygen in air provides a good additional constraint because it is well mixed globally and varies in line with precession, providing opportunities for aligning measurements with calculated orbital targets as well as with measurements from other ice cores (Extier et al., 2018). CH4 and δ18Oatm have previously been used powerfully in tandem to untangle disturbed ice chronologies in the LIG (Chappellaz et al., 1997; Yau et al., 2016).
In this work, 27 samples were analysed for δ18Oatm at the Laboratoire des Sciences du Climat et de l'Environnement (LSCE). Two samples were in the depth range 160–170 m, and five samples were between 435 and 471 m. The remaining samples were in the depth range 602–635 m. Data were corrected for firn fractionation and gas loss (Extier et al., 2018) and are shown in Table S1; data below 600 m are shown on a depth scale in Fig. S1. Uncertainty on each value is estimated at ±0.03 ‰. Combining this with the similar uncertainty in data points in the reference dataset suggests that we should allow an uncertainty of 0.04 ‰ when comparing our data with the reference.
3.4 10Be across the Laschamps event
The flux/concentration of 10Be in ice shows a pattern related to variations in the magnetic field of the Sun and, on longer timescales, Earth. The pattern of these variations can be matched between ice cores, and with 14C variations in other archives such as tree rings, in order to synchronise records (e.g. Adolphi and Muscheler, 2016). A particularly clear and prominent pattern is seen across the Laschamps event, a weakening of Earth's magnetic field that occurred around 41 ka (e.g. Raisbeck et al., 2017). Because this section of ice is in the last glacial period, its synchronisation in the ice phase should allow for a particularly useful and unambiguous estimate of the offset between ice age and gas age (Δage) in the glacial period.
Seventy samples from between 509 and 520 m depth were spiked with a known amount of 9Be, processed in Lund and analysed for 10Be by accelerator mass spectrometry at ETH Zurich. Measured 10Be 9Be ratios were normalised to the ETH Zurich in-house standards S2007N and S2010N with nominal 10Be 9Be ratios of 28.1 × 10⁻¹² and 3.3 × 10⁻¹² (Christl et al., 2013). Data and associated uncertainties are presented in Supplement Table S2.
3.5 Aluminium (Al) and non-sea-salt magnesium (nssMg)
When synchronising ice cores from different sites, it is important to use only parameters for which there is a sound reason to assume that both cores share synchronous variability. This is the case, for example, with volcanic eruption spikes, with 10Be, and with well-mixed atmospheric gases, such as methane. It is not safe to make such an assumption for water isotopes, which are site-dependent because climatic changes may vary asynchronously in different parts of Antarctica. While methane synchronisation (see above) and a relatively small Δage compared to inland sites (due to the higher accumulation rate) allows us to make a reasonable estimate of the ice age along our core, it would be advantageous to have further ties in the ice phase. It has been argued previously that variations in the components of terrestrial dust (such as Ca) can be assumed to be synchronous across Antarctica (Baggenstos et al., 2018; Mulvaney et al., 2000). This is because their concentrations are strongly controlled by events at a common source in South America and in a common part of the transport pathway towards Antarctica, with only a minor part of the variability likely to be dependent on the final stages of transport to each ice core site.
The main component used for such synchronisation to date has been non-sea-salt calcium (nssCa), calculated using marine and terrestrial ratios of Ca and Na, e.g. Röthlisberger et al., 2002). However, after an initial attempt, we observed that while nssCa at Skytrain Ice Rise shows a good coherence with that of other sites (EDC, EDML) until a depth of about 500 m (30 ka), it diverges below that. Other terrestrial markers such as Al and nssMg (calculated as Mg − 0.12 ⋅ Na and both measured by ICP-MS during the CFA campaign, Grieman et al., 2021) do not mirror the Skytrain nssCa signal and do appear to follow nssCa at other East Antarctic sites (see Sect. 5.3). It appears that an additional source of Ca-rich material, not seen in other Antarctic cores and presumably due to local sources, is present at this site in the earlier part of the last glacial. The reasons for this will be explored elsewhere. However, the solution for us is to use the terrestrial markers that appear free from this extra source but that are coherent with nssCa records at other sites. The limits of detection of Al and Mg are 3.3 and 1.3 ppb, respectively. We concentrate on alignments from nssMg because a majority of Al values in the Holocene and Marine Isotope Stage 5 fall below the detection limit; in the glacial the Al values support our conclusions with nssMg.
Since the basis for our age model is tying variations in our data to variations in well-dated ice cores, in this section we describe the reference datasets used.
4.1 Gas phase: methane and δ18O of O2 (δ18Oatm)
In order to use the more detailed variability that can be traced during the Holocene, we compared our methane data to the high-resolution Roosevelt Island methane record between 2–7 ka. Between 7–68 ka we used the WAIS Divide record (Buizert et al., 2015; Rhodes et al., 2017). Between 68 and 156 ka, we used the Southern Hemisphere methane spline generated from the EDC ice core (Köhler et al., 2017). To investigate possible matches with older ice we used the EDC data themselves (Loulergue et al., 2008). As previously explained, the Roosevelt and WAIS Divide data are on the WD2014 age scale, but we eventually used a conversion table (based on Buizert et al., 2018) to place all matches onto a common AICC2012 age scale.
A composite EDC-Vostok record of δ18Oatm (Extier et al., 2018) was used for comparison to Skytrain ice core δ18Oatm.
4.2 Ice phase: 10Be across the Laschamps event and terrestrial marker elements
The clear pattern of the 10Be record across the Laschamps event has been shown to be closely replicated at several sites in Greenland and Antarctica (Raisbeck et al., 2017). For the synchronisation, we used the normalised stack that was recently created based on three Greenland and three Antarctic records (Adolphi et al., 2018).
As the reference dataset for terrestrial deposition we used the nssCa record from EDML (Fischer et al., 2007), because of its greater proximity to Skytrain in the Atlantic sector of Antarctica, with further validation using the record from EDC (Wolff et al., 2010).
5.1 Methane
First, we note that the discrete methane data (Fig. 3) confirm that the methane concentrations in the section from 534–545 m are much too high. In this section of ice we therefore use the values from the discrete data to match with reference data.
In Table S3, we list the methane tie points that we used in this section. The very clear match between our record and the reference data is ideally seen in the past 15 kyr (460 m), where there are few spikes in the methane record due to air ingress into cracks (Fig. 4). However, the pattern of Dansgaard–Oeschger events remains clear right down to 100 ka and is shown in Fig. 5, along with the tie points used. We note that the comparisons in Fig. 4 suggest that the Skytrain data might be up to 10 % too low in concentration (but with a variable offset along the core) compared to the reference data; this results from the dissolution of gas in the melt stream (as discussed in Sect. 3.1) and the difficulty of accurately calibrating data from the continuous melter due to the absence of an external certified standard. In Fig. 5 we show the full methane record on the eventual age scale, compared to reference data. It is clear that some spikes due to air ingress across cracks remain in the dataset beyond about 60 ka, but the pattern for matching is still apparent to at least 100 ka. The match between Skytrain and reference methane between 80 and 100 ka is less secure than it is in shallower ice, because ice with high concentration outliers and/or missing data is common as a result of extensive cracking. This makes it hard to match absolute values of methane and forces us to rely on the pattern with depth. Nonetheless, the methane ties we have made result in a good match in this part of the core between nssMg and reference nssCa (Fig. 7 and Sect. 5.3), supporting our choices. The section beyond 100 ka will be discussed in Sect. 6.
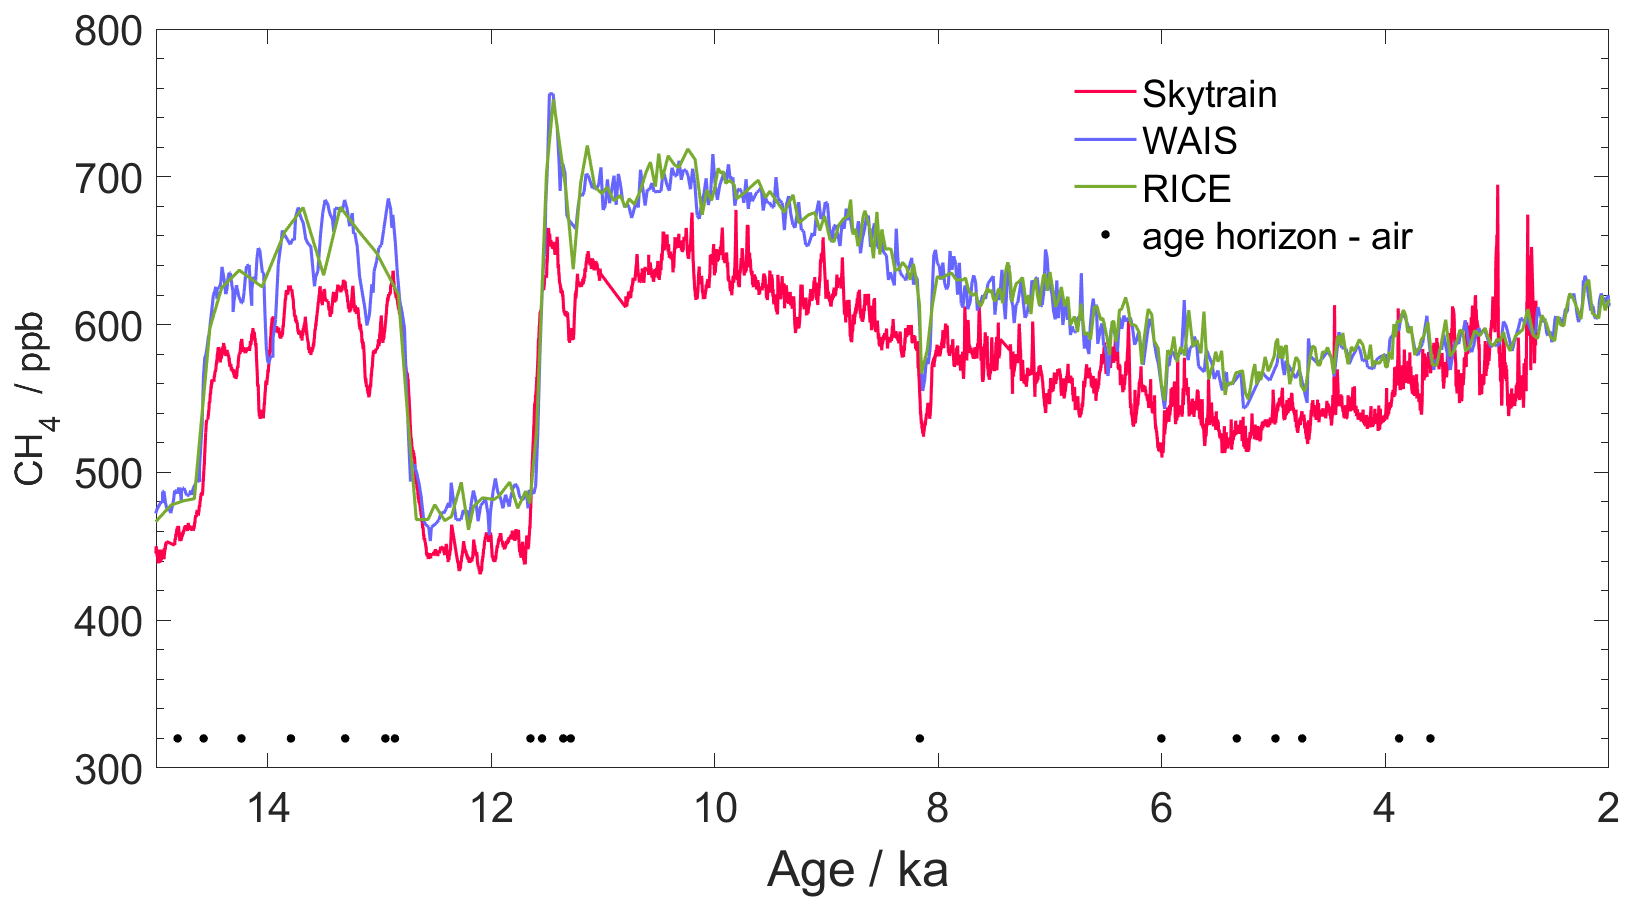
Figure 4Methane matching over the last 15 kyr. Methane from Skytrain Ice Rise (red) on its age scale after synchronisation, along with methane from Roosevelt Island (green) (Lee et al., 2020), and WAIS Divide (blue) (Buizert et al., 2015; Mitchell et al., 2013). Ages shown here are WD2014. The concentration offset between the Skytrain and other data is probably caused by partial dissolution in the melt stream for Skytrain as discussed in the text. Tie points used to construct the age scale are shown as black dots.
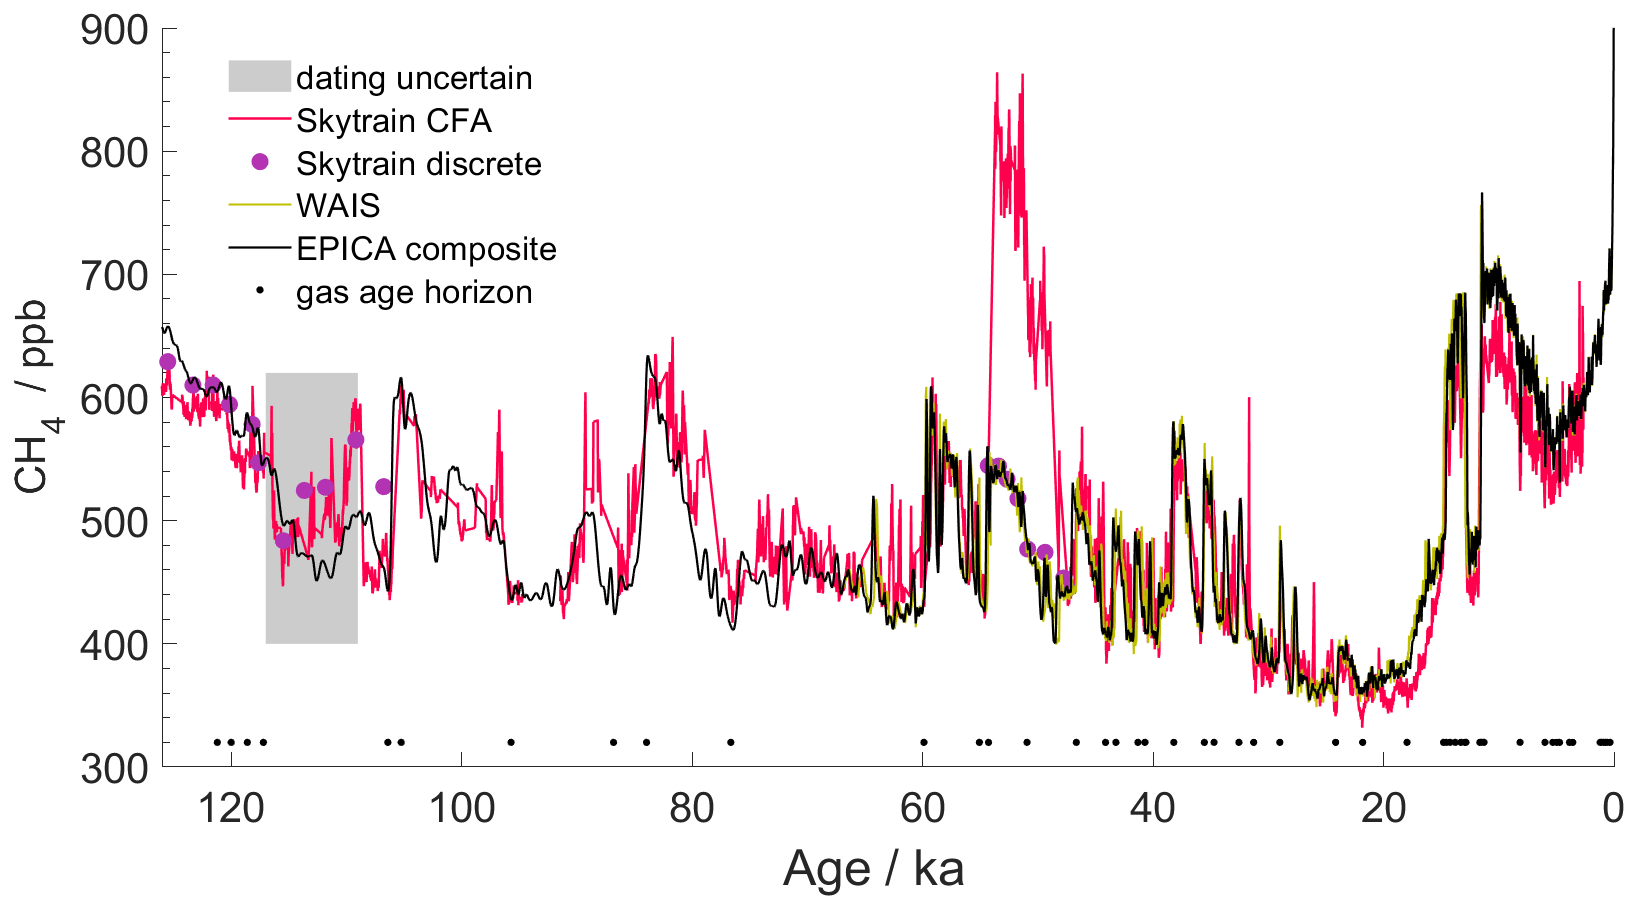
Figure 5Methane from Skytrain Ice Rise on the ST22 age scale, along with reference data. Skytrain is shown by the red line (continuous) and purple dots (discrete data). In black is a spline of Antarctic data (Köhler et al., 2017). WAIS Divide is shown in yellow (Buizert et al., 2015; Mitchell et al., 2013). Ages shown here are AICC2012. Gas age tie points are shown along the bottom of the figure. The grey shaded area represents the ice (605–617 m) with unreliable ages due to flow disturbance (see Sect. 8).
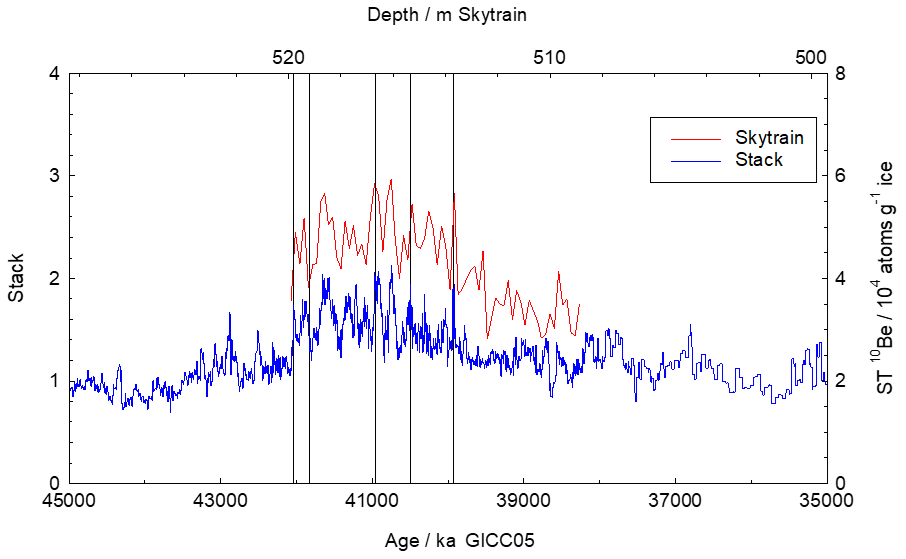
Figure 610Be concentration in the Skytrain (ST) ice core (red) compared to the normalised stack of ice core radionuclide data (Adolphi et al., 2018). Two samples with obvious low outlier concentrations in the ST record have not been plotted. Vertical lines show the tie points used in this study.
5.2 10Be across the Laschamps event
In Fig. 6 we show the Skytrain 10Be concentration from 509–520 m, aligned with the reference dataset. The common shape across the wider event as well as the presence of individual peaks and troughs is clear. We chose five tie points in the range 39.9–42.0 ka (Table S4).
5.3 nssMg compared to Ca at EDML
Skytrain nssMg was compared to nssCa from EDML (Fischer et al., 2007) (Fig. 7). The two records show strong similarities, as does Skytrain Al (not shown) where it exceeds the detection limit; comparison with EDC nssCa (Wolff et al., 2010) shows a comparably good match. We chose a few obvious tie points (Table S4) concentrating on regions with clear variability and trying to fill the gaps where fewer ice tie points existed. We discuss the ice below 100 ka in Sect. 6.

Figure 7nssMg at Skytrain shown on its age scale after synchronisation (purple). nssCa from EDML (cyan) (Fischer et al., 2007). Tie points used in this paper are shown (circles are gas age, triangles are ice age ties). The grey shaded area represents the ice (605–617 m) with unreliable ages due to flow disturbance (see Sect. 8).
Below about 600 m (100 ka), methane continues to show a pattern similar to that of the reference record, with a peak between 600–603 m (Fig. 3) that seems to correspond to the methane peak associated with Greenland interstadial (GI) 24 at 102–107 ka (Baumgartner et al., 2014; Capron et al., 2010). However, below this, between 605–608 m, there is a further methane peak that appears anomalous: its concentrations are too high to match the reference data at GI 25. Whereas methane peaks typically have a sharp jump in concentration at their old (deeper) side, this peak has a sharp drop at its shallower side. From 616 to 622 m, methane rises in a stepped fashion similar to the increase seen in the reference record on the young side of the LIG between 114 and 123 ka, before plateauing (∼ 625–629 m) at concentrations typical of the last interglacial (as confirmed by the discrete measurements made in Bern, with several concentrations between 630 and 644 ppb). However, there are no values (in either the continuous or discrete data) that reach those (going above 700 ppb) that are seen in the reference data in the early last interglacial peak between 127 and 129 ka. Additionally, methane experiences a rapid alternation of values (two values > 600 ppb surrounding a value of 400 ppb within a metre) at 631 m (the base of the values that appear to be interglacial). This coincides (in depth) with a rapid alternation in water isotope ratios (not shown here). Finally there are also very few values below 400 ppb that would correspond to the low values seen in the reference data during the penultimate glacial maximum between about 140–145 ka.
These observations suggest that the ice is in good chronological order to 107 ka and probably from about 117–126 ka but that there might be a flow disturbance between 107 and 117 ka and a definite disturbance and discontinuity at the base of the last interglacial ice with some thousands of years potentially missing from our record. Later we speculate on the reasons for this. For now it causes us to be concerned about the integrity of the record above this depth (i.e. the LIG to 126 ka). It suggests that the use of simple pattern matching of methane and nssMg in the LIG ice might risk a false assignment, and so instead we seek a more definite quantitative match.
6.1 CH4 and δ18Oatm
Flow disturbances affecting LIG ice have been seen previously, though until now this has been observed mainly in Greenland. To confirm the age of ice with difficult stratigraphy, and even to re-order disordered layers, previous authors have used a combination of methane and δ18Oatm (Chappellaz et al., 1997; NEEM Community Members, 2013; Yau et al., 2016). Provided data are sufficiently precise, the two-dimensional field of these parameters can define an age for a given layer that is close to unique within the plausible range. In Fig. 8a we show the reference data for CH4 and δ18Oatm.
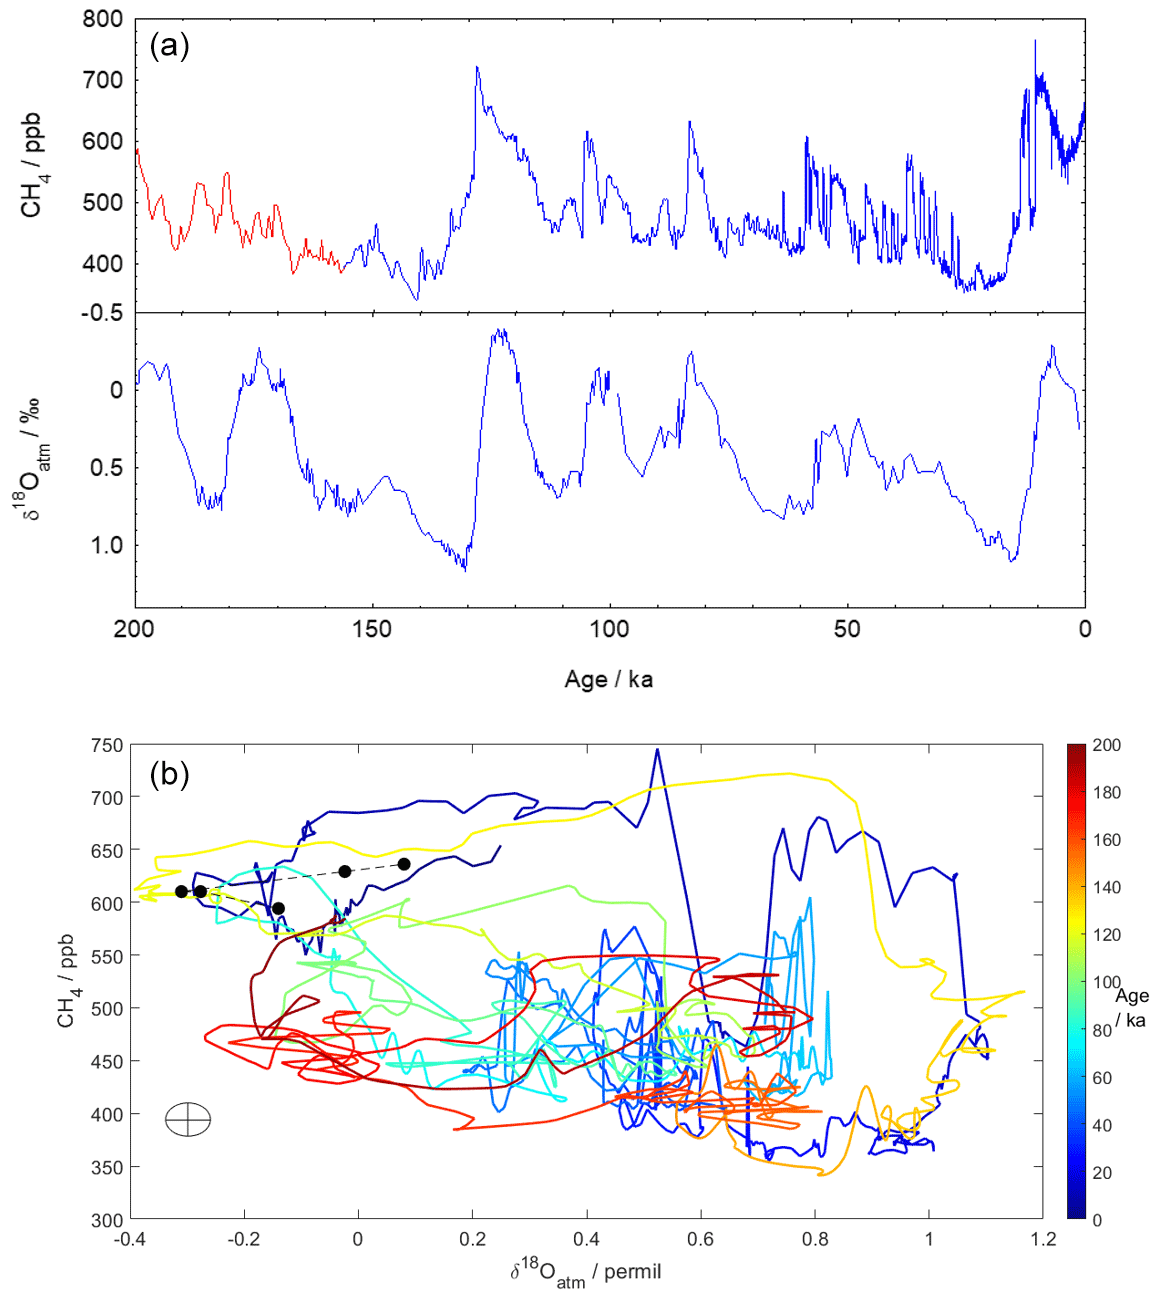
Figure 8Reference data for CH4 and δ18Oatm (Extier et al., 2018) over the last 200 kyr. Data are all on the AICC2012 age model. (a) The two datasets as time series. CH4 to 156 ka in blue (Köhler et al., 2017) and beyond 156 ka in red (Loulergue et al., 2008). (b) Cross plot of CH4 and δ18Oatm reference data for the period 0–200 ka. The colour bar indicates the age of the sample. The combined uncertainty is shown by the grey ellipse/cross. An alternative visualisation of panel (b) is provided in Fig. S5. The black dots are data from Skytrain Ice Rise from 621.5 to 627.3 m (following the dashed line clockwise).
By plotting the two-dimensional distribution of values (Fig. 8b) one can see how the data clearly differentiate samples of different ages – this is particularly true in the section from about 120–140 ka (section that goes clockwise in increasing age coloured yellow). While the δ18Oatm data were used mainly in combination with CH4 to assess the ages of ice around the LIG, δ18Oatm was also measured in two Skytrain ice core samples from the Holocene and two from the Last Glacial Maximum: these were not used to construct the age scale, but the values were entirely consistent with the modelled ages. Three samples were also measured between 435 and 456 m. These three values of δ18Oatm, along with the less precise CH4 data obtained from the continuous measurements, were used to assign ages (Table S1) more precisely between 11 and 15 ka in a section in which δ18Oatm is increasing rapidly with age (Fig. 8).
Twenty Skytrain ice core samples were analysed for δ18Oatm between 600 and 635 m depth, covering the period that the discussion above would lead us to expect is older than 100 ka. In all but two cases discrete methane measurements were made (in Bern) on an adjacent sample (a few centimetres away from the δ18Oatm sample).
We now examine the data at depths for which we have both δ18Oatm and methane measurements. We start with the data from 603–618 m (Fig. 9a). The data point at 603.1 m can be assigned an age of ∼ 106 ka, as we had already deduced above from the shape and amplitude of the methane peak alone. While the point at 606.4 m matches best with ∼ 118 ka, the three data points deeper than that (609–618 m) are only compatible with younger ages, between 106 and 117 ka. We cannot untangle this section, but there is apparently some degree of disturbance at least between 605 and 615 m.
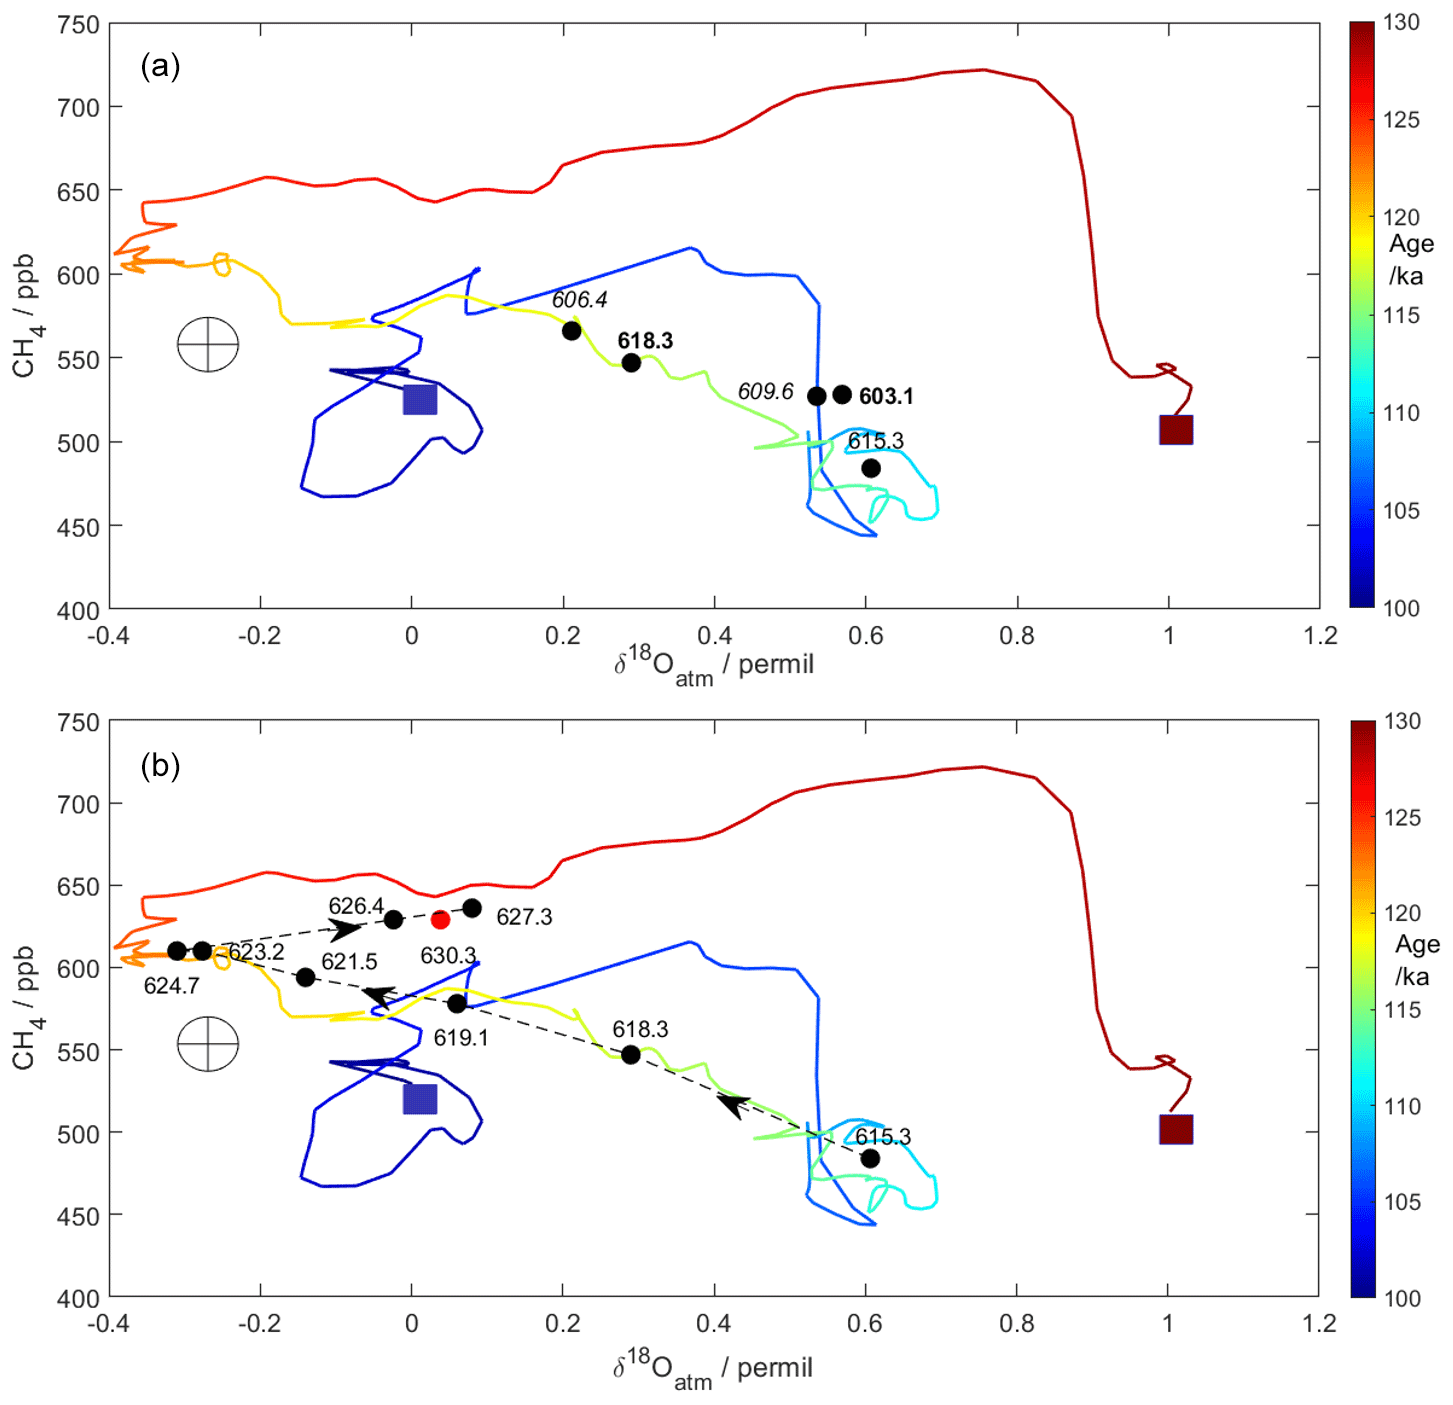
Figure 9Cross plots of CH4 (Köhler et al., 2017) and δ18Oatm (Extier et al., 2018) reference data for the period 100–130 ka, along with Skytrain Ice Rise data from (a) 603–618 m depth and (b) 615–628 m (black dots) and 630.3 m (red dot). The combined uncertainty (used to decide whether a match between the Skytrain and reference data is acceptable) is shown by the grey ellipse/cross. The start (130 ka) and end (100 ka) of the reference curve are marked by red and blue squares. Skytrain data points are marked with depths; in panel (a) the ones we later judge as being in disturbed ice are marked with italics, while the ones we consider well dated are in bold. In panel (b), the black dots are joined by a dashed line, with arrows pointing in order of increasing depth. An alternative visualisation of this figure is provided in Fig. S6.
We have no reason to doubt that the ice is in good order until 605 m, but we acknowledge that the section we date as 95–107 ka (Figs. 5, 7) relies on the pattern of methane and on a single CHOatm data point. This point, dated at 106 ka, firmly defines the lower end of this section, with values that do not occur again as a pair until 57 ka.
Turning now to Fig. 9b, the data from 615.3 to 627.3 m plot in chronological sequence with respect to the reference data between about 110–126 ka. Most of these points are not consistent with δ18Oatm and methane values at any other ages in the range 60–180 ka. Crucially the two data points at 623.2 and 624.7 m with very negative δ18Oatm and CH4 > 600 ppb are not compatible with any other age in the past 200 kyr other than the LIG at around 122 ka and a short period in the Holocene at 7 ka. These data points are also incompatible with any mixtures of ice from other depths. Because the data point at 615.3 m is compatible with a range of ages, we choose a conservative range of depths from 617 m (just above the clear match at 618.3 m) to 628 m where we are very confident that we have a sequence of ice from the last interglacial, covering the period 126 to 117 ka. Although it lies within the uncertainty of the values at 627.3 m, the data point at 630.3 m (shown in red) is also only consistent with the last interglacial but does not show the expected increase in age with depth and could show a reversal in age. As this is already in the section that appears disturbed in methane and δ18Oice, we consider this data point and the ice around it as subject to disturbance.
Finally, we examine the data from 630 to 635 m (Fig. 10). The point at 631.6, sitting close to clearly disturbed ice with rapidly changing values of CH4 and δ18Oice, has values not seen in the reference data and is probably a mixture of interglacial and glacial ice. The other data have values consistent with ages that would occur in the middle of MIS6 (140–180 ka) or alternatively could originate from ice that is much older (from an earlier glacial cycle). Because there are a number of age solutions within the uncertainty of the measurements, we do not attempt to assign ages to these data points.
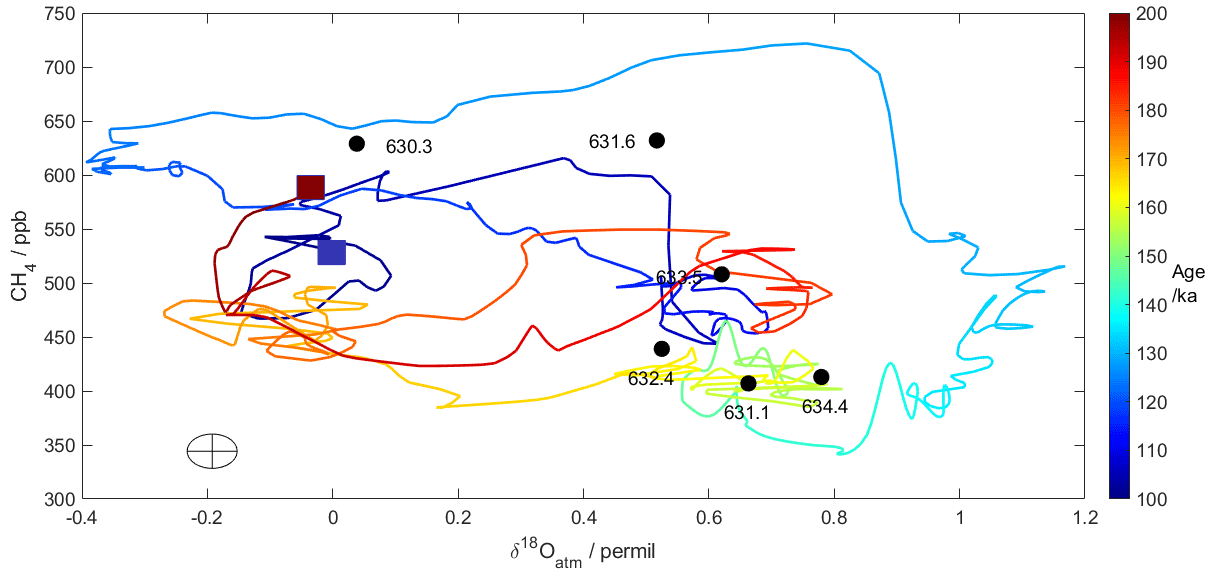
Figure 10Cross plot of CH4 (Köhler et al., 2017; Loulergue et al., 2008) and δ18Oatm (Extier et al., 2018) reference data for the period 100–200 ka. The colour bar indicates the age of the sample. Also shown are the Skytrain data from 630 m downwards (black dots). The combined uncertainty (used to decide whether a match between the Skytrain and reference data is acceptable) is shown by the grey ellipse/cross. The start (200 ka) and end (100 ka) of the reference curve are marked by red and blue squares. An alternative visualisation of this figure is provided in Fig. S7.
6.2 Stratigraphy around the LIG
Combining the observation that no ice has methane values that fit in the age ranges 127–129 or ∼ 140 ka and the positive identification of ice with unique combinations of CH4 and δ18Oatm, we conclude the following:
- a.
there is probably a flow disturbance at the top of the last interglacial section, with ice from ∼ 106–117 ka repeated;
- b.
despite this, there is a continuous section of ice from 617–628 m that represents the time period from 117–126 ka in good order;
- c.
there is strongly disturbed ice at the base of the LIG section, with the ice below it most likely representing much older ice from MIS6 or beyond.
The Paleochrono model was run using the prior constraints discussed in Sect. 2 and the tie points described in Sect. 5 (and shown in Tables S3 and S4). For the section deeper than 600 m we have assigned tie points based on CH4 and δ18Oatm that anchor 603 m at 106 ka, as well as ties for each CHOatm pair between 617 and 627.3 m (117–126 ka). We then assigned a much older age to 632 m just to allow continuity of the age scale to the bed. No other tie points were applied below 628 m (126 ka), and the ice ages below that were ignored. Between the tie points at 603 and 618 m, Paleochrono assigns ages, but because we know that there is disturbance and likely repeated ice, we cannot trust all of them. As a compromise, in our age scale we report the ages as far as 605 m (108.7 ka) and from 617 m (∼ 117 ka) but do not show any ages for 605–617 m. The age model is reported with both ice age and gas age, along with uncertainties derived from the model. Figure 11 shows the depth–age relationship (continuous line) from the model. A depth–age lookup table is supplied in the Supplement. Methane and nssMg data are shown on the derived age model to 126 ka in Figs. 5 and 7. We have placed a grey bar on data in the disturbed section (605–617 m) where ages cannot be considered reliable.
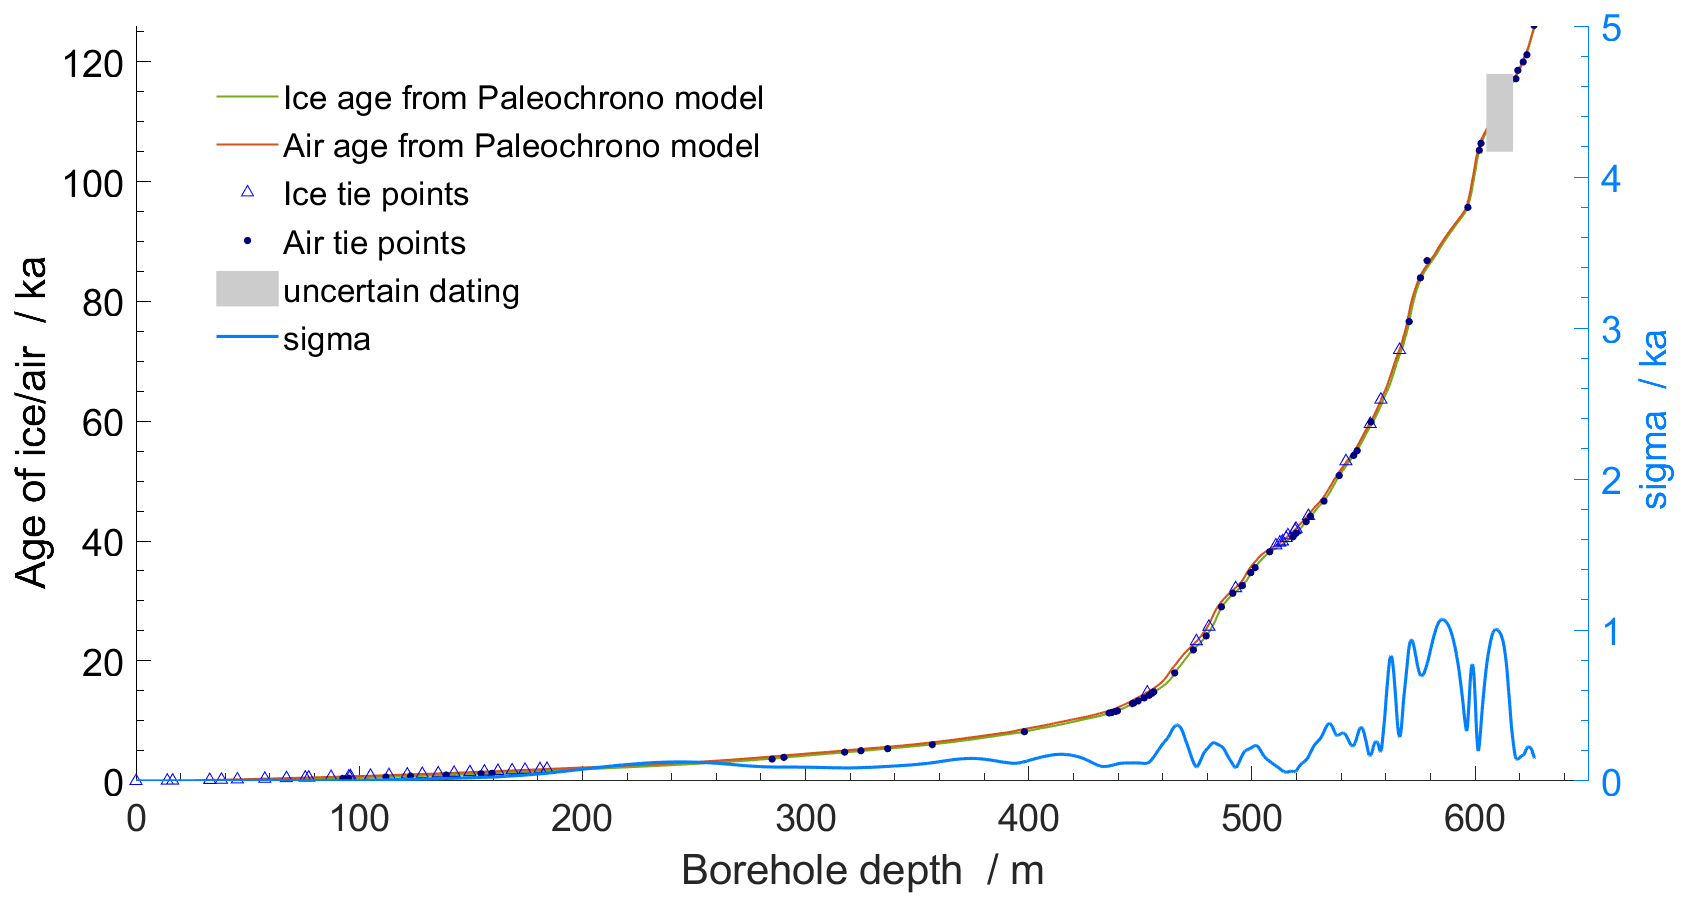
Figure 11Age against depth for the Skytrain Ice Rise ice core. In the top panel, ice and air age are shown, along with the tie points we applied. The turquoise line shows the uncertainty on the ice age derived from Paleochrono, using the right hand y axis. The section with unreliable ages (605–617 m) is greyed out, and the uncertainties around this section are probably underestimated.
In the Supplement we present the deposition rate (Fig. S2), thinning function (Fig. S3), and annual layer thickness (Fig. S4) derived from the model. No dramatic deviations are seen, indicating that the derived age model is physically reasonable. However, given the flow disturbances beyond 605 m the derived values may be unreliable from 605 m to the bed.
To further assess the age assignments around the LIG, in Fig. 12 we show the values of discrete measurements of CH4 and δ18Oatm with the ages from Paleochrono for the sections of ice we consider less disturbed. It can be seen that the values and sequence for both parameters are consistent and generally match the reference data within uncertainty between 117 and 126 ka. Although Paleochrono separated them in order to maintain continuity, the data points (at 626.4 and 627.3 m), showing as slightly displaced from the reference curves at 125 and 127 ka in Fig. 12, were originally both assigned tie point ages of ∼ 126 ka, which would also place them on the reference curves.
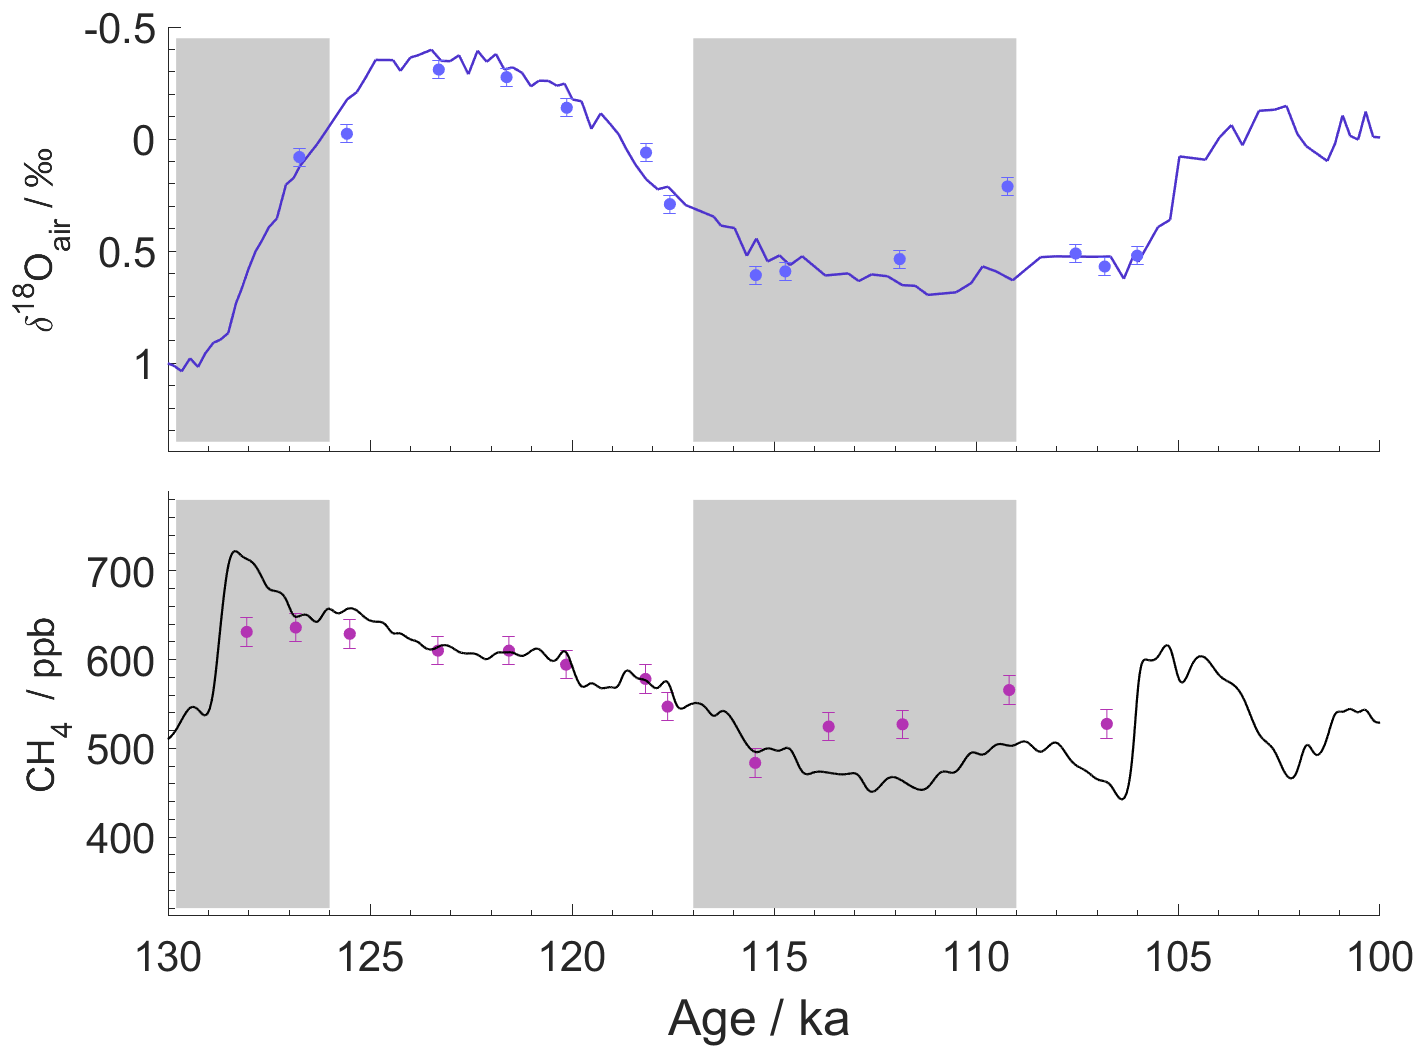
Figure 12Reference data for CH4 and δ18Oatm between 100 and 130 ka (as in Fig. 8a), along with discrete measurements (symbols) for the Skytrain Ice Rise ice core. Sections with unreliable ages (605–617 and > 627 m) are greyed out. The error bars are the combined uncertainty (at 1σ) of the Skytrain and reference data.
It is evident that there is ice disturbance at the top and particularly at the base of the LIG. Such disturbances have been observed in previous LIG ice, though until now they have only been documented in Greenland ice (Grootes et al., 1993; NEEM Community Members, 2013). Such discontinuities have been hypothesised to result from the contrast between ice layers with very different rheological properties, due to changes in impurity content and grain size (LIG versus penultimate glacial maximum (PGM) and LIG versus late MIS 5) (NEEM Community Members, 2013). We expect smaller contrasts in properties in Antarctica compared to Greenland.
We do not have enough evidence to conclude whether the disturbance we see is indeed due to rheological contrasts or is just a consequence of investigating ice that is close to the bed. A tendency to become disturbed and folded might be exacerbated at Skytrain Ice Rise by the existence of a rather large Raymond arch (Mulvaney et al., 2021), a dynamic feature seen in the radar profiles, extending right to the bed (the internal layering (Mulvaney et al., 2021) shows upwarping of order 50 m within around 1 km horizontal distance only 100 m above the bed). Although we expect Skytrain Ice Rise to have remained a separate flow centre, it is likely that the position of the dome was different during the Last Glacial Maximum (LGM) when the Ronne Ice Shelf would have been grounded and provided greater restraint to the north and east; this could also have led to disturbance around the LIG ice, which would already have been deep in the ice column at that time.
We consider here possible alternative causes for the hiatus, with ice from 127–129 ka missing from our sequence and probably ice from 129 to at least 140 ka also unrepresented.
- a.
The first possibility is that there was no snow accumulation during this period. This is considered extremely unlikely. The section from 127–129 ka at other Antarctic sites shows high temperatures and inferred high accumulation rates.
- b.
A second possibility is that the ice from inland overrode Skytrain Ice Rise, causing some layers to be removed completely. However, the Ellsworth Mountains provide a high and rather solid barrier against such flow. There is also no sign of ice anywhere in the core with the much more negative water isotopic contents one would expect from ice originating at much higher altitude inland.
- c.
Some ice sheet models have inferred a possible loss of ice from parts of WAIS during the LIG (DeConto and Pollard, 2016). This hypothesis raises the possibility that ice was completely lost from Skytrain Ice Rise in the warmest part of the LIG. However, the existence of more than 20 m of ice that appears to derive from MIS6 or older suggests that ice was not completely removed from Skytrain Ice Rise. In addition if some ice was lost by melting, while older ice was retained, we would expect to see bubble-free ice (caused by refreezing after melting). This is not observed anywhere in the core: normal values of total air content and methane concentrations are seen at all depths.
We therefore conclude that the most plausible explanation for our observations is flow disturbance due to contrasting rheology. However, detailed ice sheet modelling, as well as rheological studies on the Skytrain ice core, is required to firmly rule out other causes.
We have constructed an age model, which we call ST22, for the Skytrain Ice Rise ice core. This age model is based mainly on tie points to previous Antarctic ice cores, using a range of analyses. The age–depth relationship is well behaved until at least 100 ka. There appears to be flow disturbance at the top of the LIG section, but the core contains ice from the last interglacial (117 to 126 ka) in good stratigraphic order. It is, however, missing the earliest part of the LIG and the coldest part of the PGM, apparently also due to flow disturbance affecting ice layers with contrasting rheologies.
Because the missing ice appears to have been affected by flow disturbances, we surmise that another core at a suitably chosen location on Skytrain Ice Rise might be capable of retrieving ice from the missing sections. This is the first time that flow disturbances around the LIG have been clearly documented for Antarctica, as they have been several times for Greenland. These disturbances raise the possibility that such disturbances might also have affected other records of the LIG (Korotkikh et al., 2011). One obvious conclusion from our data is that the ice sheet was certainly present at Skytrain Ice Rise during the LIG.
The continuous methane and nssMg used in this paper (and shown in Figs. 5 and 7) are available at Pangaea (https://doi.org/10.1594/PANGAEA.956062, Wolff et al., 2023a). The discrete CH4, δ18Oatm, and 10Be data used in this paper are included in the Supplement (Tables S1 and S2). The air and ice tie points used in Paleochrono are included in the Supplement (Tables S3 and S4). All reference data used in this paper are already published and available online. The final derived age model ST22 is included in the Supplement as Table S5 and is available at Pangaea (https://doi.org/10.1594/PANGAEA.956061, Wolff et al., 2023b).
The supplement related to this article is available online at: https://doi.org/10.5194/cp-19-851-2023-supplement.
The first two authors contributed equally to this paper. The paper was written by RoM and EWW with contributions mainly from HHH, MMG, and RHR. The ice core was drilled and sectioned by EWW, RoM, CNA, MMG, and IR. The CFA analysis was performed by HHH, MMG, JDH, RoM, RHR, and IFR. Discrete methane analyses were provided by LS, HF, and TFS; δ18Oatm data were provided by FP and AL; and 10Be data were provided by MC and RaM. RoM ran Paleochrono with advice from FP. All authors contributed to improving the final paper.
At least one of the (co-)authors is a member of the editorial board of Climate of the Past. The peer-review process was guided by an independent editor, and the authors also have no other competing interests to declare.
This material reflects only the authors'
views and the European Commission is not liable for any use that may be made of the
information contained therein.
Publisher's note: Copernicus Publications remains neutral with regard to jurisdictional claims in published maps and institutional affiliations.
This article is part of the special issue “Ice core science at the three poles (CP/TC inter-journal SI)”. It is a result of the IPICS 3rd Open Science Conference, Crans-Montana, Switzerland, 2–7 October 2022.
The authors thank Shaun Miller, Charlie Durman, Amy King, Emily Ludlow, Liz Thomas, and Victoria Alcock for help with cutting, processing, and analysing the ice core, as well as Jonny Kingslake for providing the radar data used in site selection. This project has received funding from the European Research Council under the Horizon 2020 research and innovation programme (grant agreement no. 742224, WACSWAIN).
This research has been supported by the European Research Council, H2020 (WACSWAIN, grant no. 742224); the Schweizerischer Nationalfonds zur Förderung der Wissenschaftlichen Forschung (grant nos. 172745 and 2000492); the Royal Society (grant no. RP/R/180003); and the Centre National de la Recherche Scientifique (IceChrono and CO2Role).
This paper was edited by Alexey Ekaykin and reviewed by two anonymous referees.
Adolphi, F. and Muscheler, R.: Synchronizing the Greenland ice core and radiocarbon timescales over the Holocene – Bayesian wiggle-matching of cosmogenic radionuclide records, Clim. Past, 12, 15–30, https://doi.org/10.5194/cp-12-15-2016, 2016.
Adolphi, F., Bronk Ramsey, C., Erhardt, T., Edwards, R. L., Cheng, H., Turney, C. S. M., Cooper, A., Svensson, A., Rasmussen, S. O., Fischer, H., and Muscheler, R.: Connecting the Greenland ice-core and U Th timescales via cosmogenic radionuclides: testing the synchroneity of Dansgaard–Oeschger events, Clim. Past, 14, 1755–1781, https://doi.org/10.5194/cp-14-1755-2018, 2018.
Ahn, J. and Brook, E. J.: Atmospheric CO2 and climate on millennial time scales during the last glacial period, Science, 322, 83–85, https://doi.org/10.1126/science.1160832, 2008.
Baggenstos, D., Severinghaus, J. P., Mulvaney, R., McConnell, J. R., Sigl, M., Maselli, O., Petit, J. R., Grente, B., and Steig, E. J.: A Horizontal Ice Core From Taylor Glacier, Its Implications for Antarctic Climate History, and an Improved Taylor Dome Ice Core Time Scale, Paleoceanography and Paleoclimatology, 33, 778–794, https://doi.org/10.1029/2017pa003297, 2018.
Baumgartner, M., Kindler, P., Eicher, O., Floch, G., Schilt, A., Schwander, J., Spahni, R., Capron, E., Chappellaz, J., Leuenberger, M., Fischer, H., and Stocker, T. F.: NGRIP CH4 concentration from 120 to 10 kyr before present and its relation to a δ15N temperature reconstruction from the same ice core, Clim. Past, 10, 903–920, https://doi.org/10.5194/cp-10-903-2014, 2014.
Bazin, L., Landais, A., Lemieux-Dudon, B., Toyé Mahamadou Kele, H., Veres, D., Parrenin, F., Martinerie, P., Ritz, C., Capron, E., Lipenkov, V., Loutre, M.-F., Raynaud, D., Vinther, B., Svensson, A., Rasmussen, S. O., Severi, M., Blunier, T., Leuenberger, M., Fischer, H., Masson-Delmotte, V., Chappellaz, J., and Wolff, E.: An optimized multi-proxy, multi-site Antarctic ice and gas orbital chronology (AICC2012): 120–800 ka, Clim. Past, 9, 1715–1731, https://doi.org/10.5194/cp-9-1715-2013, 2013.
Brook, E. J., White, J. W. C., Schilla, A. S. M., Bender, M. L., Barnett, B., Severinghaus, J. P., Taylor, K. C., Alley, R. B., and Steig, E. J.: Timing of millennial-scale climate change at Siple Dome, West Antarctica, during the last glacial period, Quaternary Sci. Rev., 24, 1333–1343, 2005.
Buizert, C., Cuffey, K. M., Severinghaus, J. P., Baggenstos, D., Fudge, T. J., Steig, E. J., Markle, B. R., Winstrup, M., Rhodes, R. H., Brook, E. J., Sowers, T. A., Clow, G. D., Cheng, H., Edwards, R. L., Sigl, M., McConnell, J. R., and Taylor, K. C.: The WAIS Divide deep ice core WD2014 chronology – Part 1: Methane synchronization (68–31 ka BP) and the gas age–ice age difference, Clim. Past, 11, 153–173, https://doi.org/10.5194/cp-11-153-2015, 2015.
Buizert, C., Sigl, M., Severi, M., Markle, B. R., Wettstein, J. J., McConnell, J. R., Pedro, J. B., Sodemann, H., Goto-Azuma, K., Kawamura, K., Fujita, S., Motoyama, H., Hirabayashi, M., Uemura, R., Stenni, B., Parrenin, F., He, F., Fudge, T. J., and Steig, E. J.: Abrupt ice-age shifts in southern westerly winds and Antarctic climate forced from the north, Nature, 563, 681–685, https://doi.org/10.1038/s41586-018-0727-5, 2018.
Capron, E., Landais, A., Lemieux-Dudon, B., Schilt, A., Masson-Delmotte, V., Buiron, D., Chappellaz, J., Dahl-Jensen, D., Johnsen, S., Leuenberger, M., Loulergue, L., and Oerter, H.: Synchronising EDML and NorthGRIP ice cores using δ18O of atmospheric oxygen (δ18Oatm) and CH4 measurements over MIS 5 (80–123 ka), Quaternary Sci. Rev., 29, 222–234, 2010.
Chappellaz, J., Brook, E., Blunier, T., and Malaizé, B.: CH4 and delta δ18O of O2 records from Antarctic and Greenland ice: A clue for stratigraphic disturbance in the bottom part of the Greenland Ice Core Project and the Greenland Ice Sheet Project 2 ice cores, J. Geophys. Res., 102, 26547–26557, 1997.
Christl, M., Vockenhuber, C., Kubik, P. W., Wacker, L., Lachner, J., Alfimov, V., and Synal, H. A.: The ETH Zurich AMS facilities: Performance parameters and reference materials, Nuclear Instruments and Methods in Physics Research Section B: Beam Interactions with Materials and Atoms, 294, 29–38, https://doi.org/10.1016/j.nimb.2012.03.004, 2013.
Crotti, I., Landais, A., Stenni, B., Bazin, L., Parrenin, F., Frezzotti, M., Ritterbusch, F., Lu, Z.-T., Jiang, W., Yang, G.-M., Fourré, E., Orsi, A., Jacob, R., Minster, B., Prié, F., Dreossi, G., and Barbante, C.: An extension of the TALDICE ice core age scale reaching back to MIS 10.1, Quaternary Sci. Rev., 266, 107078, https://doi.org/10.1016/j.quascirev.2021.107078, 2021.
DeConto, R. M. and Pollard, D.: Contribution of Antarctica to past and future sea-level rise, Nature, 531, 591–597, https://doi.org/10.1038/nature17145, 2016.
DeConto, R. M., Pollard, D., Alley, R. B., Velicogna, I., Gasson, E., Gomez, N., Sadai, S., Condron, A., Gilford, D. M., Ashe, E. L., Kopp, R. E., Li, D., and Dutton, A.: The Paris Climate Agreement and future sea-level rise from Antarctica, Nature, 593, 83–89, https://doi.org/10.1038/s41586-021-03427-0, 2021.
Dutton, A., Carlson, A. E., Long, A. J., Milne, G. A., Clark, P. U., DeConto, R., Horton, B. P., Rahmstorf, S., and Raymo, M. E.: Sea-level rise due to polar ice-sheet mass loss during past warm periods, Science, 349, 153, aaa4019, https://doi.org/10.1126/science.aaa4019, 2015.
Dyer, B., Austermann, J., D'Andrea, W. J., Creel, R. C., Sandstrom, M. R., Cashman, M., Rovere, A., and Raymo, M. E.: Sea-level trends across The Bahamas constrain peak last interglacial ice melt, P. Natl. Acad. Sci. USA, 118, e2026839118, https://doi.org/10.1073/pnas.2026839118, 2021.
EPICA Community Members: Eight glacial cycles from an Antarctic ice core, Nature, 429, 623–628, https://doi.org/10.1038/nature02599, 2004.
Epifanio, J. A., Brook, E. J., Buizert, C., Edwards, J. S., Sowers, T. A., Kahle, E. C., Severinghaus, J. P., Steig, E. J., Winski, D. A., Osterberg, E. C., Fudge, T. J., Aydin, M., Hood, E., Kalk, M., Kreutz, K. J., Ferris, D. G., and Kennedy, J. A.: The SP19 chronology for the South Pole Ice Core – Part 2: gas chronology, Δage, and smoothing of atmospheric records, Clim. Past, 16, 2431–2444, https://doi.org/10.5194/cp-16-2431-2020, 2020.
Extier, T., Landais, A., Bréant, C., Prié, F., Bazin, L., Dreyfus, G., Roche, D. M., and Leuenberger, M.: On the use of δ18Oatm for ice core dating, Quaternary Sci. Rev., 185, 244–257, https://doi.org/10.1016/j.quascirev.2018.02.008, 2018.
Fischer, H., Fundel, F., Ruth, U., Twarloh, B., Wegner, A., Udisti, R., Becagli, S., Castellano, E., Morganti, A., Severi, M., Wolff, E. W., Littot, G. C., Rothlisberger, R., Mulvaney, R., Hutterli, M. A., Kaufmann, P., Federer, U., Lambert, F., Bigler, M., Hansson, M., Jonsell, U., de Angelis, M., Gabrielli, P., Boutron, C., Siggaard-Andersen, M. L., Steffensen, J. P., Barbante, C., Gaspari, V., and Wagenbach, D.: Reconstruction of millennial changes in transport, dust emission and regional differences in sea ice coverage using the deep EPICA ice cores from the Atlantic and Indian Ocean sector of Antarctica., Earth Planet. Sci. Lett., 260, 340–354, 2007.
Fox-Kemper, B., Hewitt, H., Xiao, C., Aðalgeirsdóttir, G., Drijfhout, S. S., Edwards, T. L., Golledge, N. R., Hemer, M., Kopp, R. E., Krinner, G., Mix, A., Notz, D., Nowicki, S., Nurhati, I. S., Ruiz, L., Sallée, J.-B., Slangen, A. B. A., and Yu, Y.: Chapter 9: Ocean, Cryosphere and Sea Level Change, in: Climate Change 2021: The Physical Science Basis. Contribution of Working Group I to the Sixth Assessment Report of the Intergovernmental Panel on Climate Change, edited by: Masson-Delmotte, V., Zhai, P., Pirani, A., Connors, S. L., Péan, C., Berger, S., Caud, N., Chen, Y., Goldfarb, L., Gomis, M. I., Huang, M., Leitzell, K., Lonnoy, E., Matthews, J. B. R., Maycock, T. K., Waterfield, T., Yelekçi, O., Yu, R., and Zhou, B., Cambridge University Press, https://www.ipcc.ch/report/ar6/wg1/downloads/report/IPCC_AR6_WGI_Chapter09.pdf (last access: 23 April 2023), 2021.
Gilford, D. M., Ashe, E. L., DeConto, R. M., Kopp, R. E., Pollard, D., and Rovere, A.: Could the Last Interglacial Constrain Projections of Future Antarctic Ice Mass Loss and Sea-Level Rise?, J. Geophys. Res.-Earth, 125, e2019JF005418, https://doi.org/10.1029/2019JF005418, 2020.
Grieman, M. M., Hoffmann, H. M., Humby, J. D., Mulvaney, R., Nehrbass-Ahles, C., Rix, J., Thomas, E. R., Tuckwell, R., and Wolff, E. W.: Continuous flow analysis methods for sodium, magnesium and calcium detection in the Skytrain ice core, J. Glaciol., 68, 90–100, https://doi.org/10.1017/jog.2021.75, 2021.
Grootes, P. M., Stuiver, M., White, J. W. C., Johnsen, S., and Jouzel, J.: Comparison of oxygen isotope records from the GISP2 and GRIP Greenland ice cores, Nature, 366, 552–554, 1993.
Grootes, P. M., Steig, E. J., Stuiver, M., Waddington, E. D., and Morse, D. L.: The Taylor Dome Antarctic δ18O record and globally synchronous changes in climate, Quaternary Res., 56, 289–298, 2001.
Hoffmann, H. M., Grieman, M. M., King, A. C. F., Epifanio, J. A., Martin, K., Vladimirova, D., Pryer, H. V., Doyle, E., Schmidt, A., Humby, J. D., Rowell, I. F., Nehrbass-Ahles, C., Thomas, E. R., Mulvaney, R., and Wolff, E. W.: The ST22 chronology for the Skytrain Ice Rise ice core – Part 1: A stratigraphic chronology of the last 2000 years, Clim. Past, 18, 1831–1847, https://doi.org/10.5194/cp-18-1831-2022, 2022.
Jacobel, R. W., Welch, B. C., Steig, E. J., and Schneider, D. P.: Glaciological and climatic significance of Hercules Dome, Antarctica: An optimal site for deep ice core drilling, J. Geophys. Res.-Earth, 110, F01015, https://doi.org/10.1029/2004jf000188, 2005.
Kawamura, K., Parrenin, F., Lisiecki, L., Uemura, R., Vimeux, F., Severinghaus, J. P., Hutterli, M. A., Nakazawa, T., Aoki, S., Jouzel, J., Raymo, M. E., Matsumoto, K., Nakata, H., Motoyama, H., Fujita, S., Azuma, K., Fujii, Y., and Watanabe, O.: Northern Hemisphere forcing of climatic cycles over the past 360,000 years implied by accurately dated Antarctic ice cores, Nature, 448, 912–916, 2007.
Köhler, P., Nehrbass-Ahles, C., Schmitt, J., Stocker, T. F., and Fischer, H.: A 156 kyr smoothed history of the atmospheric greenhouse gases CO2, CH4, and N2O and their radiative forcing, Earth Syst. Sci. Data, 9, 363–387, https://doi.org/10.5194/essd-9-363-2017, 2017.
Korotkikh, E. V., Mayewski, P. A., Handley, M. J., Sneed, S. B., Introne, D. S., Kurbatov, A. V., Dunbar, N. W., and McIntosh, W. C.: The last interglacial as represented in the glaciochemical record from Mount Moulton Blue Ice Area, West Antarctica, Quaternary Sci. Rev., 30, 1940–1947, 2011.
Lee, J. E., Brook, E. J., Bertler, N. A. N., Buizert, C., Baisden, T., Blunier, T., Ciobanu, V. G., Conway, H., Dahl-Jensen, D., Fudge, T. J., Hindmarsh, R., Keller, E. D., Parrenin, F., Severinghaus, J. P., Vallelonga, P., Waddington, E. D., and Winstrup, M.: An 83 000-year-old ice core from Roosevelt Island, Ross Sea, Antarctica, Clim. Past, 16, 1691–1713, https://doi.org/10.5194/cp-16-1691-2020, 2020.
Loulergue, L., Schilt, A., Spahni, R., Masson-Delmotte, V., Blunier, T., Lemieux, B., Barnola, J. M., Raynaud, D., Stocker, T. F., and Chappellaz, J.: Orbital and millennial-scale features of atmospheric CH4 over the last 800,000 years, Nature, 453, 383–386, 2008.
Matsuoka, K., Skoglund, A., Roth, G., de Pomereu, J., Griffiths, H., Headland, R., Herried, B., Katsumata, K., Le Brocq, A., Licht, K., Morgan, F., Neff, P. D., Ritz, C., Scheinert, M., Tamura, T., Van de Putte, A., van den Broeke, M., von Deschwanden, A., Deschamps-Berger, C., Van Liefferinge, B., Tronstad, S., and Melvær, Y.: Quantarctica, an integrated mapping environment for Antarctica, the Southern Ocean, and sub-Antarctic islands, Environ. Modell. Softw., 140, 105015, https://doi.org/10.1016/j.envsoft.2021.105015, 2021.
Mitchell, L., Brook, E., Lee, J. E., Buizert, C., and Sowers, T.: Constraints on the Late Holocene Anthropogenic Contribution to the Atmospheric Methane Budget, Science, 342, 964–966, https://doi.org/10.1126/science.1238920, 2013.
Mulvaney, R., Alemany, O., and Possenti, P.: The Berkner Island ice core drilling project, Ann. Glaciol., 47, 115–124, 2007.
Mulvaney, R., Rix, J., Polfrey, S., Grieman, M., Martìn, C., Nehrbass-Ahles, C., Rowell, I., Tuckwell, R., and Wolff, E.: Ice drilling on Skytrain Ice Rise and Sherman Island, Antarctica, Ann. Glaciol., 62, 311–323, https://doi.org/10.1017/aog.2021.7, 2021.
Mulvaney, R., Röthlisberger, R., Wolff, E. W., Sommer, S., Schwander, J., Hutterli, M. A., and Jouzel, J.: The transition from the last glacial period in inland and near-coastal Antarctica, Geophys. Res. Lett., 27, 2673–2676, 2000.
Mulvaney, R., Triest, J., and Alemany, O.: The James Ross Island and the Fletcher Promontory ice-core drilling projects, Ann. Glaciol., 55, 179–188, https://doi.org/10.3189/2014AoG68A044, 2014.
NEEM Community Members: Eemian interglacial reconstructed from a Greenland folded ice core, Nature, 493, 489–494, https://doi.org/10.1038/nature11789, 2013.
Parrenin, F., Bazin, L., Capron, E., Landais, A., Lemieux-Dudon, B., and Masson-Delmotte, V.: IceChrono1: a probabilistic model to compute a common and optimal chronology for several ice cores, Geosci. Model Dev., 8, 1473–1492, https://doi.org/10.5194/gmd-8-1473-2015, 2015.
Raisbeck, G. M., Cauquoin, A., Jouzel, J., Landais, A., Petit, J.-R., Lipenkov, V. Y., Beer, J., Synal, H.-A., Oerter, H., Johnsen, S. J., Steffensen, J. P., Svensson, A., and Yiou, F.: An improved north–south synchronization of ice core records around the 41 kyr 10Be peak, Clim. Past, 13, 217–229, https://doi.org/10.5194/cp-13-217-2017, 2017.
Rhodes, R. H., Brook, E. J., Chiang, J. C. H., Blunier, T., Maselli, O. J., McConnell, J. R., Romanini, D., and Severinghaus, J. P.: Enhanced tropical methane production in response to iceberg discharge in the North Atlantic, Science, 348, 1016–1019, https://doi.org/10.1126/science.1262005, 2015.
Rhodes, R. H., Brook, E. J., McConnell, J. R., Blunier, T., Sime, L. C., Faïn, X., and Mulvaney, R.: Atmospheric methane variability: Centennial-scale signals in the Last Glacial Period, Global Biogeochem. Cy., 31, 575–590, https://doi.org/10.1002/2016GB005570, 2017.
Röthlisberger, R., Mulvaney, R., Wolff, E. W., Hutterli, M., Bigler, M., Sommer, S., and Jouzel, J.: Dust and sea salt variability in central East Antarctica (Dome C) over the last 45 kyrs and its implications for southern high-latitude climate, Geophys. Res. Lett., 29, 1963, https://doi.org/10.1029/2002GL015186, 2002.
Saltzman, E. S., Dioumaeva, I., and Finley, B. D.: Glacial/interglacial variations in methanesulfonate (MSA) in the Siple Dome ice core, West Antarctica, Geophys. Res. Lett., 33, L11811, https://doi.org/10.1029/2005GL025629, 2006.
Schmidely, L., Nehrbass-Ahles, C., Schmitt, J., Han, J., Silva, L., Shin, J., Joos, F., Chappellaz, J., Fischer, H., and Stocker, T. F.: CH4 and N2O fluctuations during the penultimate deglaciation, Clim. Past, 17, 1627–1643, https://doi.org/10.5194/cp-17-1627-2021, 2021.
Severinghaus, J. P., Beaudette, R., Headly, M. A., Taylor, K., and Brook, E. J.: Oxygen-18 of O2 Records the Impact of Abrupt Climate Change on the Terrestrial Biosphere, Science, 324, 1431–1434, https://doi.org/10.1126/science.1169473, 2009.
Sigl, M., Fudge, T. J., Winstrup, M., Cole-Dai, J., Ferris, D., McConnell, J. R., Taylor, K. C., Welten, K. C., Woodruff, T. E., Adolphi, F., Bisiaux, M., Brook, E. J., Buizert, C., Caffee, M. W., Dunbar, N. W., Edwards, R., Geng, L., Iverson, N., Koffman, B., Layman, L., Maselli, O. J., McGwire, K., Muscheler, R., Nishiizumi, K., Pasteris, D. R., Rhodes, R. H., and Sowers, T. A.: The WAIS Divide deep ice core WD2014 chronology – Part 2: Annual-layer counting (0–31 ka BP), Clim. Past, 12, 769-786, https://doi.org/10.5194/cp-12-769-2016, 2016.
Sigl, M., Toohey, M., McConnell, J. R., Cole-Dai, J., and Severi, M.: Volcanic stratospheric sulfur injections and aerosol optical depth during the Holocene (past 11 500 years) from a bipolar ice-core array, Earth Syst. Sci. Data, 14, 3167–3196, https://doi.org/10.5194/essd-14-3167-2022, 2022.
Veres, D., Bazin, L., Landais, A., Toyé Mahamadou Kele, H., Lemieux-Dudon, B., Parrenin, F., Martinerie, P., Blayo, E., Blunier, T., Capron, E., Chappellaz, J., Rasmussen, S. O., Severi, M., Svensson, A., Vinther, B., and Wolff, E. W.: The Antarctic ice core chronology (AICC2012): an optimized multi-parameter and multi-site dating approach for the last 120 thousand years, Clim. Past, 9, 1733–1748, https://doi.org/10.5194/cp-9-1733-2013, 2013.
Wolff, E. W., Barbante, C., Becagli, S., Bigler, M., Boutron, C. F., Castellano, E., De Angelis, M., Federer, U., Fischer, H., Fundel, F., Hansson, M., Hutterli, M., Jonsell, U., Karlin, T., Kaufmann, P., Lambert, F., Littot, G. C., Mulvaney, R., Rothlisberger, R., Ruth, U., Severi, M., Siggaard-Andersen, M. L., Sime, L. C., Steffensen, J. P., Stocker, T. F., Traversi, R., Twarloh, B., Udisti, R., Wagenbach, D., and Wegner, A.: Changes in environment over the last 800,000 years from chemical analysis of the EPICA Dome C ice core, Quaternary Sci. Rev., 29, 285–295, https://doi.org/10.1016/j.quascirev.2009.06.013, 2010.
Wolff, E. W., Mulvaney, R., Grieman, M. M., Hoffmann, H., and Humby, J.: Skytrain Ice Rise ice core: age model ST22 and underlying data, PANGAEA [data set], https://doi.org/10.1594/PANGAEA.956062, 2023a.
Wolff, E. W., Mulvaney, R., Grieman, M. M., Hoffmann, H., and Humby, J.: Age model output of ice core Skytrain Ice Rise, PANGAEA [data set], https://doi.org/10.1594/PANGAEA.956061, 2023b.
Yau, A. M., Bender, M. L., Robinson, A., and Brook, E. J.: Reconstructing the last interglacial at Summit, Greenland: Insights from GISP2, P. Natl. Acad. Sci. USA, 113, 9710–9715, https://doi.org/10.1073/pnas.1524766113, 2016.
- Abstract
- Introduction
- Overall dating strategy
- Data available
- Reference datasets
- Tie points to 100 ka
- Dating the ice older than 100 ka
- Application of Paleochrono
- Disturbed ice around the LIG
- Conclusion
- Data availability
- Author contributions
- Competing interests
- Disclaimer
- Special issue statement
- Acknowledgements
- Financial support
- Review statement
- References
- Supplement