the Creative Commons Attribution 4.0 License.
the Creative Commons Attribution 4.0 License.
 | 26 Apr 2023
Mechanisms of hydrological responses to volcanic eruptions in the Asian monsoon and westerlies-dominated subregions
Zhihong Zhuo
Ingo Kirchner
Ulrich Cubasch
Explosive volcanic eruptions affect surface climate, especially in monsoon regions, but responses vary in different regions and to volcanic aerosol injection (VAI) in different hemispheres. Here, we use six ensemble members from the last-millennium experiment of the Coupled Model Intercomparison Project Phase 5 to investigate the mechanisms of regional hydrological responses to different hemispheric VAIs in the Asian monsoon region (AMR). Northern hemispheric VAI (NHVAI) leads to an intensified aridity over the AMR after northern hemispheric VAI (NHVAI); spatially, a distinct inverse response pattern to the climatological conditions emerges, with an intensified aridity in the relatively wettest area (RWA) but a weakened aridity in the relatively driest area (RDA) of the AMR. Southern hemispheric VAI (SHVAI) shows a weakened aridity over the AMR, but the spatial response pattern is not that clear due to small aerosol magnitude. The mechanism of the hydrological impact relates to the indirect change of atmospheric circulation due to the direct radiative effect of volcanic aerosols. The decreased thermal contrast between the land and the ocean after NHVAI results in a weakened East Asian summer monsoon and South Asian summer monsoon. This changes the moisture transport and cloud formation in the monsoon and westerlies-dominated subregions. The subsequent radiative effect and physical feedbacks of local clouds lead to different hydrological effects in different areas. Results here indicate that future volcanic eruptions may temporarily alleviate the uneven distribution of precipitation in the AMR, which should be considered in the near-term climate predictions and future strategies of local adaptation to global warming. The local hydrological responses and mechanisms found here can also provide a reference for stratospheric aerosol engineering.
- Article
(6805 KB) - Full-text XML
- BibTeX
- EndNote


The Asian monsoon region (AMR; 8.75∘ S–56.25∘ N, 61.25–143.75∘ E; Cook et al., 2010) is the most densely populated region over all the world. As part of the largest continental landmass, the climate here shows large regional differences. Figure 1 shows the dominant climate systems and climatological precipitation distribution in the boreal summer (June–July–August, JJA) in 1981–2010. The purple line indicates the modern Asian summer monsoon limit (Chen et al., 2008); to the northwest are the westerlies-dominated arid areas, and to the southeast are the monsoon-dominated humid areas, which are due to the contrast between the landmass and the Indian and Pacific oceans (Dando, 2005; Chen et al., 2008). It includes two monsoon subsystems: the East Asian summer monsoon (EASM) and the South Asian summer monsoon (SASM), which are usually separated by 100∘ E longitude (Chiang et al., 2017). The precipitation is unevenly distributed, with a diminishing scale from southeast to northwest in the AMR. In comparison to the monsoon-dominated subregion, there is much less precipitation in the westerlies-dominated subregion. The southwestern part has the least precipitation (dashed black box, hereafter marked as the relatively driest area (RDA)). Here, because westerly wind brings limited moisture to this region, the transport of air mass from its adjacent areas may play a key role in controlling the moisture conditions (Chen et al., 2008). In the monsoon-dominated subregion, precipitation is largely affected by the evolution of the South and East Asian summer monsoons (Wang et al., 2005). The southern part affected by the SASM has the most precipitation (solid black box, hereafter marked as the relatively wettest area (RWA)). This large uneven precipitation distribution makes the AMR a region susceptible to perturbations, which has a large impact on the local environment and society. Understanding the hydrological variation to perturbations and potential mechanisms are both biophysically and socioeconomically important (Dando, 2005).

Figure 1Hydrological distribution and climate systems in the Asian monsoon region (8.75∘ S–56.25∘ N, 61.25–143.75∘ E). The colors indicate the climatological June–July–August mean precipitation (mm month−1) in 1981–2010, which is based on the monthly global land surface precipitation of the Global Precipitation Climatology Centre Full Data Reanalysis version 7. The solid and dashed black boxes indicate the relatively wettest area (RWA) and the relatively driest area (RDA), respectively.
Volcanic eruptions are one of the important natural forcings that cool the surface (Robock, 2000; Timmreck, 2012) and cause strong hydrological perturbations, especially in monsoon regions (Iles and Hegerl, 2014; Trenberth and Dai, 2007; Zambri and Robock, 2016; Zhuo et al., 2014, 2020). Some studies focused on global impact show a significant decrease of Asian summer monsoon precipitation after volcanic eruptions in both observation (Trenberth and Dai, 2007) and model simulations (Iles and Hegerl, 2014; Zambri and Robock, 2016). A few studies focused on Asian summer monsoon response to volcanic eruptions. Model simulations (Peng et al., 2010; Man et al., 2014; Man and Zhou, 2014) show a reduced precipitation due to a reduced land–sea thermal contrast that in favor of a weakened monsoon circulation; hydrological proxy reconstructions (Anchukaitis et al., 2010; Gao and Gao, 2018; Zhuo et al., 2014) generally agree on the temporal drying trend in the monsoon region, but discrepancies exist in spatial responses to volcanic classifications among different reconstruction data. Besides, most of them only focused on part of the AMR, except Zhuo et al. (2020), who studied temporal and spatial characteristics of the hydrological impact in subregions of the AMR through comparing proxy reconstruction data and models.
Climate impacts of volcanic eruptions depend on the distribution of volcanic aerosols and the associated radiative forcing structures (Haywood et al., 2013; Toohey et al., 2019; Yang et al., 2019). Haywood et al. (2013) reported the potential inverse climate effects that the interhemispherically asymmetric volcanic aerosol distributions may have on Sahelian precipitation. Further studies found potential inverse climate impacts of interhemispherically asymmetric volcanic aerosol injection (VAI) in China (Zhuo et al., 2014), the tropics (Colose et al., 2016) and monsoon regions (Iles and Hegerl, 2014; Liu et al., 2016; Zuo et al., 2019a; Zhuo et al., 2021). These studies were mostly focused on global or regional mean responses; local hydrological variations are rarely studied.
The mechanisms of the hydrological responses in the AMR were roughly investigated. Precipitation can be reduced as a result of a weakening of the summer monsoon after volcanic eruptions (Dogar and Sato, 2019; Liu et al., 2016; Man and Zhou, 2014; Man et al., 2014; Zhuo et al., 2021; Zuo et al., 2019a). This was generally based on qualitative analysis of the altered land–sea thermal contrast. The Intertropical Convergence Zone (ITCZ) moving toward a warmer hemisphere with less volcanic aerosol loading leads to inverse climate impacts in two hemispheres (Colose et al., 2016; Haywood et al., 2013; Iles and Hegerl, 2014; Zhuo et al., 2021). With moisture budget analyses over the hemispheric arid regions, Zuo et al. (2019b) showed wetter conditions in arid regions due to an enhanced cross-Equator flow after southern hemispheric VAI (SHVAI) and a monsoon–desert coupling mechanism after northern hemispheric VAI (NHVAI). However, these analyses cannot fully explain the mechanisms of local hydrological responses to volcanic eruptions, as regional responses and local feedback processes were not considered. Based on spatial analyses, Zhuo et al. (2021) showed that dynamical responses to NHVAI change local cloud cover. A subsequent physical feedback of local temperature and adjusted horizontal and vertical motions of local water vapor lead to decreased precipitation in the SASM region. Responses in different subregions of the AMR and related mechanisms need further investigation.
This study tries to fill in the gap with regards to investigating mechanisms of local hydrological responses in monsoon and westerlies-dominated subregions of the AMR to different hemispheric VAIs. We perform spatiotemporal analyses on multi-model ensemble means of the last-millennium (LM) experiments from the Paleoclimate Modeling Intercomparison Project Phase 3 (PMIP3) and the Coupled Model Intercomparison Project Phase 5 (CMIP5). This study aims to answer the following questions: what different hydrological impacts do hemispheric volcanic aerosol injections have in different subregions of the AMR? What is the mechanism behind the local hydrological responses to hemispheric VAI?
After this introduction, we describe the data and methods in Sect. 2, followed by our results and discussions in Sect. 3. In Sect. 4, we give our summary and conclusions.
2.1 Model data
Nine models participated in the last-millennium experiments of PMIP3 and CMIP5 (Schmidt et al., 2011). Two different volcanic-forcing indices, namely GRA (Gao et al., 2008) and CEA (Crowley et al., 2008), were freely chosen in the model simulations. Zhuo et al. (2020) calculated two multi-model ensemble means (MMEMs) based on six ensemble members of four models that separately adopted the GRA and CEA volcanic-forcing indices; these MMEMs were then compared with proxy reconstruction data. Results indicate the reliability of MMEMs in reproducing the hydrological effects of volcanic eruptions in the southern Asian monsoon region. Since similar patterns were shown between two MMEMs, and because significant and pronounced patterns were shown in the MMEM with model members adopting the GRA volcanic forcing (GRA-based MMEM), in this study, we further use the GRA-based MMEM to investigate the mechanism of the hydrological impacts of VAI in subregions of the AMR. The green box of Fig. 2 shows model ensemble members employed in the GRA-based MMEM, which are the same as in Zhuo et al. (2020). Similarly, we choose the data from 1300–1850 CE and calculate the MMEM after regridding the model outputs to spatial resolution.
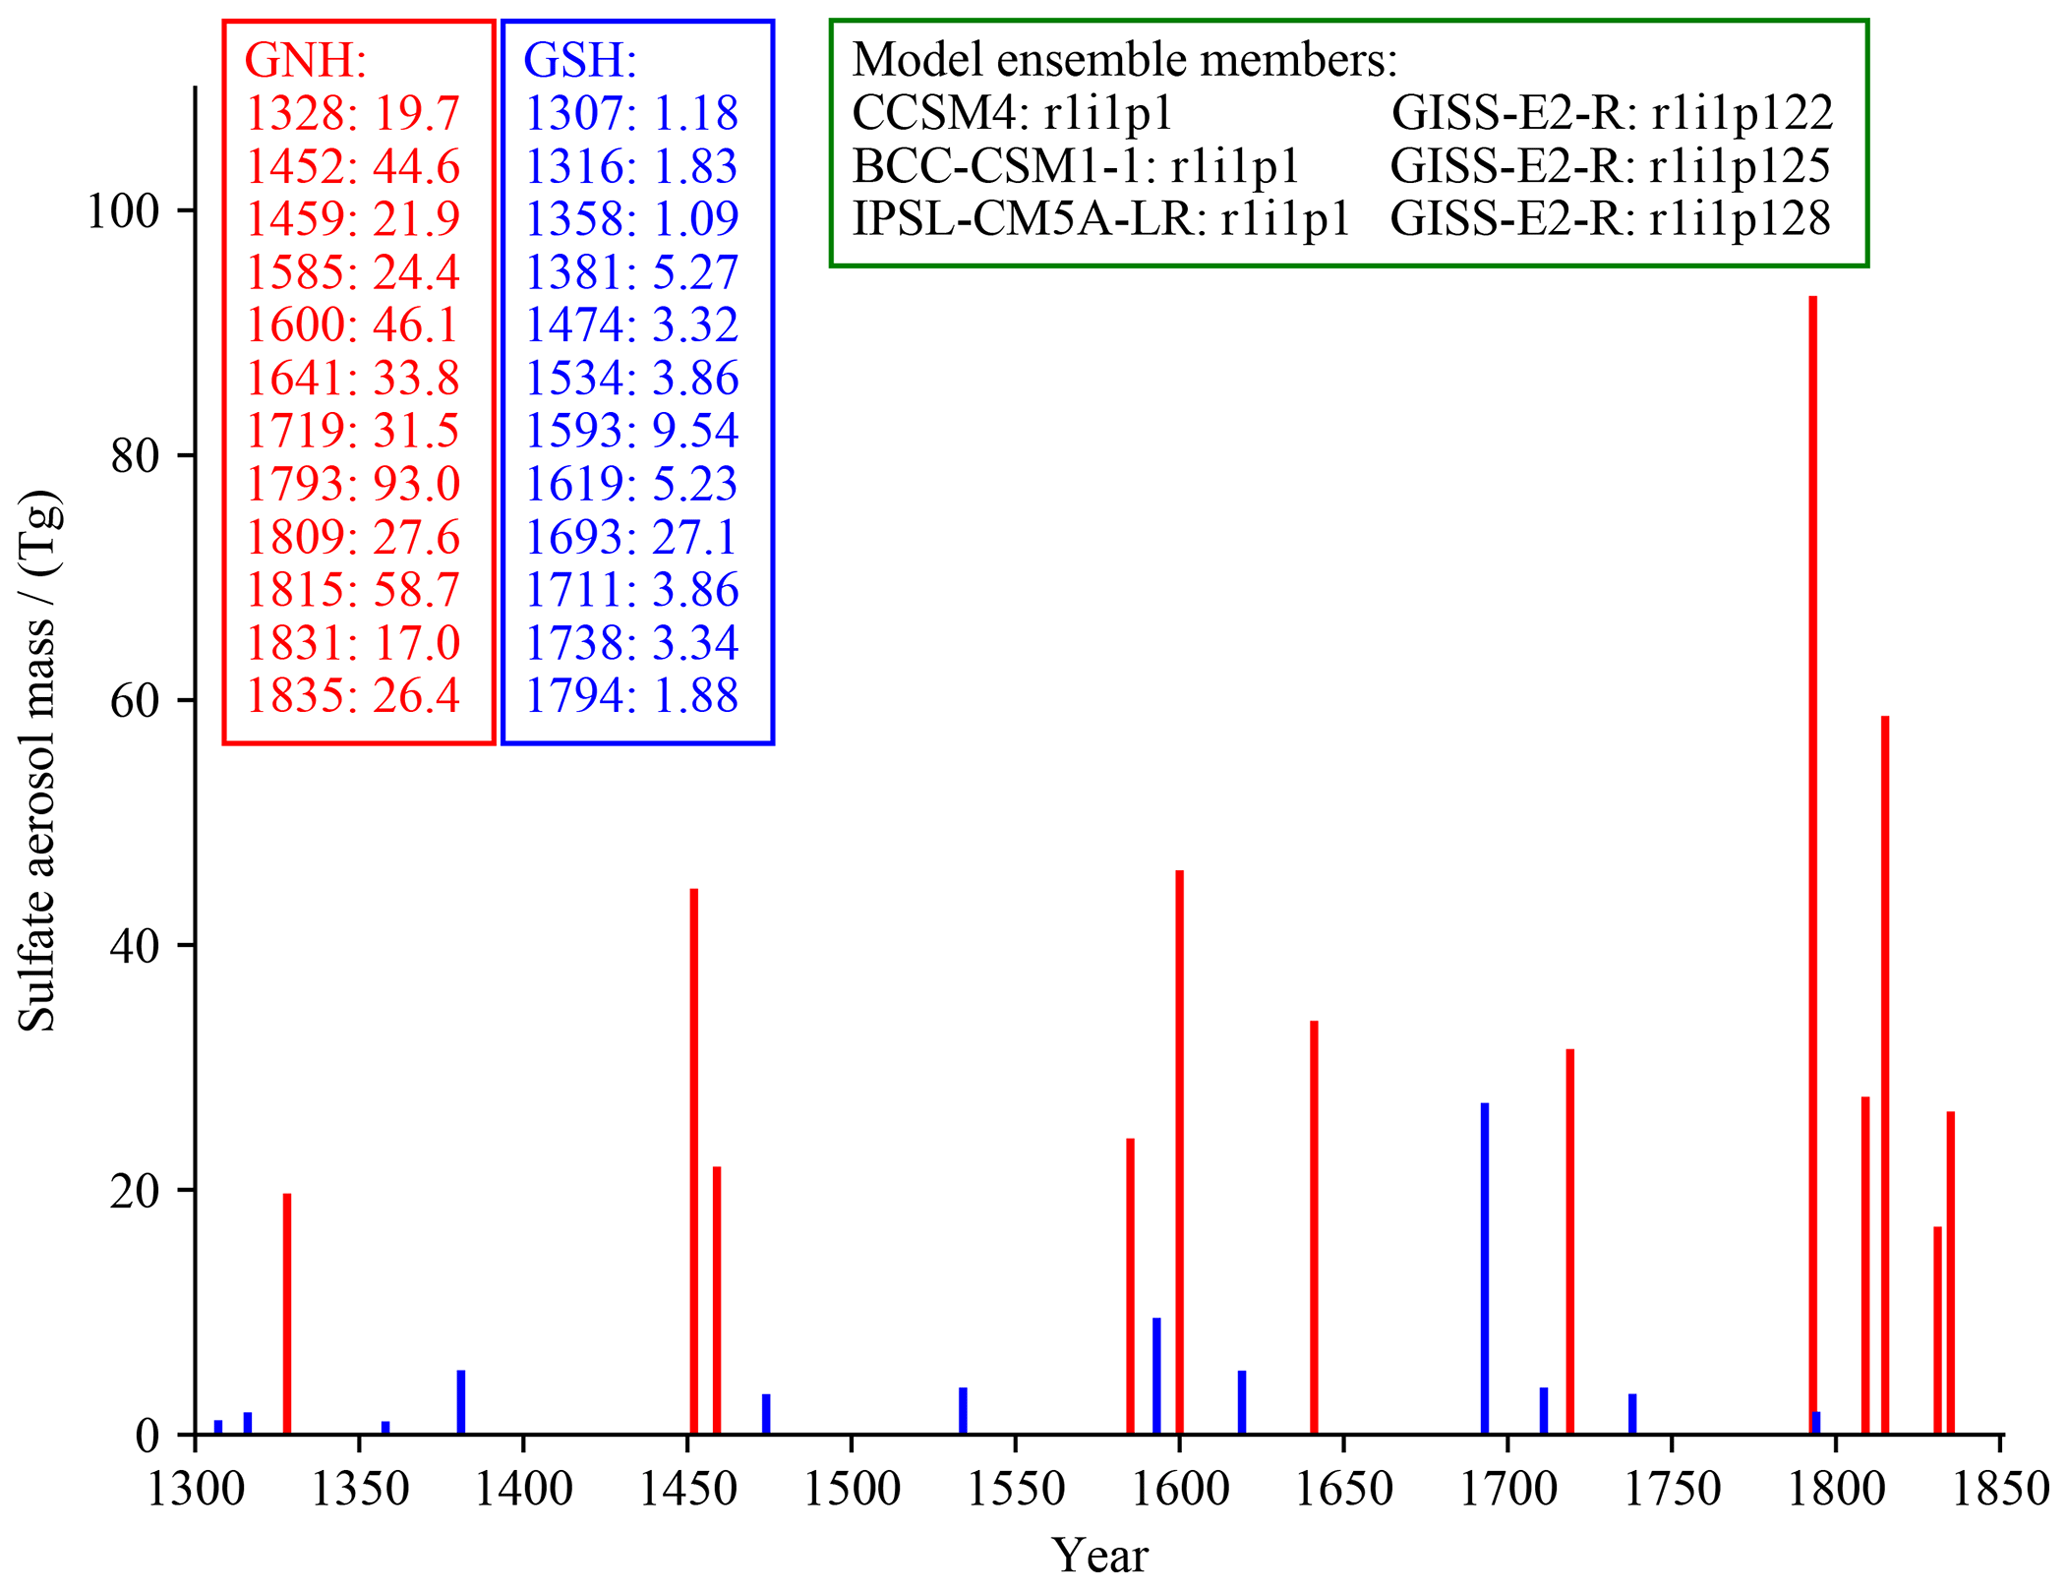
Figure 2Volcanic years and the hemispheric volcanic aerosol injection magnitudes (Tg) in the GNH (red lines and text) and GSH (blue lines and text) classifications based on the GRA volcanic forcing (following Schmidt et al., 2021, reconstructed by Gao et al., 2008). Model ensemble members used in this study are shown in the green box.
2.2 Volcanic classifications
Following Zhuo et al. (2020), we pick out volcanic events in 1300–1850 CE that have larger northern hemispheric volcanic aerosol injections (NHVAIs) than that of the 1991 Mount Pinatubo eruption (17 Tg SO2 based on the GRA volcanic-forcing index) as GNH classification. To explore the inverse hydrological impacts of interhemispherically asymmetric VAIs, another classification using volcanic events in 1300–1850 CE that only have southern hemispheric volcanic aerosol injections (SHVAIs) is constructed as the GSH classification. Just by coincidence, based on these two criteria, 12 volcanic events are included in each of the classifications. Figure 2 shows the years and aerosol magnitudes of the volcanic events. In comparison to the GNH classification, the aerosol magnitudes of volcanic events in the GSH classification are much smaller. This can result in a limited climate impact in the GSH classification; thus, the GSH classification might not be sufficient for showing the inverse hydrological impact of interhemispherically asymmetric VAIs. However, since both classifications have 12 volcanic events, the GSH classification is sufficient to serve as a reference classification without NHVAI.
2.3 Analysis indices
Following Zhuo et al. (2020), we use a Palmer Drought Severity Index (PDSI; Palmer, 1965) to indicate hydrological conditions. PDSI is calculated from model precipitation and temperature data, together with latitude and water-holding capacity (WEBB et al., 2000), using the MATLAB program produced by Jacobi et al. (2013). It represents normal conditions when PDSI is between −0.5 and 0.5 and indicates incipient drought when PDSI falls below −0.5 and a wet spell when PDSI goes above 0.5.
Previous studies suggested that decreased precipitation in monsoon regions results from a weakened monsoon circulation after volcanic aerosol injections – this is based on qualitative analysis of a weakened thermal contrast between the land and the ocean (Man and Zhou, 2014; Man et al., 2014). In this study, we adopt two indices to better quantify the East and South Asian summer monsoon (EASM and SASM) variations. Following the recommendation in Wang et al. (2008), to assess the strength of the EASM, we calculate the East Asian summer monsoon index (EASMI) as the difference between the zonal winds at 850 hPa over the regions 5–15∘ N, 90–130∘ E and 22.5–32.5∘ N, 110–140∘ E (Wang and Fan, 1999), as it outperforms the other 24 indices in reflecting the summer precipitation distribution. For the South Asian summer monsoon index (SASMI), we used the definition of Webster and Yang (1992), which is defined as the difference between the zonal wind at 850 hPa over the region 0–20∘ N, 40–110∘ E and the zonal wind at 200 hPa over the region 0–20∘ N, 40–110∘ E. This index is widely used to assess the large-scale intensity of the southern ASM.
The moisture transport is reflected by the vertically integrated moisture transport (IVT) and its divergence (IVTD). We calculate the IVT using the following equation:
where g is the acceleration due to gravity, q is specific humidity, v is the horizontal wind vector, and p is pressure. The vertical integration of the equation is performed from the surface to the model top.
2.4 Superposed epoch analysis with Monte Carlo model test
The superposed epoch analysis (SEA; Haurwitz and Brier, 1981) method is used to study climate responses to the classified volcanic eruptions. We present 11 years (the eruption year and 5 years before and 5 years after the eruption) of the temporal analysis. To test the significance of the results, Monte Carlo model tests (Adams et al., 2003) are performed with 10 000 resampling processes for each year based on the null hypothesis that there is no relationship between volcanic eruption and climate variation. Significant results at the 95 % and 99 % confidence levels are identified when SEA results exceed the 95 % and 99 % range of the Monte Carlo sample. For the spatial distribution of the response, since the largest hydrological impacts emerge in the eruption year (year 0; Zhuo et al., 2020), we present anomalies in the eruption year with respect to the mean of 5 years before the eruption (Adams et al., 2003; Zhuo et al., 2014). Similar Monte Carlo model tests (Adams et al., 2003) are performed for significance tests but with 1000 resampling processes for anomalies of each grid in the eruption year.
2.5 Pearson cross-correlation analysis and mechanism exploration
To explore mechanisms of the hydrological effects, we analyze first the correlation relationship between temperature, precipitation, and the radiation-, heat- and evaporation-related variables using the widely used Pearson cross-correlation value (r) as the indicator. We calculate r in each grid between variables among the selected 11 years before and after the aerosol injection, and then we calculate the average r value of the Asian monsoon region. Hereafter, to explore the mechanisms of different hydrological responses in different regions, we show anomalies in the eruption year and compare the spatial patterns of the highly correlated variables.
3.1 Hydrological responses to NHVAI and SHVAI
Hydrological responses to the classified volcanic eruptions are shown by temporal and spatial SEA results of PDSI. Figure 3 shows the hydrological responses to two volcanic classifications in the Asian monsoon region. In the GNH volcanic classification, PDSI reduces significantly in the eruption year (year 0), and this reduction extends to 3 years after the eruption (year 3), indicating an intensified aridity after NHVAI. For the GSH classification, PDSI does not show strong changes, but positive PDSI emerges in year 2 and passed the significance test at the 99 % confidence level, which indicates a weakened aridity after SHVAI. The limited effect might be caused by the limited aerosol magnitude that was injected into the SH based on the GRA volcanic-forcing reconstruction (Gao et al., 2008). However, results in the GSH classification evidently indicate a large difference with and without volcanic aerosol injection in the Northern Hemisphere.
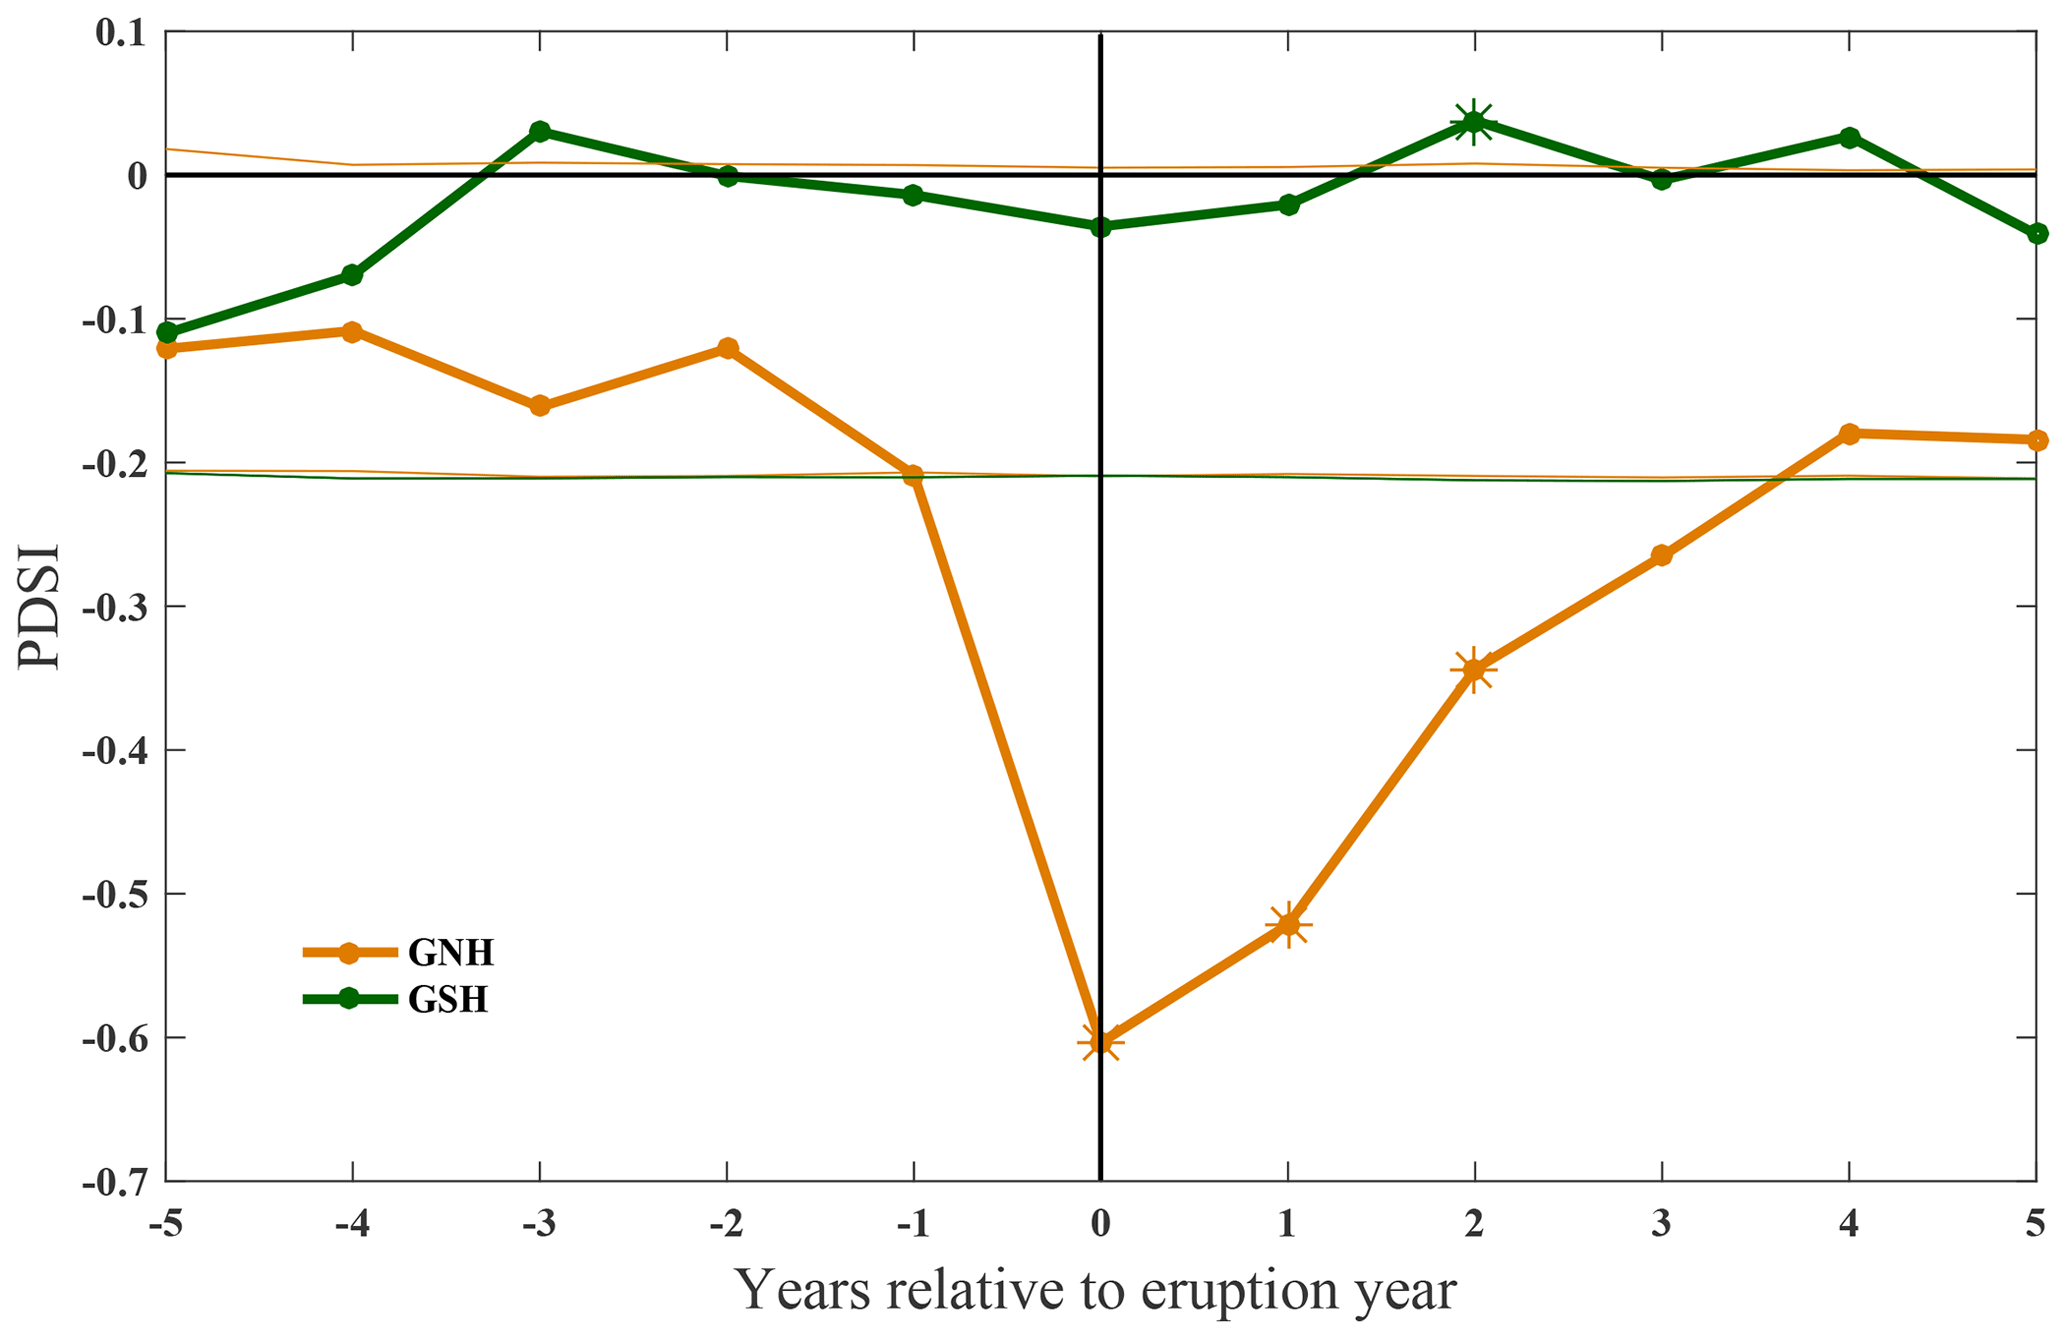
Figure 3Temporal SEA results of summer (JJA) mean PDSI corresponding to the GNH (yellow line) and GSH (green line) volcanic classifications in 1300–1850 CE in the Asian monsoon region (8.75∘ S–56.25∘ N, 61.25–143.75∘ E). The thinner lines stand for the relative Monte Carlo model results at the 95 % confidence level. The asterisks represent the years that passed the Monte Carlo model tests at the 99 % confidence level. Year 0 represents the eruption year identified by the volcanic-forcing index; negative and positive years represent relative years before and after the eruption.
Figure 4 further shows the spatial patterns of PDSI in the eruption year, when it has the largest drying effect after NHVAI (Fig. 3). In the GNH classification (Fig. 4a), significantly reduced PDSI indicates an intensified aridity in a large part of the Asian monsoon region. The largest reduction of PDSI emerges in the southern part of the region (solid black box), while the largest increase of PDSI is concentrated in the southwestern part of the region (dotted black box). This is exactly opposite to the climatological hydrological conditions in the areas where the RWA and RDA are located. In the GSH classification (Fig. 4b), differently from that in the GNH classification, PDSI increases in the RWA, while a slight decrease emerges in the RDA. This indicates inverse hydrological effects between NHVAI and SHVAI in the Asian monsoon region.
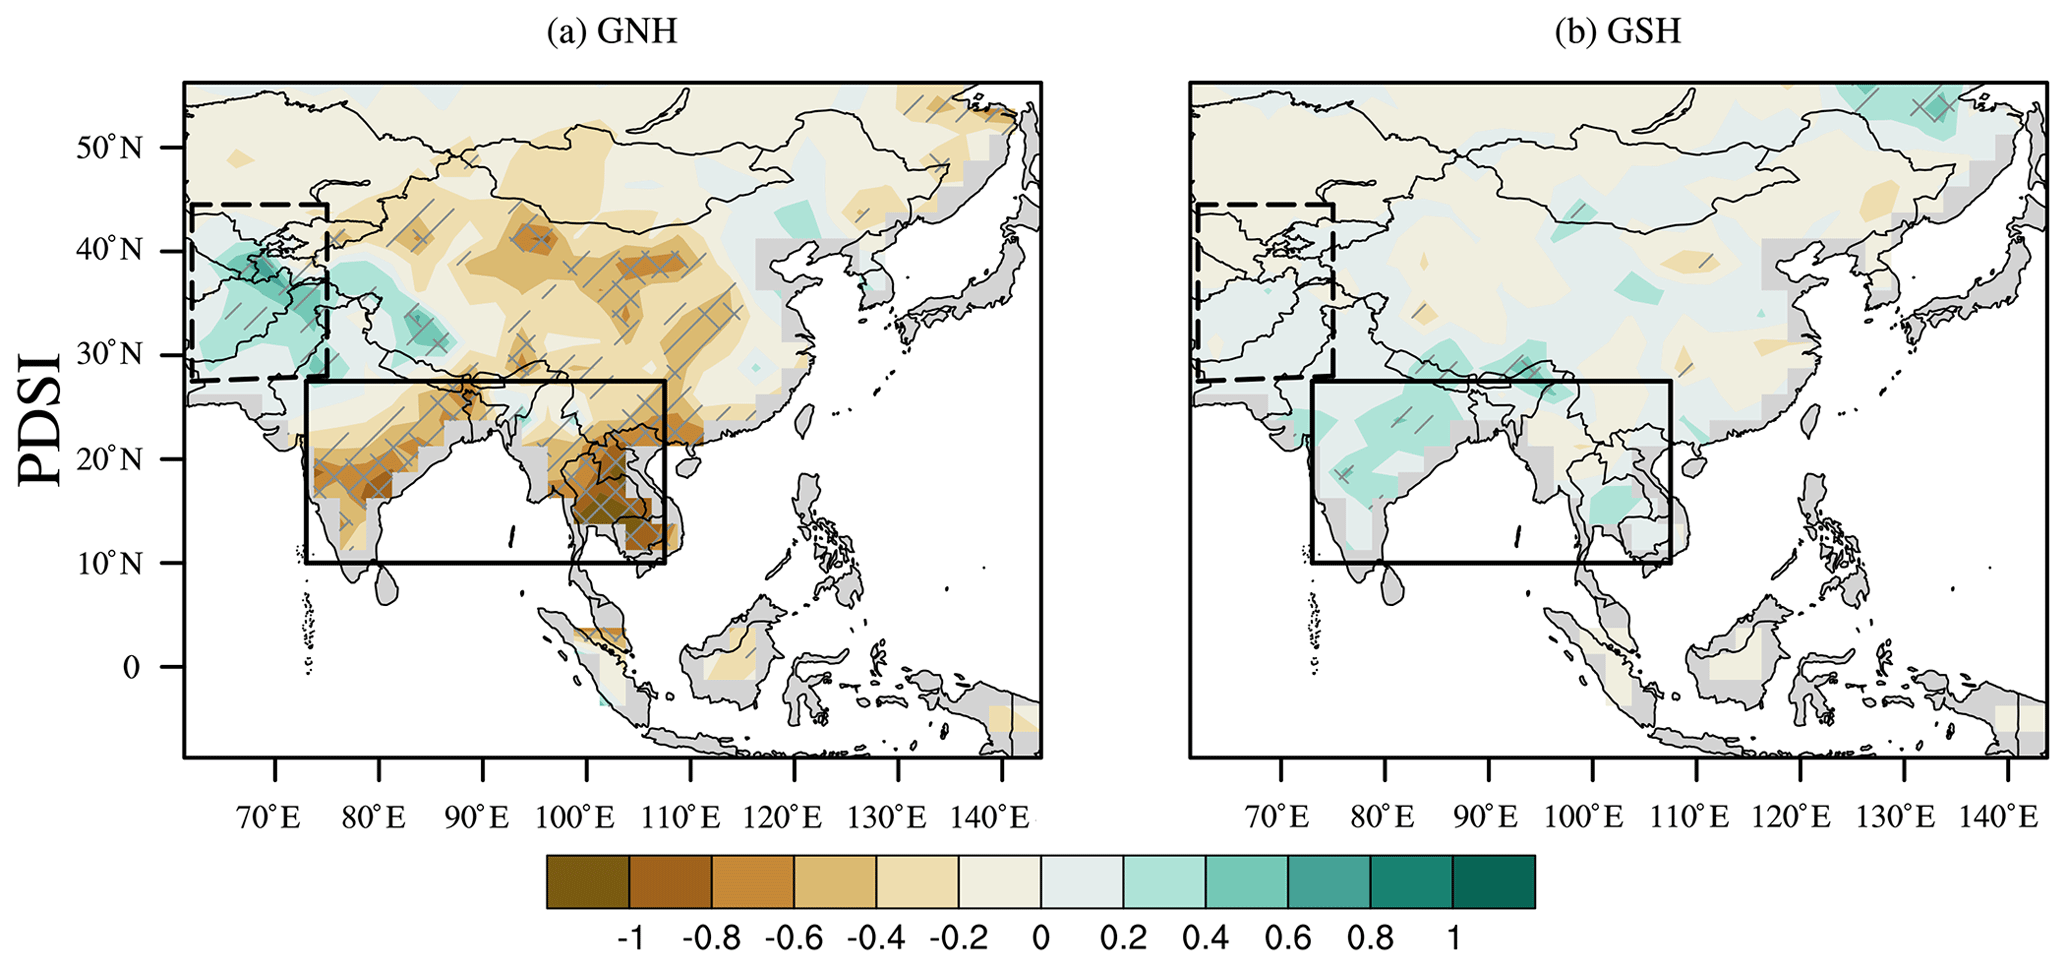
Figure 4Spatial distribution of the Palmer Drought Severity Index (PDSI) anomalies in the eruption year with respect to the mean of 5 years before the eruption. The solid and dashed black boxes indicate the relatively wettest area (RWA) and relatively driest area (RDA), respectively, as shown in Fig. 1. The gray slashes and cross signs indicate the significant results that passed the Monte Carlo model tests at the 95 % and 99 % confidence levels.
The reduction of PDSI in the GNH classification shows agreement regarding a weakened Asian monsoon with Liu et al. (2016), who showed a significant reduction of PDSI in the first year after tropical eruptions and in the second year after NH volcanic eruptions. Due to limited aerosol magnitude in the GSH classification, a slight increase of PDSI emerges after SHVAI and is only significant in year 2. This also agrees well with Liu et al. (2016), who showed an increase in PDSI in the first year from SH volcanic eruptions, although without passing the significance tests. The PDSI spatial patterns indicate distinct hydrological responses to NHVAI, with an inverse aridity pattern between the RDA and RWA in relation to the climatological conditions. This may counteract the “wet gets wetter, dry gets drier” precipitation response to global warming that is mainly caused by increased anthropogenic greenhouse gases (Schurer et al., 2020). This agrees with Zhuo et al. (2021) with regards to a decreased SASM precipitation after NHVAI and also confirms that NHVAI leads to decreased global monsoon precipitation (Zuo et al., 2019a) and wetter global arid regions (Zuo et al., 2019b). However, Zuo et al. (2019b) also found wetter global arid regions after SHVAI, but our results indicate a normal wet condition in the RDA after SHVAI (Fig. 4). This normal condition might be the result of limited aerosol magnitude in the GSH classification. The problem that different volcanic classifications have different aerosol magnitudes also exists in Zuo et al. (2019b). This brings uncertainty to the conclusion. Even though Zhuo et al. (2021) avoided the problem with the same Pinatubo eruption magnitude in both the NHVAI and SHVAI experiments, the precipitation response is still invisible in the RDA in Zhuo et al. (2021). These disagreements indicate that further studies are needed to understand the hydrological impact of SHVAI in the arid regions.
3.2 Correlation analysis
To identify the key factors that affect the hydrological variation, we show correlations between radiation-, heat- and moisture-related variables and near-surface air temperature (T) and precipitation (P) in Table 1 using the Pearson cross-correlation (r) as the indicator. Since only limited effects are shown in the GSH classification, which is likely due to the small magnitude of aerosol injection, we only conduct the correlation analyses on the GNH classification.
Table 1Mean Pearson cross-correlation (r) values between near-surface air temperature (T), precipitation (P), and radiation-, heat- and moisture-related variables over the Asian monsoon region. Numbers in italics and in bold are significant at the 95 % and 99 % confidence levels.
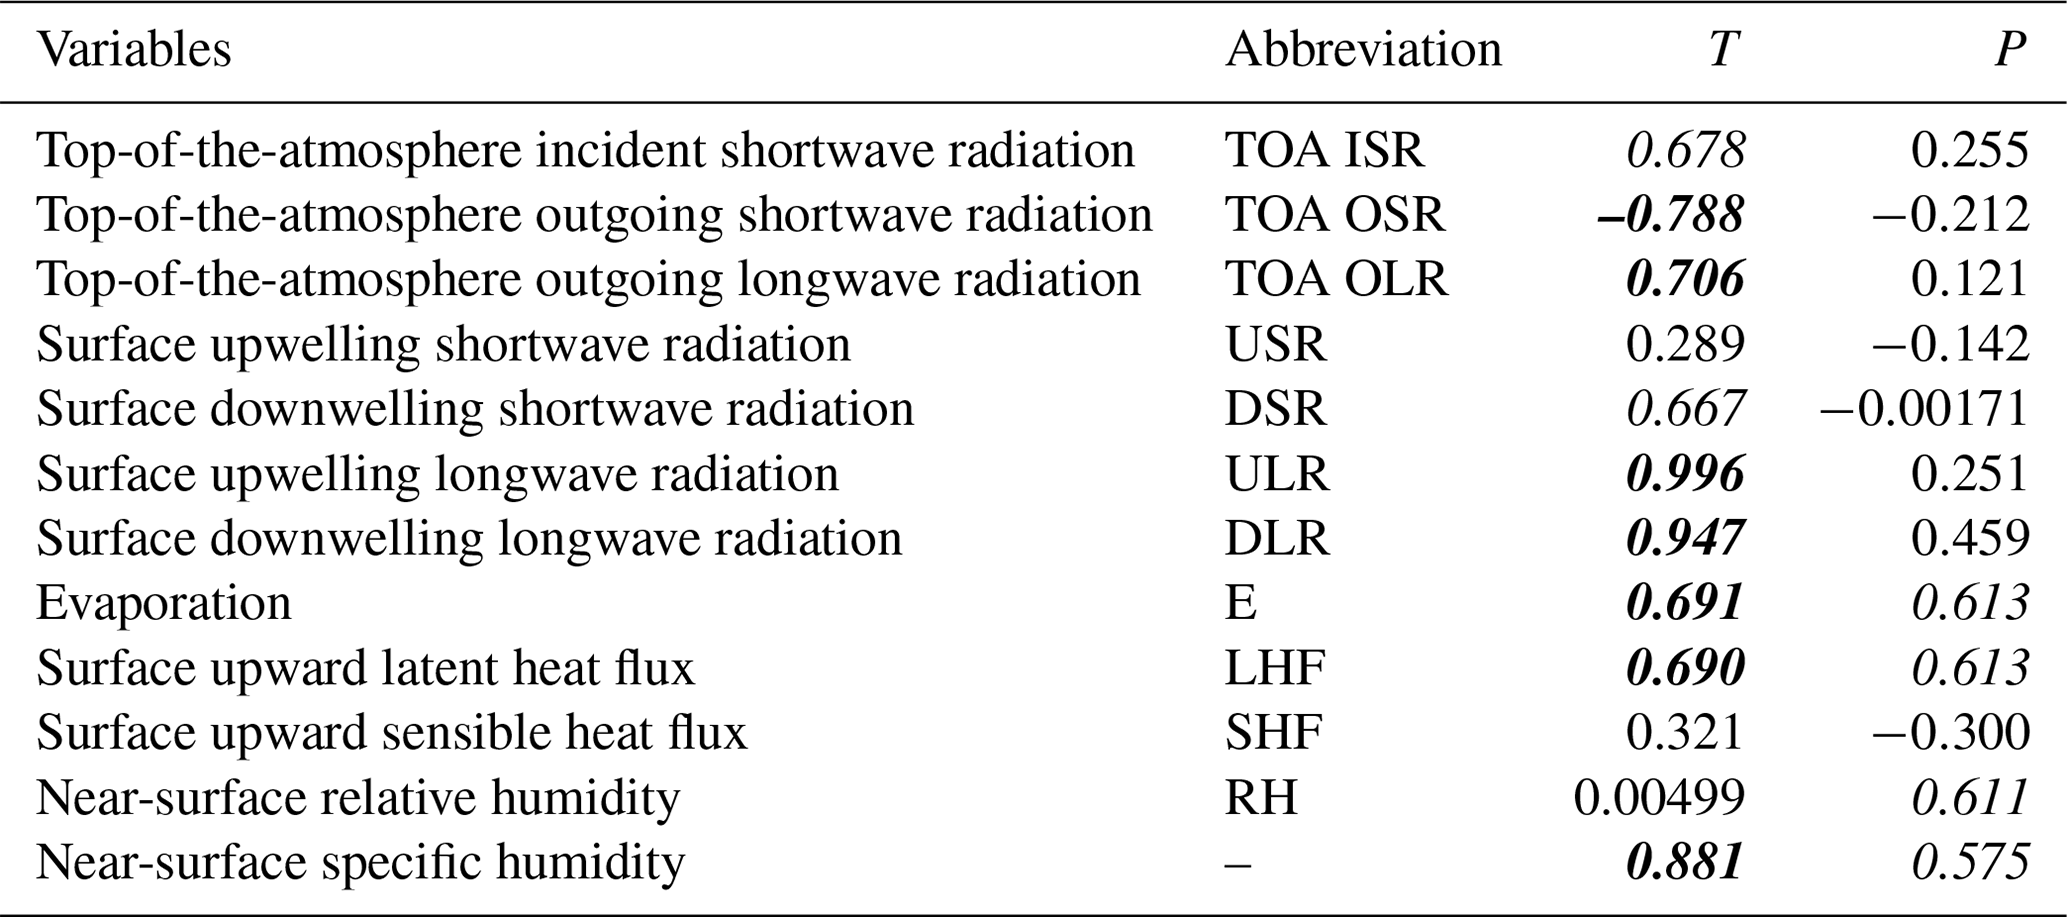
Table 1 shows that T correlates highly with radiation and specific humidity, with r reaching 0.996 and 0.947 between T and upwelling and downwelling longwave radiation (LW), followed by −0.788 and 0.881 between T and top-of-the-atmosphere (TOA) outgoing shortwave radiation (OSR) and specific humidity. P correlates with evaporation (E) and latent heat flux (LHF; both r are equal to 0.613) and closely relates to relative humidity (RH; r is equal to 0.611) and specific humidity (r is equal to 0.575). From these correlations, we know that, in order to understand the temperature variation, it is important to investigate shortwave and longwave radiation responses to volcanic eruptions. For the precipitation variation, the variations of evaporation, latent heat flux and relative humidity need to be checked. Both temperature and precipitation are highly correlated with specific humidity, which indicates that the response of the model follows the Clausius–Clapeyron relation. These correlation analyses can identify the key factors of the hydrological variation, but they are not sufficient to explain the inverse hydrological responses in the RDA and RWA (Fig. 4).
3.3 Mechanisms of the hydrological responses to NHVAI
Considering that limited climate impacts are shown due to limited aerosol magnitude in the GSH classification, we mainly focus on the GNH classification in the following discussions to investigate the mechanisms of the hydrological responses to NHVAI.
3.3.1 Cooling and subsequent dynamical responses to volcanic eruptions
Reflected incoming solar radiation by stratospheric volcanic aerosols leads to significant surface cooling and further affects the hydrological process (Robock, 2002; Timmreck, 2012). Figure 5 shows temperature responses in the two volcanic classifications. The largest temperature decrease over ASM land emerges in year 0 in the GNH classification, and the significant cooling extends to year 2 after the NHVAI. For the GSH classification, insignificant cooling is shown in year 0 to year 2 (Fig. 5a). Figure 5b shows the temperature difference between the land and the ocean in the Asian monsoon region. A significant decrease in the GNH classification confirms that the NHVAI causes a decreased land–sea thermal contrast in the AMR. In the GSH classification, a significant increase in year 0 and year 1 indicates an increased land–sea thermal contrast after the SHVAI. This quantitative analysis result confirms that volcanic eruption leads to an inhomogeneous cooling between the land and the sea. The opposite responses to the GNH and the GSH classification quantitatively show different impacts of interhemispherically asymmetric VAI, which was also reported in the African monsoon region (Haywood et al., 2013) and the global monsoon domain (Liu et al., 2016; Zuo et al., 2019a).
For spatial distributions of the temperature responses, Fig. 6 shows that, in the GNH classification, the strongest cooling emerges in the RDA, but slight cooling and warming emerge in different parts of the RWA. Oppositely, in the GSH classification, the strongest cooling appears in the RWA. When compared to the spatial pattern of PDSI, in the GNH classification (Fig. 6a), the area with the strongest wetting effect coincides with the strongest cooling effect in the RDA, while the driest area is identical to the area with the weakest warming effect in the RWA. This matching relationship between PDSI and temperature also exists in the GSH classification (Fig. 6b). This indicates a strong coupling between temperature variations and hydrological responses to volcanic eruptions.
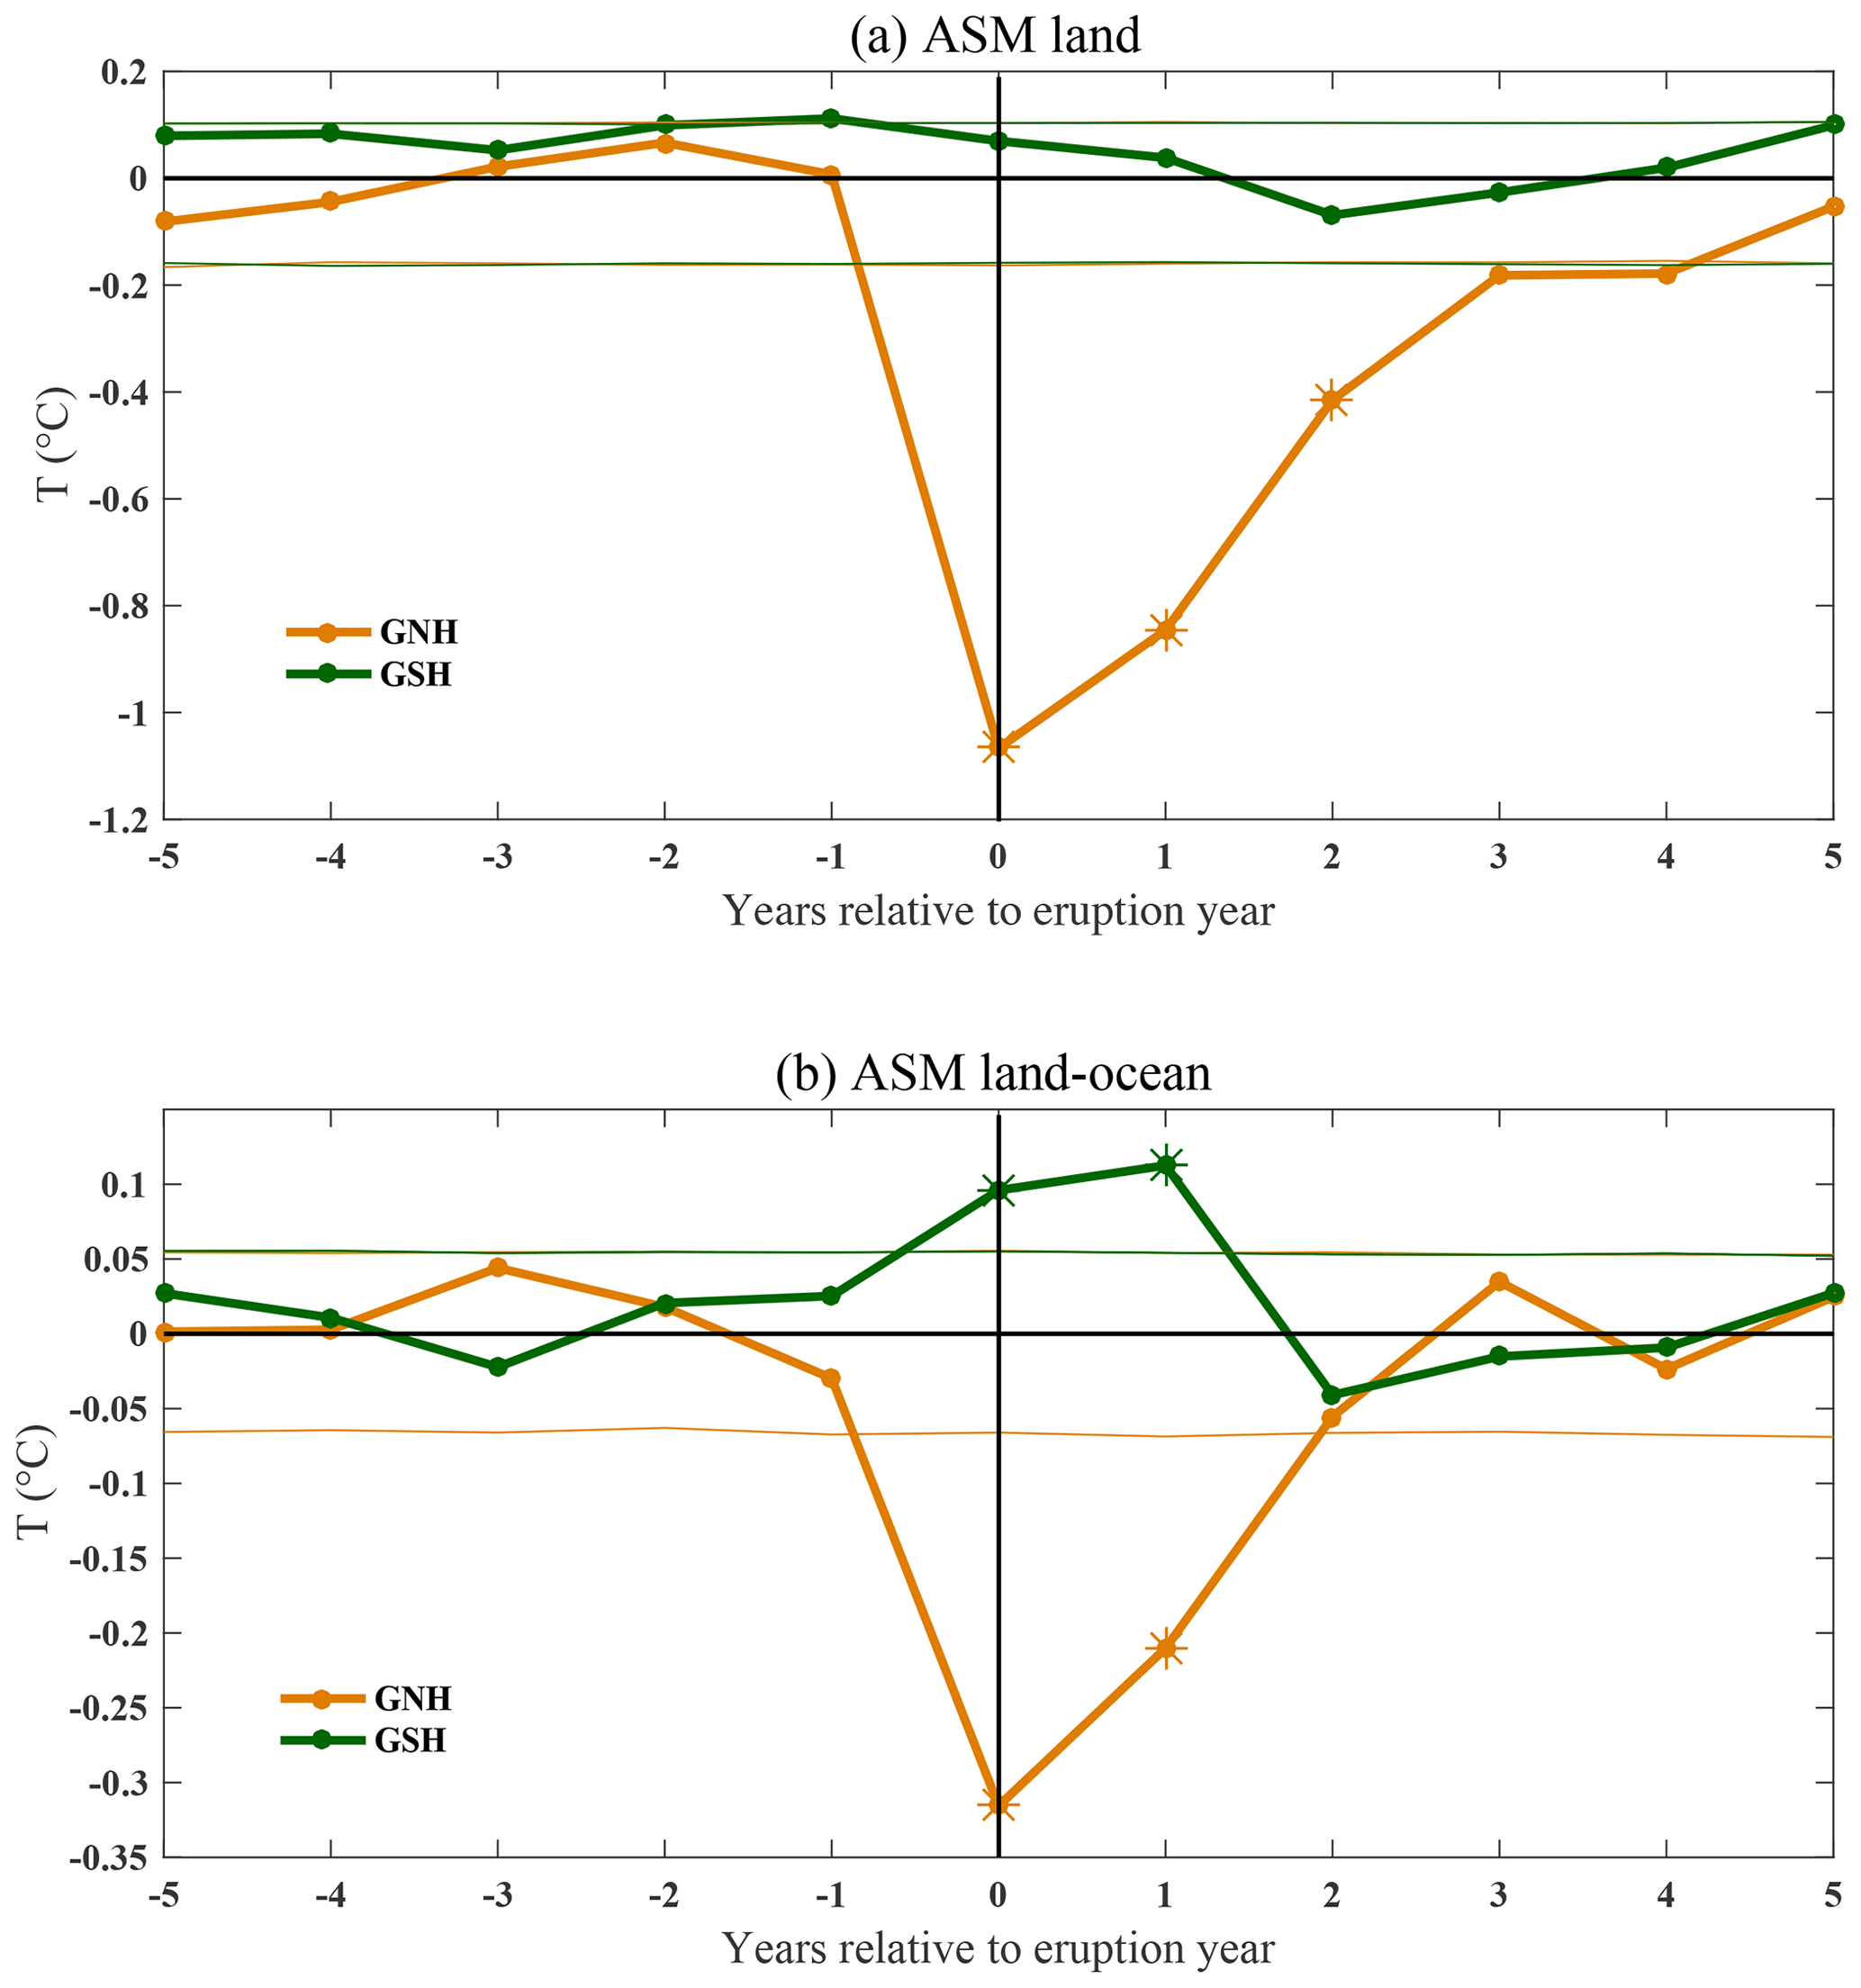
Figure 5Temporal SEA results of the summer (JJA) mean temperature (∘C) of land (a) and the difference between land and ocean (b) in the Asian monsoon region (land and ocean part is 8.75∘ S–56.25∘ N, 61.25–143.75∘ E). The thinner lines stand for the relative Monte Carlo model results at the 95 % confidence level. The asterisks represent the years that passed the Monte Carlo model tests at the 99 % confidence level. Year 0 represents the eruption year identified by the volcanic-forcing index, while negative and positive years represent relative years before and after the eruption.
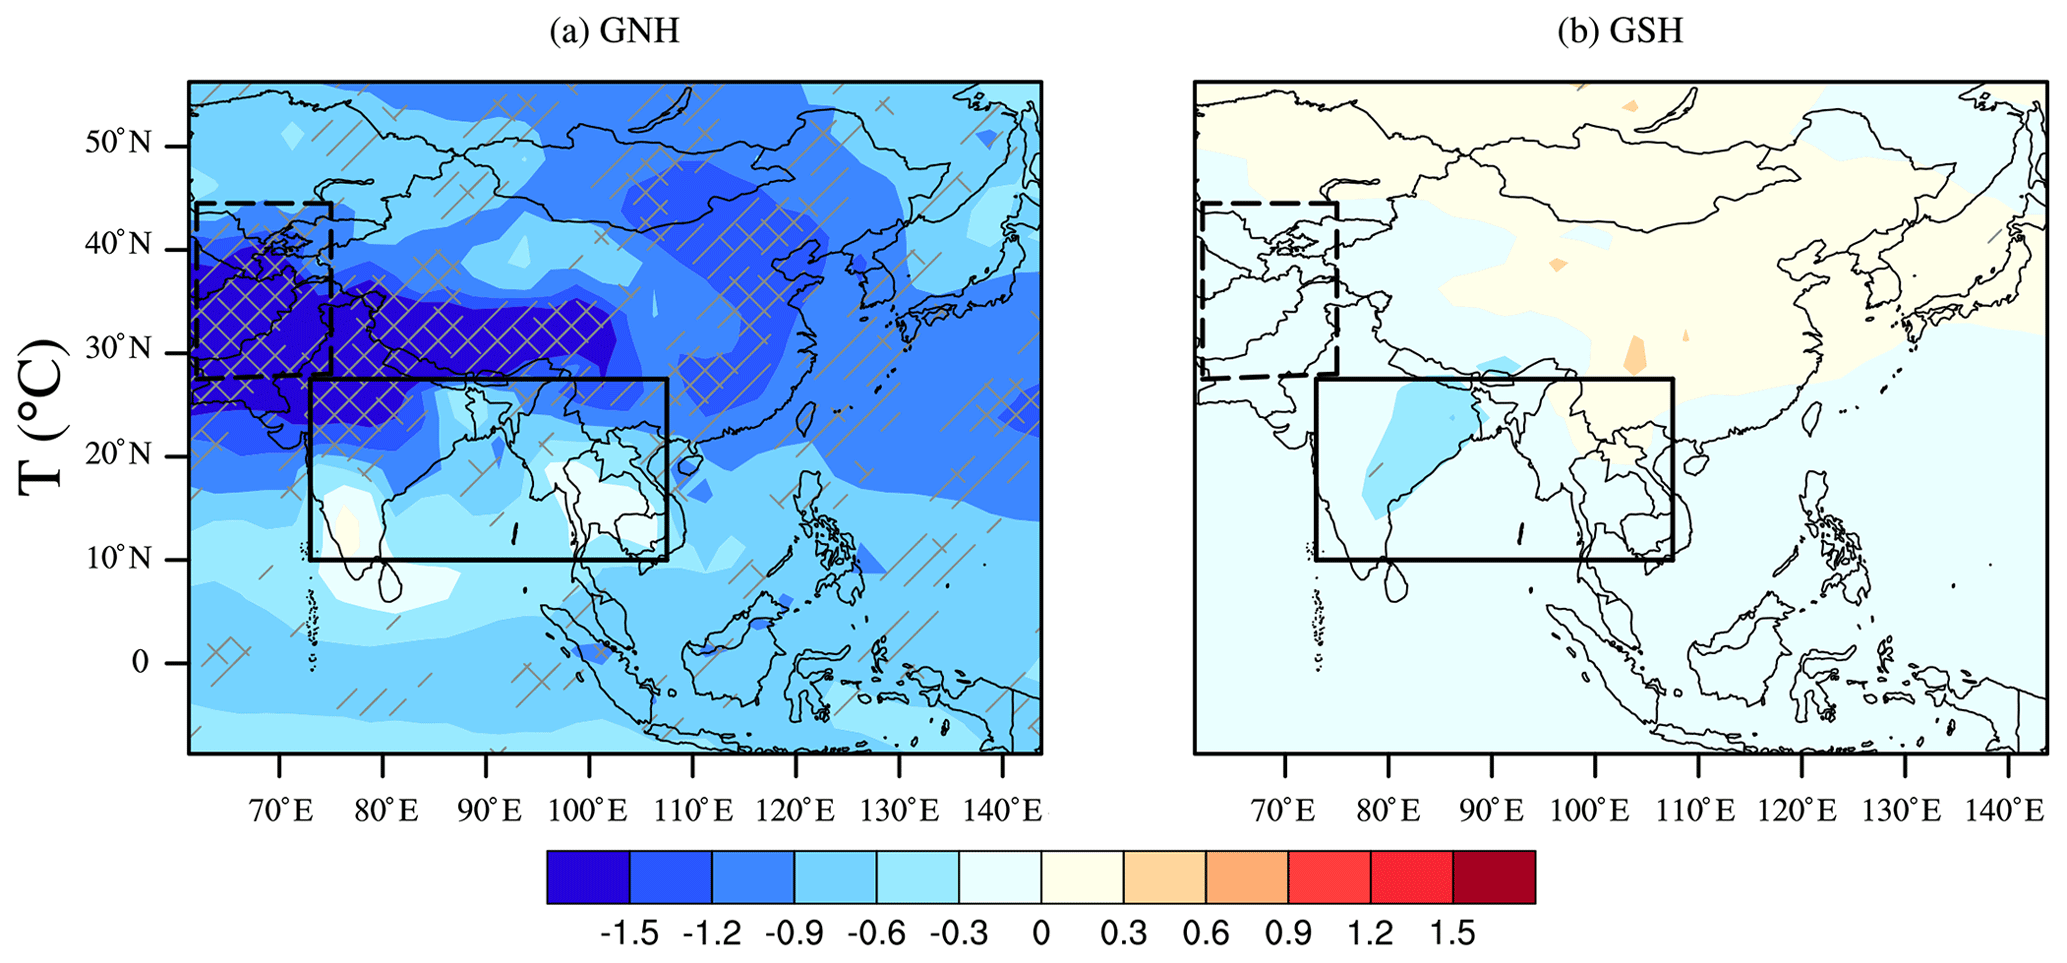
Figure 6Spatial distribution of the temperature anomalies in the eruption year with respect to the mean of 5 years before the eruption. The solid and dashed black boxes indicate the relatively wettest area (RWA) and relatively driest area (RDA), respectively, as shown in Fig. 1. The gray slashes and cross signs indicate the significant results at the 95 % and 99 % confidence levels.
Uneven temperature responses between the land and the ocean after volcanic eruptions (Figs. 5 and 6) lead to subsequent dynamical responses of the climate system. Here, we quantify summer monsoon circulation changes with the EASMI and the SASMI. In the GNH classification, the EASMI decreases significantly in year 0, and the significant anomaly lasts to year 3 (Fig. 7a); the SASMI also decreases significantly in year 0 and recovers until year 2 (Fig. 7b). This indicates a significant weakening of the EASM and the SASM. For the GSH classification, the EASMI does not show significant change, while a significant increase of the SASMI in year 0 indicates a strengthening of the SASM. The opposite weakening and strengthening of the SASM after different hemispheric VAIs is in agreement with the findings shown in Zhuo et al. (2021).
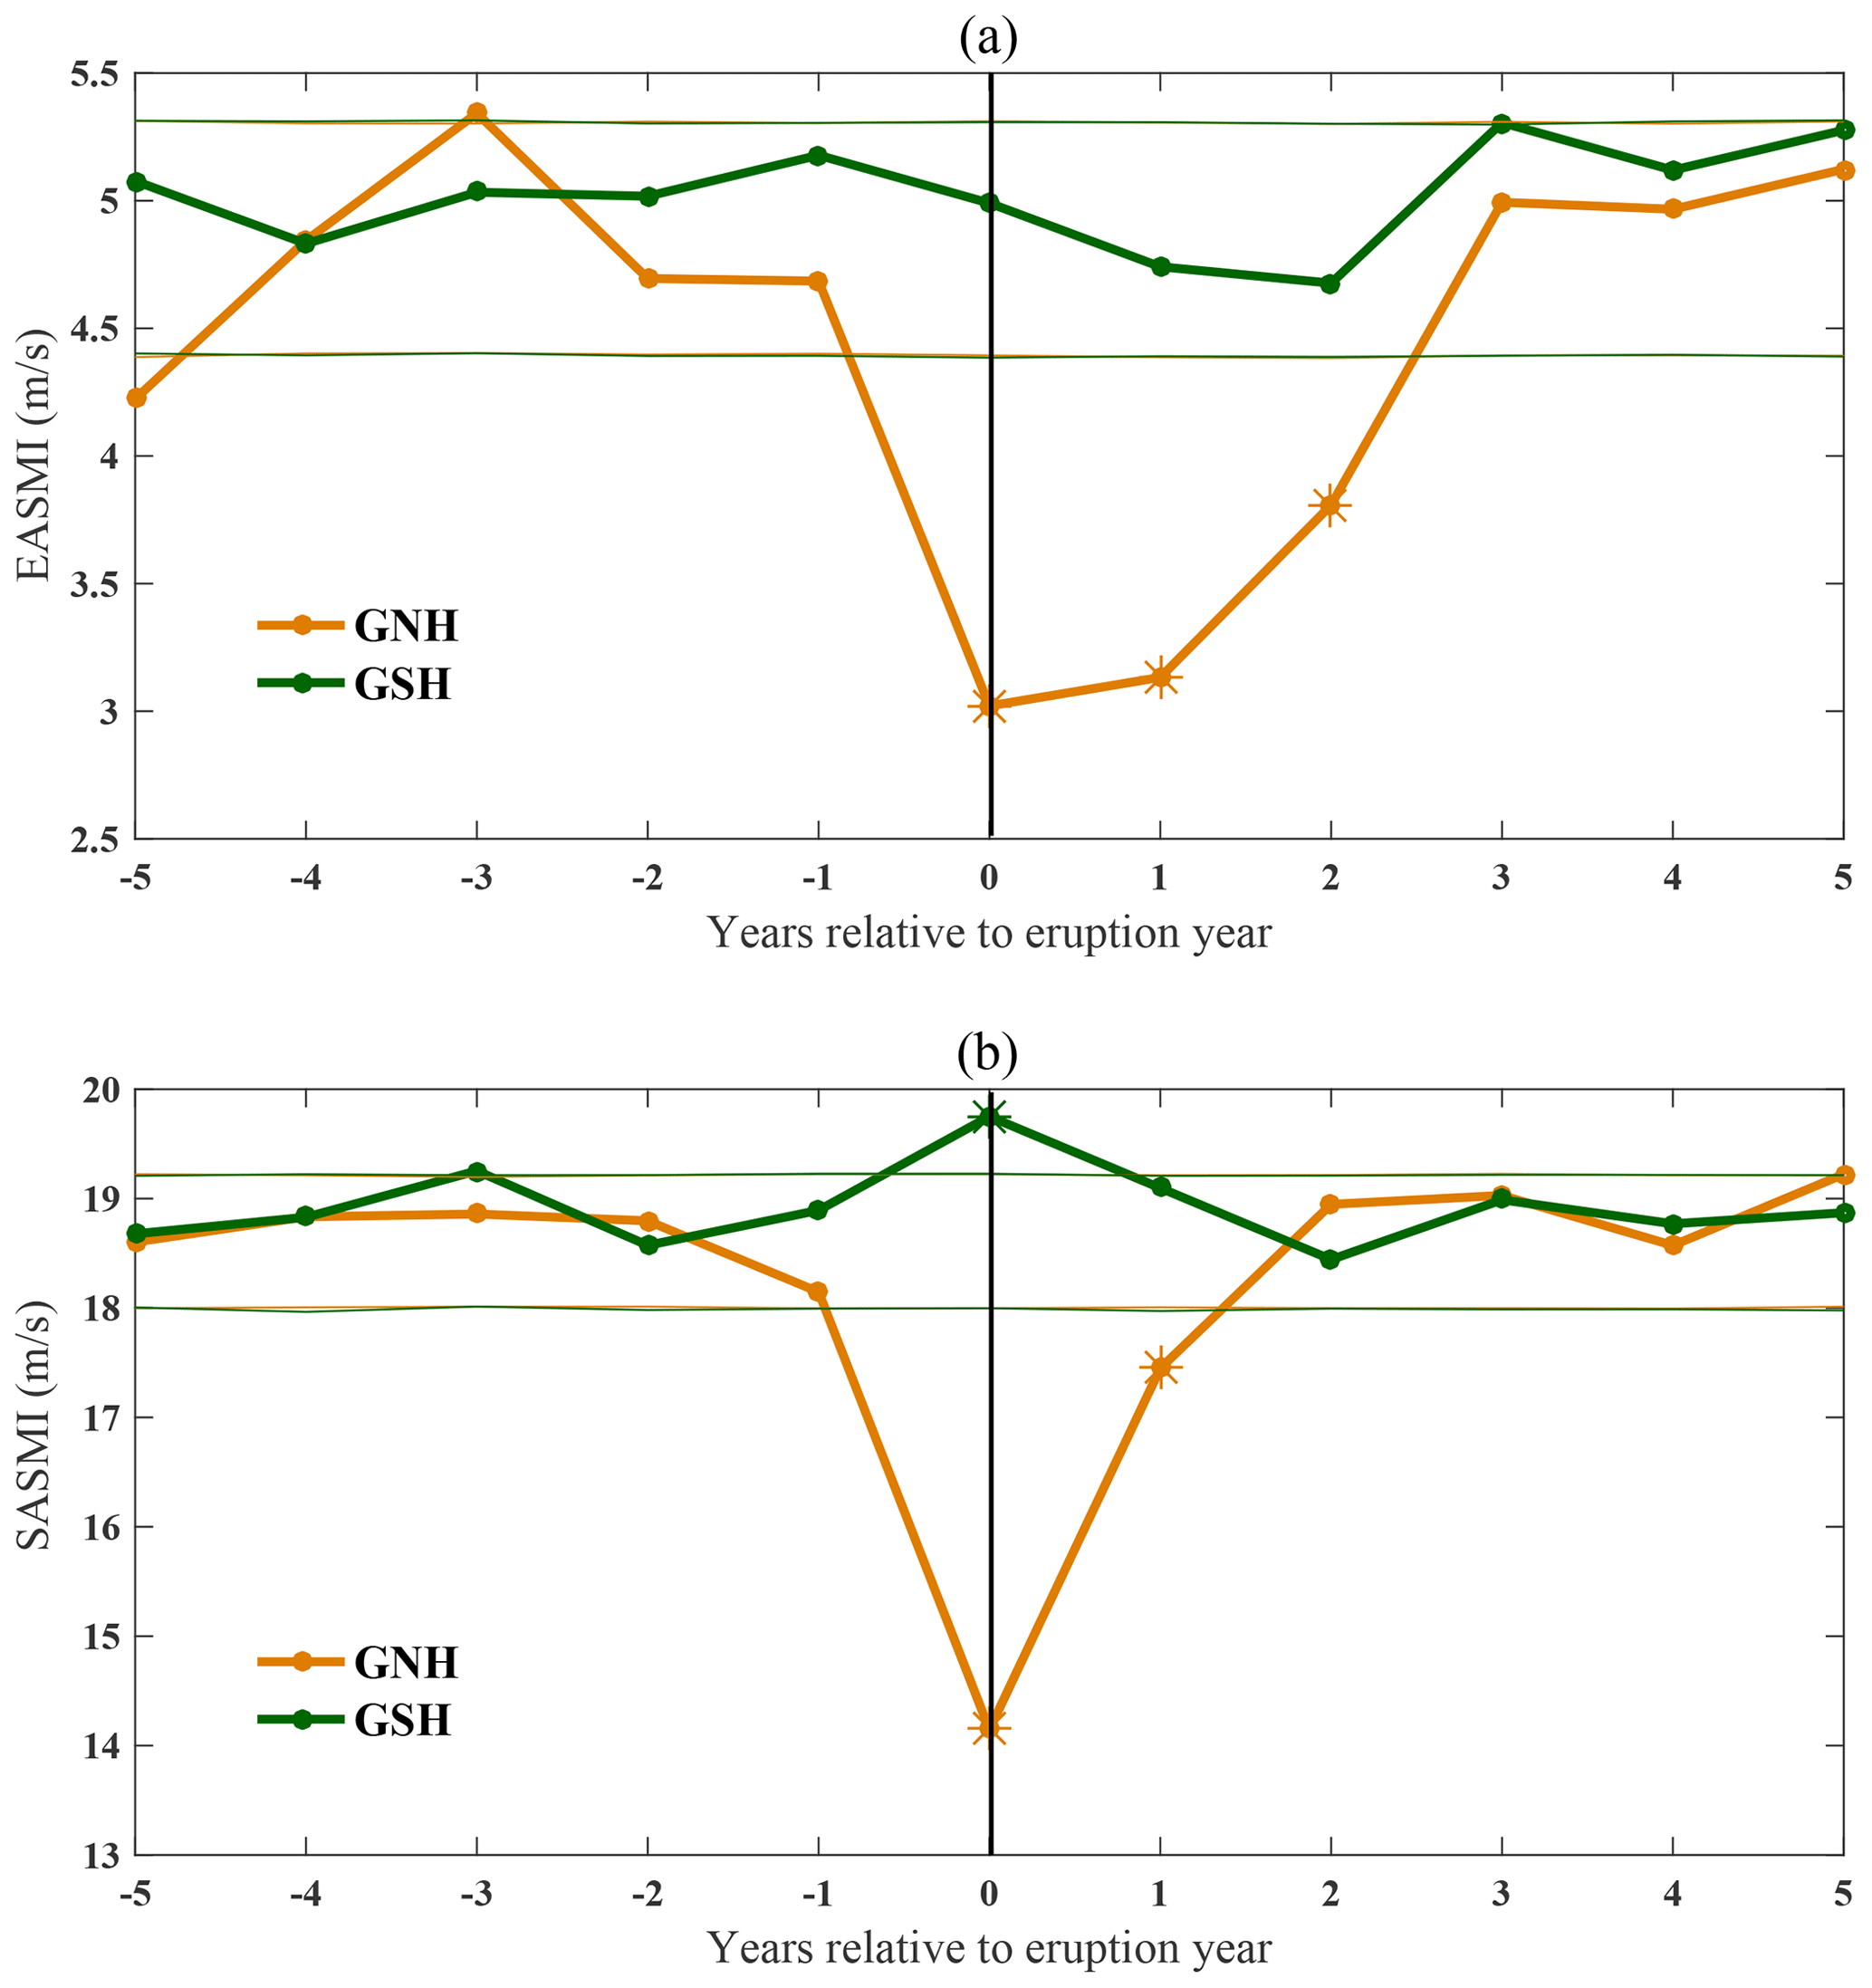
Figure 7Temporal SEA results of the East Asian summer monsoon index (EASMI; m s−1; a) and South Asian summer monsoon index (SASMI; m s−1; b) anomalies. The thinner lines stand for the Monte Carlo model results at the 95 % confidence level. The asterisks represent the years that passed the Monte Carlo model tests at the 99 % confidence level. Year 0 represents the eruption year identified by the GRA volcanic-forcing index, while negative and positive years represent relative years before and after the eruption.
Changes of the EASM and the SASM show the horizontal motion changes of the atmospheric circulation. The vertical motion changes of the atmospheric circulation are shown by the vertically integrated moisture transport (IVT – vector) and its divergence (IVTD – shaded) in Fig. 8. Before the volcanic eruptions, the southwest wind transports a large amount of moisture from the ocean to the monsoon-dominated subregion, and the RWA is a significant convergence area, while less moisture is transported by the northwest wind to the westerlies-dominated subregion, and the RDA is controlled by the divergence of moisture flux (Fig. 8a). After the NHVAI, moisture is transported from the ocean and adjacent eastern highlands by the southwest and east wind (Fig. 8b – vector) with a strengthened convergence in the RDA (Fig. 8b – shaded). This results in an enhanced amount and upward transport of moisture, which favors cloud formation and precipitation, and finally results in the significantly weakened aridity in this area (Fig. 4). In the RWA, the weakened southwest wind deceases moisture transport from the ocean to the land (Fig. 8b – vector), and a weakened convergence suppresses the upward transport of moisture (Fig. 8b – shaded). This leads to less cloud formation and precipitation and thus results in the significantly intensified aridity in this area (Fig. 4).

Figure 8JJA mean vertically integrated moisture transport (IVT – vector; kg m−1 s−1) and its divergence (IVTD – shaded; kg m−2 s−1) 5 years before the eruption (a; REF) and the anomalies in the eruption year of the GNH (b) and GSH (c) classifications. The gray dots in (b) and (c) mark the insignificant results at the 95 % confidence level. The scale of the wind arrow is shown in the green box in the top-right corner of the panel. Note that the scales of the colors and arrows are different between the top and bottom panels of the figure.
3.3.2 Physical feedbacks of local clouds
The dynamical response of the climate system after VAI leads to changes of cloud cover in different areas; this has corresponding physical feedbacks, which cause different temperature and precipitation variations in different areas. Volcanic sulfate aerosols in the stratosphere reflect solar radiation (SR) at the top of the atmosphere (TOA). In clear-sky conditions, without taking clouds into consideration, a significant increase of the TOA OSR indicates an increased reflection of SR after the NHVAI (Fig. 9a). The reflected SR is relatively homogeneous along the same latitude band but decreases from low latitudes to high latitudes in the Northern Hemisphere, and more SR is reflected in the RWA compared to in the RDA. This indicates the direct radiative effect of latitude-dependent volcanic aerosols. In comparison, limited variations of OSR emerge in the GSH classification (Fig. 9b), indicating a different pattern without NHVAI. However, the full-sky TOA OSR shows inhomogeneous distribution in different areas (Fig. 10). Specifically, a stronger reflection of SR emerges in the RDA (Fig. 10a), resulting in a stronger cooling in this area (Fig. 6a). Inconsistent changes of OSR occur in different parts (Fig. 10a), leading to inconsistent temperature changes, with slight cooling or warming in different parts of the RWA (Fig. 6a). The temperature responses in different areas reflect the impact of local clouds. As shown in Fig. 10, the cloud area fraction increases significantly in the RDA but decreases significantly in the RWA. The TOA OSR is different in the clear-sky condition compared to that in the full-sky condition, and the spatial variation of the full-sky TOA OSR is consistent with the spatial variations of temperature and cloud. These suggest that the regional surface temperature variation is not just due to the direct radiative effect of stratospheric volcanic aerosols but is more dominated by the radiative effect of the subsequently formed atmospheric clouds in different areas.
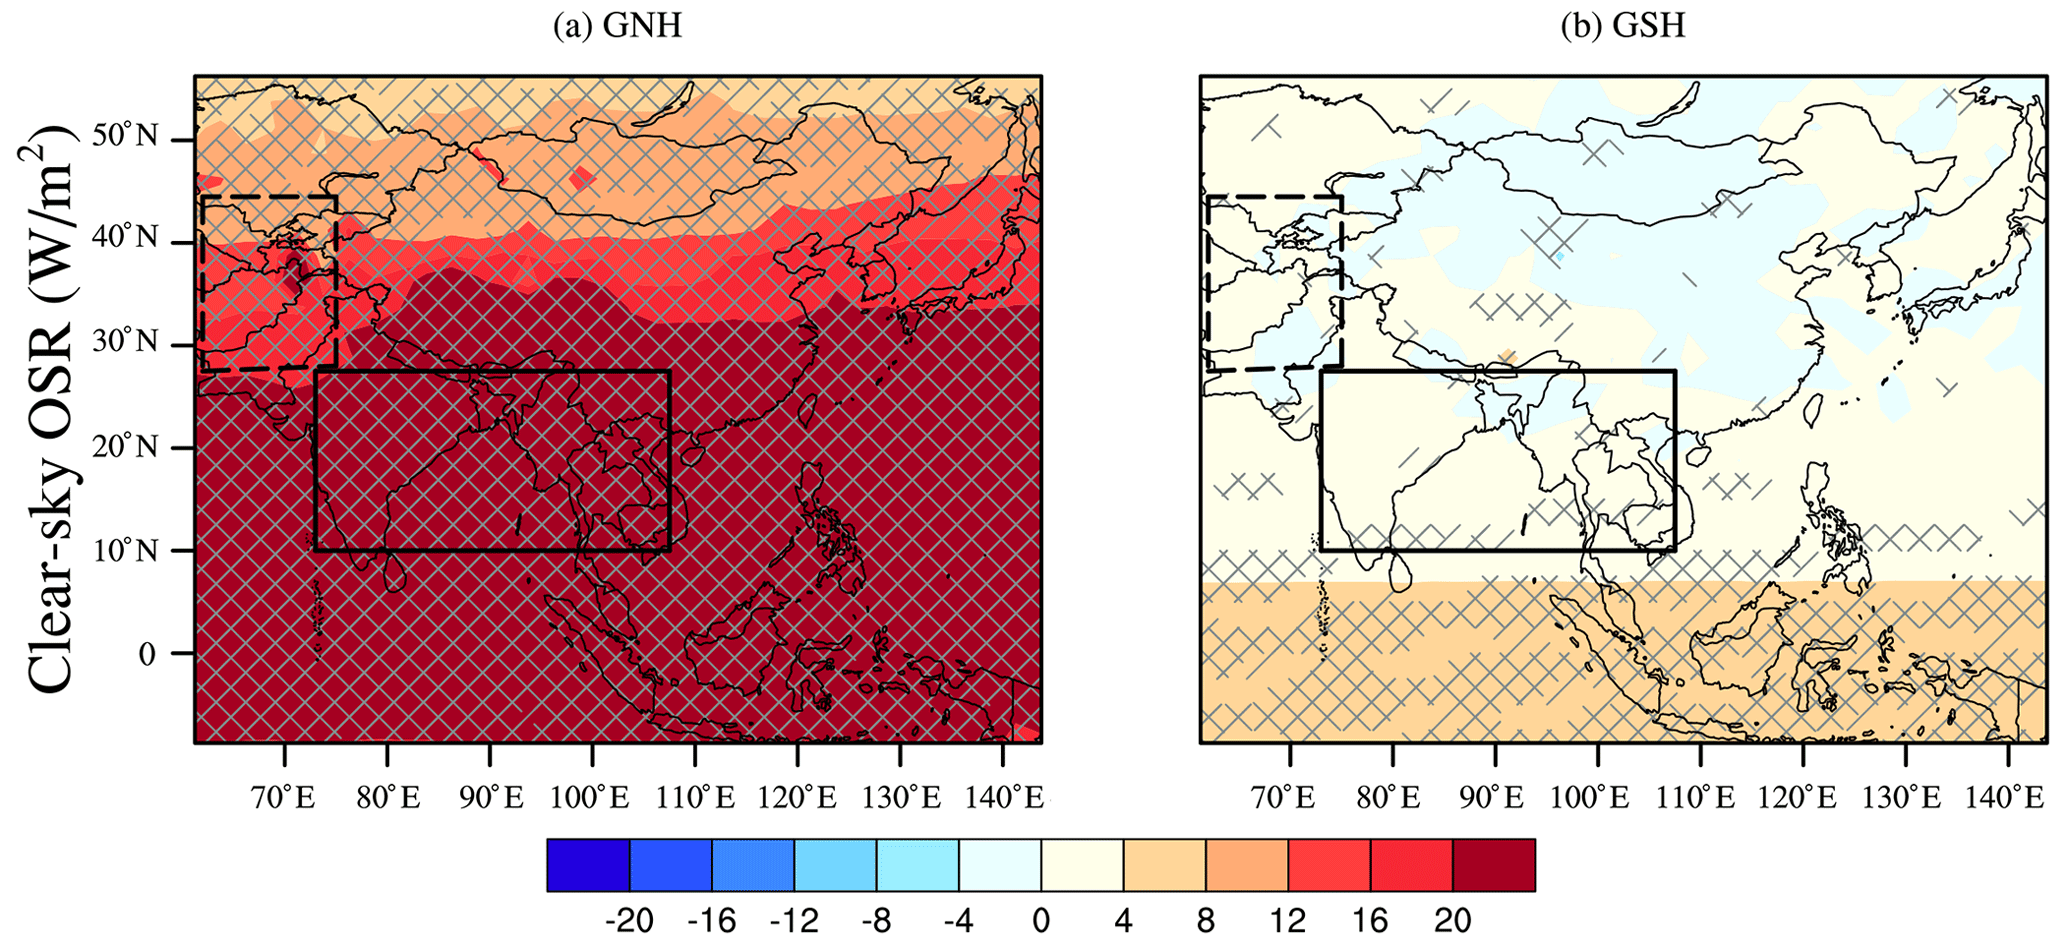
Figure 9Spatial distribution of top-of-the-atmosphere outgoing shortwave radiation (TOA OSR; W m−2) anomalies under clear-sky conditions in the eruption year with respect to the mean of 5 years before the eruption. The solid and dashed black boxes indicate the relatively wettest area (RWA) and the relatively driest area (RDA), respectively, as shown in Fig. 1. The gray slashes and cross signs indicate the significant results at the 95 % and 99 % confidence levels.
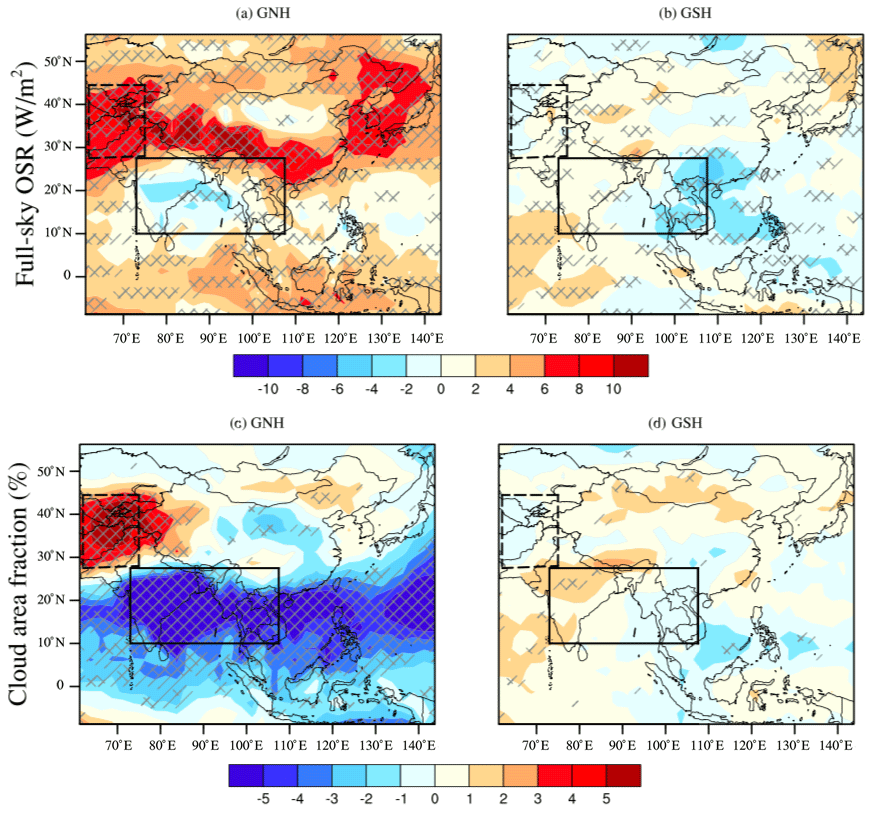
Figure 10Spatial distribution of top-of-the-atmosphere outgoing shortwave radiation (TOA OSR; W m−2; a, b) in full-sky and cloud area fraction (%; c, d) anomalies in the eruption year with respect to the mean of 5 years before the eruption. The solid and dashed black boxes indicate the relatively wettest area (RWA) and relatively driest area (RDA), respectively. The gray slashes and cross signs indicate the significant results at the 95 % and 99 % confidence levels.
The temperature variations further affect the hydrological process. Precipitation is closely related to evaporation (E) and relative humidity (RH; Table 1). The spatial pattern shows an increase of evaporation in the RDA but a significant decrease in the RWA. RH increases significantly in the RDA but decreases significantly in the RWA (Fig. 11a). The model follows the Clausius–Clapeyron relation, which connects these responses with the temperature variation. In the RDA, along with the cooling, the saturation humidity is decreased. The significant increase of the relative humidity results from the increase of the actual moisture content in the air, which favors the formation of more clouds and precipitation and results in the weakened aridity here. Oppositely, in the RWA, because of the temperature variation, the saturation humidity varies. The significant decrease of the relative humidity results from the decrease of the actual moisture content. This reduces the formation of local clouds and precipitation and results in the intensified aridity.
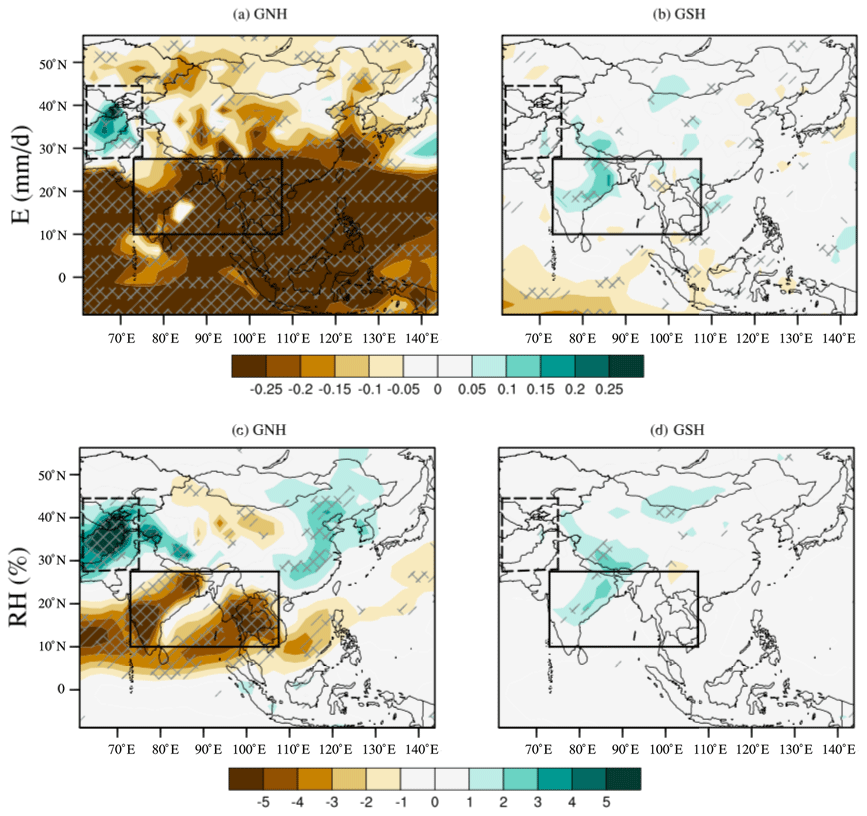
Figure 11Spatial distribution of evaporation (E; mm d−1; a, b) and relative humidity (RH; %; c, d) anomalies in the eruption year with respect to the mean of 5 years before the eruption. The solid and dashed black boxes indicate the relatively wettest area (RWA) and relatively driest area (RDA). The gray slashes and cross signs indicate the significant results at the 95 % and 99 % confidence levels.
3.3.3 Summary of the mechanism and discussion
Based on these results, the mechanism of the hydrological effects of NHVAI in these two representative areas of the monsoon and westerlies-dominated subregions can be summarized as follows: the direct radiative effect of stratospheric volcanic aerosols affects the atmospheric circulation. The decreased thermal contrast between the land and the ocean results in the weakened EASM and SASM. It changes the moisture transport and the formation of clouds in different areas. The subsequent radiative effect and physical feedback of the local cloud and moisture content lead to different aridity changes in different areas. Specifically, in the RDA, an increased moisture transport from the adjacent south and east areas, together with an enhanced upward motion, contributes to the formation of clouds and precipitation, which results in the weakened aridity here. In the RWA, the opposite intensified aridity results from a decreased moisture transport from the adjacent ocean to the land due to the weakened summer monsoon circulation and weakened upward motion.
Although the mechanism is mainly based on the analysis in the RWA and RDA, where the strongest impact of NHVAI emerges, similar response patterns can be seen in most of the areas but with a weaker amplitude. They, therefore, reflect the pervasive mechanism of the hydrological response to NHVAI in the monsoon and westerlies-dominated subregions.
Previous studies explored the mechanisms of precipitation responses to volcanic eruptions (Peng et al., 2010; Man et al., 2014; Iles et al., 2013; Zhuo et al., 2021; Zuo et al., 2019a; Iles and Hegerl, 2014). The reduction of monsoon precipitation results in the decreased land–sea thermal contrast and the subsequent weakening of summer monsoon circulation (Iles et al., 2013; Man et al., 2014; Zhuo et al., 2021; Zuo et al., 2019a). Our quantitative analysis confirms this in terms of the dynamical responses of the climate system to volcanic eruptions. The decrease of latent heat flux and evaporation over tropical oceans led to the reduction of the summer precipitation in eastern China (Peng et al., 2010). Zuo et al. (2019b) found a wetting response across arid regions, which is caused by the enhanced cross-Equator flow after VAI in the other hemisphere and the monsoon–desert coupling mechanism after VAI in the same hemisphere. This is well reflected by the moisture transport from the adjacent area to the RDA (Fig. 8). Joseph and Zeng (2011) found less cooling in areas near the Equator. The regional warming was suggested to be associated with the reduction of clouds, while less evaporation due to less precipitation further contributes to the regional warming. This indicates that regional temperature and precipitation responses relate to changes of local clouds. Our findings, based on both temporal and spatial analyses, show the importance of both the dynamical response and the physical feedback in terms of understanding the mechanisms of hydrological responses to NHVAI. The dynamical responses change the moisture transport and the formation of local clouds, and the subsequent radiative effect and physical feedbacks result in different temperature and hydrological responses in different areas. This agrees with Dogar and Sato (2019) in terms of the cloud reduction over the monsoon region and confirms that both dynamical and physical feedbacks are important to understanding regional climate responses to volcanic eruptions (Zhuo et al., 2021). As the first study to explore the mechanisms of different hydrological responses to volcanic eruptions in the monsoon and westerlies-dominated subregions, we give a comprehensive explanation of the mechanisms of different hydrological responses to volcanic eruptions in different areas of monsoon Asia.
3.4 Different hydrological responses to SHVAI
The above figures show a clear difference between the GNH and the GSH classification. In the GSH classification, oppositely, PDSI increases significantly 2 years after the SHVAI in the Asian monsoon region (Fig. 3), temperature decreases slightly over the land (Fig. 5a), and the land–sea thermal contrast increases significantly (Fig. 5b), suggesting a cooler effect over the ocean than over the land of the AMR. This contributes to an inverse dynamical response and the subsequent physical feedbacks of the local clouds and precipitation, as shown in the SASM region by most of the spatial patterns (Figs. 4b, 6b, 8c and 9b to 11b). The mechanisms of the hydrological responses, although inverse, still follow that summarized in Sect. 3.3.3. This further validates our explanation regarding the mechanisms of the hydrological responses to the NHVAI.
The volcanic classifications are based on the volcanic-forcing reconstruction (Gao et al., 2008) used in the CMIP5 model simulations (Schmidt et al., 2011), which only identified small aerosol magnitudes for the events in the GSH classification. The large difference in terms of aerosol magnitude between the GNH and the GSH classification brings uncertainty to the conclusion. The small magnitude of volcanic aerosols in the GSH classification has a limited climate effect. This makes it imperfect for comparison with the significant climate effect shown in the GNH classification. Despite this, results are in good agreement with previous studies. Zhuo et al. (2014), Liu et al. (2016) and Zuo et al. (2019a), based on different criteria of volcanic classifications, pointed out the inverse hydrological effects the asymmetric aerosol loadings may have on monsoon precipitation. Endeavors are also made to understand the mechanisms of the hydrological effects over global monsoon regions (Zuo et al., 2019a) and global arid regions (Zuo et al., 2019b). These studies were all based on volcanic classifications that include different magnitudes of volcanic aerosols and different numbers of volcanic events. Both can bring large uncertainties to their conclusions. Zhuo et al. (2021) avoided these uncertainties with the same aerosol magnitudes as the 1991 Pinatubo eruption being injected into different hemispheres in their sensitivity tests, which also show an inverse hydrological response to NHVAI and SHVAI that is mostly visible in the SASM region of monsoon Asia. With the same 12 volcanic events coincidentally included in the two classifications, results in this study provide valuable references, especially with regard to the significant difference between classifications with and without NHVAI.
We investigate the mechanism of the hydrological responses to volcanic eruptions in different regions of the AMR based on model outputs of PMIP3 and CMIP5. Hydrological patterns after NHVAI and SHVAI are shown with temporal and spatial analyses of PDSI. We use correlation analysis to identify key factors that closely relate to climate variation and compare their spatial patterns to study the mechanisms of the hydrological responses to volcanic eruptions in different regions of the AMR.
After the NHVAI, PDSI decreases significantly in the AMR in the eruption year, and this reduction lasts up to 3 years after the eruption. Regionally, it shows a weakened aridity in the southwestern part of the AMR, while an intensified aridity is concentrated in the southern Asian summer monsoon region, where the relatively driest area (RDA) and the relatively wettest area (RWA) are located. The response pattern is distinctly inverse to the climatological conditions, which may counteract the “wet gets wetter, dry gets drier” precipitation response pattern under global warming (Schurer et al., 2020).
We perform correlation analysis and spatial analyses of related variables to understand the mechanisms of the responses. Surface temperature is highly correlated with longwave and shortwave radiation, while precipitation is closely related to evaporation, latent heat flux and relative humidity in climate responses to volcanic eruptions. Spatial patterns of these variables show that, after NHVAI, temperature gradients decrease between the land and the ocean; this leads to a weakening of the EASM and SASM that alters the atmospheric circulation. This alters moisture transport and cloud formation processes in different regions. The different regional hydrological responses to volcanic eruptions result from the local physical feedbacks of atmospheric clouds, whose distributions are changed due to atmospheric circulation changes after aerosol injections. After NHVAI, stronger cooling emerges over the land than over the ocean. This decreases the land–ocean thermal contract and thus weakens the SASM and EASM. This decreases moisture transport from the ocean to the monsoon-dominated subregions, especially in the RWA, and, together with a suppressed vertical motion, results in the decrease of local cloud formation. Less cloud reflects less SR, which brings a local warming effect. This forms a positive physical feedback with decreased evaporation and relative humidity, thus leading to the local intensified aridity. Opposite to the RWA, shifted circulation transports more moisture from adjacent areas to the westerlies-dominated subregion and forms more clouds, especially over the RDA. This further decreases the shortwave radiation and brings a significant cooling in the RDA. The cooling and strengthened upward motion as a result of convergence favor condensation. This forms a positive feedback for more precipitation and causes the local weakened aridity.
In comparison to NHVAI, after SHVAI, an increased PDSI and an increased land–sea thermal contract are observed, and spatially, most variables show inverse responses, especially in the South Asian summer monsoon region. This indicates the different hydrological effects of different hemispheric VAIs. However, uncertainties exist with small volcanic aerosol magnitudes in the GSH classification; thus, we emphasize the different hydrological responses to classifications with and without NHVAI. Further studies on hydrological responses to SHVAI will contribute to a better understanding of the different hydrological impacts of different hemispheric VAIs. Future studies with PMIP4 and CMIP6 data (Jungclaus et al., 2017) and with updated volcanic-forcing reconstructions (Toohey and Sigl, 2017) can contribute to a better understanding of this topic. Except for forcing inputs, uncertainties in terms of the hydrological responses can also come from internal variability, especially, as discussed in Zhuo et al. (2020), the initial state of the El Niño–Southern Oscillation (ENSO) and its response to volcanic eruption. Studies tend towards a consensus on an El Niño tendency after tropical and NH volcanic eruptions (Khodri et al., 2017; Liu et al., 2022; Stevenson et al., 2016), but this can be an overestimation of the forced response relative to natural ENSO variability (Dee et al., 2020). The disagreement may result from different initial states of ENSO used in different studies. Through analyzing the model output from the Model Intercomparison Project on the climatic response to Volcanic forcing (VolMIP; Zanchettin et al., 2016), Zanchettin et al. (2022) found that the pre-condition of ENSO impacts temperature and precipitation responses after volcanic eruptions. This points out the importance of investigating the dependency of post-eruption ENSO and hydrological responses to pre-eruption initial conditions. More studies are also needed to understand the ENSO response to SH volcanic eruptions. Besides, the interaction between post-eruption ENSO and monsoon precipitation varies in different monsoon regions. A weakened African monsoon due to post-eruption cooling in Africa leads to the El Niño response after tropical eruptions (Khodri et al., 2017), but a more frequent occurrence of El Niño in the first boreal winter after eruptions leads to an enhanced EASM (Liu et al., 2022). The interaction among ENSO, monsoon and volcanic eruptions remains unclear. The VolMIP (Zanchettin et al., 2016) and its potential future phases, with improved protocols addressing the pre-eruption ENSO state (Zanchettin et al., 2022), can be valuable resources for investigating these questions.
Results in this study show the opposite hydrological impacts of volcanic eruptions in the driest and wettest areas of the AMR and shed light on the mechanisms of the hydrological impact in the westerlies and monsoon-dominated subregions of Asia. Future volcanic eruptions might temporarily alleviate the uneven hydrological condition that exists between the driest and the wettest area of the AMR. This should be considered in the design of near-term climate predictions and future strategies of local adaptation to global warming. These results can also act as a reference to the local hydrological impact of stratospheric aerosol engineering (Simpson et al., 2019) and related mechanisms.
The post-processing and visualization of data were performed with CDO (https://code.mpimet.mpg.de/projects/cdo, last access: 20 April 2023, https://doi.org/10.5281/zenodo.7112925, Schulzweida, 2022) and batch scripts. The scripts are available on request from the corresponding author.
The PMIP3 and CMIP5 data used in this study are from the Deutsche Klimarechenzentrum (DKRZ, https://www.dkrz.de/, last access: 6 December 2021) and can be downloaded from the ESGF portal (https://esgf-data.dkrz.de/search/cmip5-dkrz/, last access: 20 April 2023).
ZZ designed the study, analyzed the results and wrote the paper. IK and UC supervised and provided support for designing the study. IK provided support for the analysis. All the authors contributed to revising the paper.
The contact author has declared that none of the authors has any competing interests.
Publisher’s note: Copernicus Publications remains neutral with regard to jurisdictional claims in published maps and institutional affiliations.
This article is part of the special issue “Interdisciplinary studies of volcanic impacts on climate and society”. It is not associated with a conference.
The authors acknowledge the climate modeling groups listed in Fig. 2 for producing and making their model outputs available, and the authors acknowledge the German Climate Computing Center (DKRZ, https://www.dkrz.de/, last access: 6 December 2021) for making the CMIP5 output and computational resources available. We would like to thank the reviewers, Fei Liu and another anonymous reviewer, for their helpful and constructive comments.
This research has been supported by the China Scholarship Council (grant no. 201506320225).
We acknowledge support from the Open Access Publication Initiative of Freie Universität Berlin.
This paper was edited by Marit-Solveig Seidenkrantz and Allegra N. LeGrande and reviewed by Fei Liu and one anonymous referee.
Adams, J. B., Mann, M. E., and Ammann, C. M.: Proxy evidence for an El Niño-like response to volcanic forcing, Nature, 426, 274–278, https://doi.org/10.1038/nature02101, 2003. a, b, c
Anchukaitis, K. J., Buckley, B. M., Cook, E. R., Cook, B. I., D'Arrigo, R. D., and Ammann, C. M.: Influence of volcanic eruptions on the climate of the Asian monsoon region, Geophys. Res. Lett., 37, L22703, https://doi.org/10.1029/2010gl044843, 2010. a
Chen, F., Yu, Z., Yang, M., Ito, E., Wang, S., Madsen, D. B., Huang, X., Zhao, Y., Sato, T., John B. Birks, H., Boomer, I., Chen, J., An, C., and Wünnemann, B.: Holocene moisture evolution in arid central Asia and its out-of-phase relationship with Asian monsoon history, Quaternary Sci. Rev., 27, 351–364, https://doi.org/10.1016/j.quascirev.2007.10.017, 2008. a, b, c
Chiang, J. C. H., Swenson, L. M., and Kong, W.: Role of seasonal transitions and the westerlies in the interannual variability of the East Asian summer monsoon precipitation, Geophys. Res. Lett., 44, 3788–3795, https://doi.org/10.1002/2017gl072739, 2017. a
Colose, C. M., LeGrande, A. N., and Vuille, M.: Hemispherically asymmetric volcanic forcing of tropical hydroclimate during the last millennium, Earth Syst. Dynam., 7, 681–696, https://doi.org/10.5194/esd-7-681-2016, 2016. a, b
Cook, E. R., Anchukaitis, K. J., Buckley, B. M., D'Arrigo, R. D., Jacoby, G. C., and Wright, W. E.: Asian monsoon failure and megadrought during the last millennium, Science, 328, 486–489, https://doi.org/10.1126/science.1185188, 2010. a
Crowley, T. J., ZieLinsKi, G., Vinther, B., Udisti, R., Kreutz, K., Cole-Dai, J., and Castellano, E.: Volcanism and the Little Ice Age, PAGES news, 16, 22–23, https://doi.org/10.22498/pages.16.2.22, 2008. a
Dando, W. A.: Asia, Climates of Siberia, Central and East Asia, 102–114, Springer Netherlands, Dordrecht, https://doi.org/10.1007/1-4020-3266-8_19, 2005. a, b
Dee, S. G., Cobb, K. M., Emile-Geay, J., Ault, T. R., Edwards, R. L., Cheng, H., and Charles, C. D.: No consistent ENSO response to volcanic forcing over the last millennium, Science, 367, 1477–1481, https://doi.org/10.1126/science.aax2000, 2020. a
Dogar, M. M. and Sato, T.: Regional Climate Response of Middle Eastern, African, and South Asian Monsoon Regions to Explosive Volcanism and ENSO Forcing, J. Geophys. Res.-Atmos., 124, 7580–7598, https://doi.org/10.1029/2019JD030358, 2019. a, b
Gao, C. and Gao, Y.: Revisited Asian Monsoon Hydroclimate Response to Volcanic Eruptions, J. Geophys. Res., 123, 7883–7896, https://doi.org/10.1029/2017JD027907, 2018. a
Gao, C., Robock, A., and Ammann, C.: Volcanic forcing of climate over the past 1500 years: An improved ice core-based index for climate models, J. Geophys. Res., 113, D23111, https://doi.org/10.1029/2008jd010239, 2008. a, b, c
Haurwitz, M. W. and Brier, G. W.: A Critique of the Superposed Epoch Analysis Method: Its Application to Solar–Weather Relations, Mon. Weather Rev., 109, 2074–2079, https://doi.org/10.1175/1520-0493(1981)109<2074:ACOTSE>2.0.CO;2, 1981. a
Haywood, J. M., Jones, A., Bellouin, N., and Stephenson, D.: Asymmetric forcing from stratospheric aerosols impacts Sahelian rainfall, Nat. Clim. Change, 3, 660–665, https://doi.org/10.1038/nclimate1857, 2013. a, b, c, d
Iles, C. E. and Hegerl, G. C.: The global precipitation response to volcanic eruptions in the CMIP5 models, Environ. Res. Lett., 9, 104012, https://doi.org/10.1088/1748-9326/9/10/104012, 2014. a, b, c, d, e
Iles, C. E., Hegerl, G. C., Schurer, A. P., and Zhang, X.: The effect of volcanic eruptions on global precipitation, J. Geophys. Res.-Atmos., 118, 8770–8786, https://doi.org/10.1002/jgrd.50678, 2013. a, b
Jacobi, J., Perrone, D., Duncan, L. L., and Hornberger, G.: A tool for calculating the Palmer drought indices, Water Resour. Res., 49, 6086–6089, https://doi.org/10.1002/wrcr.20342, 2013. a
Joseph, R. and Zeng, N.: Seasonally Modulated Tropical Drought Induced by Volcanic Aerosol, J. Climate, 24, 2045–2060, https://doi.org/10.1175/2009jcli3170.1, 2011. a
Jungclaus, J. H., Bard, E., Baroni, M., Braconnot, P., Cao, J., Chini, L. P., Egorova, T., Evans, M., González-Rouco, J. F., Goosse, H., Hurtt, G. C., Joos, F., Kaplan, J. O., Khodri, M., Klein Goldewijk, K., Krivova, N., LeGrande, A. N., Lorenz, S. J., Luterbacher, J., Man, W., Maycock, A. C., Meinshausen, M., Moberg, A., Muscheler, R., Nehrbass-Ahles, C., Otto-Bliesner, B. I., Phipps, S. J., Pongratz, J., Rozanov, E., Schmidt, G. A., Schmidt, H., Schmutz, W., Schurer, A., Shapiro, A. I., Sigl, M., Smerdon, J. E., Solanki, S. K., Timmreck, C., Toohey, M., Usoskin, I. G., Wagner, S., Wu, C.-J., Yeo, K. L., Zanchettin, D., Zhang, Q., and Zorita, E.: The PMIP4 contribution to CMIP6 – Part 3: The last millennium, scientific objective, and experimental design for the PMIP4 past1000 simulations, Geosci. Model Dev., 10, 4005–4033, https://doi.org/10.5194/gmd-10-4005-2017, 2017. a
Khodri, M., Izumo, T., Vialard, J., Janicot, S., Cassou, C., Lengaigne, M., Mignot, J., Gastineau, G., Guilyardi, E., Lebas, N., Robock, A., and McPhaden, M. J.: Tropical explosive volcanic eruptions can trigger El Niño by cooling tropical Africa, Nat. Commun., 8, 778, https://doi.org/10.1038/s41467-017-00755-6, 2017. a, b
Liu, F., Chai, J., Wang, B., Liu, J., Zhang, X., and Wang, Z.: Global monsoon precipitation responses to large volcanic eruptions, Sci. Rep., 6, 24331, https://doi.org/10.1038/srep24331, 2016. a, b, c, d, e, f
Liu, F., Gao, C., Chai, J., Robock, A., Wang, B., Li, J., Zhang, X., Huang, G., and Dong, W.: Tropical volcanism enhanced the East Asian summer monsoon during the last millennium, Nat. Commun., 13, 3429, https://doi.org/10.1038/s41467-022-31108-7, 2022. a, b
Man, W. and Zhou, T.: Response of the East Asian summer monsoon to large volcanic eruptions during the last millennium, Chinese Sci. Bull., 59, 4123–4129, 2014. a, b, c
Man, W., Zhou, T., and Jungclaus, J. H.: Effects of Large Volcanic Eruptions on Global Summer Climate and East Asian Monsoon Changes during the Last Millennium: Analysis of MPI-ESM Simulations, J. Climate, 27, 7394–7409, https://doi.org/10.1175/jcli-d-13-00739.1, 2014. a, b, c, d, e
Palmer, W. C.: Meteorological Drought, Weather Bureau, 45, 1–58, 1965. a
Peng, Y., Shen, C., Wang, W.-C., and Xu, Y.: Response of Summer Precipitation over Eastern China to Large Volcanic Eruptions, J. Climate, 23, 818–824, 2010. a, b, c
Robock, A.: Volcanic eruptions and climate, Rev. Geophys., 38, 191–219, 2000. a
Robock, A.: Pinatubo eruption. The climatic aftermath, Science, 295, 1242–12424, https://doi.org/10.1126/science.1069903, 2002. a
Schmidt, G. A., Jungclaus, J. H., Ammann, C. M., Bard, E., Braconnot, P., Crowley, T. J., Delaygue, G., Joos, F., Krivova, N. A., Muscheler, R., Otto-Bliesner, B. L., Pongratz, J., Shindell, D. T., Solanki, S. K., Steinhilber, F., and Vieira, L. E. A.: Climate forcing reconstructions for use in PMIP simulations of the last millennium (v1.0), Geosci. Model Dev., 4, 33–45, https://doi.org/10.5194/gmd-4-33-2011, 2011. a, b
Schulzweida, U.: CDO User Guide (2.1.0), Zenodo [code], https://doi.org/10.5281/zenodo.7112925, 2022. a
Schurer, A. P., Ballinger, A. P., Friedman, A. R., and Hegerl, G. C.: Human influence strengthens the contrast between tropical wet and dry regions, Environ. Res. Lett., 15, 104026, https://doi.org/10.1088/1748-9326/ab83ab, 2020. a, b
Simpson, I. R., Tilmes, S., Richter, J. H., Kravitz, B., MacMartin, D. G., Mills, M. J., Fasullo, J. T., and Pendergrass, A. G.: The Regional Hydroclimate Response to Stratospheric Sulfate Geoengineering and the Role of Stratospheric Heating, J. Geophys. Res.-Atmos., 124, 12587–12616, https://doi.org/10.1029/2019JD031093, 2019. a
Stevenson, S., Otto-Bliesner, B., Fasullo, J., and Brady, E.: “El Niño Like” Hydroclimate Responses to Last Millennium Volcanic Eruptions, J. Climate, 29, 2907–2921, https://doi.org/10.1175/jcli-d-15-0239.1, 2016. a
Timmreck, C.: Modeling the climatic effects of large explosive volcanic eruptions, WIRES Clim. Change, 3, 545–564, https://doi.org/10.1002/wcc.192, 2012. a, b
Toohey, M. and Sigl, M.: Volcanic stratospheric sulfur injections and aerosol optical depth from 500 BCE to 1900 CE, Earth Syst. Sci. Data, 9, 809–831, https://doi.org/10.5194/essd-9-809-2017, 2017. a
Toohey, M., Krüger, K., Schmidt, H., Timmreck, C., Sigl, M., Stoffel, M., and Wilson, R.: Disproportionately strong climate forcing from extratropical explosive volcanic eruptions, Nat. Geosci., 12, 100–107, https://doi.org/10.1038/s41561-018-0286-2, 2019. a
Trenberth, K. E. and Dai, A.: Effects of Mount Pinatubo volcanic eruption on the hydrological cycle as an analog of geoengineering, Geophys. Res. Lett., 34, L15702, https://doi.org/10.1029/2007gl030524, 2007. a, b
Wang, B. and Fan, Z.: Choice of South Asian Summer Monsoon Indices, B. Am. Meteorol. Soc., 80, 629–638, 1999. a
Wang, B., Wu, Z., Li, J., Liu, J., Chang, C.-P., Ding, Y., and Wu, G.: How to Measure the Strength of the East Asian Summer Monsoon, J. Climate, 21, 4449–4463, https://doi.org/10.1175/2008jcli2183.1, 2008. a
Wang, P., Clemens, S., Beaufort, L., Braconnot, P., Ganssen, G., Jian, Z., Kershaw, P., and Sarnthein, M.: Evolution and variability of the Asian monsoon system: state of the art and outstanding issues, Quaternary Sci. Rev., 24, 595–629, https://doi.org/10.1016/j.quascirev.2004.10.002, 2005. a
Webb, R., Rosenzweig, C., and Levine, E.: Global Soil Texture and Derived Water-Holding Capacities (Webb et al.), The Oak Ridge National Laboratory Distributed Active Archive Center (ORNL DAAC) [data set], https://doi.org/10.3334/ORNLDAAC/548, 2000. a
Webster, P. J. and Yang, S.: Monsoon and ENSO: Selectively interactive systems, Q. J. Roy. Meteor. Soc., 118, 877–926, 1992. a
Yang, W., Gabriel A., Vecchi Stephan, F., Larry W., H., David J., L., Ãngel G., M., David, P., and Seth, U.: Climate Impacts From Large Volcanic Eruptions in a High-Resolution Climate Model: The Importance of Forcing Structure, Geophys. Res. Lett., 46, 7690–7699, https://doi.org/10.1029/2019GL082367, 2019. a
Zambri, B. and Robock, A.: Winter warming and summer monsoon reduction after volcanic eruptions in Coupled Model Intercomparison Project 5 (CMIP5) simulation, Geophys. Res. Lett., 43, 10920–10928, https://doi.org/10.1002/2016GL070460, 2016. a, b
Zanchettin, D., Khodri, M., Timmreck, C., Toohey, M., Schmidt, A., Gerber, E. P., Hegerl, G., Robock, A., Pausata, F. S. R., Ball, W. T., Bauer, S. E., Bekki, S., Dhomse, S. S., LeGrande, A. N., Mann, G. W., Marshall, L., Mills, M., Marchand, M., Niemeier, U., Poulain, V., Rozanov, E., Rubino, A., Stenke, A., Tsigaridis, K., and Tummon, F.: The Model Intercomparison Project on the climatic response to Volcanic forcing (VolMIP): experimental design and forcing input data for CMIP6, Geosci. Model Dev., 9, 2701–2719, https://doi.org/10.5194/gmd-9-2701-2016, 2016. a, b
Zanchettin, D., Timmreck, C., Khodri, M., Schmidt, A., Toohey, M., Abe, M., Bekki, S., Cole, J., Fang, S.-W., Feng, W., Hegerl, G., Johnson, B., Lebas, N., LeGrande, A. N., Mann, G. W., Marshall, L., Rieger, L., Robock, A., Rubinetti, S., Tsigaridis, K., and Weierbach, H.: Effects of forcing differences and initial conditions on inter-model agreement in the VolMIP volc-pinatubo-full experiment, Geosci. Model Dev., 15, 2265–2292, https://doi.org/10.5194/gmd-15-2265-2022, 2022. a, b
Zhuo, Z., Gao, C., and Pan, Y.: Proxy Evidence for China's Monsoon Precipitation Response to Volcanic Aerosols over the Past Seven Centuries, J. Geophys. Res., 119, 6638–6652, https://doi.org/10.1002/2013JD021061, 2014. a, b, c, d, e
Zhuo, Z., Gao, C., Kirchner, I., and Cubasch, U.: Impact of Volcanic Aerosols on the Hydrology of the Asian Monsoon and Westerlies‐Dominated Subregions: Comparison of Proxy and Multimodel Ensemble Means, J. Geophys. Res.-Atmos., 125, e2020JD032831, https://doi.org/10.1029/2020jd032831, 2020. a, b, c, d, e, f, g, h
Zhuo, Z., Kirchner, I., Pfahl, S., and Cubasch, U.: Climate impact of volcanic eruptions: the sensitivity to eruption season and latitude in MPI-ESM ensemble experiments, Atmos. Chem. Phys., 21, 13425–13442, https://doi.org/10.5194/acp-21-13425-2021, 2021. a, b, c, d, e, f, g, h, i, j, k, l
Zuo, M., Zhou, T., and Man, W.: Hydroclimate Responses over Global Monsoon Regions Following Volcanic Eruptions at Different Latitudes, J. Climate, 32, 4367–4385, https://doi.org/10.1175/jcli-d-18-0707.1, 2019a. a, b, c, d, e, f, g, h
Zuo, M., Zhou, T., and Man, W.: Wetter Global Arid Regions Driven by Volcanic Eruptions, J. Geophys. Res.-Atmos., 124, 13648–13662, https://doi.org/10.1029/2019jd031171, 2019b. a, b, c, d, e, f