the Creative Commons Attribution 4.0 License.
the Creative Commons Attribution 4.0 License.
 | 23 Mar 2023
Asymmetric changes in temperature in the Arctic during the Holocene based on a transient run with the Community Earth System Model (CESM)
Hongyue Zhang
Zhengyao Lu
Weiyi Sun
Lingfeng Wan
The Arctic temperature changes are closely linked to midlatitude weather variability and extreme events, which has attracted much attention in recent decades. Syntheses of proxy data from poleward of 60∘ N indicate that there was asymmetric cooling of −1.54 and −0.61 ∘C for the Atlantic Arctic and the Pacific Arctic during the Holocene, respectively. We also present a similar consistent cooling pattern from an accelerated transient Holocene climate simulation based on the Community Earth System Model. Our results indicate that the asymmetric Holocene Arctic cooling trend is dominated by the winter temperature variability, with −0.67 ∘C cooling for the Atlantic Arctic and 0.09 ∘C warming for the Pacific Arctic, which is particularly pronounced at the proxy sites. Our findings indicate that sea ice in the North Atlantic expanded significantly during the late Holocene, while a sea ice retreat is seen in the North Pacific, amplifying the cooling in the Atlantic Arctic by the sea ice feedback. The positive Arctic dipole pattern, which promotes warm southerly winds to the North Pacific, offsets parts of the cooling trend in the Pacific Arctic. The Arctic dipole pattern also causes sea ice expansion in the North Atlantic, further amplifying the cooling asymmetry. We found that the temperature asymmetry is more pronounced in a simulation driven only by orbital forcing. The accelerated simulations lead to a partial delay in the feedback of climate processes. Therefore, we confirm the occurrence of the asymmetry of the Arctic temperature changes in un-accelerated simulations using ECBilt-CLIO, IPSL, and in TraCE-21k.
- Article
(9614 KB) - Full-text XML
-
Supplement
(1454 KB) - BibTeX
- EndNote


Arctic climate is a critical component of the climate system. Since the 1990s, the changes in the Arctic climate have attracted increasing attention. Observational and model data show that the Arctic temperature variability is much greater than the global mean temperature variability, known as the Arctic amplification (AA) (Jones and Moberg, 2003; Holland and Bitz, 2003; Serreze and Barry, 2011). The Intergovernmental Panel on Climate Change (Mandel and Lipovetsky, 2021) suggests that the Arctic temperature has likely increased more than double compared to the global average, with high confidence over the last 2 decades. There has been intense debate about how the AA affects the midlatitude circulation, with some scholars suggesting that the AA increases the Equator-to-pole temperature gradient and impacts the predominant westerly wind through the thermal-wind relation, which leads to disturbances in the midlatitude circulation, further increasing the probability of extreme weather in the midlatitudes (Smith et al., 2019; Vavrus, 2018; Screen and Simmonds, 2014; Cohen et al., 2014; Francis and Vavrus, 2012, 2015). The changes in Arctic temperature have also been directly linked to sea ice loss or expansion, which affect the exchanges of heat and moisture between the ocean and atmosphere as well as the salinity of the ocean (Aagaard and Carmack, 1989; Wu et al., 2004; Goosse and Fichefet, 1999; Deser et al., 2016). Changes in sea ice extent and salinity in turn leads to changes in the thermohaline circulation (Rahmstorf, 1999; Alekseev et al., 2001), which may cause significant negative impacts on the climate and maritime transportation (Ragner, 2000) in high-latitude regions. All these processes have strong impacts on the regional economic development.
The different drivers of the significant increase in temperature at high latitudes over the past decades have been debated by scholars, and it is widely accepted that one of the extremely important factors is natural variability (Polyakov and Johnson, 2000; Polyakov et al., 2002; Delworth and Knutson, 2000). For the past decades, Hoerling et al. (2001) show that due to the increase in tropical temperature, convective activity has increased, resulting in an increase in the North Atlantic Oscillation/Arctic Oscillation (NAO/AO) positive pattern, which is significantly related to the Arctic temperature (Hurrell, 1995). Deser et al. (2015) and Blackport and Kushner (2018) attribute part of the warming of the Arctic to an increase in extratropical ocean temperature. Johannessen et al. (2004) used ECHAM4 and HadCM3 and found that anthropogenic forcing is the dominant reason for the Arctic warming over the past decades. For the centennial and millennial timescales, the anomalies in summer insolation, driven primarily by Earth's orbital forcing, have a greater impact on the Arctic region than the low latitudes and amplify changes in temperature through positive feedbacks. Many scholars proposed a link between Arctic temperature trends and summer insolation changes, especially during the early to mid-Holocene (Park et al., 2018; Marcott et al., 2013; Kaufman et al., 2009). Arctic temperature change affects the radiative balance, which dominates the surface energy balance that controls Arctic sea ice growth and melting (Kay et al., 2008; Francis and Hunter, 2007). At the same time, sea ice changes and trends affect Arctic temperature through feedbacks and also influence Arctic atmospheric circulation changes, particularly in the lower troposphere during winter (Barnes and Screen, 2015; Overland and Wang, 2015; Francis and Skific, 2015; Cohen, 2016). The Holocene proxy data also suggest a decrease in the Arctic sea ice relative to the present, impacting the temperature gradient between the Equator and the pole, which might enhance warming in the North American and North Pacific regions, and leading to a slight decrease in temperature over East Asia and shifting tropical rainfall northwards (Smith et al., 2019; Park et al., 2018; Hanslik et al., 2010; Funder et al., 2011; Müller et al., 2012).
From a geological perspective the characterization of the Arctic temperature variability captured by observational data are only a small fraction of the history of climate variations. The short time period of the observed Arctic temperature change is not sufficient to represent the full range of its natural variability and to fully assess feedbacks about air–sea interactions, climate, and ecosystems; it is still necessary to study the long-term changes, especially the millennium-scale changes, which can help shed more light on Arctic climate change in the future. For the past 2 millennia, temperature reconstructions (such as tree-ring, sediment, and ice core records) from PAGES2k and model data show a millennial cooling trend in the late Holocene, particularly in the Atlantic Arctic compared to the Pacific Arctic (Zhong et al., 2018). Zhong et al. (2018) show that this cooling pattern was caused by both a weaker North Atlantic subpolar gyre and a stronger Aleutian low. The Holocene (the past 11 700 years) shows millennial-scale climate variations forced by changes in insolation due to orbital changes. The early to mid-Holocene period is known as the Holocene thermal maximum (HTM) due to an average 5 % increase in solar radiation compared to the present (Berger, 1978). The warm climate conditions were particularly pronounced at high latitudes in the early-to-middle Holocene, which is usually associated with the insolation forcing (Kaufman et al., 2004; Larsen et al., 2015; Gajewski, 2015; Briner et al., 2016; Renssen et al., 2012). Previous work examining the response to Arctic temperature change has either focused only on the trend over the whole Arctic and neglected potential regional asymmetry or used only reconstruction data. The asymmetry of temperature change in the Arctic throughout the Holocene period, however, is evident (Fig. 1), likely associated with responses of climate modes to external climate forcings. The uncertainty and the low spatial coverage of reconstruction in temperature changes from proxy data make it difficult to fully understand the Arctic temperature changes during the Holocene.
To overcome these limitations, a more comprehensive view of climate system changes can be obtained by using model data studies for the Holocene. There are some transient simulations covering the Holocene with different prescribed forcings and initial conditions that have been done during the past decades. For example, TraCE-21ka (Liu et al., 2009) is a transient simulation with resolution of for exploring the climate evolution since the Last Glacial Maximum (LGM), based on Community Climate System Model version 3 (CCSM3). Bader et al. (2020) used the Max Planck Institute Earth System Model (MPI-ESM) to perform transient simulations spanning the period from 8 ka until 1850 to investigate the contradiction of temperature trend changes between reconstructed and model simulated climate. Braconnot et al. (2019) used the transient Holocene simulations based on the IPSL ESM (Institut Pierre-Simon Laplace Earth System Model) with prescribed vegetation, interactive phenology, and an interactive carbon cycle for exploring the climate changes coupled to vegetation over the last 6000 years. In this study, the transient simulation performed by the Community Earth System Model (CESM) with an acceleration factor of 10 and a recent compilation of temperature proxy data are used to investigate the characteristics of the regional temperature changes in the Arctic. Numerous studies have shown that accelerated transient simulations have the ability to study climate evolution over long timescales. For instance, Varma et al. (2012) compared the simulation results with a 10-fold acceleration and non-acceleration and found that there is no significant difference in the characteristics of global surface climate change. Timm and Timmermann (2007) used the earth system model of intermediate complexity, ECBilt-CLIO, to simulate the climate since the Last Glacial Maximum (LGM) by a 10-fold acceleration and compared the simulation results without acceleration. They found that the simulation results with a 10-fold acceleration reproduced the large-scale trend of atmospheric temperature in the Holocene well. Lu and Liu (2019) found that the acceleration leads to suppressed and delayed responses mainly in the deep sea and has a less robust effect on the surface and subsurface. Jing et al. (2022) compared the temperature and precipitation changes in NNU-Hol (Nanjing Normal University-Holocene) simulation and the TraCE-21ka non-acceleration simulation, and in terms of overall trend and distribution, the temperature and precipitation patterns of NNU and TraCE-21ka are similar. We are therefore motivated to use these simulations to assess the changes in spatial pattern of Holocene Arctic temperature variability and reveal the physical mechanisms behind these changes.
In this paper, we investigate whether temperature changes differed between the Atlantic and Pacific Arctic during the Holocene and whether changes in sea ice and sea level pressure contributed to the pattern of temperature changes. To address these questions and identify the key factors driving asymmetric temperature changes, we analyze changes in sea ice, sea level pressure, and orbital forcing from CESM NNU-Hol simulations and other transient simulations. This is critical for future studies of the climate implications of temperature changes at high latitudes. The structure of this article is as follows. Section 2 describes the proxy and model data used in the current study. In Sect. 3, we summarized the temperature asymmetric changes reflected in the proxy and model data in the high latitudes of the Northern Hemisphere and presented the changes in sea ice and sea level pressure during the Holocene. In Sect. 4, the characteristics of Arctic temperature changes in Holocene un-accelerated simulations are discussed. Finally, a summary is given in Sect. 5.
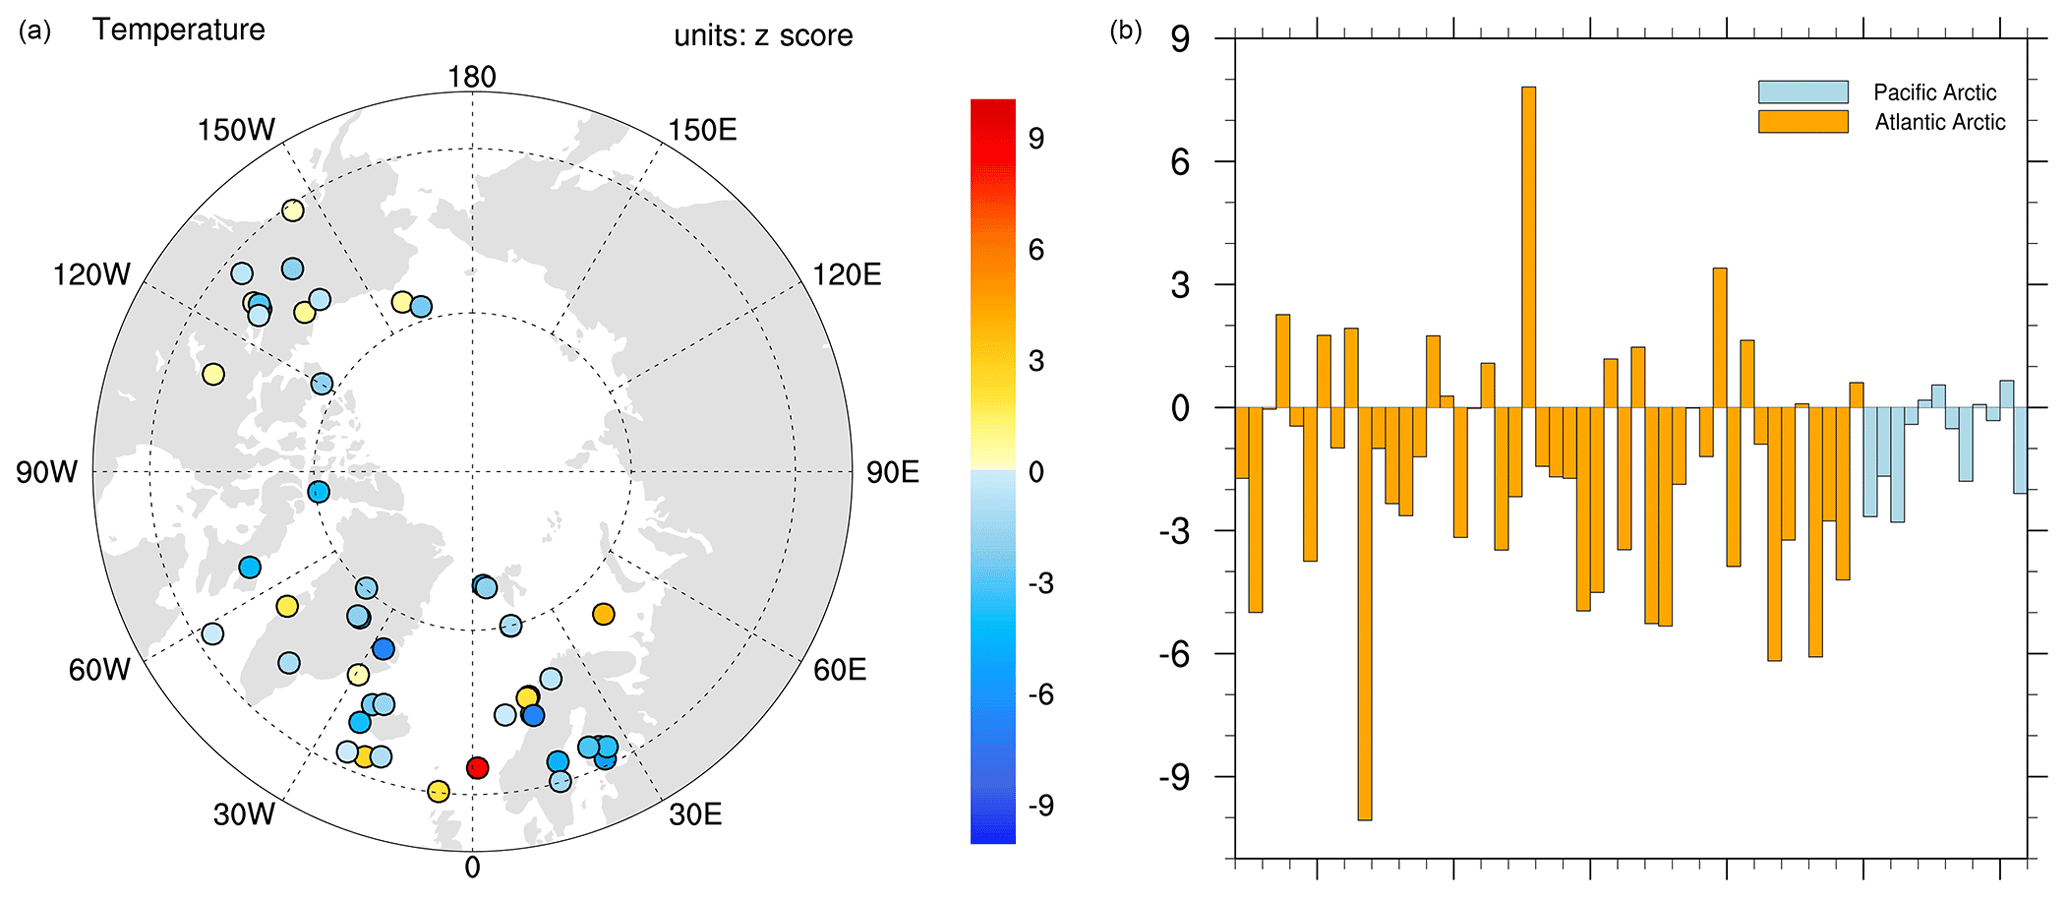
Figure 1(a) The annual temperature changes between two periods (0–2 ka minus 5–8 ka) in reconstructions (Temperature 12k). (b) Histogram of temperature change for each proxy site.
2.1 CESM and the transient simulations
This study analyzes a new transient simulation result based on CESM, named NNU-Hol (Nanjing Normal University-Holocene), which considers more comprehensive external forcings for the Holocene climate change. CESM is a fully coupled, global climate model, which was launched by the National Center for Atmospheric Research (NCAR) in June 2010. It is an Earth system model developed on the basis of CCSM4. CESM includes components for atmosphere, ocean, sea ice, and land surface and considers atmospheric chemistry, biogeochemistry, and anthropogenic forcing. It is widely used to study the mechanism of the changes in climate and the environment and the interaction between natural and anthropogenic forcing for the climate and for scenarios of future climate change. CESM is coupled with several advanced modules, including CAM5 (Community Atmosphere Model 5) used by the atmosphere module, POP2 (Parallel Ocean Program 2) used by the ocean module, CLM4 (Community Land Model 4) used by the land module, CICE (the Los Alamos National Laboratory sea ice model) used by the sea ice module, and CISM2.0 (The Glimmer Ice Sheet Model 2.0) used by the land ice module. CISM2.0 is deactivated in the NNU-Hol simulation. For a more detailed introduction, please visit the official website of CESM (http://www.cesm.ucar.edu/models/cesm1.0/notable_improvements.html, last access: 6 March 2023)).
In NNU-Hol, CESM 1.0.3 was configured to simulate the transient climate evolution of the Holocene period at a horizontal resolution of , forced by several external forcings (orbital parameters, solar irradiance, volcanic eruptions, greenhouse gases, and land use and land cover) accelerated by a factor of 10. With this acceleration method (Lorenz and Lohmann, 2004), climate trends and feedbacks from the past 11.95 kyr to 1990 CE, imposed by the external-forcing-driven changes, are represented in the experiments with 1199 model years to save computation resources. The solar irradiance forcing comes from the reconstruction of Vieira et al. (2011), aggregated to 10-year average timescale of solar forcing and prescribed in the simulation. The volcanic eruption comes from the ice-core-based reconstructions of Wan et al. (2020) and Sigl et al. (2015). For the volcanic forcing, the volcanic events during the 10-year period were integrated into one volcanic eruption event. On the basis of this assumption, the horizontal diffusion of lower-stratospheric aerosols was calculated using the stratospheric transport parameters. Based on the stratospheric–tropospheric folding and BD (Brewer Dobson) circulation theory, latitude- and time-dependent functions were used to describe aerosol production and deposition (Grieser and Schonwiese, 1999; Holton et al., 1995). The greenhouse gas forcing data use the reconstruction based on ice cores in Joos and Spahni (2008). The data for land use and extra land cover forcing comes from the HYDE 3.2.1 (the History Database of the Global Environment, referred to as HYDE version 3.2.1) (Klein Goldewijk et al., 2017) data set. The orbital parameters come from Berger (1978). The external forcing time series used in the NNU-Hol simulation is shown in the Supplement. Wan et al. (2020) found that the global annual average temperature in the NNU-Hol “All” forcing simulation and reconstruction records from Marcott et al. (2013) has similar trends and strengths, decreasing by about 0.5 K during 5.0 to 0.15 ka. We explore the characteristics of changes in Arctic temperature during the Holocene and try to understand its underlying mechanism based on the All forcing (AF) and orbital forcing (ORB) simulations in NNU-Hol.
There are, to our knowledge, five sets of climate simulations published so far covering the entire Holocene period (0–11 700 ka), namely ECBilt-CLIO (Timm and Timmermann, 2007), FOAM (Kutzbach et al., 2008), TraCE-21ka (Liu et al., 2009), FAMOUS (Smith and Gregory, 2012), and LOVECLIM (Timmermann et al., 2014). Except for TraCE-21ka and one of the ECBilt-CLIO simulations, these simulations are accelerated by different factors. Additional un-accelerated simulations, such as the simulations based on MPI-ESM (Bader et al., 2020) and IPSL (Braconnot et al., 2019) covering only part of the Holocene period (0–8 and 0–6 ka, respectively) have also been published in recent years. The external forcings considered in these simulations are generally a part of the combination of orbital forcing (ORB), greenhouse gases (GHGs), continental ice sheets (ICE), meltwater flux (MWF), volcanic forcing, land use forcing, and ozone forcing.
2.2 Reconstructing paleo-proxy data
In order to better understand the Holocene evolution of the earth system, a comprehensive database of paleoclimate records was compiled by Kaufman et al. (2020), which is named the Temperature 12k database.
The Temperature 12k database is a global compilation of good-quality, published, temperature-sensitive proxy records (such as lake sediment, marine sediment, peat, glacier ice, and pollen) throughout the entire Holocene period. The data are mainly collected from previously published research, containing 1319 records (1162 from the Northern Hemisphere and 157 from the Southern Hemisphere), distributed across 679 sites (including 470 terrestrial and 209 marine sites), where the time period covers at least 4000 years. For our study we only selected records with a resolution finer than 400 years: 15 % of these records have a resolution of 50 years or finer, 39 % have a resolution of 51 to 150 years, and 21 % have a resolution of more than 250 years.
The data are mainly based on a collection of published reconstructions of Holocene temperature especially in the Northern Hemisphere (Routson et al., 2019; Marcott et al., 2013; Sundqvist et al., 2014; Chen et al., 2008; Wanner et al., 2011). Part of the global paleotemperature data are collected from the PAGES 2k Consortium 9 database. The compilation of Marsicek et al. (2018) provides most pollen-based paleotemperature records, and the other part comes from public repositories (such as PANGAEA and the World Data Service for Paleoclimatology, NOAA). The paleotemperature records at 209 marine sites are mainly from the US-based Data Assimilation for Deep Time (DADT) project and the compilations of the German Climate Modeling Initiative (PalMod) (Jonkers et al., 2020). In this database, uncertainties are estimated by various methods. Some studies characterize uncertainty based on calibration and proxy bias or measurement error, while others represent uncertainties after rigorous cross-validation. The uncertainties in most of these paleotemperature records from North American and European pollen and most of the marine sediment-based records (except for those from microfossil assemblages) are calculated using the Bayesian procedure in early studies (Malevich et al., 2019; Tierney and Tingley, 2014, 2018; Tierney et al., 2019). For the other proxy types, most of the paleotemperature values and their uncertainties are based on multigenerational analysis and calibration methods. Specific information about the uncertainty for each proxy recorded is available in Supplement Table 2 of Kaufman et al. (2020) as well as in their paper itself. More detailed information can be found at https://www.ncei.noaa.gov/access/paleo-search/study/27330 (last access: 6 March 2023).
In order to investigate the changes in temperature over the Arctic area during the Holocene, we selected records from the site, which are located above 60∘ north latitude, and eliminated some records with shorter time series (missing more than 2500 years during the Holocene), which leaves us with 58 records.
2.3 Analytical and statistical methods
We focus on long-term temperature changes in the Arctic during the Holocene. The significance test used in this study was calculated according to a two-tailed Student's t test at the 90 % (α = 0.1) or 95 % (α = 0.05) confidence level. Student's t test was used to compare the means of two groups and determine if the difference in means is statistically significant and was also used to test the statistical significance for each grid point in the figures in this paper. The sample size of the Pacific Arctic region in the temperature proxy data is small and thus has a small degree of freedom. The potential impact of temporal and spatial correlation is not taken into account in the analyses. We apply empirical orthogonal function (EOF) analysis, also known as principal component analysis (PCA), to sea level pressure changes in the Northern Hemisphere. EOF analysis is a standard analytical technique used in climate science to study patterns of spatial variability. The EOF is obtained by computing the eigenvectors and eigenvalues of the spatially weighted covariance matrix of the temperature field. Equation (24) from North et al. (1982) was used as a statistical test to evaluate the separation of EOF eigenvalues (leading modes). Applying the EOF to the Northern Hemisphere sea level pressure is a common method to study the Arctic dipole mode. The objective is to show the variation in the Arctic dipole mode during different periods of the Holocene (0–2 and 5–8 ka). As described in Sect. 3 below, the second mode of the EOF for the Holocene 5–8 ka period explains 11.5 % and that for the 0–2 ka period explains 16.3 % of the sea level pressure variation.
3.1 Arctic temperature change
In order to demonstrate asymmetric temperature changes in the Arctic during the Holocene, we analyzed the Temperature 12k database (Kaufman et al., 2020). The results are shown in Fig. 1, where the circles represent the site locations of the 52 selected records. The proxy records are mainly concentrated on the Atlantic coast and in Europe, Greenland, and northern Canada. The average temperature across the Arctic showed a cooling trend during the Holocene, which is consistent with previous findings (Marcott et al., 2013; Kaufman et al., 2004). To study the asymmetric changes in temperature, we divided the Arctic region into two parts: the Pacific Arctic ( >60∘ N, 90∘ W–59∘ E) and the Atlantic Arctic ( >60∘ N, 60∘ E–91∘ W). The proxy data show that there is an asymmetric cooling between the two regions, with an average cooling of −1.54 ∘C in the Atlantic Arctic and −0.61 ∘C in the Pacific Arctic, showing significance at the 90 % confidence level (p<0.10) on Student's t test. The degrees of freedom of the temperature proxy data in the Pacific and Arctic region are small. The histogram shows that only two proxy sites have extreme temperature variations in the Atlantic Arctic region. However, combined with the box plot of the temperature changes (Fig. S1 in the Supplement), the asymmetric temperature variation in the two regions is still considered robust. To further study the robustness of this asymmetric change in temperature, we likewise analyze it with model data, allowing us to also investigate the seasonal changes.
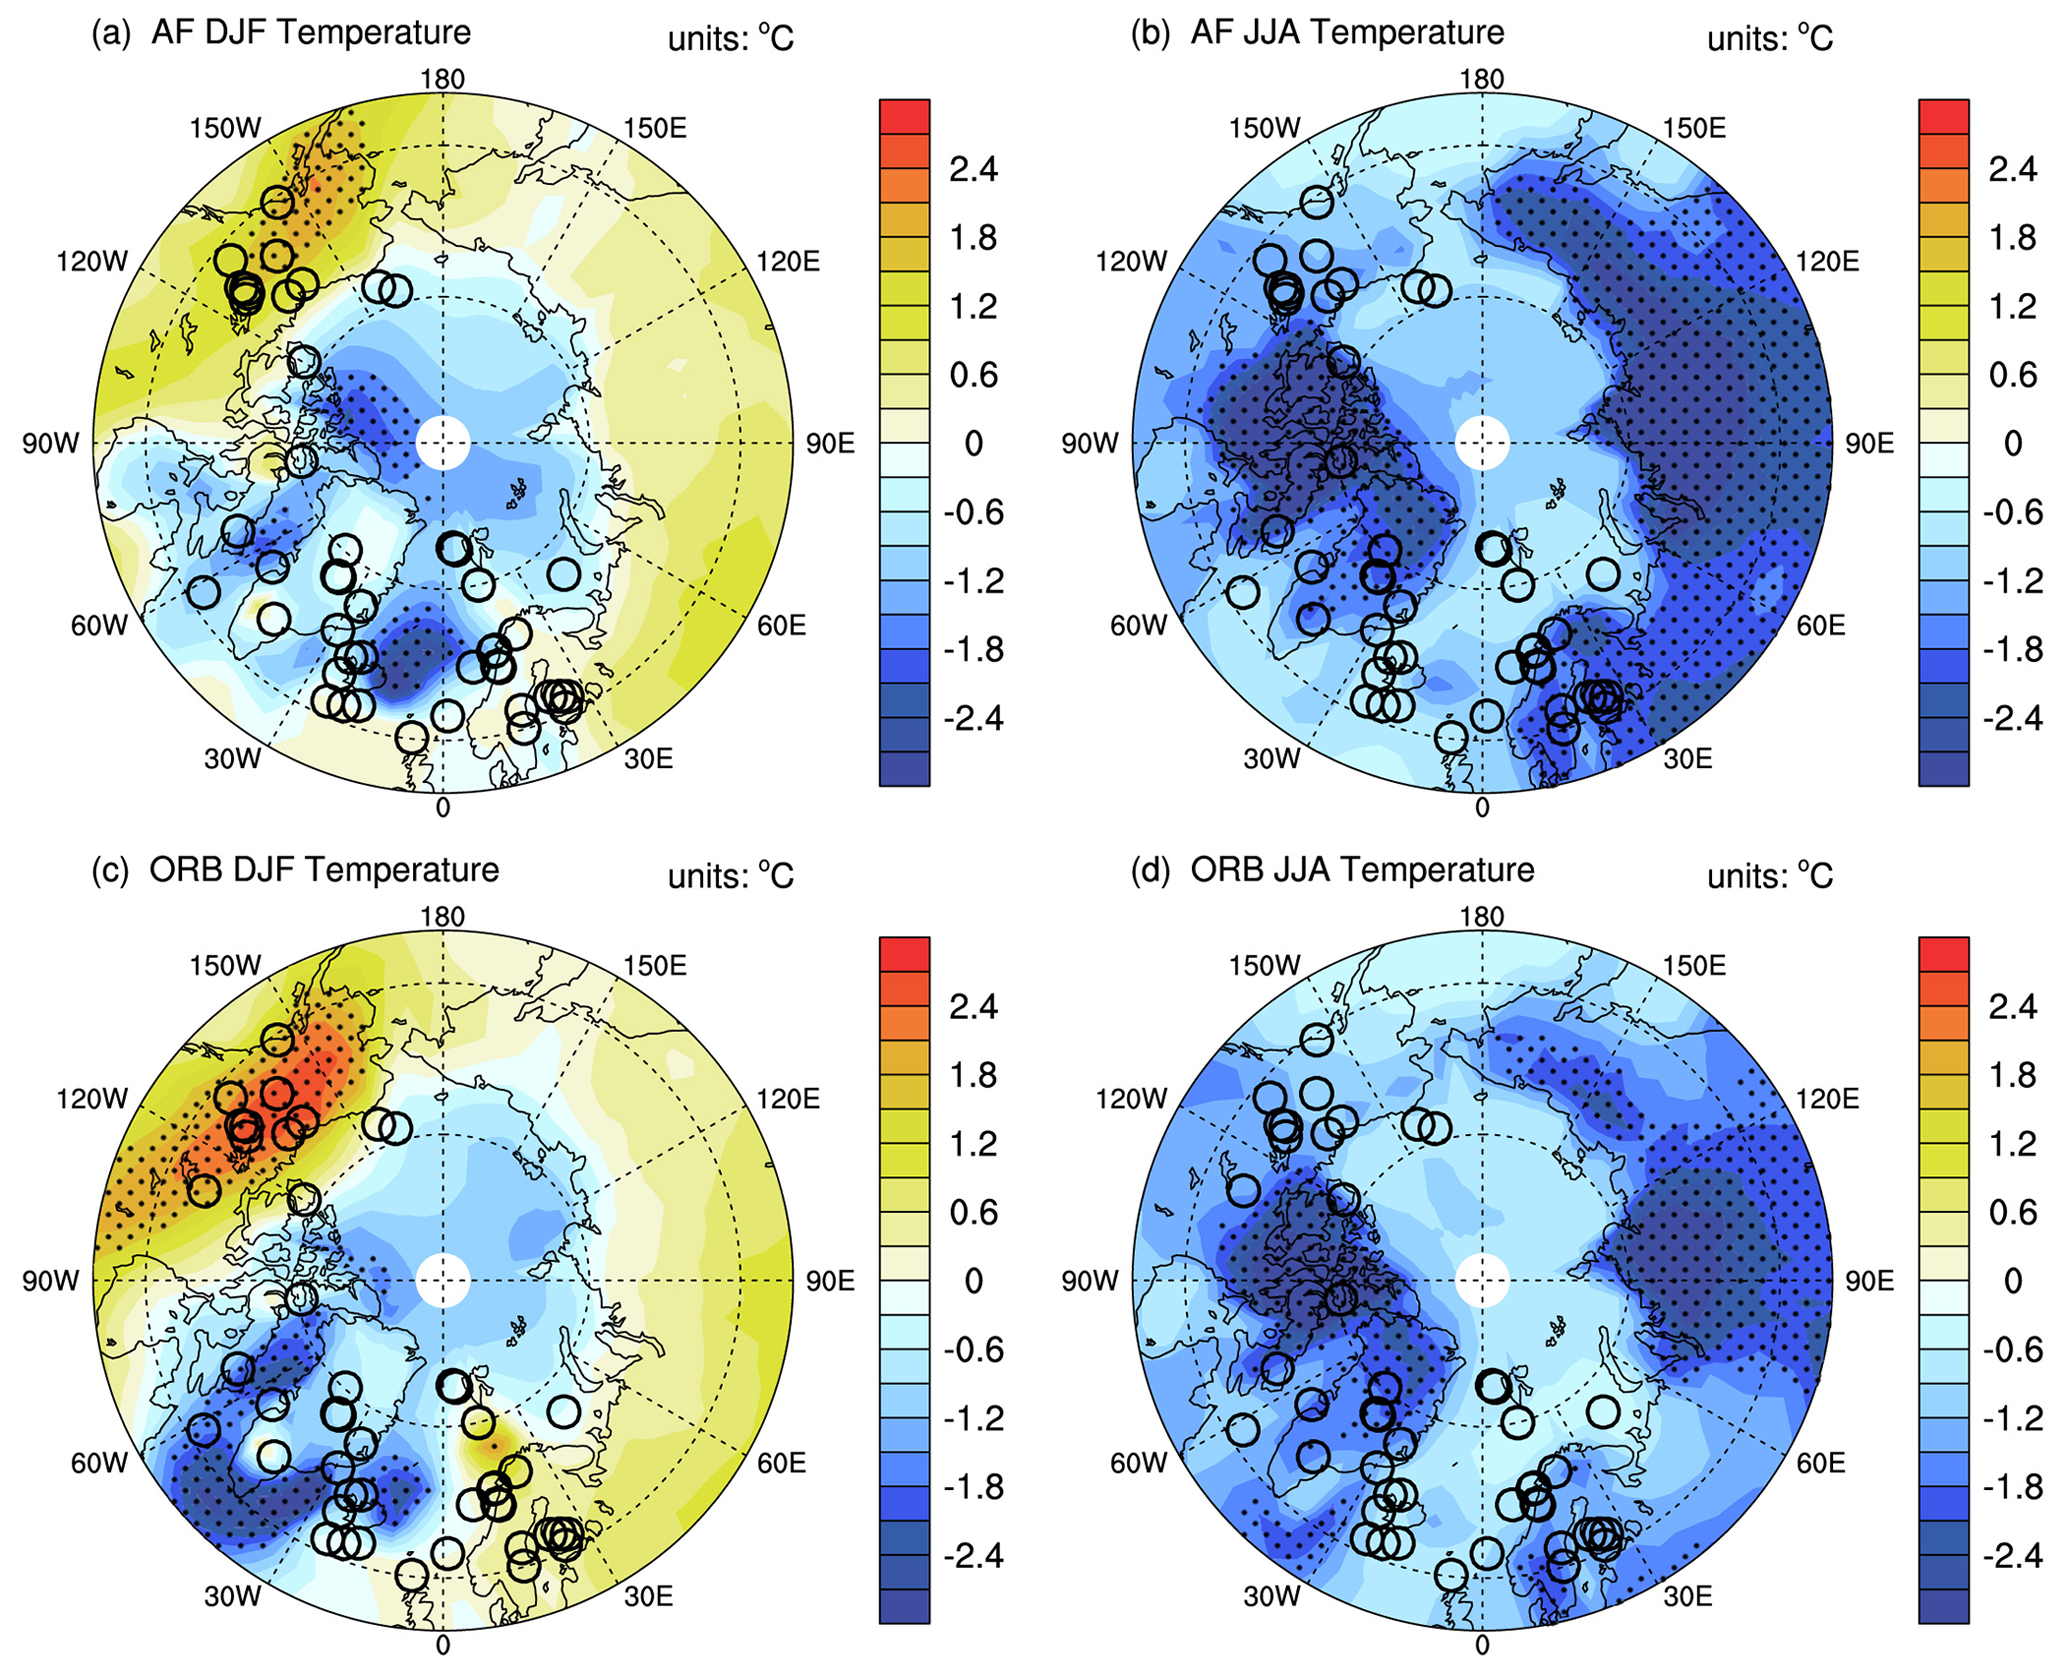
Figure 2(a) The DJF temperature changes between two periods (0–2 ka and 5–8 ka) in NNU-Hol All forcing simulations (Pacific Arctic: −0.44; Atlantic Arctic: 1.00; the difference is statistically significant at the 95 % confidence level). (b) Same as (a) but for JJA (Pacific Arctic: 3.98; Atlantic Arctic: 3.81). (c) Same as (a) but for NNU-Hol ORB forcing simulations (Pacific Arctic: −0.80; Atlantic Arctic: 1.75; the difference is statistically significant at the 95 % confidence level). (d) Same as (c) but for JJA (Pacific Arctic: 7.48; Atlantic Arctic: 6.07). Areas that are dotted are significant at the 90 % confidence level.
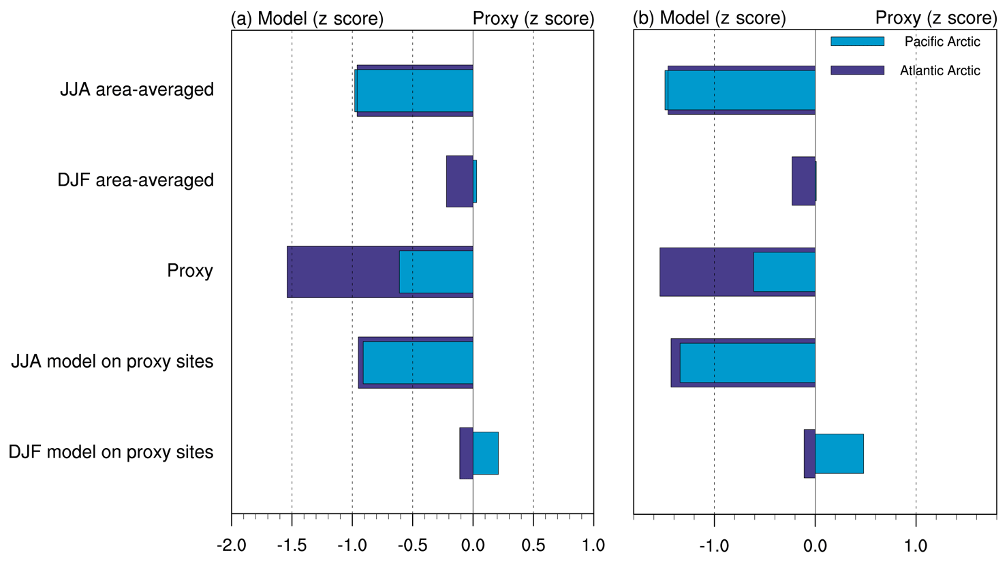
Figure 3Model area average temperature change in JJA. Model area average temperature change in DJF. Annual temperature change in the proxy. Model JJA average temperature change at proxy sites. Model DJF average temperature change at proxy sites (a AF simulation; b ORB simulation).
Here we use the model data based on CESM and the NNU-Hol, and we choose data from the All forcing simulation (AF) and the orbital forcing simulation (ORB) in order to assess the most realistic temperature changes (AF) and the role of the orbital forcing (ORB) in the changes during the Holocene. As shown in Fig. 2, to better understand the asymmetry, we further analyze the temperature changes in two seasons: DJF (December, January, and February) and JJA (June, July, and August). The results from AF and ORB show a similar pattern. In the JJA, the Arctic exhibits a comparable cooling trend in the Atlantic sector and the North Pacific sector, with cooling centers in Eurasia and northeastern America. However, there is significant regional asymmetric cooling in the DJF (−0.67 ∘C for Atlantic Arctic average cooling and 0.09 ∘C for the Pacific Arctic average warming in AF; the difference is statistically significant at the 95 % confidence level on Student's t test), with the Arctic Ocean, the North Atlantic Ocean, and Greenland cooling while the land and North Pacific Ocean are warming. Areas that are dotted are significant at the 90 % confidence level in Fig. 2. Northern Canada, where numerous proxy sites are located, is the center of the temperature warming, with the cooling center changing from the Norwegian Sea in the AF to the North Atlantic in the ORB. We can see more clearly the difference in temperature asymmetry in the two seasons through Fig. 3, and the intensity of the asymmetry is more pronounced at the proxy sites. In the DJF of AF, the average cooling is −0.44 ∘C for the Atlantic Arctic proxy site and the average warming is 0.85 ∘C for the Pacific Arctic proxy site, while in the ORB it is −0.25 ∘C and 1.61 ∘C, respectively. The difference in the mean temperature changes in the two regions is significant at the 90 % confidence level in both AF and ORB. Figure 3 shows that the temperature difference between the Pacific and Atlantic Arctic is neglectable for either the regional average or the sites' station average in JJA. Therefore, the asymmetric temperature changes in the Atlantic and Pacific Arctic are dominated by the changes in DJF.
3.2 Sea ice (March) and sea level pressure change
Past research has shown that sea ice is always an important factor when we discuss Arctic climate change (Jenkins and Dai, 2021). Arctic temperature changes are often tightly linked to sea ice changes, with temperature causing changes in the expansion of sea ice cover and therefore changes in surface albedo, further amplifying climate change in the Arctic region (Wohlfahrt et al., 2004; Renssen et al., 2005; Braconnot et al., 2007). The simulations show that the temperature asymmetry is closely related to the asymmetric change in sea ice pattern. The difference in March sea ice area between the two periods (0–2 ka and 5–8 ka) is fairly consistent in the AF and ORB simulations. Consistent with previous studies of Holocene sea ice concentration proxies, sea ice concentrations were low in the early to mid-Holocene and increased in the mid- to late Holocene during the Neoglacial (Jennings et al., 2002; de Vernal et al., 2005; Müller et al., 2012). For the Atlantic Arctic, the sea ice concentration of the Chukchi Sea was not always low during the Early Holocene, while there were millennial oscillations and minimum values in the Chukchi Sea during the Neoglacial (de Vernal et al., 2005). Müller et al. (2012) showed that for the North Atlantic sea ice reconstruction P25 decreased significantly in the early Holocene, while in the middle Holocene (7000–3000 years BCE), sea ice gradually increased. The maximum value was gradually reached in 3000–300 years. In our model, sea ice increased throughout the Arctic during the Holocene, especially around the Norwegian Sea and Davis Strait, with the exception of the Barents Sea, where sea ice area declined significantly (significant areas are dotted in Fig. 4). The large expansion of sea ice in the North Atlantic and the slight decrease in sea ice in the North Pacific leads to strong differences in surface albedo between the two regions, with more reflection of radiation in the North Atlantic and more absorption in the North Pacific, which contributes to the stronger asymmetry during winter (Fig. 3).
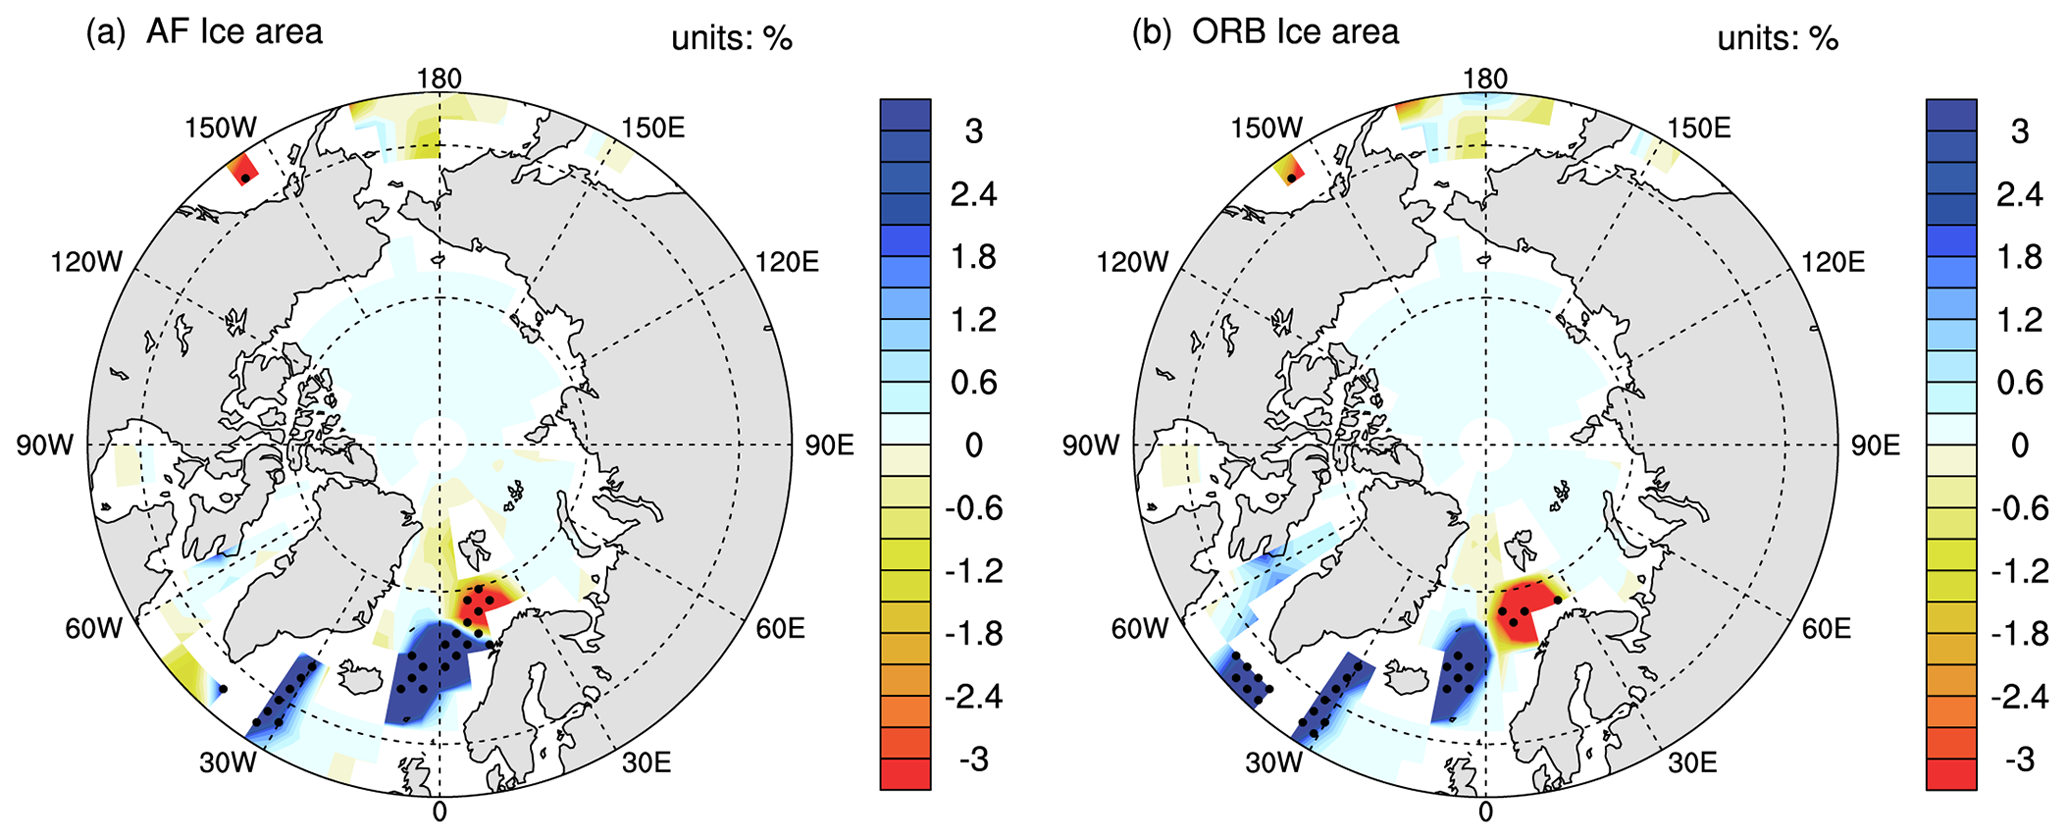
Figure 4(a) The March sea ice area changes between two period (0–2 and 5–8 ka) in the NNU-Hol All forcing simulation (regional average in the Pacific Arctic, 0.02 %, and the Atlantic Arctic, 0.29 %). (b) Same as (a) but for the ORB forcing simulation (regional average in the Pacific Arctic, 0.04 %, and the Atlantic Arctic, 0.29 %). Areas that are dotted are significant at the 90 % confidence level. The difference in the mean sea ice area changes in the two regions is significant at the 90 % confidence level in both AF and ORB.
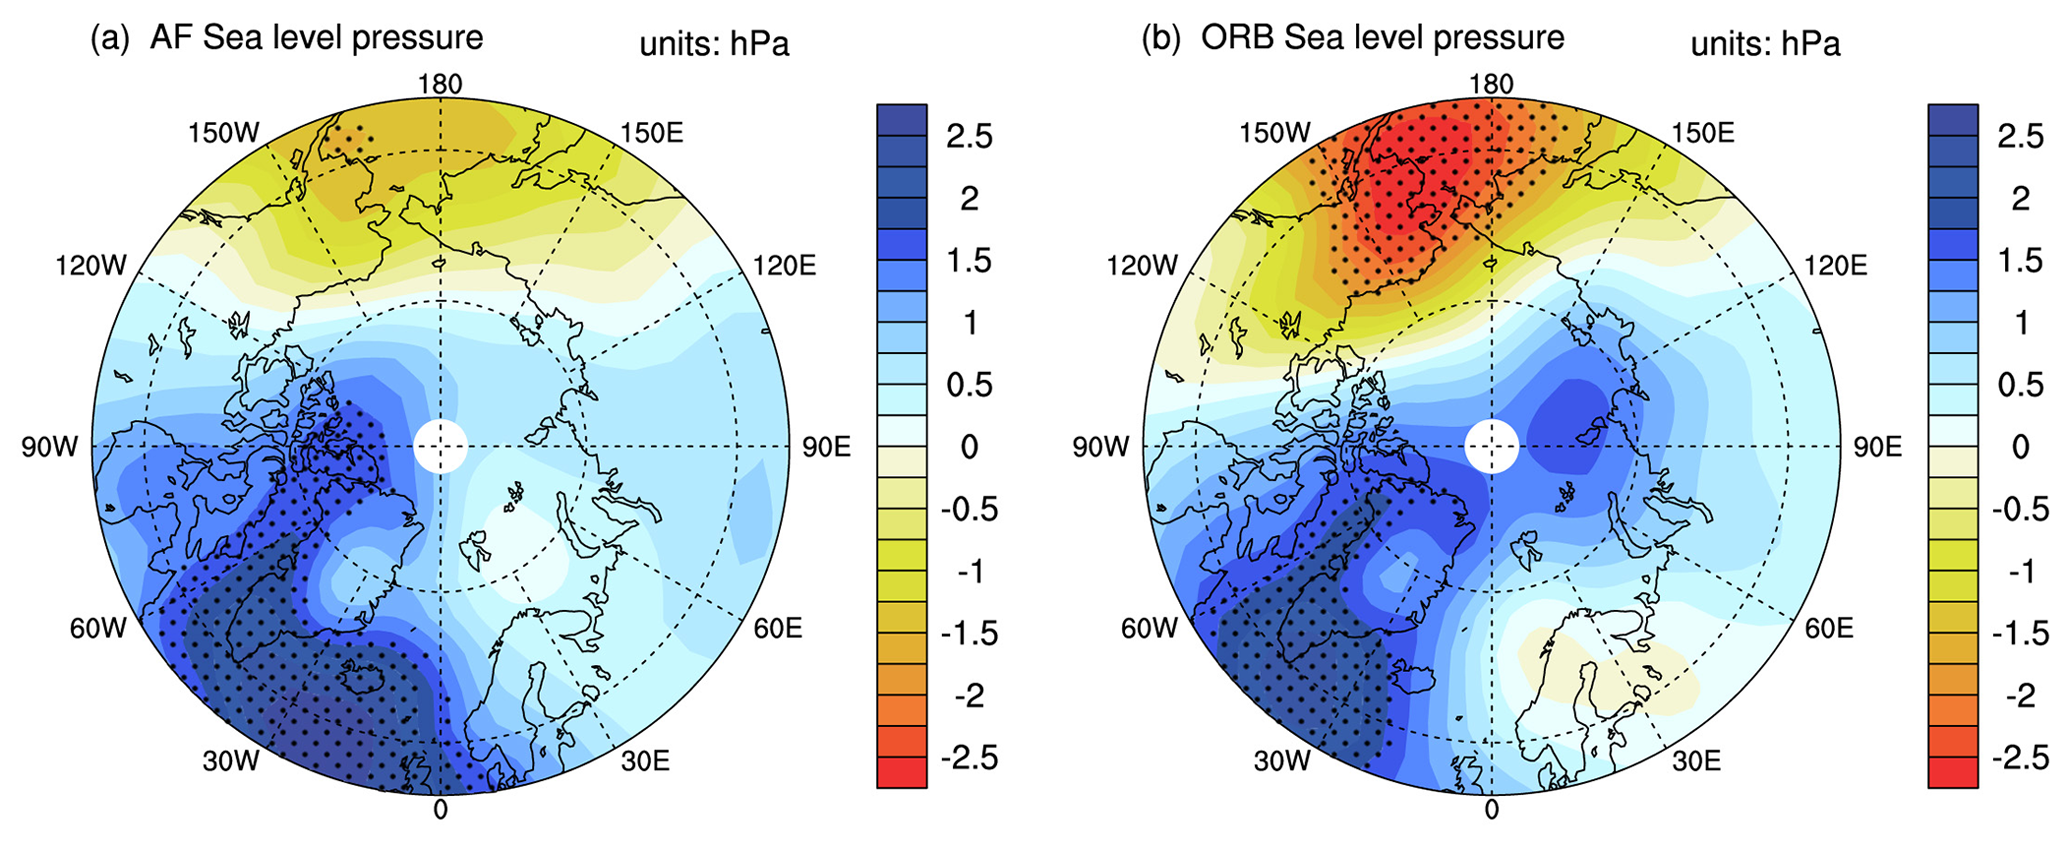
Figure 5(a) The DJF sea level pressure changes between two period (0–2 and 5–8 ka) in the NNU-Hol All forcing simulation. (b) Same as (a) but for the ORB forcing simulation. Areas that are dotted are significant at the 90 % confidence level.
To understand the dynamical aspects of the stronger cooling in the North Atlantic, we investigate the regional-scale atmospheric circulation and surface wind variations related to sea ice transport. We focus our analysis on the December–February season because these months yield the largest impact of temperature asymmetry. In DJF, the sea level pressure (SLP) has a distinct dipole distribution. Sea level pressure increases in the North Atlantic and decreases in the North Pacific. The low pressure in the North Pacific intensifies during the late Holocene. Based on data from the past decades, many studies (Wu et al., 2006; Niebauer et al., 1999; Stabeno et al., 2001; Rodionov et al., 2005) have demonstrated that the stronger low pressure transported warm air from the south to the North Pacific, resulting in higher temperatures in the North Pacific, offsetting parts of the Holocene cooling trend in the North Pacific and causing sea ice expansion in the North Atlantic due to atmospheric circulation. We suspect that this contributes to the regional asymmetry in Arctic temperatures. Compared with the AF results, the ORB simulation shows that the sea level pressure changes in the two regions contrast more and the difference is larger. This suggests that orbital forcing plays a dominant role in generating this asymmetry.
3.3 The EOF of SLP and regressed U and V wind components and sea ice
Previous studies have established that atmospheric circulation anomalies in the Arctic atmosphere, dipole structure anomalies, are closely related to sea ice (Wu et al., 2006; Watanabe et al., 2006; Choi et al., 2019). The Arctic dipole strongly influences sea ice movement and sea ice export. The empirical orthogonal function (EOF) method has commonly been used to study the Arctic dipole in past studies (Wu et al., 2006; Skeie, 2000; Wang and Ikeda, 2000). The EOF's first leading mode of the monthly mean SLP north of 60∘ N in winter corresponds to the Arctic Oscillation pattern, and the second leading mode of the EOF corresponds to the Arctic dipole anomaly. In order to confirm our conjecture that changes in SLP and sea ice play a role in promoting regional temperature asymmetry, we analyzed the Arctic dipole, and the results are shown in Fig. 6. The first and second leading modes are statistically independent at the 95 % confidence level on the North significance test (North et al., 1982). In the AF simulation, the EOF pattern of the SLP is similar for both periods (0–2 and 5–8 ka), with the second mode showing an Arctic dipolar distribution. There are two action centers with opposite signs: one center is located over the North Pacific and the other exists over northern Eurasia (significant at the 90 % confidence level), accounting for 11.5 % (5–8 ka) and 16.3 % (0–2 ka) of the variance. Figure 6c and d show that the PC2 (second principal component) time series of the EOF in the mid-Holocene oscillated repeatedly, while the PC2 in the late Holocene showed a strengthening trend. Combined with the stronger SLP of the late Holocene shown in Fig. 5, it can be concluded that the late Holocene has a stronger Arctic dipole pattern.
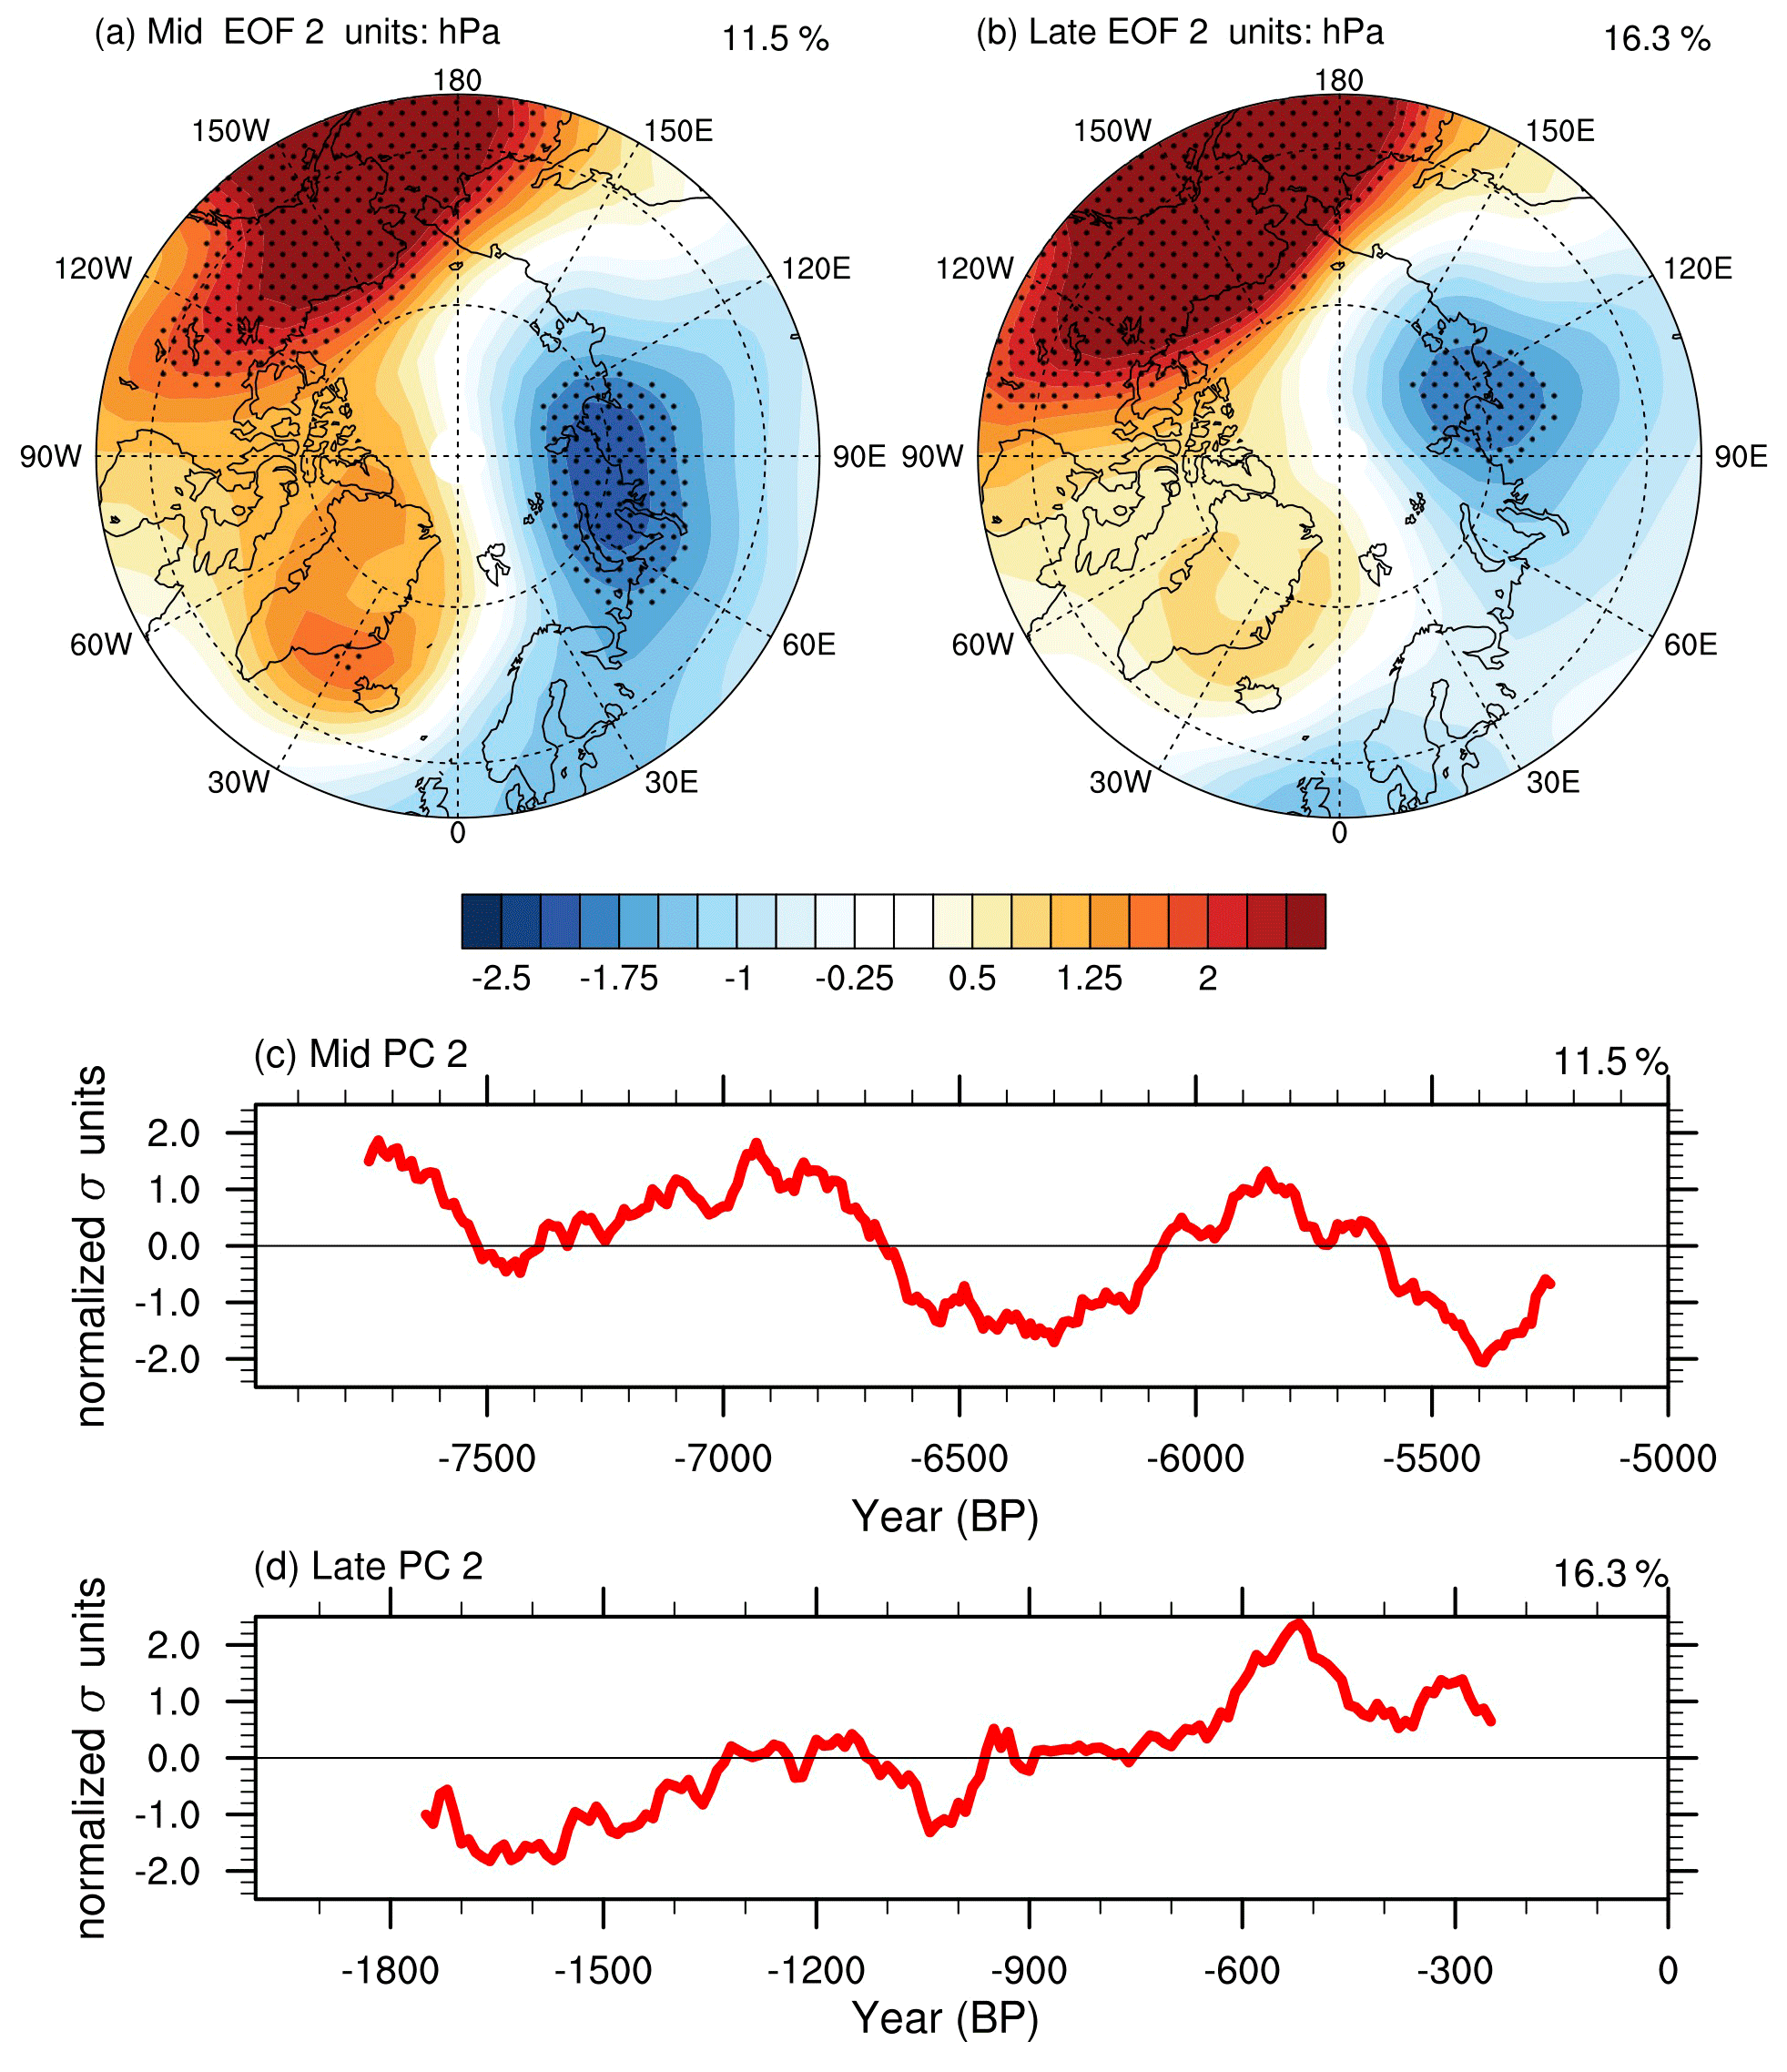
Figure 6The second EOF (EOF2) pattern of sea level pressure in NNU-Hol All forcing simulations during 5–8 ka (a) and 0–2 ka (b). The second principal component time series of the EOF during 5–8 ka (c) and 0–2 ka (d) after 50 years (smoothed). Areas that are dotted are significant at the 90 % confidence level.
Regressing on the PC2 of the EOF allows us to understand how the Arctic dipole pattern affects the changes in sea ice and wind, and the corresponding sea ice field and wind field can explain the physical mechanism of the Arctic dipole effect on temperature asymmetry. To explore our conjectures, we compared two spatial patterns of sea ice and U and V wind field regressions to the PC2 (Fig. 7). By regressing the sea ice distribution onto the second principal component time series (Fig. 7), a pattern consistent with past sea ice reconstructions (de Vernal et al., 2005; Müller et al., 2012; Jennings et al., 2002), we show that the Arctic dipole in the late Holocene had a greater role in influencing sea ice. In the late Holocene, the Bering Strait, Chukchi seas, and East Siberia were influenced by warm winds from the south, promoting strong ice melting, pushing the ice away from the coast and increasing the temperature in these areas. On the other hand, the pressure pattern causes the Arctic Ocean sea ice to expand to the North Atlantic Ocean through Fram Strait transfer. This leads to more sea ice in the Atlantic Ocean and, therefore, more radiant heat reflectance and surface temperature cooling in the Atlantic Arctic due to the sea ice feedback. This pattern contributes to the asymmetry of temperature variations between the North Atlantic and the North Pacific. In the late Holocene, the wind field characteristics are more pronounced than those in the early to mid-Holocene, and thus the temperature asymmetry is more significant.
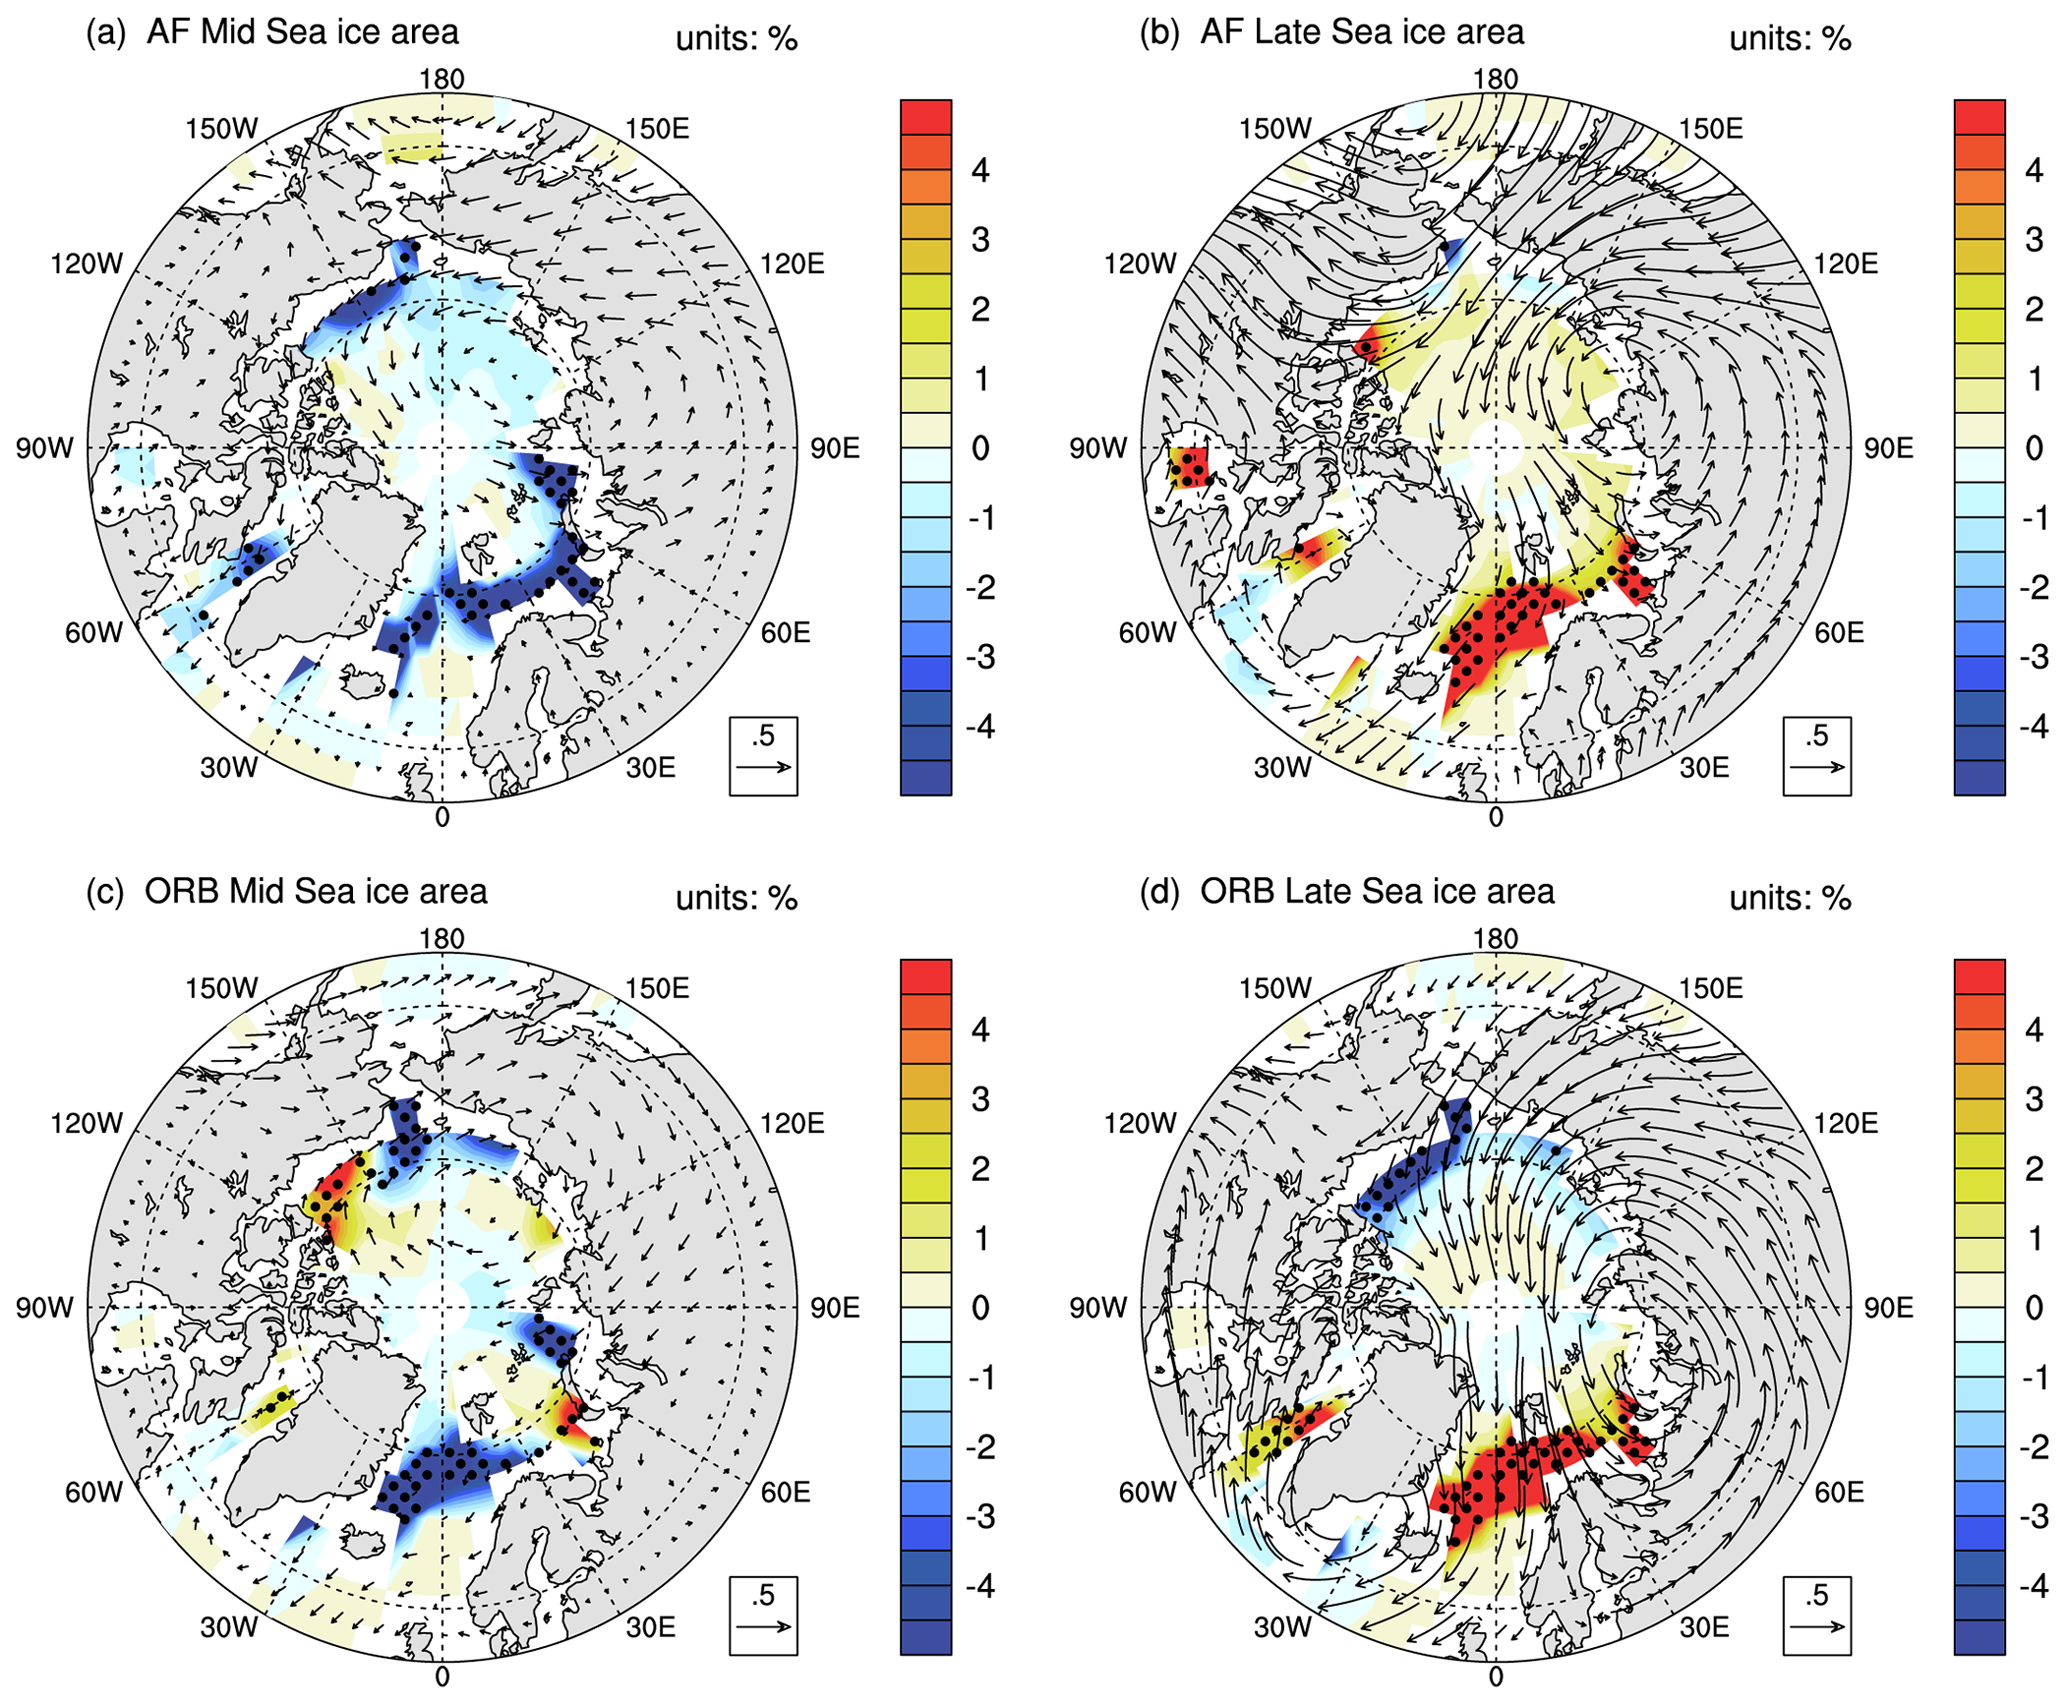
Figure 7The regression of U and V wind components and sea ice based on the second principal component time series of sea level pressure in the NNU-Hol AF simulation during 5–8 ka (a) and 0–2 ka (b) and in the NNU-Hol ORB simulation during 5–8 ka (c) and 0–2 ka (d). Areas that are dotted are significant at the 90 % confidence level.
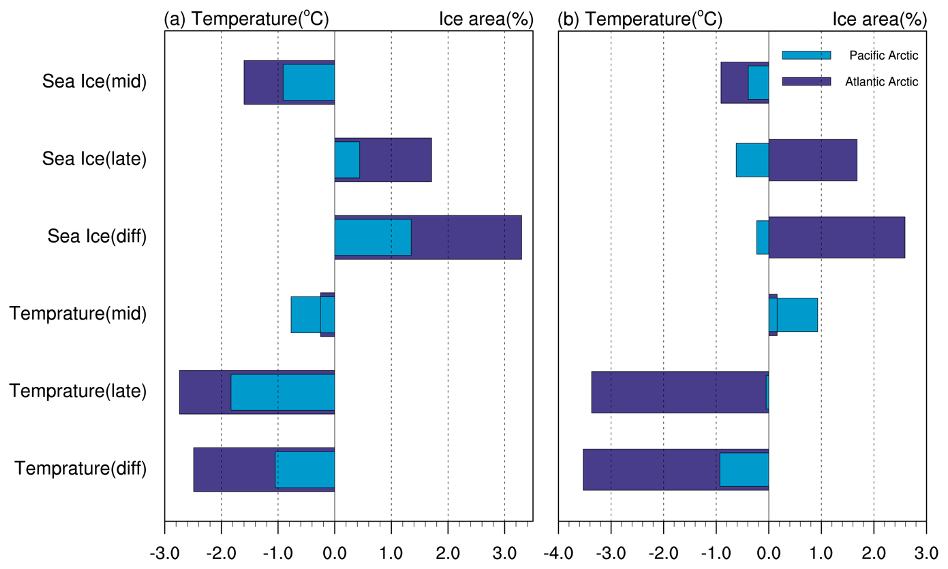
Figure 8Average change in the regression of Sea ice on the PC2 of the SLP in the early to mid-Holocene and the late Holocene. Differences in the regressions of sea ice on the PC2 of SLP between the two periods. The regression of average temperature change in the early to mid-Holocene and the late Holocene. Differences in the regressions of temperature on the PC2 of SLP between the two periods (a AF simulation; b ORB simulation). The difference in sea ice and temperature between the two periods are statistically significant at the 90 % confidence level.
Figure 8 shows the average change in the regression of temperature and sea ice onto the PC2, and the differences in sea ice and temperature between the two regions are mainly contributed by the late Holocene period. The regression of sea ice on the PC2 of SLP increased by 1.71 % in the North Atlantic and 0.44 % in the North Pacific during the late Holocene, while it decreased by −1.60 % and −0.91 % during the early to mid-Holocene (significant at the 90 % confidence level). The corresponding asymmetric cooling in the early to mid- to late Holocene was −2.74 ∘C in the North Atlantic and −1.83 ∘C in the North Pacific (significant at the 90 % confidence level). The results of the ORB simulations in terms of asymmetry are similar to the AF simulations but stronger. Figure 7 shows that in the ORB simulation, the late Holocene had stronger warm southerly winds and more open water in the North Pacific, while sea ice expanded more widely in the North Atlantic, resulting in stronger asymmetric temperature. The regression of temperature shows a cooling of −3.37 and −0.05 ∘C in the North Atlantic and North Pacific (significant at the 90 % confidence level), respectively, during the late Holocene. Therefore, the regression of the U and V wind, the sea ice, and the temperature on the PC2 show the contribution of the Arctic dipole to the temperature asymmetry, The result indicates that it is an important factor affecting the temperature asymmetry in the Arctic.
The results indicate that the sea level pressure and sea ice changes are an important factor for the asymmetric Arctic cooling, since these two factors show similar asymmetric variations over the North Atlantic and the North Pacific. Compared with the early to mid-Holocene, the sea ice expanded in the North Atlantic during the late Holocene, which leads to more cooling in the Atlantic Arctic due to its feedback. On the other hand, the Arctic dipole pattern, which plays an important role in sea ice expansion in the North Atlantic, promotes more cooling in the Atlantic Arctic and raises the temperature in the Pacific Arctic with warm southerly winds, exacerbating the temperature asymmetry. The asymmetric pattern is consistent with the asymmetric cooling in the Arctic over the past 2000 years (Zhong et al., 2018). Zhong et al. (2018) suggest that the change in ocean density due to the millennial cooling has led to a slowdown of the subpolar circulation. This deceleration of the subpolar circulation reduces the heat advection in the northern North Atlantic and intensifies the cooling in the Atlantic Arctic region. Our results are qualitatively consistent with their results that sea level pressure and sea ice play an important role in the asymmetric cooling. However, it should be pointed out that meltwater forcing was not prescribed in NNU-Hol; thus the response in ocean salinity and subpolar circulation as a Zhong et al. (2018) due to meltwater may be underestimated in our simulation.
It can be assumed that our accelerated simulations are largely in qualitative agreement with the un-accelerated experiments in terms of the long-term climate evolution without involving changes in the deep ocean. We present some simple results to validate our results by comparing other non-accelerated simulations. We have selected three open-access un-accelerated simulations: TraCE-21ka, ECBilt-CLIO, and IPSL. The ECBilt-CLIO is an Earth system model of intermediate complexity. In summary, for the asymmetric cooling of the Arctic, the simulations of ECBilt-CLIO as well as IPSL are similar to our results, while TraCE-21ka differs from our results. In particular, both the ECBilt-CLIO and IPSL simulations show asymmetric cooling in the two Arctic regions and both have a greater cooling in the North Atlantic than in the North Pacific. The first transient simulations (Timm and Timmermann, 2007) are based on the ECBilt-CLIO model with a horizontal resolution of about and covering the past 21 kyr, with the external forcing of ice cover, greenhouse gas concentration, and orbital configuration. The un-accelerated simulations using ECBilt-CLIO similarly reveal a regional asymmetry in temperature variability during the early to mid- to late Holocene, with greater cooling in the North Atlantic (−0.26 ∘C cooling) than in the North Pacific (−0.02 ∘C cooling) (significant at the 90 % confidence level; Fig. S3 in the Supplement). The second non-accelerated simulations based on the IPSL ESM (Braconnot et al., 2019) explored the relationship between climate change and vegetation over the past 6000 years. The IPSL ESM also captures the asymmetry characteristics of Arctic temperature variability between the mid-Holocene (4–6 ka) and late Holocene (0–2 ka), with − 0.14 ∘C cooling in the Pacific Arctic and − 0.18 ∘C cooling in the Atlantic Arctic (Fig. S3 in the Supplement). However, the result of IPSL was not significant. The asymmetric changes are more pronounced if we focus only on the North Atlantic and North Pacific ocean regions. However, the results of TraCE-21ka are slightly different. TraCE-21ka is forced by the Earth's orbital parameter forcing, greenhouse gas forcing, meltwater flux forcing, and continental ice sheet forcing. Its results show that the difference in annual mean temperature between the early to mid-Holocene and late Holocene is significantly cooler in the Arctic and that there is a regional asymmetry in temperature changes between the two regions, with − 0,94 ∘C cooling in the Pacific Arctic and − 0.06 ∘C cooling in the Atlantic Arctic (significant at the 90 % confidence level; Fig. S3 in the Supplement). However, unlike NNU-Hol, the cooling in the Atlantic Arctic is smaller in magnitude than that in the Pacific Arctic in the asymmetric change in temperature in TraCE-21ka. This result might be attributed to the different external forcings of TraCE-21ka and NNU-Hol: there is still considerable residual ice sheet and freshwater discharge in TraCE-21ka at about 8 ka which is not present in NNU-Hol.
Earlier work was more focused on the effects of the Arctic amplification in recent decades. Based on the observation data, it is assumed that AA will further increase the possibility of extreme weather in midlatitude regions by increasing the temperature gradient from the Equator to the pole in dynamic ways. However, the mechanism behind this is still not fully understood (Xue et al., 2017; Cohen et al., 2018; Chen et al., 2015; Vavrus, 2018; Screen, 2017). For long-term Arctic climate research, earlier work is mainly the study of temperature trend changes based on reconstructed proxy data (Kaufman et al., 2004; Meyer et al., 2015; Briner et al., 2016). This study provides additional insights into Holocene timescales into the regional characteristics of Arctic temperature changes. With the addition of our model analysis, this study improves our understanding of the drivers of variability changes in Arctic temperature on centennial and millennial timescales. The role of sea ice and sea level pressure offers an explanation for the regional differences in Arctic temperature trends.
The study demonstrates that the asymmetry of the orbital forcing-only simulations is greater than that of the full forcing simulation. A stronger response to orbital forcing implies that the other forcings (e.g., GHG) may compensate for this asymmetry. The stronger response to orbital forcing implies that the combined effects of other forcings (e.g., solar irradiance, volcanic eruptions, greenhouse gases, and land use and land cover) and internal climate variability may compensate for the temperature asymmetry pattern. In particular, volcanic eruptions have a larger impact on temperature at a short timescale in the region, while greenhouse gas forcing plays a more critical role as a driver of future climate than orbital forcing. Nevertheless, the individual contribution of each forcing has not been clearly investigated in our study. To fully understand the potential compensation effects induced by volcanic eruption, TSI (total solar irradiance), and GHG forcing, the next steps regarding paleo-Arctic temperature studies are compiling more high-resolution, seasonal paleoclimate temperature data, employing and analyzing the results of more comprehensive state-of-the-art simulations of different forcings (e.g., TraCE-21ka, Liu et al., 2014; IPSL, Braconnot et al., 2019) for reducing the uncertainty in the models, and validating the roles of different forcings.
The findings from this paper suggest that Arctic temperature has an asymmetric cooling trend with more cooling over the Atlantic Arctic (− 1.54∘) than the Pacific Arctic (− 0.61∘) during the Holocene, based on the Temperature 12k database (Kaufman et al., 2020). In our modeling results, a similar asymmetric change in temperature in the Arctic can be reproduced by CESM, dominated by orbital forcing. Our model simulations show the strongest cooling in the Arctic Ocean, Greenland, and the North Atlantic, while the temperature in northern Eurasia and northern Canada shows a warming trend. There is a seasonal difference in the asymmetric cooling trend, which is dominated by the DJF temperature variability. The Arctic dipole mode of sea level pressure and sea ice play a major role in asymmetric temperature changes. Using non-accelerated simulations to test the robustness of our results regarding the Arctic temperature asymmetry, we found that the ECBilt-CLIO and IPSL simulations are similar to our results, while TraCE-21ka shows the opposite asymmetry.
The proxy data are available at https://doi.org/10.25921/4RY2-G808 (Kaufman et al., 2020). Due to their large size, the climate model simulation data used in the current study are available from the author Hongyue Zhang and corresponding author Jian Liu on reasonable request.
The supplement related to this article is available online at: https://doi.org/10.5194/cp-19-665-2023-supplement.
HZ: conceptualization, methodology, formal analysis, validation, writing original draft, revision. JS: conceptualization, formal analysis, review, editing, supervision. ZL: conceptualization, methodology, formal analysis, review, editing. JL: methodology, review, editing, supervision. WS: conceptualization, data curation. LW: methodology, data curation. All authors contributed to the writing of the paper.
The contact author has declared that none of the authors has any competing interests.
Publisher’s note: Copernicus Publications remains neutral with regard to jurisdictional claims in published maps and institutional affiliations.
This work was jointly supported by the National Natural Science Foundation of China (grant nos. 42130604, 42105044, 41971108, 42105044, and 42111530182) and the Priority Academic Program Development of Jiangsu Higher Education Institutions (grant no. 164320H116). Jesper Sjolte was supported by the strategic research program of ModEling the Regional and Global Earth system (MERGE) hosted by the Faculty of Science at Lund University. Zhengyao Lu received funding from FORMAS mobility (grant no. 2020-02267)
This research has been supported by the National Natural Science Foundation of China (grant nos. 42130604, 42105044, 41971108, and 42111530182), the Priority Academic Program Development of Jiangsu Higher Education Institutions (grant no. 164320H116), and the Svenska Forskningsrådet Formas (grant no. 2020-02267).
This paper was edited by Hugues Goosse and reviewed by two anonymous referees.
Aagaard, K. and Carmack, E. C.: The role of sea ice and other fresh water in the Arctic circulation, J. Geophys. Res.-Oceans, 94, 14485–14498, https://doi.org/10.1029/JC094iC10p14485, 1989.
Alekseev, G. V., Johannessen, O. M., Korablev, A. A., Ivanov, V. V., and Kovalevsky, D. V.: Interannual variability in water masses in the Greenland Sea and adjacent areas, Polar Res., 20, 201–208, https://doi.org/10.1111/j.1751-8369.2001.tb00057.x, 2001.
Bader, J., Jungclaus, J., Krivova, N., Lorenz, S., Maycock, A., Raddatz, T., Schmidt, H., Toohey, M., Wu, C.-J., and Claussen, M.: Global temperature modes shed light on the Holocene temperature conundrum, Nat. Commun., 11, 4726, https://doi.org/10.1038/s41467-020-18478-6, 2020.
Barnes, E. A. and Screen, J. A.: The impact of Arctic warming on the midlatitude jet-stream: Can it? Has it? Will it?, WIRES Clim. Change, 6, 277–286, https://doi.org/10.1002/wcc.337, 2015.
Berger, A.: Long-Term Variations of Daily Insolation and Quaternary Climatic Changes, J. Atmos. Sci., 35, 2362–2367, https://doi.org/10.1175/1520-0469(1978)035<2362:LTVODI>2.0.CO;2, 1978.
Blackport, R. and Kushner, P. J.: The Role of Extratropical Ocean Warming in the Coupled Climate Response to Arctic Sea Ice Loss, J. Climate, 31, 9193–9206, https://doi.org/10.1175/JCLI-D-18-0192.1, 2018.
Braconnot, P., Otto-Bliesner, B., Harrison, S., Joussaume, S., Peterchmitt, J.-Y., Abe-Ouchi, A., Crucifix, M., Driesschaert, E., Fichefet, Th., Hewitt, C. D., Kageyama, M., Kitoh, A., Loutre, M.-F., Marti, O., Merkel, U., Ramstein, G., Valdes, P., Weber, L., Yu, Y., and Zhao, Y.: Results of PMIP2 coupled simulations of the Mid-Holocene and Last Glacial Maximum – Part 2: feedbacks with emphasis on the location of the ITCZ and mid- and high latitudes heat budget, Clim. Past, 3, 279–296, https://doi.org/10.5194/cp-3-279-2007, 2007.
Braconnot, P., Zhu, D., Marti, O., and Servonnat, J.: Strengths and challenges for transient Mid- to Late Holocene simulations with dynamical vegetation, Clim. Past, 15, 997–1024, https://doi.org/10.5194/cp-15-997-2019, 2019.
Briner, J. P., McKay, N. P., Axford, Y., Bennike, O., Bradley, R. S., de Vernal, A., Fisher, D., Francus, P., Fréchette, B., Gajewski, K., Jennings, A., Kaufman, D. S., Miller, G., Rouston, C., and Wagner, B.: Holocene climate change in Arctic Canada and Greenland, Quaternary Sci. Rev., 147, 340–364, https://doi.org/10.1016/j.quascirev.2016.02.010, 2016.
Chen, F., Yu, Z., Yang, M., Ito, E., Wang, S., Madsen, D. B., Huang, X., Zhao, Y., Sato, T., John B. Birks, H., Boomer, I., Chen, J., An, C., and Wünnemann, B.: Holocene moisture evolution in arid central Asia and its out-of-phase relationship with Asian monsoon history, Quaternary Sci. Rev., 27, 351–364, https://doi.org/10.1016/j.quascirev.2007.10.017, 2008.
Chen, G., Lu, J., Burrows, D. A., and Leung, L. R.: Local finite-amplitude wave activity as an objective diagnostic of midlatitude extreme weather, Geophys. Res. Lett., 42, 10 952–10 960, https://doi.org/10.1002/2015GL066959, 2015.
Choi, N., Kim, K.-M., Lim, Y.-K., and Lee, M.-I.: Decadal changes in the leading patterns of sea level pressure in the Arctic and their impacts on the sea ice variability in boreal summer, The Cryosphere, 13, 3007–3021, https://doi.org/10.5194/tc-13-3007-2019, 2019.
Cohen, J.: An observational analysis: Tropical relative to Arctic influence on midlatitude weather in the era of Arctic amplification, Geophys. Res. Lett., 43, 5287–5294, https://doi.org/10.1002/2016GL069102, 2016.
Cohen, J., Screen, J. A., Furtado, J. C., Barlow, M., Whittleston, D., Coumou, D., Francis, J., Dethloff, K., Entekhabi, D., Overland, J., and Jones, J.: Recent Arctic amplification and extreme mid-latitude weather, Nat. Geosci., 7, 627–637, https://doi.org/10.1038/ngeo2234, 2014.
Cohen, J., Pfeiffer, K., and Francis, J. A.: Warm Arctic episodes linked with increased frequency of extreme winter weather in the United States, Nat. Commun., 9, 869, https://doi.org/10.1038/s41467-018-02992-9, 2018.
Delworth, T. L. and Knutson, T. R.: Simulation of Early 20th Century Global Warming, Science, 287, 2246–2250, https://doi.org/10.1126/science.287.5461.2246, 2000.
Deser, C., Tomas, R. A., and Sun, L.: The Role of Ocean–Atmosphere Coupling in the Zonal-Mean Atmospheric Response to Arctic Sea Ice Loss, J. Climate, 28, 2168–2186, https://doi.org/10.1175/JCLI-D-14-00325.1, 2015.
Deser, C., Sun, L., Tomas, R. A., and Screen, J.: Does ocean coupling matter for the northern extratropical response to projected Arctic sea ice loss?, Geophys. Res. Lett., 43, 2149–2157, https://doi.org/10.1002/2016GL067792, 2016.
de Vernal, A., Hillaire-Marcel, C., and Darby, D. A.: Variability of sea ice cover in the Chukchi Sea (western Arctic Ocean) during the Holocene: Holocene Sea Ice in the Chukchi Sea, Paleoceanography, 20, PA4018, https://doi.org/10.1029/2005PA001157, 2005.
Francis, J. and Skific, N.: Evidence linking rapid Arctic warming to mid-latitude weather patterns, Philos. T. R. Soc. A, 373, 20140170, https://doi.org/10.1098/rsta.2014.0170, 2015.
Francis, J. A. and Hunter, E.: Drivers of declining sea ice in the Arctic winter: A tale of two seas, Geophys. Res. Lett., 34, L17503, https://doi.org/10.1029/2007GL030995, 2007.
Francis, J. A. and Vavrus, S. J.: Evidence linking Arctic amplification to extreme weather in mid-latitudes, Geophys. Res. Lett., 39, L06801, https://doi.org/10.1029/2012GL051000, 2012.
Francis, J. A. and Vavrus, S. J.: Evidence for a wavier jet stream in response to rapid Arctic warming, Environ. Res. Lett., 10, 014005, https://doi.org/10.1088/1748-9326/10/1/014005, 2015.
Funder, S., Goosse, H., Jepsen, H., Kaas, E., Kjær, K. H., Korsgaard, N. J., Larsen, N. K., Linderson, H., Lyså, A., Möller, P., Olsen, J., and Willerslev, E.: A 10,000-Year Record of Arctic Ocean Sea-Ice Variability – View from the Beach, Science, 333, 747–750, https://doi.org/10.1126/science.1202760, 2011.
Gajewski, K.: Quantitative reconstruction of Holocene temperatures across the Canadian Arctic and Greenland, Global Planet. Change, 128, 14–23, https://doi.org/10.1016/j.gloplacha.2015.02.003, 2015.
Goosse, H. and Fichefet, T.: Importance of ice-ocean interactions for the global ocean circulation: A model study, J. Geophys. Res.-Oceans, 104, 23337–23355, https://doi.org/10.1029/1999JC900215, 1999.
Grieser, J. and Schonwiese, C.-D.: Parameterization of Spatio-temporal Patterns of Volcanic Aerosol Induced Stratospheric Optical Depth and its Climate Radiative Forcing, Atmósfera, 12, 111–133, 1999.
Hanslik, D., Jakobsson, M., Backman, J., Björck, S., Sellén, E., O'Regan, M., Fornaciari, E., and Skog, G.: Quaternary Arctic Ocean sea ice variations and radiocarbon reservoir age corrections, Quaternary Sci. Rev., 29, 3430–3441, https://doi.org/10.1016/j.quascirev.2010.06.011, 2010.
Hoerling, M. P., Hurrell, J. W., and Xu, T.: Tropical Origins for Recent North Atlantic Climate Change, Science, 292, 90–92, https://doi.org/10.1126/science.1058582, 2001.
Holland, M. M. and Bitz, C. M.: Polar amplification of climate change in coupled models, Clim. Dynam., 21, 221–232, https://doi.org/10.1007/s00382-003-0332-6, 2003.
Holton, J. R., Haynes, P. H., McIntyre, M. E., Douglass, A. R., Rood, R. B., and Pfister, L.: Stratosphere-troposphere exchange, Rev. Geophys., 33, 403–439, https://doi.org/10.1029/95RG02097, 1995.
Hurrell, J. W.: Decadal Trends in the North Atlantic Oscillation: Regional Temperatures and Precipitation, Science, 269, 676–679, https://doi.org/10.1126/science.269.5224.676, 1995.
Jenkins, M. and Dai, A.: The Impact of Sea-Ice Loss on Arctic Climate Feedbacks and Their Role for Arctic Amplification, Geophys. Res. Lett., 48, e2021GL094599, https://doi.org/10.1029/2021GL094599, 2021.
Jennings, A. E., Knudsen, K. L., Hald, M., Hansen, C. V., and Andrews, J. T.: A mid-Holocene shift in Arctic sea-ice variability on the East Greenland Shelf, The Holocene, 12, 49–58, https://doi.org/10.1191/0959683602hl519rp, 2002.
Jing, Y., Liu, J., and Wan, L.: Comparison of climate responses to orbital forcing at different latitudes during the Holocene, Quatern. Int., 622, 65–76, https://doi.org/10.1016/j.quaint.2022.02.004, 2022.
Johannessen, O. M., Bengtsson, L., Miles, M. W., Kuzmina, S. I., Semenov, V. A., Alekseev, G. V., Nagurnyi, A. P., Zakharov, V. F., Bobylev, L. P., Pettersson, L. H., Hasselmann, K., and Cattle, H. P.: Arctic climate change: observed and modelled temperature and sea-ice variability, Tellus A, 56, 328–341, https://doi.org/10.3402/tellusa.v56i4.14418, 2004.
Jones, P. D. and Moberg, A.: Hemispheric and Large-Scale Surface Air Temperature Variations: An Extensive Revision and an Update to 2001, J. Climate, 16, 206–223, https://doi.org/10.1175/1520-0442(2003)016<0206:HALSSA>2.0.CO;2, 2003.
Jonkers, L., Cartapanis, O., Langner, M., McKay, N., Mulitza, S., Strack, A., and Kucera, M.: Integrating palaeoclimate time series with rich metadata for uncertainty modelling: strategy and documentation of the PalMod 130k marine palaeoclimate data synthesis, Earth Syst. Sci. Data, 12, 1053–1081, https://doi.org/10.5194/essd-12-1053-2020, 2020.
Joos, F. and Spahni, R.: Rates of change in natural and anthropogenic radiative forcing over the past 20,000 years, P. Natl. Acad. Sci. USA, 105, 1425–1430, https://doi.org/10.1073/pnas.0707386105, 2008.
Kaufman, D., McKay, N., Routson, C., Erb, M., Davis, B., Heiri, O., Jaccard, S., Tierney, J., Dätwyler, C., Axford, Y., Brussel, T., Cartapanis, O., Chase, B., Dawson, A., de Vernal, A., Engels, S., Jonkers, L., Marsicek, J., Moffa-Sánchez, P., Morrill, C., Orsi, A., Rehfeld, K., Saunders, K., Sommer, P. S., Thomas, E., Tonello, M., Tóth, M., Vachula, R., Andreev, A., Bertrand, S., Biskaborn, B., Bringué, M., Brooks, S., Caniupán, M., Chevalier, M., Cwynar, L., Emile-Geay, J., Fegyveresi, J., Feurdean, A., Finsinger, W., Fortin, M.-C., Foster, L., Fox, M., Gajewski, K., Grosjean, M., Hausmann, S., Heinrichs, M., Holmes, N., Ilyashuk, B., Ilyashuk, E., Juggins, S., Khider, D., Koinig, K., Langdon, P., Larocque-Tobler, I., Li, J., Lotter, A., Luoto, T., Mackay, A., Magyari, E., Malevich, S., Mark, B., Massaferro, J., Montade, V., Nazarova, L., Novenko, E., Pařil, P., Pearson, E., Peros, M., Pienitz, R., Płóciennik, M., Porinchu, D., Potito, A., Rees, A., Reinemann, S., Roberts, S., Rolland, N., Salonen, S., Self, A., Seppä, H., Shala, S., St-Jacques, J.-M., Stenni, B., Syrykh, L., Tarrats, P., Taylor, K., van den Bos, V., Velle, G., Wahl, E., Walker, I., Wilmshurst, J., Zhang, E., and Zhilich, S.: A global database of Holocene paleotemperature records, Sci. Data, 7, 115, https://doi.org/10.1038/s41597-020-0445-3, 2020.
Kaufman, D. S., Ager, T. A., Anderson, N. J., Anderson, P. M., Andrews, J. T., Bartlein, P. J., Brubaker, L. B., Coats, L. L., Cwynar, L. C., Duvall, M. L., Dyke, A. S., Edwards, M. E., Eisner, W. R., Gajewski, K., Geirsdóttir, A., Hu, F. S., Jennings, A. E., Kaplan, M. R., Kerwin, M. W., Lozhkin, A. V., MacDonald, G. M., Miller, G. H., Mock, C. J., Oswald, W. W., Otto-Bliesner, B. L., Porinchu, D. F., Rühland, K., Smol, J. P., Steig, E. J., and Wolfe, B. B.: Holocene thermal maximum in the western Arctic (0–180∘ W), Quaternary Sci. Rev., 23, 529–560, https://doi.org/10.1016/j.quascirev.2003.09.007, 2004.
Kaufman, D. S., Schneider, D. P., McKay, N. P., Ammann, C. M., Bradley, R. S., Briffa, K. R., Miller, G. H., Otto-Bliesner, B. L., Overpeck, J. T., Vinther, B. M., Arctic Lakes 2k Project Members, Abbott, M., Axford, Y., Bird, B., Birks, H. J. B., Bjune, A. E., Briner, J., Cook, T., Chipman, M., Francus, P., Gajewski, K., Geirsdóttir, Á., Hu, F. S., Kutchko, B., Lamoureux, S., Loso, M., MacDonald, G., Peros, M., Porinchu, D., Schiff, C., Seppä, H., and Thomas, E.: Recent Warming Reverses Long-Term Arctic Cooling, Science, 325, 1236–1239, https://doi.org/10.1126/science.1173983, 2009.
Kaufman, D. S., McKay, N. P., and Routson, C.: NOAA/WDS Paleoclimatology – Temperature 12k Database, NOAA National Centers for Environmental Information [data set], https://doi.org/10.25921/4ry2-g808, 2020.
Kay, J. E., L'Ecuyer, T., Gettelman, A., Stephens, G., and O'Dell, C.: The contribution of cloud and radiation anomalies to the 2007 Arctic sea ice extent minimum, Geophys. Res. Lett., 35, L08503, https://doi.org/10.1029/2008GL033451, 2008.
Klein Goldewijk, K., Beusen, A., Doelman, J., and Stehfest, E.: Anthropogenic land use estimates for the Holocene – HYDE 3.2, Earth Syst. Sci. Data, 9, 927–953, https://doi.org/10.5194/essd-9-927-2017, 2017.
Kutzbach, J. E., Liu, X., Liu, Z., and Chen, G.: Simulation of the evolutionary response of global summer monsoons to orbital forcing over the past 280,000 years, Clim. Dynam., 30, 567–579, https://doi.org/10.1007/s00382-007-0308-z, 2008.
Larsen, N. K., Kjær, K. H., Lecavalier, B., Bjørk, A. A., Colding, S., Huybrechts, P., Jakobsen, K. E., Kjeldsen, K. K., Knudsen, K.-L., Odgaard, B. V., and Olsen, J.: The response of the southern Greenland ice sheet to the Holocene thermal maximum, Geology, 43, 291–294, https://doi.org/10.1130/G36476.1, 2015.
Liu, Z., Otto-Bliesner, B. L., He, F., Brady, E. C., Tomas, R., Clark, P. U., Carlson, A. E., Lynch-Stieglitz, J., Curry, W., Brook, E., Erickson, D., Jacob, R., Kutzbach, J., and Cheng, J.: Transient Simulation of Last Deglaciation with a New Mechanism for Bølling-Allerød Warming, Science, 325, 310–314, https://doi.org/10.1126/science.1171041, 2009.
Liu, Z., Lu, Z., Wen, X., Otto-Bliesner, B. L., Timmermann, A., and Cobb, K. M.: Evolution and forcing mechanisms of El Niño over the past 21,000 years, Nature, 515, 550–553, https://doi.org/10.1038/nature13963, 2014.
Lorenz, S. J. and Lohmann, G.: Acceleration technique for Milankovitch type forcing in a coupled atmosphere-ocean circulation model: method and application for the holocene, Clim. Dynam., 23, 727–743, 2004.
Lu, Z. and Liu, Z.: Orbital modulation of ENSO seasonal phase locking, Clim. Dynam., 52, 4329–4350, https://doi.org/10.1007/s00382-018-4382-1, 2019.
Malevich, S. B., Vetter, L., and Tierney, J. E.: Global Core Top Calibration of δ18O in Planktic Foraminifera to Sea Surface Temperature, Paleoceanography and Paleoclimatology, 34, 1292–1315, https://doi.org/10.1029/2019PA003576, 2019.
Mandel, I. and Lipovetsky, S.: Climate Change Report IPCC 2021 – A Chimera of Science and Politics, Social Science Research Network, Rochester, NY, https://doi.org/10.2139/ssrn.3913788, 2021.
Marcott, S. A., Shakun, J. D., Clark, P. U., and Mix, A. C.: A reconstruction of regional and global temperature for the past 11,300 years, Science, 339, 1198–1201, https://doi.org/10.1126/science.1228026, 2013.
Marsicek, J., Shuman, B. N., Bartlein, P. J., Shafer, S. L., and Brewer, S.: Reconciling divergent trends and millennial variations in Holocene temperatures, Nature, 554, 92–96, https://doi.org/10.1038/nature25464, 2018.
Meyer, H., Opel, T., Laepple, T., Dereviagin, A. Y., Hoffmann, K., and Werner, M.: Long-term winter warming trend in the Siberian Arctic during the mid- to late Holocene, Nat. Geosci., 8, 122–125, https://doi.org/10.1038/ngeo2349, 2015.
Müller, J., Werner, K., Stein, R., Fahl, K., Moros, M., and Jansen, E.: Holocene cooling culminates in sea ice oscillations in Fram Strait, Quaternary Sci. Rev., 47, 1–14, https://doi.org/10.1016/j.quascirev.2012.04.024, 2012.
Niebauer, H. J., Bond, N., Yakunin, L. P., and Plotnikov, V.: An update on the climatology and sea ice of the Bering Sea, Dynamics of the Bering Sea, edited by: Loughlin, T. and Ohtani, K., University of Alaska Sea Grant, Fairbanks, AK, 29–59, 1999.
North, G. R., Bell, T. L., Cahalan, R. F., and Moeng, F. J.: Sampling Errors in the Estimation of Empirical Orthogonal Functions, Mon. Weather Rev., 110, 699–706, https://doi.org/10.1175/1520-0493(1982)110<0699:SEITEO>2.0.CO;2, 1982.
Overland, J. E. and Wang, M.: Increased Variability in the Early Winter Subarctic North American Atmospheric Circulation, J. Climate, 28, 7297–7305, https://doi.org/10.1175/JCLI-D-15-0395.1, 2015.
Park, H.-S., Kim, S.-J., Seo, K.-H., Stewart, A. L., Kim, S.-Y., and Son, S.-W.: The impact of Arctic sea ice loss on mid-Holocene climate, Nat. Commun., 9, 4571, https://doi.org/10.1038/s41467-018-07068-2, 2018.
Polyakov, I. V. and Johnson, M. A.: Arctic decadal and interdecadal variability, Geophys. Res. Lett., 27, 4097–4100, https://doi.org/10.1029/2000GL011909, 2000.
Polyakov, I. V., Alekseev, G. V., Bekryaev, R. V., Bhatt, U., Colony, R. L., Johnson, M. A., Karklin, V. P., Makshtas, A. P., Walsh, D., and Yulin, A. V.: Observationally based assessment of polar amplification of global warming, Geophys. Res. Lett., 29, 25-1–25-4, https://doi.org/10.1029/2001GL011111, 2002.
Ragner, C.: The 21st Century — Turning Point for the Northern Sea Route?: Proceedings of the Northern Sea Route User Conference, Oslo, 18–20 November 1999, https://doi.org/10.1007/978-94-017-3228-4, 2000.
Rahmstorf, S.: Shifting seas in the greenhouse?, Nature, 399, 523–524, https://doi.org/10.1038/21066, 1999.
Renssen, H., Goosse, H., Fichefet, T., Brovkin, V., Driesschaert, E., and Wolk, F.: Simulating the Holocene climate evolution at northern high latitudes using a coupled atmosphere-sea ice-ocean-vegetation model, Clim. Dynam., 24, 23–43, https://doi.org/10.1007/s00382-004-0485-y, 2005.
Renssen, H., Seppä, H., Crosta, X., Goosse, H., and Roche, D. M.: Global characterization of the Holocene Thermal Maximum, Quaternary Sci. Rev., 48, 7–19, https://doi.org/10.1016/j.quascirev.2012.05.022, 2012.
Rodionov, S. N., Overland, J. E., and Bond, N. A.: The Aleutian Low and Winter Climatic Conditions in the Bering Sea. Part I: Classification, J. Climate, 18, 160–177, https://doi.org/10.1175/JCLI3253.1, 2005.
Routson, C. C., McKay, N. P., Kaufman, D. S., Erb, M. P., Goosse, H., Shuman, B. N., Rodysill, J. R., and Ault, T.: Mid-latitude net precipitation decreased with Arctic warming during the Holocene, Nature, 568, 83–87, https://doi.org/10.1038/s41586-019-1060-3, 2019.
Screen, J. A.: Far-flung effects of Arctic warming, Nat. Geosci., 10, 253–254, https://doi.org/10.1038/ngeo2924, 2017.
Screen, J. A. and Simmonds, I.: Amplified mid-latitude planetary waves favour particular regional weather extremes, Nat. Clim. Change, 4, 704–709, https://doi.org/10.1038/nclimate2271, 2014.
Serreze, M. C. and Barry, R. G.: Processes and impacts of Arctic amplification: A research synthesis, Global Planet. Change, 77, 85–96, https://doi.org/10.1016/j.gloplacha.2011.03.004, 2011.
Sigl, M., Winstrup, M., McConnell, J. R., Welten, K. C., Plunkett, G., Ludlow, F., Büntgen, U., Caffee, M., Chellman, N., Dahl-Jensen, D., Fischer, H., Kipfstuhl, S., Kostick, C., Maselli, O. J., Mekhaldi, F., Mulvaney, R., Muscheler, R., Pasteris, D. R., Pilcher, J. R., Salzer, M., Schüpbach, S., Steffensen, J. P., Vinther, B. M., and Woodruff, T. E.: Timing and climate forcing of volcanic eruptions for the past 2,500 years, Nature, 523, 543–549, https://doi.org/10.1038/nature14565, 2015.
Skeie, P.: Meridional flow variability over the Nordic Seas in the Arctic oscillation framework, Geophys. Res. Lett., 27, 2569–2572, https://doi.org/10.1029/2000GL011529, 2000.
Smith, D. M., Screen, J. A., Deser, C., Cohen, J., Fyfe, J. C., García-Serrano, J., Jung, T., Kattsov, V., Matei, D., Msadek, R., Peings, Y., Sigmond, M., Ukita, J., Yoon, J.-H., and Zhang, X.: The Polar Amplification Model Intercomparison Project (PAMIP) contribution to CMIP6: investigating the causes and consequences of polar amplification, Geosci. Model Dev., 12, 1139–1164, https://doi.org/10.5194/gmd-12-1139-2019, 2019.
Smith, R. S. and Gregory, J.: The last glacial cycle: transient simulations with an AOGCM, Clim. Dynam., 38, 1545–1559, https://doi.org/10.1007/s00382-011-1283-y, 2012.
Stabeno, P. J., Bond, N. A., Kachel, N. B., Salo, S. A., and Schumacher, J. D.: On the temporal variability of the physical environment over the south-eastern Bering Sea, Fish. Oceanogr., 10, 81–98, https://doi.org/10.1046/j.1365-2419.2001.00157.x, 2001.
Sundqvist, H. S., Kaufman, D. S., McKay, N. P., Balascio, N. L., Briner, J. P., Cwynar, L. C., Sejrup, H. P., Seppä, H., Subetto, D. A., Andrews, J. T., Axford, Y., Bakke, J., Birks, H. J. B., Brooks, S. J., de Vernal, A., Jennings, A. E., Ljungqvist, F. C., Rühland, K. M., Saenger, C., Smol, J. P., and Viau, A. E.: Arctic Holocene proxy climate database – new approaches to assessing geochronological accuracy and encoding climate variables, Clim. Past, 10, 1605–1631, https://doi.org/10.5194/cp-10-1605-2014, 2014.
Tierney, J. E. and Tingley, M. P.: A Bayesian, spatially-varying calibration model for the TEX86 proxy, Geochim. Cosmochim. Ac., 127, 83–106, https://doi.org/10.1016/j.gca.2013.11.026, 2014.
Tierney, J. E. and Tingley, M. P.: BAYSPLINE: A New Calibration for the Alkenone Paleothermometer, Paleoceanography and Paleoclimatology, 33, 281–301, https://doi.org/10.1002/2017PA003201, 2018.
Tierney, J. E., Malevich, S. B., Gray, W., Vetter, L., and Thirumalai, K.: Bayesian Calibration of the Mg Ca Paleothermometer in Planktic Foraminifera, Paleoceanography and Paleoclimatology, 34, 2005–2030, https://doi.org/10.1029/2019PA003744, 2019.
Timm, O. and Timmermann, A.: Simulation of the Last 21 000 Years Using Accelerated Transient Boundary Conditions, J. Climate, 20, 4377–4401, https://doi.org/10.1175/JCLI4237.1, 2007.
Timmermann, A., Friedrich, T., Timm, O. E., Chikamoto, M. O., Abe-Ouchi, A., and Ganopolski, A.: Modeling Obliquity and CO2 Effects on Southern Hemisphere Climate during the Past 408 ka, J. Climate, 27, 1863–1875, https://doi.org/10.1175/JCLI-D-13-00311.1, 2014.
Varma, V., Prange, M., Merkel, U., Kleinen, T., Lohmann, G., Pfeiffer, M., Renssen, H., Wagner, A., Wagner, S., and Schulz, M.: Holocene evolution of the Southern Hemisphere westerly winds in transient simulations with global climate models, Clim. Past, 8, 391–402, https://doi.org/10.5194/cp-8-391-2012, 2012.
Vavrus, S. J.: The Influence of Arctic Amplification on Mid-latitude Weather and Climate, Curr. Clim. Change Rep., 4, 238–249, https://doi.org/10.1007/s40641-018-0105-2, 2018.
Vieira, L. E. A., Solanki, S. K., Krivova, N. A., and Usoskin, I.: Evolution of the solar irradiance during the Holocene, A&A, 531, A6, https://doi.org/10.1051/0004-6361/201015843, 2011.
Wan, L., Jian L., Chaochao G., Weiyi S., Liang N., and Mi Y.: Study about influence of the Holocene volcanic eruptions on temperature variation trend by simulation, Quaternary Sciences, 40, 1597–1610, https://doi.org/10.11928/j.issn.1001-7410.2020.06.19, 2020.
Wang, J. and Ikeda, M.: Arctic oscillation and Arctic sea-ice oscillation, Geophys. Res. Lett., 27, 1287–1290, https://doi.org/10.1029/1999GL002389, 2000.
Wanner, H., Solomina, O., Grosjean, M., Ritz, S. P., and Jetel, M.: Structure and origin of Holocene cold events, Quaternary Sci. Rev., 30, 3109–3123, https://doi.org/10.1016/j.quascirev.2011.07.010, 2011.
Watanabe, E., Wang, J., Sumi, A., and Hasumi, H.: Arctic dipole anomaly and its contribution to sea ice export from the Arctic Ocean in the 20th century, Geophys. Res. Lett., 33, L23703, https://doi.org/10.1029/2006GL028112, 2006.
Wohlfahrt, J., Harrison, S. P., and Braconnot, P.: Synergistic feedbacks between ocean and vegetation on mid- and high-latitude climates during the mid-Holocene, Clim. Dynam., 22, 223–238, https://doi.org/10.1007/s00382-003-0379-4, 2004.
Wu, B., Wang, J., and Walsh, J.: Possible Feedback of Winter Sea Ice in the Greenland and Barents Seas on the Local Atmosphere, Mon. Weather Rev., 132, 1868–1876, https://doi.org/10.1175/1520-0493(2004)132<1868:PFOWSI>2.0.CO;2, 2004.
Wu, B., Wang, J., and Walsh, J. E.: Dipole Anomaly in the Winter Arctic Atmosphere and Its Association with Sea Ice Motion, J. Climate, 19, 210–225, https://doi.org/10.1175/JCLI3619.1, 2006.
Xue, D., Lu, J., Sun, L., Chen, G., and Zhang, Y.: Local increase of anticyclonic wave activity over northern Eurasia under amplified Arctic warming, Geophys. Res. Lett., 44, 3299–3308, https://doi.org/10.1002/2017GL072649, 2017.
Zhong, Y., Jahn, A., Miller, G. H., and Geirsdottir, A.: Asymmetric Cooling of the Atlantic and Pacific Arctic During the Past Two Millennia: A Dual Observation-Modeling Study, Geophys. Res. Lett., 45, 12497–12505, https://doi.org/10.1029/2018GL079447, 2018.