the Creative Commons Attribution 4.0 License.
the Creative Commons Attribution 4.0 License.
 | 07 Dec 2023
Climatic signatures in early modern European grain harvest yields
Fredrik Charpentier Ljungqvist
Bo Christiansen
Jan Esper
Heli Huhtamaa
Lotta Leijonhufvud
Christian Pfister
Andrea Seim
Martin Karl Skoglund
Peter Thejll
The association between climate variability and grain harvest yields has been an important component of food security and economy in European history. Yet, inter-regional comparisons of climate–yield relationships have been hampered by locally varying data types and the use of different statistical methods. Using a coherent statistical framework, considering the effects of diverse serial correlations on statistical significance, we assess the temperature and hydroclimate (precipitation and drought) signatures in grain harvest yields across varying environmental settings of early modern (ca. 1500–1800) Europe. An unprecedentedly large network of yield records from northern (Sweden), central (Switzerland), and southern (Spain) Europe are compared with a diverse set of seasonally and annually resolved palaeoclimate reconstructions. Considering the effects of different crop types and time series frequencies, we find within regions consistent climate–harvest yield associations characterized by a significant summer soil moisture signal in Sweden, winter temperature and precipitation signals in Switzerland, and spring and annual mean temperature signals in Spain. The regional-scale climate–harvest associations are weaker than the recently revealed climate signals in early modern grain prices but similar in strength to modern climate–harvest relationships at comparable spatial scales. This is a noteworthy finding considering the uncertainties inherent in both historical harvest and palaeoclimate data.
- Article
(5785 KB) - Full-text XML
- BibTeX
- EndNote


Agriculture has been, and still is, highly weather and climate dependent (Hoogenboom, 2000; Cantelaube and Terres, 2005; Wallach et al., 2006; White et al., 2018; Lecerf et al., 2019; Vogel et al., 2019; Heino et al., 2020). In pre-industrial Europe, when human livelihood mainly relied on grain production for calorie intake (Allen, 2000), climate variations – and associated changes in weather patterns – were of immense importance for society (Degroot et al., 2021; Pfister and Wanner, 2021; Ljungqvist et al., 2022; White et al., 2023). Stimulated by the want to place contemporary global warming impacts on agriculture into a long-term perspective, investigations of past climate–harvest yield relationships have attained an increasing interest during the past 2 decades (for a review, see Ljungqvist et al., 2021). However, much of this scholarship has focused on the consequences for food security and related societal impacts in cases of consecutive years of adverse climatic conditions for grain production (Pfister and Brázdil, 1999; Pfister, 2005; Campbell, 2016; D'Arrigo et al., 2020; Huhtamaa et al., 2022; Stoffel et al., 2022). Years and decades with cold springs and excessively wet summers were associated with unfavourable conditions for crop growth north of the Mediterranean region (Camenisch, 2015; White et al., 2018; Pfister and Wanner, 2021). Droughts could have severe negative impacts on grain harvest yields too (Esper et al., 2017; Brázdil et al., 2020; Skoglund, 2022; Związek et al., 2022; Torbenson et al., 2023), although their agricultural impacts were geographically heterogeneous (Wetter et al., 2014; Brázdil et al., 2019) as is still the case in Europe today (Beillouin et al., 2020). In general, droughts are more spatially restricted than temperature anomalies in Europe (Büntgen et al., 2010; Cook et al., 2015; Ljungqvist et al., 2019), and they are less likely than temperature anomalies to occur over consecutive years (Bunde et al., 2013; Franke et al., 2013; Esper et al., 2017).
Quantitative and semi-quantitative analyses to estimate the impact of climate variability on past grain harvests extend back to the beginning of the nineteenth century (Herschel, 1801), followed by studies by Brückner (1895), Beveridge (1921, 1922), Le Roy Ladurie (1967), Parry (1975, 1976, 1978), and Pfister (1979, 1984, 1988), among others. Despite a comprehensive body of scholarship, conducted across different disciplines, only a handful of studies have attempted to statistically quantify the effect of temperature and hydroclimate (i.e. wetness or dryness) on harvest yields of different grain types in early modern Europe. Recent advances in palaeoclimatology have facilitated this research (Ljungqvist et al., 2021), although large-scale studies or inter-regional comparisons remain rare. An exception is the study by Pei et al. (2016), who by aggregating the heterogeneous and mostly short series of yield ratio data from Slicher van Bath (1963) found an apparently regionally different recovery after the “climax” of the Little Ice Age ca. 1570–1710 (Wanner et al., 2022): yields increased well above their pre-1570 level in western Europe as opposed to eastern Europe. Those differences were due to socio-political and technological factors rather than climate (Ljungqvist et al., 2021). Most longitudinal studies have detected relatively weak, and over time unstable, climate–grain harvest relationships (Edvinsson et al., 2009; Trnka et al., 2016; Skoglund, 2022; Soens, 2022).
The difficulty in obtaining time series of harvest yields from early modern Europe (Sect 2.1) has resulted in the frequent use of grain prices as a substitute for actual harvest data. Significant effects of climate variability on grain prices at inter-annual timescales have long been established (see, e.g. Mauelshagen, 2010). However, the influence of climate variability on decadal and longer timescales remained contested until recently. This is, in large part, because price inflation (and deflation) needs to be removed from the price series, which consequently also removes long-term price changes. By applying spline filter techniques to emphasize common mid-frequency variability, Esper et al. (2017) and Ljungqvist et al. (2022) found strong negative grain price–temperature relationships (i.e. colder temperatures being associated with high prices and vice versa) across Europe, which are of episodic rather than periodic (cyclic) nature (Ljungqvist et al., 2022). These studies showed that temperature strongly influenced early modern European grain production, and thus food security, to a larger extent than previously established.
Existing studies of climate effects on historical grain yields have mainly focused on very cold periods, in particular those containing known episodes of famines (e.g. Camenisch et al., 2016; Collet, 2019; D'Arrigo et al., 2020; Huhtamaa et al., 2022), or on extreme droughts (e.g. Brázdil et al., 2019) or floods (e.g. Kiss, 2019). However, a number of studies have also investigated the relationship between climate variability and grain yields over longer time periods (e.g. Landsteiner, 2005; Pfister, 2005; Edvinsson et al., 2009; Campbell, 2010, 2016; Huhtamaa et al., 2015; Huhtamaa and Helama, 2017; Skoglund, 2022; Martin et al., 2023). These studies have broadly shown that in northern Europe, at locations close to the thermal limits for grain agriculture, growing season length and temperature determine grain yields (for a review, see Ljungqvist et al., 2021). However, in the main agricultural areas of southeastern and southern Sweden, spring and summer hydroclimate conditions were the most important climate drivers of grain yields. More specifically, maximum harvest yields were obtained after warm winters and springs followed by cool and relatively moist summers (Edvinsson et al., 2009; Holopainen et al., 2012; Ljungqvist and Huhtamaa, 2021; Skoglund, 2022).
In central Europe, including Switzerland, cold spring periods during March–April and excessive summer precipitation lowered the grain harvest (Pfister, 2005), while moist conditions during September reduced the sown acreage and resulted in washed-out soil nitrogen (Pfister, 2007). In particular, for autumn-sown rye, wet autumns and winters had adverse effects on the next season's yields (Pfister, 1988) and on seed quality (Landsteiner, 2005). Drought had locally varying impacts on grain yields in this region (Wetter et al., 2014; Brázdil et al., 2019). Most importantly, clusters of rainy autumns, cold springs, and wet mid-summers could lead to multiple consecutive harvest failures and threatened food security across large regions of central Europe (White et al., 2018; Pfister and Wanner, 2021). Similar climatic signatures in the grain harvests, but with an even larger sensitivity to wet summer conditions, have been identified in maritime regions of western Europe, including England, where high July–August temperatures also tended to increase yields (Scott et al., 1998; Michaelowa, 2001; Brunt, 2015; Campbell, 2016; Pribyl, 2017; Soens, 2022). In Switzerland, and central Europe in general, spelt, wheat, rye, and some oats were autumn-sown crops (in September and October), while all barley and some oats were spring-sown crops (in March and April depending on the altitude). The spring-sown crops were harvested during June, prior to the season of severe summer droughts, and autumn-sown crops were harvested from mid-July onwards, with the exact timing dependent on both altitude and year (Pfister, 1984).
Due to the complex topography and diverse local-scale climatic conditions, the Mediterranean, including Spain, exhibits a highly variable climate between regions (Rodrigo and Barriendos, 2008; Santiago-Caballero, 2013b; Beck et al., 2018; Llopis et al., 2018, 2020). Many drought-prone regions were historically characterized by low average yields (Santiago-Caballero, 2013a). While spring droughts were generally the dominant climatic threat (Barriendos, 2005; Llopis et al., 2020), adverse effects might also arise from cold winters and/or springs (Moreda, 2017; Izdebski et al., 2018; Moreno et al., 2020). Autumn precipitation could have an effect on harvest yields as it provided soil moisture for the subsequent growing season. Wheat was the main crop in early modern Spain, sown in October to November, harvested in June in the south and July in the north, and mainly cultivated in the basins of major rivers (Moreno et al., 2020). Because of the warm climate and regular summer droughts, the main grain growing season in Spain extended from November to May, rendering summer climate conditions largely irrelevant for grain crops (Simpson, 1996; Mørch, 1999).
Similar to what has been found for historical times, only relatively weak climate–harvest yield relationships are reported for twentieth and twenty-first century European climate–harvest relationships. For example, Trnka et al. (2016) demonstrated rather weak climate–yield relationships for barley and wheat across most of Europe during the 1901–2012 period. While barley showed often insignificant relationships to monthly or seasonal temperature and precipitation variability, wheat showed stronger relationships. The explained variance from a combination of climate variables over the April–June season exceeded 25 % for wheat for Belgium, Bulgaria, Lower Saxony (Germany), Sweden, and Tuscany (Italy), although it did not exceed 13 % on average for Europe (Trnka et al., 2016). Climatic impacts also explain only a limited proportion of the modern German year-to-year grain yield variability (Albers et al., 2017). For much of Europe, drought conditions during April–June have the greatest impact on crop yields as demonstrated for, e.g. Czechia (Hlavinka et al., 2009) and Belgium (Gobin, 2012). Beillouin et al. (2020) found stronger relationships, explaining on average 34 % of the harvest variations for a variety of crops across Europe, with 46 % and 15 %, respectively, of the variance in yields explained by climate variability in northern/western and southern Europe since the early twentieth century. However, the large-scale effects of the warming trend in recent decades on agricultural productivity in Europe have been small: for example, growing season temperature and precipitation changes between 1989 and 2009 only reduced the potential continent-wide wheat yields by ∼2.5 % (Moore and Lobell, 2015). The estimated impact on global total wheat yields is almost identical (Iizumi et al., 2018). A linear relationship between climate and harvests can only be expected within certain ranges (e.g. Yin et al., 1995; Dell et al., 2014; De Toro et al., 2015). For most crops and locations, both excessive cold or heat and wetness or dryness would have been detrimental, and hence the climate–harvest correlation is obscured by years with contradictory effects. In contemporary studies on harvest yields, it has been clearly demonstrated that a consideration of the full range of impacts of a given climate indicator exhibits non-linear relationships (Schlenker and Roberts, 2009; Beillouin et al., 2020). This obviously puts limitations on linear estimations of the harvest–climate relationships.
In this article, we evaluate the association between grain harvest yields and seasonal temperature and hydroclimate variations in northern, central, and southern Europe during the 1500–1800 period. We compare data from Sweden, Switzerland, and Spain – as well as from some other regions such as England and southern Germany – and analyse how the yields of different grain types were impacted by varying climatic conditions. The assessment of sites across a north–south transect, including diverse environmental settings, supports comparisons of regional temperature and hydroclimatic impacts on different grain species. This study is the first to systematically assess the strength of the climate signal, and its significance, in early modern (ca. 1500–1800) Swedish, Swiss, and Spanish harvest data using a range of climate reconstructions. We focus on Sweden, Switzerland, and Spain as numerous grain yield (ratio) series and tithe series are available from these countries for the early modern period and since these countries represent a north-to-south gradient in Europe. For Sweden, Switzerland, and Spain the harvest series come from major agricultural regions that can be considered representative of harvest conditions in the three countries, although we note a large environmental heterogeneity within them.
Considering previous work on modern and historical climate–harvest relationships, we hypothesize for Sweden that warm winters and springs, relatively cool summers, and moderately high precipitation in spring and early summer benefited grain yields, whereas cold and/or dry springs and summers limited yields. Grain yields in Switzerland are expected to benefit from dry autumns and winters, warm springs and dry mid-summers. For Spain, wet and warm winters and springs are expected to increase grain yields, whereas summer conditions are irrelevant to the grain harvest because of the early harvest date. Following Ljungqvist et al. (2022), we emphasize conservatively calculated significance levels using a phase-scrambling-based method to establish the climate–harvest relationships. Additionally, we test for causality, i.e. the directions between the influence of one variable on another (e.g. climate variability causes changes in harvest yields).
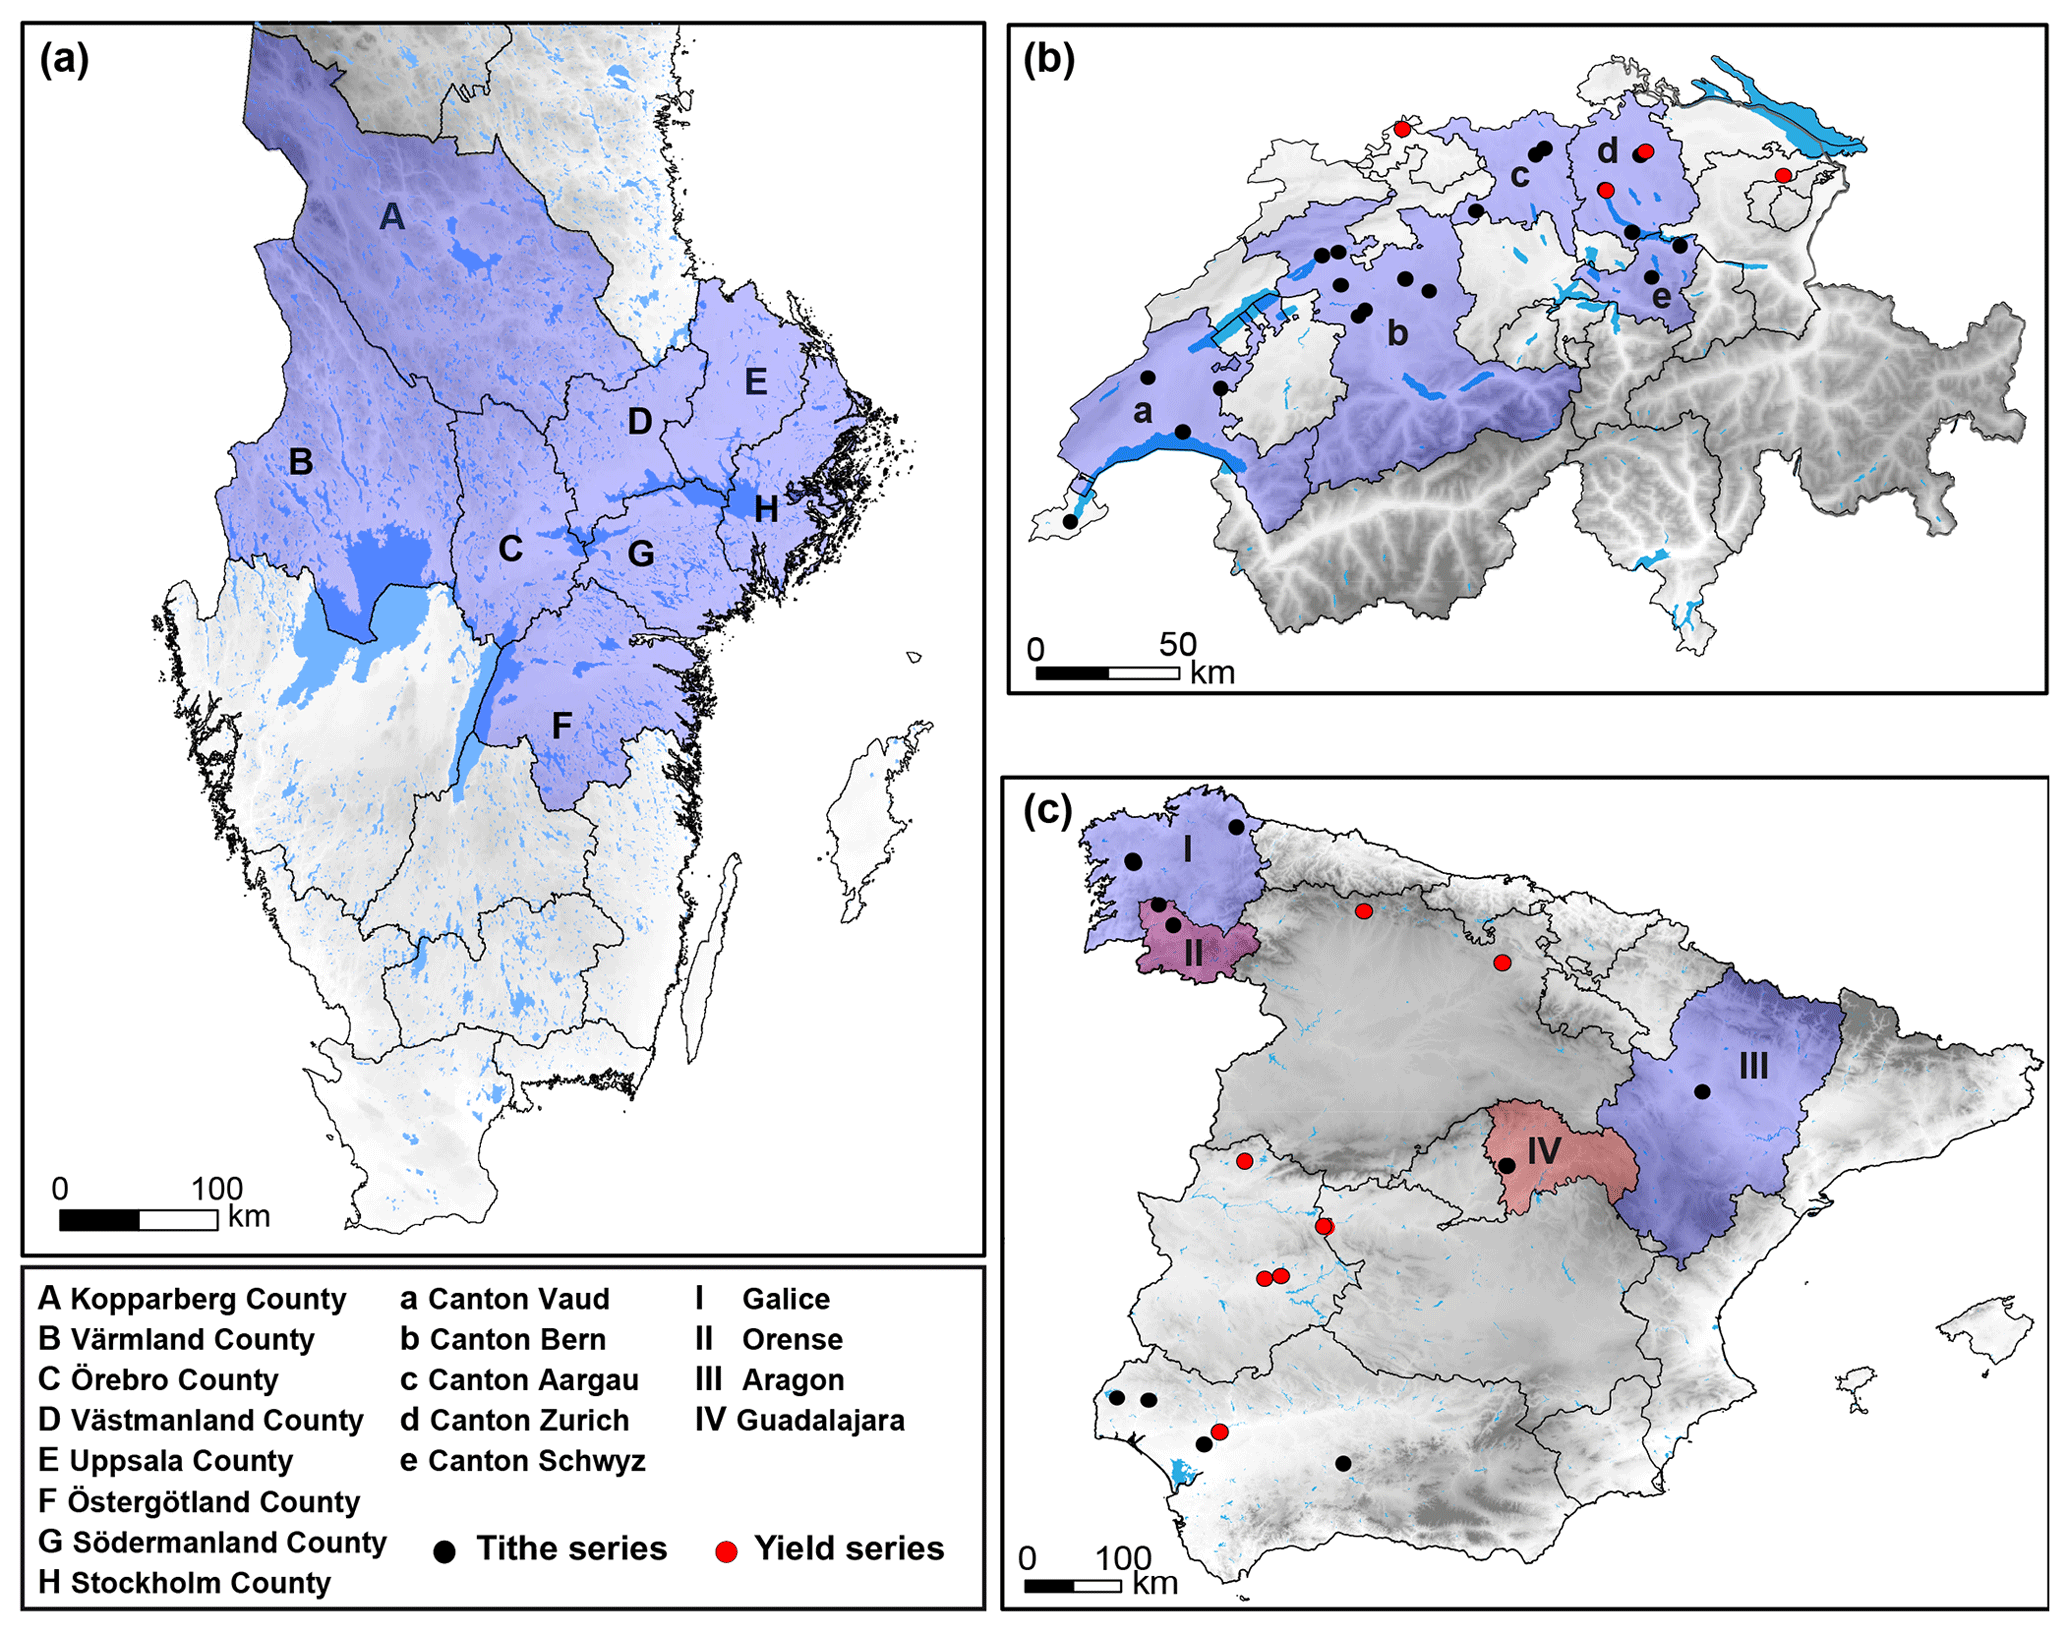
Figure 1Origin of grain tithe and yield data from (a) Sweden, (b) Switzerland, and (c) Spain. Note that for Sweden we use county-level average tithe data for barley/rye, oats, and wheat, and for Switzerland we use canton-level averages of all grain types, whereas the tithe data for Spain are derived from differently sized administrative districts. Tithe data aggregated at the provincial, canton or county level is shown in blue and yield data series in red. Due to their short length, and many data gaps, no yield series are used for Sweden.
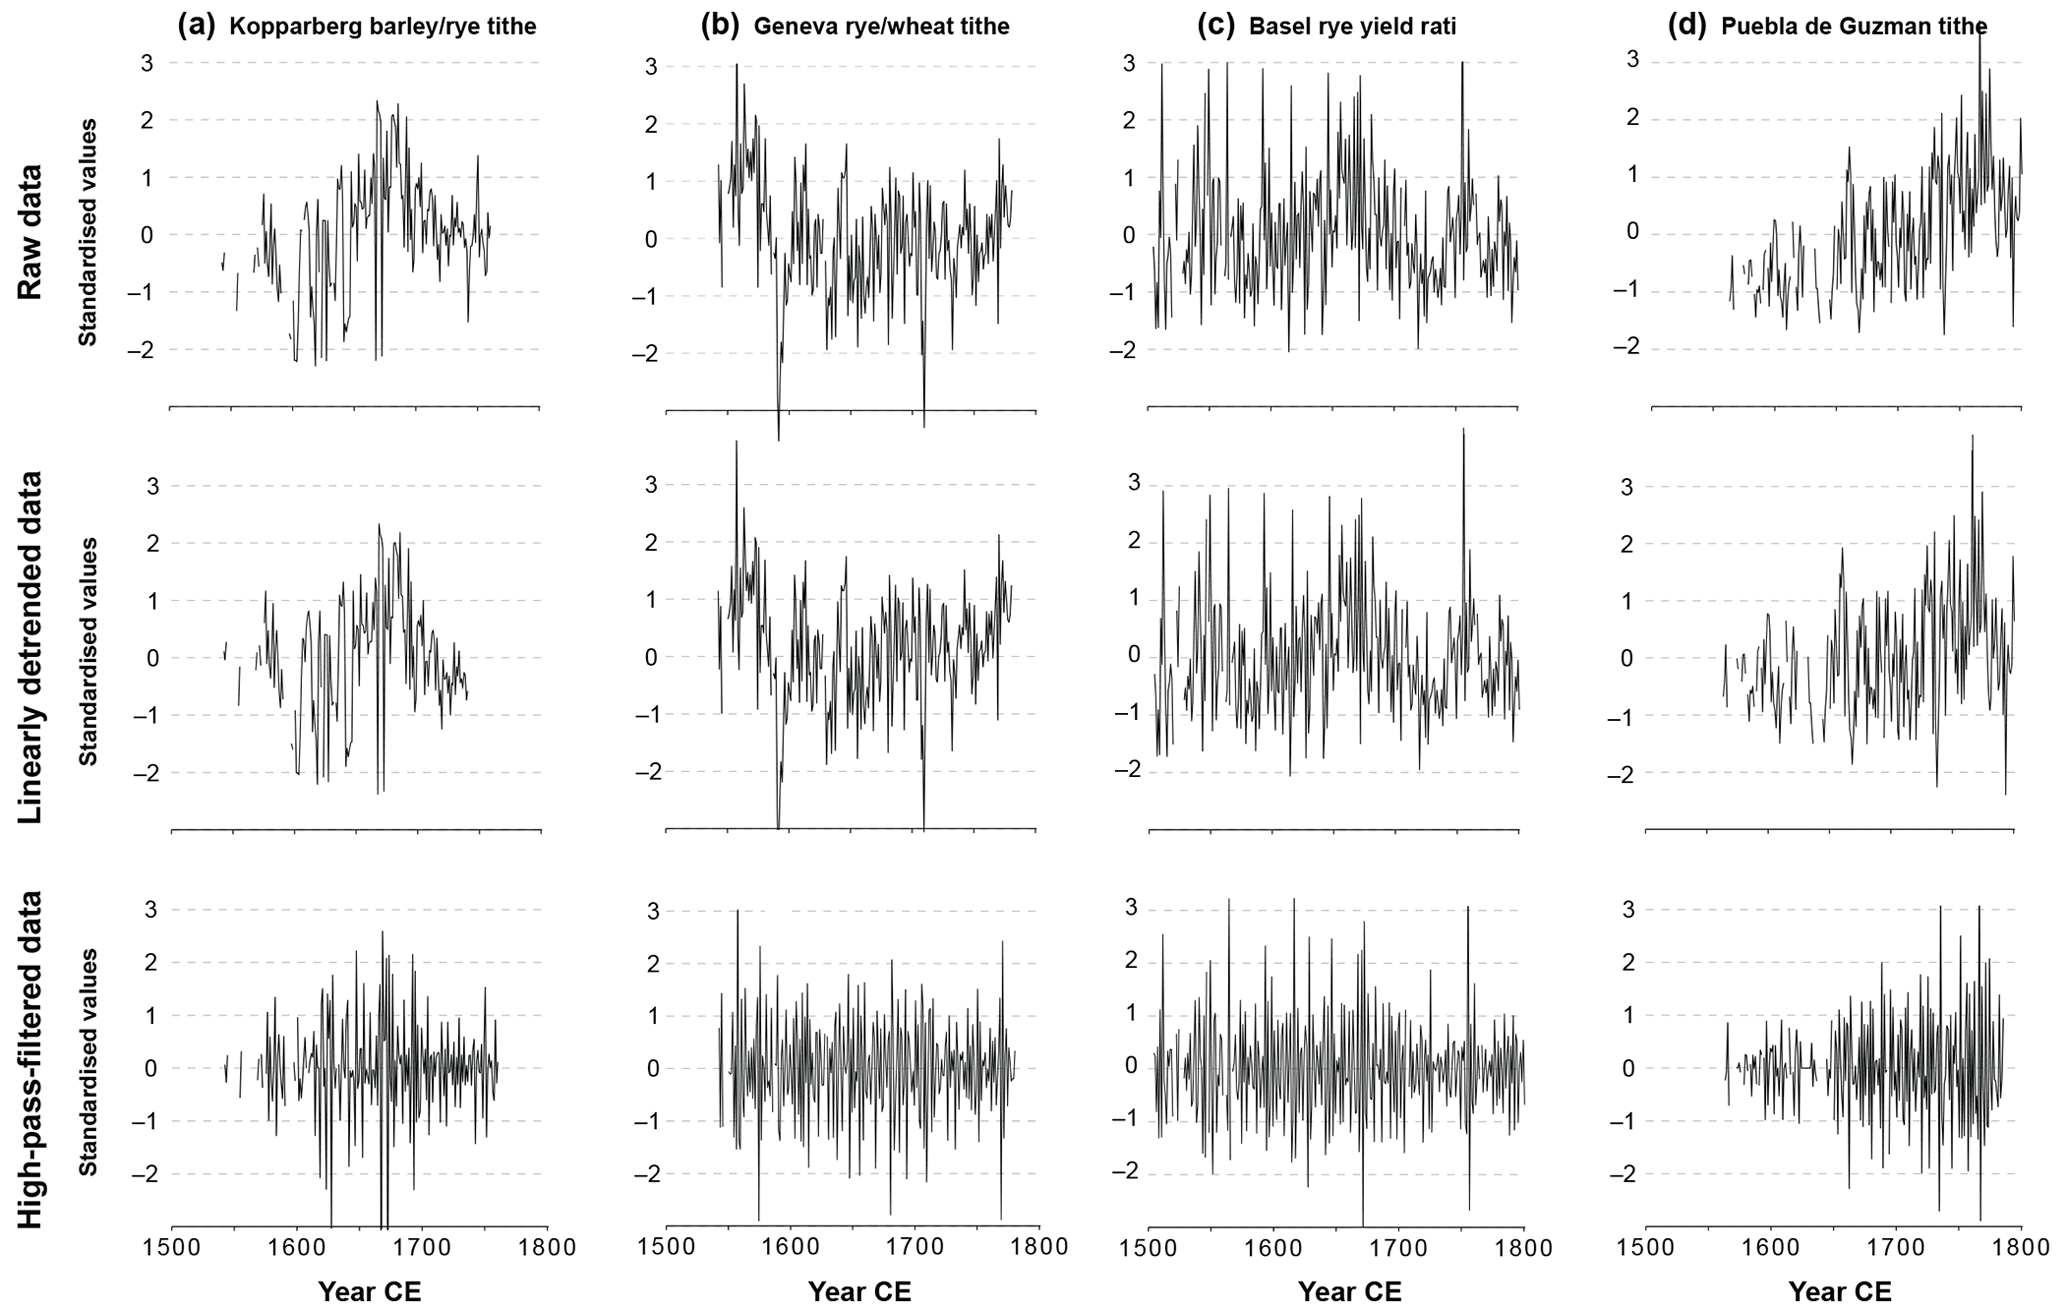
Figure 2Examples of harvest yield data from (a) Sweden (Kopparberg, barley/rye tithe), (b) Switzerland (Geneva, rye/wheat tithe), (c) Switzerland (Basel rye yield ratio), and (d) Spain (Puebla de Guzman tithe) for non-detrended (“raw”), linearly detrended, and 10-year Gaussian high-pass-filtered data. All the series shown have been standardized to zero mean and a standard deviation of 1. Note that the difference between non-detrended and linearly detrended is small in some series (e.g. Geneva) but relatively large in others (e.g. Puebla de Guzman).
2.1 Grain harvest data
Three main types of harvest data exist for the early modern period in Europe: (1) tithe records from areas where the tithe followed actual harvest size variations, (2) harvest yield ratio (i.e. sown-to-harvested grain) records from individual estates and farms, and (3) total yield quantity records for individual estates and farms or larger districts. Thus, tithe and total yield quantity records represent total grain production, whereas yield ratio records represent production relative to seed input. We have collected and digitized an unprecedentedly large dataset from published literature of both tithe and yield series of which only the longest (nearly) continuous ones have been included in this study (Tables 1 and 2). Whereas tithe data represent (sub)regional harvest variations, because the tithe data are recorded on the parish level, the yield data typically reflect local (estate)-scale yield variations. Tithe records, as they represent the output from numerous farms and usually cover a larger geographical area than yield series, can be expected to be less biased by individual outliers of single farms. The potential to study climate signals in early modern harvests using tithe data was already noted by Stauffer and Lüthi (1975). Continuous grain tithe data exist from parts of early modern Sweden, Switzerland, and Spain (Fig. 1; Table 1), as well as for some individual locations elsewhere across Europe not considered here. However, yield series (for example from one farm) may not even be locally representative. The effect of local soil conditions will be considerable, and microclimate and local weather events (e.g. one severe thunderstorm or local radiation night frost) will affect the yield ratio as well as the total yield quantity.
The lag-1 auto-correlation is much stronger in the tithe data compared to the yield data (mean AR1 =0.59 vs. 0.27) (Tables 1 and 2), indicating that the tithe time series contain a much larger “memory” from 1 year to the next. This pattern holds true for all study regions, albeit with large variations between individual tithe and yield series within each region. The auto-correlative structure of harvest series could be dependent on a number of factors, e.g. informal regulations of local tithes (Leijonhufvud, 2001), inadequate documentation (Le Roy Ladurie and Goy, 1982), or access to and shortage of seed grain (Huhtamaa et al., 2022). In comparison, grain price data contain an even stronger auto-correlation (mean AR1 = 0.78) than tithe data (Table A1), presumably due to the effects of storage, trade, and price regulations (Rahlf, 1996; Persson, 1999; Alfani and Ó Gráda, 2017). Temperature and hydroclimate reconstructions from documentary data contain auto-correlations similar to yield data, whereas tree-ring-based climate reconstructions instead contain auto-correlations similar to tithe data (Table 3; see Sect. 4.1).
For Sweden, the tithe data are only used from 1572 as the data from that year onwards were obtained through modern archival research (Myrdal and Söderberg, 1991; Leijonhufvud, 2001; Hallberg et al., 2016), whereas data prior to 1572 were compiled by Leijonhufvud (2001) from the publication by Forssell (1872), whose criteria and methods for collection remain uncertain. We merged the Swedish tithe data for barley and rye into a single “barley/rye” category as the two grain types are frequently reported as just “grain” in the tithe accounts (Ågren, 1964). In principle, “grain” in the account series generally implied a 50–50 distribution between rye and barley (Jansson et al., 1993), though this proportion shifted in reality (Leijonhufvud, 2001). Owing to insufficient tithe data coverage in some counties, we truncated the end date of individual county-level averaged tithe series (i.e. Östergötland and Södermanland in 1680, Stockholm and Värmland in 1730, Uppsala and Västmanland in 1740, and Kopparberg in 1760). Reliable tithe data for Örebro County are restricted to 1665–1720. For this study, we have not included any of the tithe data series from northern Sweden, present-day Finland, or the former Danish and Norwegian provinces that became Swedish in the mid-seventeenth century. Tithe data from Skaraborg County were also excluded as they contain numerous missing values (Leijonhufvud, 2001) and that county has a more maritime climate than the other counties (Wastenson et al., 1995). For Switzerland, rye and wheat production for the Republic of Bern and four districts of the Republic of Zurich has been estimated back to ca. 1530 based on tithe data (Pfister, 1984). Between 1755 and 1797, aggregate tithe receipts represented 57 % of the estimated total grain harvest, of which spelt accounted for the majority (see Tables 26 and 27 in Pfister, 1984). The tithe series for Spain are more heterogeneous with respect to quality and spatial domain (Ponsot, 1969; Eiras Roel, 1982; Ciria, 2007). Much of the tithe data are not separated by grain type but reflect the total agricultural productivity of grain, wine, and often also vegetables (Le Roy Ladurie and Goy, 1982). Only longer and more continuous tithe series for mainland Spain have therefore been included (Table 1).
The majority of the published yield ratio series or area yield data series are short, frequently with numerous gaps (e.g. Slicher van Bath, 1963; Tornberg, 1989; Leijonhufvud, 2001; Young, 2007). Such yield ratio series are not included in this study as they complicate assessments of statistical significance in climate–harvest yield relationships. Yield data, sufficient in length for performing correlation analyses against (palaeo)climate data, exist for Switzerland and Spain (although only for the eighteenth century in the latter case) and for some individual locations elsewhere in Europe (Table 2). Both tithe data and yield data are henceforth referred to as “grain harvest data” or just “harvest data”.
Besides the gaps in the different harvest series, there are some other notable limitations. Some of the Swedish tithe data for different counties partly cover different periods (Leijonhufvud, 2001; Hallberg et al., 2016). These periods had somewhat different prevailing climate conditions (Luterbacher et al., 2004; Xoplaki et al., 2005; Leijonhufvud et al., 2010; Cook et al., 2015; Seftigen et al., 2017; Ljungqvist et al., 2019). Another important uncertainty regarding Swedish tithe data is the unknown variation in the number of farms paying tithes (equalling gaps in the sources) and the fact that the proportion of tithes to actual harvest may have decreased over time (Leijonhufvud, 2001). Over the decades, the practices may have become more standardized as Hegardt (1975) showed to be the case for the tithes collected for Uppsala University. In some areas, tithes were fixed at an average amount (Le Roy Ladurie and Goy, 1982), but those data are not included in this study. For Switzerland, uncertainty in estimating the actual harvest size is related to the fact that tithes were sold at auctions rather than collected in the field (Pfister, 1979). The Spanish tithe data are representing a mixture of tithes paid in grain and in money (Kain, 1979) and are mainly derived from rented land and therefore do not fully represent annual grain production (Llopis et al., 2020). Finally, many, though not all, of the tithe series consist of a mixture of different grains where the exact proportion was subject to changes over time (Le Roy Ladurie and Goy, 1982), which can make it more difficult to detect climatic signals since different grains can have different phenological requirements.
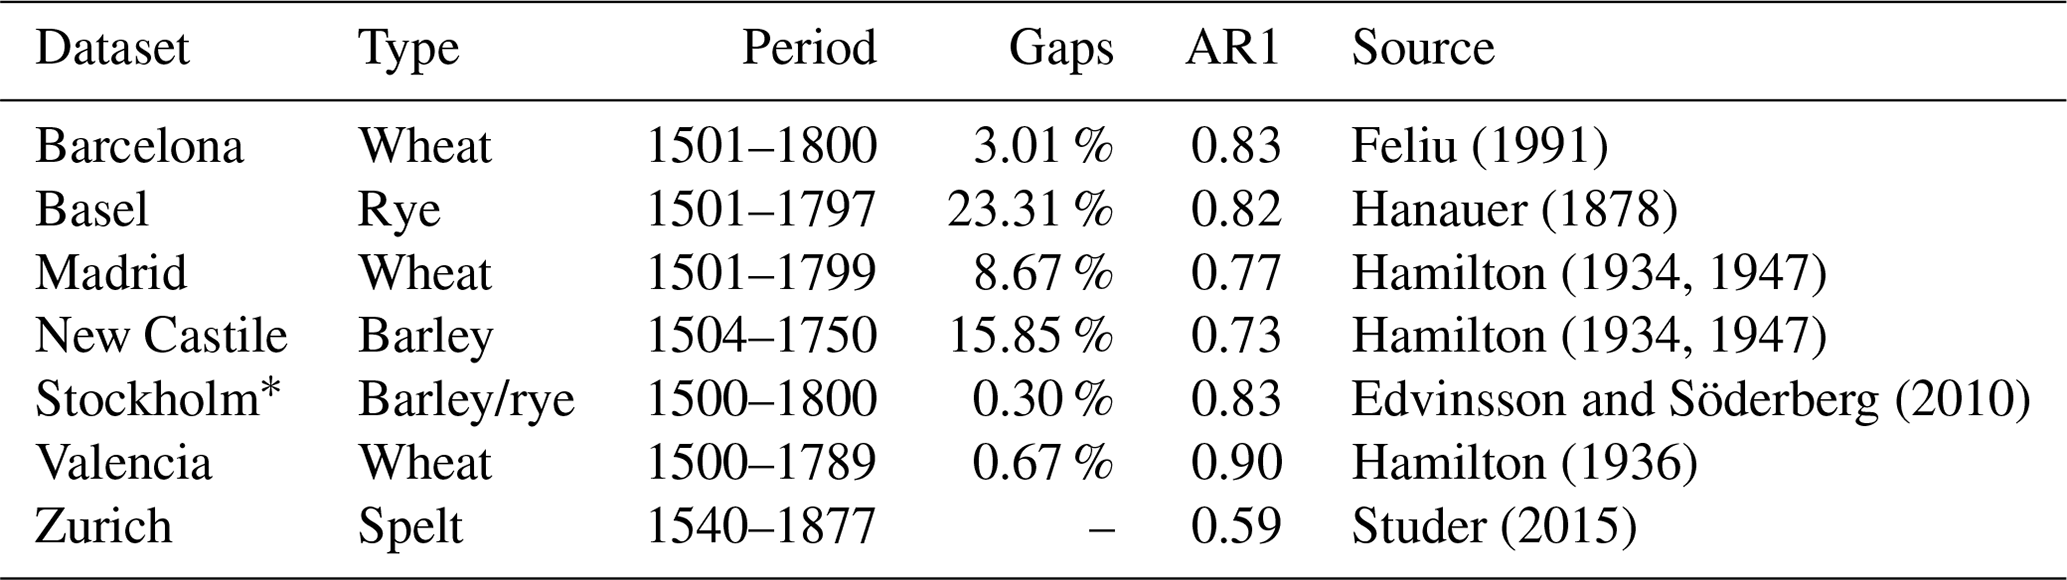
Leijonhufvud (2001)Hallberg et al. (2016)Leijonhufvud (2001)Hallberg et al. (2016)Leijonhufvud (2001)Hallberg et al. (2016)Leijonhufvud (2001)Hallberg et al. (2016)Leijonhufvud (2001)Hallberg et al. (2016)Leijonhufvud (2001)Hallberg et al. (2016)Leijonhufvud (2001)Hallberg et al. (2016)Leijonhufvud (2001)Hallberg et al. (2016)Pfister (1984)Pfister (1984)Pfister (1984)Pfister (1984)Head-Köenig and Veyrassat-Herren (1972)Pfister (1984)Pfister (1984)Pfister (1984)Pfister (1984)Pfister (1984)Pfister (1984)Pfister (1984)Pfister (1984)Pfister (1984)Pfister (1984)Pfister (1984)Pfister (1984)Pfister (1984)Pfister (1984)Eiras Roel (1982)Eiras Roel (1982)Eiras Roel (1982)Eiras Roel (1982)Ciria (2007)Santiago-Caballero (2014)Ponsot (1969)Ponsot (1969)Ponsot (1969)Ponsot (1969)Table 1Information on the grain tithe data, including the covered period and missing values (“gaps” in percentage), the grain type(s) (B is barley, R is rye, O is oats, W is wheat, B/R is a barley–rye mixture, and R/W is a rye–wheat mixture), the auto-correlation coefficient for a lag of 1 year, AR1 (numbers are in the order of the listed grain types), and the data source(s).
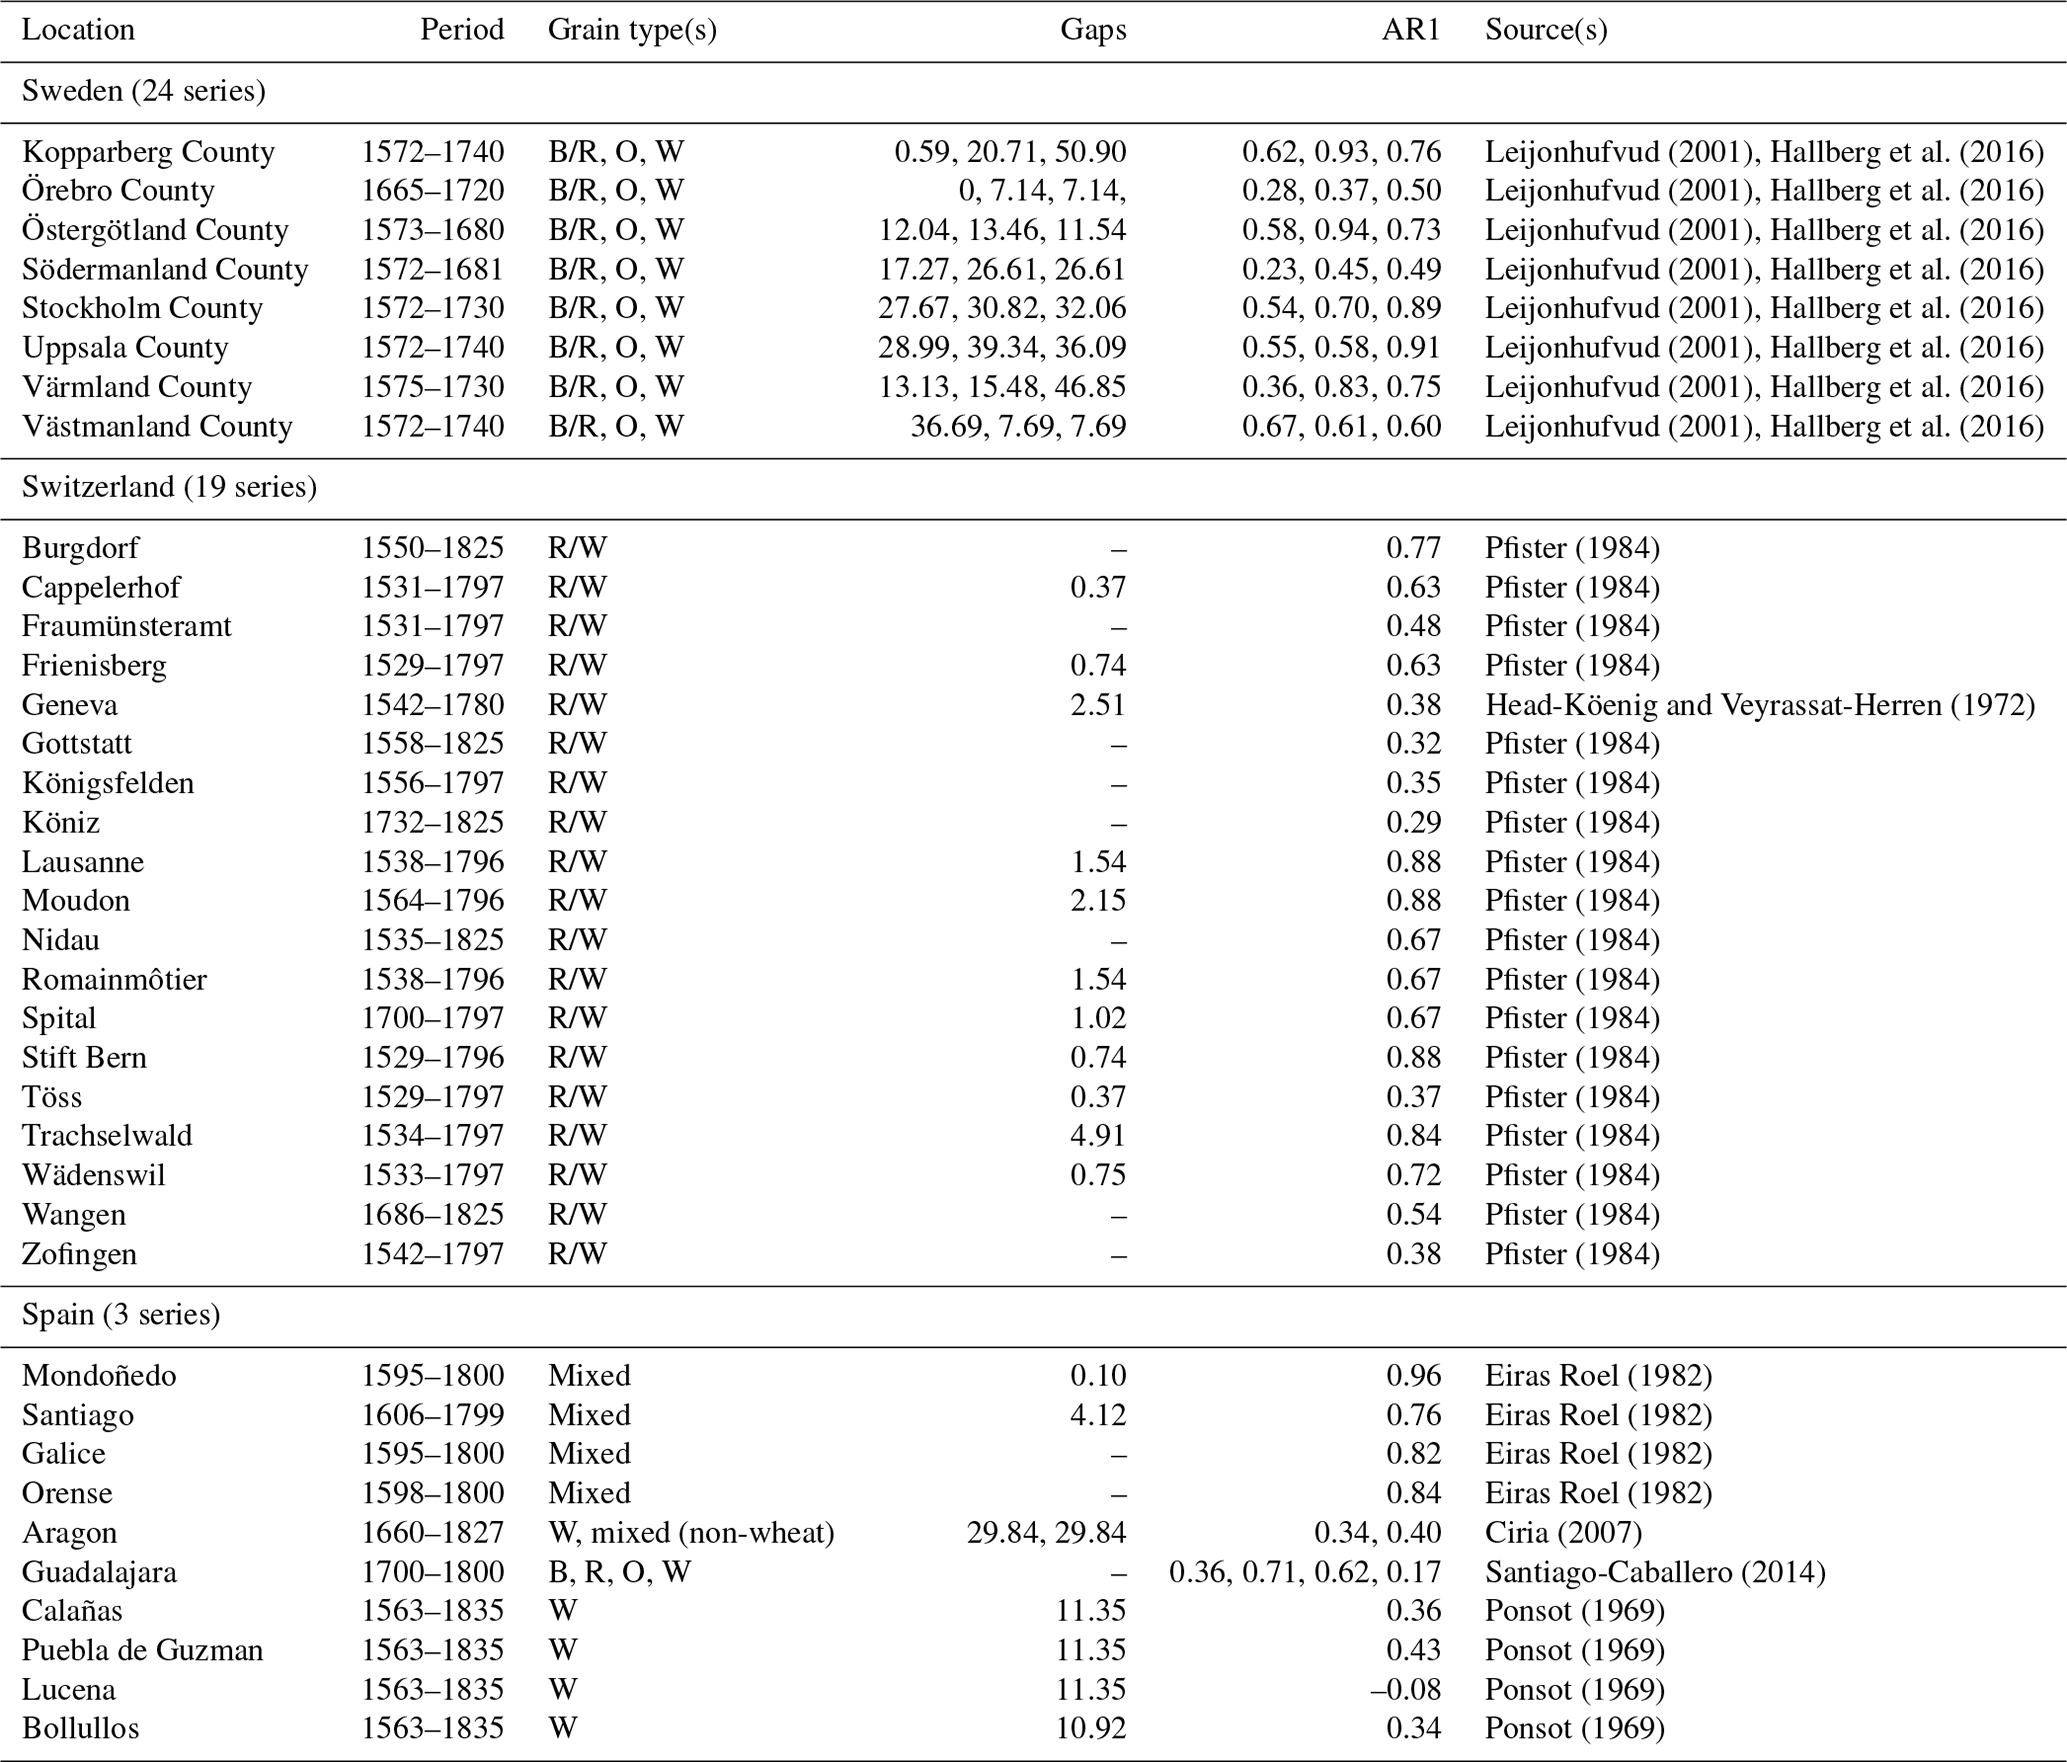
Table 2Information on the grain yield series, including location or site, the covered period and missing values (“gaps” in percentage), the grain type(s) (B is barley, R is rye, O is oats, S is spelt, and W is wheat), the auto-correlation coefficient for a lag of 1 year, AR1 (numbers are in the order of the listed grain types), and the data source.
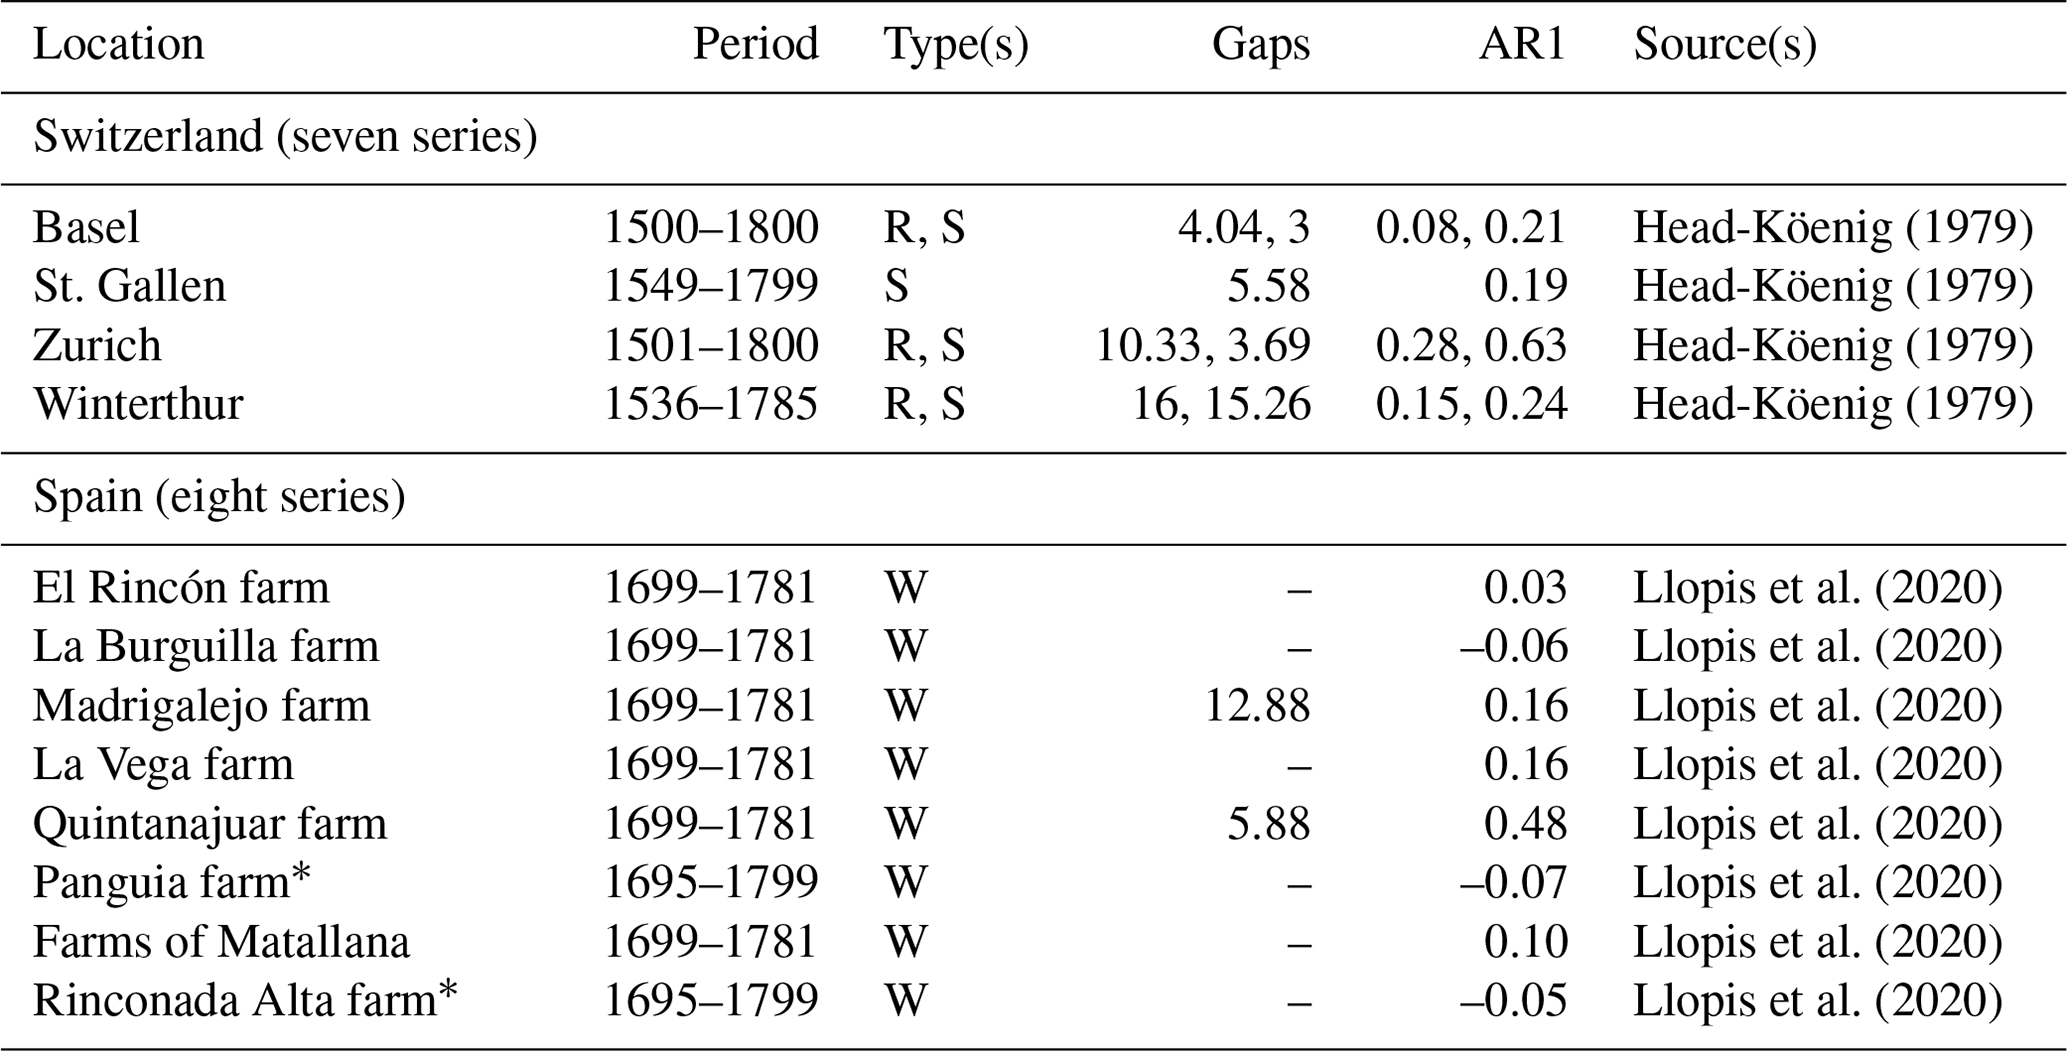
* Yield per unit area and not yield ratio.
2.2 Temperature and hydroclimate data
Instrumental measurements of temperature are available for portions of Europe from the early eighteenth century onward; however, the longest extend back to 1659, and they become increasingly common from the mid-eighteenth century onwards for precipitation (Jones, 2001; Briffa et al., 2009; Brönnimann et al., 2019). Prior to this instrumental period, indirect, “proxy”, climate information has to be derived from either historical documentary sources (e.g. Pfister and Wanner, 2021) or natural archives such as tree rings (e.g. Esper et al., 2016; Ljungqvist et al., 2020). Seasonally gridded reconstructed temperature data – for winter, spring, summer, and autumn – covering Europe are available since 1500 (Luterbacher et al., 2004; Xoplaki et al., 2005 – henceforth referred to as Luterbacher et al., 2004; Table 3). These gridded products combine instrumental measurements from the eighteenth century onwards with documentary and natural proxy data. We also use the summer (June–August) temperature data from Luterbacher et al. (2016), as updated by Ljungqvist et al. (2019), derived from quality-screened temperature-sensitive tree-ring data and historical documentary evidence for June–August from Dobrovolný et al. (2010) resolved at a 5∘ × 5∘ grid. For the Luterbacher et al. (2004) and Ljungqvist et al. (2019) reconstructions, the local grid cells for each study region have been extracted, averaged, and utilized for the correlation analyses. In addition, for Switzerland we use the documentary-based seasonally resolved temperature reconstruction of Dobrovolný et al. (2010), and for Sweden we use the documentary-based January–April temperature reconstruction of Leijonhufvud et al. (2010). The Pfister (1992) and the Dobrovolný et al. (2010) reconstructions include some harvest-related proxy data for certain seasons and periods, an important limitation to note since it implies that they are not fully independent in relation to some of the harvest yield data employed here. Furthermore, they may contain deficiencies in the low-frequency domain, as documentary-based climate reconstructions based on the so-called index method are typically unable to capture the full amplitude of low-frequency climate variations (Adamson et al., 2022). A reconstruction of gridded seasonal precipitation estimates is available for the period after 1500 for Europe (Pauling et al., 2006). These data, as well as the Luterbacher et al. (2004) seasonal temperature field reconstruction, have some important limitations. Both seasonal field reconstructions have decreasing skill going back in time, especially prior to the early eighteenth century. They also lack local input data from Sweden during the period covered by the Swedish tithe series (see Table 1). Additionally, the climate models used to derive field reconstructions from the sparse data coverage in these two field reconstructions are out of date.
As an approximation of growing season soil moisture (drought) conditions we use the Old World Drought Atlas (Cook et al., 2015). This tree-ring-based reconstruction provides June–August soil moisture conditions as self-calibrated Palmer Drought Severity Index (scPDSI) values on a 0.5∘ × 0.5∘ grid across Europe. The atlas has limited skill in northern (Ljungqvist et al., 2019) and eastern (Cook et al., 2020) Europe; furthermore, it appears to somewhat underestimate the amplitude of low-frequency (multi-decadal to centennial scale) hydroclimatic variations at regional scales (compared with, e.g. Scharnweber et al., 2019; Büntgen et al., 2021). The local grid cells from the Pauling et al. (2006) and Cook et al. (2015) reconstructions for each study region have been extracted and utilized for the correlation analyses. For particular regions, additional non-gridded tree-ring-based hydroclimate reconstructions are used. This includes an annual groundwater level reconstruction from the Upper Rhine River Valley (Tegel et al., 2020); an April–August Standardized Precipitation–Evapotranspiration Index (SPEI) reconstruction from Bavaria, Germany (Muigg et al., 2020); and a June SPEI reconstruction from Scandinavia (Seftigen et al., 2017). For Switzerland, we used the Pfister (1992) indices, ranging from +3 (extremely warm, respectively wet) to −3 (extremely cold, respectively dry), derived from historical weather descriptions (Adamson et al., 2022). Index values of −1, 0, and 1 characterize rather average seasons derived from only narrative evidence, whereas values >1 and integrate both narrative and proxy evidence (for a further description of the Pfister indices, see Pfister and Wanner, 2021).
Ljungqvist et al. (2019)Büntgen et al. (2006)Dobrovolný et al. (2010)Luterbacher et al. (2004)Leijonhufvud et al. (2010)Pfister (1992)Cook et al. (2015)Seftigen et al. (2017)Tegel et al. (2020)Muigg et al. (2020)Pauling et al. (2006)Pfister (1992)Table 3Information on the palaeoclimate series, including the location, climate parameter, season, data type, the auto-correlation coefficient for a lag of 1 year, AR1, and data source. Abbreviations are as follows: Doc is documentary data, instr. is instrumental (meteorological) data, MXD is tree-ring maximum latewood density, and TRW is tree-ring width.
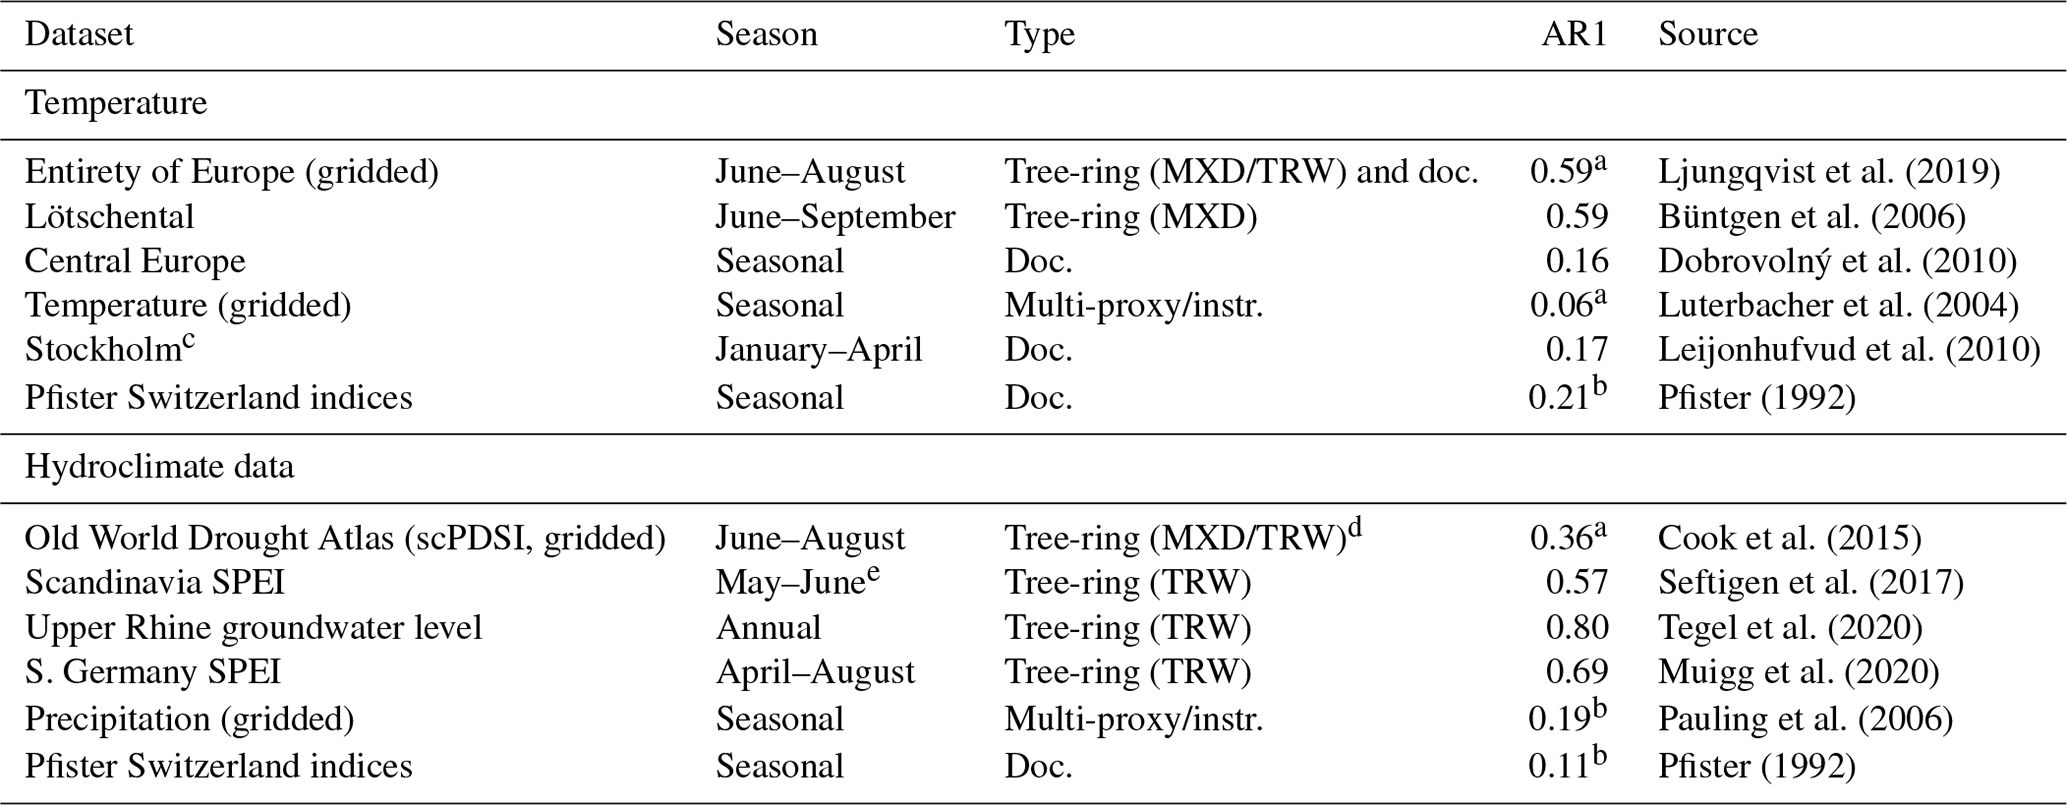
a Mean AR1 values of the area means of the different study regions. b Mean AR1 values of the different seasonal means. c Starts in 1502 with gaps in 1512–1516, 1519, 1523–1524, 1527, 1530–1532, and 1542. d Only 1 out of 106 predictors is maximum latewood density (MXD). The rest are tree-ring width (TRW). e June SPEI aggregated over a 2-month window, which corresponds to cumulative precipitation and evapotranspiration over May and June.
2.3 Detrending, correlation analysis, and significance
We detrended the harvest data because long-term yield trends are heavily influenced by factors related to human agency as opposed to climatic drivers (see Sect. 4.5). The following two different detrending methods are used: (1) linear detrending preserving variability on up to multi-decadal timescales and (2) 10-year high-pass Gaussian filtering preserving variability on only sub-decadal timescales (Fig. 2). All climate series have been detrended the same way as the harvest series. Linear detrending was performed by removing from the series an ordinary least-squares fit between the series and time. The linear fit is found by minimizing the mean square error. A possible issue with using linear detrending of early modern grain harvest data is the absence of a non-ambiguous long-term linear trend in some datasets. For example, in Sweden (Leijonhufvud, 2001; Hallberg et al., 2016) and in several regions of Switzerland (Pfister, 1984) it is difficult to discern any clear long-term productivity increases prior to the late eighteenth century. The trends in these series are often difference-stationary since there are stochastic shifts in the mean (Bauernfeind and Woitek, 1996). Tithe and yield series from some parts of Spain do appear to show long-term productivity gains earlier (Santiago-Caballero, 2013b), resulting in a larger effect on linear detrending (Fig. 2). While missing data are unproblematic for the linear detrending, they might affect the 10-year high-pass Gaussian filter. Before applying the filter, we therefore impute the missing values with a kernel smoothing method (Hastie et al., 2001). After applying the Gaussian filter, we restored the status of the missing values. We have also tested other detrending procedures as alternative to 10-year high-pass Gaussian filtering – e.g. first differencing – and find that the result is relatively robust to this choice. After detrending, we standardized the data to produce series with a mean of zero and standard deviation of 1. For calculating regional averages (e.g. all Swiss yield ratio series for rye), we lined the segments up according to time and then produced an aggregate series by averaging the values. We calculated no average for Spanish tithe or yield data given the complex topography and heterogeneous climatic conditions in Spain (Sect. 1).
In this study, we quantify the association between the time series by the Pearson correlation coefficient (r). The finite length of the time series means that spurious correlations can appear. This problem is aggravated by the presence of considerable serial correlations in the time series, as evidenced by their rather large AR1 coefficients (see Tables 1–3). It is therefore important to report the statistical significance of correlations. The significance is calculated, as in Ljungqvist et al. (2022), both by the traditional method based on the Student's t statistics and by a phase-scrambling-based method. The latter method takes the actual number of degrees of freedom into account (Schreiber and Schmitz, 2000) and gives more accurate results when the time series contain serial correlations. This method is therefore more strict and reports fewer spurious significant correlations than the t test (Bartlett, 1935; Ljungqvist et al., 2022). Thus, we focus on results obtained with the conservative phase-scrambling-based significance test, although for comparison we also report significance obtained from the traditional t test.
It should be noted that in some cases we find weak and marginally significant correlations. However, if such correlations are found in several related pairs of time series – such as correlations between yields in neighbouring regions and different but related climate indices – the belief in a physical (non-spurious) connection is increased. Obtaining a formal significance level in this situation is difficult, instead here we adopt an informal manner, choosing to emphasize those results that individually are somewhat marginal but which taken together paint a consistent picture. Time-dependent variance in one or both of the time series (heteroskedasticity) can bias correlations because periods with a higher variance will dominate. In this study, such behaviour could originate in our use of climate series composed of both documentary or proxy and instrumental information. We find that this issue is not important in the present study as we have tested this by rescaling the variance in all series using 21-year running windows and found only negligible changes in correlations (not shown).
2.4 The Granger causality test procedure
For those pairs of series showing significant correlations, it is of interest to determine which of two correlated series is the cause of the variations in the other. We know that changes in some climate parameters have a readily detectable effect on grain harvests. Likewise, we also know that changes in harvest output had a substantial effect on the price of grain, but not the other way around (see, e.g. Rahlf, 1996; Persson, 1999; Barquín, 2005; Campbell and Ó Gráda, 2011). Confirming the right direction of causality gives an additional indication of the presence of a physical relationship. A formal causality test is the Granger causality test (Granger and Elliott, 1967; Granger, 1969; Reichel et al., 2001). The test considers significant correlations between series that are lagged relative to each other. A statistical causality is indicated if appropriately lagged series correlate while they do not at the opposite lag. While correlation is not causation, the Granger test provides hints for causality between pairs of series because statistical causation is a necessary, if not sufficient, condition for establishing a physical relationship.
In the procedure, two models are written – one for the series in terms of lagged values of itself and another that additionally includes lagged values of the other series. If the latter model is statistically better than the first one, we see that the inclusion of past values of the other series improves the explanatory power of the model with respect to the former simpler model. If we thereafter exchange the roles of the series and test again, we can by inspection understand whether their roles in explaining variance are symmetric or not. Only when the past values of one series help improve the prediction of another series – and not the other way around – have we found the presence of Granger causality.
Formally, we write
where subscripts indicate lags in variables; ϵ is the residuals or variance not explained by the model. Equations (1) and (2) are estimated, and a Wald hypothesis test (Diggle et al., 2002) is performed to see if Eq. (2) is superior to (1). If so, we have preliminary signs of causality from the x series to the y series. We test Eqs. (3) and (4) as well. If Eq. (4) does not have better explanatory power than Eq. (3), we then know that the inclusion of y is unable to improve the explanatory power of x and y; i.e. past values of x help explain present values of y – but not the other way around. The maximum number of lags used, m, must be chosen. For this article, we applied the Wald test at the p=0.05 significance level and allowed lags up to 3 years (m=3) as longer lags appear unmotivated in the study of climate–harvest (or harvest–price) relationships (see, e.g. Bekar, 2019; Huhtamaa et al., 2022; Ljungqvist et al., 2022). The Granger causality is calculated both on the 10-year high-pass-filtered data and on linearly detrended data. To evaluate the skill of the Granger causality test in assessing climate–harvest yield relationships, we also calculate Granger causality on harvest yields and grain prices, using a limited price dataset (Table A1), as the true direction of this relationship during this time period is without question (i.e. from harvests to prices).
The study of the correlation between series can be confounded by the presence of auto-correlative structure in the series (von Storch and Zwiers, 1999). Series correlation and its significance can be calculated between any level stationary series as long as the presence of autocorrelation in one or both series is taken into account by the inclusion of lagged terms in the model. These are the equation terms at lags t−1, t−2, etc., as seen above. In Sect. 3.4 we only report results of tests that are unambiguous; i.e. we consider only Granger causality tests where a clear causality direction is indicated and do not consider Granger test results where one or more of the tests involved were not significant.
In the following three sub-sections, Sect. 3.1–3.3, we present the results for Sweden, Switzerland, and Spain, respectively. The climate–harvest correlations are shown in Figs. 3–5 for each country separately, while the distribution of the most important climate–harvest yield correlations are summarized in Fig. 6. Finally, we consider the Granger causality results in Sect. 3.4.
3.1 Climate–harvest yield relationships in Sweden
The strongest and most consistent climate signal recorded in the Swedish grain tithe series is the positive association with summer soil moisture (i.e. wetter conditions meaning higher yields and vice versa) (Fig. 3). This association is found both with 10-year high-pass-filtered data and the linearly detrended data. Focusing first on the results obtained using high-pass-filtered data, the relationship between harvest yields and soil moisture is significant in 57 % (phase-scrambling test) and 68 % (t test) of the cases for scPDSI and in 68 % (phase-scrambling test) and 86 % (t test) for SPEI. Notably, all tithe series averaged by type show significant positive correlations with soil moisture (Table A2).
Stronger correlations than in most county-level tithe series are obtained between the mean of the tithe series and SPEI and scPDSI with r=0.18 and 0.35 for oats, 0.32 and 0.22 for wheat, 0.39 and 0.30 for barley/rye, and 0.39 and 0.27, respectively, for the average of all the Swedish tithe series. Correlations exceeding r=0.40 against SPEI are found for all grain types in Västmanland County and for oats in Östergötland County. Weak and insignificant correlations are mainly found for the counties of Kopparberg and Värmland located in a wetter and cooler region (Table A2). The relationship with reconstructed precipitation is weak and mainly insignificant in all counties (see further discussion in Sect. 4.3).
Only a limited number of high-pass-filtered Swedish tithe series show a significant positive or negative relationship with temperature in any season. There is a minor tendency towards positive correlations between grain yields and Stockholm January–April temperature, though this association is only significant in 11 % (phase-scrambling test) and 25 % (t test) of the cases. Importantly, this relationship is insignificant with either test for the averaged tithe series. Almost all individual tithe series, and all the averaged tithe series, show a negative association with June–August temperature. Significant negative correlations are obtained in 21 % of the cases, with both significance tests using the EuroMed2k reconstruction, while 18 % (phase-scrambling test) and 25 % (t test) is reached for the Luterbacher et al. (2004) temperature reconstruction. However, importantly, all the averaged tithe series show significant negative correlations with a phase-scrambling-based significance test against at least one of the two June–August temperature reconstructions.
The relationship between grain tithes and summer soil moisture, especially SPEI, weakens when considering linearly detrended data, with mean correlations of r=0.19 and 0.12 with scPDSI and SPEI, respectively (compared to r=0.22 and 0.30, respectively, for high-pass-filtered data; Table A2). Winter temperature–harvest relationships are weaker (and mainly insignificant) in the linearly detrended data than in the high-pass-filtered data. We observe a shift from generally negative summer temperature–harvest correlations (i.e. cold temperatures meaning high yields and vice versa) in the high-pass-filtered data to weakly positive (i.e. warm temperatures meaning higher yields and vice versa), though mainly insignificant, summer temperature–harvest relationships in the linearly detrended data. Using the high-pass-filtered data, the tithe series reveal a negative summer temperature association in 75 % of the cases, while the linearly detrended tithe series instead showed a positive association – significant or not – in 71 % of the cases (Table A2).
Despite shorter time series we also tested the barley and rye tithes separately (Table A3), and found that correlations are, in general, less significant than for the combined barley/rye tithes. While the overall correlation pattern is similar to the pattern for the combined barley/rye data, some differences in the climate–harvest association can be noted between barley and rye. Rye shows, in general, a stronger positive correlation with summer soil moisture than barley considering high-pass-filtered data but not considering linearly detrended data. No significant winter temperature signal is found in barley, Västmanland County being an exception, while rye shows several significant positive correlations, in particular for high-pass-filtered data. Furthermore, we note that several of the Swedish tithe series, including the counties of Stockholm and Uppsala, have gaps and single years of “outliers” that have a large effect on the results. For example, for Uppsala County when considering only the 1690–1740 period using linearly detrended data, we found a positive correlation between summer temperature and barley (r=0.39), rye (r=0.44), and barley/rye (r=0.24) (not shown).
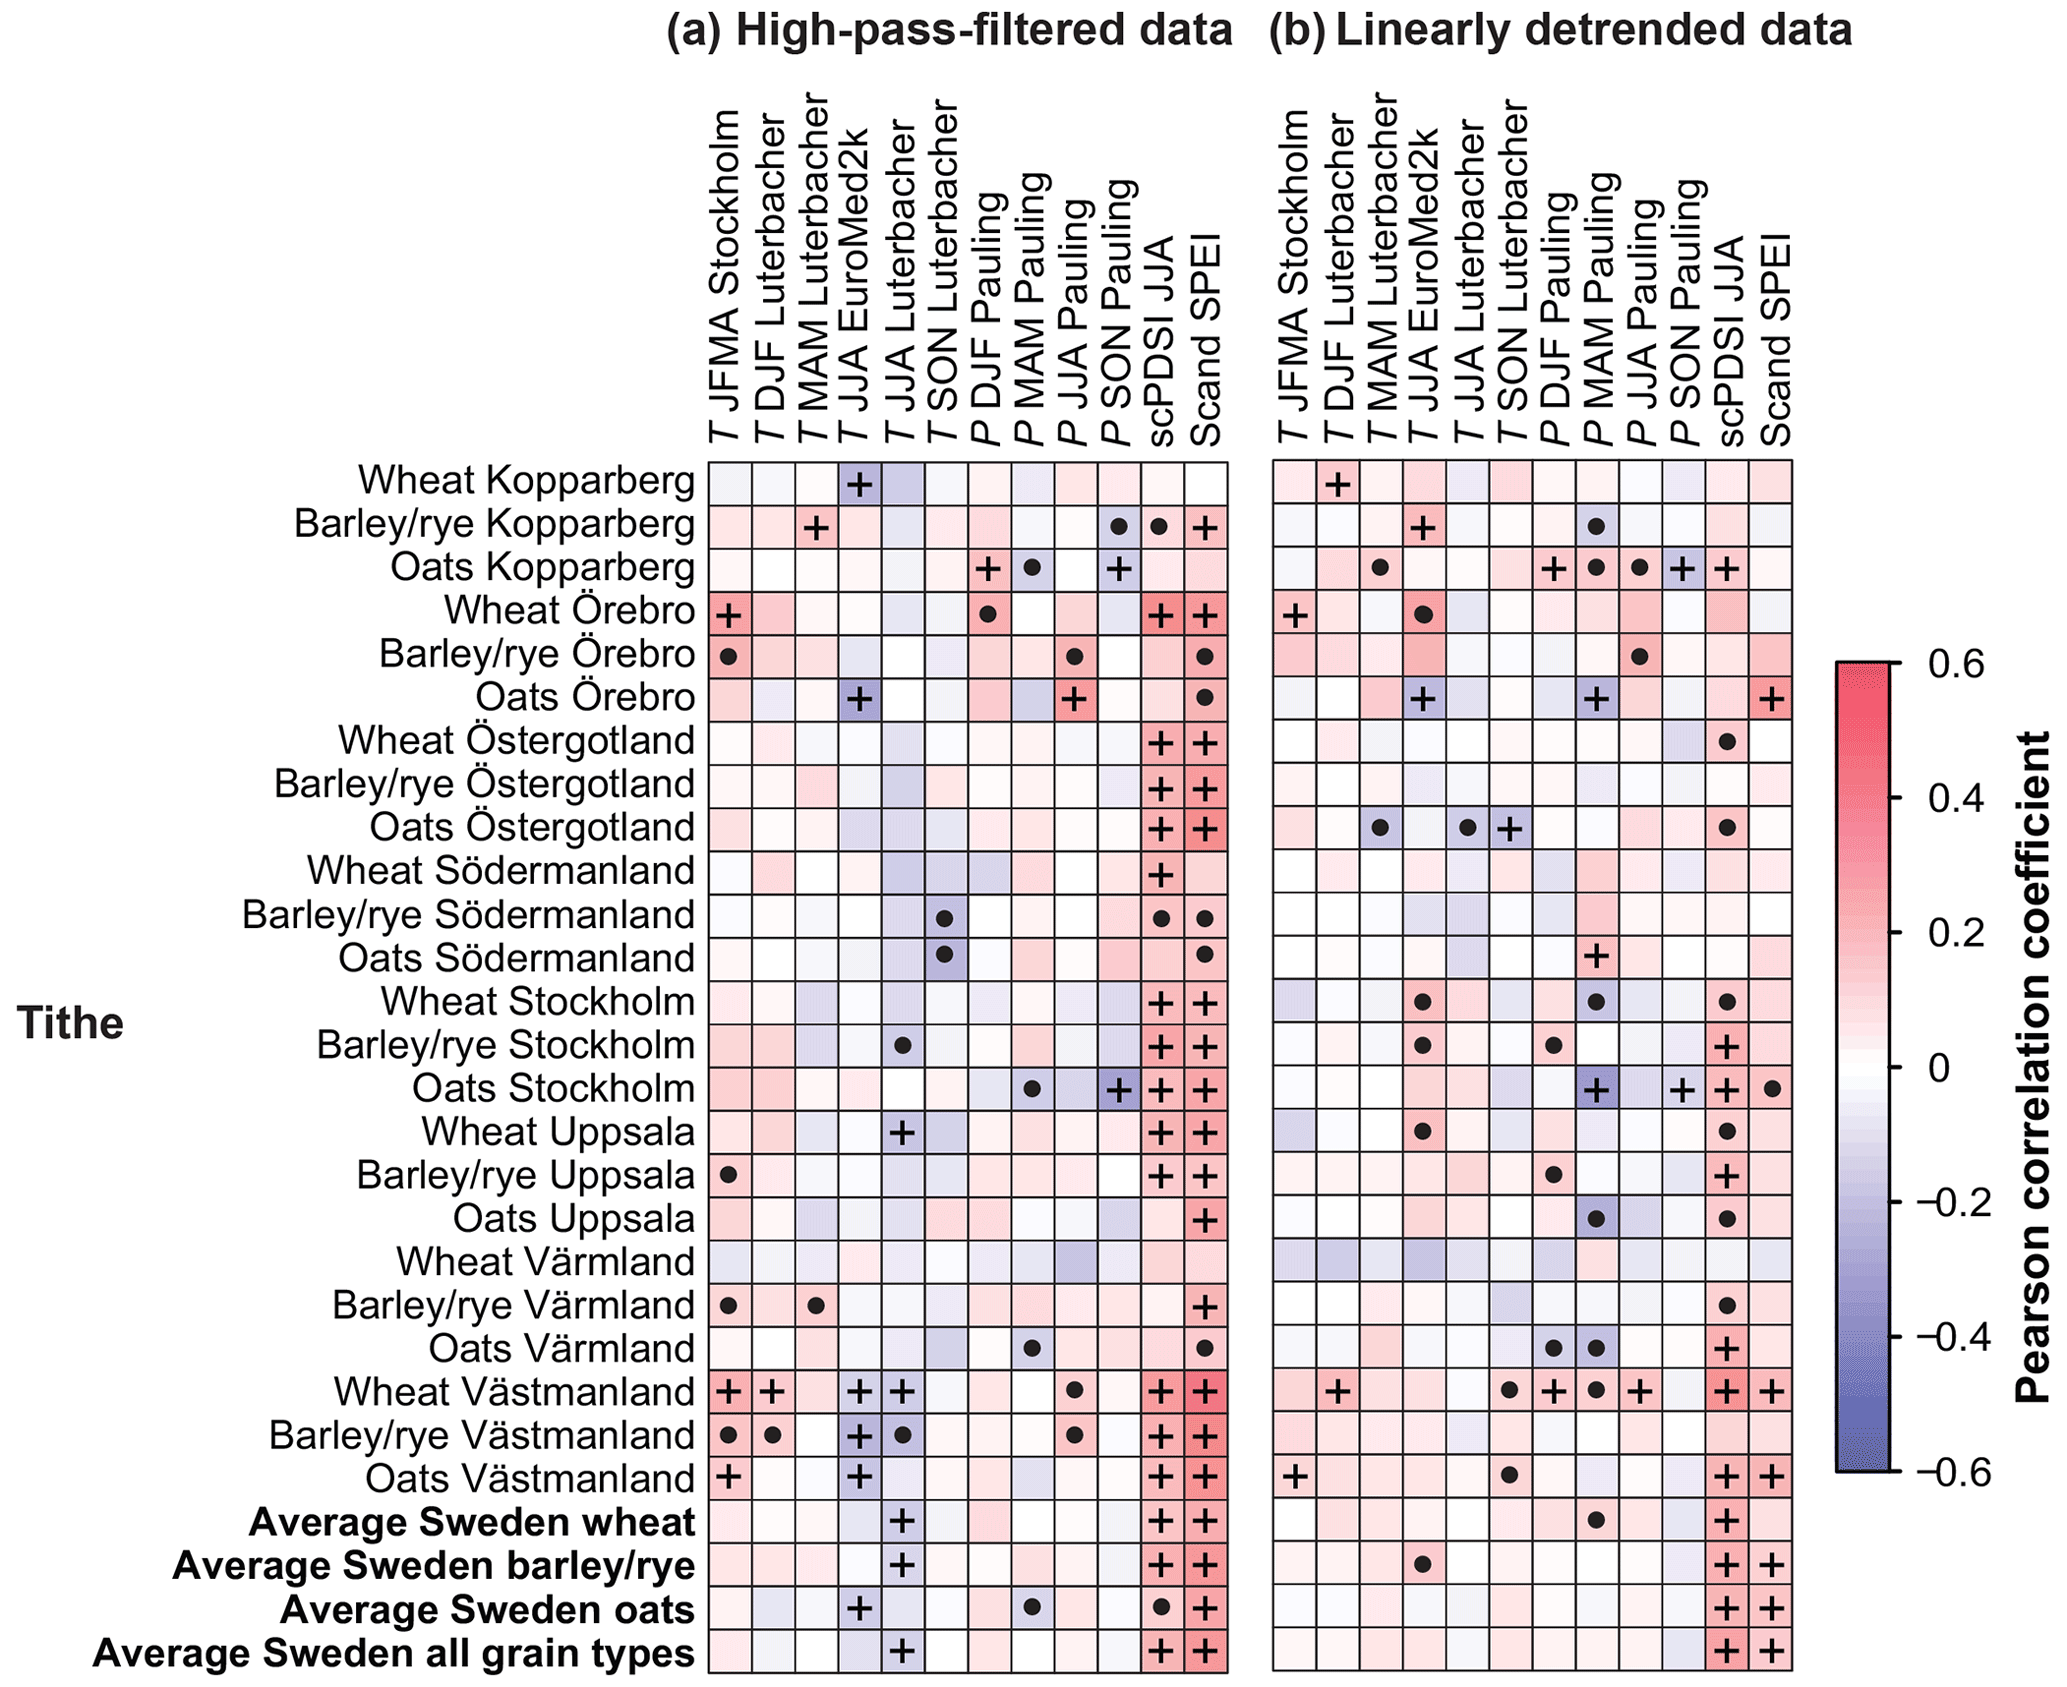
Figure 3Cross-correlation matrix for Sweden between climate series and grain tithe series at a county level for 10-year high-pass Gaussian filtered data (a) and linearly detrended data (b), respectively. Correlations significant at the p=0.05 level with a t test are marked with a dot (⋅). Values that are additionally significant using the phase-scrambling test are marked with a plus sign (+).
3.2 Climate–harvest yield relationships in Switzerland
The strongest and most consistent climate signal in harvest yields in Switzerland, when using 10-year high-pass-filtered data, is the negative relationship between harvests and December–February precipitation (i.e. higher precipitation meaning lower yields and vice versa) (Fig. 4). This association is significant in 70 % of the cases considering the phase-scrambling-based significance test (in 76 % with a t test). The mean correlation between December–February precipitation and the Swiss tithe series is , with a range from (Trachselwald) to (Gottstatt). Mean correlation for Swiss yield ratio data is , with a range from r=0.08 (St. Gallen spelt) to (Basel rye).
An almost equally strong climate signal, as with winter precipitation, in the high-pass-filtered data is the positive association between the tithe series and December–February temperature (i.e. higher temperatures meaning higher tithes and vice versa). The Pfister (1992) and Dobrovolný et al. (2010) reconstructions give almost identical results, with 50 % significant positive correlations for both datasets with the phase-scrambling-based significance test (63 % vs. 67 % significant with a t test). As opposed to the tithe records, the yield ratio records mostly show a negative – in some cases significant – correlation with December–February temperature. This negative association is most evident for the Basel rye yield ratio record and the averaged rye yield ratio record (Table A4). The mean correlation between reconstructed Pfister December–February temperature (alternatively the December–February reconstruction by Dobrovolný et al., 2010), shown within parentheses) and the Swiss tithe series is r=0.18 (0.19), with a range from (0.00) (Nidau) to r=0.37 (0.40) (Wadenswil). The corresponding correlation for Swiss yield ratio data is a mean of (−0.07), with a range from r=0.08 (0.06) (Zurich spelt) to (−0.22) (Basel rye).
Many of the Swiss tithe series also reveal a positive correlation with spring and, to a lesser extent, annual mean temperature (Fig. 4). Using the Pfister March–May temperature indices, 27 % of the harvest series show significant positive correlations with the phase-scrambling-based significance test (33 % with a t test), and 30 % (45 % with a t test) show the same pattern when using the March–May Dobrovolný et al. (2010) temperature reconstruction. Considering annual mean temperature, the Pfister temperature indices show positive significant correlations with 21 % of the harvest series with a phase-scrambling-based significance test (27 % with a t test). On the other hand, it also shows two cases of significantly negative correlations with a phase-scrambling-based significance test (three cases with a t test).
The strongest and most consistent negative Swiss harvest–summer temperature association in the high-pass-filtered data is found for the tree-ring maximum latewood density-based Lötschental summer temperature reconstruction. This association is significant in 36 % (phase-scrambling test) and 61 % (t test) of the cases. The averaged rye yield ratio for Switzerland shows a significant negative correlation with both temperature and precipitation during most seasons, except for significant positive correlations with summer and autumn precipitation, while the averaged spelt yield ratio only shows a significant negative correlation with winter precipitation and a significant positive one with summer precipitation (Fig. 4; Table A4).
In general, weaker correlations are found using linearly detrended data instead of high-pass-filtered data. However, stronger – but mixed – correlations are obtained with the linearly detrended data against reconstructed groundwater levels, scPDSI, and SPEI. The mainly positive association between winter temperature and harvests remains, albeit weakened, while it essentially disappears for spring temperature (Fig. 4). Likewise, the negative relationship between winter precipitation and harvests is retained in linearly detrended data but is considerably weaker and less significant than in high-pass-filtered data (Table A4). Furthermore, the already weak positive relationship between summer precipitation and harvests in high-pass-filtered data is entirely absent in the linearly detrended data.
Notably, when using linearly detrended data instead of high-pass-filtered data, almost all significant correlations between harvests and summer temperature disappear with the phase-scrambling test. Only three of them still remain significant with the less strict t test for the Lötschental summer temperature reconstruction (Fig. 4). Furthermore, while the relationship between Swiss harvests and summer temperature is consistently negative (i.e. colder temperatures meaning high yields and vice versa) when using high-pass-filtered data, more mixed signals are recorded when using linearly detrended data. Thus, the consistent negative relationship is restricted to the high-frequency domain, and a geographically more varied association prevails when information on longer timescales is retained (see the discussion in Sect. 4.1). In the distribution of correlations for Lötschental summer temperatures shown in Fig. 6, we see a distribution of correlations using linearly detrended data symmetric around zero as opposed to the mainly negative clustering of correlations using high-pass-filtered data. This implies the presence of an important signal at inter-annual timescales and a lack of any meaningful association over longer timescales. A similar result is seen for Swiss summer precipitation (Fig. 6).
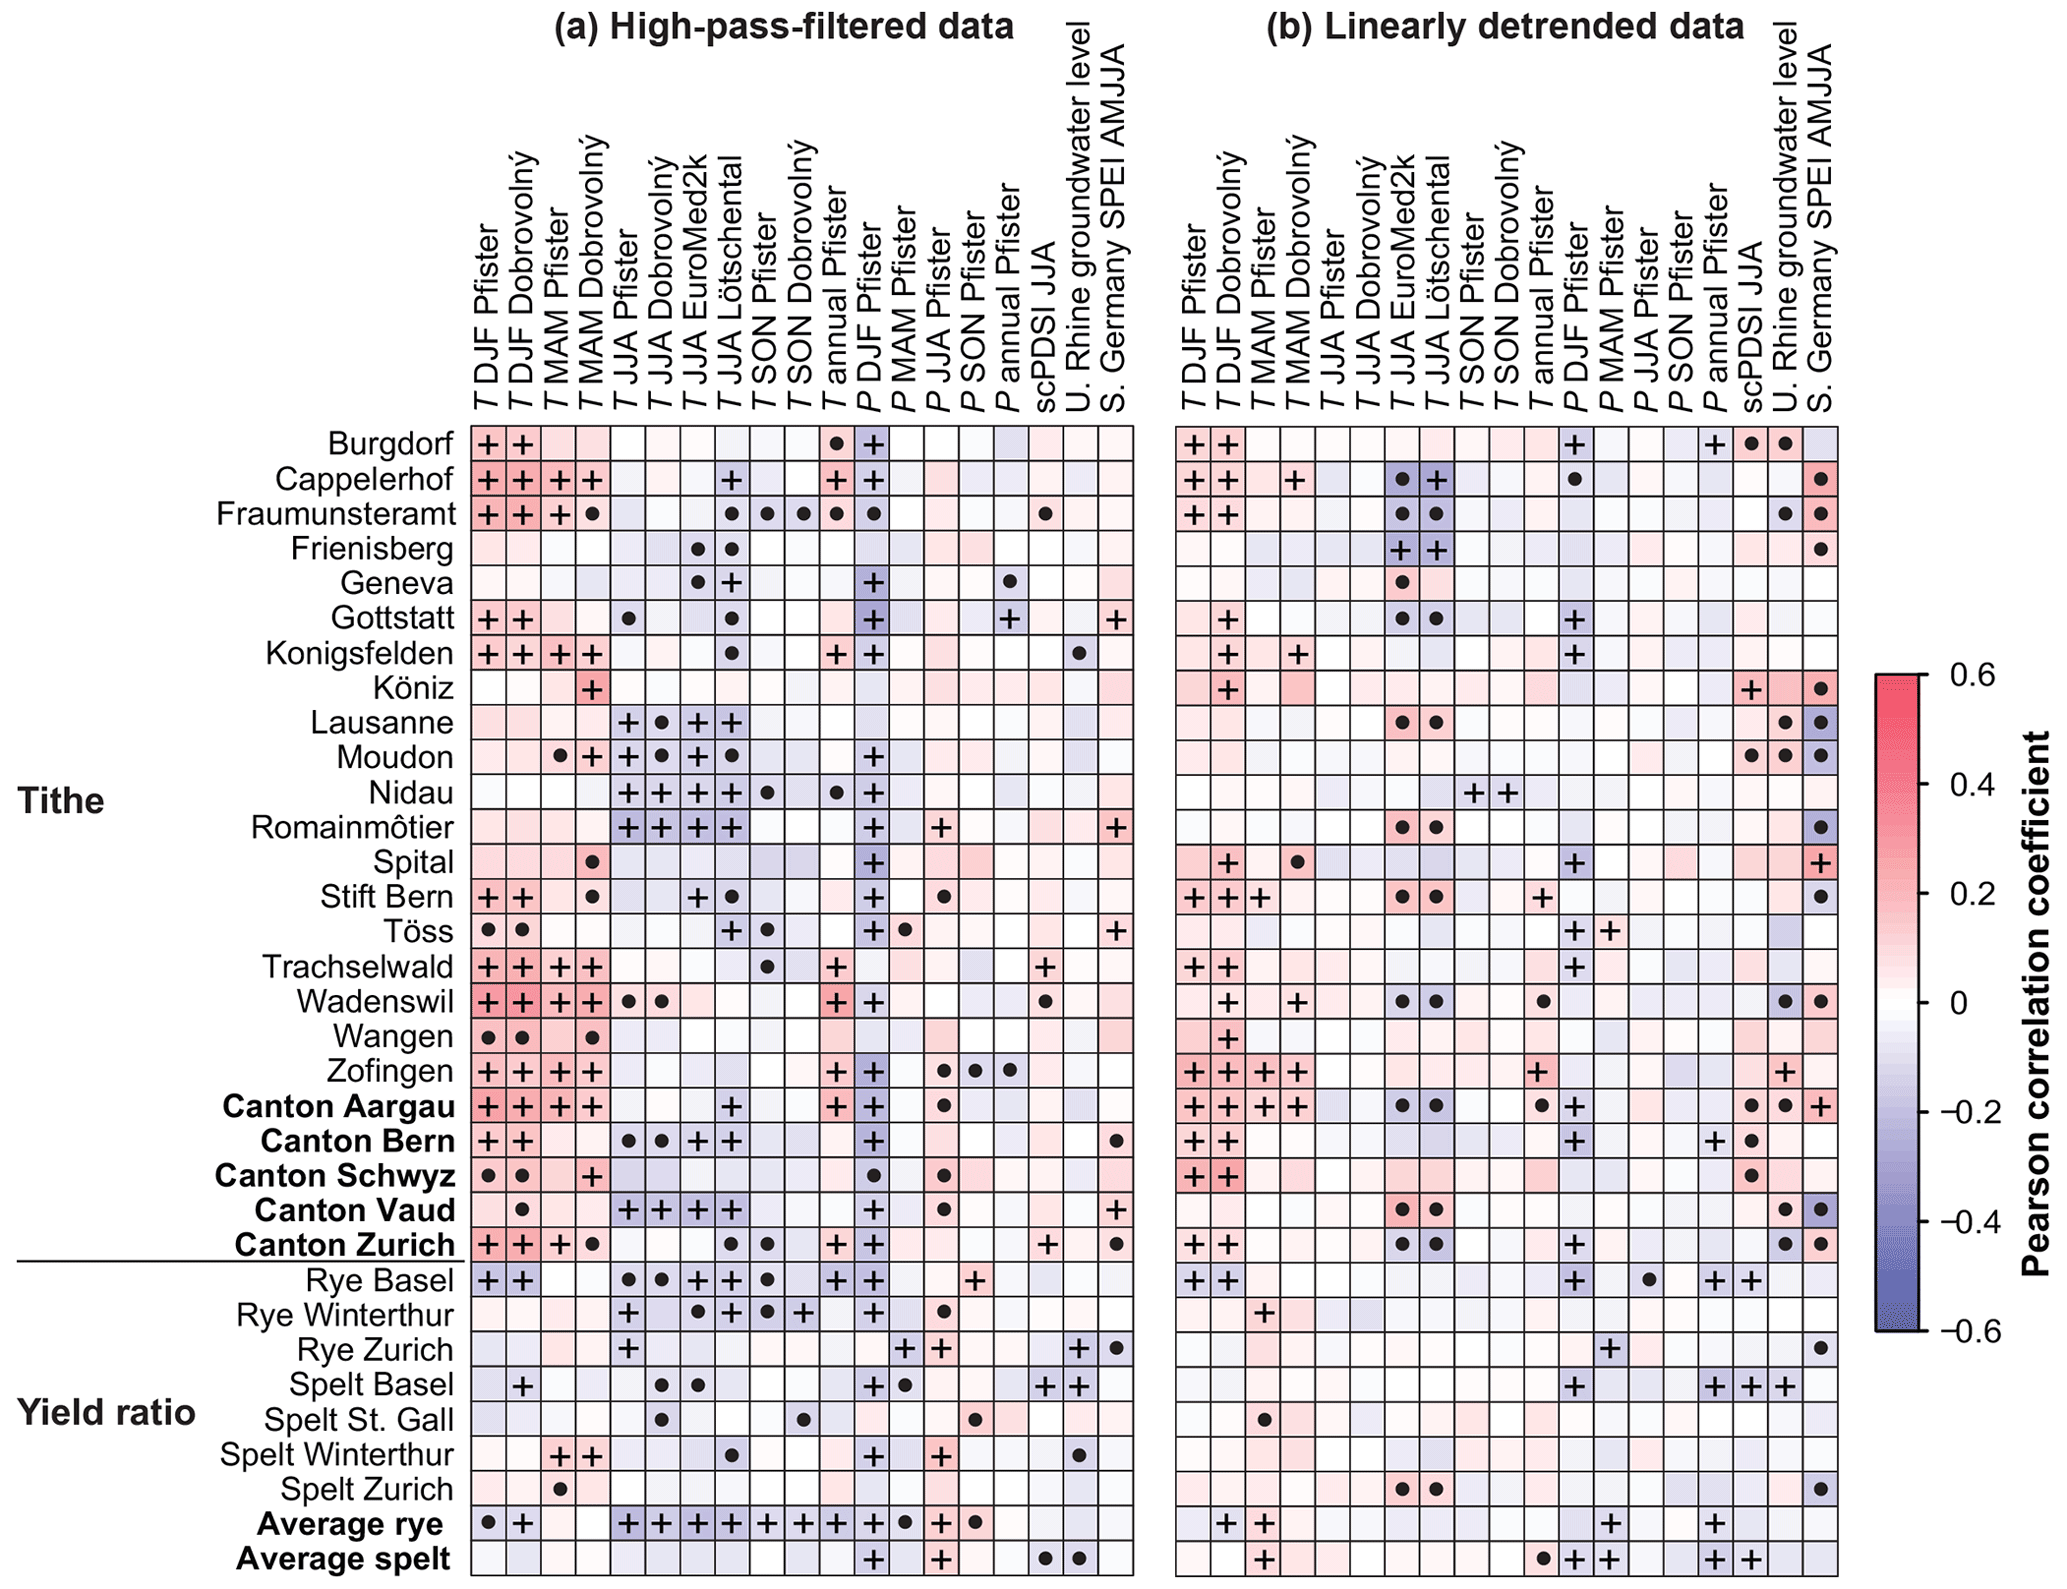
Figure 4Cross-correlation matrix for Switzerland between climate series and grain tithe and yield ratio series for 10-year high-pass Gaussian filtered data (a) and linearly detrended data (b), respectively. Correlations significant at the p=0.05 level with a t test are marked with a dot (⋅). Values that are additionally significant using the phase-scrambling test are marked with a plus sign (+).
3.3 Climate–harvest yield relationships in Spain
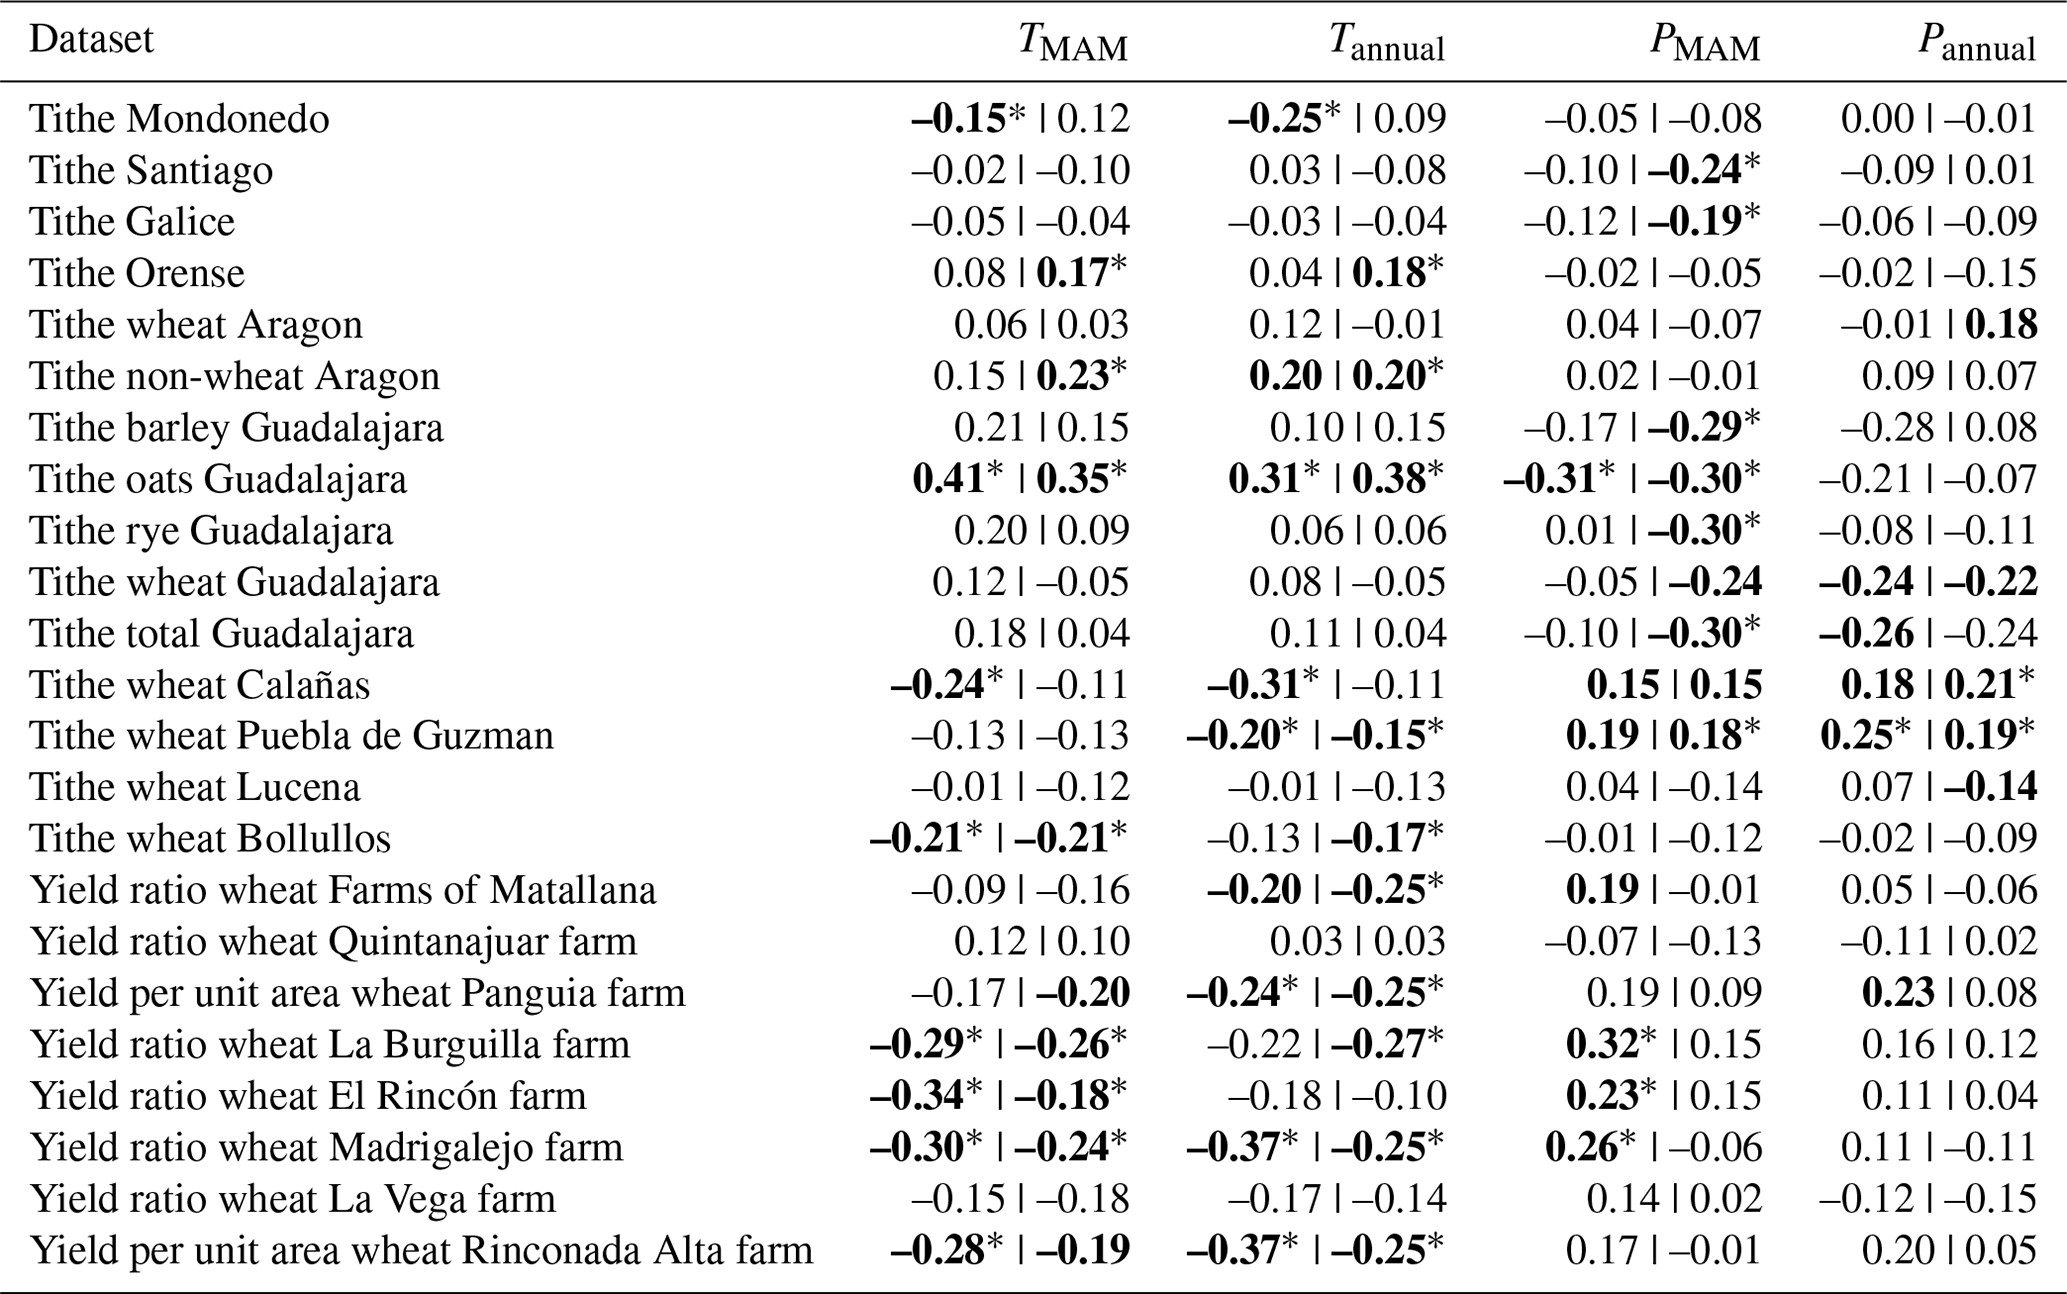
No consistent climate–harvest relationship, for either temperature or hydroclimate, is found for Spain using either high-pass-filtered or linearly detrended data (Fig. 5). The most significant correlations for high-passed filtered data are obtained for the March–May season, the main Spanish grain growing period (Sect. 1), as well as for annual mean values of temperature and precipitation. Several series are negatively correlated with December–February temperatures (Table A5). The direction of the correlations varies between locations (but maintaining local consistency), although it is mostly negative for temperature and positive for precipitation. The tithe series from Aragon and Guadalajara exhibit a different climate signature than most other Spanish series. Non-wheat tithe data from Aragon show, with a t test, significant positive correlations with September–November temperature and with annual mean temperature. Oat tithe data from Guadalajara exhibit, also with a phase-scrambling-based significance test, significant positive temperature associations for March–May and the annual mean. The wheat tithe data from Guadalajara correlate significantly positively with June–August temperature with a phase-scrambling-based significance test, whereas the average of the Guadalajara tithe data of all grain types are significantly correlated but only with a t test. Furthermore, as opposed to most other Spanish harvest series, all Guadalajara tithe series show a negative – in some cases significantly so – relationship to precipitation during all seasons. All significant correlations, both for high-pass-filtered and linearly detrended data, between Spanish yield series for wheat and temperature are negative (i.e. warmer temperatures meaning lower yields and vice versa).
Comparatively similar correlation patterns and significance levels to those using high-pass-filtered data are obtained for Spain when using linearly detrended data – which is in contrast to the findings from Sweden and Switzerland (Sect. 3.1–3.2). In fact, we find no contradicting significant results between high-pass-filtered data and linearly detrended data. However, a more significant negative correlation between the Guadalajara tithe series (covering only the eighteenth century) and March–May precipitation appears when using linearly detrended data (Table A5). Likewise, the positive relationship between March–May precipitation and several of the yield series disappears. Furthermore, the association with December–February temperature is weakened.
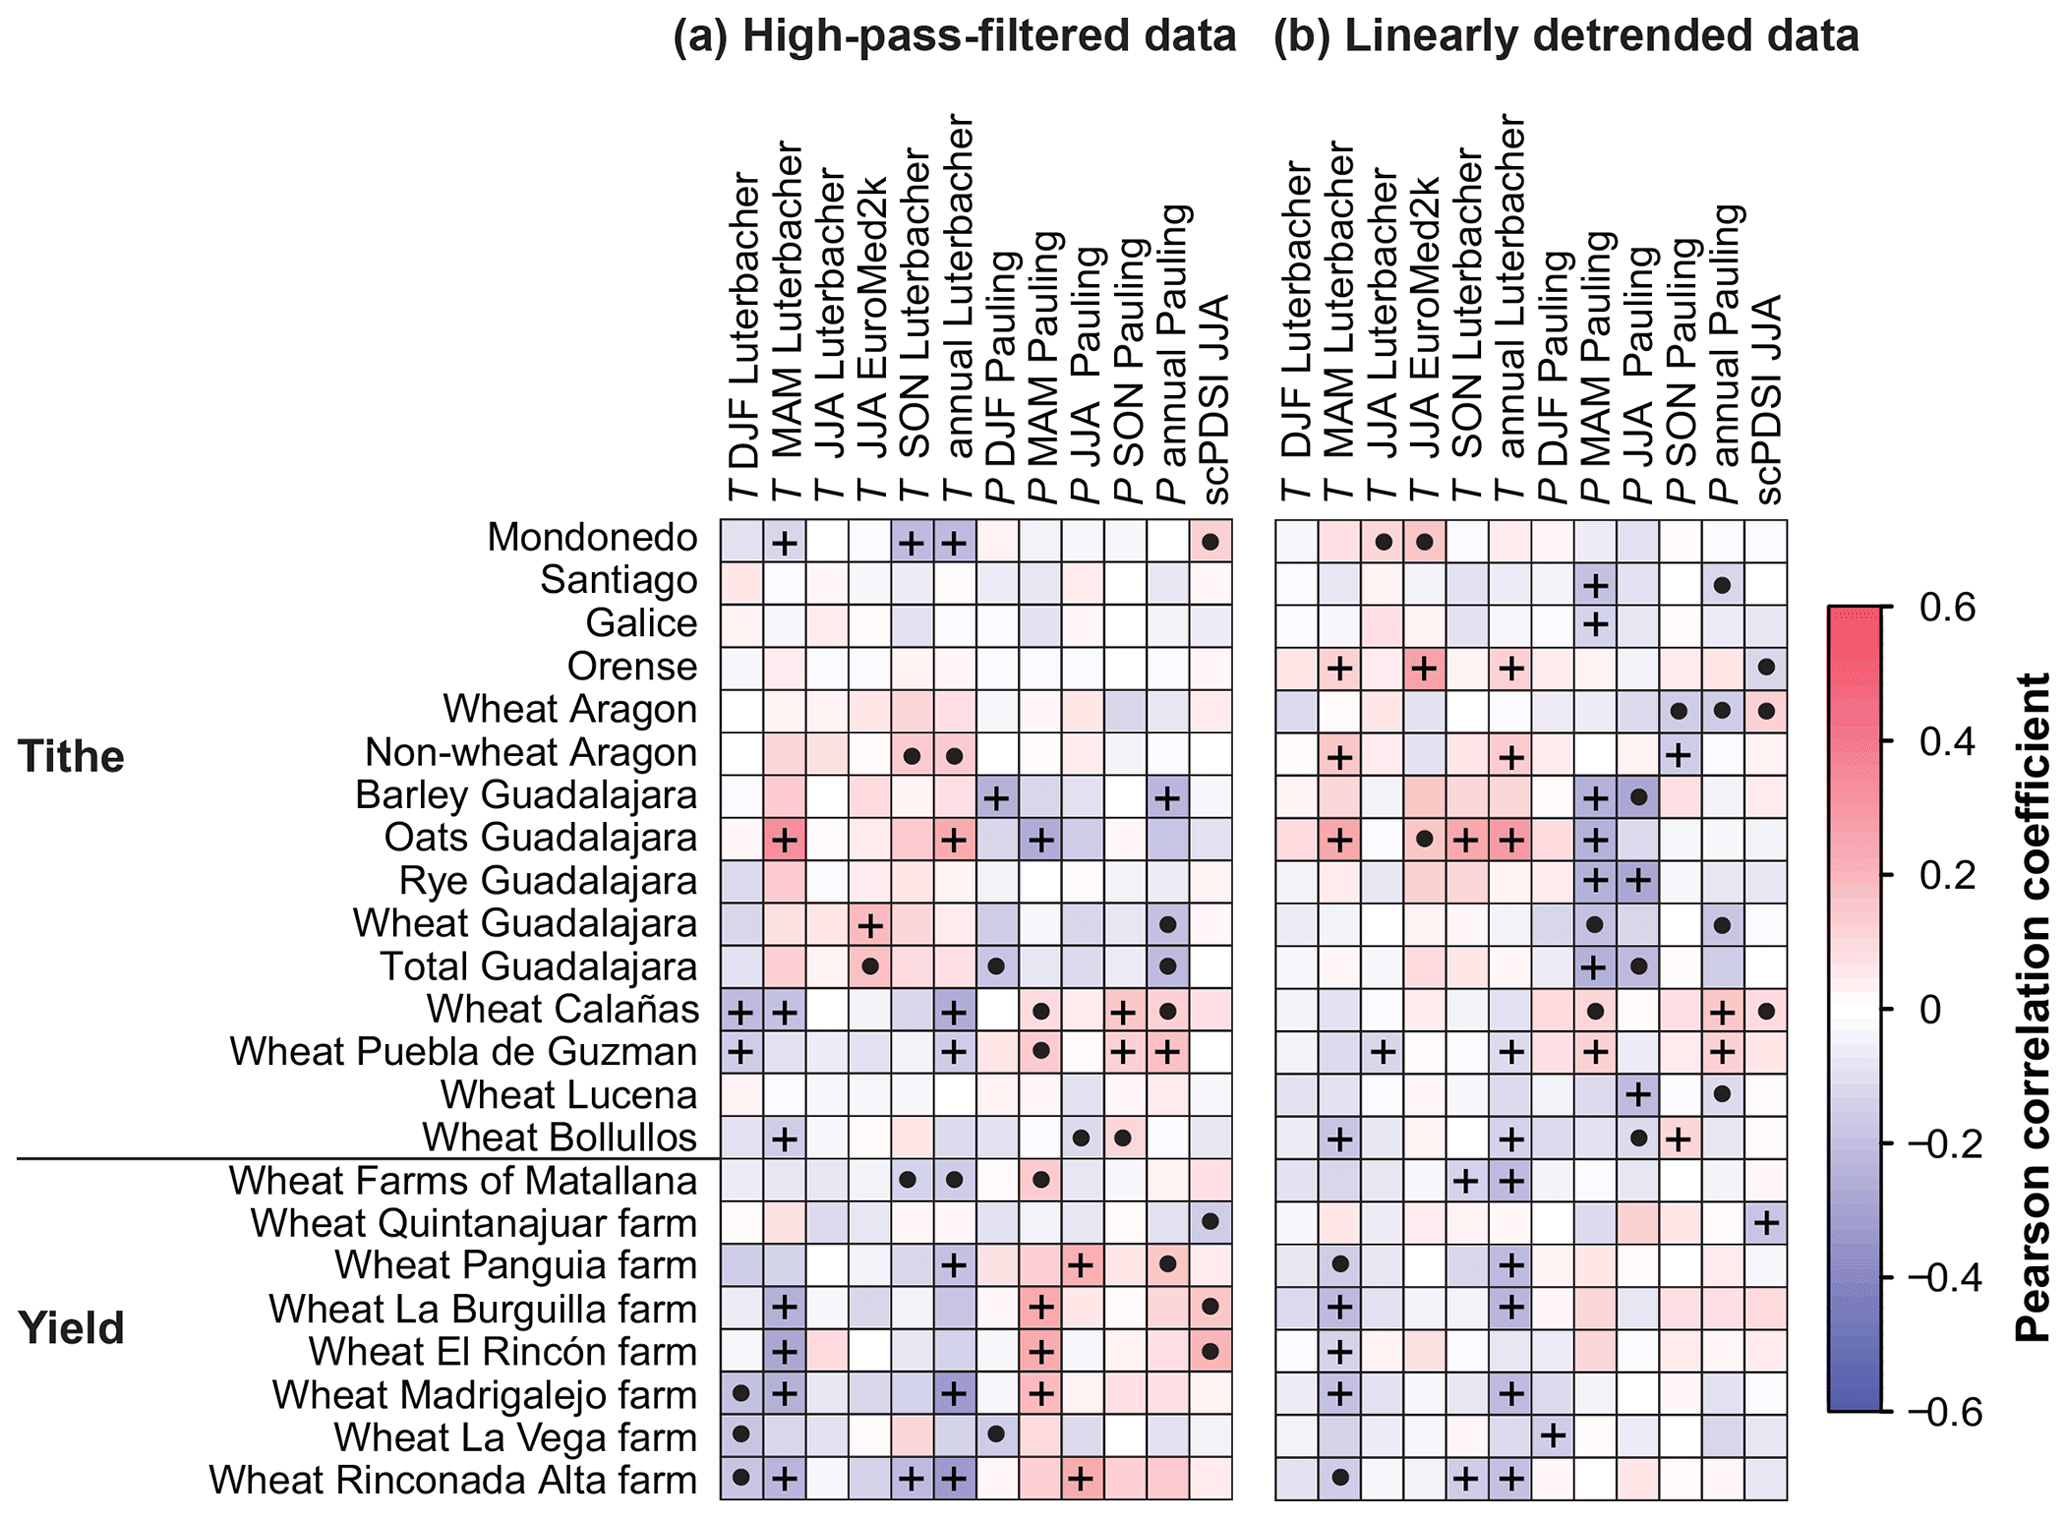
Figure 5Cross-correlation matrix for Spain between climate series and grain tithe and yield ratio series for 10-year high-pass Gaussian filtered data (a) and linearly detrended data (b). Correlations significant at the p=0.05 level with a t test are marked with a dot (⋅). Values that are additionally significant using the phase-scrambling test are marked with a plus sign (+).
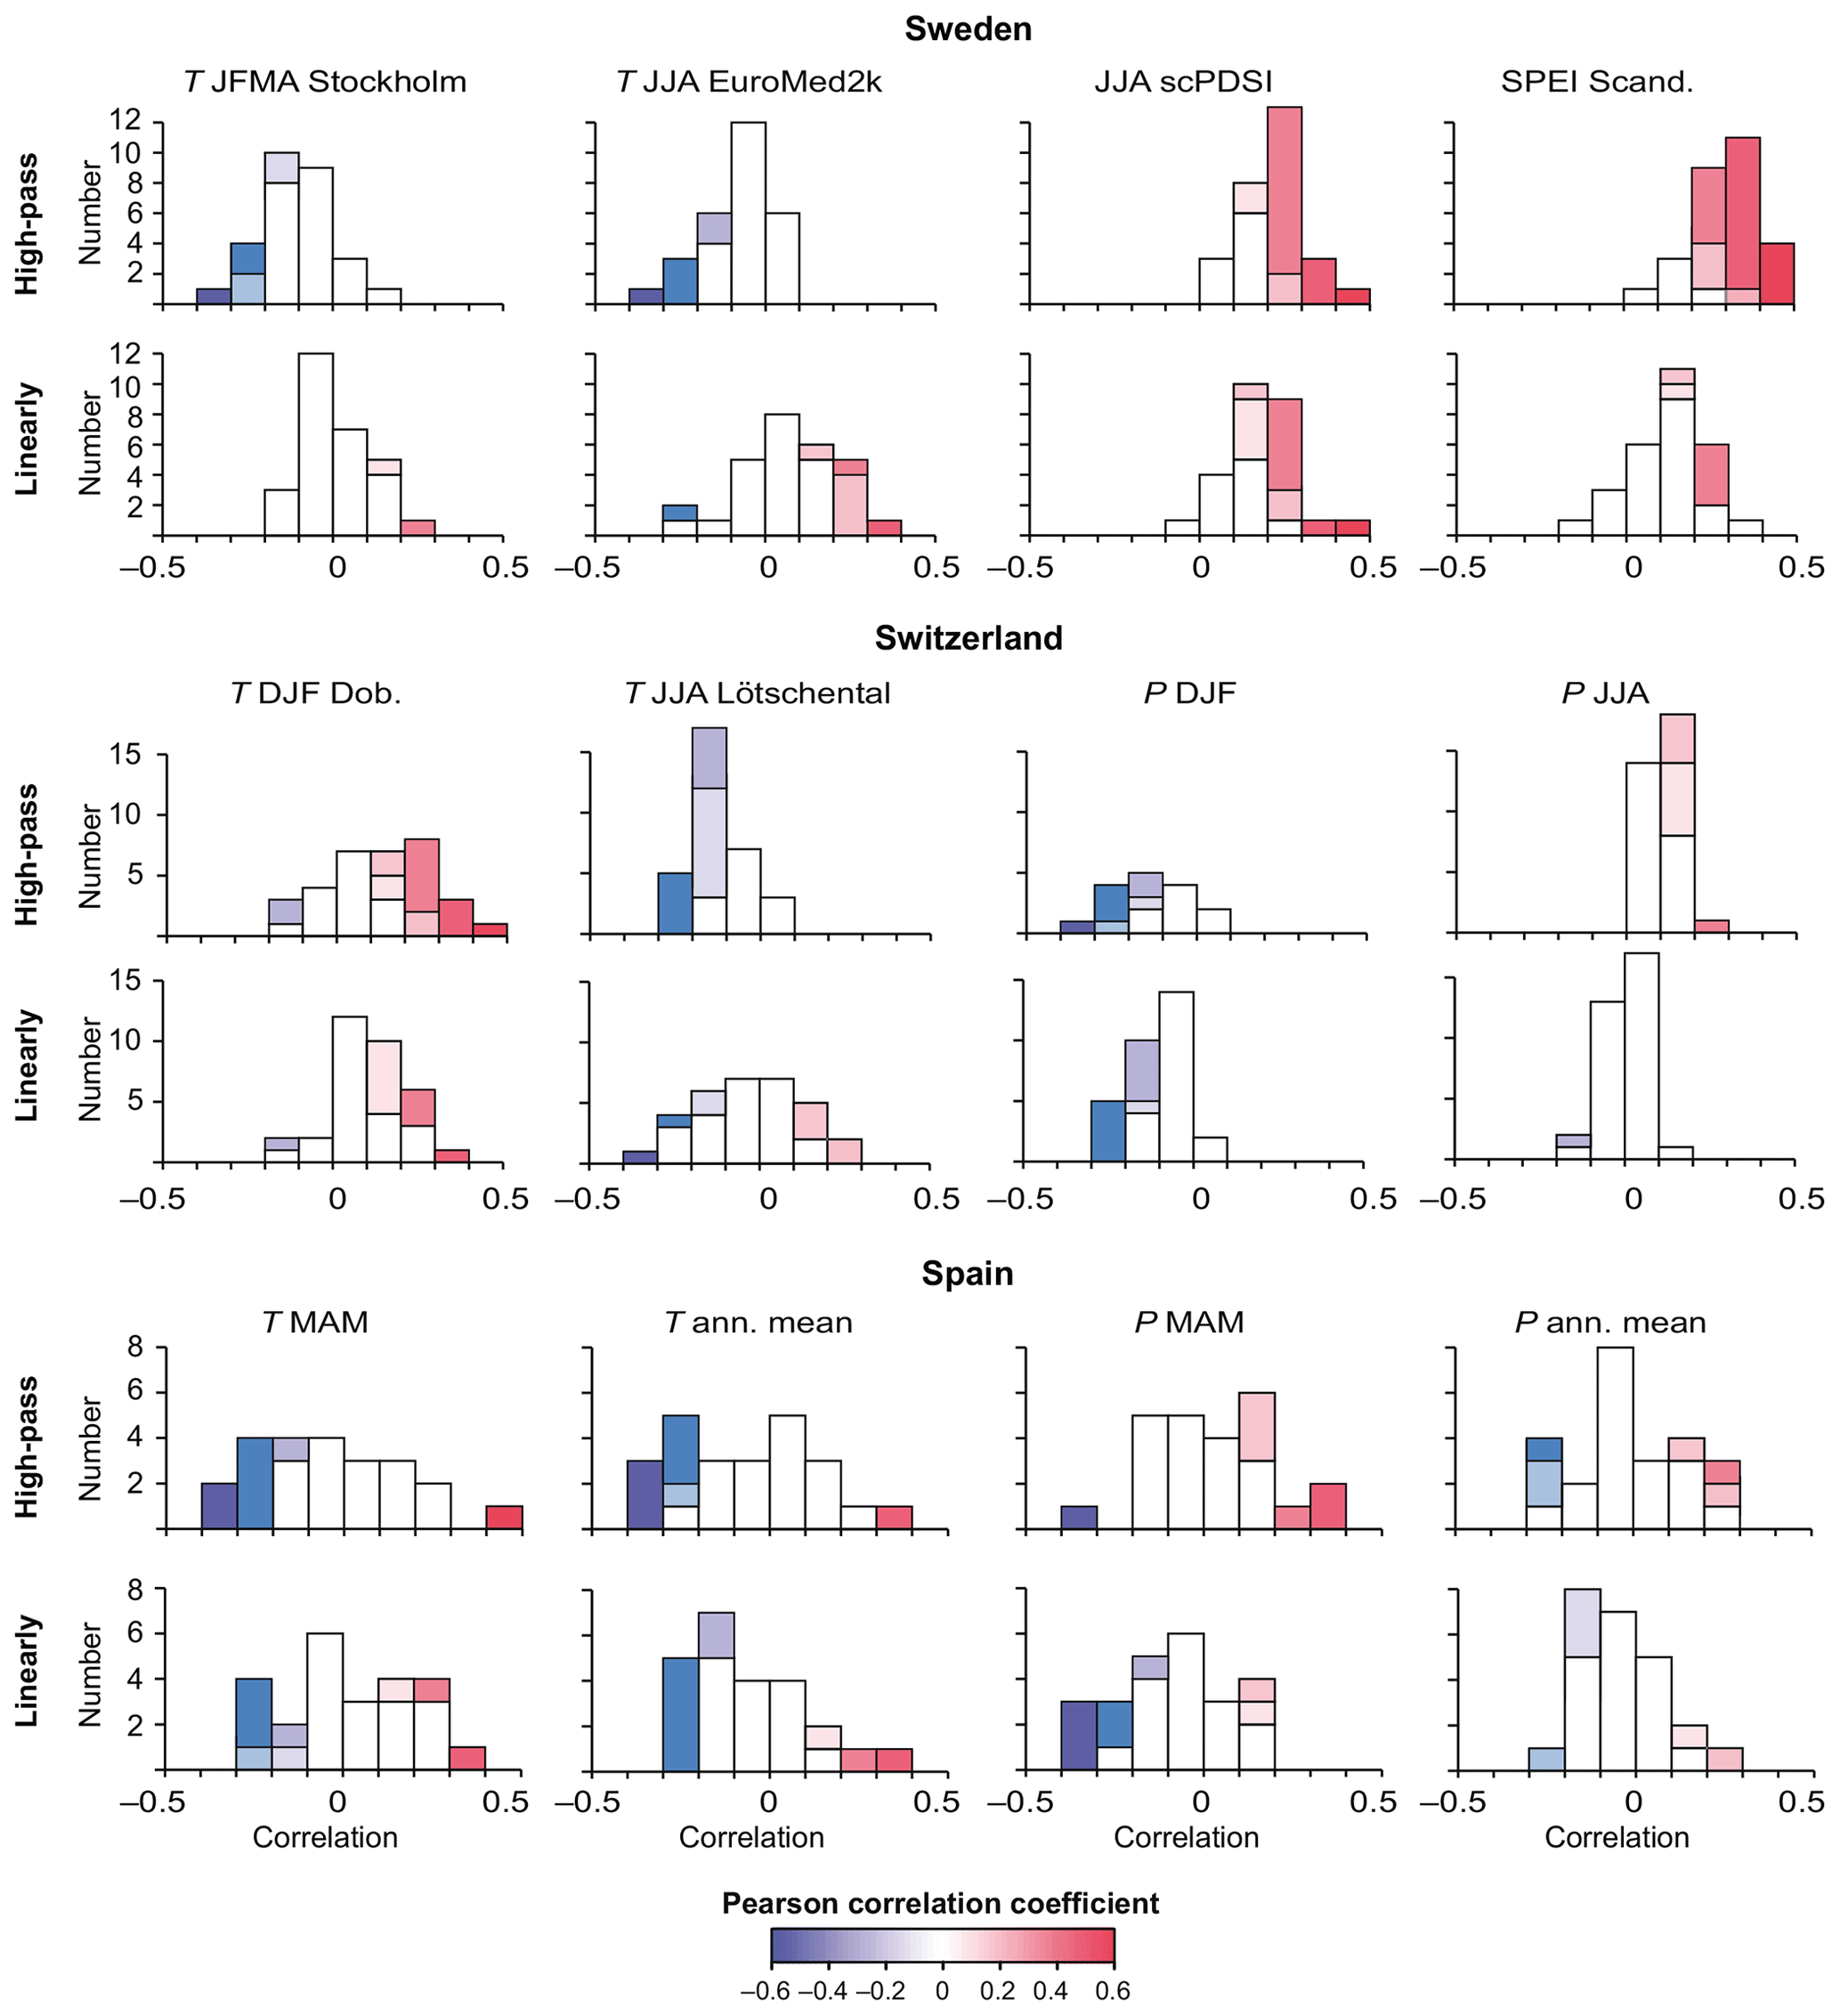
Figure 6Histograms showing the distribution of the most important climate–harvest yield correlations. Significant correlations are shown for the conservative phase-scrambling technique (dark-coloured bars) and for the standard parametric t test (light-coloured bars). The colour scheme follows the matrices in Figs. 3–5. Abbreviations are as follows: ann. mean is the annual mean, DJF is December–February, Dob. is Dobrovolný et al. (2010), JFMA is January–April, JJA is June–August, MAM is March–May, P is precipitation, scPDSI is Self-Calibrating Palmer Drought Severity Index, SPEI is Standardized Precipitation-Evapotranspiration Index, and T is temperature.
3.4 Granger causality of climate–harvest yield relationships
To establish the direction of causality, in order to reduce the possibility of spurious climate–harvest yield associations, we performed Granger causality analyses between harvest data and those temperature and hydroclimatic reconstructions with the most significant correlations for Sweden, Switzerland, and Spain (as listed in Tables A2–A5). This means EuroMed2k June–August temperature and Scandinavian SPEI for Sweden, Dobrovolný et al. (2010) December–February temperature and December–February precipitation for Switzerland, and March–May temperature and precipitation for Spain. In addition, we perform a Granger causality analysis between harvest series and regional grain price data (listed in Table A1) for the same three regions to investigate and preclude the possibility of spurious correlations.
In the case of Sweden, we have 28 harvest (tithe) series to be tested for temperature–harvest relationships of which only a handful provide evidence for a Granger causality relationship. We note that linearly detrended data give stronger results, especially at lags 1 and 2, than high-pass-filtered data. For Switzerland, we have 33 harvests (tithe and yield ratio) series to be tested, of which up to two-thirds give usable temperature–harvest results; more than half of these have Granger causality in the expected direction (i.e. from temperature to yields). Linearly detrended data give stronger indications of Granger causality at lag 1 and 3, whereas high-pass-filtered data give stronger indications of Granger causality at lag 2. In the case of Spain, where 23 series could have returned Granger causality test results, we find that at most only four do so – therefore, we have no strong evidence for Granger causality temperature–harvest relationships for Spain (Table 4).
Roughly half of the 28 “testable” pairs (i.e. the number of pairs that can be calculated) from Sweden return results for hydroclimate (Table A2). Most of these are in the expected direction. Relatively similar results are obtained for high-pass-filtered and linearly detrended data. For Switzerland, weak evidence is found for precipitation–harvest relationships with Granger causality. However, linearly detrended data give us somewhat stronger results at the risk of being spurious. We found for linearly detrended data that eight causalities were significant and that seven of these were directed from precipitation towards harvests. Only one pointed in the other direction. Very few results of precipitation–harvest relationships with Granger causality are obtained for Spain (Table 4). This is particularly the case using high-pass-filtered data.
For Sweden, for which we have 28 testable harvest series and the Stockholm barley/rye price series, roughly two-thirds return usable results, and in almost all cases they are in the expected direction of Granger causality. The high-pass-filtered data give slightly stronger results. In the case of high-pass-filtered data, at lag 1 all 20 out of 20 unambiguous results are in the expected direction (i.e. from yield to price). The harvest–price relationship for Switzerland, with 33 harvest series and the Basel rye and Zurich spelt price series, return usable results for over half the cases for lag 1 and 2 (Table 4). We tested all the harvest series against both the Basel rye and the Zurich spelt prices. The difference between high-pass-filtered and linearly detrended data is small. For Spain, 22 out of 23 series return unambiguous results at lag 1. At lags 2 and 3, almost all return unambiguous results when using linearly detrended data but only about half when using high-pass-filtered data. A higher proportion of the results for Spain for high-pass-filtered data than linearly detrended data are in the expected direction of Granger causality.
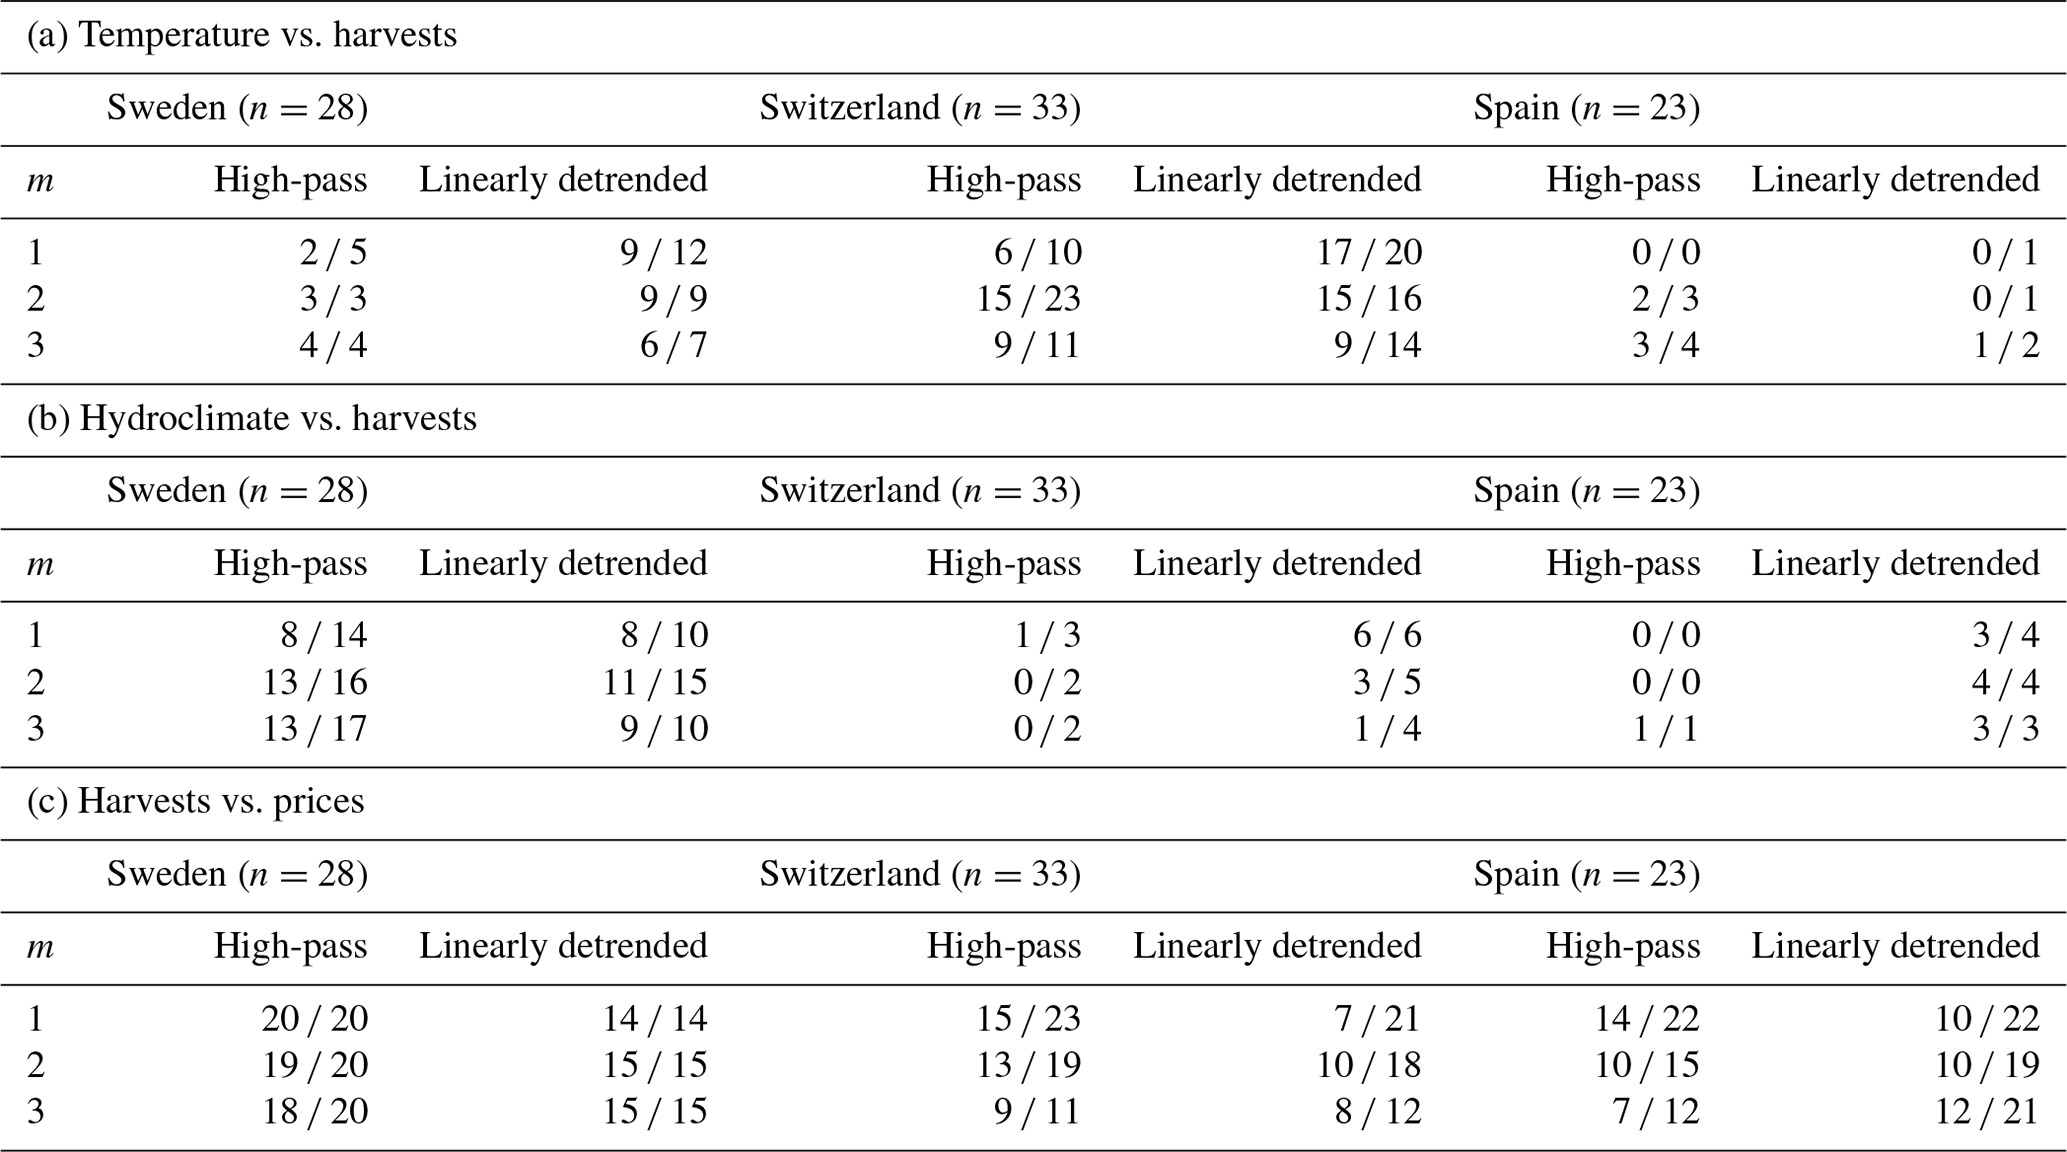
Table 4Granger causality test results based on tithe and yield series and temperature, hydroclimate, and grain price records. The maximum (m) order of the lags tested is 3 (column 1). Columns 2 to 7 give the results in pairs for 10-year high-pass-filtered and linearly detrended data, respectively, of the Granger causality test in the notation “” where “B” is the number of series that returned unambiguous test results and “A” is the number that only allowed for causality in the excepted direction. Wald testing performed at the p=0.05 significance level. After each region name we indicate n for the number of tithe and yield series available for testing.
4.1 The importance of climate for harvest yields
Relatively weak, but overall regionally consistent, climatic signals have been found in early modern harvest data across Europe (Sect. 3) regardless of the auto-correlative character of the data (Tables 1 and 2). The strongest climate signal is the positive association with summer soil moisture in Sweden (Sect. 3.1), the positive association with winter temperature and negative association with winter precipitation in Switzerland (Sect. 3.2), and the negative association with spring and annual mean temperature in Spain (Sect. 3.3). The Granger causality test reveals that highly significant climate–harvest associations tend to be in the expected direction (i.e. from climate to yield) (Sect. 3.4).
Our results (Sect. 3.1) obtained using high-pass-filtered climate and tithe data from Sweden are, in part, in line with previous studies for later historical periods using first-differenced data (e.g. Edvinsson et al., 2009). Furthermore, it is interesting to note the appearance of a temperature constraint during the growing season for Örebro and Stockholm counties, which suggests that the boundary between the temperature-constrained cultivation in northern Sweden and the precipitation-constrained cultivation in southern Sweden might historically, during colder climate periods (not shown), have been located further south than previously suggested (e.g. Utterström, 1957; Edvinsson et al., 2009).
For Switzerland, we confirm a significant negative association between winter precipitation and grain harvests (Sect. 3.2). However, no evidence was found for a negative association with autumn precipitation as previously reported (Pfister, 1988, 2005, 2007). The winter precipitation signal may, in part, be due to the flushing of nitrogen from manure spread on the fields, which mainly affected the lower part of the Swiss Plateau (Pfister, 1984). We also confirmed the reported positive correlation between warm springs and harvests, but we found the effect of warm winters to be stronger. The reported adverse effect of wet summers (Pfister and Wanner, 2021) could not be detected. This could possibly be related to the fact that we use average data for June to August, while the negative precipitation–harvest association is restricted mainly to the month of July (Pfister, 1988). Instead, though constrained to the high-frequency domain, the negative summer temperature–harvest relationship indicates a drought sensitivity (Table A5). The heterogeneous and weak climate–harvest association found for Spain (Sect. 3.3) is in line with previous results (Barriendos, 2005; Peña-Gallardo et al., 2019; Moreno et al., 2020). This is presumably directly related to the fact that Spain hosts among the most heterogeneous climatic conditions in Europe (Rodrigo and Barriendos, 2008; Beck et al., 2018). Nonetheless, the most apparent result, especially for the inland and southern Spain, is that cooler and wetter winters and springs contributed to better harvests. Only in Guadalajara on the central Spanish plateau was the opposite found.
The different detrending methods have partly revealed different correlation patterns. In the case of summer temperature for Sweden (Sect. 3.1) and Switzerland (Sect. 3.2), the high-pass-filtered data and the linearly detrended data even show opposite directions of correlations, where the high-pass-filtered data show negative (i.e. warmer temperatures meaning lower yields and vice versa) associations with summer temperatures and the linearly detrended data show positive (i.e. warmer temperatures meaning higher yields and vice versa) associations with summer temperatures (Fig. 6). To better constrain early modern climate–harvest relationships across all frequency bands, we would need to acquire harvest data that adequately capture multi-decadal grain yield variability and that are not dominated by trends on these timescales unrelated to actual growth conditions.
It might appear surprising that Sweden is the study region showing the strongest growing season drought sensitivity in grain harvest. However, the annual mean precipitation in the main agricultural areas in the southeast of Sweden is only about half of the rainfall in the main agricultural areas of Switzerland; furthermore, only about 15 % of the precipitation falls in March–May compared to about 25 % in Switzerland. Consequently, despite a shorter growing season, Swedish agriculture is more drought-prone, particularly during spring and early summer (De Toro et al., 2015). Whereas June–August mean temperature is comparable between Stockholm (17.4 ∘C) and Bern (18.0 ∘C, both from 1991–2020), the Swedish capital receives more sunshine and less precipitation during those months (789 vs. 696 h and 189 mm vs. 322 mm, respectively). The spring growing season of grain in Spain is considerably colder compared to the respective summer growing seasons in Sweden and Switzerland. At Guadalajara, at 700 m above sea level, the March–May mean temperature reaches only 12 ∘C, which is about 5 ∘C colder than the June–August mean at the Swedish and Swiss sites. Thus, it is not surprising that certain Spanish locations reveal positive correlations of grain harvest with winter and spring temperatures.
4.2 Climate–grain harvest associations during years of harvest failures
The comparatively weak correlations between seasonal climate parameters and grain harvest yields should not be interpreted as climate conditions playing a minor role for harvest failures and subsequent food crises in early modern Europe. While seasonal climate conditions only explain a fraction of the yield variations during most years, the majority of the severe harvest failures – those that could trigger famines during the early modern period – occurred during years with cold springs and summers, with prolonged periods of excessive precipitation right before, or during, harvest time (Pfister and Wanner, 2021). Consecutive years of poor harvests were especially associated with cold climatic anomalies (Ljungqvist et al., 2021).
Thus, climate played a far larger role for “shocks” to the food supply than what the relatively low climate–harvest correlations obtained here by themselves would imply. Very adverse climatic conditions for grain agriculture were responsible, partly or entirely, for most major food crises in early modern Europe (Alfani and Ó Gráda, 2017, 2018). This was especially the case as the same climatic conditions that lowered grain yields – cold springs and wet summers or severe droughts – also decreased pasture productivity and fodder availability (Pfister, 1988; White et al., 2018; Brázdil et al., 2019; Huhtamaa and Ljungqvist, 2021; Costello et al., 2023); it also favoured the development and spread of diseases among domestic animals (White, 2014; Newfield, 2015). Excess mortality among domestic animals, in turn, decreased the availability of manure to fertilize the grain fields, thus lowering the yields in subsequent years (Pfister and Wanner, 2021).
4.3 Limitations related to the climate data
Prior to the late seventeenth century, the Luterbacher et al. (2004) temperature and Pauling et al. (2006) precipitation reconstructions are solely based on proxy data, which only explain a fraction of the actual seasonal climate variability. For example, both the Luterbacher et al. (2004) temperature and the Pauling et al. (2006) precipitation field reconstruction are lacking local input data from Sweden during the period covered by the Swedish tithe series – thus, the lack of correlation with the Swedish tithe data is not surprising. The higher seasonal correlations with the Luterbacher et al. (2004) and Pauling et al. (2006) reconstructions with the Spanish tithe and yield records that only cover the eighteenth century indicate higher correlations by including early instrumental records in these reconstructions. Our findings imply that a lack of significant correlations between seasonal precipitation and harvest data is likely due to the limitations of proxy-based precipitation reconstructions. This highlights the need to develop new regional precipitation reconstructions, in the best case with a denser and longer proxy data network, and to improve the quality of existing ones.
For Switzerland, for which we have high-quality local precipitation and temperature data for all seasons (Pfister, 1992; Dobrovolný et al., 2010), we obtained more significant correlations than for Sweden and Spain for precipitation and for more seasons for temperature. However, limitations in the low-frequency domain might exist because documentary climate reconstructions based on the index method typically under-represent the full amplitude of low-frequency climate variations (Adamson et al., 2022). This may partly explain the highly significant correlations for Switzerland when using high-pass-filtered data compared to linearly detrended data (see Fig. 4; Table A4).
4.4 Limitations related to the harvest data
The Swedish tithe data contain numerous missing years and also years when the data may be considered uncertain (Myrdal and Söderberg, 1991). Furthermore, the Swedish tithe data for different counties partly cover different periods (Leijonhufvud, 2001; Hallberg et al., 2016) and thus capture different prevailing climate conditions. For Switzerland, an estimation of the actual harvest size is sometimes difficult since tithes were sold at auctions rather than collected in the field, although the authorities' controls were rather strict (Pfister, 1979). A problem in detecting climatic signals in parts of the tithe data, especially from Spain, is when tithes consisted of different types of grains with exact proportions of each changing over time (Le Roy Ladurie and Goy, 1982).
The varying climate sensitivity between tithe records and yield ratio records from the same region is not surprising as soil properties, elevation, and micro-climatic conditions additionally affected the climate–harvest yield associations. Variations in the yield data may partly be related to changes in farming methods and/or availability of manure for fertilization (Pfister and Wanner, 2021). Yield ratios from individual estates typically show low correlations among themselves and with tithe data over longer time spans (i.e. more than 10 years) except during more extreme climatic periods (Leijonhufvud, 2001). Differences between farms in ploughing, fertilizers, weeding, sowing intensity (per area), and so forth (Simpson, 1996; Hoffman, 1996; Gadd, 2011; Myrdal, 2011; Martínez-González et al., 2020) may to some extent offset potential climate signals at the local (farm) level, but they should be mitigated when averaging the data to regional means.
4.5 Human agency dominating long-term harvest yield changes
Considering that climate variables only explain parts of the harvest yield variations, past as well as present, it is also important to consider other factors when studying climate-dependent activities like agriculture (sensu Hulme, 2011; Haldon et al., 2018; van Bavel et al., 2019). This includes (i) a fading and non-linear relationship between seasonal climate and harvest yields at locations far from the climatological limits of a certain crop, (ii) poor harvests often resulting from single days or weeks of unfavourable weather conditions rather than seasonal average climate conditions, and (iii) the large degree to which harvest yields depended on factors related to human agency (e.g. socio-political and socio-economic settings, cultural traditions, infrastructure, and technology).
Moreover, early modern harvests were influenced by pests and diseases, seed quantity and quality, manure availability, access to draught animals, and availability of labour (Simpson, 1996; Gadd, 2011; Myrdal, 2011; Moreno et al., 2020; Pfister and Wanner, 2021). The lack of seed grain after consecutive harvest failures could also reduce the harvest in subsequent year(s) of good growth conditions (Appleby, 1979; Pfister, 1990; Bekar, 2019), as has been demonstrated for early modern Finland (Huhtamaa et al., 2022) but also for non-peripheral, fertile agricultural districts such as Scania, present-day southern Sweden (Brasch, 2016). The genetic variety of early modern grain types was larger than today. For example, in Sweden varieties of extremely fast-growing spring barley that could be sown in late spring existed (Leino, 2017). Such a genetic diversity of grain varieties, adapted to local environmental conditions (Forsberg et al., 2015, 2019), complicates comparisons between climate–harvest relationships through time and between regions.
Modern climate–grain harvest yield relationships are not necessarily the same as historical agrometeorological relationships. Agricultural practices changed during the nineteenth and twentieth centuries due to mechanization, chemical fertilizers, pesticides, and higher-yielding seed varieties, resulting in multiplied harvest yields. For example, “field inaccessibility” due to excessively wet soils, which reduces operability and increases soil compaction, posed a major hazard for grain production in northwestern Europe during the 1980–2010 period (Trnka et al., 2015). This type of hazard would have been very different for pre-industrial agriculture.
Using a coherent framework of statistical analyses, we re-assessed the temperature and hydroclimate signatures in grain harvest data among diverse environmental settings of early modern (ca. 1500–1800) Europe. We detected regionally consistent, but overall relatively weak, climate–harvest relationships. Even though the majority of the severe food crises during the early modern period were connected to climate anomalies, only a fraction of documented grain harvest variations can be explained by the available climate data. The strength of historical climate–harvest associations revealed here is similar to contemporary climate–grain yield relationships in Europe. Higher soil moisture have been found to be beneficial for harvests in Sweden, while warmer and drier winters favoured larger harvests in Switzerland. For Spain regionally more heterogeneous climate–harvest relationship patterns were found, with a dominating annual mean and spring temperature signal. The strength of the climate–harvest associations are somewhat weaker than the comparatively strong climate–grain price relationships previously reported by Esper et al. (2017) and Ljungqvist et al. (2022) (among others). We also found that climate–harvest correlations can change direction with frequency and in some regions with season (particularly for summer temperature in Switzerland and Sweden).
Broader empirical and methodological implications of this study include the need to (i) develop better precipitation reconstructions for the early modern period as the arguably greatest limitation to constrain climate–harvest relationships are stemming from the lack of such data; (ii) continue efforts to digitize already published harvest data and extract new harvest yield series from original archival research for additional regions and to reduce data gaps and uncertainties; (iii) explore changes in the frequency of climate extremes, and their effects on harvest yields, under different mean climate states; and (iv) further assess potential differences between the climate signal embedded in harvest yield and grain price data, including response differences to summer temperature. Further studies are also needed to assess grain quality, in addition to quantity, and their relationship to climate and their effects on grain prices during historical times.
Table A1Grain price data used for Granger causality analysis. Information about the grain type, covered period, missing values (“gaps” in percentage), the auto-correlation coefficient for a lag of 1 year, AR1, and the data source(s) is provided.
* An equal share of barley and rye prices whenever both are available.
Table A2Climate–harvest correlations for Sweden. Results using high-pass-filtered data are shown to the left of the vertical bar, and results using linearly detrended data are shown to the right of the vertical bar. Bold values indicate correlations significant at the p=0.05 level with a t test, and an asterisk (*) indicates significant correlations with the phase-scrambling test. All correlations for Sweden and their significance are shown in Fig. 3.
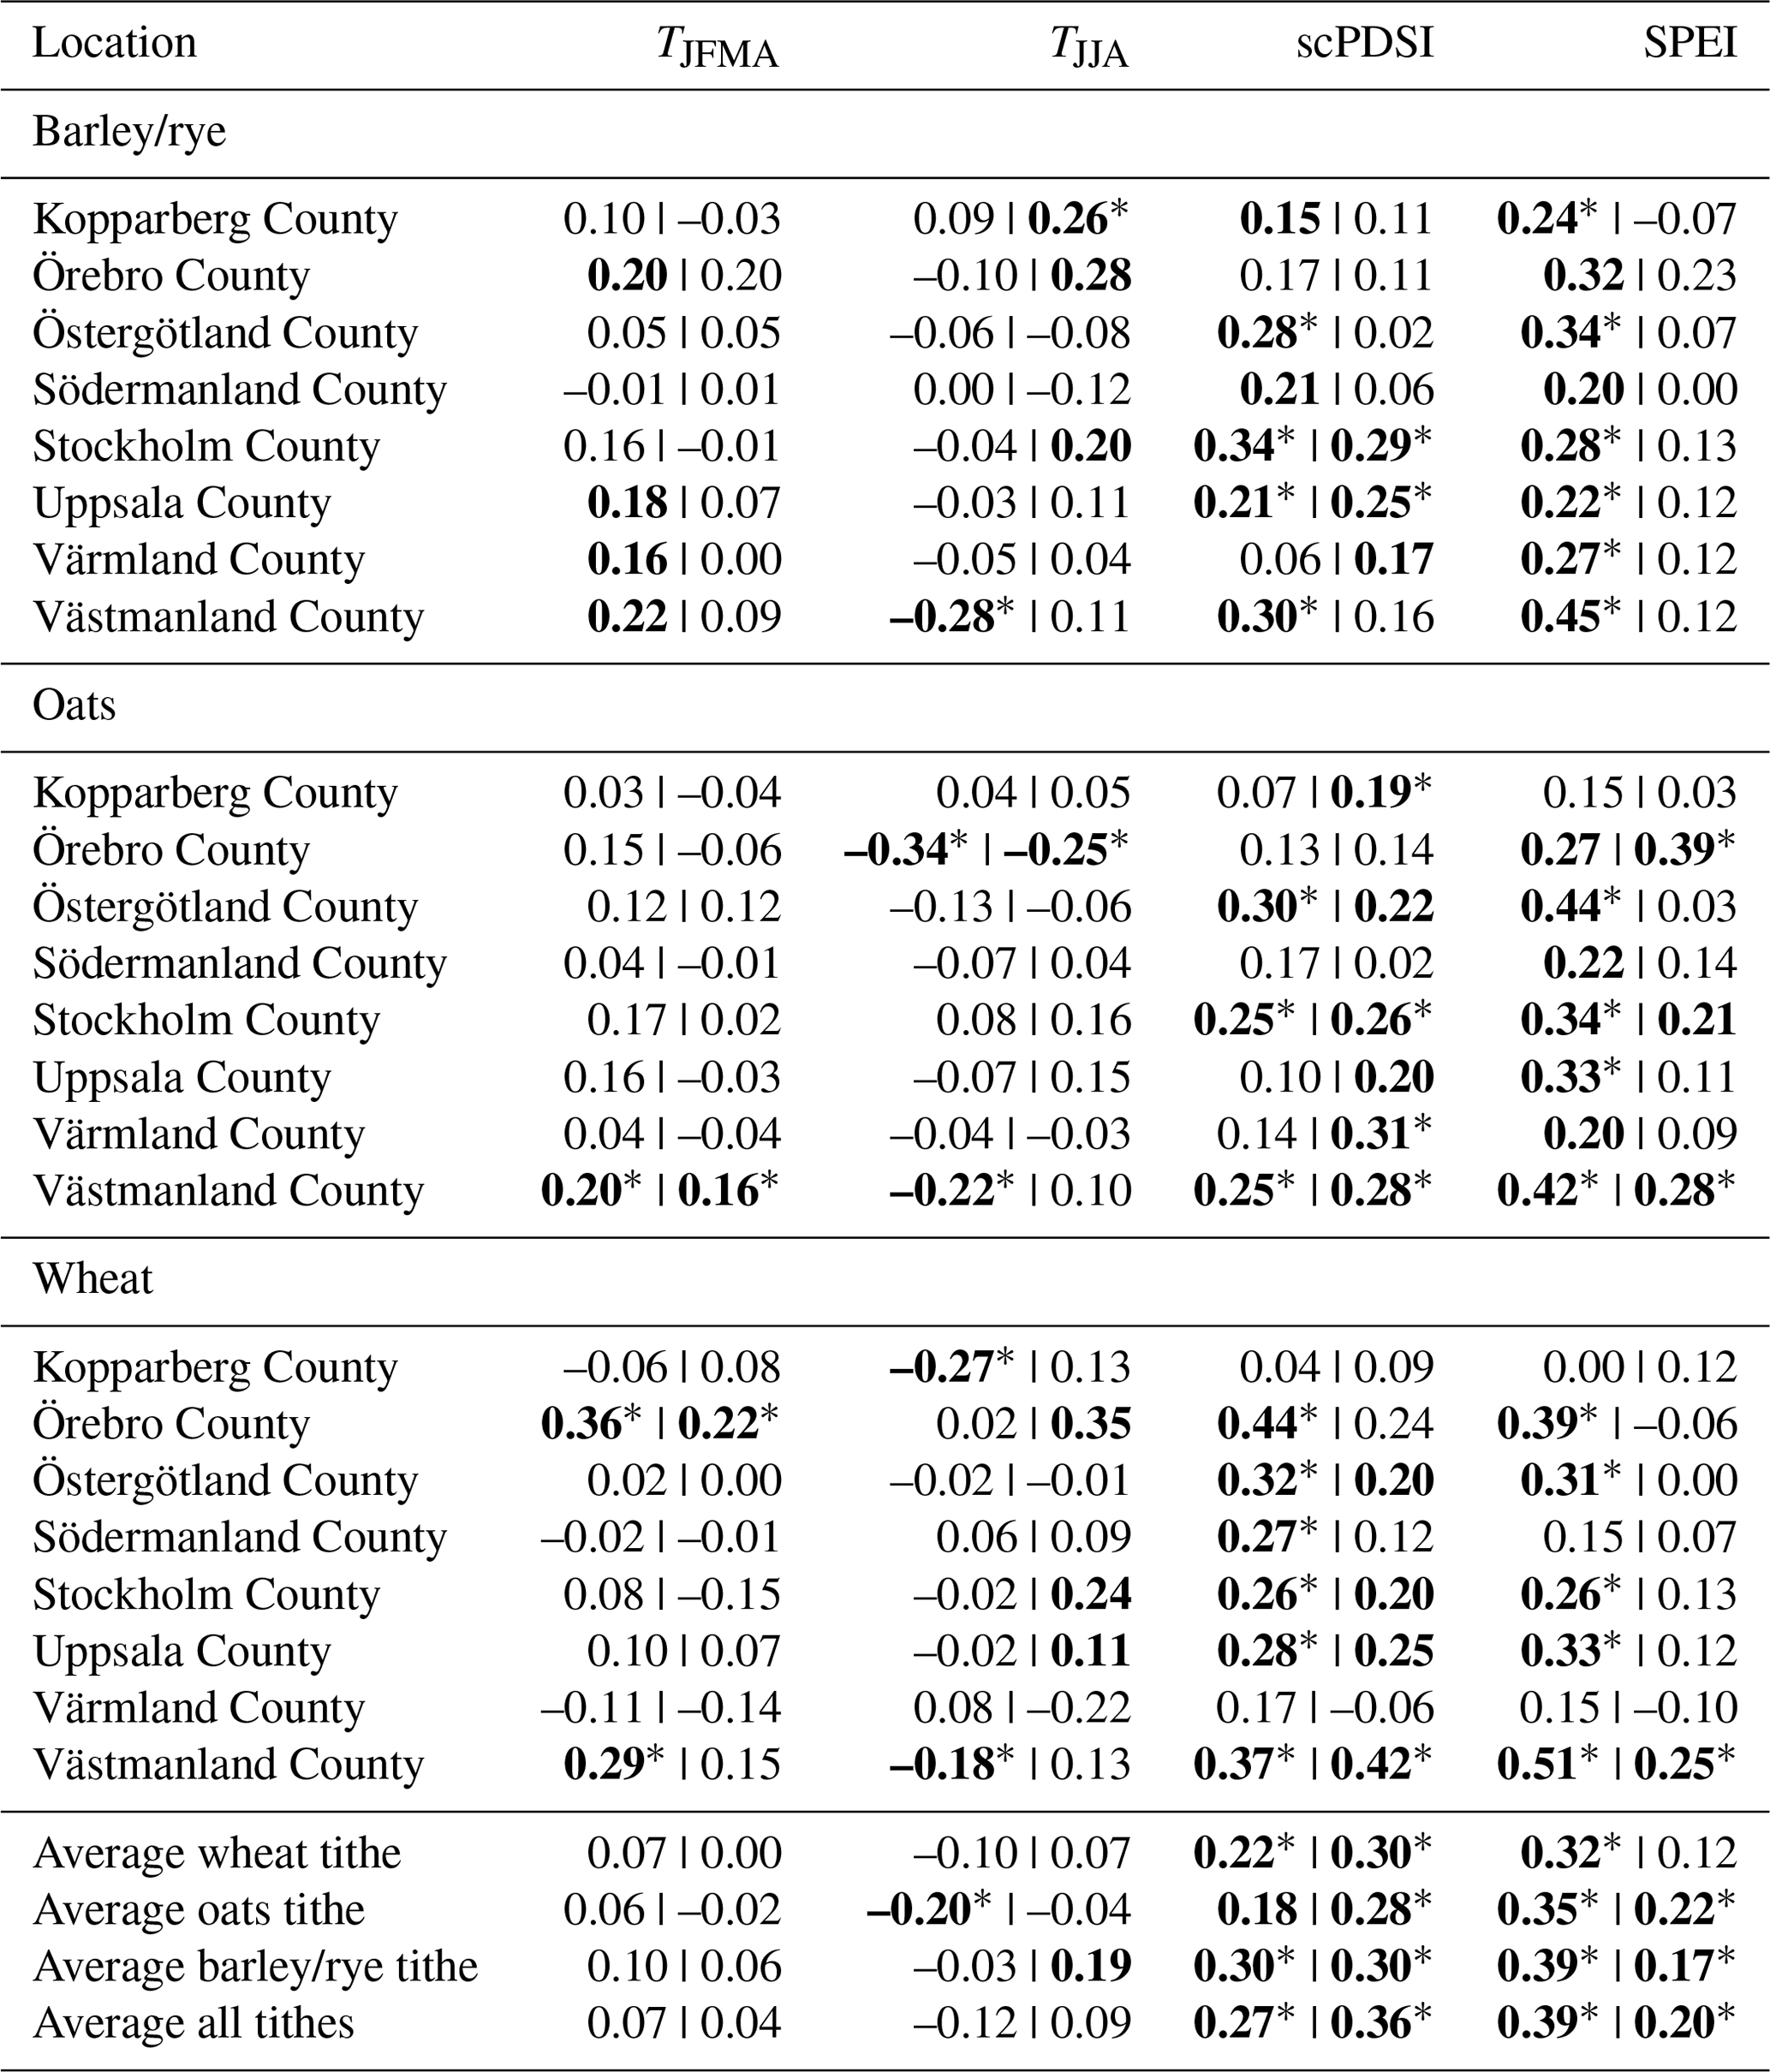
Table A3Climate–harvest correlations for Sweden for barley and rye tithe data separately. Results using high-pass-filtered data are shown to the left of the vertical bar, and results using linearly detrended data are shown to the right of the vertical bar. Bold values indicate correlations significant at the p=0.05 level with a t test, and an asterisk (*) indicates significant correlations with the phase-scrambling test.
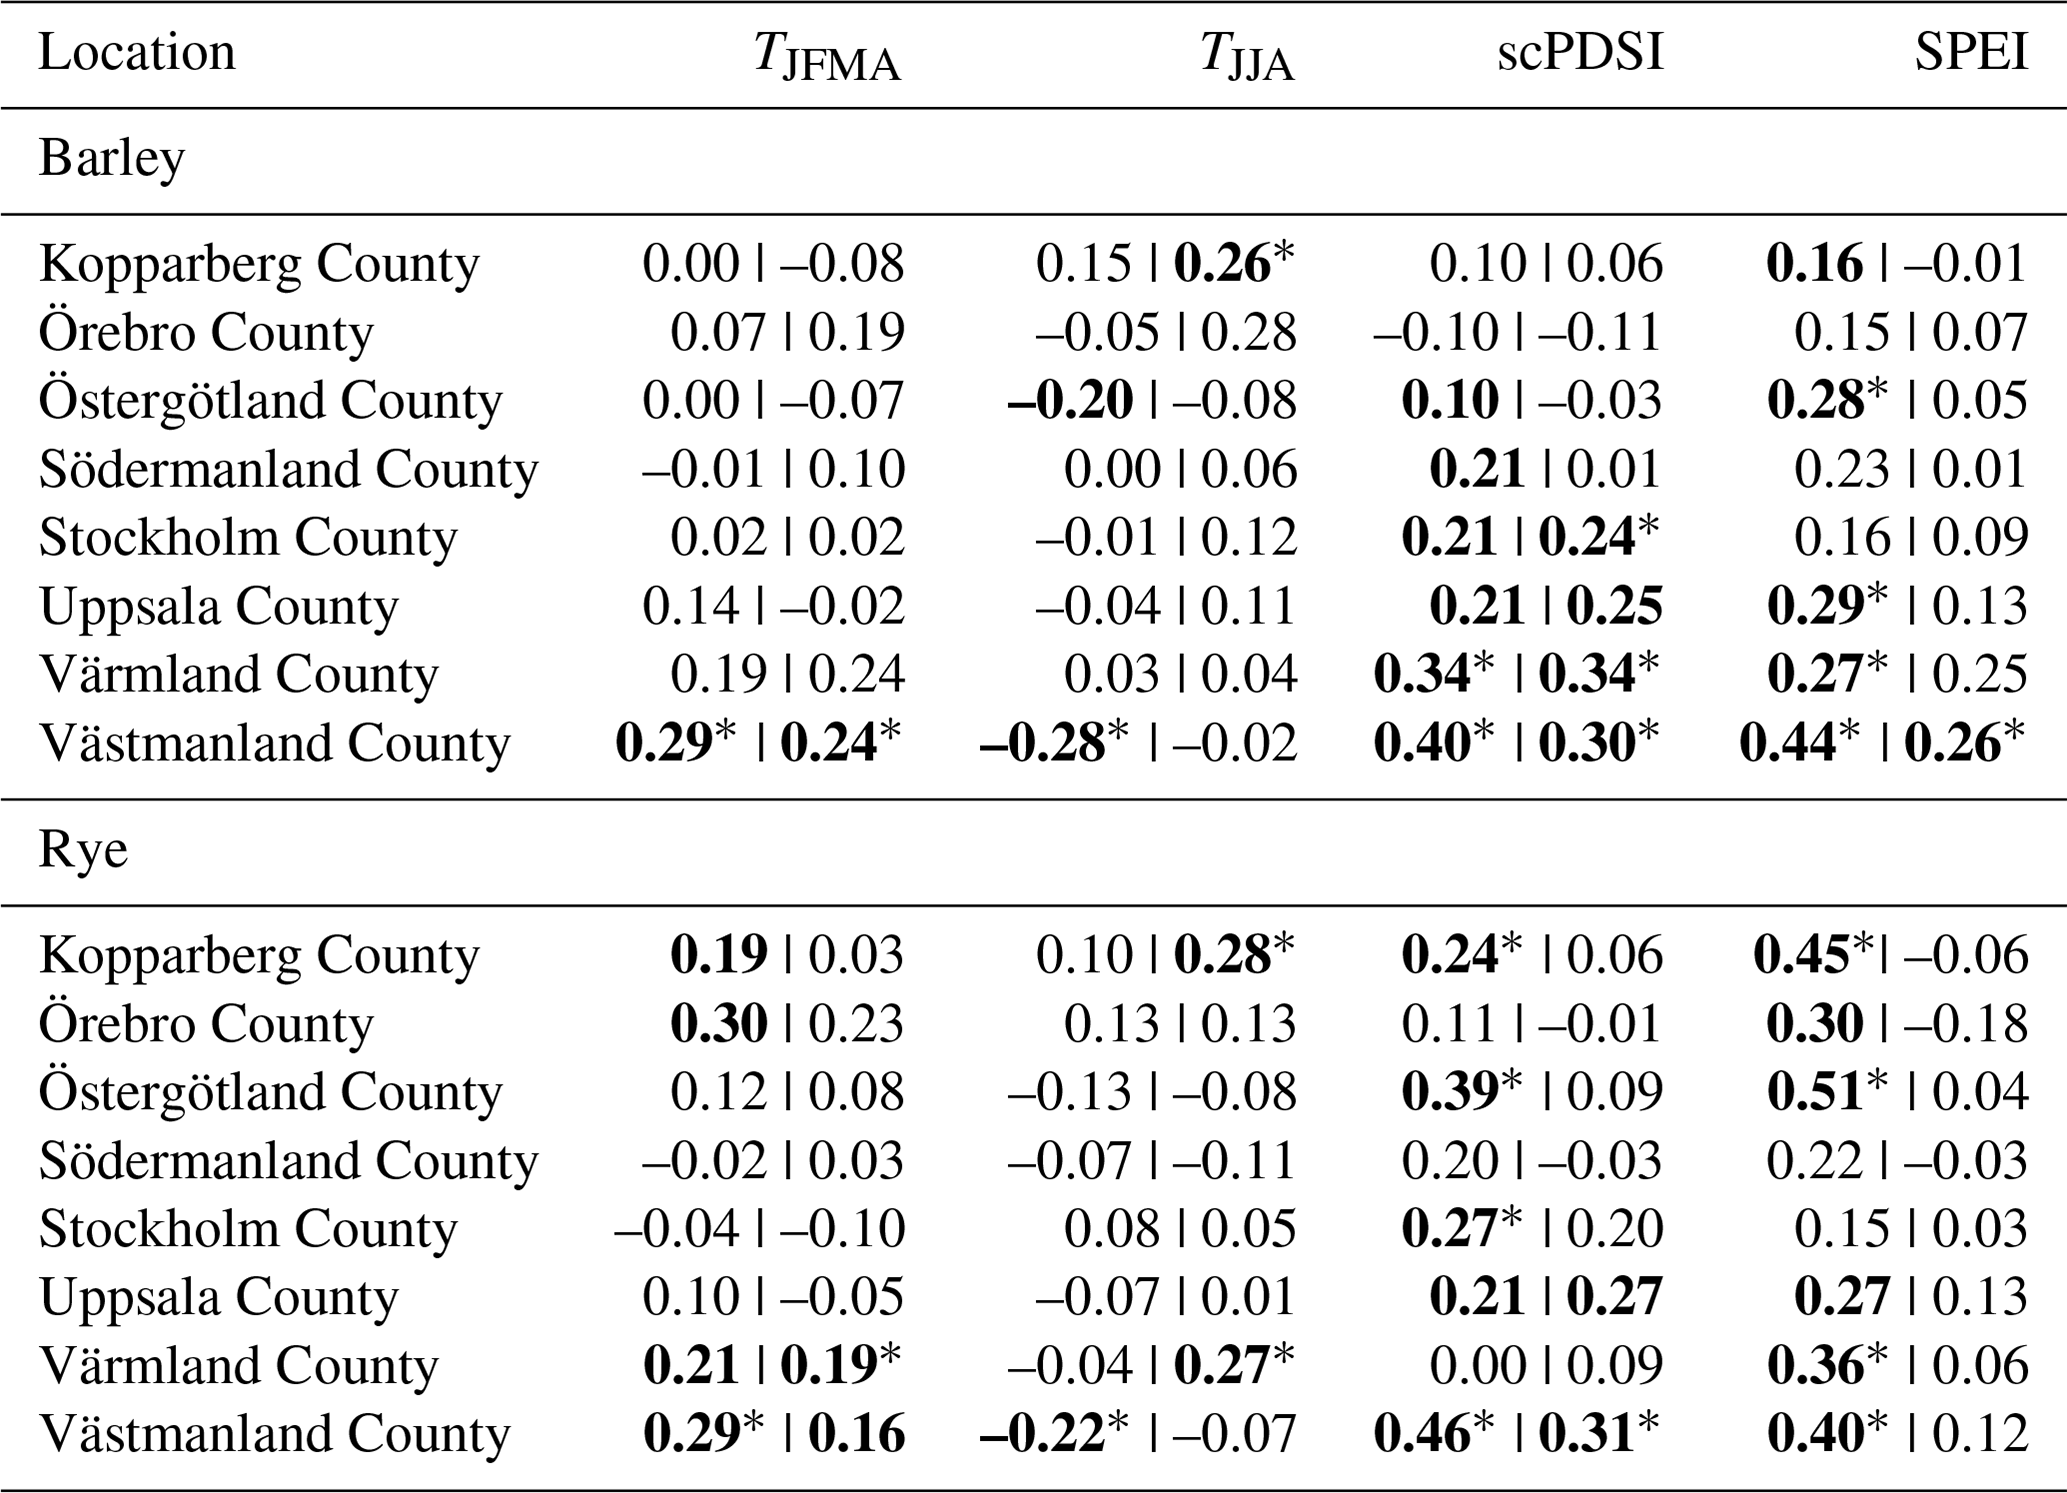
Table A4Climate–harvest correlations for Switzerland. Results using high-pass-filtered data are shown to the left of the vertical bar, and results using linearly detrended data are shown to the right the vertical bar. Bold values indicate correlations significant at the p=0.05 level with a t test, and an asterisk (*) indicates significant correlations with the phase-scrambling test. TDJF indicates Dobrovolný et al. (2010) DJF temperature reconstruction, TJJA indicates Büntgen et al. (2006) Lötschental JJAS temperature reconstruction, PDJF indicates Pfister (1992) DJF precipitation indices, and PJJA indicates Pfister (1992) JJA precipitation indices. All correlations for Switzerland and their significance are shown in Fig. 4.
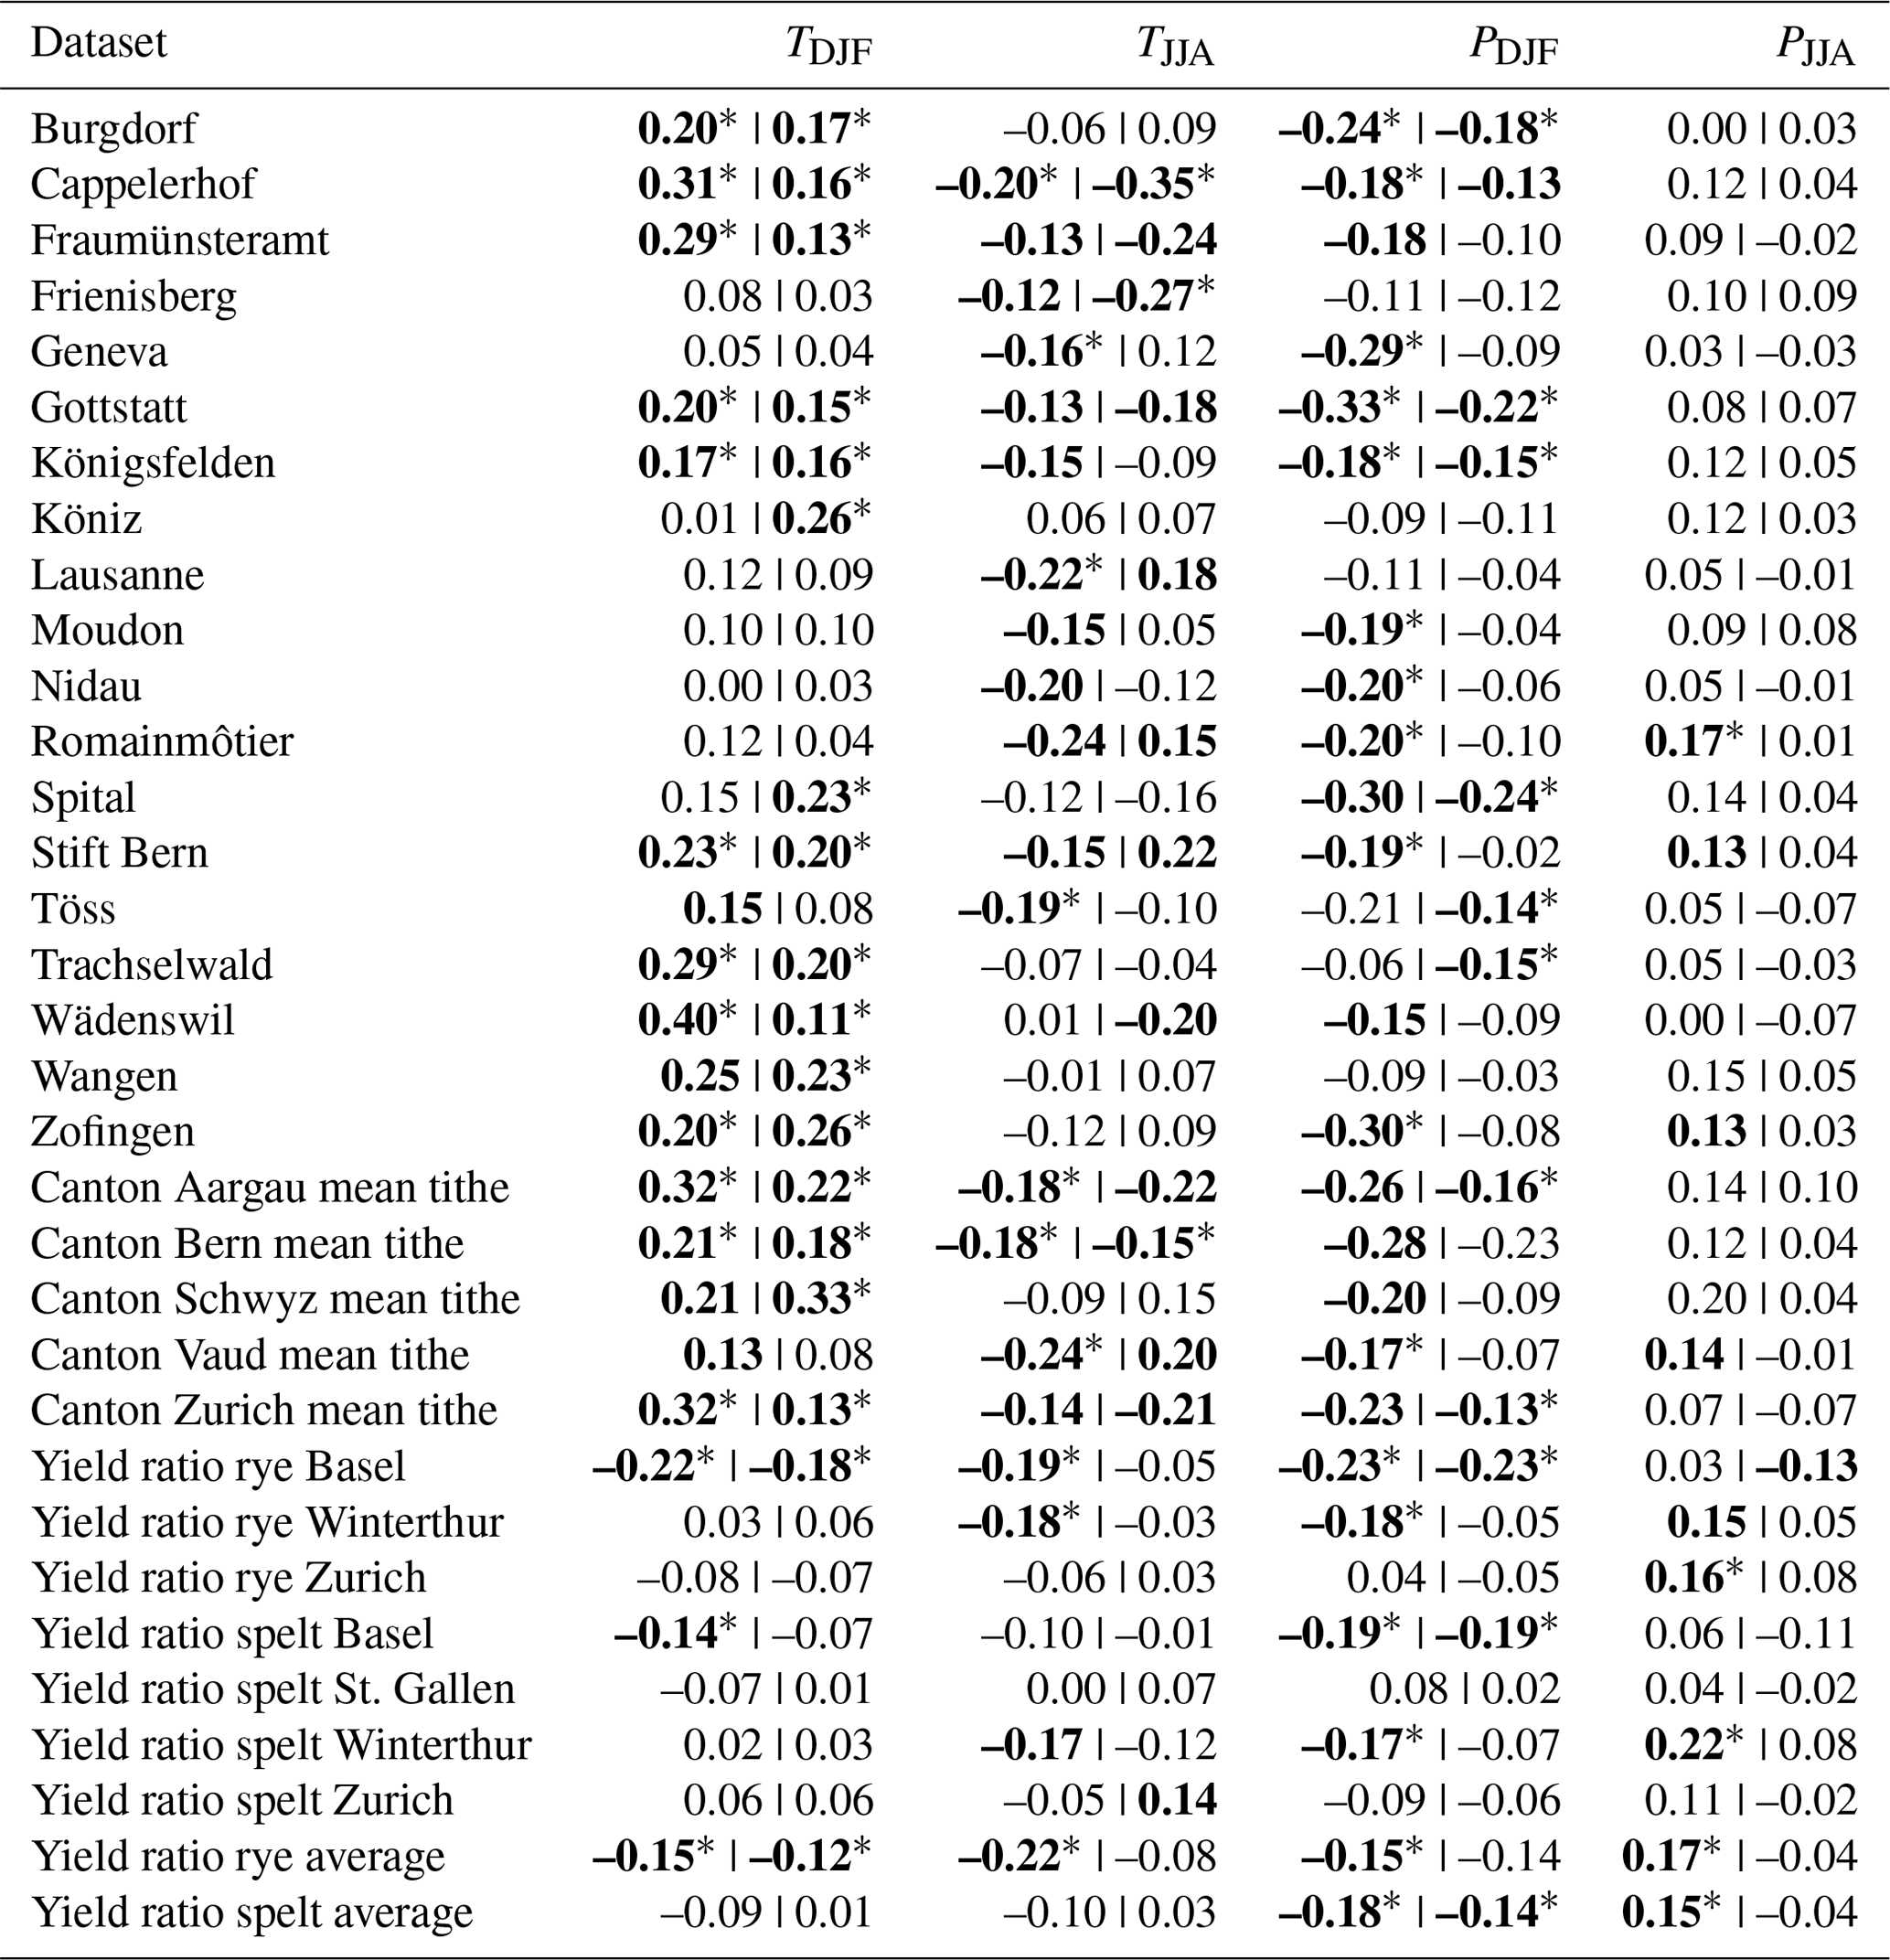
Table A5Climate–harvest correlations for Spain. Results using high-pass-filtered data are shown to the left of the vertical bar, and results using linearly detrended data are shown to the right of the vertical bar. Bold values indicate correlations significant at the p=0.05 level with a t test, and an asterisk (*) indicates significant correlations with the phase-scrambling test. All correlations for Spain and their significance are shown in Fig. 5.
We have used IDL and R (https://www.R-project.org/, R Core Team, 2022) version 3.6.3 to program the analysis codes used in this work. In R we used the “aod” package (https://cran.r-project.org/package=aod, Lesnoff and Lancelot, 2012) for the Wald test and the package “corrplot” (https://github.com/taiyun/corrplot, Wei and Simko, 2021) to generate the correlation matrices. Data were read from mixed files using “base” libraries for text files or “openxlsx” (https://CRAN.R-project.org/package=openxlsx, Schauberger and Walker, 2021) for Excel spreadsheet files. The maps in Fig. 1 were drawn in ArcMap 10.6 (program package of ArcGIS, ESRI, 2017) and then edited in Adobe Illustrator.
The majority of the tithe and yield data can be found in tables in the cited publications listed in Tables 1–2. The Swedish tithe data until 1680 are available from tables published in Leijonhufvud (2001), and the Swedish tithe data after 1665 are described and published in Hallberg et al. (2016) and available at Swedish National Data Service: https://snd.gu.se/sv/catalogue/study/snd0996 (Svensk Nationell Datatjänst, 2023). All the climate data are digitally available from the National Oceanic and Atmospheric Administration's (NOAA) Paleoclimatology Program/World Data Service for Paleoclimatology: https://www.ncei.noaa.gov/products/paleoclimatology (National Oceanic and Atmospheric Administration's Paleoclimatology Program, 2023). Most grain price series listed in Table A1 are included in the Allen-Unger Global Commodity Prices Database (Allen and Unger, 2019a) available at http://www.gcpdb.info/data.html (Allen and Unger, 2019b). The Stockholm grain price series from Edvinsson and Söderberg (2010) is available from Historical Monetary Statistics of Sweden at Sweden's central bank (Sveriges Riksbank, 2023) at Historical Monetary Statistics of Sweden, https://www.riksbank.se/en-gb/statistics/historical-monetary-statistics-of-sweden/.
FCL designed the study, collected the data, performed exploratory data analysis, interpreted the results, and did most of the writing. BC detrended the data, calculated the correlations and their significance, contributed to the interpretation of the results, drafted method section text, conducted exploratory data analysis, and edited the text. JE provided input on article structure, suggested references, and edited the text. HH provided input on the original study design, contributed to the interpretation, suggested sensitivity experiments, and gave critical feedback on the text. LL provided the Swedish tithe data, prepared them for this study, and drafted part of the text about Swedish tithe data and their limitations. CP drafted text about the Swiss tithe and yield ratio data, provided literature references, and contributed to the interpretation of the results. AS contributed to the interpretation of the results, contributed to writing, drew the maps in Fig. 1 in ArcMap 10.6 (program package of ArcGIS, ESRI, 2017) and Adobe Illustrator, provided input on article structure, and edited the text. MKS drafted the current state of research regarding Swedish climate–harvest relationships, contributed with text about Spanish agriculture, provided literature suggestions, gave input on detrending methods, conducted exploratory data analysis, and edited the text. PT suggested and calculated the Granger causality analysis, produced the correlation matrices, curated the data collection, contributed to the interpretation of the results, drafted most of the method section, and edited the text.
The contact author has declared that none of the authors has any competing interests.
Publisher's note: Copernicus Publications remains neutral with regard to jurisdictional claims made in the text, published maps, institutional affiliations, or any other geographical representation in this paper. While Copernicus Publications makes every effort to include appropriate place names, the final responsibility lies with the authors.
Fredrik Charpentier Ljungqvist acknowledges a Visiting Researcher stay at the Institute of History, University of Bern, that allowed him time to work on this article. Maria Wallenberg Bondesson helped with digitizing data from publications and translating metadata from French. We thank Enrique Llopis, Universidad Complutense de Madrid, for sharing the Spanish yield data published in Llopis et al. (2020). The authors thank the two anonymous reviewers, Rodney Edvinsson, Stockholm University, and Dag Retsö, Stockholm University, whose useful comments helped improve this article. This article is dedicated to the memory of Johan Söderberg (1950–2022), Department of Economic History and International Relations, Stockholm University.
Fredrik Charpentier Ljungqvist and Andrea Seim were supported by the Swedish Research Council (Vetenskapsrådet, grant no. 2018-01272); Bo Christiansen was supported by the NordForsk-funded Nordic Centre of Excellence project (grant no. 76654) Arctic Climate Predictions: Pathways to Resilient, Sustainable Societies (ARCPATH); Heli Huhtamaa was supported by the Swiss National Science Foundation (grant no. PZ00P1_201953) and the Swiss State Secretariat for Education, Research and Innovation (contract MB22.00030); Peter Thejll and Bo Christiansen received funding from the Danish State through the National Centre for Climate Research (NCKF); and Jan Esper was supported by the Ministry of Education, Youth and Sports of the Czech Republic for the project SustES (CZ.02.1.0/0.0/0.0/16_019/0000797) and the European Research Council (ERC-2019 Monostar AdG grant no. 882727). Fredrik Charpentier Ljungqvist conducted the work with this article as a Pro Futura Scientia XIII Fellow funded by the Swedish Collegium for Advanced Study through Riksbankens Jubileumsfond. Open-access publication funding for this article was provided by Stockholm University.
This paper was edited by Denis-Didier Rousseau and reviewed by two anonymous referees.
Adamson, G. C. D., Nash, D. J., and Grab, S. W.: Quantifying and reducing researcher subjectivity in the generation of climate indices from documentary sources, Clim. Past, 18, 1071–1081, https://doi.org/10.5194/cp-18-1071-2022, 2022. a, b, c
Ågren, K.: Adelns bönder och kronans: Skatter och besvär i Uppland 1650–1680, PhD thesis, Uppsala University, Uppsala, 1964. a
Albers, H., Gornott, C., and Hüttel, S.: How do inputs and weather drive wheat yield volatility? The example of Germany, Food Policy, 70, 50–61, https://doi.org/10.1016/j.foodpol.2017.05.001, 2017. a
Alfani, G. and Ó Gráda, C. (Eds.): Famine in European History, Cambridge University Press, Cambridge, https://doi.org/10.1017/9781316841235, 2017. a, b
Alfani, G. and Ó Gráda, C.: The timing and causes of famines in Europe, Nat. Sustain., 1, 283–288, https://doi.org/10.1038/s41893-018-0078-0, 2018. a
Allen, R. C.: Economic structure and agricultural productivity in Europe, 1300–1800, Eur. Rev. Econ. Hist., 4, 1–25, https://doi.org/10.1017/S1361491600000125, 2000. a
Allen, R. C. and Unger, R. W.: The Allen-Unger Global Commodity Prices Database, Res. Data J. Hum. Soc. Sci., 4, 81–90, https://doi.org/10.1163/24523666-00401006, 2019a. a
Allen, R. C. and Unger, R. W.: The Allen-Unger Global Commodity Prices Database, GCPDB [data set], http://www.gcpdb.info/data.html (last access: 28 November 2023), 2019b. a
Appleby, A. B.: Grain prices and subsistence crises in England and France, 1590–1740, J. Econ. Hist., 39, 865–887, https://doi.org/10.1017/S002205070009865X, 1979. a
Barquín, R.: The demand elasticity for wheat in the 14th to 18th centuries, Rev. Hist. Econ., 23, 241–267, 2005. a
Barriendos, M.: Climate and culture in Spain, religious responses to extreme climatic events in the Hispanic Kingdoms (16th–19th centuries), in: Kulturelle Konsequenzen der “Kleinen Eiszeit”, edited by: Behringer, W., Lehmann, H., and Pfister, C., 379–414, Vandenhoeck & Ruprecht, Göttingen, ISBN 9783525358641, 2005. a, b
Bartlett, M. S.: Some aspects of the time-correlation problem in regard to tests of significance, J. Royal Stat. Soc., 98, 536–543, https://doi.org/10.1111/j.2397-2335.1935.tb04277.x, 1935. a
Bauernfeind, W. and Woitek, U.: Cyclical characteristics of tithe series in Mid Franconia and Switzerland 1339–1708: An application of maximum entropy spectral analysis, Hist. Soc. Res., 21, 122–150, 1996. a
Beck, H. E., Zimmermann, N. E., McVicar, T. R., Vergopolan, N., Berg, A., and Wood, E. F.: Present and future Köppen-Geiger climate classification maps at 1-km resolution, Sci. Data, 5, 1–12, https://doi.org/10.1038/sdata.2018.214, 2018. a, b
Beillouin, D., Schauberger, B., Bastos, A., Ciais, P., and Makowski, D.: Impact of extreme weather conditions on European crop production in 2018, Philos. Trans. R. Soc. B, 375, 20190510, https://doi.org/10.1098/rstb.2019.0510, 2020. a, b, c
Bekar, C. T.: The persistence of harvest shocks in medieval England, J. Econ. Hist., 79, 954–988, https://doi.org/10.1017/S0022050719000524, 2019. a, b
Beveridge, W. H.: Weather and harvest cycles, Econ. J., 31, 429–452, https://doi.org/10.2307/2223104, 1921. a
Beveridge, W. H.: Wheat prices and rainfall in western Europe, J. Roy. Stat. Soc., 85, 412–475, https://doi.org/10.1111/j.2397-2335.1922.tb00808.x, 1922. a
Brasch, E.: Ekonomikommissionen 1725–1731: Sveriges första jordbruksutredning och preludium till den agrara revolutionen, Licentiate thesis, Lund University, Lund, 2016. a
Brázdil, R., Dobrovolný, P., Trnka, M., Řezníčková, L., Dolák, L., and Kotyza, O.: Extreme droughts and human responses to them: the Czech Lands in the pre-instrumental period, Clim. Past, 15, 1–24, https://doi.org/10.5194/cp-15-1-2019, 2019. a, b, c, d
Brázdil, R., Dobrovolný, P., Bauch, M., Camenisch, C., Kiss, A., Kotyza, O., Oliński, P., and Řezníčková, L.: Central Europe, 1531–1540 CE: The driest summer decade of the past five centuries?, Clim. Past, 16, 2125–2151, https://doi.org/10.5194/cp-16-2125-2020, 2020. a
Briffa, K., van der Schrier, G., and Jones, P.: Wet and dry summers in Europe since 1750: evidence of increasing drought, Int. J. Climatol., 29, 1894–1905, https://doi.org/10.1002/joc.1836, 2009. a
Brönnimann, S., Allan, R., Ashcroft, L., Baer, S., Barriendos, M., Brázdil, R., Brugnara, Y., Brunet, M., Brunetti, M., Chimani, B., Cornes, R., Domínguez-Castro, F., Filipiak, J., Founda, D., Herrera, R. G., Gergis, J., Grab, S., Hannak, L., Huhtamaa, H., Jacobsen, K. S., Jones, P., Jourdain, S., Kiss, A., Lin, K. E., Lorrey, A., Lundstad, E., Luterbacher, J., Mauelshagen, F., Maugeri, M., Moberg, A., Neukom, R., Nicholson, S., Noone, S., Nordli, Ø., Ólafsdóttir, K. B., Pearce, P. R., Pfister, L., Pribyl, K., Przybylak, R., Pudmenzky, C., Rasol, D., Reichenbach, D., Řezníčková, L., Rodrigo, F. S., Rohr, C., Skrynyk, O., Slonosky, V., Thorne, P., Valente, M. A., Vaquero, J. M., Westcottt, N. E., Williamson, F., and Wyszyński, P.: Unlocking pre-1850 instrumental meteorological records: A global inventory, B. Am. Meteorol. Soc., 100, ES389–ES413, https://doi.org/10.1175/BAMS-D-19-0040.1, 2019. a
Brückner, E.: Der Einfluß der Klimaschwankungen auf die Ernteerträge und Getreidepreise in Europa, Geogr. Z., 1, 39–51, 100–108, 1895. a
Brunt, L.: Weather shocks and English wheat yields, 1690–1871, Explor. Econ. Hist., 57, 50–58, https://doi.org/10.1016/j.eeh.2014.12.001, 2015. a
Bunde, A., Büntgen, U., Ludescher, J., Luterbacher, J., and von Storch, H.: Is there memory in precipitation?, Nat. Clim. Change, 3, 174–175, https://doi.org/10.1038/nclimate1830, 2013. a
Büntgen, U., Frank, D. C., Nievergelt, D., and Esper, J.: Summer temperature variations in the European Alps, AD 755–2004, J. Climate, 19, 5606–5623, https://doi.org/10.1175/JCLI3917.1, 2006. a, b
Büntgen, U., Franke, J., Frank, D., Wilson, R., González-Rouco, F., and Esper, J.: Assessing the spatial signature of European climate reconstructions, Clim. Res., 41, 125–130, https://doi.org/10.3354/cr00848, 2010. a
Büntgen, U., Urban, O., Krusic, P. J., Rybníček, M., Kolář, T., Kyncl, T., Ač, A., Koňasová, E., Čáslavský, J., Esper, J., Wagner, S., Saurer, M., Tegel, W., Dobrovolný, P., Cherubini, P., Reinig, F., and Trnka, M.: Recent European drought extremes beyond Common Era background variability, Nat. Geosci., 14, 190–196, https://doi.org/10.1038/s41561-021-00698-0, 2021. a
Camenisch, C.: Endlose Kälte: Witterungsverlauf und Getreidepreise in den Burgundischen Niederlanden im 15. Jahrhundert, Schwabe, Basel, https://doi.org/10.24894/978-3-7965-3474-4, 2015. a
Camenisch, C., Keller, K. M., Salvisberg, M., Amann, B., Bauch, M., Blumer, S., Brázdil, R., Brönnimann, S., Büntgen, U., Campbell, B. M. S., Fernández-Donado, L., Fleitmann, D., Glaser, R., González-Rouco, F., Grosjean, M., Hoffmann, R. C., Huhtamaa, H., Joos, F., Kiss, A., Kotyza, O., Lehner, F., Luterbacher, J., Maughan, N., Neukom, R., Novy, T., Pribyl, K., Raible, C. C., Riemann, D., Schuh, M., Slavin, P., Werner, J. P., and Wetter, O.: The 1430s: a cold period of extraordinary internal climate variability during the early Spörer Minimum with social and economic impacts in north-western and central Europe, Clim. Past, 12, 2107–2126, https://doi.org/10.5194/cp-12-2107-2016, 2016. a
Campbell, B. M.: Nature as historical protagonist: environment and society in pre-industrial England, Econ. Hist. Rev., 63, 281–314, https://doi.org/10.1111/j.1468-0289.2009.00492.x, 2010. a
Campbell, B. M.: The Great Transition: Climate, Disease and Society in the Late-Medieval World, Cambridge University Press, Cambridge, https://doi.org/10.1017/CBO9781139031110, 2016. a, b, c
Campbell, B. M. and Ó Gráda, C.: Harvest shortfalls, grain prices, and famines in preindustrial England, J. Econ. Hist., 71, 859–886, https://doi.org/10.1017/S0022050711002178, 2011. a
Cantelaube, P. and Terres, J.-M.: Seasonal weather forecasts for crop yield modelling in Europe, Tellus A, 57, 476–487, https://doi.org/10.3402/tellusa.v57i3.14669, 2005. a
Ciria, J. M. L.: La producción agraria en el sur de Aragón (1660–1827), Hist. Agrar., 41, 3–30, 2007. a, b
Collet, D.: Die doppelte Katastrophe: Klima und Kultur in der europäischen Hungerkrise 1770–1772, Vandenhoeck & Ruprecht, Göttingen, ISBN 978-3-525-35592-3, 2019. a
Cook, E. R., Seager, R., Kushnir, Y., Briffa, K. R., Büntgen, U., Frank, D., Krusic, P. J., Tegel, W., van der Schrier, G., Andreu-Hayles, L., Baillie, M., Baittinger, C., Bleicher, N., Bonde, N., Brown, D., Carrer, M., Cooper, R., Čufar, K., Dittmar, C., Esper, J., Griggs, C., Gunnarson, B., Günther, B., Gutierrez, E., Haneca, K., Helama, S., Herzig, F., Heussner, K.-U., Hofmann, J., Janda, P., Kontic, R., Köse, N., Kyncl, T., Levanič, T., Linderholm, H., Manning, S., Melvin, T. M., Miles, D., Neuwirth, B., Nicolussi, K., Nola, P., Panayotov, M., Popa, I., Rothe, A., Seftigen, K., Seim, A., Svarva, H., Svoboda, M., Thun, T., Timonen, M., Touchan, R., Trotsiuk, V., Trouet, V., Walder, F., Ważny, T., Wilson, R., and Zang, C.: Old World megadroughts and pluvials during the Common Era, Sci. Adv., 1, e1500561, https://doi.org/10.1126/sciadv.1500561, 2015. a, b, c, d, e
Cook, E. R., Solomina, O., Matskovsky, V., Cook, B. I., Agafonov, L., Berdnikova, A., Dolgova, E., Karpukhin, A., Knysh, N., Kulakova, M., Kuznetsova, V., Kyncl, T., Kyncl, J., Maximova, O., Panyushkina, I., Seim, A., Tishin, D., Ważny, T., and Yermokhin, M.: The European Russia Drought Atlas (1400–2016 CE), Clim. Dynam., 54, 2317–2335, https://doi.org/10.1007/s00382-019-05115-2, 2020. a
Costello, E., Kearney, K., and Gearey, B.: Adapting to the Little Ice Age in pastoral regions: An interdisciplinary approach to climate history in north-west Europe, Hist. Methods, 56, 77–96, https://doi.org/10.1080/01615440.2022.2156958, 2023. a
D'Arrigo, R., Klinger, P., Newfield, T., Rydval, M., and Wilson, R.: Complexity in crisis: The volcanic cold pulse of the 1690s and the consequences of Scotland's failure to cope, J. Volcanol. Geotherm. Res., 389, 106746, https://doi.org/10.1016/j.jvolgeores.2019.106746, 2020. a, b
De Toro, A., Eckersten, H., Nkurunziza, L., and Von Rosen, D.: Effects of Extreme Weather on Yield of Major Arable Crops in Sweden, Swedish University of Agricultural Sciences, Ulltuna, https://res.slu.se/id/publ/68718 (last access: 1 December 2023), 2015. a, b
Degroot, D., Anchukaitis, K., Bauch, M., Burnham, J., Carnegy, F., Cui, J., de Luna, K., Guzowski, P., Hambrecht, G., Huhtamaa, H., Izdebski, A., Kleemann, K., Moesswilde, E., Neupane, N., Newfield, T., Pei, Q., Xoplaki, E., and Zappia, N.: Towards a rigorous understanding of societal responses to climate change, Nature, 591, 539–550, https://doi.org/10.1038/s41586-021-03190-2, 2021. a
Dell, M., Jones, B. F., and Olken, B. A.: What do we learn from the weather? The new climate–economy literature, J. Econ. Lit., 52, 740–798, https://doi.org/10.1257/jel.52.3.740, 2014. a
Diggle, P., Diggle, P. J., Heagerty, P., Liang, K.-Y., and Zeger, S.: Analysis of Longitudinal Data, Oxford University Press, Oxford, ISBN 9780198524847, 2002. a
Dobrovolný, P., Moberg, A., Brázdil, R., Pfister, C., Glaser, R., Wilson, R., van Engelen, A., Limanówka, D., Kiss, A., Halíčková, M., Macková, J., Riemann, D., Luterbacher, J., and Böhm, R.: Monthly, seasonal and annual temperature reconstructions for Central Europe derived from documentary evidence and instrumental records since AD 1500, Clim. Change, 101, 69–107, https://doi.org/10.1007/s10584-009-9724-x, 2010. a, b, c, d, e, f, g, h, i, j, k
Edvinsson, R. and Söderberg, J.: The Evolution of Swedish Consumer Prices 1290–2008, Ekerlids Förlag & Sveriges Riksbank, Stockholm, ISBN 978-91-7092-124-7, 2010. a, b
Edvinsson, R., Leijonhufvud, L., and Söderberg, J.: Väder, skördar och priser i Sverige, in: Agrarhistoria på många sätt: 28 studier om människan och jorden. Festskrift till Janken Myrdal på hans 60-årsdag, edited by: Liljewall, B., Flygare, I. A., Lange, U., Ljunggren, L., and Söderberg, J., 115–136, The Royal Swedish Academy of Agriculture and Forestry, Stockholm, ISBN 978-91-85205-91-2, 2009. a, b, c, d, e
Eiras Roel, A.: Dîme et mouvement du produit agricole en Galice 1600–1837, in: Prestations paysannes, dîmes, rente foncière et mouvements de la production agricole à l'époque pré-industrielle, edited by: Goy, J. and Le Roy Ladurie, E., 341–358, Mouton, Paris, ISBN 3112311019, 1982. a, b, c, d, e
Esper, J., Krusic, P. J., Ljungqvist, F. C., Luterbacher, J., Carrer, M., Cook, E., Davi, N. K., Hartl-Meier, C., Kirdyanov, A., Konter, O., Myglan, V., Timonen, M., Treydte, K., Trouet, V., Villalba, R., Yang, B., and Büntgen, U.: Ranking of tree-ring based temperature reconstructions of the past millennium, Quat. Sci. Rev., 145, 134–151, https://doi.org/10.1016/j.quascirev.2016.05.009, 2016. a
Esper, J., Büntgen, U., Denzer, S., Krusic, P. J., Luterbacher, J., Schäfer, R., Schreg, R., and Werner, J.: Environmental drivers of historical grain price variations in Europe, Clim. Res., 72, 39–52, https://doi.org/10.3354/cr01449, 2017. a, b, c, d
ESRI: ArcGIS desktop: Release 10.6, Environmental Systems Research Institute Redlands, CA, https://www.esri.com/en-us/arcgis/products/arcgis-desktop/overview (last access: 28 November 2023), 2017. a, b
Feliu, G.: Precios y salarios en la Cataluña moderna, Banco de España, Madrid, https://repositorio.bde.es/handle/123456789/7178 (last access: 2 December 2023), 1991. a
Forsberg, N., Russell, J., Macaulay, M., Leino, M., and Hagenblad, J.: Farmers without borders – genetic structuring in century old barley (Hordeum vulgare), Heredity, 114, 195–206, https://doi.org/10.1038/hdy.2014.83, 2015. a
Forsberg, N. E., Leino, M. W., and Hagenblad, J.: Population structure in landrace barley (Hordeum vulgare L.) during the late 19th century crop failures in Fennoscandia, Heredity, 123, 733–745, https://doi.org/10.1038/s41437-019-0277-0, 2019. a
Forssell, H.: Sverige 1571: Försök till en administrativ-statistisk beskrifning öfver det egentliga Sverige, utan Finland och Estland, Norstedt, Stockholm, http://urn.kb.se/resolve?urn=urn:nbn:se:alvin:portal:record-184519, 1872. a
Franke, J., Frank, D., Raible, C. C., Esper, J., and Brönnimann, S.: Spectral biases in tree-ring climate proxies, Nat. Clim. Change, 3, 360–364, https://doi.org/10.1038/nclimate1816, 2013. a
Gadd, C.-J.: The agricultural revolution in Sweden, 1700–1870, in: The Agrarian History of Sweden 4000 BC to AD 2000, edited by: Myrdal, J., 118–165, Lund, Nordic Academic Press, ISBN 978-91-85509-56-0, 2011. a, b
Gobin, A.: Impact of heat and drought stress on arable crop production in Belgium, Nat. Hazards Earth Syst. Sci., 12, 1911–1922, https://doi.org/10.5194/nhess-12-1911-2012, 2012. a
Granger, C. W. and Elliott, C.: A fresh look at wheat prices and markets in the eighteenth century, Econ. Hist. Rev., 20, 257–265, https://doi.org/10.1111/j.1468-0289.1967.tb00135.x, 1967. a
Granger, C. W. J.: Investigating causal relations by econometric models and cross-spectral methods, Econometrica, 37, 424–438, https://doi.org/10.2307/1912791, 1969. a
Haldon, J., Mordechai, L., Newfield, T. P., Chase, A. F., Izdebski, A., Guzowski, P., Labuhn, I., and Roberts, N.: History meets palaeoscience: Consilience and collaboration in studying past societal responses to environmental change, P. Natl. Acad. Sci. USA, 115, 3210–3218, https://doi.org/10.1073/pnas.1716912115, 2018. a
Hallberg, E., Leijonhufvud, L., Linde, M., and Andersson Palm, L.: Skördar i Sverige före agrarrevolutionen: Statistisk undersökning av det rörliga tiondet fr.o.m. 1665: Introduktion till databaser, Department of Historical Studies, University of Gothenburg, Gothenburg, http://hdl.handle.net/2077/42266 (last access: 1 December 2023), 2016. a, b, c, d, e, f, g, h, i, j, k, l, m
Hamilton, E. J.: American treasure and the price revolution in Spain, 1501–1650, Harvard University Press, Cambridge, MA, ISBN 0374934207, 1934. a, b
Hamilton, E. J.: Money, Prices, and Wages in Valencia, Aragon, and Navarre, 1351–1500, Harvard University Press, Cambridge, MA, 1936. a
Hamilton, E. J.: War and prices in Spain: 1651–1800, Harvard University Press, Cambridge, MA, 1947. a, b
Hanauer, A.: Études économiques sur l'Alsace ancienne et moderne, A. Durand & Pédone-Lauriel, Paris, https://gallica.bnf.fr/ark:/12148/bpt6k1153437.texteImage (last access: 1 December 2023), 1878. a
Hastie, T., Tibshirani, R., and Friedman, J.: The Elements of Statistical Learning, Springer, New York, https://doi.org/10.1007/978-0-387-84858-7, 2001. a
Head-Köenig, A.-L.: Les fluctuations des rendements et du produit décimal céréaliers dans quelques régions du plateau suisse (1500–1800), Revue Suisse d'histoire, 29, 575–604, https://doi.org/10.1515/9783112316047-018, 1979. a, b, c, d
Head-Köenig, A.-L. and Veyrassat-Herren, B.: Les revenus décimaux à Genève de 1540 à 1783, in: Les fluctuations du produit de la dîme: Conjoncture décimale et domaniale de la fin du Moyen Age au 18. siècle, edited by: Goy, J. and Le Roy Ladurie, E., 165–179, École pratique des hautes études, Paris, https://doi.org/10.1515/9783111413822, 1972. a
Hegardt, A.: Akademiens spannmål: uppbörd, handel och priser vid Uppsala universitet 1635–1719, PhD thesis, Uppsala University, 1975. a
Heino, M., Guillaume, J. H. A., Müller, C., Iizumi, T., and Kummu, M.: A multi-model analysis of teleconnected crop yield variability in a range of cropping systems, Earth Syst. Dynam., 11, 113–128, https://doi.org/10.5194/esd-11-113-2020, 2020. a
Herschel, W.: Observations Tending to Investigate the Nature of the Sun, in Order to Find the Causes or Symptoms of Its Variable Emission of Light and Heat; With Remarks on the Use That May Possibly Be Drawn from Solar Observations, Philos. T. R. Soc., 91, 265–318, https://doi.org/10.1098/rstl.1801.0015, 1801. a
Hlavinka, P., Trnka, M., Semerádová, D., Dubrovský, M., Žalud, Z., and Možný, M.: Effect of drought on yield variability of key crops in Czech Republic, Agric. For. Meteorol., 149, 431–442, https://doi.org/10.1016/j.agrformet.2008.09.004, 2009. a
Hoffman, P. T.: Growth in a Traditional Society: The French Countryside, 1450–1815, Princeton University Press, Princeton, ISBN 9780691187204, 1996. a
Holopainen, J., Rickard, I. J., and Helama, S.: Climatic signatures in crops and grain prices in 19th-century Sweden, Holocene, 22, 939–945, https://doi.org/10.1177/0959683611434220, 2012. a
Hoogenboom, G.: Contribution of agrometeorology to the simulation of crop production and its applications, Agric. For. Meteorol., 103, 137–157, https://doi.org/10.1016/S0168-1923(00)00108-8, 2000. a
Huhtamaa, H. and Helama, S.: Distant impact: tropical volcanic eruptions and climate-driven agricultural crises in seventeenth-century Ostrobothnia, Finland, J. Hist. Geogr., 57, 40–51, https://doi.org/10.1016/j.jhg.2017.05.011, 2017. a
Huhtamaa, H. and Ljungqvist, F. C.: Climate in Nordic historical research – a research review and future perspectives, Scand. J. Hist., 46, 665–695, https://doi.org/10.1080/03468755.2021.1929455, 2021. a
Huhtamaa, H., Helama, S., Holopainen, J., Rethorn, C., and Rohr, C.: Crop yield responses to temperature fluctuations in 19th century Finland: Provincial variation in relation to climate and tree-rings, Boreal Environ. Res., 20, 707–723, 2015. a
Huhtamaa, H., Stoffel, M., and Corona, C.: Recession or resilience? Long-range socioeconomic consequences of the 17th century volcanic eruptions in northern Fennoscandia, Clim. Past, 18, 2077–2092, https://doi.org/10.5194/cp-18-2077-2022, 2022. a, b, c, d, e
Hulme, M.: Reducing the future to climate: a story of climate determinism and reductionism, Osiris, 26, 245–266, https://doi.org/10.1086/661274, 2011. a
Iizumi, T., Shiogama, H., Imada, Y., Hanasaki, N., Takikawa, H., and Nishimori, M.: Crop production losses associated with anthropogenic climate change for 1981–2010 compared with preindustrial levels, Int. J. Climatol., 38, 5405–5417, https://doi.org/10.1002/joc.5818, 2018. a
Izdebski, A., Mordechai, L., and White, S.: The social burden of resilience: a historical perspective, Hum. Ecol., 46, 291–303, https://doi.org/10.1007/s10745-018-0002-2, 2018. a
Jansson, A., Palm, L. A., and Söderberg, J.: Dagligt bröd i onda tider: Priser och löner i Stockholm och Västsverige 1500–1770, Department of Historical Studies, University of Gothenburg, Gothenburg, ISBN 9188162109, 1993. a
Jones, P. D.: Early European instrumental records, in: History and Climate: Memories of the Future?, edited by: Jones, P. D., Ogilvie, A. E. J., Davies, T., and Briffa, K., 55–77, Springer, Berlin/Heidelberg, https://doi.org/10.1007/978-1-4757-3365-5_4, 2001. a
Kain, R.: Tithe as an index of pre-industrial agricultural production, Agric. Hist. Rev., 27, 73–81, 1979. a
Kiss, A.: Floods and Long-Term Water-Level Changes in Medieval Hungary, Springer, Berlin/Heidelberg, https://doi.org/10.1007/978-3-319-38864-9, 2019. a
Landsteiner, E.: Wenig Brot und saurer Wein. Kontinuität und Wandel in der zentraleuropäischen Ernährungskultur im letzten Drittel des 16. Jahrhunderts, in: Kulturelle Konsequenzen der “Kleinen Eiszeit”, edited by: Behringer, W., Lehmann, H., and Pfister, C., 87–147, Vandenhoeck & Ruprecht, Göttingen, ISBN 9783525358641, 2005. a, b
Le Roy Ladurie, E.: Histoire du climat depuis l'an mil, Flammarion, Paris, ISBN 9782081451988, 1967. a
Le Roy Ladurie, E. and Goy, J.: Tithe and Agrarian History from the Fourteenth to the Nineteenth Century: An Essay in Comparative History, Cambridge University Press, Cambridge, https://doi.org/10.1017/CBO9780511897412, 1982. a, b, c, d, e
Lecerf, R., Ceglar, A., López-Lozano, R., Van Der Velde, M., and Baruth, B.: Assessing the information in crop model and meteorological indicators to forecast crop yield over Europe, Agric. Syst., 168, 191–202, https://doi.org/10.1016/j.agsy.2018.03.002, 2019. a
Leijonhufvud, L.: Grain Tithes and Manorial Yields in Early Modern Sweden: Trends and Patterns of Production and Productivity c. 1540–1680, PhD thesis, Swedish University of Agricultural Sciences, Ulltuna, ISBN 9157658293, 2001. a, b, c, d, e, f, g, h, i, j, k, l, m, n, o, p, q, r, s, t
Leijonhufvud, L., Wilson, R., Moberg, A., Söderberg, J., Retsö, D., and Söderlind, U.: Five centuries of Stockholm winter/spring temperatures reconstructed from documentary evidence and instrumental observations, Clim. Change, 101, 109–141, https://doi.org/10.1007/s10584-009-9650-y, 2010. a, b, c
Leino, M. W.: Spannmål: svenska lantsorter, Nordiska museets förlag, Stockholm, ISBN 9789171085948, 2017. a
Lesnoff, M. and Lancelot, R: aod: Analysis of Overdispersed Data, R-project.org [code], https://cran.r-project.org/package=aod (last access: 28 November 2023), 2012. a
Ljungqvist, F. C. and Huhtamaa, H.: Histoire du climat du Royaume de Suède à l'époque modern, Nord. Hist. Rev., 27, 201–226, 2021. a
Ljungqvist, F. C., Seim, A., Krusic, P. J., González-Rouco, J. F., Werner, J. P., Cook, E. R., Zorita, E., Luterbacher, J., Xoplaki, E., Destouni, G., García-Bustamante, E., Aguilar, C. A. M., Seftigen, K., Wang, J., Gagen, M. H., Esper, J., Solomina, O., Fleitmann, D., and Büntgen, U.: European warm-season temperature and hydroclimate since 850 CE, Environ. Res. Lett., 14, 084015, https://doi.org/10.1088/1748-9326/ab2c7e, 2019. a, b, c, d, e, f
Ljungqvist, F. C., Piermattei, A., Seim, A., Krusic, P. J., Büntgen, U., He, M., Kirdyanov, A. V., Luterbacher, J., Schneider, L., Seftigen, K., Stahle, D. W., Villalba, R., Yang, B., and Esper, J.: Ranking of tree-ring based hydroclimate reconstructions of the past millennium, Quat. Sci. Rev., 230, 106074, https://doi.org/10.1016/j.quascirev.2019.106074, 2020. a
Ljungqvist, F. C., Seim, A., and Huhtamaa, H.: Climate and society in European history, WIRES Clim. Change, 12, e691, https://doi.org/10.1002/wcc.691, 2021. a, b, c, d, e
Ljungqvist, F. C., Thejll, P., Christiansen, B., Seim, A., Hartl, C., and Esper, J.: The significance of climate variability on early modern European grain prices, Cliometrica, 16, 29–77, https://doi.org/10.1007/s11698-021-00224-7, 2022. a, b, c, d, e, f, g, h
Llopis, A. E., Amarilla, J. A. S., Sanz, J. U. B., Sánchez, Á. L. V., and Abarca, V. A.: ?`Descendió el producto agrario por habitante en la Europa moderna? El caso castellano, Investig. Hist. Econ., 14, 69–81, https://doi.org/10.1016/j.ihe.2016.12.002, 2018. a
Llopis, E., Alonso, E., Fontanillo, P., Méndez, S., Ramos, J., and Toyos, A.: The severity of wheat yield crises on eight Spanish farms, 1700–1774, Hist. Agrar., 82, 1–34, https://doi.org/10.26882/histagrar.082e01t, 2020. a, b, c, d, e, f, g, h, i, j, k, l
Luterbacher, J., Dietrich, D., Xoplaki, E., Grosjean, M., and Wanner, H.: European seasonal and annual temperature variability, trends, and extremes since 1500, Science, 303, 1499–1503, https://doi.org/10.1126/science.1093877, 2004. a, b, c, d, e, f, g, h, i, j
Luterbacher, J., Werner, J. P., Smerdon, J. E., Fernández-Donado, L., González-Rouco, F., Barriopedro, D., Ljungqvist, F. C., Büntgen, U., Zorita, E., Wagner, S., Esper, J., Frank, D., Barriendos, M., Bertolin, C., Bothe, O., Brázdil, R., Camuffo, D., Dobrovolný, P., Gagen, M., García-Bustamante, E., Ge, Q., Gómez-Navarro, J., Guiot, J., Hao, Z., Hegerl, G., Holmgren, K., Jungclaus, J., Klimenko, V., Martín-Chivelet, J., McCarroll, D., Pfister, C., Roberts, N., Schindler, A., Schurer, A., Solomina, O., Toreti, A., von Gunten, L., Wahl, E., Wanner, H., Wetter, O., Xoplaki, E., Yuan, N., Zanchettin, D., Zhang, H., and Zerefos, C.: European summer temperatures since Roman times, Environ. Res. Lett., 11, 024001, https://doi.org/10.1088/1748-9326/11/2/024001, 2016. a
Martin, P., Brown, T. A., George, T. S., Gunnarson, B., Loader, N. J., Ross, P., Wishart, J., and Wilson, R.: Climatic controls on the survival and loss of ancient types of barley on North Atlantic Islands, Clim. Change, 176, 4, https://doi.org/10.1007/s10584-022-03474-0, 2023. a
Martínez-González, J. L., Suriñach, J., Jover, G., Martín-Vide, J., Barriendos-Vallvé, M., and Tello, E.: Assessing climate impacts on English economic growth (1645–1740): an econometric approach, Clim. Change, 160, 233–249, https://doi.org/10.1007/s10584-019-02633-0, 2020. a
Mauelshagen, F.: Klimageschichte der Neuzeit, Wissenschaftliche Buchgesellschaft, Darmstadt, ISBN 978-3-534-21024-4, 2010. a
Michaelowa, A.: The impact of short-term climate change on British and French agriculture and population in the first half of the 18th century, in: History and Climate: Memories of the Future?, edited by: Jones, P. D., Ogilvie, A. E. J., Davies, T., and Briffa, K., 201–217, Springer, Berlin/Heidelberg, https://doi.org/10.1007/978-1-4757-3365-5_10, 2001. a
Moore, F. C. and Lobell, D. B.: The fingerprint of climate trends on European crop yields, P. Natl. Acad. Sci. USA, 112, 2670–2675, https://doi.org/10.1073/pnas.1409606112, 2015. a
Mørch, H. F.: Mediterranean agriculture – an agro-ecological strategy, Geogr. Tidsskr.-Den., 1, 143–156, 1999. a
Moreda, V. P.: Spain, in: Famine in European History, edited by: Alfani, G. and Ó Gráda, C., 48–72, Cambridge University Press, Cambridge, https://doi.org/10.1017/9781316841235, 2017. a
Moreno, F. M., Solis, I., Barriendos, M., and Tejedor, E.: Correlations between historical climate data and incidents of common bunt in Spanish wheat, 1755–1801, Hist. Agrar., 82, 67–97, https://doi.org/10.26882/histagrar.082e08m, 2020. a, b, c, d
Muigg, B., Seim, A., Tegel, W., Werther, L., Herzig, F., Schmidt, J., Zielhofer, C., Land, A., and Büntgen, U.: Tree rings reveal dry conditions during Charlemagne's Fossa Carolina construction in 793 CE, Quat. Sci. Rev., 227, 106040, https://doi.org/10.1016/j.quascirev.2019.106040, 2020. a, b
Myrdal, J.: Farming and feudalism: 1000–1700, in: The Agrarian History of Sweden 4000 BC to AD 2000, edited by: Myrdal, J., 72–117, Lund, Nordic Academic Press, ISBN 9185509566, 2011. a, b
Myrdal, J. and Söderberg, J.: Kontinuitetens dynamik: agrar ekonomi i 1500-talets Sverige, Almqvist & Wiksell International, Stockholm, ISBN 9122014489, 1991. a, b
National Oceanic and Atmospheric Administration's (NOAA) Paleoclimatology Program: Paleoclimatology, NOAA [data set], https://www.ncei.noaa.gov/products/paleoclimatology, last access: 1 December 2023. a
Newfield, T.: Domesticates, disease and climate in early post-classical Europe: the cattle plague of c. 940 and its environmental context, Post-Class. Archaeol., 5, 95–126, 2015. a
Parry, M.: Secular climatic change and marginal agriculture, Trans. Inst. Br. Geogr., 64, 1–13, https://doi.org/10.2307/621462, 1975. a
Parry, M.: The significance of the variability of summer warmth in upland Britain, Weather, 31, 212–217, https://doi.org/10.1002/j.1477-8696.1976.tb04442.x, 1976. a
Parry, M. L.: Climatic Change, Agriculture and Settlement, Folkestone, Kent, ISBN-13 978-0712907941, 1978. a
Pauling, A., Luterbacher, J., Casty, C., and Wanner, H.: Five hundred years of gridded high-resolution precipitation reconstructions over Europe and the connection to large-scale circulation, Clim. Dynam., 26, 387–405, https://doi.org/10.1007/s00382-005-0090-8, 2006. a, b, c, d, e, f
Pei, Q., Zhang, D., Lee, H., and Li, G.: Crop management as an agricultural adaptation to climate change in early modern era: A comparative study of eastern and western Europe, Agriculture, 6, 29, https://doi.org/10.3390/agriculture6030029, 2016. a
Peña-Gallardo, M., Vicente-Serrano, S. M., Domínguez-Castro, F., and Beguería, S.: The impact of drought on the productivity of two rainfed crops in Spain, Nat. Hazards Earth Syst. Sci., 19, 1215–1234, https://doi.org/10.5194/nhess-19-1215-2019, 2019. a
Persson, K. G.: Grain Markets in Europe, 1500–1900: Integration and Deregulation, Cambridge University Press, Cambridge, ISBN 9780521023887, 1999. a, b
Pfister, C.: Getreide-Erntebeginn und Frühsommertemperaturen im schweizerischen Mittelland seit dem 17. Jahrhundert, Geogr. Helv., 34, 23–35, https://doi.org/10.5194/gh-34-23-1979, 1979. a, b, c
Pfister, C.: Klimageschichte der Schweiz 1525–1860. Das Klima der Schweiz und seine Bedeutung in der Geschichte von Bevölkerung und Landwirtschaft, vol. 2, Verlag Paul Haupt, Bern, https://doi.org/10.11588/fr.1987.0.53195, 1984. a, b, c, d, e, f, g, h, i, j, k, l, m, n, o, p, q, r, s, t, u, v, w, x
Pfister, C.: Fluctuations climatiques et prix céréaliers en Europe du XVIe au XXe siècle, Ann. Hist. Sci. Soc., 43, 25–53, 1988. a, b, c, d, e
Pfister, C.: The early loss of ecological stability in an agrarian region, in: The Silent Countdown, edited by: Brimblecombe, P. and Pfister, C., 37–55, Springer, Berlin, https://doi.org/10.1007/978-3-642-75159-2, 1990. a
Pfister, C.: Monthly temperature and precipitation patterns in Central Europe from 1525 to the present: A methodology for quantifying man-made evidence on weather and climate, in: Climate Since A.D. 1500, edited by: Bradley, R. S. and Jones, P. D., 118–142, Routledge, London, ISBN 0-415-07593-9, 1992. a, b, c, d, e, f, g, h
Pfister, C.: Weeping in the snow: The second period of Little Ice Age-type impacts, 1570–1630, in: Kulturelle Konsequenzen der “Kleinen Eiszeit”, edited by: Behringer, W., Lehmann, H., and Pfister, C., 31–86, Vandenhoeck & Ruprecht, Göttingen, ISBN 9783525358641, 2005. a, b, c, d
Pfister, C.: Little Ice Age-type impacts and the mitigation of social vulnerability to climate in the Swiss Canton of Bern prior to 1800, in: Sustainability or Collapse? An Integrated History and Future of People on Earth, edited by: Graumlich, L. and Costanza, R., The Mit Press, Cambridge, MA, ISBN-13 978-0-262-03366-4, 2007. a, b
Pfister, C. and Brázdil, R.: Climatic variability in sixteenth-century Europe and its social dimension: a synthesis, Clim. Change, 43, 5–53, https://doi.org/10.1023/A:1005585931899, 1999. a
Pfister, C. and Wanner, H.: Climate and Society in Europe: The Last Thousand Years, Haupt Verlag, Bern, ISBN 978-3-258-08234-9, 2021. a, b, c, d, e, f, g, h, i, j
Ponsot, P.: En Andalousie occidentale: Les fluctuations de la production du blé sous l'Ancien Régime, Étud. rurales, 34, 97–112, 1969. a, b, c, d, e
Pribyl, K.: Farming, Famine and Plague: The Impact of Climate in Late Medieval England, Springer, Berlin/Heidelberg, https://doi.org/10.1007/978-3-319-55953-7, 2017. a
R Core Team: R: A Language and Environment for Statistical Computing, R Foundation for Statistical Computing, Vienna, Austria, https://www.R-project.org/ (last access: 28 November 2023), 2022. a
Rahlf, T.: Getreide in der Sozial- und Wirtschaftsgeschichte vom 16. bis 18. Jahrhundert, Das Beispiel Köln im regionalen Vergleich, Auenthal Verlag, Trier, ISBN 3-89070-032-2, 1996. a, b
Reichel, R., Thejll, P., and Lassen, K.: The cause-and-effect relationship of solar cycle length and the Northern Hemisphere air surface temperature, J. Geophys. Res. Space Phys., 106, 15635–15641, https://doi.org/10.1029/2001JA900027, 2001. a
Rodrigo, F. S. and Barriendos, M.: Reconstruction of seasonal and annual rainfall variability in the Iberian peninsula (16th–20th centuries) from documentary data, Glob. Planet. Change, 63, 243–257, https://doi.org/10.1016/j.gloplacha.2007.09.004, 2008. a, b
Santiago-Caballero, C.: The Rain in Spain? Climate versus urban demand as causes of agricultural stagnation in eighteenth-century Spain, Eur. Rev. Econ. Hist., 17, 452–470, https://doi.org/10.1093/ereh/het017, 2013a. a
Santiago-Caballero, C.: Trapped by nature: Provincial grain yields in Spain in the mid 18th century, Rev. Hist. Econ., 31, 359–386, https://doi.org/10.1017/S0212610913000165, 2013b. a, b
Santiago-Caballero, C.: Tithe series and grain production in central Spain, 1700–1800, Rural Hist., 25, 15–37, https://doi.org/10.1017/S0956793313000186, 2014. a
Scharnweber, T., Heußner, K.-U., Smiljanic, M., Heinrich, I., van der Maaten-Theunissen, M., van der Maaten, E., Struwe, T., Buras, A., and Wilmking, M.: Removing the no-analogue bias in modern accelerated tree growth leads to stronger medieval drought, Sci. Rep., 9, 1–10, https://doi.org/10.1038/s41598-019-39040-5, 2019. a
Schauberger, P. and Walker, A.: openxlsx: Read, Write and Edit xlsx Files, R-project.org [code], https://CRAN.R-project.org/package=openxlsx (last access: 28 November 2023), 2021. a
Schlenker, W. and Roberts, M.: Nonlinear temperature effects indicate severe damages to U.S. crop yields under climate change, P. Natl. Acad. Sci. USA, 106, 15594–15598, https://doi.org/10.1073/pnas.0906865106, 2009. a
Schreiber, T. and Schmitz, A.: Surrogate time series, Physica D, 142, 346–382, https://doi.org/10.1016/S0167-2789(00)00043-9, 2000. a
Scott, S., Duncan, S. R., and Duncan, C. J.: The origins, interactions and causes of the cycles in grain prices in England, 1450–1812, Agric. Hist. Rev., 46, 1–14, 1998. a
Seftigen, K., Goosse, H., Klein, F., and Chen, D.: Hydroclimate variability in Scandinavia over the last millennium – insights from a climate model–proxy data comparison, Clim. Past, 13, 1831–1850, https://doi.org/10.5194/cp-13-1831-2017, 2017. a, b, c
Simpson, J.: Spanish Agriculture: The Long Siesta, 1765–1965, Cambridge University Press, Cambridge, https://doi.org/10.1017/CBO9780511523816, 1996. a, b, c
Skoglund, M. K.: Climate variability and grain production in Scania, 1702–1911, Clim. Past, 18, 405–433, https://doi.org/10.5194/cp-18-405-2022, 2022. a, b, c, d
Slicher van Bath, B. H.: Yield Ratios, 1810–1820, Afdeling Agrarische Geschiedenis, Universiteit Wageningen, Wageningen, https://edepot.wur.nl/296371 (last access: 2 December 2023), 1963. a, b
Svensk Nationell Datatjänst (SND): Swedish tithe data, SND [data set], https://snd.gu.se/sv/catalogue/study/snd0996, last access: 28 November 2023. a
Soens, T.: No second Lord: Agriculture and climatic variability in the late medieval Low Countries, in: Communities, Environment and Regulation in the Premodern World: Essays in Honour of Peter Hoppenbrouwers, edited by: Weeda, C., Stein, R., and Sicking, L., 71–98, Brepols, Turnhout, ISBN 978-2-503-59446-0, 2022. a, b
Stauffer, B. and Lüthi, A.: Wirtschaftsgeschichtliche Quellen im Dienste der Klimaforschung, Geogr. Helv., 30, 49–56, https://doi.org/10.5194/gh-30-49-1975, 1975. a
Stoffel, M., Corona, C., Ludlow, F., Sigl, M., Huhtamaa, H., Garnier, E., Helama, S., Guillet, S., Crampsie, A., Kleemann, K., Camenisch, C., McConnell, J., and Gao, C.: Climatic, weather, and socio-economic conditions corresponding to the mid-17th-century eruption cluster, Clim. Past, 18, 1083–1108, https://doi.org/10.5194/cp-18-1083-2022, 2022. a
Studer, R.: The Great Divergence Reconsidered, Cambridge University Press, Cambridge, ISBN 978-1-107-02054-2, 2015. a
Sveriges Riksbank: The Stockholm grain price series, Historical Monetary Statistics of Sweden [data set], https://www.riksbank.se/en-gb/statistics/historical-monetary, 28 November 2023. a
Tegel, W., Seim, A., Skiadaresis, G., Ljungqvist, F. C., Kahle, H.-P., Land, A., Muigg, B., Nicolussi, K., and Büntgen, U.: Higher groundwater levels in western Europe characterize warm periods in the Common Era, Sci. Rep., 10, 1–8, https://doi.org/10.1038/s41598-020-73383-8, 2020. a, b
Torbenson, M. C., Büntgen, U., Esper, J., Urban, O., Balek, J., Reinig, F., Krusic, P. J., Martinez del Castillo, E., Brázdil, R., Semerádová, D., Štěpánek, P., Pernicová, N., Kolář, T., Rybníček, M., Koňasová, E., Arbelaez, J., and Trnka, M.: Central European agroclimate over the past 2000 years, J. Climate, 36, 4429–4441, https://doi.org/10.1175/JCLI-D-22-0831.1, 2023. a
Tornberg, M.: Ilmaston-ja sadonvaihtelut Lounais-Suomessa 1550-luvulta 1860-luvulle, Turun Hist. Ark., 44, 58–87, 1989. a
Trnka, M., Hlavinka, P., and Semenov, M. A.: Adaptation options for wheat in Europe will be limited by increased adverse weather events under climate change, J. R. Soc. Interface, 12, 20150721, https://doi.org/10.1098/rsif.2015.0721, 2015. a
Trnka, M., Olesen, J. E., Kersebaum, K. C., Rötter, R. P., Brázdil, R., Eitzinger, J., Jansen, S., Skjelvåg, A. O., Peltonen-Sainio, P., Hlavinka, P., Balek, J., Eckersten, H., Gobin, A., Vučeti, V., Dalla Marta, A., Orlandini, S., Alexandrov, V., Semerádová, D., Štěpánek, P., Svobodová, E., and Rajdl, K.: Changing regional weather crop yield relationships across Europe between 1901 and 2012, Clim. Res., 70, 195–214, https://doi.org/10.3354/cr01426, 2016. a, b, c
Utterström, G.: Jordbrukets arbetare: Levnadsvillkor och arbetsliv på landsbygden från frihetstiden till mitten av 1800-talet, Tiden, Stockholm, 1957. a
van Bavel, B. J., Curtis, D. R., Hannaford, M. J., Moatsos, M., Roosen, J., and Soens, T.: Climate and society in long-term perspective: Opportunities and pitfalls in the use of historical datasets, WIRES Clim. Change, 10, e611, https://doi.org/10.1002/wcc.611, 2019. a
Vogel, E., Donat, M. G., Alexander, L. V., Meinshausen, M., Deepak, R. K., Karoly, D., Meinshausen, N., and Frieler, K.: The effects of climate extremes on global agricultural yields, Environ. Res. Lett., 14, 1–12, https://doi.org/10.1088/1748-9326/ab154b, 2019. a
von Storch, H. and Zwiers, F.: Statistical Analysis in Climate Research, Cambridge University Press, Cambridge, https://doi.org/10.1017/CBO9780511612336, 1999. a
Wallach, D., Makowski, D., Jones, J. W., and Brun, F.: Working with Dynamic Crop Models: Evaluation, Analysis, Parameterization, and Applications, Elsevier, Amsterdam, ISBN 9780080461939, 2006. a
Wanner, H., Pfister, C., and Neukom, R.: The variable European Little Ice Age, Quat. Sci. Rev., 287, 107531, https://doi.org/10.1016/j.quascirev.2022.107531, 2022. a
Wastenson, L., Raab, B., and Vedin, H.: Sveriges nationalatlas: Klimat, sjöar och vattendrag, Sveriges nationalatlas, Stockholm, ISBN 9187760312, 1995. a
Wei, T. and Simko, V.: R package “corrplot”: Visualization of a Correlation Matrix, GitHub [code], https://github.com/taiyun/corrplot (last access: 28 November 2023), 2021. a
Wetter, O., Pfister, C., Werner, J. P., Zorita, E., Wagner, S., Seneviratne, S. I., Herget, J., Grünewald, U., Luterbacher, J., Alcoforado, M.-J., Barriendos, M., Bieber, U., Brázdil, R., Burmeister, K. H., Camenisch, C., Contino, A., Dobrovolný, P., Glaser, R., Himmelsbach, I., Kiss, A., Kotyza, O., Labbé, T., Limanówka, D., Litzenburger, L., Nordl, Ø., Pribyl, K., Retsö, D., Riemann, D., Rohr, C., Siegfried, W., Söderberg, J., and Spring, J.-L.: The year-long unprecedented European heat and drought of 1540 – a worst case, Clim. Change, 125, 349–363, https://doi.org/10.1007/s10584-014-1184-2, 2014. a, b
White, S.: The real Little Ice Age, J. Interdiscip. Hist., 44, 327–352, https://doi.org/10.1162/JINH_a_00574, 2014. a
White, S., Brooke, J., and Pfister, C.: Climate, Weather, agriculture, and food, in: The Palgrave Handbook of Climate History, edited by: White, S., Pfister, C., and Mauelshagen, F., 331–353, Springer, Berlin/Heidelberg, https://doi.org/10.1057/978-1-137-43020-5, 2018. a, b, c, d
White, S., Pei, Q., Kleemann, K., Dolák, L., Huhtamaa, H., and Camenisch, C.: New perspectives on historical climatology, WIRES Clim. Change, 14, e808, https://doi.org/10.1002/wcc.808, 2023. a
Xoplaki, E., Luterbacher, J., Paeth, H., Dietrich, D., Steiner, N., Grosjean, M., and Wanner, H.: European spring and autumn temperature variability and change of extremes over the last half millennium, Geophys. Res. Lett., 32, L15713, https://doi.org/10.1029/2005GL023424, 2005. a, b
Yin, X., Kropff, M. J., and McLaren, G.: A nonlinear model for crop development as a function of temperature, Agric. For. Meteorol., 77, 1–16, https://doi.org/10.1016/0168-1923(95)02236-Q, 1995. a
Young, M.: Scottish crop yields in the second half of the seventeenth century: evidence from the Mains of Castle Lyon in the Carse of Gowrie, Agric. Hist. Rev., 55, 51–74, 2007. a
Związek, T., Guzowski, P., Poniat, R., Radomski, M. T., Kozłowska-Szyc, M., Panecki, T., Słowińska, S., Kruczkowska, B., Targowski, M., and Adamska, D.: On the economic impact of droughts in central Europe: the decade from 1531 to 1540 from the Polish perspective, Clim. Past, 18, 1541–1561, https://doi.org/10.5194/cp-18-1541-2022, 2022. a