the Creative Commons Attribution 4.0 License.
the Creative Commons Attribution 4.0 License.
 | 04 Dec 2023
Distinguishing the combined vegetation and soil component of δ13C variation in speleothem records from subsequent degassing and prior calcite precipitation effects
Heather M. Stoll
Chris Day
Franziska Lechleitner
Oliver Kost
Laura Endres
Jakub Sliwinski
Carlos Pérez-Mejías
Hai Cheng
Denis Scholz
The carbon isotopic signature inherited from soil and epikarst processes may be modified by degassing and prior calcite precipitation (PCP) before its imprint on speleothem calcite. Despite laboratory demonstration of PCP effects on carbon isotopes and increasingly sophisticated models of the governing processes, to date, there has been limited effort to deconvolve the dual PCP and soil–epikarst components in measured speleothem isotopic time series. In this contribution, we explore the feasibility, advantages, and disadvantages of using trace element ratios and δ44Ca to remove the overprinting effect of PCP on measured δ13C to infer the temporal variations in the initial δ13C of drip water prior to degassing and PCP. In nine examined stalagmites, the most widely utilized PCP indicators and δ44Ca covary as expected. However, Sr Ca does not show consistent relationships with δ44Ca so PCP is not the dominant control on Sr Ca. From δ44Ca and , our calculation of PCP as fCa, the fraction of initial Ca remaining in solution at the time the stalagmite layer is deposited, yields multiple viable solutions depending on the assumed δ44Ca fractionation factor and inferred variation in DMg. Uncertainty in the effective fractionation of δ13C during degassing and precipitation contributes to uncertainty in the absolute value of estimated initial δ13C. Nonetheless, the trends in initial δ13C are less sensitive to these uncertainties. In coeval stalagmites from the same cave spanning the 94 to 82 ka interval, trends in calculated initial δ13C are more similar than those in measured δ13C and reveal a common positive-anomaly initial δ13C during a stadial cooling event. During deglaciations, calculated initial δ13C implies a trend of greater respiration rates and higher soil CO2, although the higher interglacial drip water saturation favors more extensive PCP. Initial δ13C can be estimated for active and fossil speleothems from a range of settings, wherever there is confidence that and/or δ44Ca provides a quantitative indication of past changes in PCP. Further study of Mg partitioning in speleothems will improve the robustness of as a PCP proxy.
- Article
(2927 KB) - Full-text XML
-
Supplement
(1634 KB) - BibTeX
- EndNote


Changes in vegetation productivity and soil processes significantly influence the δ13C of drip water. The δ13C of CO2 in the soil and karst reflects the relative contributions of isotopically light respired CO2 and isotopically heavier atmospheric CO2. Conditions which favor higher vegetation productivity, including deeper-rooted trees (Meyer et al., 2014), and faster rates of heterotrophic and autotrophic respiration in soils will lead to higher soil pCO2 and a lower δ13C of CO2. In contrast, in less productive and slower respiring systems, the atmospheric CO2 and its higher δ13C will be more significant C sources in the soil. This soil and vegetation signature imparted to the drip water is also imprinted on speleothem δ13C. In the temperature range characterizing the middle and high latitudes, respiration rates and vegetation density are highly sensitive to temperature, and speleothem δ13C has been exploited to serve as a temperature proxy in midlatitude speleothems (Genty et al., 2003, 2006). Sufficient soil moisture is also required for high soil CO2 (Romero-Mujalli et al., 2019). In addition to its direct effect on the δ13C of soil CO2, higher soil CO2 concentrations also lead to more open system dissolution of karst host rock carbonate, which further contributes to lower δ13C of the drip water dissolved inorganic carbon (DIC).
Superimposed on soil and karst process are in-cave processes which subsequently modify the δ13C of DIC and thereby speleothem δ13C, since coupled degassing and precipitation of CaCO3 progressively enriches the δ13C of the remaining dissolved inorganic carbon. This process has been demonstrated in lab experiments (Polag et al., 2010; Hansen et al., 2019) and in “farmed calcite” in cave environments (Mickler et al., 2004, 2006) and can be modeled as a Rayleigh process. Extensive quantitative modeling of this processes has been conducted in purpose built models (Mühlinghaus et al., 2007, 2009; Scholz et al., 2009; Sade et al., 2022) and embedded in broader models (Owen et al., 2018). Our interest here is to extend the previous analysis by relating the evolution of the δ13C of bicarbonate to the evolution of the Ca in solution. In this way, we can evaluate the viability of using trace element and Ca isotopic data as independent indices of the progression of coupled CO2 degassing and prior calcite precipitation (PCP).
In this contribution, we explore the potential and limitations of simple, easy to use approaches to distinguish temporal variations in δ13C attributable to soil and epikarst vs. in-cave processes. We acknowledge that effects to recover the absolute initial δ13C will be challenging in most applications. Therefore we focus on the simpler goal of separating the temporal trends in PCP from those due to soil and epikarst components within a given stalagmite. We present new analyses of PCP proxies δ44Ca and on nine stalagmites from a single cave system which experienced the same climate regime and represent a range of climate states from glacial through interglacial. Using these stalagmites as examples, we evaluate approaches for estimating the quantitative extent of PCP and degassing in fossil stalagmites in which initial drip water chemistry and partition coefficients are not independently constrained. For three time intervals including Termination II (TII), Marine Isotope Stage (MIS) 5b–c, and the last deglaciation, we present δ13C time series and compare trends of coeval δ13C records with and without deconvolution of in-cave as well as soil and epikarst processes.
2.1 Rayleigh fractionation of carbon isotopes during CO2 degassing and prior calcite precipitation
The δ13C value of dissolved inorganic carbon in drip water, dominantly bicarbonate, will evolve with the coupled precipitation of calcite and evolution of CO2(g) from the drip water. Because the C removed by CO2 degassing is isotopically much lighter than the bicarbonate pool, the δ13C value of the dissolved bicarbonate increases. The net total fractionation, εtot is the weighted mean (by the number of C atoms) of the individual fractionations between bicarbonate and CO2(g) and between calcite and bicarbonate, respectively (Scholz et al., 2009):
The first of these fractionations is strongly temperature-dependent. The second bicarbonate–calcite fractionation factor showed negligible temperature dependence in seeded experiments (Romanek et al., 1992) but modest temperature dependence in earlier studies and which were used in compilations (Emrich et al., 1970; Rubinson and Clayton, 1969; Mook and Rozanski, 2001). Thus, the net fractionation evolves from −3.5 ‰ at 25 ∘C to −5.2 ‰ at 5 ∘C using temperature-sensitive calcite fractionation factors, but from −3.5 ‰ at 25 ∘C to −4.6 ‰ at 5 ∘C when the calcite fractionation factor is invariant. The evolution of the δ13C of the bicarbonate in drip water has been modeled by a Rayleigh process, in which the dependence of the δ13C of bicarbonate is a function of the remaining HCO in solution (Mühlinghaus et al., 2007, 2009). Newer models have added the effect of isotopic exchange between cave air and the drip water (Hansen et al., 2017). Finally, advection–diffusion–reaction models simulate the dynamic speleothem formation from a flowing thin film, including the evolution from degassing, precipitation, and exchange with atmosphere (Sade et al., 2022). This latter model confirms that the evolution of δ13C of speleothem calcite is very closely correlated to the extent of PCP once >20 % of initial DIC has precipitated.
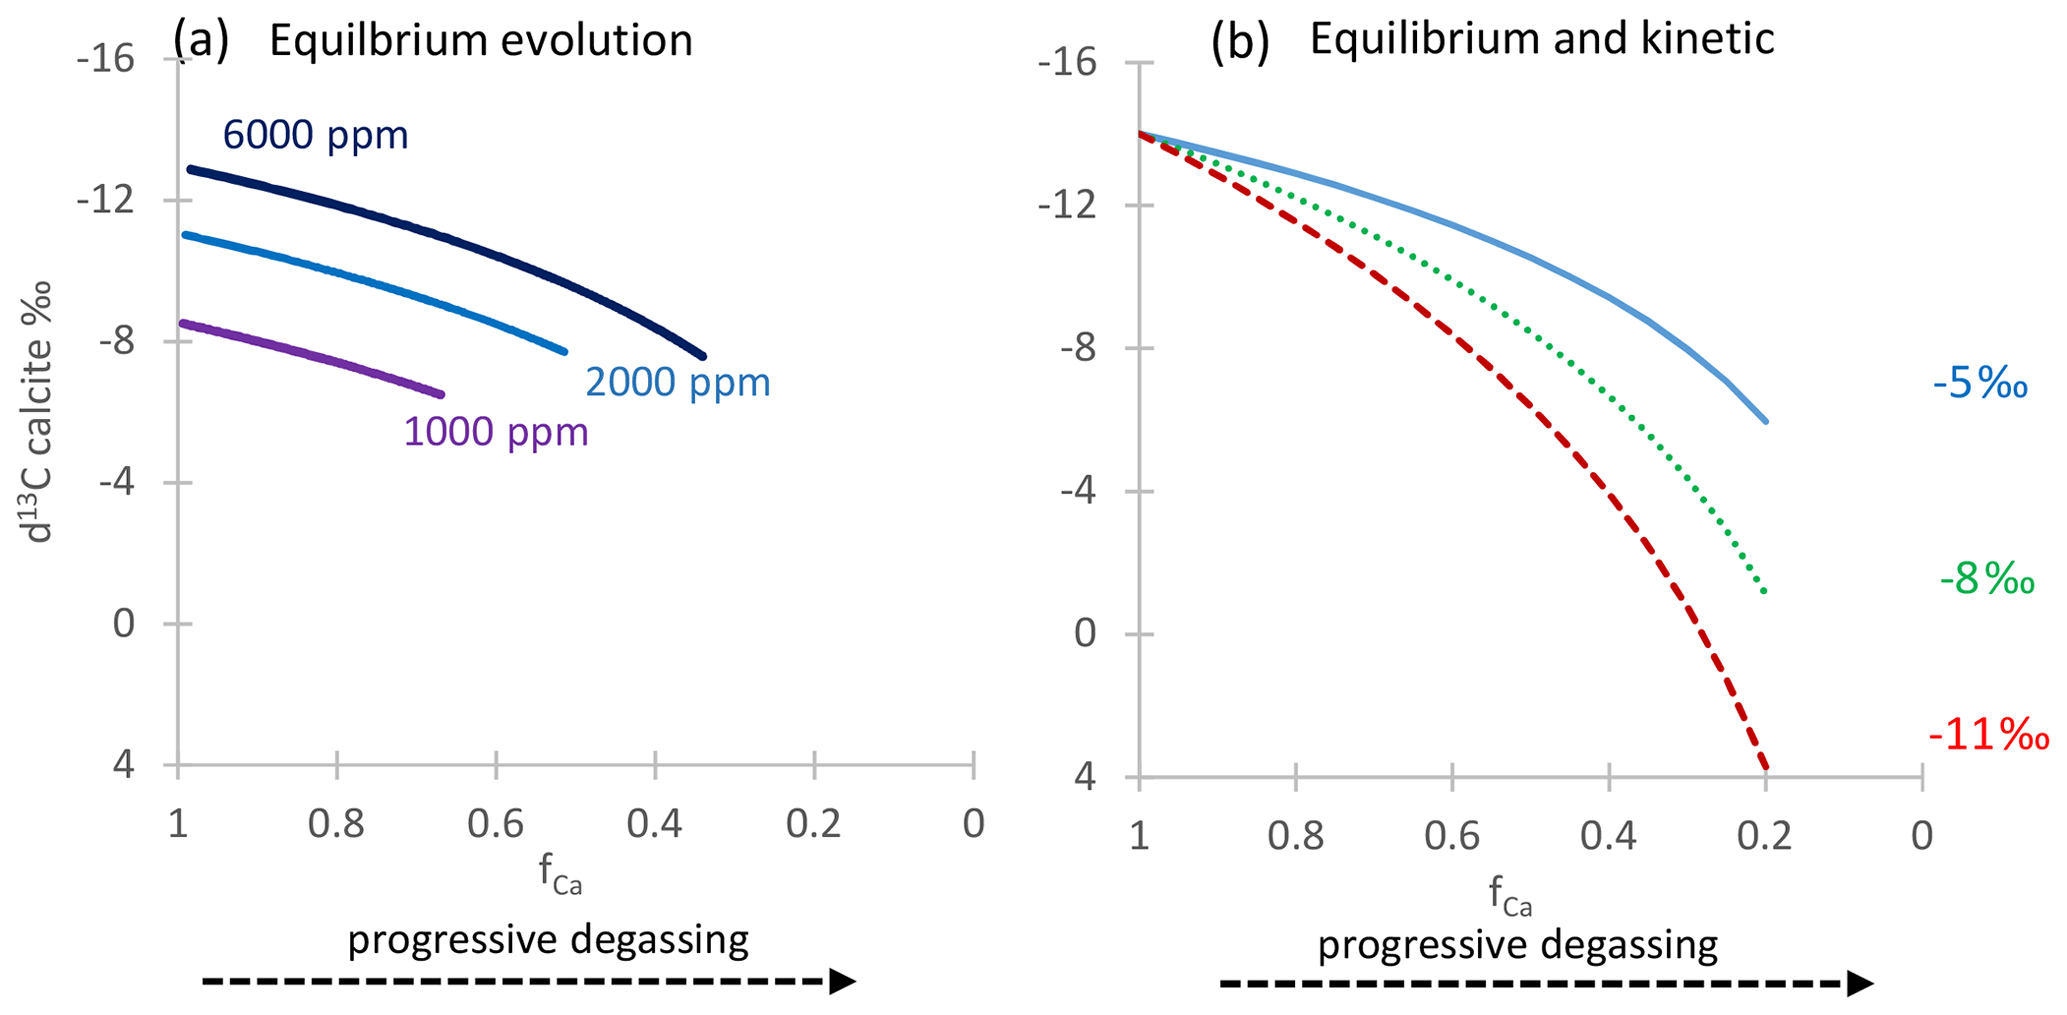
Figure 1(a) Simulation of the equilibrium evolution of δ13C in calcite with increasing PCP for three initial δ13C values of DIC corresponding to different pCO2 of soil, with the soil CO2 isotopic composition following the typical Keeling line (e.g., Pataki et al., 2003). Calculations were completed in CaveCalc (Owen et al., 2018). The fraction of initial Ca remaining at the time of speleothem deposition (fCa) is the index of PCP. (b) Example simulation of the evolution of δ13C in calcite from a single initial δ13C of DIC following Eq. (3); an equilibrium degassing and precipitation fractionation slope A (−5 ‰) is contrasted with two possible kinetically enhanced fractionation slopes (−8 ‰ and −11 ‰).
Previous modeling has focused on the evolution of δ13C bicarbonate as a function of the remaining DIC. In contrast, here we focus on the evolution of δ13C bicarbonate as a function of the Ca remaining in the solution. The Ca remaining in solution allows us to estimate the extent of calcite precipitation, and from this we estimate the degree of degassing (and carbonate precipitation) the solution has undergone prior to deposition of the speleothem. We target Ca as the indicator because trace element ratios and Ca isotopic systems may preserve proxy information about the Ca remaining in solution. CaveCalc (Owen et al., 2018) simulates this process and examples are given in Fig. 1a. We therefore relate the Rayleigh-driven progressive enrichment in δ13C of bicarbonate with the progressive depletion of Ca in the drip water. fCa is the fraction of initial Ca remaining in solution. This relationship is
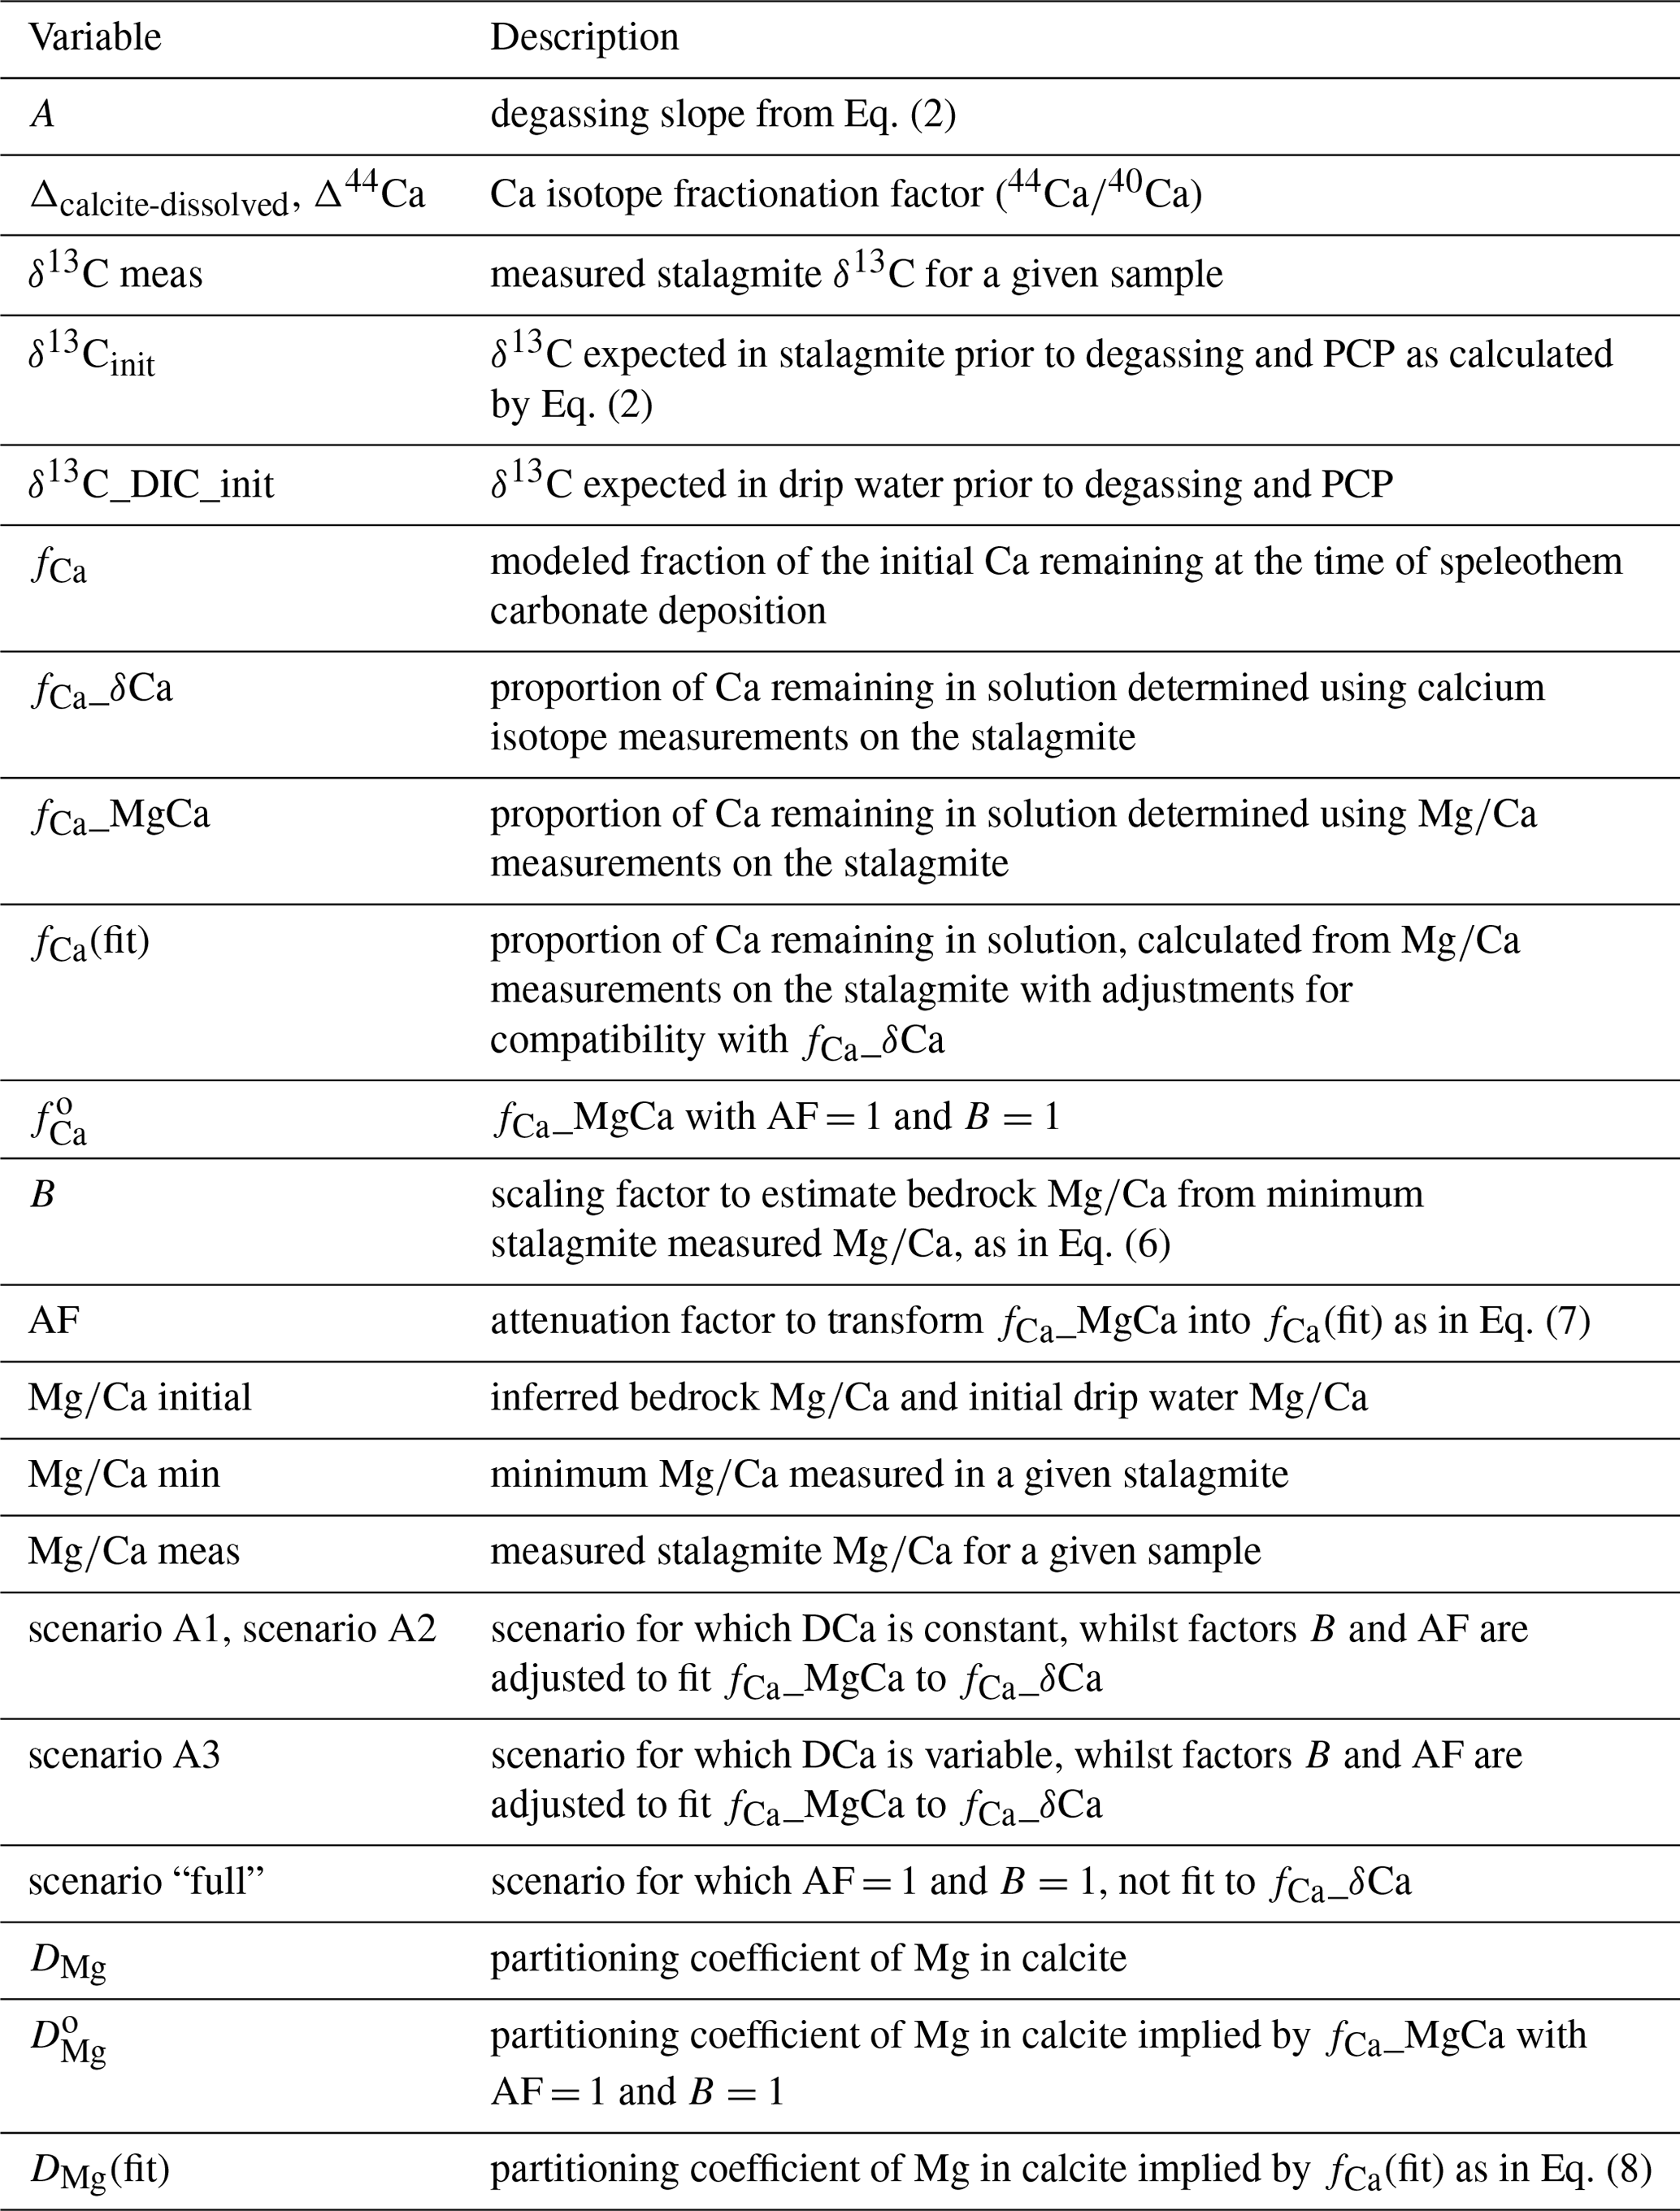
in which δ13Cinit is the composition for a case of negligible degassing and CaCO3 precipitation (fCa=1), and δ13Cmeas corresponds to the δ13C at a given value of fCa (Table 1 provides a summary of abbreviations used in this paper). The term A describes the rate of evolution of δ13C with progressive degassing and CaCO3 precipitation. We subsequently refer to term A as the degassing slope. A range of values have been proposed for A, from equilibrium precipitation and degassing in CaveCalc to greater kinetically enhanced fractionation during degassing suggested by some laboratory (Hansen et al., 2019) and field (Mickler et al., 2019) studies (Figs. 1b and S1 in the Supplement). The support for each of these values and implications are discussed at length in Sect. 5.3. To test the influence of different degassing slopes on the magnitude of the PCP effect, we complete a sensitivity analysis with a range of values for the parameter A.
2.2 Indicators of PCP
2.2.1 and Sr Ca
As discussed previously (Stoll et al., 2012), the signal of PCP imprinted on a stalagmite includes calcite precipitation truly prior to landing of the water drop on the stalagmite surface, as well as the “extent of precipitation” occurring from the drop on the stalagmite surface before it is displaced from the active growth axis by flow. As the combined signal is manifest in the stalagmite, hereafter we discuss both true PCP and the extent of precipitation processes under the term “PCP”.
is the most widely applied indicator of degassing and PCP. Due to the low partition coefficient of Mg in calcite (e.g., as low as 0.012; Day and Henderson, 2013), the precipitation of calcite leads to an increase in the solution . The Rayleigh equation (Eq. 2) relates the fraction of initial Ca remaining in solution (fCa_MgCa) to the initial drip water (e.g., prior to degassing) and measured solution when the partition coefficient D is known.
Figure 2a illustrates an example evolution. is most robust as a quantitative indicator of PCP in a given stalagmite when the initial drip water (prior to degassing) remains constant and when there is minimal variation in the partition coefficient of Mg. In cave analogue laboratory experiments, DMg increases by about 17 % with a 10 ∘C temperature increase (Day and Henderson, 2013). Additionally, in farmed calcite a 60 %–70 % increase in the DMg was observed as calcite increases from 10 to 30 mmol mol−1 (Wassenburg et al., 2020). If DMg increases with solution , it would amplify the due to increasing PCP. This dependence of DMg on has also been shown in some non-cave analogue laboratory experiments (Alkhatib et al., 2022). For inference of PCP, the measured Mg in the stalagmite should be fully in the calcite and not in detrital minerals, a criterion which can be effectively checked using other detrital-sensitive indicators like Al Ca.
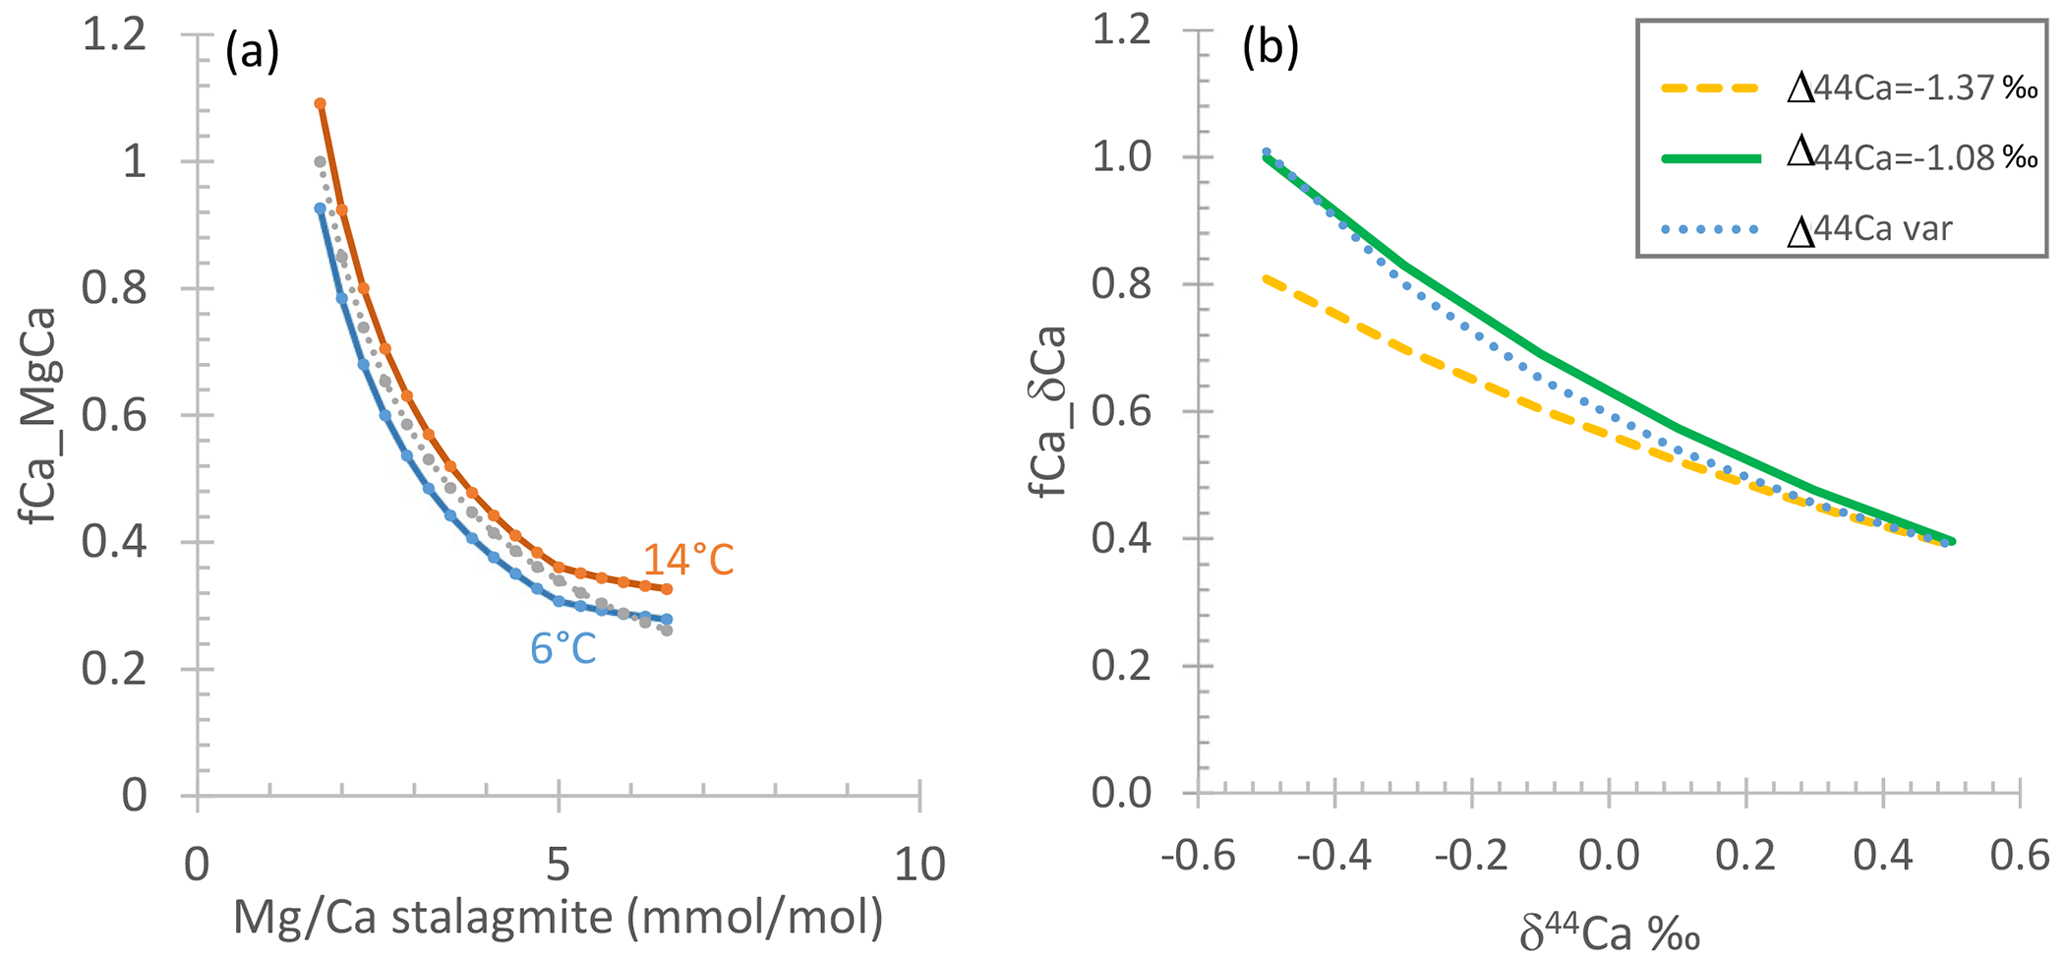
Figure 2(a) Example variation in with fCa from Rayleigh simulations of progressive calcite precipitation at 6 ∘C (lowermost curve) and 14 ∘C (uppermost curve) using the DMg of Day and Henderson (2013); an example is shown for drip water 400 mmol mol−1. Also shown with a dashed line is the “index” approximation produced by Eq. (5). (b) Example estimation of fCa from δ44Ca, illustrating the effect of the fractionation factor on the calculated fCa for two examples of constant fractionation and one case in which the fractionation factor systematically evolves from Δcalcite-dissolved of −1.37 to −1.08 with increasing PCP and concomitant slowing of the growth rate. The example shown is for a bedrock δ44Ca of 0.58.
A formulation similar to Eq. (1) can be made for other divalent cations with partition coefficients significantly less than 1, such as Sr Ca and Ba Ca. The coherence of changes in , Sr Ca, and to a lesser extent Ba Ca is often interpreted to signify that PCP is the controlling process (Sinclair, 2011; Wassenburg et al., 2020). Deviations from expected PCP control may reflect variation in the partition coefficients of Sr (or Ba). Increased DSr with a higher growth rate or saturation state is widely seen in non-cave analogue laboratory experiments (Tang et al., 2008a; Tesoriero and Pankow, 1996; Lorens, 1981). An up to 5-fold increase in DSr is simulated for a 2 order of magnitude increase in growth rate (Nielsen et al., 2013) based on ion-by-ion growth models and non-cave analogue experiments. According to this model, the magnitude of the growth rate dependence depends on the forward and reverse reaction rates, which are sensitive to temperature and solution chemistry. Additionally, in-cave measurements suggest that the DSr increases with increasing calcite ratio. A tripling of calcite from 1.4 to 4.2 mmol mol−1 leads to an 18 % increase in DSr, and a tripling of from 10 to 30 mmol mol−1 leads to an 80 % increase in DSr (Wassenburg et al., 2020). A similar increase in DSr with higher , observed in laboratory growth in a seawater-like matrix, is attributed to the increased accommodation of larger Sr ions in the crystal lattice when the lattice is distorted by incorporation of Mg ions which are smaller than Ca (Mucci and Morse, 1983).
The use of (or Sr/Ca) as a quantitative indicator of PCP also requires that the initial drip water attained by karst rock dissolution prior to PCP remain constant for a given drip water site and stalagmite over the time period of interest. Yet, in karst rocks composed of heterogeneous carbonate mineralogy, there is potential for variation in initial drip water trace element to Ca ratios. In karst rocks composed of both dolomite and calcite, the slower dissolution kinetics of dolomite may lead to greater relative dolomite contribution with longer water residence times, leading to higher drip water and higher drip water with longer water residence times (Tremaine and Froelich, 2013; Fairchild and Treble, 2009). In young reef limestone, primary aragonite and high-Mg calcite dissolve more rapidly than diagenetic low-Mg calcite, potentially contributing to temporal evolution of initial, undegassed drip water ratios over time due to progressive meteoric diagenesis of primary phases (Sinclair et al., 2012). Where bedrock is heterogeneous, it can be useful to define the initial (undegassed, without PCP) drip water chemistry as resulting from the mixture of the multiple bedrock components, e.g., the bedrock mixing fraction (Tremaine and Froelich, 2013). In a synthesis of published drip water time series, in 30 out of 32 drip locations (from 11 different cave systems), bedrock mixing fractions remained constant to within 3 %, and the temporal variations in were driven by variable extent of PCP (Tremaine and Froelich, 2013). This compilation suggests that in a large majority of investigated settings, for an individual drip, seasonal and interannual variations in water residence time do not significantly affect the initial attained through karst dissolution. In the cave system from which our example stalagmite records derive, drip water monitoring similarly suggests stable bedrock mixing fractions at each drip location (Kost et al., 2023b).
In monitoring studies, a constant drip water ratio over periods of strongly varying drip rate and water residence time is an indicator of constancy in the proportion of dolomite–calcite dissolution. When partition coefficients of Mg and Sr in speleothems are constant over time, constancy of ratio of speleothems may be a useful indicator that PCP, rather than differential dissolution, is the main process responsible for variations (Tremaine and Froelich, 2013). However, variable in stalagmites may also be caused by strong variations in the partition coefficients of Sr, an interpretation supported by the dependence of stalagmite and inferred DSr on growth rate in many stalagmites (Sliwinski et al., 2023). In such cases, variation in stalagmite ratios does not necessarily indicate variation in the drip water ratios or variation in the dolomite and calcite relative contribution. Thus, we suggest that monitoring of drip water systems may serve as the most meaningful check of the potential stability of the bedrock mixing fraction and initial drip water trace element to Ca ratios.
2.2.2 Calcium isotopes
δ44Ca has also been employed as an indicator of PCP, since there is a fractionation of Ca isotopes during the dehydration of the ion for it to be incorporated in the crystal lattice. The lighter isotope desolvates more rapidly and is thereby preferentially incorporated in the calcite lattice (Hofmann et al., 2012). Consequently, with progressive removal of Ca into calcite, the remaining dissolved Ca evolves to an isotopically heavier composition (Owen et al., 2016) (Fig. 2b). The quantitative calculation of fCa from calcium isotopes (fCa_δCa) is most robust when the Ca isotopic composition of the host rock is known, initial δ44Ca from dissolution is constant (i.e., always congruent), and the fractionation factor for Ca isotopes during dehydration and calcite precipitation is constant and known. The fractionation factor may be expressed as α or as Δcalcite-dissolved.
Previous applications of δ44Ca in speleothem studies have focused on the Holocene and have monitored cave drip water and farmed calcite to calculate the dissolved calcite fractionation factor in that particular cave setting and drip site (Owen et al., 2016; de Wet et al., 2021). Studies then apply this constant fractionation factor to calculate fCa_δCa in stalagmite. For fossil, non-active stalagmites, the fractionation factor cannot be measured in farmed calcite and must be assumed or based on information from farmed calcite in the same or similar cave settings. A summary of field and experimental fractionation factors is given in Table S1 in the Supplement. In one monitoring study, Δcalcite-dissolved of farmed calcite varied among different drips in a modern cave (de Wet et al., 2021). Models of desolvation and attachment during crystal growth suggest that at higher net precipitation rates, the effective fractionation is greater (DePaolo, 2011). This has been observed in non-cave analogue laboratory experiments (Tang et al., 2008b) and simulated in models which suggest that a 2 order of magnitude increase in net precipitation rates leads to a decrease in Δcalcite-dissolved from −0.75 ‰ to −1.45 ‰ (Mills et al., 2021). According to this model, the magnitude of the growth rate dependence – specifically the absolute range of growth rate at which Δcalcite-dissolved varies strongly – depends on the forward and reverse reaction rates, which are sensitive to temperature and solution chemistry (DePaolo, 2011). For a given growth rate, lower temperatures strengthen the water solvation structure, leading to greater fractionation. A laboratory study suggests that a 10∘ cooling leads to a Δcalcite-dissolved decrease of 0.17 ‰ (Tang et al., 2008b). Yet over a seasonal 7.5 ∘C cave air temperature cycle in Heshang Cave, no seasonal difference in Δ44–40Ca was resolved within analytical error (Owen et al., 2016).
2.2.3 Previous comparisons of PCP indicators
Both δ44Ca and have been simultaneously employed to study Holocene stalagmites (HS4 in Heshang Cave) (Owen et al., 2016; Li et al., 2018) and last interglacial stalagmites from northern India (Magiera et al., 2019). These studies report good quantitative agreement in estimated fCa_δCa and fCa_MgCa. Relative to glacial–interglacial transitions, the Holocene and last interglacial experienced more stable temperatures and potentially also more stable drip water initial oversaturation, with both factors potentially contributing to constant calcite water Δ44Ca fractionation factors. Heshang Cave contains dolomite host rock, and varying water residence times could potentially alter bedrock mixing fraction, altering the initial of drip water prior to degassing. However, if this process were significant, it would lead to deviation in the fCa calculated from compared to that calculated from δ44Ca. The consistency of fCa estimates from and δ44Ca suggests that variations in water–rock contact times did not result in appreciable variation in the bedrock mixing fraction and initial from dissolution.
2.3 Limitations of the Hendy test for degassing correction
The sampling of calcite precipitated from the same initial drip water but with a progressive degree of CO2 degassing and calcite removal has often been attempted through extraction of samples in a single growth layer at successive distances along the growth axis (Hendy, 1971). In theory, the evolution of and δ13C could be examined along a growth layer. However, in practice it is difficult and often impossible to follow a single growth layer laterally along the stalagmite, especially since growth layer thickness decreases with increasing distance from the main growth axis (Dorale and Liu, 2009). Furthermore, simulations suggest that for a drip interval from the 1960s, a flow distance in excess of 3 cm from the main axis is required to generate even a 1 ‰ enrichment of δ13C through PCP and CO2 degassing (Mühlinghaus et al., 2009). Finally, because the drip waters experiencing a lot of degassing are less saturated as they flow off axis than drips with little degassing, the off-axis growth may be biased towards times of low degassing and low PCP. For these reasons, it is often impractical to test relationships between δ13C and using the Hendy test.
3.1 Geochemical models of speleothems
We employ CaveCalc for simulations of the equilibrium fractionation of carbon isotopes. The CaveCalc package employs the PHREEQC geochemical model to simulate the initial dissolution of karst limestone in equilibrium with a given volume of soil gas of specified pCO2 and δ13C and the subsequent equilibration of this solution with a cave atmosphere of specified pCO2, leading to precipitation of CaCO3. Relevant for this study, the CaveCalc package calculates the initial δ13C of bicarbonate and initial Ca concentration of the drip water resulting from karst dissolution and the stepwise evolution of both parameters as well as the δ13C of the precipitated calcite as the solution equilibrates with the cave atmosphere. These CaveCalc simulations allow us to relate the Rayleigh-driven progressive enrichment in δ13C of bicarbonate with the progressive depletion of Ca in the drip water in equilibrium conditions. CaveCalc employs the temperature-dependent calcite–HCO fractionation as calculated by Mook and Rozanski (2001).
Independent from CaveCalc, a modified version of the I-STAL model (Stoll et al., 2012) is used to simulate PCP variation resulting from changes in initial drip water saturation state and changes in drip interval. The effect of variations in initial drip water Ca, temperature, and drip interval are explored at conditions of cave pCO2 fixed at ventilated, near interglacial atmospheric concentrations (300 ppm). In I-STAL calculations, the temperature sensitivity of DMg follows Day and Henderson (2013).
3.2 Analysis of fossil stalagmites
We compile existing data and report new data on nine stalagmites from NW Spain with growth periods during the Holocene, during late MIS 5, and during the penultimate deglaciation (Tables S2 and S3). Reported stalagmites are from La Vallina Cave, whose setting and lithology are described in a detailed previous monitoring study (Kost et al., 2023b). The cave is hosted in Carboniferous limestones of the Barcaliente Formation. Because the section dips at 80∘, different sectors of the cave sample stratigraphically different portions of the limestone, which have significant heterogeneity in and some heterogeneity in Sr Ca and other trace elements. Thus, different drip locations can feature different initial trace element ratios due to congruent dissolution of limestones of differing composition. Despite site-to-site heterogeneity, individual drips monitored over an 18-month period show very limited temporal variation in ratios despite order of magnitude differences in drip rate, suggesting that in this cave, individual drips sample a relatively stable bedrock dissolution source and maintain a constant bedrock mixing fraction. For most stalagmites, age models are previously published, including those for GAE, GAL, and GLO (Stoll et al., 2013, 2015), as well as GAR and GUL (Stoll et al., 2022). For BEL, GLD, and ROW, age model constraints are given in Table S2. The slowly growing fossil stalagmites consist of dense calcite and show no evidence of columnar porous fabrics. Stalagmite calcite for GAR and GAL consist of predominantly columnar compact to columnar open fabrics (Sliwinski and Stoll, 2021). Similar fabrics are confirmed in GUL and GAE (Sliwinski et al., 2023). Samples ROW, BEL, and NYM exhibit growth rates (12–40 µm yr−1) similar to GAR, GAL, GUL, and GAE and feature similar dense, nonporous macroscopic textures. The much more slowly growing GLO and GLD likewise feature dense, compact calcite comparable to sample GLA with a similar growth rate and are described as columnar and columnar open (Kost et al., 2023a, b).
For geochemical analyses, we sampled approximately 1 mg of powder. Trace element ratios (, Sr Ca) were determined by dissolution of powders in 2 % HNO3 and analysis on an Agilent 8800 inductively coupled mass spectrometer (ICP-MS) at ETH Zurich in collision mode. On splits of the same powders, we measured δ13C and δ18O using a Thermo Fisher Scientific Gas Bench II with methods previously described and precision of 0.08 ‰ for both isotopes (Breitenbach and Bernasconi, 2011).
In eight stalagmites, we selected several intervals of contrasting to additionally measure δ44Ca. From the same aliquot used for analysis, ∼500 µg of powder was dissolved in distilled 2M HNO3. An automated Ca–Sr separation method (PrepFAST MC, Elemental Scientific, Omaha, NE, USA) was used to separate Ca from Sr, Mg, and other matrix elements to avoid isobaric interferences with the multi-collector inductively coupled mass spectrometer (MC-ICP-MS). SRM 915b solutions were purified in parallel with the samples to provide a combined column chemistry and analytical accuracy assessment. Ca isotope ratios were determined using a Nu Instruments MC-ICP-MS (the University of Oxford) with a desolvating nebulizer as described previously (Reynard et al., 2011). Solutions were run at 10±1 ppm concentration, and the samples were measured with standard sample bracketing. A minimum of five analyses were conducted on each aliquot. δ44/40Ca is reported normalized to NIST SRM 915a and was calculated from measured Ca as Ca = Ca ⋅ ((43.956–39.963)/(43.956–41.959)) (Hippler et al., 2003). To determine accuracy and external precision, secondary standards NIST SRM 915b and HPSnew (in-house standard) were used. Uncertainty in Ca isotope data is quoted as the t-distribution-derived 95 % confidence interval on the mean of repeat measurements calculated using either the standard deviation or all repeat measurements on each sample.
Additionally, we incorporate published δ13C, fCa_δCa, and data from Heshang stalagmite HS4 (Owen et al., 2016; Noronha et al., 2014).
3.3 Calculation of fCa from δ44Ca, , and Sr Ca
measurement is much faster than δ44Ca, and therefore it is common to have measured for every δ13Cinit measured in the stalagmite. We therefore carry out examples employing as the preferred measurement for deriving a continuous record of δ13Cinit. At the same time, using δ44Ca to derive the PCP-corrected δ13Cinit may be more robust because the δ44Ca of the initial solution can be derived from the measured bedrock, and the isotopic composition of the bedrock is expected to be more homogeneous than , leading to less uncertainty in the initial solution, and because Ca is a major element.
We calculate fCa_δCa from δ44Ca measurements using a constant bedrock δ44Ca equal to average bedrock (0.58 ‰) reported previously (Lechleitner et al., 2021). Use of the highest or lowest measured bedrock δ44Ca leads to a ±0.05 range in absolute fCa_δCa values. Because bedrock δ44Ca is not expected to change at a given location over time, we do not expect this factor to contribute to temporal variations in δ44Ca. The Δcalcite-dissolved for these fossil stalagmites is not independently constrained. Therefore, we complete a sensitivity analysis using the range of Δcalcite-dissolved observed in laboratory calcite growth and ion-by-ion growth models. Table S1 lists the four values of Δcalcite-dissolved which we evaluate.
Inference of the fCa_MgCa from using the Rayleigh formula requires knowledge of the partition coefficient and the initial drip water , which are both difficult to infer for fossil stalagmites.
Because the DMg is very low and the exponent in the Rayleigh formula (Eq. 3) is therefore very close to −1, the following provides a close approximation for fCa:
For a DMg of 0.025, this approximation deviates from the Rayleigh equation by 0.01 at fCa=0.36 and deviates by lesser degrees for higher fCa_MgCa (e.g., dashed gray line in Fig. 2a).
Because of heterogeneity in cave bedrock, we calculate fCa_MgCa assuming there may be differences in the initial drip water for each stalagmite location. Time series data for each stalagmite indicate a range of values. In a first approach, we assume that the minimum of a stalagmite corresponds to a situation of negligible degassing and PCP, that the DMg is constant, and therefore that the numerator can be approximated by the minimum for the stalagmite:
By default in this approximation, the maximum fCa_MgCa calculated for any stalagmite is 1. Therefore, we consider the consequences for calculated fCa_MgCa if the measured minimum in the stalagmite corresponds to precipitation from a solution which has already experienced PCP. We assess this impact with a scaling factor B (between 0.5 and 1) to approximate the initial bedrock dissolution from the minimum measured in the stalagmite and apply a constant B for the stalagmite:
fCa_SrCa may also be calculated from Sr Ca measurements in an approach analogous to . Because of the higher DSr, Eq. (5) is a less accurate approximation for Sr; e.g., for a DSr of 0.1, there would be a 0.04 deviation of the fCa_SrCa by Eq. (5) (fCa=0.30) compared to the Rayleigh formula at fCa_SrCa = 0.265.
Finally, we also evaluate the possibility of temporal variation in DMg in a given stalagmite, testing the scale of variation in DMg which would be consistent with fCa_δCa estimations from δ44Ca. In this fCa(fit), the curvature or slope of the relationship in Fig. 2a is modified by an attenuation factor AF.
The relative change in DMg needed for the fit is given as
where indicates the fCa_MgCa for the full scenario, with AF = 1 and B=1. This AF gives a linear increase in DMg with ; however, other forms of dependence could also fit the data, since we have δ44Ca for only two points for most of the analyzed stalagmites.
3.4 Estimation of δ13Cinit from δ13Cmeas and estimated fCa
We use to derive continuous PCP-corrected δ13Cinit, but we employ the few existing δ44Ca measurements for each stalagmite to validate and adjust the precise relationship between and PCP yielding fCa(fit) in order to achieve a more robust estimate of δ13Cinit. In detail, we use the to calculate fCa in four different ways: fCa_MgCa from the minimum stalagmite and constant DMg (termed “full” with both B and AF = 1) and additionally from three other fCa(fit) values using Eq. (7) (termed A1, A2, and A3) in which the parameters B and AF are adjusted to provide fCa_MgCa compatible with fCa_δCa. For each stalagmite, the values of B and AF employed for A1, A2, and A3 are given in Table 2.
Table 2Parameters for elaboration of fCa based on δ44Ca and .
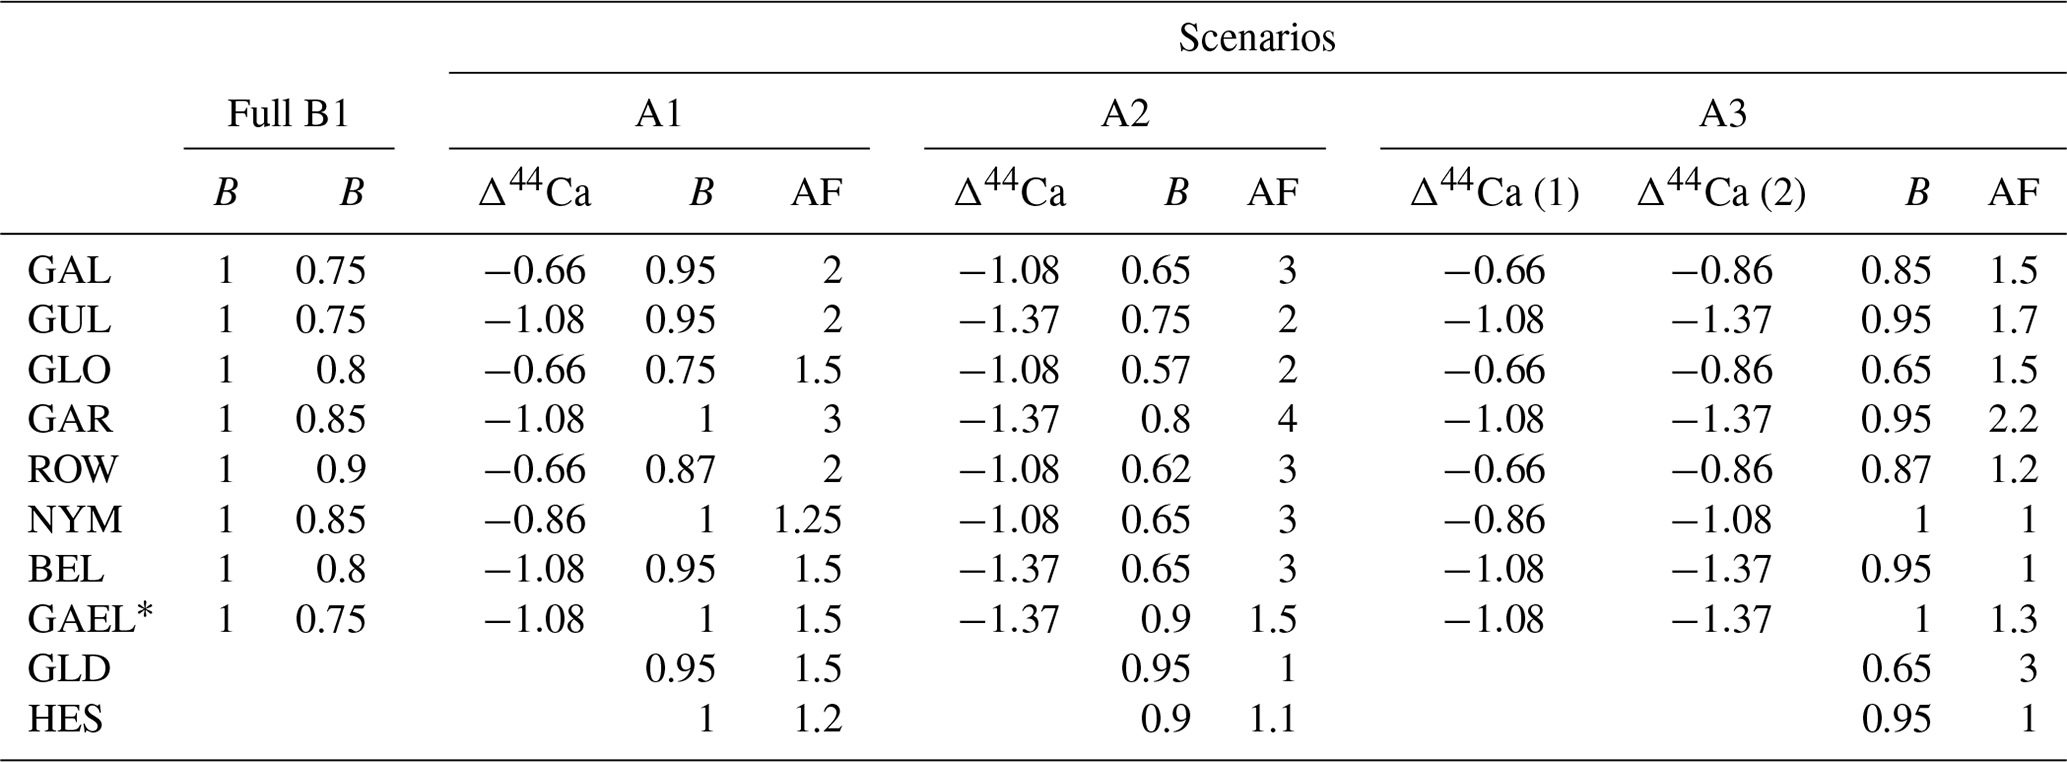
* Fit with min substituted by the 5th percentile value of 6 mmol.
For each of these four possible fCa scenarios, we additionally calculate δ13Cinit using three possible values of the degassing slope (A) in Eq. (3): −5 ‰, −8 ‰, and −11 ‰ (e.g., in Fig. 2b). This exercise illustrates the consequences of a range of possible equilibrium and disequilibrium fractionation behaviors.
4.1 PCP indicators in stalagmites
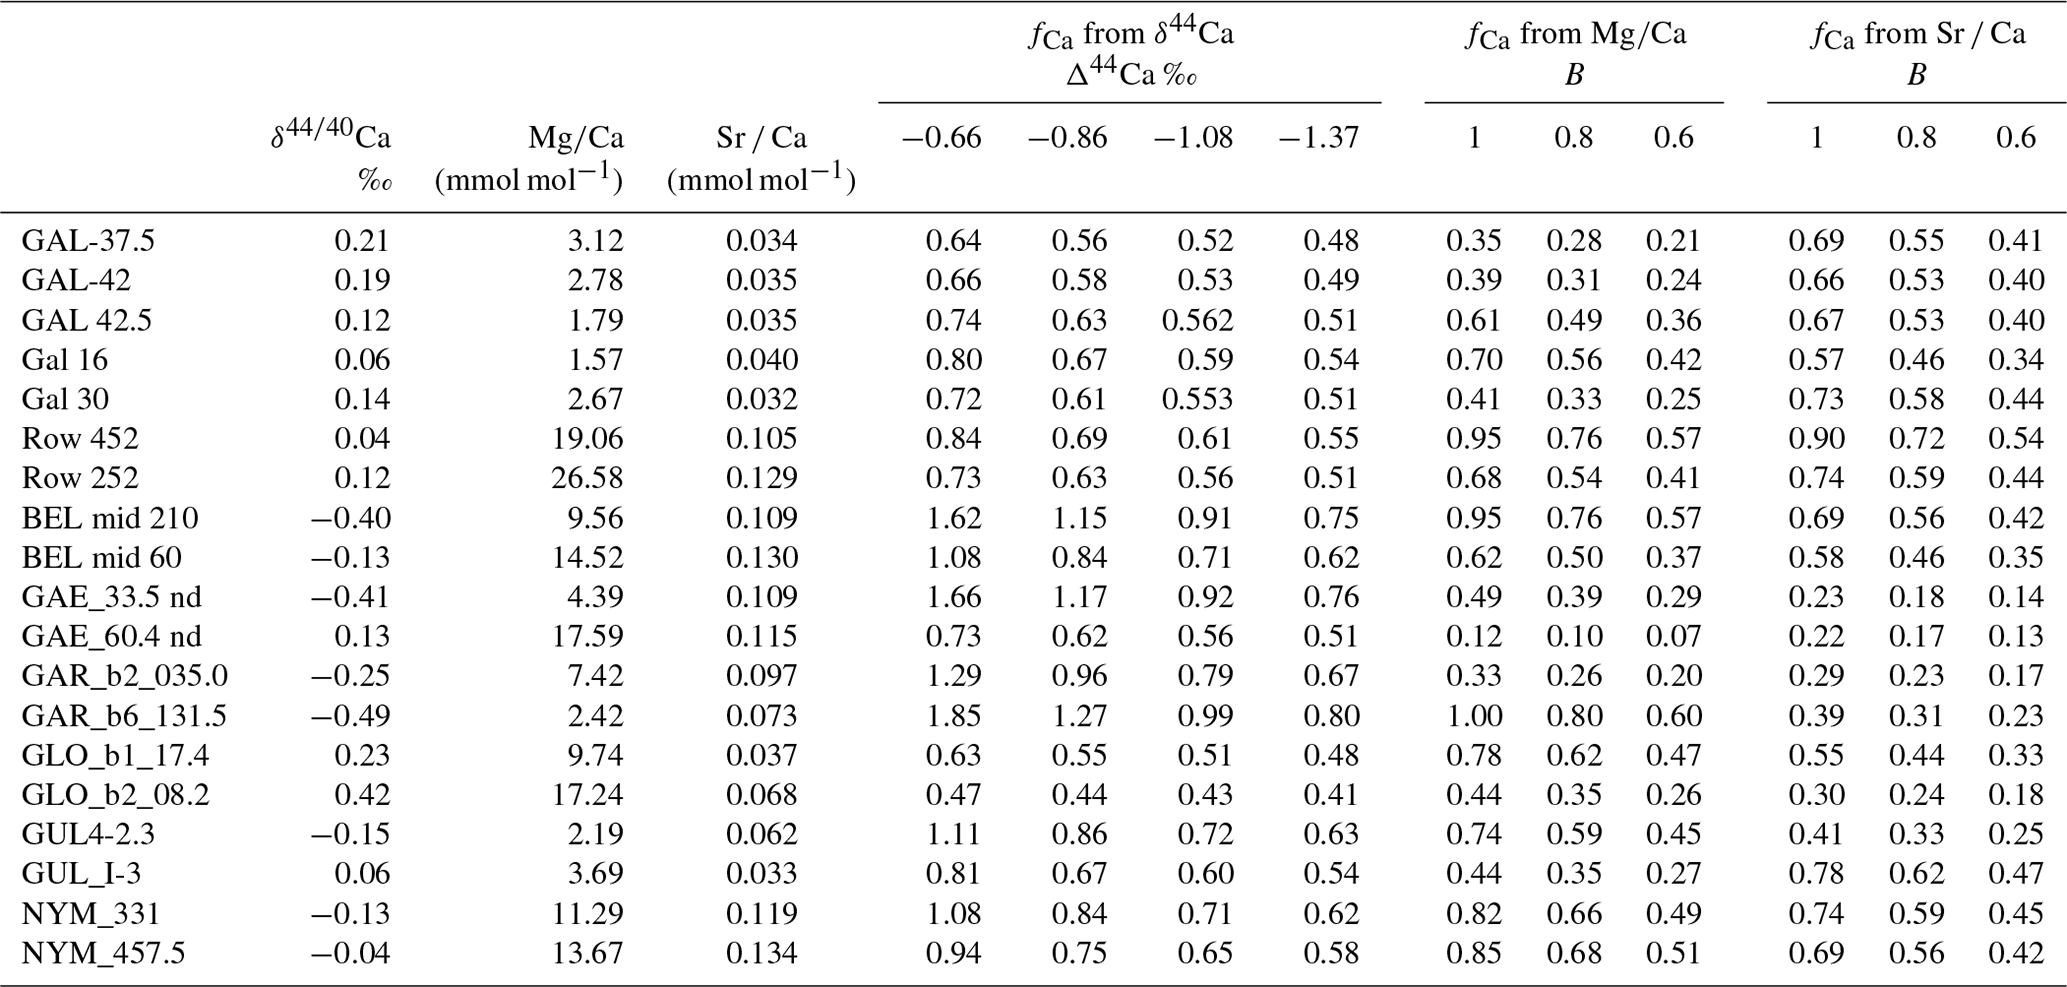
Within the subsamples measured for both and δ44Ca, the δ44Ca of measured samples ranges from −0.49 to +0.42. In all of these subsets, the and δ44Ca positively correlate (Fig. 3). In all but two stalagmites, Sr Ca and δ44Ca positively correlate. In GUL and GAL, Sr Ca and δ44Ca negatively correlate.
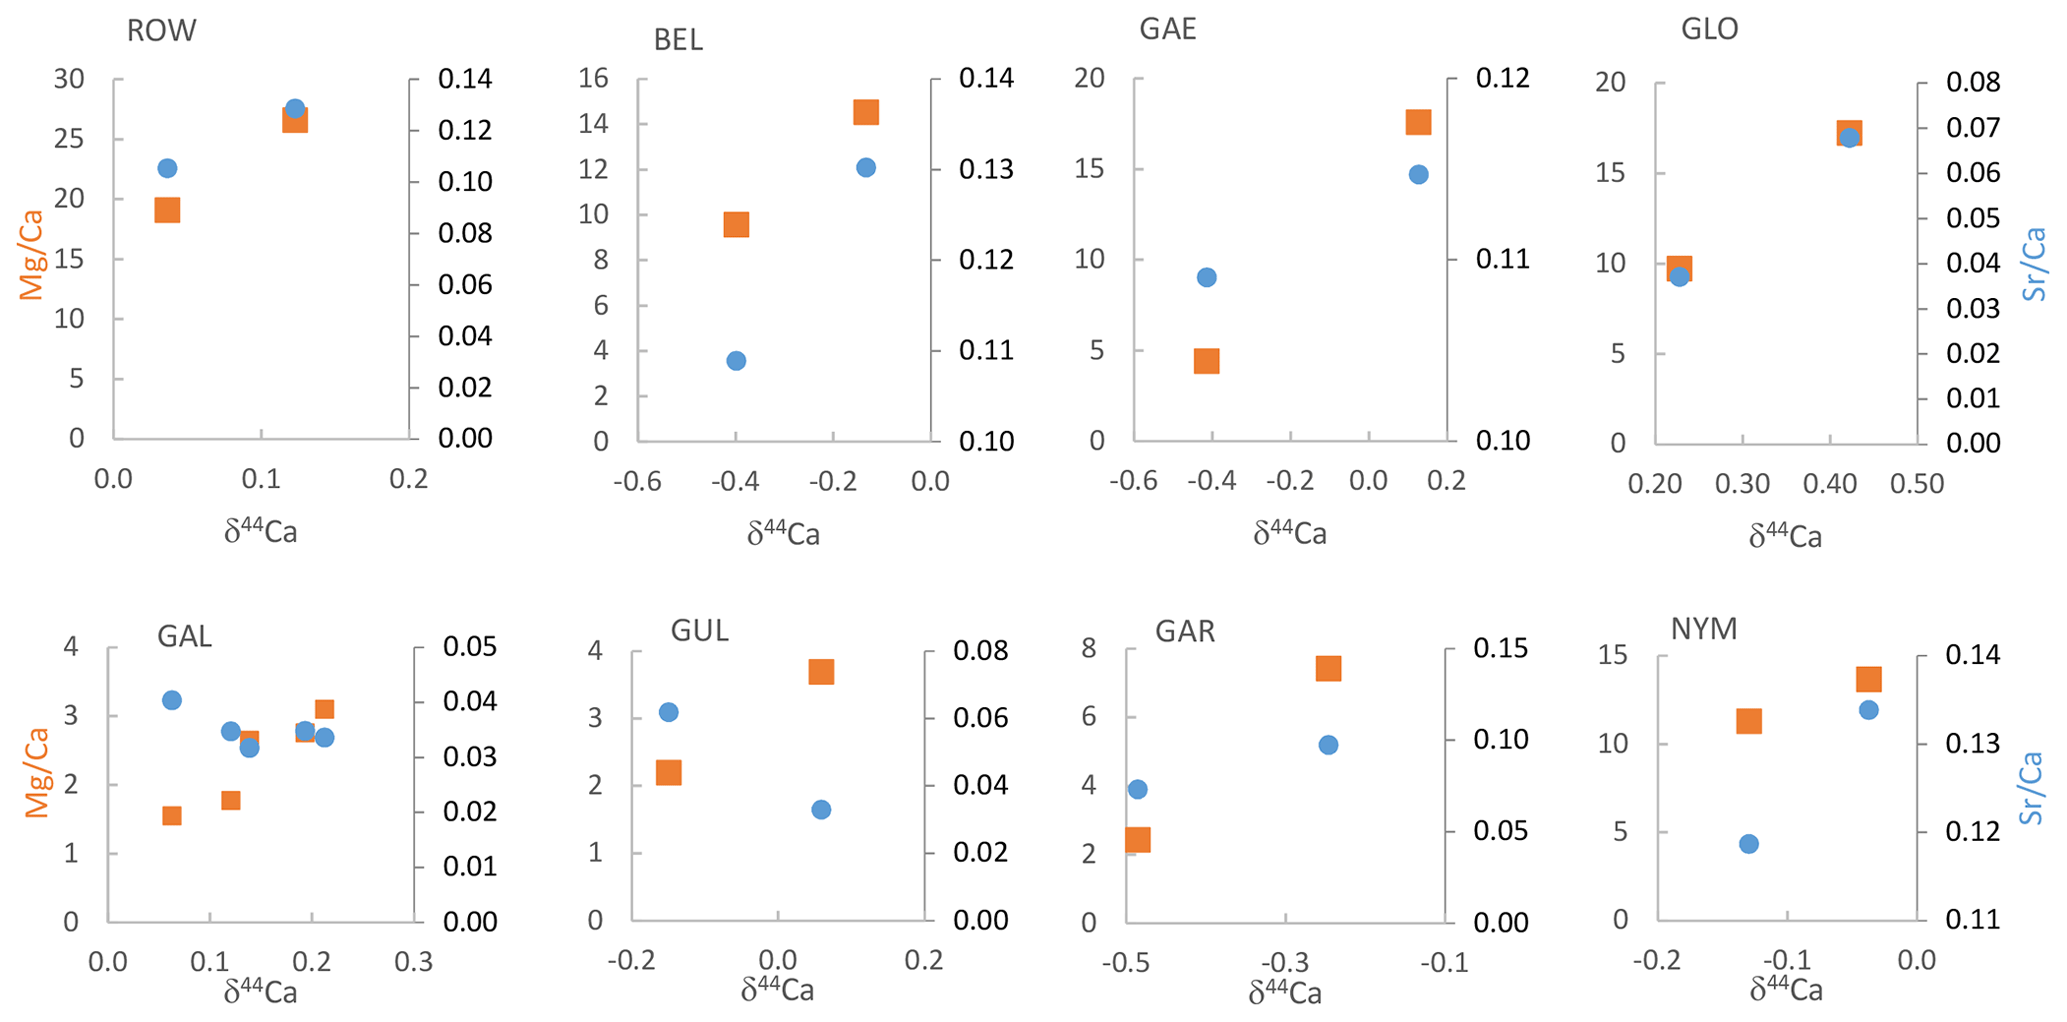
Figure 3 (orange squares on left axes, in mmol mol−1) and Sr Ca (blue circles on right axes, mmol mol−1) vs. δ44Ca (‰) for paired samples from each stalagmite.
In the full geochemical sampling of the nine examined speleothems from La Vallina Cave, variation in a given stalagmite ranges between 1.7-fold and 3.5-fold, with the exception of GAE (12.2-fold range). Six of the nine stalagmites have variations of 2-fold to 3-fold (Table S3). The 1.7- to 3.5-fold range could be fully explained by PCP even with no change in DMg, since a 3.5-fold range requires the initial drip water Ca concentration to be greater than 3.5 times the saturation Ca concentration for the cave conditions. Changes in the of the initial drip water prior to degassing from varying bedrock mixing fraction or an enhanced ratio due to increased fluid inclusion density are not required to attain the range of in seven of the eight of the stalagmites. With the exception of Holocene GAL, minimum generally occurs during the glacials and stadials (Table S3). In GAE, the basal 0.5 cm of the stalagmite features an unusually low ratio, which is 12-fold lower than the maximum ratio. If driven solely by PCP, this range would require drip water Ca in excess of 300 ppm during warm periods to drive such a large range in PCP. In this stalagmite, the of this basal portion may reflect a different initial state of the fracture network and mineral surface age over time. GAE was sampled growing on a large block fallen from the ceiling, and first growth after block emplacement may reflect flow through newly opened fracture networks.
The total range in Sr Ca across each speleothem is between 1.7-fold and 4-fold in all speleothems except GAE (6) (Table S3). The strongest positive correlation between Sr Ca and is found in GLO, GLD, and BEL. Strong negative correlation occurs in GUL, and modest negative correlation occurs in GAL and GAR.
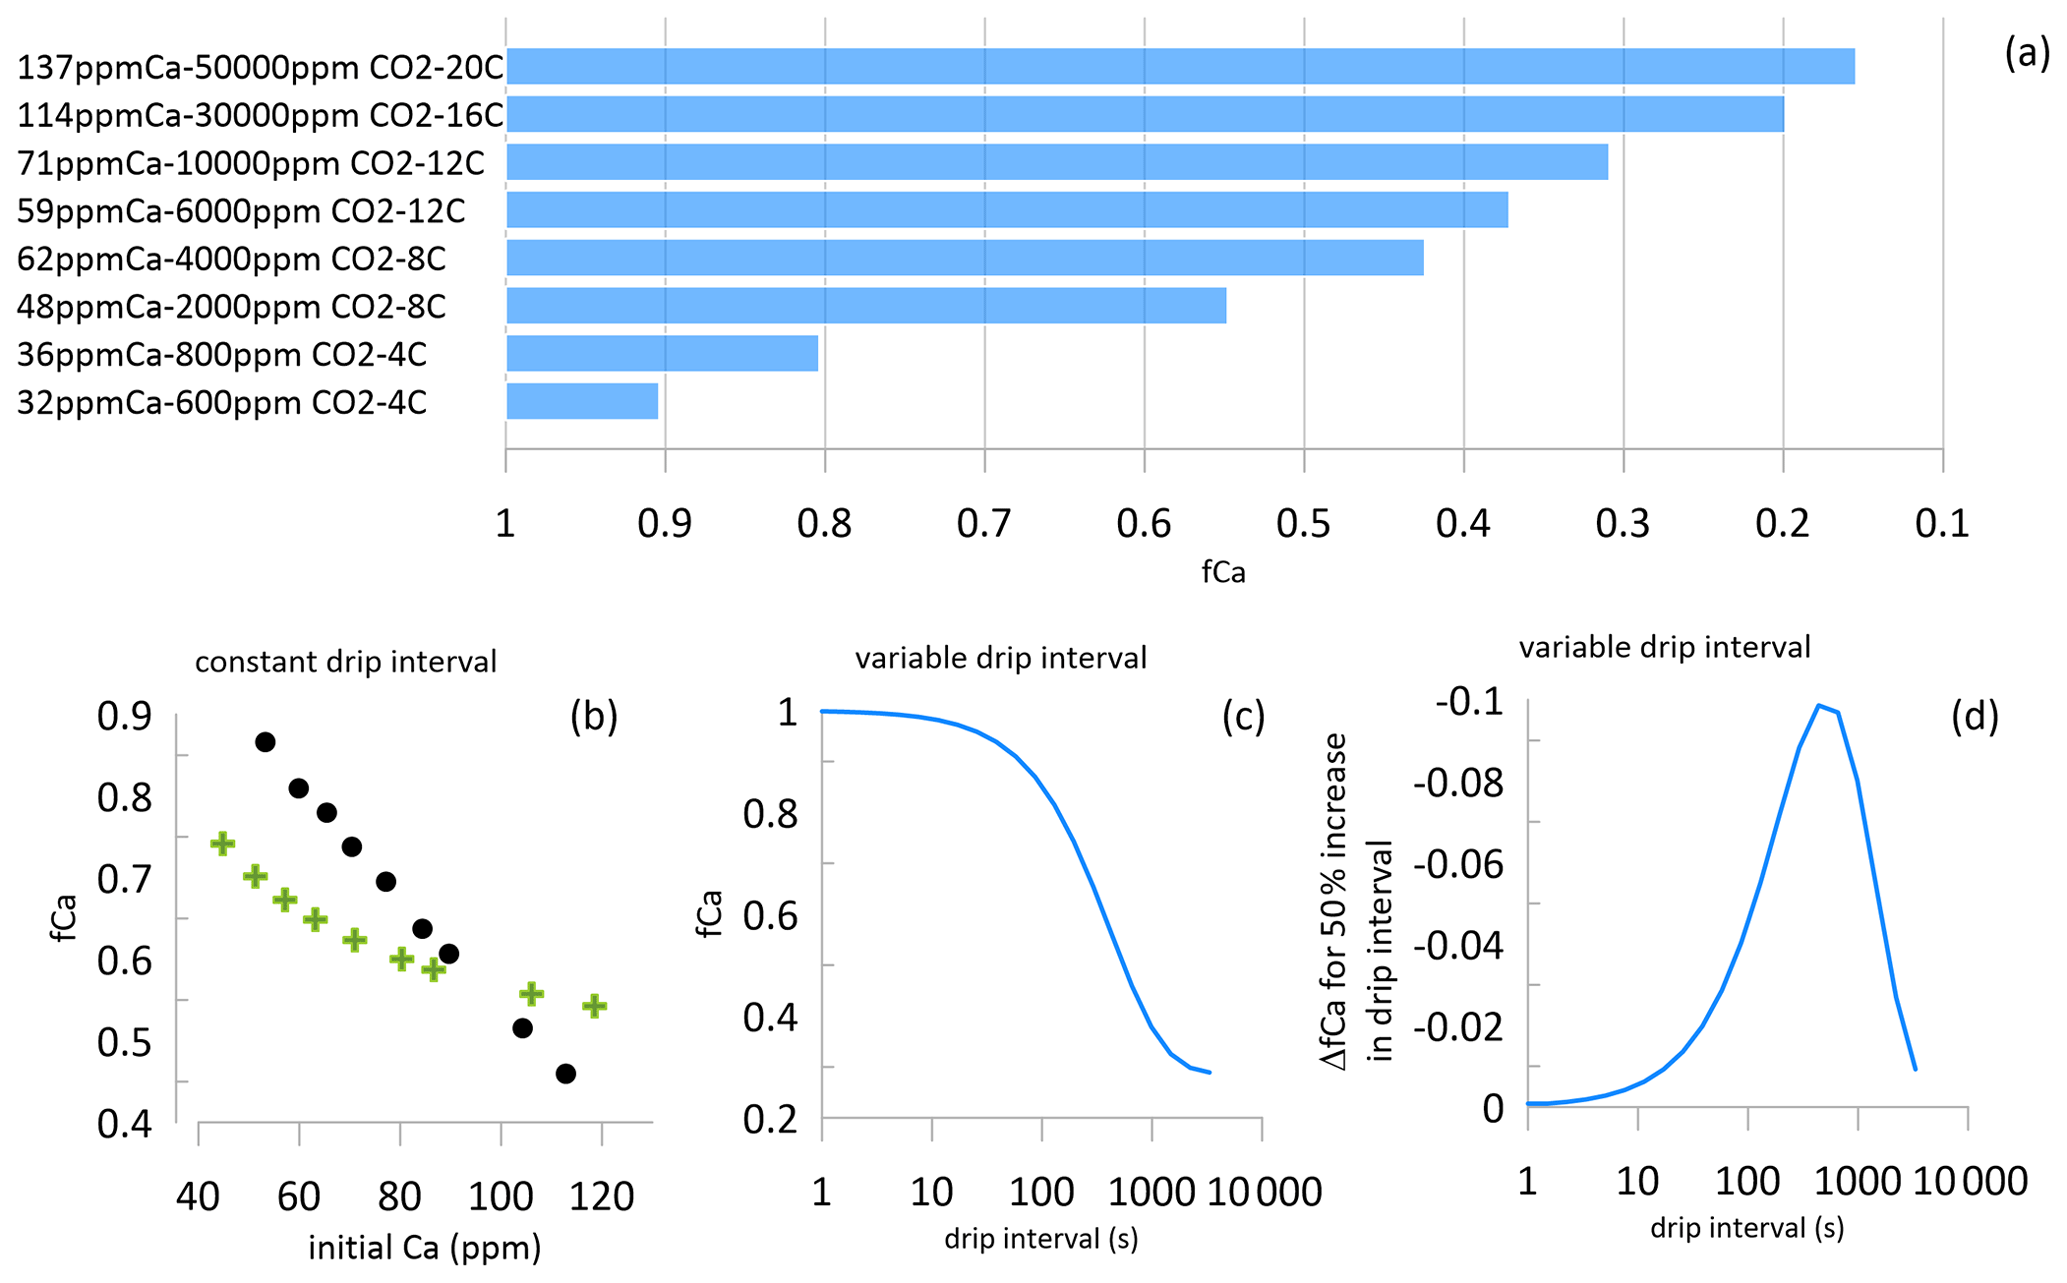
Figure 4(a) The degree of PCP which is possible based on the initial drip water saturation state simulated by CaveCalc for the initial Ca (ppm), soil pCO2 for 150 L gas volume, and reaction temperature. The lowest fCa is defined as that which would correspond to an instantaneous calcite deposition rate equivalent to 4 µm yr−1, as simulated in I-STAL with Dreybrodt (Romanov et al., 2008) kinetics. (b) The fCa simulated for a fixed drip interval of 300 s but variable initial saturation (indexed by Ca concentration). In one case shown with circles, the variable initial Ca corresponds to a progressive decline in temperature from 18 to 5 ∘C, simulating soil pCO2 limited by temperature. In a second case shown with green crosses, variable initial Ca corresponds to constant temperature, simulating soil pCO2 limited by moisture at constant temperature. Simulations assume Dreybrodt kinetics (Romanov et al., 2008) executed in I-STAL with a PCP enhancement factor of 3. (c, d) Illustration of the nonlinearity of PCP relative to drip interval, simulated with Dreybrodt kinetics at a temperature of 12 ∘C, initial Ca 90 ppm, d=0.01, and a PCP enhancement factor of 3. The drip interval range of maximum PCP sensitivity will vary with modeled temperature and PCP enhancement parameters.
4.2 Calculated fCa from PCP indicators
4.2.1 Expected ranges in fCa
Because highly oversaturated drip waters have a greater potential for PCP than minimally oversaturated drip waters, fCa can vary over a wider range in settings with high oversaturation (e.g., warm climates with higher soil CO2 and initial drip water Ca; Fig. 4a). In contrast, minimum degassing and high fCa will be favored by a very low oversaturation state of the drip, even for slow drip rates (Fig. 4a and b). Minimal degassing is also favored by colder temperatures. In the middle and high latitudes, low oversaturation of drip waters and low PCP are more likely during cold glacial or stadial time periods when CO2 in soils is depressed due to low temperatures (e.g., Fig. 4b). We consider this expected association of colder climates and higher fCa in the quantitative interpretation of fCa indices. Alternatively, when soil pCO2 and drip water initial saturation are regulated by the moisture limitation of soils, then fCa varies over a narrower range at a constant drip interval (Fig. 3b). We simulate fCa as low as 0.15 in the case of an initial Ca concentration of 137 ppm.
In addition to the oversaturation state, PCP is also dependent on the degassing time. PCP can occur in air-filled voids above the cave as well as on walls and ceilings of the cave prior to the landing of drip water on the studied stalagmite. Here, we discuss the integrated PCP, regardless of where along the flow path PCP has occurred. The susceptibility of a given speleothem to PCP may depend on the geometry of the flow path. Temporal variations in PCP in a given stalagmite are expected to depend on the flow (e.g., drip rate) as well as on the oversaturation. Because the relationship between drip interval and PCP is known to be highly nonlinear (Fig. 4c and d), different coeval stalagmites often have asynchronous variations in PCP indicators or contrasting magnitudes of PCP variation.
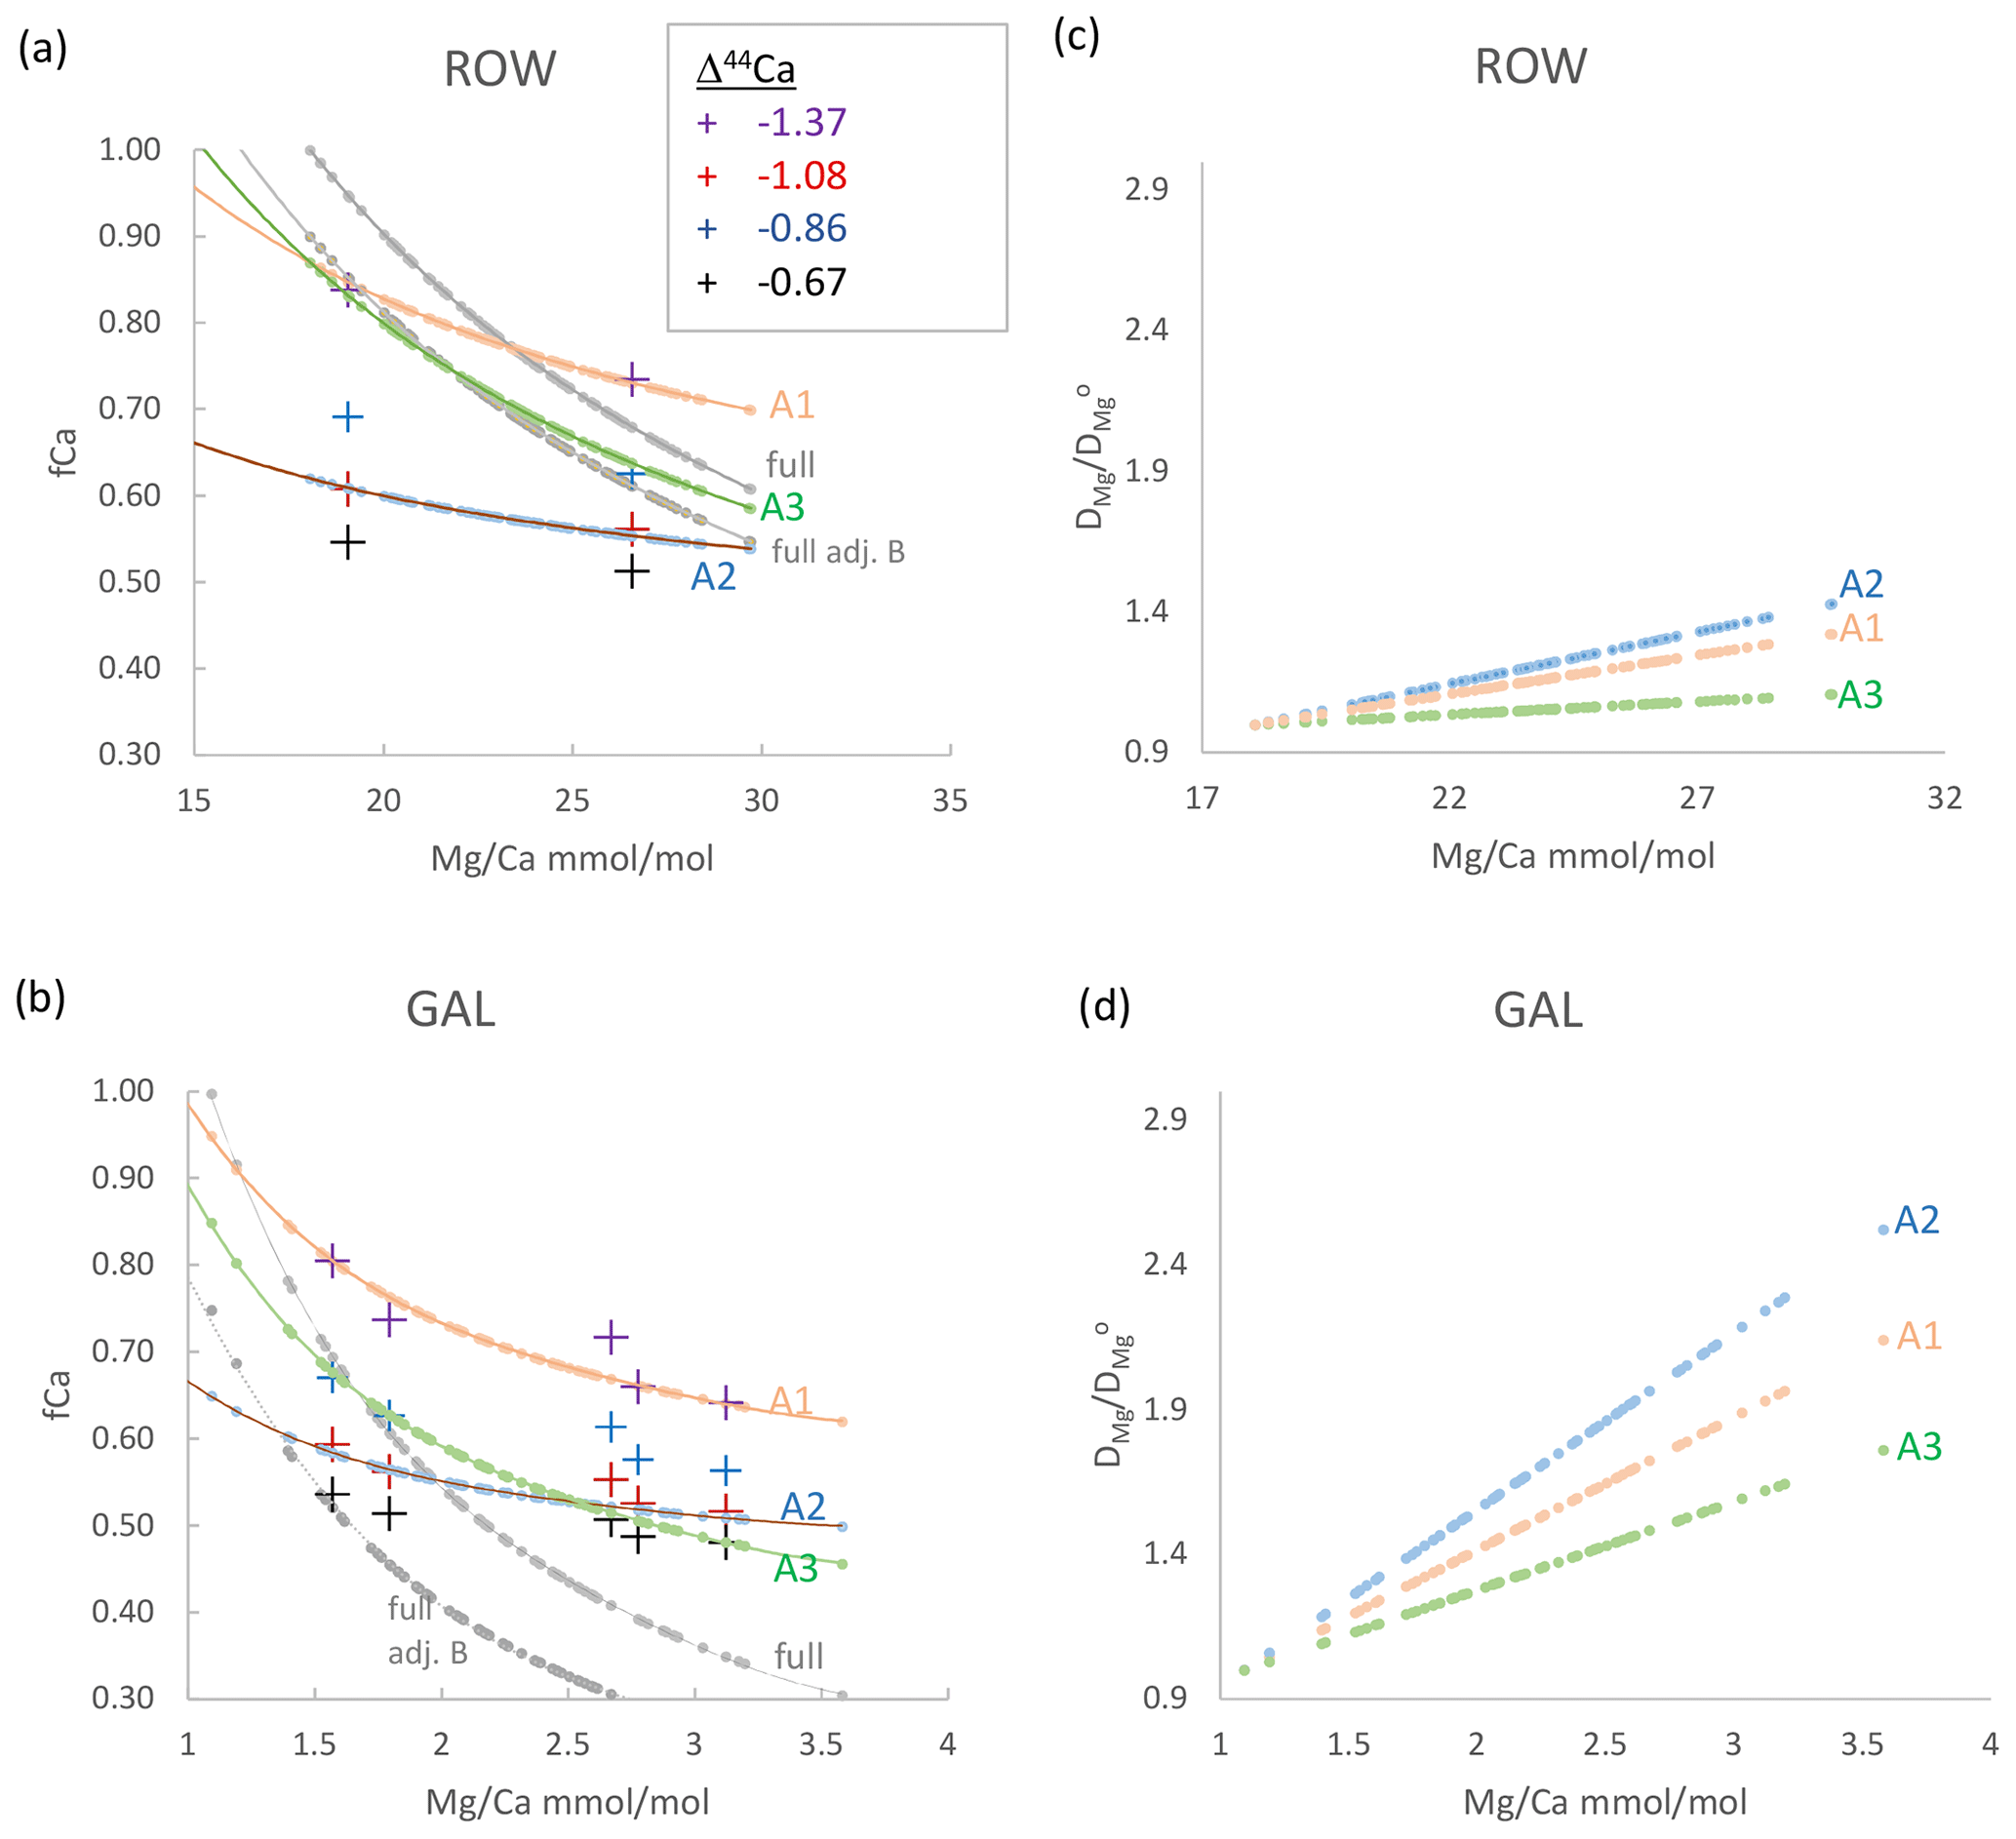
Figure 5(a, b) fCa_δCa (crosses) as well as fCa_MgCa and fCa(fit) (both with lines) vs. measured . Crosses show fCa_δCa calculated from δ44Ca according to different Δ44Ca fractionation factors, vertically ordered according to fractionation factor as given in the legend. Gray curves show calculation of fCa_MgCa from assuming min reflects undegassed drip water (“full”, upper gray line) or that undegassed drip water is lower than the minimum by a factor of 0.65 to 0.95 (“full adj. b”, lower gray line; value in Table 2). Pink, blue, and green lines illustrate scenarios A1, A2, and A3, which are potential relationships between fCa(fit) and consistent with fCa_δCa estimates according to Eq. (7) and fit parameters in Table 2. (c, d) The variation in DMg implied by scenarios in (a) and (b), calculated as in Eq. (8) and assuming constant congruent bedrock dissolution to yield a constant initial undegassed ratio of drip water. A 10 ∘C temperature increase would cause to reach 1.22 according to laboratory experiments (Day and Henderson, 2013).
4.2.2 δ44Ca
The absolute fCa_δCa calculated from a given δ44Ca depends on the choice of the calcite dissolved fractionation factor (Table S1). Given bedrock estimated at 0.58 ‰, the measured δ44Ca in some samples would imply fCa_δCa higher than 1 for the Δ44Ca fractionation factor corresponding to the slowest laboratory growth rates (−0.66). For a given stalagmite, choosing a Δ44Ca corresponding to slower laboratory growth rates (−0.66, −0.86) yields a wider range of calculated fCa_δCa than choosing Δ44Ca corresponding to faster laboratory growth rates (−1.08, −1.37). The largest range in fCa_δCa is found in GAE, and for a given Δ44Ca, the lowest average fCa_δCa values are in GAL and GLO (Fig. 5, Appendix A). Because the fractionation factor depends on growth rate and the solution characteristics, it may not be constant throughout the growth period of a stalagmite if there are significant changes in the growth conditions. For a given stalagmite, a slower growth rate during periods of low initial drip water oversaturation might be characterized by less fractionation, e.g., a Δ44Ca which is closer to 0, compared to periods of stalagmite growth from solutions with greater oversaturation.
4.2.3 and Sr Ca
Using Eq. (4) and the minimum for each stalagmite as an estimation of a nondegassed fCa_MgCa = 1, the high- stalagmites BEL and ROW exhibit a range in fCa_MgCa from 0.95 to 0.6 (Fig. 5; Appendix A) and GLO exhibits a similar range (Appendix A). As mentioned previously, in GAE, the total range exceeds that expected from PCP if the minimum in the basal growth phase is used. We complete a sensitivity analysis calculating fCa_MgCa of GAE with the 5th percentile value rather than minimum, which is equivalent to the minimum observed in the upper 82 cm of the stalagmite, including the period of interest presented here. GAR exhibits the highest range in fCa_MgCa estimated from measured . A smaller range of fCa_MgCa and the lowest fCa_MgCa are calculated from Eq. (6) when the B factor is <1.
4.2.4 Comparison of fCa estimations
We explored which combinations of Δ44Ca and assumptions of B and AF lead to coherent estimations of fCa_δCa and fCa_MgCa of yield fCa(fit). We find that in many stalagmites, with AF = 1 the leads to a wider range in fCa_MgCa than fCa_δCa (e.g., Figs. 5 and S1). Covariation in DMg with is one process which could cause AF to be greater than 1.
Estimates of fCa_δCa and fCa_MgCa for stalagmites BEL, ROW, and NYM are consistent with no systematic variation in DMg (i.e., an AF ≈ 1) if the calcite dissolved fractionation factor Δ44Ca varies by 0.2 ‰ between the sample of lowest and highest PCP (scenario A3; Fig. 5, Table 2). Alternatively, if Δ44Ca is constant (scenarios A1, A2), then fCa_δCa and fCa_MgCa estimates are consistent only when AF is 1.25 to 3, which implies a systematic variation in DMg with (Fig. 5). For other stalagmites (Fig. S1), if the calcite dissolved fractionation factor Δ44Ca varies by 0.2 ‰ between the sample of lowest and highest PCP (Fit A3), some variation in DMg is still required (AF 1.5–2.2); for the assumption of constant Δ44Ca in each stalagmite, a larger range of AF is required (1.5 to 3, with a single higher value of 4 required for GAR). For GAE, only a min of 6 mmol mol−1, which is the 5th percentile value, enabled calculation of a PCP factor consistent with δ44Ca.
The concomitant changes in DMg for these scenarios range from 1 (e.g., constant DMg) to over a 2.5-fold increase in DMg over the range of in the stalagmite (Fig. 5). GAL and GAR have the most significant increases in DMg, whereas BEL, NYM, and ROW feature the lowest. Most scenarios require an increase in DMg larger than that expected from reasonable (5 to 10∘) temperature dependence of DMg alone; for example, according to an experimental cave analogue calculation, a 10∘ warming would lead to a DMg/DMg of 1.22 (Day and Henderson, 2013). Holocene stalagmite GAL features a large simulated range in DMg despite only limited regional temperature change.
We acknowledge that we have limited fCa_δCa for each stalagmite, and therefore our particular scenarios are intended to illustrate potential compatible solutions but do not cover all the possible ranges. The variation in DMg may be exaggerated because datasets with higher numbers of paired δ44Ca and such as GAL show coherency but also some scatter around this relationship, which may be interpreted as a steeper or shallower relationship in our limited dataset.
4.3 Estimation of δ13Cinit in measured speleothems
Following the use of scenarios A1, A2, and A3 to generate the fCa used in Eq. (3), we generated time series records of δ13Cinit for eight stalagmites spanning three time periods of interest – the late glacial to the Holocene, the penultimate glacial to the interglacial transition, and a stadial event occurring between 87 and 85 ka BP. For clarity in time series figures, we illustrate the three scenarios only for the −8 ‰ degassing slope. For one scenario (A1) we illustrate the range in δ13Cinit for degassing slopes from −5 ‰ to −11 ‰. This range is variable over time in a given stalagmite because the choice of degassing slope (−5 ‰, −8 ‰, −11 ‰) impacts the δ13Cinit significantly for low fCa and to a lesser degree for higher fCa.
We begin by comparing the range of δ13Cinit calculated for growth during interglacials and present the time series trends for selected individual stalagmites.
4.3.1 Interglacials
The median δ13Cinit among interglacial samples (here averaging 9–4 ka and 129 to 125 ka) is strongly dependent on the degassing fractionation slope A (Fig. 6). For the three fCa scenarios (A1, A2, A3) in which -based fCa is attenuated for consistency with δ44Ca, with a −5 ‰ slope, median δ13Cinit ranges from −9 ‰ to −13 ‰, and for the −11 ‰ slope, δ13Cinit is in the −11.5 ‰ to −16 ‰ range. For scenario full, the −5 ‰ and −8 ‰ δ13Cinit overlap with modern nondegassed calcite predicted from δ13CDIC measurements, whereas for −11 ‰, scenarios A1 and full lead to δ13Cinit which is 5 ‰ to 7 ‰ more negative than modern δ13C calcite of undegassed drip. Use of the “full” fCa scenario with no attenuation of the fCa from and the slope of −11 ‰ leads to extreme negative δ13Cinit for GAR, GAL, GUL, and GAE but not BEL or GLD. With this fCa scenario, a slope of −5 ‰ or −8 ‰ yields δ13Cinit within the ranges described above.
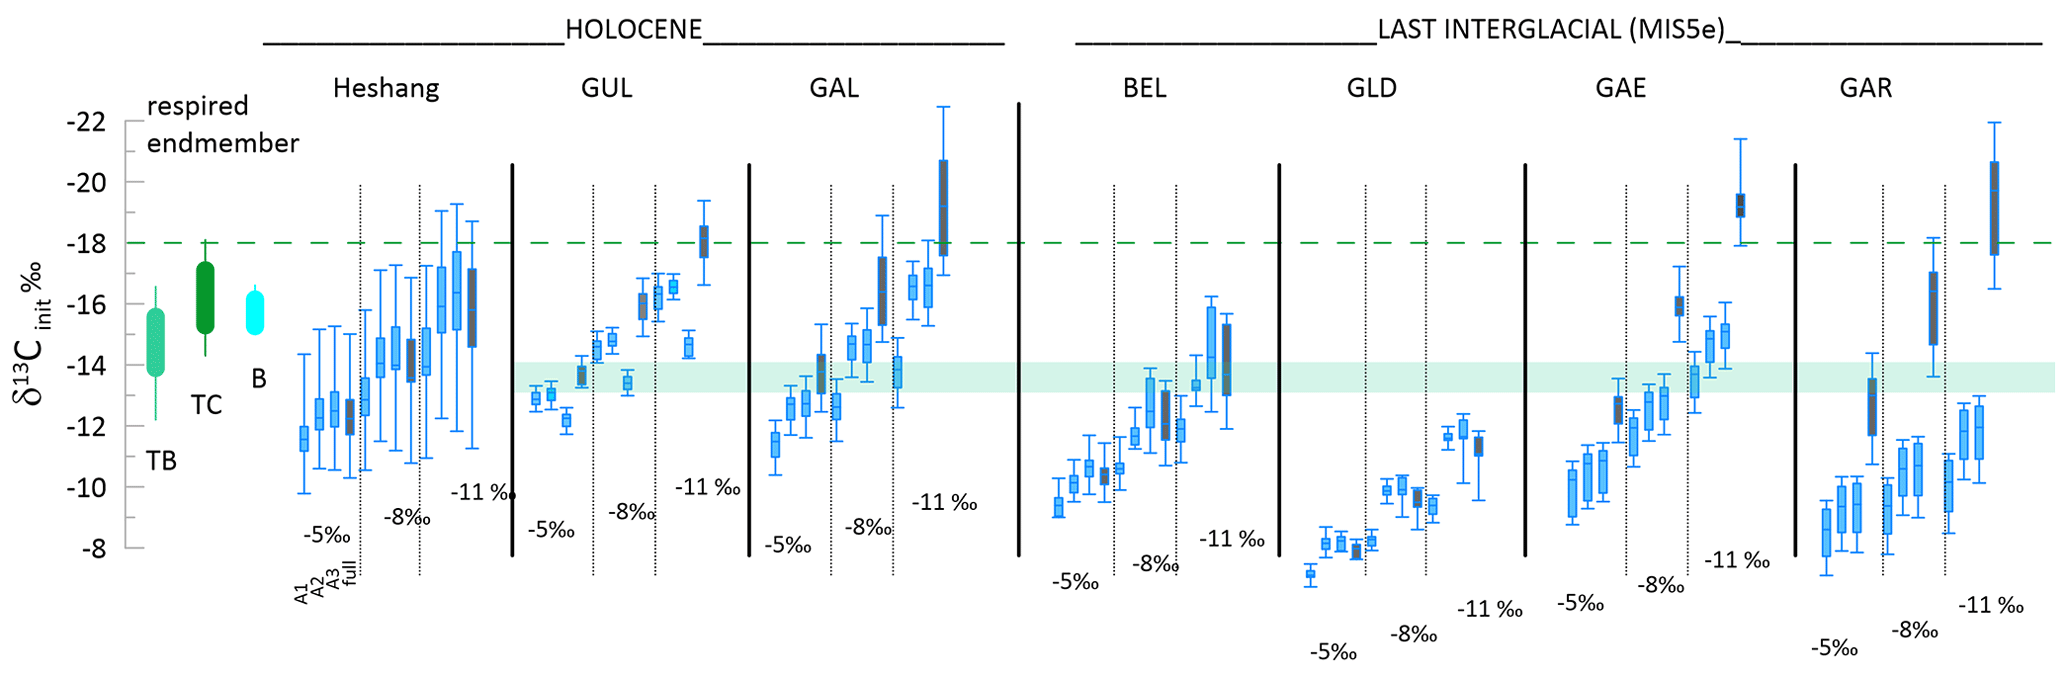
Figure 6Comparison of calculated δ13Cinit for interglacial samples spanning 9 to 5 ka and 129 to 125 ka with the calculated composition for calcite for modern δ13CDIC composition under forested portions of the cave (green horizontal band), as well as the calcite calculated for limited degassing of drip waters equilibrated with soil pCO2 (10 000 ppm) of composition consistent with the δ13C of respired end-members in temperate broadleaf (TB), temperate conifer (TC), and boreal (B) ecosystems (Pataki et al., 2003) illustrated as vertical ranges. For each stalagmite, the whisker plots show distribution of δ13Cinit for three fCa scenarios consistent between and δ44Ca (A1, A2, A3; blue shading) as well as the fCa derived from the full unadjusted record (gray shading) for three different degassing slopes. Shown are the median as well as the upper and lower quartile, and whiskers show 99 % and 1 % for the four different fCa scenarios and three different slopes of degassing fractionation. The dashed green line gives the upper limit of calcite expected to form from drip waters in the temperate conifer ecosystem; interglacial δ13Cinit is not expected to be more negative than this value.
4.3.2 Three coeval time series during MIS 5b–c
Three stalagmites spanning the 94 to 82 ka interval feature contrasting trends in measured δ13C (Fig. 7). An excursion to more positive measured δ13C is noted around 89 to 86 ka BP in GLO, the stalagmite with the most constant . However, the brief positive anomaly is not well expressed in measured δ13C GAE because of a high-amplitude long-term trend over this time interval. Yet, in δ13Cinit, all three stalagmites show a similar positive anomaly. The δ13Cinit with a slope of −8 or −11, for all fCa scenarios, leads to a double-structure positive δ13C anomaly at 89 to 86 ka and a constant background δ13Cinit from 94 to 82 ka. The δ13Cinit for these simulations in GAE exhibits a more similar trend to that of GLO and ROW.
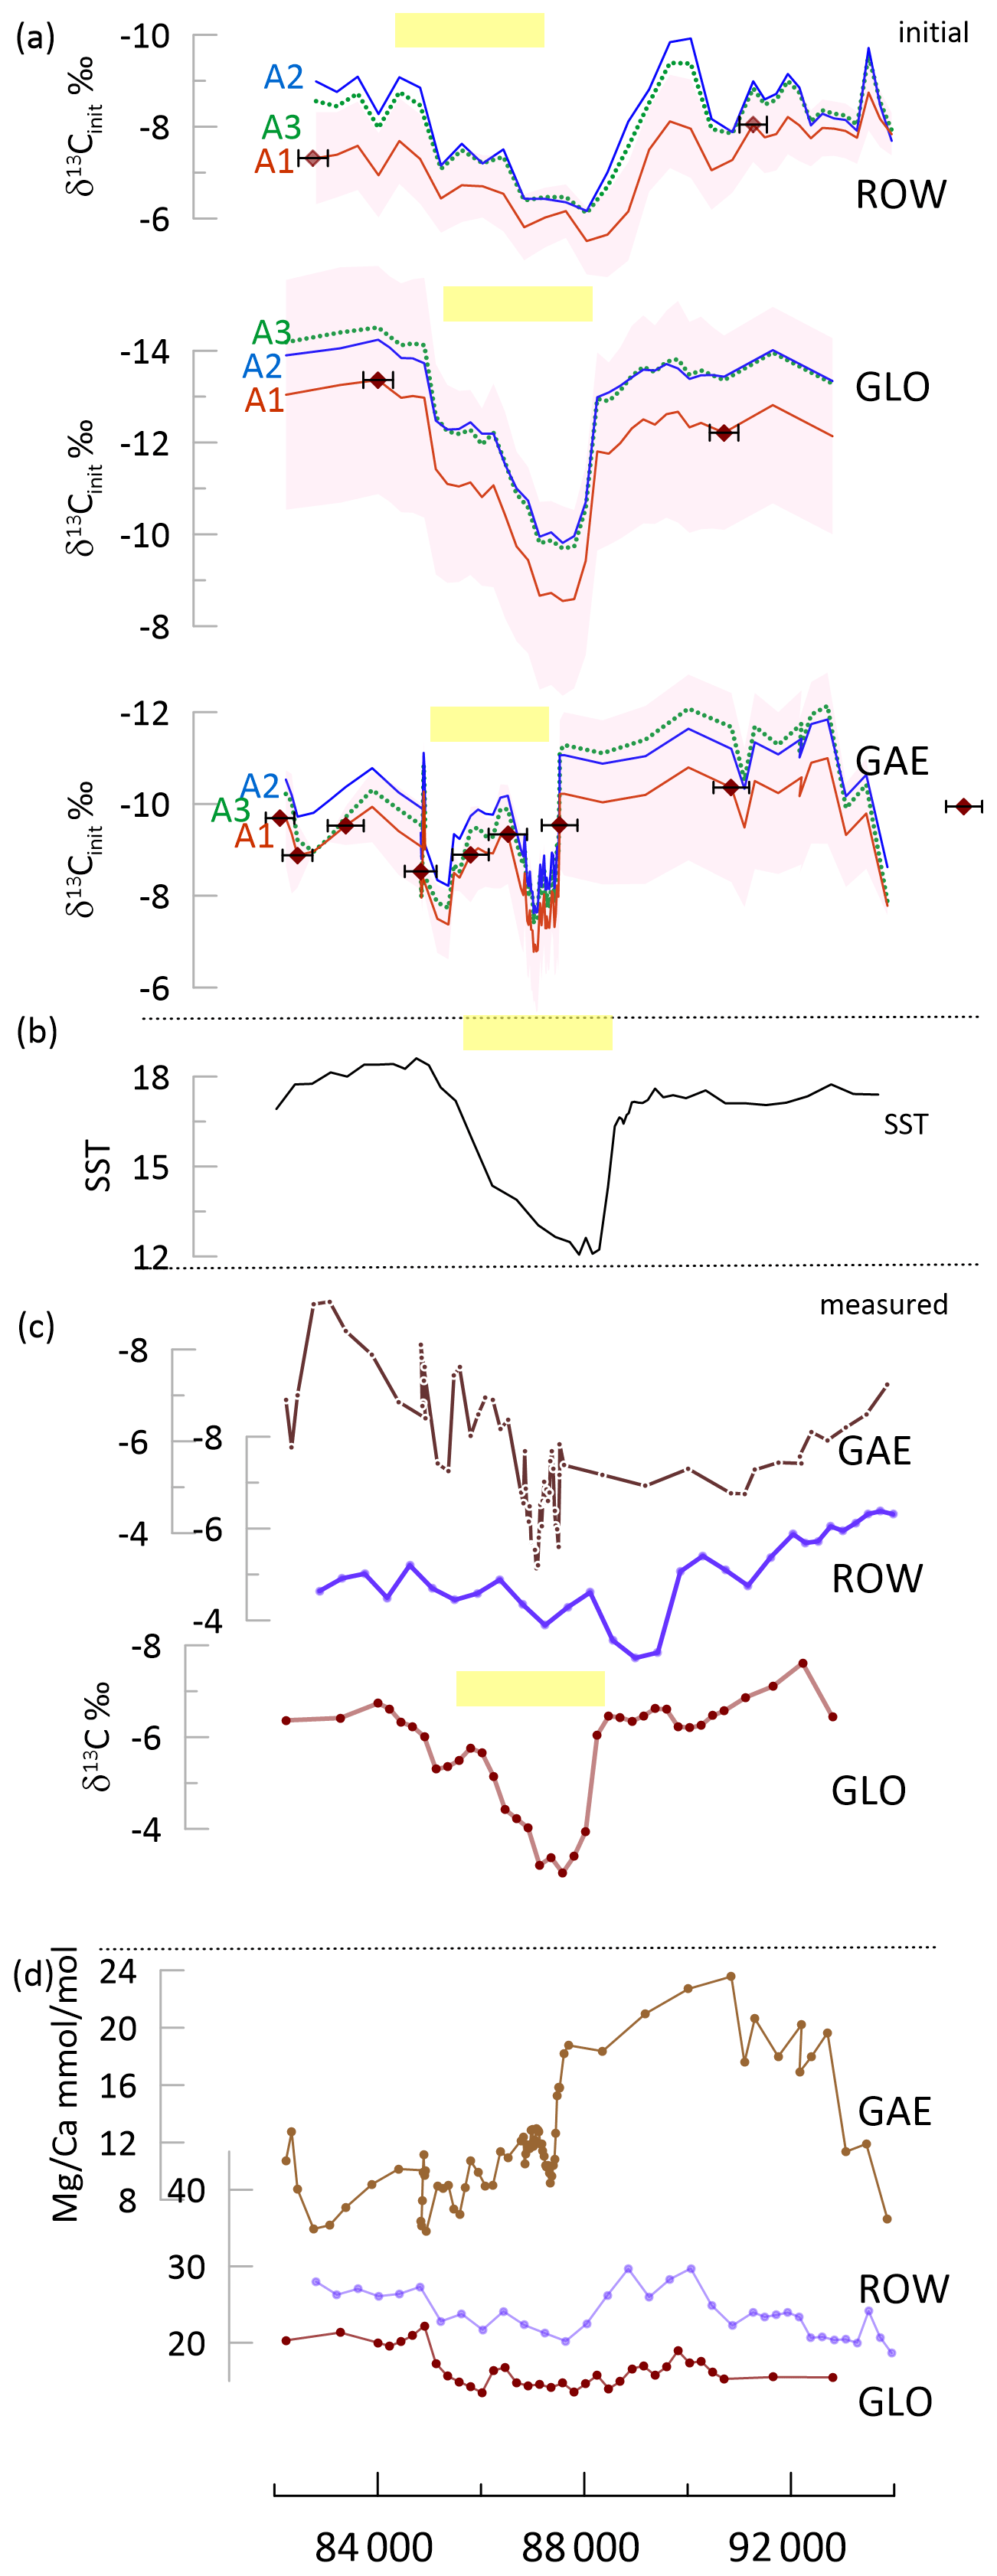
Figure 7Stadial event in the time interval 94 to 82 ka in ROW, GLO, and GAE. (a) The δ13Cinit for three fCa scenarios (A1 and A2 solid lines, A3 dashed line) for each stalagmite; the line shows the result for a degassing fractionation slope of −8 ‰, and shading for the A1 scenario shows the range using other degassing slopes of −5 ‰ (more positive) and −11 ‰ (more negative). Diamond symbols on the red curve indicate the position of U Th dates and the uncertainty in the age. (b) The SST record from the Iberian Margin (Martrat et al., 2007). (c) The measured δ13C for the three stalagmites; small symbols indicate measured samples. (d) for the three stalagmites; small symbols indicate measured samples. A box-and-whisker plot is given in Fig. S2. In (a) through (c), yellow bars highlight the inferred position of the stadial cooling event in each record, given uncertainty in the age model.
A comparison of the range of fCa in each scenario, the resulting range in δ13Cinit, and the correlation of measured δ13C with the δ13Cinit is given in Fig. S2. The most pronounced change between measured δ13C and the δ13Cinit is simulated for GAE, in which correlation of δ13Cinit and measured δ13C is below 0.2 for all degassing slopes except −5 ‰. The case of GAE contrasts with that of GLO, in which the correlation remains above 0.5 for all scenarios consistent with δ44Ca (e.g., scenarios A1, A2, and A3). This reflects the greater range in fCa for GAE than for GLO.
4.3.3 Deglaciation
For the Holocene stalagmite GUL, there is a significant temporal trend of increase from the Bølling–Allerød (B/A) into the Holocene (Figs. 8 and S3). Measured δ13C was comparable in the B/A and the Holocene, but for all scenarios and degassing slopes, the δ13Cinit exhibits greater contrast between the early glacial and the Holocene, as the calculated δ13Cinit of the Bølling–Allerød (B/A) is more positive than that of the Holocene.
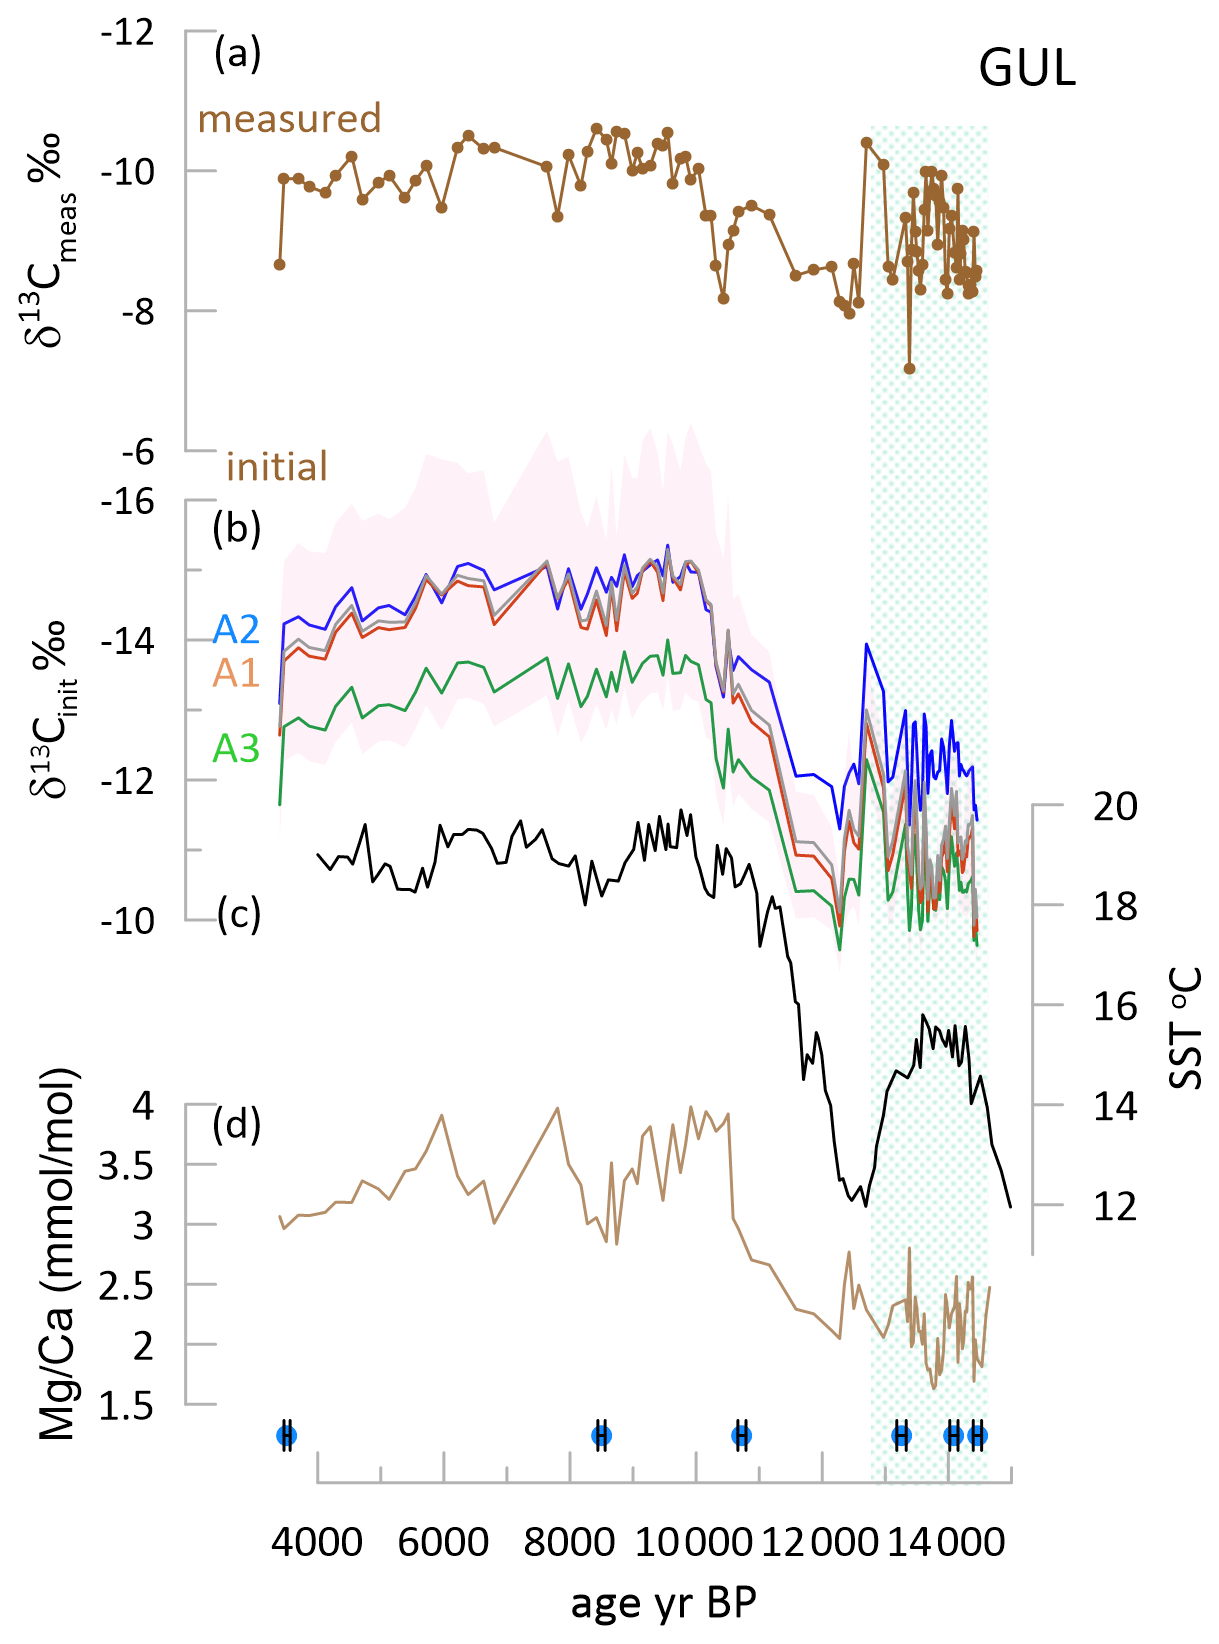
Figure 8Glacial to Holocene transition in GUL. (a) The measured δ13C for GUL. (b) The δ13Cinit for three fCa scenarios; the line shows the result for a degassing fractionation slope of −8 ‰, and shading for the A3 scenario shows the range using other degassing slopes of −5 ‰ (more positive) and −11 ‰ (more negative). (c) The alkenone-based SST for the southern Iberian Margin (Cacho et al., 1999). (d) the for GUL. At the base the position of U Th age points and their uncertainty are indicated with diamond symbols. A box-and-whisker plot is given in Fig. S3. Green shading highlights the B/A period.
A similar steepening of the temporal trend in δ13Cinit occurs for stalagmite GLD spanning the penultimate deglaciation. GLD measured δ13C features a very stable average value punctuated by two positive anomalies, while exhibits a decrease over the deglaciation. The δ13Cinit features a significant negative shift between 136 and 130 ka. With this significant change in trends among δ13Cinit and measured δ13C, correlation coefficients drop well below 0.5 for two scenarios at the −8 slope of degassing and correlations approach 0 at the −11 ‰ slope (Figs. 9 and S4).
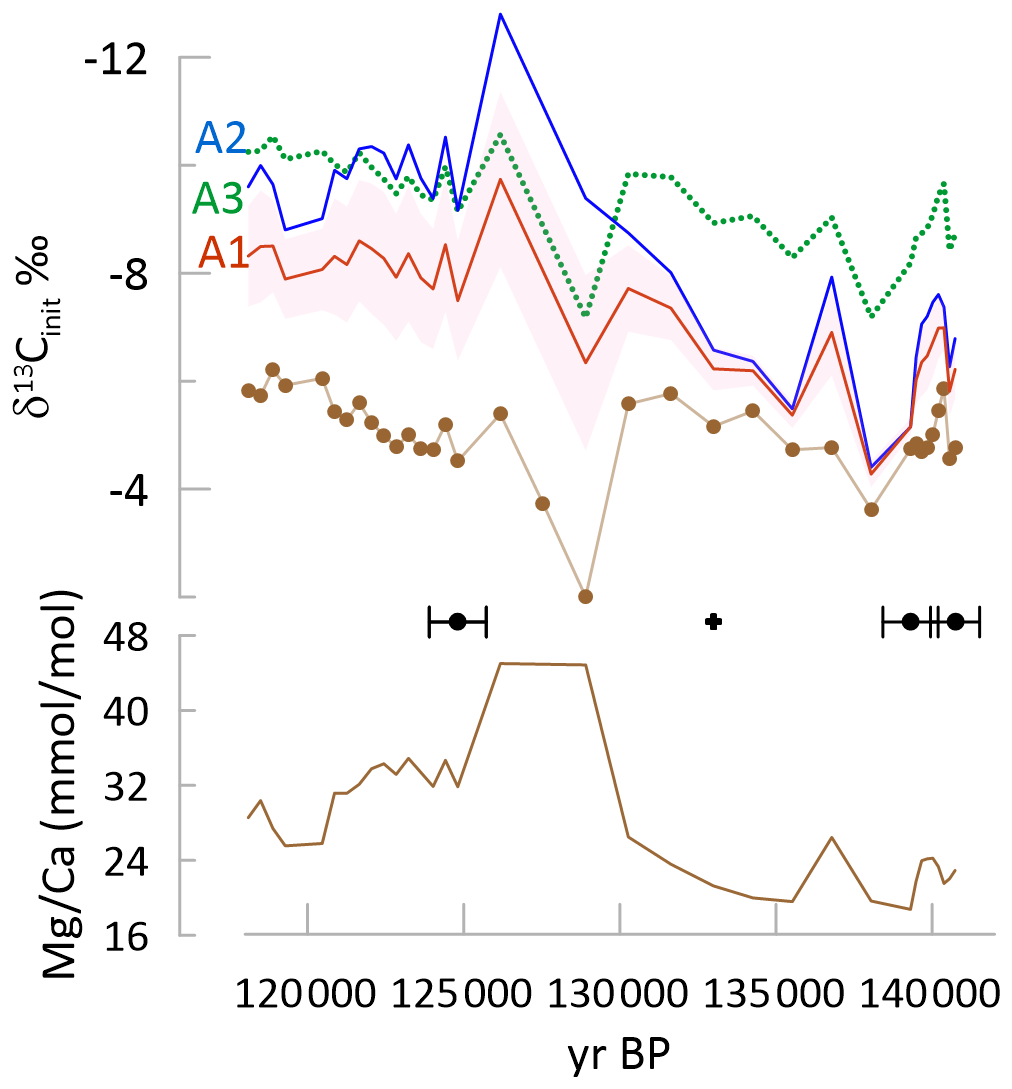
Figure 9Penultimate glacial to interglacial transition in GLD showing the measured δ13C (brown curve with symbols indicating measured samples), with colored lines for δ13Cinit for the three fCa scenarios A1, A2, and A3 (dashed line) for a degassing fractionation slope of −8 ‰. Shading for the A3 scenario shows the range using other degassing slopes of −5 ‰ (more positive) and −11 ‰ (more negative). Black diamonds indicate the position of U Th dates and their uncertainty; the black cross indicates a tie point based on δ18O as indicated in Table S2. is also shown with a solid brown line. A box-and-whisker plot is given in Fig. S4.
5.1 Interpretation of δ13Cinit and coherence of coeval speleothem signals and regional climate
The calculated δ13Cinit is formulated to reflect the isotopic signal of DIC prior to significant evolution via degassing and PCP. Warmer interglacial climates characterized by higher soil pCO2 promote more negative δ13CDIC and increase the degree of drip water saturation, which promotes greater PCP for a given drip interval (Fig. 4). For some locations with drip intervals very sensitive to PCP, these processes may exert comparable magnitude but opposing influence on measured stalagmite δ13C and lead to nearly constant measured δ13C despite significant changes in temperature (Martrat et al., 2007) and vegetation (Goni et al., 2008; Tzedakis et al., 2018). We suggest that such a process may have contributed to the similar average measured δ13C in GUL in late glacial and Holocene time intervals (Fig. 6) and also to the similar glacial and interglacial measured δ13C in GLD (Fig. 7). Both of these stalagmites are characterized by large increases in in the interglacial, indicating significant enhancements of PCP.
For stalagmite GUL growing during the last deglaciation, all of the examined calculations of δ13Cinit yield a temporal pattern more consistent with independent evidence of cooler regional temperatures during the late glacial B/A compared to the early Holocene (Fig. 7) (Martrat et al., 2007; Ausín et al., 2019; Cacho et al., 1999). The aggregate δ13Cinit of both stalagmites spanning TI (GAL and GUL) exhibits a stronger correlation with regional sea surface temperature (SST) than the measured δ13C (Fig. 10).
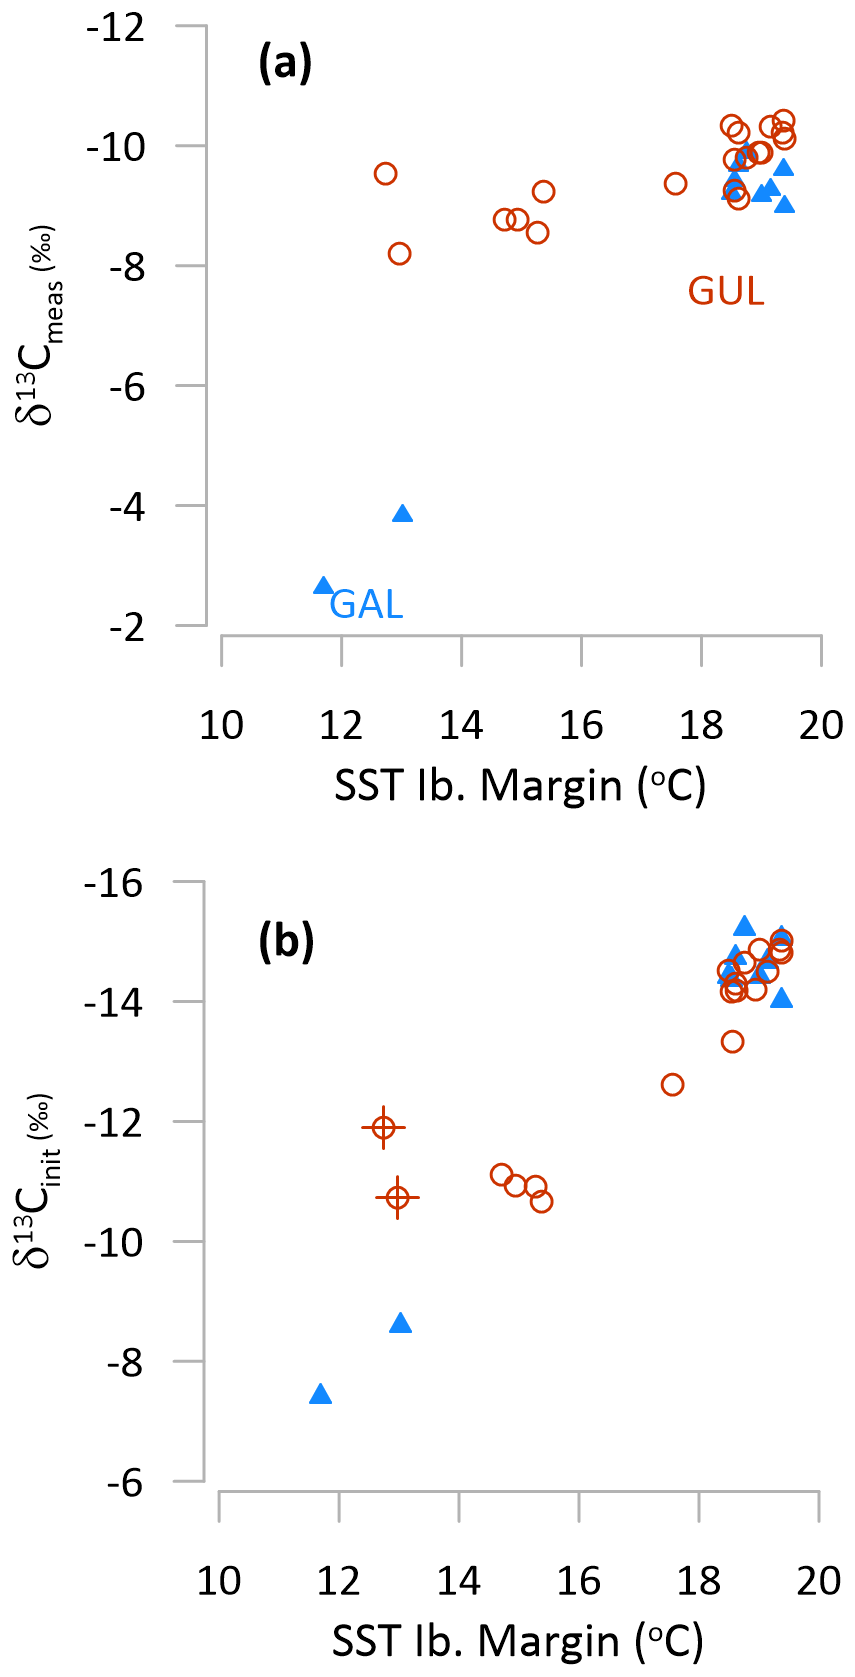
Figure 10Comparison in 500 kyr fixed time bins of (a) measured δ13C and (b) δ13Cinit vs. regional Iberian Margin SST (Cacho et al., 1999) over the last glacial to interglacial transition in GAL (blue triangle) and GUL (red circle). In (b) we show a −8 ‰ degassing slope and scenario A1. Other scenarios for GAL are illustrated in Fig. S5. In (b), crosses denote two samples of age 12.25 and 12.75 ka, for which the offset may reflect uncertainty in the age interpolation as shown in Fig. 8.
Because the extent of degassing and PCP can be strongly conditioned by the drip rate and drip chemistry supplying an individual stalagmite, the extent and temporal variations of PCP may differ significantly among coeval stalagmites, leading to contrasting measured δ13C among coeval stalagmites, even in the case of similar temperature and vegetation forcing of the initial drip water δ13CDIC. Between 94 and 82 ka, the Greenland Stadial (GS) 22 event is a salient cooling feature in regional SST records (Martrat et al., 2007). Yet, only one of the three stalagmites spanning this age range exhibits a clear positive anomaly in measured δ13C: stalagmite GLO, which features stable over this time interval. Stalagmite GAE features a long-term trend towards negative measured δ13C not observed in GLO or ROW, and GAE also features a significant decrease in (Fig. 7). The calculated δ13Cinit of GLO does not alter the trend seen in measured δ13C. However, the δ13Cinit of ROW features the positive anomaly typical of stadial cooling. Significantly, despite the strong long-term trend in measured δ13C, the calculated δ13Cinit of GAE also resolves a positive anomaly consistent with the timing of the GS22 cooling. These more coherent temporal trends are resolved in the three records regardless of the fCa scenario employed.
These results for multiple coeval stalagmites suggest that calculation of δ13Cinit has the potential to improve reproducibility among coeval records and resolve signals of important regional changes in temperature and vegetation effects in the soil and epikarst environment.
5.2 Coherency of quantitative PCP estimations and impact on deconvolving PCP effects in δ13C
5.2.1 Quantitative PCP indicators in this sample set
The calculation of δ13Cinit relies on quantitative estimation of PCP. PCP should exert a similar effect on ratios of divalent cations with low partition coefficients like and Sr Ca. However, many published and Sr Ca records do not exhibit strong positive correlation (Sinclair, 2011). In our dataset, the greater correlation of and Sr Ca in some of the high- stalagmites may reflect the proportionally greater effect of calcite on the DSr in higher- stalagmites (e.g., Wassenburg et al., 2020). A 3-fold reduction in Ca due to PCP is attainable for reasonable degrees of soil pCO2 and drip water saturation in our interglacial climates, and therefore a 3-fold range in or Sr Ca due to PCP is possible. Over a 3-fold range in in low- stalagmites (e.g., 2 to 6 mmol mol−1 ), existing compilations suggest that the DSr increases by 20 %. Yet, for a 3-fold increase in in the high- stalagmites (e.g., 10 to 30 mmol mol−1 ) the DSr would increase by 80 %. Because and δ44Ca are always positively correlated, but Sr Ca and δ44Ca are not positively correlated in all samples, we conclude that growth-rate-driven variations in DSr can strongly overprint the PCP-driven trends in Sr Ca in some stalagmites. For a given fCa, faster growth rates would promote a lower δ44Ca and a higher DSr, fueling inverse correlation. Because Ca and Sr are dominantly bedrock-sourced in this setting, this reversal from the expected PCP relationship cannot be attributed to variable contribution of other element sources but must reflect the operation of processes at the solution–calcite interface. Similarly, deviation of Sr Ca and from the PCP slope, or variation in the Sr Mg ratio, does not conclusively require variation in non-bedrock sources in either element but could reflect partitioning effects which for Sr are decoupled from PCP, as suggested by strong growth rate dependence of Sr partitioning in stalagmites from this cave (Sliwinski et al., 2023).
In our dataset, temperature variation in DMg could explain some, but not all, of the apparent amplification in the -based fCa compared to δ44Ca-based fCa. Significant amplification is observed within the Holocene when temperature variation is limited. Additionally, in many cases the required range in DMg is larger than the 22 % increase predicted from reasonable-amplitude (e.g., <10∘) temperature increases according to laboratory calibrations (Day and Henderson, 2013). One candidate explanation for higher-magnitude changes in DMg may be the up to 2-fold increase in the DMg with increasing calcite (Wassenburg et al., 2020). This effective partitioning increase may reflect true lattice partitioning and/or increased Mg in fluid inclusions. The existing field data do not precisely constrain the slope of this increase in DMg or define if the slope is indeed linear. For future absolute estimation of fCa from , improved constraints on the variation of DMg are required from laboratory and field studies. In field monitoring studies, true variation in DMg can be most accurately determined when observations adequately control for both the initial solution and the integrated water during calcite precipitation, which may be higher than the initial if a significant amount of the Ca is precipitated on the stalagmite from each solution aliquot. Future field monitoring and farmed calcite studies should also evaluate whether calcite fabrics could provide independent evidence of variation in DMg, since some stalagmites show a relationship between fabrics and Sr partitioning (Frisia et al., 2022).
In addition to variation in DMg, temporal changes in the of undegassed drip water could also contribute to discrepancies between fCa from δ44Ca and (e.g., the requirement for AF > 1). We observe only a greater, never lower, magnitude of change than that expected from changes in fCa alone. In the La Vallina Cave system, drip water monitoring shows very constant drip water ratios seasonally despite order of magnitude changes in drip water flow rates (Fig. 12 in Kost et al., 2023b). This suggests that despite variation in water residence times, there is not widespread or significant variation in bedrock mixing fraction.
5.2.2 Suggested approach for fossil stalagmites
is a widely measured PCP-sensitive indicator. However, it can be unreliable in host rocks which feature significant components of widely varying solubility and if the bedrock mixing fraction varies over time. This can produce variation in the initial drip water attained by bedrock dissolution before evolution of drip water by PCP. Large temporal variations in drip water ratios at a single drip during monitoring may be one sign of varying bedrock mixing fraction. can also be unreliable as a PCP indicator if a large fraction of the Mg in the stalagmite is present in detrital minerals rather than in the calcite. Stalagmite which covaries with Al Ca or Si Ca may indicate an important detrital component of Mg. In these two situations, it is not recommended to use for quantitative PCP estimation.
In settings where bedrock mixing fraction is stable and detrital minerals are not a significant source of Mg in the stalagmite, the quantitative estimation of fCa nonetheless entails uncertainty. For stalagmites in which only is measured and δ44Ca is not determined, the constancy or range of variation in DMg will represent one source of uncertainty in the calculation of δ13Cinit. The calculation of fCa from can be adjusted by an attenuation factor as in Eq. (7). An attenuation factor > 1 is likely required if measured leads to calculation of a larger fCa range than expected. For example, fCa<0.20 would require initial drip water Ca concentrations > 100 ppm. If a bedrock adjustment factor in Eq. (7) is used, it may need to be coupled with an attenuation factor (other than 1) so that absolute fCa does not reach values lower than expected for the cave and climatic context. This uncertainty will be reduced as future research better constrains the variation of DMg with .
5.3 What is the magnitude of the PCP+degassing effect on δ13C?
5.3.1 Do interglacial stalagmites constrain the degassing δ13C slope?
For interglacial stalagmites, we can estimate the lowest expected δ13Cinit and use this limit to evaluate the range of reasonable degassing slopes. The δ13CDIC of drip water has been measured under forested sections of the cave, with sample collection techniques to limit degassing (Kost et al., 2023b). From this, we estimate the δ13Cinit for calcite forming under similar drip water δ13CDIC. Additionally, we hypothesize that pre-anthropogenic land use at this location would have led to soil pCO2 in the 8000 to 10 000 ppm range during the mid-Holocene and previous interglacials (Lechleitner et al., 2021). We therefore calculate the composition of calcite forming from DIC in equilibrium with open-system dissolution (e.g., 150 L gas volume and resulting 3 % dead carbon percentage) of limestone by 10 000 ppm soil CO2 of isotopic composition corresponding to modern respired end-members in three ecosystems (Pataki et al., 2003) (Fig. 6).
We find that interglacial stalagmites cannot rule out any of the investigated degassing slopes. The stalagmites from our monitored cave which include long Holocene growth phases are GAL and GUL, which require low to moderate attenuation factors (1.3 to 3) for calculation of fCa from . When the fCa calculated from includes the estimated AF for coherency with δ44Ca as in Table 2, then the −8 ‰ slope for all GUL and GAL samples falls within the range of calcite composition expected from modern drip water with limited degassing (Fig. 6). With the −11 ‰ slope, the median δ13Cinit approaches −17 ‰, which, although higher than modern drip water predictions, is still compatible with DIC derived from equilibration with respired CO2 from temperate broadleaf and conifer ecosystems (Pataki et al., 2003). With the −5 ‰ slope, the median δ13Cinit is slightly below that implied for calcite on the basis of modern monitoring. Results for stalagmites spanning the last interglacial also indicate that the −8 ‰ to −11 ‰ slopes yield δ13Cinit coherent with expected interglacial calcite. BEL, which requires little attenuation, best matches expected range with −11 ‰. But, our comparison does reveal that unreasonable corrections which are more negative than expected for the respired CO2 component result from the combination of the −11 ‰ degassing slope and fCa calculated from measured without the use of AF (scenario “full”) for some low- stalagmites.
A similar analysis for the Holocene Heshang Cave, for which both and fCa data are available, yields δ13Cinit with the −5 ‰ slope of −12 ‰ and with the −11 ‰ slope δ13Cinit of −15 ‰, both within the range of calcite composition expected from high-CO2 soils with respired CO2 composition from temperature broadleaf or tropical ecosystems (Pataki et al., 2003) (Fig. 6), consistent with the C3 evergreen broadleaf vegetation overlying Heshang Cave (Li et al., 2014).
Thus, the available interglacial datasets so far do not preclude the kinetically enhanced slope of −11 ‰ for fractionation during degassing and PCP. In fact, for the last interglacial, for many stalagmites, the higher slopes yield δ13Cinit more consistent with expected interglacial soil pCO2. Although the degree of open vs. closed dissolution cannot be inferred for last interglacial samples, if it is in the range of Holocene and late glacial samples from this and nearby caves (Lechleitner et al., 2021), the δ13Cinit is not expected to differ by more than 1 ‰from that calculated for the relatively open 10 000 ppm soil CO2 CaveCalc model.
5.3.2 Previous laboratory and field calibrations
The CaveCalc simulation assumes that the loss of carbon from drip water is attained via CO2 degassing and calcite precipitation in a 1:1 ratio, with close coupling of the processes, and that fractionation is occurring at equilibrium according to laboratory-estimated fractionation factors. Empirical laboratory and field results are sensitive to true degassing and PCP as well as the isotopic consequences of exchange between drip water and cave atmosphere. We are aware of one published field study in which drip water was sampled before and after a ∼3 m transit across a subvertical flowstone surface in a cave with average temperature of 22.5 ∘C (Mickler et al., 2019). In this transect, Ca and DIC were directly measured and δ13C DIC was determined from total evolution as CO2 in flushed vials. Ca concentrations were on average 20 % lower after the ISST flowstone transit, and the median estimated degassing slope was −9.9 ‰ in the eight monthly paired samples. The slopes estimated on individual sampling dates (ranging from −7.7 to −13.7) did not correlate with drip water oversaturation or the estimated ratio of Ca to DIC decrease on those dates. The slope in this study is more than double that of CaveCalc at comparable temperatures. One interpretation is that the rapid initial phases of degassing occur at kinetically enhanced fractionation factors (Mickler et al., 2019). A similar experiment conducted on one day in La Vallina Cave was also consistent with a slope of −11 ‰based on sampling at a cave temperature of 12 ∘C and modest saturation (55 ppm Ca in drip water vs. 21 ppm for equilibrium at cave temperature and pCO2 ppm) (Kost et al., 2023b). During this sampling, cave air was ventilated to nearly atmospheric CO2 concentrations and isotopic composition. These laboratory and field results suggest that, given current available data, the CaveCalc slopes may need to be considered the minimum slopes required to correct for degassing and PCP effects on carbon isotopes.
The laboratory experiment best simulating the coupled evolution of δ13C DIC, calcite δ13C, and fCa allowed highly supersaturated solutions to degas and precipitate CaCO3 as they flowed along a marble plate, with electrical conductivity measurements estimating the degree of Ca depletion along the flow path in a parallel experimental setup with flow over a glass plate (Hansen et al., 2019). The δ13C of DIC was measured by precipitation in SrCO3 and analysis as solid phase. The slope A in the 10 experiments, based on the evolution of δ13C of DIC, ranged from −4.63 ‰ to −13.2 ‰or from −5.9 ‰ to −16 ‰ based on evolution of δ13C of calcite, although precise estimation of the latter slope is complicated by the measurement of precipitated calcite δ13C and conductivity in separate experimental setups which may have experienced slightly different locations of calcite precipitation (Sade et al., 2022). Many of these estimated experimental fractionations are considerably higher than those predicted by CaveCalc.
A dynamical model (Sade et al., 2022) was developed to simulate the laboratory experiments (Hansen et al., 2019). This model derived a single relationship between PCP and DIC evolution using fDIC in contrast to our calculated index based on Ca consumption, fCa. In this model formulation, the degassing slope relative to ln (fDIC) averages −8.7 ‰ from f=1.0 to f=0.3, but the slope is not constant. Rather, at fDIC between 0.8 and 1, there is an inverse slope as net DIC evolution is modeled to lead to more negative, rather than more positive, δ13C of speleothem calcite. Over the subsequent phase of PCP (fDIC 0.8 to 0.3), the average modeled degassing slope relative to fDIC would be −10.1 ‰; however, it flattens to −4 ‰ in the range of fDIC 0.33 to 0.4. If this model is representative of cave flowstone formation, it may suggest that some of the calculated differences in degassing slopes in field experiments may result from measurements of solutions sampled in different stages of drip water Ca and DIC evolution. Alternatively, it is possible that some differences in degassing slopes reflect different degrees of coupling between degassing and CaCO3 precipitation. The influence of factors inhibiting CaCO3 precipitation, potentially including elevated Mg concentrations or certain dissolved organic compounds, on the degassing slope remains to be investigated.
If there were significant variations in the degassing slope experienced by a given stalagmite over time, it could complicate efforts to estimate trends in δ13Cinit using Eq. (2). Yet, our speleothem time series are broadly consistent with the narrow range of variation of degassing slope within a given stalagmite, since correction of −5 ‰ in one part of the time series and −11 ‰ in another would alter the trends and reduce coherence among the records in Fig. 7. This coherence with a single slope may reflect the limited range of variation in fCa inferred for our stalagmites. For example, for all stalagmites except GAE, the A2 scenarios and the majority of data from A3 scenarios fall between fCa of 0.4 and 0.8. If coincident with fDIC of 0.4 to 0.8, these samples would all be within the range of similar slope (−10 ‰ to −11.5 ‰) predicted by the dynamical model simulation. Sampled stalagmite growth may often be biased to periods when fCa>0.4, which lead to higher precipitation rates and more calcite deposition. The consistency of our interglacial data with steeper degassing slopes than CaveCalc may reflect the reality that much calcite precipitation will happen when cave pCO2 is much lower than drip water pCO2, a situation in which drip water exchange with isotopically heavier cave air could be a significant contributor to a steep degassing slope.
A future calculation of the dynamical model prediction (Sade et al., 2022) of δ13C evolution relative to fCa, rather than fDIC, as a PCP indicator would provide a helpful reference for future calculation of δ13Cinit. This could elucidate whether a nonlinear relationship should be used to calculate δ13Cinit from ln (fCa) and δ13Cmeas. It would clarify if calcite precipitated at high fCa, analogous to that precipitated at high fDIC, should be excluded from the correction because of compensating effects of kinetic fractionation factors and evolution of fCa in the range of high fCa. Scenarios employing a B≤0.8 by default have a maximum fCa largely outside the range of inverse slope.
5.3.3 Suggested approach
Trends in δ13Cinit are less sensitive to the choice of the degassing slope but the absolute value of δ13Cinit is strongly dependent on the choice of degassing slope. At the moment, the absolute δ13Cinit can be reconstructed with low confidence. However, the reconstructed δ13Cinit can be used to rule out combinations of fCa scenarios and degassing slopes which lead to “overcorrection” to δ13Cinit values which are more negative than DIC equilibrated with a reasonable respired soil pCO2 composition for the ecosystem type. Until further constraints to assess the slope of δ13C and Ca co-evolution during degassing and PCP which characterizes typical cave environments are available, a sensitivity analysis employing a range of degassing slopes will provide the greatest transparency for assessing δ13Cinit.
We provide a first analysis of the potential estimation of speleothem δ13Cinit, the δ13C which characterized drip water DIC prior to significant degassing and PCP. δ13Cinit is proposed as a useful interpretable variable derived from speleothem isotope measurements because trends in δ13Cinit are expected to be more reproducible than measured δ13C among coeval stalagmites from a given region and because δ13Cinit is more sensitive to the vegetation, soil, and epikarst processes which in many regions may be sensitive to temperature in addition to moisture. Calculation of δ13Cinit for a given sample or growth increment requires a quantitative indicator of the extent of PCP experienced in that growth increment and knowledge of the general rate of change in δ13C with progressive degassing and PCP.
In fossil stalagmites, the extent of PCP, as the Rayleigh fCa, can be approximated for a particular growth increment using the measured and the minimum measured in the entire stalagmite. fCa can also be estimated from δ44Ca given reasonable choices of the calcite dissolved fractionation factor. In several of the stalagmites examined here, the fCa calculated from shows an amplified range compared to that calculated from δ44Ca. An increase in DMg with increasing , as proposed in previous studies (Wassenburg et al., 2020), is one viable explanation for this systematic trend. This observation warrants further investigation to improve confidence in future estimates of fCa from , which is the most widely available PCP indicator for stalagmites.
At the moment, there is uncertainty in the degassing slope or rate of change in δ13C with progressive degassing and PCP. Values may range from −5 ‰ to −11 ‰. The stalagmites investigated here could be consistent with any value in this range. Because these different possible degassing slopes affect the absolute value of the calculate δ13Cinit, currently there is uncertainty in the exact value. However, the trends in δ13Cinit are less sensitive to the choice of degassing slope.
Despite these uncertainties, δ13Cinit provides more consistent time series among coeval stalagmites and with regional climate records. In one example δ13Cinit reconciles three divergent measured stalagmite δ13C records in the 94 to 82 ka time interval, yielding three δ13Cinit time series which feature a pronounced positive anomaly corresponding to the regional cooling of Greenland Stadial 22. In western Europe, over the warming trend of deglaciations, the trend towards more negative δ13CDIC due to higher soil respiration and soil CO2 may be fully or partially compensated for in stalagmite δ13C due to the increased PCP from the more oversaturated drip waters. The calculation of δ13Cinit reveals the trend of increasing respiration rates and soil pCO2. Over the last deglaciation, the δ13Cinit matches the millennial structure in regional SST more closely than the measured δ13C.
As better constraints emerge on the degassing slope and on Mg partitioning, δ13Cinit estimates will become more precise and should improve the utility of the high volume of stalagmite δ13C measurements made simultaneously with δ18O in all labs.
Table A1Measured δ44Ca, , and Sr Ca, as well as the calculated fCa for differing Δ44Ca and B (bedrock factors).
Data and sample Excel sheets for calculations are archived in the ETH Research Collection at https://doi.org/10.3929/ethz-b-000630754 (Stoll et al., 2023).
The supplement related to this article is available online at: https://doi.org/10.5194/cp-19-2423-2023-supplement.
HMS conceived the study, conducted calculations, prepared figures, and wrote the text in discussion with CD and FL. CD completed Ca isotope measurements. FL and LE conducted CaveCalc simulations. OK and JS assisted with trace element analysis and sampling for Ca isotopes and dating. DS contributed to interpretation. HC and CPM completed new chronology.
The contact author has declared that none of the authors has any competing interests.
Publisher's note: Copernicus Publications remains neutral with regard to jurisdictional claims made in the text, published maps, institutional affiliations, or any other geographical representation in this paper. While Copernicus Publications makes every effort to include appropriate place names, the final responsibility lies with the authors.
Heather M. Stoll acknowledges ETH core funding and grant ETH-13 18-1. Franziska Lechleitner was supported by SNSF grant P400P2_180789. Chris Day and Ca isotope measurements were supported by the John Fell Oxford University Press Research Fund under grant 0007911. Franziska Lechleitner was supported by SNSF grant P400P2_180789. Carlos Pérez-Mejías and Hai Cheng acknowledge the NSFC (41888101, 42050410317) and Postdoctoral Science Foundation of China (2020M683452). We thank the ETH Climate Geology lab manager Madalina Jaggi and student assistants Tim Loeffel and Romain Alosius for assistance with stable isotope and trace element sampling. We thank the ETH fall 2021 paleoclimate course students and course assistant Pien Anjewierden for preparing samples from GLD, as well as fall 2019 paleoclimate course students for initiating the study of GUL.
This research has been supported by the Eidgenössische Technische Hochschule Zürich (grant no. ETH-13 18-1), the Schweizerischer Nationalfonds zur Förderung der Wissenschaftlichen Forschung (grant no. P400P2_180789), and the National Natural Science Foundation of China (grant nos. 41888101, 42050410317, and 2020M683452).
This paper was edited by Dominik Fleitmann and reviewed by two anonymous referees.
Alkhatib, M., Qutob, M., Alkhatib, S., and Eisenhauer, A.: Influence of precipitation rate and temperature on the partitioning of magnesium and strontium in calcite overgrowths, Chem. Geol., 599, 120841, https://doi.org/10.1016/j.chemgeo.2022.120841, 2022.
Ausín, B., Magill, C., Haghipour, N., Fernández, Á., Wacker, L., Hodell, D., Baumann, K.-H., and Eglinton, T. I.: (In) coherent multiproxy signals in marine sediments: Implications for high-resolution paleoclimate reconstruction, Earth Planet. Sc. Lett., 515, 38–46, 2019.
Breitenbach, S. F. and Bernasconi, S. M.: Carbon and oxygen isotope analysis of small carbonate samples (20 to 100 µg) with a GasBench II preparation device, Rapid Commun. Mass Spectrom., 25, 1910–1914, 2011.
Cacho, I., Grimalt, J. O., Pelejero, C., Canals, M., Sierro, F. J., Flores, J. A., and Shackleton, N.: Dansgaard-Oeschger and Heinrich event imprints in Alboran Sea paleotemperatures, Paleoceanography, 14, 698–705, 1999.
Day, C. C. and Henderson, G. M.: Controls on trace-element partitioning in cave-analogue calcite, Geochim. Cosmochim. Ac., 120, 612–627, 2013.
DePaolo, D. J.: Surface kinetic model for isotopic and trace element fractionation during precipitation of calcite from aqueous solutions, Geochim. Cosmochim. Ac., 75, 1039–1056, https://doi.org/10.1016/j.gca.2010.11.020, 2011.
de Wet, C. B., Erhardt, A. M., Sharp, W. D., Marks, N. E., Bradbury, H. J., Turchyn, A. V., Xu, Y., and Oster, J. L.: Semiquantitative estimates of rainfall variability during the 8.2 kyr event in California using speleothem calcium isotope ratios, Geophys. Res. Lett., 48, e2020GL089154, https://doi.org/10.1029/2020GL089154, 2021.
Dorale, J. A. and Liu, Z.: Limitations of Hendy test criteria in judging the paleoclimatic suitability of speleothems and the need for replication, J. Cave Karst Stud., 71, 73–80, 2009.
Emrich, K., Ehhalt, D., and Vogel, J.: Carbon isotope fractionation during the precipitation of calcium carbonate, Earth Planet. Sc. Lett., 8, 363–371, 1970.
Fairchild, I. J. and Treble, P. C.: Trace elements in speleothems as recorders of environmental change, Quaternary Sci. Rev., 28, 449–468, 2009.
Frisia, S., Borsato, A., Hartland, A., Faraji, M., Demeny, A., Drysdale, R. N., and Marjo, C. E.: Crystallization pathways, fabrics and the capture of climate proxies in speleothems: Examples from the tropics, Quaternary Sci. Rev., 297, 107833, https://doi.org/10.1016/j.quascirev.2022.107833, 2022.
Genty, D., Blamart, D., Ouahdi, R., Gilmour, M., Baker, A., Jouzel, J., and Van-Exter, S.: Precise dating of Dansgaard–Oeschger climate oscillations in western Europe from stalagmite data, Nature, 421, 833–837, 2003.
Genty, D., Blamart, D., Ghaleb, B., Plagnes, V., Causse, C., Bakalowicz, M., Zouari, K., Chkir, N., Hellstrom, J., and Wainer, K.: Timing and dynamics of the last deglaciation from European and North African δ13C stalagmite profiles – comparison with Chinese and South Hemisphere stalagmites, Quaternary Sci. Rev., 25, 2118–2142, 2006.
Goni, M. F. S., Landais, A., Fletcher, W. J., Naughton, F., Desprat, S., and Duprat, J.: Contrasting impacts of Dansgaard–Oeschger events over a western European latitudinal transect modulated by orbital parameters, Quaternary Sci. Rev., 27, 1136–1151, 2008.
Hansen, M., Scholz, D., Froeschmann, M.-L., Schöne, B. R., and Spötl, C.: Carbon isotope exchange between gaseous CO2 and thin solution films: Artificial cave experiments and a complete diffusion-reaction model, Geochim. Cosmochim. Ac., 211, 28–47, 2017.
Hansen, M., Scholz, D., Schöne, B. R., and Spötl, C.: Simulating speleothem growth in the laboratory: Determination of the stable isotope fractionation (δ13C and δ18O) between H2O, DIC and CaCO3, Chem. Geol., 509, 20–44, 2019.
Hendy, C. H.: The isotopic geochemistry of speleothems – I. The calculation of the effects of different modes of formation on the isotopic composition of speleothems and their applicability as palaeoclimatic indicators, Geochim. Cosmochim. Ac., 35, 801–824, https://doi.org/10.1016/0016-7037(71)90127-X, 1971.
Hippler, D., Schmitt, A. D., Gussone, N., Heuser, A., Stille, P., Eisenhauer, A., and Nägler, T. F.: Calcium isotopic composition of various reference materials and seawater, Geostand. Newslett., 27, 13–19, 2003.
Hofmann, A. E., Bourg, I. C., and DePaolo, D. J.: Ion desolvation as a mechanism for kinetic isotope fractionation in aqueous systems, P. Natl. Acad. Sci. USA, 109, 18689–18694, 2012.
Kost, O., Sliwinski, J., Gies, N., Lueder, M., and Stoll, H. M.: The influence of fluid inclusions, organics, and calcite fabric on trace element distributions in stalagmites, Front. Earth Sci., 202311, 1240888, https://doi.org/10.3389/feart.2023.1240888, 2023a.
Kost, O., Gonzalez Lemos, S., Rodriguez-Rodriguez, L., Sliwinski, J., Endres, L., Haghipour, N., and Stoll, H. M.: Relationship of seasonal variations in drip water δ13CDIC, δ18O, and trace elements with surface and physical cave conditions of La Vallina cave, NW Spain, Hydrol. Earth Syst. Sci., 27, 2227–2255, https://doi.org/10.5194/hess-27-2227-2023, 2023b.
Lechleitner, F. A., Day, C. C., Kost, O., Wilhelm, M., Haghipour, N., Henderson, G. M., and Stoll, H. M.: Stalagmite carbon isotopes suggest deglacial increase in soil respiration in western Europe driven by temperature change, Clim. Past, 17, 1903–1918, https://doi.org/10.5194/cp-17-1903-2021, 2021.
Li, X., Hu, C., Huang, J., Xie, S., and Baker, A.: A 9000-year carbon isotopic record of acid-soluble organic matter in a stalagmite from Heshang Cave, central China: Paleoclimate implications, Chem. Geol., 388, 71–77, 2014.
Li, X., Cui, X., He, D., Liao, J., and Hu, C.: Evaluation of the Heshang Cave stalagmite calcium isotope composition as a paleohydrologic proxy by comparison with the instrumental precipitation record, Sci. Rep., 8, 1–7, 2018.
Lorens, R. B.: Sr, Cd, Mn and Co distribution coefficients in calcite as a function of calcite precipitation rate, Geochim. Cosmochim. Ac., 45, 553–561, 1981.
Magiera, M., Lechleitner, F. A., Erhardt, A. M., Hartland, A., Kwiecien, O., Cheng, H., Bradbury, H. J., Turchyn, A. V., Riechelmann, S., and Edwards, L.: Local and regional Indian summer monsoon precipitation dynamics during Termination II and the Last Interglacial, Geophys. Res. Lett., 46, 12454–12463, 2019.
Martrat, B., Grimalt, J. O., Shackleton, N. J., de Abreu, L., Hutterli, M. A., and Stocker, T. F.: Four climate cycles of recurring deep and surface water destabilizations on the Iberian margin, Science, 317, 502–507, 2007.
Meyer, K. W., Feng, W., Breecker, D. O., Banner, J. L., and Guilfoyle, A.: Interpretation of speleothem calcite δ13C variations: Evidence from monitoring soil CO2, drip water, and modern speleothem calcite in central Texas, Geochim. Cosmochim. Ac., 142, 281–298, 2014.
Mickler, P. J., Banner, J. L., Stern, L., Asmerom, Y., Edwards, R. L., and Ito, E.: Stable isotope variations in modern tropical speleothems: evaluating equilibrium vs. kinetic isotope effects, Geochim. Cosmochim. Ac., 68, 4381–4393, 2004.
Mickler, P. J., Stern, L. A., and Banner, J. L.: Large kinetic isotope effects in modern speleothems, Geol. Soc. Am. Bull., 118, 65–81, 2006.
Mickler, P. J., Carlson, P., Banner, J. L., Breecker, D. O., Stern, L., and Guilfoyle, A.: Quantifying carbon isotope disequilibrium during in-cave evolution of drip water along discreet flow paths, Geochim. Cosmochim. Ac., 244, 182–196, 2019.
Mills, J. V., DePaolo, D. J., and Lammers, L. N.: The influence of Ca:CO3 stoichiometry on Ca isotope fractionation: Implications for process-based models of calcite growth, Geochim. Cosmochim. Ac., 298, 87–111, 2021.
Mook, W. and Rozanski, K. Environmental isotopes in the hydrolgoical cycle, Principles and Applications, International Hydrological Program V 1 Technical Documents in Hydrology 1 No. 39, Vol. I, IV, and VI, UNESCO, Paris, 2001.
Mucci, A. and Morse, J. W.: The incorporation of Mg2+ and Sr2+ into calcite overgrowths: influences of growth rate and solution composition, Geochim. Cosmochim. Ac., 47, 217–233, 1983.
Mühlinghaus, C., Scholz, D., and Mangini, A.: Modelling stalagmite growth and δ13C as a function of drip interval and temperature, Geochim. Cosmochim. Ac., 71, 2780–2790, 2007.
Mühlinghaus, C., Scholz, D., and Mangini, A.: Modelling fractionation of stable isotopes in stalagmites, Geochim. Cosmochim. Ac., 73, 7275–7289, 2009.
Nielsen, L. C., De Yoreo, J. J., and DePaolo, D. J.: General model for calcite growth kinetics in the presence of impurity ions, Geochim. Cosmochim. Ac., 115, 100–114, 2013.
Noronha, A. L., Johnson, K. R., Hu, C., Ruan, J., Southon, J. R., and Ferguson, J. E.: Assessing influences on speleothem dead carbon variability over the Holocene: implications for speleothem-based radiocarbon calibration, Earth Planet. Sc. Lett., 394, 20–29, 2014.
Owen, R., Day, C., Hu, C.-Y., Liu, Y.-H., Pointing, M., Blättler, C., and Henderson, G.: Calcium isotopes in caves as a proxy for aridity: Modern calibration and application to the 8.2 kyr event, Earth Planet. Sc. Lett., 443, 129–138, 2016.
Owen, R., Day, C. C., and Henderson, G. M.: CaveCalc: A new model for speleothem chemistry & isotopes, Comput. Geosci., 119, 115–122, 2018.
Pataki, D., Ehleringer, J., Flanagan, L., Yakir, D., Bowling, D., Still, C., Buchmann, N., Kaplan, J. O., and Berry, J.: The application and interpretation of Keeling plots in terrestrial carbon cycle research, Global Biogeochem. Cy., 17, 1022, https://doi.org/10.1029/2001GB001850, 2003.
Polag, D., Scholz, D., Mühlinghaus, C., Spötl, C., Schröder-Ritzrau, A., Segl, M., and Mangini, A.: Stable isotope fractionation in speleothems: Laboratory experiments, Chem. Geol., 279, 31–39, https://doi.org/10.1016/j.chemgeo.2010.09.016, 2010.
Reynard, L., Day, C., and Henderson, G.: Large fractionation of calcium isotopes during cave-analogue calcium carbonate growth, Geochim. Cosmochim. Ac., 75, 3726–3740, 2011.
Romanek, C. S., Grossman, E. L., and Morse, J. W.: Carbon isotopic fractionation in synthetic aragonite and calcite: effects of temperature and precipitation rate, Geochim. Cosmochim. Ac., 56, 419–430, 1992.
Romanov, D., Kaufmann, G., and Dreybrodt, W.: Modeling stalagmite growth by first principles of chemistry and physics of calcite precipitation, Geochim. Cosmochim. Ac., 72, 423–437, 2008.
Romero-Mujalli, G., Hartmann, J., Börker, J., Gaillardet, J., and Calmels, D.: Ecosystem controlled soil-rock pCO2 and carbonate weathering – Constraints by temperature and soil water content, Chem. Geol., 527, 118634, https://doi.org/10.1016/j.chemgeo.2018.01.030, 2019.
Rubinson, M. and Clayton, R. N.: Carbon-13 fractionation between aragonite and calcite, Geochim. Cosmochim. Ac., 33, 997–1002, 1969.
Sade, Z., Hegyi, S., Hansen, M., Scholz, D., and Halevy, I.: The effects of drip rate and geometry on the isotopic composition of speleothems: Evaluation with an advection-diffusion-reaction model, Geochim. Cosmochim. Ac., 317, 409–432, 2022.
Scholz, D., Mühlinghaus, C., and Mangini, A.: Modelling δ13C and δ18O in the solution layer on stalagmite surfaces, Geochim. Cosmochim. Ac., 73, 2592–2602, 2009.
Sinclair, D. J.: Two mathematical models of Mg and Sr partitioning into solution during incongruent calcite dissolution: implications for dripwater and speleothem studies, Chem. Geol., 283, 119–133, 2011.
Sinclair, D. J., Banner, J. L., Taylor, F. W., Partin, J., Jenson, J., Mylroie, J., Goddard, E., Quinn, T., Jocson, J., and Miklavič, B.: Magnesium and strontium systematics in tropical speleothems from the Western Pacific, Chem. Geol., 294, 1–17, 2012.
Sliwinski, J., Kost, O., Endres, L., Iglesias, M., Haghipour, N., González-Lemos, S., and Stoll, H.: Exploring soluble and colloidally transported trace elements in stalagmites: The strontium-yttrium connection, Geochim. Cosmochim. Ac., 343, 64–83, 2023.
Sliwinski, J. T. and Stoll, H. M.: Combined fluorescence imaging and LA-ICP-MS trace element mapping of stalagmites: Microfabric identification and interpretation, Chem. Geol., 581, 120397, https://doi.org/10.1016/j.chemgeo.2021.120397, 2021.
Stoll, H., Mendez-Vicente, A., Gonzalez-Lemos, S., Moreno, A., Cacho, I., Cheng, H., and Edwards, R. L.: Interpretation of orbital scale variability in mid-latitude speleothem δ18O: Significance of growth rate controlled kinetic fractionation effects, Quaternary Sci. Rev., 127, 215–228, 2015.
Stoll, H. M., Müller, W., and Prieto, M.: I-STAL, a model for interpretation of , Sr/Ca and Ba/Ca variations in speleothems and its forward and inverse application on seasonal to millennial scales, Geochem. Geophy. Geosy., 13, Q09004, https://doi.org/10.1029/2012gc004183, 2012.
Stoll, H. M., Moreno, A., Mendez-Vicente, A., Gonzalez-Lemos, S., Jimenez-Sanchez, M., Dominguez-Cuesta, M. J., Edwards, R. L., Cheng, H., and Wang, X.: Paleoclimate and growth rates of speleothems in the northwestern Iberian Peninsula over the last two glacial cycles, Quatern. Res., 80, 284–290, https://doi.org/10.1016/j.yqres.2013.05.002, 2013.
Stoll, H. M., Cacho, I., Gasson, E., Sliwinski, J., Kost, O., Moreno, A., Iglesias, M., Torner, J., Perez-Mejias, C., and Haghipour, N.: Rapid northern hemisphere ice sheet melting during the penultimate deglaciation, Nat. Commun., 13, 1–16, 2022.
Stoll, H. M., Day, C., Lechleitner, F., Kost, O., Endres, L., Sliwinski, J., Pérez-Mejías, C., Cheng, H., and Scholz, D.: Distinguishing the combined vegetation and soil component of δ13C variation in speleothem records from subsequent degassing and prior calcite precipitation effects, ETH Zürich [data set], https://doi.org/10.3929/ethz-b-000630754, 2023.
Tang, J., Köhler, S. J., and Dietzel, M.: Sr2+/Ca2+ and 44Ca/40Ca fractionation during inorganic calcite formation: I. Sr incorporation, Geochim. Cosmochim. Ac., 72, 3718–3732, 2008a.
Tang, J., Dietzel, M., Böhm, F., Köhler, S. J., and Eisenhauer, A.: Sr2+/Ca2+ and 44Ca/40Ca fractionation during inorganic calcite formation: II. Ca isotopes, Geochim. Cosmochim. Ac., 72, 3733–3745, 2008b.
Tesoriero, A. J. and Pankow, J. F.: Solid solution partitioning of Sr2+, Ba2+, and Cd2+ to calcite, Geochim. Cosmochim. Ac., 60, 1053–1063, 1996.
Tremaine, D. M. and Froelich, P. N.: Speleothem trace element signatures: a hydrologic geochemical study of modern cave dripwaters and farmed calcite, Geochim. Cosmochim. Ac., 121, 522–545, 2013.
Tzedakis, P., Drysdale, R. N., Margari, V., Skinner, L. C., Menviel, L., Rhodes, R. H., Taschetto, A. S., Hodell, D. A., Crowhurst, S. J., and Hellstrom, J. C.: Enhanced climate instability in the North Atlantic and southern Europe during the Last Interglacial, Nat. Commun., 9, 4235, https://doi.org/10.1038/s41467-018-06683-3, 2018.
Wassenburg, J. A., Riechelmann, S., Schröder-Ritzrau, A., Riechelmann, D. F., Richter, D. K., Immenhauser, A., Terente, M., Constantin, S., Hachenberg, A., and Hansen, M.: Calcite Mg and Sr partition coefficients in cave environments: Implications for interpreting prior calcite precipitation in speleothems, Geochim. Cosmochim. Ac., 269, 581–596, 2020.