the Creative Commons Attribution 4.0 License.
the Creative Commons Attribution 4.0 License.
 | 10 Nov 2023
Precipitation reconstructions for Paris based on the observations by Louis Morin, 1665–1713 CE
Thomas Pliemon
Ulrich Foelsche
Christian Rohr
Christian Pfister
This paper presents a precipitation reconstruction that is based on the continuous observations by Louis Morin in Paris from 1665–1713. Morin usually recorded precipitation intensity and duration three times each day (sometimes up to six times) when it snowed or rained. The continuity of his observations can be calculated considering all measurements and observations (e.g., temperature, cloud cover), where on 98.7 % of all days between February 1665 and July 1713 at least one entry per day is noted. To convert these observations to common units, we calibrated them with a multiplicative interacting model using Philippe and Gabriele-Philippe de la Hire's instrumental measurements from Paris. The two series of measurements by de la Hire (father and son) and observations by Morin overlap from 1688–1713. To test the quality of the reconstruction, we analyzed it with the de la Hire's measurements, proxy data, an internal analysis of Morin's measurements of different climate variables, and modern data. Thus, we assess the reliability of the precipitation reconstructions based on Morin's data as follows. We have moderate confidence regarding the exact quantities of daily, seasonal, and annual precipitation totals. We have low confidence regarding exceptionally high precipitation amounts, but we have high confidence in the indices of an impact analysis (i.e., dry days, wet days, consecutive dry days, consecutive wet days); in monthly frequencies of rainfall; and in interannual, interseasonal, and interdecadal variability. Rainy seasons with precipitation totals greater than 250 mm occurred in MAM 1682, JJA 1682, SON 1687, JJA 1697, and JJA 1703. Furthermore, compared to other DJF seasons, the winter of 1666/1667 slightly stands out with a precipitation total of 214.6 mm. Dry seasons with precipitation totals less than 60 mm occurred in SON 1669, DJF 1671/1672, and DJF 1690/1691. An impact analysis shows no abnormalities regarding consecutive dry days or wet days in MAM. In JJA a longer dry period of 31 days appeared in 1686 and a dry period of 69 d appeared in DJF 1671/1672.
- Article
(4551 KB) - Full-text XML
- BibTeX
- EndNote


Precipitation and temperature are the most straightforward climatic elements that affect human economies and terrestrial ecosystems. The interest in climatic data from previous centuries results, on the one hand, from the simple interest to describe the climate in the past and, on the other hand and more importantly, from the desire to analyze climate variability and extremes in the context of climate change. Given that precipitation is far more spatially variable than temperature, a higher density of stations and measurements is needed to assess historical precipitation patterns. The history of rain gauge measurements is extensive. The first known references date back to India in the fourth century BCE and Palestine in the second century BCE (Strangeways, 2010). The rain gauge was practically unknown in Europe until Benedetto Castelli “invented” the rain gauge in 1639 (Camuffo, 2018; Camuffo et al., 2020). However, most precipitation stations were only set up in the twentieth century. Even in Europe and the United States relatively few long instrumental series exist prior to 1850 (e.g., Auer et al., 2001; Wigley et al., 1984; Camuffo, 1984; Slonosky, 2002; Murphy et al., 2018; Brönnimann et al., 2019; Camuffo et al., 2019, 2020; Lundstad et al., 2023). This shortage may be connected to the fact that rain gauges, unlike thermometers and barometers, were not standardized and manufactured in large quantities in the eighteenth and early nineteenth centuries (Gimmi et al., 2007).
As a consequence of this scarcity of continuous measurements of precipitation in the early instrumental period, the EU IMPROVE (Improved Understanding of Past Climatic Variability from Early Daily European Instrumental Sources) project aimed to improve our knowledge of past climatic variability from early daily instrumental sources but only focused on air pressure and air temperature (Gimmi et al., 2007), and it did not include early instrumental precipitation series (Camuffo and Jones, 2002). Little is known about precipitation patterns in the “Little Ice Age” or even in the period prior to a substantial anthropogenic forcing in the 20th century (Bradley and Jones, 1993; Lean et al., 1995; Mann et al., 1998). Thus, to achieve a higher density of precipitation data, spatially as well as temporally, more methods were developed to reconstruct past variations of precipitation. A general distinction is made between archives of nature (nature-generated data) and archives of societies (anthropogenic data) (White et al., 2018). For instance, apart from instrumental measurements, the former include dendroclimatic or lake sediments data (e.g., Rinne et al., 2013; Labuhn et al., 2016a). The latter include data of weather chronicles, weather diaries, ship logbooks, weather reports, agricultural production, snow cover, or floods (e.g., Pfister et al., 1999; Wheeler and Suarez-Dominguez, 2006; Rohr, 2006; Glaser, 2008; Wheeler et al., 2010; Rohr, 2013; Dobrovolný et al., 2015; Brázdil et al., 2016, 2018). Digitization of a large number of historical weather observations from archival sources becomes possible through data recovery by citizen scientists (Hawkins et al., 2023).
Louis Morin from Paris recorded daily, eyewitness observations of quantitative values for precipitation amount and intensity. Consequently, his records count as narrative observations or, more accurately, as a weather diary. Therefore, Louis Morin's narrative data of precipitation are of great interest because he consistently recorded precipitation and other meteorological variables three times a day from 1665 to 1713 (Legrand and Le Goff, 1987; Pfister and Bareiss, 1994; Pliemon et al., 2022). Some years (1688–1713, except 1691, 1692, 1697, and 1698) overlap with the instrumental measurements by Philippe de la Hire and his son Gabriel-Philippe in Paris, but these are available only at monthly resolution (Slonosky, 2002). To our knowledge, only Pfister and Bareiss (1994) dealt with Morin's precipitation notes and showed snow and rainfall frequencies from 1675 to 1713. Furthermore, Pfister and Bareiss (1994) supposed that a calibration of precipitation totals leads to non-significant results on a monthly basis.
The objective of this paper is to provide reconstructions of precipitation using Morin's eyewitness observations. This is undertaken by discussing the most appropriate transfer function and analyzing these weaknesses of the reconstruction. With the awareness of the weaknesses of the reconstruction, individual indices of precipitation are discussed and thus the climate of Paris in terms of precipitation of the late seventeenth century and early eighteenth century is presented. Section 2 introduces the observer Morin and his meteorological journal. In Sect. 3, we introduce the transformation of Morin's observations into common units (i.e., the calibration methods). In Sect. 4, we discuss the reliability of the reconstruction by comparing them with the measurements of Philippe and Gabriel-Philippe de la Hire, proxy data, an internal analysis of Morin's measurements of different climate variables, and modern data. Furthermore, we present different time series and conduct an impact analysis in Sect. 4. The last section sums up the results.
2.1 The observer Louis Morin and his meteorological journal
Louis Morin was born on 11 July 1635 in Le Mans. In his youth, he relocated to Paris where he lived until he passed away on 1 March 1715. Morin practiced as a doctor and had a profound interest in botany. The majority of Morin's measurements and observations (e.g., temperature, pressure, direction of the movement of the clouds) were performed three times a day. A detailed explanation of his measurements and observations, as well as his biography, has been presented in previous studies (Legrand and Le Goff, 1987; Pfister and Bareiss, 1994; Pliemon et al., 2022). Because Morin had a fixed daily routine, it is suggested that these measurements and observations were undertaken at around 06:00 LT, between 11:00 and 14:00 LT, and between 18:00 and 19:00 LT (Pfister and Bareiss, 1994). Cornes et al. (2012) estimated the observation times at 06:00, 15:00, and 19:00 LT. Further evidence of the times of the measurements was provided by Pliemon et al. (2022) using a statistical analysis, which suggested measurement times at 06:00 to 08:00 LT, 15:00 to 17:00 LT, and 18:00 to 20:00 LT. However, rainfall was noted to sometimes be unaligned with the other measurements (see Fig. 1; 6 August 1702) and sometimes in between (see Fig. 1; 7 August 1702). A further consequence of his fixed daily routine is that his measurements show just three gaps with more than 10 consecutive missing days. These periods are 7 June to 6 September 1666, 24 February to 18 March 1668 and 1 December to 12 December 1673. However, in the latter two time periods he at least sometimes noted non-instrumental observations, such as the direction of the movement of the clouds and precipitation. This reflects the consistent record of his meteorological journal, which shows at least one entry for 98.7 % of all days between February 1665 and July 1713.
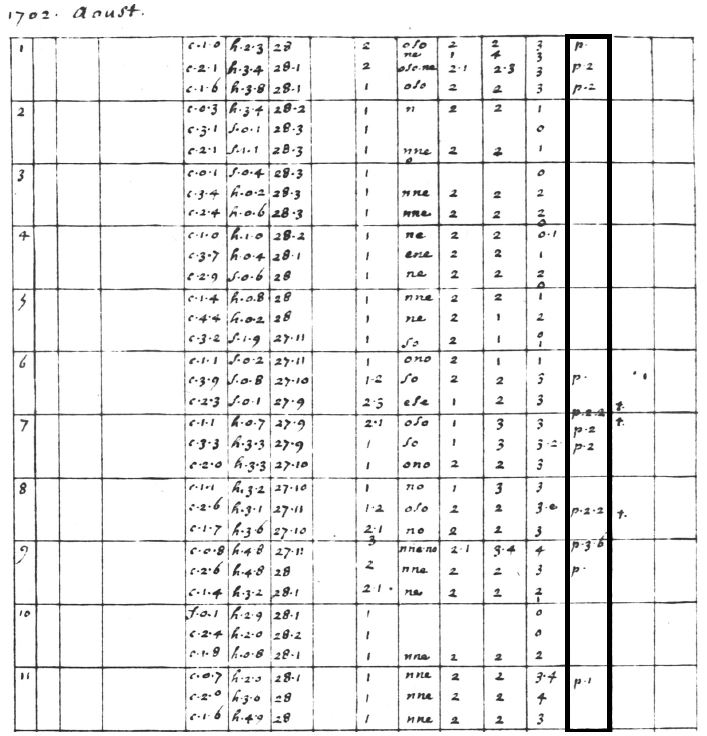
Figure 1Example of Morin's notes (source: Institute of History/Oeschger Centre for Climate Change Research, University of Bern). The precipitation observations are entered in column 14 (highlighted). His records consist of two numbers, one denoting rain intensity (RI) and the second rain duration (RD). Both RI and RD are noted by numbers between 0 and 6, where 0 means low RI and short RD and 6 means high RI and long RD. Furthermore, single “p” notes represent light rainfall and single “n” notes represent a light snowfall (see text for the remaining variables).
Morin's location of residence changed several times within Paris, which is known from the rare notes of Louis Morin (Legrand and Le Goff, 1987). From presumably 1665 (the start date of his meteorological journal) until October 1685, he lived on the Quinquempoix Street, then from October 1685 until June 1688 he lived in the Hotel Rohan-Soubisse, where the National Archives are located today. He then resided from June 1688 until his death in March 1715 at the Abbey of Saint-Victor, which was located at the former city border next to the Seine (Legrand and Le Goff, 1987; Pfister and Bareiss, 1994; Pliemon et al., 2022, their Fig. 02, to find the localization on a city map of that time).
Morin measured and observed several meteorological variables (Legrand and Le Goff, 1987; Pfister and Bareiss, 1994; Pliemon et al., 2022) and has recorded them in a well-structured manner from 1665 to 1709 in his meteorological journal. After that, from December 1709 to June 1713, his measurements and observations are noted on loose paper (Pfister and Bareiss, 1994). The data were transcribed from a copy of his meteorological journal (provided by the Institute of History/Oeschger Centre for Climate Change Research, University of Bern) and from the original records (manuscript and loose paper, provided by the Institut de France). He did not leave any metadata, i.e., no details concerning the measuring instruments and the measuring procedure, but only a short indication of what he measured or observed in the respective columns of his meteorological journal. Figure 1 shows as an example the first days of August 1702. As highlighted in Fig. 1, the precipitation observations are entered in column 14. Before discussing the precipitation notes in more detail, we briefly introduce his other measurements and observations. Columns 1 to 4 represent the day of the month; the day of lunar cycle; the conjunction, opposition, and other aspects of the moon and the sun; and the conjunction, opposition, and other aspects of the planets, respectively. The latter three are mostly empty. This is followed by the thermometer measurements (column 5; see Pliemon et al., 2022), the hygrometer measurements (column 6; see Pliemon et al., 2023a), and the barometer measurements (column 7). These three values were measured instrumentally, and – except for the hygrometer measurements (from 1701 to 1711) – were consequently performed over the whole period. Columns 8 to 13 give the direction of the wind (seldom noted), the strength of the wind (often noted), the direction of the movement of the clouds (often noted; see Pliemon et al., 2022), the regional origin of air (often noted), the speed of the clouds (often noted), and the cloud cover (often noted; see Pliemon et al., 2022), respectively. Finally, the last column (column 15) gives details for fog, snow, and so on.
Rain gauges were already known and partially used before Louis Morin's lifetime in India, Palestine, China, and Korea (Strangeways, 2010). However, in Europe the first rain gauges were used in the 17th century (Strangeways, 2010). Morin did not measure precipitation but made eyewitness observations of precipitation. This means that he subjectively noted the intensity and duration of precipitation. The notes consist of one letter and two numbers, where the former indicates the weather type, e.g., a snow (letter “n”; in French: neige) or a rain event (letter “p”; in French: pluie). The first number denotes rain intensity (RI) and the second rain duration (RD). Both RI and RD are quantified by numbers between 1 and 6, where 1 means low RI and short RD, whereas 6 means high RI and long RD. Furthermore, single “p” notes represent light rainfall and single “n” notes a light snowfall. He quite often noted just a single number. For instance, we interpret a single number of 2 as a RI of 2 and a RD of 0. To check the distribution of values for abnormalities, we plotted the total occurrences of each value in Fig. 2 (for visualization “p” entries get the number 0 and “n” entries get the number −1). Note that the y axis has a logarithmic scale. Furthermore, the x axis is read in such a way that RI indicates the first number and RD the second number, thus leaving non-existing notations free. The following conspicuous points can be determined: (1) Morin strongly reduced or did not note numbers with a value of 5 for both RI and RD, and (2) he has a strong preference for RI of 2. The latter is more pronounced for rainfall than for snowfall and results in a lower variance of RI compared to RD. A tendency to prefer certain values was already seen when analyzing the notes of the temperature (Legrand and Le Goff, 1987).
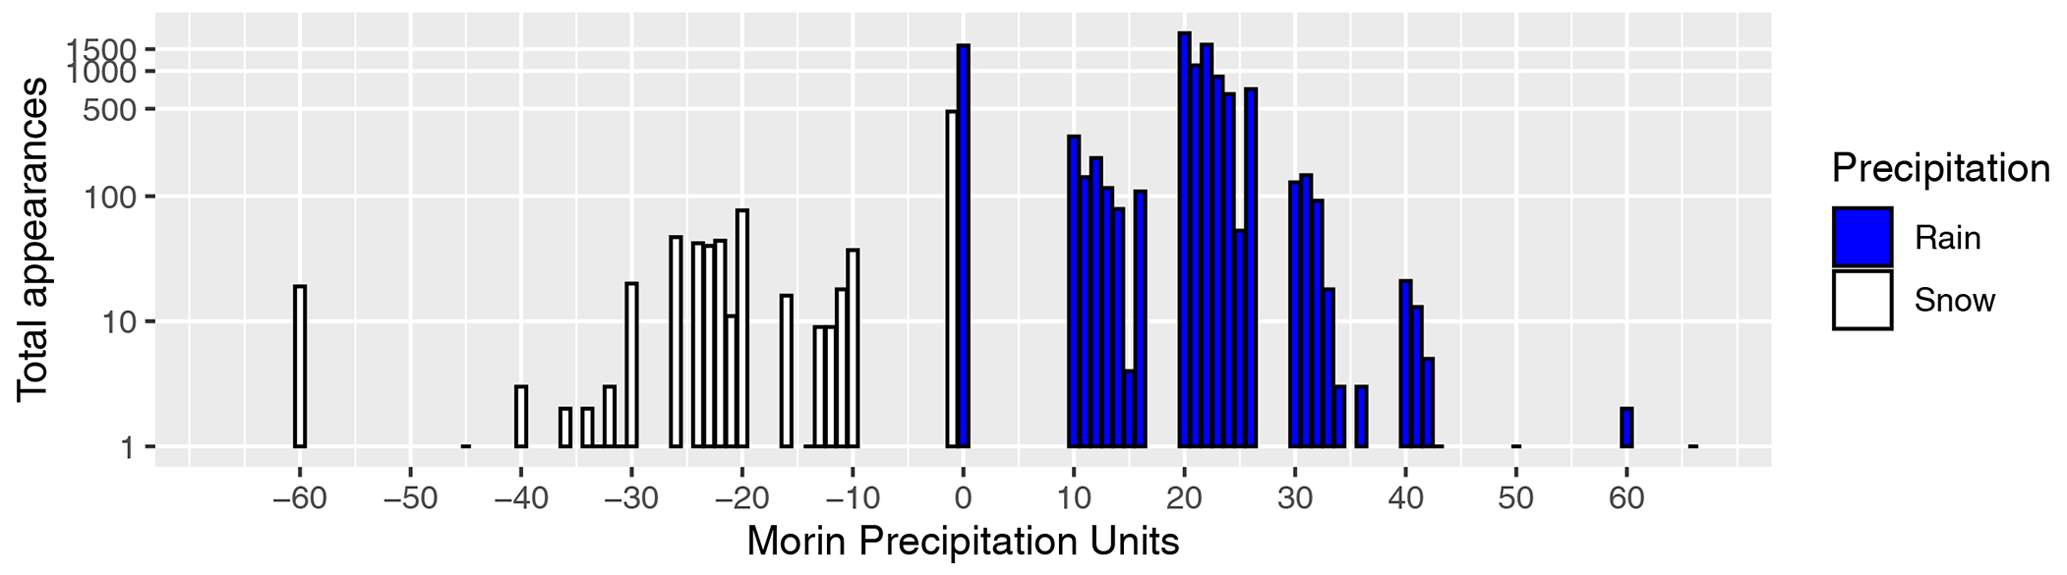
Figure 2The cumulative occurrences per unit used, which was noted in Morin's precipitation records: 0 represents the note “p”, meaning rain; −1 represents “n”, meaning snowfall; and the two-digit numbers consist of rain intensity (first number) and rain duration (second number). Note that the y axis has a logarithmic scale.
Given that his observations were made on a subjective basis, we have also analyzed the time series of individual values, and this analysis revealed that he made small changes in his notes. Firstly, he only introduced the further categorization and quantification with numerical values from October 1666. Thus, until September 1665, he only listed the values “n” and “p”. Secondly, while notes with RD of 1 decrease, others with RD of 0 increase for notes in the period between 1679 and 1681. Thirdly, notes of “n” are rare up to 1680, while they increase later to up to 50 times per year (see Fig. A1). We consider the first two points in the reconstruction but not the third. Harvey-Fishenden and Macdonald (2021) state that reconstructions based on indices may overestimate snow because snow is a highly visible weather phenomenon and therefore might be over-reported. Furthermore, Harvey-Fishenden and Macdonald (2021) state that the use of the same index for snow and rain may lead to an overestimation of precipitation. This suggests that precipitation totals for snowy winter months may be subject to higher uncertainty. A source of underestimation of precipitation from subjective observations could be the overlooking of nighttime precipitation. We rule this out for this data set, since monthly frequency of wet days is consistent with modern data (see later in the text).
2.2 Reference data
We used the modern observations of E-OBS version 26.0e (Cornes et al., 2018). We follow the WMO (World Meteorological Organization, 2017) and chose the historical base period (1961 to 1990) as a 30-year reference normal. Furthermore, we use indices of the North Atlantic Oscillation (NAO; Luterbacher et al., 2001, 2002) and dendroclimatological data (Labuhn et al., 2016b, c). Slonosky (2002) examined instrumental precipitation measurements of Philippe and Gabriel-Philippe de la Hire (Slonosky, 2010). Because the measurements performed by father and son de la Hire overlap with the observations by Morin, we used these data for calibration and also for comparison. Nevertheless, we have to expect measurement errors with rain gauges. An important error source results from wind, especially when given that rain gauges used to be positioned at higher altitudes (Auer et al., 2005; Camuffo et al., 2020, 2022a). This leads to reduced precipitation totals (PTs) with stronger influence in winter due to snowfall than in the remaining seasons. Other possible influencing factors are evaporation (lower PT; Camuffo et al., 2020) and dew (higher PT; Camuffo et al., 2019, 2020). The influence of dew and evaporation is negligible because father and son de la Hire recorded precipitation as soon as it fell (Slonosky, 2002). However, due to the higher elevation of the measurements sites, the influence of wind is significant. The copper box (measurement device) of the de la Hires was based in an uncompleted tower of the observatory, which had four walls with window holes but no roof (Slonosky, 2002). Thus, the values of winter months of the supplementary data file for the study by Slonosky (2002) have been updated and adjusted upwards in 2019. The reason may be due to an undercatch of snowfall in winter (e.g., see Murphy et al., 2020).
3.1 Assumptions and data modification
To get common units, we applied a transfer function to Morin's precipitation data. Before doing so, we made two modifications to the data. First, notes without a RD specification are set with a RD of 1. The reason for this modification of the raw data has already been mentioned, namely that Morin's attribution of rainfall events without a specification of time in earlier years was very likely noted as RD of 1 in later years. The second is more of an assumption and concerns the notes with “n” and “p”, which are interpreted as short and light snow and rainfall events. In previous studies, different thresholds of the precipitation amounts are given, which can be recognized without instrumentation: 0.1 mm (Glaser, 2008), 0.2 mm (Brumme, 1978), and 0.3 mm (Pfister and Bareiss, 1994; Gimmi et al., 2007). Glaser (2008) suggests that a precipitation amount of 0.1 mm is detectable during the day due to wet roads and roofs, and reduced precipitation amounts compared to instrumental data are more likely to occur due to unnoticed precipitation amounts at night. Based on our data, we are unable to analyze the reasons for inhomogeneities and decided to use a minimum perceptible precipitation amount of 0.3 mm. In total, Morin noted about 15 % of all values with either “n” or “p”. Derived from previous analyses (Gimmi et al., 2007, Table 3), we set the upper limit at 0.7 mm. Thus, we assume that the precipitation amount of these precipitation events lies between 0.3 and 0.7 mm, and therefore assign these values with the mean of 0.5 mm. We do not account for the rise of “p” values since 1680 (see Fig. A1), which may slightly overestimate years without “p” values. Because of Morin's careful record keeping, we rule out another possibility of interpretation, such as that the “n” and “p” values were merely not fully noted.
3.2 Calibration per transfer function
Once the assumptions are made, the measured values, which consist of RI and RD, were converted into common values (mm). To our knowledge, there is no identical historical database in the literature with measurements of RI and RD. Somewhat similar are the records of Morgagni (Camuffo et al., 2022b), who noted RI but not the rain duration. From a methodological perspective, Camuffo et al. (2022b) had daily measurements available for calibration. Due to the lack of similar studies, we applied different transfer functions f(RI,RD). In Eq. (1), we use the simplest form, multiplying RI and RD. In Eq. (2), a multiplicative variable a2 is appended with the unit millimeter. In Eq. (3), we kept the multiplicative factor and weighted RI and RD separately by the parameters b3 and c3. A multiplicative interaction model is shown in Eq. 4 with the parameters a4, b4, c4, and d4.
where PT denotes the monthly precipitation total; RI the rain intensity; RD the rain duration; and ax, bx, cx, and dx the parameters. For the calibration, monthly PTs were taken from the measurements by the de la Hires (Slonosky, 2002). Their available measurements started in June 1688 and are mostly noted throughout except for the years 1691, 1692, 1697, and 1698. This means that about 20 monthly mean values for each month in the measurement series overlap between 1688 and 1713. This time span is too short for us to separate it into a calibration time period and a validation time period. Therefore, we use this time period between 1688 and 1713 for both calibration and validation. The de la Hire measurements are instrumental measurements and are available in a monthly resolution, and thus this is a calibration on a monthly basis.
A clear choice of the parameters in Eqs. (1)–(4) could not be made by the least-squares method alone because some parameter constellations achieve approximately equally good or minimal results. Consequently, constellations of parameters have been selected that exceed the minimum root-mean-square error (RMSE) and mean average error (MAE) by less than a percent (see Table A1, but we note that due to the high number of possibilities we only show errors less than 3 ‰ for the warmer period). Of the values that meet these conditions, the choice was made according to either the strongest weighting of the multiplicative term (RI ⋅ RD) or the highest degree of retention of the original values of RI and RD. The heavy weighting on a RI value of 2 leads Morin to underestimate summer values. We address this problem by calculating the parameters for the summer months (May–September) and the remaining months separately. A different calibration for each month (January, February, etc.) does not seem to be reasonable due to the small number of individual months possible for calibration. As an example, all parameters that fulfill the conditions for Eq. (4) are listed in Table A1. For Eq. (3) we chose the parameters a2=0.6 (October to April) and a2=0.9 (May to September). For Eq. (3) we chose the parameters a3=0.7, b3=1.2, and c3=0.7 (October to April) and a3=0.7, b3=1.7, and c3=0.7 (May to September). For Eq. (4) we chose the parameters a4=0.0, b4=0.2, c4=0.0, and d4=0.5 (October to April) and a4=0.0, b4=0.6, c4=0.0, and d4=0.6 (May to September).
3.3 Calibration per rainfall frequency
For the months January to September 1665, only precipitation events are documented and no rain intensity or rain duration data are documented. Thus, we calculated the PT for these months using a calibration (linear regression) with the rain frequency. This means that a given rainfall frequency receives a certain PT.
To find the strengths and weaknesses of the data, in the following two subsections we compare Morin's observations with both contemporary and modern precipitation measurements and with proxy data. These comparisons also serve as a basis for a discussion of the various calibration methods and selected ones of Eqs. (1)–(4). The last subsection presents the time series of Morin's precipitation observations and an impact analysis.
4.1 Calibration and validation and choice of the calibration method
To compare the de la Hire data with calibrated data of Morin according to Eqs. (1)–(4), we created a scatterplot of each in Fig. 3. Thereby, method 2 strongly underestimates the measurements of father and son de la Hire, and methods 1 and 2 show relatively high scatter. Methods 3 and 4 provide a good result, showing a good correlation and only slightly underestimating the de la Hire data. In terms of correlation (Pearson), method 1 and method 2 reveal 0.59 and 0.69 (1688–1713), respectively, whereas method 3 and method 4 show, rounded to the second digit, a correlation of 0.73. The Spearman correlation coefficients are also given in Fig. 3 and show a high correlation. However, more analysis and reasons for the underestimation of the de la Hire data are needed to commit to a calibration method.
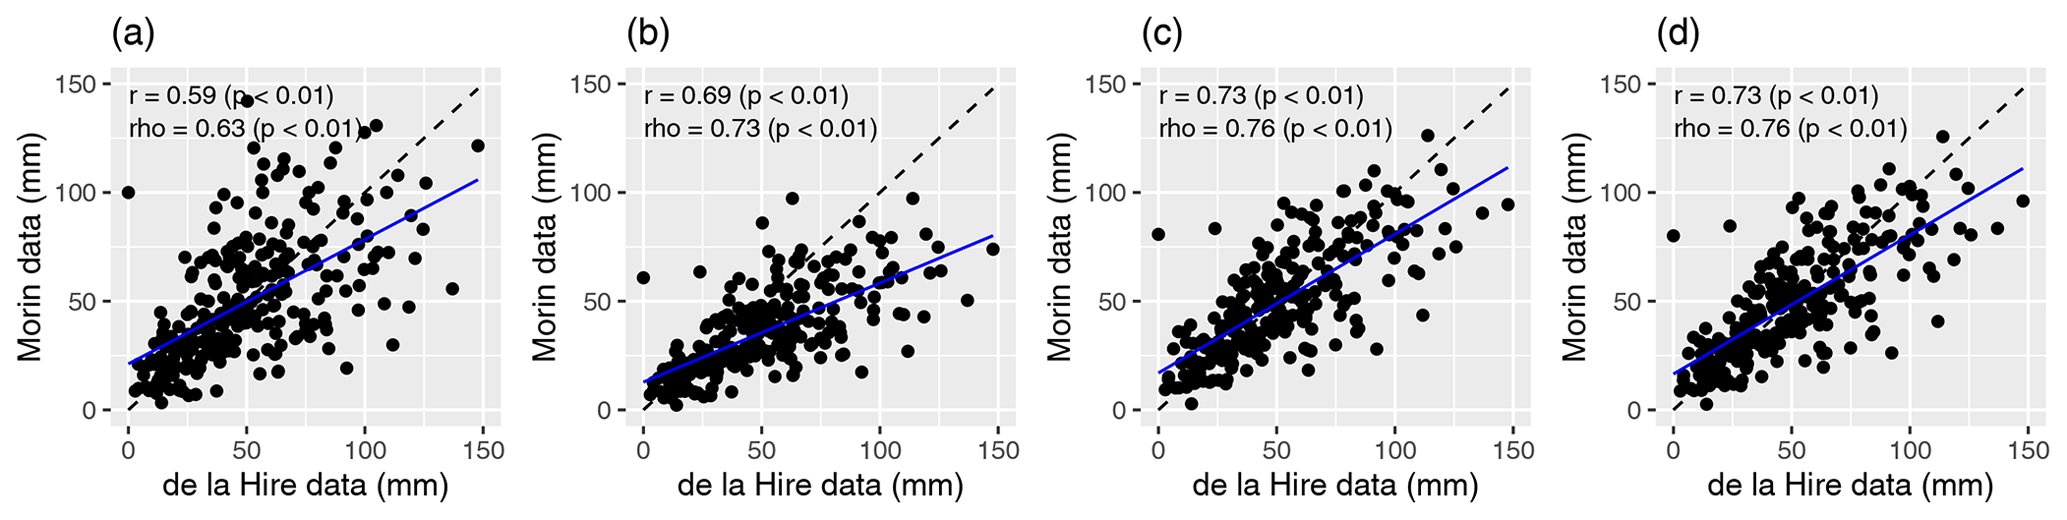
Figure 3Scatterplots of the instrumental measurements of the de la Hires (x axis) of the different calibration methods based on Morin's data: (a) method 1, (b) method 2, (c) method 3, and (d) method 4 for the precipitation totals from 1688 to 1713. Furthermore, the Pearson (r) and Spearman (ρ) correlation coefficients are noted in each panel.
The monthly means for the calibration period of 1688 to 1713 (excluding missing data; see Sect. 3) are shown in Fig. 4. If the calibration period is not split into summer and winter periods, then the monthly means show an underestimation of the summer months and an overestimation of the winter months for all calibration methods. Even when the periods are calibrated separately, the summer months (especially May and July) show larger deviations (see Fig. 4). It is also easy to see that calibration methods 1 and 2 do not provide satisfactory results. However, calibration methods 3 and 4 show a good agreement, with slightly lower precipitation amounts in summer. Using this graph, we settle on calibration method 4, which will be used to process the following evaluation in this paper. The results of this method and the calibration method 3 are similar. However, 8.8 % values of RI (RI = 1) and 35.9 % values of RD (RD = 1) do not affect the result of method 3 due to the base one. Even though Eq. (3) achieves slightly better results in terms of RMSE and MAE, Eq. (4) seems reasonable to us because of the reason given earlier and the fact that it is the mathematically simpler regression formula.
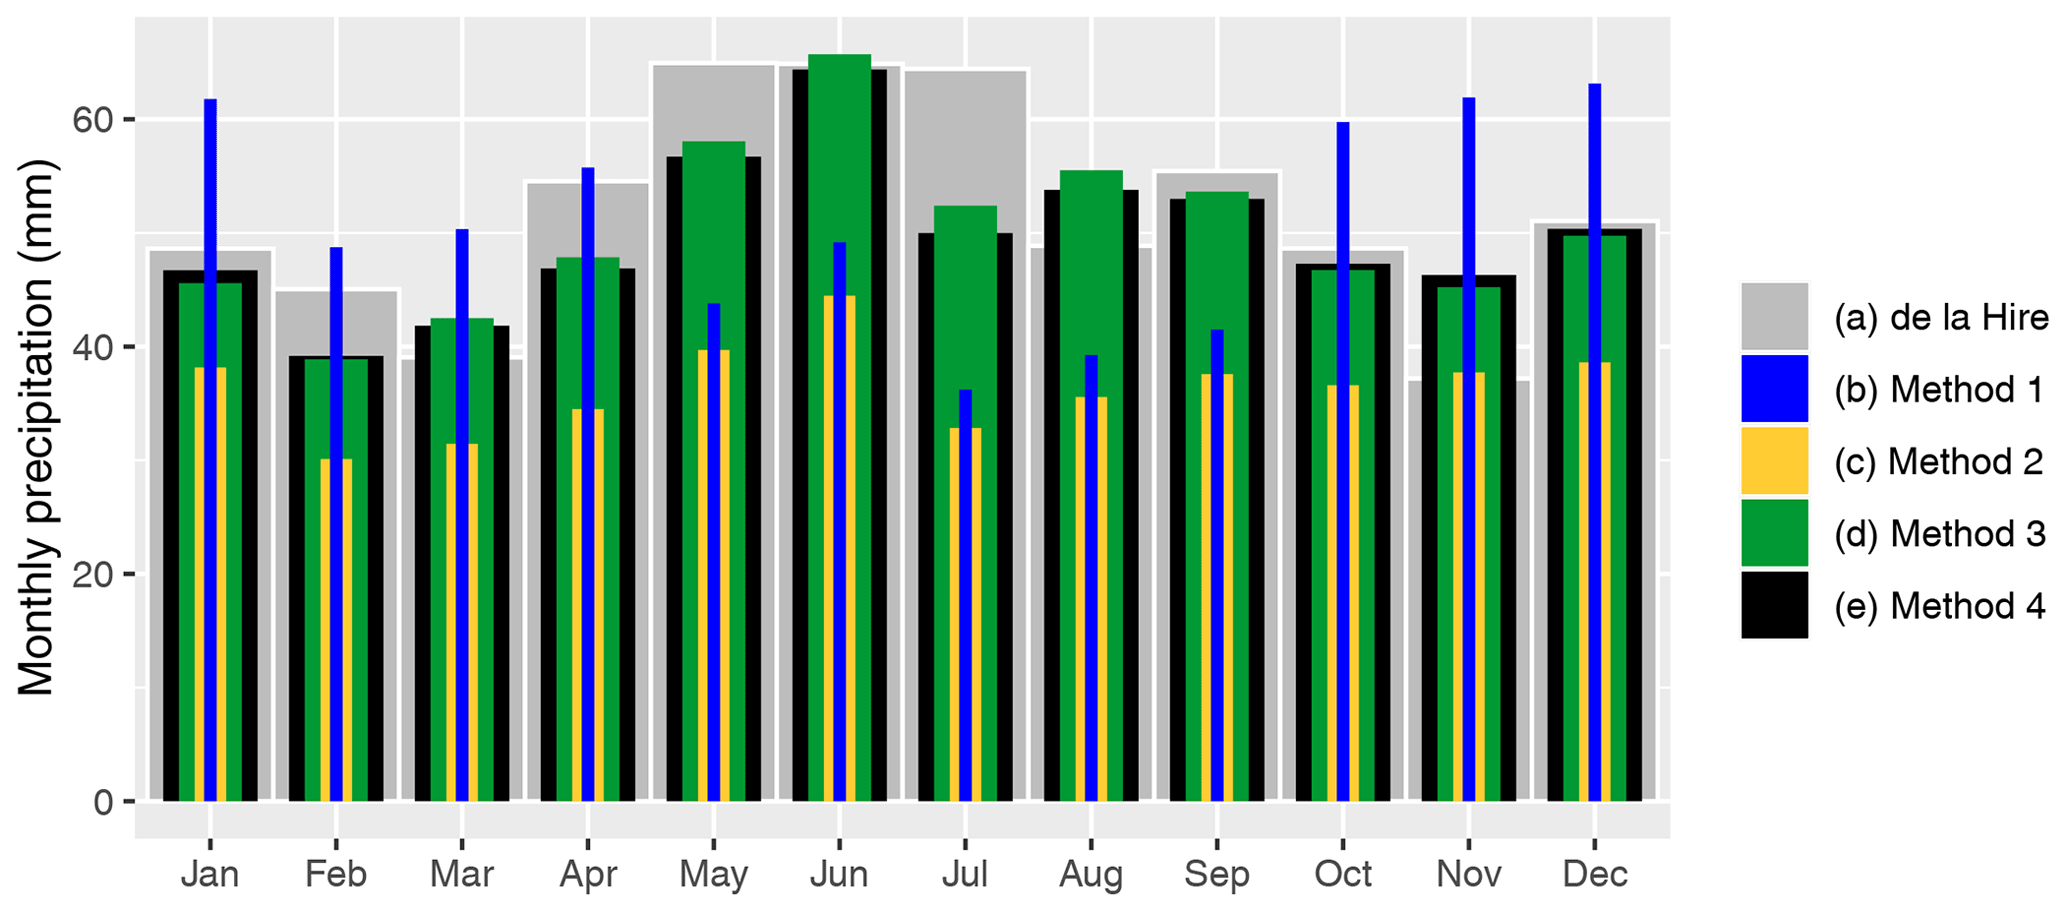
Figure 4Comparison of the monthly means of the calibration period 1688–1713 (excluding 1691, 1692, 1697, and 1698) of (a) the de la Hire instrumental measurements, (b) Morin observations with calibration method 1, (c) Morin observations with calibration method 2, and (d) Morin observations with calibration method 3.
Precipitation totals based on eyewitness observations tend to underestimate heavy rainfall (Camuffo et al., 2022b). Thus, we looked at whether the data reflect extreme events. Philippe and Gabriel-Philippe de la Hire, Bonamy, and Deparcieux highlighted the years 1658, 1711, and 1740, in which flooding occurred in Paris (Slonosky et al., 2020). February 1711 falls in our time period, and the flood level of this year is also recorded on buildings (e.g., Paris, 29 place Maubert, 5e arr.). However, this flooding was not only due to heavy rain but was a combination of snowmelt and rain (Slonosky et al., 2020). As expected, the de la Hire data reflect this exceptional year better (high PT in February) than Morin's data (see Fig. 5). In this figure, the comparisons of the PT between Morin and the de la Hires are plotted seasonally and annually as a time series. Furthermore, we find an annual Pearson correlation of 0.72 (p<0.01), and an annual Spearman correlation of 0.77 (p<0.01).
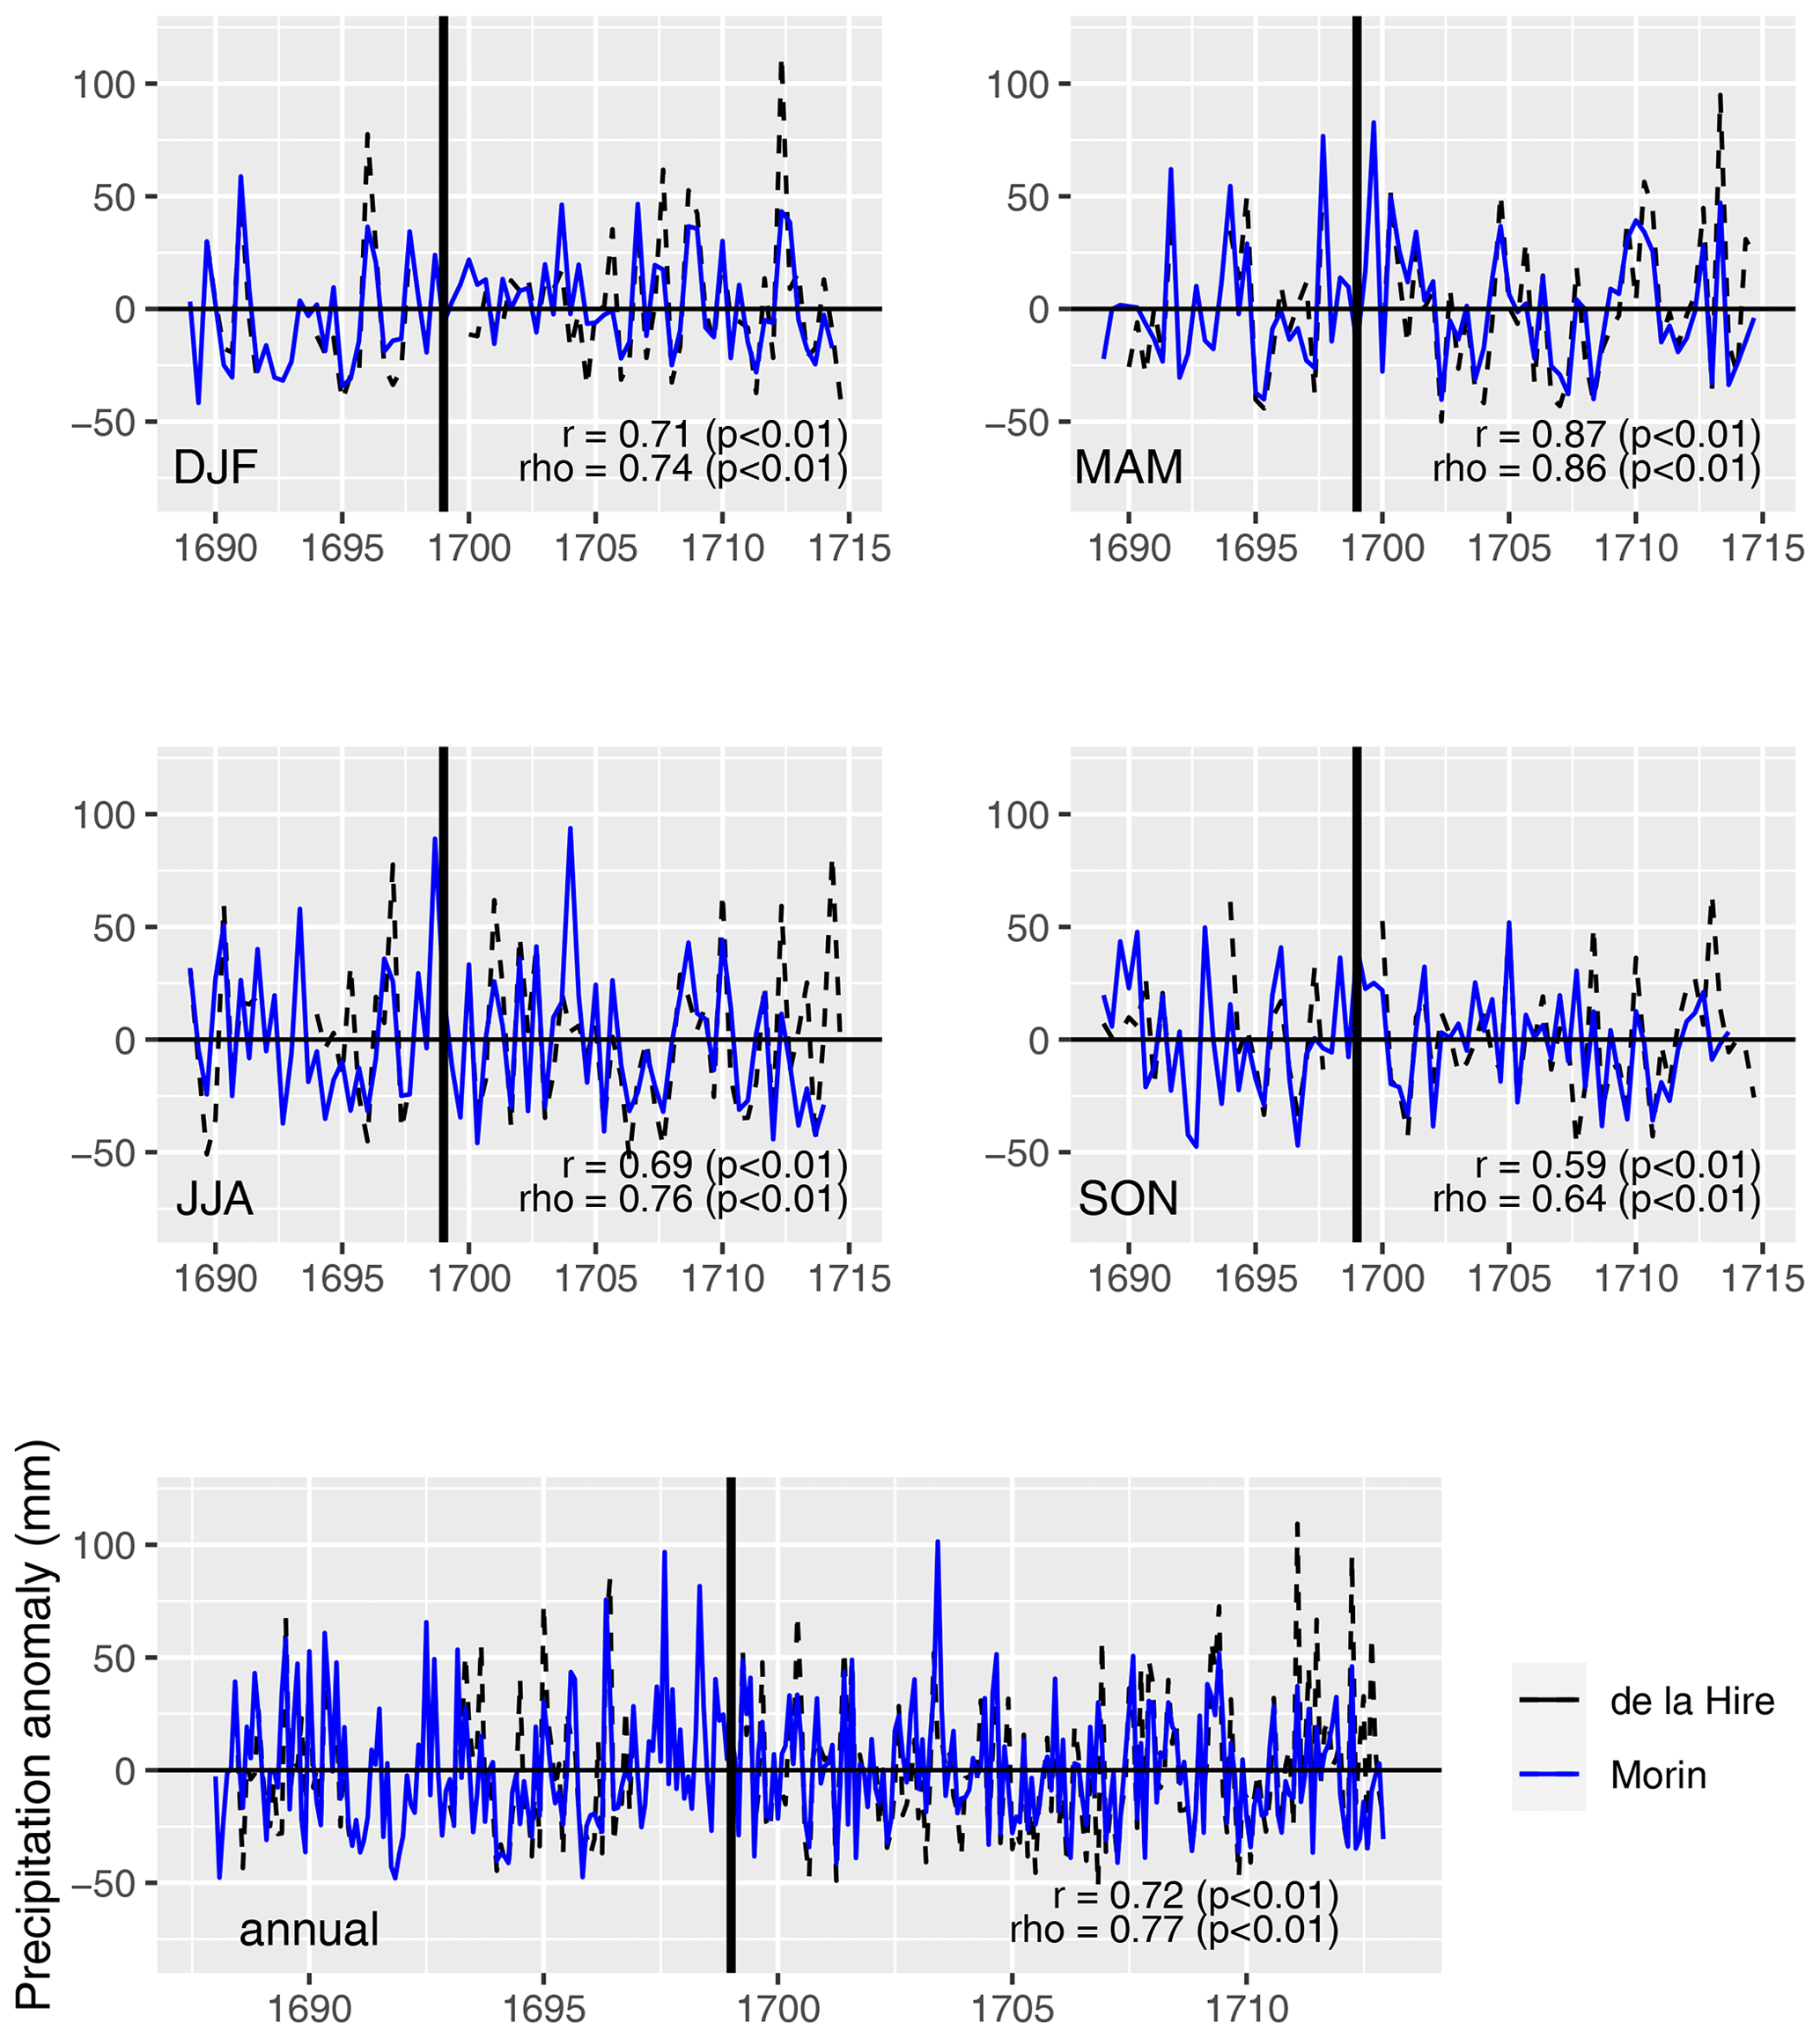
Figure 5Measured (dashed line) and reconstructed (solid line) monthly anomalies of each season and annual. The vertical black line marks the transition from continuous measurements (>1698) of father and son de la Hire and non-continuous measurements. The Pearson (r) and Spearman (ρ) correlation coefficients were calculated for the continuous measurement period.
Another possibility of validation is a comparison with proxy data. The latewood tree ring isotope δ18O (Labuhn et al., 2016a, Fontainebleau) significantly correlates with the growing season maximum temperatures, as well as with precipitation. The correlation is more significant for temperature than for precipitation (Etien et al., 2009; Labuhn et al., 2016a). However, Etien et al. (2009) compared summer (JJA) and annual precipitation amounts with δ18O for Fontainebleau. They showed that these variables are significantly anti-correlated from 1900 to 1950 (R=−0.50 and p=0.0002 for PJJA, R=−0.59 and for Pann) but the anti-correlation is weaker since 1950 (R=−0.38 and p=0.006 for PJJA, R=−0.32 and p=0.02 for Pann). Our correlation (Spearman) analysis for PTJJA revealed a correlation of and p=0.04 and for PTann a correlation of and p=0.003. Thus, the correlation with our data reveals a weaker anticorrelation and both are significant at the 0.05 level. The time series of both δ18O and the monthly average of PT of each year are plotted in Fig. 6.
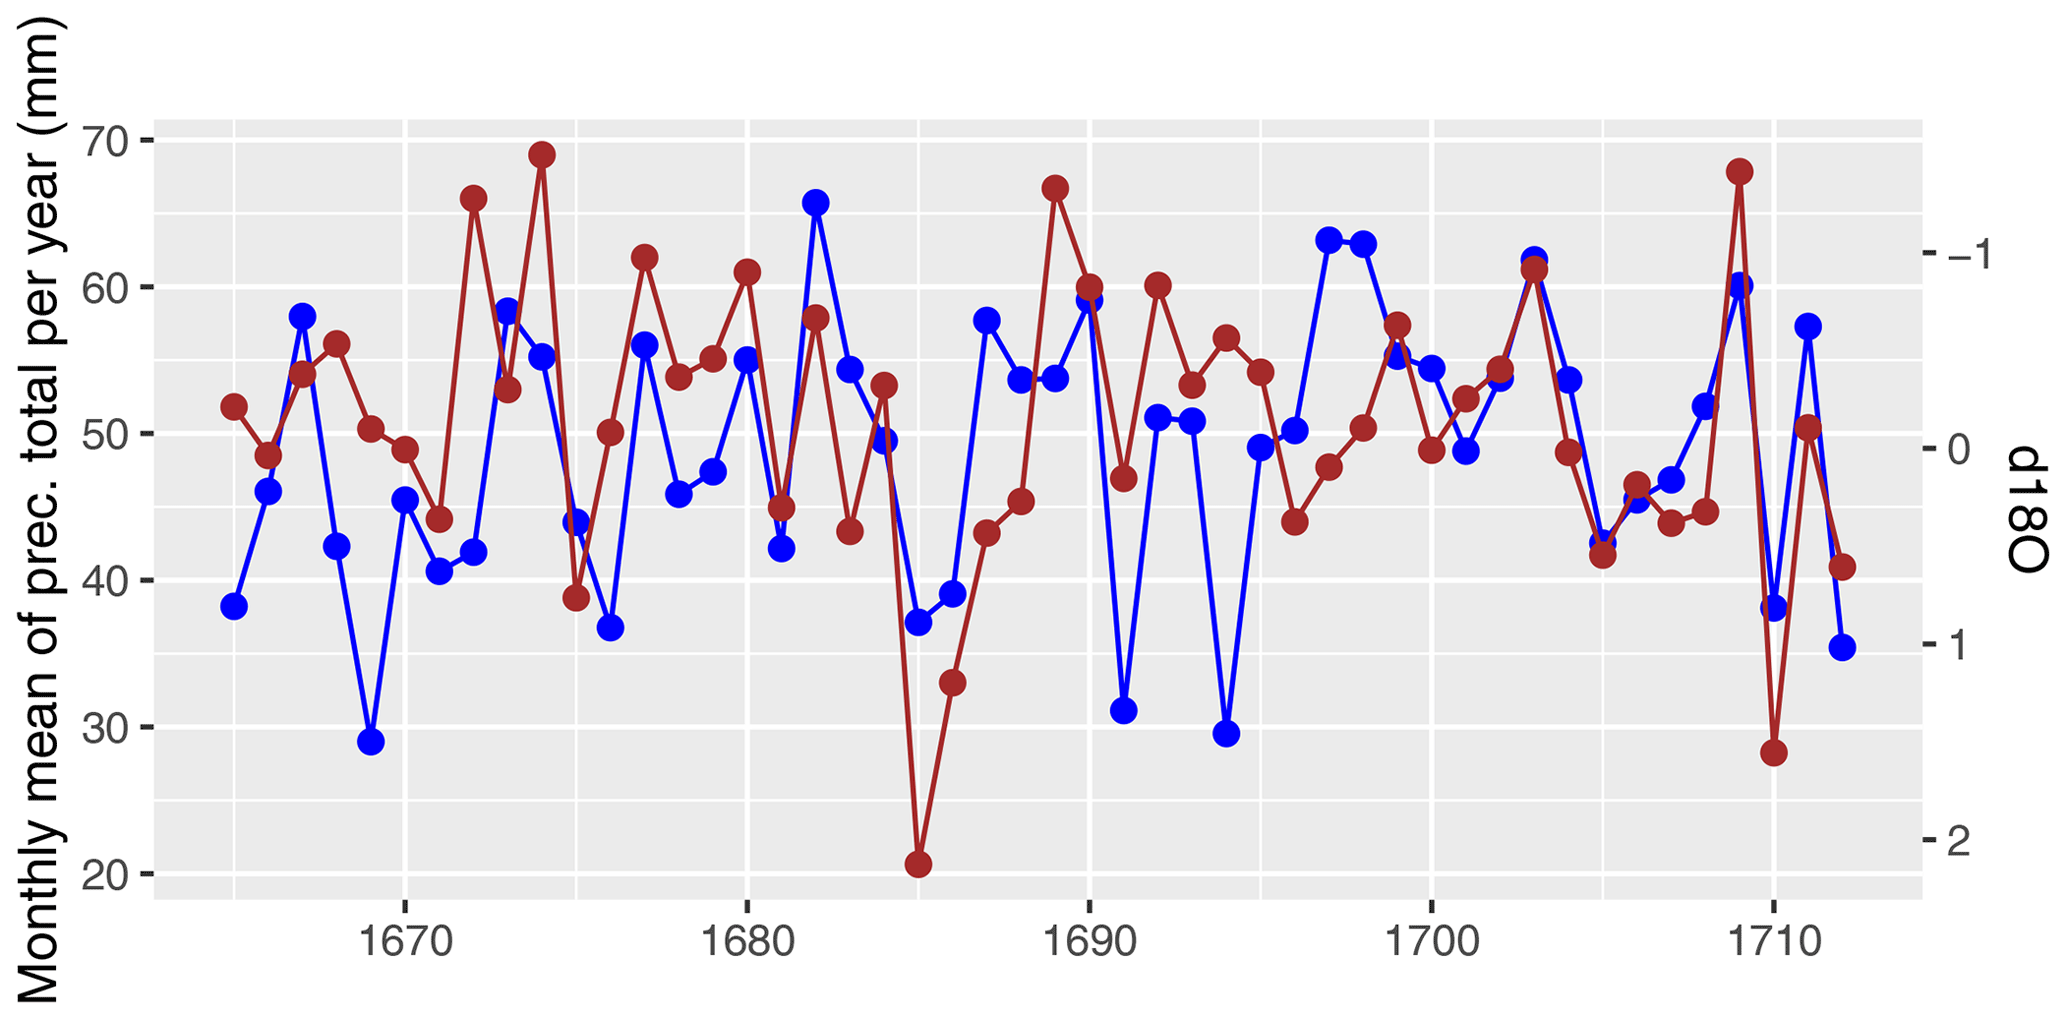
Figure 6Comparison of the monthly average of the precipitation total of each year (blue) and the δ18O (Labuhn et al., 2016b) (red).
A comparison with the North Atlantic Oscillation (NAO) is difficult because NAO data itself is based on reconstructions for the time period of interest. The further in the past, the fewer predictors and the larger the error (Pauling et al., 2006). In theory, in contrast to temperature, there should be no correlation in Paris between precipitation and the NAO index (Cleary et al., 2017; Müller-Plath et al., 2022). This means that other climatic drivers are responsible for the precipitation pattern over France. Morin's data show r=0.01 and p=0.97 in DJF, and r=0.21 and p=0.16 in JJA, and so the data show what is expected.
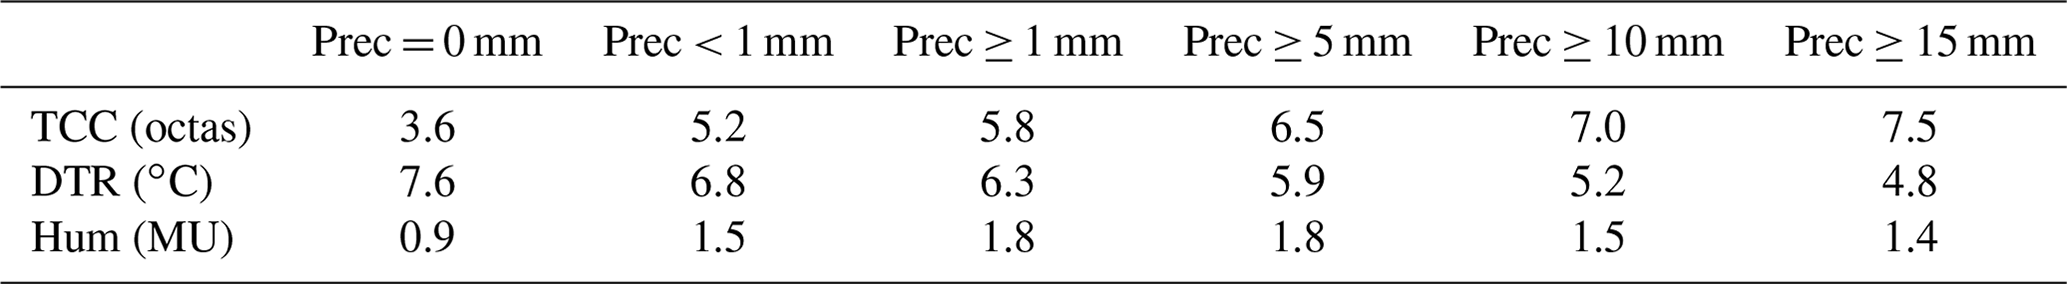
A further, but weaker, possibility of validation is to intercompare Morin's various meteorological variables. Looking at selected meteorological variables influenced by precipitation, differences should be noticeable. We compared three different parameters (see Table 1). Given that precipitation is sometimes not in line with the usual three measurements per day (Pliemon et al., 2022), we made the comparison based on daily mean values. Total cloud cover (TCC) reflects the expected relationship: the higher the PT, the higher the TCC. In detail, the TCC increases from 3.6 for precipitation (prec) of 0 to 7.5 for prec ≥ 15 mm. Diurnal temperature range (DTR) is also consistent: the higher the PT, the smaller the value for DTR. In detail, the DTR decreases from 7.6 ∘C for prec of 0 to 4.9 ∘C for prec ≥ 15 mm. Humidity measurements were made instrumentally by Morin. However, we do not know which instrument he used, and there is no information about the metadata or the implementation. Thus, we made the comparison with the units noted by Morin. Here, a positive value means humid air and a negative value means dry air. Again, the calculated values are plausible: the higher the PT, the more humid the air. Nevertheless, the values for prec ≥ 10 mm and prec ≥ 15 mm show smaller values.
Table 1Various meteorological values measured and observed by Morin as a function of precipitation. Total cloud cover (TCC) in octas (without fog days), diurnal temperature range (DTR) in ∘C, and humidity in Morin's noted unit.
4.2 Comparison and validation with modern measurements
We also compared the results of the reconstruction with modern data, primarily for the plausibility check. However, if we felt confident enough to make stronger statements about differences, then this is explicitly noted. As a modern data set, we used the E-OBS data for the period 1961–1990 (Cornes et al., 2018). The daily resolution of the E-OBS data allows us to compare not only the monthly precipitation totals but also the monthly frequency of wet days (see Fig. 7). Although Morin was known for consistently making his measurements and observations with only a few misses (Legrand and Le Goff, 1987; Pliemon et al., 2022), looking at the frequency of precipitation serves as further validation of the reliability of his data. Over the year, the precipitation totals in Paris are approximately evenly distributed. This is true for both the E-OBS data and Morin's observations, but the annual cycle is more pronounced for Morin's observations. The monthly frequency of wet days (PT ≥ 1 mm) shows an almost uniform distribution and ranges from about 8 to 12 wet days on average per month. Interestingly, in contrast to Morin's observations, the E-OBS data indicate a slightly stronger annual variation with lower values in the summer months. However, the comparison of monthly frequencies shows no clear differences, and thus Morin's observations can be considered consistent in this regard. Similarly, the annual pattern of monthly precipitation totals, which is dependent on the calibration method, matches that of the comparison period to a high degree. Nonetheless, our model underestimates the winter months. The reasons for this could be that the calibration data are subject to higher measurement inaccuracies in the winter months (see Sect. 2.2) or that Morin's records underestimate snowfall because the majority of the records correspond to only 0.5 mm (see Fig. 2).
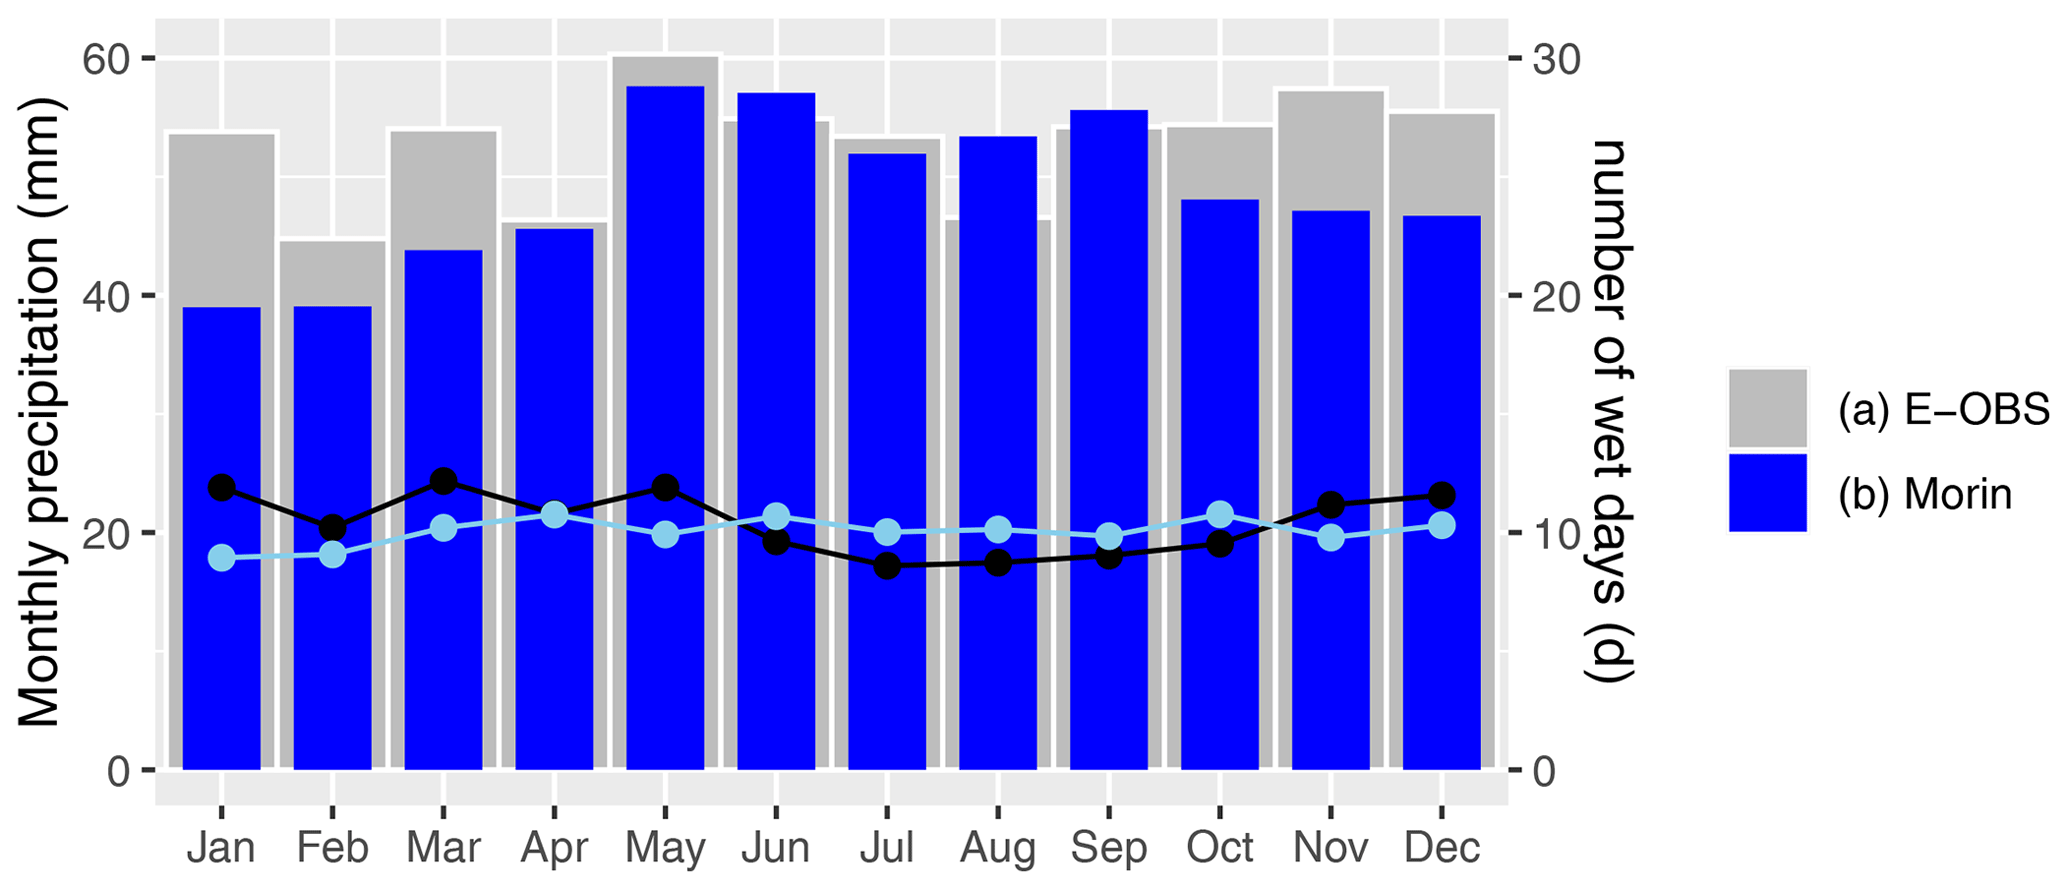
Figure 7The monthly means of Morin's precipitation reconstruction (blue bars) and of the reference period (gray bars; 1961–1990). Furthermore, the blue and black lines represent the number of wet days for Morin's observations and modern data (E–OBS), respectively.
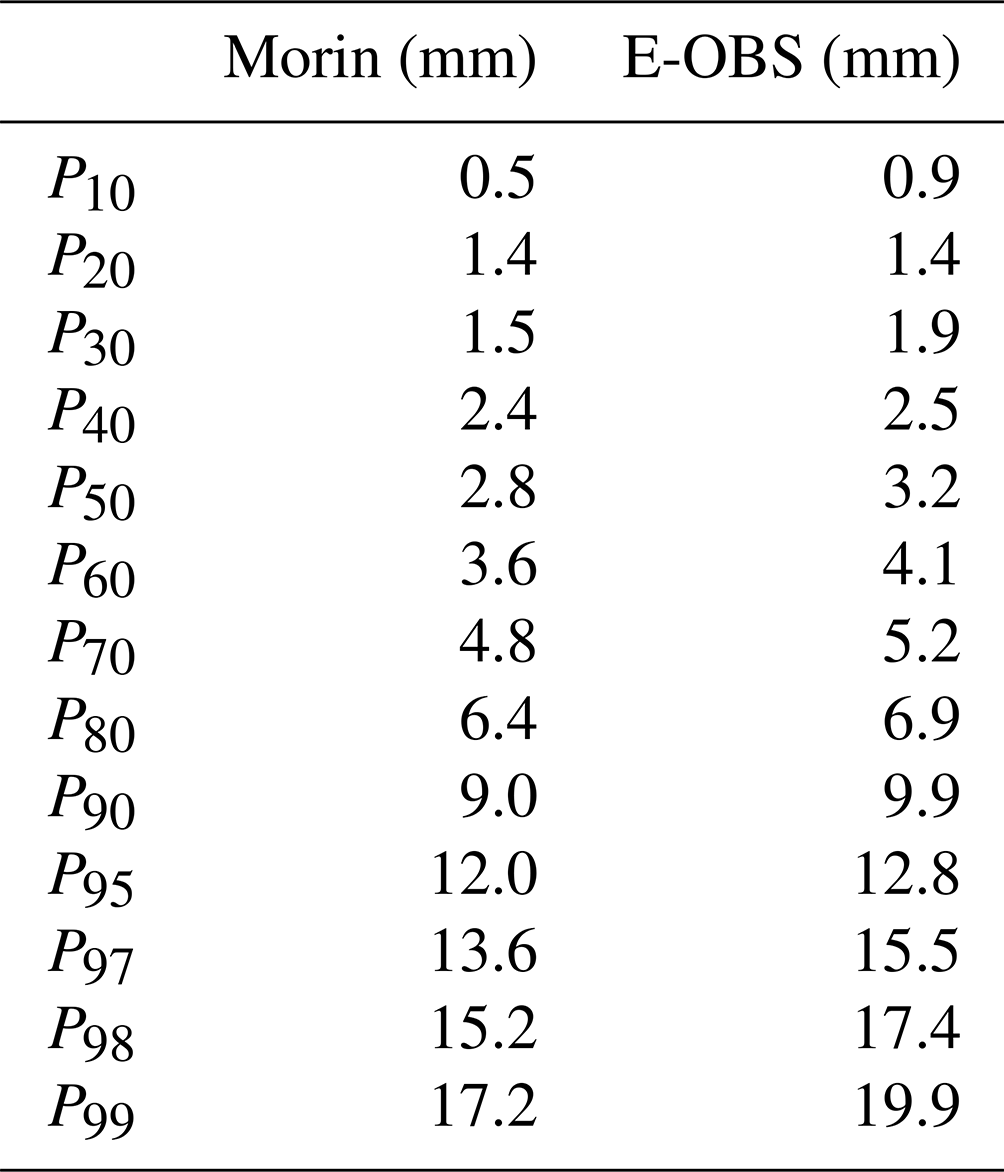
The frequency of daily precipitation totals (a) and the frequency of consecutive wet days (b) are plotted in Fig. 8. In theory, the frequency of the daily precipitation totals follows a gamma distribution (e.g., Thom, 1958; Martinez-Villalobos and Neelin, 2019). This is well satisfied for the E-OBS data, and Morin's observations also roughly follow this distribution. Only the frequencies of light precipitation show stronger deviations. This is due to the discrete nature of his observations. This effect varies strongly with the choice of the calibration method (see Sect. 3). In particular, the peak of the frequency for precipitation of the interval (1–2] mm is underestimated while the interval (0–1] mm is overestimated. However, many values are equal to 1 mm due to the calibration method, and thus we feel that an impact analysis is possible. Furthermore, we can see that heavy rainfall events are underestimated by Morin's observation method. The underestimation of intense precipitation becomes more apparent when looking at the percentiles (Table 2). The higher the percentiles (especially from the 90 % decile), the more the values diverge between Morin's calibrated observations and the E-OBS data. Morin's calibrated precipitation totals underestimate heavy precipitation, as seen previously. Especially from the 97 % percentile on, the values diverge and already show a difference of 1.9 mm and more, whereas up to the 80 % decile there is good agreement. In Fig. 8b, we see good agreement in the frequency of consecutive wet days between the E-OBS data and Morin's observations. Given that this comparison has a weaker dependence on the choice of the calibration method, we cautiously hypothesize that the studied time period indeed shows a higher frequency of single events but a lower frequency of longer rain periods.
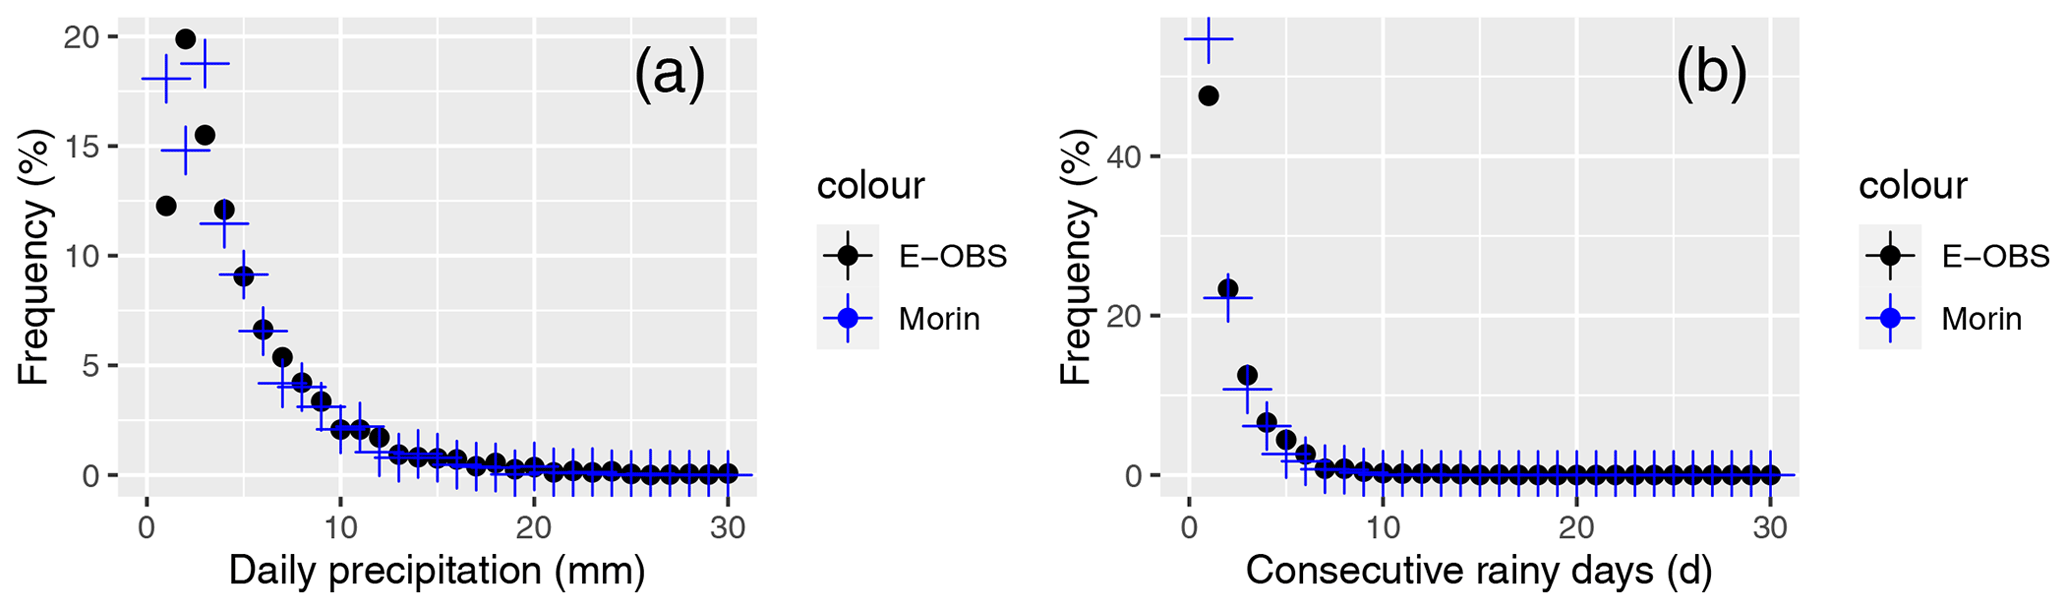
Figure 8Frequency of precipitation as a function of daily precipitation of Morin's precipitation reconstruction (blue dots) and of the reference period (1961–1990) and the frequency of precipitation as a function of consecutive wet days.
Table 2Percentiles of the calibrated results of Morin's observations compared with the E-OBS data.
To summarize, following the analyses of the previous section and this section, we assess the reliability of the precipitation reconstructions based on Morin's data as follows. We have low confidence regarding exceptionally high precipitation amounts. We have moderate confidence regarding daily, seasonal, and annual precipitation totals. We have high confidence for an impact analysis (dry days, wet days, consecutive dry days, and consecutive wet days), in monthly frequencies of rainfall, and in interannual and interdecadal variability. Thus, the last section will present time series of precipitation and will give an impact analysis.
4.3 Reconstructed time series and impact analysis
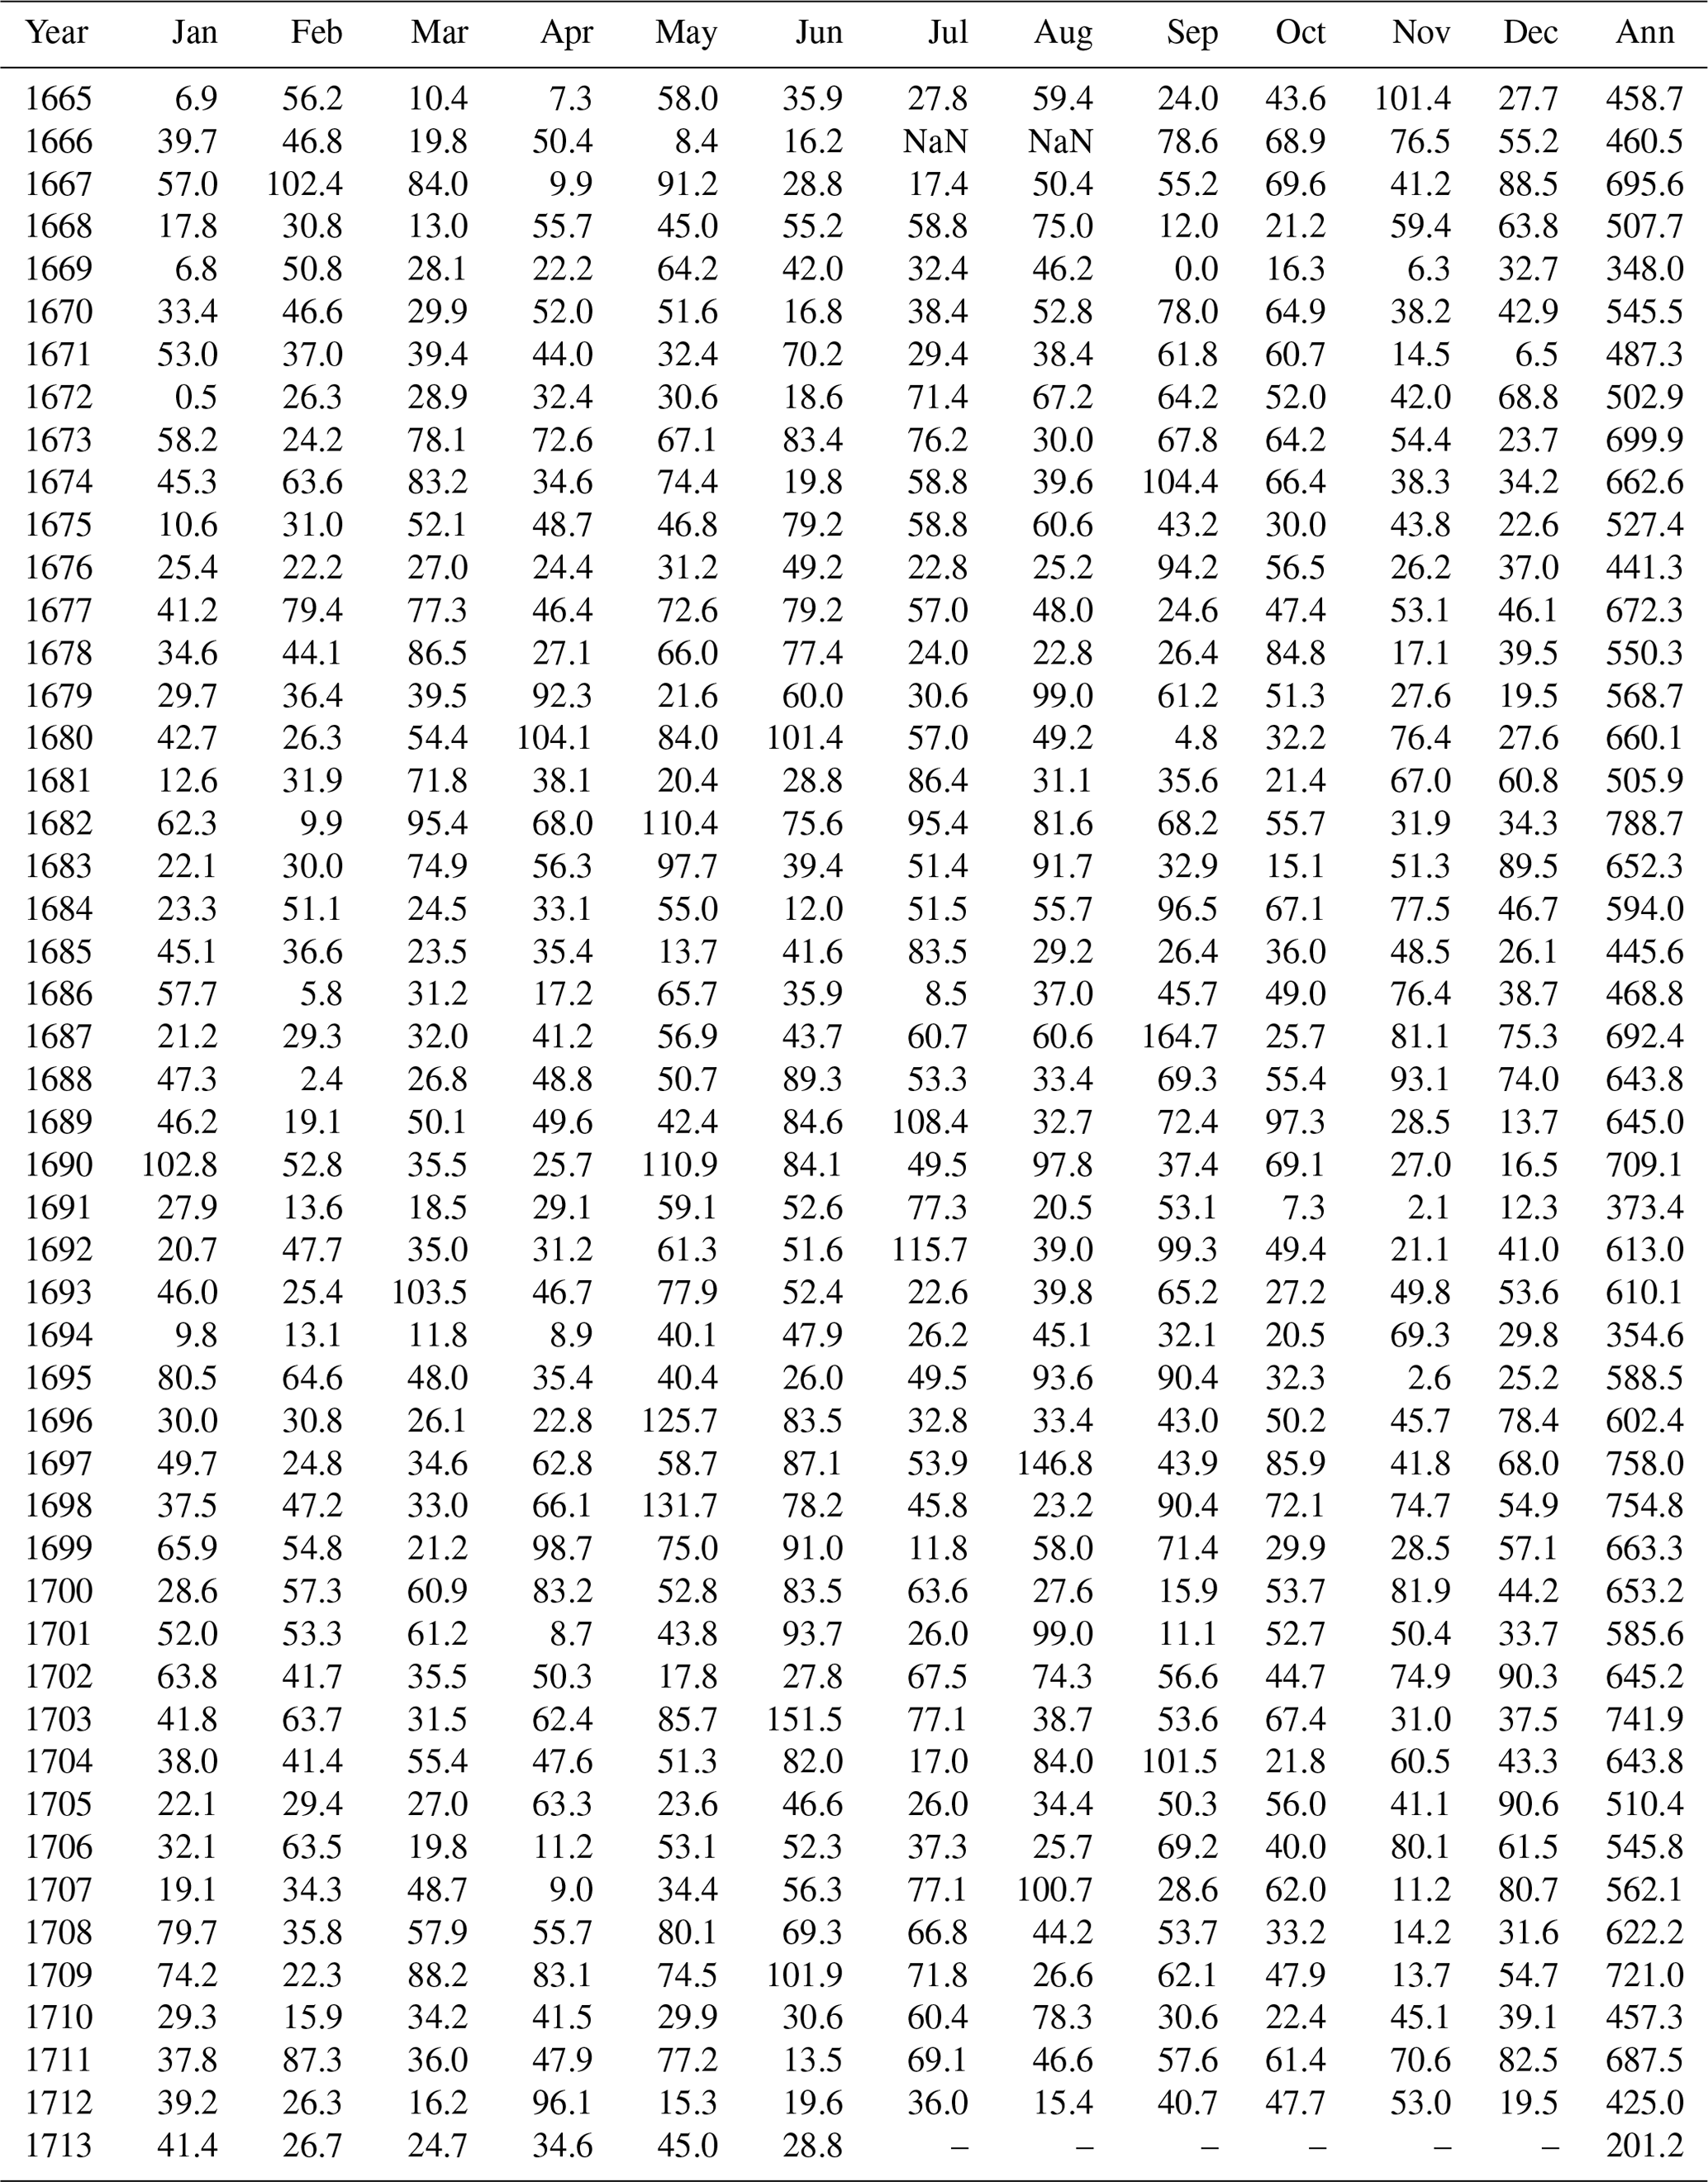
First, we examine monthly variability. Thus, we present monthly precipitation anomalies and monthly precipitation frequency anomalies in Fig. 9 with respect to the monthly mean of the whole observation period. In addition, the blue-shaded areas show the 11-month running mean (see Table A2 for all absolute values of monthly and annual PT). No observations are recorded for July and August 1666, and consequently we set the precipitation total anomaly and precipitation frequency anomaly to zero for these months (see Sect. 2.1). Furthermore, because only the precipitation event is noted for the months of January 1665 to September 1665, precipitation totals of those months are calculated as a function of the precipitation frequency. The highest monthly precipitation totals are noted in September 1687 (164.7 mm), August 1697 (146.8 mm), and June 1703 (151.5 mm). Nevertheless, we claim the quantity of monthly PT only with medium confidence. The highest numbers of 23 precipitation days per month were recorded by Morin in March 1693, June 1703, and March 1709. The 11-month running mean shows relatively high variability for both rainfall amounts and frequency, with moderately pronounced wet and dry periods. Basically, it can be said that no exceptional dry or wet period can be detected during Morin's observation period. Regarding the wet day frequency anomalies in Fig. 9b, there is a predominance of negative anomalies up to and including 1672, positive anomalies up to and including 1683, negative anomalies up to and including 1697, and positive anomalies up to and including 1710.
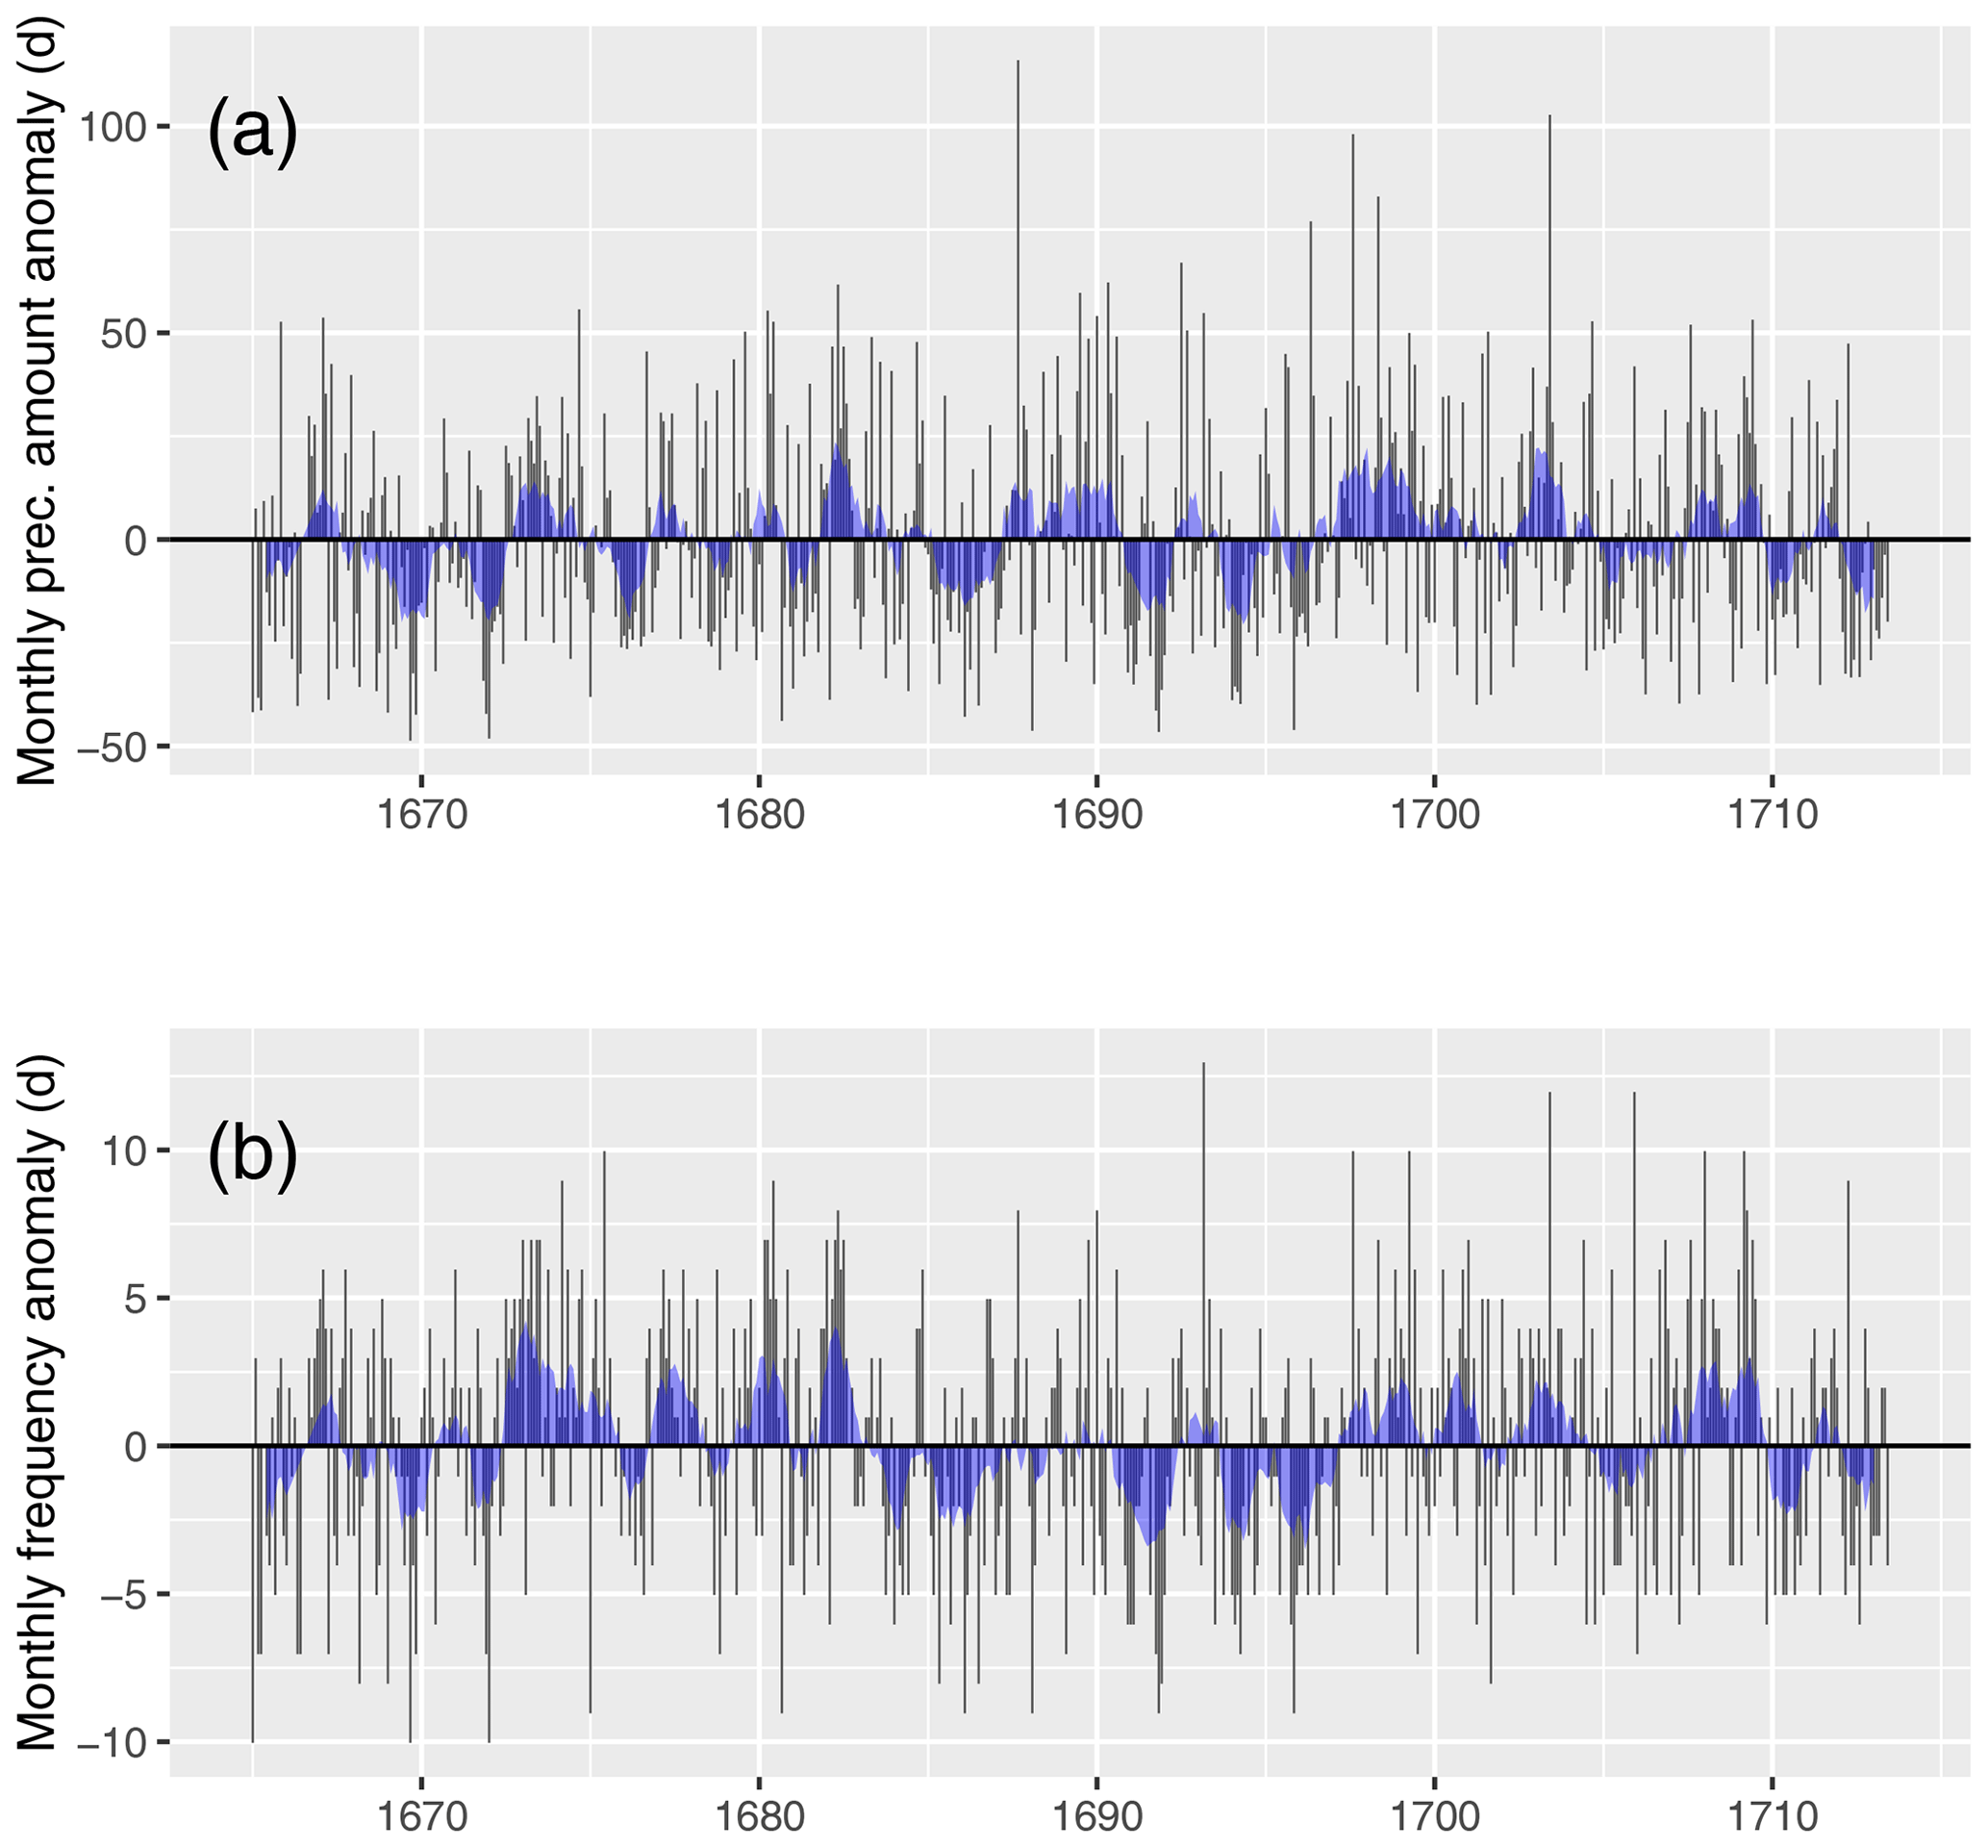
Figure 9In (a), monthly precipitation anomalies are plotted from 1665–1713 with respect to the monthly mean of the whole observation period. In (b), the monthly frequency anomalies of wet days are plotted. In each case, the blue shaded curve shows the 11-month running mean.
Second, we examine seasonal variability. To do this, we have plotted the precipitation totals for each season in Fig. 10. The red bars indicate the number of days when Morin did not make observations. With just a few exceptions, the observations are continuous. Rainy seasons with precipitation totals greater than 250 mm occurred in MAM 1682, JJA 1682, SON 1687, JJA 1697, and JJA 1703. Furthermore, with respect to the other DJF seasons, DJF 1666/1667 slightly stands out with a PT of 214.6 mm. Dry seasons with precipitation totals less than 60 mm occurred in SON 1669, DJF 1671/1672, and DJF 1690/1691. The three highest annual precipitation totals are recorded in 1682 (788.7 mm), 1697 (758.0 mm), and 1698 (754.8 mm). The three lowest annual precipitation totals are recorded in 1669 (348.0 mm), 1691 (373.4 mm), and 1694 (354.6 mm). Morin's differentiation between rainfall and snowfall allows us to analyze the winters in terms of snowfall. The days of snowfall for the seasons DJF, MAM, and SON are shown in Fig. A2. Thereby, each day was considered where at least one note with “n” was made. DJF 1678/1679 and 1694/1695 stand out with 26 d of snowfall. In MAM 1688 and 1701, Morin noted 9 d of snowfall. We can compare Morin's snow records with those of Gordon Manley for Britain (Manley, 1969; Veale et al., 2018): Gordon Manley described the winter of 1695 as “notably snowy”, which is consistent with Morin's records. Further, Manley writes that snow has covered the lower ground around London on a number of days in May 1698; 13 May 1698 was probably the latest in spring. No snowfall is noted in Morin's records. However, according Morin's notes it was relatively cold and rainy in Paris in May 1698.
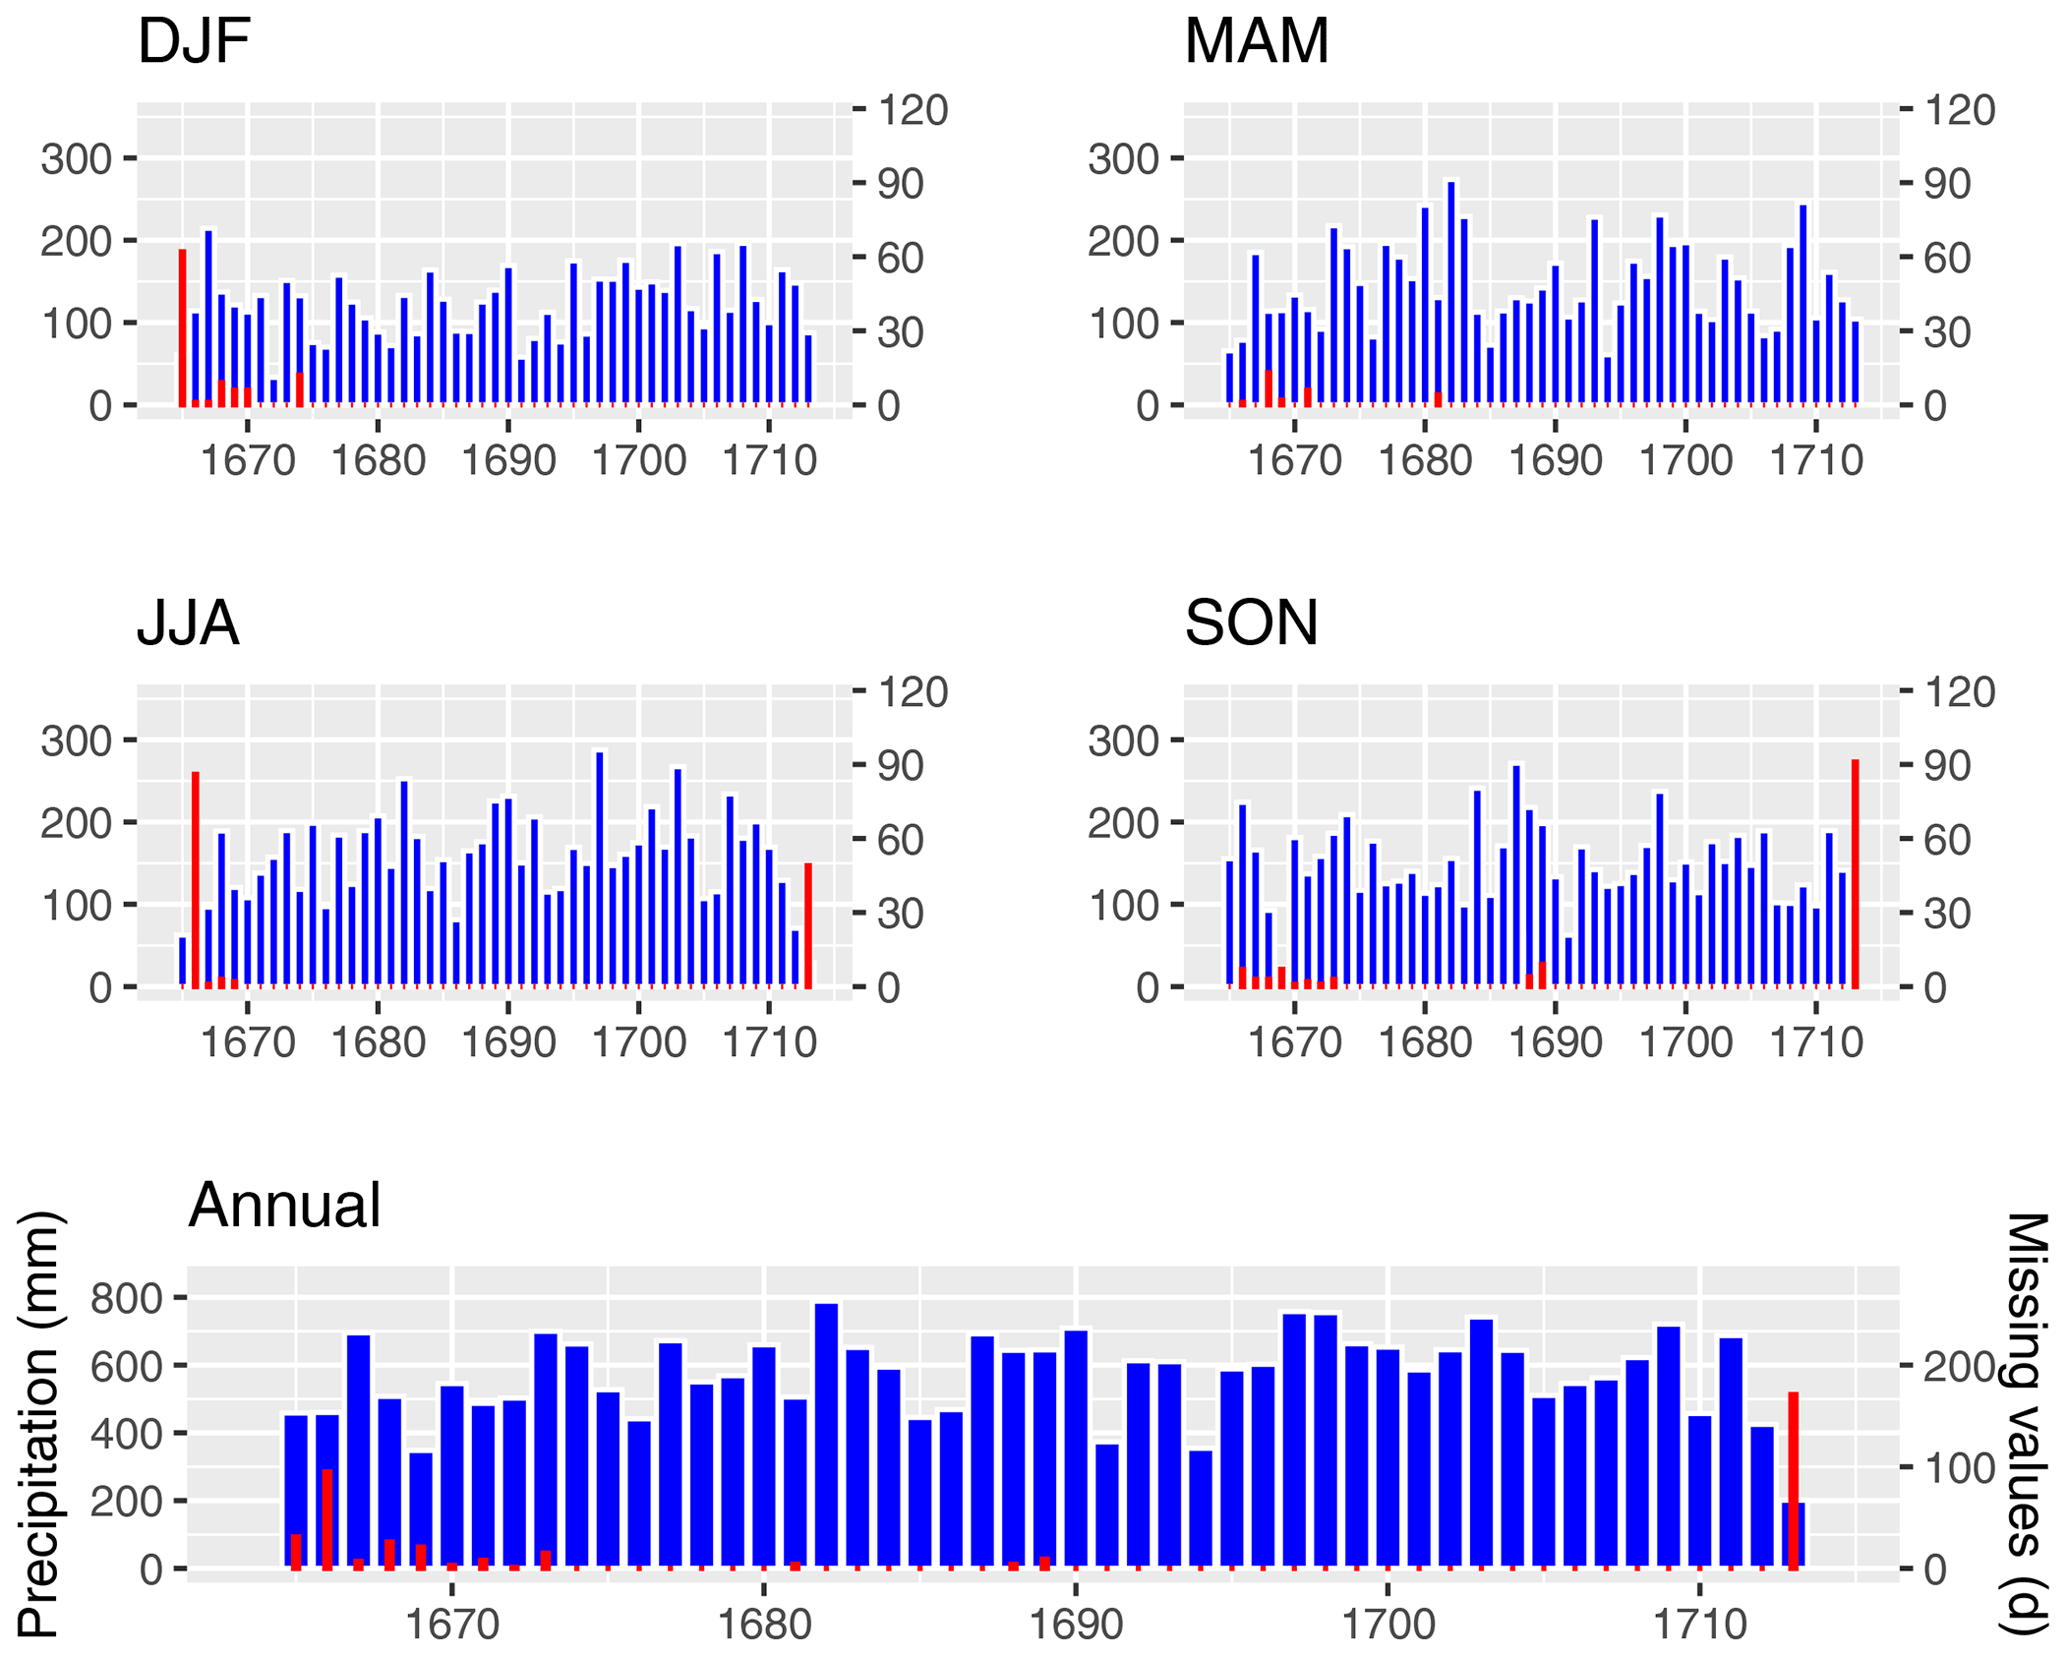
Figure 10Seasonal (DJF, MAM, JJA, SON) and annual precipitation totals are shown as blue bars. The red bars show the days with missing entries in Morin's journal.
Third, we performed an impact analysis. Here, we examined the indices wet days (daily PT ≥ 1 mm), dry days (PT ≤ 1 mm), consecutive wet days (CWD), and consecutive dry days (CDD). The last two indices are important because extreme values, for example in spring or summer, may have led to crop failure. With respect to the interannual variability of wet and dry days (Fig. 11a), there are no conspicuous findings. The same is true for CWD, but exceptionally long CDD periods are noted in 1669 with 48 d and in 1672 with 43 d (Fig. 11b). The latter dry period is even more pronounced in DJF with 69 CDD (Fig. A3). In JJA, the year 1686 stands out with 31 CDD. No exceptional dry periods are noted in MAM. In SON, longer dry periods occurred in 1669 (43 d) and 1691 (37 d).
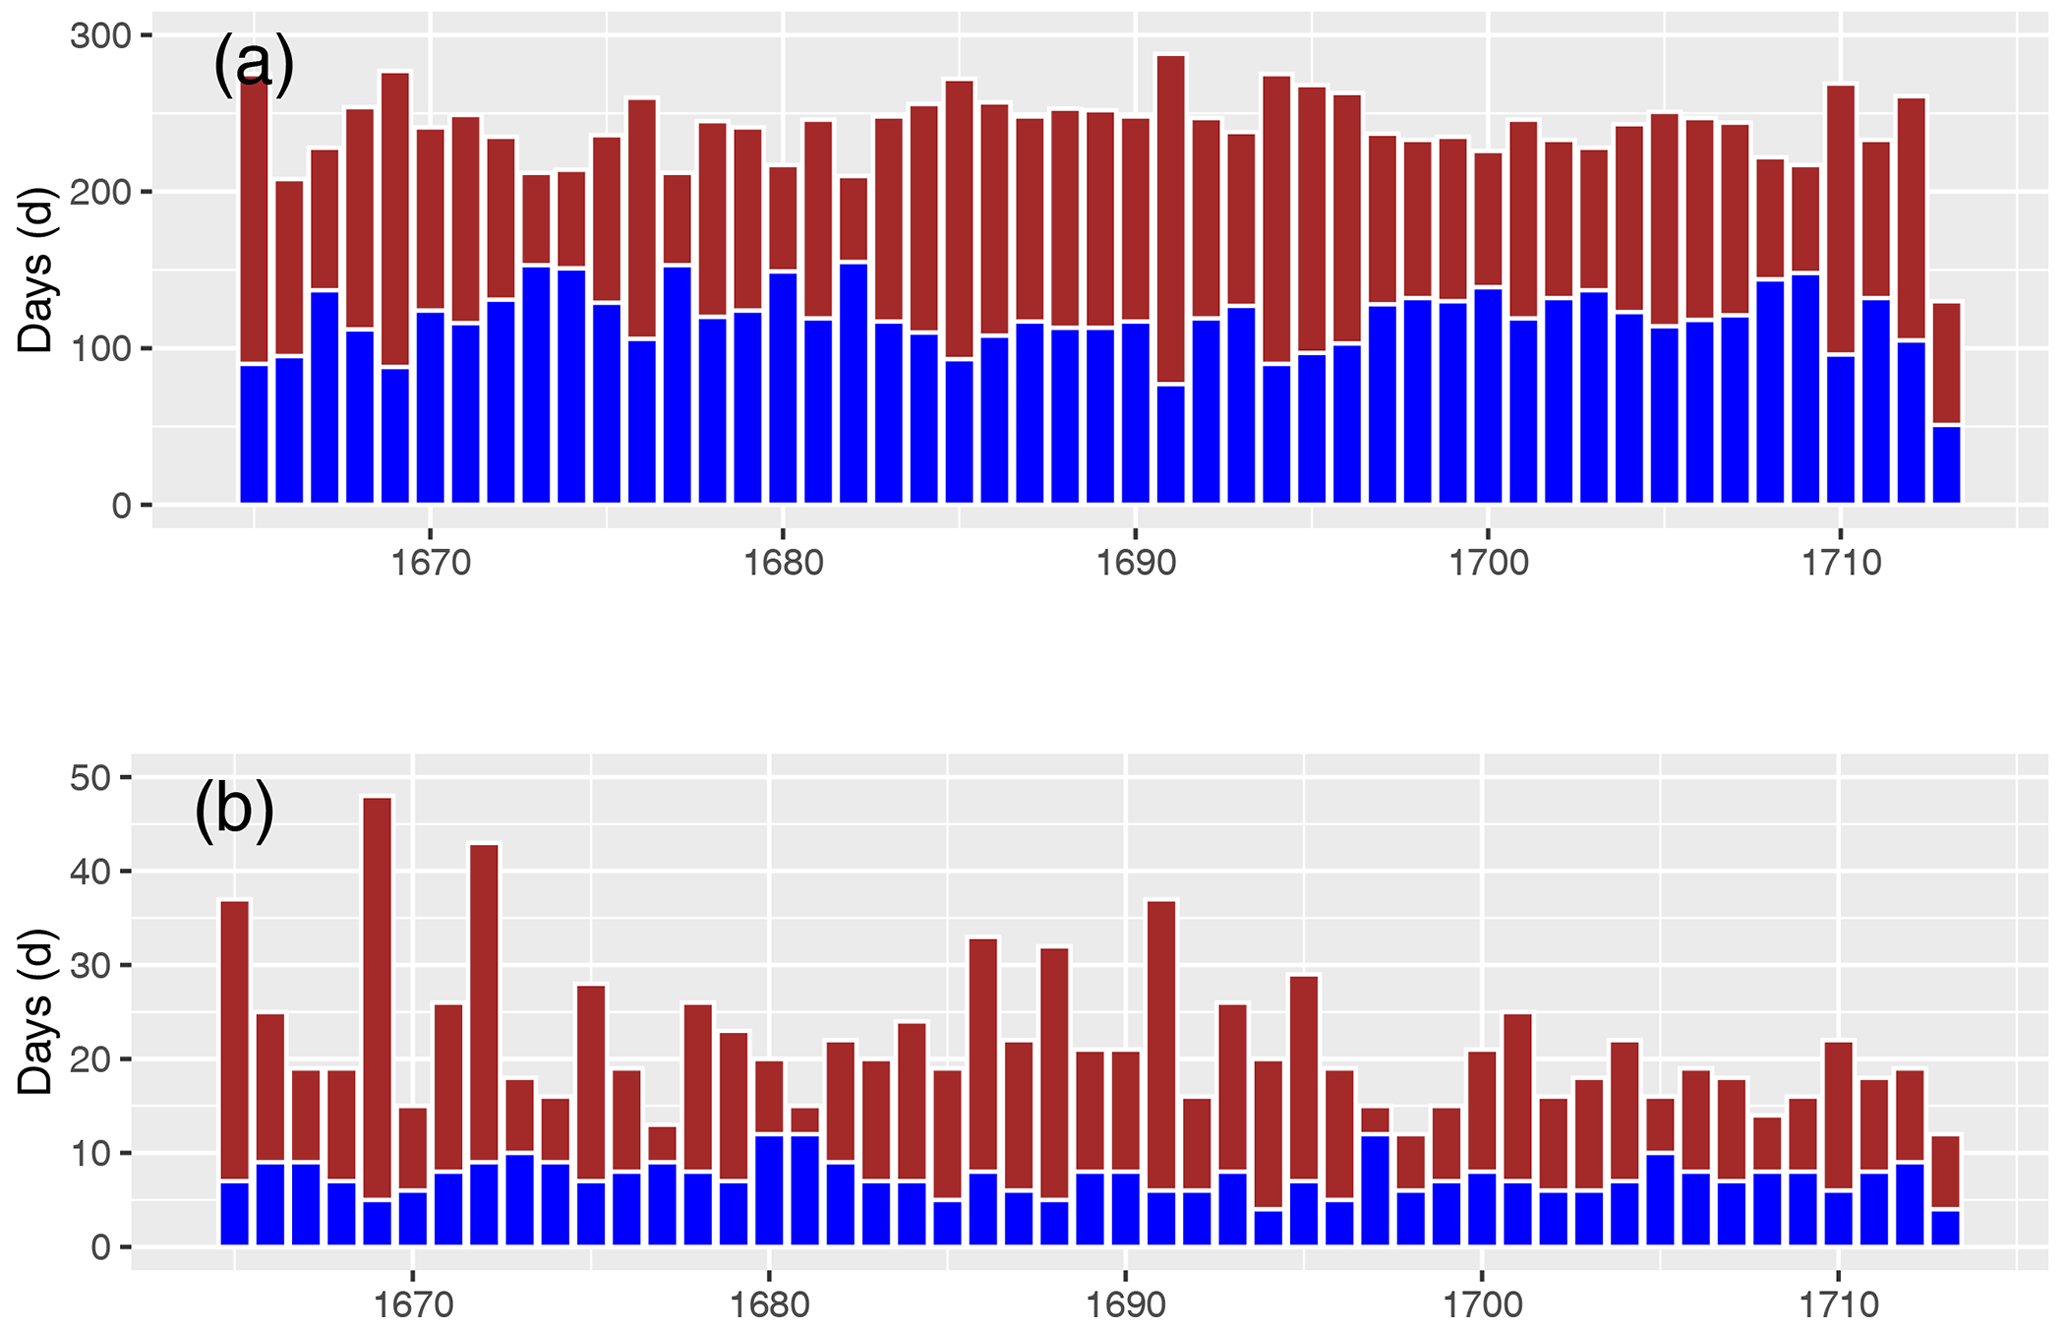
Figure 11In (a), dry days (red bar; PT < 1 mm) and wet days (blue bar; PT ≥ 1 mm) are plotted. In (b), the contiguous dry days (red bar; CDD) and the contiguous wet days (blue bar; CWD) are plotted.
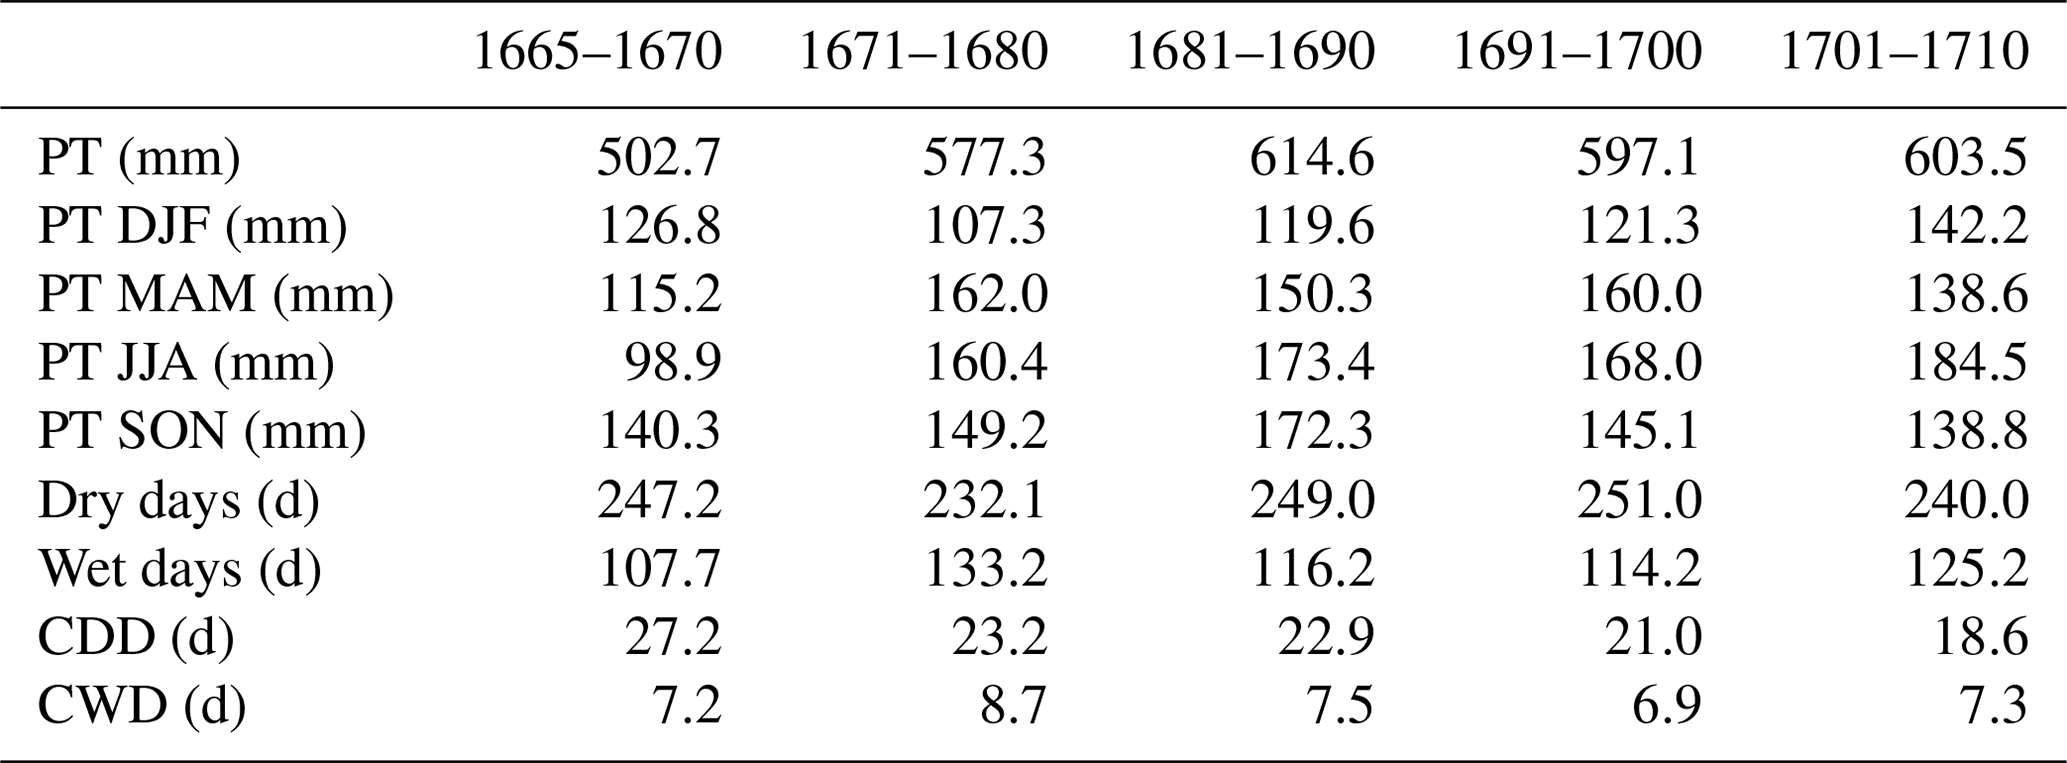
Finally, Table 3 shows the decadal variability for different indices. Here we see a minimum for the annual PT in the 1660s and a maximum in the 1680s. In DJF, the maximum appears in the 1700s and the minimum appears in the 1670s. The JJA-season shows the highest mean PT in the 1700s and the lowest is in the 1660s. Furthermore, the 1660s show a high value of CDD, and the 1700s show a low value of CDD. In terms of CWD, the 1670s show the highest value with 8.7 d and the 1690s the lowest value with 6.9 d.
Table 3Seasonal and yearly means of different indices per decade: yearly means of precipitation totals (PT), decadal means of precipitation totals (PT DJF, PT MAM, PT JJA, and PT SON), yearly means of dry days, yearly means of wet days, yearly means of consecutive dry days (CDD), and yearly means of consecutive wet days (CWD).
Louis Morin had a strict daily routine and was conscientious. This is reflected in his careful observations of rainfall (at least one entry of his different measurements for 98.7 % of all days), where he continuously recorded both intensity (RI) and duration of precipitation (RD) from October 1665 to July 1713 in Paris. Due to the subjective nature of eyewitness observations, the original entries were checked for homogeneity. A comparison with modern data suggests that Morin underestimated summer months. This is the reason why we separated the calibration into two periods (May–September and October–April). A comparison with the measurements by de la Hire (father and son) suggests that Morin underestimated summer months.
For the calibration, we compared the results of four different transfer functions (functions of RI and RD). Morin's observations overlap with instrumental measurements of the de la Hires (Slonosky, 2002) available on monthly basis from 1688 to 1713. Based on our analyses and the method of least-squares error, we chose a multiplicative interaction model as transfer function. To test the quality of the reconstruction, we analyzed it with the measurements of father and son de la Hire, proxy data, an internal analysis of Morin's measurements and observations of different climate variables, and modern data. Thus, we assessed the reliability of the precipitation reconstructions based on Morin's data as follows. We have low confidence regarding exceptionally high precipitation amounts. We have moderate confidence regarding the exact quantity of daily, seasonal, and annual precipitation totals. We have high confidence in the indices of an impact analysis (dry days, wet days, consecutive dry days, and consecutive wet days), in monthly frequencies of rainfall, and in interannual, interseasonal, and interdecadal variability.
The agreement of the monthly rain frequency with modern data shows that Morin documented the rain events well. Looking at the time series of precipitation totals, there are no exceptionally strong extremes for maximum and minimum precipitation. Rainy seasons with precipitation totals greater than 250 mm occurred in MAM 1682, JJA 1682, SON 1687, JJA 1697 and JJA 1703. Furthermore, compared to other DJF seasons, the winter 1666/67 slightly stands out with a precipitation total of 214.6 mm. Dry seasons with precipitation totals less than 60 mm occurred in SON 1669, DJF 1671/1672 and DJF 1690/1691. The three highest annual precipitation totals are recorded in 1682 (788.7 mm), 1697 (758.0 mm), and 1698 (754.8 mm), the three lowest annual precipitation totals in 1669 (348.0 mm), 1691 (373.4 mm), and 1694 (354.6 mm). The impact analysis shows 69 d of consecutive dry days for DJF in 1671/1672. In the growing season of the plants, MAM, no abnormalities could be reconstructed, and in JJA a longer dry period with 31 d is noted in 1686. In summary, compared to the temperature variability (e.g., winter 1708/1709; see Pliemon et al., 2022), this period is much less conspicuous in terms of precipitation.
A1 Appendix A figures
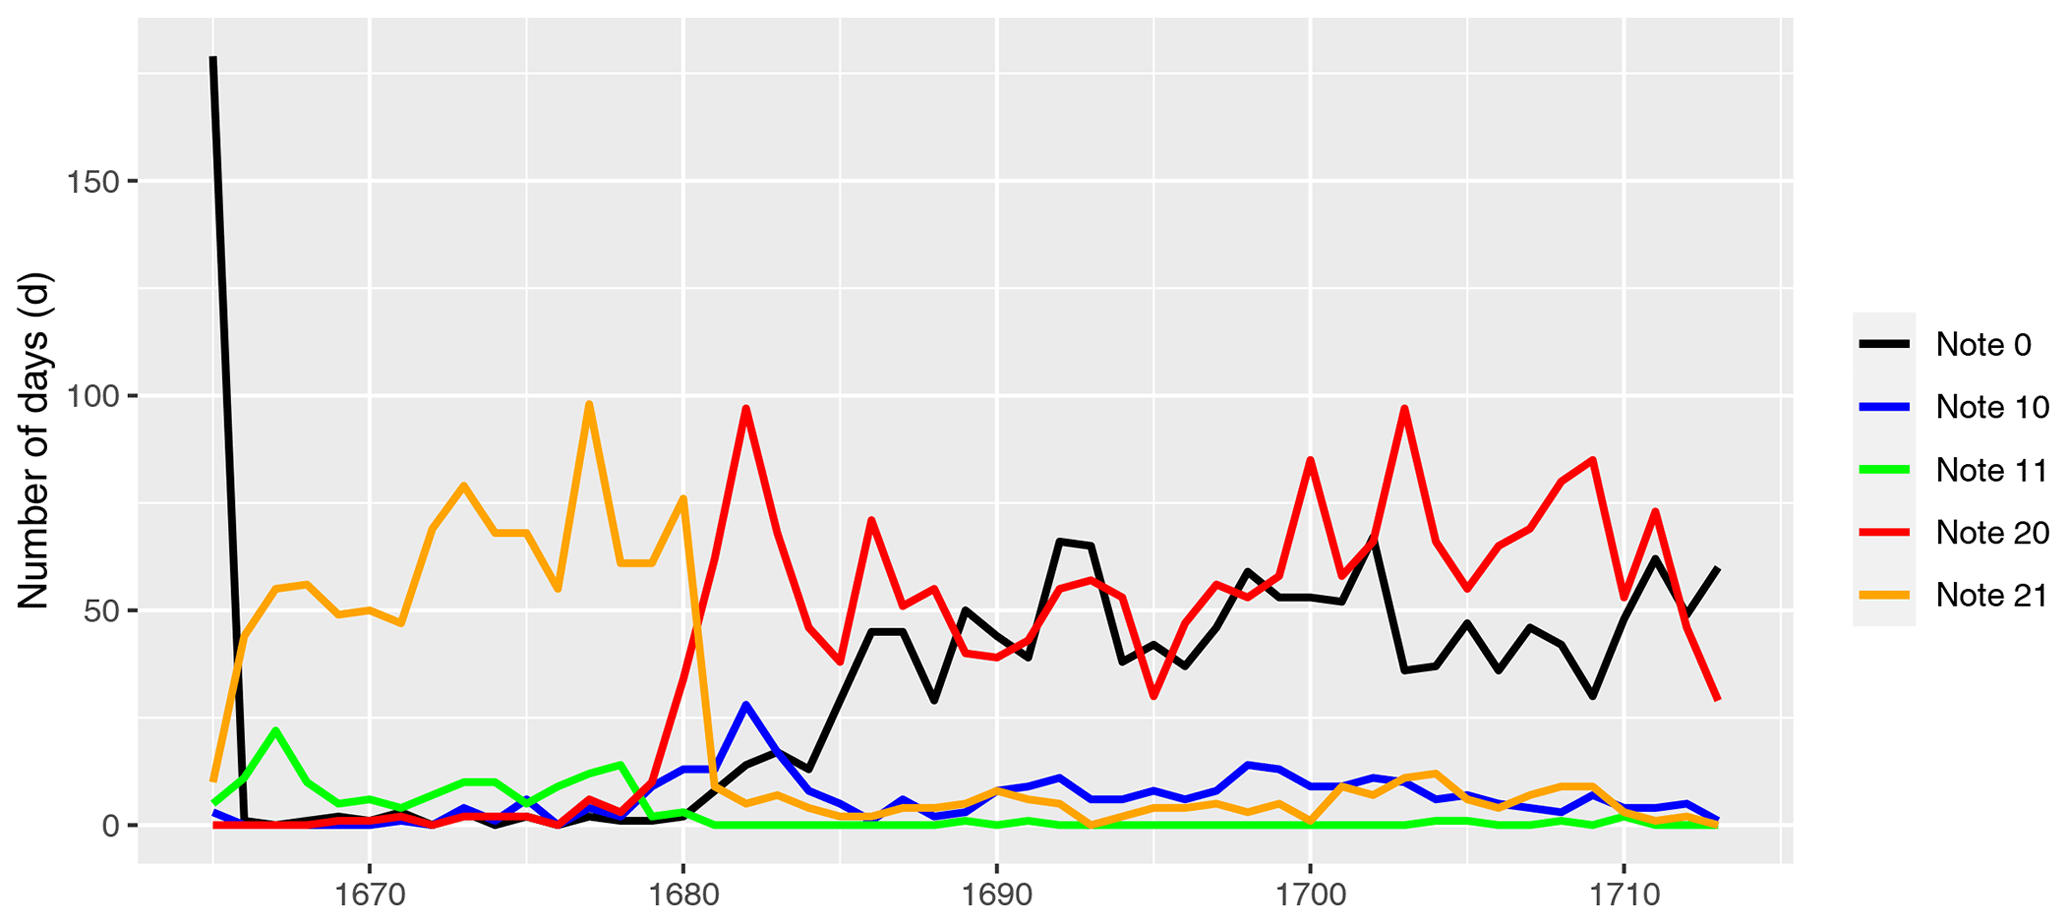
Figure A1The colored lines show the time series of different notes in Louis Morin's journal of appearances per year.
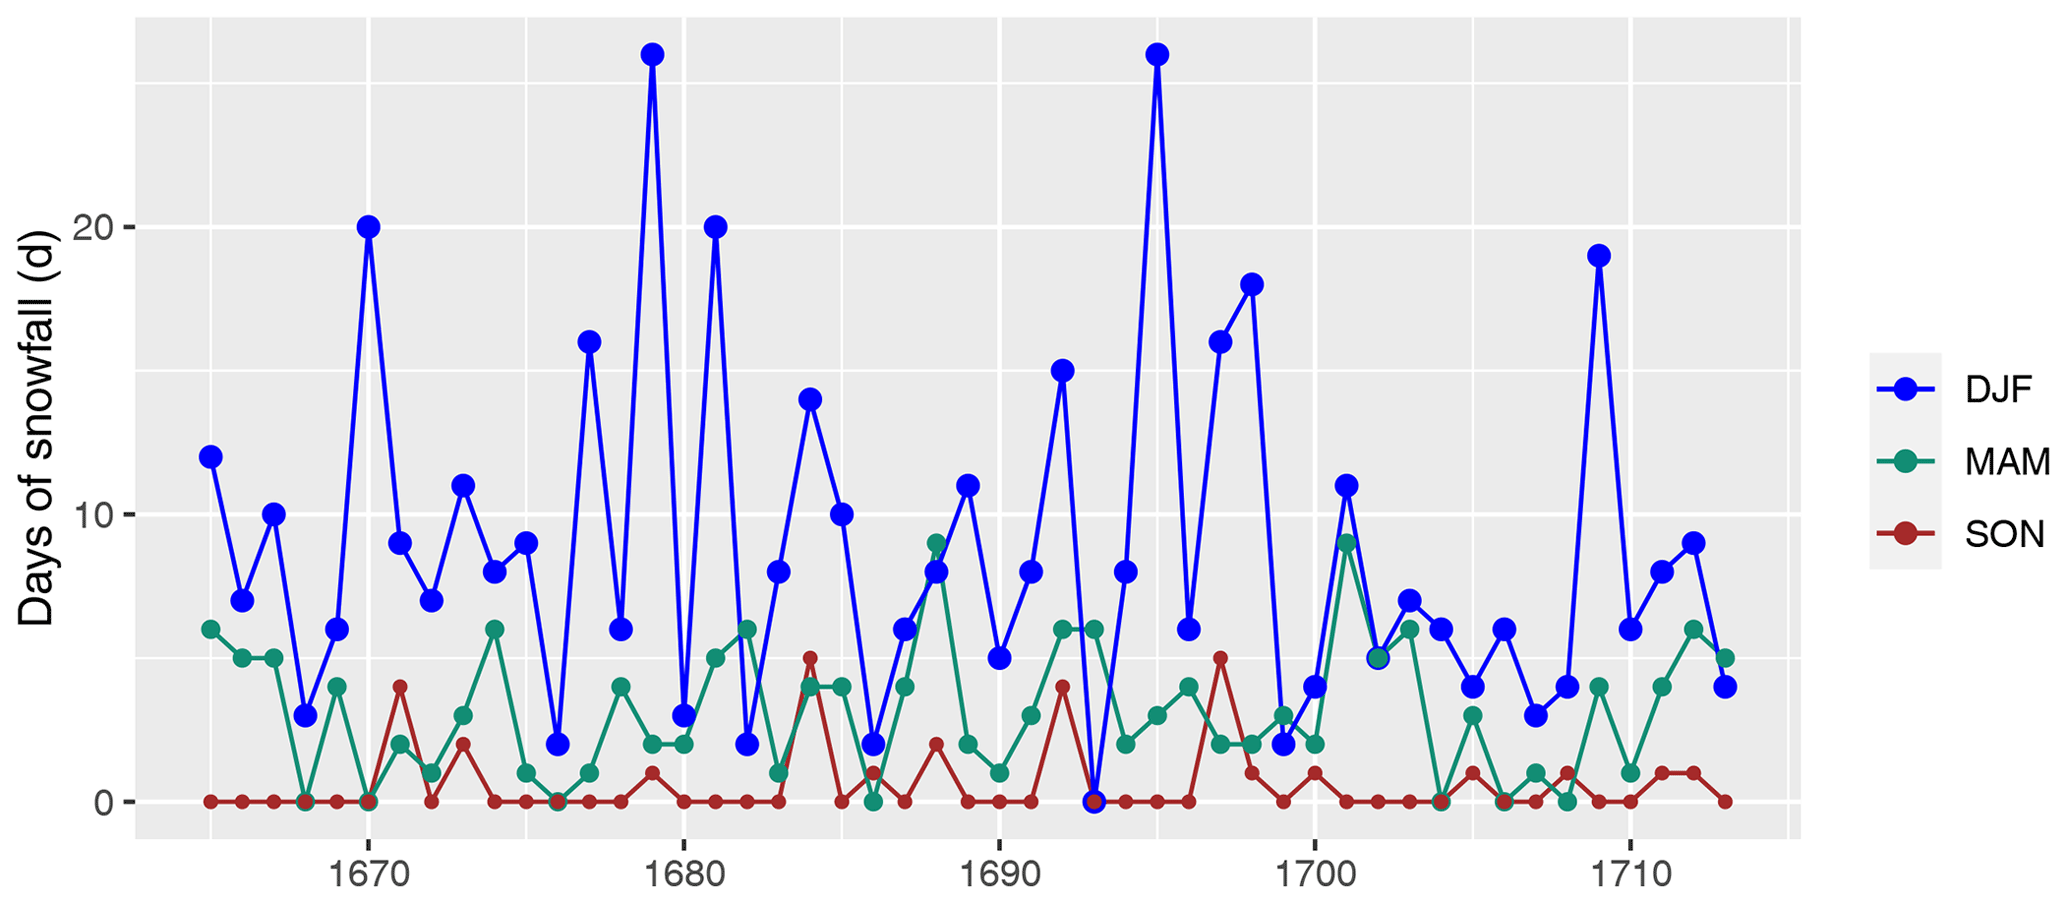
Figure A2Total number of days when at least one note for snow was made per season (DJF, MAM, SON).
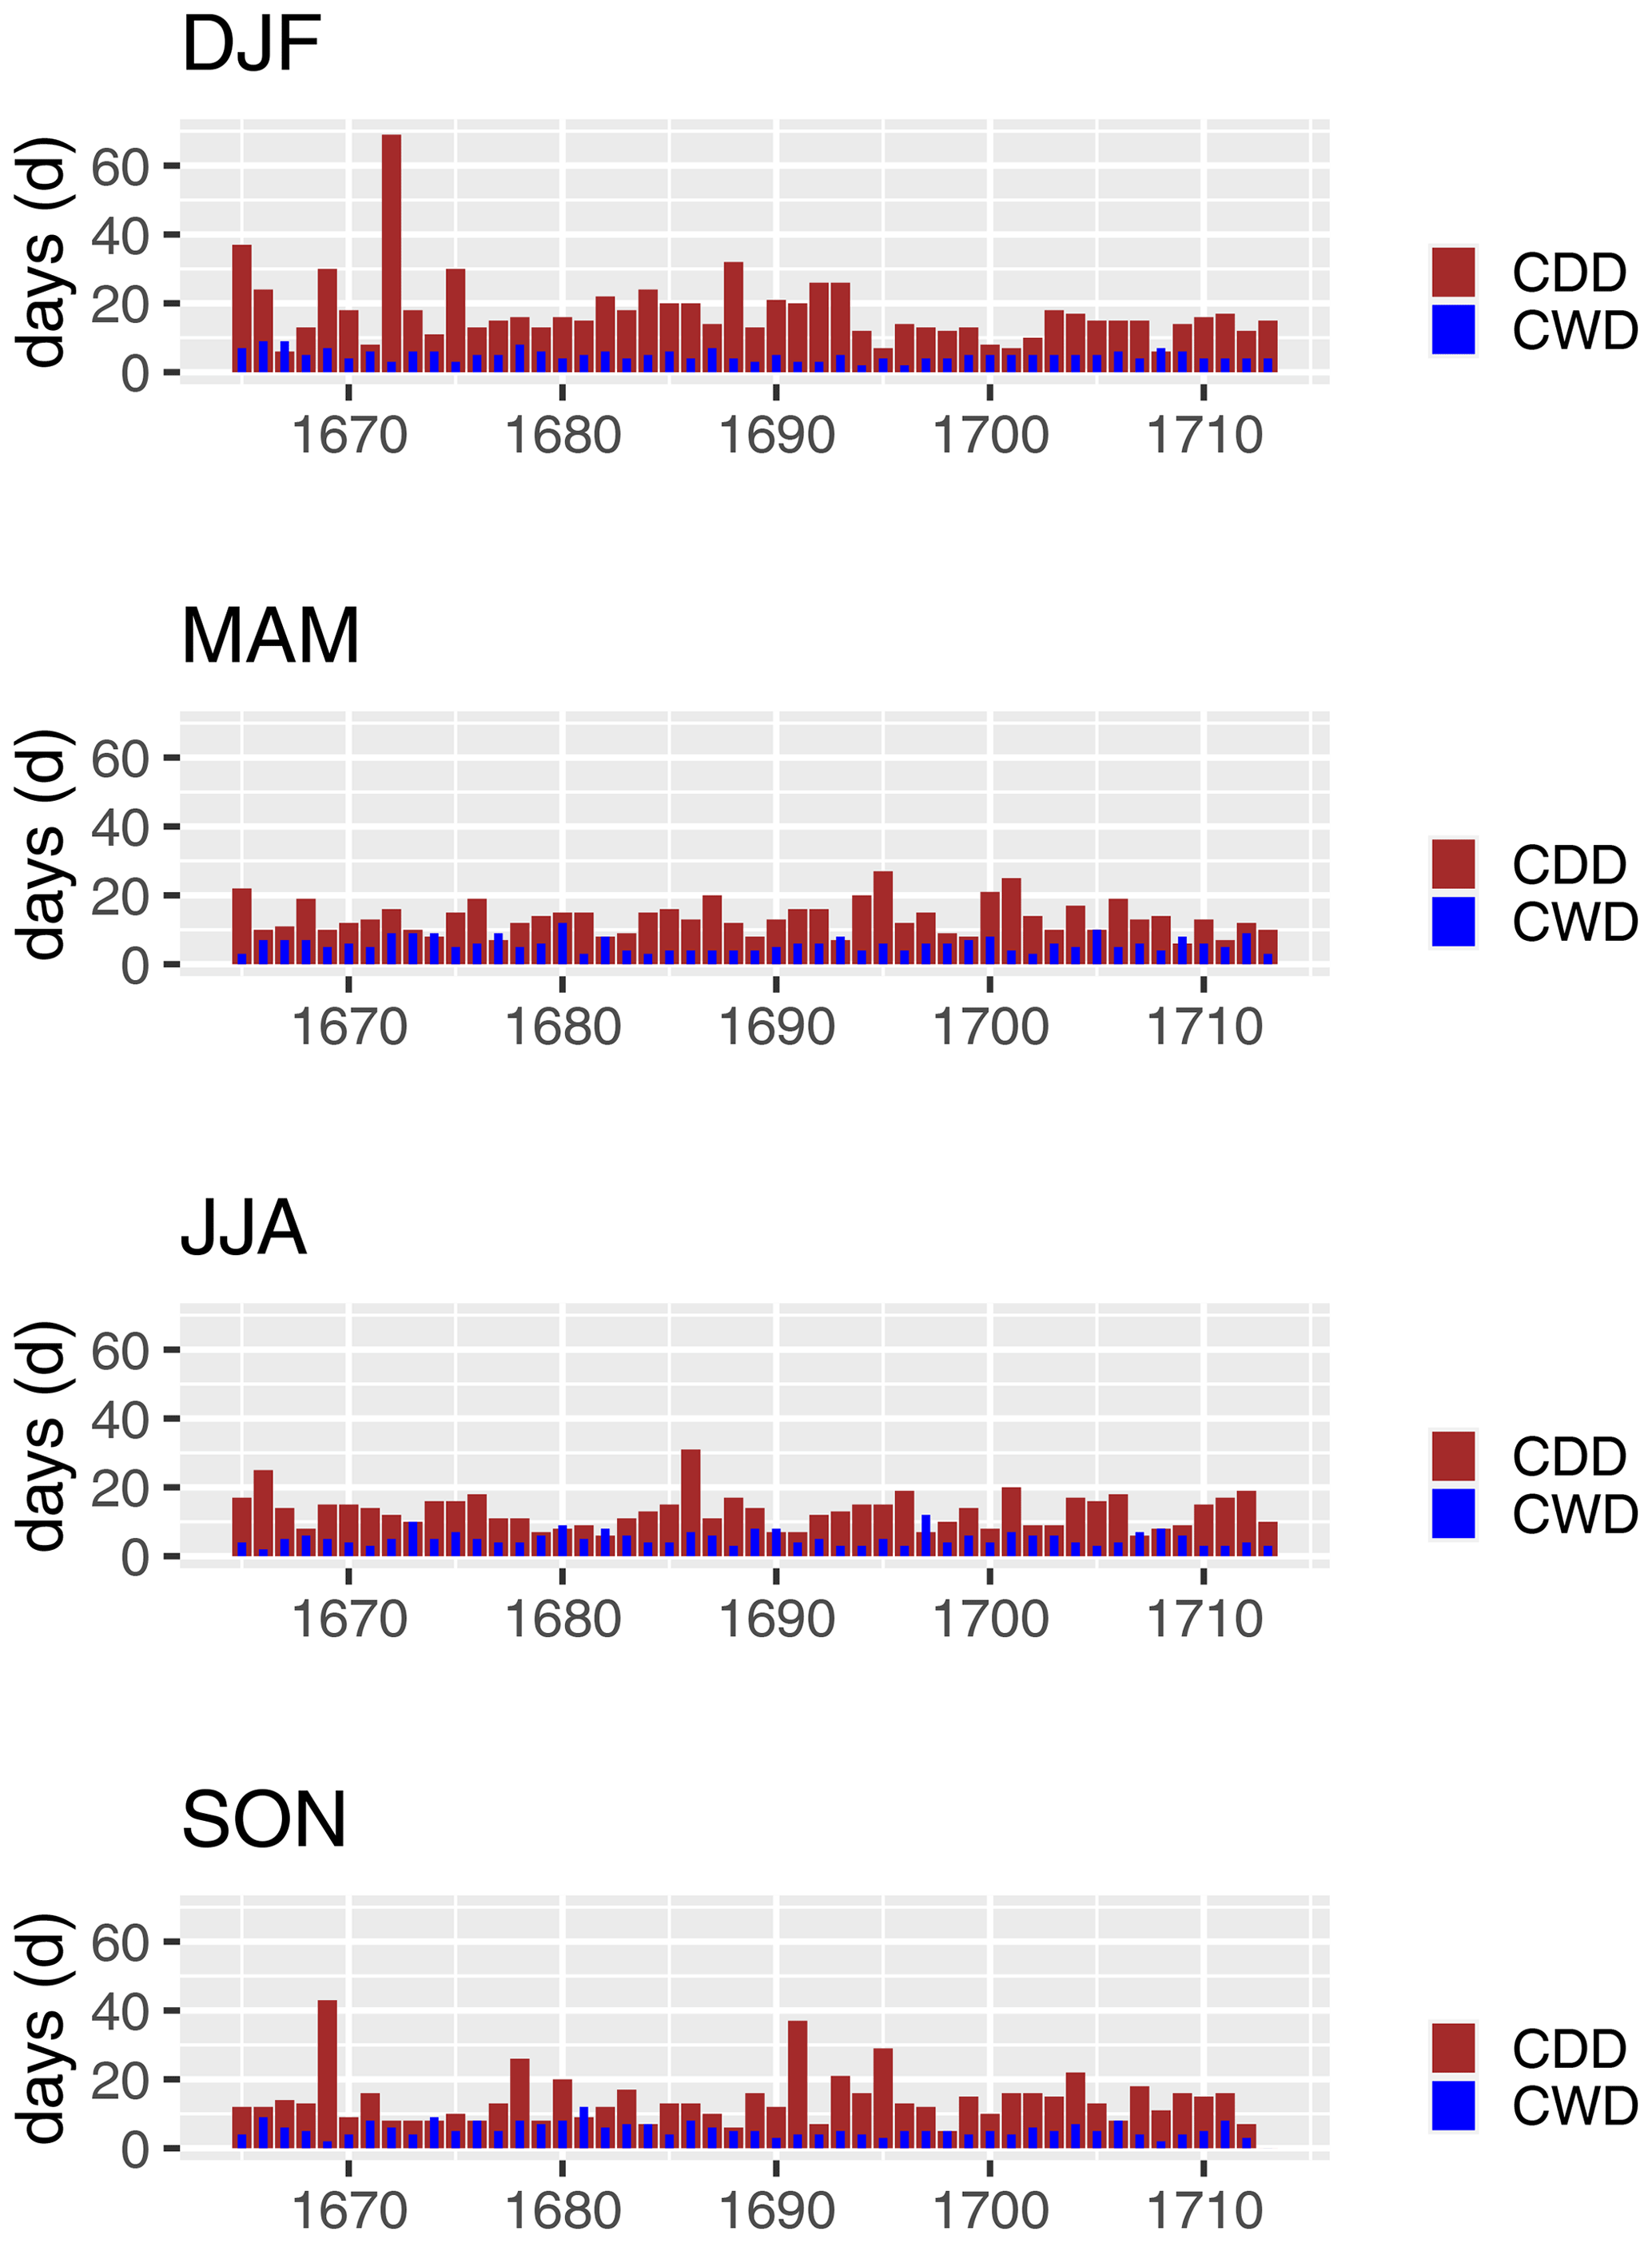
Figure A3Consecutive dry days (CDD, red) and consecutive wet days (CWD, blue) for each season.
A2 Appendix A tables
Table A1Parameters for Eq. (4) with the lowest root-mean-square error (RMSE) and mean absolute error (MAE) for the warmer months (May to September) and colder months (October to April).
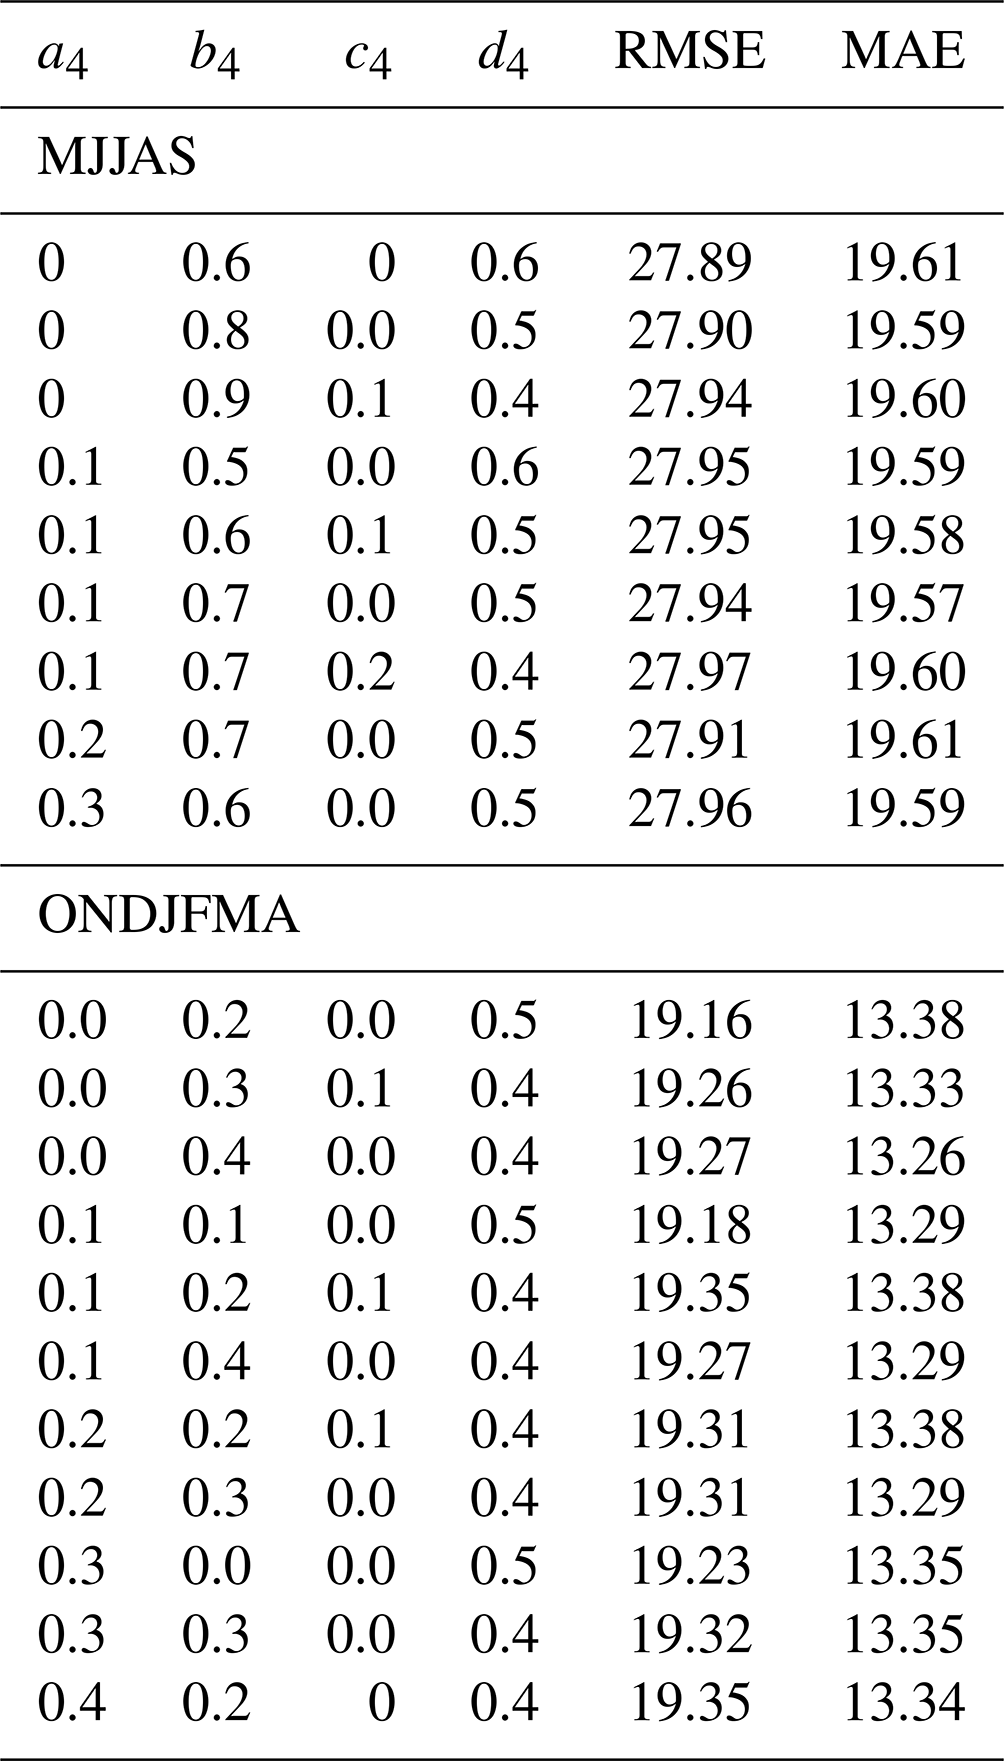
Table A2Precipitation totals (mm) of each month and year from 1665–1713.
All of the data used to perform the analysis in this study are described and properly referenced in the paper. The supplementary data set can be found here: https://doi.org/10.5281/zenodo.7404635 (Pliemon et al., 2023b).
TP was responsible for conceptualization, data curation, formal analysis, investigation, methodology, resources, software, validation, visualization, and writing (original draft preparation, as well as review and editing). UF was responsible for conceptualization, funding acquisition, project administration, resources, supervision, validation, and writing (review and editing). CR was responsible for resources, validation, and writing (review and editing). CP was responsible for resources, validation, and writing (review and editing).
The contact author has declared that none of the authors has any competing interests.
Publisher's note: Copernicus Publications remains neutral with regard to jurisdictional claims made in the text, published maps, institutional affiliations, or any other geographical representation in this paper. While Copernicus Publications makes every effort to include appropriate place names, the final responsibility lies with the authors.
This research has been supported by the Austrian Science Fund (grant no. Clim_Hist_LIA P31088-N29). We thank PRF (https://www.proof-reading-service.com/en/, last access: 2 November 2023) for the conscientious proofreading on an earlier version of the paper. We acknowledge the EOBS dataset from the EU FP6 project UERRA (https://www.uerra.eu, last access: 13 December 2022) and the Copernicus Climate Change Service, as well as the data providers in the ECA&D project (https://www.ecad.eu, last access: 13 December 2022).
This research has been supported by the Austrian Science Fund (grant no. Clim_Hist_LIA P31088-N29).
This paper was edited by Chantal Camenisch and reviewed by Cary Mock and Neil Macdonald.
Auer, I., Böhm, R., and Schöner, W.: Austrian Long-term Climate 1767–2000: Multiple Instrumental Climate Time Series from Central Europe, in: vol. 25, Zentralanstalt für Meteorologie und Geodynamik, Wien, ISBN 1016-6254, 2001. a
Auer, I., Böhm, R., Jurković, A., Orlik, A., Potzmann, R., Schöner, W., Ungersböck, M., Brunetti, M., Nanni, T., Maugeri, M., Briffa, K., Jones, P., Efthymiadis, D., Mestre, O., Moisselin, J.-M., Begert, M., Brazdil, R., Bochnicek, O., Cegnar, T., Gajić-Čapka, M., Zaninović, K., Majstorović, v., Szalai, S., Szentimrey, T., and Mercalli, L.: A new instrumental precipitation dataset for the greater alpine region for the period 1800–2002, Int. J. Climatol., 25, 139–166, https://doi.org/10.1002/joc.1135, 2005. a
Brönnimann, S., Allan, R., Ashcroft, L., Baer, S., Barriendos, M., Brázdil, R., Brugnara, Y., Brunet, M., Brunetti, M., Chimani, B., Cornes, R., Domínguez-Castro, F., Filipiak, J., Founda, D., Herrera, R. G., Gergis, J., Grab, S., Hannak, L., Huhtamaa, H., Jacobsen, K. S., Jones, P., Jourdain, S., Kiss, A., Lin, K. E., Lorrey, A., Lundstad, E., Luterbacher, J., Mauelshagen, F., Maugeri, M., Maughan, N., Moberg, A., Neukom, R., Nicholson, S., Noone, S., Nordli, Ø., Ólafsdóttir, K. B., Pearce, P. R., Pfister, L., Pribyl, K., Przybylak, R., Pudmenzky, C., Rasol, D., Reichenbach, D., Řezníčková, L., Rodrigo, F. S., Rohr, C., Skrynyk, O., Slonosky, V., Thorne, P., Valente, M. A., Vaquero, J. M., Westcottt, N. E., Williamson, F., and Wyszyński, P.: Unlocking pre-1850 instrumental meterologoical records: a global inventory, B. Am. Meteorol. Soc., 100, ES389–ES413, 2019. a
Bradley, R. S. and Jones, P. D.: `Little Ice Age' summer temperature variations: their nature and relevance to recent global warming trends, Holocene, 3, 367–376, https://doi.org/10.1177/095968369300300409, 1993. a
Brázdil, R., Dobrovolny, P., Trnka, M., Büntgen, U., Řezníčková, L., Kotyza, O., Valasek, H., and Stepanek, P.: Documentary and instrumental-based drought indices for the Czech Lands back to AD 1501, Clim. Res., 70, 103–117, https://doi.org/10.3354/cr01380, 2016. a
Brázdil, R., Kiss, A., Luterbacher, J., Nash, D. J., and Řezníčková, L.: Documentary data and the study of past droughts: a global state of the art, Clim. Past, 14, 1915–1960, https://doi.org/10.5194/cp-14-1915-2018, 2018. a
Brumme, B.: Klimadaten 1683–1774 von Mitteldeutschland und Berlin nach einer Bearbeitung der Beobachtungs-Tagebücher der Familie KIRCH (Teil 1), MS thesis, Meteorologisches Institut der Universität Bonn, Bonn, 1978. a
Camuffo, D.: Analysis of the series of precipitation at Padova, Italy, Climatic Change, 6, 57–77, https://doi.org/10.1007/BF00141668, 1984. a
Camuffo, D.: Evidence from the archives of societies: early instrumental observations, in: The Palgrave Handbook of Climate History, Chap. 7, edited by: White, S., Pfister, C., and Mauelshagen, F., Palgrave Macmillan, London, 83–92, ISBN 978-1-137-43019-9, 2018. a
Camuffo, D. and Jones, P.: Improved Understanding of Past Climatic Variability from Early Daily European Instrumental Sources, in: vol. 53, Springer, ISBN 1-4020-0556-3, https://doi.org/10.1023/A:1014902904197, 2002. a
Camuffo, D., Becherini, F., and della Valle, A.: The Beccari series of precipitation in Bologna, Italy, from 1723 to 1765, Climatic Change, 155, 359–376, https://doi.org/10.1007/s10584-019-02482-x, 2019. a, b
Camuffo, D., della Valle, A., Becherini, F., and Zanini, V.: Three centuries of daily precipitation in Padua, Italy, 1713–2018: history, relocations, gaps, homogeneity and raw data, Climatic Change, 162, 923–942, https://doi.org/10.1007/s10584-020-02717-2, 2020. a, b, c, d, e
Camuffo, D., Becherini, F., and della Valle, A.: How the rain-gauge threshold affects the precipitation frequency and amount, Climatic Change, 170, 1573–1480, https://doi.org/10.1007/s10584-021-03283-x, 2022a. a
Camuffo, D., Becherini, F., della Valle, A., and Zanini, V.: A comparison between different methods to fill gaps in early precipitation series, Environ. Earth Sci., 81, 345, https://doi.org/10.1007/s12665-022-10467-w, 2022b. a, b, c
Cleary, D. M., Wynn, J. G., Ionita, M., Forray, F. L., and Onac, B. P.: Evidence of long-term NAO influence on East-Central Europe winter precipitation from a guano-derived δ15N record, Sci. Rep., 7, 14095, https://doi.org/10.1038/s41598-017-14488-5, 2017. a
Cornes, R. C., Jones, P. D., Briffa, K. R., and Osborn, T. J.: A daily series of mean sea-level pressure for Paris, 1670–2007, Int. J. Climatol., 32, 1135–1150, https://doi.org/10.1002/joc.2349, 2012. a
Cornes, R. C., van der Schrier, G., van den Besselaar, E. J. M., and Jones, P.: An ensemble version of the E-OBS temperature and precipitation datasets, J. Geophy. Res.-Atmos., 123, 9391–9409, https://doi.org/10.1029/2017JD028200, 2018. a, b
Dobrovolný, P., Brázdil, R., Trnka, M., Kotyza, O., and Valášek, H.: Precipitation reconstruction for the Czech Lands, AD 1501–2010, Int. J. Climatol., 35, 1–14, https://doi.org/10.1002/joc.3957, 2015. a
Etien, N., Daux, V., Masson-Delmotte, V., Mestre, O., Stievenard, M., Guillemin, M. T., Boettger, T., Breda, N., Haupt, M., and Perraud, P. P.: Summer maximum temperature in northern France over the past century: instrumental data versus multiple proxies (tree-ring isotopes, grape harvest dates and forest fires), Climatic Change, 94, 429–456, https://doi.org/10.1007/s10584-008-9516-8, 2009. a, b
Gimmi, U., Luterbacher, J., Pfister, C., and Wanner, H.: A method to reconstruct long precipitation series using systematic descriptive observations in weather diaries: the example of the precipitation series for Bern, Switzerland (1760–2003), Theor. Appl. Climatol., 87, 185–199, https://doi.org/10.1007/s00704-005-0193-5, 2007. a, b, c, d
Glaser, R.: Klimageschichte Mitteleuropas, in: 2nd Edn., Primus Verlag, ISBN 978-3-534-20869-2, 2008. a, b, c
Harvey-Fishenden, A. and Macdonald, N.: Evaluating the utility of qualitative personal diaries in precipitation reconstruction in the eighteenth and nineteenth centuries, Clim. Past, 17, 133–149, https://doi.org/10.5194/cp-17-133-2021, 2021. a, b
Hawkins, E., Burt, S., McCarthy, M., Murphy, C., Ross, C., Baldock, M., Brazier, J., Hersee, G., Huntley, J., Meats, R., O'Grady, J., Scrimgeour, I., and Silk, T.: Millions of historical monthly rainfall observations taken in the UK and Ireland rescued by citizen scientists, Geosci. Data J., 10, 246–261, https://doi.org/10.1002/gdj3.157, 2023. a
Labuhn, I., Daux, V., Girardclos, O., Stievenard, M., Pierre, M., and Masson-Delmotte, V.: French summer droughts since 1326 CE: a reconstruction based on tree ring cellulose δ18O, Clim. Past, 12, 1101–1117, https://doi.org/10.5194/cp-12-1101-2016, 2016a. a, b, c
Labuhn, I., Daux, V., Girardclos, O., Stievenard, M., Pierre, M., and Masson-Delmotte, V.: France 670 Year Tree-Ring δ180 Data and SPEI Drought Reconstruction, Tech. rep., NOAA, https://doi.org/10.25921/2n61-ta84, 2016b. a, b
Labuhn, I.., Daux, V., Girardclos, O., Stievenard, M., Pierre, M., Masson-Delmotte, V.: NOAA/WDS Paleoclimatology – France 670 Year Tree-Ring δ18O Data and SPEI Drought Reconstruction, NOAA National Centers for Environmental Information [data set], https://doi.org/10.25921/2n61-ta84, 2016c. a
Lean, J. L., Beer, J., and Bradley, R. S.: Reconstruction of solar irradiance since 1610: implications for climate change, Geophys. Res. Lett., 22, 3195–3198, 1995. a
Legrand, J.-P. and Le Goff, M.: Louis Morin et les observations météorologiques sous Louis XIV, La Vie des Sciences, 4, 251–281, 1987. a, b, c, d, e, f, g
Lundstad, E., Brugnara, Y., Pappert, D., Kopp, J., Samakinwa, E., Hürzeler, A., Andersson, A., Chimani, B., Cornes, R., Demarée, G., Filipiak, J., Gates, L., Ives, G. L., Jones, J. M., Jourdain, S., Kiss, A., Nicholson, S. E., Przybylak, R., Jones, P., Rousseau, D., Tinz, B., Rodrigo, F. S., Grab, S., Domínguez-Castro, F., Slonosky, V., Cooper, J., Brunet, M., and Brönnimann, S.: The global historical climate database HCLIM, Sci. Data, 10, 44, https://doi.org/10.1038/s41597-022-01919-w, 2023. a
Luterbacher, J., Xoplaki, E., Dietrich, D., Jones, P., Davies, T., Portis, D., Gonzalez-Rouco, J., von Storch, H., Gyalistras, D., Casty, C., and Wanner, H.: Extending North Atlantic Oscillation reconstructions back to 1500, Atmos. Sci. Lett., 2, 114–124, https://doi.org/10.1006/asle.2001.0044, 2001. a
Luterbacher, J., Schmutz, C., Gyalistras, D., Xoplaki, E., and Wanner, H.: Climatic Research Unit, University of East Anglia – Luterbacher NAO Reconstructions Back to 1500, University of East Anglia [data set], https://crudata.uea.ac.uk/cru/data/paleo/naojurg/ (last access: 31 August 2023), 2002. a
Manley, G.: Snowfall In Britain Over The Past 300 Years, Weather, 24, 428–437, https://doi.org/10.1002/j.1477-8696.1969.tb03117.x, 1969. a
Mann, M. E., Bradley, R. S., and Hughes, M. K.: Global-scale temperature patterns and climate forcing over the past six centuries, Nature, 392, 779–787, https://doi.org/10.1038/33859, 1998. a
Martinez-Villalobos, C. and Neelin, J.: Why do precipitation intensities tend to follow gamma distributions?, J. Atmos. Sci., 76, 3611–3631, https://doi.org/10.1175/JAS-D-18-0343.1, 2019. a
Müller-Plath, G., Lüdecke, H.-J., and Lüning, S.: Long-distance air pressure differences correlate with European rain, Sci. Rep., 12, 10191, https://doi.org/10.1038/s41598-022-14028-w, 2022. a
Murphy, C., Broderick, C., Burt, T. P., Curley, M., Duffy, C., Hall, J., Harrigan, S., Matthews, T. K. R., Macdonald, N., McCarthy, G., McCarthy, M. P., Mullan, D., Noone, S., Osborn, T. J., Ryan, C., Sweeney, J., Thorne, P. W., Walsh, S., and Wilby, R. L.: A 305-year continuous monthly rainfall series for the island of Ireland, 1711–2016, Clim.e Past, 14, 413–440, https://doi.org/10.5194/cp-14-413-2018, 2018. a
Murphy, C., Wilby, R. L., Matthews, T. K. R., Thorne, P., Broderick, C., Fealy, R., Hall, J., Harrigan, S., Jones, P., McCarthy, G., MacDonald, N., Noone, S., and Ryan, C.: Multi-century trends to wetter winters and drier summers in the England and Wales precipitation series explained by observational and sampling bias in early records, Int. J. Climatol., 40, 610–619, https://doi.org/10.1002/joc.6208, 2020. a
Pauling, A., Luterbacher, J., Casty, C., and Wanner, H.: Five hundred years of gridded high-resolution precipitation reconstructions over Europe and the connection to large-scale circulation, Clim. Dynam., 26, 387–405, https://doi.org/10.1007/s00382-005-0090-8, 2006. a
Pfister, C. and Bareiss, W.: The climate in Paris between 1675 and 1715 according to the Meteorological Journal of Louis Morin, in: Climatic Trends and Anomalies in Europe 1675–1715: High Resolution Spatio-temporal Reconstructions from Direct Meteorological Observations and Proxy Data: Methods and Results, edited by: Frenzel, B., Pfister, C., and Gläser, B., Gustav Fischer Verlag, Stuttgart, Jena, New York, 151–171, ISBN 10:3437307746, ISBN 13:9783437307744, 1994. a, b, c, d, e, f, g, h, i
Pfister, C., Brázdil, R., and Glaser, R. (Eds.): Climatic Variability in Sixteenth-Century Europe and Its Social Dimension, in: 1st Edn., Springer, Dordrecht, ISBN 978-0-7923-5934-0, https://doi.org/10.1007/978-94-015-9259-8, 1999. a
Pliemon, T., Foelsche, U., Rohr, C., and Pfister, C.: Subdaily meteorological measurements of temperature, direction of the movement of the clouds, and cloud cover in the Late Maunder Minimum by Louis Morin in Paris, Clim. Past, 18, 1685–1707, https://doi.org/10.5194/cp-18-1685-2022, 2022. a, b, c, d, e, f, g, h, i, j, k
Pliemon, T., Foelsche, U., Rohr, C., and Pfister, C.: Early Humidity Measurements by Louis Morin in Paris between 1701 and 1711 – Data and Metadata, Climate, 11, 156, https://doi.org/10.3390/cli11070156, 2023a. a
Pliemon, T., Foelsche, U., Rohr, C., and Pfister, C.: Precipitation reconstructions for Paris based on the observations by Louis Morin, 1665–1713 CE, Zenodo [data set], https://doi.org/10.5281/zenodo.7404635, 2023b. a
Rinne, K., Loader, N., Switsur, V., and Waterhouse, J.: 400-year May–August precipitation reconstruction for Southern England using oxygen isotopes in tree rings, Quaternary Sci. Rev., 60, 13–25, https://doi.org/10.1016/j.quascirev.2012.10.048, 2013. a
Rohr, C.: Measuring the frequency and intensity of floods of the Traun River (Upper Austria), 1441–1574, Hydrolog. Sci. J., 51, 834–847, https://doi.org/10.1623/hysj.51.5.834, 2006. a
Rohr, C.: Floods of the Upper Danube River and its tributaries and their impact on urban economies (c. 1350–1600): the examples of the towns of Krems/Stein and Wels (Austria), Environ. Hist., 19, 133–148, https://doi.org/10.3197/096734013X13642082568534, 2013. a
Slonosky, V.: Paris Monthly Precipitation 1688–2004, IGBP PAGES/World Data Center for Paleoclimatology Data Contribution Series # 2010-020, NOAA/NCDC Paleoclimatology Program, Boulder, CO, USA [data set], https://catalog.data.gov/dataset/noaa-wds-paleoclimatology-slonosky-2002-paris-monthly (last access: 31 August 2023), 2010. a
Slonosky, V. C.: Wet winters, dry summers? Three centuries of precipitation data from Paris, Geophys. Res. Lett., 29, 34-1–34-4, https://doi.org/10.1029/2001GL014302, 2002. a, b, c, d, e, f, g, h
Slonosky, V. C., Bauden, F., and Waller, R.: Les Observations Du Temps Au XVIIIe Siècle. Galland, Morin, De La Hire Et Le Climat Du “Petit Âge Glaciaire”, in: Antoine Galland (1646–1715) et son Journal: Actes du colloque international organise a l’Universite de Liege (16–18 fevrier 2015) a l'occasion du tricentenaire de sa mort, edited by: Bauden, F. and Waller, R., Peeters Publishers, 497–518, https://doi.org/10.2307/j.ctv1q26m6v.26, 2020. a, b
Strangeways, I.: A history of rain gauges, Weather, 65, 133–138, https://doi.org/10.1002/wea.548, 2010. a, b, c
Thom, H.: A note on the gamma distribution, Mon. Weather Rev., 86, 117–122, https://doi.org/10.1175/1520-0493(1958)086<0117:ANOTGD>2.0.CO;2, 1958. a
Veale, L., Endfield, G., and Bowen, J.: The `Great Snow' of winter 1614/1615 in England, Weather, 73, 3–9, https://doi.org/10.1002/wea.3198, 2018. a
Wheeler, D. and Suarez-Dominguez, J.: Climatic reconstructions for the northeast Atlantic region AD 1685–1700: a new source of evidence from naval logbooks, Holocene, 16, 39–49, https://doi.org/10.1191/0959683606hl894ra, 2006. a
Wheeler, D., Garcia-Herrera, R., Wilkinson, C. W., and Ward, C.: Atmospheric circulation and storminess derived from Royal Navy logbooks, 1685 to 1750, Climatic Change, 101, 257–280, https://doi.org/10.1007/s10584-009-9732-x, 2010. a
White, S., Pfister, C., and Mauelshagen, F.: The Palgrave Handbook of Climate History, Basingstoke, ISBN 978-1-1-137-43019-9, https://doi.org/10.1057/978-1-137-43020-5, 2018. a
Wigley, T. M. L., Lough, J. M., and Jones, P. D.: Spatial patterns of precipitation in England and Wales and a revised, homogeneous England and Wales precipitation series, J. Climatol., 4, 1–25, https://doi.org/10.1002/joc.3370040102, 1984. a
World Meteorological Organization: WMO Guidelines on the Calculation of Climate Normals, WMO-No. 1203, Geneva, https://library.wmo.int/idurl/4/55797 (last access: 2 November 2023), 2017. a