the Creative Commons Attribution 4.0 License.
the Creative Commons Attribution 4.0 License.
 | 30 Sep 2022
Integrating plant wax abundance and isotopes for paleo-vegetation and paleoclimate reconstructions: a multi-source mixing model using a Bayesian framework
Gabriel J. Bowen
Plant wax n-alkane chain length distribution and isotopes have been studied in modern ecosystems as proxies to reconstruct vegetation and climate of the past. However, most paleo-proxies focus on either concentrations or isotopes, whereas both carry complementary information on the mixing sources. We propose a multi-source mixing model in a Bayesian framework that evaluates both chain length distributions and isotopes simultaneously. The model consists of priors that include user-defined source groups and their associated parametric distributions of n-alkane concentration and δ13C. The mixing process involves newly defined mixing fractions such as fractional leaf mass contribution (FLMC) that can be used in vegetation reconstruction. Markov Chain Monte Carlo is used to generate samples from the posterior distribution of these parameters conditioned on both data types. We present three case studies from distinct settings. The first involves n-C27, n-C29, and n-C31 alkanes in lake surface sediments of Lake Qinghai, China. The model provides more specific interpretations on the n-alkane input from aquatic sources than the conventional Paq proxy. The second involves n-C29, n-C31, and n-C33 alkanes in lake surface sediments in Cameroon, western Africa. The model produces mixing fractions of forest C3, savanna C3, and C4 plants, offering additional information on the dominant biomes compared to the traditional two-end-member mixing regime. The third couples the vegetation source model to a hydrogen isotope model component, using biome-specific apparent fractionation factors (εa) to estimate the δ2H of mean annual precipitation. By leveraging chain length distribution, δ13C, and δ2H data of four n-alkane chains, the model produces estimated precipitation δ2H with relatively small uncertainty limits. The new framework shows promise for interpretation of paleo-data but could be further improved by including processes associated with n-alkane turnover in plants, transport, and integration into sedimentary archives. Future studies on modern plants and catchment systems will be critical to develop calibration datasets that advance the strength and utility of the framework.
- Article
(9874 KB) - Full-text XML
-
Supplement
(2106 KB) - BibTeX
- EndNote


Plant wax n-alkyl compounds, including n-alkanes, n-alkanoic acids, n-alkanols, and n-esters are important biomarkers in paleoenvironmental reconstructions. Among them, mid- and long-chain n-alkanes (23–35 carbons) are the most frequently studied lipid compound class due to their great abundance in higher plants and excellent preservation in sedimentary archives (e.g., Sachse et al., 2012; Bush and McInerney, 2013; Freeman and Pancost, 2014; Diefendorf and Freimuth, 2017; Liu and An, 2020). The use of n-alkanes as paleoenvironmental proxies relies on our understanding of their biosynthesis and extensive surveys of their distributions in modern plants. These n-alkanes of various chain lengths are synthesized via the same acetogenic biochemical pathway in all higher plants, which results in the characteristic of odd-over-even carbon chain length predominance (e.g., Eglinton and Hamilton, 1967; Kolattukudy et al., 1976; Cheesbrough and Kolattukudy, 1984; Hayes, 1993; Kunst and Samuels, 2003; Chikaraishi et al., 2004). The persistence of such chain length predominance in sedimentary archives has been used to inform the state of preservation in plant-derived n-alkanes (e.g., Bray and Evans, 1961; Eglinton and Hamilton, 1967; Buggle et al., 2010; Zech et al., 2013; Brittingham et al., 2017).
Despite the shared odd-over-even chain length predominance, the absolute amounts and relative abundances of n-alkanes differ between major plant groups, and the distribution of chain lengths in sediments has been used as a chemical fingerprint to reconstruct vegetation composition. In terms of absolute amounts, angiosperms generally produce greater quantities of long-chain n-alkanes than gymnosperms (Diefendorf et al., 2011, 2015; Diefendorf and Freimuth, 2017), while terrestrial plants produce greater quantities of long-chain n-alkanes than submerged or emergent aquatic macrophytes (Ficken et al., 2000; Mead et al., 2005; Aichner et al., 2010; Liu et al., 2015; Liu and Liu, 2016). In terms of relative abundances, n-alkane chain length distributions differ between plant functional types such as trees, shrubs, forbs, grasses, and succulents and between deciduous and evergreen plants (Rommerskirchen et al., 2006; Vogts et al., 2009; Diefendorf et al., 2011; Bush and McInerney, 2013; Carr et al., 2014; Garcin et al., 2014; Badewien et al., 2015; Diefendorf et al., 2015; Magill et al., 2019). However, both absolute amounts and relative abundances of n-alkanes have been found to be highly variable within groups, as they are influenced by physiological and environmental factors such as photosynthetic pathways, leaf age, temperature, elevation, light intensity and water stress (e.g., Koch et al., 2006; Diefendorf et al., 2011; Macková et al., 2013; Tipple et al., 2013; Bush and McInerney, 2015; Feakins et al., 2016; Liu et al., 2017; Suh and Diefendorf, 2018; Griepentrog et al., 2019). The large uncertainties associated with characteristic n-alkane chain length distributions have limited their application in quantitative vegetation reconstruction (Bush and McInerney, 2013). Several models have been developed to reconstruct vegetation composition from n-alkyl lipid chain length distribution (Jansen et al., 2010; Gao et al., 2011; Peaple et al., 2021), but they all require a wide spectrum of chains to be analyzed, which may not be feasible depending on the type of sediment analyzed.
Stable carbon isotopes of chain-length-specific n-alkanes have also been used extensively to indicate changes in vegetation of the past. This is based on the well-established empirical evidence that the distribution of carbon isotope ratios (using the δ notation) of plant n-alkanes largely mirrors that of bulk plant tissue, primarily reflecting differences in the photosynthetic pathways among terrestrial plants (e.g., C3 vs. C4) and the source of carbon in aquatic plants (e.g., Collister et al., 1994; Mead et al., 2005; Aichner et al., 2010; Diefendorf and Freimuth, 2017; Liu and An, 2020). For example, terrestrial C4 plants produce more 13C-enriched n-alkanes than C3 plants (e.g., Bi et al., 2005; Rommerskirchen et al., 2006; Vogts et al., 2009; Kristen et al., 2010; Badewien et al., 2015). Such a distinction has been used to identify large-scale changes between C3 and C4 vegetation based on δ13C values of n-alkanes extracted from sedimentary archives (e.g., Bird et al., 1995; Huang et al., 2000; Freeman and Colarusso, 2001; Schefuß et al., 2003; Hughen et al., 2004; Castañeda et al., 2009; Niedermeyer et al., 2010; Tipple and Pagani, 2010; Schefuß et al., 2011; Vogts et al., 2012; Uno et al., 2016; Zhou et al., 2017; Andrae et al., 2018; Polissar et al., 2019). At a finer scale, carbon isotope compositions of n-alkanes from C3 plants are influenced by both biological and environmental factors, such as taxonomy, plant functional types, water availability, temperature, and altitude (e.g., Diefendorf et al., 2010; Cernusak et al., 2013; Diefendorf et al., 2015; Wu et al., 2017; J. Wang et al., 2018; Liu and An, 2020). Compared to the uncertainties associated with n-alkane chain length distribution, the uncertainties of δ13C values in C3 and C4 plants are relatively constrained and have been incorporated into reconstructions of vegetation cover (e.g., Garcin et al., 2014; Uno et al., 2016; Andrae et al., 2018; Polissar et al., 2019). However, when the reconstructions are based on a linear mixing relationship with a careful selection of one specific n-alkane compound (often n-C29 or n-C31), they are associated with the challenge that n-alkane production of the selected chain could vary between the end-members. If the uncertainties associated with n-alkane production are not accounted for, it is possible that the uncertainty associated with paleo-vegetation reconstructions could be mischaracterized and that the interpretations could be biased.
Traditional interpretations of n-alkane proxies often rely on one line of evidence: either chain length distribution or δ13C values of one chain. While many studies have reported δ13C values and relative abundance of multiple n-alkane chains with their respective uncertainties, they are often interpreted independently, using the interpretation of one to qualitatively support that of another. A more rigorous approach to interpreting these data could be developed through the use of a proxy system model (Evans et al., 2013; Dee et al., 2018; Konecky et al., 2019), in which the common and unique assumptions underlying the interpretation of both chain-length and isotope data are explicitly represented. Such a model would provide a quantitative framework within which one proxy type can be used to constrain the uncertainties involved in the interpretation of the other, and vice versa. In the case of plant n-alkanes, both chain length distribution and δ13C values of multiple chains carry complementary information related to the mixing of compounds from different vegetation sources. The combination of both proxies, therefore, may help to better constrain uncertainties, reduce biases, and refine our interpretations. This study describes a generic multi-source n-alkane mixing model that incorporates both lines of evidence (chain lengths, carbon isotopes) and their associated uncertainties in the interpretation. Using case studies based on published sedimentary n-alkane records, the primary goals of this study are (1) to demonstrate model utility by proposing and evaluating multi-source n-alkane mixing regimes, (2) to demonstrate model potential by providing informed interpretations on the mixing regimes with well characterized uncertainties, and (3) to explore the use of the model in paleoclimate reconstruction by linking the mixing model to a simple model describing the ecosystem-specific H-isotope fractionation between n-alkanes and local precipitation.
2.1 Model structure
The proposed approach is achieved in a Bayesian hierarchical modeling framework (Fig. 1), which can leverage information from multiple proxies to provide a robust statistical basis for proxy integration. The hierarchical model is then inverted using Markov Chain Monte Carlo (MCMC) methods (Geman and Geman, 1984) to obtain posterior parameter estimates that are conditioned simultaneously on all proxy data. Similar modeling approaches have been applied to meta-analyses of paleoclimatic and vegetation proxies (e.g., Garreta et al., 2010; Li et al., 2010; Tingley et al., 2012; Bowen et al., 2020) but have not been specifically proposed for proxy interpretation of n-alkanes.
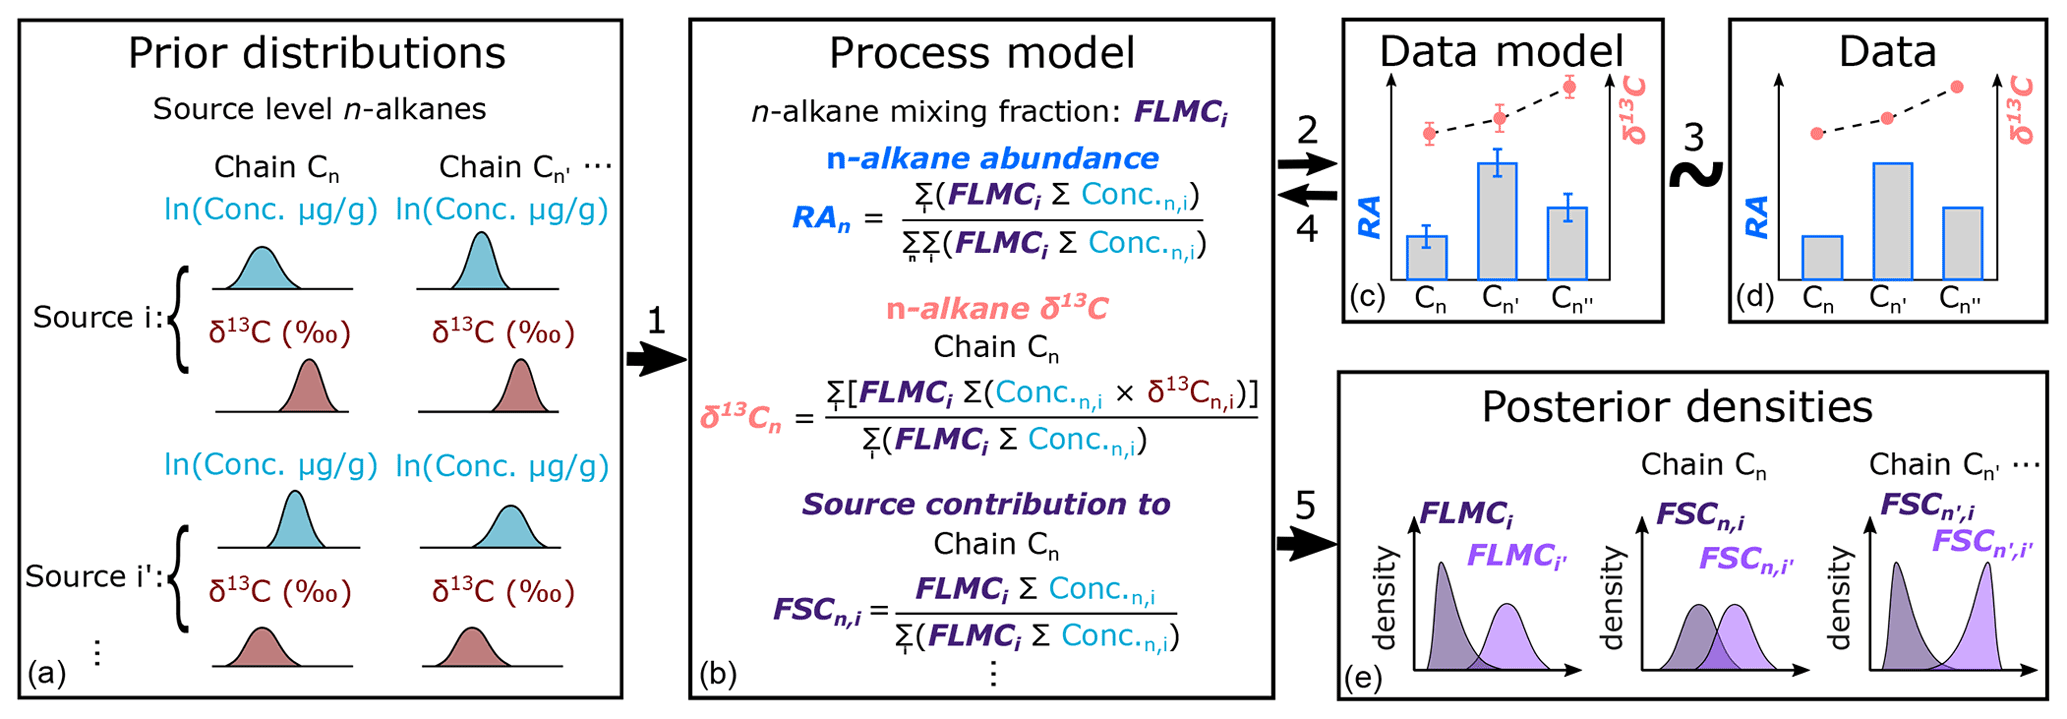
Figure 1Proposed model structure of the Bayesian hierarchical framework for interpretation of n-alkane records, where model components are represented by boxes. Links between components are numbered and referenced in Sect. 2. RA stands for relative abundance of n-alkane chains. FLMCi is the fractional leaf mass contribution from source i. FSCn,i is the fractional contribution from source i to chain n.
2.1.1 Prior distributions
Our understanding of species-level n-alkane chain length distribution and chain-specific δ13C values is based on empirical evidence from extant plants (Sachse et al., 2012; Bush and McInerney, 2013; Diefendorf and Freimuth, 2017). The extensive record of literature and the published empirical data form the basis for prescribing the prior chain length distributions used in this work.
The n-alkane concentrations (µg g−1 of dried leaves) are influenced by the taxonomy, growth forms, and growing conditions of the plant (Han et al., 1968; Ficken et al., 2000; Rommerskirchen et al., 2006; Vogts et al., 2009; Diefendorf et al., 2011; Bush and McInerney, 2013, 2015; Andrae et al., 2019; Magill et al., 2019). Within a source group that is associated with a specific combination of these factors, we expect n-alkane concentration to follow a group-specific chain length distribution pattern. The distribution of concentration values for a given chain within a well-defined source group typically follows a log-normal distribution (Garcin et al., 2014). Therefore, we assume that for each sample drawn from source group i (Fig. 1a), n-alkane concentrations are derived from a multivariate log-normal distribution:
where are the means of the natural log-transformed n-alkane concentration values for chains 1 to n, while is a n × n variance–covariance matrix of the natural log-transformed n-alkane concentration values calculated from empirical data for each source group i.
Similarly, n-alkane δ13C values are primarily influenced by taxonomy, photosynthetic pathways, and growing conditions of the plant (e.g., Bi et al., 2005; Rommerskirchen et al., 2006; Vogts et al., 2009; Diefendorf et al., 2010; Kristen et al., 2010; Cernusak et al., 2013; Badewien et al., 2015; Diefendorf et al., 2015; Wu et al., 2017; J. Wang et al., 2018; Liu and An, 2020). Within a source group i that is associated with a specific combination of these factors, we expect n-alkane δ13C to follow a group-specific distribution pattern. Because n-alkanes of different chain lengths are synthesized via the same biochemical pathway, of all chains should be correlated (Eglinton and Hamilton, 1967; Cheesbrough and Kolattukudy, 1984; Hayes, 1993; Kunst and Samuels, 2003; Chikaraishi et al., 2004). Therefore, we assume that for each sample drawn from source group i (Fig. 1a), are derived from a multivariate normal distribution:
where are the means of δ13C for chains 1 to n, while is a n × n variance–covariance matrix calculated from empirical data for each source group i.
Calculation of the variance–covariance matrices does not allow for missing values in the empirical dataset. Therefore, data entries with any missing value are removed before calculation of the variance–covariance matrices. The prior distribution parameters allow random samples to be drawn from the prior distributions and used in the process model calculation (Step 1 in Fig. 1). By using prior distributions derived entirely from modern plant n-alkane data to inform the interpretation of sedimentary alkane data, the version of the model implemented here implicitly assumes no change in the δ13C value of atmospheric CO2 and minimal incorporation of reworked and potentially pre-aged n-alkanes into sedimentary archives.
2.1.2 Process model
The model consists of a generic mixing process with multiple sources, following the principle of isotope mass balance. First, a fixed number of random draws (k) from the prior distributions are used to generate samples of Concn,i and δ13Cn,i to characterize chain n for each source group i (similar to Fig. 1a). Concentration values are in units of micrograms of n-alkane per gram of dried leaves, and the random draws thus give a distribution of alkane yields per unit leaf mass sampled from the prior. Both concentration and isotope data used to specify the prior distributions typically represent measurements from individual plants, and the process of drawing these k random samples is intended to represent the production of an integrated sample from k individuals. Although in many cases we would expect more than 50 individuals of a particular source group to contribute to a sedimentary sample, k = 50 is chosen to balance sample representation of prior distributions, process stochasticity, and algorithmic complexity. In general, larger values of k are more prescriptive in that the random sample will conform more closely to the prior distribution, and we consider k = 50 to be appropriately conservative in terms of allowing some variation in the samples drawn from the priors.
Second, we calculate the mixture of alkanes from all groups as a function of the fractional leaf mass contribution (FLMC), where FLMCi gives the relative leaf biomass from group i contributing alkanes to the sedimentary sample. Because ; follows a Dirichlet distribution:
where are the Dirichlet concentration parameters. Using an uninformative prior assuming equal mixture of the sources, the Dirichlet concentration parameters are set to be the same. The values are chosen assuming a uniform probability of FLMCi within its range (0, 1). It is important to note that potential differences in leaf mass or lipid turnover are not incorporated into this formulation: the values of FLMCi may not be directly related to the standing biomass of source i if the alkane and/or leaf turnover rates for the groups differ.
Third, the weighted average relative abundance (RA) of each n-alkane n in the mixture can be calculated from the concentrations and mixing fractions:
where in the numerator, is the sum of concentrations from the random draws (k) for chain n and source group i, while is the fraction-weighted sum of concentrations for chain n of all source groups. In the denominator, is the total n-alkane concentration for all chains and all source groups. Equation (4) dictates that .
Lastly, for chain n and its δ13Cn,mix, according to isotope mass balance
where in the numerator is the sum of the products of n-alkane concentration and δ13C in each round of random draws (k) for source i, while is the fraction-weighted sum of the sums for chain n of all source groups. In the denominator, is the same as in the numerator in Eq. (4). Equation (5) is essentially a concentration-weighted isotope mass balance equation for δ13C.
The process model specifies the numerical relationships between random samples from the prior distributions and the simulated metrics of interest (RAn,mix, δ13Cn,mix). The simulated metrics are then used in the data model for further evaluations (Step 2 in Fig. 1).
2.1.3 Data model and model inversion
All proxy data are subject to errors that are associated with the proxy observations themselves (Evans et al., 2013). Therefore, RAn,mix and δ13Cn,mix are modeled with their respective measurement error (Fig. 1c). Because each of the measured RA values are ratios by nature, they are assumed to be associated with a Cauchy error term while centering around the true value RAn,mix:
where τn,mea is the measurement error of RAn,mea, and the hyper parameter shape and rate are set to 5 and 0.05, respectively, corresponding to the small error margins of n-alkane concentration measurements and the associated RA values, which are often reported to the third decimal digit.
Because the uncertainty of the measured δ13C values typically follows a normal distribution, they are assumed to be associated with a Gaussian error term while centering around the true value δ13Cn,mix:
where σn,mea is the measurement error of δ13Cn,mea, which is often reported as 1 standard deviation (SD) in the literature.
In the model inversion step (Steps 3 to 5 in Fig. 1), MCMC is used to propose samples of all model parameters conditioned on the measured δ13C and RA results.
2.1.4 Model implementation
The model structure described above is coded in the BUGS (Bayesian inference Using Gibbs Sampling) language (Lunn et al., 2012), and implemented in R version 4.0.5 (R Core Team, 2021), using the “rjags” package with the standalone JAGS (Just Another Gibbs Sampler) encoder installed separately (Plummer, 2021). Three chains are run in parallel, and the number of iterations is set at 800 000 to ensure model convergence, with the first 200 000 interactions as burn-ins. Chain thinning is set at once per 240 iterations. Convergence is assessed visually via trace plots (R package “mcmcplots”, Curtis, 2018) and with reference to the convergence factor “rhat” (Gelman and Rubin, 1992) and effective sample sizes reported by the “rjags” package. The iteration parameters are chosen to ensure complete convergence with rhat values smaller than 1.01. The average run time for a three-chain δ13C evaluation is approximately 2 h.
2.1.5 Model output
Once the model inversion is completed for each model parameter, its posterior density is summarized via the kernel density estimation function “density” in the R package “stats” with default settings. For selected parameters, posterior density summaries such as the maximum a posteriori estimation (MAPE), median density estimation, and the 89 % highest density interval (HDI) are reported using functions in the R package “bayestestR” (Makowski et al., 2019). Out of all the parameters, the posterior densities of two parameters are of special interest in the mixing process. One of these parameters is FLMCi (as in Eq. 3, Fig. 1e). The other parameter is derived from the posterior samples generated by the MCMC process, which we term as the fractional contribution of source i to each specific chain n (FSCn,i, Fig. 1e):
where the numerator is the fraction-weighted sum of randomly drawn (k) concentrations for chain n of source i. The denominator is the same as the numerator of Eq. (4). Bivariate density plots and contour lines are used to explore covariation patterns of FLMCi among the sources.
2.2 Case studies
Here we provide three case studies that demonstrate model characteristics and offer alternative interpretations of previously published n-alkane proxy data. We considered that n-alkanes extracted from lake surface sediments fulfill most of the assumptions associated with the model structure, and we therefore chose lake surface sediments as the archive of interest for the first two case studies. The third case study is based on n-alkanes extracted from marine core sediments to demonstrate model utility in paleorecords. The case studies are not intended to formally test or validate the modeling approach but to illustrate how the model framework can offer an accessible and statistically informative approach for interpretations of n-alkanes and similar proxy data.
2.2.1 Evaluating aquatic and terrestrial n-alkane input in sediment samples of Lake Qinghai
Background
Lacustrine sediments can incorporate n-alkanes that are sourced from both terrestrial and aquatic plants (Ficken et al., 2000; Mead et al., 2005; Aichner et al., 2010). Quantifying contributions from the different sources to specific n-alkanes is important because it guides paleoenvironmental interpretation of n-alkane proxies. For example, n-alkane chain length distribution and stable isotopes (δ13C and δ2H) have been used to investigate the composition of sedimentary organic matter and regional hydrological conditions through time (e.g., Ficken et al., 1998; Schwark et al., 2002; Huang et al., 2004; Sachse et al., 2004; Mead et al., 2005; Aichner et al., 2010). Many studies use the proxy (Ficken et al., 2000) as an indicator of terrestrial or aquatic source dominance to interpret measured isotope ratios of sedimentary n-alkanes. It quantifies the relative proportion of mid-chain (n-C23 and n-C25) vs. long-chain homologs, based on the evidence that mid-chain alkanes are largely produced by aquatic plants, while long-chain alkanes (n-C29 and n-C31) are largely produced by terrestrial plants (e.g., Ficken et al., 2000; Aichner et al., 2010; Gao et al., 2011; Duan and Xu, 2012; Wang and Liu, 2012; Liu and Liu, 2016). However, long-chain alkanes (e.g., n-C27 and n-C29) have been found in aquatic macrophytes, while mid-chain alkanes (e.g., n-C25) have been found in some terrestrial plants (e.g., Aichner et al., 2010; Gao et al., 2011; Duan and Xu, 2012; Wang and Liu, 2012; Liu et al., 2015; Dion-Kirschner et al., 2020). These findings add some uncertainty to the use of Paq and similar indices as indicators of n-alkane contributions from aquatic plants.
The δ13C values of n-alkanes have also been used as an indicator of terrestrial or aquatic source dominance (e.g., Mead et al., 2005; Aichner et al., 2010; Liu et al., 2015). This is based on the observation that some aquatic macrophytes that grow in shallow waters display δ13C values that are distinctive from those of terrestrial C3 plants and algae due to their ability to utilize dissolved bicarbonate ions as their carbon source (e.g., Allen and Spence, 1981; Prins and Elzenga, 1989; Keeley and Sandquist, 1992). However, the interpretation of δ13C values for a specific n-alkane homologue using a linear two-end mixing relationship will be sensitive to differences in n-alkane concentrations between the end-member vegetation types, leading to contradictory interpretations from different compounds. The presence of additional (beyond two) potential sources further complicates the interpretation of such data.
To demonstrate how our model can provide quantitative estimates of n-alkane mixing fractions of multiple aquatic and terrestrial plant sources, simultaneously conditioned on isotopic and concentration data for all measured chain lengths, we apply the model using published lake surface sediment data from three locations in Lake Qinghai.
Data compilation
The region of interest is the Qinghai–Tibetan Plateau in western China, where both freshwater and saline lakes are abundant. The land cover of the region is dominated by alpine meadow, steppe, and shrubland, which consist of almost exclusively C3 plants (Yu et al., 2001; Duan and Xu, 2012; Liu et al., 2015). Most of the lakes in the region are shallow and densely populated with submerged aquatic macrophytes and green algae during the short growing season (Aichner et al., 2010; Liu et al., 2015; Liu and Liu, 2016). Based on these potential sources of n-alkanes in the region, we define three source groups: (1) terrestrial plants, (2) aquatic macrophytes, and (3) algae.
Table 1Lake surface sediment samples used in case study 1, with measured chain-specific n-alkane concentrations and δ13C values; these data were originally published by Liu et al. (2015).
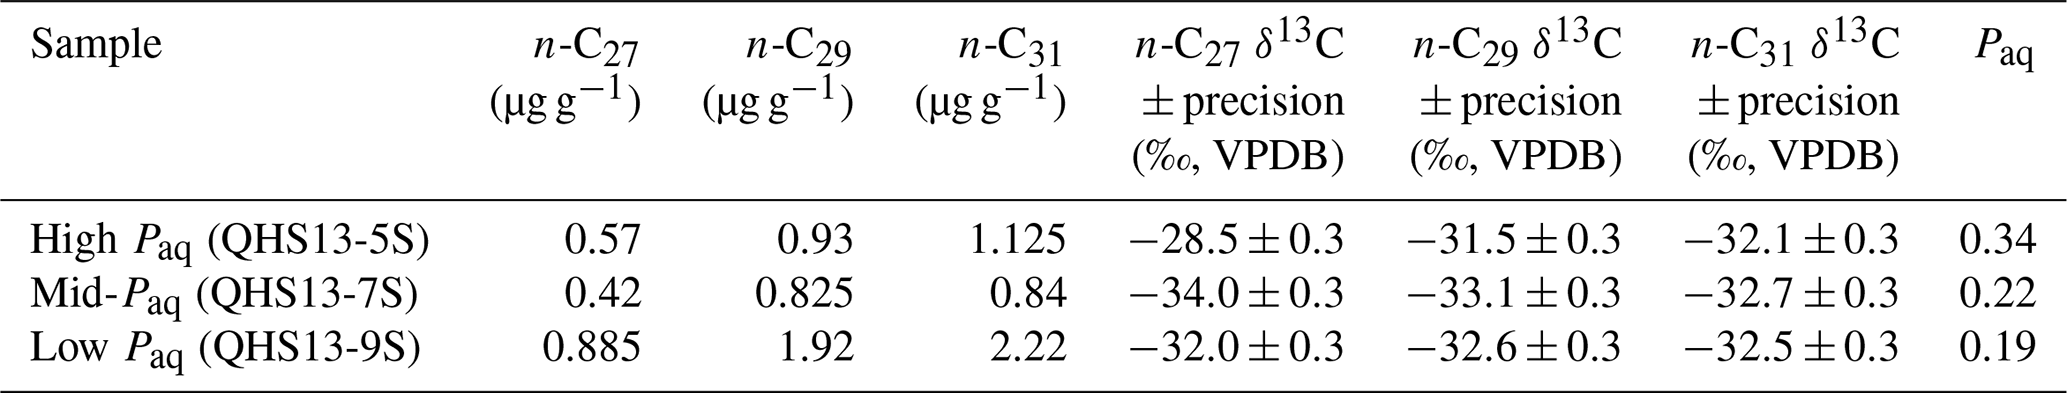

Figure 2Empirical data of per sample n-alkane concentrations (µg g−1 of dried sample, blue histograms) and δ13C (‰, VPDB, red histograms) of n-C27, n-C29, and n-C31 alkanes and their corresponding prior distributions (blue Gaussian curve overlays) of published plants in the terrestrial, aquatic macrophyte, and algae sources; raw data are compiled in supplementary data EA-2 (Yang, 2022). Estimated prior parameters of each source, including the means and variance–covariance matrices, are reported in Tables S1 and S2.
Per-sample n-alkane concentrations (µg g−1 of dried sample) and δ13C (‰, VPDB) of n-C27, n-C29, and n-C31 alkanes are compiled from the literature for terrestrial plants in the region and aquatic macrophytes and algae in the lakes (Aichner et al., 2010; Liu et al., 2015; Liu and Liu, 2016). The compiled dataset (supplementary data EA-2, Yang, 2022) is used to provide parameter estimates for the prior distributions (as explained in Sect. 2.1.1) for each source. Parameters of the multivariate normal distributions are estimated using the R packages “stats” (R Core Team, 2021). To evaluate the assumption that n-alkane concentrations follow a log-normal distribution for each chain in each source, the distribution parameters are estimated using the R package “EnvStats” (Millard, 2013). Goodness of fit is visually assessed using quantile–quantile plots (Fig. S1 in the Supplement). The n-alkane concentrations and δ13C values of selected lake surface sediments from Lake Qinghai are compiled from Liu et al. (2015). Other data that characterize the composition and preservation of n-alkanes in the geological archives, such as the Paq proxy, are also referenced in the data compilation (Table 1). Because the data are modeled to follow multivariate normal and log-normal distributions (Sect. 2.1.1), the prior distributions should be theoretically assessed in a multivariate space, but such an assessment would be difficult to visualize. Instead, for each variable in the multivariate space, the multivariate density is “collapsed” onto a single dimension by integrating the densities in other dimensions (as in Fig. 2) using the function “omxMnor” in the R package “OpenMx” (Neale et al., 2016).
2.2.2 Evaluating n-alkane input along a vegetation gradient in lake sediments in western Africa
Background
Biome composition and its change over time have profound implications on climatic shifts and the evolution of the biosphere. The tropical grassland biome has been of particular interest because of its unique δ13C signature and its important association with climate of the past and mammalian evolution (e.g., Cerling, 1992; Quade and Cerling, 1995; Latorre et al., 1997; Janis et al., 2002; Bobe and Behrensmeyer, 2004; Strömberg, 2011; Kaya et al., 2018; Polissar et al., 2019). Many studies used δ13C values of long-chain n-alkanes to provide estimates of C3 C4 vegetation cover, based on linear mixing calculations using data from one or more chain lengths (Garcin et al., 2014). In many cases, n-C31 alkane is used, as its concentration is often similar in C3 and C4 plants (e.g., Uno et al., 2016; Polissar et al., 2019). However, this approach does not take advantage of the distinct chain length dominance patterns associated with different biomes. For example, C4 grasses are associated with much higher production of the n-C33 alkane than most C3 plants (Krull et al., 2006; Rommerskirchen et al., 2006; Bush and McInerney, 2013; Garcin et al., 2014), while tropical rainforest plants are associated with the very high production of the n-C29 alkane (Vogts et al., 2009). Using the information from chain length distribution in addition to δ13C values has the potential to produce more detailed reconstructions of biome composition beyond the binary C3 C4 ratio.
To demonstrate how the model can provide quantitative estimates of n-alkane contributions from multiple broadly defined biomes, we apply the model using published lake surface sediment data from three locations in a vegetation gradient in Cameroon, western Africa.
Data compilation
The region of interest is Sub-Saharan Africa where rainfall amount and seasonality are the primary determinants of biome types (Sankaran et al., 2005; Aleman et al., 2020). In western Africa, vegetation cover is dominated by rainforest close to the Equator, wooded grassland to the north, and a transitional zone in between (Huang et al., 2000; Rommerskirchen et al., 2003; Garcin et al., 2012, 2014; Schwab et al., 2015). In particular, tropical forest and savanna woody plant species have been shown to co-occur in this region (Aleman et al., 2020), making it an ideal place to investigate the potential of using n-alkane proxies to reconstruct the dominant C3 biome. Based on the above information, we define three source groups: (1) tropical C4 plants, (2) savanna C3 plants, and (3) rainforest C3 plants. Succulent plants are excluded in the analysis due to their low presence in the region.
Table 2Lake surface sediment samples used in case study 2, with measured chain-specific n-alkane concentrations and δ13C values; these data were originally published by Garcin et al. (2014).
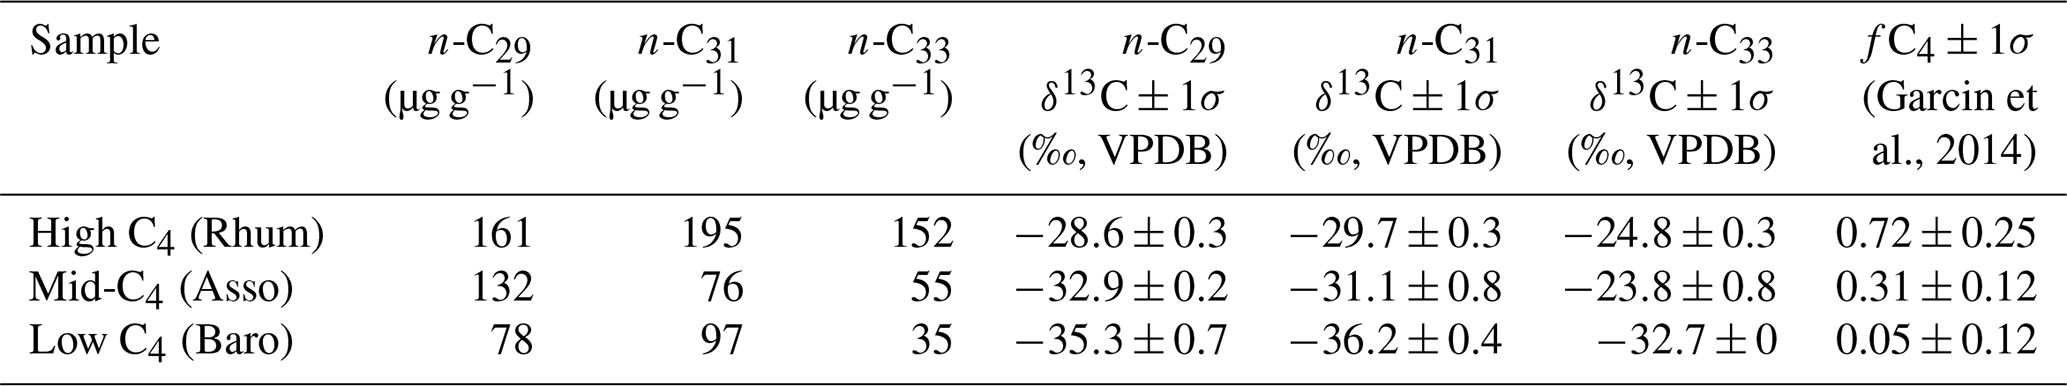
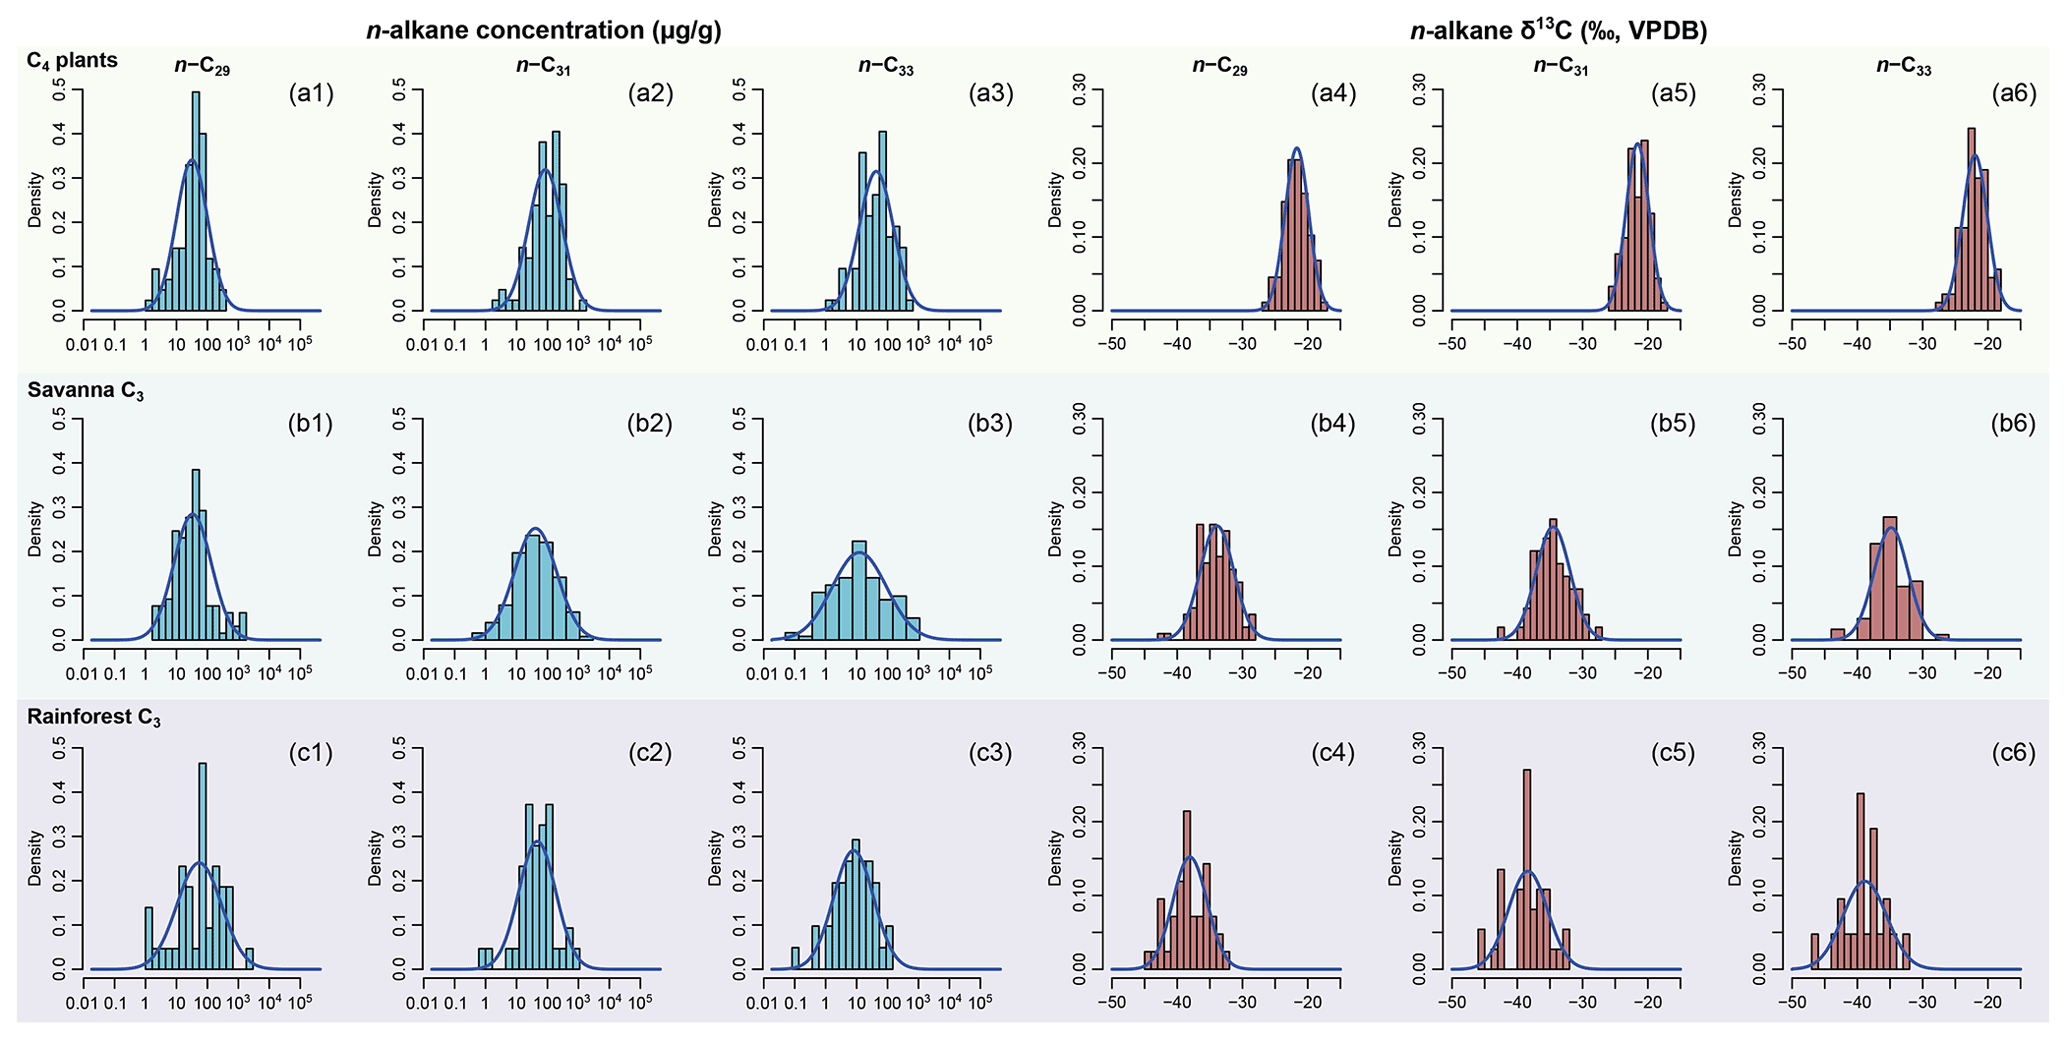
Figure 3Empirical data of per-sample n-alkane concentrations (µg g−1 of dried sample, blue histograms) and δ13C (‰, VPDB, red histograms) of n-C29, n-C31, and n-C33 alkanes and their corresponding prior distributions (blue Gaussian curve overlays) of published plants in the C4 plants, savanna C3, and rainforest C3 sources. Raw data are compiled in supplementary data EA-3 (Yang, 2022). Estimated prior parameters of each source, including the means and variance-covariance matrices, are reported in Tables S3 and S4.
Per sample n-alkane concentrations (µg g−1 of dried sample) and δ13C (‰, VPDB) of n-C29, n-C31, and n-C33 alkanes are compiled from the literature for terrestrial plants in western, southwestern, and eastern Africa (Ali et al., 2005; Rommerskirchen et al., 2006; Vogts et al., 2009; Kristen et al., 2010; Badewien et al., 2015; Diefendorf and Freimuth, 2017; Magill et al., 2019). The compiled dataset (supplementary data EA-3, Yang, 2022) is used to provide parameter estimates for the prior distributions for each source (as explained in Sect. 2.1.1). Prior parameters are estimated using the same methods as in Sect. 2.2.1. Goodness of fit is visually assessed using quantile–quantile plots (Fig. S2). The n-alkane concentrations and δ13C values of selected lake surface sediments are compiled from Garcin et al. (2014), with estimated fractional C4 vegetation cover () referenced from the same publication (Table 2). Following the same methods as in Sect. 2.2.1 (“Data compilation”), univariate prior distributions are plotted in Fig. 3 as density curves.
2.2.3 Estimating precipitation δ2H from n-alkane records in marine sediments off the Zambezi River mouth
Background
Hydrogen isotope ratios (δ2H, ‰, VSMOW) of terrestrial plant wax lipids have been extensively used to interpret changes in hydroclimate and rainfall regimes in the African tropics (e.g., Tierney et al., 2008; Konecky et al., 2011; Schefuß et al., 2011; Berke et al., 2012; Feakins, 2013; Kuechler et al., 2013; Collins et al., 2014; Costa et al., 2014; Shanahan et al., 2015; Castañeda et al., 2016; Niedermeyer et al., 2016; Caley et al., 2018; Norström et al., 2018). This is based on the common assumption that variation in precipitation δ2H is the primary driver of δ2H variation in terrestrial plant wax lipids (Huang et al., 2004; Sachse et al., 2006; Hou et al., 2008). Investigations into the apparent fractionation factor (εa) between plant wax lipids and source water revealed that εa of grasses (both C3 and C4) is much more negative than that of other C3 plants (Krull et al., 2006; Liu et al., 2006; Smith and Freeman, 2006; Sachse et al., 2012; Kahmen et al., 2013a; Gamarra et al., 2016; Z. Wang et al., 2018). A strong positive correlation is also found between aridity and εa in C3 plants, while a much weaker correlation is present in C4 grasses (Sachse et al., 2004; Hou et al., 2008; Feakins and Sessions, 2010; Polissar and Freeman, 2010; McInerney et al., 2011; Sachse et al., 2012; Kahmen et al., 2013a, b; Schwab et al., 2015; Gamarra et al., 2016). These findings suggest that both vegetation type (e.g., C3 vs. C4 plants) and aridity (e.g., in rainforest vs. savanna C3 biomes) can impact the interpretation of sedimentary plant wax δ2H records (Douglas et al., 2012; Collins et al., 2013; Feakins, 2013; Nelson et al., 2013; Wang et al., 2013a; Z. Wang et al., 2018). In addition, as mentioned in Sect. 2.2.2, C4 grasses produce more n-C31 and n-C33 alkanes than C3 plants in general. As a result, when the n-alkanes are sourced from a C3 C4 mixed-vegetation region, the magnitude of change through time in δ2H of n-C31 and n-C33 alkanes can be higher than that of n-C29 alkane (Schefuß et al., 2011; Wang et al., 2013a). While different methods have been proposed to account for the vegetation effect on lipid δ2H (Collins et al., 2013; Feakins, 2013; Magill et al., 2013; Konecky et al., 2014), most interpretations are based on data of one selected chain (e.g., either n-C29 or n-C31 for n-alkanes) while data of other chains are not directly interpreted. With the model structure in Sect. 2.1 and prior distributions of broadly defined biomes in Sect. 2.2.2, we assume that the mixing fractions among the vegetation types can be resolved using δ13C and chain length distribution of multiple n-alkane chains. One possible solution to account for the effects of aridity to n-alkane δ2H is to use biome-specific εa between n-alkanes and mean annual precipitation (MAP). However, challenges remain in the high parametric uncertainty of observed εa (e.g., in n-C29, 1σ ranges from 22 ‰ to 32 ‰ in different plant functional types; Konecky et al., 2019), which can introduce a substantial amount of uncertainty in the reconstructed precipitation δ2H values from a single n-alkane chain (Polissar and D'Andrea, 2014). While the parametric uncertainties of individual n-alkane chains are likely to be similar, simultaneous evaluation of δ2H in multiple chains can theoretically reduce the overall uncertainty of estimated δ2H of MAP by leveraging their common sensitivities to precipitation.
To demonstrate how the reconstructed biome compositions in Sect. 2.2.2 can be used to further assist interpretation of n-alkane δ2H and quantitative estimation of precipitation δ2H, we expand the existing model structure outlined in Sect. 2.1 to permit evaluation of associated n-alkane δ2H, δ13C, and relative abundance of multiple chains simultaneously. We apply the expanded model to published marine core data (GIK 16160-3, lat. −18.2412∘, long. 37.8685∘) off the Zambezi River mouth, Indian Ocean (Wang et al., 2013a). This dataset also allows for a qualitative comparison (results reported in Supplement) to the pollen record from another marine core nearby (GeoB9311-1, lat. −21.55∘, long. 36.4166∘; Dupont and Kuhlmann, 2017).
Prior distributions of εa
To estimate δ2H in MAP, we first use the definition of the apparent fractionation factor (εa) between δ2H of n-alkane and MAP:
where the δ2H terms are numerically expressed with a factor of 1000.
Solving Eq. (10), δ2Hn,i can be expressed as follows:
where δ2H of alkane chain n and source group i is determined by εa of chain n and source group i, as well as δ2HMAP.
Similar to Eq. (2), we expect εa among the chains of source group i to follow a group-specific distribution pattern and assume that for each sample drawn from source group i, are derived from a multivariate normal distribution:
where are the means of εa for chains 1 to n, while is a n × n variance–covariance matrix calculated from empirical data for each source group i.
δ2H of MAP is modeled to follow a normal distribution with the following mean and precision parameters:
where is modeled with an uninformative prior using a uniform distribution with the following bounding values:
and is modeled with a target error of ±10 ‰, using the following shape and rate parameters:
Process model for n-alkane δ2H
The process model for n-alkane δ2H follows the same model structure outlined in Sect. 2.1.2 and is based on the same assumptions associated with n-alkane concentration distribution among the chains. This provides a concentration-weighted isotope mass balance equation similar to Eq. (5), for chain n and its δ2Hn,mix, as follows:
Data model and model inversion for n-alkane δ2H
The measured δ2H data are assumed to relate to the modeled δ2Hn,mix with a Gaussian error term:
where is the measurement error of δ2Hn,mea, which is often reported as 1 standard deviation (SD) in the literature.
In the model inversion step, MCMC is used to propose samples of all model parameters conditioned on the measured δ2H, δ13C, and RA data for multiple n-alkane chains. Five chains are run in parallel at 1 million iterations with 200 000 burn-ins. Average run time for the dual-isotope evaluation is approximately 8 h.
Data compilation
The sedimentary record of interest (GIK16160-3) is located off the Zambezi River mouth, which has a temporal range of ca. 0.1–36.7 ka BP (Wang et al., 2013a, b). The dominant biomes of the catchment area today are the Zambezian woodland savanna and grassland savanna, with coastal forest and Afromontane biomes also present (White, 1983; Dupont et al., 2011; Wang et al., 2013a; Dupont and Kuhlmann, 2017). Previous studies have interpreted the sedimentary record to reflect hydrological and vegetation changes in the catchment area of the Zambezi River, as well as patterns of sediment transport from the catchment vs. regions north of the river mouth (Wang et al., 2013a; Khon et al., 2014; van der Lubbe et al., 2014; Kasper et al., 2015; van der Lubbe et al., 2016; Lattaud et al., 2017). The published n-alkane record of this core comprises n-alkane concentrations; δ2H; and δ13C values of n-C27, n-C29, n-C31, and n-C33 alkanes (Wang et al., 2013a). Due to the high computational demand of the method, only 10 sets of data in the sedimentary sequence are used in this case study. The selected data span across late Marine Isotope Stage 3 (MIS 3), the Last Glacial Maximum (LGM), Heinrich Stadial event 1 (HS1), the Younger Dryas (YD), and the Holocene. Ice-volume-corrected δ2H values (Wang et al., 2013a) are used to account for baseline changes in δ2H of source moisture.
For the prior distributions of n-alkane concentration and δ13C, we use the same empirical dataset as in Sect. 2.2.2, while adding a distribution for n-C27 alkane. To account for the post-industrial change in the δ13C of atmospheric CO2, corrections are made to the δ13C means of the prior distributions, using the δ13C of atmospheric CO2 of the year 2010 (−8.3 ‰ VPDB, Graven et al., 2017) and the pre-industrial values from an Antarctic ice core (Schmitt et al., 2012). For the prior distribution of 2H fractionation between plant wax and MAP (εa), location-specific plant wax δ2H data are compiled from the literature. We use a subset of the global compilation by Sachse et al. (2012) by setting the latitudinal limits to −30 and 30∘ to reflect the tropical and subtropical latitudes of the catchment area of the Zambezi River. We also include more recently published plant n-alkane δ2H data (Kahmen et al., 2013b; Feakins et al., 2016; Griepentrog et al., 2019), with the same latitudinal limits. The δ2H of MAP is obtained from the Online Isotopes in Precipitation Calculator (OIPC version 3.1, Bowen and Revenaugh, 2003; IAEA/WMO, 2015; Bowen, 2022). The OIPC data product is chosen here because studies on modern plant wax lipid δ2H are often not associated with data of plant source water (soil or xylem water). Moreover, OIPC data have been widely applied to global models of plant ecology and paleoclimate and specifically to plant wax n-alkanes (e.g., Sachse et al., 2006; West et al., 2008; Sachse et al., 2012; Nusbaumer et al., 2017; Konecky et al., 2019). Since n-alkanes in marine sedimentary records often integrate climatic signals across large spatial areas and time intervals at the millennial scale, we consider the interpolated data of OIPC a reasonable set of prior information in the estimation of MAP δ2H. εa for each n-alkane chain in each data entry is calculated using Eq. (10). The same source groups (rainforest C3 plants, savanna C3 plants, C4 plants, as in Sect. 2.2.2) are assigned to the data compilation based on either taxonomic identification or description of sample location from the original publications (supplementary data EA-5, Yang, 2022). Prior parameters of group-specific εa are estimated using the same methods as in Sect. 2.2.1 (“Data compilation”; Table S5). Univariate prior distributions of εa are plotted in Fig. S3.
2.3 Sensitivity tests
The model results are to some degree sensitive to the prior parameter estimates, which are derived from empirical data but imperfectly known in our case studies. Here we use data associated with case study 2 to explore the influence of prior parameter estimates on model output. To produce a different set of prior parameter estimates, plant samples are selected from western Africa only, as a subset of the sub-Saharan empirical dataset (123 entries out of the 301 entries from the original dataset, supplementary data EA-4, Yang, 2022). Prior parameters are estimated from this dataset using the same methods as described in Sect. 2.2.1 (“Data compilation”). The resultant prior distributions differ from those of the sub-Saharan dataset primarily in the C4 source, in that they display lower n-alkane concentrations and less negative δ13C values (Fig. 4). Model sensitivity is assessed via a comparison between the model outputs based on the different priors.

Figure 4Comparisons of prior distributions based on wester African plant samples (thick red curves) vs. sub-Saharan African plant samples (thin blue curves). The three left-most columns illustrate n-alkane concentrations. The three right-most columns illustrate n-alkane δ13C values.
3.1 Case study 1
For each of the three data points of the Lake Qinghai case study (Fig. 5a–c), the posterior densities of FLMCs of terrestrial plants and aquatic macrophytes vary substantially between the samples (Fig. 5d–f), while the distributions of the algal FLMC are almost the same between the samples. FLMC from aquatic macrophytes is the highest in the high-Paq sample (QHS13-5S, Paq = 0.34, Table 1), with the MAPE at 0.53 (summary statistics in Table 3). In comparison, FLMC from aquatic macrophytes is the lowest (MAPE close to 0, Table 3) in the mid-Paq sample (QHS13-7S, Paq = 0.22, Table 1). FLMC from aquatic macrophytes is intermediate in the low-Paq sample (QHS13-9S, Paq = 0.19, Table 1) at 0.09 (MAPE, Table 3).
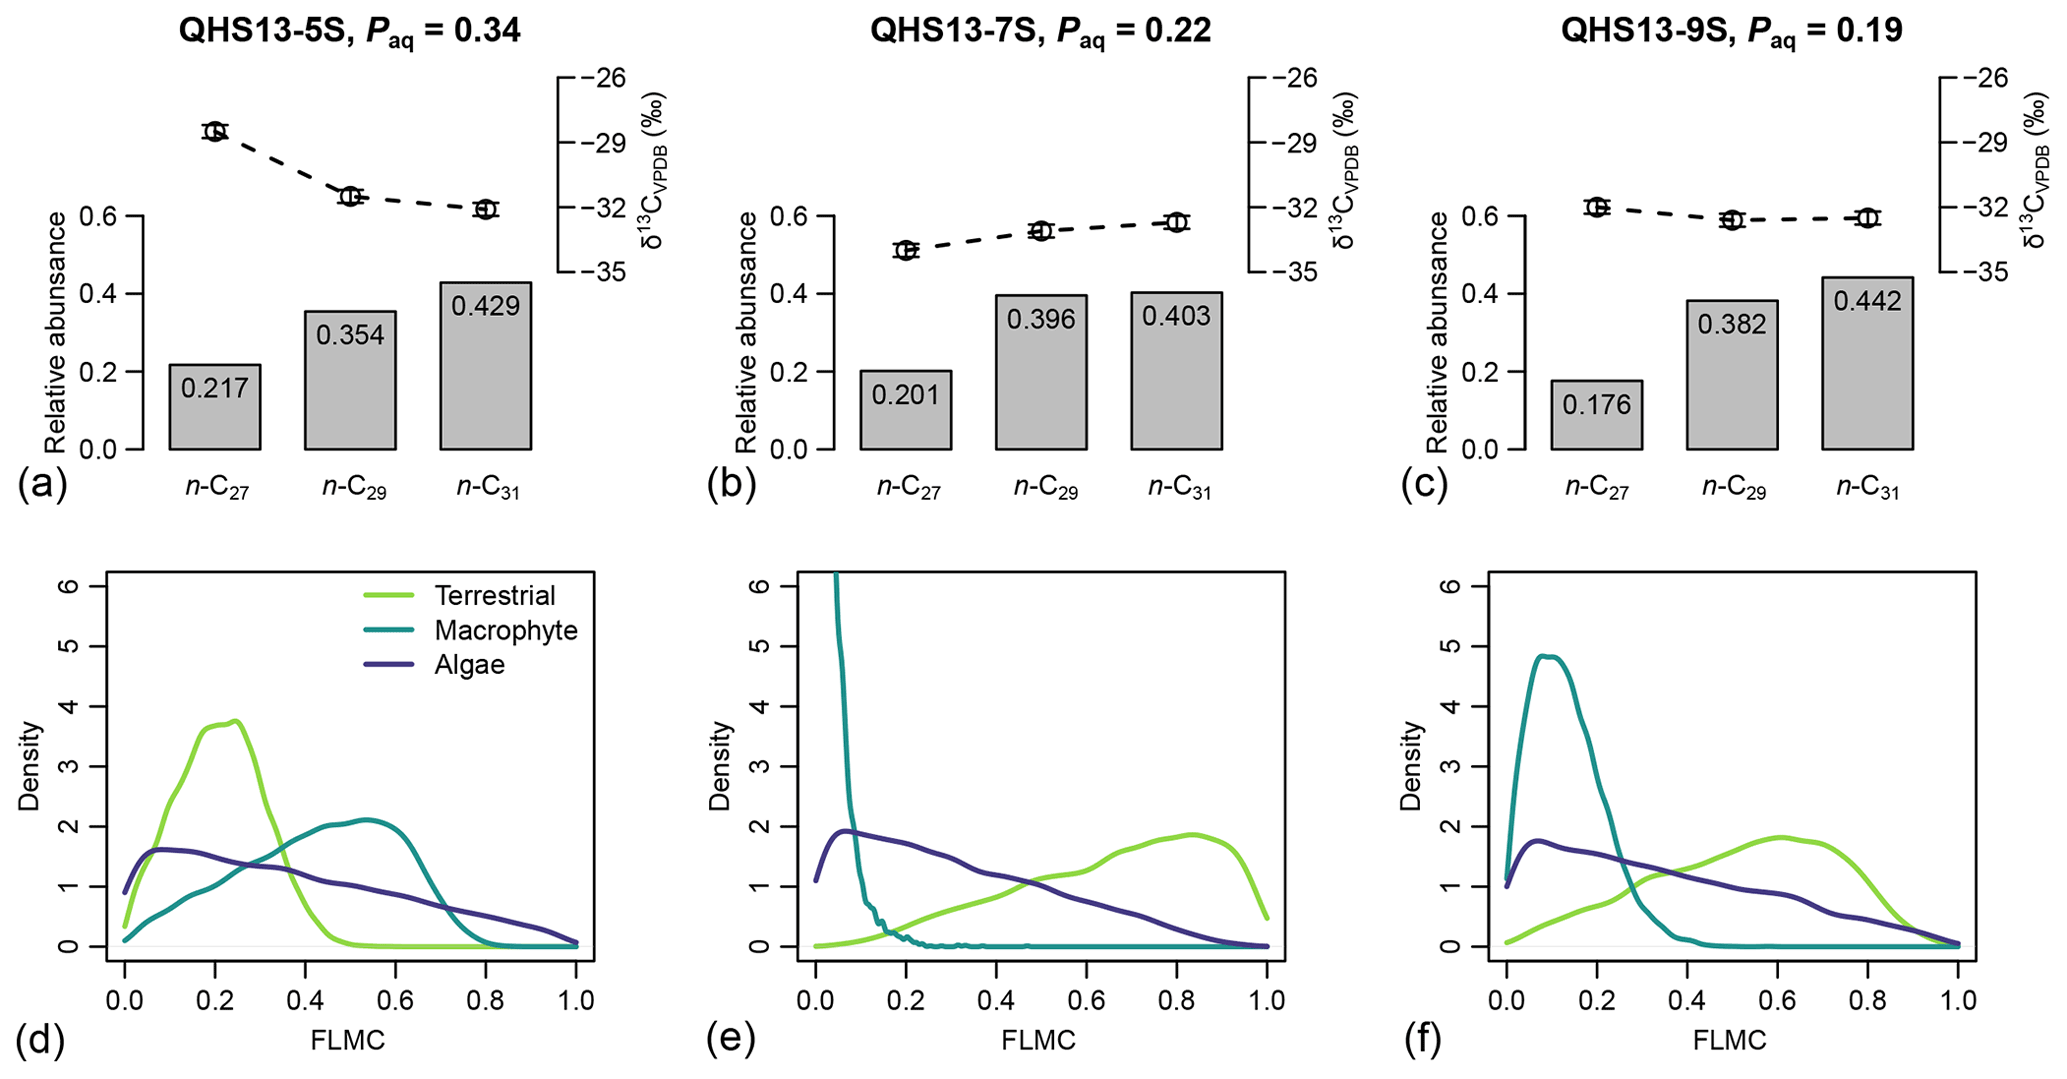
Figure 5(a–c) Sedimentary long-chain n-alkanes (n-C27, n-C29, and n-C31), their δ13C (‰, VPDB) and relative abundance values (excluding other chains) in published lake surface sediment samples from Lake Qinghai (Liu et al., 2015). (d–f) Posterior densities of fractional leaf mass contribution (FLMC) of terrestrial plants, aquatic macrophytes, and algae as model output conditioned on the δ13C and relative abundance values.
Table 3The maximum a posteriori probability estimates (MAPE), the medians, and the 89 % highest density intervals (HDI) of posterior densities of the mixing fractions as model output using data in published lake surface sediment samples from Lake Qinghai (Fig. 5).
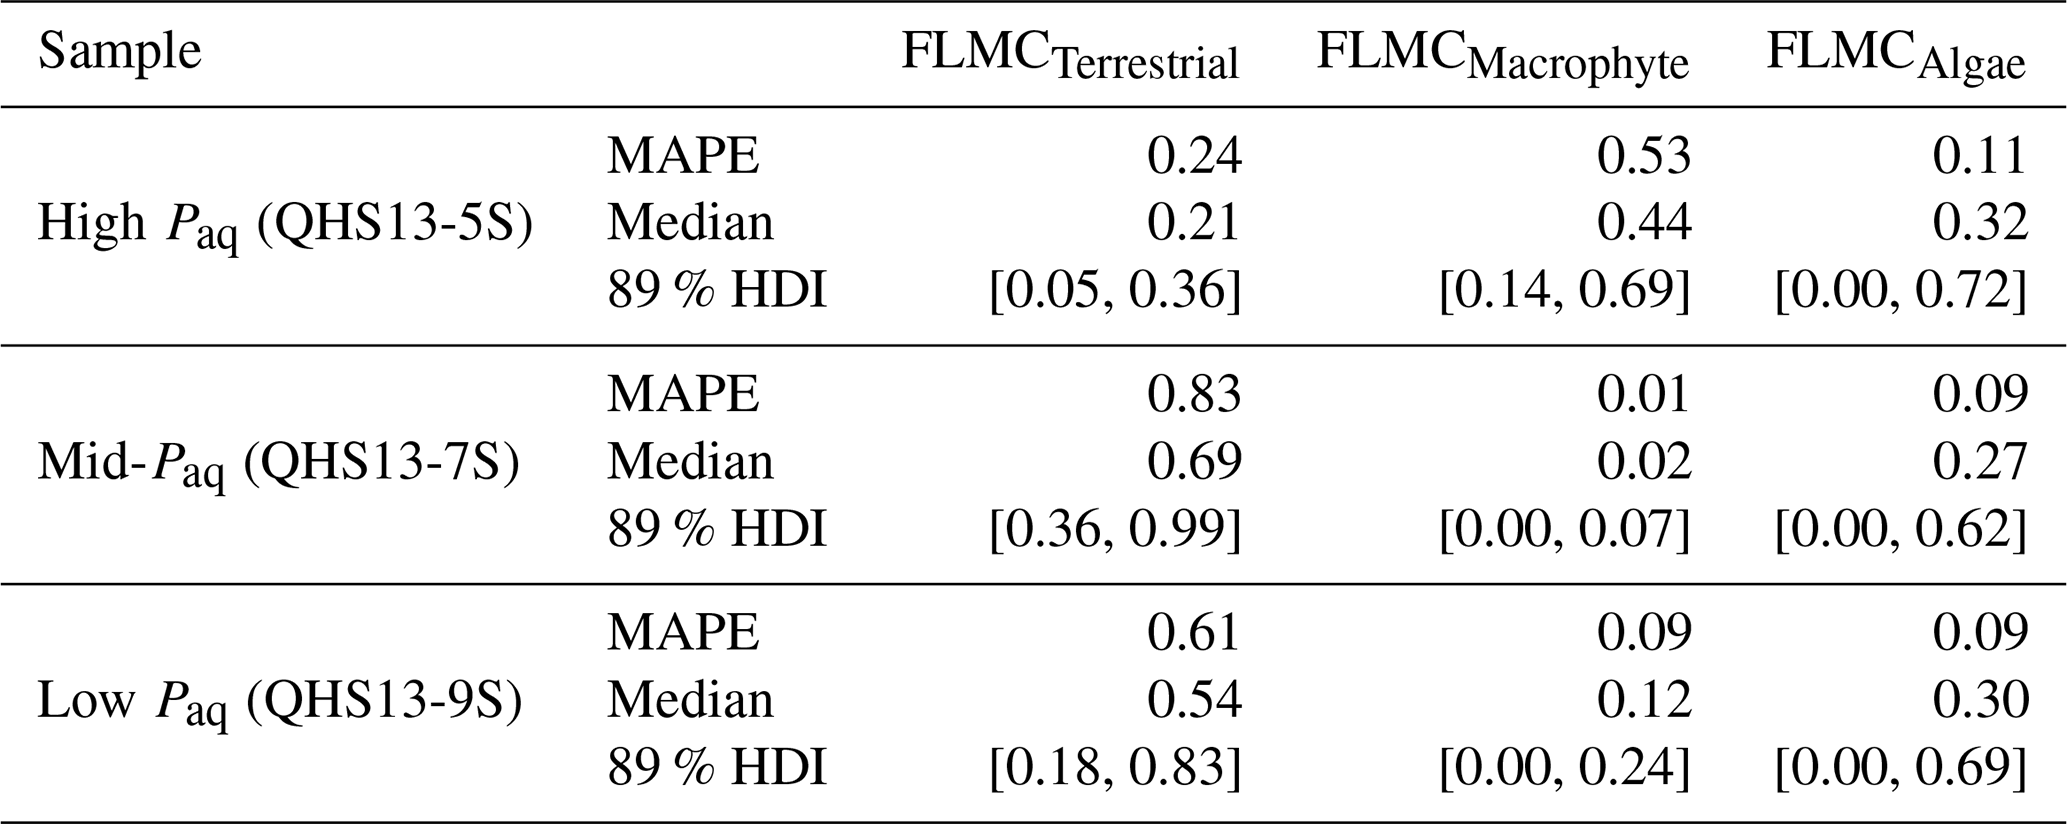
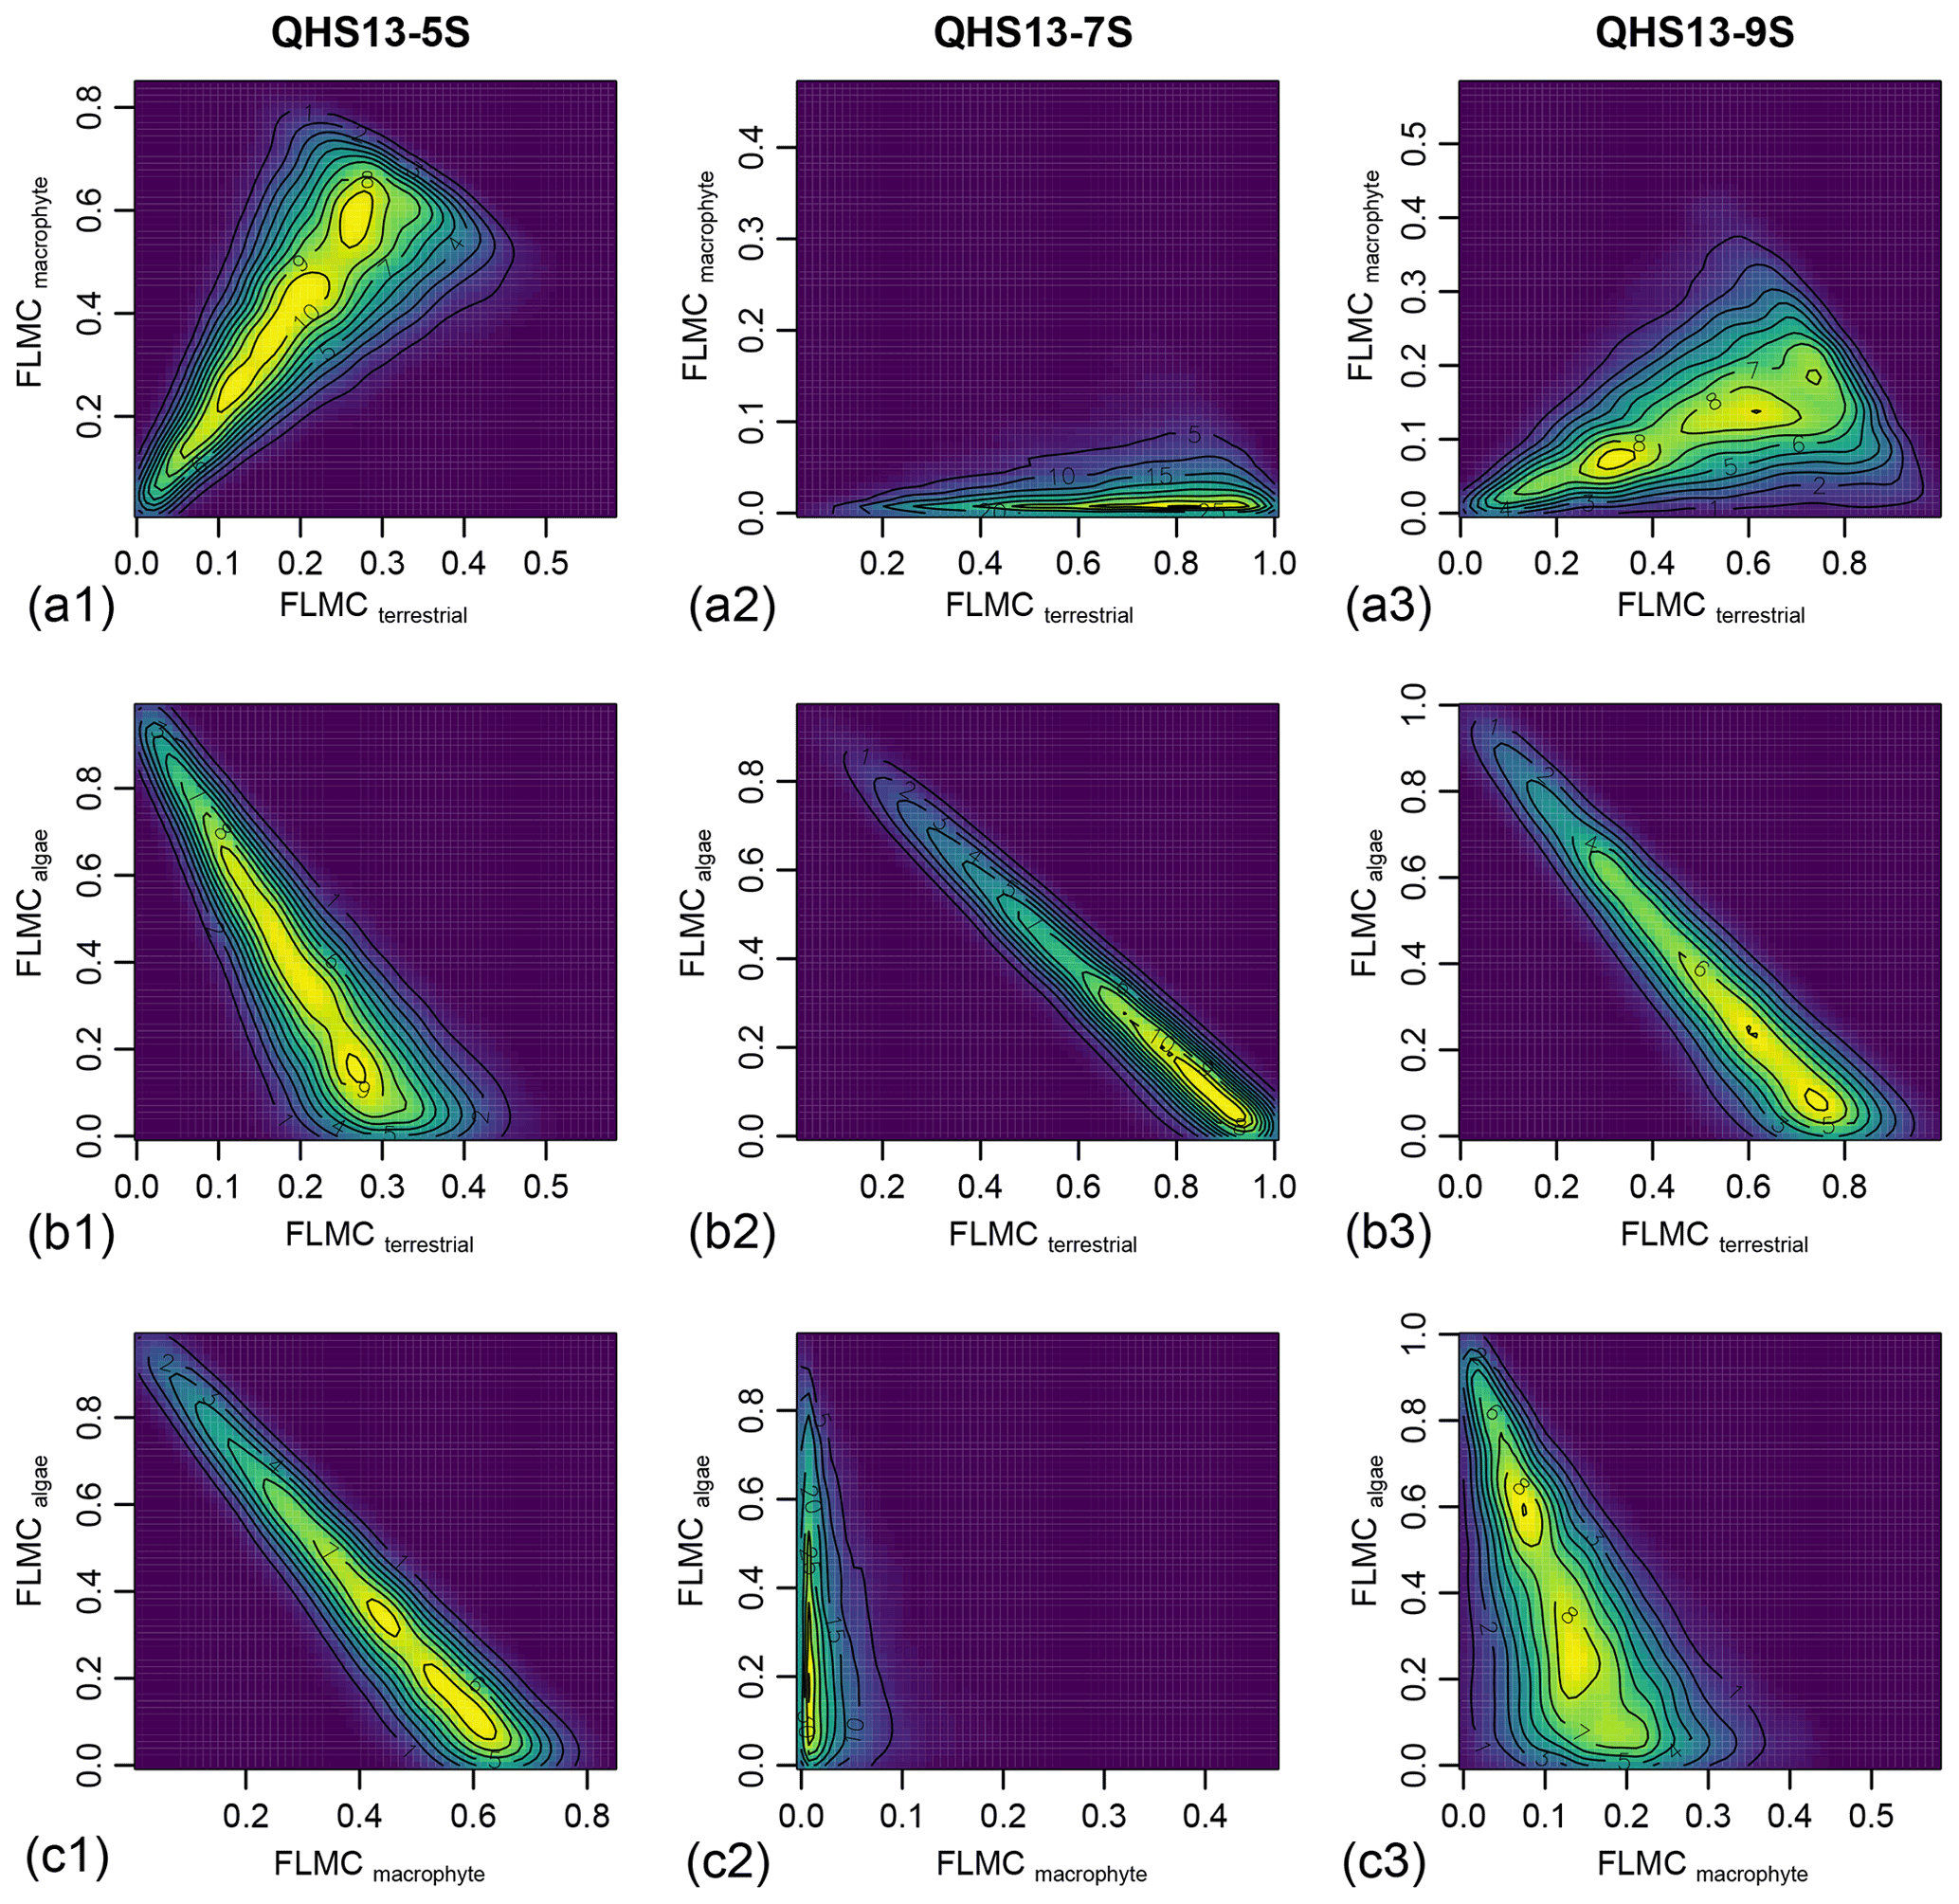
Figure 6Bivariate density plots of the posterior densities of fractional leaf mass contribution (FLMC) of terrestrial plants, aquatic macrophytes, and algae in published lake surface sediment samples from Lake Qinghai (Liu et al., 2015).
Although the algal FLMC is not well constrained (Fig. 5), a strong “trade-off” correlation (the increase of one correlates with the decrease of another) between algal FLMC and those of the other two sources is apparent in bivariate density plots (Fig. 6). The high-Paq (QHS13-5S) and low-Paq (QHS13-9S) samples display multiple local modes for FLMCs, represented by multiple bivariate density peaks (as indicated by the contour lines and color gradient, Fig. 6).
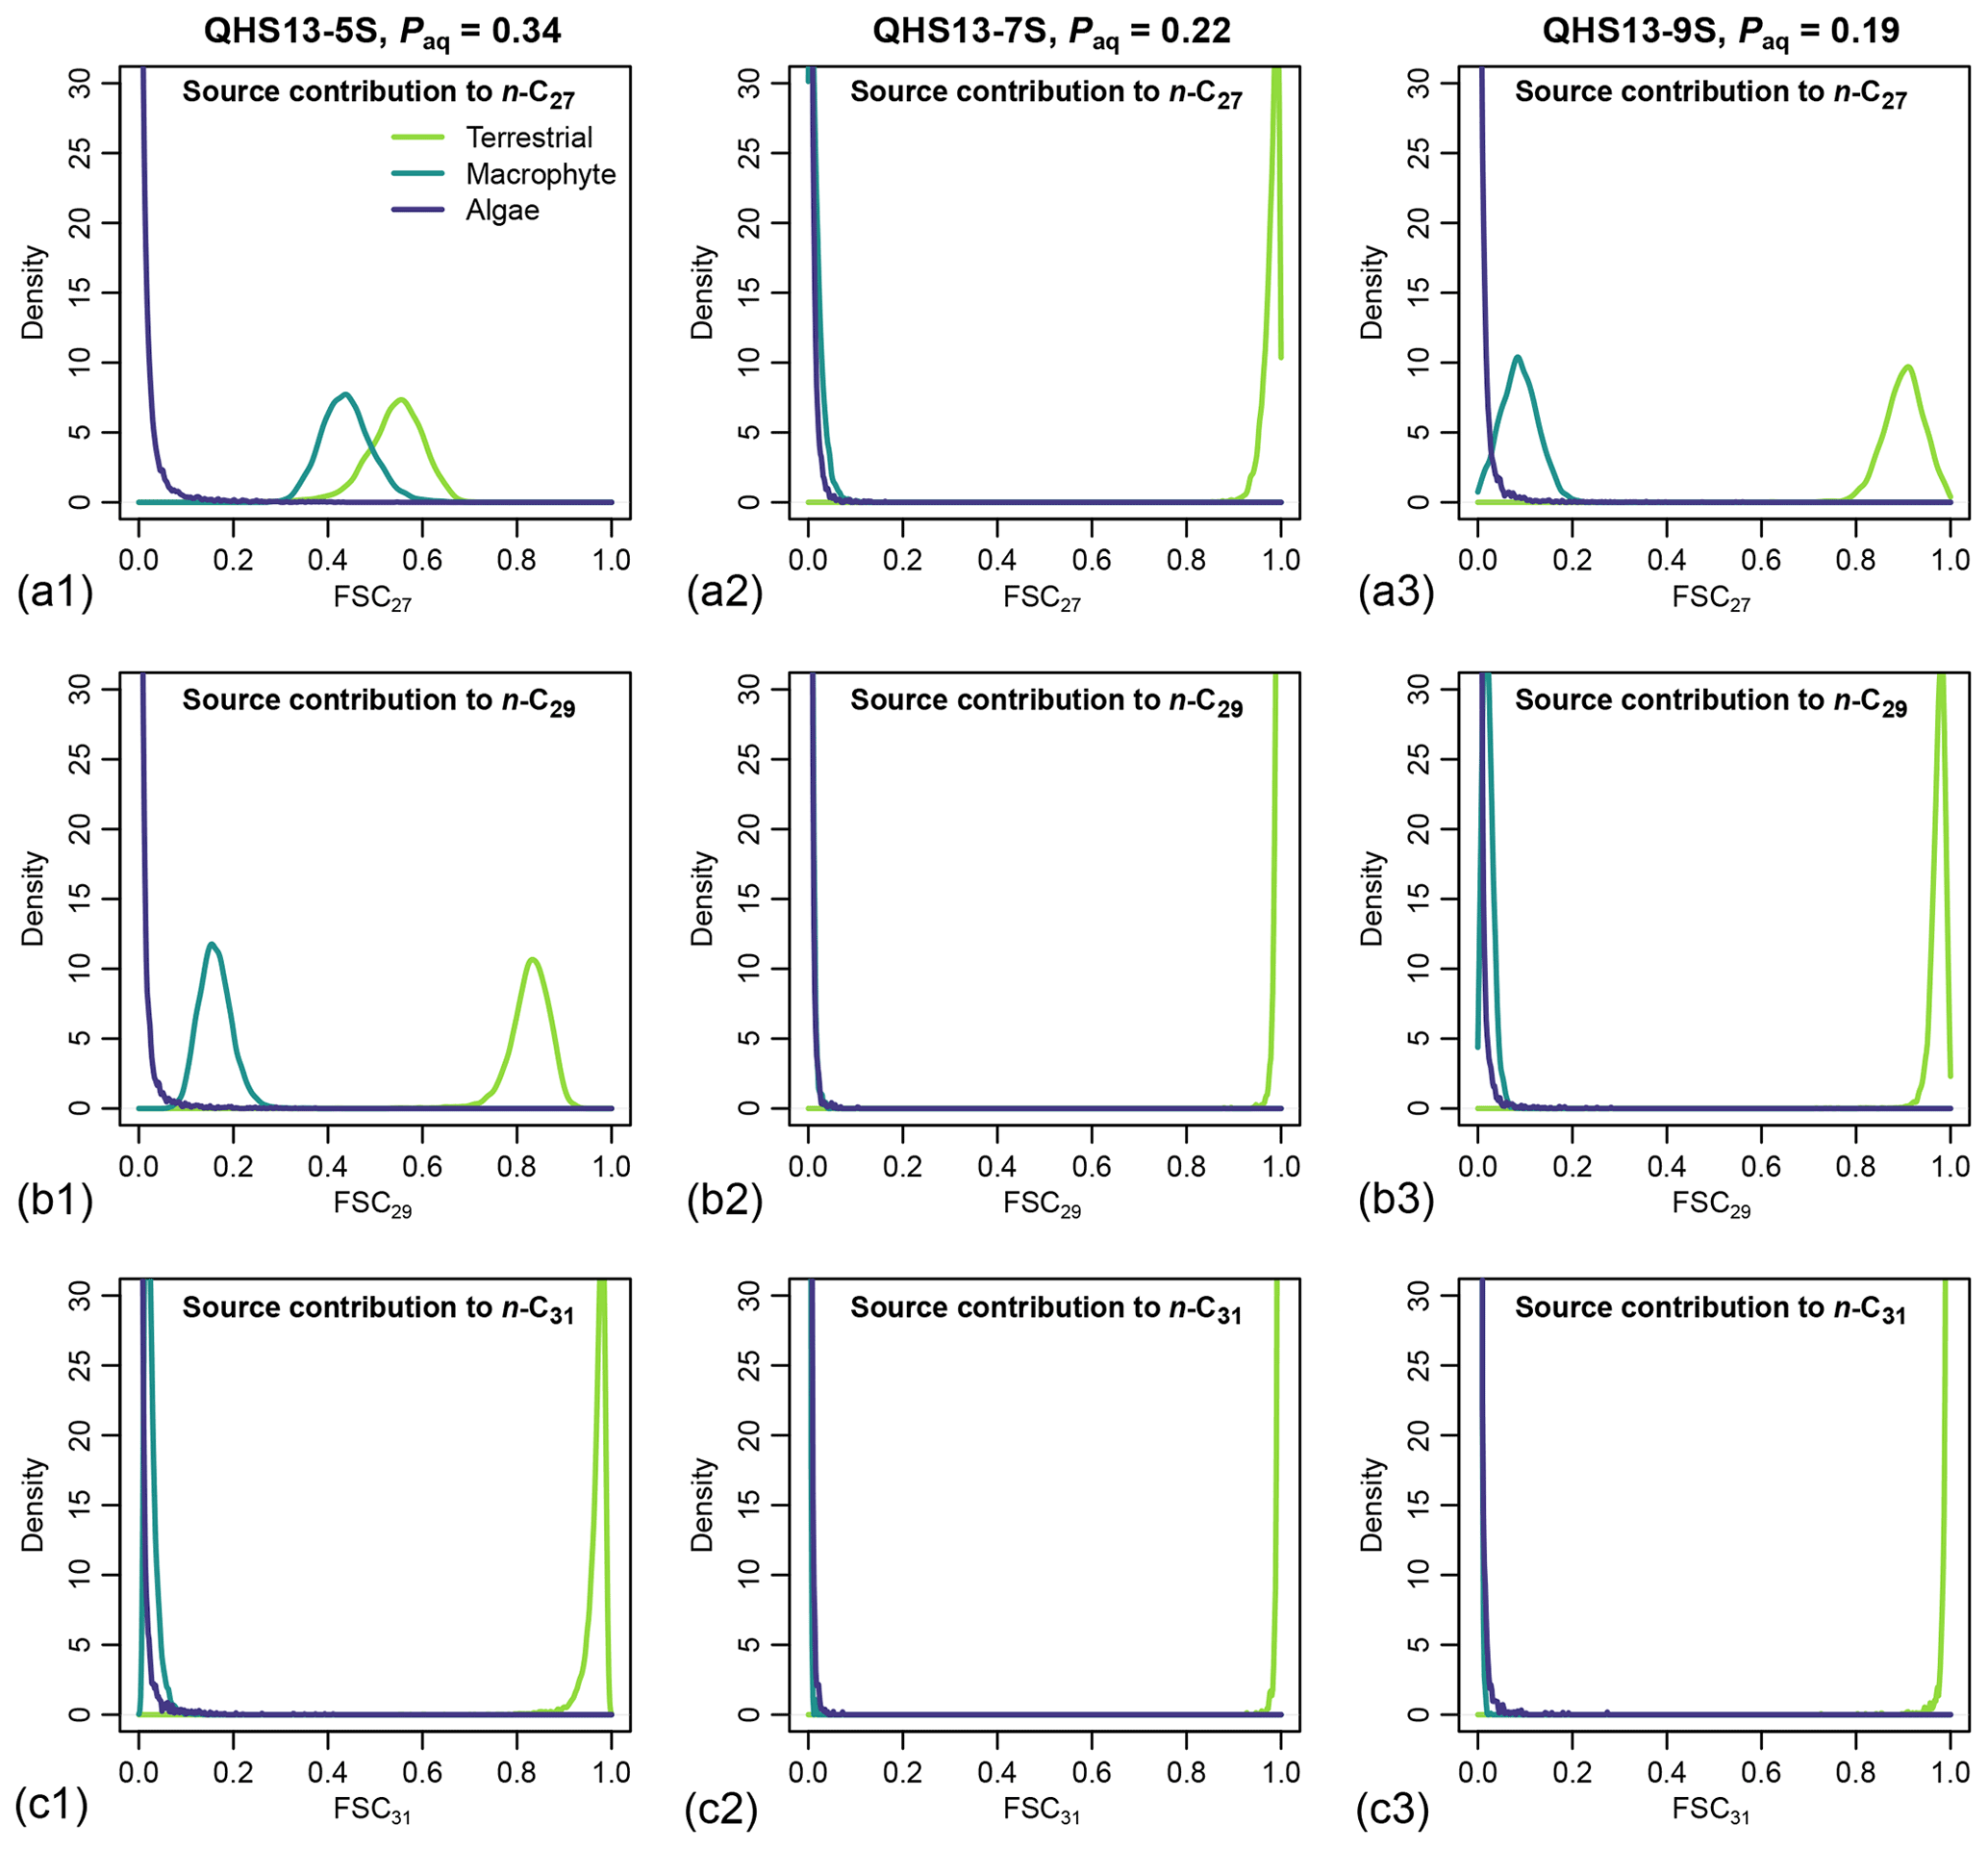
Figure 7Posterior densities of fractional source contribution (FSCn) of terrestrial plants, aquatic macrophytes, and algae to each specific alkane chain (n-C27, n-C29 and n-C31) in published lake surface sediment samples from Lake Qinghai (Liu et al., 2015).
The posterior densities of the algal FSCn to the sedimentary long-chain n-alkane pool are consistently low (Fig. 7). In comparison, the FSC27 of aquatic macrophytes can be substantial in both the high-Paq (QHS13-5S) and low-Paq (QHS13-9S) samples, while FSC29 of aquatic macrophytes is substantial only in the high-Paq sample (QHS13-5S). The terrestrial source shows consistently high FSC31s across all samples.
3.2 Case study 2
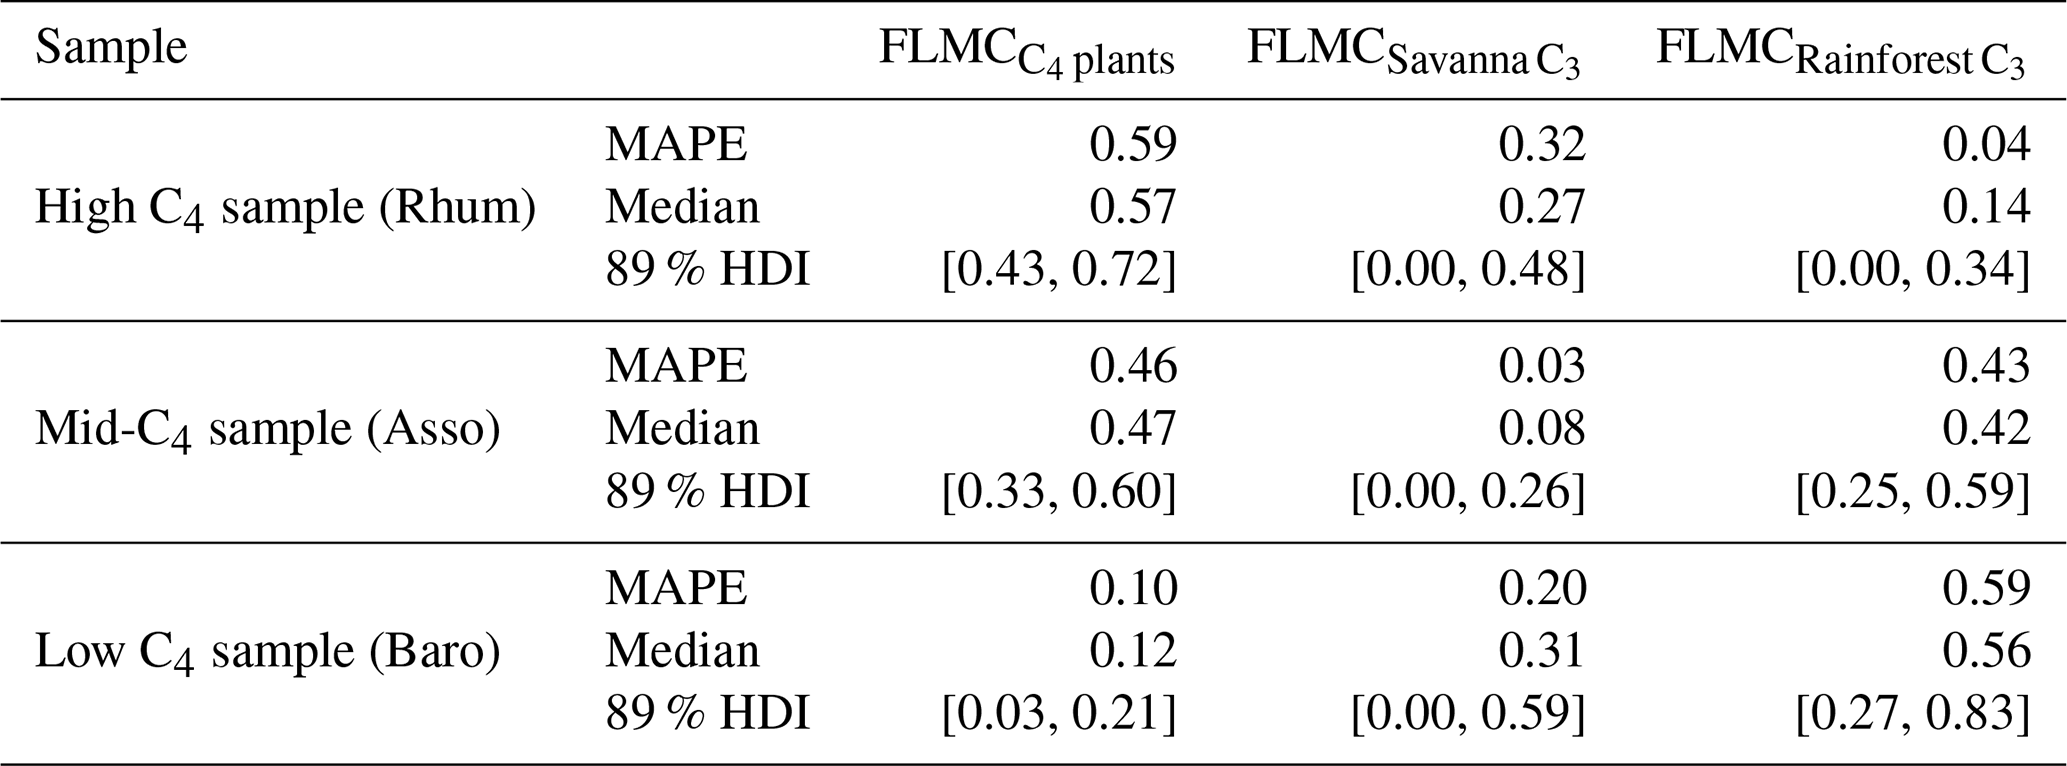
For the western African transect case study (Fig. 8a–c), the posterior densities for fractional leaf mass contribution of C4 plants, savanna C3 plants, and rainforest C3 plants vary substantially between samples (Fig. 8d–f). The C4 plant contribution is the highest in the high-C4 sample (Rhum, = 0.72, Table 2), at 0.59 (MAPE, Table 4). The FLMC of C4 plants is lowest in the low-C4 sample (Baro, = 0.05, Table 2) at 0.10 (MAPE, Table 4). FLMCs from the savanna C3 and rainforest C3 plants are generally less strongly constrained than those of C4 plants, except for in the mid-C4 sample (Asso), which shows a low FLMC from the savanna C3 plants (MAPE close to 0, Fig. 8e, Table 4). The MAPEs of FLMCs of C4 plants of the high-C4 (Rhum) and the low-C4 (Baro) samples fall within the reported mean ±1σ ranges for at these sites based on satellite imaging (Garcin et al., 2014, Table 2). The MAPE of FLMC of C4 plants of the mid-C4 sample (Asso) falls outside the reported mean ±1σ range.
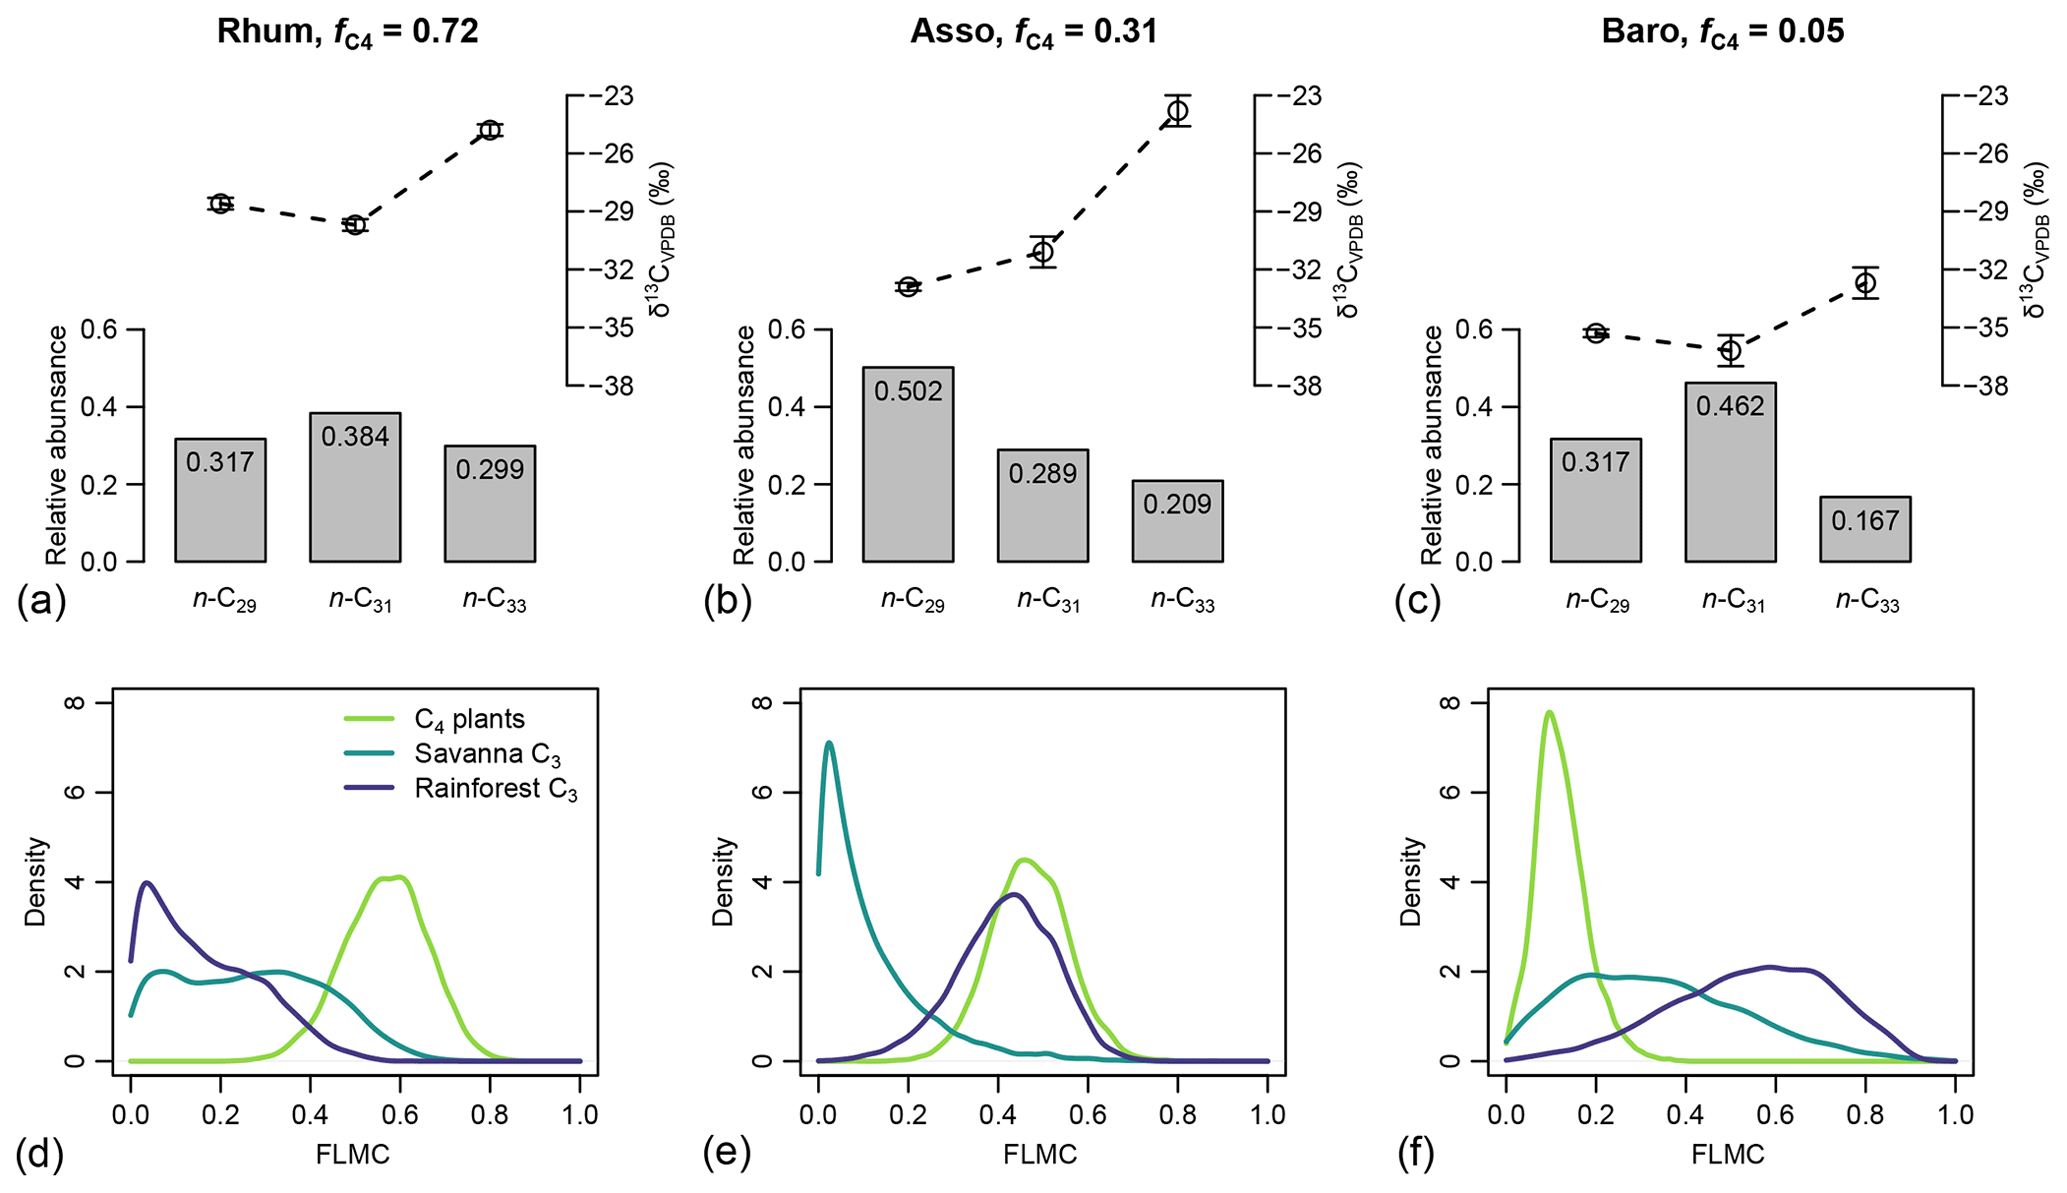
Figure 8(a–c) Sedimentary long-chain n-alkanes (n-C27, n-C29 and n-C31), their δ13C (‰, VPDB), and relative abundance values (excluding other chains) in published lake surface sediment samples from Cameroon (Garcin et al., 2014). (d–f) Posterior densities of fractional leaf mass contribution (FLMC) of tropical C4 plants, savanna C3 plants, and rainforest C3 plants as model output conditioned on the δ13C and relative abundance values.
Table 4The maximum a posteriori probability estimates (MAPE), the medians, and the 89 % highest density intervals (HDI) of posterior densities of the fractional leaf mass contributions (FLMCs) as model output using data in published lake surface sediment samples from Cameroon (Fig. 8).
Bivariate density plots show relatively weak “trade-off” correlation patterns between the FLMCs of savanna and rainforest C3 sources in the High C4 sample (Rhum) and Low C4 sample (Baro, Fig. 9). All three samples display a single mode of most likely vegetation contributions, represented by a single peak in the bivariate density plots (as indicated by the contour lines and color gradient, Fig. 9), although a secondary mode with higher rainforest and lower savanna C3 FLMCs exists at Rhum.
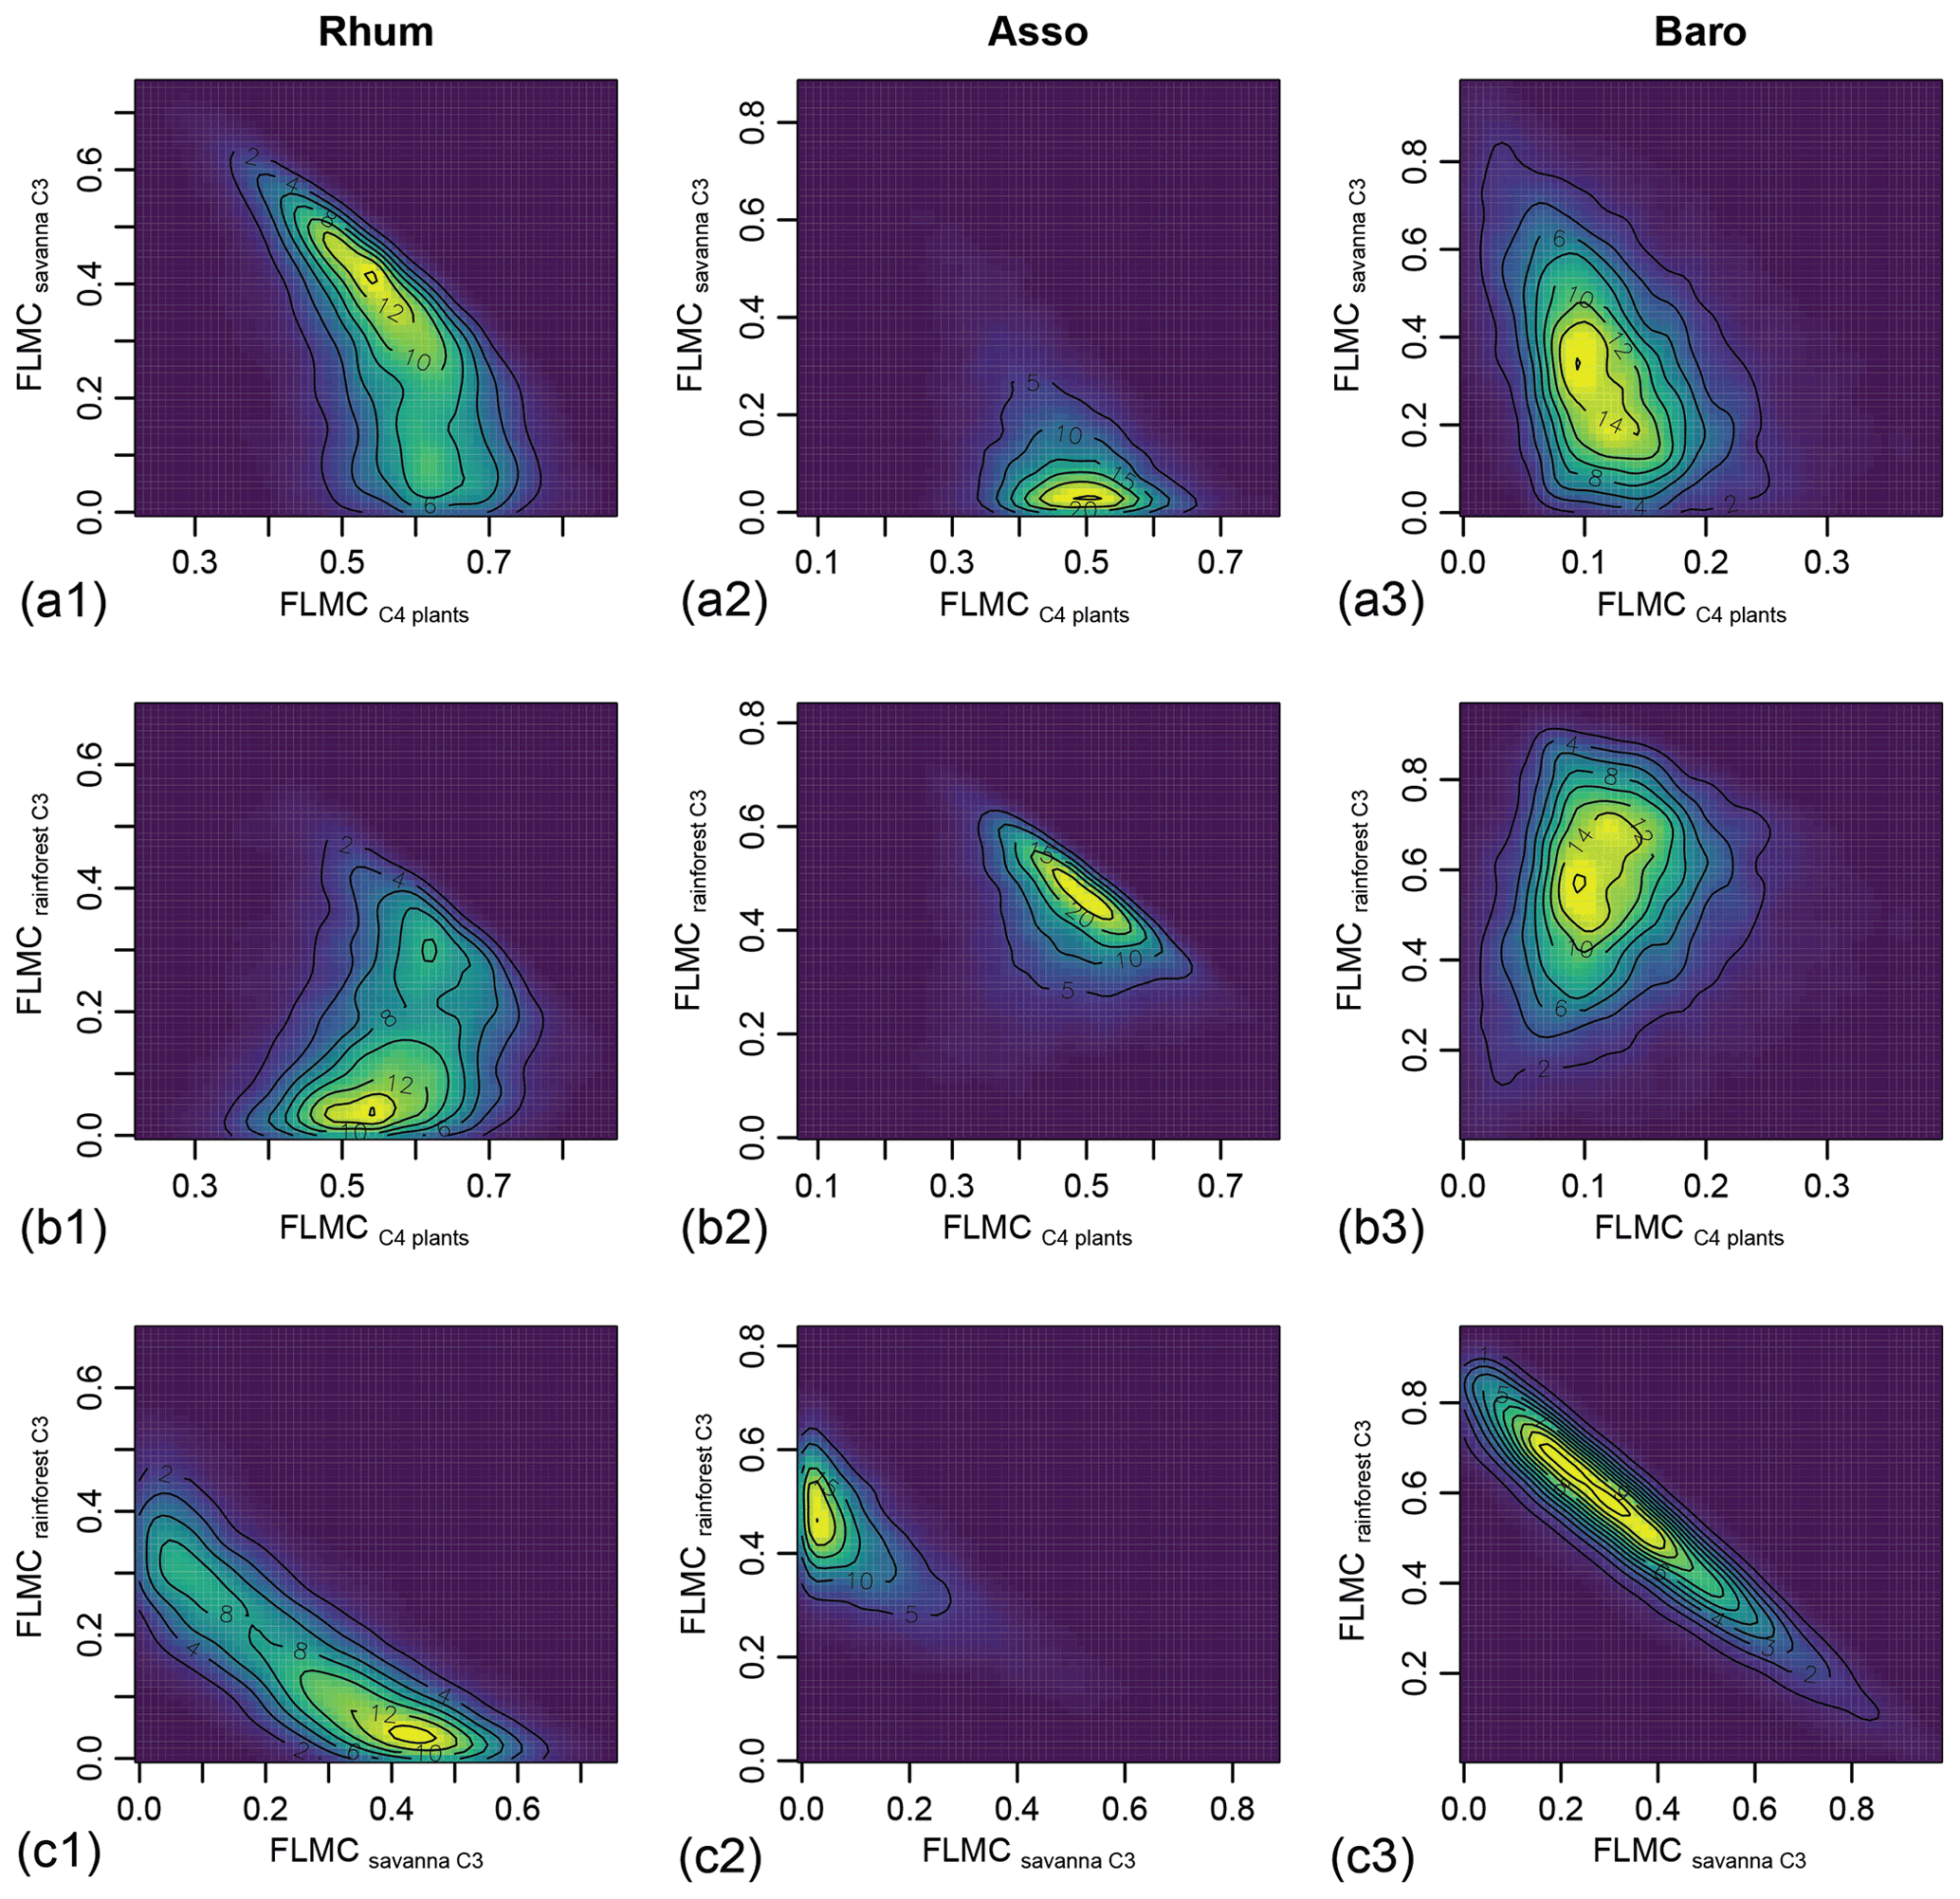
Figure 9Bivariate density plots of the posterior densities of fractional leaf mass contribution (FLMC) of tropical C4 plants, savanna C3 plants, and rainforest C3 plants in published lake surface sediment samples from Cameroon.
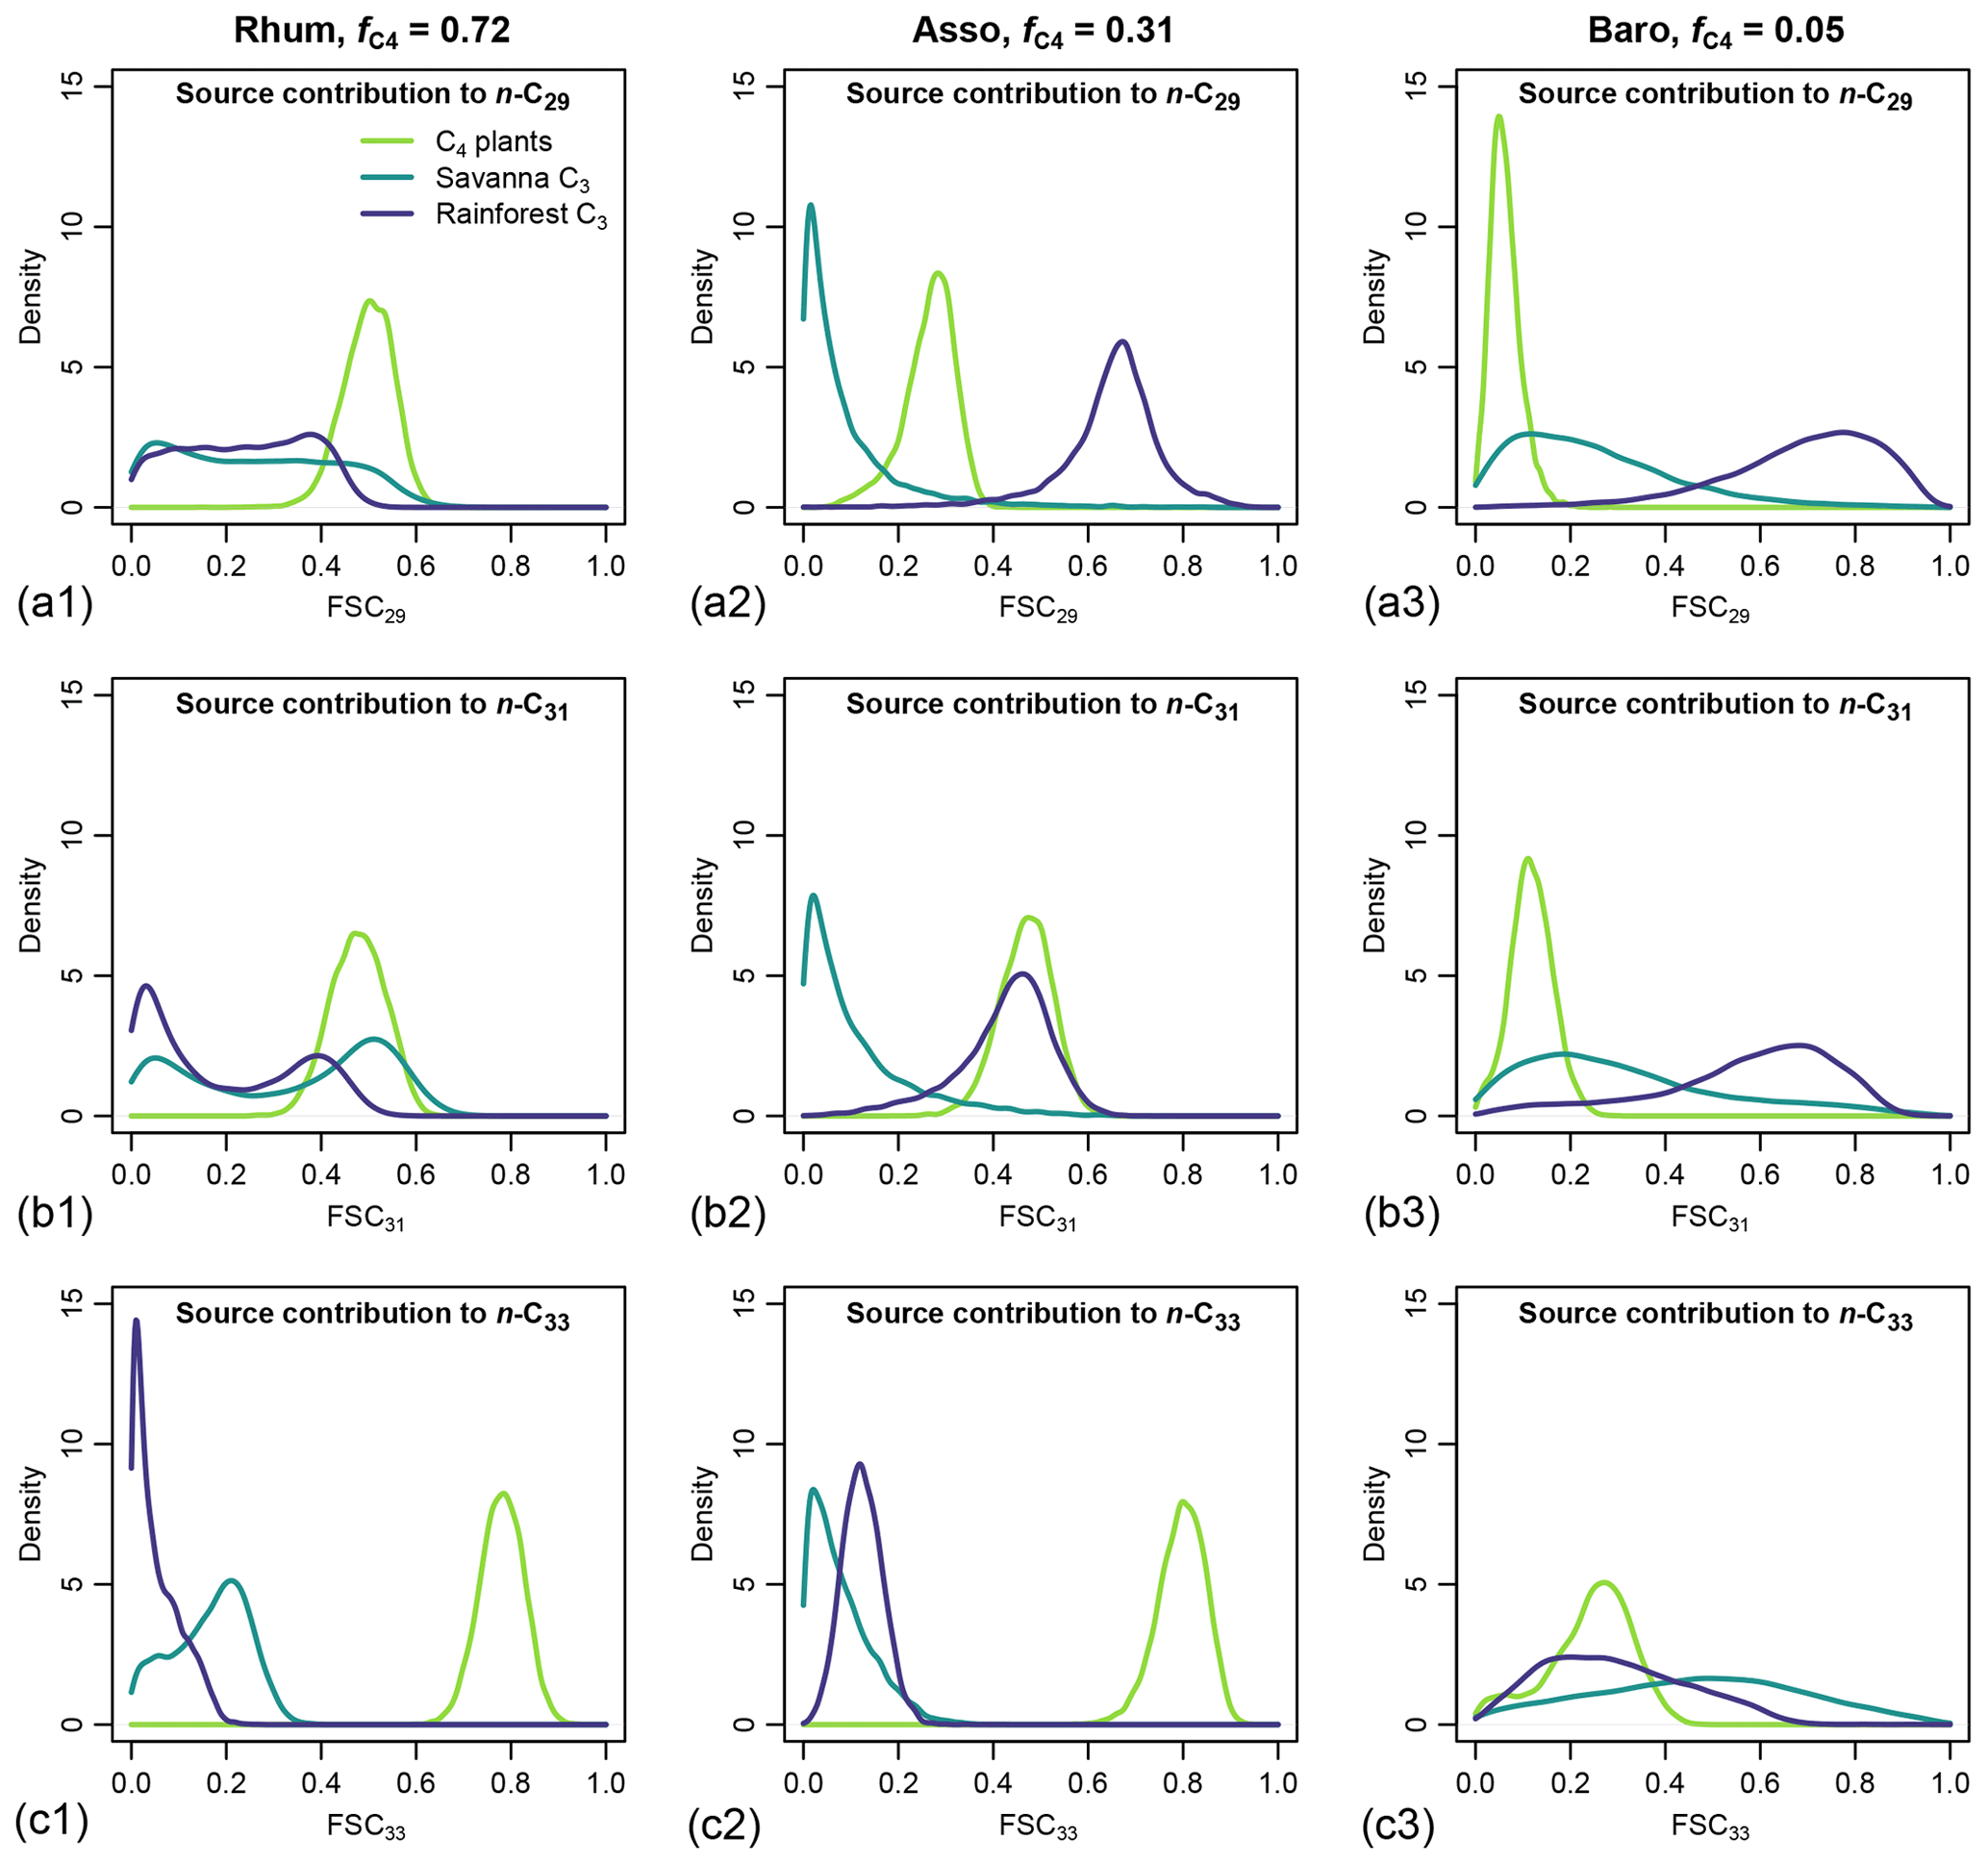
Figure 10Posterior densities of fractional source contribution (FSCn) of terrestrial plants, aquatic macrophytes, and algae to each specific alkane chain (n-C29, n-C31 and n-C33) in published lake surface sediment samples from Cameroon.
The distributions of FSCn of all three sources to each specific chain (n-C29, n-C31 and n-C33) vary substantially between samples. Within each sample, the rainforest C3 source consistently shows a higher FSC29 value over FSC31 and FSC33 (Fig. 10). In comparison, the C4 source shows a lower FSC29 value over FSC31 and FSC33 with the exception of the high-C4 sample (Rhum), in which the C4 FSC29 and FSC31 are almost identical (Fig. 10). Within each sample, the uncertainties of FSCn vary among the chains, with the high-C4 sample (Rhum) exhibiting the highest overall uncertainty in FSC29 and FSC31, and the low-C4 sample (Baro) exhibiting the highest overall uncertainty in FSC33. The high-C4 sample (Rhum) also shows bimodal distributions in FSC29 and FSC31 for the rainforest C3 and savanna C3 sources. Among the samples, the FSCn uncertainty of the C4 source is the lowest.
3.3 Case study 3
The MAPEs of rainforest C3 FLMC are consistently low, ranging from 0.01 to 0.25 in the GIK 16160-3 sequence (Fig. 11). MAPEs of savanna C3 FLMC are consistently high, ranging from 0.51 to 0.80. MAPEs of C4 FLMC range from 0.17 to 0.39. MAPEs of C4 FLMC were relatively stable at ∼ 0.4 from the end of MIS3 to the LGM and gradually decreased to ∼ 0.2 through HS1 and the YD entering the early Holocene. By contrast, MAPEs of rainforest C3 FLMC gradually increased within the same time span to its peak value at ∼ 0.25 but experienced an abrupt drop by the end of HS1 to a consistently low value through the YD and the Holocene. MAPEs of savanna C3 FLMC were relatively steady at ∼ 0.55 from MIS 3 to HS1 but experienced an abrupt increase to ∼ 0.8 by the end of HS1 and remained relatively stable through the YD and the Holocene.

Figure 11(a) Model estimates of fractional leaf mass contribution (FLMC) of three broadly defined biomes through time, based on n-alkane data of the GIK 16160-3 core (Wang et al., 2013a). Solid lines represent maximum a posteriori estimates (MAPE) of the three sources. Dashed lines represent the 89 % highest density interval (HDI) of the posterior distributions. (b) The n-alkane relative abundance and (c) n-alkane δ13C of the same core (Wang et al., 2013a). (d) Global sea level change (Lambeck et al., 2014). (e) BIT index indicating terrestrial sedimentary input (Kasper et al., 2015). (f) The εNd of clay indicating relative influence of the Zambezi River (van der Lubbe et al., 2016). YD represents the Younger Dryas (∼ 13–11 ka). HS1 represents Heinrich Stadial 1 (∼ 18–15 ka). LGM represents the Last Glacial Maximum (∼ 26–19 ka).

Figure 12(a) Model estimates of mean annual precipitation δ2H based on n-alkane δ2H (ice-volume-corrected data, IVC), δ13C, and relative abundance of four n-alkane chains from the GIK 16160-3 core (Wang et al., 2013a). Solid lines represent maximum a posteriori estimates (MAPE) of the three sources. Horizontal dashed lines represent the 89 % highest density interval (HDI) of the posterior distributions. (b) The δ2H (IVC) of n-C29 and n-C31 chains reported by Wang et al. (2013a) for reference. YD represents the Younger Dryas (∼ 13–11 ka). HS1 represents Heinrich Stadial 1 (∼ 18–15 ka). LGM represents the Last Glacial Maximum (∼ 26–19 ka).
The MAPEs of MAP δ2H range from −42 ‰ to −30 ‰, broadly consistent with the range of the modern MAP δ2H record (−37 ± 15 ‰) at the GNIP Ndola station (lat. −13.0000∘, long. 28.6500∘), Zambia (IAEA/WMO, 2022). From the end of MIS 3 to the LGM, MAP δ2H decreased from a local peak value of −35 ‰ at 30 ka to the lowest value of −42 ‰ at 18.6 ka (Fig. 12a). During the glacial–interglacial transgression, MAP δ2H briefly spiked to −32 ‰ during HS1 and immediately dropped to a local low value of −40 ‰ between HS1 and the YD, and it then went up again to −34 ‰ during the YD. The overall range of estimated MAP δ2H (∼ 12 ‰) is also similar to that of the n-C29 alkane but is smaller than that of the n-C31 alkane (Fig. 12b). The estimated MAP δ2H sequence is positively correlated with δ2H of both n-C29 and n-C31 alkanes (p values = 0.0206 and 0.0387, respectively, Fig. 12b), although n-C29 shows a higher correlation coefficient (r = 0.713) than n-C31 (r = 0.658). The overall uncertainty (range of the 89 % HDI) of estimated δ2H of MAP is ∼ 13 ‰ (Fig. 12a), which is much smaller than the parametric uncertainty (−1σ to 1σ, equivalent to a range of 68 % HDI assuming a normal distribution) of εa for, e.g., the n-C29 alkane of trees at > 40 ‰ (Sachse et al., 2012; Konecky et al., 2019).
3.4 Model sensitivity
3.4.1 Sensitivity to parameters of the prior distributions
Using the western Africa prior dataset (Fig. 4), with lower n-alkane concentration and less negative δ13C values in the C4 source, resulted in consistent shifts to higher values of FLMC of the C4 source relative to the results obtained with the sub-Saharan prior dataset (Fig. 13). With the published data on fractional C4 vegetation cover as a reference (Garcin et al., 2014), this set of priors produces FLMC of the C4 source similar to the reported fractional C4 vegetation cover () at the high-C4 site (Rhum) but produces much higher FLMCs than published values at the mid- and low-C4 sites (Asso and Baro).
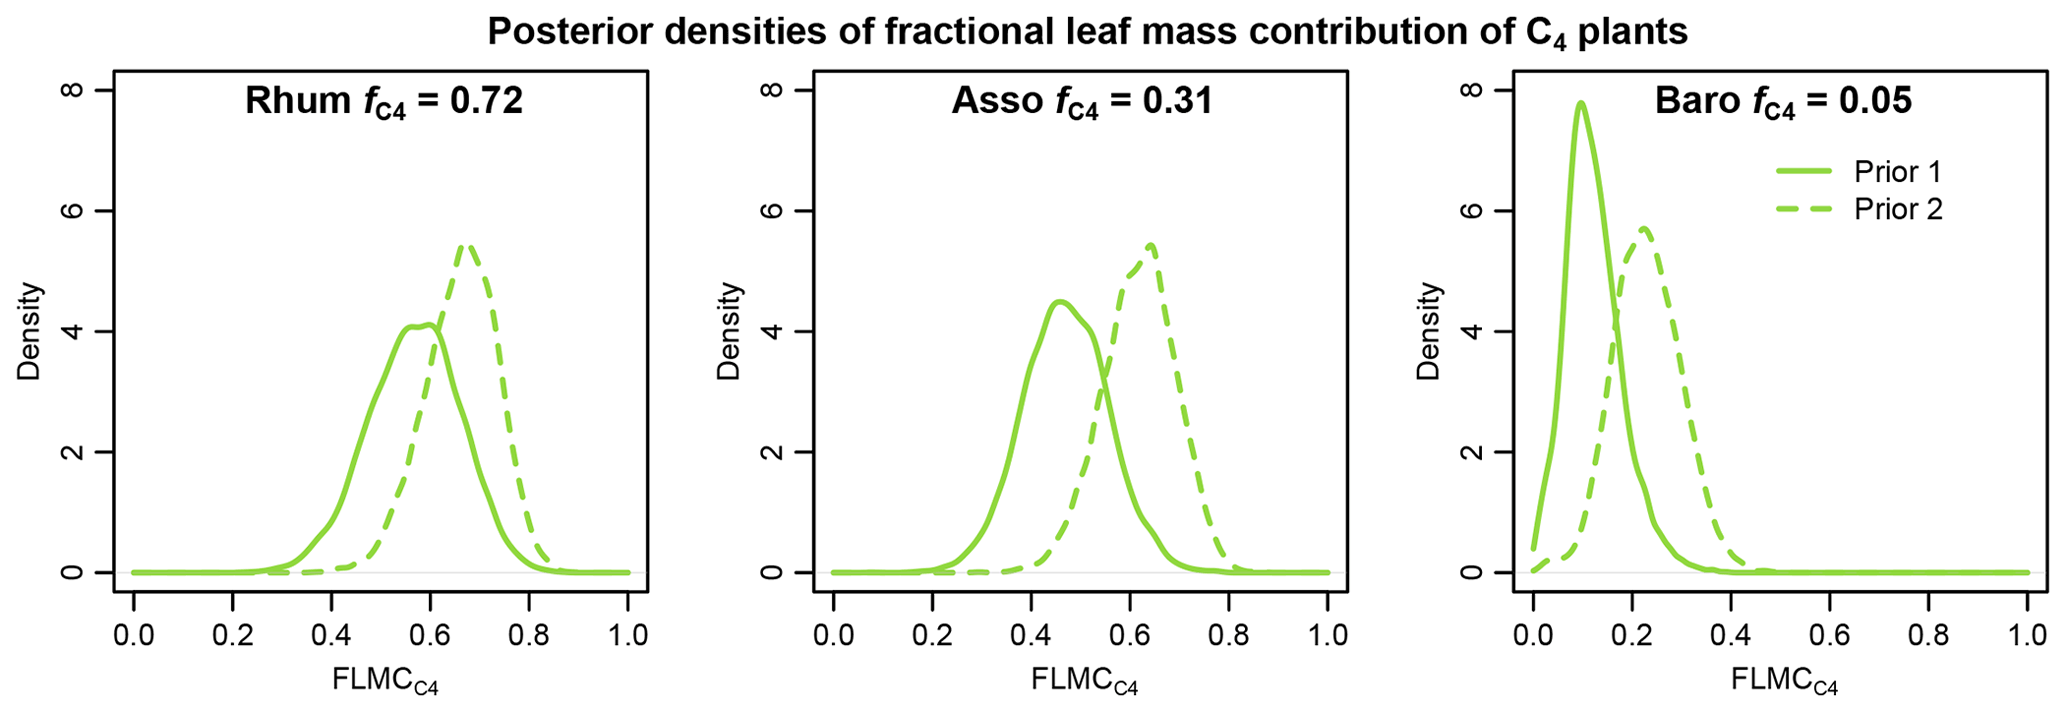
Figure 13Comparisons of posterior densities of fractional leaf mass contribution of the C4 source (FLMC) based on two sets of prior distributions: Prior 1 (solid lines) using sub-Saharan Africa dataset and Prior 2 (dashed lines) using the western Africa dataset. Detailed prior distributions are illustrated in Fig. 4, and values are from Garcin et al. (2014).
3.4.2 Sensitivity to proxy type
The model shows different sensitivity to chain length distribution and carbon stable isotopes. It is relatively insensitive to chain length distribution: only minor changes in the posterior densities are observed when the likelihood evaluations of RA are removed (left column, Fig. 14). By contrast, the model is much more sensitive to the n-alkane δ13C data: the central tendencies of the posterior densities shifted substantially when the likelihood evaluations are removed (right column, Fig. 14). Substantial increases in the dispersion of the posterior densities are also observed, indicating more weakly constrained FLMCs (right column, Fig. 14).
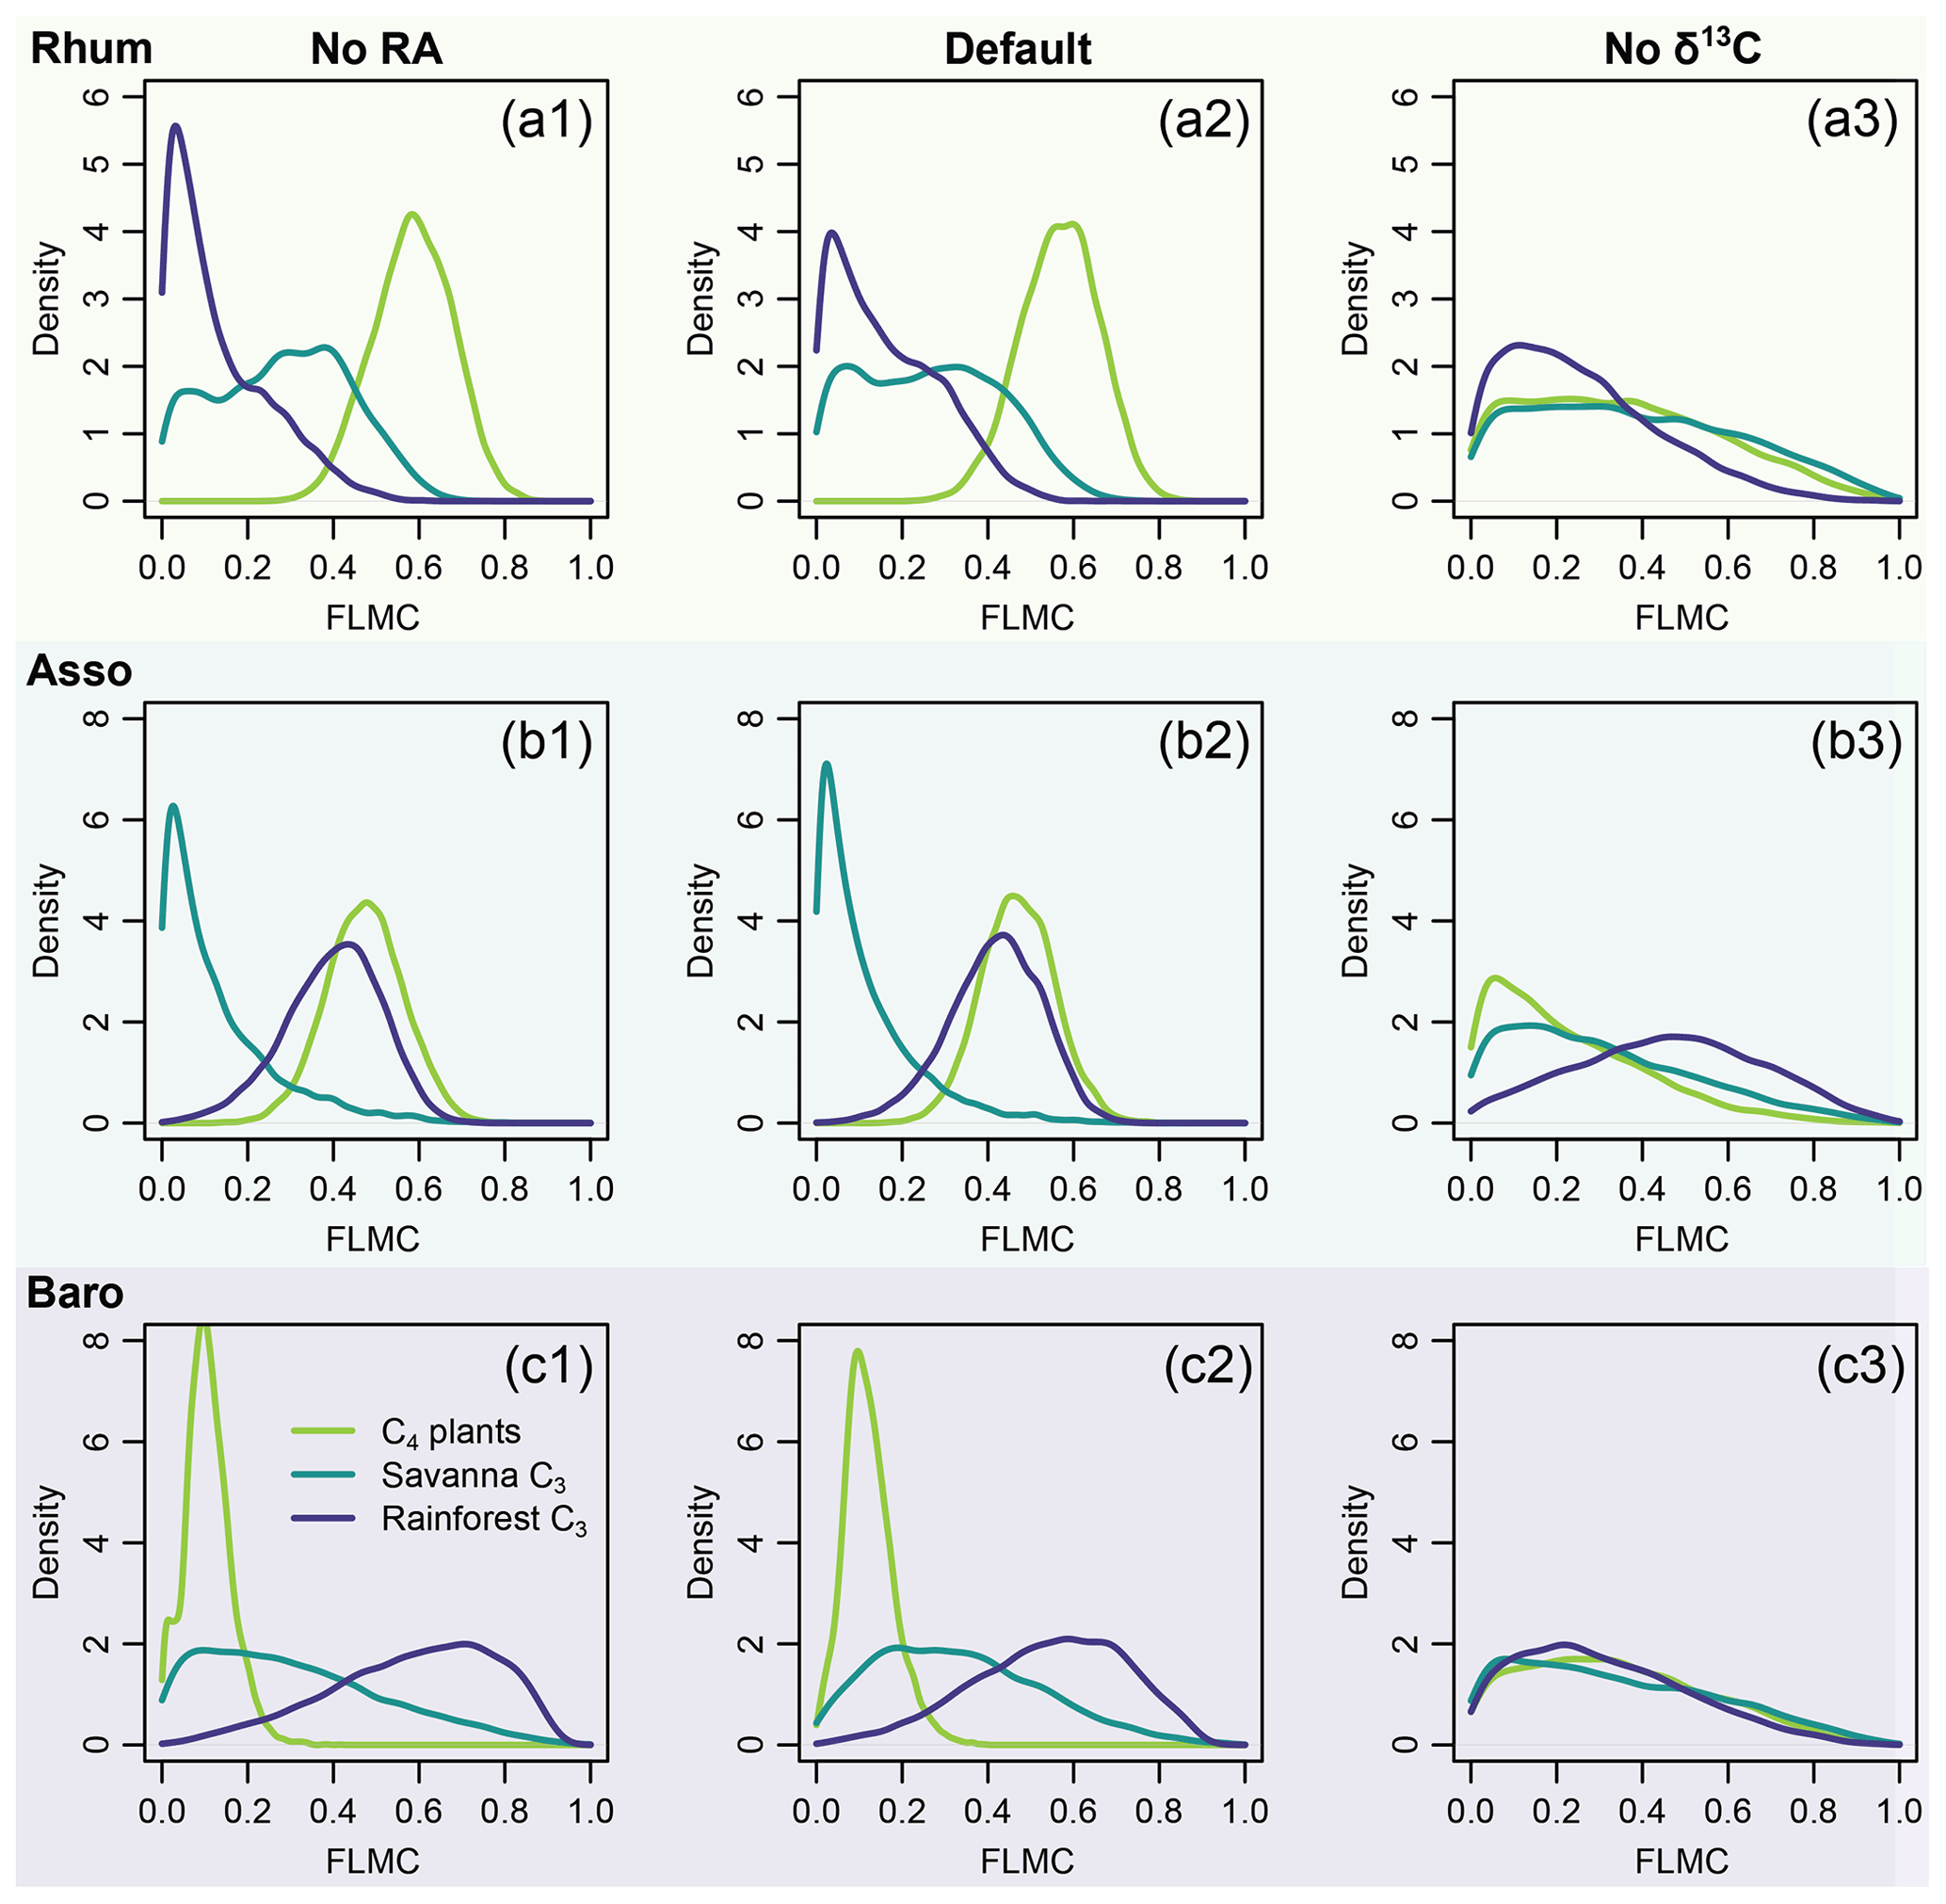
Figure 14Model sensitivity to proxy type in model inversion (Eqs. 6 and 8), using case study 2 as an example. The right column (No RA) shows the model output with the likelihood evaluations of RA completely removed from model evaluation. The left column (No δ13C) shows the model output with the likelihood evaluations of δ13C completely removed from model evaluation.
4.1 Interpretations of results
4.1.1 Case study 1
Long chain n-alkanes (especially 27–31 carbons) in lake sediments are possibly a mixture of both terrestrial and aquatic sources (e.g., Aichner et al., 2010; Duan and Xu, 2012; Wang and Liu, 2012; Liu and Liu, 2016; Dion-Kirschner et al., 2020). Based on model output, both FLMC and FSC27 of aquatic macrophytes are not negligible in the low-Paq sample (QHS13-9S, Figs. 5 and 7). By contrast, FLMC and FSC27 of aquatic macrophytes are minimal in the mid-Paq sample (QHS13-7S, Figs. 5 and 7). These results suggest that Paq alone may not be a reliable indicator of the relative aquatic macrophyte input into the sedimentary archive. In addition, for the high-Paq sample (QHS13-5S), FSC29 of aquatic macrophytes is not negligible, while FSC31 of the terrestrial source is consistently close to 1 among the samples (Fig. 7). This suggests caution should be taken when interpretations of terrestrial paleoenvironment are based on the isotope ratios of n-C29 alkane alone, while previous interpretations based on the n-C31 alkane are likely more reliable.
The relatively unconstrained FLMC of the algae source (Fig. 5) and its “trade-off” with that of the terrestrial source (Fig. 6) suggest that the possibility of algae being an important biomass source of the lake surface sediment cannot be eliminated, and would impact the interpreted contributions from other sources. This possibility is consistent with the observations that the deep-water lake bottom is covered mainly by green algae in Lake Qinghai (Liu et al., 2015). The model approach successfully identified such a possibility, despite the consistently low FSC27 of the algal source (Fig. 7), most likely due to its limited production of the n-C27 alkane (Liu et al., 2015). Algae produce greater amounts of short-chain n-alkanes than mid-chain and long-chain homologues (Han and Calvin, 1969; Gelpi et al., 1970; Cranwell et al., 1987). Theoretically, the inclusion of n-C25 or even shorter chains would provide better constraints on both the aquatic macrophyte and the algae sources. However, this option proved impractical due to the many missing values of n-C25 in the empirical records of terrestrial plants. The other concern would be that mid-chain n-alkanes are also produced by microorganisms (Grimalt et al., 1988; Park, 2005; Ladygina et al., 2006; Brittingham et al., 2017), the influence of which is difficult to assess when only odd-chain alkanes are analyzed.
The Tibetan Plateau has been argued to be an ideal region to investigate the input from aquatic macrophytes to the organic matter and n-alkane pool in lake sediments, due to the minimal presence of terrestrial C4 plants in the region (Wang, 2003; Aichner et al., 2010; Duan and Xu, 2012; Liu et al., 2015). While the carbon isotope values of these two n-alkane sources largely overlap (Aichner et al., 2010; Liu et al., 2015), they display different chain length dominance patterns: aquatic macrophytes produce relatively high proportions of the n-C27 alkane, while terrestrial C4 plants produce relatively high proportions of the n-C31 alkane (Rommerskirchen et al., 2006; Bush and McInerney, 2013; Badewien et al., 2015; Liu et al., 2015; Magill et al., 2019). The consistently low δ13C values of the n-C31 alkane among the samples confirm the minimal contribution from terrestrial C4 plants. In a hypothetical situation where both aquatic macrophytes and terrestrial C4 plants are present, increased aquatic macrophyte contribution would increase the δ13C value of the n-C27 alkane more than the n-C29 alkane, while increased terrestrial C4 contribution would increase the δ13C value of the n-C31 alkane more than the n-C29 alkane. The proposed modeling approach is theoretically capable of distinguishing the n-alkane input from aquatic macrophytes and terrestrial C4 plants by leveraging both chain length distribution and δ13C values of these n-alkane chains. While we do not have a case study to clearly demonstrate such a possibility, future studies are encouraged to explore this further.
4.1.2 Case study 2
This case study demonstrates that the proposed framework can leverage chain length distribution and δ13C of multiple n-alkane chains and offer interpretations on the mixing ratios of multiple sources. The mid-C4 sample (Asso) shows a high relative abundance of n-C29 alkane and contrasting δ13C values among the n-alkane chains (Fig. 8b, which suggests that the most likely mixing regime of the sample is a much higher FLMC of rainforest C3 plants than savanna C3 plants. For the high-C4 sample (Rhum) the model also recovered bimodal mixing possibilities between the rainforest and savanna C3 sources (Fig. 10b1). Such information on the possible mixing patterns of the C3 biomes cannot be achieved with the traditional two-end-member mixing model using n-alkane δ13C values alone.
FLMC as a metric for vegetation reconstruction is not directly comparable with estimated from remote sensing imagery (e.g., MODIS Vegetation Continuous Fields). A carefully selected calibration dataset could support a rigorous comparison of the two metrics. On the other hand, assuming that estimated from satellite imagery is reflecting the true vegetation distribution contributing to the study samples, the differences between FLMC and could inform possible biases associated with FLMC. As presented, the central tendencies of the C4 FLMC at the low- and mid-C4 sites are higher than , while C4 FLMC at the high-C4 site is lower than (Fig. 8). Such a pattern of biases cannot be explained by a higher leaf mass to vegetation cover ratio of the C3 biomes. One possible explanation is with a spatial pattern of n-alkane sourcing and integration. Tropical African lake shores often host a gradient of mixed vegetation from C4 grasses and sedges to C3 trees and shrubs (Vesey-Fitzgerald, 1963; Greenway and Vesey-Fitzgerald, 1969; Howard-Williams and Walker, 1974). If n-alkanes in lake sediments are sourced consistently more from the immediate lakeshore region than from further away, the sediments would more likely integrate a mixed vegetation signal than the surrounding regions, which is consistent with the observed differences between FLMC and .
4.1.3 Case study 3
The model recovered a prominent shift in the vegetation source of the n-alkane record from the LGM to the YD: a gradual increase in rainforest FLMC to its peak during HS1 and an abrupt decrease by the end of HS1 (Fig. 11a). This pattern is driven by both n-alkane chain length distribution and δ13C of the sequence, with an n-C29 dominance and low δ13C values for the n-C29 and the n-C31 alkanes within this time interval (Fig. 11b, c; Wang et al., 2013a). This time interval coincided with the lowest sea level (Fig. 11d; Lambeck et al., 2014) and a high terrestrial organic matter input as indicated by the BIT index (Fig. 11e; Kasper et al., 2015). Neodymium isotopes (εNd, ‰), an indicator of sedimentary clay source, suggest that the Zambezi outflow was the dominant source at the core location during the LGM and HS1, but the outflow from small coastal rivers draining the highlands north of the Zambezi River mouth was relatively high during the early Holocene (Fig. 11f; van der Lubbe et al., 2016). The correlations between n-alkane chain length distribution, δ13C, sea level, and other sedimentary source proxies (see also Just et al., 2014; van der Lubbe et al., 2014; Lattaud et al., 2017) suggest that the source area of n-alkanes at the core location may have changed substantially. Variations in plant wax δ2H in the tropics have been interpreted to primarily reflect variations in local rainfall amount (e.g., Tierney et al., 2008; Schefuß et al., 2011; Berke et al., 2012; Collins et al., 2014; Costa et al., 2014; Shanahan et al., 2015; Castañeda et al., 2016; Niedermeyer et al., 2016; Norström et al., 2018). However, with evidence that supports a substantial change in plant wax sourcing area, alternative explanations for the n-alkane δ2H variation should be considered.
Prior to 15 ka BP, the contribution of Zambezi River sediments to the core location was relatively stable (Fig. 11d, e). The transient rise in rainforest FLMC during the deglaciation is likely associated with alkanes sourcing from near-coastal forests. At the peak of rainforest FLMC during HS1, the estimated MAP δ2H reached its highest point, which is consistent with expectations that coastal rainfall, proximal to ocean moisture sources, would have high δ2H values (Dansgaard, 1964; Rozanski et al., 1993). Immediately after 15 ka BP, coincident with abrupt sea level rise (Fig. 11d), rainforest FLMC dropped to near zero and savanna FLMC became dominant. At the same time, a transient drop in estimated MAP δ2H is consistent with the lower values expected for inland moisture contributing to n-alkanes mobilized from the savanna biome. This pattern aligns well with interpretations of the changing properties of terrigenous sediments in the nearby GeoB9307-3 core (Just et al., 2014). Going into the early and mid-Holocene with rising sea level and warmer conditions, there is an overall rise in MAP δ2H leading to the mid-Holocene peak, which can be explained by a gradual increase in moisture availability in the Zambezi catchment. This interpretation is also supported by patterns of sedimentary transport (Just et al., 2014; van der Lubbe et al., 2016). As such, when interpreting variations in plant wax δ2H record from a marine core, it is important to consider moisture source and transport history as alternative mechanisms to temporal change in rainfall isotope values at fixed locations.
4.1.4 Sensitivity tests
The results of sensitivity test 1 (Fig. 13) show that using a different set of prior distributions (Fig. 4) can produce somewhat different central tendencies in FLMCs with the same sedimentary n-alkane data. This demonstrates that the outputs are model dependent: they provide a basis for interpreting proxy data in the context of a specific model with its associated priors and assumptions. Using the published values as a reference, Prior 2 (the western Africa prior) is associated with overall higher estimated C4 FLMCs than those with Prior 1 (the sub-Saharan Africa prior, Fig. 13). This unidirectional shift in FLMCs is consistent with the expectation of a systematic difference between the two prior distributions. Based on the comparison with satellite-based vegetation cover, this further suggests that Prior 1 is perhaps a better representation of the vegetation sources that produced the n-alkane mixtures in the sedimentary samples than Prior 2 (given the caveats of this comparison, discussed above).
The results of sensitivity test 2 (Fig. 14) show that δ13C places stronger constraints on the results than chain length distribution. This demonstrates the importance of stable isotopes as tracers in compound-specific mixing models. In contrast to other carbon-isotope based methods, the model proposed here might still provide reasonable resolution of sources when the chain-length distribution of the sources is substantially different.
4.2 Model achievements
The proposed model framework offers a more integrative approach to interpretation of n-alkane records that could better leverage these rich data to support more nuanced and specific reconstructions of paleo-vegetation and paleoclimate. It has potential advantages over traditional approaches to the interpretation of sedimentary n-alkanes.
First, the model offers a numerical solution (Sect. 2.1.2) that accounts for the uncertainty associated with n-alkane production among the sources (Figs. 2 and 3), which is coupled with the mass balance equation of n-alkane δ13C (Eq. 5). This allows δ13C to be used to constrain the uncertainty associated with n-alkane chain length distributions, which have previously been used in isolation to reconstruct vegetation (Jansen et al., 2010; Gao et al., 2011; Peaple et al., 2021). The model also addresses a common assumption in the interpretation of lipid δ13C data via linear mixing relationships, in which n-alkane production for a selected chain is assumed to be the same among all sources (Bush and McInerney, 2013; Garcin et al., 2014).
Second, the case studies demonstrate that the model can be used to explore mixing regimes of multiple sources, which offers alternative interpretations compared to the traditional two-end-member mixing regime using δ13C of one n-alkyl lipid. Case studies 1 and 2 showcase the flexibility of the model framework since the vegetation sources and their prior distributions are user-defined. They also highlight the strengths of the Bayesian framework in disentangling multivariate mixing scenarios in plant wax lipids. The multi-source framework can also be used to assist the interpretations of associated n-alkane δ2H as demonstrated in case study 3.
Moreover, the new metric FLMC has the potential to evaluate leaf mass integration patterns in sedimentary archives. The molecular distribution and δ13C of n-alkanes have been used extensively in the assessment of sedimentary organic matter input (e.g., Wiesenberg et al., 2004; Mead et al., 2005; Aichner et al., 2010; Kristen et al., 2010; Seki et al., 2010; Hockun et al., 2016; Ankit et al., 2017; Liu et al., 2020). Because n-alkane concentrations (µg g−1) involved in the mixing model are ultimately derived from dried leaf mass (Sect. 2.1.2), the model can potentially make an explicit connection between FLMC (as in Figs. 5 and 8) and patterns of organic matter sourcing. Although the model presented here does not yet support these interpretations, addition of components to enable e.g., parameterizing of biome-specific primary productivity would be relatively straightforward in future applications.
Lastly, by leveraging compound-specific stable isotope data from multiple n-alkane chains, the model framework is capable of filtering out noise from true environmental signals. Many studies use plant wax δ2H data of one selected chain to estimate source water δ2H. However, the reported uncertainty of the source water δ2H estimation can be miscalculated (Polissar and D'Andrea, 2014). The advantage of the Bayesian framework is in its straightforward propagation of uncertainties (Tingley et al., 2012) in the mixing process of multiple plant wax compounds. For example, in case study 3, the relatively narrow uncertainty bounds of the estimated MAP δ2H values (Fig. 12a) demonstrates that the model framework is less sensitive to the parametric uncertainty associated with any one n-alkane chain than conventional approaches. This can reduce the risks of potentially interpreting data anomalies as environmental signals.
4.3 Future directions
The proposed mixing model is the bare core of a potentially more comprehensive proxy system model, an approach that has gained traction in recent developments of paleoenvironmental reconstruction (e.g., Garreta et al., 2010; Li et al., 2010; Tingley et al., 2012; Evans et al., 2013; Dee et al., 2018; Konecky et al., 2019; Bowen et al., 2020). A proxy system model is a representation of the complete proxy system that ideally includes four components: the environment, the sensor, the archive, and the observation (Evans et al., 2013). The mixing model here primarily describes the sensor and observation components of the complete proxy system, while the environment and the archive components have not been incorporated (see Dee et al., 2015, 2018; Konecky et al., 2019 as examples for other model components). Future efforts that elaborate on the model structure will provide updated model assumptions, which should be based on systematic investigations of the specific proxy system components. Here are three categories of model improvements to consider.
4.3.1 Improvements on prior distributions
A better characterization of n-alkane chain length distribution and δ13C in modern plants can potentially expand model application, due to the prior distributions' reliance on empirical data. At the same time, substantial gaps in our knowledge of n-alkanes still exist, especially from certain underrepresented regions of the world, such as western, central, and southeastern Asia, as well as certain biomes, such as Afromontane and coastal forests (see global compilations by, e.g., Bush and McInerney, 2013; Diefendorf and Freimuth, 2017). Future studies should aim at bridging the gaps with systematic surveys of the concentrations, δ13C, and εa of n-alkanes and potentially other plant wax compounds in modern plants. The need for a centralized database for plant wax lipids is also worth mentioning, as it will facilitate easy access to published records of both lipid concentrations and stable isotope values. From a different perspective, the development of mechanistic ways to represent the prior covariance patterns in concentrations, δ13C, and εa of n-alkanes can reduce the model's reliance on complete data records and improve its tolerance of missing values. These efforts can improve the flexibility of model application and the robustness of model results.
4.3.2 Better understanding of the processes and the incorporation of additional tracers
Processes such as n-alkane turnover and transportation have not been incorporated into the model framework primarily because they are still poorly understood (Sachse et al., 2012; Diefendorf and Freimuth, 2017). For example, factors associated with plant growth, such as primary productivity, leaf lifespan, and leaf turnover patterns (e.g., Burnham, 1989; Greenwood, 1991; Hauke and Schreiber, 1998; Jetter and Schäffer, 2001; Ellis and Johnson, 2013; Tipple et al., 2013; Suh and Diefendorf, 2018; Suh et al., 2019), can influence the overall n-alkane turnover rate of a specific plant source. The n-alkane transportation can be another source of systematic biases in the interpretation of n-alkane records (e.g., Schefuß et al., 2004; Yamamoto et al., 2013; Nelson et al., 2018; Freimuth et al., 2019; McFarlin et al., 2019; Suh et al., 2019). Catchment-specific integration effects such as spatial and temporal lipid integration (see case study 3) can also affect the interpretation of n-alkane records (e.g., Schefuß et al., 2004; Seki et al., 2010; Vogts et al., 2012; Douglas et al., 2014; Garcin et al., 2014; Herrmann et al., 2016; French et al., 2018; Freimuth et al., 2019, 2021). Understanding these processes would ideally involve additional tracers or proxies. Future studies that investigate n-alkane turnover patterns may consider tracking the total amount of n-alkanes produced and its relationship with the primary productivity of the plants in a year. The incorporation of, e.g., pollen, sedimentary tracers, and multiple isotopes (e.g., Seki et al., 2010; Feakins, 2013; Just et al., 2014; Kasper et al., 2015; van der Lubbe et al., 2016; Feakins et al., 2018; Freimuth et al., 2019), as process indicators can help to inform the relative importance of different transportation processes.
4.3.3 Incorporation of environmental factors into the proxy system
Environmental factors, such as temperature and precipitation, are primary determinants of vegetation composition, but they also influence n-alkane concentration, δ13C and δ2H (sensor values) through plant physiological response. The inclusion of environmental factors into the model framework would naturally involve n-alkane δ2H in a more mechanistic way (e.g., Liu and Yang, 2008; Sachse et al., 2012; Sessions, 2016; Liu and An, 2018). For example, εa of n-alkanes can be partitioned into a biosynthetic fractionation term (εbio) and a evaporative enrichment term (εeva). The multi-level influence from environmental factors to, e.g., εa of n-alkanes, include a relatively static element, such as a taxon-specific biosynthetic fractionation term (εbio) (although, see Newberry et al., 2015, for counterexamples; Cormier et al., 2018), and dynamic elements such as environment-dependent evaporative enrichment terms (εeva) for leaf water and soil water (e.g., Douglas et al., 2012; Sachse et al., 2012; Kahmen et al., 2013a; Tipple et al., 2015; Cernusak et al., 2016; Sprenger et al., 2016; Liu and An, 2018; Konecky et al., 2019). Future studies should consider developing such model components, which will ultimately permit proxy system interpretation at the environmental level.
Traditional interpretations of n-alkane proxies often rely on either chain length distribution or δ13C values of one chain to reconstruct vegetation composition. An alternative approach is to combine the information from both lines of evidence to refine our interpretations. We presented a Bayesian modeling approach that simultaneously evaluates both chain length distribution and stable carbon isotope measurements of sedimentary n-alkanes. The model incorporates the uncertainties associated with n-alkane concentration and carbon isotope ratios of multiple chains, using a generic mixing process with isotope mass balance. We presented three case studies to illustrate how the model can be applied to the interpretation of sedimentary n-alkane records. The first one involves published long-chain n-alkane records from lake surface sediments of Lake Qinghai, China. The second one involves published long-chain n-alkane records from lake surface sediments along a vegetation gradient in Cameroon, western Africa. The third one involves published long-chain n-alkane records with associated δ2H data from a marine core off the Zambezi River mouth. The first two case studies demonstrate that compared to traditional two-end mixing models, our approach can resolve mixing fractions (FLMC) of multiple n-alkane sources, providing alternative interpretations of vegetation composition to the same n-alkane record. With biome-specific εa component added to the framework, the third case study demonstrates that the model is capable of estimating precipitation δ2H with a reasonable range of uncertainty by leveraging δ2H of multiple n-alkane chains. Despite these achievements, several processes associated with n-alkane integration in sedimentary archives are still not accounted for. Future studies on n-alkane turnover and transportation will improve our understanding of the biases and constraints associated with n-alkane records. The Bayesian model framework could be further improved by adding more mechanistic modeling components such as n-alkane integration processes and additional environmental processes involving δ2H. The modeling approach represents a continuously evolving framework that can incorporate new understandings and leverage additional proxies in the future.
All data and code used to conduct the analyses and create figures reported in this paper are archived online and available at https://doi.org/10.5281/zenodo.7025765 (Yang, 2022).
The supplement related to this article is available online at: https://doi.org/10.5194/cp-18-2181-2022-supplement.
DY conceived, designed, and conducted the analyses with support from GJB. DY prepared the manuscript with contributions from GJB.
The contact author has declared that none of the authors has any competing interests.
Publisher’s note: Copernicus Publications remains neutral with regard to jurisdictional claims in published maps and institutional affiliations.
We would like to thank Jamie McFarlin, Kevin Uno, and Brenden Fischer-Femal for their comments and discussions about the model development.
This research has been supported by the NSF Division of Biological Infrastructure (grant no. ABI-1759730).
This paper was edited by Julie Loisel and reviewed by two anonymous referees.
Aichner, B., Herzschuh, U., and Wilkes, H.: Influence of aquatic macrophytes on the stable carbon isotopic signatures of sedimentary organic matter in lakes on the Tibetan Plateau, Org. Geochem., 41, 706–718, https://doi.org/10.1016/j.orggeochem.2010.02.002, 2010.
Aleman, J. C., Fayolle, A., Favier, C., Staver, A. C., Dexter, K. G., Ryan, C. M., Azihou, A. F., Bauman, D., te Beest, M., Chidumayo, E. N., Comiskey, J. A., Cromsigt, J. P. G. M., Dessard, H., Doucet, J.-L., Finckh, M., Gillet, J.-F., Gourlet-Fleury, S., Hempson, G. P., Holdo, R. M., Kirunda, B., Kouame, F. N., Mahy, G., Gonçalves, F. M. P., McNicol, I., Quintano, P. N., Plumptre, A. J., Pritchard, R. C., Revermann, R., Schmitt, C. B., Swemmer, A. M., Talila, H., Woollen, E., and Swaine, M. D.: Floristic evidence for alternative biome states in tropical Africa, P. Natl. Acad. Sci. USA, 117, 28183–28190, https://doi.org/10.1073/pnas.2011515117, 2020.
Ali, H. A. M., Mayes, R. W., Hector, B. L., and Orskov, E. R.: Assessment of n-alkanes, long-chain fatty alcohols and long-chain fatty acids as diet composition markers: The concentrations of these compounds in rangeland species from Sudan, Anim. Feed Sci. Tech., 121, 257–271, https://doi.org/10.1016/j.anifeedsci.2005.02.026, 2005.
Allen, E. D. and Spence, D. H. N.: The differential ability of aquatic plants to utilize the inorganic carbon supply in fresh waters, New Phytol., 87, 269–283, https://doi.org/10.1111/j.1469-8137.1981.tb03198.x, 1981.
Andrae, J. W., McInerney, F. A., Polissar, P. J., Sniderman, J. M. K., Howard, S., Hall, P. A., and Phelps, S. R.: Initial expansion of C4 vegetation in Australia during the late Pliocene, Geophys. Res. Lett., 45, 4831–4840, https://doi.org/10.1029/2018GL077833, 2018.
Andrae, J. W., McInerney, F. A., Tibby, J., Henderson, A. C. G., Hall, P. A., Marshall, J. C., McGregor, G. B., Barr, C., and Greenway, M.: Variation in leaf wax n-alkane characteristics with climate in the broad-leaved paperbark (Melaleuca quinquenervia), Org. Geochem., 130, 33–42, https://doi.org/10.1016/j.orggeochem.2019.02.004, 2019.
Ankit, Y., Mishra, P. K., Kumar, P., Jha, D. K., Kumar, V. V., Ambili, V., and Anoop, A.: Molecular distribution and carbon isotope of n-alkanes from Ashtamudi Estuary, South India: Assessment of organic matter sources and paleoclimatic implications, Mar. Chem., 196, 62–70, https://doi.org/10.1016/j.marchem.2017.08.002, 2017.
Badewien, T., Vogts, A., and Rullkötter, J.: n-Alkane distribution and carbon stable isotope composition in leaf waxes of C3 and C4 plants from Angola, Org. Geochem., 89–90, 71–79, https://doi.org/10.1016/j.orggeochem.2015.09.002, 2015.
Berke, M. A., Johnson, T. C., Werne, J. P., Grice, K., Schouten, S., and Sinninghe Damsté, J. S.: Molecular records of climate variability and vegetation response since the Late Pleistocene in the Lake Victoria basin, East Africa, Quaternary Sci. Rev., 55, 59–74, https://doi.org/10.1016/j.quascirev.2012.08.014, 2012.
Bi, X., Sheng, G., Liu, X., Li, C., and Fu, J.: Molecular and carbon and hydrogen isotopic composition of n-alkanes in plant leaf waxes, Org. Geochem., 36, 1405–1417, https://doi.org/10.1016/j.orggeochem.2005.06.001, 2005.
Bird, M. I., Summons, R. E., Gagan, M. K., Roksandic, Z., Dowling, L., Head, J., Keith Fifield, L., Cresswell, R. G., and Johnson, D. P.: Terrestrial vegetation change inferred from n-alkane δ13C analysis in the marine environment, Geochim. Cosmochim. Ac., 59, 2853–2857, https://doi.org/10.1016/0016-7037(95)00160-2, 1995.
Bobe, R. and Behrensmeyer, A. K.: The expansion of grassland ecosystems in Africa in relation to mammalian evolution and the origin of the genus Homo, Palaeogeogr. Palaeocl., 207, 399–420, https://doi.org/10.1016/j.palaeo.2003.09.033, 2004.
Bowen, G. J.: The Online Isotopes in Precipitation Calculator (version 3.1) [data set], http://www.waterisotopes.org, last access: 20 May 2022.
Bowen, G. J. and Revenaugh, J.: Interpolating the isotopic composition of modern meteoric precipitation, Water Resour. Res., 39, 1299, https://doi.org/10.1029/2003WR002086, 2003.
Bowen, G. J., Fischer-Femal, B., Reichart, G.-J., Sluijs, A., and Lear, C. H.: Joint inversion of proxy system models to reconstruct paleoenvironmental time series from heterogeneous data, Clim. Past, 16, 65–78, https://doi.org/10.5194/cp-16-65-2020, 2020.
Bray, E. E. and Evans, E. D.: Distribution of n-paraffins as a clue to recognition of source beds, Geochim. Cosmochim. Ac., 22, 2–15, https://doi.org/10.1016/0016-7037(61)90069-2, 1961.
Brittingham, A., Hren, M. T., and Hartman, G.: Microbial alteration of the hydrogen and carbon isotopic composition of n-alkanes in sediments, Org. Geochem., 107, 1–8, https://doi.org/10.1016/j.orggeochem.2017.01.010, 2017.
Buggle, B., Wiesenberg, G. L. B., and Glaser, B.: Is there a possibility to correct fossil n-alkane data for postsedimentary alteration effects?, Appl. Geochem., 25, 947–957, https://doi.org/10.1016/j.apgeochem.2010.04.003, 2010.
Burnham, R. J.: Relationships between standing vegetation and leaf litter in a paratropical forest: Implications for paleobotany, Rev. Palaeobot. Palynol., 58, 5–32, https://doi.org/10.1016/0034-6667(89)90054-7, 1989.
Bush, R. T. and McInerney, F. A.: Leaf wax n-alkane distributions in and across modern plants: Implications for paleoecology and chemotaxonomy, Geochim. Cosmochim. Ac., 117, 161–179, https://doi.org/10.1016/j.gca.2013.04.016, 2013.
Bush, R. T. and McInerney, F. A.: Influence of temperature and C4 abundance on n-alkane chain length distributions across the central USA, Org. Geochem., 79, 65–73, https://doi.org/10.1016/j.orggeochem.2014.12.003, 2015.
Caley, T., Extier, T., Collins, J. A., Schefuß, E., Dupont, L., Malaizé, B., Rossignol, L., Souron, A., McClymont, E. L., Jimenez-Espejo, F. J., García-Comas, C., Eynaud, F., Martinez, P., Roche, D. M., Jorry, S. J., Charlier, K., Wary, M., Gourves, P.-Y., Billy, I., and Giraudeau, J.: A two-million-year-long hydroclimatic context for hominin evolution in southeastern Africa, Nature, 560, 76–79, https://doi.org/10.1038/s41586-018-0309-6, 2018.
Carr, A. S., Boom, A., Grimes, H. L., Chase, B. M., Meadows, M. E., and Harris, A.: Leaf wax n-alkane distributions in arid zone South African flora: Environmental controls, chemotaxonomy and palaeoecological implications, Org. Geochem., 67, 72–84, https://doi.org/10.1016/j.orggeochem.2013.12.004, 2014.
Castañeda, I. S., Mulitza, S., Schefuß, E., Lopes dos Santos, R. A., Sinninghe Damsté, J. S., and Schouten, S.: Wet phases in the Sahara/Sahel region and human migration patterns in North Africa, P. Natl. Acad. Sci. USA, 106, 20159–20163, https://doi.org/10.1073/pnas.0905771106, 2009.
Castañeda, I. S., Schouten, S., Pätzold, J., Lucassen, F., Kasemann, S., Kuhlmann, H., and Schefuß, E.: Hydroclimate variability in the Nile River Basin during the past 28 000 years, Earth Planet. Sc. Lett., 438, 47–56, https://doi.org/10.1016/j.epsl.2015.12.014, 2016.
Cerling, T. E.: Development of grasslands and savannas in East Africa during the Neogene, Palaeogeogr. Palaeocl., 97, 241–247, 1992.
Cernusak, L. A., Ubierna, N., Winter, K., Holtum, J. A. M., Marshall, J. D., and Farquhar, G. D.: Environmental and physiological determinants of carbon isotope discrimination in terrestrial plants, New Phytol., 200, 950–965, https://doi.org/10.1111/nph.12423, 2013.
Cernusak, L. A., Barbour, M. M., Arndt, S. K., Cheesman, A. W., English, N. B., Feild, T. S., Helliker, B. R., Holloway-Phillips, M. M., Holtum, J. A. M., Kahmen, A., McInerney, F. A., Munksgaard, N. C., Simonin, K. A., Song, X., Stuart-Williams, H., West, J. B., and Farquhar, G. D.: Stable isotopes in leaf water of terrestrial plants, Plant Cell Environ., 39, 1087–1102, https://doi.org/10.1111/pce.12703, 2016.
Cheesbrough, T. M. and Kolattukudy, P. E.: Alkane biosynthesis by decarbonylation of aldehydes catalyzed by a particulate preparation from Pisum sativum, P. Natl. Acad. Sci. USA, 81, 6613–6617, https://doi.org/10.1073/pnas.81.21.6613, 1984.
Chikaraishi, Y., Naraoka, H., and Poulson, S. R.: Carbon and hydrogen isotopic fractionation during lipid biosynthesis in a higher plant (Cryptomeria japonica), Phytochemistry, 65, 323–330, https://doi.org/10.1016/j.phytochem.2003.12.003, 2004.
Collins, J. A., Schefuß, E., Mulitza, S., Prange, M., Werner, M., Tharammal, T., Paul, A., and Wefer, G.: Estimating the hydrogen isotopic composition of past precipitation using leaf-waxes from western Africa, Quaternary Sci. Rev., 65, 88–101, https://doi.org/10.1016/j.quascirev.2013.01.007, 2013.
Collins, J. A., Schefuß, E., Govin, A., Mulitza, S., and Tiedemann, R.: Insolation and glacial–interglacial control on southwestern African hydroclimate over the past 140 000 years, Earth Planet. Sc. Lett., 398, 1–10, https://doi.org/10.1016/j.epsl.2014.04.034, 2014.
Collister, J. W., Rieley, G., Stern, B., Eglinton, G., and Fry, B.: Compound-specific δ13C analyses of leaf lipids from plants with differing carbon dioxide metabolisms, Org. Geochem., 21, 619–627, https://doi.org/10.1016/0146-6380(94)90008-6, 1994.
Cormier, M.-A., Werner, R. A., Sauer, P. E., Gröcke, D. R., Leuenberger, M. C., Wieloch, T., Schleucher, J., and Kahmen, A.: 2H-fractionations during the biosynthesis of carbohydrates and lipids imprint a metabolic signal on the δ2H values of plant organic compounds, New Phytol., 218, 479–491, https://doi.org/10.1111/nph.15016, 2018.
Costa, K., Russell, J., Konecky, B., and Lamb, H.: Isotopic reconstruction of the African Humid Period and Congo Air Boundary migration at Lake Tana, Ethiopia, Quaternary Sci. Rev., 83, 58–67, https://doi.org/10.1016/j.quascirev.2013.10.031, 2014.
Cranwell, P. A., Eglinton, G., and Robinson, N.: Lipids of aquatic organisms as potential contributors to lacustrine sediments – II, Org. Geochem., 11, 513–527, https://doi.org/10.1016/0146-6380(87)90007-6, 1987.
Curtis, S. M.: mcmcplots: Create Plots from MCMC Output (0.4.3), CRAN [code], https://CRAN.R-project.org/package=mcmcplots (last access: 30 November 2021), 2018.
Dansgaard, W.: Stable isotopes in precipitation, Tellus, 16, 436–468, 1964.
Dee, S., Emile-Geay, J., Evans, M. N., Allam, A., Steig, E. J., and Thompson, D. M.: PRYSM: An open-source framework for PRoxY System Modeling, with applications to oxygen-isotope systems, J. Adv. Model. Earth Syst., 7, 1220–1247, https://doi.org/10.1002/2015MS000447, 2015.
Dee, S. G., Russell, J. M., Morrill, C., Chen, Z., and Neary, A.: PRYSM v2.0: A Proxy System Model for Lacustrine Archives, Paleoceanography and Paleoclimatology, 33, 1250–1269, https://doi.org/10.1029/2018PA003413, 2018.
Diefendorf, A. F. and Freimuth, E. J.: Extracting the most from terrestrial plant-derived n-alkyl lipids and their carbon isotopes from the sedimentary record: A review, Org. Geochem., 103, 1–21, https://doi.org/10.1016/j.orggeochem.2016.10.016, 2017.
Diefendorf, A. F., Mueller, K. E., Wing, S. L., Koch, P. L., and Freeman, K. H.: Global patterns in leaf 13C discrimination and implications for studies of past and future climate, P. Natl. Acad. Sci. USA, 107, 5738–5743, https://doi.org/10.1073/pnas.0910513107, 2010.
Diefendorf, A. F., Freeman, K. H., Wing, S. L., and Graham, H. V.: Production of n-alkyl lipids in living plants and implications for the geologic past, Geochim. Cosmochim. Ac., 75, 7472–7485, https://doi.org/10.1016/j.gca.2011.09.028, 2011.
Diefendorf, A. F., Leslie, A. B., and Wing, S. L.: Leaf wax composition and carbon isotopes vary among major conifer groups, Geochim. Cosmochim. Ac., 170, 145–156, https://doi.org/10.1016/j.gca.2015.08.018, 2015.
Dion-Kirschner, H., McFarlin, J. M., Masterson, A. L., Axford, Y., and Osburn, M. R.: Modern constraints on the sources and climate signals recorded by sedimentary plant waxes in west Greenland, Geochim. Cosmochim. Ac., 286, 336–354, https://doi.org/10.1016/j.gca.2020.07.027, 2020.
Douglas, P. M. J., Pagani, M., Brenner, M., Hodell, D. A., and Curtis, J. H.: Aridity and vegetation composition are important determinants of leaf-wax δD values in southeastern Mexico and Central America, Geochim. Cosmochim. Ac., 97, 24–45, https://doi.org/10.1016/j.gca.2012.09.005, 2012.
Douglas, P. M. J., Pagani, M., Eglinton, T. I., Brenner, M., Hodell, D. A., Curtis, J. H., Ma, K. F., and Breckenridge, A.: Pre-aged plant waxes in tropical lake sediments and their influence on the chronology of molecular paleoclimate proxy records, Geochim. Cosmochim. Ac., 141, 346–364, https://doi.org/10.1016/j.gca.2014.06.030, 2014.
Duan, Y. and Xu, L.: Distributions of n-alkanes and their hydrogen isotopic composition in plants from Lake Qinghai (China) and the surrounding area, Appl. Geochem., 27, 806–814, https://doi.org/10.1016/j.apgeochem.2011.12.008, 2012.
Dupont, L. M. and Kuhlmann, H.: Glacial-interglacial vegetation change in the Zambezi catchment, Quaternary Sci. Rev., 155, 127–135, https://doi.org/10.1016/j.quascirev.2016.11.019, 2017.
Dupont, L. M., Caley, T., Kim, J.-H., Castañeda, I., Malaizé, B., and Giraudeau, J.: Glacial-interglacial vegetation dynamics in South Eastern Africa coupled to sea surface temperature variations in the Western Indian Ocean, Clim. Past, 7, 1209–1224, https://doi.org/10.5194/cp-7-1209-2011, 2011.
Eglinton, G. and Hamilton, R. J.: Leaf epicuticular waxes, Science, 156, 1322–1335, https://doi.org/10.1126/science.156.3780.1322, 1967.
Ellis, B. and Johnson, K. R.: Comparison of leaf samples from mapped tropical and temperate forests: Implications for interpretations of the diversity of fossil assemblages, Palaios, 28, 163–177, https://doi.org/10.2110/palo.2012.p12-073r, 2013.
Evans, M. N., Tolwinski-Ward, S. E., Thompson, D. M., and Anchukaitis, K. J.: Applications of proxy system modeling in high resolution paleoclimatology, Quaternary Sci. Rev., 76, 16–28, https://doi.org/10.1016/j.quascirev.2013.05.024, 2013.
Feakins, S. J.: Pollen-corrected leaf wax reconstructions of northeast African hydrological changes during the late Miocene, Palaeogeogr. Palaeocl., 374, 62–71, https://doi.org/10.1016/j.palaeo.2013.01.004, 2013.
Feakins, S. J. and Sessions, A. L.: Controls on the ratios of plant leaf waxes in an arid ecosystem, Geochim. Cosmochim. Ac., 74, 2128–2141, https://doi.org/10.1016/j.gca.2010.01.016, 2010.
Feakins, S. J., Peters, T., Wu, M. S., Shenkin, A., Salinas, N., Girardin, C. A. J., Bentley, L. P., Blonder, B., Enquist, B. J., Martin, R. E., Asner, G. P., and Malhi, Y.: Production of leaf wax n-alkanes across a tropical forest elevation transect, Org. Geochem., 100, 89–100, https://doi.org/10.1016/j.orggeochem.2016.07.004, 2016.
Feakins, S. J., Wu, M. S., Ponton, C., Galy, V., and West, A. J.: Dual isotope evidence for sedimentary integration of plant wax biomarkers across an Andes-Amazon elevation transect, Geochim. Cosmochim. Ac., 242, 64–81, https://doi.org/10.1016/j.gca.2018.09.007, 2018.
Ficken, K. J., Street-Perrott, F. A., Perrott, R. A., Swain, D. L., Olago, D. O., and Eglinton, G.: Glacial/interglacial variations in carbon cycling revealed by molecular and isotope stratigraphy of Lake Nkunga, Mt. Kenya, East Africa, Org. Geochem., 29, 1701–1719, https://doi.org/10.1016/S0146-6380(98)00109-0, 1998.
Ficken, K. J., Li, B., Swain, D. L., and Eglinton, G.: An n-alkane proxy for the sedimentary input of submerged/floating freshwater aquatic macrophytes, Org. Geochem., 31, 745–749, https://doi.org/10.1016/S0146-6380(00)00081-4, 2000.
Freeman, K. H. and Colarusso, L. A.: Molecular and isotopic records of C4 grassland expansion in the late miocene, Geochim. Cosmochim. Ac., 65, 1439–1454, https://doi.org/10.1016/S0016-7037(00)00573-1, 2001.
Freeman, K. H. and Pancost, R. D.: 12.15 – Biomarkers for Terrestrial Plants and Climate, in: Treatise on Geochemistry, 2nd edn., edited by: Holland, H. D. and Turekian, K. K., Elsevier, Oxford, 395–416, https://doi.org/10.1016/B978-0-08-095975-7.01028-7, 2014.
Freimuth, E. J., Diefendorf, A. F., Lowell, T. V., and Wiles, G. C.: Sedimentary n-alkanes and n-alkanoic acids in a temperate bog are biased toward woody plants, Org. Geochem., 128, 94–107, https://doi.org/10.1016/j.orggeochem.2019.01.006, 2019.
Freimuth, E. J., Diefendorf, A. F., Lowell, T. V., Schartman, A. K., Landis, J. D., Stewart, A. K., and Bates, B. R.: Centennial-scale age offsets of plant wax n-alkanes in Adirondack lake sediments, Geochim. Cosmochim. Ac., 300, 119–136, https://doi.org/10.1016/j.gca.2021.02.022, 2021.
French, K. L., Hein, C. J., Haghipour, N., Wacker, L., Kudrass, H. R., Eglinton, T. I., and Galy, V.: Millennial soil retention of terrestrial organic matter deposited in the Bengal Fan, Sci. Rep.-UK, 8, 11997, https://doi.org/10.1038/s41598-018-30091-8, 2018.
Gamarra, B., Sachse, D., and Kahmen, A.: Effects of leaf water evaporative 2H-enrichment and biosynthetic fractionation on leaf wax n-alkane δ2H values in C3 and C4 grasses, Plant Cell Environ., 39, 2390–2403, https://doi.org/10.1111/pce.12789, 2016.
Gao, L., Hou, J., Toney, J., MacDonald, D., and Huang, Y.: Mathematical modeling of the aquatic macrophyte inputs of mid-chain n-alkyl lipids to lake sediments: Implications for interpreting compound specific hydrogen isotopic records, Geochim. Cosmochim. Ac., 75, 3781–3791, https://doi.org/10.1016/j.gca.2011.04.008, 2011.
Garcin, Y., Schwab, V. F., Gleixner, G., Kahmen, A., Todou, G., Séné, O., Onana, J.-M., Achoundong, G., and Sachse, D.: Hydrogen isotope ratios of lacustrine sedimentary n-alkanes as proxies of tropical African hydrology: Insights from a calibration transect across Cameroon, Geochim. Cosmochim. Ac., 79, 106–126, https://doi.org/10.1016/j.gca.2011.11.039, 2012.
Garcin, Y., Schefuß, E., Schwab, V. F., Garreta, V., Gleixner, G., Vincens, A., Todou, G., Séné, O., Onana, J.-M., Achoundong, G., and Sachse, D.: Reconstructing C3 and C4 vegetation cover using n-alkane carbon isotope ratios in recent lake sediments from Cameroon, Western Central Africa, Geochim. Cosmochim. Ac., 142, 482–500, https://doi.org/10.1016/j.gca.2014.07.004, 2014.
Garreta, V., Miller, P. A., Guiot, J., Hély, C., Brewer, S., Sykes, M. T., and Litt, T.: A method for climate and vegetation reconstruction through the inversion of a dynamic vegetation model, Clim. Dynam., 35, 371–389, https://doi.org/10.1007/s00382-009-0629-1, 2010.
Gelman, A. and Rubin, D. B.: Inference from iterative simulation using multiple sequences, Stat. Sci., 7, 457–472, 1992.
Gelpi, E., Schneider, H., Mann, J., and Oró, J.: Hydrocarbons of geochemical significance in microscopic algae, Phytochemistry, 9, 603–612, https://doi.org/10.1016/S0031-9422(00)85700-3, 1970.
Geman, S. and Geman, D.: Stochastic relaxation, Gibbs distributions, and the Bayesian restoration of images, IEEE T. Pattern Anal., 6, 721–741, https://doi.org/10.1109/TPAMI.1984.4767596, 1984.
Graven, H., Allison, C. E., Etheridge, D. M., Hammer, S., Keeling, R. F., Levin, I., Meijer, H. A. J., Rubino, M., Tans, P. P., Trudinger, C. M., Vaughn, B. H., and White, J. W. C.: Compiled records of carbon isotopes in atmospheric CO2 for historical simulations in CMIP6, Geosci. Model Dev., 10, 4405–4417, https://doi.org/10.5194/gmd-10-4405-2017, 2017.
Greenway, P. J. and Vesey-Fitzgerald, D. F.: The Vegetation of Lake Manyara National Park, J. Ecol., 57, 127–149, https://doi.org/10.2307/2258212, 1969.
Greenwood, D. R.: The taphonomy of plant macrofossils, in: The Processes of Fossilization, edited by: Donovan, S., Belhaven Press, 141–169, ISBN 1852931345, 1991.
Griepentrog, M., De Wispelaere, L., Bauters, M., Bodé, S., Hemp, A., Verschuren, D., and Boeckx, P.: Influence of plant growth form, habitat and season on leaf-wax n-alkane hydrogen-isotopic signatures in equatorial East Africa, Geochim. Cosmochim. Ac., 263, 122–139, https://doi.org/10.1016/j.gca.2019.08.004, 2019.
Grimalt, J. O., Torras, E., and Albaigés, J.: Bacterial reworking of sedimentary lipids during sample storage, Org. Geochem., 13, 741–746, https://doi.org/10.1016/0146-6380(88)90096-4, 1988.
Han, J. and Calvin, M.: Hydrocarbon distribution of algae and bacteria, and microbiological activity in sediments, P. Natl. Acad. Sci. USA, 64, 436–443, https://doi.org/10.1073/pnas.64.2.436, 1969.
Han, J., McCarthy, E. D., Hoeven, W. V., Calvin, M., and Bradley, W. H.: Organic geochemical studies, ii. A preliminary report on the distribution of aliphatic hydrocarbons in algae, in bacteria, and in a recent lake sediment, P. Natl. Acad. Sci. USA, 59, 29–33, https://doi.org/10.1073/pnas.59.1.29, 1968.
Hauke, V. and Schreiber, L.: Ontogenetic and seasonal development of wax composition and cuticular transpiration of ivy (Hedera helix L.) sun and shade leaves, Planta, 207, 67–75, https://doi.org/10.1007/s004250050456, 1998.
Hayes, J. M.: Factors controlling 13C contents of sedimentary organic compounds: Principles and evidence, Mar. Geol., 113, 111–125, https://doi.org/10.1016/0025-3227(93)90153-M, 1993.
Herrmann, N., Boom, A., Carr, A. S., Chase, B. M., Granger, R., Hahn, A., Zabel, M., and Schefuß, E.: Sources, transport and deposition of terrestrial organic material: A case study from southwestern Africa, Quaternary Sci. Rev., 149, 215–229, https://doi.org/10.1016/j.quascirev.2016.07.028, 2016.
Hockun, K., Mollenhauer, G., Ho, S. L., Hefter, J., Ohlendorf, C., Zolitschka, B., Mayr, C., Lücke, A., and Schefuß, E.: Using distributions and stable isotopes of n-alkanes to disentangle organic matter contributions to sediments of Laguna Potrok Aike, Argentina, Org. Geochem., 102, 110–119, https://doi.org/10.1016/j.orggeochem.2016.10.001, 2016.
Hou, J., D'Andrea, W. J., and Huang, Y.: Can sedimentary leaf waxes record ratios of continental precipitation? Field, model, and experimental assessments, Geochim. Cosmochim. Ac., 72, 3503–3517, https://doi.org/10.1016/j.gca.2008.04.030, 2008.
Howard-Williams, C. and Walker, B. H.: The vegetation of a tropical African lake: Classification and ordination of the vegetation of Lake Chilwa (Malawi), J. Ecol., 62, 831–854, https://doi.org/10.2307/2258958, 1974.
Huang, Y., Dupont, L., Sarnthein, M., Hayes, J. M., and Eglinton, G.: Mapping of C4 plant input from North West Africa into North East Atlantic sediments, Geochim. Cosmochim. Ac., 64, 3505–3513, https://doi.org/10.1016/S0016-7037(00)00445-2, 2000.
Huang, Y., Shuman, B., Wang, Y., and Webb, T.: Hydrogen isotope ratios of individual lipids in lake sediments as novel tracers of climatic and environmental change: a surface sediment test, J Paleolimnol, 31, 363–375, https://doi.org/10.1023/B:JOPL.0000021855.80535.13, 2004.
Hughen, K. A., Eglinton, T. I., Xu, L., and Makou, M.: Abrupt tropical vegetation response to rapid climate changes, Science, 304, 1955–1959, https://doi.org/10.1126/science.1092995, 2004.
IAEA/WMO: Global Network of Isotopes in Precipitation, IAEA [data set], https://nucleus.iaea.org/wiser (last access: 31 March 2017), 2015.
IAEA/WMO: Global Network of Isotopes in Precipitation, IAEA [data set], https://nucleus.iaea.org/wiser, last access: 31 May 2022.
Janis, C. M., Damuth, J., and Theodor, J. M.: The origins and evolution of the North American grassland biome: the story from the hoofed mammals, Palaeogeogr. Palaeocl., 177, 183–198, https://doi.org/10.1016/S0031-0182(01)00359-5, 2002.
Jansen, B., van Loon, E. E., Hooghiemstra, H., and Verstraten, J. M.: Improved reconstruction of palaeo-environments through unravelling of preserved vegetation biomarker patterns, Palaeogeogr. Palaeocl., 285, 119–130, https://doi.org/10.1016/j.palaeo.2009.10.029, 2010.
Jetter, R. and Schäffer, S.: Chemical composition of the Prunus laurocerasus leaf surface. Dynamic changes of the epicuticular wax film during leaf development, Plant Physiol., 126, 1725–1737, https://doi.org/10.1104/pp.126.4.1725, 2001.
Just, J., Schefuß, E., Kuhlmann, H., Stuut, J.-B. W., and Pätzold, J.: Climate induced sub-basin source-area shifts of Zambezi River sediments over the past 17 ka, Palaeogeogr. Palaeocl., 410, 190–199, https://doi.org/10.1016/j.palaeo.2014.05.045, 2014.
Kahmen, A., Schefuß, E., and Sachse, D.: Leaf water deuterium enrichment shapes leaf wax n-alkane δD values of angiosperm plants I: Experimental evidence and mechanistic insights, Geochim. Cosmochim. Ac., 111, 39–49, https://doi.org/10.1016/j.gca.2012.09.003, 2013a.
Kahmen, A., Hoffmann, B., Schefuß, E., Arndt, S. K., Cernusak, L. A., West, J. B., and Sachse, D.: Leaf water deuterium enrichment shapes leaf wax n-alkane δD values of angiosperm plants II: Observational evidence and global implications, Geochim. Cosmochim. Ac., 111, 50–63, https://doi.org/10.1016/j.gca.2012.09.004, 2013b.
Kasper, S., van der Meer, M. T. J., Castañeda, I. S., Tjallingii, R., Brummer, G.-J. A., Sinninghe Damsté, J. S., and Schouten, S.: Testing the alkenone ratio as a paleo indicator of sea surface salinity in a coastal ocean margin (Mozambique Channel), Org. Geochem., 78, 62–68, https://doi.org/10.1016/j.orggeochem.2014.10.011, 2015.
Kaya, F., Bibi, F., Þliobaitë, I., Eronen, J. T., Hui, T., and Fortelius, M.: The rise and fall of the Old World savannah fauna and the origins of the African savannah biome, Nat. Ecol. Evol., 2, 241–246, https://doi.org/10.1038/s41559-017-0414-1, 2018.
Keeley, J. E. and Sandquist, D. R.: Carbon: freshwater plants, Plant Cell Environ., 15, 1021–1035, https://doi.org/10.1111/j.1365-3040.1992.tb01653.x, 1992.
Khon, V. C., Wang, Y. V., Krebs-Kanzow, U., Kaplan, J. O., Schneider, R. R., and Schneider, B.: Climate and CO2 effects on the vegetation of southern tropical Africa over the last 37 000 years, Earth Planet. Sc. Lett., 403, 407–417, https://doi.org/10.1016/j.epsl.2014.06.043, 2014.
Koch, K., Hartmann, K. D., Schreiber, L., Barthlott, W., and Neinhuis, C.: Influences of air humidity during the cultivation of plants on wax chemical composition, morphology and leaf surface wettability, Environ. Exp. Bot., 56, 1–9, https://doi.org/10.1016/j.envexpbot.2004.09.013, 2006.
Kolattukudy, P. E., Croteau, R., and Buckner, J.: Biochemistry of plant waxes, Chemistry and biochemistry of natural waxes, Elsevier, ISBN 978-0444414700, 1976.
Konecky, B., Russell, J., Huang, Y., Vuille, M., Cohen, L., and Street-Perrott, F. A.: Impact of monsoons, temperature, and CO2 on the rainfall and ecosystems of Mt. Kenya during the Common Era, Palaeogeogr. Palaeocl., 396, 17–25, https://doi.org/10.1016/j.palaeo.2013.12.037, 2014.
Konecky, B., Dee, S. G., and Noone, D. C.: WaxPSM: A forward model of leaf wax hydrogen isotope ratios to bridge proxy and model estimates of past climate, J. Geophys. Res.-Biogeo., 124, 2107–2125, https://doi.org/10.1029/2018JG004708, 2019.
Konecky, B. L., Russell, J. M., Johnson, T. C., Brown, E. T., Berke, M. A., Werne, J. P., and Huang, Y.: Atmospheric circulation patterns during late Pleistocene climate changes at Lake Malawi, Africa, Earth Planet. Sc. Lett., 312, 318–326, https://doi.org/10.1016/j.epsl.2011.10.020, 2011.
Kristen, I., Wilkes, H., Vieth, A., Zink, K. G., Plessen, B., Thorpe, J., Partridge, T. C., and Oberhänsli, H.: Biomarker and stable carbon isotope analyses of sedimentary organic matter from Lake Tswaing: evidence for deglacial wetness and early Holocene drought from South Africa, J. Paleolimnol., 44, 143–160, https://doi.org/10.1007/s10933-009-9393-9, 2010.
Krull, E., Sachse, D., Mügler, I., Thiele, A., and Gleixner, G.: Compound-specific δ13C and δ2H analyses of plant and soil organic matter: A preliminary assessment of the effects of vegetation change on ecosystem hydrology, Soil Biol. Biochem., 38, 3211–3221, https://doi.org/10.1016/j.soilbio.2006.04.008, 2006.
Kuechler, R. R., Schefuß, E., Beckmann, B., Dupont, L., and Wefer, G.: NW African hydrology and vegetation during the Last Glacial cycle reflected in plant-wax-specific hydrogen and carbon isotopes, Quaternary Sci. Rev., 82, 56–67, https://doi.org/10.1016/j.quascirev.2013.10.013, 2013.
Kunst, L. and Samuels, A. L.: Biosynthesis and secretion of plant cuticular wax, Prog. Lipid Res., 42, 51–80, https://doi.org/10.1016/S0163-7827(02)00045-0, 2003.
Ladygina, N., Dedyukhina, E. G., and Vainshtein, M. B.: A review on microbial synthesis of hydrocarbons, Process. Biochem., 41, 1001–1014, https://doi.org/10.1016/j.procbio.2005.12.007, 2006.
Lambeck, K., Rouby, H., Purcell, A., Sun, Y., and Sambridge, M.: Sea level and global ice volumes from the Last Glacial Maximum to the Holocene, P. Natl. Acad. Sci. USA, 111, 15296–15303, https://doi.org/10.1073/pnas.1411762111, 2014.
Latorre, C., Quade, J., and McIntosh, W. C.: The expansion of C4 grasses and global change in the late Miocene: stable isotope evidence from the Americas, Earth Planet. Sc. Lett., 146, 83–96, 1997.
Lattaud, J., Dorhout, D., Schulz, H., Castañeda, I. S., Schefuß, E., Sinninghe Damsté, J. S., and Schouten, S.: The C32 alkane-1,15-diol as a proxy of late Quaternary riverine input in coastal margins, Clim. Past, 13, 1049–1061, https://doi.org/10.5194/cp-13-1049-2017, 2017.
Li, B., Nychka, D. W., and Ammann, C. M.: The value of multiproxy reconstruction of past climate, J. Am. Stat. Assoc., 105, 883–895, https://doi.org/10.1198/jasa.2010.ap09379, 2010.
Liu, C., Li, Z., Berhe, A. A., and Hu, B. X.: Chapter Six – The isotopes and biomarker approaches for identifying eroded organic matter sources in sediments: A review, in: Adv Agron, edited by: Sparks, D. L., Academic Press, 257–303, https://doi.org/10.1016/bs.agron.2020.02.005, 2020.
Liu, H. and Liu, W.: n-Alkane distributions and concentrations in algae, submerged plants and terrestrial plants from the Qinghai-Tibetan Plateau, Org. Geochem., 99, 10–22, https://doi.org/10.1016/j.orggeochem.2016.06.003, 2016.
Liu, J. and An, Z.: A hierarchical framework for disentangling different controls on leaf wax δD n-alkane values in terrestrial higher plants, Quaternary Sci. Rev., 201, 409–417, https://doi.org/10.1016/j.quascirev.2018.10.026, 2018.
Liu, J. and An, Z.: Leaf wax n-alkane carbon isotope values vary among major terrestrial plant groups: Different responses to precipitation amount and temperature, and implications for paleoenvironmental reconstruction, Earth-Sci. Rev., 202, 103081, https://doi.org/10.1016/j.earscirev.2020.103081, 2020.
Liu, W. and Yang, H.: Multiple controls for the variability of hydrogen isotopic compositions in higher plant n-alkanes from modern ecosystems, Glob. Change Biol., 14, 2166–2177, https://doi.org/10.1111/j.1365-2486.2008.01608.x, 2008.
Liu, W., Yang, H., and Li, L.: Hydrogen isotopic compositions of n-alkanes from terrestrial plants correlate with their ecological life forms, Oecologia, 150, 330–338, https://doi.org/10.1007/s00442-006-0494-0, 2006.
Liu, W., Yang, H., Wang, H., An, Z., Wang, Z., and Leng, Q.: Carbon isotope composition of long chain leaf wax n-alkanes in lake sediments: A dual indicator of paleoenvironment in the Qinghai-Tibet Plateau, Org. Geochem., 83–84, 190–201, https://doi.org/10.1016/j.orggeochem.2015.03.017, 2015.
Liu, X., Feakins, S. J., Dong, X., Xue, Q., Marek, T., Leskovar, D. I., Neely, C. B., and Ibrahim, A. M. H.: Experimental study of leaf wax n-alkane response in winter wheat cultivars to drought conditions, Org. Geochem., 113, 210–223, https://doi.org/10.1016/j.orggeochem.2017.07.020, 2017.
Lunn, D., Jackson, C., Best, N., Thomas, A., and Spiegelhalter, D.: The BUGS Book: A Practical Introduction to Bayesian Analysis, CRC Press/Chapman and Hall, Boca Raton, FL, ISBN 978-1584888499, 2012.
Macková, J., Vašková, M., Macek, P., Hronková, M., Schreiber, L., and Šantrùèek, J.: Plant response to drought stress simulated by ABA application: Changes in chemical composition of cuticular waxes, Environ. Exp. Bot., 86, 70–75, https://doi.org/10.1016/j.envexpbot.2010.06.005, 2013.
Magill, C. R., Ashley, G. M., and Freeman, K. H.: Water, plants, and early human habitats in eastern Africa, P. Natl. Acad. Sci. USA, 110, 1175–1180, https://doi.org/10.1073/pnas.1209405109, 2013.
Magill, C. R., Eglinton, G., and Eglinton, T. I.: Isotopic variance among plant lipid homologues correlates with biodiversity patterns of their source communities, Plos One, 14, e0212211, https://doi.org/10.1371/journal.pone.0212211, 2019.
Makowski, D., Ben-Shachar, M. S., and Lüdecke, D.: bayestestR: Describing effects and their uncertainty, existence and significance within the Bayesian framework, J. Open Source Softw., 4, 1541, https://doi.org/10.21105/joss.01541, 2019.
McFarlin, J. M., Axford, Y., Masterson, A. L., and Osburn, M. R.: Calibration of modern sedimentary δ2H plant wax-water relationships in Greenland lakes, Quaternary Sci. Rev., 225, 105978, https://doi.org/10.1016/j.quascirev.2019.105978, 2019.
McInerney, F. A., Helliker, B. R., and Freeman, K. H.: Hydrogen isotope ratios of leaf wax n-alkanes in grasses are insensitive to transpiration, Geochim. Cosmochim. Ac., 75, 541–554, https://doi.org/10.1016/j.gca.2010.10.022, 2011.
Mead, R., Xu, Y., Chong, J., and Jaffé, R.: Sediment and soil organic matter source assessment as revealed by the molecular distribution and carbon isotopic composition of n-alkanes, Org. Geochem., 36, 363–370, https://doi.org/10.1016/j.orggeochem.2004.10.003, 2005.
Millard, S. P.: EnvStats: an R package for environmental statistics, 2013.
Neale, M. C., Hunter, M. D., Pritikin, J. N., Zahery, M., Brick, T. R., Kirkpatrick, R. M., Estabrook, R., Bates, T. C., Maes, H. H., and Boker, S. M.: OpenMx 2.0: Extended structural equation and statistical modeling, Psychometrika, 81, 535–549, https://doi.org/10.1007/s11336-014-9435-8, 2016.
Nelson, D. B., Ladd, S. N., Schubert, C. J., and Kahmen, A.: Rapid atmospheric transport and large-scale deposition of recently synthesized plant waxes, Geochim. Cosmochim. Ac., 222, 599–617, https://doi.org/10.1016/j.gca.2017.11.018, 2018.
Nelson, D. M., Henderson, A. K., Huang, Y., and Hu, F. S.: Influence of terrestrial vegetation on leaf wax δD of Holocene lake sediments, Org. Geochem., 56, 106–110, https://doi.org/10.1016/j.orggeochem.2012.12.010, 2013.
Newberry, S. L., Kahmen, A., Dennis, P., and Grant, A.: n-Alkane biosynthetic hydrogen isotope fractionation is not constant throughout the growing season in the riparian tree Salix viminalis, Geochim. Cosmochim. Ac., 165, 75–85, https://doi.org/10.1016/j.gca.2015.05.001, 2015.
Niedermeyer, E. M., Schefuß, E., Sessions, A. L., Mulitza, S., Mollenhauer, G., Schulz, M., and Wefer, G.: Orbital- and millennial-scale changes in the hydrologic cycle and vegetation in the western African Sahel: insights from individual plant wax δD and δ13C, Quaternary Sci. Rev., 29, 2996–3005, https://doi.org/10.1016/j.quascirev.2010.06.039, 2010.
Niedermeyer, E. M., Forrest, M., Beckmann, B., Sessions, A. L., Mulch, A., and Schefuß, E.: The stable hydrogen isotopic composition of sedimentary plant waxes as quantitative proxy for rainfall in the West African Sahel, Geochim. Cosmochim. Ac., 184, 55–70, https://doi.org/10.1016/j.gca.2016.03.034, 2016.
Norström, E., Norén, G., Smittenberg, R. H., Massuanganhe, E. A., and Ekblom, A.: Leaf wax δD inferring variable medieval hydroclimate and early initiation of Little Ice Age (LIA) dryness in southern Mozambique, Global Planet. Change, 170, 221–233, https://doi.org/10.1016/j.gloplacha.2018.09.004, 2018.
Nusbaumer, J., Wong, T. E., Bardeen, C., and Noone, D.: Evaluating hydrological processes in the Community Atmosphere Model Version 5 (CAM5) using stable isotope ratios of water, J. Adv. Model. Earth Syst., 9, 949–977, https://doi.org/10.1002/2016MS000839, 2017.
Park, M.-O.: New pathway for long-chain n-alkane synthesis via 1-alcohol in Vibrio furnissii M1, J. Bacteriol., 187, 1426–1429, https://doi.org/10.1128/JB.187.4.1426-1429.2005, 2005.
Peaple, M. D., Tierney, J. E., McGee, D., Lowenstein, T. K., Bhattacharya, T., and Feakins, S. J.: Identifying plant wax inputs in lake sediments using machine learning, Org. Geochem., 156, 104222, https://doi.org/10.1016/j.orggeochem.2021.104222, 2021.
Plummer, M.: rjags: Bayesian graphical models using MCMC, R package, https://cran.r-project.org/web/packages/rjags/index.html, last access: 31 May 2021.
Polissar, P. J. and D'Andrea, W. J.: Uncertainty in paleohydrologic reconstructions from molecular δD values, Geochim. Cosmochim. Ac., 129, 146–156, https://doi.org/10.1016/j.gca.2013.12.021, 2014.
Polissar, P. J. and Freeman, K. H.: Effects of aridity and vegetation on plant-wax δD in modern lake sediments, Geochim. Cosmochim. Ac., 74, 5785–5797, https://doi.org/10.1016/j.gca.2010.06.018, 2010.
Polissar, P. J., Rose, C., Uno, K. T., Phelps, S. R., and deMenocal, P.: Synchronous rise of African C4 ecosystems 10 million years ago in the absence of aridification, Nat. Geosci., 12, 657–660, https://doi.org/10.1038/s41561-019-0399-2, 2019.
Prins, H. B. A. and Elzenga, J. T. M.: Bicarbonate utilization: Function and mechanism, Aquat. Bot., 34, 59–83, https://doi.org/10.1016/0304-3770(89)90050-8, 1989.
Quade, J. and Cerling, T. E.: Expansion of C4 grasses in the Late Miocene of Northern Pakistan: evidence from stable isotopes in paleosols, Palaeogeogr. Palaeocl., 115, 91–116, 1995.
R Core Team: R: A language and environment for statistical computing, R Foundation for Statistical Computing, The R Foundation [code], https://www.R-project.org/, last access: 31 March 2021.
Rommerskirchen, F., Eglinton, G., Dupont, L., Güntner, U., Wenzel, C., and Rullkötter, J.: A north to south transect of Holocene southeast Atlantic continental margin sediments: Relationship between aerosol transport and compound-specific δ13C land plant biomarker and pollen records, Geochem. Geophy. Geosy., 4, 1101, https://doi.org/10.1029/2003GC000541, 2003.
Rommerskirchen, F., Plader, A., Eglinton, G., Chikaraishi, Y., and Rullkötter, J.: Chemotaxonomic significance of distribution and stable carbon isotopic composition of long-chain alkanes and alkan-1-ols in C4 grass waxes, Org. Geochem., 37, 1303–1332, https://doi.org/10.1016/j.orggeochem.2005.12.013, 2006.
Rozanski, K., Araguás-Araguás, L., and Gonfiantini, R.: Isotopic Patterns in Modern Global Precipitation, in: Climate Change in Continental Isotopic Records, Geophysical Monograph-American Geophysical Union, vol. 78, edited by: Swart, P. K., Lohmann, K. C., McKenzie, J., and Savin, S., American Geophysical Union, 1–36, https://doi.org/10.1029/GM078p0001, 1993.
Sachse, D., Radke, J., and Gleixner, G.: Hydrogen isotope ratios of recent lacustrine sedimentary n-alkanes record modern climate variability, Geochim. Cosmochim. Ac., 68, 4877–4889, https://doi.org/10.1016/j.gca.2004.06.004, 2004.
Sachse, D., Radke, J., and Gleixner, G.: δD values of individual n-alkanes from terrestrial plants along a climatic gradient – Implications for the sedimentary biomarker record, Org. Geochem., 37, 469–483, https://doi.org/10.1016/j.orggeochem.2005.12.003, 2006.
Sachse, D., Billault, I., Bowen, G. J., Chikaraishi, Y., Dawson, T. E., Feakins, S. J., Freeman, K. H., Magill, C. R., McInerney, F. A., van der Meer, M. T. J., Polissar, P., Robins, R. J., Sachs, J. P., Schmidt, H.-L., Sessions, A. L., White, J. W. C., West, J. B., and Kahmen, A.: Molecular paleohydrology: Interpreting the hydrogen-isotopic composition of lipid biomarkers from photosynthesizing organisms, Annu. Rev. Earth Pl. Sc., 40, 221–249, https://doi.org/10.1146/annurev-earth-042711-105535, 2012.
Sankaran, M., Hanan, N. P., Scholes, R. J., Ratnam, J., Augustine, D. J., Cade, B. S., Gignoux, J., Higgins, S. I., Le Roux, X., Ludwig, F., Ardo, J., Banyikwa, F., Bronn, A., Bucini, G., Caylor, K. K., Coughenour, M. B., Diouf, A., Ekaya, W., Feral, C. J., February, E. C., Frost, P. G. H., Hiernaux, P., Hrabar, H., Metzger, K. L., Prins, H. H. T., Ringrose, S., Sea, W., Tews, J., Worden, J., and Zambatis, N.: Determinants of woody cover in African savannas, Nature, 438, 846–849, https://doi.org/10.1038/nature04070, 2005.
Schefuß, E., Schouten, S., Jansen, J. H. F., and Sinninghe Damsté, J. S.: African vegetation controlled by tropical sea surface temperatures in the mid-Pleistocene period, Nature, 422, 418–421, https://doi.org/10.1038/nature01500, 2003.
Schefuß, E., Versteegh, G. J. M., Jansen, J. H. F., and Sinninghe Damsté, J. S.: Lipid biomarkers as major source and preservation indicators in SE Atlantic surface sediments, Deep-Sea Res. Pt. I, 51, 1199–1228, https://doi.org/10.1016/j.dsr.2004.05.002, 2004.
Schefuß, E., Kuhlmann, H., Mollenhauer, G., Prange, M., and Pätzold, J.: Forcing of wet phases in southeast Africa over the past 17 000 years, Nature, 480, 509–512, https://doi.org/10.1038/nature10685, 2011.
Schmitt, J., Schneider, R., Elsig, J., Leuenberger, D., Lourantou, A., Chappellaz, J., Köhler, P., Joos, F., Stocker, T. F., Leuenberger, M., and Fischer, H.: Carbon isotope constraints on the deglacial CO2 rise from ice cores, Science, 336, 711–714, https://doi.org/10.1126/science.1217161, 2012.
Schwab, V. F., Garcin, Y., Sachse, D., Todou, G., Séné, O., Onana, J.-M., Achoundong, G., and Gleixner, G.: Effect of aridity on δ13C and δD values of C3 plant- and C4 graminoid-derived leaf wax lipids from soils along an environmental gradient in Cameroon (Western Central Africa), Org. Geochem., 78, 99–109, https://doi.org/10.1016/j.orggeochem.2014.09.007, 2015.
Schwark, L., Zink, K., and Lechterbeck, J.: Reconstruction of postglacial to early Holocene vegetation history in terrestrial Central Europe via cuticular lipid biomarkers and pollen records from lake sediments, Geology, 30, 463–466, https://doi.org/10.1130/0091-7613(2002)030<0463:Ropteh>2.0.Co;2, 2002.
Seki, O., Nakatsuka, T., Shibata, H., and Kawamura, K.: A compound-specific n-alkane δ13C and δD approach for assessing source and delivery processes of terrestrial organic matter within a forested watershed in northern Japan, Geochim. Cosmochim. Ac., 74, 599–613, https://doi.org/10.1016/j.gca.2009.10.025, 2010.
Sessions, A. L.: Factors controlling the deuterium contents of sedimentary hydrocarbons, Org. Geochem., 96, 43–64, https://doi.org/10.1016/j.orggeochem.2016.02.012, 2016.
Shanahan, T. M., McKay, N. P., Hughen, K. A., Overpeck, J. T., Otto-Bliesner, B., Heil, C. W., King, J., Scholz, C. A., and Peck, J.: The time-transgressive termination of the African Humid Period, Nat. Geosci., 8, 140–144, https://doi.org/10.1038/ngeo2329, 2015.
Smith, F. A. and Freeman, K. H.: Influence of physiology and climate on δD of leaf wax n-alkanes from C3 and C4 grasses, Geochim. Cosmochim. Ac., 70, 1172–1187, https://doi.org/10.1016/j.gca.2005.11.006, 2006.
Sprenger, M., Leistert, H., Gimbel, K., and Weiler, M.: Illuminating hydrological processes at the soil-vegetation-atmosphere interface with water stable isotopes, Rev. Geophys., 54, 674–704, https://doi.org/10.1002/2015RG000515, 2016.
Strömberg, C. A. E.: Evolution of grasses and grassland ecosystems, Annu. Rev. Earth Pl. Sc., 39, 517–544, https://doi.org/10.1146/annurev-earth-040809-152402, 2011.
Suh, Y. J. and Diefendorf, A. F.: Seasonal and canopy height variation in n-alkanes and their carbon isotopes in a temperate forest, Org. Geochem., 116, 23–34, https://doi.org/10.1016/j.orggeochem.2017.10.015, 2018.
Suh, Y. J., Diefendorf, A. F., Bowen, G. J., Cotton, J. M., and Ju, S.-J.: Plant wax integration and transport from the Mississippi River Basin to the Gulf of Mexico inferred from GIS-enabled isoscapes and mixing models, Geochim. Cosmochim. Ac., 257, 131–149, https://doi.org/10.1016/j.gca.2019.04.022, 2019.
Tierney, J. E., Russell, J. M., Huang, Y., Damsté, J. S. S., Hopmans, E. C., and Cohen, A. S.: Northern hemisphere controls on tropical southeast African climate during the past 60 000 years, Science, 322, 252–255, https://doi.org/10.1126/science.1160485, 2008.
Tingley, M. P., Craigmile, P. F., Haran, M., Li, B., Mannshardt, E., and Rajaratnam, B.: Piecing together the past: statistical insights into paleoclimatic reconstructions, Quaternary Sci. Rev., 35, 1–22, https://doi.org/10.1016/j.quascirev.2012.01.012, 2012.
Tipple, B. J. and Pagani, M.: A 35Myr North American leaf-wax compound-specific carbon and hydrogen isotope record: Implications for C4 grasslands and hydrologic cycle dynamics, Earth Planet. Sc. Lett., 299, 250–262, https://doi.org/10.1016/j.epsl.2010.09.006, 2010.
Tipple, B. J., Berke, M. A., Doman, C. E., Khachaturyan, S., and Ehleringer, J. R.: Leaf-wax n-alkanes record the plant–water environment at leaf flush, P. Natl. Acad. Sci. USA, 110, 2659–2664, https://doi.org/10.1073/pnas.1213875110, 2013.
Tipple, B. J., Berke, M. A., Hambach, B., Roden, J. S., and Ehleringer, J. R.: Predicting leaf wax n-alkane 2H 1H ratios: controlled water source and humidity experiments with hydroponically grown trees confirm predictions of Craig–Gordon model, Plant Cell Environ., 38, 1035–1047, https://doi.org/10.1111/pce.12457, 2015.
Uno, K. T., Polissar, P. J., Jackson, K. E., and deMenocal, P. B.: Neogene biomarker record of vegetation change in eastern Africa, P. Natl. Acad. Sci. USA, 113, 6355–6363, https://doi.org/10.1073/pnas.1521267113, 2016.
van der Lubbe, H. J. L., Frank, M., Tjallingii, R., and Schneider, R. R.: Neodymium isotope constraints on provenance, dispersal, and climate-driven supply of Zambezi sediments along the Mozambique Margin during the past ∼ 45 000 years, Geochem. Geophy. Geosy., 17, 181–198, https://doi.org/10.1002/2015GC006080, 2016.
van der Lubbe, J. J. L., Tjallingii, R., Prins, M. A., Brummer, G.-J. A., Jung, S. J. A., Kroon, D., and Schneider, R. R.: Sedimentation patterns off the Zambezi River over the last 20 000 years, Mar. Geol., 355, 189–201, https://doi.org/10.1016/j.margeo.2014.05.012, 2014.
Vesey-Fitzgerald, D. F.: Central African Grasslands, J. Ecol., 51, 243–274, https://doi.org/10.2307/2257683, 1963.
Vogts, A., Moossen, H., Rommerskirchen, F., and Rullkötter, J.: Distribution patterns and stable carbon isotopic composition of alkanes and alkan-1-ols from plant waxes of African rain forest and savanna C3 species, Org. Geochem., 40, 1037–1054, https://doi.org/10.1016/j.orggeochem.2009.07.011, 2009.
Vogts, A., Schefuß, E., Badewien, T., and Rullkötter, J.: n-Alkane parameters from a deep sea sediment transect off southwest Africa reflect continental vegetation and climate conditions, Org. Geochem., 47, 109–119, https://doi.org/10.1016/j.orggeochem.2012.03.011, 2012.
Wang, J., Xu, Y., Zhou, L., Shi, M., Axia, E., Jia, Y., Chen, Z., Li, J., and Wang, G.: Disentangling temperature effects on leaf wax n-alkane traits and carbon isotopic composition from phylogeny and precipitation, Org. Geochem., 126, 13–22, https://doi.org/10.1016/j.orggeochem.2018.10.008, 2018.
Wang, R. Z.: C4 plants in the vegetation of Tibet, China: Their natural occurrence and altitude distribution pattern, Photosynthetica, 41, 21–26, https://doi.org/10.1023/A:1025844009120, 2003.
Wang, Y. V., Larsen, T., Leduc, G., Andersen, N., Blanz, T., and Schneider, R. R.: What does leaf wax δD from a mixed C3 C4 vegetation region tell us?, Geochim. Cosmochim. Ac., 111, 128–139, https://doi.org/10.1016/j.gca.2012.10.016, 2013a.
Wang, Y. V., Leduc, G., Regenberg, M., Andersen, N., Larsen, T., Blanz, T., and Schneider, R. R.: Northern and southern hemisphere controls on seasonal sea surface temperatures in the Indian Ocean during the last deglaciation, Paleoceanography, 28, 619–632, https://doi.org/10.1002/palo.20053, 2013b.
Wang, Z. and Liu, W.: Carbon chain length distribution in n-alkyl lipids: A process for evaluating source inputs to Lake Qinghai, Org. Geochem., 50, 36–43, https://doi.org/10.1016/j.orggeochem.2012.06.015, 2012.
Wang, Z., Liu, H., and Cao, Y.: Choosing a suitable εw−p by distinguishing the dominant plant sources in sediment records using a new Pta index and estimating the paleo-δDp spatial distribution in China, Org. Geochem., 121, 161–168, https://doi.org/10.1016/j.orggeochem.2018.01.002, 2018.
West, J. B., Sobek, A., and Ehleringer, J. R.: A Simplified GIS Approach to Modeling Global Leaf Water Isoscapes, PLOS ONE, 3, e2447, https://doi.org/10.1371/journal.pone.0002447, 2008.
White, F.: The vegetation of Africa, UNESCO, Paris, France, 356 pp., ISBN 978-9231019555, 1983.
Wiesenberg, G. L. B., Schwarzbauer, J., Schmidt, M. W. I., and Schwark, L.: Source and turnover of organic matter in agricultural soils derived from n-alkane/n-carboxylic acid compositions and C-isotope signatures, Org. Geochem., 35, 1371–1393, https://doi.org/10.1016/j.orggeochem.2004.03.009, 2004.
Wu, M. S., Feakins, S. J., Martin, R. E., Shenkin, A., Bentley, L. P., Blonder, B., Salinas, N., Asner, G. P., and Malhi, Y.: Altitude effect on leaf wax carbon isotopic composition in humid tropical forests, Geochim. Cosmochim. Ac., 206, 1–17, https://doi.org/10.1016/j.gca.2017.02.022, 2017.
Yamamoto, S., Kawamura, K., Seki, O., Kariya, T., and Lee, M.: Influence of aerosol source regions and transport pathway on δD of terrestrial biomarkers in atmospheric aerosols from the East China Sea, Geochim. Cosmochim. Ac., 106, 164–176, https://doi.org/10.1016/j.gca.2012.12.030, 2013.
Yang, D.: SPATIAL-Lab/LipidMM: Bok choy (v. 1.0.5), Zenodo [code], https://doi.org/10.5281/zenodo.7025765, 2022.
Yu, G., Tang, L., Yang, X., Ke, X., and Harrison, S. P.: Modern pollen samples from alpine vegetation on the Tibetan Plateau, Global Ecol. Biogeogr., 10, 503–519, https://doi.org/10.1046/j.1466-822X.2001.00258.x, 2001.
Zech, M., Krause, T., Meszner, S., and Faust, D.: Incorrect when uncorrected: Reconstructing vegetation history using n-alkane biomarkers in loess-paleosol sequences – A case study from the Saxonian loess region, Germany, Quatern. Int., 296, 108–116, https://doi.org/10.1016/j.quaint.2012.01.023, 2013.
Zhou, B., Bird, M., Zheng, H., Zhang, E., Wurster, C. M., Xie, L., and Taylor, D.: New sedimentary evidence reveals a unique history of C4 biomass in continental East Asia since the early Miocene, Sci. Rep.-UK, 7, 170, https://doi.org/10.1038/s41598-017-00285-7, 2017.