the Creative Commons Attribution 4.0 License.
the Creative Commons Attribution 4.0 License.
 | 24 May 2022
Do Southern Hemisphere tree rings record past volcanic events? A case study from New Zealand
Philippa A. Higgins
Jonathan G. Palmer
Chris S. M. Turney
Martin S. Andersen
Fiona Johnson
Much of our knowledge about the impacts of volcanic eruptions on climate comes from proxy records. However, little is known about their impact on the low to mid-latitudes of the Southern Hemisphere. Using superposed epoch analysis, we investigated whether volcanic signals could be identified in annual tree-ring series from eight New Zealand dendrochronological species. We found that most species are reliable recorders of volcanic cooling and that the magnitude and persistence of the post-event response can be broadly linked to plant life history traits. Across species, site-based factors, particularly altitude and exposure to prevailing conditions, are more important determinants of the strength of the volcanic response than species. We then investigated whether chronology selection impacts the magnitude of post-volcanic cooling in tree-ring-based temperature reconstructions by developing two new multispecies reconstructions of New Zealand summer (December–February) temperature with one reconstruction from the pool of all available chronologies, and the other from a selected subset shown to be sensitive to volcanic eruptions. Both reconstructions record temperature anomalies that are remarkably consistent with studies based on instrumental temperature and the ensemble mean response of climate models, demonstrating that New Zealand ring widths are reliable indicators of regional volcanic climate response. However, we also found that volcanic response can be complex, with positive, negative, and neutral responses identified – sometimes within the same species group. Species-wide composites thus tend to underestimate the volcanic response. This has important implications for the development of future tree-ring and multiproxy temperature reconstructions from the Southern Hemisphere.
- Article
(4375 KB) - Full-text XML
-
Supplement
(4213 KB) - BibTeX
- EndNote


Emissions from large volcanic eruptions are a key source of temperature and hydroclimate variability on interannual to decadal timescales (Robock, 2005; Iles et al., 2013; Sigl et al., 2015). As few large volcanic eruptions have occurred during the instrumental era, much of our knowledge about volcanic impacts on climate, particularly regional and global temperature, comes from proxy records spanning centuries to millennia (Tejedor et al., 2021; Wilson et al., 2016; D'Arrigo et al., 2013). These records are predominantly high-altitude or high-latitude tree-ring proxies from the Northern Hemisphere (e.g. Briffa et al., 1998; D'Arrigo et al., 2009; Pieper et al., 2014). In comparison, there are very few proxy-based characterisations of the temperature response to volcanic events from the Southern Hemisphere (Tejedor et al., 2021; Neukom et al., 2014). The limited number of studies considering Southern Hemisphere tree-ring proxies have generally not found significant impacts following what are considered “large” volcanic eruptions (Krakauer and Randerson, 2003; Palmer and Ogden, 1992; Allen et al., 2018; Cook et al., 1992). Two eruptions (Santa Maria in 1902 CE and Agung in 1963 CE) have been identified in tree-ring sites spanning South America, but the impacts of other eruptions on growth have proved less conclusive (Villalba and Boninsegna, 1992).
Discovering whether the hemispheres have contrasting sensitivities to volcanic eruptions is vital to understanding future climate projections (Neukom et al., 2014). The muted volcanic impact in Southern Hemisphere proxy reconstructions could be due to a maritime dampening effect on post-eruption cooling and/or the distribution of landmasses toward the Equator (Raible et al., 2016; Krakauer and Randerson, 2003; Allen et al., 2018). Such explanations suggest that the magnitude of Southern Hemisphere cooling is too small to be reliably recorded in tree-ring archives. However, climate models show a clear Southern Hemisphere volcanic signal via reduced mean surface air temperatures (Neukom et al., 2014, 2018). There are several potential explanations for the discrepancy between proxy reconstructions and climate models in the Southern Hemisphere. These include the underestimation of the moderating effects of the ocean on post-eruption cooling in climate models, changes to the hydrological cycle in response to volcanic cooling, uncertainties in volcanic forcing data, and/or proxy noise and spatial distribution (Neukom et al., 2018; Zhu et al., 2020).
The question remains as to whether Southern Hemisphere proxies – specifically tree rings – do record volcanic events. To our knowledge, no studies have explored the factors which influence whether (or not) volcanic signals can be identified using tree-ring data from the Southern Hemisphere. Tree growth depends on a range of environmental and biological factors, and thus careful site and tree selection is necessary to ensure that a specific influence of interest can be studied (Norton and Ogden, 1987). Northern Hemisphere tree-ring studies are predominantly from high latitudes or mid-latitude alpine treeline sites where tree growth is temperature limited (Scuderi, 1990). Around 80 % of chronologies from such sites show significant growth reductions following large eruptions due to unusually low growing-season temperatures (Krakauer and Randerson, 2003). For high-latitude sites, decreased light availability after eruptions also contributes to the strong growth reduction (Tingley et al., 2014). Tree-ring studies from Northern Hemisphere mid-latitude lowland sites have shown that volcanic response is less clear, as temperate-zone trees are less temperature-limited and have more complex relationships with multiple climate variables (Pieper et al., 2014; Wilson et al., 2016).
Exploring possible responses to volcanic eruptions, Pieper et al. (2014) proposed three modes for tree growth in temperate regions: (1) growth reduction due to decreased growing-season temperature, resulting in narrow rings, (2) neutral or no response if the climate sensitivity to volcanic eruptions is insufficient to influence tree growth, and (3) enhanced growth due to an increase in the diffuse light fraction and reduced water stress, resulting in wide rings. Temperate-zone trees from the Southern Hemisphere are also likely to display similar mixed volcanic signals, depending on their relative sensitivity mode and the magnitude of the regional cooling effect. Understanding these factors will help elucidate the proxy archive contribution to the Southern Hemisphere model–data discrepancy. This knowledge will benefit future studies of hemispheric temperatures and help identify which species and/or regions should be prioritised for future proxy development.
Our goal in this study is to assess whether Southern Hemisphere tree rings record past volcanic events using a multispecies network of high-quality, replicated tree-ring chronologies from New Zealand. This country is a long, narrow, archipelagic landscape stretching from 34 to 47∘ S. Climatically, the northern part protrudes into the warm sub-tropical ridge, whereas the southern end is embedded in the cool southwesterlies (Salinger, 1980). The North Island and South Island axial ranges, which rise to 3764 m, are a significant barrier to east–west airflow, leading to strong regionalisation of precipitation anomalies (Salinger, 1980). Land clearing has resulted in the loss of forests from most lowland areas and nearly all of the eastern drylands. The most common remaining forest types are wet conifer–broadleaved forests and montane to alpine forests dominated by southern beech (Nothofagaceae) (McGlone et al., 2017).
Tree-ring chronologies have been developed from locations widely distributed throughout New Zealand. Since the initial dendrochronological studies undertaken by LaMarche et al. (1979), records have been generated from nine endemic species, of which seven are conifers and two are Nothofagaceae (Table 1). Five main species have been used to develop multi-centennial tree-ring chronologies: kauri (Agathis australis), pink pine (Halocarpus biformis), silver pine (Manoao colensoi), cedar (Libocedrus bidwillii), and silver beech (Lophozonia menziesii). Most chronologies are primarily sensitive to austral summer temperatures, with temperature reconstructions developed from beech (Norton et al., 1989), silver pine (Cook et al., 2002), cedar (Palmer and Xiong, 2004), pink pine (Duncan et al., 2010), and multispecies networks (Salinger et al., 1994). Thus, New Zealand, with its wide latitudinal and altitudinal range, regionalised climate zones, and wide distribution of tree-ring chronologies from multiple species – including some instances of multiple species from the same site – is ideal for studying tree-ring sensitivities to past volcanic events. Using the New Zealand dendrochronological dataset, we aim to answer the following specific questions.
-
Can we identify volcanic signals in high-quality tree-ring series from the Southern Hemisphere?
-
Are there differences in the expression of volcanic signals amongst the species?
-
Does chronology selection impact the magnitude of post-volcanic cooling in tree-ring-based temperature reconstructions?
2.1 Tree-ring chronologies
The New Zealand tree-ring chronologies analysed in this study were collated to develop the Eastern Australia and New Zealand Drought Atlas (Palmer et al., 2015; Fig. 1). Palmer et al. (2015) identified chronologies from the International Tree Ring Data Bank and personal collections, screened the tree-ring measurements for dating problems using the software program COFECHA (Holmes., 1983; Grissino-Mayer, 2001), and developed site “master” chronologies from the raw ring widths using the “signal-free” method of standardisation (Melvin and Briffa, 2008). The metadata for all New Zealand chronologies are provided in Table S1 in the Supplement. As only a single chronology has been developed from mountain toatoa (Phyllocladus alpinus), it was excluded from the study, leaving a pool of 96 chronologies from eight dendrochronological species for volcanic response analysis.
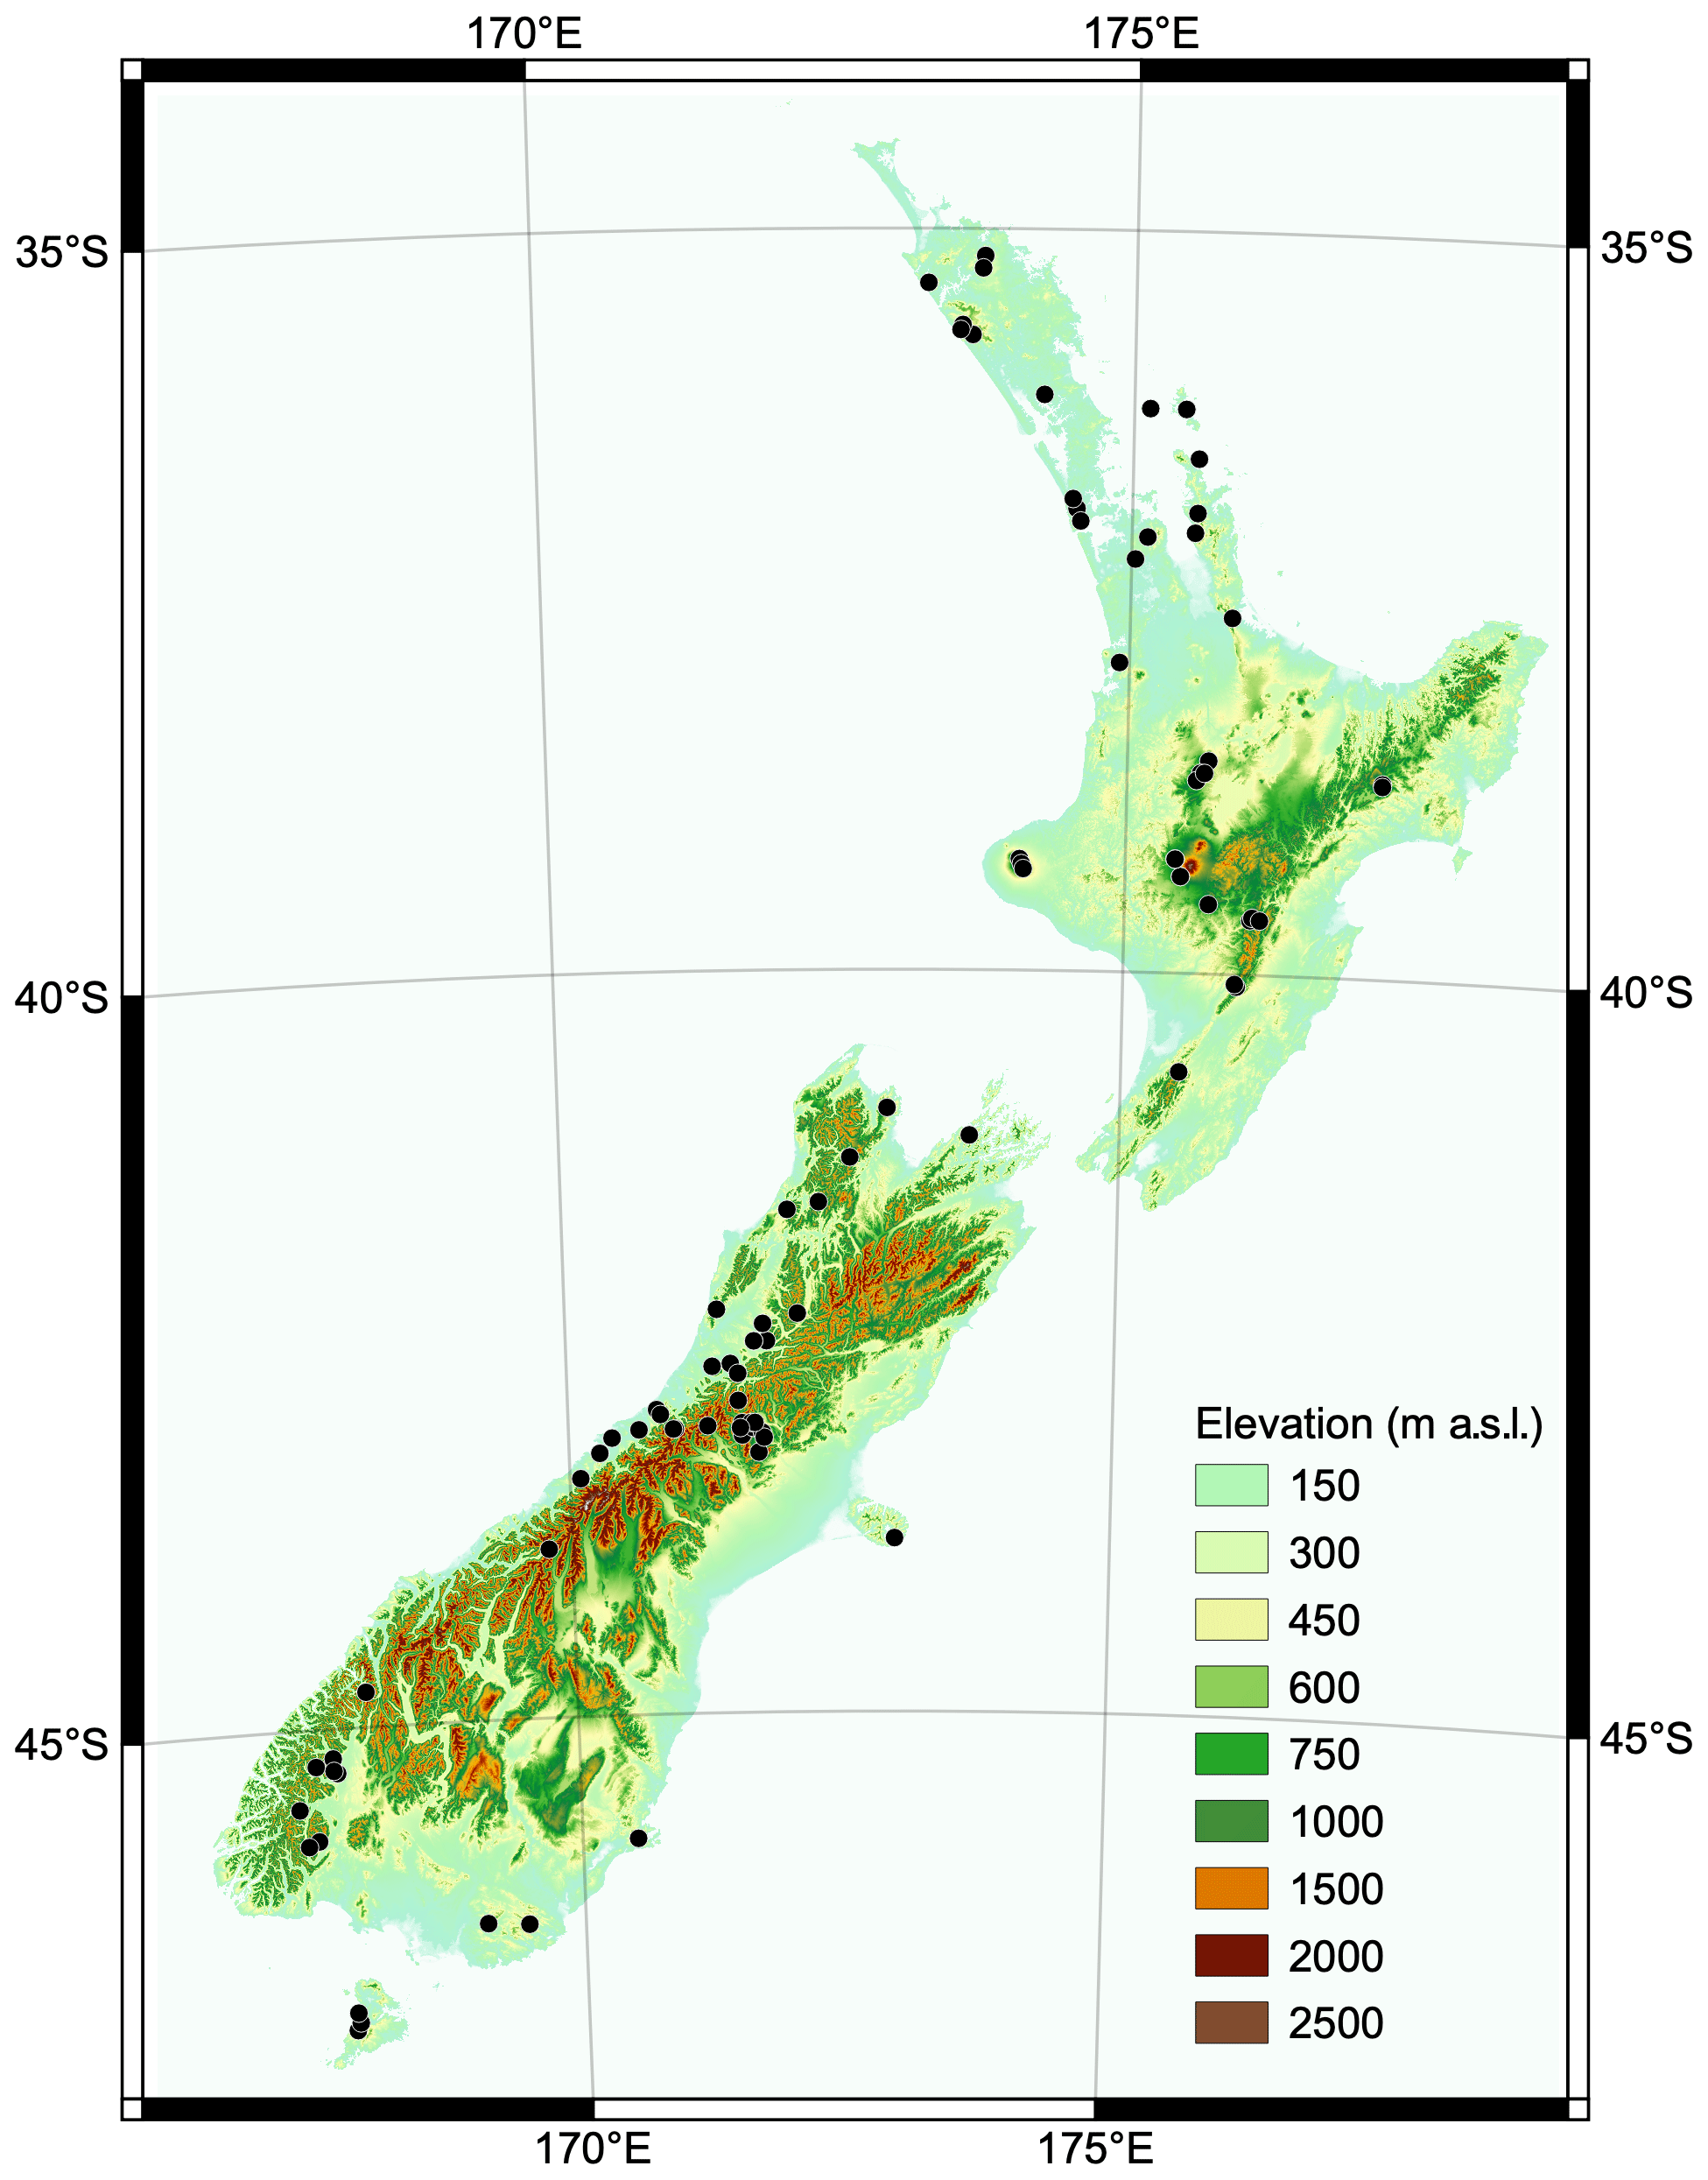
Figure 1Distribution of tree-ring chronologies in New Zealand. Elevation data sourced from the LINZ Data Service and licensed for reuse under CC BY 4.0.
Table 1Distribution, reported climate sensitivities, and key references for New Zealand dendrochronological species.
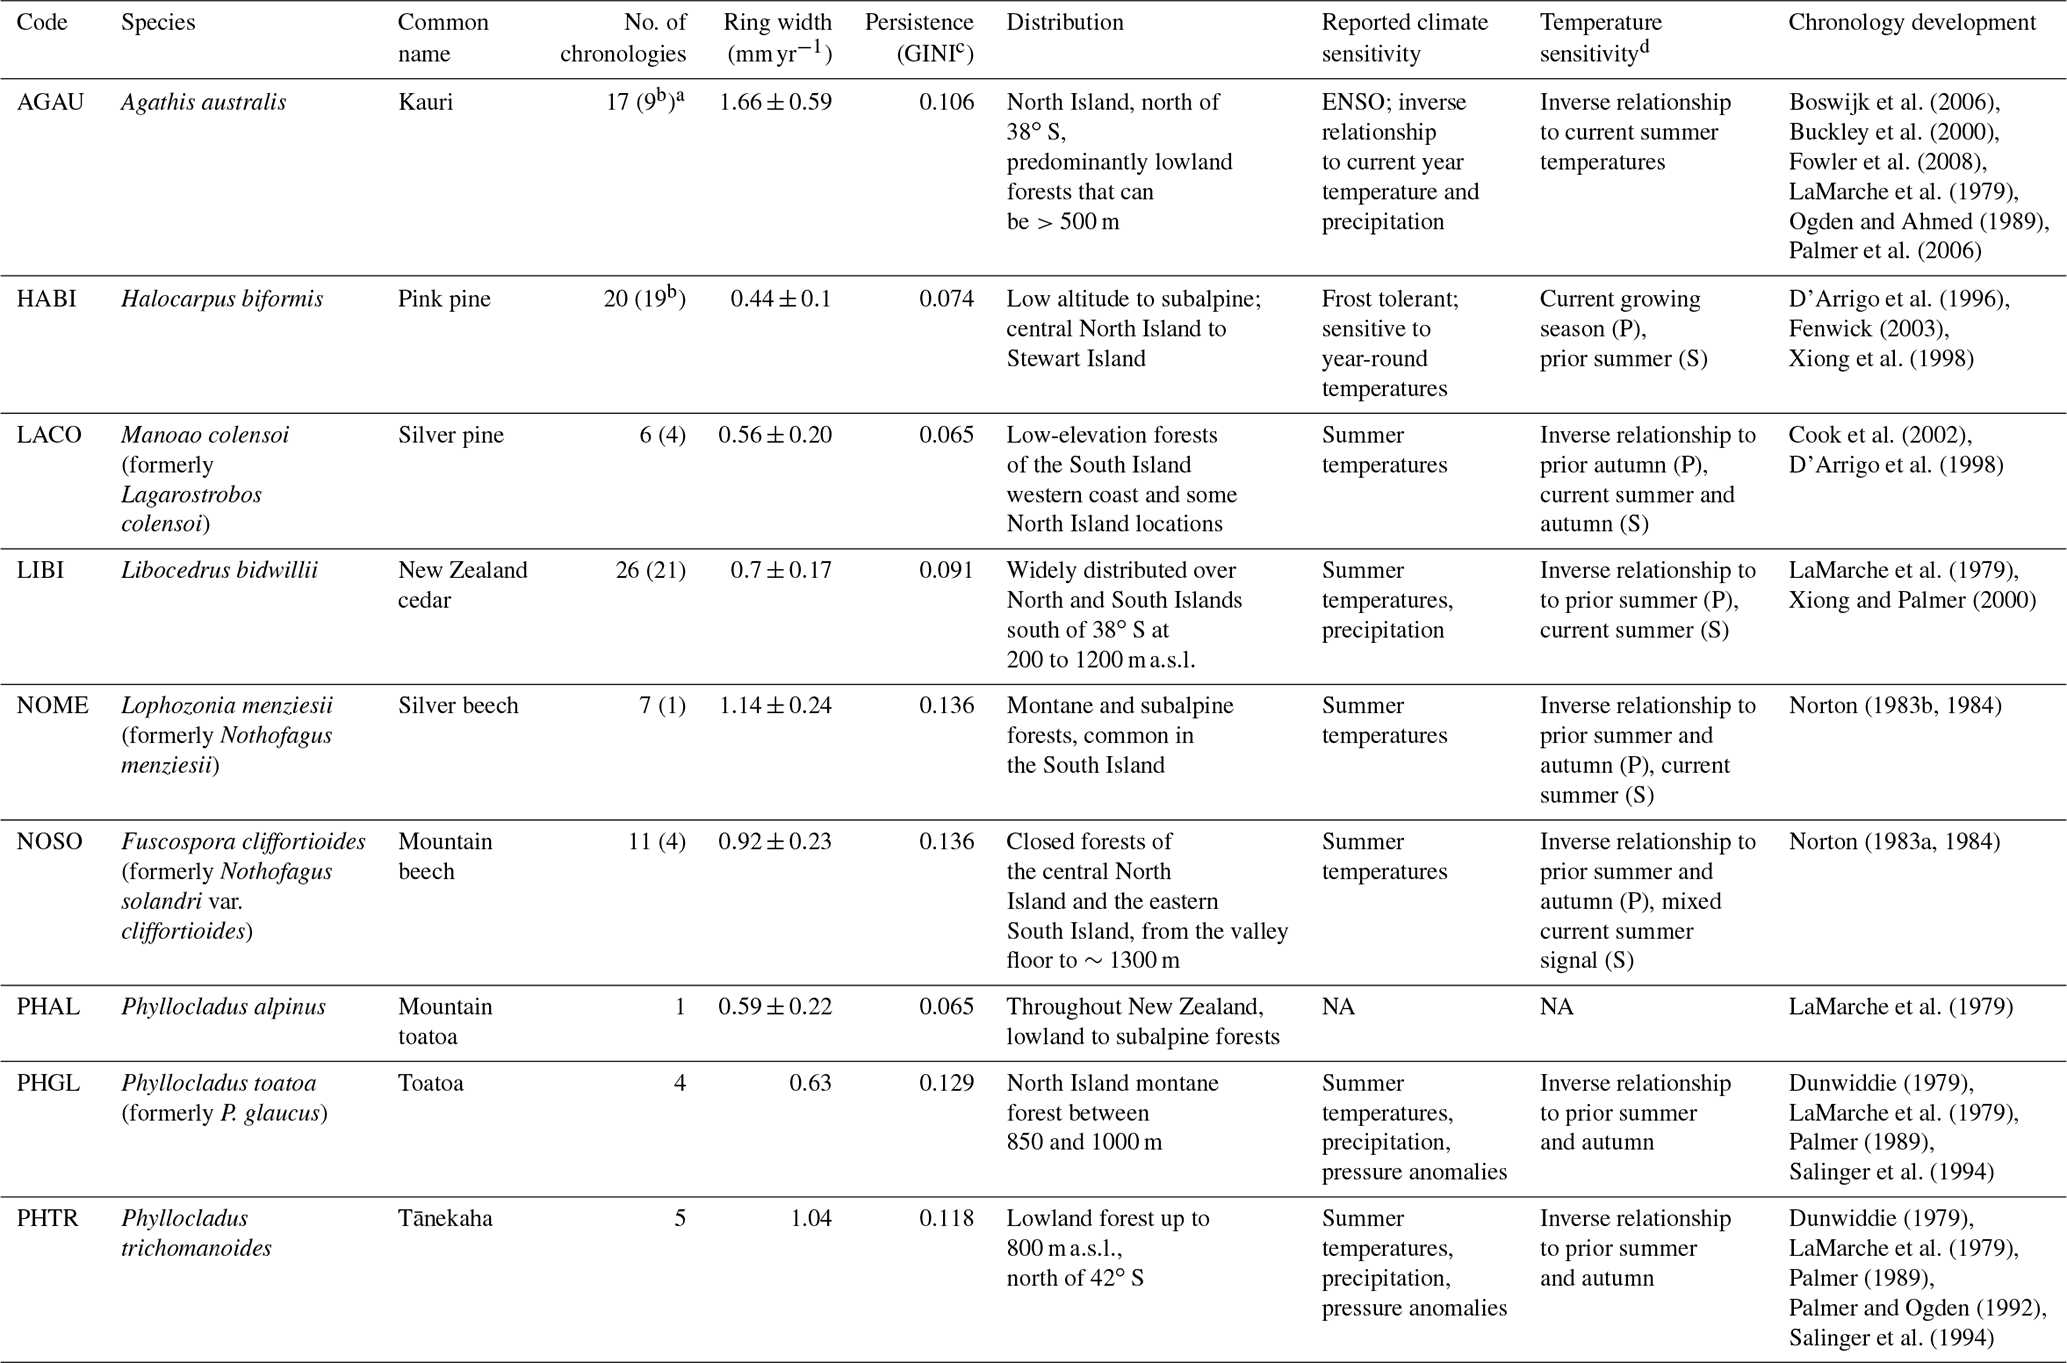
a Numbers in brackets indicate the number of chronologies extending to 1990 CE available for the temperature reconstructions. b Includes published master chronology. c GINI coefficient – an all-lag measure of diversity in tree-ring records (Biondi and Qeadan, 2008) d Summary of sensitivity to New Zealand average temperatures calculated for this study (see also Figs. S1 to S6). Where significant relationships to both prior and current season temperatures exist, P indicates the primary (dominant) sensitivity and S indicates the secondary sensitivity. NA: not available.
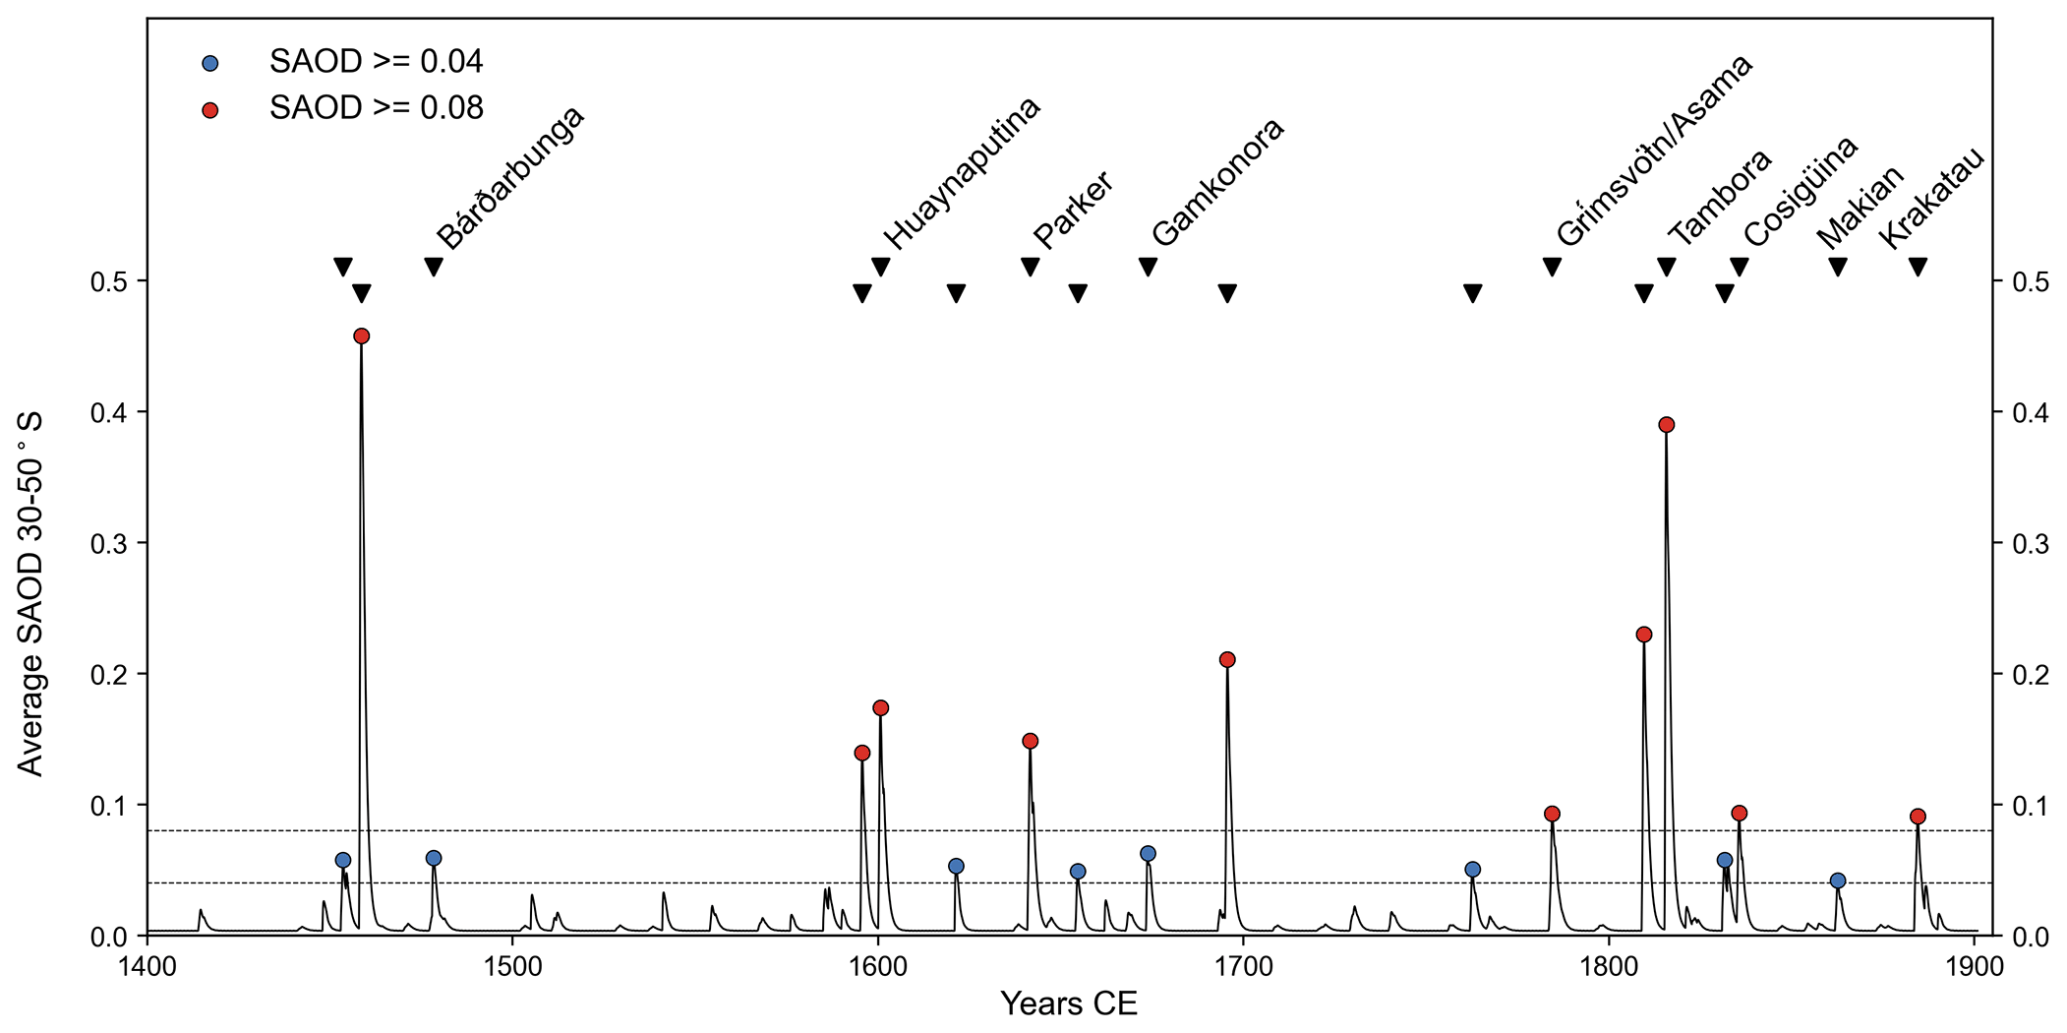
Figure 2Selection of volcanic events based on thresholds of peak modelled stratospheric atmospheric optical depth (Toohey and Sigl, 2017), averaged over 30–50∘ S, greater than 0.04 (blue) and 0.08 (red). Known eruptions are labelled.
Table 1 summarises the distribution, average climate responses, and main wood properties (average annual ring growth and temporal correlation or persistence) of the species, as described by the studies documenting the development of the chronologies. In addition, the response of each species to average New Zealand monthly temperatures, calculated for this study, is also summarised. All species show significant (p < 0.05) relationships with average New Zealand temperatures (Salinger, 1981; Mullan, 2012) during individual months of the current growing season, except toatoa (Table 1, Figs. S1–S6 in the Supplement). Tree growth is only weakly correlated with average monthly temperatures, with |r| < 0.3 for most chronologies. Pink pine shows stronger correlations with summer temperatures, with r values of 0.4–0.6. Pine pink is also significantly correlated to temperatures over the entire growing season, whereas the other species are seasonally restricted with significant correlations to peak summer temperatures only. Most species are positively correlated to current season temperatures, with wider ring widths associated with warm years; however, kauri and beech show an inverse relationship to temperature, with warm temperatures restricting growth. Cedar, silver pine, mountain beech, and both Phyllocladus species show stronger sensitivities to prior than current season temperatures (Figs. S1–S6).
2.2 Selection of volcanic events
Event selection is a significant source of uncertainty in tree-ring studies of volcanic cooling. The choice of volcanic events can greatly influence the magnitude of average regional cooling identified (Esper et al., 2013; Wilson et al., 2016). In addition, for many events that occurred before instrumental records, the timing, location, and size of eruptions are uncertain (Timmreck et al., 2021; Garrison et al., 2018). For this analysis, we are interested in those events which would likely have reduced growing-season temperatures over New Zealand and thus be identifiable as ring-width anomalies. Therefore, we selected events using a regional volcanic dimming threshold rather than an eruption magnitude. Prior to the instrumental era, we picked events from the Greenland and Antarctic ice core sulfate aerosol analysis of Toohey and Sigl (2017) based on peak stratospheric atmospheric aerosol depth (SAOD). We averaged SAOD, modelled using the Easy Volcanic Aerosol module (Toohey et al., 2016), over the latitudinal range of New Zealand (30 to 50∘ S). The SAOD magnitude corresponding to a substantial temperature response is unknown before analysis. However, selecting a magnitude post-analysis based on the observed response risks biasing the results (Haurwitz and Brier, 1981). Therefore, the following two different SAOD thresholds were used: SAOD > 0.08, which resulted in 10 eruptions for analysis between 1400 and 1900 CE, and SAOD > 0.04, resulting in 18 eruptions for the same period (Fig. 2). Between 1900 and 1990 CE, we selected the three largest tropical eruptions, which have been shown to have significant impacts on instrumental temperatures in New Zealand (Salinger, 1998). At each methodological step, the analysis was carried out using both the 13 (10 pre-1900 CE events plus 3 post-1900 CE) and 21 (18 pre-1900 CE events plus 3 post-1900 CE) event lists separately. Full details of all selected eruptions are provided in Table S2 in the Supplement.
2.3 Superposed epoch analysis
We tested whether a volcanic signal can be identified in New Zealand tree-ring chronologies using superposed epoch analysis (SEA; Haurwitz and Brier, 1981), a statistical technique widely used to determine the impacts of volcanic eruptions on climate (Rao et al., 2019b; Adams et al., 2003; Scuderi, 1990; Salinger, 1998; Tejedor et al., 2021). The composite response of individual chronologies to the 13 largest eruptions and the 21 full eruption list between 1400 and 1990 CE was studied 0–5 years post-event, with anomalies calculated by subtracting the average of the nearest 5 year background period undisturbed by volcanic forcing (Table S2; Büntgen et al., 2020). Species-level responses were then tested using a composite chronology produced by simple averaging of annual values across sites (Cook and Kairiukstis, 1990). Volcanic responses were categorised as positive or negative if the anomalies exceeded the 5th or 95th percentile response of 10 000 random samples of years undisturbed by volcanic forcing or neutral if they fell between these bounds.
2.4 Temperature reconstructions
To investigate the influence of chronology selection on the identification of volcanic signals in temperature reconstructions, we report two new reconstructions of New Zealand summer temperatures (December–February). We used the New Zealand average “seven-station” monthly instrumental temperature series (Salinger, 1981; Mullan, 2012), obtained from the New Zealand National Institute of Water and Atmospheric Research (NIWA), to examine the temperature response of the chronologies. Correlations were calculated between autoregressively modelled chronologies and monthly climate data, with each month treated as a separate time series. A 20-month window was selected for correlation analysis, extending from October of the previous growing season to May at the end of the current austral growing season. Two growing seasons were included as significant prior season climate sensitivities have been reported for some species. Based on the response analysis, December–February (DJF) was selected as the seasonal target, as this window captures the strongest correlations across all species (Table 1).
To ensure sufficient overlap between the chronologies and the temperature dataset for calibration and verification, only chronologies extending to or beyond 1990 CE were retained for the reconstructions. As many sites have not been updated since they were originally sampled in the 1970s and 1980s CE, only 58 of the 96 chronologies were retained. The first reconstruction (NZall) included the full suite of available chronologies extending to 1990 CE, while the second (NZsel) was limited to those chronologies that showed a significant volcanic signal using SEA. In each case, only those chronologies significantly (p < 0.1) correlated to average DJF temperatures over the period 1911–1990 CE were used. The tree-ring series were also tested as potential predictors with a lag of 1 year with respect to the temperature data, as prior climate often has a lingering influence on current year's tree growth (Fritts, 1976; Table 1). Average DJF temperatures were reconstructed using nested principal component linear regression (Cook et al., 2007, 2010, 1999). A 50:50 split calibration–validation scheme was used in which the model was initially calibrated on the first half of the data (1911–1950 CE) and validated on the second half (1951–1990 CE); following this, the model was re-estimated with the calibration and validation periods reversed. Once the split models were verified based on the verification period reduction of error (VRE) and verification period coefficient of efficiency (VCE; Cook and Kairiukstis, 1990) metrics, the entire data period was used to produce the final reconstructions (Briffa et al., 1990).
The volcanic response in tree-ring reconstructions of temperature was also tested using SEA and the two sets of volcanic eruption years. Further, variation in the temperature response to different volcanic events was estimated by calculating the 90th percentile bootstrap confidence interval from 1000 replicates drawn without replacement from the event list (Rao et al., 2019b). In each iteration, approximately two-thirds (9 of 13 or 15 of 21) of the volcanic events were selected. The confidence interval provides some indication of how eruptions of different sizes, locations, and seasonality may impact the SEA results. To further assess how event selection may have affected the SEA results, the analysis was repeated using volcanic events selected from the ice core analysis of Crowley and Unterman (2013), using a Southern Hemisphere-wide average threshold of SAOD > 0.08 and SAOD > 0.04 rather than a regional threshold (Table S3).
We compared the volcanic response seen in our multispecies reconstructions to the ensemble mean DJF response of seven climate models from the Coupled Model Intercomparison Project 5 (CMIP5) suite with Last Millennium (past1000, 850–1850 CE) simulations. The CMIP5 models were forced with either the Gao et al. (2008) or Crowley and Unterman (2013) volcanic forcing series (see Table S4). Data from the historical simulations were appended to extend the dataset from 1850 to 2005 CE.
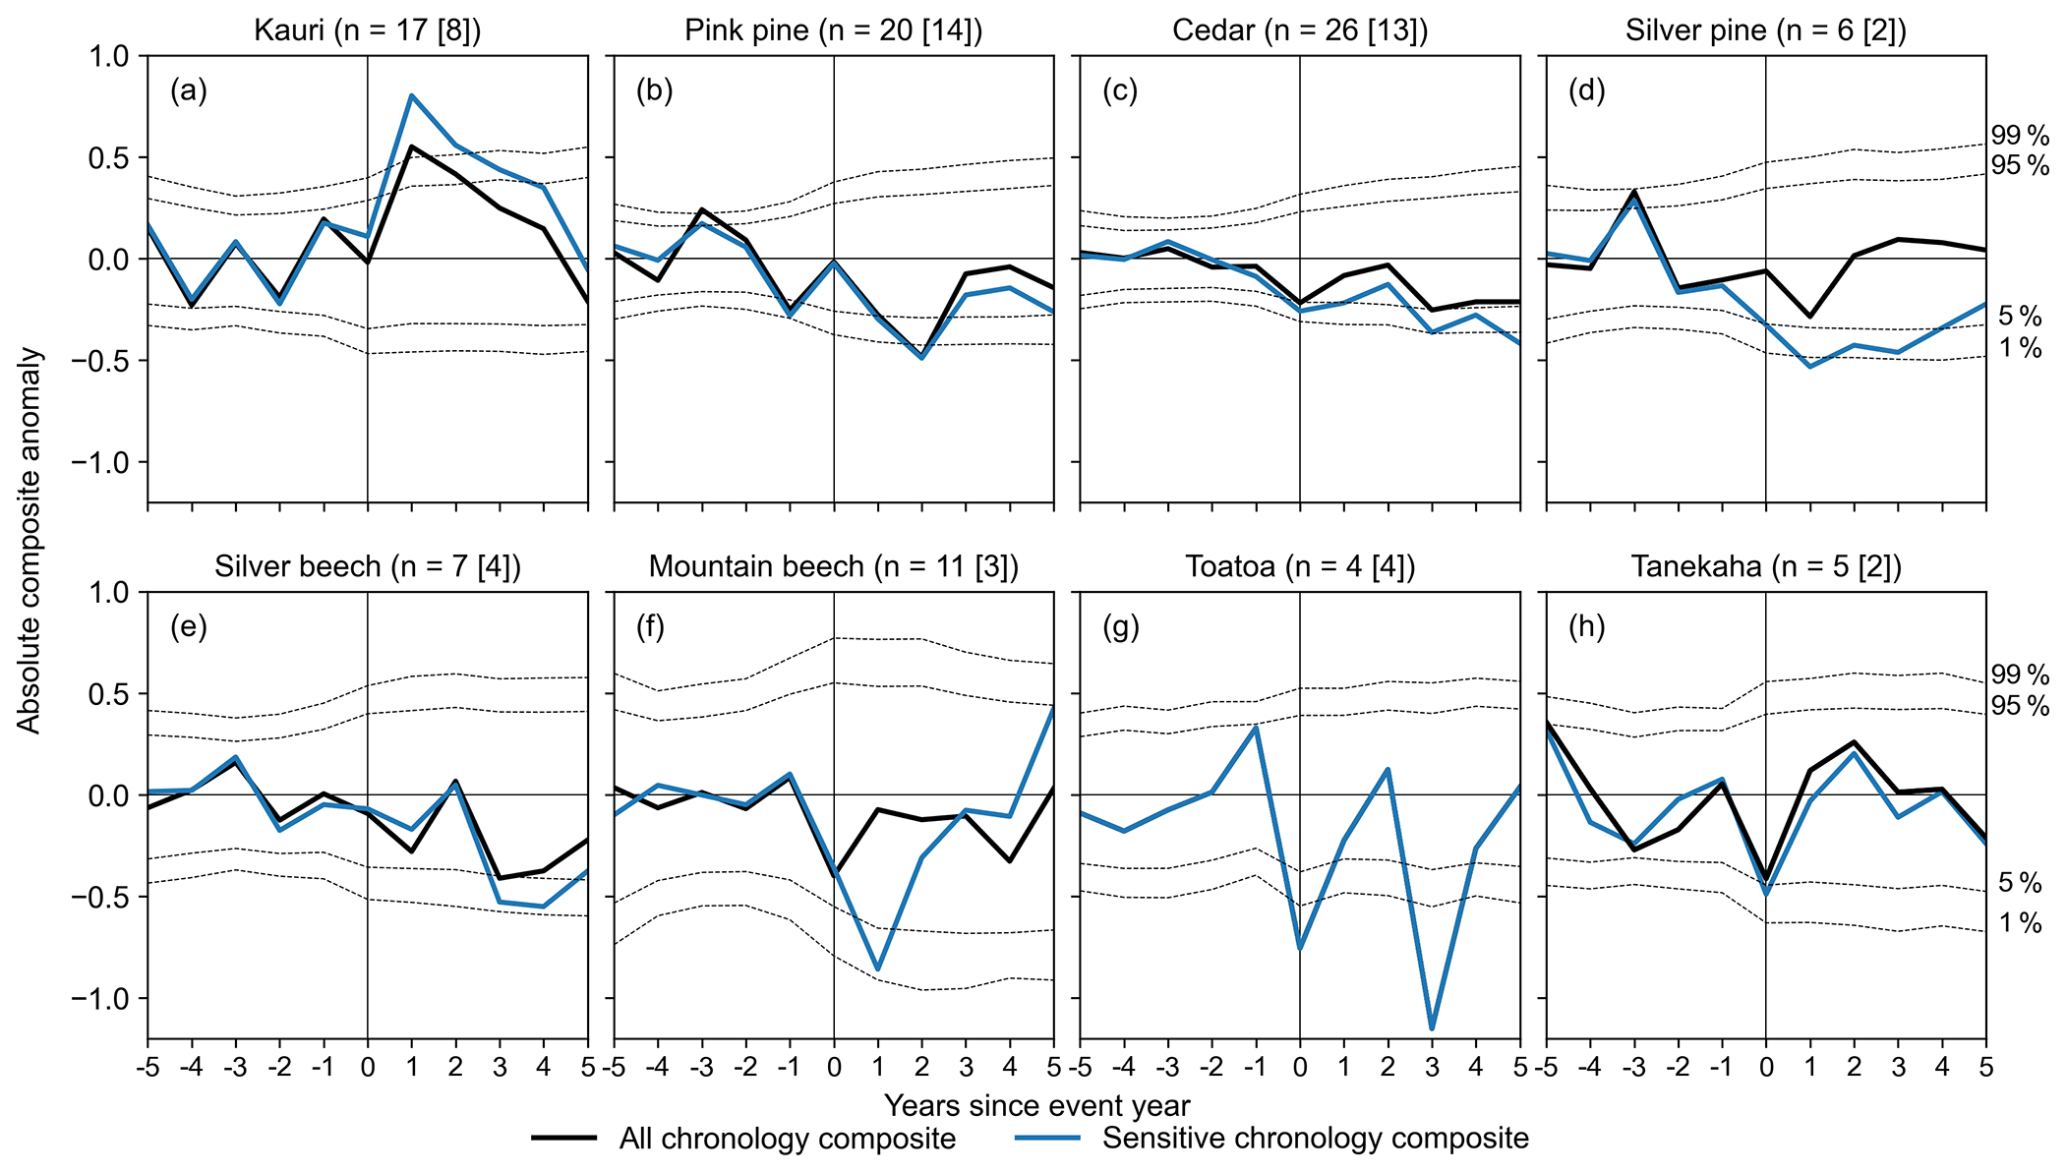
Figure 3Mean chronology departures 5 years before and 5 years after the 13 largest eruption years (year 0), separated by tree species. The chronologies contributing to the species-wide composite are shown in black, with the number of chronologies indicated in parentheses. The sensitive chronology composite in shown in blue and the number of contributing chronologies is shown in brackets. Significance bands (dotted grey lines) are the 1st, 5th, 95th, and 99th percentile of 10 000 random samples of non-event years from the species-wide composite.
3.1 Overall species volcanic responses
The results of the superposed epoch analysis for the 13 largest volcanic eruptions between 1400 and 1990 CE are shown in Fig. 3. Two composite responses are shown for each species: the response averaged across all sites (“all chronology composite”) and the response calculated only from the site chronologies that individually showed a significant (either positive or negative) response to volcanic eruptions (“sensitive chronology composite”). Analysis was repeated for the full set of 21 eruptions with SAOD > 0.04, with similar (but weaker) results for most species, suggesting that not all events had a measurable climatic impact over New Zealand (Fig. S7).
The species-wide response to volcanic events varied widely between New Zealand dendrochronological species. Three out of eight species, i.e. silver pine, mountain beech, and tānekaha, recorded a composite neutral response. Tānekaha is only weakly correlated to New Zealand average temperatures (Fig. S6b), which may explain its subdued response. However, compared to other species, mountain beech and silver pine both show relatively strong temperature sensitivities (Figs. S1a and S4). As many mountain beech chronologies extend only to the mid-1700s, the species composites were tested against a smaller subset of volcanic events, which may contribute to this result.
Of the remaining five species, one recorded a positive response, while four recorded a negative response. Kauri (Fig. 3a) was the only species to show a composite positive response to volcanic events, maximal in year t+1. Kauri showed a consistent response across sites, with all except two chronologies showing a positive anomaly following an event, although only 8 of the 17 positive responses were significant at p < 0.05. The sensitive chronology composite recorded a very strong t+1 response, indicating that at these eight sites, kauri receives a significant growth benefit from the climatic changes following a volcanic eruption. This response is coherent with the predominant kauri temperature sensitivity, which is an inverse response to current summer temperatures (Fig. S3). However, as most kauri chronologies are only weakly correlated to monthly temperatures, the strong volcanic response suggests climatic changes other than temperature also contribute to the post-event growth benefit.
Pink pine, cedar, silver beech, and toatoa show lagged negative responses to volcanic events, with peak negative anomalies recorded in years t+2 or t+3 (Fig. 3b, c, e, and g). The pink pine response is consistent across sites. All except one pink pine chronology recorded a negative response in t+2, which was significant for most of the chronologies (; p < 0.05). This response is coherent with the pink pine's broad sensitivity to temperatures over the current growing season (Fig. S2), i.e. cooler spring–summer–autumn temperatures suppress growth across most pink pine sites. Similarly, the negative silver beech response is coherent with its current season temperature sensitivity (Fig. S1b), although neither the temperature correlation nor the volcanic response is particularly strong. All four toatoa chronologies recorded a significant negative response in t+3. However, as toatoa shows only weak lagged correlation with monthly temperatures (Fig. S6a), the link between temperature sensitivity and volcanic response is not easily elucidated.
In contrast, cedar does not show a consistent species-wide response. Both significant negative and positive responses were recorded in 13 of the 26 chronologies, with the rest showing a neutral response. This is despite a largely consistent within-species temperature sensitivity, which is an inverse response to prior season temperatures (Fig. S5).
3.2 Within-species variability in volcanic response
The overall muted species response of cedar masks very different individual chronology responses. Cedar ring-width series respond differently to volcanic events depending on their location, with both very negative and very positive responses recorded. The other species do not show similar variation. The cedar chronologies have the widest geographical distribution of any species, and thus geographical factors may influence the variability in response. We used k-means clustering via principal component analysis (Ding and He, 2004) to investigate whether within-species variation could be explained by obvious factors like regional climate or elevation. Principal component analysis (PCA) was applied to the longest common time interval of the chronologies (1732–1976 CE), and the first four principal components were retained.

Figure 4(a) Results of k-means clustering of New Zealand cedar chronologies. (b–f) Mean chronology departures 5 years before and after eruption years (year 0), separated by cluster, and the 95th and 99th significance levels calculated by generating 10 000 random samples of non-event years from the group composite. The map in (a) was made with Natural Earth free vector map data, which are available at http://naturalearthdata.com (last access: 17 November 2021).
Five chronology groups were identified via clustering (Fig. 4a), broadly corresponding to differences in region and altitude. North Island chronologies were distributed in two groups. All chronologies are from montane to subalpine areas above 800 m, with groups differentiated between coastal (G1) and inland (G2) locations. A single chronology from the north of the South Island was included in G2. Chronologies from the western coast of the South Island were also distributed in two groups, differentiating between lowland (G3) and montane (G4) forest. The final grouping (G5) includes three chronologies from the dry eastern lowlands. Strong – but opposing – volcanic responses are identified via clustering. Significant lagged post-eruption growth reduction is identified in groups G1 and G2 from montane to subalpine sites from the North Island, including Takapari (Fig. S8c), and the southernmost grouping, G5. Group three (G3), which includes lowland chronologies from the northwestern coast of the South Island, including Ahaura and Flagstaff Creek (Fig. S8d and e), receives a growth benefit in the 2 years following an eruption similar to that observed in North Island kauri. In cedar, we observed all three of the proposed temperate-zone tree responses to volcanic events – positive, negative, and neutral growth – all within a single species, highlighting the importance of site-based factors in determining tree response in temperate zones.
3.3 Calibration and validation of the temperature reconstructions
The peak summer period was selected as the seasonal reconstruction target, as the largest number of chronologies across species showed significant correlations with temperatures between December and February (Table 1). Selecting only those chronologies correlated at p < 0.1 with average DJF temperatures resulted in a predictor pool of 45 chronologies for reconstruction NZall, of which 25 showed significant volcanic impacts and were used to produce the reconstruction NZsens.
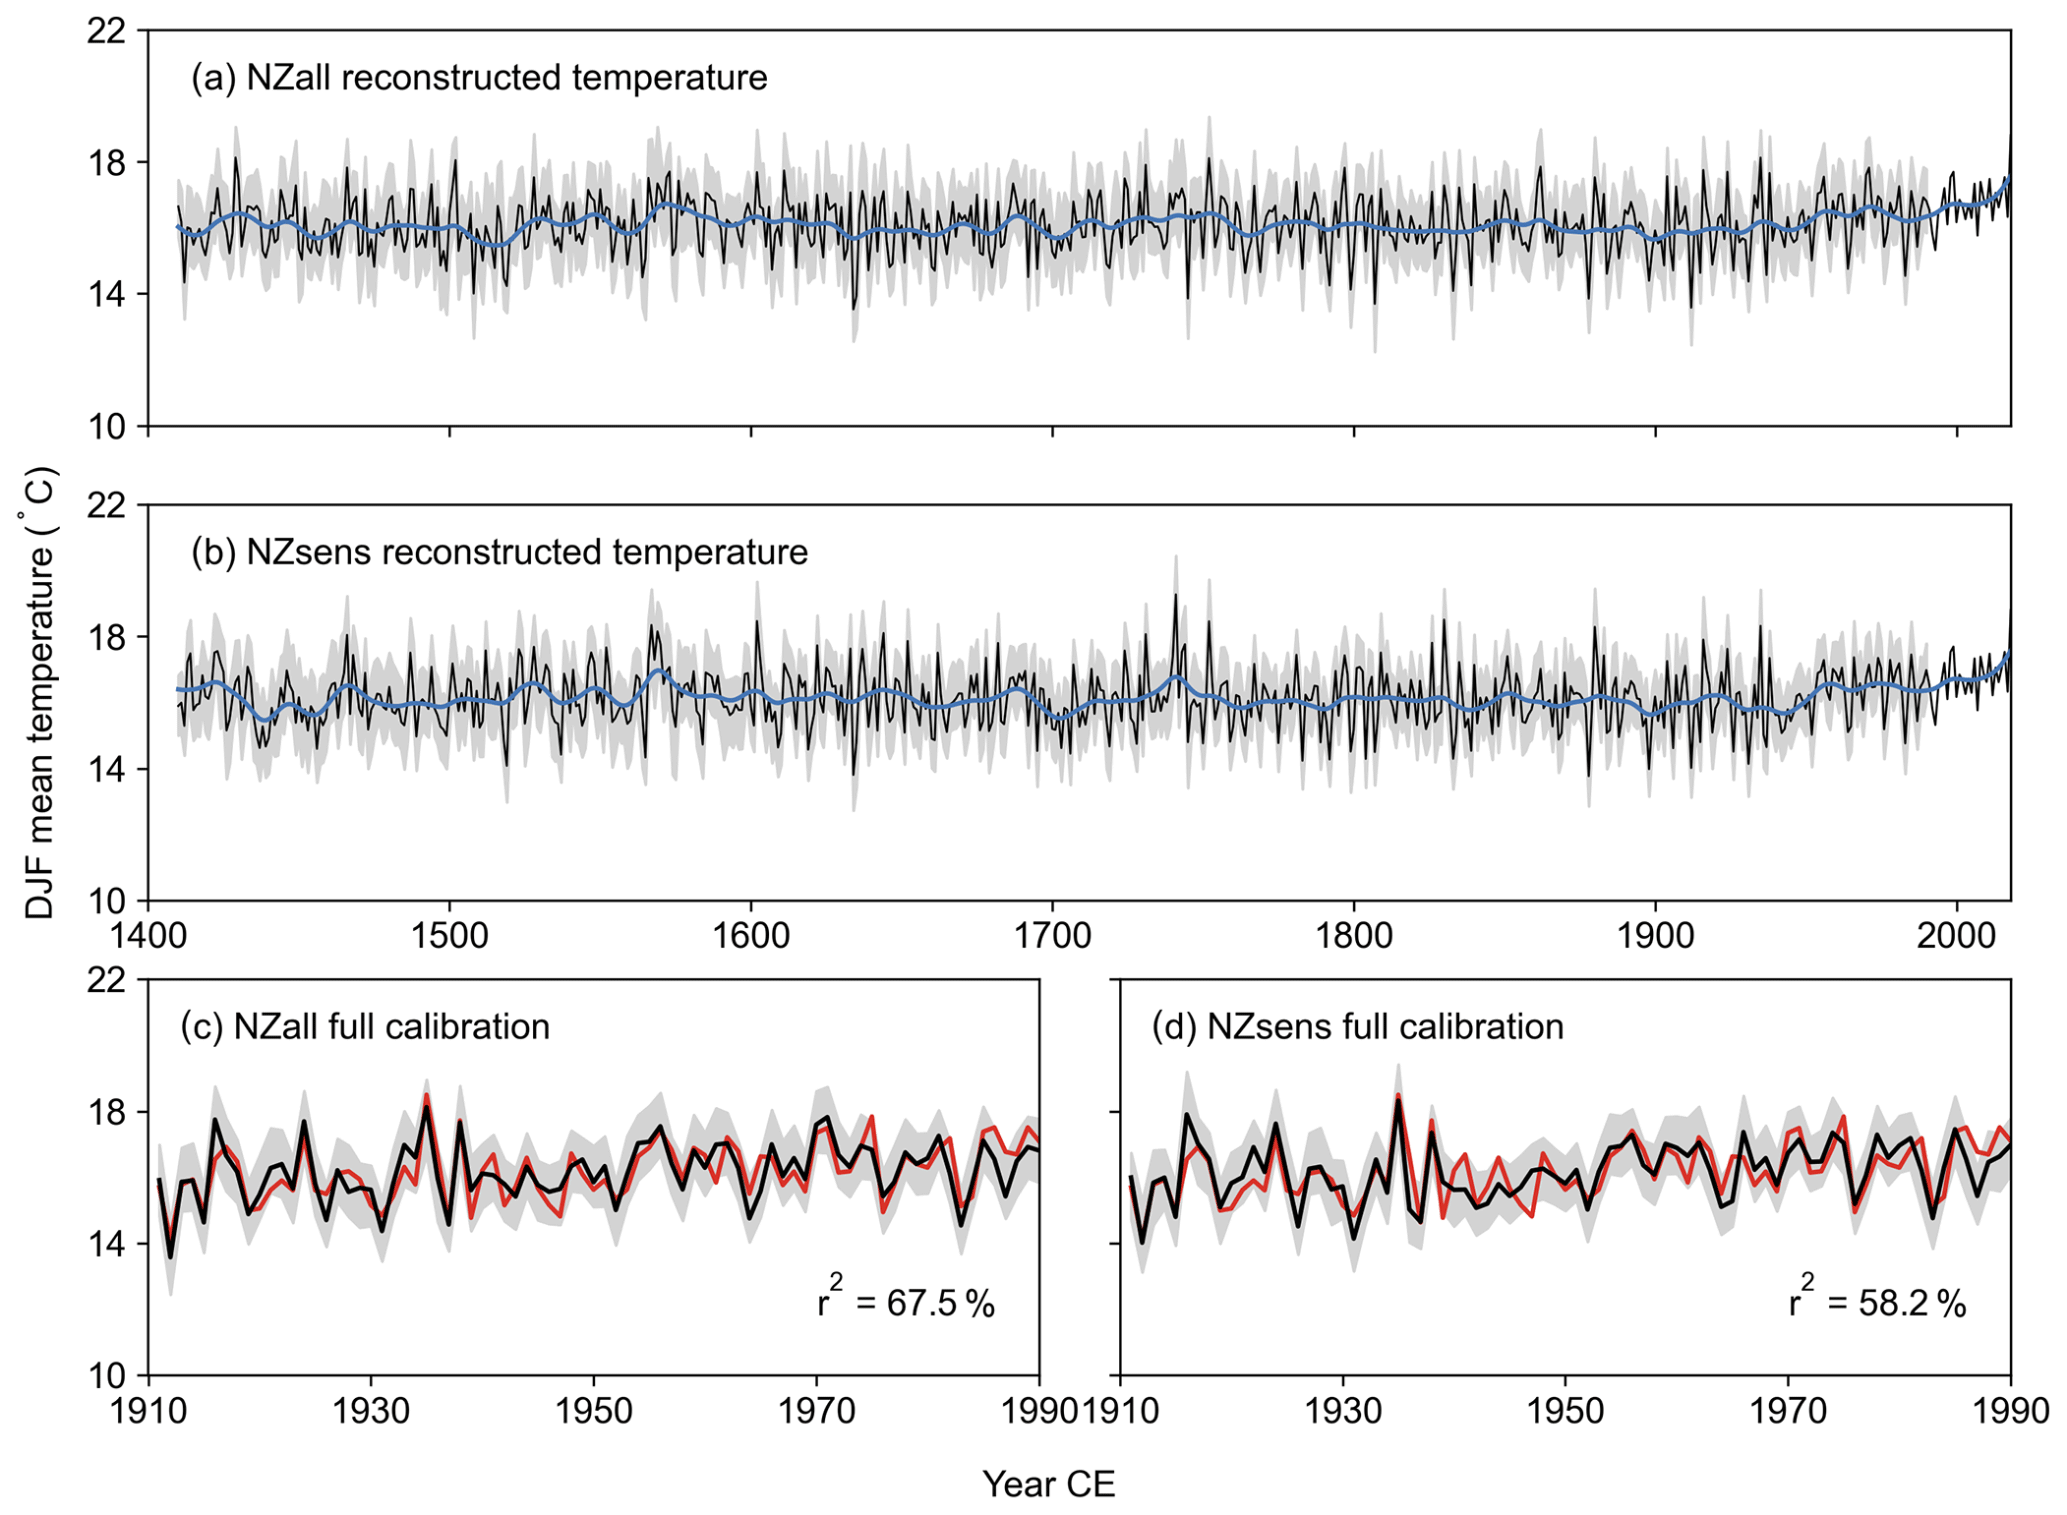
Figure 5New Zealand average DJF temperature reconstructions. Unfiltered (black) and filtered (20-year spline; blue) mean DJF reconstruction with 90 % uncertainty interval (grey) between 1400 and 2018 CE for (a) NZall and (b) NZsens. Reconstruction fit to instrumental temperature (red) over the full calibration period 1911–1990 CE for (c) NZall and (d) NZsens. The 90 % uncertainty interval was calculated from 300 maximum entropy bootstrap replications.
Both New Zealand DJF average temperature reconstructions are shown in Fig. 5 alongside their instrumental fit over the 1911–1990 CE calibration period. There is good agreement between the reconstructions, with a Pearson r of 0.81 over the entire reconstruction period and 0.9 after 1750 CE. The initial, best-replicated nests, which cover the period 1790–1990 CE, account for 67.5 % and 58.2 % of instrumental temperature variability for the NZall and NZsens reconstructions, respectively. The minimum amount of variance explained over all nests is 44.1 % for NZall and 34.3 % for NZsens. The full calibration and validation statistics are provided in Figs. S9 and S10. For both reconstructions, VRE values are positive over all nests from 1413 to 1990 CE; however, VCE values are only positive after 1520 CE in the NZsens reconstruction when calibrated to the early window (1911–1950 CE). The declining instrumental data quality in the early period and the relatively few predictors retained for NZsens, are likely responsible for the negative values.
Increasing temperatures are observable in both reconstructions from around 1950 CE, matching the trend in instrumental temperatures. Prior to the instrumental period, temperatures were higher than average for a sustained period during the 16th century and for a shorter period in the early 18th century. Periods of cooler-than-average temperatures have also occurred, starting at ∼ 1470, 1630, and 1860 CE. The reconstructions are consistent with previously published temperature reconstructions from New Zealand (Cook et al., 2002; Duncan et al., 2010; Palmer and Xiong, 2004) despite differences in the climate targets (seasons and locations), reconstruction methodologies, and large differences in the number and geographical distribution of chronologies used in their development (Fig. S11 and Table S5).

Figure 6Mean anomalies 5 years before and after 21 eruption years with SAOD > 0.04 (a, c) and 13 eruption years with SAOD > 0.08 (b, d) for both the NZall (blue) and NZsens (red) reconstructions. The mean response from an ensemble of seven climate models to the same set of events is shown in black. The 90th percentile bootstrap confidence intervals were constructed from 1000 replicates of either 15 or 9 event years at random.
3.4 Volcanic signals in the temperature reconstructions
Figure 6 shows the results of the SEA analysis for the two New Zealand temperature reconstructions, for both sets of volcanic events, compared to the volcanic response of an ensemble of seven CMIP5 model outputs for the New Zealand region. For the 21 events with SAOD > 0.04, results are remarkably similar between the temperature reconstructions and the model ensemble. Both the timing and magnitude of the post-event anomaly, which is only significant in year t+1, are consistent across the models and reconstructions, as is the timing of the post-event recovery, which occurs in year t+2. The response to the subset of the 13 largest events shows larger year t+1 temperature anomalies for both the climate models and the reconstructions, with the greatest increase in response magnitude displayed by the model ensemble. Year t+1 anomalies are ∼ 0.1 ∘C larger for NZall, ∼ 0.2 ∘C larger for NZsens, and ∼ 0.4 ∘C larger for the model ensemble than the 21-event anomalies. However, the mean model ensemble lies within the 90 % uncertainty range of both reconstructions, indicating that the difference in magnitude between models and reconstructions is not significant for either the restricted 13-event set or the full 21-event set. The difference in post-event recovery is significant, with temperatures recovering by year t+2 in the reconstructions and modelled temperature anomalies persisting in year t+2. This is the opposite result to many tree-ring-based temperature reconstructions from the Northern Hemisphere, which show lagged persistence compared to climate models due to biological effects in the ring-width series (see Sect. 4.4).
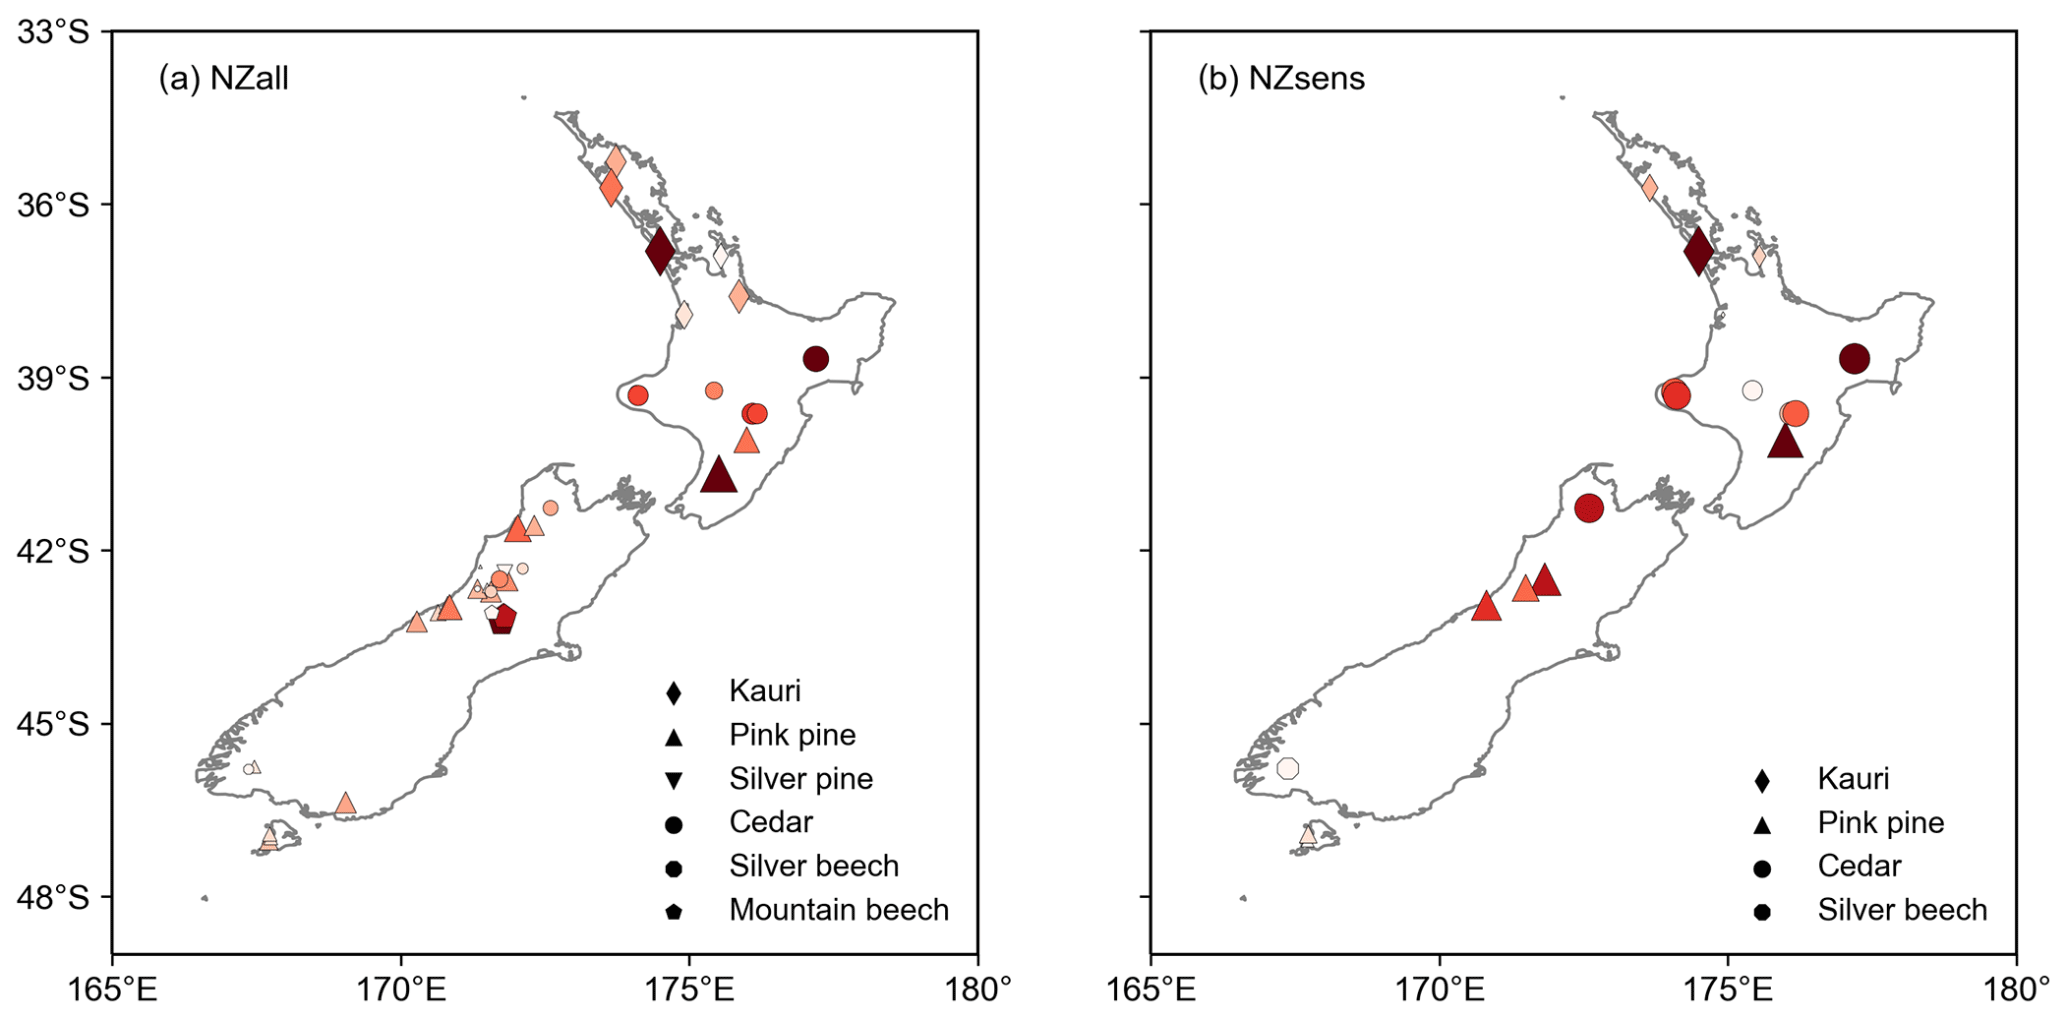
Figure 7Distribution of tree rings used in (a) the NZall temperature reconstruction and (b) the NZsens temperature reconstruction. Larger, darker red markers represent chronologies with greater relative weighting in the multiple regression. Made with Natural Earth free vector map data available at http://naturalearthdata.com (last access: 17 November 2021).
The difference between the NZall and NZsens reconstruction response is minor for both subsets of volcanic events. The anomaly recorded by NZsens is 0.07 ∘C larger than NZall for the 21-event series and 0.1 ∘C larger for the 13-event series. The small difference between the reconstructions can be explained by the weightings applied to the chronologies in each reconstruction, with both reconstructions heavily weighted towards the same subset of chronologies. Four of the eight highest-weighted chronologies underpinning NZall are sensitive to volcanic events, and three of these are within the top four highest-weighted chronologies underpinning NZsens (Fig. 7). Thus, limiting NZsens to only sensitive chronologies had less impact on post-eruption temperature anomalies than was expected.
4.1 Volcanic responses recorded by New Zealand trees
Previous studies have not identified significant volcanic responses in Southern Hemisphere tree rings (Krakauer and Randerson, 2003; Palmer and Ogden, 1992) or in the temperature reconstructions based on them (Allen et al., 2018; Cook et al., 1992). In contrast to previous studies, we found that volcanic events can be clearly identified in New Zealand ring widths, although some species are stronger recorders of volcanic signals than others. Unlike Northern Hemisphere high-latitude and tree line sites, which tend to show a consistent reduction in growth due to volcanic cooling and reductions in light availability, no consistent response was identified across New Zealand conifer and Nothofagaceae species. Predominantly negative (pink pine, cedar, toatoa, silver beech), positive (kauri), and neutral (mountain beech, tānekaha, silver pine) responses were recorded. As most New Zealand chronology sites have been sampled from localised areas of residual forest that are restricted compared to their natural distributional range, it is difficult to distinguish between species-related sensitivities to volcanic eruptions and regional climate factors that may control the response. In reality, it is the combination of biological characteristics, including intrinsic species sensitivity, regional climate, and site-specific factors (e.g. soils, exposure to prevailing conditions), which determine the observed volcanic response. While necessarily simplified, here we discuss some possible explanatory factors for the species-wide responses.
The species-level results in Figs. 3 and S7 clearly show two response types following volcanic events: a rapid but short-lived response and a delayed response that begins in year t+2 or t+3 but then persists over several years. The first response, demonstrated by mountain beech and kauri, we label here the “fast responder”, and the second, shown by pink pine, silver pine, cedar, and silver beech, we label the “stress tolerator” (after Grime, 1979). Many New Zealand conifers appear as typical stress-tolerator species, which have adapted to growing in highly stressful conditions. As a group, they are longer-lived, slower-growing, taller, and markedly frost-tolerant species compared to endemic angiosperms and are tolerant of poor soils (e.g. low nutrients and often poor drainage). Silver beech is highly frost and exposure resistant, shade tolerant, and grows on extreme exposure sites (Manson, 1974; Stewart, 2002). Several species, including pink pine and silver pine, show an affinity for leached, low-nutrient, and waterlogged soils (McGlone et al., 2017). The stress tolerators are characterised by narrow average ring widths and high biological persistence (temporal autocorrelation) arising from carbohydrate storage or leaf retention (see Table 1). Therefore, stress tolerators are slow to respond to changes in conditions, such as volcanic cooling. The stress-tolerator response resembles the response of high-latitude Northern Hemisphere trees, although arctic trees display even greater lagged persistence, with suppressed growth for up to 10 years following volcanic events (Krakauer and Randerson, 2003).
In contrast, the fast responders both respond and recover more quickly from a detrimental change in conditions (e.g. mountain beech) or can rapidly capitalise on beneficial conditions (e.g. kauri). These are relatively fast-growing species, indicated by wider average ring widths than the stress tolerators, and they have lower persistence (Table 1). Mountain beech is shade intolerant but has several responses to abnormally cold temperatures, including rapid shoot growth and temporarily halting bud formation, which allows it to rebound quickly after a poor summer (Wardle, 1970). Kauri could be considered a stress tolerator due to its affinity for poor soils, occurrence on ridges and slopes, and drought tolerance (McGlone et al., 2017); however, relative to other New Zealand conifers in this study, it is a fast responder.
In contrast to the subdued, persistent decrease in growth shown by the stress tolerator species, the initial decline in toatoa ring width in year t+0, subsequent extreme decline in year t+3, and recovery by year t+4 closely resembles the boom–bust behaviour of the fast responders, but with several years' lag. The dominant climate response of toatoa is a weak negative correlation to prior growing-season temperatures (Fig. S6a) but a strong positive correlation to summer temperatures two growing seasons prior. This results in a quasi-biennial pattern of wide and narrow rings, which has also been observed in other species of Phyllocladus. This pattern may be related to a climate-triggered flowering cycle (Ogden and Dunwiddie, 1982; Allen, 1998), foliage production followed by cladode senescence, or a mast seeding event, which can be triggered by multiple cool summers in New Zealand Podocarpaceae (Norton and Kelly, 1988). All three potential explanations suggest toatoa channel resources to reproduction at the expense of cambial growth (Harper, 1977) following a climate trigger after volcanic events – perhaps increased humidity and reduced summer water stress at low-elevation North Island sites or an increase in photosynthesis due to a greater fraction of diffuse radiation. More research on the ecology and life history of toatoa is needed to confirm these possible mechanisms.
We compared the response at six sites which each have chronologies from two different species (Fig. S8), providing the unique opportunity to compare species differences in volcanic sensitivity directly whilst controlling for most other factors. The three species that are co-located and thus available for site-based comparison (cedar–pink pine and cedar–silver pine) all showed stress-tolerator responses to volcanic eruptions. Pink pine and cedar often grow together in mixed stands. Both species are sensitive to temperature, although pink pine has a maximum correlation to late summer temperature, whereas cedar responds to conditions in the winter prior to the growing season and in spring (Fenwick, 2003). A significant difference in the response between species was observed only at one of three sites. Comparison over additional sites is therefore required to determine whether the difference in seasonal temperature response may result in a difference in the sensitivity of pink pine and cedar to climate disturbance following eruptions. Differences between the cedar and silver pine responses were observed at two of the three sites, with cedar showing greater sensitivity to volcanic eruptions. Silver pine is primarily found in the moist, temperate, low-elevation forests of the western coast of the South Island. It is a shade-tolerant species that grows in highly competitive closed-canopy forests on infertile, poorly drained or waterlogged soils (Wardle, 1977; Cook et al., 2002). It is an exceptionally slow-growing species and shows little year-to year variability in ring width (Table 1). Thus, it is unsurprising that volcanic effects were more readily identified in cedar at the Ahaura and Flagstaff Creek sites (Fig. S8).
4.2 A kauri growth benefit
An interesting result of this study is the strong positive species-wide response of North Island kauri to volcanic events (Fig. 3a) despite the weak correlation of the chronologies to monthly temperatures (Fig. S3). Over 70 % of the kauri chronologies recorded a small but significant increase in ring width in the year following a large eruption (SAOD > 0.04), indicating a growth benefit from volcanism. Previous studies of kauri climate response function have shown that growth is not primarily related to temperature but is enhanced during cool, dry years, with the strongest (negative) correlation to austral spring temperatures (Ogden and Ahmed, 1989; Buckley et al., 2000). Ring growth is thus enhanced during El Niño events, which result in cool, dry spring conditions in northern New Zealand, and kauri has been successfully used as a proxy for the El Niño–Southern Oscillation (ENSO; Fowler et al., 2008). The mechanism behind this relationship remains largely unclear, although it has been proposed that reduced cloud cover during El Niño events may benefit kauri growth via increased insolation (Fowler et al., 2000). The opposite conditions follow a volcanic eruption, with reduced direct insolation and increased diffuse insolation due to scattering by volcanic aerosols (Gu et al., 2003). The commonality between the two sets of events is cooler-than-average spring and summer temperatures.
This suggests that kauri may capitalise on a decrease in summer evapotranspiration during both El Niño events and following significant eruptions. Maximum kauri growth occurs during spring, with large declines in growth rate over the peak summer months when evapotranspiration exceeds precipitation in the northern North Island (Fowler et al., 2005). Dendrometer band studies suggest that reduced spring and summer moisture stress may delay the cessation of growth, resulting in wider annual rings (Palmer and Ogden, 1983). No summer cessation of growth was observed by Palmer and Ogden (1983) at the highest-altitude site, Mt Moehau (1MOE, Table S1). This site receives moisture from condensation and fog drip, as well as rainfall, reducing the summer precipitation deficit. Plausibly, the increase in diffuse radiation and resulting enhanced photosynthesis (Gu et al., 2003; Robock, 2005) may also contribute to post-event kauri growth. However, tree growth is generally more constrained by the environment than photosynthesis (Fatichi et al., 2019; Zweifel et al., 2021), and thus increased photosynthesis may not necessarily translate into growth (i.e. a wider ring) in the presence of another limiting factor, such as the summer moisture deficit. Additional research is needed to understand the relative importance of temperature, light availability, humidity, and soil moisture to sub-annual growth in kauri.
Many observational and modelling studies propose a link between large tropical volcanic eruptions and sea surface temperature variability in the tropical Pacific, with El Niño-like conditions more likely in the year following a significant event (Emile-Geay et al., 2008; Adams et al., 2003; Khodri et al., 2017; Christiansen, 2008; Miao et al., 2018; McGregor et al., 2010), although this link is not always identifiable in the paleoclimate data (Dee et al., 2020). The three eruptions included in this analysis since 1900 CE co-occurred with an El Niño event, and the 1982/83 CE El Niño is one of the largest on record (Santoso et al., 2017). While we do not wish to debate the eruption–ENSO response as part of this study, these potential interactions complicate our analysis of the volcanic signal in kauri.
In an attempt to distinguish between the effects of El Niño events and volcanic eruptions on kauri growth, we repeated the SEA analysis, removing the three volcanic eruptions since 1900 CE. A smaller composite ring-width anomaly was recorded without the three events, but the response remained significant in year t+1 (Fig. S13). To test the potential follow-through impact of the kauri response to El Niño events on the temperature reconstructions, we removed the ENSO component via linear regression of the Southern Oscillation Index on the reconstructed temperature series. There is a negligible difference between the original and ENSO-adjusted temperature reconstructions for all volcanic events between 1880 and 1990 CE, except for the response to El Chichón in 1982 CE, which is much larger in the unadjusted reconstruction (Fig. S14). Based on currently available data, we cannot confidently discount that the kauri growth benefit identified in year t+1 may be a secondary response to changes in tropical Pacific sea surface temperatures following a large eruption. However, this is unlikely to have a large impact on the post-event anomalies identified in the temperature reconstructions.
4.3 Site-related volcanic responses
Differences in volcanic response between sites are observed for all species, largely between sites with significant decreases in growth and sites with neutral responses (Figs. 3 and S7). More temperature-limited sites, such as sites at higher elevation and lower latitude, are expected to be more sensitive to volcanic cooling and thus experience the most reduction in growth. Broadly in line with this expectation, chronologies that are highly correlated to monthly temperatures show greater sensitivity to volcanic eruptions (Fig. S15). However, there are many exceptions, both for temperature-sensitive sites with a neutral volcanic response and sites that are only weakly correlated to temperature but that are markedly affected by the climatic changes following volcanic eruptions. Thus, volcanic response cannot be simply interpreted as a response to cooler-than-average temperatures.
Based on the variability in volcanic response observed in cedar (Fig. S8) it is evident that site-related factors can have a substantial impact on the volcanic response within a species group. This finding was further explored using k-means clustering of the widely distributed cedar chronologies (Fig. 4). Altitude and latitude are expected to be important explanatory factors for cedar tree growth, as together they represent the relative importance of temperature and water stress at a site. Temperature-limited high-altitude cedar sites at or near the treeline in the North Island ranges show a significant decline in tree growth following eruptions, as did coastal sites at higher latitudes (∼ 46∘ S). We observed a significant increase in cedar growth at low-elevation sites on the northern South Island (Group 3) in response to volcanic cooling, which we interpret as a reduction in summer evaporative demand. Low-elevation trees are more likely to experience summer water stress than their high-elevation counterparts due to higher average temperatures if precipitation rates are similar. In contrast to the significant positive correlation of treeline cedar sites to average summer temperatures (Fig. S5), the Group 3 chronologies display a negative correlation to summer temperatures (not significant at p < 0.05) indicating that soil moisture may be a limiting factor at these sites. Thus, we find that both high- and low-elevation cedar stands can reliably record volcanic signals, provided that the sites experience sufficient temperature or moisture stress. Sites that are neither strongly temperature nor water limited (Group 4; Fig. 4) show a neutral response to volcanic eruptions. A limitation of this analysis is that we have not considered potential spatial differences in the regional pattern of cooling or changes in regional atmospheric circulation patterns (Salinger, 1998), which could also impact the results for species with a wide distributional range (e.g. cedar).
Tree growth of species at different sites is limited by a variety of environmental factors, of which temperature and soil moisture are only two (Fritts, 1976). For many New Zealand species, little is known about what types of sites might accentuate these factors and thereby enhance the climatic sensitivity in the tree-ring series (Dunwiddie, 1979). Although the overall Group 2 cedar response was significant, not all high-altitude sites recorded a volcanic signal. Considering the location, aspect, forest characteristics, and soil type at individual cedar sites, we find that exposure to prevailing conditions is the key explanatory variable for the within-species response for sites near the altitudinal limit. Sites that record a significant growth response have high exposure to prevailing winds and are more sensitive to abnormally low growing-season temperatures. In contrast, chronologies from sites characterised by undulating ridgelines and more continuous forest showed a neutral growth response. Sites experiencing mesic conditions and closed-canopy forests tend to show lower sensitivity to adverse environmental conditions, such as low temperatures (Phipps, 1982). Closed-canopy forests are also more likely to be sensitive to increases in the fraction of diffuse radiation driving photosynthesis (Gu et al., 2003; Tingley et al., 2014), and thus the increase in diffuse radiation fraction may compensate for the decrease in temperature to a greater extent compared to sites with more open canopies.
North Island kauri is another species for which exposure appears to be a determining factor in the chronology response to eruptions. For kauri, sites with a strong positive response to volcanic eruptions are coastal sites exposed to prevailing wind conditions or sites limited by poor underlying sediment substrates (e.g. 1TRO, 1KAW; Table S1). In comparison, sites that showed little volcanic response were those on the leeward side of the coastal range, which are buffered by inland microclimate effects (e.g. 1PBL, 1PKF; Table S1). These sites likely experience less water stress during the summer; therefore, we expect that they receive less benefit from reduced evaporative demand related to volcanic cooling, resulting in a neutral response. The importance of aspect to climate sensitivity – particularly when windward sites are exposed to prevailing winds – has been highlighted in many previous studies (e.g. Dang et al., 2007; Rozas et al., 2013). For New Zealand, a thorough exploration of the importance of site-based parameters other than elevation and latitude (e.g. aspect, exposure, soil type) to volcanic sensitivity is limited because these parameters have not been recorded for many sites.
4.4 Implications for temperature reconstructions
We expected to find a substantially greater volcanic response in NZsens (i.e. limited to only those chronologies with an individual significant volcanic response) compared to NZall. However, while NZsens shows a larger post-volcanic temperature response, the difference between the two reconstructions is not significant (Fig. 6). As shown in Fig. 7, both reconstructions are heavily weighted towards the same subset of chronologies. Since, sites with higher sensitivity (correlation) to temperature in general show higher volcanic response (Fig. S15), limiting NZsens to only sensitive chronologies has only a small impact on post-eruption temperatures. Another factor leading to the minimal difference between the reconstructions is that many volcanically sensitive chronologies, particularly kauri, were cored before 1990 CE and therefore not included in either temperature reconstruction. These sites should be updated with priority for future studies of volcanic impact in the Southern Hemisphere. In developing NZsens, we used a “volcanic sensitivity” threshold based on the SEA result significance (p < 0.05). By doing so, we reduced the size of the predictor pool, which reduced the strength of the reconstruction, particularly over the initial 100 years, when there were relatively few predictors (Fig. S10a).
When testing the reconstructions using the event list from Toohey and Sigl (2017) (Fig. 6), we concluded that losing reconstruction strength outweighs the small increase in volcanic sensitivity in NZsens and that it is not beneficial to restrict the predictor pool. However, when we then repeated the SEA analysis using the event list derived from Crowley and Unterman (2013), the mean response of NZall to the largest subset of 12 events with SAOD > 0.08 (Table S3; Fig. S12c) was not significant (p > 0.05). The benefit of the restricted predictor set in strengthening the volcanic signal in NZsens is highlighted when using this event list. It is important to note that the mean NZall response to the full set of Crowley and Unterman (2013) events with Southern Hemisphere-average SAOD > 0.04 is significant (Fig. S12a), which suggests that some eruptions classified as SAOD > 0.08 in Table S3 were not climatically effective over New Zealand. Potential reasons for the differences between the two volcanic datasets, which may have impacted the findings here, are discussed Sigl et al. (2014) and Toohey and Sigl (2017).
Figure S12c indicates that the SEA compositing procedure can fail when using a small number of events if the volcanic signal is small compared to other sources of interannual variability, especially when not all events have a climate impact. This is one potential reason that this study has identified significant volcanic signals in Southern Hemisphere tree rings when previous studies did not. Before Gao et al. (2008), no comprehensive reconstruction of global aerosol loading was available. Uncertainty in eruption dates and sizes likely contributed to the lack of volcanic signal identified in studies undertaken prior to the release of the “Gao” dataset (e.g. Cook et al., 2002; Villalba and Boninsegna, 1992). Revisiting the data from other major Southern Hemisphere dendrochronology regions (e.g. Tasmania, South America) is therefore an important aspect for future research.
Previous studies that narrowly focused on the impacts of the 1815 CE eruption of Tambora on New Zealand tree rings (Palmer and Ogden, 1992; Norton, 1992) also presented inconclusive results. The authors of these studies were seeking synchronous growth reductions across species, whereas our analysis, with the benefit of much more data, shows responses vary widely between species. Because of this variation in response, studies that rely on compositing across species and regions (e.g. Krakauer and Randerson, 2003) are also likely to underestimate the true volcanic response in Southern Hemisphere tree rings.
In this study we also compared reconstructed temperature anomalies with anomalies from climate models over the New Zealand region for DJF – peak growing season in the Southern Hemisphere. We found no difference between the magnitude of the year t+1 anomaly for either the 13- or 21-event composites, with the difference between the reconstructed and modelled anomalies < 0.12 ∘C for both sets of events. Recent work investigating the reasons for differences between climate model and proxy reconstructions of post-event temperature anomalies in the Northern Hemisphere (Zhu et al., 2020) found that these differences can be minimised by focusing on the growing season rather than annual temperatures, undertaking regional rather than hemispheric analysis, and resolving biological persistence. By focusing on regional DJF temperatures, we resolved two of these issues. A criticism of temperature reconstructions based solely on ring widths is that biological persistence in treeline conifers decreases the abruptness and magnitude of volcanic cooling. In the Northern Hemisphere, more emphasis is now being placed on maximum latewood density (MXD) or mixed MXD and ring widths for investigations of volcanic cooling (Wilson et al., 2016; Zhu et al., 2020). For this study, we focused only on ring widths, as few investigations of alternative wood properties have been undertaken in New Zealand (Blake et al., 2020; Xiong et al., 1998).
Unlike some Northern Hemisphere studies, our ring-width temperature reconstructions show no increased persistence in temperature anomalies following eruptive events compared to the climate model ensemble (Fig. 6). Ring widths from New Zealand conifers therefore appear suitable for volcanic investigations. Northern Hemisphere high-altitude and high-latitude trees predominantly used to determine the temperature impacts of volcanic eruptions contain higher biological persistence than the chronologies we used in our temperature reconstructions, influencing their post-eruption response. For example, the average first-order autocorrelation of our predictor chronologies is 0.53 (range 0.15–0.87; SD 0.15) compared to Arctic sites with an average of 0.62 (range 0.15–0.93; SD 0.13; Cropper and Fritts, 1981). Nevertheless, several New Zealand species do show a lagged volcanic response (Figs. 3 and S7) that is not present in the final temperature reconstructions. Methodological decisions play an important role in the persistence of tree-ring-based temperature reconstructions (Büntgen et al., 2021). In our reconstructions, pre-whitening of both the tree-ring predictors and the temperature data, including significant lagged predictors, and the selection of predictors from multiple species all contribute to the responses we identified.
Very few studies have considered whether volcanic signals are identifiable in tree-ring chronologies from the Southern Hemisphere. We investigated whether volcanic events could be identified in New Zealand tree rings using data from eight dendrochronological species. In doing so, we set out to answer the following three questions. First, can volcanic signals be identified in the Southern Hemisphere? Second, are there species-level differences in volcanic signal strength? Finally, does chronology selection impact the magnitude of post-volcanic cooling in temperature reconstructions from tree rings?
In answering the first two questions, we found that New Zealand dendrochronological species are reliable recorders of volcanic cooling but that response varies across species. The magnitude and persistence of the species-wide volcanic response can be broadly linked to plant life history traits. The larger magnitude and more immediate responses are recorded by the “fast-responder” species, such as mountain beech and kauri, and more delayed but persistent responses are recorded by the “stress-tolerator” species, such as silver pine. In general, volcanic events can be more readily observed in the ring widths of fast-responder species, which should be prioritised for future regional or hemispheric studies. Unfortunately, the paucity of information on the ecology of many New Zealand species limits our understanding of how species allocate resources to processes other than cambial growth in response to short-term changes in climatic conditions.
The volcanic response of New Zealand trees is complex, with positive, negative, and neutral responses identified sometimes within the same species group. For subalpine sites, this finding is not dissimilar to previous studies of temperate-zone Northern Hemisphere species. We found that site-related factors have greater control over displayed volcanic responses than species and presented a suite of plausible, testable hypotheses explaining the results. The altitude of the site with respect to the species altitudinal limit and exposure to prevailing conditions are factors thought to determine whether a tree-ring volcanic response could be identified. In some cases, sites near the lower altitudinal limit of the species were also strong responders, suggesting a reduction in summer moisture stress could also be an important factor in post-volcanic growth. Our results indicate that studies intending to utilise tree rings to investigate regional volcanic cooling should carefully consider the characteristics of the sample site. While valid for all dendrochronological studies, it is particularly important for identifying volcanic signals, as we find that the range of temperature-sensitive sites is greater than the range of volcanically sensitive sites.
In answer to the last question, we developed two new reconstructions of New Zealand summer temperature to investigate whether chronology selection impacted the magnitude of post-volcanic cooling. There was little difference in the post-event anomalies, suggesting that limiting the predictor pool for volcanic sensitivity is unnecessary when targeting average growing-season temperatures in New Zealand. Both reconstructions showed temperature anomalies remarkably consistent with studies based on instrumental temperature and the ensemble mean response of CMIP5 climate models. Based on these results, New Zealand ring widths are reliable indicators of regional volcanic climate response.
More broadly, the findings of this study have important implications for the development of future tree-ring or multiproxy hemispheric temperature reconstructions from the Southern Hemisphere, which often incorporate species-specific “master” chronologies (i.e. composite chronologies developed from across many sites) into their predictor pool. As shown in this study, the compositing process can result in reduced volcanic signals when more than one type of response (i.e. positive, negative, or neutral) is recorded by a single species. However, as most New Zealand species-level composites show significant volcanic responses, temperature reconstructions based on composite chronologies should also show the influence of volcanic eruptions.
All data and software used in this study are publicly available. The New Zealand “seven-station” temperature series was downloaded from NIWA at https://niwa.co.nz/seven-stations (last access: 4 July 2021; NIWA Research, 2021). The Southern Oscillation Index time series was sourced from https://climatedataguide.ucar.edu/climate-data/southern-oscillation-indices-signal-noise-and-tahitidarwin-slp-soi (last access: 7 August 2021; Trenberth and National Center for Atmospheric Research Staff, 1984). The raw tree-ring width series can be downloaded from the International Tree Ring Data Bank at https://www.ncei.noaa.gov/products/paleoclimatology/tree-ring (last access: 13 March 2021; NCEI, 2022). Superposed epoch analysis was undertaken using R code published on Mendeley Datasets with https://doi.org/10.17632/8p7y29hz5h.1 (Rao et al., 2019a). The two new temperature reconstruction series can be accessed through the NOAA/World Data Service for Paleoclimatology archives (https://www.ncdc.noaa.gov (last access: 6 February 2022; NOAA, 2022).
The supplement related to this article is available online at: https://doi.org/10.5194/cp-18-1169-2022-supplement.
PAH and JGP conceptualised this study, JGP curated the data, and PAH undertook the analysis. PAH wrote the manuscript with contributions from all authors.
The contact author has declared that neither they nor their co-authors have any competing interests.
Publisher's note: Copernicus Publications remains neutral with regard to jurisdictional claims in published maps and institutional affiliations.
This article is part of the special issue “Interdisciplinary studies of volcanic impacts on climate and society”. It is not associated with a conference.
We acknowledge the World Climate research Programme's Working Group on Coupled Modelling, which is responsible for CMIP, and we thank the climate modelling groups (listed in Table S4 of this paper) for producing their model output and making it available. The authors thank Kathy Allen, Michael Sigl, and the two anonymous reviewers for their helpful comments that greatly improved this paper.
Philippa A. Higgins is supported by an Australian Government Research Training Scholarship and the UNSW Scientia PhD Scholarship Scheme. Fiona Johnson is supported by the UNSW Scientia Program. Further support was provided by the ARC Centre of Excellence in Australian Biodiversity and Heritage (grant no. CE170100015).
This paper was edited by Michael Sigl and reviewed by two anonymous referees.
Adams, J. B., Mann, M. E., and Ammann, C. M.: Proxy evidence for an El Niño-like response to volcanic forcing, Nature, 426, 274–278, https://doi.org/10.1038/nature02101, 2003.
Allen, K. J.: A Dendroclimatological Investigation of Phyllocladus, University of Tasmania, PhD thesis, 343 pp., 1998.
Allen, K. J., Cook, E. R., Evans, R., Francey, R., Buckley, B. M., Palmer, J. G., Peterson, M. J., and Baker, P. J.: Lack of cool, not warm, extremes distinguishes late 20th Century climate in 979-year Tasmanian summer temperature reconstruction, Environ. Res. Lett., 13, 034041, https://doi.org/10.1088/1748-9326/aaafd7, 2018.
Blake, S. A. P., Palmer, J. G., Björklund, J., Harper, J. B., and Turney, C. S. M.: Palaeoclimate potential of New Zealand Manoao colensoi (silver pine) tree rings using Blue-Intensity (BI), Dendrochronologia, 60, 125664, https://doi.org/10.1016/j.dendro.2020.125664, 2020.
Biondi, F. and Qeadan, F.: Inequality in paleorecords, Ecology, 89, 1056–1067, https://doi.org/10.1890/07-0783.1, 2008.
Boswijk, G., Fowler, A., Lorrey, A., Palmer, J., and Ogden, J.: Extension of the New Zealand kauri (Agathis australis) chronology to 1724 BC, The Holocene, 16, 188–199, https://doi.org/10.1191/0959683606hl919rp, 2006.
Briffa, K. R., Bartholint, T. S., Eckstein, D., Jones, P. D., Karlen, W., Schweingruberll, F. H., and Zetterberg, P.: A 1,400-year tree-ring record of summer temperatures in Fennoscandia, Nature, 346, 434–439, 1990.
Briffa, K. R., Jones, P. D., and Osborn, T. J.: Influence of volcanic eruptions on Northern Hemisphere summer temperature over the past 600 years, Nature, 393, 2–7, 1998.
Buckley, B., Ogden, J., Palmer, J., Fowler, A., and Salinger, J.: Dendroclimatic interpretation of tree-rings in Agathis australis (kauri). 1. Climate correlation functions and master chronology, J. Roy. Soc. New Zeal., 30, 263–276, https://doi.org/10.1080/03014223.2000.9517621, 2000.
Büntgen, U., Arseneault, D., Boucher, É., Churakova (Sidorova), O. V., Gennaretti, F., Crivellaro, A., Hughes, M. K., Kirdyanov, A. V., Klippel, L., Krusic, P. J., Linderholm, H. W., Ljungqvist, F. C., Ludescher, J., McCormick, M., Myglan, V. S., Nicolussi, K., Piermattei, A., Oppenheimer, C., Reinig, F., Sigl, M., Vaganov, E. A., and Esper, J.: Prominent role of volcanism in Common Era climate variability and human history, Dendrochronologia, 64, 125757, https://doi.org/10.1016/j.dendro.2020.125757, 2020.
Büntgen, U., Allen, K., Anchukaitis, K. J., Arseneault, D., Boucher, É., Bräuning, A., Chatterjee, S., Cherubini, P., Churakova (Sidorova), O. V., Corona, C., Gennaretti, F., Grießinger, J., Guillet, S., Guiot, J., Gunnarson, B., Helama, S., Hochreuther, P., Hughes, M. K., Huybers, P., Kirdyanov, A. V., Krusic, P. J., Ludescher, J., Meier, W. J. H., Myglan, V. S., Nicolussi, K., Oppenheimer, C., Reinig, F., Salzer, M. W., Seftigen, K., Stine, A. R., Stoffel, M., St. George, S., Tejedor, E., Trevino, A., Trouet, V., Wang, J., Wilson, R., Yang, B., Xu, G., and Esper, J.: The influence of decision-making in tree ring-based climate reconstructions, Nat. Commun., 12, 3411, https://doi.org/10.1038/s41467-021-23627-6, 2021.
Christiansen, B.: Volcanic eruptions, large-scale modes in the Northern Hemisphere, and the El Niño-Southern Oscillation, J. Climate, 21, 910–922, https://doi.org/10.1175/2007JCLI1657.1, 2008.
Cook, E. R. and Kairiukstis, L. A. (Eds.): Methods of dendrochronology: applications in the environmental sciences, Kluwer Academic Publishers, Amsterdam, 394 pp., https://doi.org/10.2307/1551446, 1990.
Cook, E. R., Bird, T., Peterson, M., Barbetti, M., Buckley, B., D'Arrigo, R., and Francey, R.: Climatic change over the last millennium in Tasmania reconstructed from tree-rings, Holocene, 2, 205–217, https://doi.org/10.1177/095968369200200302, 1992.
Cook, E. R., Meko, D. M., Stahle, D. W., and Cleaveland, M. K.: Drought reconstructions for the continental United States, J. Climate, 12, 1145–1163, https://doi.org/10.1175/1520-0442(1999)012<1145:drftcu>2.0.co;2, 1999.
Cook, E. R., Palmer, J. G., Cook, B. I., Hogg, A., and D'Arrigo, R. D.: A multi-millennial palaeoclimatic resource from Lagarostrobos colensoi tree-rings at Oroko Swamp, New Zealand, Global Planet. Change, 33, 209–220, https://doi.org/10.1016/S0921-8181(02)00078-4, 2002.
Cook, E. R., Seager, R., Cane, M. A., and Stahle, D. W.: North American drought: Reconstructions, causes, and consequences, Earth-Sci. Rev., 81, 93–134, https://doi.org/10.1016/j.earscirev.2006.12.002, 2007.
Cook, E. R., Seager, R., Heim, R. R., Vose, R. S., Herweijer, C., and Woodhouse, C.: Megadroughts in North America: Placing IPCC projections of hydroclimatic change in a long-term palaeoclimate context, J. Quaternary Sci., 25, 48–61, https://doi.org/10.1002/jqs.1303, 2010.
Cropper, J. P. and Fritts, H. C.: Tree-ring width chronologies from the North American Arctic, Arctic Alpine Res., 13, 245–260, https://doi.org/10.2307/1551032, 1981.
Crowley, T. J. and Unterman, M. B.: Technical details concerning development of a 1200 yr proxy index for global volcanism, Earth Syst. Sci. Data, 5, 187–197, https://doi.org/10.5194/essd-5-187-2013, 2013.
D’Arrigo, R. D., Buckley, B. M., Cook, E. R., and Wagner, W. S.: Temperature-sensitive tree-ring width chronologies of pink pine (Halocarpus biformis) from Stewart Island, New Zealand, Palaeogeogr. Palaeoclimatol. Palaeoecol., 119, 293–300, https://doi.org/10.1016/0031-0182(95)00014-3, 1996.
D’Arrigo, R. D., Cook, E. R., Salinger, M. J., Palmer, J., Krusic, P. J., Buckley, B. M., and Villalba, R.: Tree-ring records from New Zealand: Long-term context for recent warming trend, Clim. Dynam., 14, 191–199, https://doi.org/10.1007/s003820050217, 1998.
D'Arrigo, R., Wilson, R., and Tudhope, A.: The impact of volcanic forcing on tropical temperatures during the past four centuries, Nat. Geosci., 2, 51–56, https://doi.org/10.1038/ngeo393, 2009.
D'Arrigo, R., Wilson, R., and Anchukaitis, K. J.: Volcanic cooling signal in tree ring temperature records for the past millennium, J. Geophys. Res.-Atmos., 118, 9000–9010, https://doi.org/10.1002/jgrd.50692, 2013.
Dang, H., Jiang, M., Zhang, Q., and Zhang, Y.: Growth responses of subalpine fir (Abies fargesii) to climate variability in the Qinling Mountain, China, Forest Ecol. Manag., 240, 143–150, https://doi.org/10.1016/j.foreco.2006.12.021, 2007.
Dee, S. G., Cobb, K. M., Emile-geay, J., Ault, T. R., Edwards, R. L., Cheng, H., and Charles, C. D.: No consistent ENSO response to volcanic forcing over the last millennium, Science, 367, 1477–1481, 2020.
Ding, C. and He, X.: K-means Clustering via Principal Component Analysis, in: Proceedings of the 21st International Conference on Machine Learning, Banff, Alberta, Canada, 4–8 July 2004, 29–38, 2004.
Duncan, R. P., Fenwick, P., Palmer, J. G., McGlone, M. S., and Turney, C. S. M.: Non-uniform interhemispheric temperature trends over the past 550 years, Clim. Dynam., 35, 1429–1438, https://doi.org/10.1007/s00382-010-0794-2, 2010.
Dunwiddie, P. W.: Dendrochronological studies of indigenous New Zealand trees, New Zeal. J. Bot., 17, 251–266, https://doi.org/10.1080/0028825X.1979.10426899, 1979.
Emile-Geay, J., Seager, R., Cane, M. A., Cook, E. R., and Haug, G. H.: Volcanoes and ENSO over the past millennium, J. Climate, 21, 3134–3148, https://doi.org/10.1175/2007JCLI1884.1, 2008.
Esper, J., Schneider, L., Krusic, P. J., Luterbacher, J., Büntgen, U., Timonen, M., Sirocko, F., and Zorita, E.: European summer temperature response to annually dated volcanic eruptions over the past nine centuries, B. Volcanol., 75, 1–14, https://doi.org/10.1007/s00445-013-0736-z, 2013.
Fatichi, S., Pappas, C., Zscheischler, J., and Leuzinger, S.: Modelling carbon sources and sinks in terrestrial vegetation, New Phytol., 221, 652–668, https://doi.org/10.1111/nph.15451, 2019.
Fenwick, P.: Reconstruction of past climates using pink pine (Halocarpus biformus) tree-ring chronologies, Lincoln University, PhD thesis, 2003.
Fowler, A. M., Palmer, J., Salinger, J., and Ogden, J.: Dendroclimatic interpretation of tree-rings in Agathis australis (kauri): 2. Evidence of a significant relationship with ENSO, J. Roy. Soc. New Zeal., 30, 277–292, https://doi.org/10.1080/03014223.2000.9517622, 2000.
Fowler, A. M., Lorrey, A., and Crossley, P.: Seasonal growth characteristics of kauri, Tree-Ring Res., 61, 3–19, https://doi.org/10.3959/1536-1098-61.1.3, 2005.
Fowler, A. M., Boswijk, G., Gergis, J., and Lorrey, A.: ENSO history recorded in Agathis australis (kauri) tree rings. Part A: kauri's potential as an ENSO proxy, Int. J. Climatol., 28, 1–20, https://doi.org/10.1002/joc.1525, 2008.
Fritts, H. C.: Tree Rings and Climate, Academic Press, 582 pp., ISBN 978-0122684500, 1976.
Gao, C., Robock, A., and Ammann, C.: Volcanic forcing of climate over the past 1500 years: An improved ice core-based index for climate models, J. Geophys. Res.-Atmos., 113, D23111, https://doi.org/10.1029/2008JD010239, 2008.
Garrison, C. S., Kilburn, C. R. J., and Edwards, S. J.: The 1831 eruption of Babuyan Claro that never happened: has the source of one of the largest volcanic climate forcing events of the nineteenth century been misattributed?, J. Appl. Volcanol., 7, 8, https://doi.org/10.1186/s13617-018-0078-9, 2018.
Grime, J. P.: Plant Strategies and Vegetation Processes, John Wiley & Sons, Ltd., Chichester-New York-Brisbane-Toronto, 222 pp., ISBN 978047199695, 1979.
Grissino-Mayer, H. D.: Evaluating Crossdating Accuracy: A Manual and Tutorial for the Computer Program COFECHA, Tree-Ring Res., 57, 205–221, 2001.
Gu, L., Baldocchi, D. D., Wofsy, S. C., William Munger, J., Michalsky, J. J., Urbanski, S. P., and Boden, T. A.: Response of a deciduous forest to the Mount Pinatubo eruption: Enhanced photosynthesis, Science, 299, 2035–2038, https://doi.org/10.1126/science.1078366, 2003.
Harper, J. L.: Population biology of plants, Academic Press, New York, 892 pp., ISBN 9780123258502, 1977.
Haurwitz, M. W. and Brier, G. W.: A Critique of the Superposed Epoch Analysis Method: Its Application to Solar-Weather Relations, Mon. Weather Rev., 109, 2074–2079, 1981.
Holmes, R. L.: Computer-Assisted Quality Control in Tree-Ring Dating and Measurement, Tree-Ring Bulletin, 43, 69–78, 1983.
Iles, C. E., Hegerl, G. C., Schurer, A. P., and Zhang, X.: The effect of volcanic eruptions on global precipitation, J. Geophys. Res.-Atmos., 118, 8770–8786, https://doi.org/10.1002/jgrd.50678, 2013.
Khodri, M., Izumo, T., Vialard, J., Janicot, S., Cassou, C., Lengaigne, M., Mignot, J., Gastineau, G., Guilyardi, E., Lebas, N., Robock, A., and McPhaden, M. J.: Tropical explosive volcanic eruptions can trigger El Ninõ by cooling tropical Africa, Nat. Commun., 8, 1–12, https://doi.org/10.1038/s41467-017-00755-6, 2017.
Krakauer, N. Y. and Randerson, J. T.: Do volcanic eruptions enhance or diminish net primary production? Evidence from tree rings, Global Biogeochem. Cy., 17, 1118, https://doi.org/10.1029/2003gb002076, 2003.
LaMarche, V. C., Holmes, R. L., Dunwiddie, P. W., and Drew, L. G.: Tree-ring chronologies of the Southern Hemisphere 3. New Zealand, Laboratory of Tree-Ring Research, University of Arizona, Tucson, Arizona, 1979.
Manson, B. R.: The life history of silver beech (Nothofagus menziesii), Proc. New Zeal. Ecol. Soc., 21, 27–31, 1974.
McGlone, M. S., Richardson, S. J., Burge, O. R., Perry, G. L. W., and Wilmshurst, J. M.: Palynology and the ecology of the New Zealand conifers, Front. Earth Sci., 5, 1–23, https://doi.org/10.3389/feart.2017.00094, 2017.
McGregor, S., Timmermann, A., and Timm, O.: A unified proxy for ENSO and PDO variability since 1650, Clim. Past, 6, 1–17, https://doi.org/10.5194/cp-6-1-2010, 2010.
Melvin, T. M. and Briffa, K. R.: A “signal-free” approach to dendroclimatic standardisation, Dendrochronologia, 26, 71–86, https://doi.org/10.1016/j.dendro.2007.12.001, 2008.
Miao, J., Wang, T., Wang, H., and Sun, J.: Interannual Weakening of the Tropical Pacific Walker Circulation Due to Strong Tropical Volcanism, Adv. Atmos. Sci., 35, 645–658, https://doi.org/10.1007/s00376-017-7134-y, 2018.
Mullan, B.: Applying the Rhoades and Salinger Method to New Zealand's “Seven-Station” Temperature Series, Weather Clim., 32, 23, https://doi.org/10.2307/26169723, 2012.
NCEI: International Tree Ring Data Bank, NCEI, https://www.ncei.noaa.gov/products/paleoclimatology/tree-ring, last access: 13 March 2022.
Neukom, R., Gergis, J., Karoly, D. J., Wanner, H., Curran, M., Elbert, J., González-Rouco, F., Linsley, B. K., Moy, A. D., Mundo, I., Raible, C. C., Steig, E. J., van Ommen, T., Vance, T., Villalba, R., Zinke, J., and Frank, D.: Inter-hemispheric temperature variability over the past millennium, Nat. Clim. Change, 4, 362–367, https://doi.org/10.1038/nclimate2174, 2014.
Neukom, R., Schurer, A. P., Steiger, N. J., and Hegerl, G. C.: Possible causes of data model discrepancy in the temperature history of the last Millennium, Sci. Rep.-UK, 8, 1–15, https://doi.org/10.1038/s41598-018-25862-2, 2018.
NIWA (National Institute of Water and Atmospheric) Research: 'Seven station' series temperature data, NIWA climate archive [data set], Wellington, New Zealand, https://niwa.co.nz/seven-stations, last access: 4 July 2021 (updated regularly).
NOAA: World Data Service for Paleoclimatology archives, NOAA, https://www.ncdc.noaa.gov, last access: 6 February 2022.
Norton, D. A.: Modern New Zealand Tree-Ring Chronologies I. Nothofagus solandri, Tree-Ring Bulletin, 43, 39–49, 1983a.
Norton, D. A.: Modern New Zealand Tree-Ring Chronologies II. Nothofagus meziesii, Tree-Ring Bulletin, 43, 31–38, 1983b.
Norton, D. A.: Tree-growth-climate relationships in subalpine Nothofagus forests, South Island, New Zealand, New Zeal. J. Bot., 22, 471–481, https://doi.org/10.1080/0028825X.1984.10425281, 1984.
Norton, D. A.: New Zealand Temperatures, 1800–30, in: The Year without a summer?: World climate in 1816, edited by: Harington, C. R., Canadian Museum of Nature, 516–520, ISBN 978-0660130637, 1992.
Norton, D. A. and Kelly, D.: Mast Seeding Over 33 Years by Dacrydium cupressinum Lamb. (rimu) (Podocarpaceae) in New Zealand: The Importance of Economies of Scale, Funct. Ecol., 2, 399, https://doi.org/10.2307/2389413, 1988.
Norton, D. A. and Ogden, J.: Dendrochronology: a review with emphasis on New Zealand applications, New Zeal. J. Ecol., 10, 77–95, 1987.
Norton, D. A., Briffa, K. R., and Salinger, M. J.: Reconstruction of New Zealand summer temperatures to 1730 AD using dendroclimatic techniques, Int. J. Climatol., 9, 633–644, https://doi.org/10.1002/joc.3370090607, 1989.
Ogden, J. and Ahmed, M.: Climate response function analyses of kauri (Agathis australis) tree-ring chronologies in northern New Zealand, J. Roy. Soc. New Zeal., 19, 205–221, https://doi.org/10.1080/03036758.1989.10426449, 1989.
Ogden, J. and Dunwiddie, P. W.: Australasia, in: Climate from tree rings, edited by: Hughes, M. K., Kelly, P. M., Pilcher, J. R., and LaMarche Jr., V. C., Cambridge University Press, Cambridge, 90–104, IBSN: 978-0521242912, 1982.
Palmer, J. G.: A dendroclimatic study of tanekaha (Phyllocladus trichomanoides), University of Aukland, PhD thesis, 1989.
Palmer, J. G. and Ogden, J.: A dendrometer band study of the seasonal pattern of radial increment in kauri (Agathis australis), New Zeal. J. Bot., 21, 121–125, https://doi.org/10.1080/0028825X.1983.10428535, 1983.
Palmer, J. G. and Ogden, J.: Tree-Ring Chronologies from Endemic Australian and New Zealand Conifers 1800-30, in: The Year without a summer?: World climate in 1816, edited by: Harington, C. R., Canadian Museum of Nature, Ottawa, 510–515, 1992.
Palmer, J. G. and Xiong, L.: New Zealand climate over the last 500 years reconstructed from Libocedrus bidwillii Hook. f. tree-ring chronologies, The Holocene, 14, 282–289, https://doi.org/10.1191/0959683604hl679rr, 2004.
Palmer, J. G., Lorrey, A., Turney, C. S. M., Hogg, A., Baillie, M., Fifield, K., and Ogden, J.: Extension of New Zealand kauri (Agathis australis) tree-ring chronologies into Oxygen Isotope Stage (OIS) 3, J. Quaternary Sci., 21, 779–787, https://doi.org/10.1002/jqs.1075, 2006.
Palmer, J. G., Cook, E. R., Turney, C. S. M., Allen, K., Fenwick, P., Cook, B. I., O'Donnell, A., Lough, J., Grierson, P., and Baker, P.: Drought variability in the eastern Australia and New Zealand summer drought atlas (ANZDA, CE 1500-2012) modulated by the Interdecadal Pacific Oscillation, Environ. Res. Lett., 10, 124002, https://doi.org/10.1088/1748-9326/10/12/124002, 2015.
Phipps, R.: Comments on interpretation of climatic information from tree rings, eastern North America, Tree Ring Bull., 42, 11–22, 1982.
Pieper, H., Heinrich, I., Heußner, K. U., and Helle, G.: The influence of volcanic eruptions on growth of central European lowland trees in NE-Germany during the last millennium, Palaeogeogr. Palaeoclim., 411, 155–166, https://doi.org/10.1016/j.palaeo.2014.06.012, 2014.
Raible, C. C., Brönnimann, S., Auchmann, R., Brohan, P., Frölicher, T. L., Graf, H. F., Jones, P., Luterbacher, J., Muthers, S., Neukom, R., Robock, A., Self, S., Sudrajat, A., Timmreck, C., and Wegmann, M.: Tambora 1815 as a test case for high impact volcanic eruptions: Earth system effects, WIREs Clim. Change, 7, 569–589, https://doi.org/10.1002/wcc.407, 2016.
Rao, M., Cook, E., Cook, B., Anchukaitis, K., D'Arrigo, R., Krusic, P., and LeGrande, A.: “Data for: A double bootstrap approach to Superposed Epoch Analysis to evaluate response uncertainty”, V1 Mendeley Data [data set], https://doi.org/10.17632/8p7y29hz5h.1, 2019a.
Rao, M. P., Cook, E. R., Cook, B. I., Anchukaitis, K. J., D'Arrigo, R. D., Krusic, P. J., and LeGrande, A. N.: A double bootstrap approach to Superposed Epoch Analysis to evaluate response uncertainty, Dendrochronologia, 55, 119–124, https://doi.org/10.1016/j.dendro.2019.05.001, 2019b.
Robock, A.: Cooling following large volcanic eruptions corrected for the effect of diffuse radiation on tree rings, Geophys. Res. Lett., 32, 1–4, https://doi.org/10.1029/2004GL022116, 2005.
Rozas, V., García-González, I., Pérez-De-Lis, G., and Arévalo, J. R.: Local and large-scale climatic factors controlling tree-ring growth of Pinus canariensis on an oceanic island, Clim. Res., 56, 197–207, https://doi.org/10.3354/cr01158, 2013.
Salinger, M. J.: New Zealand Climate: 1. Precipitation Patterns, Mon. Weather Rev., 108, 1892–1904, 1980.
Salinger, M. J.: New Zealand Climate: The instrumental record, Victoria University of Wellington, Wellington, New Zealand, 357 pp., 1981.
Salinger, M. J.: New Zealand Climate: The Impact of Major Volcanic Eruptions, Weather Clim., 18, 11–19, 1998.
Salinger, M. J., Palmer, J. G., Jones, P. D., and Briffa, K. R.: Reconstruction of New Zealand climate indices back to AD 1731 using dendroclimatic techniques: Some preliminary results, Int. J. Climatol., 14, 1135–1149, https://doi.org/10.1002/joc.3370141005, 1994.
Santoso, A., Mcphaden, M. J., and Cai, W.: The Defining Characteristics of ENSO Extremes and the Strong 2015/2016 El Niño, Rev. Geophys., 55, 1079–1129, https://doi.org/10.1002/2017RG000560, 2017.
Scuderi, L. A.: Tree-ring evidence for climatically effective volcanic eruptions, Quaternary Res., 34, 67–85, https://doi.org/10.1016/0033-5894(90)90073-T, 1990.
Sigl, M., McConnell, J. R., Toohey, M., Curran, M., Das, S. B., Edwards, R., Isaksson, E., Kawamura, K., Kipfstuhl, S., Krüger, K., Layman, L., Maselli, O. J., Motizuki, Y., Motoyama, H., Pasteris, D. R., and Severi, M.: Insights from Antarctica on volcanic forcing during the Common Era, Nat. Clim. Change, 4, 693–697, 2014.
Sigl, M., Winstrup, M., McConnell, J. R., Welten, K. C., Plunkett, G., Ludlow, F., Büntgen, U., Caffee, M., Chellman, N., Dahl-Jensen, D., Fischer, H., Kipfstuhl, S., Kostick, C., Maselli, O. J., Mekhaldi, F., Mulvaney, R., Muscheler, R., Pasteris, D. R., Pilcher, J. R., Salzer, M., Schüpbach, S., Steffensen, J. P., Vinther, B. M., and Woodruff, T. E.: Timing and climate forcing of volcanic eruptions for the past 2,500 years, Nature, 523, 543–549, 2015.
Stewart, G. H.: Structure and canopy tree species regeneration requirements in indigenous forests, Westland, New Zealand, Department of Conservation, Wellington, New Zealand, Doc Science Internal Series 66, 1–33, 2002.
Tejedor, E., Steiger, N., Smerdon, J. E., Serrano-Notivoli, R., and Vuille, M.: Global Temperature Responses to Large Tropical Volcanic Eruptions in Paleo Data Assimilation Products and Climate Model Simulations Over the Last Millennium, Paleoceanogr. Paleocl., 36, 1–17, https://doi.org/10.1029/2020PA004128, 2021.
Timmreck, C., Toohey, M., Zanchettin, D., Brönnimann, S., Lundstad, E., and Wilson, R.: The unidentified eruption of 1809: a climatic cold case, Clim. Past, 17, 1455–1482, https://doi.org/10.5194/cp-17-1455-2021, 2021.
Tingley, M. P., Stine, A. R., and Huybers, P.: Temperature reconstructions from tree-ring densities overestimate volcanic cooling, Geophys. Res. Lett., 41, 7838–7845, https://doi.org/10.1002/2014GL061268, 2014.
Toohey, M. and Sigl, M.: Volcanic stratospheric sulfur injections and aerosol optical depth from 500 BCE to 1900 CE, Earth Syst. Sci. Data, 9, 809–831, https://doi.org/10.5194/essd-9-809-2017, 2017.
Toohey, M., Stevens, B., Schmidt, H., and Timmreck, C.: Easy Volcanic Aerosol (EVA v1.0): an idealized forcing generator for climate simulations, Geosci. Model Dev., 9, 4049–4070, https://doi.org/10.5194/gmd-9-4049-2016, 2016.
Trenberth, K. and National Center for Atmospheric Research Staff (Eds.): SOI Data, Climate Analysis Section [data set], NCAR, Boulder, USA, https://climatedataguide.ucar.edu/climate-data/southern-oscillation-indices-signal-noise-and-tahitidarwin- slp-soi (last access: 7 August 2021), 1984 (updated regularly).
Villalba, R. and Boninsegna, J. A.: Changes in Southern South American Tree-Ring Chronologies following Major Volcanic Eruptions between 1750-1970, in: The Year without a summer?: World climate in 1816, edited by: Harington, C. R., Canadian Museum of Nature, Ottawa, 493–509, 1992.
Wardle, J.: The ecology of Nothofagus solandri, New Zealand, New Zeal. J. Bot., 8, 609–646, https://doi.org/10.1080/0028825X.1970.10430162, 1970.
Wardle, P.: Plant communities of Westland National Park (New Zealand) and neighbouring lowland and coastal areas, New Zeal. J. Bot., 15, 323–398, https://doi.org/10.1080/0028825X.1977.10432549, 1977.
Wilson, R., Anchukaitis, K., Briffa, K. R., Büntgen, U., Cook, E., D'Arrigo, R., Davi, N., Esper, J., Frank, D., Gunnarson, B., Hegerl, G., Helama, S., Klesse, S., Krusic, P. J., Linderholm, H. W., Myglan, V., Osborn, T. J., Rydval, M., Schneider, L., Schurer, A., Wiles, G., Zhang, P., and Zorita, E.: Last millennium Northern Hemisphere summer temperatures from tree rings: Part I: The long term context, Quaternary Sci. Rev., 134, 1–18, https://doi.org/10.1016/j.quascirev.2015.12.005, 2016.
Xiong, L. and Palmer, J. G.: Libocedrus Bidwillii Tree-ring Chronologies in New Zealand, Tree-Ring Bulletin, 56, 1–16, 2000.
Xiong, L., Okada, N., Fujiwara, T., Ohta, S., and Palmer, J. G.: Chronology development and climate response analysis of different New Zealand pink pine (Halocarpus biformis) tree-ring parameters, Can. J. Forest Res., 28, 566–573, https://doi.org/10.1139/cjfr-28-4-566, 1998.
Zhu, F., Emile-Geay, J., Hakim, G. J., King, J., and Anchukaitis, K. J.: Resolving the Differences in the Simulated and Reconstructed Temperature Response to Volcanism, Geophys. Res. Lett., 47, 1–12, https://doi.org/10.1029/2019GL086908, 2020.
Zweifel, R., Sterck, F., Braun, S., Buchmann, N., Eugster, W., Gessler, A., Häni, M., Peters, R. L., Walthert, L., Wilhelm, M., Ziemińska, K., and Etzold, S.: Why trees grow at night, New Phytol., 231, 2174–2185, https://doi.org/10.1111/nph.17552, 2021.