the Creative Commons Attribution 4.0 License.
the Creative Commons Attribution 4.0 License.
 | 11 Mar 2021
Simulation of ash clouds after a Laacher See-type eruption
Ulrike Niemeier
Felix Riede
Claudia Timmreck
Dated to approximately 13 000 years ago, the Laacher See (East Eifel volcanic zone) eruption was one of the largest midlatitude Northern Hemisphere volcanic events of the Late Pleistocene. This eruptive event not only impacted local environments and human communities but probably also affected Northern Hemispheric climate. To better understand the impact of a Laacher See-type eruption on NH circulation and climate, we have simulated the evolution of its fine ash and sulfur cloud with an interactive stratospheric aerosol model. Our experiments are based around a central estimate for the Laacher See aerosol cloud of 15 Tg of sulfur dioxide (SO2) and 150 Tg of fine ash, across the main eruptive phases in May and a smaller one in June with 5 Tg SO2 and 50 Tg of fine ash. Additional sensitivity experiments reflect the estimated range of uncertainty of the injection rate and altitude and assess how the solar-absorptive heating from the fine ash emitted in the first eruptive phase changed the volcanic clouds' dispersion. The chosen eruption dates were determined by the stratospheric wind fields to reflect the empirically observed ash lobes as derived from geological, paleoecological and archeological evidence linked directly to the prehistoric Laacher See eruption. Whilst our simulations are based on present-day conditions, and we do not seek to replicate the climate conditions that prevailed 13 000 years ago, we consider our experimental design to be a reasonable approximation of the transport pathways in the midlatitude stratosphere at this time of year. Our simulations suggest that the heating of the ash plays an important role for the transport of ash and sulfate. Depending on the altitude of the injection, the simulated volcanic cloud begins to rotate 1 to 3 d after the eruption. This mesocyclone, as well as the additional radiative heating of the fine ash, then changes the dispersion of the cloud itself to be more southward compared to dispersal estimated without fine ash heating. This ash-cloud-generated southerly migration process may at least partially explain why, as yet, no Laacher See tephra has been found in Greenland ice cores. Sulfate transport is similarly impacted by the heating of the ash, resulting in stronger transport to low latitudes, later arrival of the volcanic cloud in the Arctic regions and a longer lifetime compared to cases without injection of fine ash. Our study offers new insights into the dispersion of volcanic clouds in midlatitudes and addresses a likely behavior of the ash cloud of the Laacher See eruption that darkened European skies at the end of the Pleistocene. In turn, this study can also serve as significant input for scenarios that consider the risks associated with re-awakened volcanism in the Eifel.
- Article
(12016 KB) - Full-text XML
-
Supplement
(2291 KB) - BibTeX
- EndNote


The very large magnitude explosive eruption of the Laacher See volcano (LSE), Volcanic Explosivity Index 6, dated to approximately 13 000 years ago (13 kyr before present (BP); Reinig et al., 2020), marked the end of explosive volcanism in the now dormant East Eifel volcanic zone (Germany). It was amongst the largest Late Pleistocene volcanic events in the Northern Hemisphere (NH) and has previously been suggested to have temporarily impacted not only local environments (Baales et al., 2002) but also regional NH climate (Graf and Timmreck, 2001), as well as human communities even at some distance, e.g., in southern Scandinavia (Riede, 2008; Blong et al., 2018). It has also been suggested repeatedly – most recently by Baldini et al. (2018) – that the eruption may in fact be implicated in the onset of the Greenland Stadial 1 cold spell that significantly interrupted the general warming trend of the last glacial–interglacial transition and which led to the Younger Dryas ecological deterioration. The latter hypothesis is contested, however, due to uncertainties related to the dating of the LSE itself (see Bronk Ramsey et al., 2015; Reinig et al., 2020; Svensson et al., 2020) and the difficulty of linking this eruption conclusively to the Greenlandic ice cores (e.g., Abbott and Davies, 2012), where a clear chemical signal or actual tephra shards from this eruption remain unclear.
Rather detailed reconstructions of the Laacher See eruption dynamics have been proposed (e.g., Schmincke et al., 1999; van den Bogaard and Schmincke, 1985; Schmincke, 2010). The eruption might have lasted several weeks and possibly even months, most likely with an initial short (about 10 h) and intense phase (Lower Laacher See tephra; LLST), followed by a later explosive phase (Middle Laacher See tephra C; MLST-C) interspersed with and followed by eruption activity of varying intensity. Finds of plant macrofossils and animal tracks embedded in the proximal fallout of the eruption have revealed some important details: finds of leaves and the tracks left by young animals indicate a late spring/early summer date of the eruption (Baales et al., 2002); this seasonal determination is supported by highly resolved paleoecological observations in, for instance, varved lake sediments that indicate fallout ash deposition after the formation of the winter layer but also prior to the deposition of sediments associated with summer (e.g., Merkt and Müller, 1999; Hajdas et al., 1995). The same animal prints also suggest that the eruption lasted long enough and was characterized by at least some subdued phases for rain to fall and for animals to make their way through the ash-covered landscape. The distal ash distribution is also interesting in this regard. The LSE shows an unusual, two-lobed pattern (Fig. 1) with deposits belonging to a massive primary lobe stretching over northeast Germany and the Baltic Sea towards northwest Russia, and a secondary lobe leaving deposits to the south of the volcano towards the Alps (Riede et al., 2011; Reinig et al., 2020). This two-lobed fallout distribution also suggests that (i) the eruption phases were of very different intensity with ejecta reaching different heights dominated by different wind directions, and/or that (ii) the duration of the eruption was long enough for the dominant wind directions to shift significantly. The eruptive phases are, following Schmincke (2010), divided into LLST (first Plinian stage) and MLST (A, B, C; second Plinian stage) and a late and generally less explosive Upper Laacher See tephra (ULST). These data are used to constrain the novel simulations presented here.
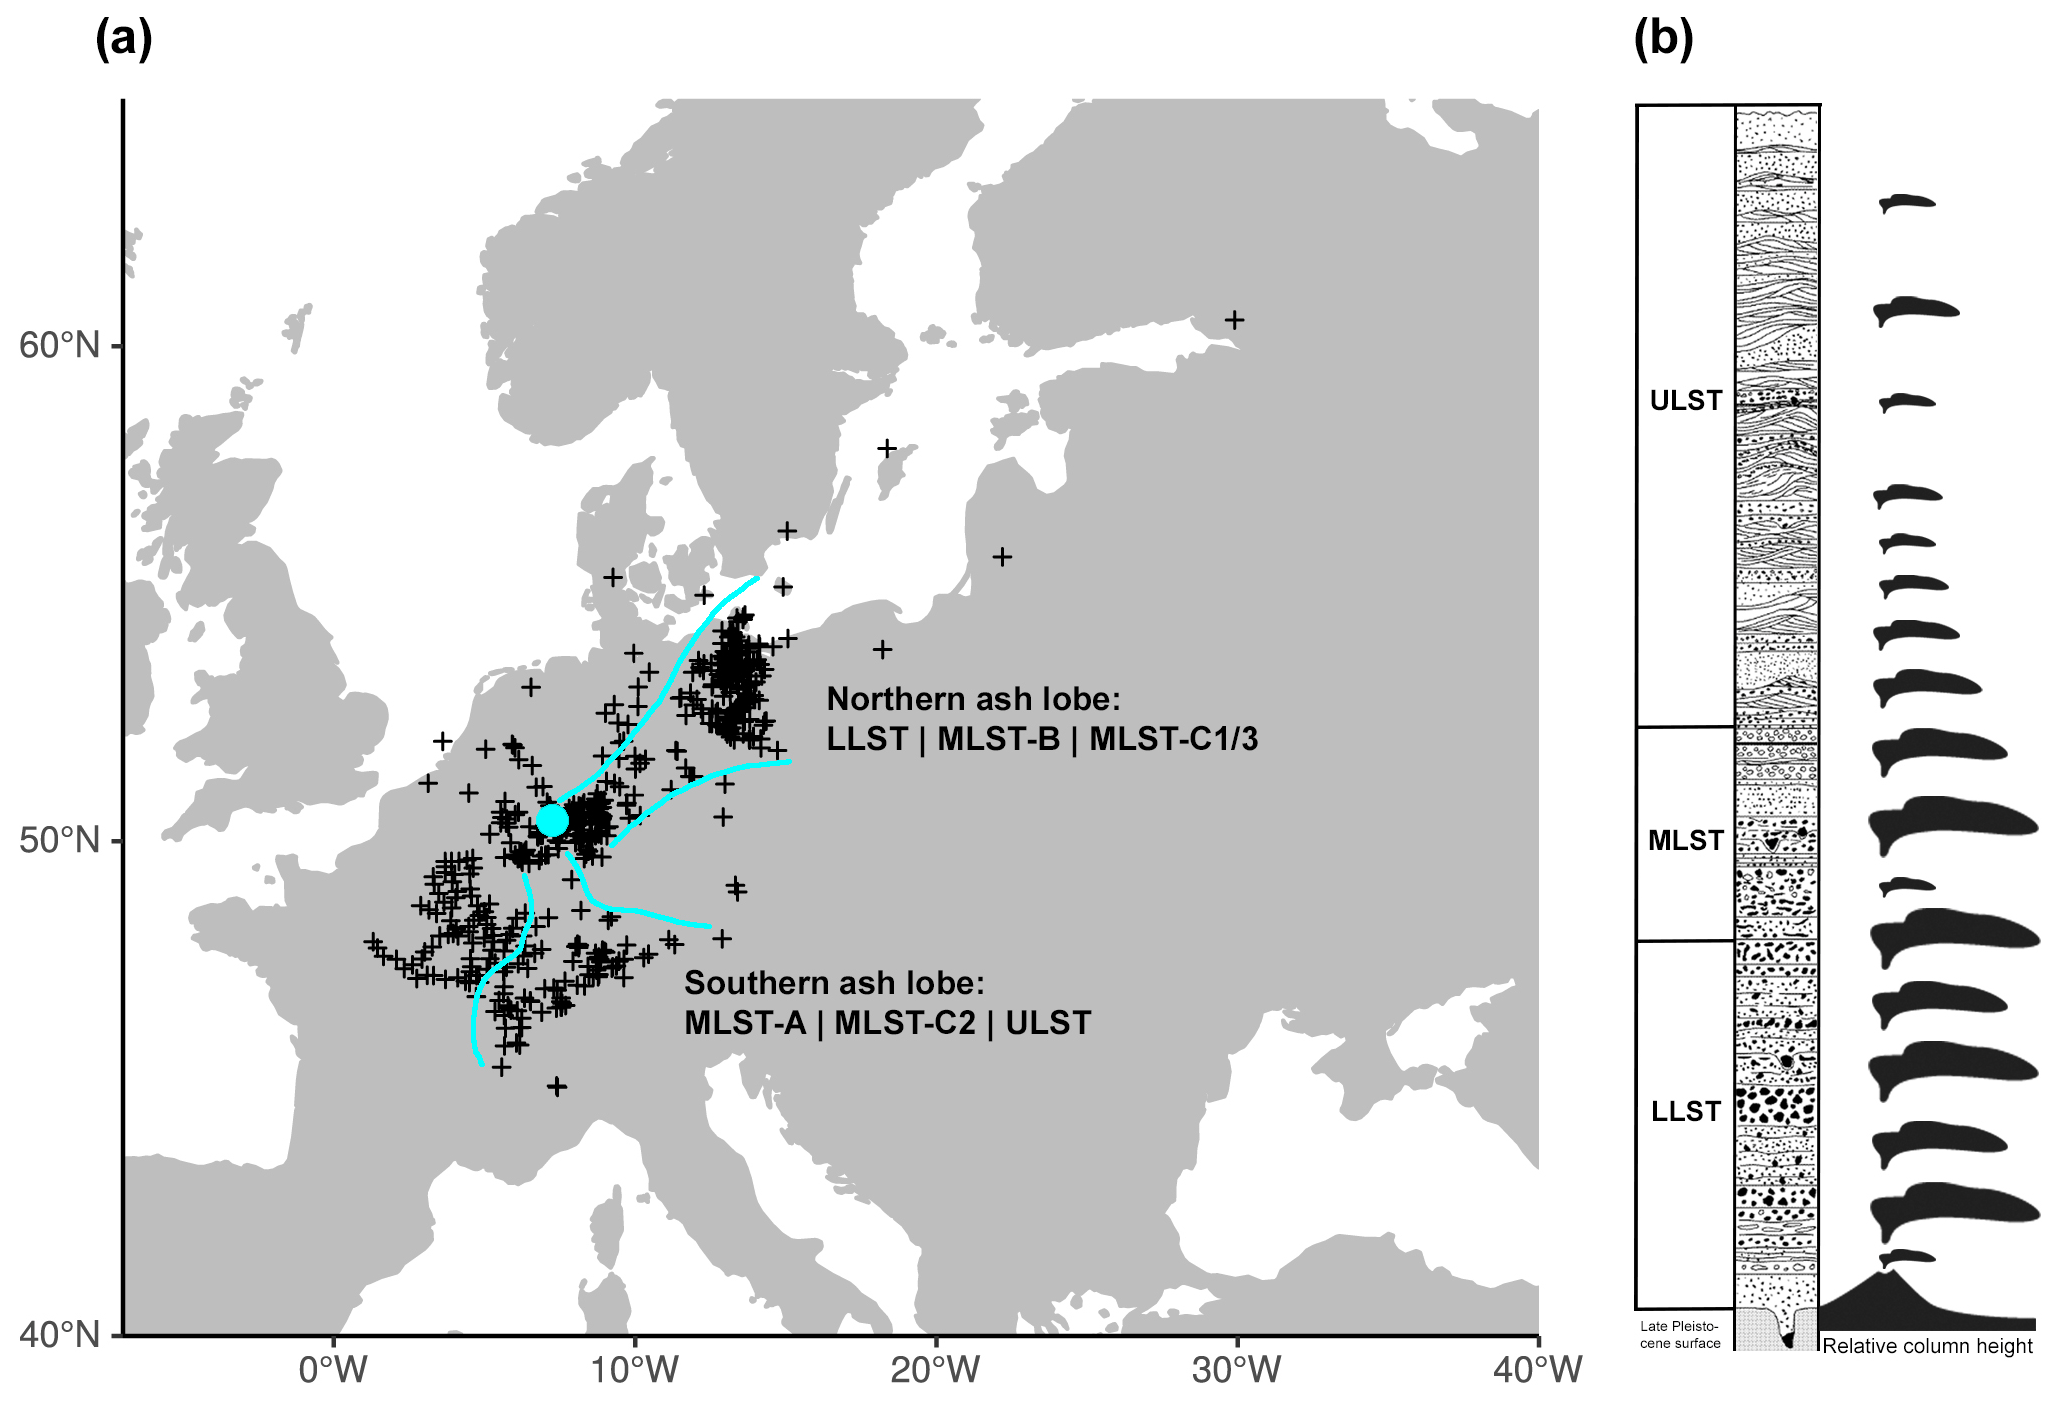
Figure 1(a) The currently known extent of the Laacher See tephra. The cyan circle marks the eruptive center; the cyan lines approximate the main fall-out lobes. Find localities outside of these lobes likely reflect on very minor tephra fall or fluvially deposited ejecta (e.g., along the Rhine river). (b) The stratigraphy of the near-vent Mendig facies (where the MLST is poorly represented, from Harms and Schmincke, 2000) and a schematic of the reconstructed eruption column height, following Schmincke (2004). LLST and MLST-C were the main eruptive phases.
Ash particles are relatively large and sediment quickly out of the stratosphere usually already during the first days after an eruption, although some very fine ash particles can remain in the stratosphere for longer (Vernier et al., 2016). Mossop (1964) showed that after the Mt. Agung eruption only particles with diameters smaller than 0.6 µm stayed about 1 year or longer in the stratosphere. Since the first in situ measurements more than 50 years ago (e.g., Mossop, 1964; Lamb and Sawyer, 1970), fine volcanic ash has been observed with various in situ measurement techniques over the last decades (see, e.g., overview articles by Mackie et al., 2016; Prata, 2016). The volcanic cloud interacts with solar and terrestrial radiation. The ash is heated by absorption of solar radiation, causing an additional vertical updraft (Muser et al., 2020) and may cause the development of a mesocyclone (Baines and Sparks, 2005; Chakraborty et al., 2009; Niemeier et al., 2009; Ungarish et al., 2016). This heating occurs right after the eruption, before the substantial formation of sulfate aerosols. Regionally, the heating can have an impact on the transport of the volcanic cloud in the first 3 weeks after the eruption, but following Niemeier et al. (2009), the impact on global sulfate burden is small in the year after the eruption. Sulfate aerosols absorb terrestrial and near-infrared radiation as well. The consequent heating of the volcanic cloud enhances transport towards the Equator when aerosol–radiation interaction was incorporated into the models (Timmreck and Graf, 2006; Aquila et al., 2012).
Considerable advances in the modeling of volcanically induced climatic forcing of NH midlatitude eruptions have recently been made (Toohey et al., 2019), and these warrant renewed attention to the prehistoric LSE's potential influence on NH climate. The rich volcanological detail associated with this Late Pleistocene eruption facilitates a robust understanding of its interaction with the meteorological conditions shaping its ash and aerosol dispersal. These interactions, in turn, are important for not only addressing the enigmatic absence of this eruption in the ice-core records as well as for unraveling which (if any) climatic effects associated with the eruption may have influenced the human responses observable in the archeological record. These responses range from regional depopulation to migration and cultural fluorescence but it remains contested as to whether the reduction in ecosystem services due to tephra fall or the climatic impacts of the eruption shaped these responses (Riede, 2017; Blong et al., 2018). In addition, recent research is also revisiting the LSE as a model worst-case scenario (cf. Aspinall and Woo, 2019) for considering the damages, costs and surge capacity requirements of contemporary society to a potential Laacher See-type eruption (Leder et al., 2017; Riede, 2017). The practice of using historical eruption data to constrain future emergency planning is well established in municipalities plagued by active volcanism (e.g., Vesuvius; Mastrolorenzo et al., 2006; Zuccaro et al., 2008; Martin, 2020). A number of national governments also use, for instance, Laki-type eruptions to derive so-called “realistic disaster scenarios” (Mazzorana et al., 2009) for the long-range aerosol-mediated impacts of NH volcanism on contemporary societies (Schmidt et al., 2011; Sonnek et al., 2017). Developing robust models for a Laacher See-type eruption and its potential impact would thus not only facilitate a further exploration of the impact of the actual eruption on past communities but also its use as a realistic disaster scenario that addresses the combination of ash- and sulfate-driven impacts as well as critical issues of communication, cross-border coordination, migration and infrastructural damage beyond the proximal impact zone (Donovan and Oppenheimer, 2018).
Against this background and building on much earlier work by Graf and Timmreck (2001), we here present new simulations of a Laacher See-type eruption under present-day climatic conditions. We do not attempt to reconstruct the climatic impact of the LSE itself as it occurred during the Late Pleistocene but draw on available volcanological and paleoecological proxy data to realistically constrain our simulation (Sect. 2). We thus use the prehistoric LSE as a shorthand for a substantial, highly explosive Plinian NH midlatitude (Laacher See-type) eruption. We present significant new insights into ash transport and deposition (Sect. 3.1) as well as the role of fine ash for the transport of sulfate and for the magnitude of climatic forcing associated with such a midlatitude eruption (Sect. 3.2). While our simulations do not attempt to reconstruct the likely climatic impacts of the Late Pleistocene LSE itself, our study does have implications for our understanding of that eruptive event and its socio-ecological consequences.
2.1 Model description
The volcanic aerosol simulations reported here were performed with the middle atmosphere version of the ECHAM general circulation model (GCM) (MAECHAM5; Giorgetta et al., 2006). MAECHAM5 was applied with the spectral truncation at wavenumber 63 (T63), a grid size of about and 95 vertical layers up to 0.01 hPa. The model solves prognostic equations for temperature, surface pressure, vorticity, divergence and phases of water. MAECHAM5 was interactively coupled to the prognostic modal aerosol microphysical Hamburg Aerosol Model (HAM) (Stier et al., 2005), which calculates the sulfate aerosol formation including nucleation, accumulation, condensation and coagulation, as well as its removal processes by sedimentation and deposition. To simulate the evolution of a volcanic cloud, HAM was adapted to a stratospheric version (Niemeier et al., 2009). The initial conversion of SO2 into H2SO4 is simulated with a simple stratospheric sulfur chemistry scheme, which is applied above the tropopause (Timmreck, 2001; Hommel et al., 2011). We prescribe reactive gases (e.g., ozone–O3, nitrogen oxides, hydroxyl radical–OH) and photolysis rates of carbonyl sulfide (OCS), H2SO4, SO2, SO3 and O3 on a monthly mean basis. Therefore, we can parameterize the depletion of OH due to high sulfur load (Mills et al., 2017) only: reduction of OH by 90 % for the first 10 d and by 50 % until 30 d after the eruption. The uptake of SO2 on ash (Zhu et al., 2020) is not included in our simulations. For these simulations, only sulfur sources relevant for stratospheric background concentration were taken into account: dimethyl sulfide (DMS) was emitted (Stier et al., 2005) and OCS concentrations are prescribed at the surface and transported within the model. The stratospheric setup of HAM is described in detail by Niemeier and Timmreck (2015).
Ash particles are relatively large and sediment quickly out of the stratosphere, usually already during the first days after the eruption. We simulate fine ash with one mode only and do not take into account large ash particles that fall out swiftly and usually very close to the eruptive center. For the fine ash mode, we assume a geometric standard deviation of σ=1.8, a density of 2400 kg m−3, a mean radius of m and an effective radius of m, similar to the simulation of the June 1991 Mt. Pinatubo eruption by Niemeier et al. (2009). The direct radiative effect of fine ash and sulfate aerosol is included for both solar (shortwave, SW) and terrestrial (longwave, LW) radiation and coupled to the radiation scheme of ECHAM. The model diagnoses the instantaneous aerosol radiative forcing, via double call to the radiation, once with aerosol and once with an extra diagnostic call without aerosols. The fine ash and sulfate aerosols both heat the stratosphere and thereby dynamically influence the resulting processes via circulation changes caused by absorption of near-infrared and LW radiation. This model has already been successfully applied for the simulation of recent and past large volcanic eruptions (e.g., Niemeier et al., 2009, 2019; Toohey et al., 2016, 2019). However, earlier studies with MAECHAM5-HAM were often performed with a lower horizontal and vertical resolution. The impact of model resolution on the results is discussed in Niemeier and Schmidt (2017) and Niemeier et al. (2020a).
2.2 Simulations
2.2.1 General setup
The simulations were started from a present-day control simulation and lasted for 1.5 years after the eruption. Land–sea mask, sea surface temperature (SST) and sea ice are prescribed for present-day conditions. SST and sea ice are set to climatological values (Hurrell et al., 2008), averaged over the period 1950 to 2000. Although our boundary conditions are not representative of the SST during the Late Pleistocene, we assume that their impact on our results is small especially as the eruption itself almost certainly caused a strong disturbance in the stratospheric flow pattern. By the same token, given that Arctic sea ice cover during the Late Pleistocene differed from today and given that stratospheric dynamics respond to sea ice conditions (Jaiser et al., 2013), it is highly likely that stratospheric conditions also differed. This might also cause the timing of the breakup of the polar vortex to differ from the year these simulations are representing. Consequently, the specific meteorological situation that caused the observed ash lobes could have occurred later in spring than in the model world of our simulations.
2.2.2 Source parameters
The eruption is initialized over the grid box where the Laacher See is located (50.24∘ N, 7.16∘ E). An eruption history of the LSE has been reconstructed and described in detail by Schmincke et al. (1999), whose eruption chronology we follow here for setting the basic emission parameter ranges. The setup of the model experiment ensures that the transport of the ash in the simulations captured the observed two-lobed pattern in the tephra deposits within two distinct eruption phases: firstly, a 10 h long strong explosive eruption phase, corresponding to the LLST, where ash is transported to the northeastward lobe, and a second less substantial 3 h long phase, corresponding to eruption phase MLST-C, depositing ash in the southward direction.
Only limited information exists for determining how much fine ash has to be emitted in the model experiments. In addition, only limited particle size data for the distal Laacher See tephra are available (Riede and Bazely, 2009). These data are heterogeneously generated and not directly comparable to present-day instrumental observations, nor are they representative of the LSE as a whole – and hence not appropriate as modeling input. While comparable in Volcanic Explosivity Index (Newhall and Self, 1982), the calculated magnitude of the LSE (M=6.2) is slightly greater than the 1991 Mt. Pinatubo eruption (M=6). Textor et al. (2003) estimated 1 to 10 km3 erupted tephra mass or 20 km3 of ejecta (Baales et al., 2002) for LSE. Yet, the amount of fine ash that reached the stratosphere was likely much smaller. When simulating the Mt. Pinatubo volcanic aerosol cloud, Niemeier et al. (2009) used a 1 % figure to determine the fine ash mass to the stratosphere (Guo et al., 2004), and given the large uncertainties, we consider it a reasonable approximation also for the LSE cloud. Overall, only very limited information exists to determine how much fine ash has to be emitted in the model experiments, and our best-estimate fine ash emission of 150 Tg in eruption phase one is based on the eruption rate of 4×10⁸ kg s−1 given in Textor et al. (2003), based on a 10 h duration and approximately 1 % of the mass emitted having been fine ash for the explosive LLST and MLST-C phases.
The amount of sulfur released during the ancient LSE is not very well known, and estimates span a range of almost 3 orders of magnitude (Baldini et al., 2018). To explore the range of most likely estimates (Textor et al., 2003) in our study, we therefore performed simulations with three different SO2 emissions: 1.5, 15 and 100 Tg (SO2). We define here the 15 Tg (SO2), which was also used in the study of Graf and Timmreck (2001), together with 150 Tg of fine ash as our reference emission scenario. The ratio of erupted mass of SO2 to fine ash (1:10) is assumed to be constant in all the simulations discussed here. The injected number of particles stays in a constant ratio to the injected mass to keep the radii of the injected particles the same in all simulations, e.g., 2.2×10²³ for the 15 Tg (SO2) injection and 14.8×10²³ for the 100 Tg SO2 injection.
No information is available for the injection profile. Observations made during recent eruptions as well as numerical simulations suggest a separation of ash and sulfate in the eruptive cloud (e.g., Schneider et al., 1999; Holasek et al., 1996; Prata et al., 2017) with a lower neutral buoyancy height for fine ash than for sulfur. In the absence of pertinent data, we assume for our simulations an injection profile for SO2 and fine ash which has been derived from satellite observations and been employed for the simulation of the 1991 Mt. Pinatubo-like eruption (Niemeier et al., 2009). The 1991 Mt. Pinatubo-type eruption was a tropical one. Midlatitude to high-latitude eruptions might not reach as high into the stratosphere given that the erupted column reaches a buoyancy level with the local environment at lower altitude. We therefore also consider two scenarios with lower injection altitudes: 60 and 100 hPa for SO2, and 80 and 120 hPa for fine ash, keeping the vertical offset between the sulfur and ash emission layers constant.
For the second eruption phase, we conservatively assume an injection of one third of the first eruption phase for SO2 and fine ash based on the respective tephra volumes of the proximal LLST and MLST-C deposits. We also adopt the injection profile of the second eruption phase assuming 220 hPa for SO2 and 240 hPa for fine ash lower injection altitudes compared to the first phase, which did just reach the lowermost stratosphere. An overview of the different LSE simulations is given in Table 1.
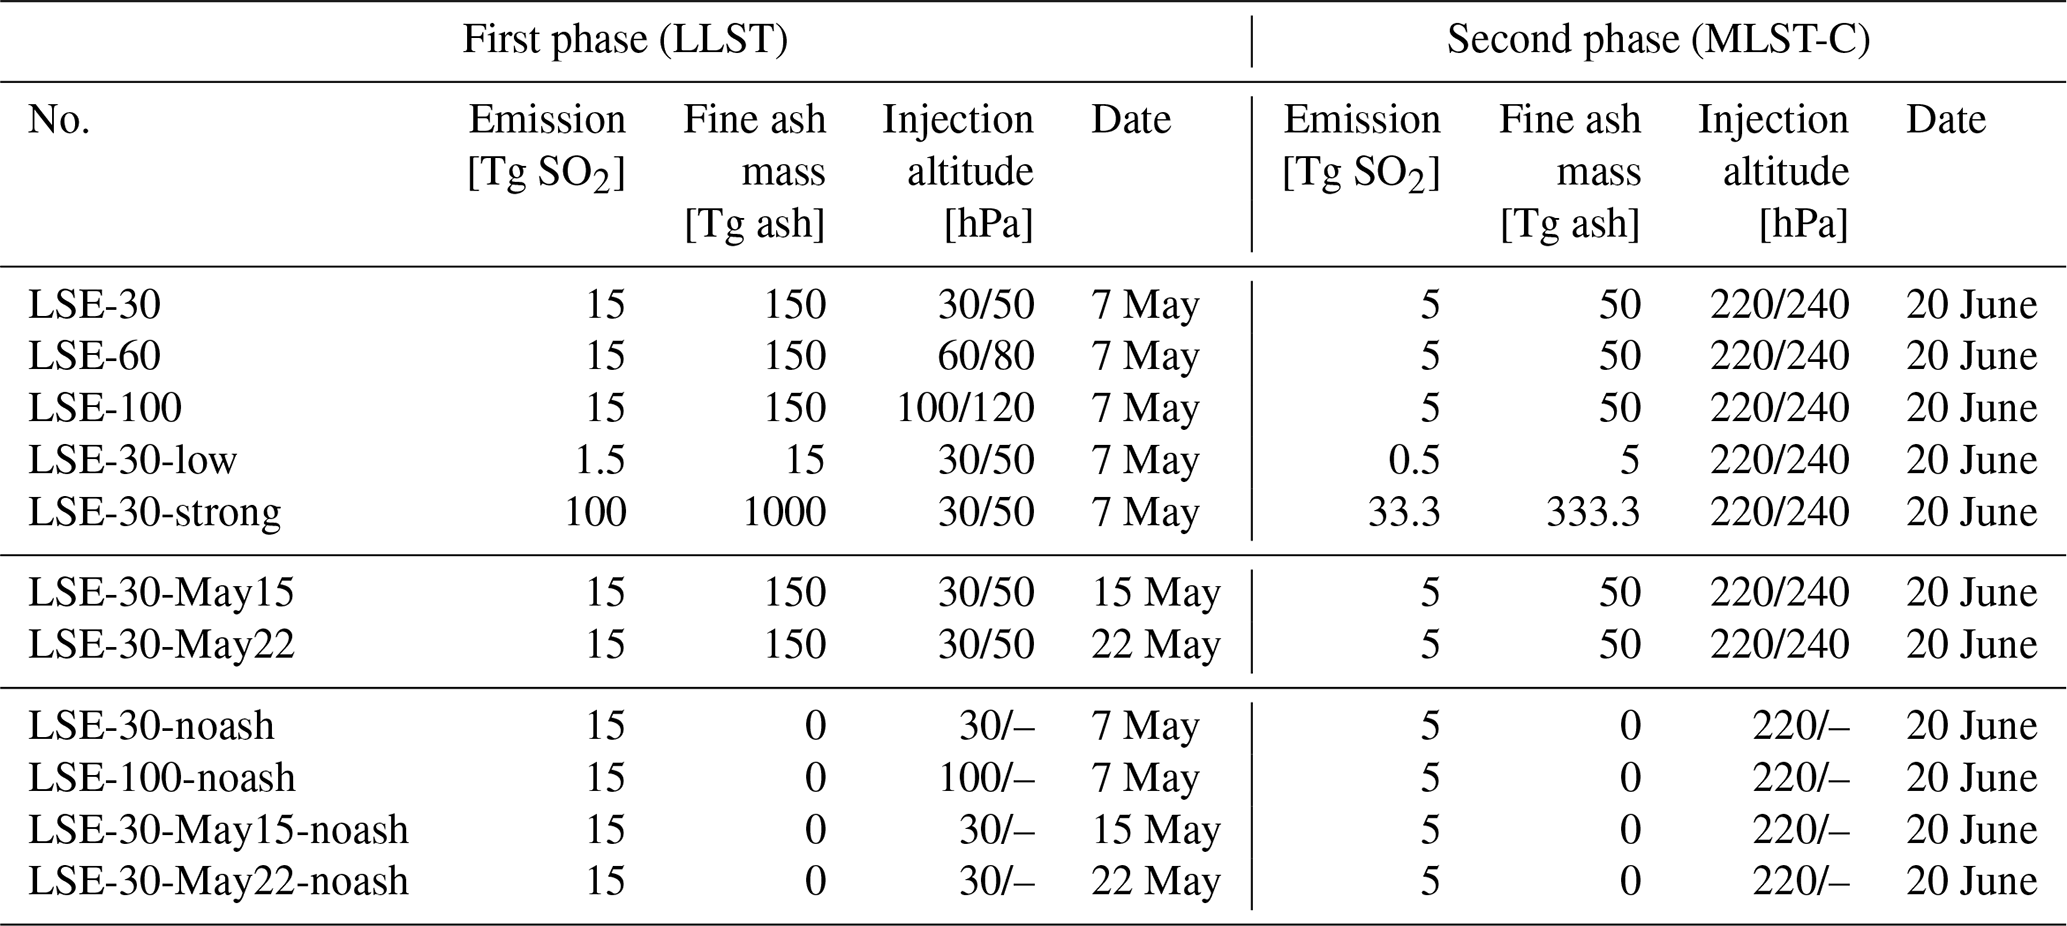
Table 1Overview of the different LSE-type simulations. The emitted mass of the second eruption is one-third of the first eruption for SO2 and ash, respectively. The first number of the injection altitude is the altitude of the SO2 injection; the second is the altitude of the ash injection. The duration of the first phase (LLST) was assumed to be 10 h and the second phase (MLST-C) 3 h.
2.2.3 Eruption day
The initial distribution and subsequent evolution of the volcanic cloud depends on the meteorological conditions of the stratosphere at the time of the eruption (Marshall et al., 2019; Toohey et al., 2019). This is particularly pronounced in midlatitude eruptions but also holds true for tropical eruptions (Jones et al., 2016). Fine ash deposition patterns reflect the transport of volcanic ash over several hundred kilometers, which is mainly determined by the meteorological situation in the lower stratosphere at the time of the eruption. Test simulations aimed at finding an appropriate injection day showed that the meteorological conditions in the troposphere were less important.

Figure 2Streamlines over Europe of the undisturbed zonal wind [m s−1] at 48 hPa. The panels show 1-week separated snapshots of the flow pattern in May with (a) westward flow over central Europe on 1 May, (b) eastward flow on 7 May and northwestward flow on (c) 15 May and (d) 22 May. The red dots mark the eruptive center.
The paleontological (botanical and trace-zoological) evidence preserved in the proximal LSE ash deposits offers strong indications of a late spring/early summer date of the eruption. Still, it is almost impossible to simulate an ash deposition pattern in a numerical model that reflects exactly an empirically known one, not least a deposition pattern as complicated as that of the ancient LSE. For a present-day eruption, observational data could be used together with nudging (e.g., ECMWF analysis data) to push the model into a state that is similar to the weather and wind situation on the eruption day. As this nudging of meteorological variables is not possible for simulations of ancient eruptions, we used the known tephra lobe deposition as a footprint on the surface helping us to identify possible conditions in the stratosphere during the LSE in the Late Pleistocene: southwesterly wind causing transport to the Baltic Sea for the first explosive eruption phase (LLST) and northerly wind for the second explosive eruption phase (MLST-C). Winds in the stratosphere vary strongly by season. During summer at an altitude of 30 hPa, easterly winds between 50 and 60∘ N are dominant; westerly winds are dominant during winter (Andrews et al., 1987). During spring, and after the breakdown of the polar vortex, different transport directions are possible due to more unstable meteorological conditions with local low- or high-pressure systems. It is these that would allow transport of the ash from the East Eifel towards the Baltic Sea.
We performed a 20-year control simulation without any volcanic emission, with climatological SST values but a free-running atmosphere and thus constantly changing meteorological conditions. We checked the meteorological situation in the stratosphere in spring of 3 of the 20 years. In May of one year, we found a situation similar to the assumed conditions at the prehistoric LSE. Figure 2 shows the flow pattern at 48 hPa, close to our reference injection height for different days in May of this specific year. Our model shows strong easterly winds from late May onwards, for instance, on 22 May (Fig. 2d). We therefore selected early May for the model initialization and the volcanic ash and SO2 emission, even if this is not in full agreement with the paleontological evidence. The best agreement of the spatiotemporal distribution between simulated and observed ash deposits was found for 7 May as the starting day for the LLST eruption phase (LSE-30; see definition of simulations in Table 1). We performed two additional simulations with explosive eruption events on 15 May (LSE-30-May15) and 22 May (LSE-30-May22) to highlight the impact of the dynamic state of the stratosphere on the dispersion of the volcanic cloud. Additionally, we performed simulations without the injection of fine ash for the three injection dates. This small ensemble allows us to discuss the role of fine ash on tracer distribution and transport.
In order to determine a day for the SO2 and ash emissions during the second eruptive phase (MLST-C), we continued the simulation after the first explosive eruption but without a second explosive eruption phase. This simulation provided the basis for identifying a date when the volcanic cloud of the MLST-C phase would be transported to the south/southwest. The meteorological situation that gave best agreement to the empirically known MLST-C tephra deposits was obtained for 20 June. This emission timing was chosen for all simulations despite the fact that after the first eruptive phase (LLST), the dynamic conditions changed (as a result of the ash radiative effects; Fig. S2 in the Supplement), and the deposition structure of the second explosive eruption phase was only reproduced in LSE-30.
3.1 Simulation of fine ash
3.1.1 Sensitivity to emission altitude and rate
Emission rate and altitude have a major impact on the deposition pattern of fine ash. In our study, the explosive eruption days, 7 May for the first phase and 20 June for the second, were chosen to simulate as closely as possible the empirically known tephra distribution of the LSE phases (Schmincke, 2010; Riede et al., 2011; Reinig et al., 2020) shown in Fig. 1. The transport towards the Baltic Sea after the first eruption is captured well in all simulations (Fig. 3a–f) for ash lobes. Compared to LSE-30, the transport of ash is straighter eastward and the distribution of deposited ash is longer with a narrower eastward spread in LSE-60 and LSE-100, where SO2 and ash are injected at lower altitudes. The pattern of deposited ash in LSE4-30-low is similar, but, due to a 10-fold lower injected mass, the absolute value is much smaller. The opposite is the case for LSE-30-strong. The main area of deposition is similar to LSE-30, but the spread is much greater and the ash deposits correspondingly cover a much larger area.

Figure 3Deposition of fallout ash accumulated over May and June following the explosive eruption phases in simulations LSE-30 to LSE-30-strong. Simulations with injection of 150 Tg fine ash at different altitudes (a, c, e), simulations with two different injection rates, both at 50 hPa for the fine ash (d, f), and (b) currently known distribution of all Late Pleistocene tephra deposits (black) of the LSE; LLST is in green, and MLST is in orange (Riede et al., 2011; Reinig et al., 2020). Note that many LST finds are not directly associated with any specific eruption phase. The light blue dot marks the eruptive center.
The estimated pattern of tephra distribution of the MLST-C phase, main deposition towards the south, is also well captured in our central experiment (LSE-30). Ash deposition in model runs LSE-60 and LSE-100 shows a similar pattern, albeit with deposition occurring preferentially over the Adriatic Sea and also over England and the North Sea. The southward distribution of fine ash deposition in LSE4-30-low and LSE-30-strong is very different. The absorption of radiation, mainly solar radiation, heats the layer of ash (Fig. S1). The ash-induced heating changes the wind pattern in the stratosphere. These changes depend on the injection altitude and, more importantly, on the emitted mass. Consequently, the wind in the stratosphere is in different states on 20 June in all simulations (Fig. S2) with the result that transport directions of the ash associated with the second explosive phase (MLST-C) differ substantially between model runs and in relation to the empirical benchmark of the Late Pleistocene eruption (Fig. 3b). The differences in transport after the first phase are more related to a direct impact of the heated ash cloud on the wind pattern in the stratosphere, as described in the next section.
Importantly, our results indicate almost no transport of ash to high latitudes, except in LSE-30-strong, which is characterized by a very strong eruption rate. LSE-30 results in a small amount of deposited ash over Iceland (not shown), LSE-60 even slightly further north. LSE-100 shows no ash deposition north of 70∘ N. However, do note that our simulations represent only a single state of the atmosphere out of many possible ones which possibly could also lead to the observed ash deposits. Thus, the simulated winds reflect the prehistorical wind conditions in central Europe. Further away from the eruption site, the transport path of the tracer has been, most probably, different during the Late Pleistocene LSE.
3.1.2 Role of rotating ash cloud
The simulated deposition pattern of ash of the LLST explosive eruption phase in May, with deposition along the Baltic Sea, differs in shape in LSE-30 from LSE-60 and LSE-100. This feature is related to the heating of the ash due to absorption of solar radiation and the consequent impact on the stratospheric winds. The heated air causes a vertical updraft, a change of density and positive divergence due to expanding air at the top of the cloud where the vertical motion within the volcanic cloud turns into a horizontal outflow (for theoretical details, see explanations in Baines and Sparks, 2005; Costa et al., 2013). Under the influence of the Coriolis force, the horizontally expanding air turns clockwise and may even cause an anticyclonic rotation, a mesocyclone, of the heated volcanic cloud. At night, the upper part of the cloud becomes colder. Without the heating of solar radiation, upward motion of the cloud ceases and sedimentation increases. Then the cloud is no longer expanding, divergence becomes negative, and the anticyclonic rotation is less pronounced but not breaking down. Without the radiative heating of the cloud, no rotation develops.
Figure 4 shows the streamlines of the wind slightly above the eruption altitude – the area of positive divergence described above – for the 3 d after the first eruption phase of simulations LSE-30 and LSE-100. At the higher injection altitude (50 hPa) of LSE-30, the ash cloud starts rotating shortly after the eruption, while for LSE-100 only a slight change of divergence of the flow is simulated. The rotating ash cloud of LSE-30 stays closer to the eruptive center as transport in the rotating cloud dominates over passive transport (compare Fig. 4a and d). The fast passive easterly transport of ash in LSE-100 is diminished on the third day after the eruption, when the ash cloud of LSE-100 has risen, the cloud starts to rotate (10 May), and transport becomes dominated by the rotation of the ash cloud.

Figure 4Ash concentration (shaded) and streamlines of the zonal wind for LSE-30 (a–c) and LSE-100 (d–f) at 12:00 UTC on the first (a, d), second (b, e) and third (c, f) days after the first-phase LLST. The ash is plotted in both scenarios in the second vertical level above the injection altitude, 44 and 96 hPa, respectively. The color scale of the streamlines is similar to Fig. 2 but represents 10 values between 0 and 20 m s−1. Note the different area in panels (e, f) which can be seen as an extension of the area in panel (d).
One explanation of the later development of a rotating in LSE-100 is the vertical extension of the cloud which is driven by the injection altitude. In LSE-30, the vertical distance to the tropopause is larger, allowing a larger vertical extension of the cloud and stronger heating. The vertical extension of the cloud is important for the development of the rotation (Baines and Sparks, 2005). In LSE-100, the ash cloud has to rise to higher altitudes, caused by the heating due to absorbed radiation (Muser et al., 2020), before the rotation develops. In addition, the difference between the density of the cloud and the density of the environment is larger at higher injection altitudes, which may increase the velocity of the horizontal outflow. Previous work on the formation of an umbrella or a rotating cloud (e.g., Baines and Sparks, 2005; Costa et al., 2013) does not discuss this aspect of ash cloud dynamics.
The rotating volcanic cloud may explain the local maxima and uneven deposition of Laacher See tephra in the eruption's medial field in particular (see Riede et al., 2011). Our simulation scenarios demonstrate how the heated ash cloud impacts the flow and the dispersion of the cloud itself. The clockwise turn of the wind field before the rotation develops (Fig. 3.1.2) and the rotation of the air masses hinder transport to the north, and this mechanism could therefore offer an explanation for the absence of LSE deposits in the Greenland ice cores.
3.2 Simulation of sulfate aerosols
3.2.1 Global distribution of sulfur burden
Sulfate aerosols have a longer lifetime than fine ash and elicit a stronger climate impact. The LSE is an extratropical eruption and could, locally, have led to a stronger impact than a tropical eruption of the same size (Toohey et al., 2019). Following a NH eruption, sulfate is mainly transported within the Brewer–Dobson circulation (BDC) to higher northern latitudes (Fig. 5). The aerosols reach high latitudes about 1 to 2 months after the eruption. Smaller amounts of sulfate aerosols reach the equatorial latitudes roughly 3 months after the eruption. They cross the Equator with the transition to northern winter conditions and are transported towards the southern high latitudes.
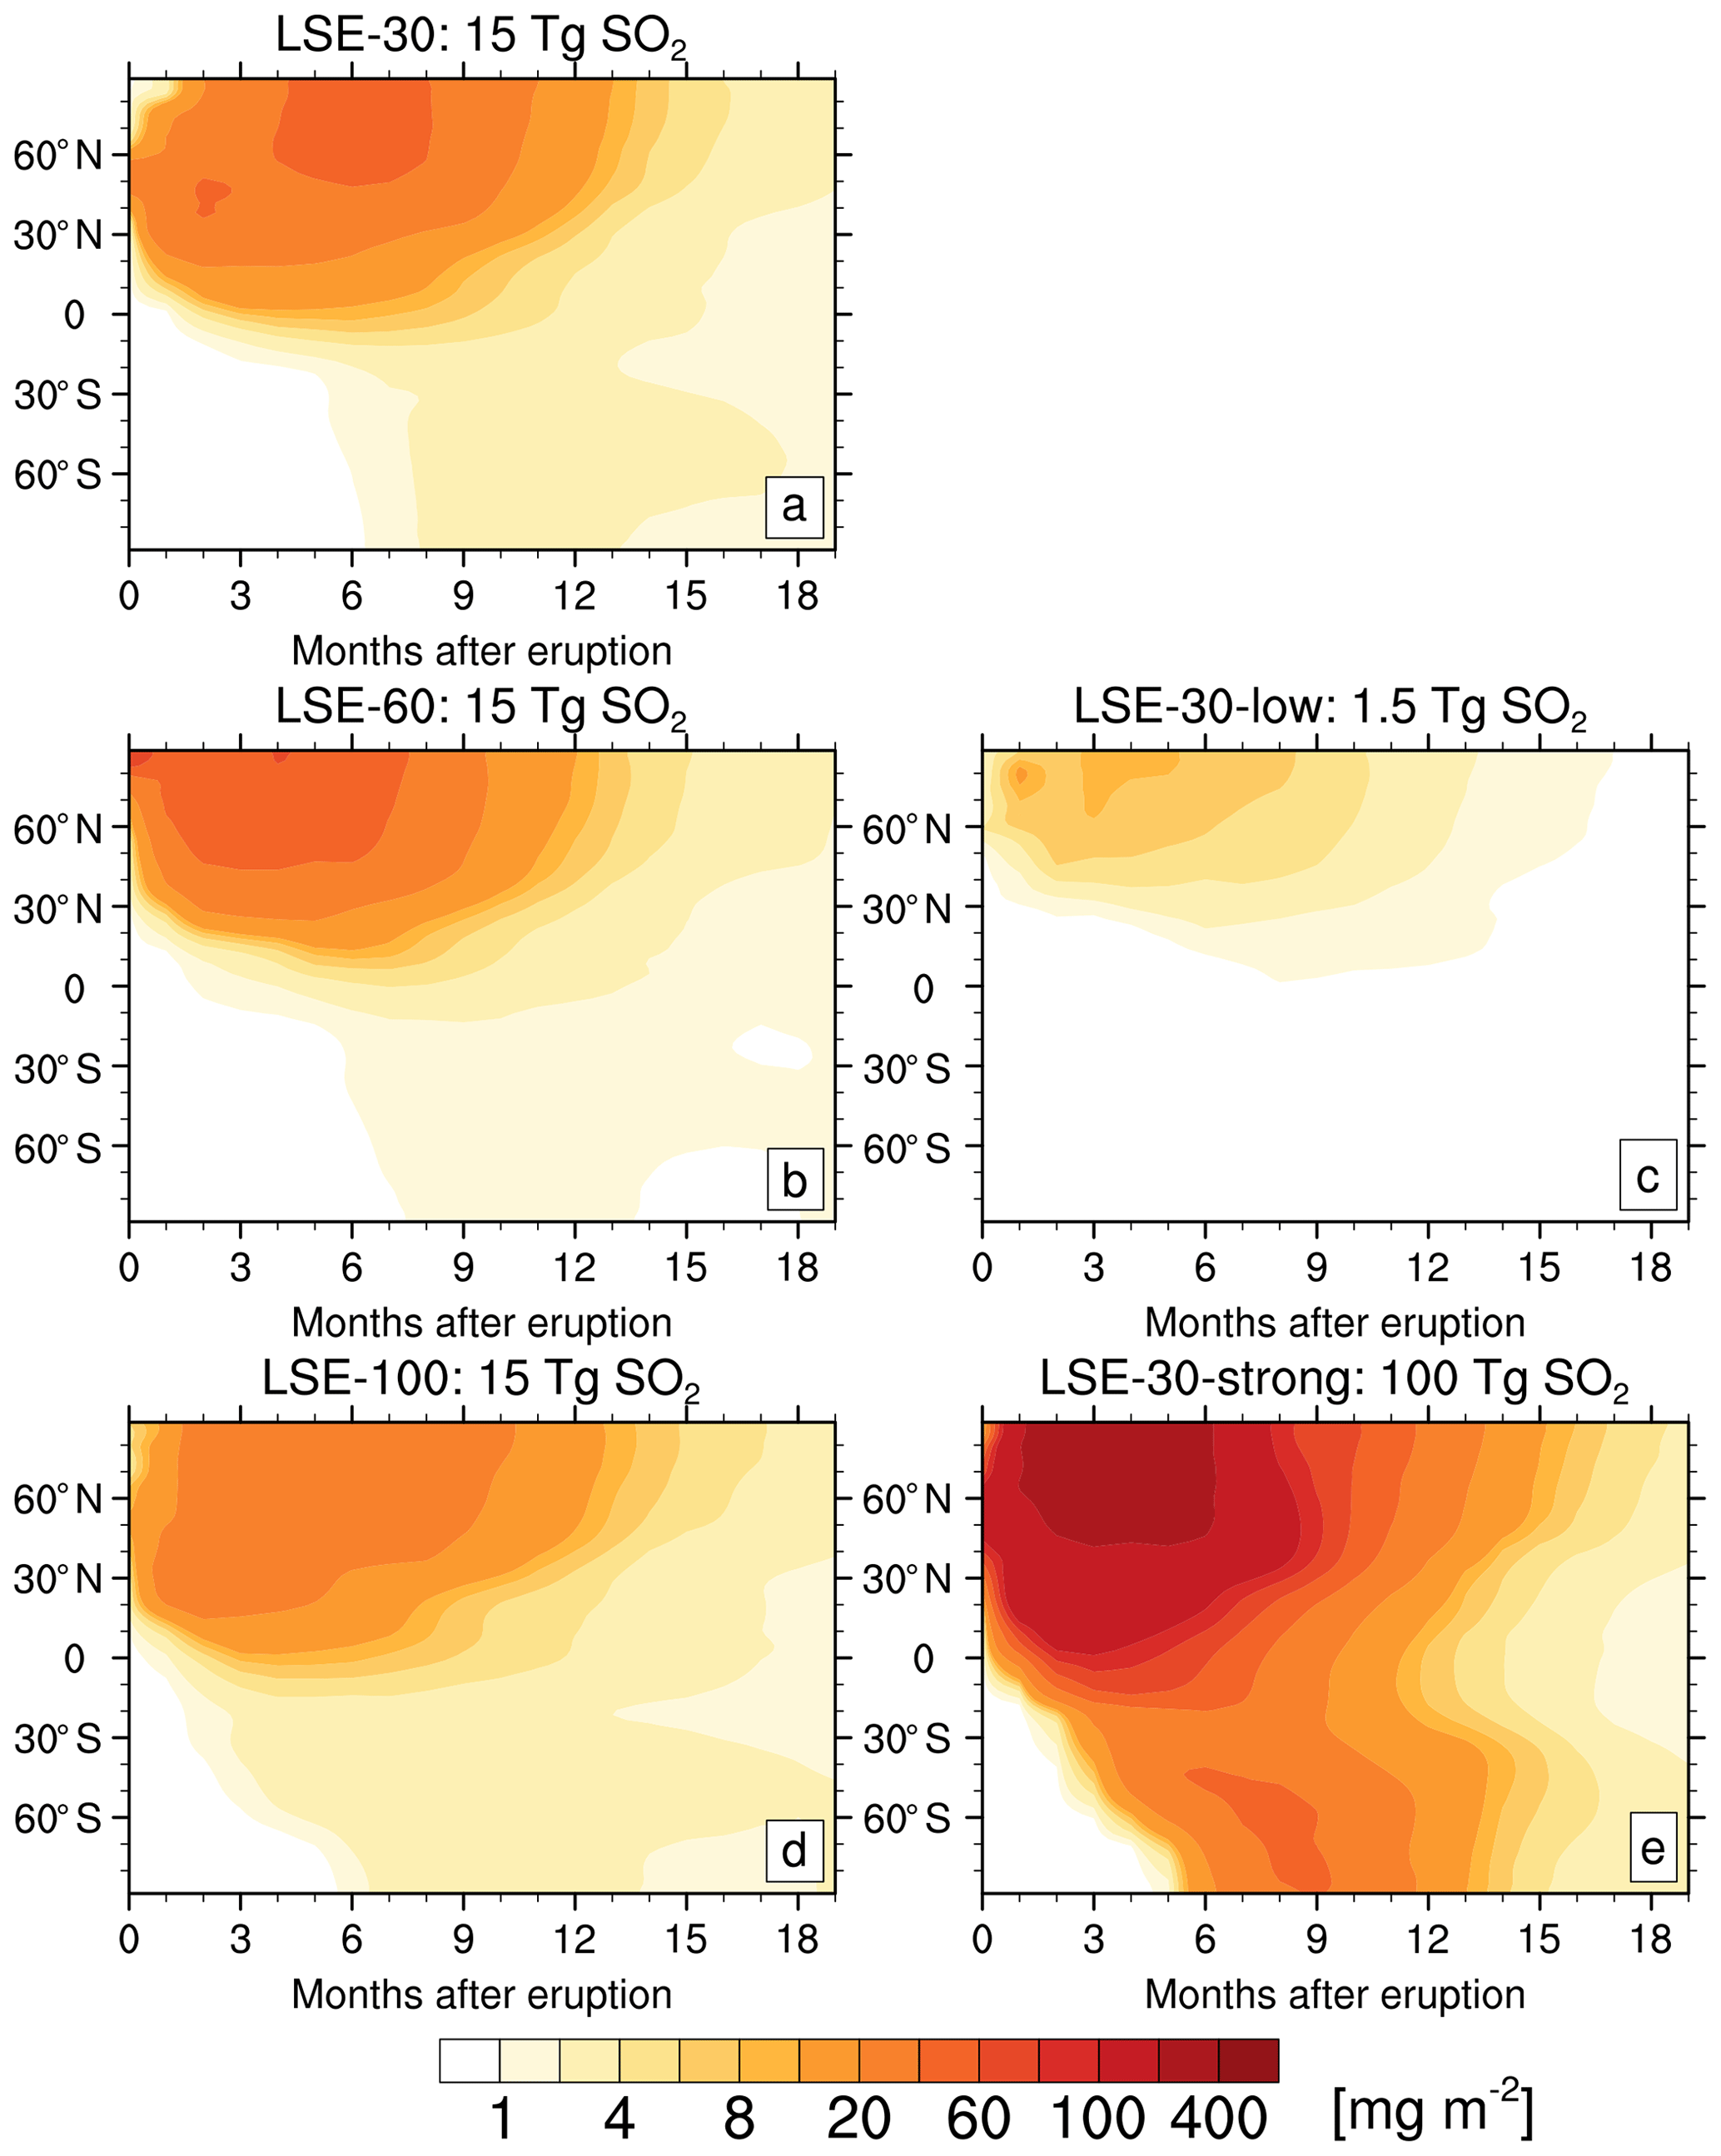
Figure 5Hovmøller diagram of zonally averaged sulfur burden [mg (S) m−2], vertical integral of sulfur, over a period of 1.5 years after the first eruption phase. The zero mark is in May, the month of the first eruption phase.
Meridional transport in the stratosphere is stronger within the lower stratosphere due to wave-induced turbulent structures which has implications for the simulated sulfate transport when injecting sulfur in different altitudes (Fig. 5a, c and e). In LSE-30, the volcanic cloud arrives later at the pole with less sulfate than in LSE-60. Sulfur injection at 100 hPa (LSE-100) causes the smallest burden, but the aerosols stay longer in the stratosphere which is related to smaller particles (Fig. S3). The stronger meridional transport in the lower stratosphere results in a faster dilution of the injected sulfur and consequently in smaller particles. This is in line with previous studies: Toohey et al. (2019) showed that effective radii of volcanic sulfate particles are smaller for an initial injection at 100 hPa compared to an injection at 30 hPa. Stratospheric aerosol optical depth and volcanic net radiative forcing results in Marshall et al. (2019) suggest a similar behavior. Additionally, LSE-100 shows the most pronounced transport to lower latitudes, which reduces the local sulfur load as well as particle radii.
Changing the injection rate reveals a decreasing ratio of maximum burden to injected mass for the first step for LSE-30-low to LSE-30: 5.3 to 3.3 , respectively. This is in line with previous work, which shows a decreasing burden-to-injected-mass ratio for tropical eruptions (English et al., 2013) and a comparative result of decreasing aerosol-optical-depth-to-injected-mass ratio for both tropical and extratropical eruptions (Marshall et al., 2019). This behavior changes when we increase the injection rate from LSE-30 to LSE-30-strong; the ratio increases from 3.3 to 3.7 . This underlines the non-linearity of the sulfate evolution and the role of the mesocyclone in a strong eruption. In LSE-30-low, the heating of ash is too low for a pronounced rotation of the volcanic cloud, and sulfate reaches high latitudes early. In LSE-30-strong, the mesocyclone causes both fast transport to high latitudes as well as stronger transport into the tropics and Southern Hemisphere than in LSE-30. However, the lifetime of the aerosols is notably similar in both simulations.
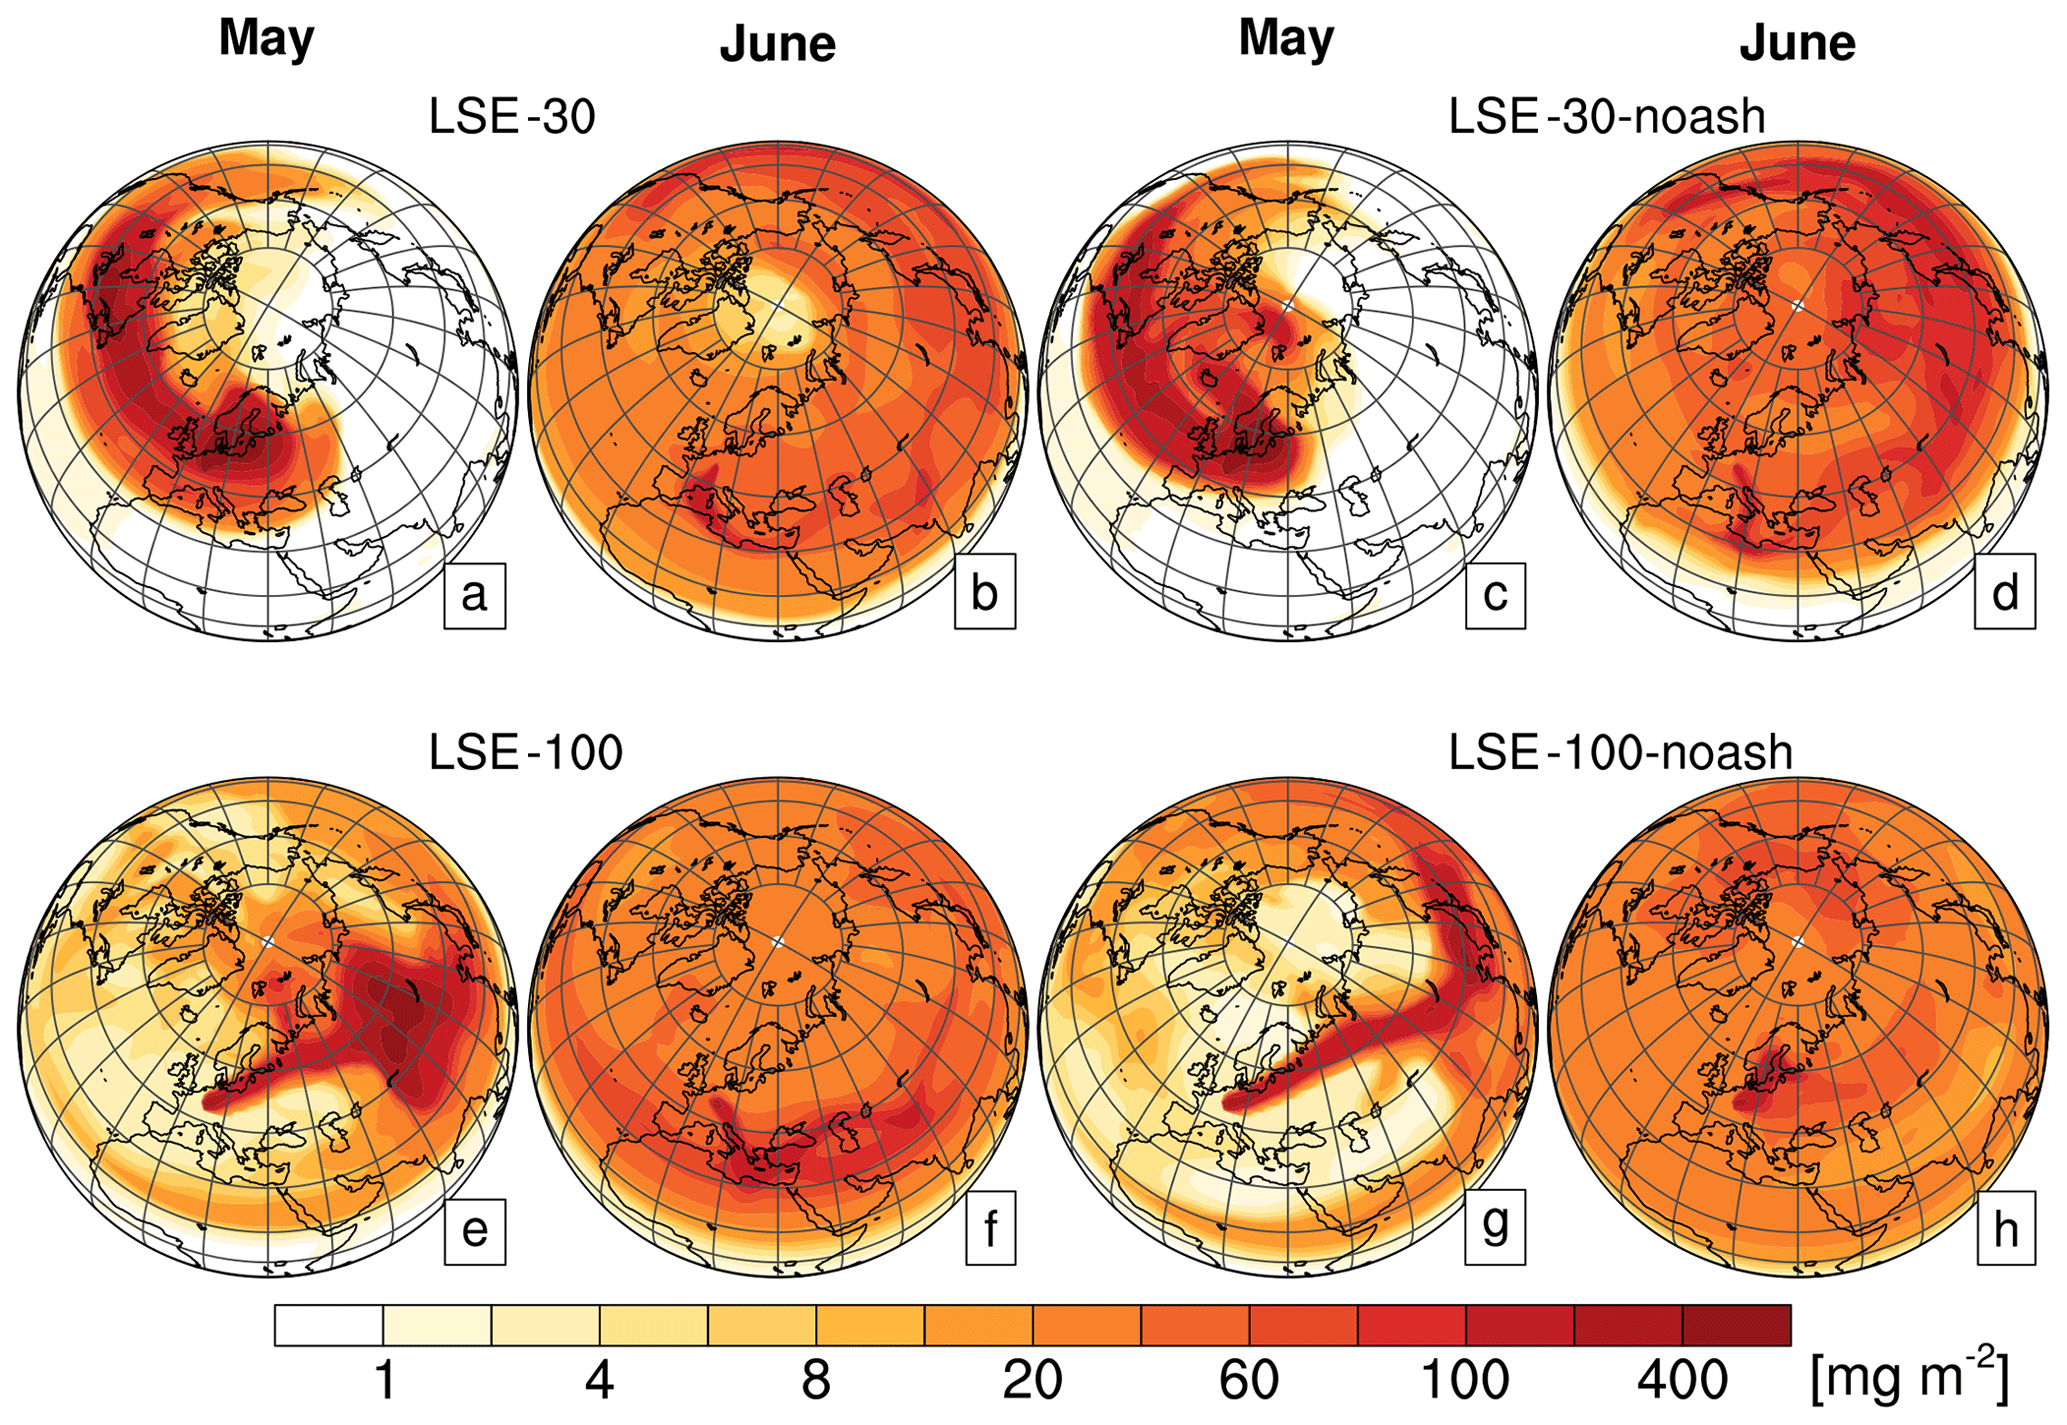
Figure 6Monthly mean sulfur burden (SO2 plus sulfate [mg (S) m−2]) with (a, b, e, f) and without (c, d, g, h) the injection of ash. The burden is averaged over May and June for the LSE-30, LSE-100, LSE-30-noash and LSE-100-noash scenarios with the same eruption rate but different injection altitudes (30 hPa, a–d; 100 hPa, e–h).
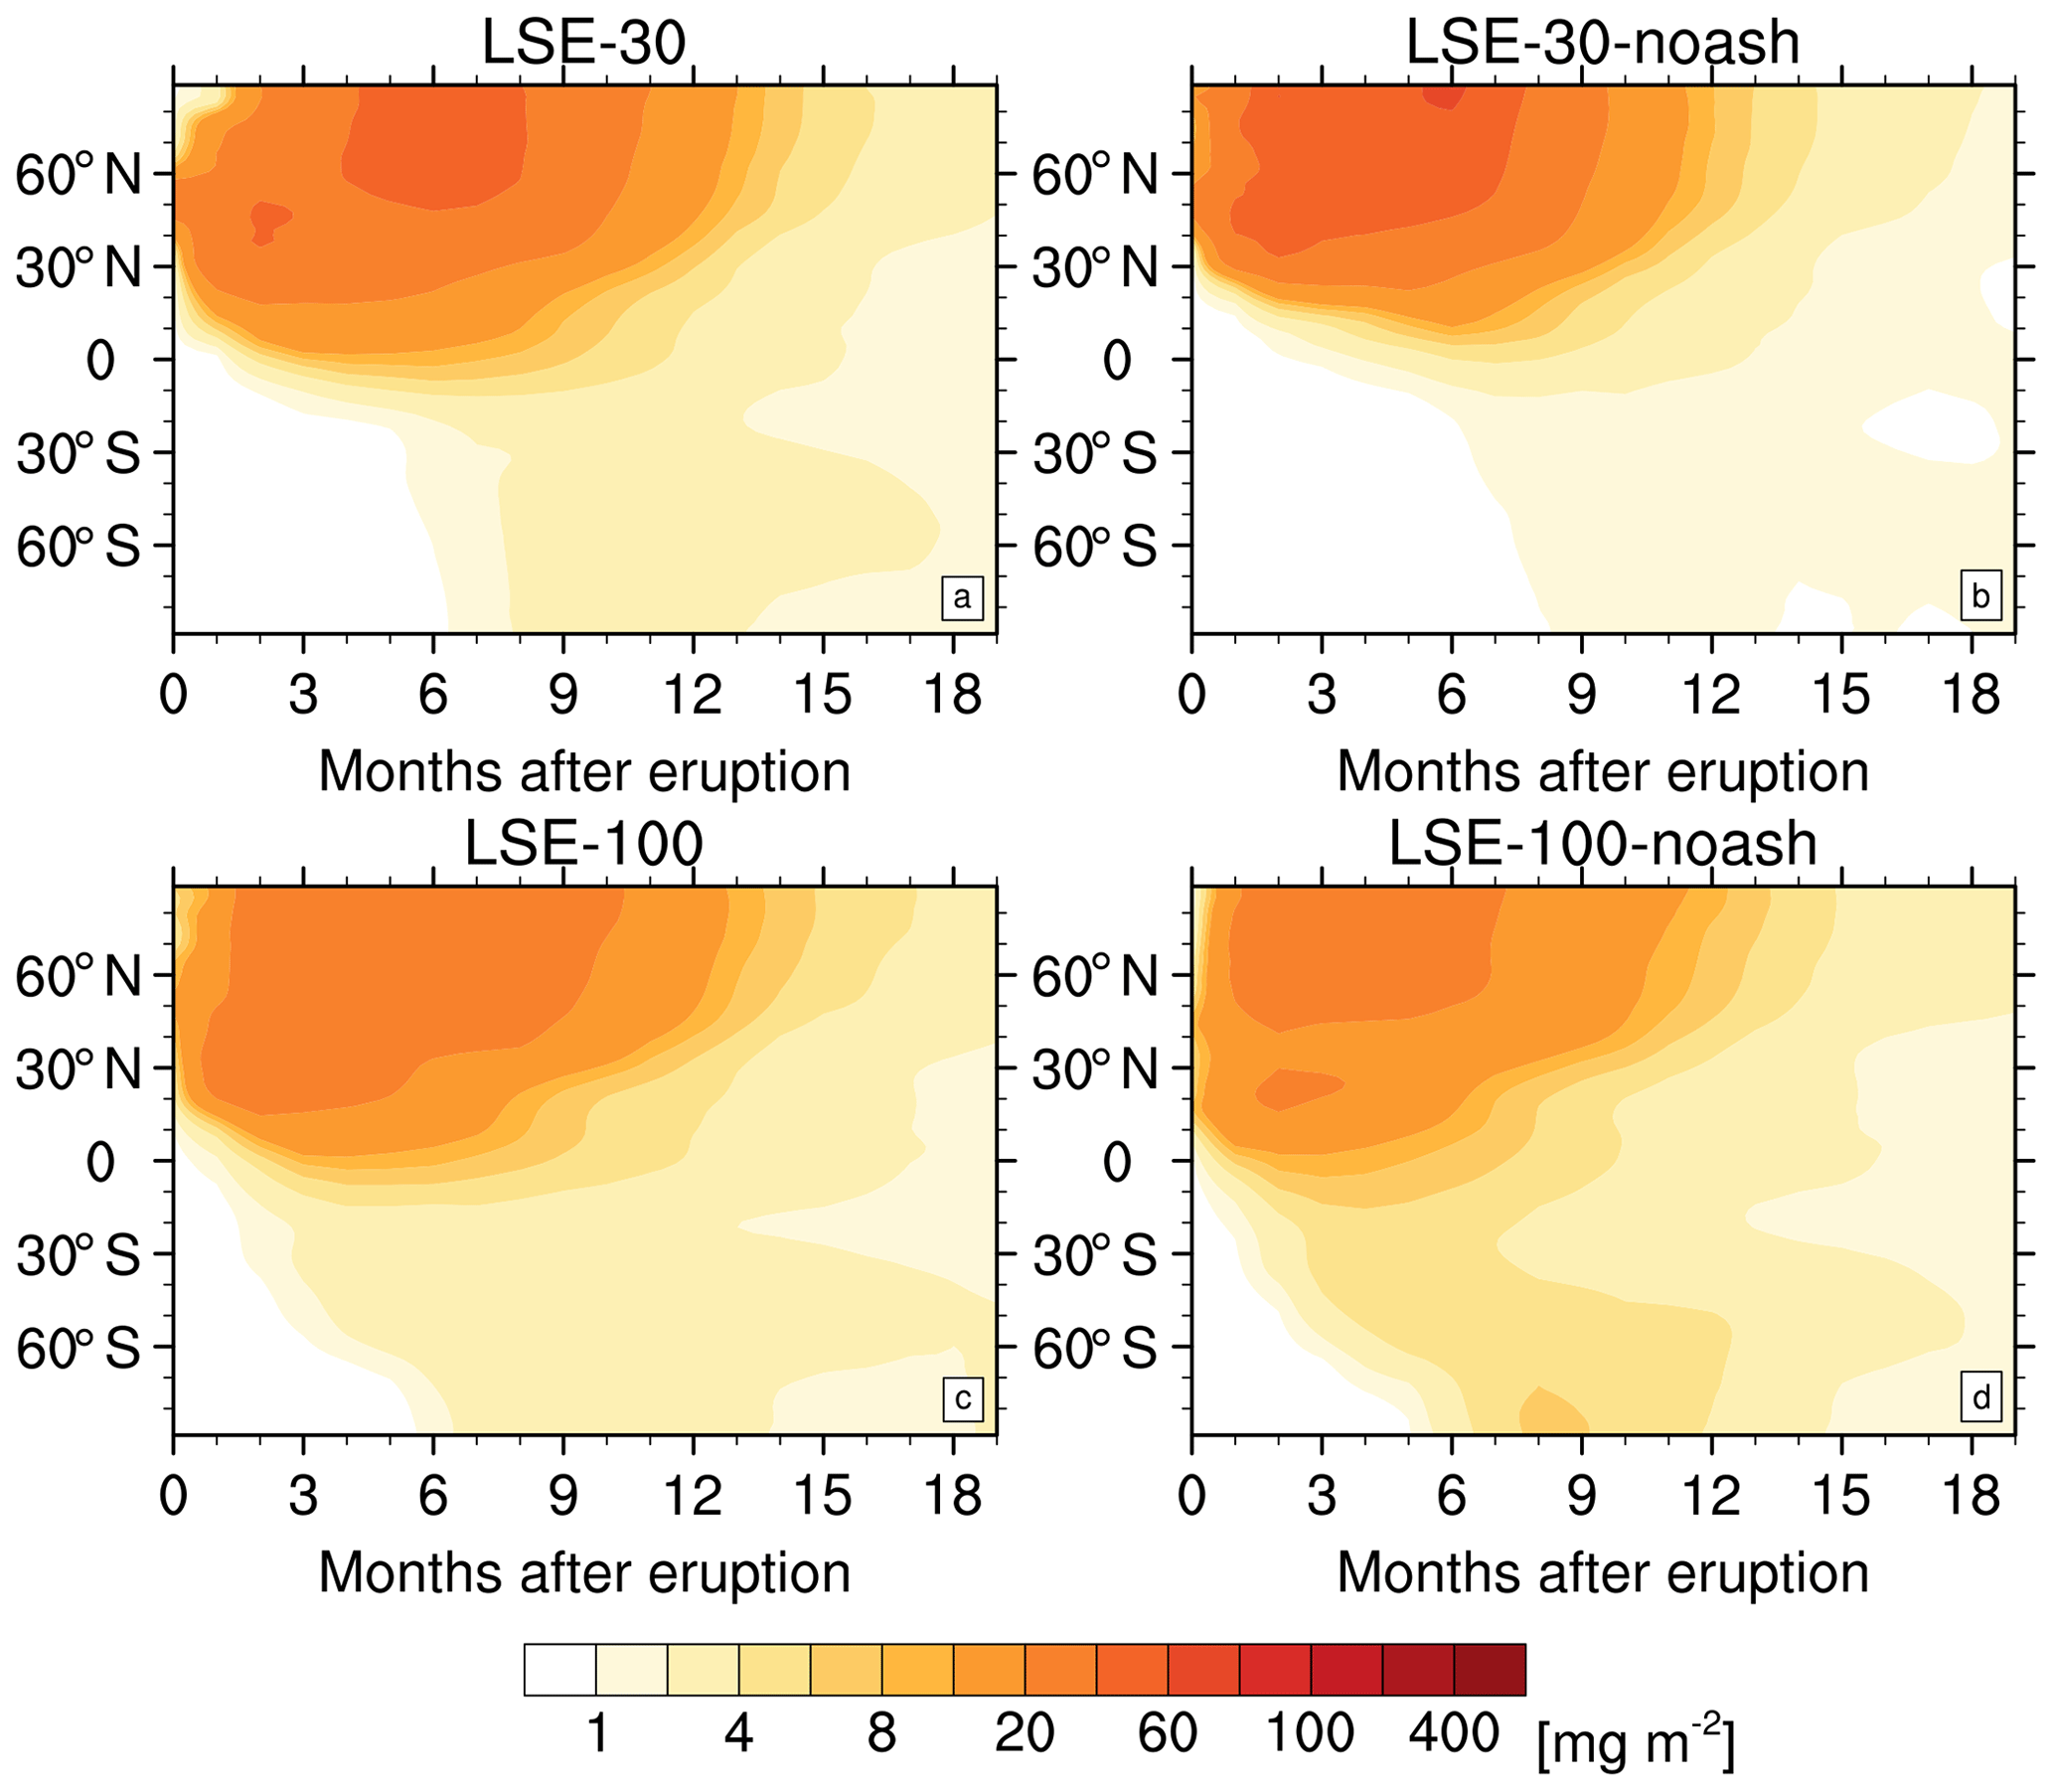
Figure 7Hovmøller diagram of zonally averaged sulfur burden [mg (S) m−2] for an assumed LSE-like eruption over a period of 1.5 years after the first eruption phase. On the left are simulations with injection of fine ash: (a) LSE-30 (c) LSE-100. On the right are the corresponding simulations without the injection of fine ash: (b) LSE-30-noash and (d) LSE-100-noash.
The monthly mean sulfur burden in May and June (Fig. 6) reveals more details regarding the differences in transport within the first 2 months after the eruption for those simulations with different injection altitudes. In May, the main transport occurs with easterly winds at 30 hPa (LSE-30) and with westerly winds in LSE-100 and LSE-60 (Fig. S4). In LSE-30, the rotation of the volcanic cloud keeps the SO2 and sulfate aerosols over Scandinavia right after the eruption phase in May, while in LSE-30-noash sulfate is transported to Greenland and Svalbard. In LSE-30, only a very small amount of sulfate reached the pole in June, in contrast to LSE-30-noash. Comparing LSE-100 to LSE-100-noash, the difference in transport is clearly related to the rotation of the volcanic cloud. With ash (LSE-100), the cloud widens when it starts to rotate over Siberia in May. In contrast, the cloud of simulation LSE-100-noash is transported straight over Siberia.
In the 12 months following this (Fig. 7b), we observe in the sulfur burden stronger transport to high latitudes and less equatorward transport into the tropics in LSE-30-noash compared to LSE-30 and similar behavior for simulations LSE-100 and LSE-100-noash. Overall, the rotating ash cloud adds a southern component to the transport. Additionally, the zonal mean heating rates indicate a stronger heating right after the eruption at 50∘ N in LSE-30 due to the presence of ash, as well as stronger heating and vertical lofting in the volcanic cloud at 30∘ N (Fig. S1). Thus, the stronger equatorward transport with ash emissions results in a stronger heating as solar irradiation is stronger in midlatitudes and low latitudes than at high latitudes.
The results of LSE-60 differ from LSE-30 as they show much faster transport to the pole (Fig. 5). LSE-60 and LSE-100 show similar passive transport along the Baltic Sea right after the first eruption phase (LLST; Figs. 6e and S4), but the transport gets quite different with the onset of the rotation over Finland in LSE-60 and over Siberia in LSE-100. The consequence is strong poleward transport in LSE-60 but not in LSE-100. Thus, the rotation slows down the zonal transport but widens the cloud. These examples show that the transport depends on details of injection rate and altitude which impact the flow pattern differently.
The impact of the second eruption is less strong, mainly because of the lower altitude of the eruption but also because of the smaller erupted mass. The lower altitude avoids a strong interaction with the sulfate of the first eruption; otherwise, enhanced coagulation would cause larger particles. However, the second eruption adds to the sulfur burden, as can be seen in results of June in Fig. 6.
3.2.2 LSE eruption later in May
Earlier, we discussed the conditions in the stratosphere during a specific eruption date (7 May). Fixing the eruption date in this way allows us to match the ash lobes of the prehistoric LSE. The consequence of this forced date fixing is, however, that ensemble modeling was not possible. To mitigate this missing ensemble, usually necessary to take into account different states of dynamical conditions, we show results of LSE-like simulations, on 15 (LSE-30-May15) and 22 May (LSE-30-May22), respectively (Fig. 8). Both have a clear northwest component of the wind, with LSE-30-May15 oriented more northward in the vicinity of an anticyclone (Fig. 2). The distribution of sulfate is very different in both simulations (Figs. 8 and 9). The slightly stronger northward transport at the edge of the clockwise-rotating pressure system over Scandinavia in LSE-30-May15 results in a volcanic cloud mostly located between 45 and 60∘ N in May, compared to 30 to 50∘ N in LSE-30-May22 (Fig. 9). This minor difference in early transport results, eventually, in very different sulfur burden patterns in June: the burden maximum in LSE-30-May15 is located at the pole, but in the subtropics in LSE-30-May22 this feature continues later in time (Fig. 8). This example underlines the importance of the specific wind pattern during the eruption influencing downstream climate impacts.
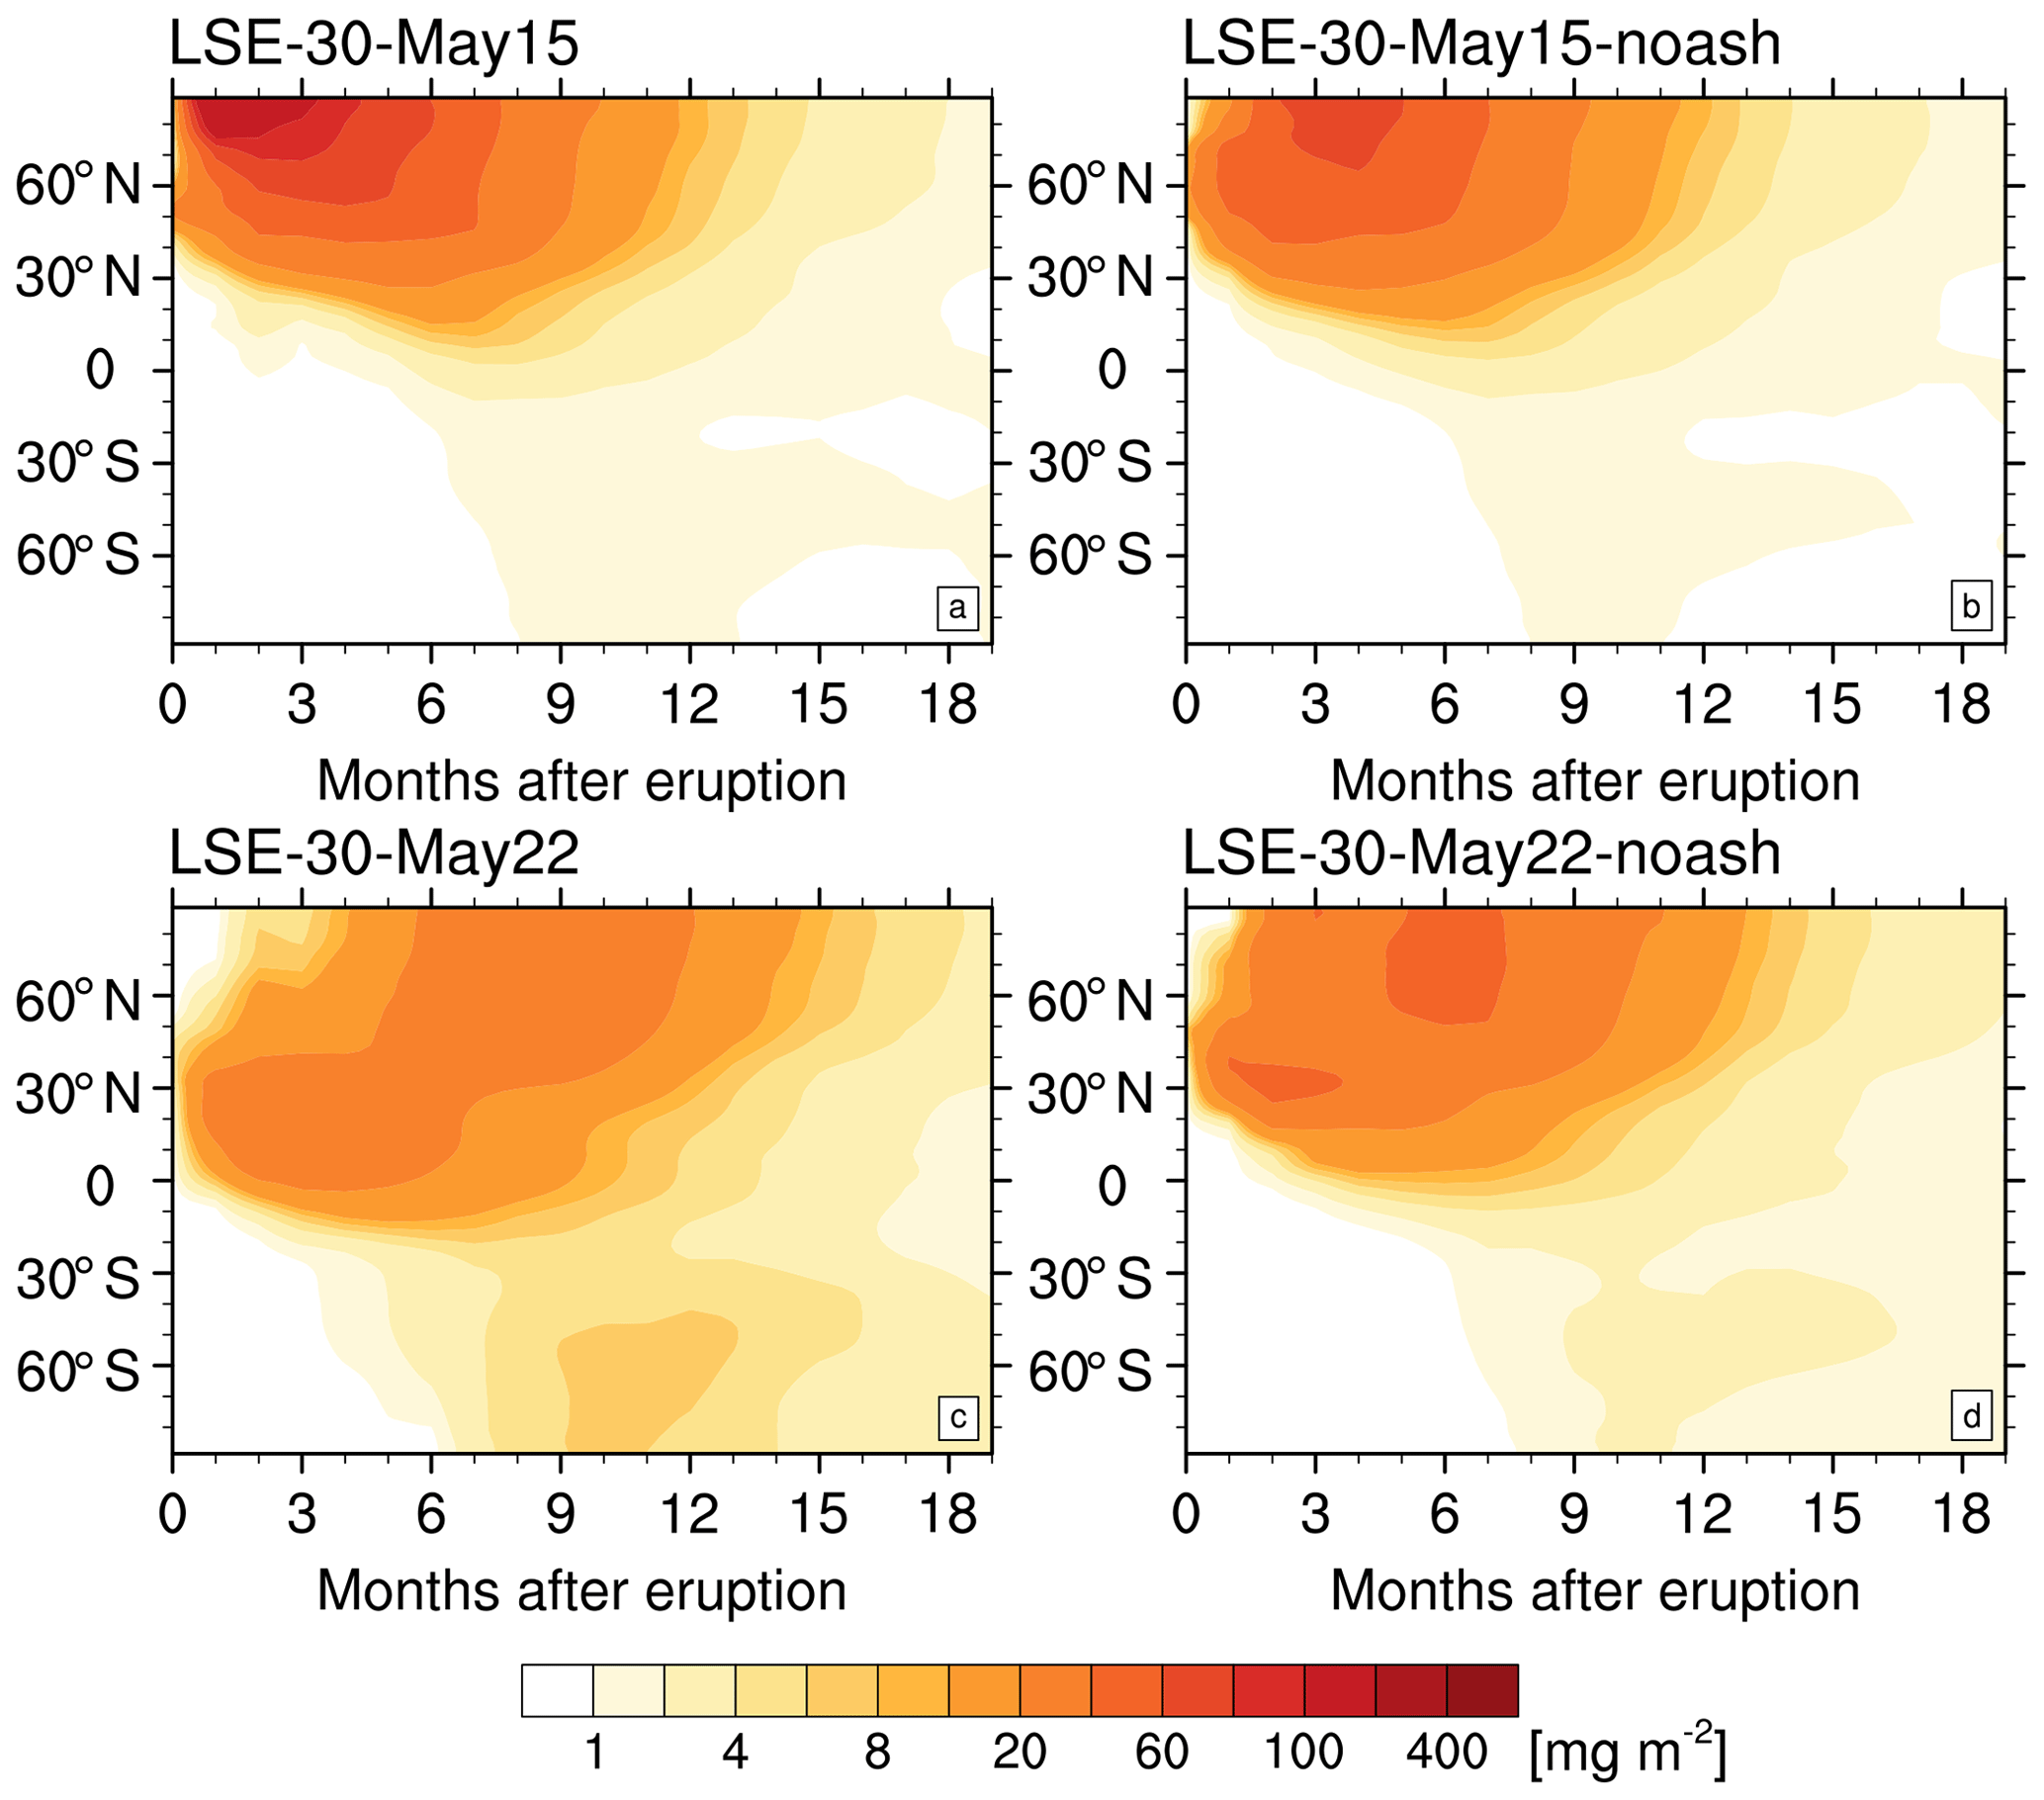
Figure 8Hovmøller diagram of zonally averaged sulfur burden for an assumed LSE-like eruption over a period of 1.5 years after the first eruption phase. Eruptions take place on 15 (a, b) and 22 May (c, d) with injection of fine ash (a, c) and without the injection of ash (b, c).
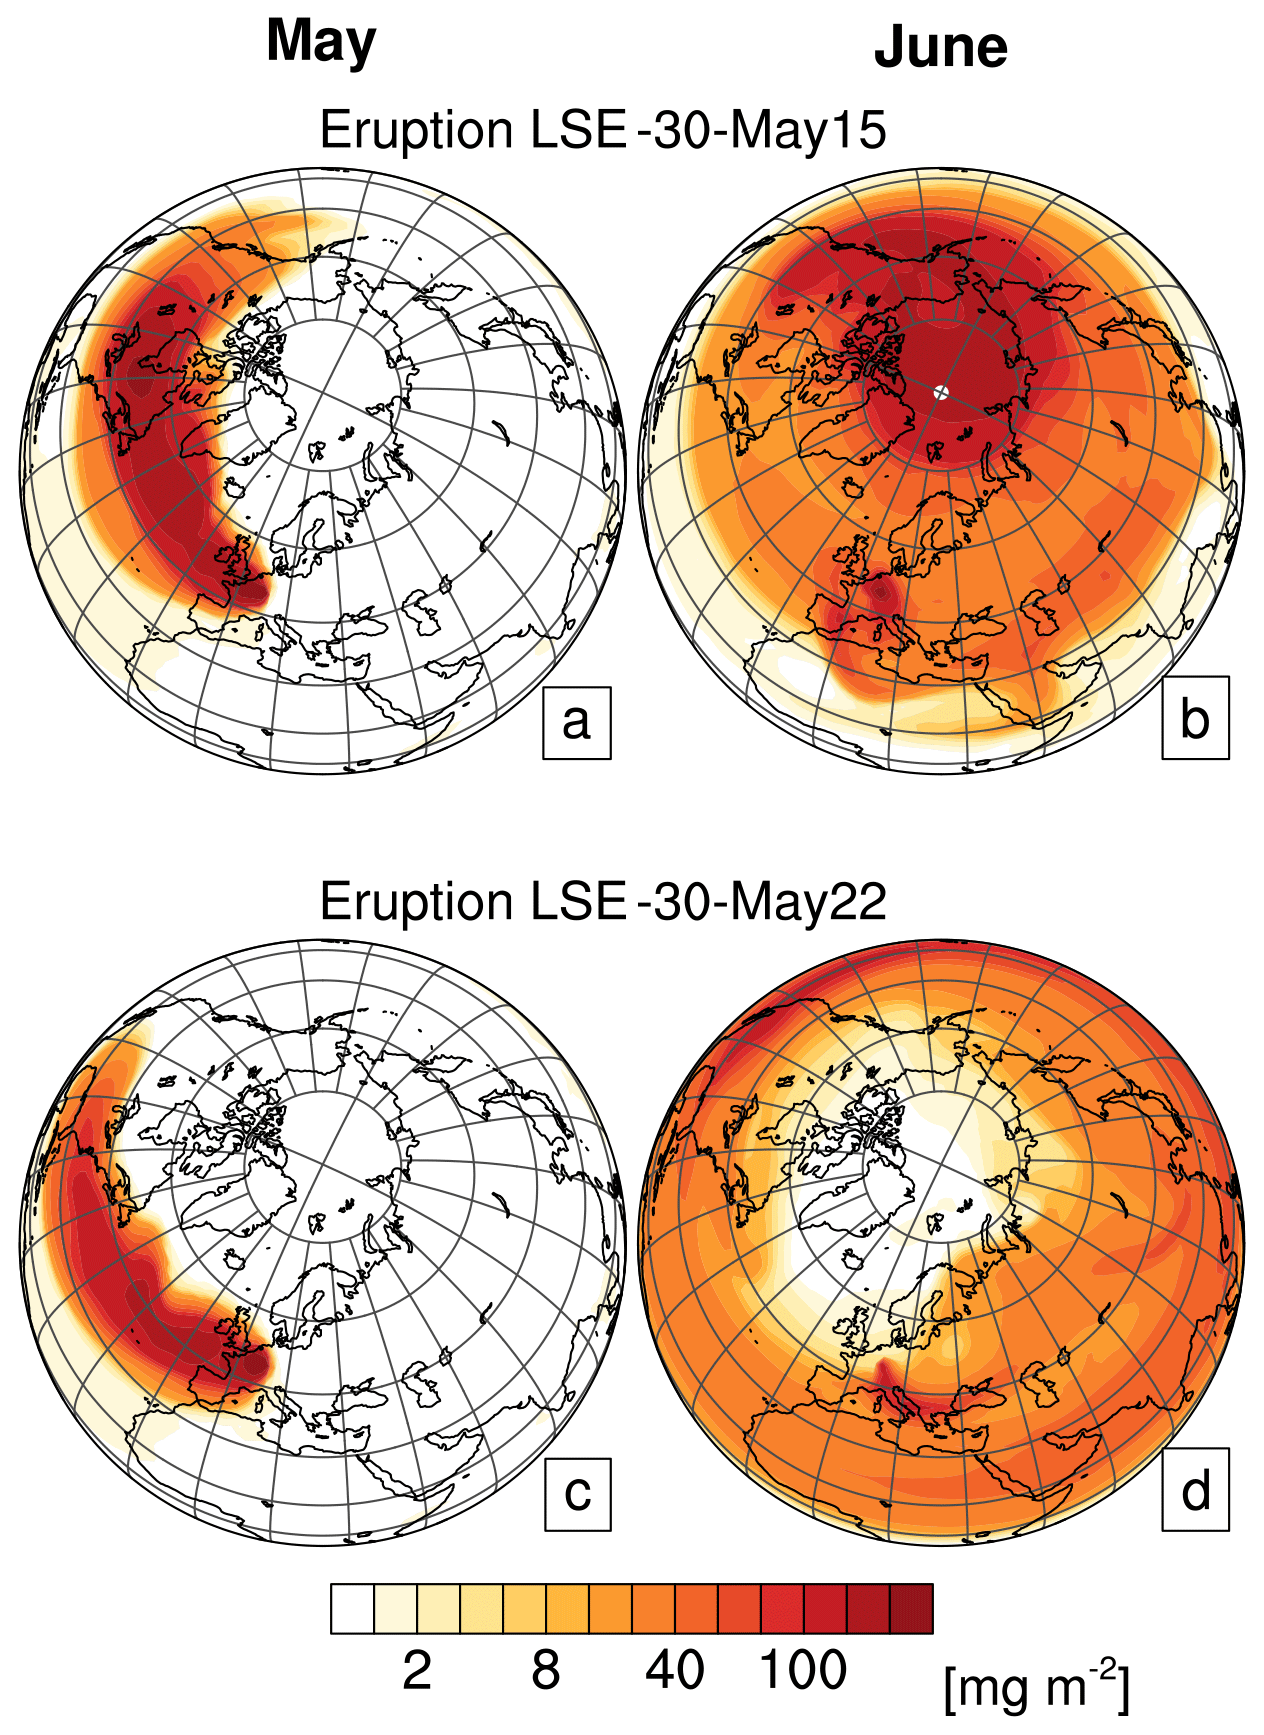
Figure 9Monthly mean sulfur burden (SO2 plus sulfate) shortly after the eruption (May, a, c; June, b, d) for the LSE-30-May15 (a, b) and LSE-30-May22 (c, d) scenarios with the same eruption rate but eruption on 15 and 22 May.
3.2.3 Radiative forcing
The radiative forcing at the top of the atmosphere (TOA) of sulfate aerosols, is, in general, negative with regional values below −2.5 W m−2 in the NH for roughly 1 year after the eruption (Fig. 10). During polar nights, the additional absorption of near-infrared and LW radiation due to the volcanic aerosol leads to positive forcing anomalies around 2 W m−2 at high latitudes. The lower injection altitude in LSE-100 results in a slightly stronger negative forcing peak compared to LSE-30, caused by smaller particle radii, and is also further extended to the south. In both cases, substantial negative forcing anomalies last until the end of the second summer after the eruptions not only in the NH but also the SH tropics and subtropics.

Figure 10Hovmøller diagram of zonally averaged radiative forcing (all sky, top of atmosphere) of sulfate aerosols of the LSE-30 (a) and LSE-100 (b) scenarios.
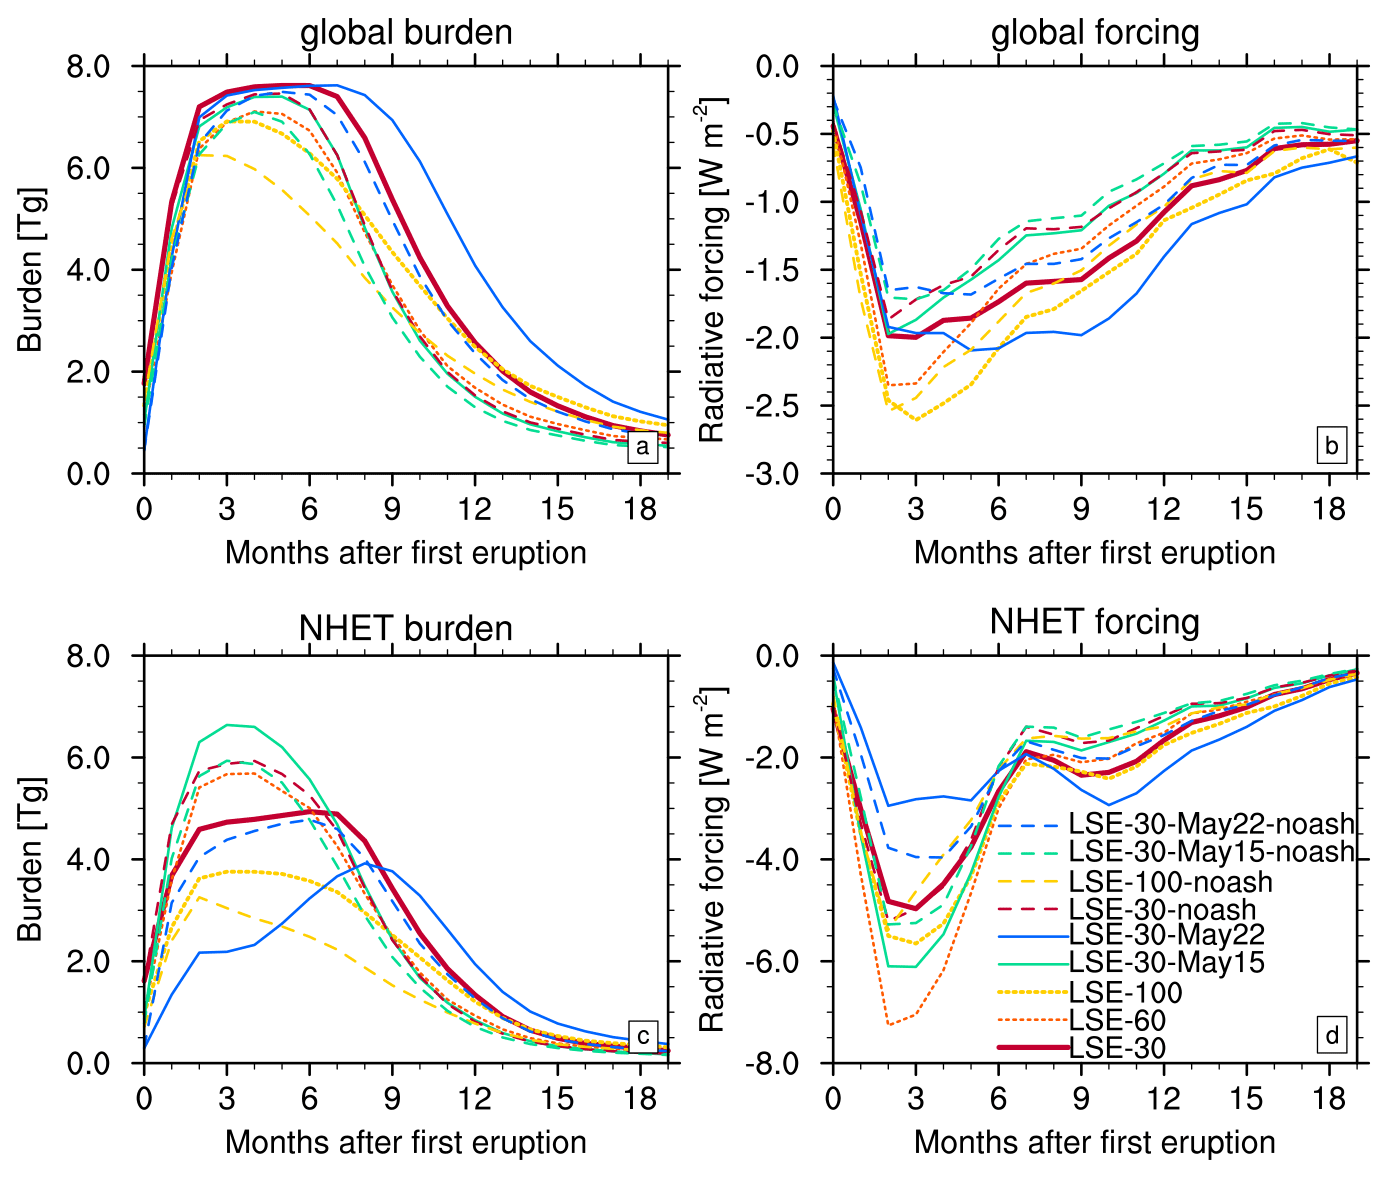
Figure 11Area average of sulfur burden (a, c) and radiative forcing (b, d, all sky, TOA) of sulfate aerosols over time. Top: global average. Bottom: average over the Northern Hemisphere extratropics (NHET, 30 to 90∘ N). Solid lines show the simulations with an initial injection of 15 Tg SO2 on different eruption days (LSE-30, LSE-30-May15, LSE-30-May22), dotted lines at different injection altitudes (LSE-60, LSE-100) and dashed lines simulations without the injection of fine ash (LSE-30-noash, LSE-30-May15-noash, LSE-30-Mar22-noash).
Compared to Graf and Timmreck (2001), the peak radiative forcing anomalies are smaller in our study but reach further into NH midlatitudes and low latitudes than previously simulated, mostly because of the different transport dynamics in our simulations with ash. Graf and Timmreck (2001) used a parameterization for the effective radius based on Russell et al. (1996) for the calculation of the optical parameters. These radii with peak values of 0.55 are much smaller than those in our study (>0.7 µm; Fig. S3) and scatter more efficiently, which could explain the higher forcing values in their study.
We compare global and Northern Hemisphere extratropics (NHET, 30 to 90∘ N) mean values of net TOA radiative forcing and sulfur burden for all our simulations with an initial emission of 15 Tg SO2 (Fig. 11). The global burden is rather similar between the most simulations in the first 6 months after the eruption but the decay time differs by up to 4 months (Fig. 11a). In general, the higher the injection altitude, the stronger the global burden maximum (LSE-30 to LSE-100, reddish curves). The shortest sulfate lifetime, i.e., the fastest decay rate of all simulations with fine ash, is shown in LSE-30-May15 and LSE-60. Both simulations show strong poleward transport (Figs. 5 and 8). LSE-30-May22 shows the latest decay of the maximum values of the global burden because of a strong equatorward component of the transport (Fig. 8).
This pattern is not fully mirrored in the radiative forcing (Fig. 11b). Scattering of solar radiation by sulfate aerosols depends on particle size; smaller particles scatter more intensely. The globally averaged radiative forcing increased with decreasing injection altitude because particles injected into an altitude of 100 hPa remain smaller compared to an injection into 30 hPa, which results in stronger global forcing. The ensemble mean of the three simulations with an injection of 15 Tg SO2 and fine ash (LSE-30, LSE-30-May15, LSE-30-May22) at the same altitude (Fig. S5) shows a higher burden, longer lifetime and stronger forcing in the global average compared to the ensemble without injected fine ash (LSE-30-noash, LSE-30-May15-noash, LSE-30-May22-noash). This is mainly caused by the stronger southward component in transport (see also the Discussion, Sect. 3.3) and smaller particle radii in simulations with fine ash.
Interestingly, our NHET results (Fig. 11c and d) are only partly in line with the globally averaged data. This difference is mainly caused by transport dynamics and consequently the amount of aerosol that moves into the tropics and Southern Hemisphere. Simulations with a strong poleward component of transport (LSE-60, LSE-30-May15) differ only slightly in their global and NHET burden (Fig. 11c), while the NHET burden evolves differently for LSE-30-May22. Figure 8 shows the stronger southward transport of LSE-30-May22 with the main aerosols located south of 40∘ N until the fifth month after the eruption. Consequently, also NHET burden and radiative forcing remain smaller than in the other simulations as large amounts of the burden did not add to the NHET values. The strongest negative radiative forcing in NHET is simulated in LSE-60 and LSE-30-May15, where most of the aerosols stay in NHET (Fig. 11d). In contrast, in LSE-30-May22, the regional impact in NHET is comparably small but the simulation shows a strong long-lasting decrease of the global radiative forcing. In the simulations without ash (dashed lines), the burden and global radiative forcing of NHET are stronger in the first 6 months after the eruption (see also ensemble mean in Fig. S5), as more aerosols stay in NHET than in the corresponding simulations with ash. We discuss details in the Discussion (Sect. 3.3) when comparing our results to previous studies, which have been simulated without an injection of fine ash.
3.2.4 Sulfur deposition
While deposition of volcanic ash occurs mostly in the first days after the eruption, volcanic sulfate aerosol has a longer lifetime and is distributed more globally. Deposition of sulfur occurs mostly by wet deposition in the troposphere and deposition patterns are determined by the storm tracks and the Intertropical Convergence Zone. Figure 12 shows for LSE-30 the global distribution of accumulated sulfur deposition over 1.5 years after the eruption. As expected following a NH midlatitude eruption deposition, values in the Southern Hemisphere are smaller than in the Northern Hemisphere; e.g., over the Southern Ocean values are only half of the values over the northern Atlantic. Importantly, according to our results, it might therefore in principle be possible to find LSE sulfate deposits in Greenlandic as well as Antarctic ice cores. For LSE eruptions of 100, 15 and 1.5 Tg (LSE-30-strong, LSE-30 and LSE4-30-low), respectively, we find averaged deposition values of 300, 40 and 6.7 mg m−2 over central Greenland (70 to 80∘ N, 30 to 50∘ W), while over Antarctica (75 to 85∘ S, 0–60∘ E), roughly 54, 6 and up to 1.8 mg (S) m−2 would have been deposited (Fig. S6). Our study thus indicates that a large NH midlatitude eruption such as the Laacher See eruption could show a bipolar signature (cf. Svensson et al., 2020). This finding may guide the identification of Laacher See eruption signals in ice-core data. Previous identification attempts were anchored in assumed dates of the eruption and most commonly looked towards major spikes around the 13 kyr BP mark. Baldini et al. (2018) ascribe a large sulfate spike at 12 867 years BP in the GISP2 (Greenland Ice Sheet Project 2) ice-core record to the Laacher See eruption. In contrast, Svensson et al. (2020) point at four large bipolar sulfate spikes clustered around 13 kyr BP. It remains unclear whether the prehistoric LSE should be associated with one of these major spikes or one of the minor spikes in the adjacent decades, or whether we can at all reliably link any of these sulfate spikes with this eruption. Increased age control on the eruption through, for instance, refined dendrochronological analyses may allow a more confident assignment of sulfate spikes to this particular eruption.

Figure 12Sulfur deposition [mg m−2] of the results of LSE-30 accumulated over a period of 1.5 years after the first eruption.
3.3 Discussion
At present, only few studies exist which have investigated the climatic impact of a NH midlatitude eruption with global aerosol models (e.g., Graf and Timmreck, 2001; Niemeier et al., 2009; Toohey et al., 2019; Marshall et al., 2019). Comparing our results to the emulator approach of Marshall et al. (2019), who analyzed the radiative forcing of eruptions at different altitudes, latitudes and magnitudes, we see broadly similar features. The effective radius of sulfate gets smaller with lower injection altitude and at the same time increases the radiative forcing, as well as the lifetime of the aerosols.
When comparing our results to previous simulations of NH midlatitude eruptions with ECHAM (Graf and Timmreck, 2001; Niemeier et al., 2009; Toohey et al., 2019), we can point out small yet important differences. These earlier studies suggest stronger transport towards high northern latitudes than shown in our results. Graf and Timmreck (2001) performed the first global simulation of a LSE-type eruption. Their eruption took place in May, and they used a much larger injection area, as well as an already prescribed northeastward transport of the volcanic cloud over the Baltic Sea. Therefore, we do not compare variables other than the radiative forcing described in Sect. 3.2.3.
Importantly, our study comes to a somewhat different result regarding the role of ash compared to Niemeier et al. (2009) for a simulated eruption of Mt. Katmai (58∘ N) with an assumed SO2 emission of 15 Tg and a fine ash emission of 100 Tg. In contrast to most of our simulations, they found a very small difference of global sulfur burden (1 %) between results of simulations with and without the injection of fine ash. Possible reasons for these differences can be the smaller amount of fine ash, the meteorological situation during the eruption and the grid resolution. Niemeier et al. (2009) assumed an eruption on 1 June with a clear northward flow which might have kept the difference small. Also Fig. 11 shows a smaller difference of the global burden between the simulations with the strongest northward transport (LSE-30-May15 and LSE6-noash). Additionally, the simulations of this study were performed with a better horizontal and vertical resolution than the previous study (T63/L95 vs. T42/L37). This can be an important difference when discussing the role of a mesocyclone, an important issue for future studies to address.
Toohey et al. (2019) compared winter (January) and summer (July) eruptions at different NH latitudes, i.e., 56 and 36∘ N. The stratospheric dynamic state is different when it is closer to the winter and summer solstice when compared to the dynamic state in spring, as discussed above. Hence, our results are not directly comparable to those of Toohey et al. (2019). In our LSE-30-May22 simulation, with an eruption day in late May, the eruption injects sulfate into a stratospheric dynamic state that is akin to summer conditions. However, simulation LSE-30-May22 does not match well with results of the 56∘ N summer eruption by Toohey et al. (2019). Our simulated sulfate transport (Fig. 7) corresponds more to their pattern of a subtropical volcanic eruption at 36∘ N (see Toohey et al., 2019, Fig. S3). Both our study and Toohey et al. (2019) use MAECHAM5-HAM, but we also consider volcanic ash. The additional impact of the heated ash cloud on the dynamics and flow pattern in the stratosphere causes more southward transport and therefore a sulfate distribution comparable to that of a summer eruption at 36∘ N without the injection of ash. In contrast, the corresponding simulation without volcanic ash (LSE-30-May15-noash) closely reflects the model results of a midlatitude summer eruption at 56∘ N by Toohey et al. (2019). In general, the ensemble without ash injection shows much smaller sulfate burden between the Equator and 30∘ N but higher values at high latitudes shortly after the eruption, resulting in lower global sulfate burden, earlier maxima and shorter atmospheric lifetime of the aerosols (Figs. 11 and S5). In line with Toohey et al. (2019), the maximum burden also decays faster in the simulation without ash (LSE-30-noash and LSE-100-noash) with decreasing injection altitude.
Our study strongly suggests that the injection of ash is important for the simulation of an eruption in the extratropics, independent of the eruption date in May. All our simulations with ash showed stronger transport to lower latitudes than the ones without. Our study reveals also that the development of a mesocyclonic volcanic ash cloud depends on emission altitude and rate. Other factors which might likely be important are gas-to-particle interactions and the ash size distribution.
Observations after the eruption of El Chichón (e.g., Woods and Chuan, 1983; Chuan and Woods, 2013; Pueschel et al., 1994) found ash in the atmosphere that was mantled with sulfuric acid, which could be relevant for the simulated sulfate composition in the stratosphere (Zhu et al., 2020; Muser et al., 2020). Our simulations neglect this effect, resulting in a possible slight overestimation of the SO2 lifetime. We also include a single mode of fine ash which is merely a small part of the possible spectrum of grain sizes of ejecta. Varying grain size distributions may not only alter the radiative heating due to volcanic ash in duration and strength but also impact the onset of cloud rotation. In addition, our simulated ash deposition shows only a fraction of the possible deposition. Models, e.g., ICON-ART (Muser et al., 2020), which consider several ash modes and take gas-to-particle processes into account (e.g., ash coating due to sulfuric acid) may allow more detailed studies regarding the impact of the rotating volcanic cloud on stratospheric dynamics and tracer transport.
For our reference scenario (LSE-30), with an injection of sulfur and ash at 30 and 50 hPa, we find conditions for simulating a realistic scenario in 1 of 3 years only. At lower altitudes, the wind in the stratosphere is more variable, and one may find more days with wind patterns that allow an ash deposition comparable to the reconstructed LSE lobe also slightly later in the year. Hence, our LSE-100 simulation with an injection altitude of sulfur and ash at 100 and 120 hPa, respectively, might present, under present-day conditions, a more realistic injection scenario for the LSE. It also aptly reflects the fact that no volcanic ash from this eruption reached Greenland. The simulated deposition pattern of fine volcanic ash also indicates that our strong emission scenario, LSE-30-strong with an injection of 100 Tg SO2 and 1000 Tg of fine ash, is not likely.
MAECHAM-HAM is known for a shorter lifetime for stratospheric volcanic aerosols compared to other aerosol models (Clyne et al., 2020; Marshall et al., 2018; Zanchettin et al., 2016). The reason for the shorter lifetime is complex, e.g., missing gas-phase chemistry with more realistic OH depletion, gravity wave parameterization, strength of meridional transport and grid resolution of the models. A longer lifetime of even just a couple of months would prolong the climate impact of the eruption but would not lead to a dramatic climate shift as implied by Baldini et al. (2018). This would almost certainly require other processes to be involved. A multi-model comparison of global aerosol models revealed that the simulated volcanic sulfate deposition differs considerably between the models in timing, spatial pattern and magnitude due to differences in both the transport and the formation of sulfate aerosol (Marshall et al., 2018). Deposition values should therefore be taken as approximate only.
For our study, we had to make assumptions regarding several parameter values. One of the most critical ones is the relationship between the ejecta of volcanic sulfur and fine ash, which we set constant to 1:10. A different fraction would certainly change our results. The transport pattern will most likely be dominated by the amount of ash in the volcanic cloud during the weeks immediately after the eruptive phase, while after a month the amount of sulfate released is most important. Other factors are unknown or estimated with high uncertainty at best. We aimed to test the sensitivity of our results to some of these uncertainties (emission rate, altitude, meteorological conditions) but exhaustive sensitivity testing has not been possible in this experimental design. To arrive at a more comprehensive picture on the impact of these parameters (e.g., injection altitude, injection duration, ash-to-sulfate ratio, time of the year) on the volcanic radiative forcing and climate, emulation studies akin to that by Marshall et al. (2019) would be desirable.
We here report renewed attempts to model a large and explosive midlatitude NH eruption akin to the cataclysmic eruption of the Laacher See volcano around 13 000 years ago. We simulate such an eruption under volcanological and meteorological conditions mirroring those of the Late Pleistocene eruption as documented in diverse geological, paleoenvironmental and archeological archives. Our study aligns well with that of Toohey et al. (2019) in highlighting the impact potential of extratropical eruptions but complements their general model by exploring specific source parameters in a quasi-realistic scenario. In line with previous studies, we also find that source parameters have a substantial impact on aerosol transport as well as downstream climatic impacts. Apart from this, we could demonstrate for the first time the importance of volcanic ash for the burden, lifetime and radiative forcing of a large NH midlatitude eruption. We find that heating of ash and the consequent rotation of the ash cloud play a crucial role in the initial transport of the fine ash and that of sulfate. The additional heating of the fine ash causes more southward transport into areas with stronger solar irradiation, which increases the impact further. Consequently, in this study, the sulfur burden resulting from an eruption at 50∘ N with fine ash is more comparable to a simulation of a subtropical eruption without ash in Toohey et al. (2019). This shows the importance of ash for the sulfate distribution after a strong extratropical volcanic eruption. Therefore, fine ash should be taken into account in future studies – a recommendation that differs from our previous results reported by Niemeier et al. (2009).
The formation of a mesocyclone in the aftermath of the eruption may, at least partly, provides an explanation for the maximum and uneven deposition of Laacher See tephra in the eruption's medial field and the elusive tephra signal of LSE ash deposits in the Greenlandic ice cores. That said, our study does suggest that the assignment of a particular, albeit almost certainly minor, ice-core sulfate spike to the LSE may yet be possible, both in the Arctic and the Antarctic.
Given the dramatically different land–sea relations in the Late Pleistocene as well as differences in NH climate systems, it is unlikely that climate models for the present day suitably capture the stratospheric wind patterns that prevailed at 13 kyr BP. Our modeling study does, however, provide new insights into both the ancient eruption of the Laacher See volcano, and it provides pointers for risk assessment scenarios related to potential future volcanism in the Eifel (cf. Leder et al., 2017). Our initial conditions were taken to fit the modeled ash deposition to the observed lobes of the LSE. Therefore, they depend on the specific conditions found – in our case, on a single day in early May. Such an eruption date fits well with that suggested for the ancient eruption, although it likely represents an earliest starting date.
Our simulations provide tantalizing hints regarding the likely climatic and environmental impacts of the LSE, yet it remains difficult to assess these impacts fully from general circulation models alone. Instead, it stands clear that the impact on climate of both the Late Pleistocene Laacher See eruption and any future eruption scenarios has to be calculated with a fully coupled atmosphere–ocean model that, for the ancient eruption, takes account of contemporaneous land–sea relations including the fast and abrupt climate changes that occurred during the transition from the glacial to the interglacial. For future eruptions, such modeling efforts similarly need to account for the rapidly changing climatic boundary conditions of the Anthropocene.
Primary data and scripts used in the analysis and other supplementary information that may be useful in reproducing the author's work are archived by the Max Planck Institute for Meteorology and can be obtained by contacting publications@mpimet.mpg.de. Model results are available at http://cera-www.dkrz.de/WDCC/ui/Compact.jsp?acronym=DKRZ_LTA_550_ds00004 (last access: 1 October 2020, see Niemeier et al., 2020b).
The supplement related to this article is available online at: https://doi.org/10.5194/cp-17-633-2021-supplement.
All authors designed the study. UN performed the simulations and the analysis, and coordinated the writing process with equal contributions of all co-authors.
The authors declare that they have no conflict of interest.
This article is part of the special issue “Interdisciplinary studies of volcanic impacts on climate and society”. It is not associated with a conference.
We thank Christian Tegner, Anke Zernack, Anja Schmidt and Clive Oppenheimer for inspiring discussions and Traute Crüger for valuable comments on an earlier version of this paper. We thank two anonymous reviewer for their comments and suggestions, which greatly improved the manuscript.
This work used resources of the Deutsches Klimarechenzentrum (DKRZ) granted by its Scientific Steering Committee (WLA) under project ID bb1093.
This research has been supported by the Deutsche Forschungsgemeinschaft Research Unit VollImpact (FOR2820 (grant no. 398006378)) and the H2020 European Research Council (CLIOARCH (grant agreement no. 817564)).
The article processing charges for this open-access publication were covered by the Max Planck Society.
This paper was edited by Céline Vidal and reviewed by two anonymous referees.
Abbott, P. M. and Davies, S. M.: Volcanism and the Greenland ice-cores: the tephra record, Earth-Sci. Rev., 115, 173–191, https://doi.org/10.1016/j.earscirev.2012.09.001, 2012. a
Andrews, D. G., Holton, J. R., and Leovy, C. B.: Middle Atmosphere Dynamics, Academic Press, San Diego, CA, 1987. a
Aquila, V., Oman, L. D., Stolarski, R. S., Colarco, P. R., and Newman, P. A.: Dispersion of the volcanic sulfate cloud from a Mount Pinatubo-like eruption, J. Geophys. Res-Atmos., 117, D06216, https://doi.org/10.1029/2011JD016968, 2012. a
Aspinall, W. and Woo, G.: Counterfactual Analysis of Runaway Volcanic Explosions, Front. Earth Sci., 7, 222, https://doi.org/10.3389/feart.2019.00222, 2019. a
Baales, M., Jöris, O., Street, M., Bittmann, F., Weninger, B., and Wiethold, J.: Impact of the Late Glacial Eruption of the Laacher See Volcano, Central Rhineland, Germany, Quaternary Res., 58, 273–288, https://doi.org/10.1006/qres.2002.2379, 2002. a, b, c
Baines, P. G. and Sparks, R. S. J.: Dynamics of giant volcanic ash clouds from supervolcanic eruptions, Geophys. Res. Lett., 32, L24808, https://doi.org/10.1029/2005GL024597, 2005. a, b, c, d
Baldini, J. U. L., Brown, R. J., and Mawdsley, N.: Evaluating the link between the sulfur-rich Laacher See volcanic eruption and the Younger Dryas climate anomaly, Clim. Past, 14, 969–990, https://doi.org/10.5194/cp-14-969-2018, 2018. a, b, c, d
Blong, R., Riede, F., and Chen, Q.: A fuzzy logic methodology for assessing the resilience of past communities to tephra fall: a Laacher See eruption 13,000 year BP case, Volcanica, 1, 63–84, https://doi.org/10.30909/vol.01.01.6384, 2018. a, b
Bronk Ramsey, C., Albert, P. G., Blockley, S. P., Hardiman, M., Housley, R. A., Lane, C. S., Lee, S., Matthews, I. P., Smith, V. C., and Lowe, J. J.: Improved age estimates for key Late Quaternary European tephra horizons in the RESET lattice, Quaternary Sci. Rev., 118, 18–32, https://doi.org/10.1016/j.quascirev.2014.11.007, synchronising Environmental and Archaeological Records using Volcanic Ash Isochrons, 2015. a
Chakraborty, P., Gioia, G., and Kieffer, S.: Volcanic mesocyclones, Nature, 458, 497–500, https://doi.org/10.1038/nature07866, 2009. a
Chuan, R. L. and Woods, D. C.: Temporal variations in characteristics of the El Chichon stratospheric cloud, Geofis. Int., Vol. 23, available at: http://revistagi.geofisica.unam.mx/index.php/RGI/article/view/1155 (last access: 23 January 2020), 2013. a
Clyne, M., Lamarque, J.-F., Mills, M. J., Khodri, M., Ball, W., Bekki, S., Dhomse, S. S., Lebas, N., Mann, G., Marshall, L., Niemeier, U., Poulain, V., Robock, A., Rozanov, E., Schmidt, A., Stenke, A., Sukhodolov, T., Timmreck, C., Toohey, M., Tummon, F., Zanchettin, D., Zhu, Y., and Toon, O. B.: Model physics and chemistry causing intermodel disagreement within the VolMIP-Tambora Interactive Stratospheric Aerosol ensemble, Atmos. Chem. Phys. Discuss. [preprint], https://doi.org/10.5194/acp-2020-883, in review, 2020. a
Costa, A., Folch, A., and Macedonio, G.: Density-driven transport in the umbrella region of volcanic clouds: Implications for tephra dispersion models, Geophys. Res. Lett., 40, 4823–4827, https://doi.org/10.1002/grl.50942, 2013. a, b
Donovan, A. and Oppenheimer, C.: Imagining the Unimaginable: Communicating Extreme Volcanic Risk, Springer International Publishing, Cham, 149–163, https://doi.org/10.1007/11157_2015_16, 2018. a
English, J. M., Toon, O., and Mills, M. J.: Microphysical simulations of large volcanic eruptions: Pinatubo and Toba, J. Geophys. Res.-Atmos., 118, 1880–1895, https://doi.org/10.1002/jgrd.50196, 2013. a
Giorgetta, M. A., Manzini, E., Roeckner, E., Esch, M., and Bengtsson, L.: Climatology and forcing of the quasi–biennial oscillation in the MAECHAM5 model, J. Climate, 19, 3882–3901, 2006. a
Graf, H.-F. and Timmreck, C.: Aerosol radiative forcing of the Laacher See volcano eruption, J. Geophys. Res., 106, 14747–14756, 2001. a, b, c, d, e, f, g, h
Guo, S., Rose, W. I., Bluth, G. J. S., and Watson, I. M.: Particles in the great Pinatubo volcanic cloud of June 1991: The role of ice, Geochemistry, Geophys. Geosystems, 5, Q05003, https://doi.org/10.1029/2003GC000655, 2004. a
Hajdas, I., Zolitschka, B., Ivy-Ochs, S. D., Beer, J., Bonani, G., Leroy, S. A., Negendank, J. W., Ramrath, M., and Suter, M.: AMS radiocarbon dating of annually laminated sediments from lake Holzmaar, Germany, Quaternary Sci. Rev., 14, 137–143, https://doi.org/10.1016/0277-3791(94)00123-S, 1995. a
Harms, E. and Schmincke, H.: Volatile composition of the phonolitic Laacher See magma (12,900 yr BP): implications for syn-eruptive degassing of S, F, Cl and H2O, Contrib. Mineral. Petr., 138, 84–98, https://doi.org/10.1007/PL00007665, 2000.
Holasek, R. E., Woods, A. W., and Self, S.: Experiments on gas-ash separation processes in volcanic umbrella clouds, J. Volcanol. Geotherm. Res., 70, 169–181, https://doi.org/10.1016/0377-0273(95)00054-2, 1996. a
Hommel, R., Timmreck, C., and Graf, H. F.: The global middle-atmosphere aerosol model MAECHAM5-SAM2: comparison with satellite and in-situ observations, Geosci. Model Dev., 4, 809–834, https://doi.org/10.5194/gmd-4-809-2011, 2011. a
Hurrell, J. W., Hack, J. J., Shea, D., Caron, J. M., and Rosinski, J.: A New Sea Surface Temperature and Sea Ice Boundary Dataset for the Community Atmosphere Model, J. Climate, 21, 5145–5153, https://doi.org/10.1175/2008JCLI2292.1, 2008. a
Jaiser, R., Dethloff, K., and Handorf, D.: Stratospheric response to Arctic sea ice retreat and associated planetary wave propagation changes, Tellus A, 65, 19375, https://doi.org/10.3402/tellusa.v65i0.19375, 2013. a
Jones, A. C., Haywood, J. M., Jones, A., and Aquila, V.: Sensitivity of volcanic aerosol dispersion to meteorological conditions: A Pinatubo case study, J. Geophys. Res.-Atmos., 121, 6892–6908, https://doi.org/10.1002/2016JD025001, 2016. a
Lamb, H. H. and Sawyer, J. S.: Volcanic dust in the atmosphere; with a chronology and assessment of its meteorological significance, Philos. Trans. A Math. Phys. Eng. Sci., 266, 425–533, https://doi.org/10.1098/rsta.1970.0010, 1970. a
Leder, J., Wenzel, F., Daniell, J. E., and Gottschämmer, E.: Loss of residential buildings in the event of a re-awakening of the Laacher See Volcano (Germany), J. Volcanol. Geotherm. Res., 337, 111–123, https://doi.org/10.1016/j.jvolgeores.2017.02.019, 2017. a, b
Mackie, S., Cashman, K., Ricketts, H., Rust, A., and Watson, M.: Volcanic ash: hazard observation, Elsevier, Oxford, https://doi.org/10.1016/C2014-0-03381-3, 2016. a
Marshall, L., Schmidt, A., Toohey, M., Carslaw, K. S., Mann, G. W., Sigl, M., Khodri, M., Timmreck, C., Zanchettin, D., Ball, W. T., Bekki, S., Brooke, J. S. A., Dhomse, S., Johnson, C., Lamarque, J.-F., LeGrande, A. N., Mills, M. J., Niemeier, U., Pope, J. O., Poulain, V., Robock, A., Rozanov, E., Stenke, A., Sukhodolov, T., Tilmes, S., Tsigaridis, K., and Tummon, F.: Multi-model comparison of the volcanic sulfate deposition from the 1815 eruption of Mt. Tambora, Atmos. Chem. Phys., 18, 2307–2328, https://doi.org/10.5194/acp-18-2307-2018, 2018. a, b
Marshall, L., Johnson, J. S., Mann, G. W., Lee, L., Dhomse, S. S., Regayre, L., Yoshioka, M., Carslaw, K. S., and Schmidt, A.: Exploring How Eruption Source Parameters Affect Volcanic Radiative Forcing Using Statistical Emulation, J. Geophys. Res.-Atmos., 124, 964–985, https://doi.org/10.1029/2018JD028675, 2019. a, b, c, d, e, f
Martin, S. C.: Past eruptions and future predictions: Analyzing ancient responses to Mount Vesuvius for use in modern risk management, J. Volcanol. Geotherm. Res., 396, 106851, https://doi.org/10.1016/j.jvolgeores.2020.106851, 2020. a
Mastrolorenzo, G., Petrone, P., Pappalardo, L., and Sheridan, M. F.: The Avellino 3780-yr-B.P. catastrophe as a worst-case scenario for a future eruption at Vesuvius, P. Natl. Acad. Sci. USA, 103, 4366–4370, https://doi.org/10.1073/pnas.0508697103, 2006. a
Mazzorana, B., Hübl, J., and Fuchs, S.: Improving risk assessment by defining consistent and reliable system scenarios, Nat. Hazards Earth Syst. Sci., 9, 145–159, https://doi.org/10.5194/nhess-9-145-2009, 2009. a
Merkt, J. and Müller, H.: Varve chronology and palynology of the Lateglacial in Northwest Germany from lacustrine sediments of Hamelsee in Lower Saxony, Quat. Int., 61, 41–59, 1999. a
Mills, M. J., Richter, J. H., Tilmes, S., Kravitz, B., MacMartin, D. G., Glanville, A. A., Tribbia, J. J., Lamarque, J.-F., Vitt, F., Schmidt, A., Gettelman, A., Hannay, C., Bacmeister, J. T., and Kinnison, D. E.: Radiative and Chemical Response to Interactive Stratospheric Sulfate Aerosols in Fully Coupled CESM1(WACCM), J. Geophys. Res.-Atmos., 122, 13061–13078, https://doi.org/10.1002/2017JD027006, 2017. a
Mossop, S.: Volcanic Dust Collected at an Altitude of 20 KM, Nature, 203, 824–827, https://doi.org/10.1038/203824a0, 1964. a, b
Muser, L. O., Hoshyaripour, G. A., Bruckert, J., Horváth, Á., Malinina, E., Wallis, S., Prata, F. J., Rozanov, A., von Savigny, C., Vogel, H., and Vogel, B.: Particle aging and aerosol–radiation interaction affect volcanic plume dispersion: evidence from the Raikoke 2019 eruption, Atmos. Chem. Phys., 20, 15015–15036, https://doi.org/10.5194/acp-20-15015-2020, 2020. a, b, c, d
Newhall, C. G. and Self, S.: The volcanic explosivity index (VEI) an estimate of explosive magnitude for historical volcanism, J. Geophys. Res.-Oceans, 87, 1231–1238, https://doi.org/10.1029/JC087iC02p01231, 1982. a
Niemeier, U. and Schmidt, H.: Changing transport processes in the stratosphere by radiative heating of sulfate aerosols, Atmos. Chem. Phys., 17, 14871–14886, https://doi.org/10.5194/acp-17-14871-2017, 2017. a
Niemeier, U. and Timmreck, C.: What is the limit of climate engineering by stratospheric injection of SO2?, Atmos. Chem. Phys., 15, 9129–9141, https://doi.org/10.5194/acp-15-9129-2015, 2015. a
Niemeier, U., Timmreck, C., Graf, H.-F., Kinne, S., Rast, S., and Self, S.: Initial fate of fine ash and sulfur from large volcanic eruptions, Atmos. Chem. Phys., 9, 9043–9057, https://doi.org/10.5194/acp-9-9043-2009, 2009. a, b, c, d, e, f, g, h, i, j, k, l
Niemeier, U., Timmreck, C., and Krüger, K.: Revisiting the Agung 1963 volcanic forcing – impact of one or two eruptions, Atmos. Chem. Phys., 19, 10379–10390, https://doi.org/10.5194/acp-19-10379-2019, 2019. a
Niemeier, U., Richter, J. H., and Tilmes, S.: Differing responses of the quasi-biennial oscillation to artificial SO2 injections in two global models, Atmos. Chem. Phys., 20, 8975–8987, https://doi.org/10.5194/acp-20-8975-2020, 2020a. a
Niemeier, U., Riede, F., and Timmreck, C.: ECHAM5 Data of: Simulation of a Laacher See-type eruption, World Data Center for Climate (WDCC) at DKRZ, available at: http://cera-www.dkrz.de/WDCC/ui/Compact.jsp?acronym=DKRZ_LTA_550_ds00004, last access: 1 October 2020b. a
Prata, A. T.: Remote Sensing of Volcanic Eruptions, American Geophysical Union (AGU), chap. 14, 289–322, https://doi.org/10.1002/9781119054146.ch14, 2016. a
Prata, F., Woodhouse, M., Huppert, H. E., Prata, A., Thordarson, T., and Carn, S.: Atmospheric processes affecting the separation of volcanic ash and SO2 in volcanic eruptions: inferences from the May 2011 Grímsvötn eruption, Atmos. Chem. Phys., 17, 10709–10732, https://doi.org/10.5194/acp-17-10709-2017, 2017. a
Pueschel, R. F., Russell, P. B., Allen, D. A., Ferry, G. V., Snetsinger, K. G., Livingston, J. M., and Verma, S.: Physical and optical properties of the Pinatubo volcanic aerosol: Aircraft observations with impactors and a Sun-tracking photometer, J. Geophys. Res.-Atmos., 99, 12915–12922, https://doi.org/10.1029/94JD00621, 1994. a
Reinig, F., Cherubini, P., Engels, S., Esper, J., Guidobaldi, G., Jöris, O., Lane, C., Nievergelt, D., Oppenheimer, C., Park, C., Pfanz, H., Riede, F., Schmincke, H.-U., Street, M., Wacker, L., and Büntgen, U.: Towards a dendrochronologically refined date of the Laacher See eruption around 13 000 years ago, Quaternary Sci. Rev., 229, 106128, https://doi.org/10.1016/j.quascirev.2019.106128, 2020. a, b, c, d, e
Riede, F.: The Laacher See-eruption (12,920 BP) and material culture change at the end of the Allerød in Northern Europe, J. Archaeol. Sci., 35, 591–599, https://doi.org/10.1016/j.jas.2007.05.007, 2008. a
Riede, F.: Splendid Isolation: The Eruption of the Laacher See Volcano & Southern Scandinavian Late Glacial Hunter-Gatherers, Aarhus Universitetsforlag, Aarhus, 2017. a, b
Riede, F. and Bazely, O.: Testing the “Laacher See hypothesis”: a health hazard perspective, J. Archaeol. Sci., 36, 675–683, https://doi.org/10.1016/j.jas.2008.10.013, 2009. a
Riede, F. and Bazely, O., Newton, A. J., and Lane, C. S.: A Laacher See-eruption supplement to Tephrabase: Investigating distal tephra fallout dynamics, Quatern. Int., 246, 134–144, https://doi.org/10.1016/j.quaint.2011.06.029, 2011. a, b, c, d
Russell, P. B., Livingston, J. M., Pueschel, R. F., Pollack, J. B., Brooks, S., Hamill, P., Hughes, J., Thomason, L., Stowe, L., Deshler, T., and Dutton, E.: Global to microscale evolution of the Pinatubo volcanic aerosol, derived from diverse measurements and analyses, J. Geophys. Res., 101, 18745–18763, 1996. a
Schmidt, A., Ostro, B., Carslaw, K. S., Wilson, M., Thordarson, T., Mann, G. W., and Simmons, A. J.: Excess mortality in Europe following a future Laki-style Icelandic eruption, P. Natl. Acad. Sci. USA, 108, 15710–15715, https://doi.org/10.1073/pnas.1108569108, 2011. a
Schmincke, H.-U.: Volcanism, Springer Science & Business Media, Berlin, Heidelberg, Vol. 28, https://doi.org/10.1007/978-3-642-18952-4, 2004. a
Schmincke, H.-U.: Vulkanismus: 3, Überarb. Aufl., Primus-Verl., Wissenschaftliche Buchgesellschaft, Darmstadt, 2010. a, b, c
Schmincke, H.-U., Park, C., and Harms, E.: Evolution and environmental impacts of the eruption of Laacher See Volcano (Germany) 12 900 a BP, Quatern. Int., 61, 61–72, https://doi.org/10.1016/S1040-6182(99)00017-8, 1999. a, b
Schneider, D. J., Rose, W. I., Coke, L. R., Bluth, G. J. S., Sprod, I. E., and Krueger, A. J.: Early evolution of a stratospheric volcanic eruption cloud as observed with TOMS and AVHRR, J. Geophys. Res., 104, 4037–4050, https://doi.org/10.1029/1998JD200073, 1999. a
Sonnek, K., Mårtensson, T., Veibäck, E., Tunved, P., Grahn, H., von Schoenberg, P., Brännström, N., and Bucht, A.: The impacts of a Laki-like eruption on the present Swedish society., Nat Hazards, 88, 1565–1590, https://doi.org/10.1007/s11069-017-2933-0, 2017. a
Stier, P., Feichter, J., Kinne, S., Kloster, S., Vignati, E., Wilson, J., Ganzeveld, L., Tegen, I., Werner, M., Balkanski, Y., Schulz, M., Boucher, O., Minikin, A., and Petzold, A.: The aerosol-climate model ECHAM5-HAM, Atmos. Chem. Phys., 5, 1125–1156, https://doi.org/10.5194/acp-5-1125-2005, 2005. a, b
Svensson, A., Dahl-Jensen, D., Steffensen, J. P., Blunier, T., Rasmussen, S. O., Vinther, B. M., Vallelonga, P., Capron, E., Gkinis, V., Cook, E., Kjær, H. A., Muscheler, R., Kipfstuhl, S., Wilhelms, F., Stocker, T. F., Fischer, H., Adolphi, F., Erhardt, T., Sigl, M., Landais, A., Parrenin, F., Buizert, C., McConnell, J. R., Severi, M., Mulvaney, R., and Bigler, M.: Bipolar volcanic synchronization of abrupt climate change in Greenland and Antarctic ice cores during the last glacial period, Clim. Past, 16, 1565–1580, https://doi.org/10.5194/cp-16-1565-2020, 2020. a, b, c
Textor, C., Sachs, P. M., Graf, H.-F., and Hansteen, T. H.: The 12 900 years BP Laacher See eruption: estimation of volatile yields and simulation of their fate in the plume, Geol. Soc. Spec. Publ., 213, 307–328, https://doi.org/10.1144/GSL.SP.2003.213.01.19, 2003. a, b, c
Timmreck, C.: Three–dimensional simulation of stratospheric background aerosol: First results of a multiannual general circulation model simulation, J. Geophys. Res., 106, 28313–28332, 2001. a
Timmreck, C. and Graf, H.-F.: The initial dispersal and radiative forcing of a Northern Hemisphere mid-latitude super volcano: a model study, Atmos. Chem. Phys., 6, 35–49, https://doi.org/10.5194/acp-6-35-2006, 2006. a
Toohey, M., Krüger, K., Sigl, M., Stordal, F., and Svensen, H.: Climatic and societal impacts of a volcanic double event at the dawn of the Middle Ages, Clim. Change, 136, 401–412, https://doi.org/10.1007/s10584-016-1648-7, 2016. a
Toohey, M., Krüger, K., Schmidt, H., Timmreck, C., Sigl, M., Stoffel, M., and Wilson, R.: Disproportionately strong climate forcing from extratropical explosive volcanic eruptions, Nat. Geosci., 12, 100–107, https://doi.org/10.1038/s41561-018-0286-2, 2019. a, b, c, d, e, f, g, h, i, j, k, l, m, n, o, p
Ungarish, M., Johnson, C., and Hogg, A.: Sustained axisymmetric intrusions in a rotating system, Eur. J. Mech. B Fluid., 56, 110–119, https://doi.org/10.1016/j.euromechflu.2015.10.008, 2016. a
van den Bogaard, P. and Schmincke, H.-U.: Laacher See Tephra: A widespread isochronous late Quaternary tephra layer in central and northern Europe, Geol. Soc. Am. Bull., 96, 1554–1571, 1985. a
Vernier, J.-P., Fairlie, T. D., Deshler, T., Natarajan, M., Knepp, T., Foster, K., Wienhold, F. G., Bedka, K. M., Thomason, L., and Trepte, C.: In situ and space-based observations of the Kelud volcanic plume: The persistence of ash in the lower stratosphere, J. Geophys. Res.-Atmos., 121, 11104–11118, https://doi.org/10.1002/2016JD025344, 2016. a
Woods, D. C. and Chuan, R. L.: Size-specific composition of aerosols in the El Chichon volcanic cloud, Geophys. Res. Lett., 10, 1041–1044, https://doi.org/10.1029/GL010i011p01041, 1983. a
Zanchettin, D., Khodri, M., Timmreck, C., Toohey, M., Schmidt, A., Gerber, E. P., Hegerl, G., Robock, A., Pausata, F. S. R., Ball, W. T., Bauer, S. E., Bekki, S., Dhomse, S. S., LeGrande, A. N., Mann, G. W., Marshall, L., Mills, M., Marchand, M., Niemeier, U., Poulain, V., Rozanov, E., Rubino, A., Stenke, A., Tsigaridis, K., and Tummon, F.: The Model Intercomparison Project on the climatic response to Volcanic forcing (VolMIP): experimental design and forcing input data for CMIP6, Geosci. Model Dev., 9, 2701–2719, https://doi.org/10.5194/gmd-9-2701-2016, 2016. a
Zhu, Y., Toon, O. B., Jensen, E. J., Bardeen, C. G., Mills, M. J., Tolbert, M. A., Yu, P., and Woods, S.: Persisting volcanic ash particles impact strato-spheric SO2 lifetime and aerosol optical properties, Nat. Commun., 11, 4526, https://doi.org/10.1038/s41467-020-18352-5, 2020. a, b
Zuccaro, G., Cacace, F., Spence, R., and Baxter, P.: Impact of explosive eruption scenarios at Vesuvius, evaluating Explosive Eruption Risk at European Volcanoes, J. Volcanol. Geotherm. Res., 178, 416–453, https://doi.org/10.1016/j.jvolgeores.2008.01.005, 2008. a