the Creative Commons Attribution 4.0 License.
the Creative Commons Attribution 4.0 License.
 | 11 Mar 2021
Simulated stability of the Atlantic Meridional Overturning Circulation during the Last Glacial Maximum
Frerk Pöppelmeier
Jeemijn Scheen
Aurich Jeltsch-Thömmes
Thomas F. Stocker
The response of the Atlantic Meridional Overturning Circulation (AMOC) to freshwater perturbations critically depends on its mean state. Large swaths of icebergs melting in the North Atlantic during the last deglaciation constituted such perturbations and can, thus, provide important constraints on the stability of the AMOC. However, the mean AMOC state during the Last Glacial Maximum (LGM), preceding the rapid disintegration of the ice sheets during the deglaciation, as well as its response to these perturbations remain debated. Here, we investigate the evolution of the AMOC as it responds to freshwater perturbations under improved LGM boundary conditions in the Bern3D intermediate complexity model. Particularly, we consider the effect of an open versus a closed Bering Strait and the effect of increased tidal dissipation as a result of the altered bathymetry due to the lower glacial sea level stand. The vigorous and deep AMOC under these glacial boundary conditions, consistent with previous simulations with different models, reacts more strongly to North Atlantic freshwater forcings than under preindustrial conditions. This increased sensitivity is mostly related to the closed Bering Strait that cuts off the freshwater escape route through the Arctic into the Pacific, thereby facilitating faster accumulation of freshwater in the North Atlantic and halting deep-water formation. Proxy reconstructions of the LGM AMOC instead indicate a weaker and possibly shallower AMOC than today, which is in conflict with the particularly strong and deep circulation states coherently simulated with ocean circulation models for the LGM. Simulations with reduced North Atlantic deep-water formation, as a consequence of potentially increased continental runoff from ice sheet melt and imposed changes in the hydrological cycle, more closely resemble the overturning circulation inferred from proxies. These circulation states also show bistable behavior, where the AMOC does not recover after North Atlantic freshwater hosing. However, no AMOC states are found here that either comprise an extreme shoaling or vigorous and concurrent shallow overturning as previously proposed based on paleoceanographic data.
- Article
(7661 KB) - Full-text XML
- BibTeX
- EndNote


The Atlantic Meridional Overturning Circulation (AMOC) redistributes heat, nutrients, and carbon between the hemispheres and constitutes an important tipping element in Earth's climate system (Lenton et al., 2008; Stocker and Wright, 1991). In light of this, painstaking efforts have been devoted to thoroughly understand its sensitivity and response to perturbations that are thought to play a major role in climate variability. Today, the zonally integrated Atlantic circulation is characterized by two overturning cells that are driven by the southward transport of North Atlantic Deep Water (NADW) and northward flowing Antarctic Bottom Water (AABW) occupying abyssal depths. Paleoreconstructions provide ample evidence that the AMOC experienced extensive reorganizations in the past (Böhm et al., 2015; Broecker and Denton, 1989; McManus et al., 2004; Stocker, 2000). Large AMOC variability is particularly well-documented for the transition from the Last Glacial Maximum (LGM, ∼20 kyr ago), characterized by ∼90 ppm lower atmospheric CO2 concentration (Monnin et al., 2001) and large continental ice sheets responsible for about 120 m lower sea level (Lambeck et al., 2014), into the current interglacial (Lehman and Keigwin, 1992; McManus et al., 2004). Nonetheless, a large array of uncertainties remain concerning the triggers of these abrupt climate events (Barker et al., 2015) and the overall mean AMOC state during the last glacial that facilitated the rapid sequence of climate changes during the following deglaciation (see Lynch-Stieglitz, 2017, for a review).
Notably, the water mass geometry and circulation strength of the glacial AMOC and Southern Ocean have received continuous attention over the past decades in order to improve the understanding of deep-ocean carbon storage under the different climatic boundary conditions that prevailed during the LGM. Yet, no consistent framework of the glacial AMOC has emerged to date (Lynch-Stieglitz, 2017). Early proxy reconstructions suggested a weaker and substantially shallower glacial AMOC (Curry and Oppo, 2005; Duplessy et al., 1988; Fischer et al., 2010; Sarnthein et al., 1994). However, recent investigations have provided a first clue that the initial interpretations of these data may have overestimated the extent of shoaling (Gebbie, 2014; Oppo et al., 2018). These findings are corroborated by reconstructions of the AMOC geometry based on Nd isotopes (Du et al., 2020; Howe et al., 2016; Pöppelmeier et al., 2020) providing evidence for little to no change in the overall water mass provenance in the Atlantic between today and the LGM. In addition, reconstructions of the AMOC strength provide equally ambiguous results, either indicating a more vigorous but shallow (Bradtmiller et al., 2014; Lippold et al., 2012) or, in contrast, strongly weakened deep-ocean circulation (Freeman et al., 2016; Skinner et al., 2017).
LGM model simulations in the framework of the third phase of the Paleoclimate Model Intercomparison Project (PMIP3) have not yet helped to reconcile the contrasting AMOC states suggested by proxy reconstructions, as they consistently indicate a stronger and deeper AMOC than during the preindustrial (PI) period (Muglia and Schmittner, 2015). Only a handful of studies have tried to reconcile proxy data and model simulation by an integrated intercomparison approach mainly based on stable carbon isotope data (e.g., Gebbie, 2014; Hesse et al., 2011; Menviel et al., 2017, 2020). Generally, these studies require additional forcings such as freshwater or moisture transport fluxes to achieve a reasonable model–data agreement, and results remain ambiguous regarding parameters such as circulation strength (Menviel et al., 2020). This large uncertainty in the mean glacial AMOC state contributes to the lack of understanding of the response of the AMOC to freshwater perturbations as they have occurred during the last deglaciation (Heinrich Stadial 1 and Younger Dryas; Broecker et al., 1992) and may resurface in the future under accelerated warming (Stocker and Schmittner, 1997) or Greenland ice sheet melting (Driesschaert et al., 2007). Proxy reconstructions indicate a substantial slowdown of the Atlantic deep circulation during these freshwater discharge events in the past (McManus et al., 2004; Oppo et al., 2015), but quantitative estimates of this weakening remain extremely challenging to obtain due to large proxy uncertainties. In addition, the freshwater fluxes that drove the slowdown are equally poorly constrained (Clark et al., 2001; Roberts et al., 2014). Taken together, large uncertainties remain in our understanding of the stability of the AMOC.
Here, we investigate the impact of critical changes in the boundary conditions between the LGM and PI on the mean AMOC state in the Bern3D Earth system model of intermediate complexity. These changes comprise orbital and radiative forcings, closure of the Bering Strait, changes in the wind stress, and elevated tidal dissipation due to lower sea level changing shallow-ocean bathymetry. In order to identify processes that affect the stability of these AMOC states, we then apply freshwater forcings to the North Atlantic in classical hosing experiments. Finally, we look into the processes that are required to force the model from a mono-stable regime into bistability, with an AMOC that does not recover after freshwater perturbations. This concerns the sensitivity of the hysteresis to model parameters and configurations. The latter may be responsible for transient changes in the hysteresis structure during the transition from the glacial to the Holocene (Stocker and Marchal, 2000).
2.1 Model description
The Bern3D model version 2.0 is an Earth system model of intermediate complexity with a horizontal resolution of 40×41 grid cells and 32 logarithmically scaled depth layers (Edwards et al., 1998; Müller et al., 2006; Roth et al., 2014). The geostrophic-frictional balance ocean model features an isopycnal diffusion scheme and Gent–McWilliams parametrization for eddy-induced transport (Griffies, 1998) and is coupled to a single-layer energy–moisture balance model on the same horizontal grid (Ritz et al., 2011). Wind stress and cloud cover are prescribed from present-day monthly climatologies (ERA40; Kalnay et al., 1996). We further diagnose the ideal water age through a tracer that is explicitly transported by advection, diffusion, and convection but is set to zero at the surface and otherwise increases at a rate of 1 yr yr−1.
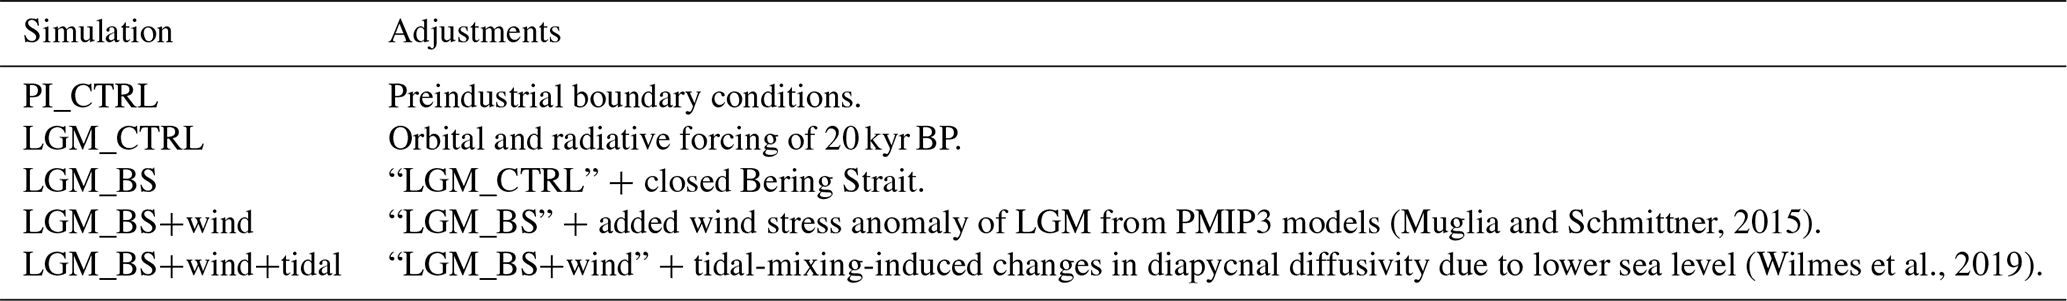
For the LGM control simulations, the orbital parameters were set to 20 kyr BP (Berger, 1978), and radiative forcing of greenhouse gases was prescribed corresponding to CO2 =191 ppm, CH4 =370 ppb, and N2O =208 ppb. Further, the LGM ice sheet extent and related changes to the albedo were constrained by reconstructions by Peltier (1994). In order to achieve topologically more realistic glacial boundary conditions, we investigate the impact of a closed Bering Strait on the AMOC, which is represented in the model by a single grid cell with a depth of about 40 m and a mean simulated meridional throughflow of 0.5 Sv (sverdrup; 1 Sv =106 m3 s−1) from the Pacific to the Arctic, which is at the lower end of the observed range of 0.4 to 1.2 Sv (Woodgate et al., 2005). The seasonally varying wind stress is prescribed in the model based on modern climatologies but was substantially different during the LGM mostly because the Laurentide and Fennoscandian ice sheets modulated the northern westerlies (Muglia and Schmittner, 2015). To alleviate this issue, we calculated LGM anomalies of zonal and meridional wind stresses from five PMIP3 model outputs of the LGM (CCSM4, CNRM, GISS, MIROC, and MPI; Braconnot et al., 2012) and added the multi-model mean to the prescribed modern wind stress fields following the approach of Muglia and Schmittner (2015) (Fig. B2a, b). Finally, due to lower sea level, tidal dissipation and, hence, diapycnal mixing was substantially increased (1.8–3.0 times) during the LGM (Egbert et al., 2004; Schmittner and Egbert, 2014). To account for this increase in vertical mixing, we replaced the globally uniform diapycnal diffusivity scheme with m2 s−1 of the Bern3D model with the output from the UVic model coupled to the high-resolution OTIS tide model, providing 3D diapycnal diffusivity fields for the LGM (Wilmes et al., 2019). We use the UVic-OTIS simulation with sea levels derived from the ICE-6G database (Fig. B2c). For this simulation, the background diffusivity was kept constant; thus, the diapycnal diffusivities can be assumed to represent a conservative estimate, as the effects of remotely dissipated tidal energy are neglected (Wilmes et al., 2019). Table 1 provides an overview of the model simulations with the according adjustments to the boundary conditions.
Rearrangements of the routing of continental precipitation to the oceans were not performed, as Muglia and Schmittner (2015) indicated that such changes have little influence on the ocean circulation. Further, average salinities due to lower sea level were not increased for the LGM simulations, because we do not focus here on globally uniform changes in salinity, and simulations with an adjusted salt budget indicate negligible effects on the AMOC (not shown).
2.2 Freshwater hosing experiments
In order to test the stability of the AMOC, we performed freshwater hosing experiments. For all experiments, we applied the freshwater hosing constantly over 500 years, evenly distributed over the northern North Atlantic between 45 and 70∘ N (Fig. B1). Simulations were hosed with 0.1 to 1.0 Sv of freshwater. The freshwater was not compensated for in the rest of the ocean, in order to avoid salinity feedbacks elsewhere (Stocker et al., 2007). Moreover, we are interested here in the AMOC responses of the late glacial–early deglacial to freshwater perturbations (i.e., Heinrich Stadial 1 analogs), which were a net addition of freshwater; hence, we consider this approach more realistic.
We also performed a set of experiments with increasing North Pacific to North Atlantic freshwater transfer flux adjustments. This tests the effect of background continental ice sheet runoff and the strength of the Pacific to Atlantic freshwater transport via the atmospheric hydrological cycle (Zaucker et al., 1994). By constantly adding 0.02 to 0.12 Sv of freshwater to the North Atlantic and removing the same amount from the North Pacific (i.e., adding salt), we progressively weaken the AMOC and equilibrate these states over 5000 years before starting further experiments.
2.3 Model initialization
The Bern3D model was spun up over 35 kyr to a preindustrial (1765 CE) equilibrium comprising greenhouse gas concentrations of CO2 =278 ppm, CH4 =722 ppb, and N2O =273 ppb. For the LGM_CTRL simulation, the model was further spun up over 10 kyr continuing from PI_CTRL to orbital parameters adjusted to 20 kyr BP (Berger, 1978) and greenhouse gas concentrations of CO2 =191 ppm, CH4 =370 ppb, and N2O =208 ppb. For all simulations with a closed Bering Strait (LGM_BS, LGM_BS+wind, and LGM_BS+wind+tidal), this same procedure was performed with the sole difference of the changed bathymetry at the Bering Strait and the respective different wind stress fields and/or diapycnal diffusivities. The freshwater experiments were then started from the corresponding spin-ups.
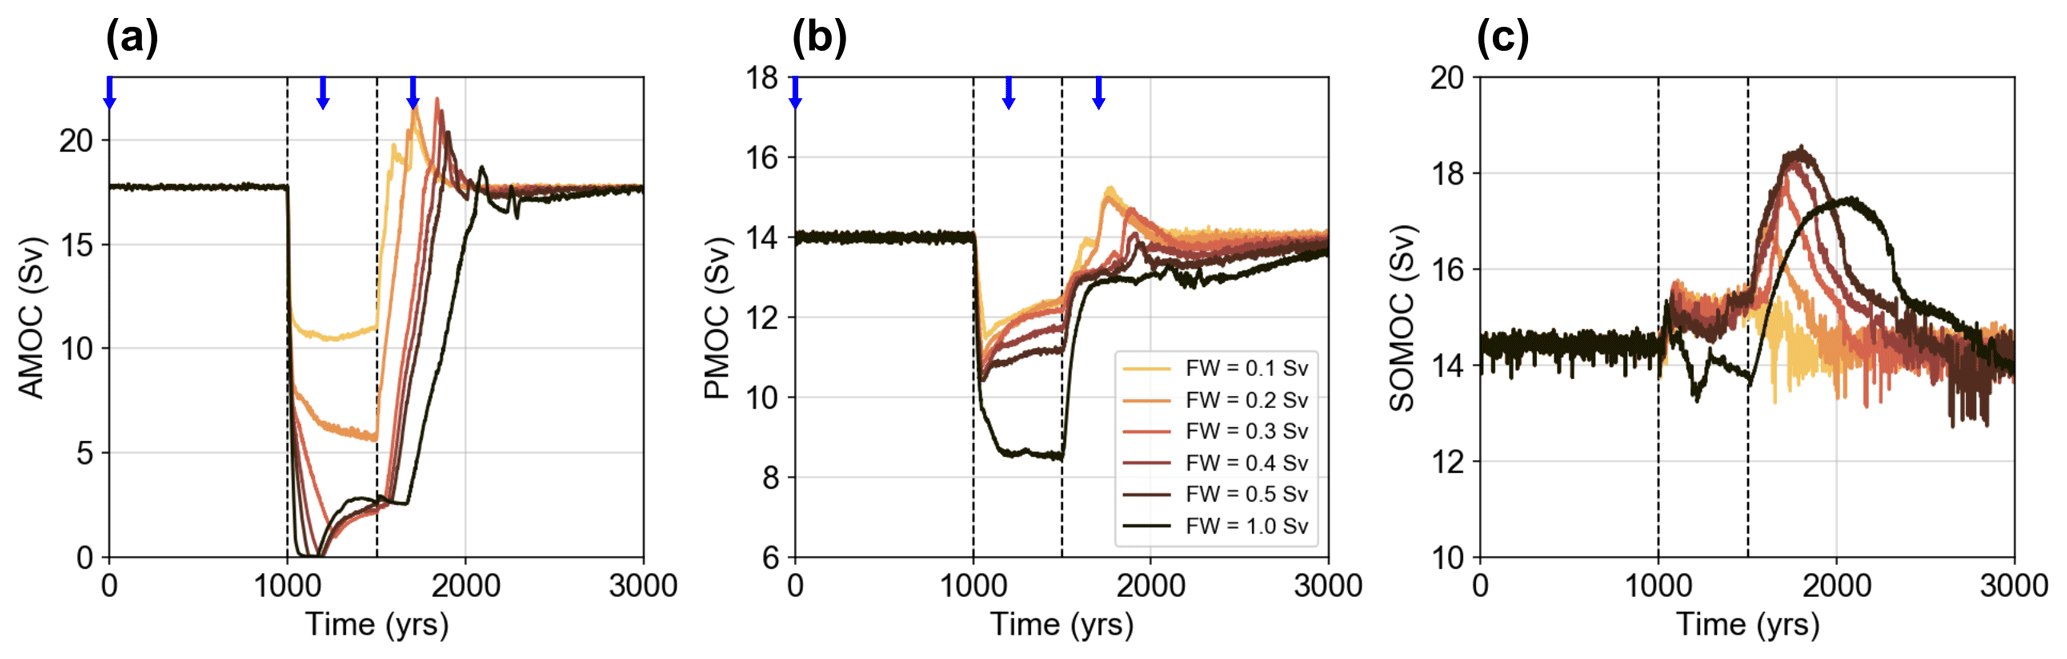
Figure 1Response of circulation strength of the (a) AMOC, (b) PMOC, and (c) SOMOC to freshwater hosing experiments for the preindustrial control. The freshwater (FW) was added for 500 years (start and end are indicated by the vertical dashed lines) to the North Atlantic between 45 and 70∘ N (Fig. B1). PMOC and SOMOC circulation cells flow anticlockwise and are, hence, defined as negative by convention (cf. Fig. 2), but they are plotted here as positive values for convenience. Note the different y axes in the panels. Blue arrows in panels (a) and (b) mark time steps for which the stream functions are shown in Fig. 2.
3.1 Preindustrial AMOC stability
Under preindustrial boundary conditions the AMOC strength in the Bern3D model is 17.7 Sv (maximum of the Atlantic overturning stream function below 400 m water depth; Fig. 1a), and the upper circulation cell, defined as positive values in the stream function, reaches down to about 3000 m depth (Fig. 2a). While the AMOC strength is in good agreement with estimates constrained using observations (17.2 Sv; McCarthy et al., 2015), the depth of the upper cell is too shallow compared with observations (Jenkins et al., 2015). During freshwater perturbations the AMOC weakens substantially within 50 years and then evolves somewhat differently depending on the amount of freshwater hosing (Fig. 1a): with 0.1 Sv freshwater hosing the AMOC quickly stabilizes for the duration of the continuous hosing of 500 years, whereas more than 0.2 Sv freshwater forcing leads to an additional AMOC weakening for another 100 to 200 years. The minimum AMOC strength during hosing does not decrease linearly with the amount of freshwater but instead approaches a collapsed state that slightly recovers during hosing before stabilizing at ∼2.5 Sv for freshwater perturbations ≥0.3 Sv. For all PI freshwater hosing experiments the AMOC returns to its initial steady-state value within 600 years (time after hosing until the steady-state strength is reached again, i.e., prior to the overshoot), indicating mono-stability of the AMOC. However, this recovery time increases with the amount of freshwater from ∼100 years for 0.1 Sv to ∼600 years for 1.0 Sv. The Pacific Meridional Overturning Circulation (PMOC, defined as minimum overturning in the Pacific north of 30∘ S) is about 14.0 Sv (Fig. 1b), which is comparable to modern observations of 14.9 Sv (Fig. 2b; McCarthy et al., 2015). The structural response of the PMOC to North Atlantic freshwater hosings is similar to the AMOC, yet with strongly diminished amplitudes in strength reductions. For freshwater amounts ≤0.5 Sv, the reduction in PMOC strength is only ∼3 Sv, whereas it is about 5.5 Sv for a North Atlantic hosing of 1 Sv, with no indication of a full collapse. Contrastingly, the Southern Ocean Meridional Overturning (SOMOC, defined as the minimum of the stream function south of 30∘ S) shows very little change during the 500 years of hosing but increases in strength afterwards by up to 4 Sv for about 500 years before stabilizing again at the steady-state strength.

Figure 2Zonally integrated AMOC (a, c, e) and PMOC (b, d, f) stream functions at different points in time during freshwater hosing of 0.2 Sv, as applied in Fig. 1 (orange line) for PI_CTRL. (a, b) Steady-state circulations at time zero of Fig. 1. (c, d) Stream functions at t=1200 years, which is 200 years into the freshwater hosing. (e, f) Stream functions at t=1700 years, which is 200 years after the freshwater hosing ended. Positive and negative values correspond to clockwise and anticlockwise circulation, respectively.
3.2 AMOC under increasingly realistic glacial boundary conditions
Radiative forcing corresponding to lower greenhouse gas concentrations and orbital parameters adjusted to 20 kyr BP with all other boundary conditions kept at PI levels (i.e., simulation LGM_CTRL) produce an AMOC of 15.8 Sv – about 2 Sv weaker than PI_CTRL (Fig. 3) – and a PMOC of 15.6 Sv – slightly stronger than PI_CTRL. This minor AMOC weakening has relatively little impact on the ideal water age distribution in the Atlantic with both PI_CTRL and LGM_CTRL exhibiting deep-water ages in the North Atlantic of up to 800 years (Fig. B3; global average of 570 years for LGM_CTRL, Table A1). A more sluggish AMOC is also indicated by nutrient-based reconstructions of the Atlantic circulation during the LGM (e.g., Curry and Oppo, 2005; Lynch-Stieglitz et al., 2007). However, these reconstructions indicate a much older deep ocean as well as substantial shoaling of the AMOC by up to 1000 m in the North Atlantic, which is not simulated here with virtually no shift in the water depth of the upper circulation cell and only a minor change in ideal ventilation age.
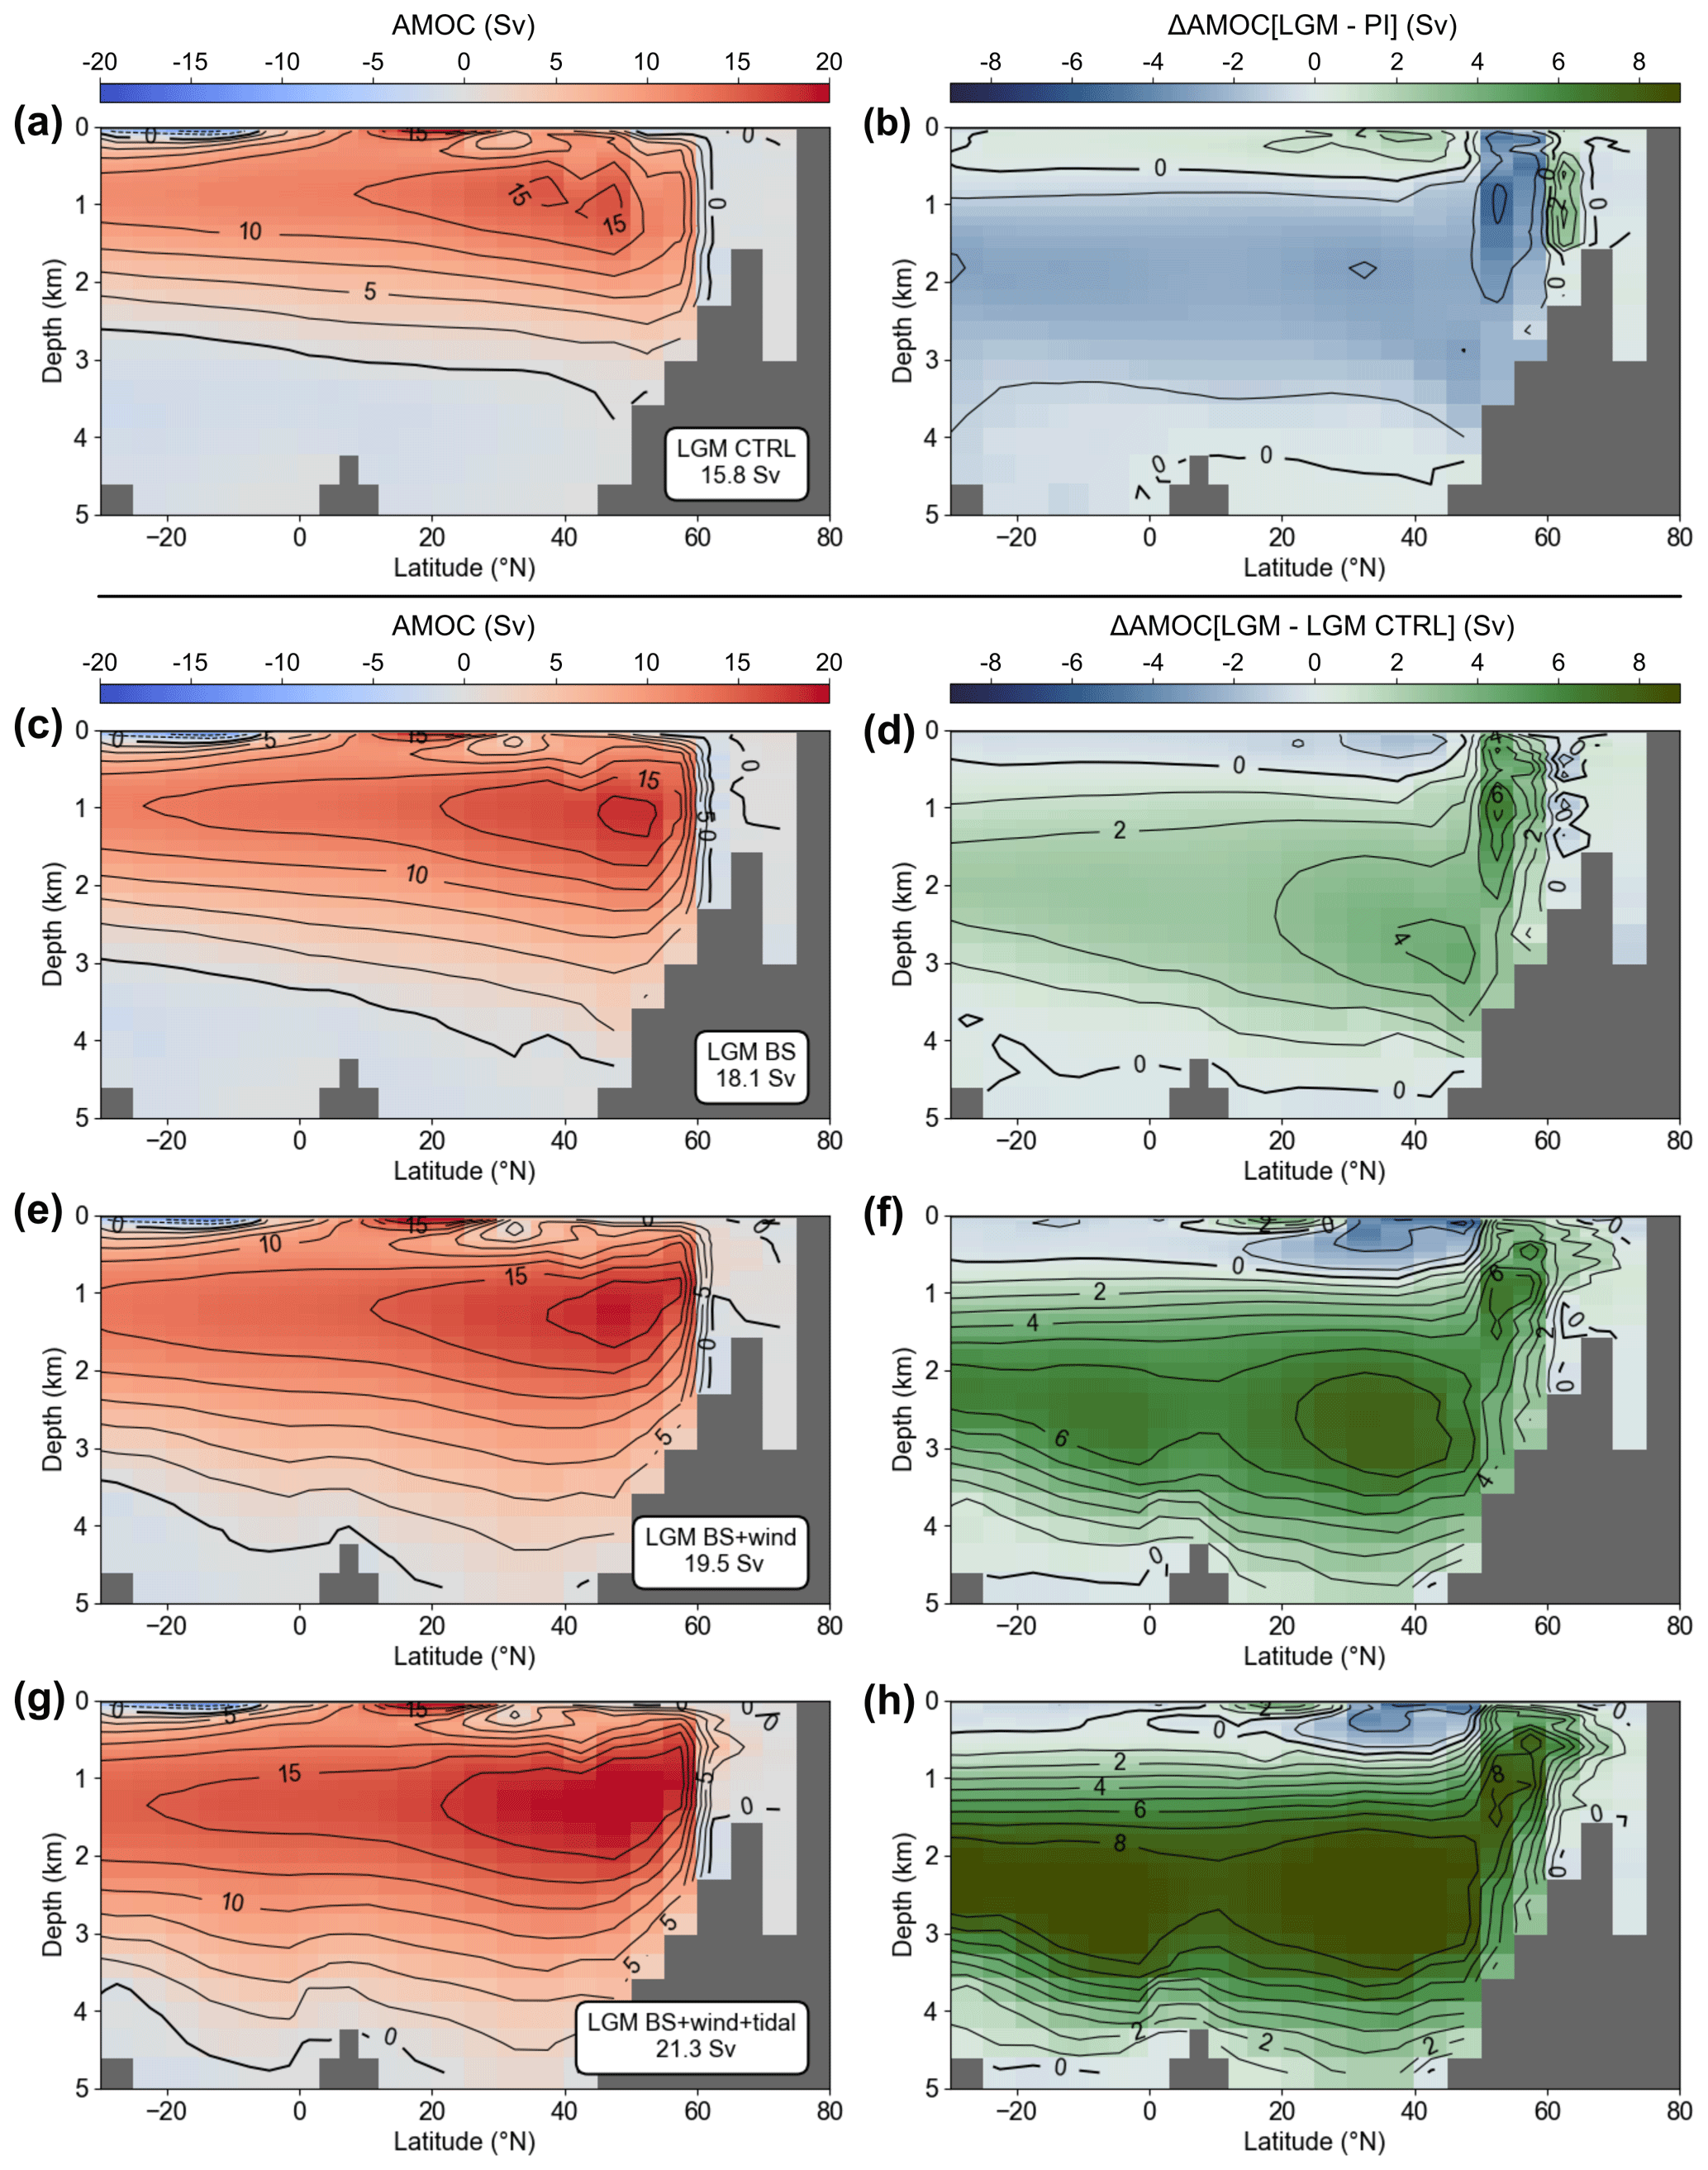
Figure 3(a) Zonally integrated overturning stream function of LGM_CTRL (AMOC =15.8 Sv) and (b) difference to the PI_CTRL depicted in Fig. 2a. (c, d) LGM with closed Bering Strait (18.1 Sv) and difference to LGM_CTRL depicted in panel (a). (e, f) LGM with closed Bering Strait and LGM wind stress (19.5 Sv). (g, h) LGM with closed Bering Strait, LGM wind stress, and increased diapycnal diffusivity due to lower sea level (21.3 Sv). See Sect. 3 and Table 1 for details on simulations.
Closing the Bering Strait under the LGM boundary conditions described above (simulation LGM_BS) increases the AMOC strength by 2.3 Sv in comparison with LGM_CTRL by cutting the inflow of relatively fresh water from the North Pacific to the Arctic and subsequently to the deep-water formation zones of the North Atlantic. As such, the closure of the Bering Strait produces an AMOC of 18.1 Sv (slightly stronger than PI_CTRL) with major increases below 1000 m water depth (Fig. 3b, d), at the same time also increasing the PMOC to about 16.2 Sv. This strengthening also deepens the AMOC by about 500 m in comparison with LGM_CTRL, contrasting the notion of a shoaled glacial AMOC suggested by nutrient-based proxy reconstructions. The combination of both the strengthening and deepening leads to better ventilation of the deep North Atlantic compared with LGM_CTRL, yielding ideal water ages between 400 and 500 years as well as a global average ideal water age of 555 years (Fig. B3).
In a next step, adding the PMIP3 LGM wind stress anomalies to the PI wind field (simulation LGM_BS+wind) further increases the circulation strength of the AMOC and PMOC by an additional 1.4 and 1.7 Sv, yielding a total of 19.5 and 17.9 Sv, respectively. This also further deepens the AMOC by about 1000 m, now reaching down to the ocean bottom at 5000 m in the northern North Atlantic. As a consequence, ideal water ages are <200 years in the deep North Atlantic and 400–500 years in the deep South Atlantic, while the global average is about 30 years younger than in LGM_CTRL. The stronger and southward-shifted Northern hemispheric westerlies of the LGM, caused by the large continental ice sheets, increase the strength of the subpolar and subtropical gyres. This, in turn, enhances the northward salt flux to the northern North Atlantic, subsequently intensifying deep-water formation (Muglia and Schmittner, 2015).
Finally, we also consider the effect of lower glacial sea level shifting tidal dissipation from the continental shelves to the deep ocean. Here, this is parameterized by replacing the diapycnal diffusivity of the Bern3D model with those derived from the UVic ocean model coupled to the OTIS tide model (Wilmes et al., 2019), i.e., simulation LGM_BS+wind+tidal. This produces an even stronger and slightly deeper AMOC (21.3 Sv) and PMOC (18.0 Sv) than LGM_BS+wind. In order to verify that these changes are not related to the different parameterizations, we also performed an additional experiment for the preindustrial where we replaced the globally uniform diapycnal diffusivity of the Bern3D model with the 3D UVic-OTIS model results for present-day tides (Wilmes et al., 2019), while keeping all other parameters as in PI_CTRL (Fig. B4). With the replaced diapycnal diffusivities, the PI AMOC strength is slightly reduced by ∼0.7 Sv and only slightly shallower than in PI_CTRL; hence, the observed changes in LGM_BS+wind+tidal cannot be attributed to the different parameterizations. Instead, these effects can be related to the elevated tidal dissipation increasing the downward mixing of northern-sourced water as well as promoting mixing between NADW and AABW (Wilmes et al., 2019). This also slightly increases deep Atlantic (and Pacific) ventilation, yielding a global mean ideal water age of 490 years – about 80 years younger than LGM_CTRL. In summary, these arguably more realistic LGM boundary conditions produce an AMOC that is about 20 % stronger and more than 1500 m deeper than PI_CTRL. Hence, these results are in relatively good agreement with the PMIP3 LGM simulations, yielding an average increase in AMOC of 41±26 % and an average deepening of 665±550 m (Muglia and Schmittner, 2015).
3.3 LGM freshwater hosing experiments and AMOC hysteresis
The various LGM configurations are expected to have different stability properties with respect to freshwater perturbations. In order to illustrate this, we apply freshwater discharge (hosing) to the North Atlantic, which leads to different responses of the AMOC in the different LGM model configurations (Fig. 4). First, we compare the different LGM configurations for a freshwater hosing of 0.2 Sv for 500 years (Fig. 4a). In simulations with an open Bering Strait (PI_CTRL and LGM_CTRL) the hosing reduces the AMOC strength by about 12 Sv, whereas a reduction of ≥15 Sv is observed for the LGM simulations with a closed Bering Strait. The physical origin of this difference lies in the freshwater balance in the North Atlantic. An open Bering Strait acts as a buffer that provides relatively salty Pacific water (relative to the hosing perturbation) to the North Atlantic during hosing when the Arctic and North Atlantic sea surface salinity is decreased, essentially diminishing the impact of the freshwater discharge. When the Bering Strait is closed, this buffer is absent and freshwater accumulates more easily in the North Atlantic during hosing. This increases upper-ocean stratification and, thus, prevents deep-water formation more effectively. However, large freshwater perturbations >0.3 Sv overwhelm this buffering process, and a collapsed circulation state with a residual circulation of about 2 Sv is approached regardless of the configuration (Fig. 4b). Recovery of the circulation also varies substantially between the configurations with fast recoveries within ∼100 years for PI_CTRL, LGM_BS+wind, and LGM_BS+wind+tidal, whereas the steady-state circulation is reached again only after 300 and 500 years for LGM_BS and LGM_CTRL, respectively. These recoveries are characterized by AMOC overshoots that also greatly vary in magnitude from 2 Sv for LGM_CTRL to 9 Sv for LGM_BS+wind+tidal. Overall, the magnitude of the overshoots correlates well with the steady-state AMOC strength of the respective configuration.
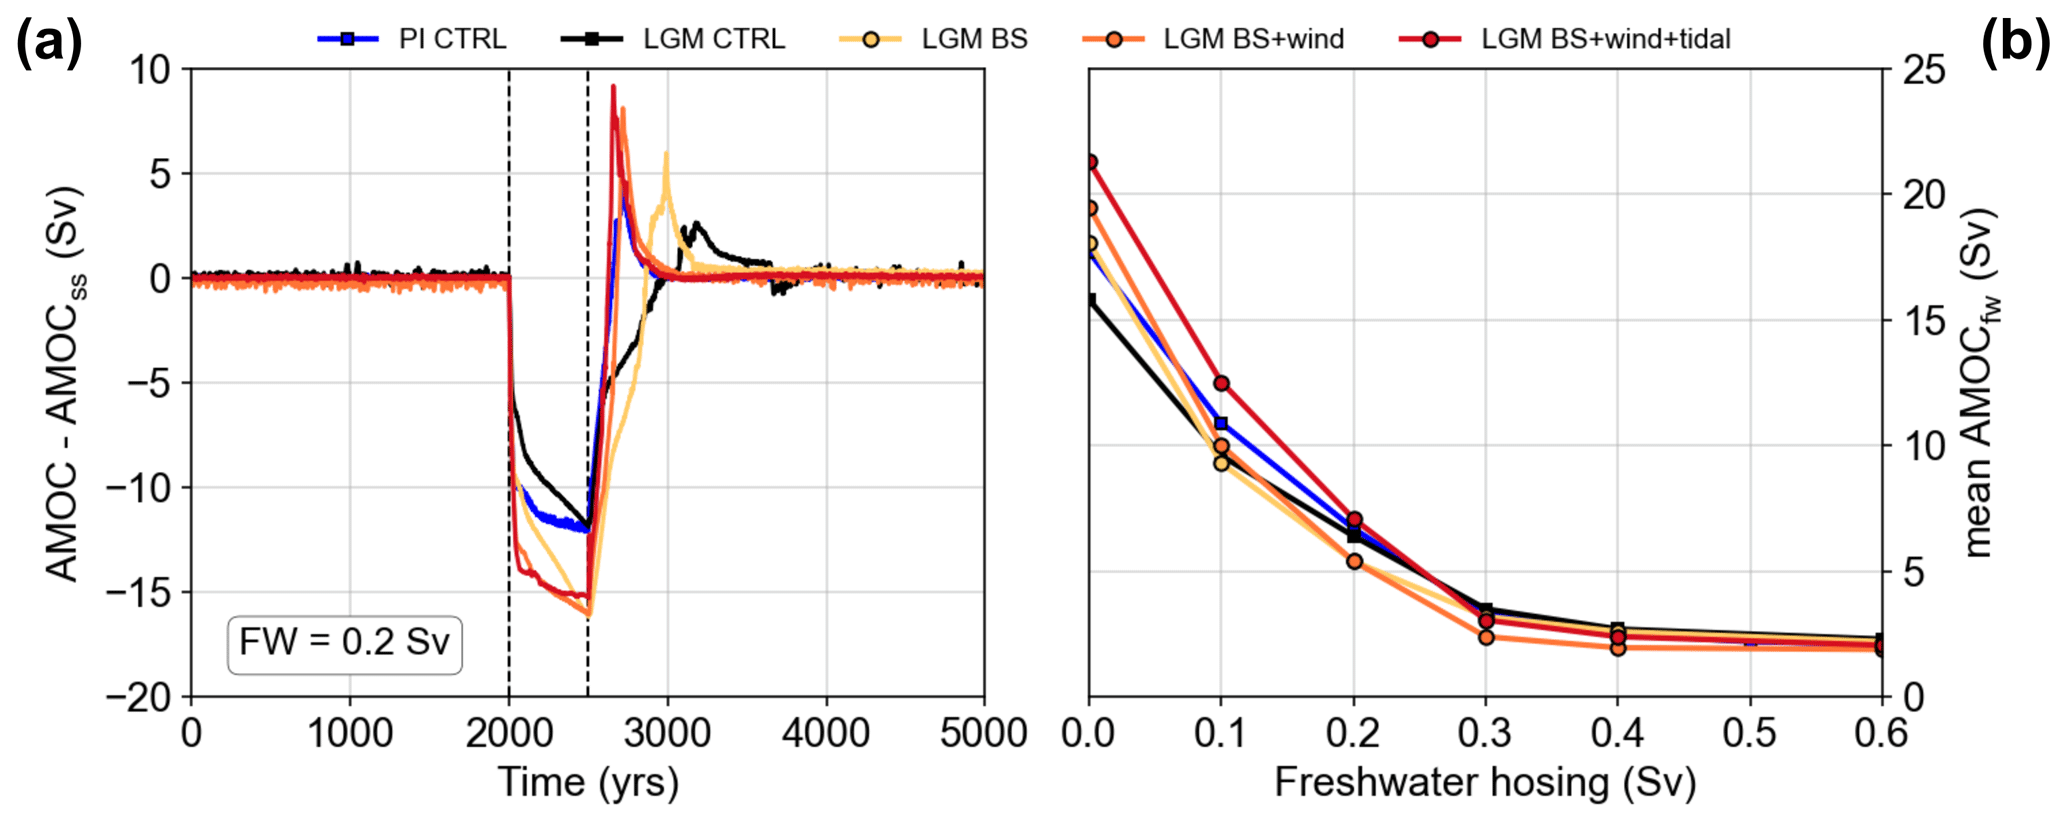
Figure 4(a) AMOC responses to freshwater perturbation of 0.2 Sv for 500 years in the North Atlantic for the different simulations listed in Table 1. Vertical dashed lines mark the start and end of hosing. To compare the AMOC anomalies, the steady-state AMOC strength (AMOCss) has been subtracted from the AMOC signal. (b) The 500-year average of AMOC strength during the freshwater perturbation (AMOCfw) versus the amount of freshwater hosing.
These different responses to freshwater are also reflected in the structure of the AMOC hysteresis, which was assessed by applying a freshwater forcing to the North Atlantic between 45 and 70∘ N linearly increasing at a rate of 0.1 Sv kyr−1 (Fig. 5). After reaching a maximum freshwater flux of 1 Sv the forcing was gradually decreased to zero at the same rate. This small rate allows the AMOC to adjust to the freshwater flux and reach a quasi-equilibrium. Both PI_CTRL and LGM_CTRL simulations with an open Bering Strait exhibit relatively little hysteresis, due to a smaller North Atlantic salt anomaly. A collapsed state is reached for both of these simulations for a hosing of about 0.23 Sv, and recovery starts below 0.15 Sv. In fully coupled atmosphere–ocean general circulation models (AOGCMs) this negative feedback of the Bering Strait emerges from the difference in sea level between the North Pacific and Arctic that reverses during freshwater hosing, i.e., export from the Arctic to the North Pacific during hosing in contrast to an import during steady state (Hu et al., 2012). The Bern3D model has a rigid-lid ocean, and the Bering Strait throughflow is always into the Arctic. However, both effects (freshwater export to the Pacific in AOGCMs and import of relatively saltier water from the Pacific in the Bern3D model) reduce the North Atlantic salt anomaly during freshwater hosing, reducing the AMOC hysteresis. With a closed Bering Strait in simulation LGM_BS+wind+tidal, the AMOC responds to a freshwater forcing with a two-step reduction on top of the continuous decrease. The first accelerated reduction occurs at 0.08 Sv hosing, followed by a second steep decline in AMOC strength at 0.25 Sv of freshwater discharge leading towards a full collapse of the circulation. After that, the AMOC stays in the collapsed state for more than 16 kyr and only recovers when the hosing decreases below 0.08 Sv, followed by an overshoot reaching a circulation of more than 25 Sv until it returns to its initial steady state. These structures are reminiscent of the hysteresis behavior of simple box models and theoretical considerations, which are driven by Stommel's salt advection feedback (Fig. 5a; Rahmstorf et al., 2005; Stocker and Wright, 1991; Stommel, 1961). The stronger hysteresis of LGM_BS+wind+tidal can be traced back to the increased freshwater accumulation in the North Atlantic due to the closed Bering Strait (cf. Hu et al., 2012). Once collapsed, the circulation is unable to efficiently export the freshwater anomaly elsewhere. Thus, the restart of the AMOC is delayed, as the only North Atlantic source of salt is via the subpolar gyre. As such, this larger AMOC hysteresis supports the notion that the closure of the Bering Strait played a central role for the abrupt climate transitions during the last glacial such as Dansgaard–Oeschger events (Hu et al., 2012).
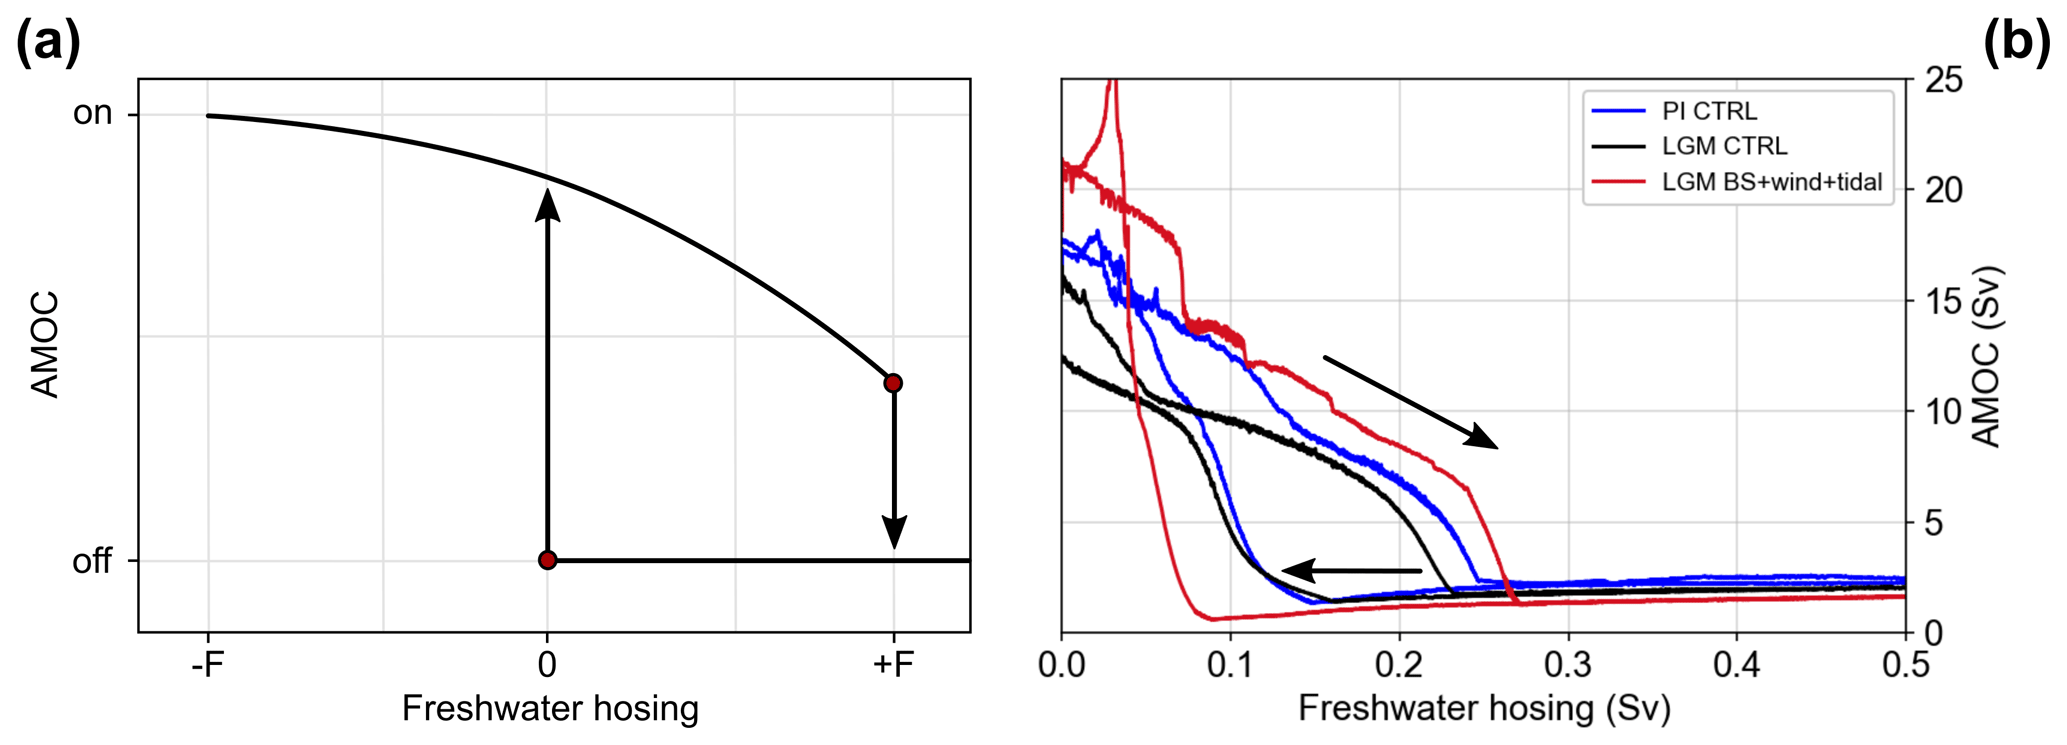
Figure 5(a) Schematic hysteresis structure of the AMOC with bifurcation points (red circles; Stommel, 1961). (b) Hysteresis diagram for PI control (blue), LGM control (black), and most realistic LGM boundary conditions (red; LGM_BS+wind+tidal). Here, the freshwater was linearly increased up to 1.0 Sv over a period of 10 kyr and then decreased back to zero over 10 kyr.
3.4 Effect of AMOC strength on freshwater response
Proxy reconstructions of the LGM AMOC strength are strongly diverging, with some studies indicating a more vigorous but shallow circulation (Bradtmiller et al., 2014; Lippold et al., 2012) and others suggesting a more sluggish circulation (Curry and Oppo, 2005; Evans and Hall, 2008; Lynch-Stieglitz et al., 2007). However, the model simulations presented here as well as PMIP3 results indicate a stronger and deeper Atlantic circulation in conflict with these proxy reconstructions. In order to also explore the responses of potentially weak glacial AMOC states to freshwater perturbations, we continuously apply constant North Pacific to North Atlantic freshwater transfer fluxes (i.e., we add small freshwater fluxes to the North Atlantic that are compensated for by salt addition to the North Pacific, thereby not changing the global salt inventory). All other boundary conditions are as in LGM_BS+wind+tidal, which we consider the configuration closest to the actual LGM boundary conditions. We let these simulations run into a new equilibrium over 5000 years before any further experiments are started. This yields reduced steady-state AMOC strengths from 20.4 to 12.3 Sv (freshwater transfer between 0.02 and 0.12 Sv; Fig. 6, Table 2). These freshwater adjustments, mimicking increased background runoff from the continental ice sheets and changes in evaporation and precipitation, lead to substantial shoaling of the AMOC due to increased upper-ocean stratification (Fig. B5). However, the shoaling does not extend beyond the PI_CTRL AMOC depth even for the weakest AMOC state produced by a freshwater transfer flux of 0.12 Sv. Further, despite the decrease in AMOC strength of 9 Sv (and 2.8 Sv for PMOC) between these simulations, the impact on ventilation ages is relatively minor with an increase of only ∼30 years yielding a global mean of 520 years for the simulation with the weakest AMOC compared with LGM_BS+wind+tidal, which is still about 80 years younger than PI_CTRL.
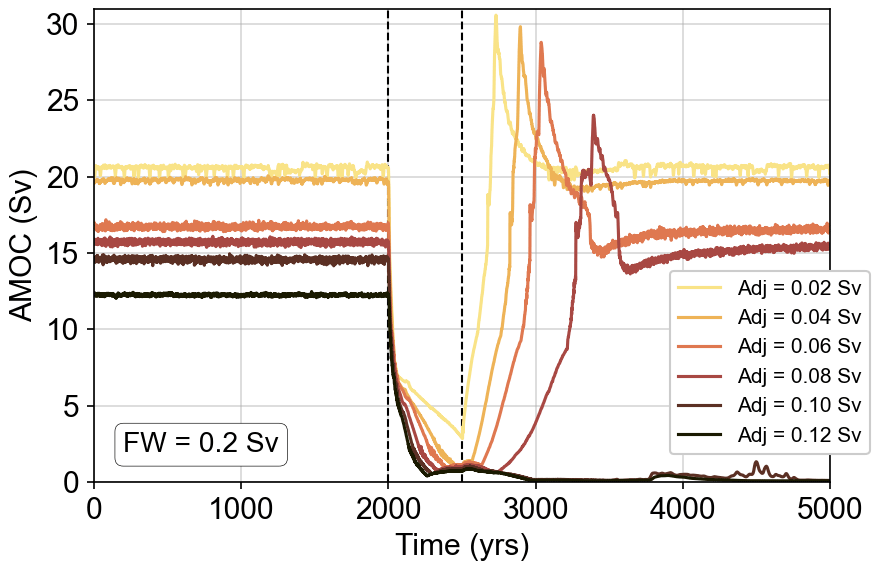
Figure 6Sensitivity of weakened AMOC states of LGM_BS+wind+tidal boundary conditions to freshwater perturbations of 0.2 Sv over 500 years. In order to reduce the AMOC strength Pacific to Atlantic freshwater transfer fluxes of 0.02 to 0.12 Sv were applied to the North Atlantic, which were compensated for in the North Pacific (Fig. B1).
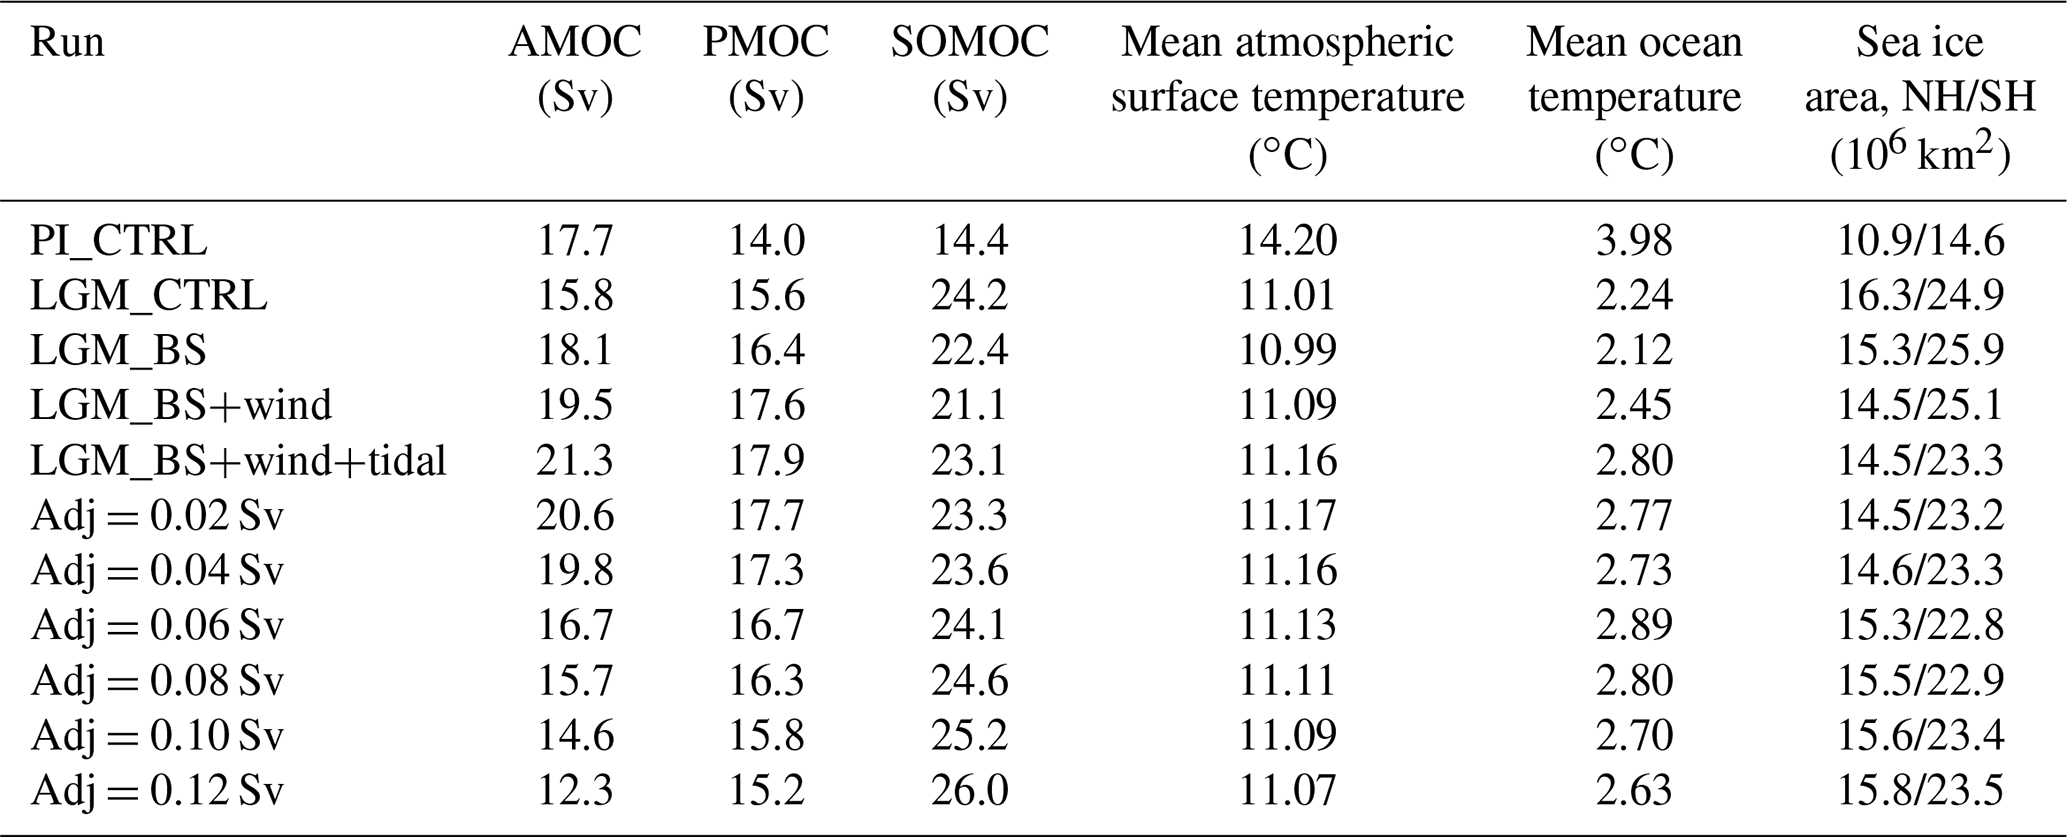
Table 2Atlantic, Pacific, and Southern Ocean meridional overturning rates (AMOC, PMOC, and SOMOC, respectively), global mean atmospheric surface temperature, mean ocean temperature, and sea ice extent of the Northern and Southern hemispheres (NH and SH, respectively) of all simulations.
Hosing these weakened AMOC states with 0.2 Sv freshwater for 500 years decreases the minimum AMOC strength during the perturbation with increasing freshwater adjustments (Fig. 6). Simulations with a steady-state AMOC larger than 15 Sv recover to their initial state, but the recovery time increases from ∼200 years for the smallest freshwater adjustment to about 1000 years for an adjustment of 0.08 Sv after the perturbation. This indicates that the AMOC is more sensitive to freshwater perturbations in the LGM_BS+wind+tidal model configuration, with decreasing overturning strength corroborating the findings of Goes et al. (2019). Indeed, for an even larger Pacific to Atlantic freshwater adjustment leading to an AMOC strength of <15 Sv (Adj =0.10 Sv), the freshwater hosing of 0.2 Sv causes a total collapse of the circulation, which does not recover after the freshwater hosing. This demonstrates bistability under these conditions and, hence, a completely different response to perturbations.
Overall, this bistable behavior is present in all LGM model configurations (Fig. 7), but the transition from mono- to bistability (red regimes) is more abrupt for LGM_BS+wind and particularly LGM_BS+wind+tidal. In both of these LGM configurations, the AMOC either recovers relatively quickly or collapses completely. In contrast, in LGM_CTRL and LGM_BS, the AMOC requires up to 2800 years to recover without fully collapsing for weak AMOC steady states and large freshwater forcings. This highlights that the LGM wind stress anomalies and elevated vertical mixing are the driving processes leading to this abrupt behavior between either fast recovery or full collapse.
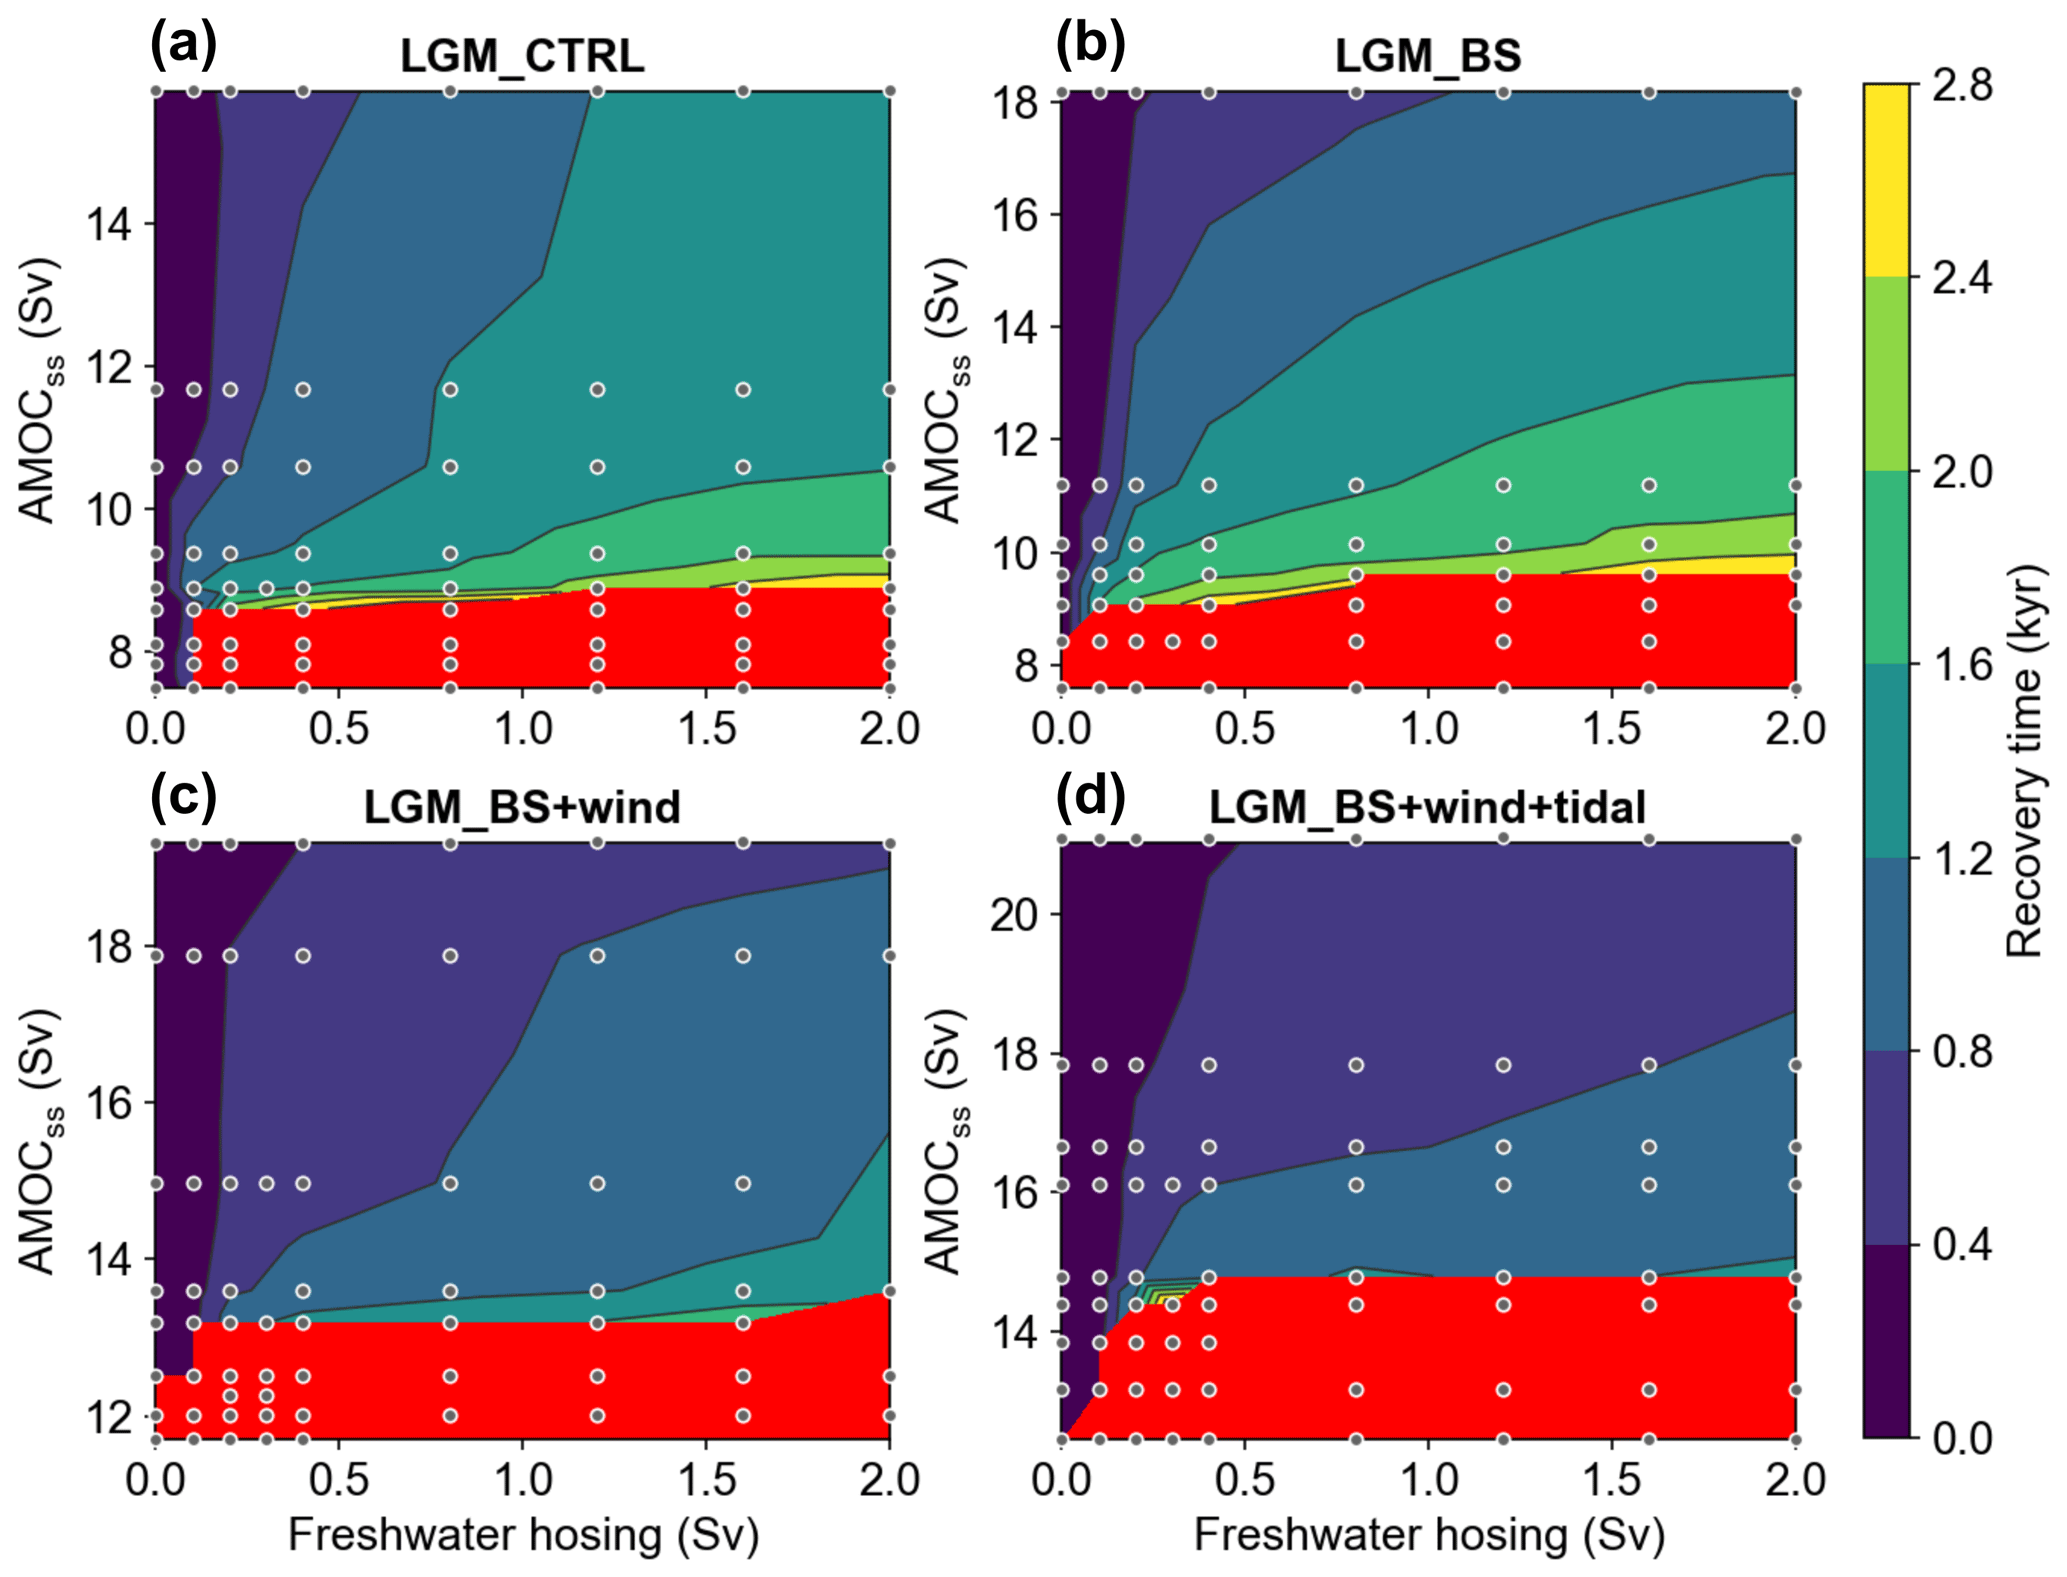
Figure 7Dependency of AMOC recovery time on steady-state circulation strength (AMOCss) and freshwater hosing amplitude. Model configurations of (a) LGM_CTRL, (b) LGM_BS, (c) LGM_BS+wind, and (d) LGM_BS+wind+tidal. The simulations are indicated by gray dots. The AMOC was weakened by applying a continuous freshwater transfer flux from the North Pacific to the North Atlantic that shifts the steady state into a new equilibrium (same as for Fig. 6). Freshwater hosing applied to the North Atlantic (45–70∘ N) lasted for 500 years. The recovery time was calculated as the time after the hosing until the steady-state AMOC strength was reached again. Red areas mark simulations where the AMOC remained in the collapsed state after the freshwater perturbation with no indication of recovery. Note the different scales on the y axes.
3.5 Transient opening of the Bering Strait
Finally, we provide a first glance of the effect of transient changes in the state configuration of the Bern3D model. After massive continental ice sheet melt during the last deglaciation, sea level rose rapidly first reconnecting the North Pacific with the Arctic during the Younger Dryas cold event (Pico et al., 2020). Here, we simulate the opening of the Bering Strait in a transient simulation under glacial boundary conditions (i.e., LGM_BS+wind+tidal; Fig. 8). Results of this simulation should be taken with caution and can only describe first-order consequences of the late deglacial Bering Strait opening, as the boundary conditions used here have limited validity for that time. More realistic transient boundary conditions of the late deglaciation are desirable, but the complex interactions between the effects of the retreating continental ice sheets with ocean circulation (freshwater fluxes, changes in the wind field, differences in tidal dissipation due to sea level rise) and the consequent transient changes are difficult to constrain and beyond the scope of this study.
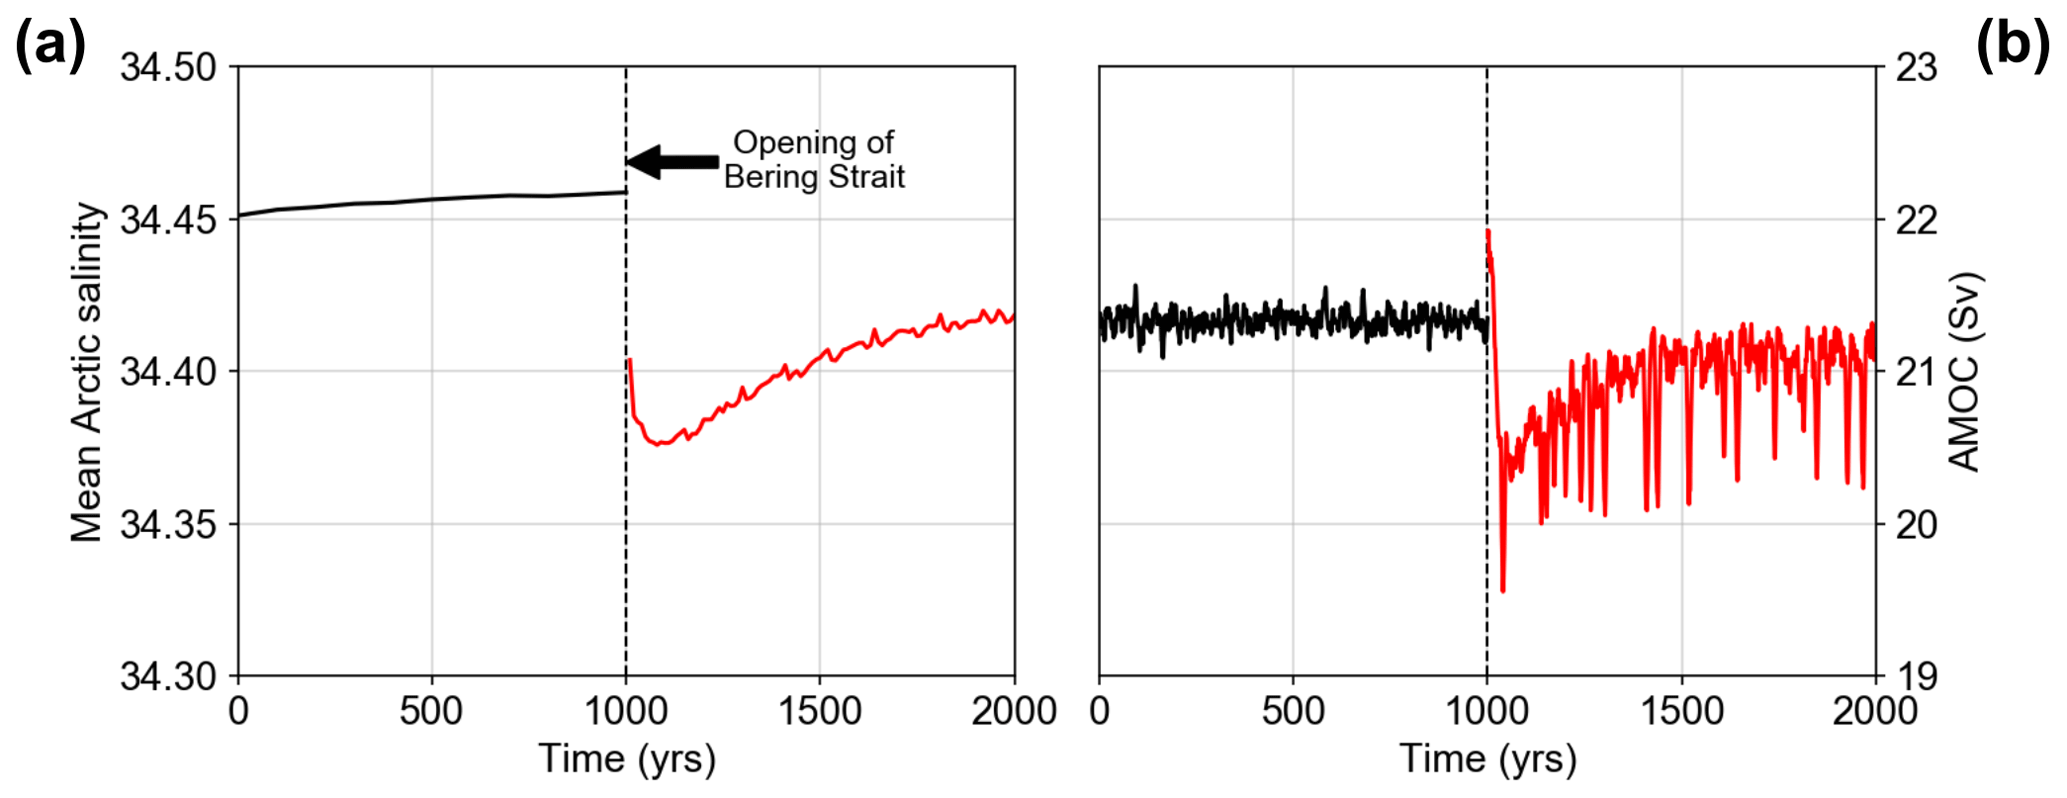
Figure 8(a) Evolution of mean Arctic salinity (integrated over all water depths) and (b) AMOC strength with opening of the Bering Strait at year 1000. The mean meridional advection through the Bering Strait is 0.5 Sv.
The opening of the Bering Strait rapidly decreases the mean Arctic salinity (integrated over all depths) due to the inflow of relatively fresh Pacific surface water (Figs. 8a, B7). Subsequently, the salinity slightly recovers after ∼100 years reaching a new steady state after ∼800 years that is about 0.05 psu less saline. This negative salt anomaly also propagates to the North Atlantic somewhat disrupting deep-water formation and reducing the AMOC by about 1 Sv (Fig. 8b). The evolution of the AMOC is similar to the mean Arctic salinity, yet the recovery to the new steady state only takes ∼400 years. This new steady state after the opening of the Bering Strait exhibits an AMOC that is stronger than that of the steady state with an open Bering Strait (Fig. B7). Further, the AMOC variability increases significantly after the Bering Strait opening from ±0.06 Sv (1σ from 800 to 1000 years) to ±0.25 Sv (1800–2000 years). Overall, the opening has relatively little impact on the sea surface salinity of the North Atlantic (Fig. B7) and, thus, on the AMOC strength in the Bern3D model under LGM boundary conditions. Consequently, this simulation suggests that the considerable climate and AMOC reorganizations found by proxy reconstructions for the late deglaciation (Denton et al., 2010; McManus et al., 2004) require further forcing mechanisms such as freshwater fluxes from the decaying Laurentide and Fennoscandian ice sheets (Condron and Winsor, 2012; Keigwin et al., 2018; Renssen et al., 2015).
Despite decades of research, large uncertainties remain regarding the overall geometry and strength of the AMOC during the LGM (Lynch-Stieglitz, 2017). In conflict with proxy reconstructions, PMIP3 model simulations consistently indicate a stronger and deeper AMOC under LGM boundary conditions than under PI conditions (Muglia and Schmittner, 2015). Here, we confirm these results of the PMIP3 simulations with the Bern3D model, indicating that three major differences in the boundary conditions between the LGM and the PI period even overcompensate for the AMOC weakening associated with the lower glacial temperatures such that the resulting LGM state exhibits a stronger AMOC than the PI period. The closure of the Bering Strait and wind stress anomalies are often considered in LGM model runs, but changes in tidal dissipation are neglected in most studies. Our simulations emphasize that all of these processes have a substantial impact on the ocean circulation, here leading to a total increase in AMOC strength of ∼5.5 Sv; therefore, all of the processes need to be considered for paleoclimate model simulations. When investigating abrupt climate transitions during the last glacial, it is particularly important to consider the interaction between the North Pacific and Arctic. Closing the Bering Strait increases the sensitivity of the AMOC to freshwater perturbations by preventing the negative feedback of salt and freshwater export through the Bering Strait (Hu et al., 2012). Thus, it is also important to investigate the impact of transient changes in the state of the Bering Strait, which could act as possible triggers for abrupt climate changes.
A counteracting effect to the AMOC strengthening due to the Bering Strait closure, increased wind stress, and elevated tidal dissipation during the LGM is the potentially increased runoff from the continental ice sheets surrounding the North Atlantic or changes in the hydrological cycle that are not explicitly implemented here. Our simulations indicate that such an additional freshwater flux implemented here as a North Pacific to Atlantic transfer flux could have substantially weakened and shoaled the AMOC. However, even for large freshwater relocations (>0.1 Sv), the AMOC does not substantially shoal beyond the PI AMOC depth in the Bern3D model. The strongly increased vertical mixing due to higher tidal dissipation, often neglected in climate simulations, and the elevated North Atlantic wind stress counterbalance the increased stratification due to the freshwater transfer flux (Fig. B5; Wilmes et al., 2019). Therefore, the simulations presented here suggest that the LGM AMOC did not shoal to the extent previously inferred from nutrient-based proxies (virtually no shoaling simulated here versus about 1 km as inferred previously by Curry and Oppo, 2005, and Lynch-Stieglitz et al., 2007). While we note that this conclusion may be model specific, it is in line with revised interpretations of the updated δ13C data in follow-up studies (Oppo et al., 2018; Keigwin and Swift, 2017). Furthermore, in our model, an AMOC weakening is always accompanied by an AMOC shoaling and vice versa, and no circulation is found here that produces a strong and shallow AMOC as initially suggested by reconstruction (Bradtmiller et al., 2014; Lippold et al., 2012).
While the work presented here suggests that some proposed LGM circulation regimes seem to be difficult to realize, further constraints from proxy reconstructions are required to reduce uncertainties and, thus, better determine the LGM AMOC state. With the present study, we have established a consistent model framework with easily tunable circulation strength that will facilitate comprehensive model–data intercomparisons with geochemical (, Nd isotopes) and nutrient-based (δ13C, Δ14C) circulation proxies implemented in the Bern3D model in the future.
Ideal ages for different simulations
We diagnosed the mean ideal ages for the global ocean as well as for the different subbasins below 2 km water depth (Table A1). These ages measure the true model ocean ventilation and, thus, cannot be directly compared to radiocarbon ventilation ages, which exhibit a preformed surface age due to not fully equilibrating at the ocean–atmosphere interface, sea ice prohibiting air–sea gas exchange, and carbon-cycle-related changes.
Table A1Mean ideal water ages for the global ocean and for the different basins below 2 km water depth.


Figure B1Map depicting regions where freshwater and saltwater perturbations are applied. For the hosing experiments, the freshwater was evenly applied to the North Atlantic (orange). In order to achieve weakened LGM AMOC states, small freshwater fluxes were added to the North Atlantic (orange) and compensated for in the North Pacific (red) by adding the equivalent salt flux to that region.
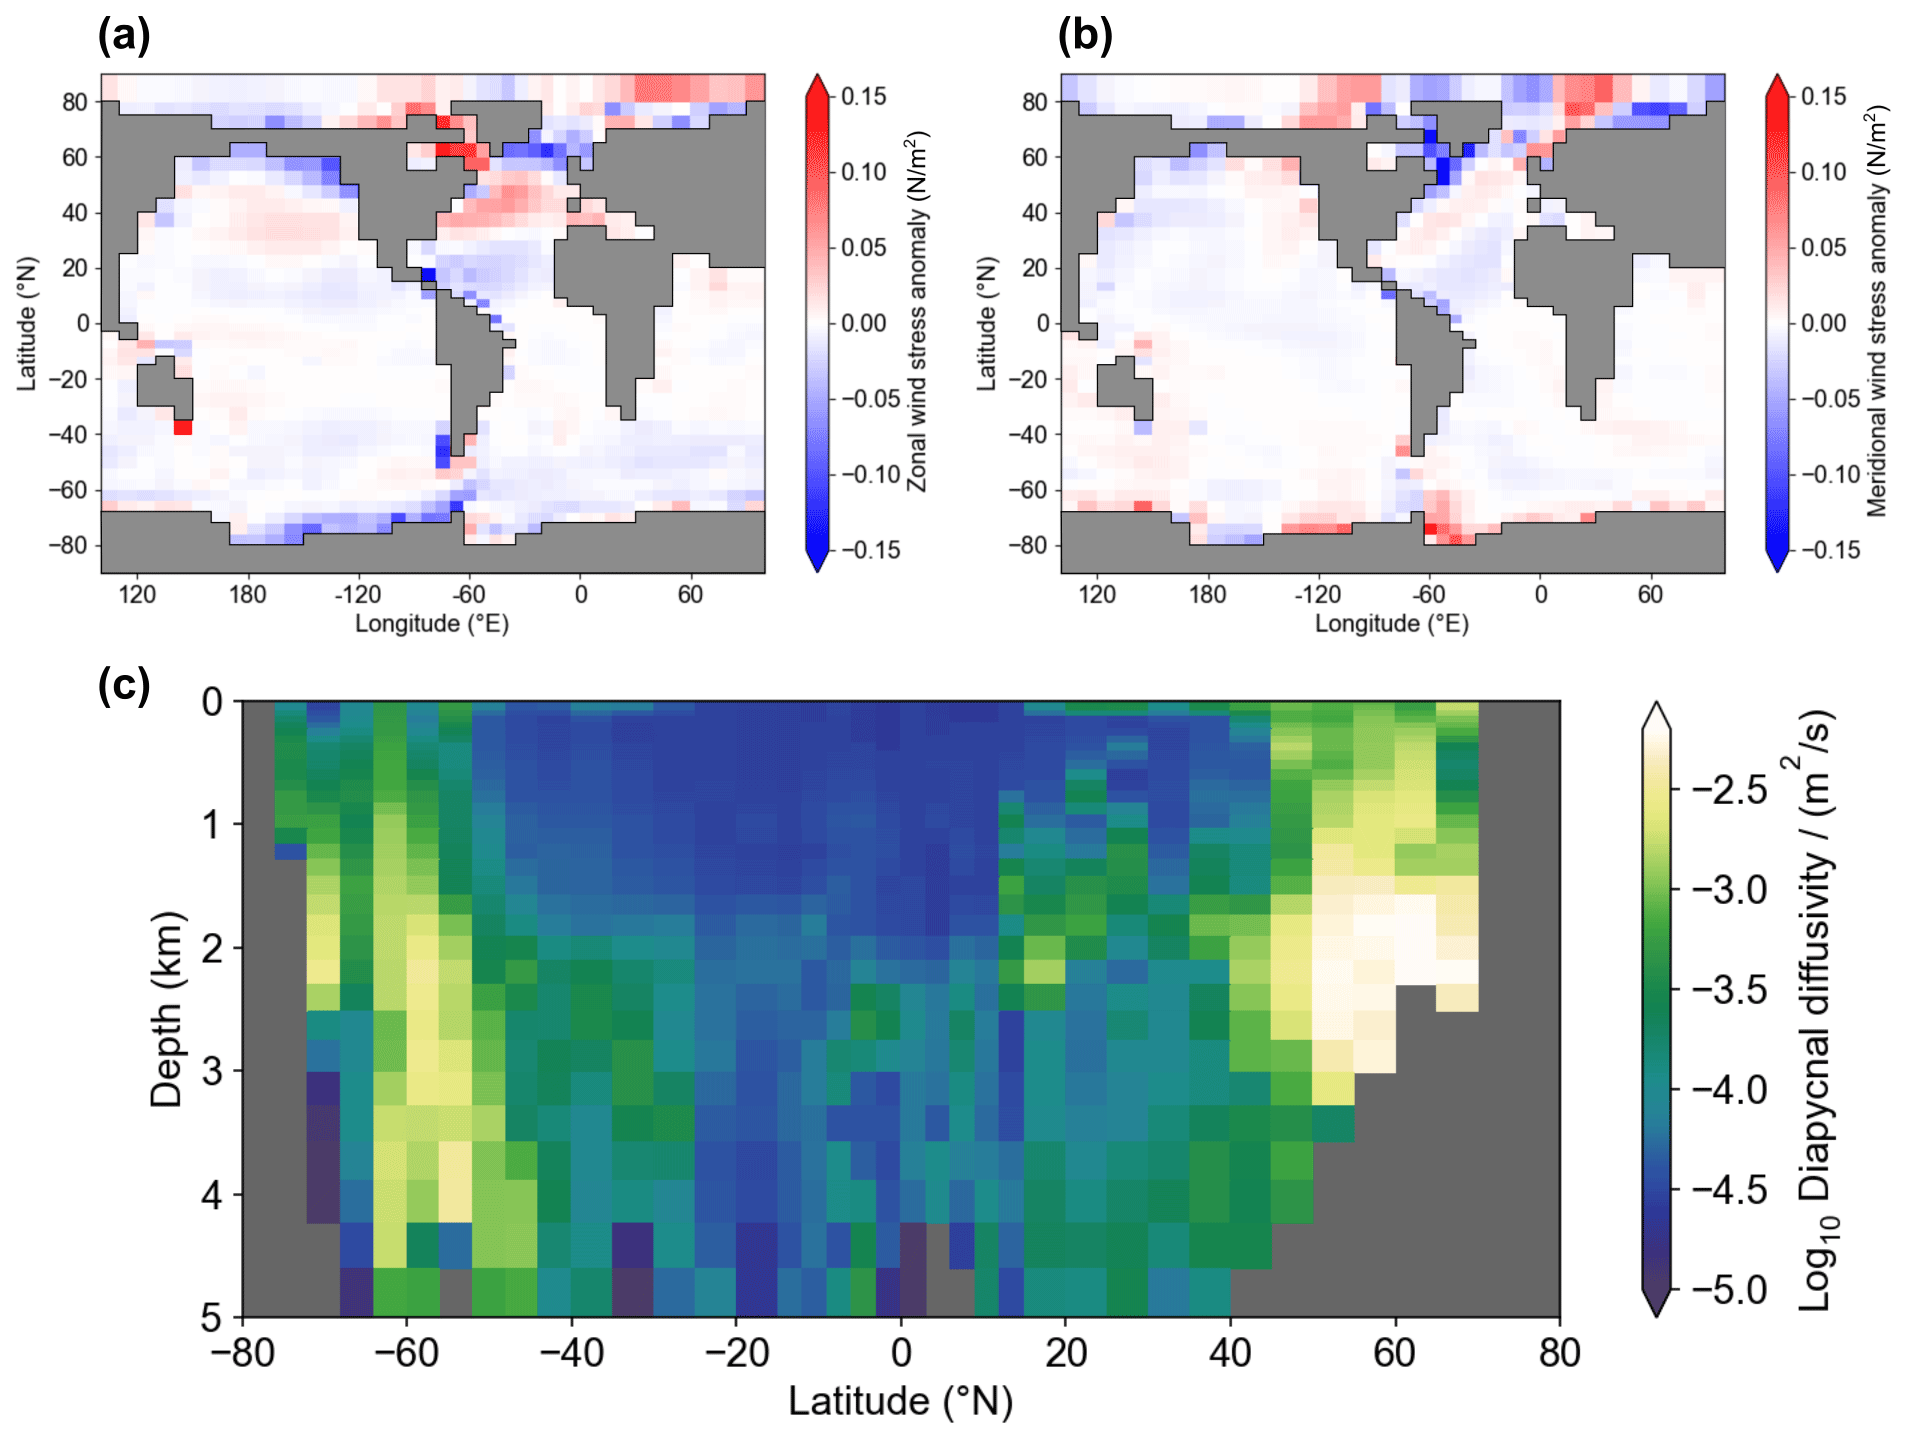
Figure B2Additional changes in LGM boundary conditions. (a, b) Multi-model mean wind stress anomalies of five PMIP3 models (CCSM4, CNRM, GISS, MIROC, and MPI) following Muglia and Schmittner (2015). The large positive anomaly south of Australia is a regridding artifact due to the lack of Tasmania in the Bern3D model. (c) Zonally averaged diapycnal diffusivities of the Atlantic, which are regridded on the Bern3D grid from the UVic climate model coupled to the OTIS tide model with sea level derived from ICE-6G (Wilmes et al., 2019).
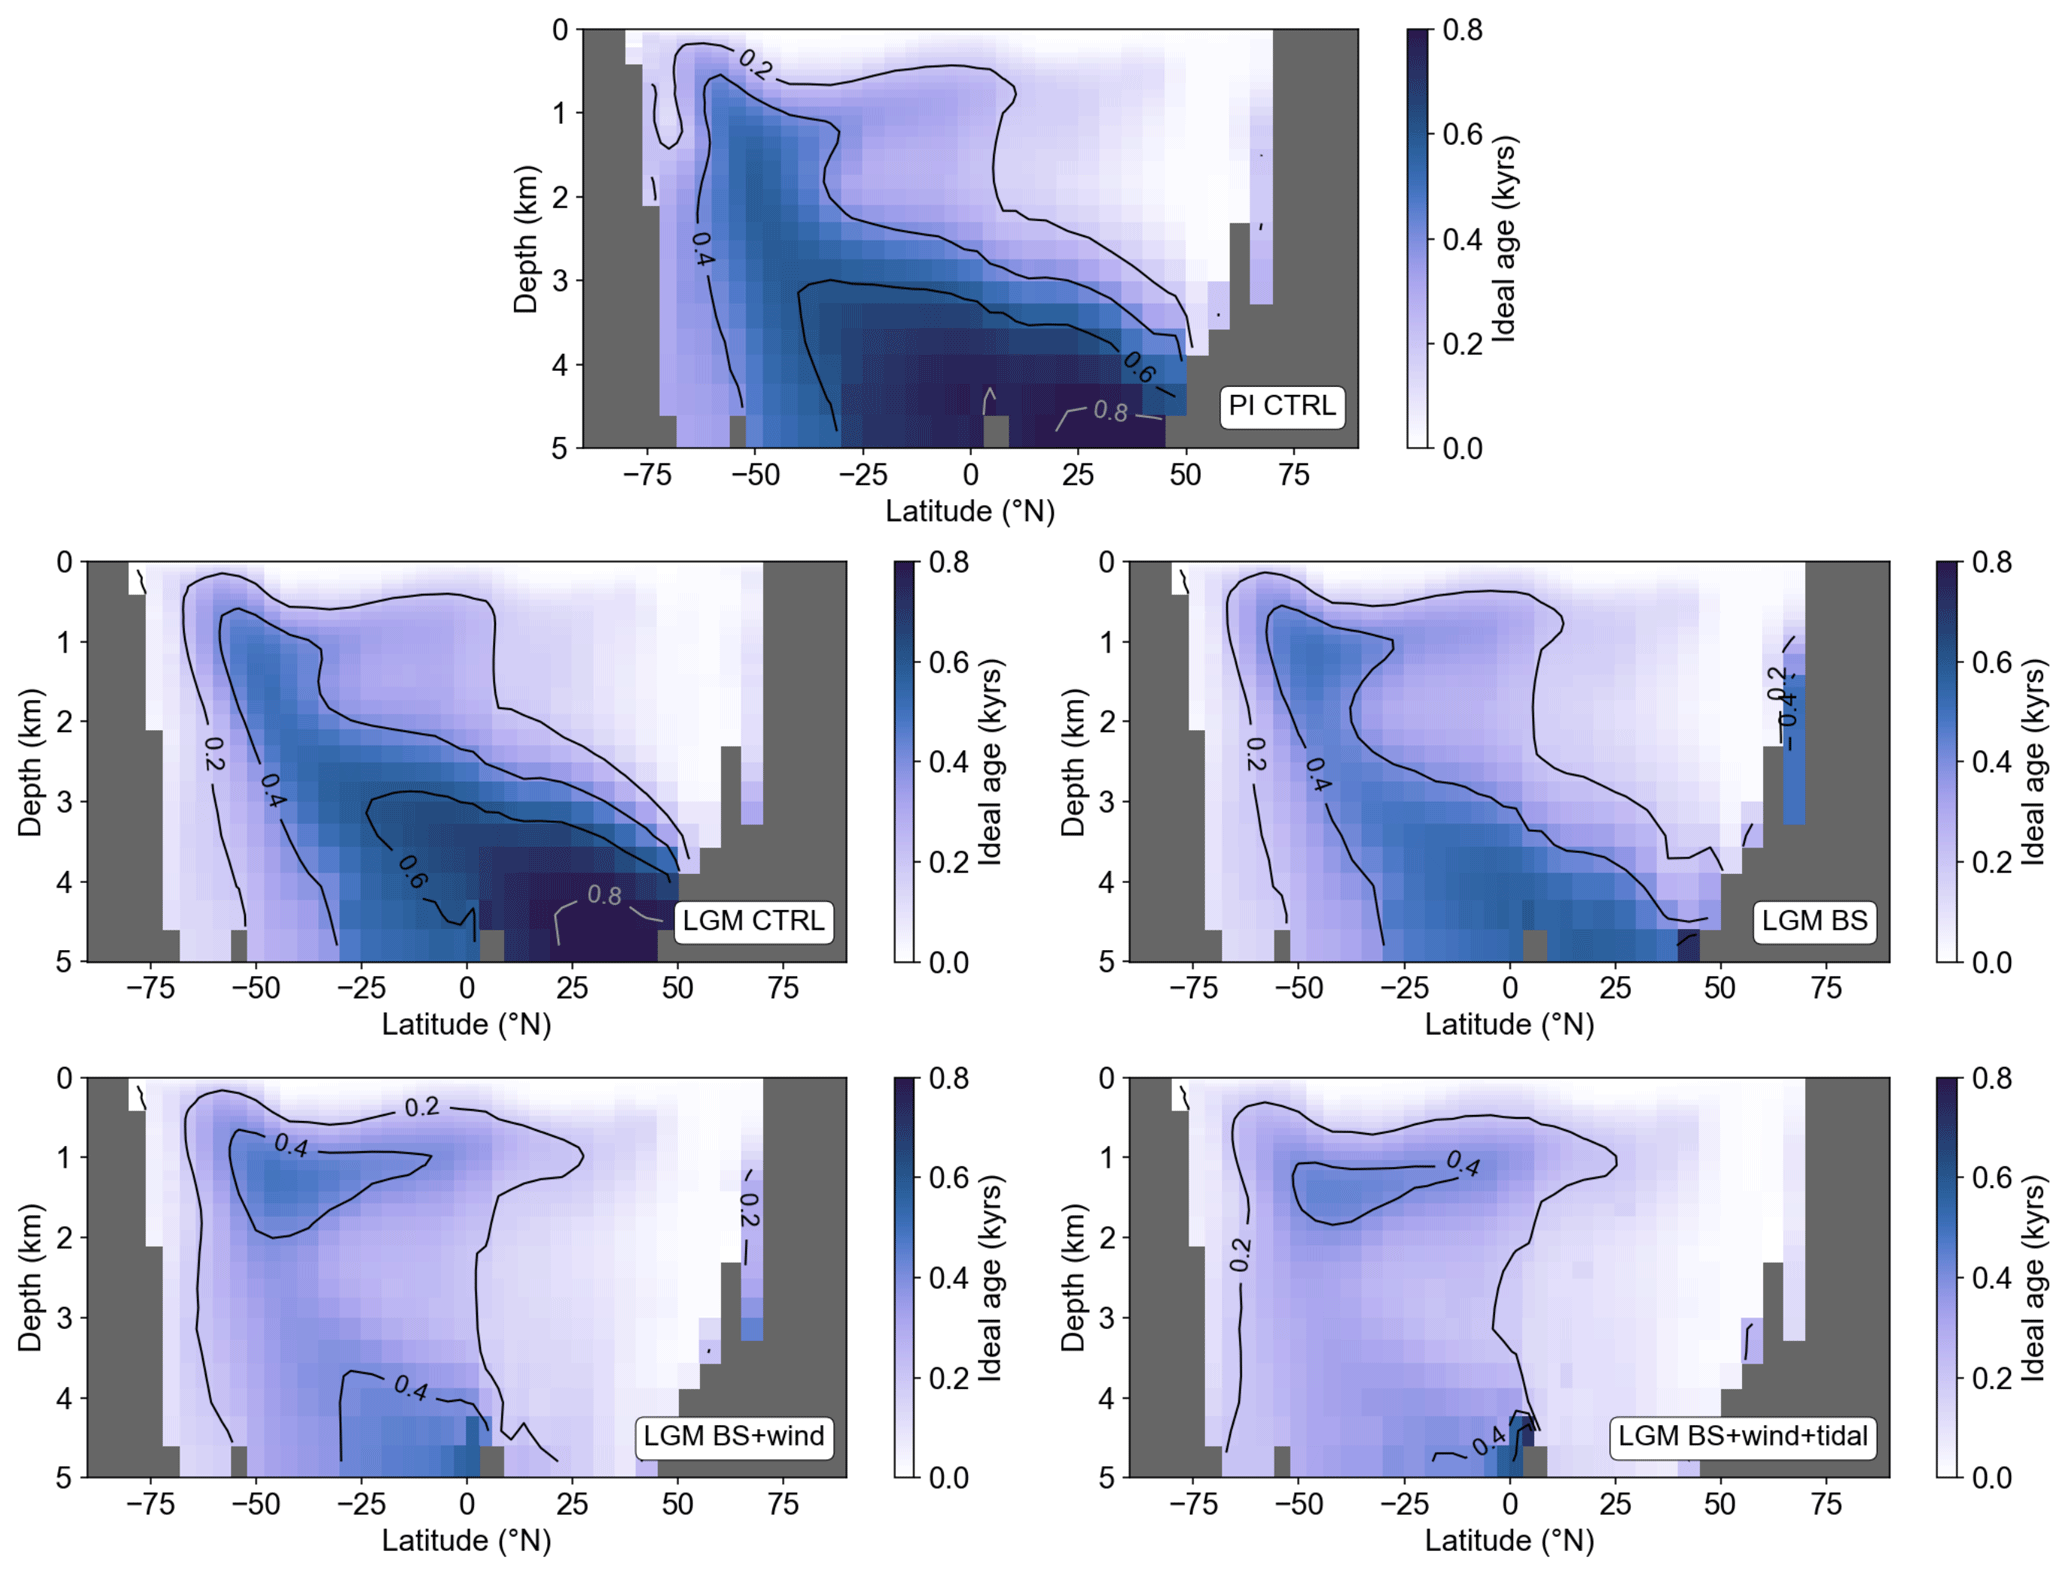
Figure B3Zonally averaged ideal water ages of the Atlantic for the different model configurations listed in Table 1. Ideal ages are set to zero at the surface and increase in the ocean interior at a rate of 1 yr yr−1.
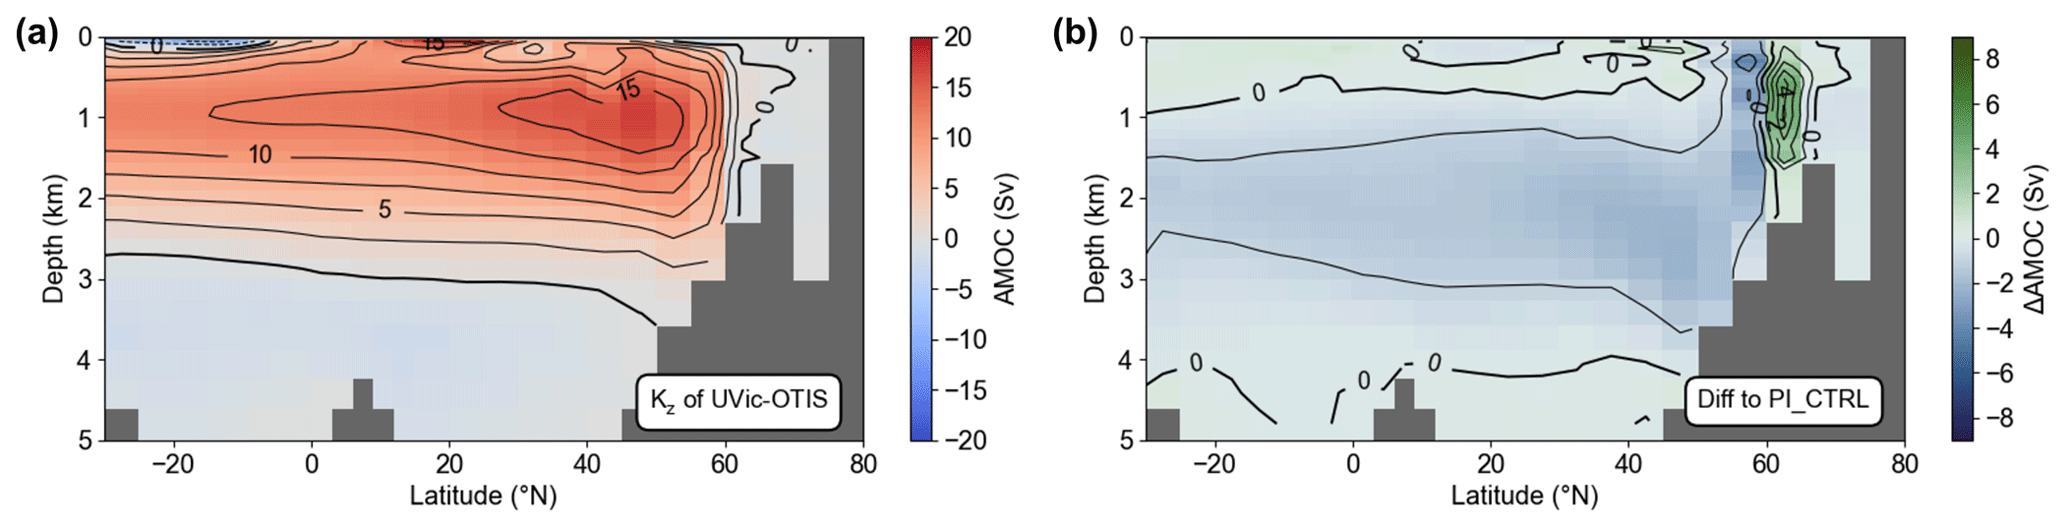
Figure B4(a) Stream function for model run with the globally uniform diapycnal diffusivity of PI_CTRL replaced with the 3D diapycnal diffusivity field of the UVic-OTIS model with present-day tides (Wilmes et al., 2019). Panel (b) shows panel (a) minus the PI_CTRL simulation. The AMOC strength is ∼0.7 Sv weaker and slightly shallower in the simulation with the 3D diapycnal diffusivity field of the UVic-OTIS model. Contour level steps are 1 Sv.
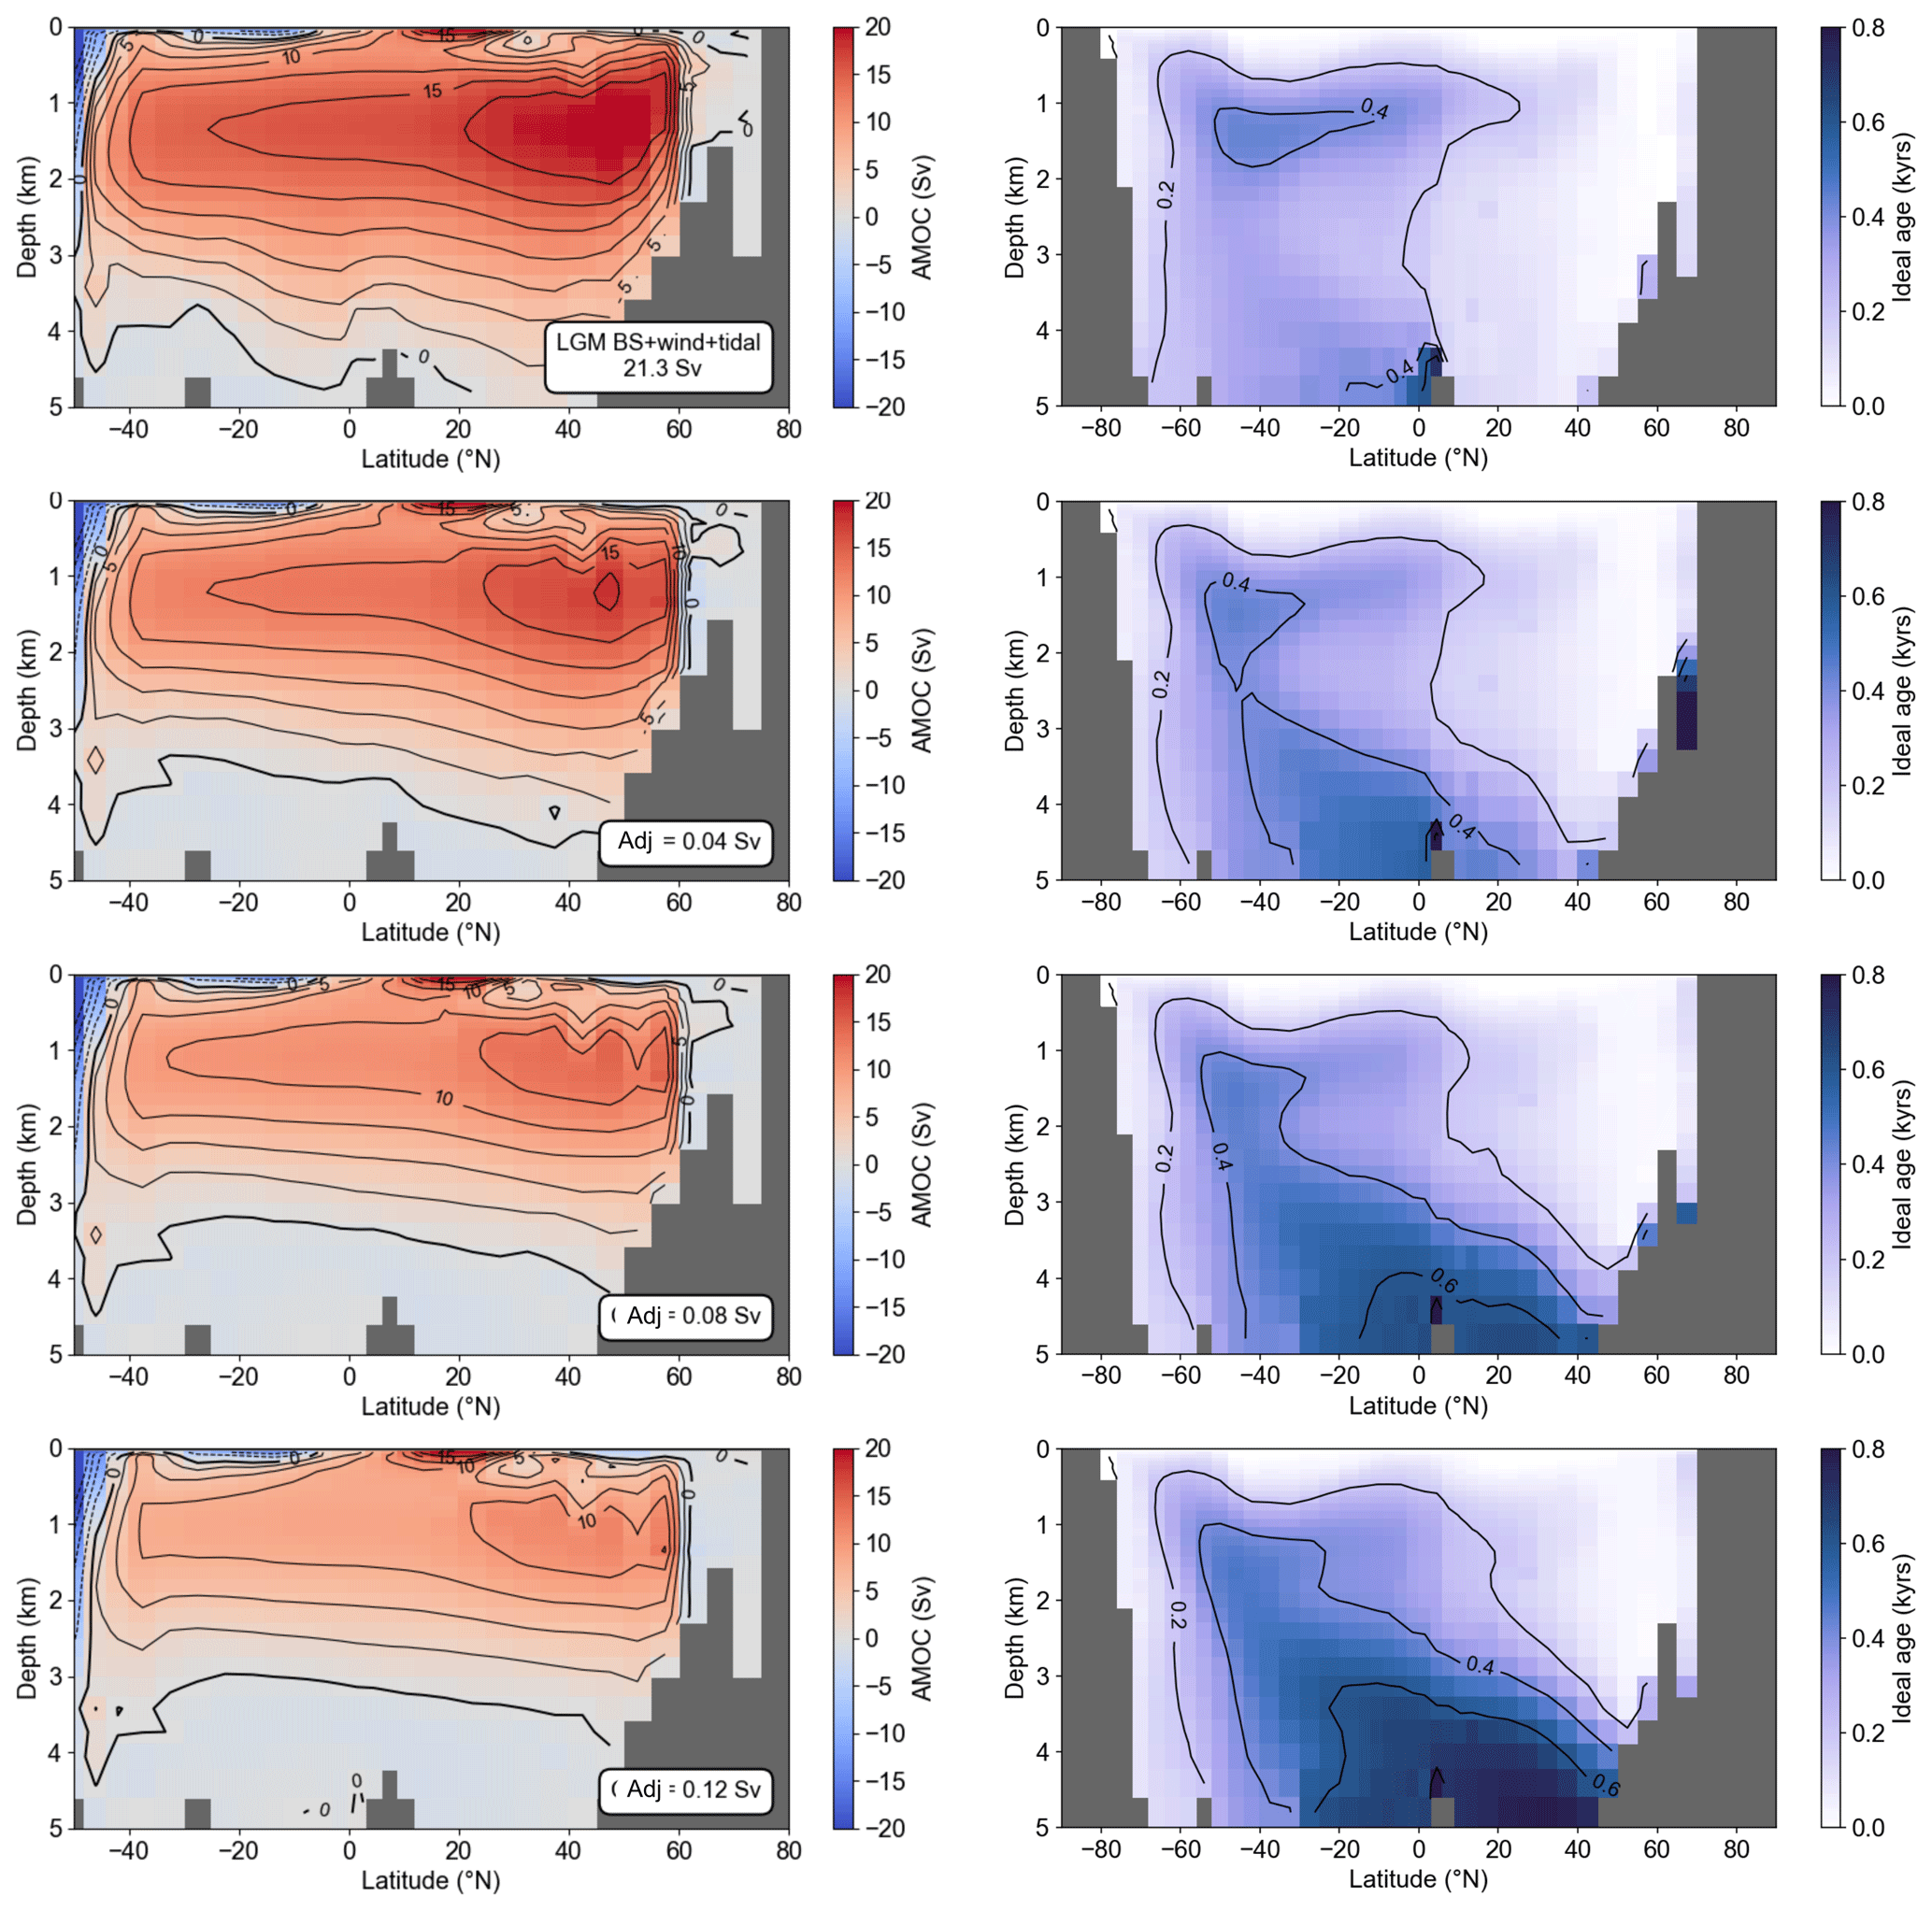
Figure B5(Left) Zonally integrated Atlantic stream functions with all LGM forcing changes (simulation LGM_BS+wind+tidal) but freshwater adjustment of 0.04 Sv to 0.12 Sv between the North Pacific and North Atlantic (cf. Fig. 6). The regions of the freshwater flux and the associated salt compensation are marked in Fig. B1. (Right) Zonally averaged ideal water age in the Atlantic. Ideal ages are set to zero at the surface and increase in the ocean interior at a rate of 1 yr yr−1.
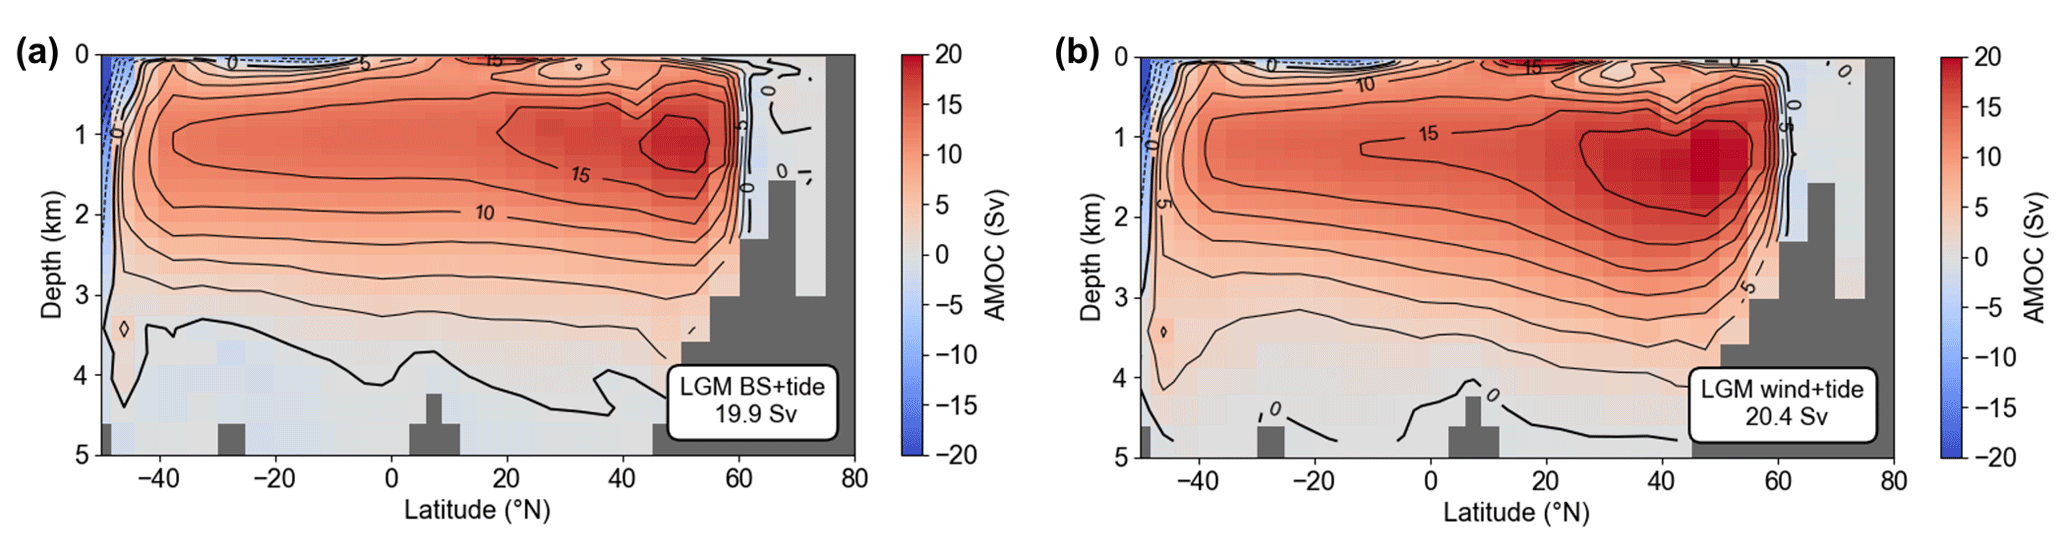
Figure B6Atlantic stream functions for LGM boundary conditions with (a) closed Bering Strait and consideration of increased tidal dissipation after Wilmes et al. (2019) and (b) added LGM wind stress anomalies from PMIP3 models (Muglia and Schmittner, 2015) and increased tidal dissipation.
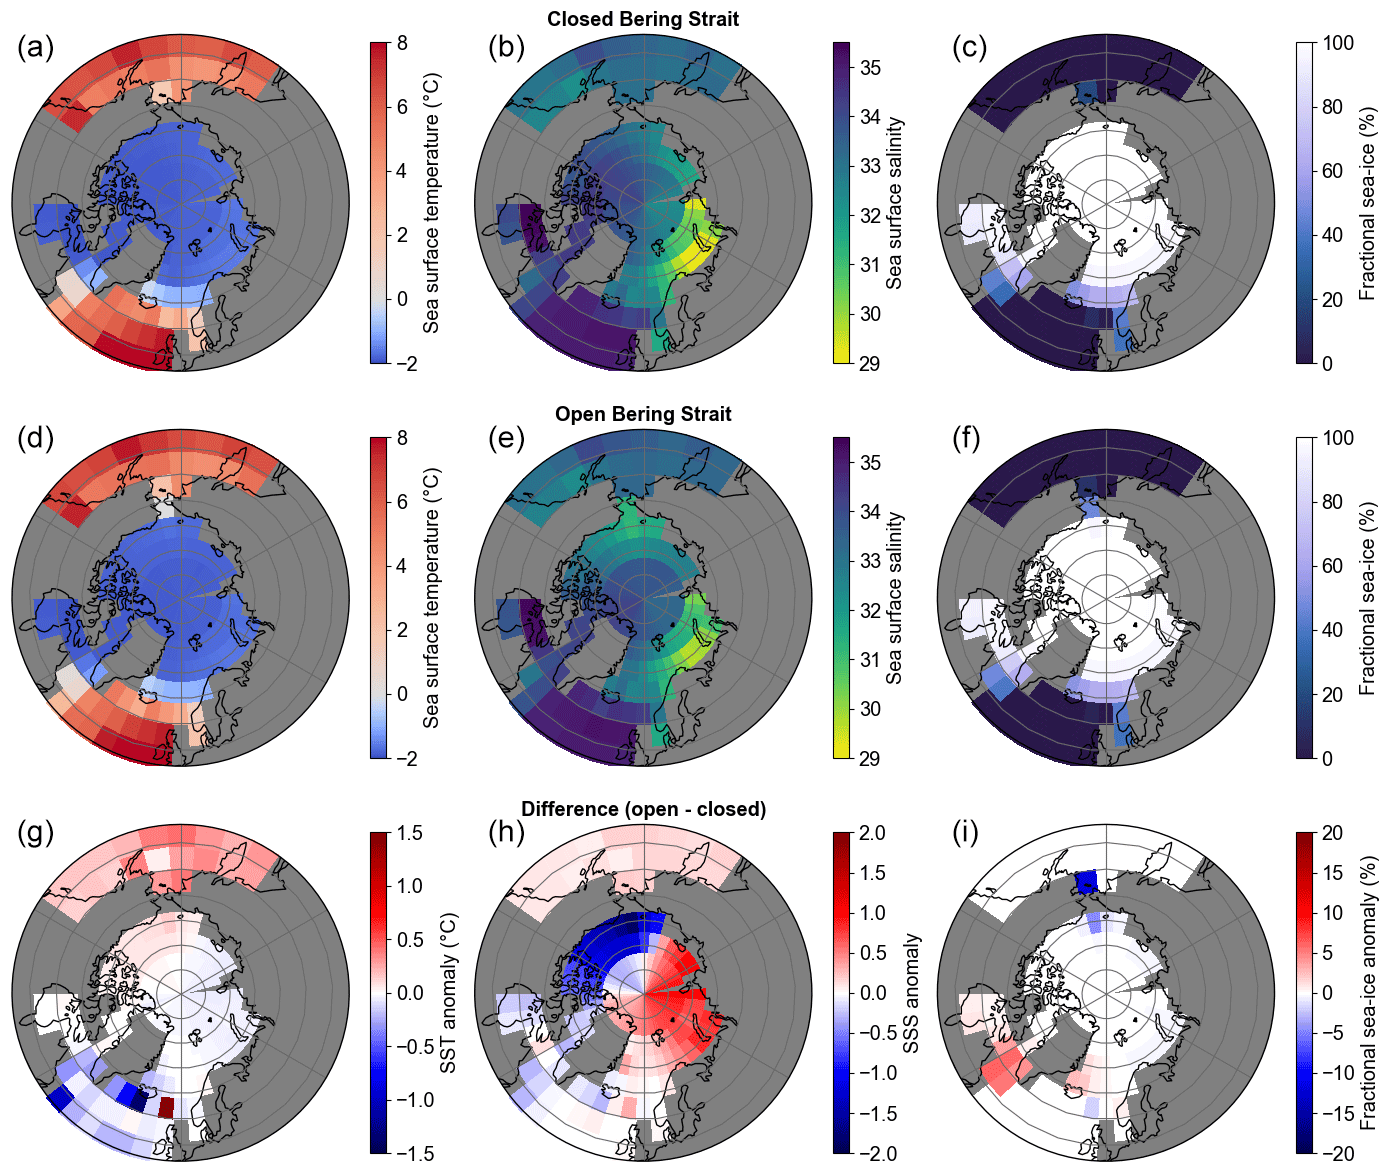
Figure B7Annual mean sea surface temperature (SST), sea surface salinity (SSS), and fractional sea ice north of 50∘ N under LGM boundary conditions. (a, b, c) Closed Bering Strait (simulation LGM_BS+wind+tidal), (d, e, f) the new steady state after transiently opening the Bering Strait but all other boundary conditions as in the top row, and (g, h, i) the difference between open and closed Bering Strait.
Simulation outputs used for this study are available at https://doi.org/10.5281/zenodo.4436092 (Pöppelmeier et al., 2021) or upon request from the corresponding author (frerk.poeppelmeier@climate.unibe.ch).
FP and TFS designed the study. FP developed and performed the model simulations with help from AJT and JS. FP wrote the initial paper with contributions from all co-authors.
The authors declare that they have no conflict of interest.
The work reflects only the authors' view; the European Commission and their executive agency are not responsible for any use that may be made of the information that the work contains.
Calculations were performed on UBELIX, the high-performance computing cluster at the University of Bern. This is TiPES contribution no. 45. The authors are grateful to Fortunat Joos for fruitful discussions and to the two anonymous reviewers for particularly helpful comments.
This research has been supported by the European Union Horizon 2020 program (COMFORT (grant no. 820989) and TiPES (grant no. 820970)) and the Schweizerischer Nationalfonds zur Förderung der Wissenschaftlichen Forschung (grant nos. 200020-172745 and 200020-172476).
This paper was edited by Qiuzhen Yin and reviewed by two anonymous referees.
Barker, S., Chen, J., Gong, X., Jonkers, L., Knorr, G., and Thornalley, D.: Icebergs not the trigger for North Atlantic cold events, Nature, 520, 333–336, https://doi.org/10.1038/nature14330, 2015.
Berger, A. L.: Long-Term Variations of Daily Insolation and Quaternary Climatic Changes, J. Atmos. Sci., 35, 2362–2367, https://doi.org/10.1175/1520-0469(1978)035<2362:LTVODI>2.0.CO;2, 1978.
Böhm, E., Lippold, J., Gutjahr, M., Frank, M., Blaser, P., Antz, B., Fohlmeister, J., Frank, N., Andersen, M. B., and Deininger, M.: Strong and deep Atlantic meridional overturning circulation during the last glacial cycle, Nature, 517, 73–76, https://doi.org/10.1038/nature14059, 2015.
Braconnot, P., Harrison, S. P., Kageyama, M., Bartlein, P. J., Masson-Delmotte, V., Abe-Ouchi, A., Otto-Bliesner, B., and Zhao, Y.: Evaluation of climate models using palaeoclimatic data, Nat. Clim. Change, 2, 417–424, https://doi.org/10.1038/nclimate1456, 2012.
Bradtmiller, L. I., McManus, J. F., and Robinson, L. F.: 231Pa/230Th evidence for a weakened but persistent Atlantic meridional overturning circulation during Heinrich Stadial 1, Nat. Commun., 5, 5817, https://doi.org/10.1038/ncomms6817, 2014.
Broecker, W., Bond, G., Klas, M., Clark, E., and McManus, J.: Origin of the northern Atlantic's Heinrich events, Clim. Dynam., 6, 265–273, https://doi.org/10.1007/BF00193540, 1992.
Broecker, W. S. and Denton, G. H.: The role of ocean-atmosphere reorganizations in glacial cycles, Geochim. Cosmochim. Ac., 53, 2465–2501, https://doi.org/10.1016/0016-7037(89)90123-3, 1989.
Clark, P. U., Marshall, S. J., Clarke, G. K. C., Hostetler, S. W., Licciardi, J. M., and Teller, J. T.: Freshwater forcing of abrupt climate change during the last glaciation, Science, 293, 283–287, https://doi.org/10.1126/science.1062517, 2001.
Condron, A. and Winsor, P.: Meltwater routing and the Younger Dryas, P. Natl. Acad. Sci. USA, 109, 19928–19933, https://doi.org/10.1073/pnas.1207381109, 2012.
Curry, W. B. and Oppo, D. W.: Glacial water mass geometry and the distribution of δ13C of ΣCO2 in the western Atlantic Ocean, Paleoceanography, 20, 1–12, https://doi.org/10.1029/2004PA001021, 2005.
Denton, G. H., Anderson, R. F., Toggweiler, J. R., Edwards, R. L., Schaefer, J. M., and Putnam, A. E.: The last glacial termination, Science, 328, 1652–1656, https://doi.org/10.1126/science.1184119, 2010.
Driesschaert, E., Fichefet, T., Goosse, H., Huybrechts, P., Janssens, I., Mouchet, A., Munhoven, G., Brovkin, V., and Weber, S. L.: Modeling the influence of Greenland ice sheet melting on the Atlantic meridional overturning circulation during the next millennia, Geophys. Res. Lett., 34, 1–5, https://doi.org/10.1029/2007GL029516, 2007.
Du, J., Haley, B. A., and Mix, A. C.: Evolution of the Global Overturning Circulation since the Last Glacial Maximum based on marine authigenic neodymium isotopes, Quaternary Sci. Rev., 241, 106396, https://doi.org/10.1016/j.quascirev.2020.106396, 2020.
Duplessy, J. C., Shackleton, N. J., Fairbanks, R. G., Labeyriefi, L., Oppo, D., Labeyrie, L., Oppo, D., and Kallel, N.: Deepwater source variations during the last climatic cylce and their impact on the global deepwater circulation, Paleoceanography, 3, 343–360, https://doi.org/10.1029/PA003i003p00343, 1988.
Edwards, N. R., Willmott, A. J., and Killworth, P. D.: On the role of topography and wind stress on the stability of the thermohaline circulation, J. Phys. Oceanogr., 28, 756–778, https://doi.org/10.1175/1520-0485(1998)028<0756:OTROTA>2.0.CO;2, 1998.
Egbert, G. D., Ray, R. D., and Bills, B. G.: Numerical modeling of the global semidiurnal tide in the present day and in the last glacial maximum, J. Geophys. Res.-Oceans, 109, 1–15, https://doi.org/10.1029/2003jc001973, 2004.
Evans, H. K. and Hall, I. R.: Deepwater circulation on Blake Outer Ridge (western North Atlantic) during the Holocene, Younger Dryas, and Last Glacial Maximum, Geochem. Geophy. Geosyst., 9, 1–19, https://doi.org/10.1029/2007GC001771, 2008.
Fischer, H., Schmitt, J., Lüthi, D., Stocker, T. F., Tschumi, T., Parekh, P., Joos, F., Köhler, P., Völker, C., Gersonde, R., Barbante, C., Le Floch, M., Raynaud, D., and Wolff, E.: The role of Southern Ocean processes in orbital and millennial CO2 variations – A synthesis, Quaternary Sci. Rev., 29, 193–205, https://doi.org/10.1016/j.quascirev.2009.06.007, 2010.
Freeman, E., Skinner, L. C., Waelbroeck, C., and Hodell, D.: Radiocarbon evidence for enhanced respired carbon storage in the Atlantic at the Last Glacial Maximum, Nat. Commun., 7, 1–8, https://doi.org/10.1038/ncomms11998, 2016.
Gebbie, G.: How much did Glacial North Atlantic Water shoal?, Paleoceanography, 29, 190–209, https://doi.org/10.1002/2013PA002557, 2014.
Goes, M., Murphy, L. N., and Clement, A. C.: The Stability of the AMOC During Heinrich Events Is Not Dependent on the AMOC Strength in an Intermediate Complexity Earth System Model Ensemble, Paleoceanogr. Paleoclimatol., 34, 1359–1374, https://doi.org/10.1029/2019PA003580, 2019.
Griffies, S. M.: The Gent–McWilliams Skew Flux, J. Phys. Oceanogr., 28, 831–841, https://doi.org/10.1175/1520-0485(1998)028<0831:TGMSF>2.0.CO;2, 1998.
Hesse, T., Butzin, M., Bickert, T., and Lohmann, G.: A model-data comparison of δ13C in the glacial Atlantic Ocean, Paleoceanography, 26, 1–16, https://doi.org/10.1029/2010PA002085, 2011.
Howe, J. N. W., Piotrowski, A. M., Noble, T. L., Mulitza, S., Chiessi, C. M., and Bayon, G.: North Atlantic Deep Water Production during the Last Glacial Maximum, Nat. Commun., 7, 11765, https://doi.org/10.1038/ncomms11765, 2016.
Hu, A., Meehl, G. A., Han, W., Timmermann, A., Otto-Bliesner, B., Liu, Z., Washington, W. M., Large, W., Abe-Ouchi, A., Kimoto, M., Lambeck, K., and Wu, B.: Role of the Bering Strait on the hysteresis of the ocean conveyor belt circulation and glacial climate stability, P. Natl. Acad. Sci. USA, 109, 6417–6422, https://doi.org/10.1073/pnas.1116014109, 2012.
Jenkins, W. J., Smethie, W. M., Boyle, E. A., and Cutter, G. A.: Water mass analysis for the U.S. GEOTRACES (GA03) North Atlantic sections, Deep Sea Res., 116, 6–20, https://doi.org/10.1016/j.dsr2.2014.11.018, 2015.
Kalnay, E., Kanamitsu, M., Kistler, R., Collins, W., Deaven, D., Gandin, L., Iredell, M., Saha, S., White, G., Wollen, J., Zhu, Y., Chelliah, M., Ebisuzaki, W., Higgins, W., Janowiak, J., Mo, K. C., Ropelewski, C., Wang, J., Leetmaa, A., and Joseph, D.: The NCEP NCAR 40-Year Reanalysis Project. B. Am. Meteorol. Soc., 77, 437–472, https://doi.org/10.1175/1520-0477(1996)077<0437:TNYRP>2.0.CO;2, 1996.
Keigwin, L. D. and Swift, S. A.: Carbon isotope evidence for a northern source of deep water in the glacial western North Atlantic, P. Natl. Acad. Sci. USA, 114, 2831–2835, https://doi.org/10.1073/pnas.1614693114, 2017.
Keigwin, L. D., Klotsko, S., Zhao, N., Reilly, B., Giosan, L., and Driscoll, N. W.: Deglacial floods in the Beaufort Sea preceded Younger Dryas cooling, Nat. Geosci., 11, 599–604, https://doi.org/10.1038/s41561-018-0169-6, 2018.
Lambeck, K., Rouby, H., Purcell, A., Sun, Y., and Sambridge, M.: Sea level and global ice volumes from the Last Glacial Maximum to the Holocene, P. Natl. Acad. Sci. USA, 111, 15296–15303, https://doi.org/10.1073/pnas.1411762111, 2014.
Lehman, S. J. and Keigwin, L. D.: Sudden changes in North Atlantic circulation during the last deglaciation, Nature, 356, 757–762, https://doi.org/10.1038/356757a0, 1992.
Lenton, T. M., Held, H., Kriegler, E., Hall, J. W., Lucht, W., Rahmstrof, S., and Schellnhuber, H. J.: Tipping elements in the Earth System, P. Natl. Acad. Sci. USA, 105, 1786–1793, https://doi.org/10.1073/pnas.0911106106, 2008.
Lippold, J., Luo, Y., Francois, R., Allen, S. E., Gherardi, J., Pichat, S., Hickey, B., and Schulz, H.: Strength and geometry of the glacial Atlantic Meridional Overturning Circulation, Nat. Geosci., 5, 813–816, https://doi.org/10.1038/ngeo1608, 2012.
Lynch-Stieglitz, J.: The Atlantic Meridional Overturning Circulation and Abrupt Climate Change, Ann. Rev. Mar. Sci., 9, 83–104, https://doi.org/10.1146/annurev-marine-010816-060415, 2017.
Lynch-Stieglitz, J., Adkins, J. F., Curry, W. B., Dokken, T., Hall, I. R., Herguera, J. C., Hirschi, J. J. M., Ivanova, E. V., Kissel, C., Marchal, O., Marchitto, T. M., McCave, I. N., McManus, J. F., Mulitza, S., Ninnemann, U., Peeters, F., Yu, E. F., and Zahn, R.: Atlantic meridional overturning circulation during the last glacial maximum, Science, 316, 66–69, https://doi.org/10.1126/science.1137127, 2007.
McCarthy, G. D., Smeed, D. A., Johns, W. E., Frajka-Williams, E., Moat, B. I., Rayner, D., Baringer, M. O., Meinen, C. S., Collins, J., and Bryden, H. L.: Measuring the Atlantic Meridional Overturning Circulation at 26∘N, Prog. Oceanogr., 130, 91–111, https://doi.org/10.1016/j.pocean.2014.10.006, 2015.
McManus, J. F., Francois, R., Gherardl, J. M., Kelgwin, L., and Drown-Leger, S.: Collapse and rapid resumption of Atlantic meridional circulation linked to deglacial climate changes, Nature, 428, 834–837, https://doi.org/10.1038/nature02494, 2004.
Menviel, L., Yu, J., Joos, F., Mouchet, A., Meissner, K. J., and England, M. H.: Poorly ventilated deep ocean at the Last Glacial Maximum inferred from carbon isotopes: A data-model comparison study, Paleoceanography, 32, 2–17, https://doi.org/10.1002/2016PA003024, 2017.
Menviel, L. C., Spence, P., Skinner, L. C., Tachikawa, K., Friedrich, T., Missiaen, L., and Yu, J.: Enhanced mid-depth southward transport in the Northeast Atlantic at the Last Glacial Maximum despite a weaker AMOC, Paleoceanog. Paleoclimatol., 35, e2019PA003793, https://doi.org/10.1029/2019PA003793, 2020.
Monnin, E., Indermühle, A., Dällenbach, A., Flückiger, J., Stauffer, B., Stocker, T. F., Raynaud, D., and Barnola, J. M.: Atmospheric CO2 concentrations over the last glacial termination, Science, 291, 112–114, https://doi.org/10.1126/science.291.5501.112, 2001.
Muglia, J. and Schmittner, A.: Glacial Atlantic overturning increased by wind stress in climate models, Geophys. Res. Lett., 42, 9862–9869, https://doi.org/10.1002/2015GL064583, 2015.
Müller, S. A., Joos, F., Edwards, N. R., and Stocker, T. F.: Water mass distribution and ventilation time scales in a cost-efficient, three dimensional ocean model, J. Climate, 19, 5479–5499, https://doi.org/10.1175/JCLI3911.1, 2006.
Oppo, D. W., Curry, W. B., and McManus, J. F.: What do benthic 13C and 18O data tell us about Atlantic circulation during Heinrich Stadial 1?, Paleoceanography, 20, 353–368, https://doi.org/10.1002/2014PA002667, 2015.
Oppo, D. W., Gebbie, G., Huang, K. F., Curry, W. B., Marchitto, T. M., and Pietro, K. R.: Data Constraints on Glacial Atlantic Water Mass Geometry and Properties, Paleoceanog. Paleoclimatol., 33, 1013–1034, https://doi.org/10.1029/2018PA003408, 2018.
Peltier, W. R.: Ice Age Paleotopography, Science, 265, 195–201, https://doi.org/10.1126/science.265.5169.195, 1994.
Pico, T., Mitrovica, J. X., and Mix, A. C.: Sea level fingerprinting of the Bering Strait flooding history detects the source of the Younger Dryas climate event, Sci. Adv., 6, eaay2935, https://doi.org/10.1126/sciadv.aay2935, 2020.
Pöppelmeier, F., Blaser, P., Gutjahr, M., Jaccard, S., Frank, M., Max, L., and Lippold, J.: Northern Sourced Water dominated the Atlantic Ocean during the Last Glacial Maximum, Geology, 48, 826–829, https://doi.org/10.1130/G47628.1, 2020.
Pöppelmeier, F., Scheen, J., Jeltsch-Thömmes, A., and Stocker, T. F.: Model output from the Bern3D model of pre-industrial and Last Glacial Maximum, Data set, Zenodo, https://doi.org/10.5281/zenodo.4436092, 2021.
Rahmstorf, S., Crucifix, M., Ganopolski, A., Goosse, H., Kamenkovich, I., Knutti, R., Lohmann, G., Marsh, R., Myzak, L. A., Wang, Z., and Weaver, A. J.: Thermohaline circulation hysteresis: A model intercomparison, Geophys. Res. Lett., 32, 1–5, https://doi.org/10.1029/2005GL023655, 2005.
Renssen, H., Mairesse, A., Goosse, H., Mathiot, P., Heiri, O., Roche, D. M., Nisancioglu, K. H., and Valdes, P. J.: Multiple causes of the Younger Dryas cold period, Nat. Geosci., 8, 946–949, https://doi.org/10.1038/ngeo2557, 2015.
Ritz, S. P., Stocker, T. F., and Joos, F.: A coupled dynamical ocean-energy balance atmosphere model for paleoclimate studies, J. Climate, 24, 349–375, https://doi.org/10.1175/2010JCLI3351.1, 2011.
Roberts, W. H. G., Valdes, P. J., and Payne, A. J.: A new constraint on the size of Heinrich Events from an iceberg/sediment model, Earth Planet. Sci. Lett., 386, 1–9, https://doi.org/10.1016/j.epsl.2013.10.020, 2014.
Roth, R., Ritz, S. P., and Joos, F.: Burial-nutrient feedbacks amplify the sensitivity of atmospheric carbon dioxide to changes in organic matter remineralisation, Earth Syst. Dynam., 5, 321–343, https://doi.org/10.5194/esd-5-321-2014, 2014.
Sarnthein, M., Winn, K., Jung, S., Duplessy, J. C., Labeyrie, L., Erlenkeuser, H., and Ganssen, G.: Changes in east Atlantic deepwater circulation over the last 30,000 years: Eight time slice reconstructions, Paleoceanography, 9, 209–267, https://doi.org/10.1029/93PA03301, 1994.
Schmittner, A. and Egbert, G. D.: An improved parameterization of tidal mixing for ocean models, Geosci. Model Dev., 7, 211–224, https://doi.org/10.5194/gmd-7-211-2014, 2014.
Skinner, L. C., Primeau, F., Freeman, E., De La Fuente, M., Goodwin, P. A., Gottschalk, J., Huang, E., McCave, I. N., Noble, T. L., and Scrivner, A. E.: Radiocarbon constraints on the glacial ocean circulation and its impact on atmospheric CO2, Nat. Commun., 8, 1–10, https://doi.org/10.1038/ncomms16010, 2017.
Stocker, T. F.: Past and future reorganizations in the climate system, Quaternary Sci. Rev., 19, 301–319, https://doi.org/10.1016/S0277-3791(99)00067-0, 2000.
Stocker, T. F. and Marchal, O.: Abrupt climate change in the computer: Is it real?, P. Natl. Acad. Sci. USA, 97, 1362–1365, https://doi.org/10.1073/pnas.97.4.1362, 2000.
Stocker, T. F. and Schmittner, A.: Influence of CO2 emission rates on the stability of the thermohaline circulation, Nature, 388, 862–865, https://doi.org/10.1038/42224, 1997.
Stocker, T. F. and Wright, D. G.: Rapid transitions of the ocean's deep circulation induced by changes in surface water fluxes, Nature, 351, 729–732, https://doi.org/10.1038/351729a0, 1991.
Stocker, T. F., Timmermann, A., Renold, M., and Timm, O.: Effect of salt compensation on the climate model response in simulations of large changes of the Atlantic meridional overturning circulation, J. Climate, 20, 5912–5928, https://doi.org/10.1175/2007JCLI1662.1, 2007.
Stommel, H.: Thermohaline Convection with Two Stable Regimes, Tellus, 13, 224–230, https://doi.org/10.1111/j.2153-3490.1961.tb00079.x, 1961.
Wilmes, S. B., Schmittner, A., and Green, J. A. M.: Glacial Ice Sheet Extent Effects on Modeled Tidal Mixing and the Global Overturning Circulation, Paleoceanogr. Paleoclimatol., 34, 1437–1454, https://doi.org/10.1029/2019PA003644, 2019.
Woodgate, R. A., Aagaard, K., and Weingartner, T. J.: Monthly temperature, salinity, and transport variability of the Bering Strait through flow, Geophys. Res. Lett., 32, 1–4, https://doi.org/10.1029/2004GL021880, 2005.
Zaucker, F., Stocker, T. F., and Broecker, W. S.: Atmospheric freshwater fluxes and their effect on the global thermohaline circulation, J. Geophys. Res., 99, 12443–12457, https://doi.org/10.1029/94JC00526, 1994.