the Creative Commons Attribution 4.0 License.
the Creative Commons Attribution 4.0 License.
 | 08 Dec 2021
Evaluating the large-scale hydrological cycle response within the Pliocene Model Intercomparison Project Phase 2 (PlioMIP2) ensemble
Ran Feng
Alan M. Haywood
Julia C. Tindall
Stephen J. Hunter
Bette L. Otto-Bliesner
Esther C. Brady
Nan Rosenbloom
Zhongshi Zhang
Xiangyu Li
Chuncheng Guo
Kerim H. Nisancioglu
Christian Stepanek
Gerrit Lohmann
Linda E. Sohl
Mark A. Chandler
Ning Tan
Gilles Ramstein
Michiel L. J. Baatsen
Anna S. von der Heydt
Deepak Chandan
W. Richard Peltier
Charles J. R. Williams
Daniel J. Lunt
Jianbo Cheng
Qin Wen
Natalie J. Burls
The mid-Pliocene (∼3 Ma) is one of the most recent warm periods with high CO2 concentrations in the atmosphere and resulting high temperatures, and it is often cited as an analog for near-term future climate change. Here, we apply a moisture budget analysis to investigate the response of the large-scale hydrological cycle at low latitudes within a 13-model ensemble from the Pliocene Model Intercomparison Project Phase 2 (PlioMIP2). The results show that increased atmospheric moisture content within the mid-Pliocene ensemble (due to the thermodynamic effect) results in wetter conditions over the deep tropics, i.e., the Pacific intertropical convergence zone (ITCZ) and the Maritime Continent, and drier conditions over the subtropics. Note that the dynamic effect plays a more important role than the thermodynamic effect in regional precipitation minus evaporation (PmE) changes (i.e., northward ITCZ shift and wetter northern Indian Ocean). The thermodynamic effect is offset to some extent by a dynamic effect involving a northward shift of the Hadley circulation that dries the deep tropics and moistens the subtropics in the Northern Hemisphere (i.e., the subtropical Pacific). From the perspective of Earth's energy budget, the enhanced southward cross-equatorial atmospheric transport (0.22 PW), induced by the hemispheric asymmetries of the atmospheric energy, favors an approximately 1∘ northward shift of the ITCZ. The shift of the ITCZ reorganizes atmospheric circulation, favoring a northward shift of the Hadley circulation. In addition, the Walker circulation consistently shifts westward within PlioMIP2 models, leading to wetter conditions over the northern Indian Ocean. The PlioMIP2 ensemble highlights that an imbalance of interhemispheric atmospheric energy during the mid-Pliocene could have led to changes in the dynamic effect, offsetting the thermodynamic effect and, hence, altering mid-Pliocene hydroclimate.
- Article
(13821 KB) - Full-text XML
- BibTeX
- EndNote


Global warming can induce regional and global anomalies in the Earth's hydrological cycle, thereby regulating the balance of global water resources (Eltahir and Bras, 1996). Many studies have indicated that pronounced climate change can occur as anthropogenic CO2 rises, including an increase in surface temperature (Xie et al., 2010; Long et al., 2014), Arctic amplification (Stuecker et al., 2018; Smith et al., 2019), and impacts on animal and plant populations (Root et al., 2003). Under current global warming, both observations and model simulations suggest a tendency for the “wet regions getting wetter and dry regions getting drier” phenomenon (Held and Soden, 2006; Wentz et al., 2007; Chou et al., 2009; Wang et al., 2012; Li et al., 2013). That is, precipitation minus evaporation (PmE) increases (decreases) in regions of climatological convergence (divergence). Note that this phenomenon is primarily focused on the ocean. A study by Greve et al. (2014) reported that only 10.8 % of the global land area shows the dry gets drier and wet gets wetter pattern. These changes in the large-scale hydrological cycle could induce severe climatic disasters worldwide, leading to considerable impacts on economies, ecosystems, and agriculture (Asokan and Destouni, 2014; Bengtsson, 2014). Therefore, understanding the potential processes responsible for large-scale hydrological cycle changes in a warmer climate is of great importance.
Previous studies have suggested that the thermodynamic effect caused by increased atmospheric moisture content in a warmer climate is one of the primary contributors to a tendency toward wet gets wetter and dry gets drier conditions (Chou et al., 2009; Seager et al., 2010). This mechanism directly follows the nonlinearity of the Clausius–Clapeyron relationship, which acts to increase atmospheric moisture content over regions with the warmest surface temperatures (Allen and Ingram, 2002; Stephens and Ellis, 2008). On the other hand, large-scale atmospheric circulation can change substantially due to nonuniform temperature changes under global warming and, hence, induce changes in the hydrological cycle via the so-called dynamic effect (Han et al., 2019a). The dynamic effect is relatively more complicated than the thermodynamic effect among climate models. Seager et al. (2010) demonstrated that the dynamic component is modulated by the weakening of the Hadley circulation and Walker circulation. An increased CO2 concentration could directly increase atmospheric static stability over tropical oceans, favoring a slowdown of these atmospheric overturning circulations (Vallis et al., 2015). Other studies have indicated that the local Hadley circulation shifts poleward due to the decreased meridional temperature gradient in response to increased CO2 concentrations (Sharmila and Walsh, 2018; Y. Hu et al., 2018). These circulation anomalies widen the subtropical dry zones (Previdi and Liepert, 2007; Sun et al., 2013a). In addition, Long et al. (2016) highlighted that model uncertainty in tropical rainfall comes from the discrepancies in the atmospheric circulation anomalies among models. Thus, the spread of circulation changes in response to global warming across climate models leads to a diversity in responses in the hydrological cycle.
Proxy data indicate that the mid-Pliocene (∼3 Ma) was one of the most recent warm periods with CO2 levels similar to the current anthropogenically elevated value of 400 ppm and can be considered an analog for future climate change (Dowsett et al., 2012; Burke et al., 2018; Tierney et al., 2019). Pliocene Model Intercomparison Project Phase 1 (PlioMIP1) simulations have been used to investigate how the climate system responded to mid-Pliocene boundary conditions, including elevated atmospheric CO2 concentrations. These past warm climate simulations exhibit many similarities with future climate projections. For example, one robust characteristic is increased temperature from 1.8 to 3.6∘C during the Pliocene compared with the preindustrial period (PI) (Haywood et al., 2013), with Arctic amplification in response to a significant decline in sea-ice extent (Howell et al., 2016; Zheng et al., 2019). These features could have reduced the meridional surface temperature gradient, inducing weaker tropical circulation (i.e., local Hadley circulation) during the Pliocene (Sun et al., 2013b; Li et al., 2015; Corvec and Fletcher, 2017). Additionally, some studies have suggested a weakened zonal sea surface temperature (SST) gradient in the Pacific during the Pliocene (Wara et al., 2005; Scroxton et al., 2011), which would have favored a weaker Walker circulation. These features could have induced large-scale changes in Pliocene hydroclimate. Using a climate simulation that captures the warming patterns seen in early-Pliocene sea surface temperature proxies, Burls and Fedorov (2017) suggested that the dynamic process might play a key role in driving wetter subtropics due to this weaker tropical circulation during the early-Pliocene warm climate compared with the future climate.
Although PlioMIP1 can reproduce similar patterns of the change in surface temperature to the reconstructed SST, models cannot capture the magnitude of warming at higher latitudes. For example, Dowsett et al. (2013) indicated that the ensemble of PlioMIP1 models underestimates the warming in the North Atlantic compared with the reconstructed SST. This might be induced by the uncertainties in PlioMIP1, including the uncertainty in atmospheric CO2 concentrations (Salzmann et al., 2013; Howell et al., 2016) and paleogeography and bathymetry (Otto-Bliesner et al., 2016; Feng et al., 2017). PlioMIP2 models show the closed Canadian Archipelago and Bering Strait and a reduced Greenland ice sheet relative to PlioMIP1. For one of the PlioMIP2 models, it has been shown that updating the paleogeography to PRISM4 is the major contributor to climate differences from PlioMIP1 to PlioMIP2 (Samakinwa et al., 2020). In addition, PlioMIP2 focuses on a specific time slice during the mid-Pliocene at approximately 3.025 Ma, which could reduce the uncertainties in reconstructions (McClymont et al., 2020). Researchers have been investigating the mid-Pliocene climate by using PlioMIP2, including Arctic warming (De Nooijer et al., 2020), Atlantic meridional overturning circulation (Z. Zhang et al., 2021), climate sensitivity (Haywood et al., 2020), global monsoons (Q. Zhang et al., 2021), and subtropical rainfall changes (Pontes et al., 2020). However, it is difficult to distinguish the relative impact of the Hadley circulation and Walker circulation on Pliocene hydrological cycling at low latitudes. Fortunately, the three-pattern decomposition of global atmospheric circulation (3P-DGAC; Hu et al., 2017; S. Hu et al., 2018a, b) method can help us to decompose atmospheric circulation into zonal (i.e., local Walker circulation) and meridional (i.e., local Hadley circulation) circulation at low latitudes. We apply this method to develop moisture budget analyses, which might provide some insight into the mechanisms of hydrological cycling during the mid-Pliocene.
This paper set is in the framework of updated PlioMIP2 models to quantitatively distinguish the relative contribution from zonal and meridional circulation anomalies to hydrological cycle changes. In the following section, we first introduce the PlioMIP2 models and moisture budget decomposition. We then evaluate the simulated large-scale hydroclimate cycle response within the PlioMIP2 ensemble in Sect. 3. Section 4 provides each moisture budget component's relative contribution to investigate the potential mechanisms driving the simulated changes in the mid-Pliocene hydrological cycle. The corresponding mechanisms are discussed in Sect. 5. The last section contains the conclusion and discussion.
2.1 Climate model simulations
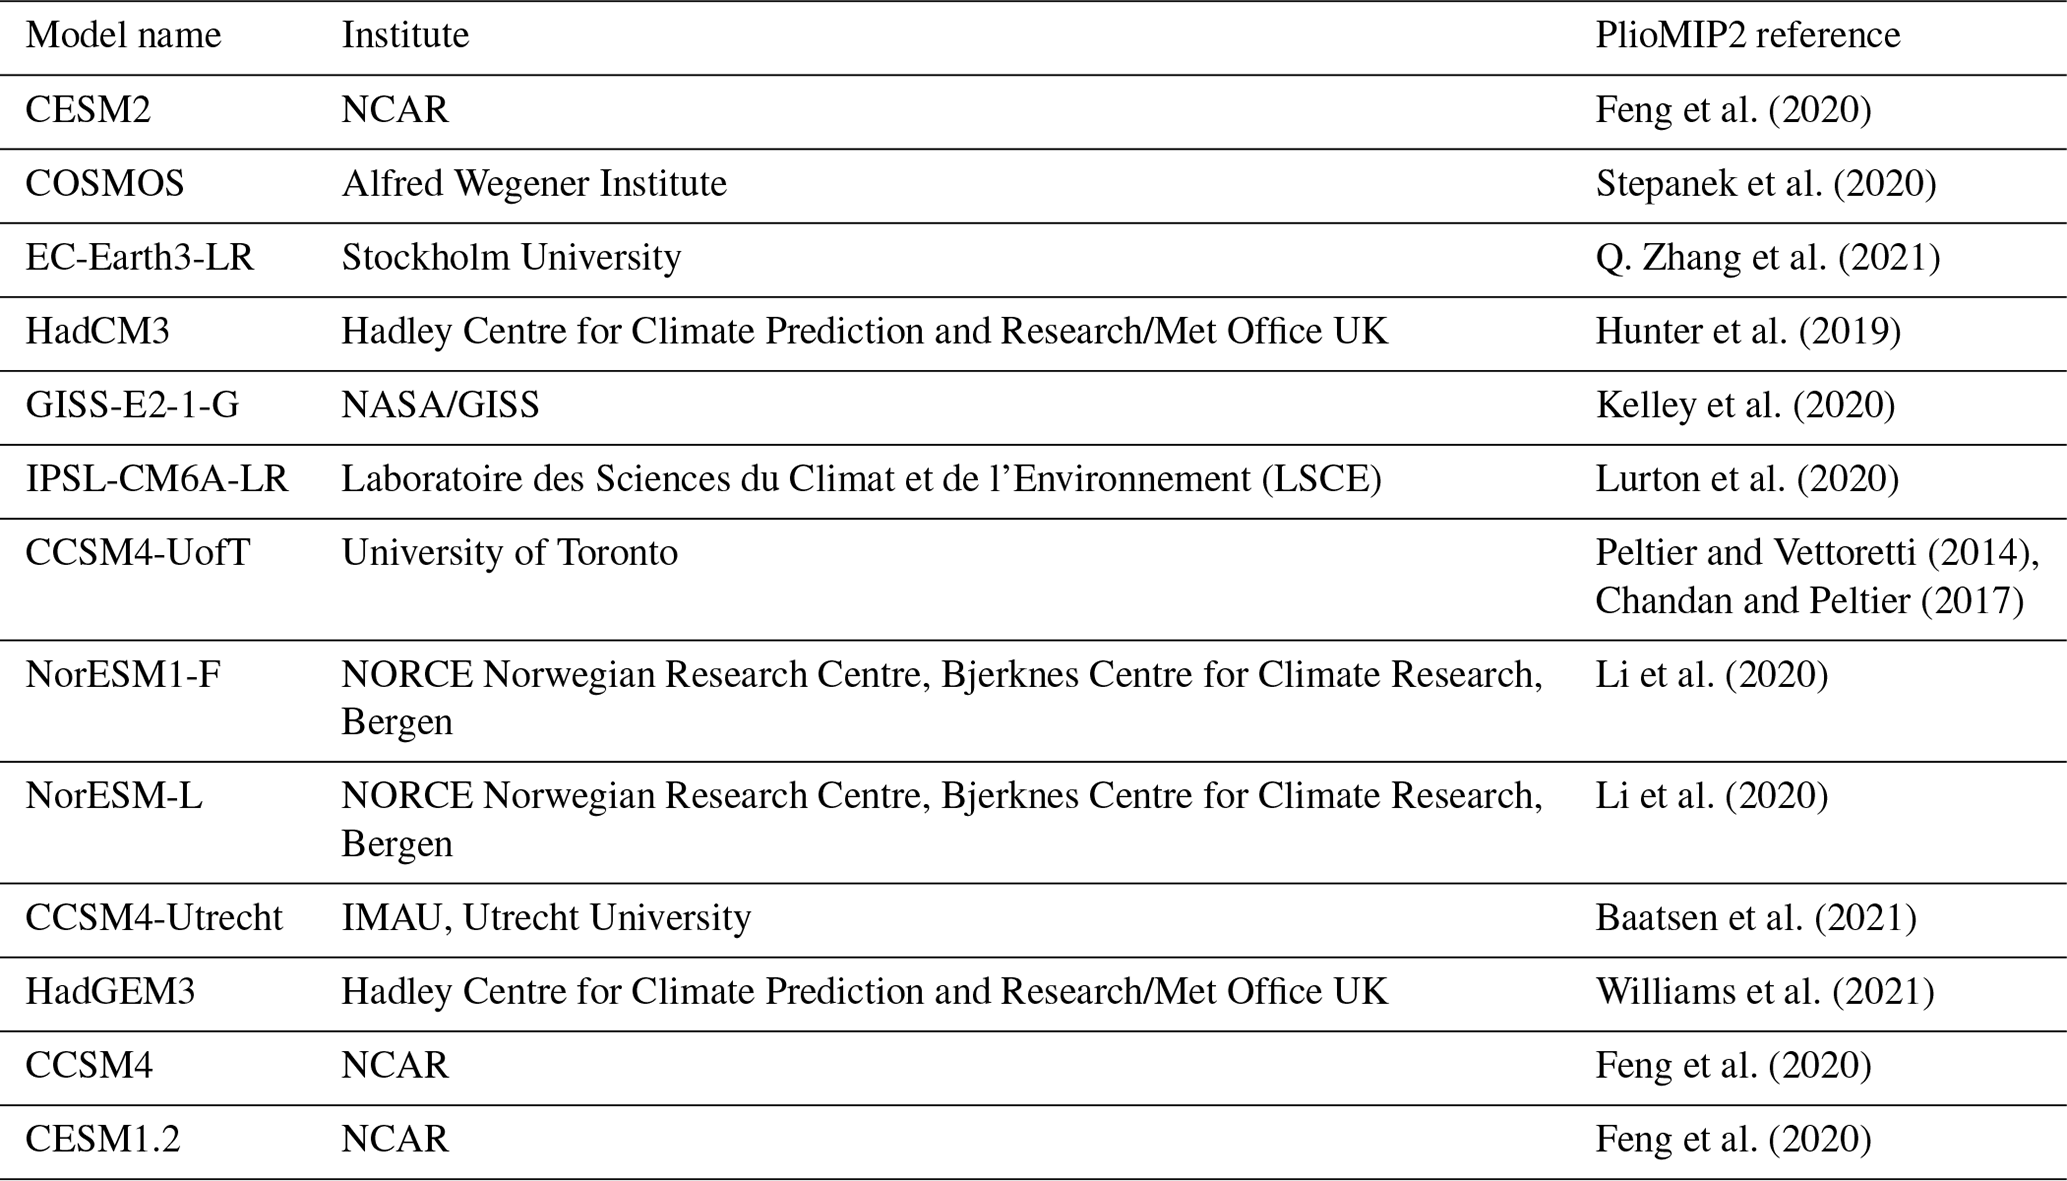
In this study, we use the simulations from 13 models participating in PlioMIP2 (Table 1). All models include a preindustrial (PI) simulation and a Pliocene climate simulation. In PlioMIP2 models, the boundary conditions have been updated using the new version of the U.S. Geological Survey PRISM4 dataset (Dowsett et al., 2016; Haywood et al., 2016), including soils, lakes, land-ice cover, vegetation, topography, and bathymetry. The CO2 levels for the mid-Pliocene and PI simulations are set at 400 and 280 ppmv, respectively. To calculate the ensemble mean, we interpolate all data onto a common grid with a resolution using bilinear interpolation.
2.2 Development of moisture budget decomposition
To examine the changes in precipitation (P) minus evaporation (E) in the PlioMIP2 mid-Pliocene experiments relative to their respective PI simulation, we decompose the moisture budget equation based on Seager et al. (2010), i.e.,
Here, g is gravity, ρw is the density of water, V is the horizontal wind, q is the specific humidity, δ(⋅) is the annual mean difference in variables between the warmer climate state (mid-Pliocene) and the PI simulation, and subscript 0 represents the variables in the PI simulation. In the warmer climate, the change in P minus E (PmE, the left-hand side of Eq. 1) is balanced by the thermodynamic (δTH, induced by increased specific humidity) and dynamic (δMCD, induced by circulation anomalies) contributions and residual term (R, which is mainly involved in the contributions from high-frequency variability of transient eddies, nonlinear effects, and surface boundary terms).
As we are interested in understanding the relative contribution from zonal circulation (i.e., local Walker circulation) changes and meridional circulation (i.e., local Hadley circulation) anomalies to the changes in PmE in a warmer climate, we further apply the three-pattern decomposition of global atmospheric circulation (3P-DGAC; Hu et al., 2017; S. Hu et al., 2018a, b) method in this study. The horizontal, meridional, and zonal circulations that can be viewed as the global generalization of the Rossby wave in the middle–high latitudes and the Hadley and Walker circulations in the low latitudes are defined to decompose the global atmospheric circulation into a superposition of the horizontal, meridional, and zonal circulations by using the 3P-DGAC method.
Based on the essential features of the Rossby, Hadley and Walker circulations, Hu et al. (2017) defined the 3D horizontal circulation VR, meridional circulation VM, and zonal circulation VZ in the spherical σ-coordinate system as follows:
Here, the following continuity equations are satisfied:
Equation (3) is the sufficient condition that the components of VR, VM, and VZ can be represented by the stream functions R(λθσ), H(λθσ), and W(λθσ), respectively, as follows:
Because three-pattern circulations (horizontal, meridional, and zonal circulations) exist in both the low latitudes and middle–high latitudes, the global atmospheric circulation can be expressed as the superposition of the horizontal, meridional, and zonal circulations – that is,
with the following components:
Equation (5) or (6) is called the three-pattern decomposition model.
In contrast to the traditional 2D decomposition of the atmospheric motion into vortex and divergent parts, the continuity Eq. (5) cannot guarantee the uniqueness of the stream functions R(λθσ), H(λθσ), and W(λθσ) because the three-pattern circulations VR, VM, and VZ have three spatial dimensions, respectively (Hu et al., 2017; S. Hu et al., 2018a, b). The following restriction condition is needed to pick up the correct decomposition (Theorems 1 and 2 in Y. Hu et al., 2018):
Equation (7) guarantees both the uniqueness of the stream functions R, H, and W and the physical rationality of the 3P-DGAC method.
Using the 3P-DGAC method, we can rephrase the moisture budget in Eq. (1) to involve the contributions from zonal and meridional circulation. Here, we neglect the relatively smaller terms at low latitudes, including transient eddies, nonlinear effects, and surface boundary terms. Thus, we mainly explore the contributions from δTH and δMCD to changes in PmE in this study. Then, the δTH and δMCD can be rewritten as follows:
where subscripts D and A represent the terms that are related to divergence and moisture advection, respectively. In addition, the subscripts R, Z, and M indicate the terms that are related to the horizontal, zonal, and meridional circulations, respectively. Note that VR represents the horizontal vortex winds, which are not divergent, which indicates that the terms that are related to the divergence/convergence of VR (i.e., δTHD_R and δMCDD_R) are zero. These terms can be clearly seen in Figs. 3h and 4h. In addition, we ignore these two terms in this study.
3.1 Changes in precipitation minus evaporation (PmE) in the PlioMIP2 models
The last 100 years of individual PlioMIP2 simulations are used to calculate the multi-model mean (MMM) PmE in Fig. 1 and individual PlioMIP2 models in Fig. 2.
Figure 1a shows that most subtropical regions experience reduced PmE in the mid-Pliocene simulations with respect to the PI simulations, including the subtropical Pacific and subtropical Atlantic in both hemispheres and the subtropical Indian Ocean in the Southern Hemisphere (SH). There is also drying over the South Pacific convergence zone (SPCZ), except in the GISS-E2-1-G, COSMOS, and HadGEM3 models (Fig. 2), consistent with other studies evaluating the hydrological cycle response within the PlioMIP2 simulations (Pontes et al., 2020). Note that there is a moistening signal in the southern part of the SPCZ in the tropical southern Pacific. In contrast, the increased MMM PmE is located in the deep tropics (i.e., Pacific intertropical convergence zone, ITCZ, and northern Indian Ocean) as well as at middle–high latitudes (Fig. 1a). However, some models (i.e., the CESM2, GISS-E2-1-G, COSMOS, and HadGEM3 models) show a drier Maritime Continent (Fig. 2), which might be related to the changes in Walker circulation (we will discuss this latter in Sect. 5.3). In addition, the North African and Southeast Asian monsoon regions also show significant moistening signals, which are consistent with faunal remains and palynological transfer functions (Sanyal et al., 2004; Trauth et al., 2007; Xie et al., 2012) as well as with other modeling studies (Zhang et al., 2019; Li et al., 2020; Feng et al., 2021). Zhang et al. (2016) indicate that the combined influence of SST and CO2 level, as well as the vegetation changes, play a very important role in changing the atmospheric circulation over North Africa during the mid-Pliocene, owing to the increased net atmospheric energy there. Additionally, the expansion of vegetation into the Sahara region tends to decrease the surface albedo, which can enhance the Saharan heat low and, hence, impact rainfall over West Africa, reflecting the vegetation–albedo feedback (Charney, 1975). Recent studies indicate that the enhanced vegetation in the PlioMIP2 ensemble is likely to have contributed to increased mid-Pliocene West African summer rainfall (Haywood et al., 2020; Berntell et al., 2021). This change over Southeast Asia is robust among PlioMIP2 models, and only the COSMOS model shows a drier change over East Asia (Fig. 2e). Furthermore, the MMM PmE changes over Southeast Asia are mainly focused on the summertime (not shown), suggesting a consequence of strengthened East Asian summer monsoon circulation (Salzmann et al., 2008; Wan et al., 2010; Yan et al., 2012; Zhang et al., 2013; Li et al., 2018; Lu et al., 2021). Note that the mid- to high-latitude North Atlantic becomes drier (Fig. 1a).
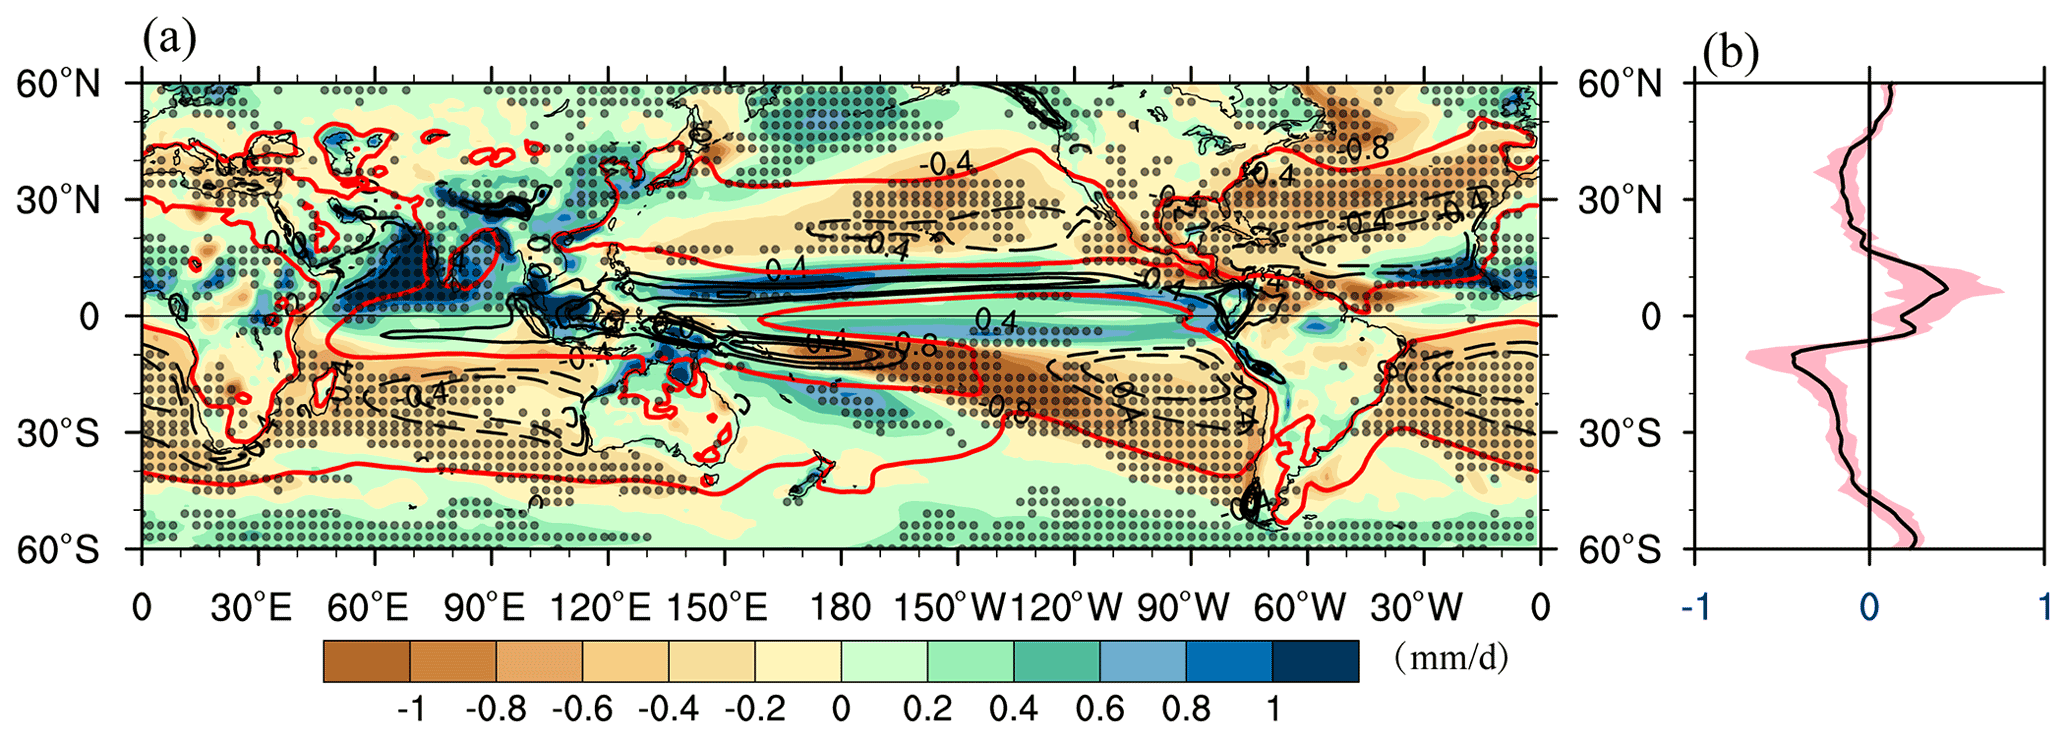
Figure 1The simulated PmE changes in individual PlioMIP2 models. The zonal average of the PmE changes in each model is shown in panel (b) (units: mm d−1).
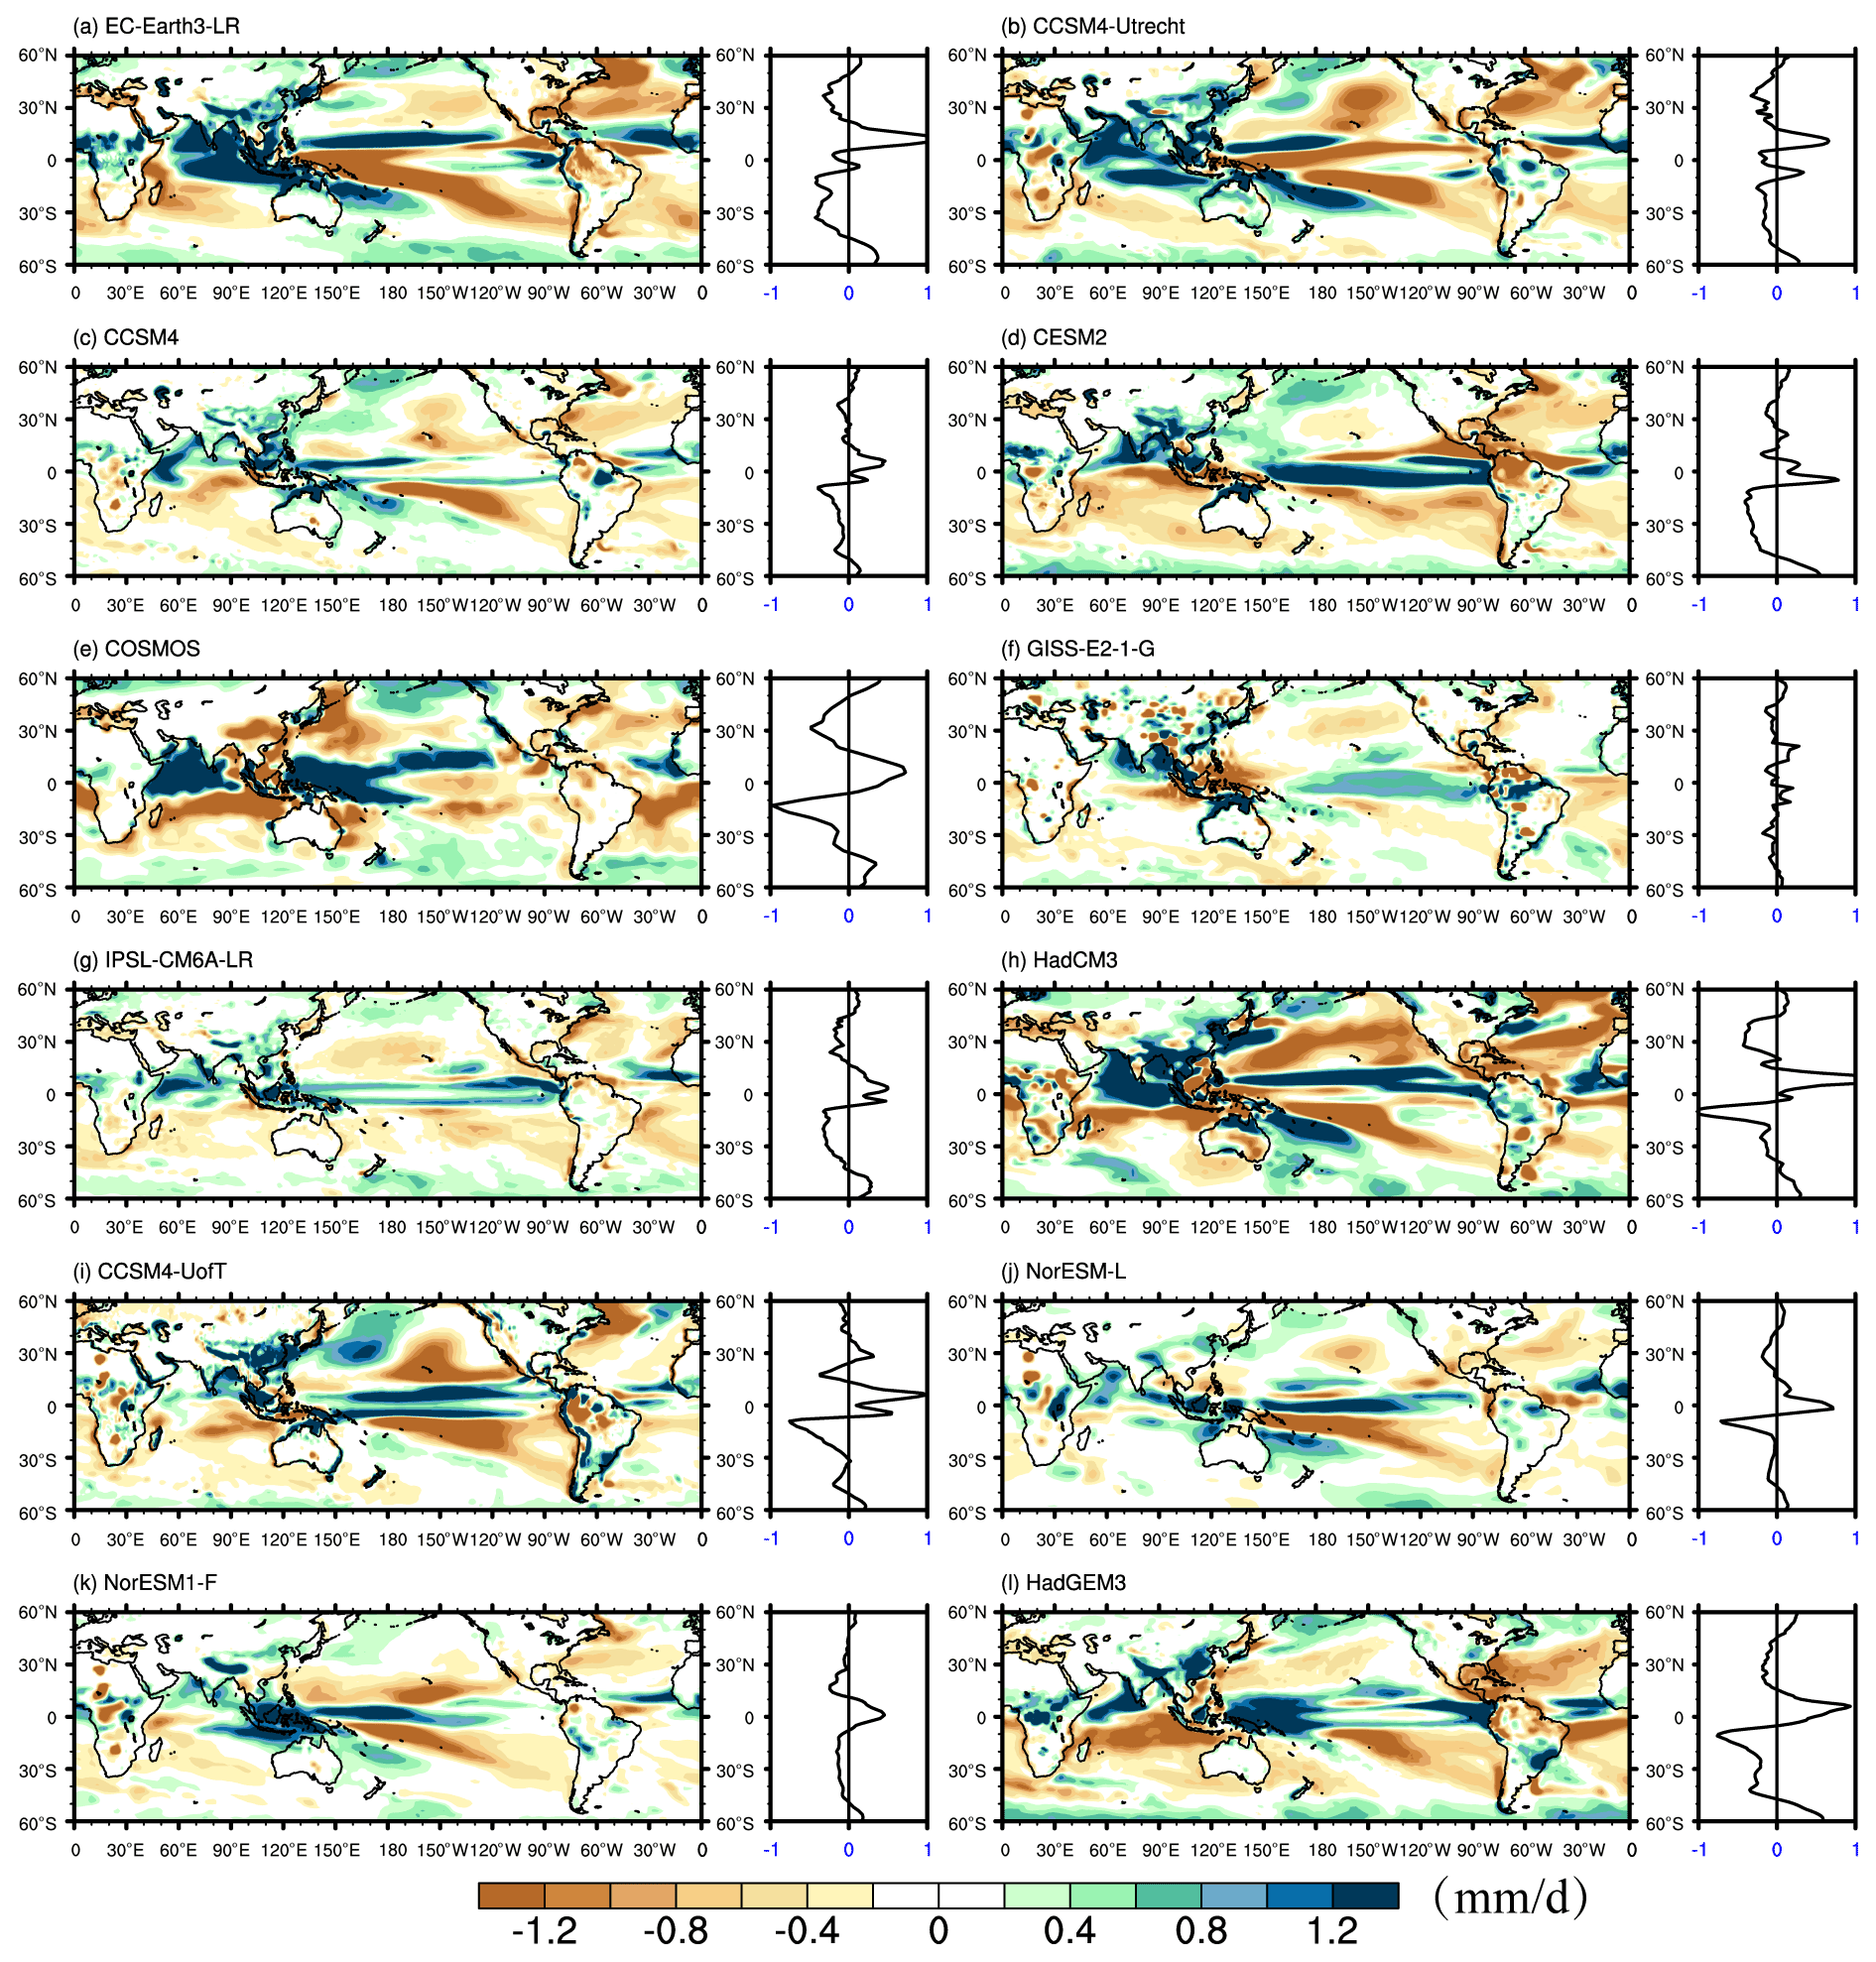
Figure 2(a) Changes in the multi-model mean (MMM) PmE for the mid-Pliocene compared with the PI simulation (shading), overlaid by the climatological MMM PmE of the PI simulation (for the contours, a solid line indicates positive values and a dashed line indicates negative values). The red solid curves represent the zero value. (b) The zonal average of the change in PmE, where the shading indicates the interquartile range among models. (Units are mm d−1.)
The response of the hydrological cycle during the mid-Pliocene generally shows a wet regions getting wetter and dry regions getting drier pattern, especially over the ocean. These features are apparent in the zonal average of the PmE change (Fig. 1b), except in the GISS-E2-1-G model (Fig. 2f). The tropical regions become wetter, and subtropical regions become drier, which are similar to the results from future high-CO2 scenario experiments (Chou et al., 2009). Earlier studies have indicated that these features of changes in PmE at low latitudes are linked to the increased specific humidity (i.e., changes in the thermodynamic effect). However, there are some opposite phenomenon as well, when looking at the regional changes in PmE (i.e., northern Indian Ocean, North Africa, and the SPCZ). These may suggest that another factor, such as atmospheric circulation anomalies (i.e., changes in dynamic effect), may play an important role in changing the regional PmE pattern at low latitudes.
3.2 Previous model–data comparisons of hydrological changes in the PlioMIP2 ensemble
Multi-proxy studies are qualitatively consistent with the results of the PlioMIP2 ensemble (Feng et al., 2021). For several studies, proxy reconstructions suggest an expansion of woodland and a higher density of land cover over northern Africa, indicating moistening signals there (Salzmann et al., 2008; Bonnefille, 2010). The sedimentological indicators and pollen data also suggest a more humid climate over the Levant and Arabian peninsulas during the mid-Pliocene (Munoz et al., 2002; Heermance et al., 2013). In addition, the faunal remains or palynological transfer functions show wetter conditions in East and South Asia during the mid-Pliocene (Sanyal et al., 2004; Igarashi and Yoshida, 1988; Kou et al., 2006). However, uncertainties related to the hydroclimate of the mid-Pliocene still remain. For instance, pollen evidence suggests little hydroclimate change during the Pliocene in Qaidam Basin and southwest China's Yuanmou region (Wang et al., 1999; Chang et al., 2010; Heermance et al., 2013). Some proxies even show a drier climate over the Loess Plateau region (Ji et al., 2017; Sun et al., 2010). Note that the relatively low availability of Pliocene hydroclimate proxies makes it difficult to perform a model–proxy comparison. Furthermore, PlioMIP2 modeling experiments are designed to simulate the Marine Isotope Stage KM5c (3.205 Ma) during the mid-Pliocene, and this particular orbital interval likely does not represent the full Pliocene hydroclimate variability, adding uncertainties to model–proxy comparison (Samakinwa et al., 2020).
Moisture budget analyses are conducted to shed light on the mechanisms driving the changes in PmE during the mid-Pliocene. Based on this decomposition, the changes in PmE are mainly influenced by the changes in humidity with unaltered atmospheric circulation (called the thermodynamic term, δTH) and changes in atmospheric circulation with no change in humidity (called the dynamic term, δMCD) at low latitudes. The thermodynamic term (δTH) and its decomposition are plotted in Fig. 3. It is clear that δTH captures the main features of hydrological cycle change (Figs. 3a vs. 1a) – that is, the positive and negative contributions over the already convergent (i.e., the ITCZ and SPCZ) and divergent (subsidence of local Hadley circulation) regions, respectively. In general, the thermodynamic term increases PmE by ∼58.6 % over the tropics, and decreases PmE by ∼84.6 % over subtropics (not shown), respectively. This term does not alter the spatial distribution of climatological PmE (contours in Fig. 1a) but amplifies the intensity of the existing pattern of PmE, reflecting the wet getting wetter and dry getting drier mechanisms (Held and Soden, 2006). These results are consistent with future global warming scenarios (Chou et al., 2009; Wang et al., 2012; Li et al., 2013).
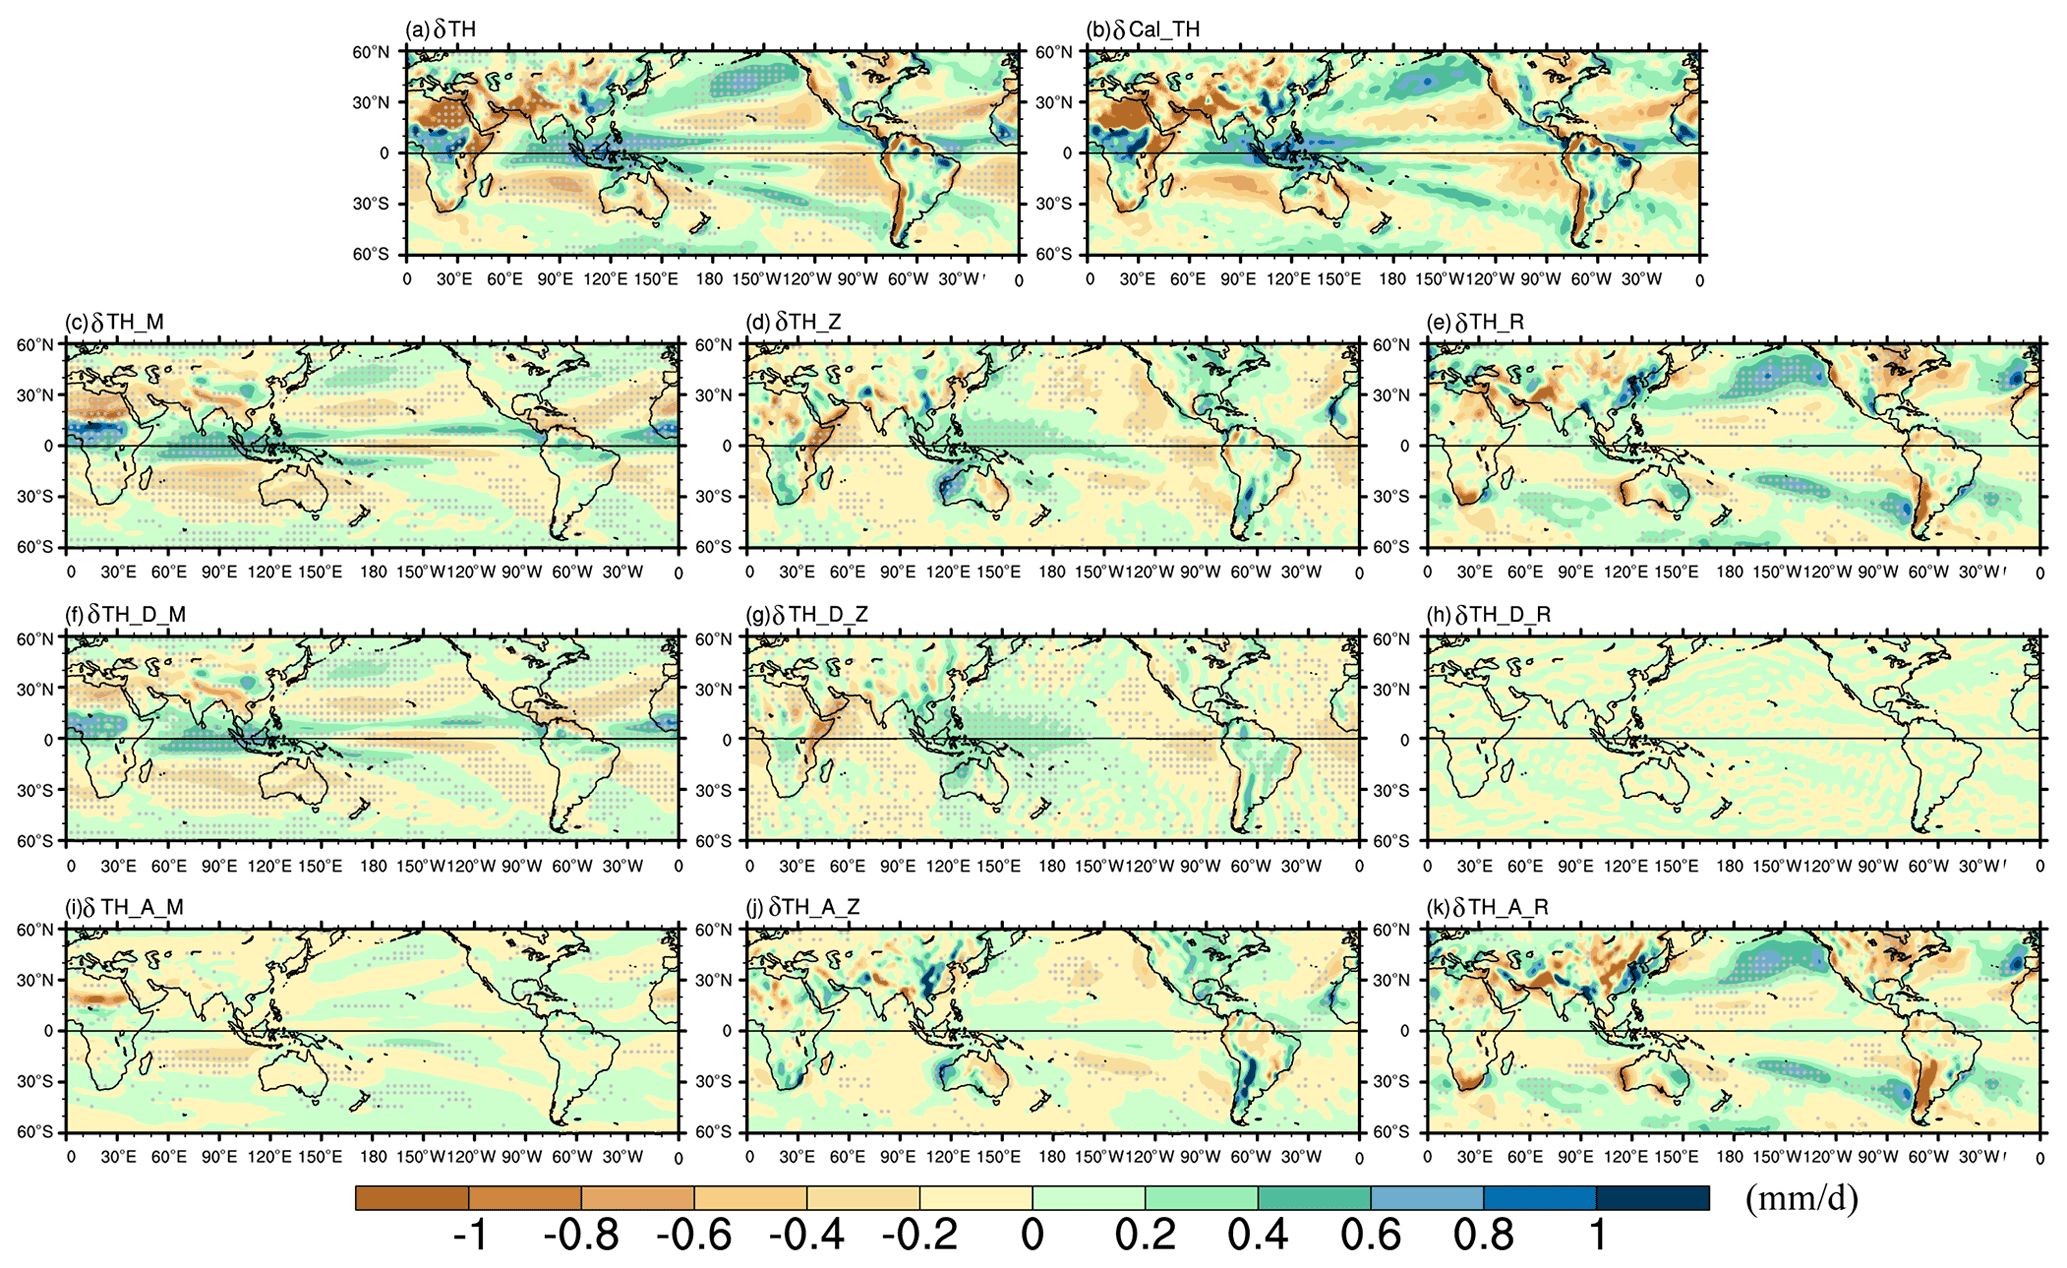
Figure 3The annual mean changes in the moisture budget components of the mid-Pliocene minus the PI control of the PlioMIP2 multi-model mean, which reflect (a) the thermodynamic term and (b) the estimated change in the thermodynamic term (calculated as the sum of the right-hand side terms in Eq. (8) of the 3P-DGAC decomposition method). The contributions to the change in the thermodynamic effect include the thermodynamic term induced by the climate mean (c) meridional, (d) zonal, and (e) horizontal circulations. The corresponding changes in panels (f–h) and (i–k) are the terms in the components shown in panels (c–e) that are related to the divergent mean flow and change in moisture advection, respectively. Stippling indicates regions where at least 10 of 13 simulations in the model group agree on the sign of the ensemble mean. (Units are mm d−1.)
From the perspective of global atmospheric circulation, previous studies have indicated that global atmospheric circulation can be decomposed into a superposition of horizontal, meridional, and zonal circulations (Hu et al., 2017; S. Hu et al., 2018a, b). δTH is further decomposed using the 3P-DGAC method (Fig. 3c–k). The estimated δTH in Fig. 3b, calculated as the sum of the right-hand side in Eq. (8) of the 3P-DGAC decomposition method, shows a similar distribution to the δTH field shown in Fig. 3a with a pattern correlation coefficient (PCC) of 0.80. This result indicates that the decomposition is representative. At low latitudes, the δTH mainly comes from terms that are related to climate mean meridional and zonal circulation (Fig. 3c, d), whereas at middle–high latitudes, the δTH mainly comes from horizontal circulation (Fig. 3e). It is clear that the thermodynamic changes associated with meridional circulation can explain the large portion of δTH (PCC of 0.9) at low latitudes, which is caused by increased specific humidity within the divergence of climate mean meridional circulation (δTHD_M; Fig. 3f). The zonal circulation can also explain δTH to some extent, with a positive contribution mainly over the Maritime Continent extending eastward to the equatorial central Pacific and eastern coast of North/South America, and a negative contribution over the eastern Pacific extending from the western Indian Ocean to the Greater Horn of Africa and the eastern tropical Atlantic (Fig. 3d). These changes associated with zonal circulation are linked to the increased specific humidity with divergence of the mean zonal circulation (δTHD_Z; Fig. 3g). At middle–high latitudes, the δTH induced by climate mean horizontal circulation is caused by changes in moisture advection (Fig. 3k), e.g., the western coast of North America, a region extending from the southern tip of South America to the central tropical Pacific Ocean, and southern tip of South Africa.
It is evident that the δTH component does not describe the full contribution to the changes in PmE, especially over the North African and Southeast Asian monsoon regions, the SPCZ, and the northern Indian Ocean, where we must consider the dynamic effect. The dynamic effect (δMCD), reflecting the impact of circulation changes, partially offsets the δTH at low latitudes (Fig. 4a). In particular, δMCD reduces PmE in the deep tropics, i.e., the ITCZ, the SPCZ, and the Maritime Continent. In contrast, δMCD can moisten subtropical regions, especially over the subtropical eastern Pacific, southern Indian Ocean, and Atlantic Ocean of both hemispheres. Compared with δTH, the dominating contribution from δMCD to changes in PmE lies adjacent to the northern Indian Ocean, the SPCZ, and the North African and Southeast Asian monsoon regions (Fig. 4a).
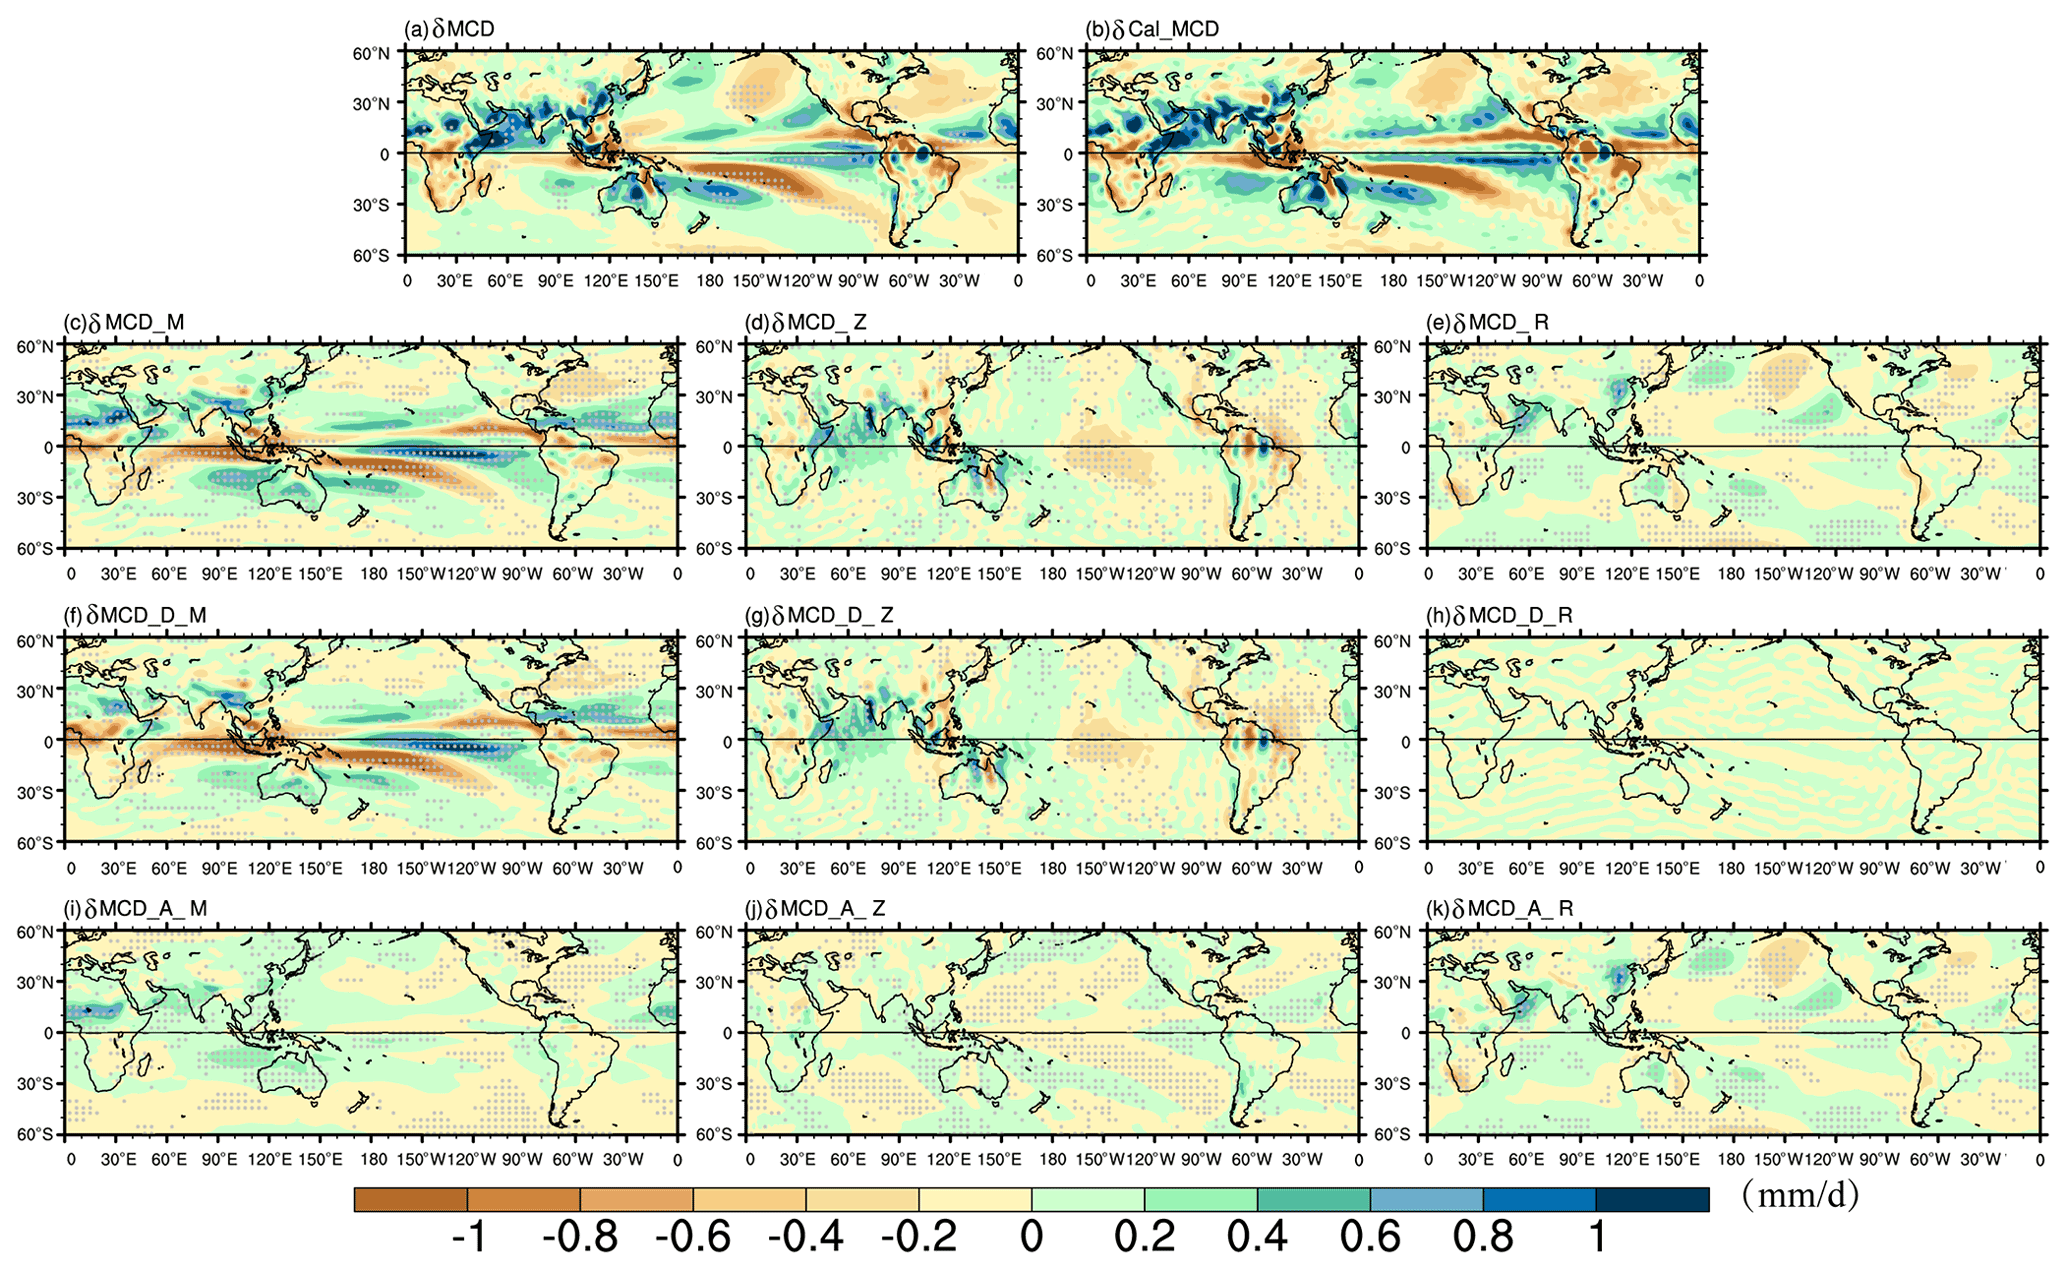
Figure 4The annual mean changes in the moisture budget components of the mid-Pliocene minus the PI control of the PlioMIP2 multi-model mean, which reflect (a) the dynamic term and (b) the estimated change in the dynamic term (calculated as the sum of the right-hand side terms in Eq. 9 of the 3P-DGAC decomposition method). The contributions to the changes in the dynamic effect include the dynamic term induced by the anomalous (c) meridional, (c) zonal, and (d) horizontal circulations. The corresponding changes in panels (f–h) and (i–k) are the terms in the components shown in panels (c–e) that are related to the change in divergent flow and mean moisture advection, respectively. Stippling indicates regions where at least 10 of 13 simulations in the model group agree on the sign of the ensemble mean. (Units are mm d−1.)
The estimated δMCD in Fig. 4b, calculated as the sum of the right-hand side terms in Eq. (9) of the 3P-DGAC decomposition method, is consistent with the δMCD in Fig. 4a with a PCC of 0.93. This result indicates that the decomposition is representative. The anomalous divergence of the meridional circulation component (δMCDD_M) appears to dry the deep tropics but moisten the Northern hemispheric part of the deep tropics, which is associated with the northward shift of the ITCZ (Fig. 7c). In particular, the northward shift of the ITCZ is clear from 150∘ E to the east in the Pacific (Fig. 4f). In addition, the component contributes a large portion to enhance PmE over the North African and Southeast Asian monsoon regions. However, the tropical southern Pacific is even more complicated. The δMCDD_M term contributes to reduced PmE over the SPCZ region but to increased PmE over the southern part of the SPCZ in the tropical southern Pacific. A previous study has suggested that these changes in PmE followed the southward shift of the SPCZ, which was mainly modulated by the intensified and westward shift of the South Pacific subtropical high for the mid-Pliocene compared with the PI simulation (Pontes et al., 2020). For the adjacent northern Indian Ocean, the convergence of zonal circulation anomalies (δMCDD_Z) is the first-order contribution to strengthen the dynamic effect (by ∼45 %) and, hence, enhances the PmE (Fig. 4g).
In summary, the dynamic and thermodynamic terms can explain the largest changes in PmE at low latitudes (Figs. 5 vs. 1). The thermodynamic term induced by the divergence of the mean meridional circulation is the dominant process driving changes in PmE at low latitudes (Fig. 3f). However, the dynamic term partially offsets δTH, especially over the ITCZ, the SPCZ, and the Maritime Continent, via changes in the divergence of meridional circulation. Even the dynamic term overwhelmingly contributes to the increased PmE over the North African and Southeast Asian monsoon regions and the northern Indian Ocean (Figs. 4 vs. 5). Note that the former two are mainly caused by meridional circulation anomalies, but the latter is dominated by zonal circulation anomalies.
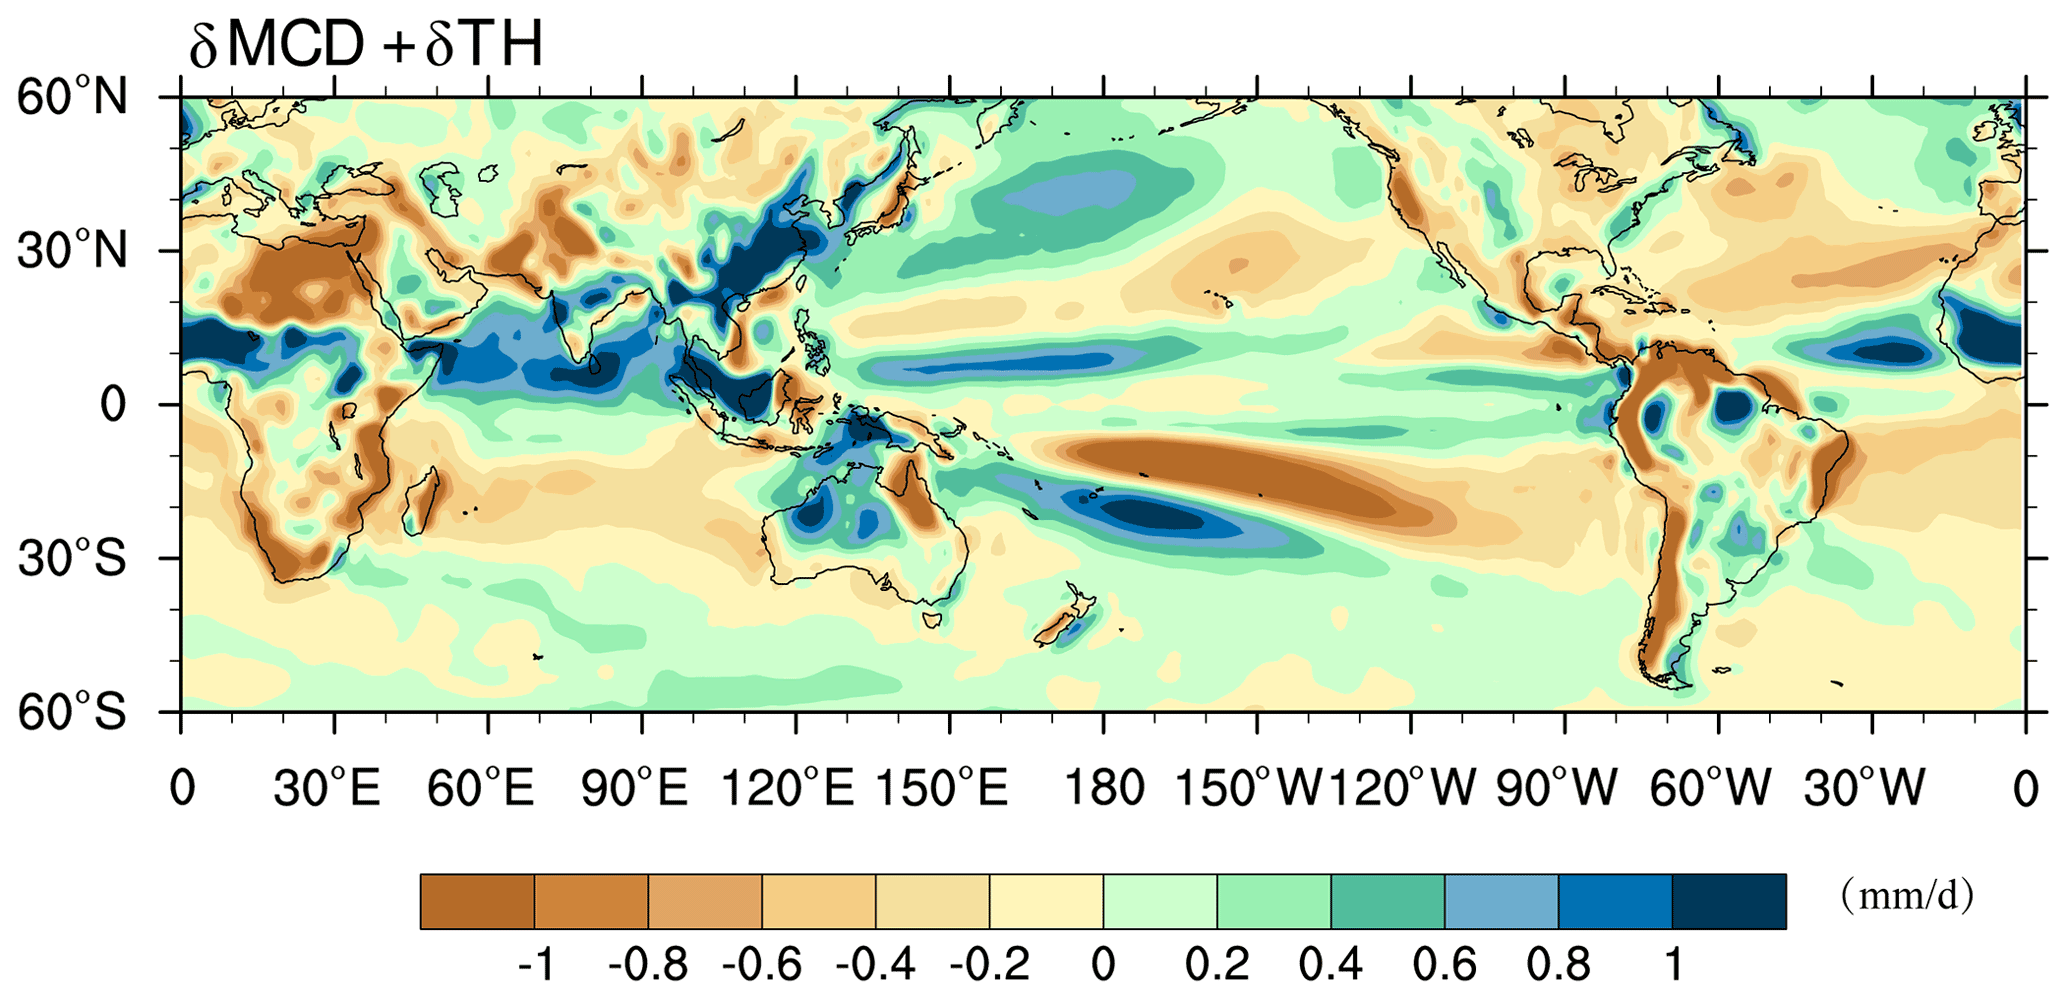
Figure 5The estimated annual mean changes in the PmE (calculated as the sum of the dynamic term and thermodynamic term) of the mid-Pliocene minus the PI control of the PlioMIP2 multi-model mean (units: mm d−1).
We further decompose the meridional moisture transport into terms that reflect the changes in specific humidity (meridional moisture transport induced by the thermodynamic effect; MMTT) and circulation (meridional moisture transport induced by the dynamic effect; MMTD) in Fig. 6a. As expected, all models show that the MMTT is responsible for the wetter tropics and drier subtropics in the mid-Pliocene simulation, indicating a dry gets drier and wet gets wetter mechanism. These features are robust among models and are associated with the increased specific humidity combined with the mean meridional circulation from the PI control (Fig. 6b), as mentioned above. This is because the zonal-mean wind depicts southerly (northerly) wind between the Equator and subtropical SH (Northern Hemisphere; NH) for the climate mean meridional circulation in the PI simulations. When the climatological wind is combined with increased specific humidity in the low-level troposphere (Fig. 7b), more moisture is transported from the subtropics to the tropics, resulting in a drier subtropics and wetter tropics. In contrast, the MMTD shows a large spread across PlioMIP2 models. On average, the anomalous MMTD appears to weaken thermodynamic contributions in the subtropical NH but strengthen it in the subtropical SH via meridional circulation anomalies (Fig. 6c). This indicates that the changes in MMTD favor the transport of more (less) moisture from the tropics to the NH (SH) subtropics, which is caused by the northward shift of the meridional circulation (as detailed further in Sect. 5.2). The equatorward moisture transport anomalies of the dynamic component in the SH are due to anomalous southerly winds in the subtropical southern Pacific (Fig. 9). This feature acts to dry the SPCZ and moisten the southern SPCZ and the equatorial central-eastern Pacific (Fig. 4f).
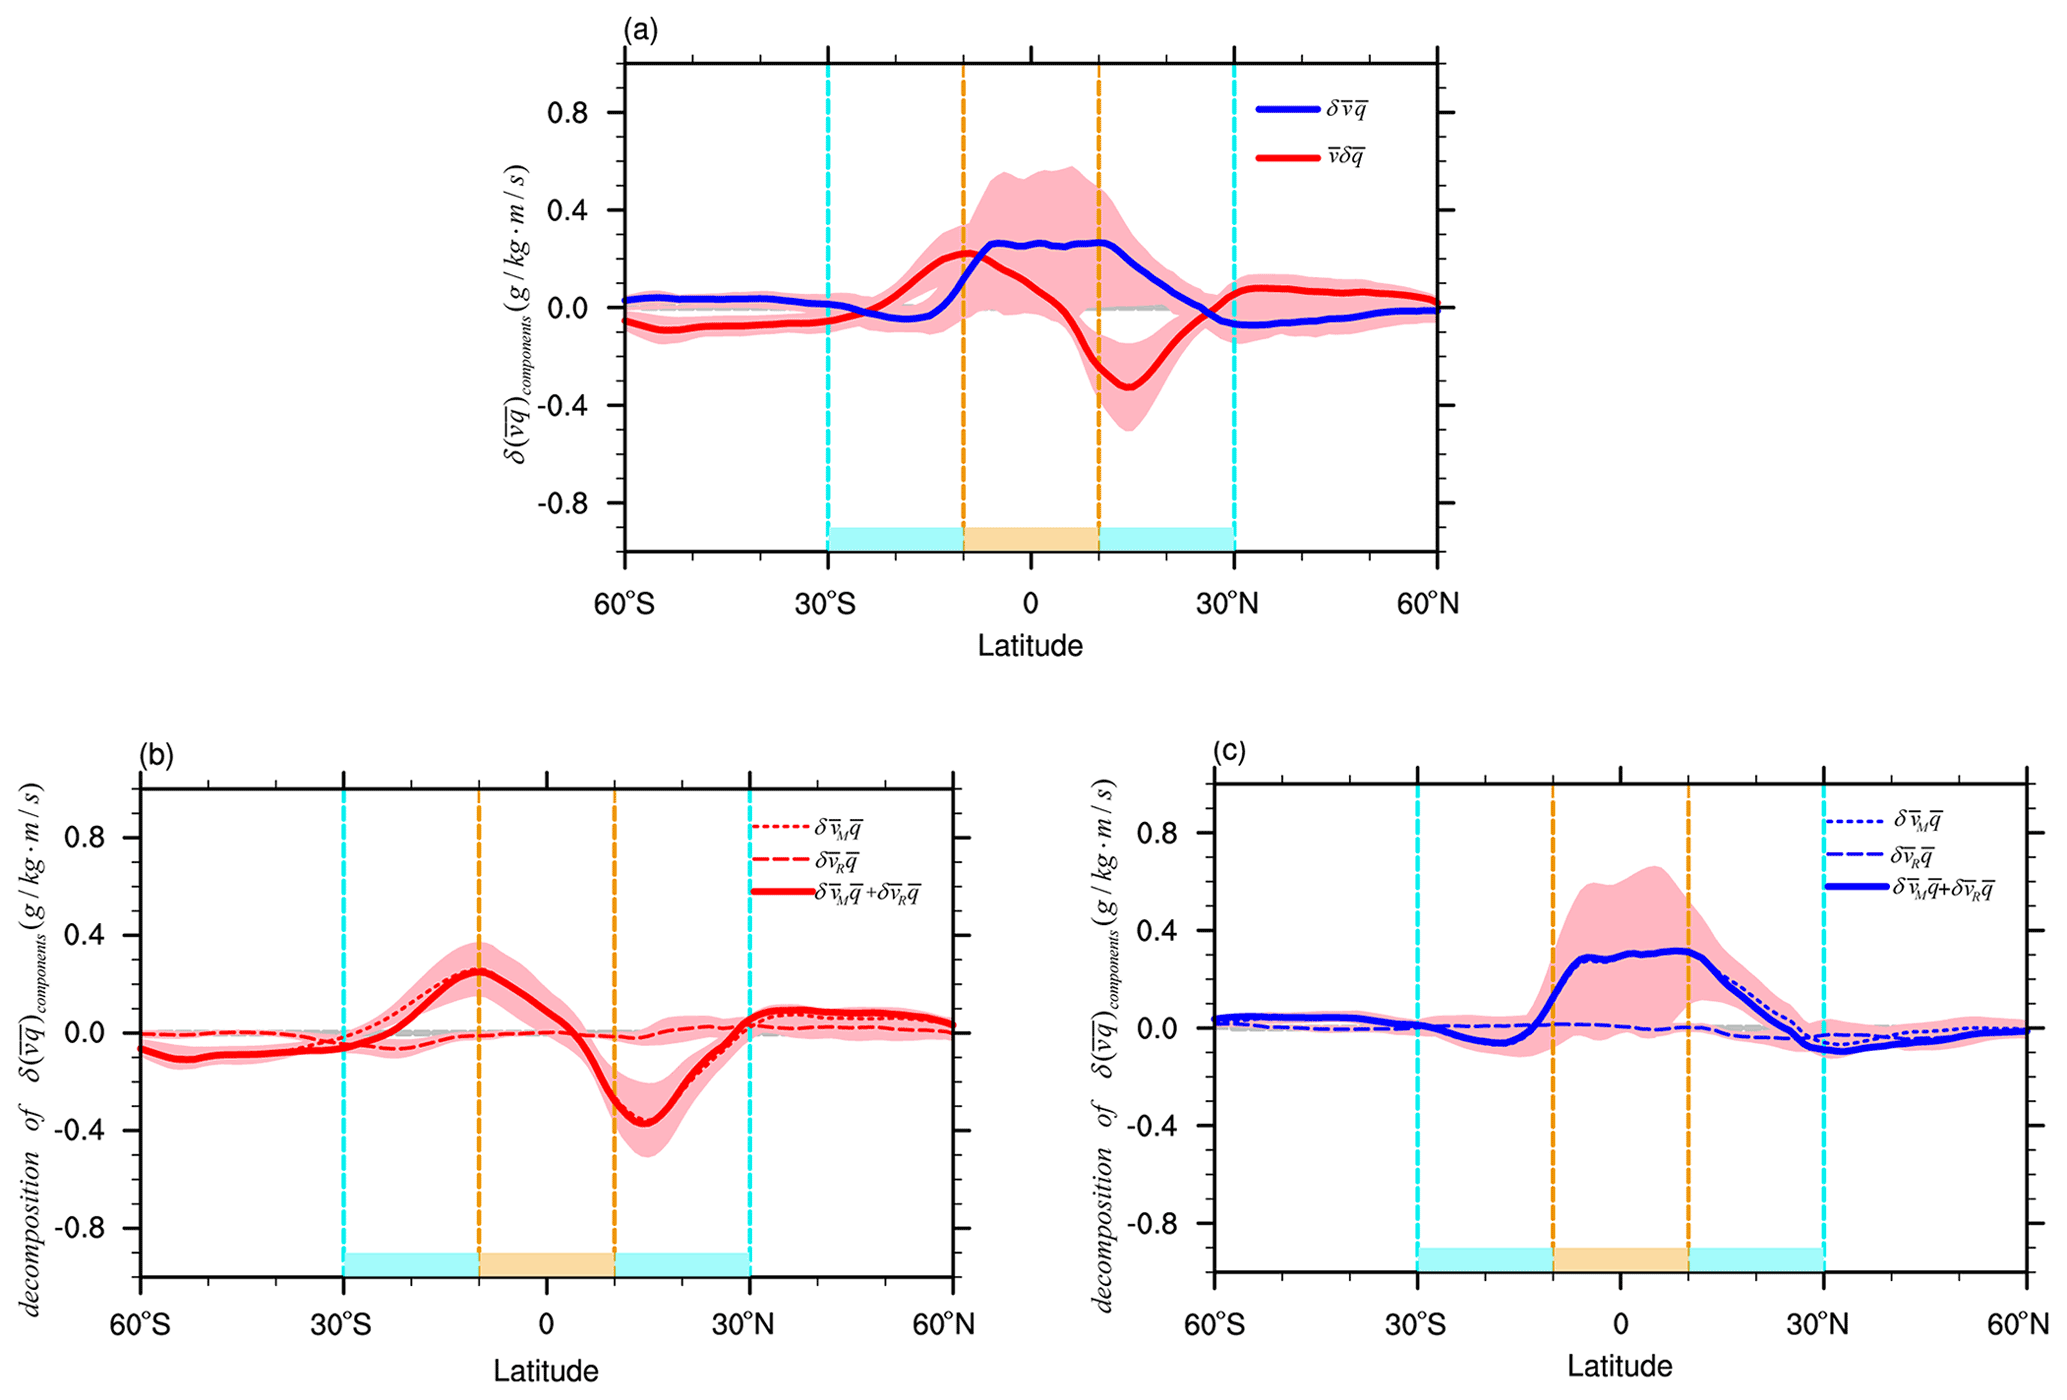
Figure 6(a) The zonal mean of meridional moisture transport anomalies induced by thermodynamic and dynamic effects for the mid-Pliocene compared with PI simulations. Panels (b) and (c) show the thermodynamic and dynamic terms in panel (a) that are induced by the meridional wind VM and VR decomposed from the 3P-DGAC method, respectively. Here, the tropical region is defined as the region between 10∘ S and 10∘ N (marked as an orange band), whereas the subtropical region refers to 10–30∘ N and 10–30∘ S (marked as a cyan band). The shading indicates 1 standard deviation of individual models departing from the MMM. (Units are g kg−1 m s−1.)
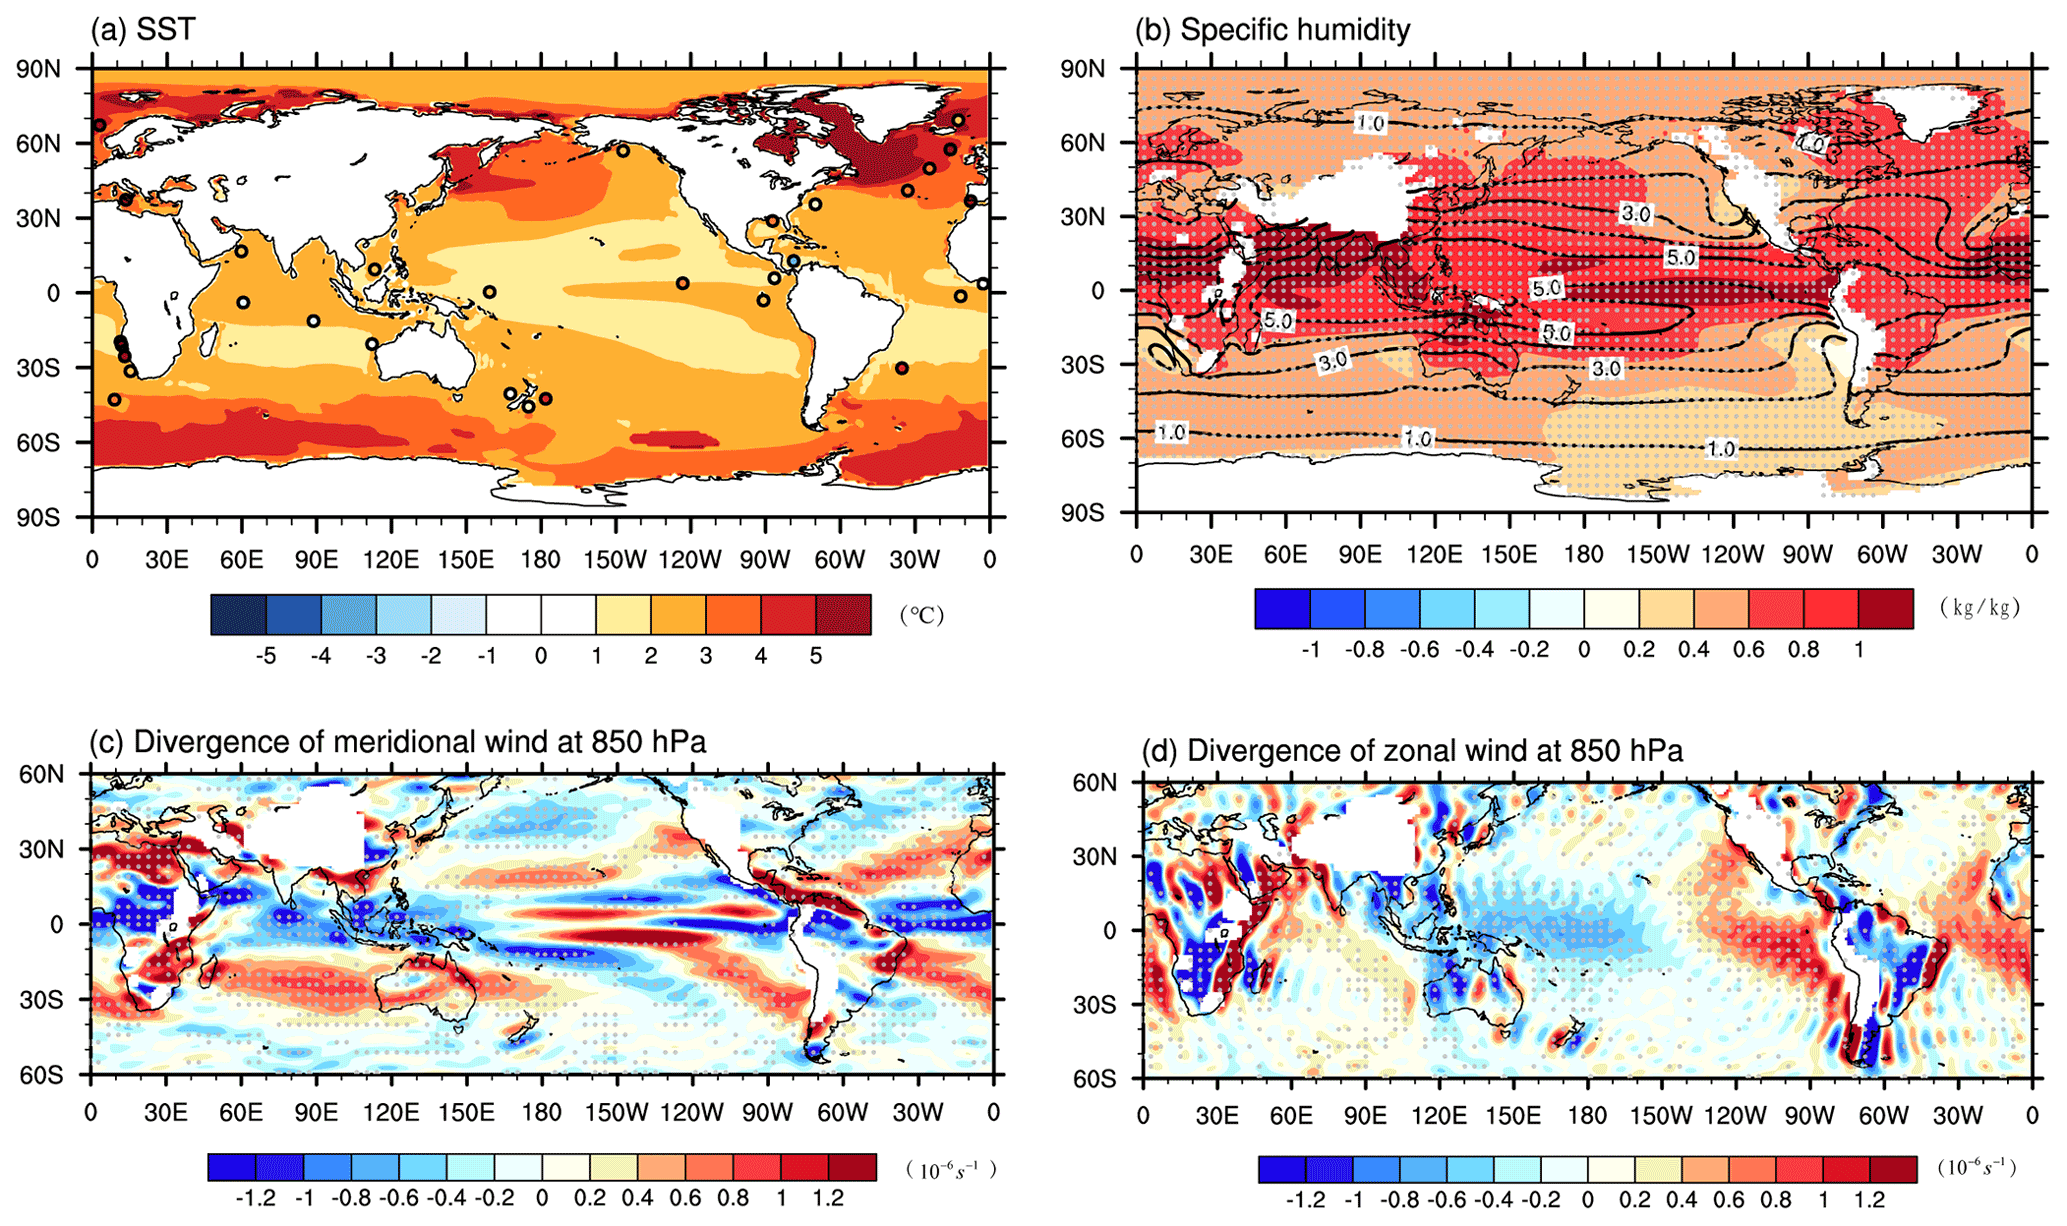
Figure 7Change in (a) MMM SST (shading; in ∘C), and (b) specific humidity (shading; in kg kg−1) overlaid by its climate mean for the PI simulation. Panels (c) and (d) show the MMM divergence of the meridional VM and zonal wind VZ fields decomposed from the 3P-DGAC method at the 850 hPa level for the PI simulation (in 10−6 s−1). The circles in panel (a) are the anomalies of reconstructed SST (McClymont et al., 2020) from the alkenone-derived index (Prahl and Wakeham, 1987) and foraminifera calcite (Delaney et al., 1985). Stippling in panels (b–d) indicates regions where at least 10 of 13 simulations in the model group agree on the sign of the ensemble mean.
Thus far, we have shown that the anomalous hydroclimate within the mid-Pliocene simulations involves anomalies of both thermodynamic and dynamic effects at low latitudes. In this section, we further examine the corresponding mechanisms in turn.
5.1 Changes in specific humidity
Figure 7a shows the changes in MMM SST superimposed on the reconstructed SST anomalies (McClymont et al., 2020). In the MMM, SSTs are between 1 and 6∘C warmer in the mid-Pliocene simulations than in the PI simulations. Note that the SST warming is amplified in the northwest tropical Indian Ocean, whereas it is reduced off the Indonesian coast, showing a pattern similar to the tropical Indian Ocean dipole (IOD). The sharp SST gradients drive strong southeasterly wind anomalies on the Equator (not shown). Xie et al. (2010) suggest that this easterly wind anomaly may shoal the thermocline in the east, helping lower the SST there via upwelling and indicating this SST anomaly over tropical Indian Ocean may be related to the Bjerknes feedback. The simulated North Atlantic warming might be related to an intensified mid-Pliocene Atlantic meridional overturning circulation (Li et al., 2020). However, Z. Zhang et al. (2021) suggest that the increased background ocean vertical mixing parameters could also contribute to the warm SSTs there. In addition, the relative smaller SST warming in Southeast Pacific and Atlantic, which is co-located with the intensified southeast trade winds, suggests the role of wind–evaporation–SST feedback (Xie et al., 2010). These SST warming patterns are consistent with current studies (Haywood et al., 2020; Williams et al., 2021). As expected, the specific humidity is increased in the low-level troposphere in the mid-Pliocene warm period (Fig. 7b) (Murray, 1966; Held and Soden, 2006). On the other hand, the sinking branch of meridional circulation in the control climate is located in subtropical regions, showing divergent circulation in the low-level troposphere; the contrary applies for the regions of deep tropics, i.e., the ITCZ and SPCZ. These two factors contribute the δTHD_M term (i.e., ) to the thermodynamic effect (Fig. 3f) and, hence, changes in PmE.
Although the δTHD_M term is the first-order control on the thermodynamic effect in most regions, the δTHD_Z term contributes to the thermodynamic effect to some extent, especially over the adjacent northern Indian Ocean. The climate mean zonal circulation characterizes ascending motion in the tropical western Pacific, tropical African, and tropical southern American regions, favoring convergent circulation (i.e., ) there (Fig. 6d; Hastenrath, 1991; Peixoto and Oort, 1992). With increased specific humidity (δq>0) under a warmer climate, the δTHD_Z term (i.e., shows a positive contribution and, hence, increases PmE in these regions (Fig. 3g). On the contrary, the δTHD_Z favors a decrease in PmE over the western Indian Ocean, eastern Pacific, and tropical Atlantic (Fig. 3g), where the climate mean zonal circulation is divergent (Fig. 7d).
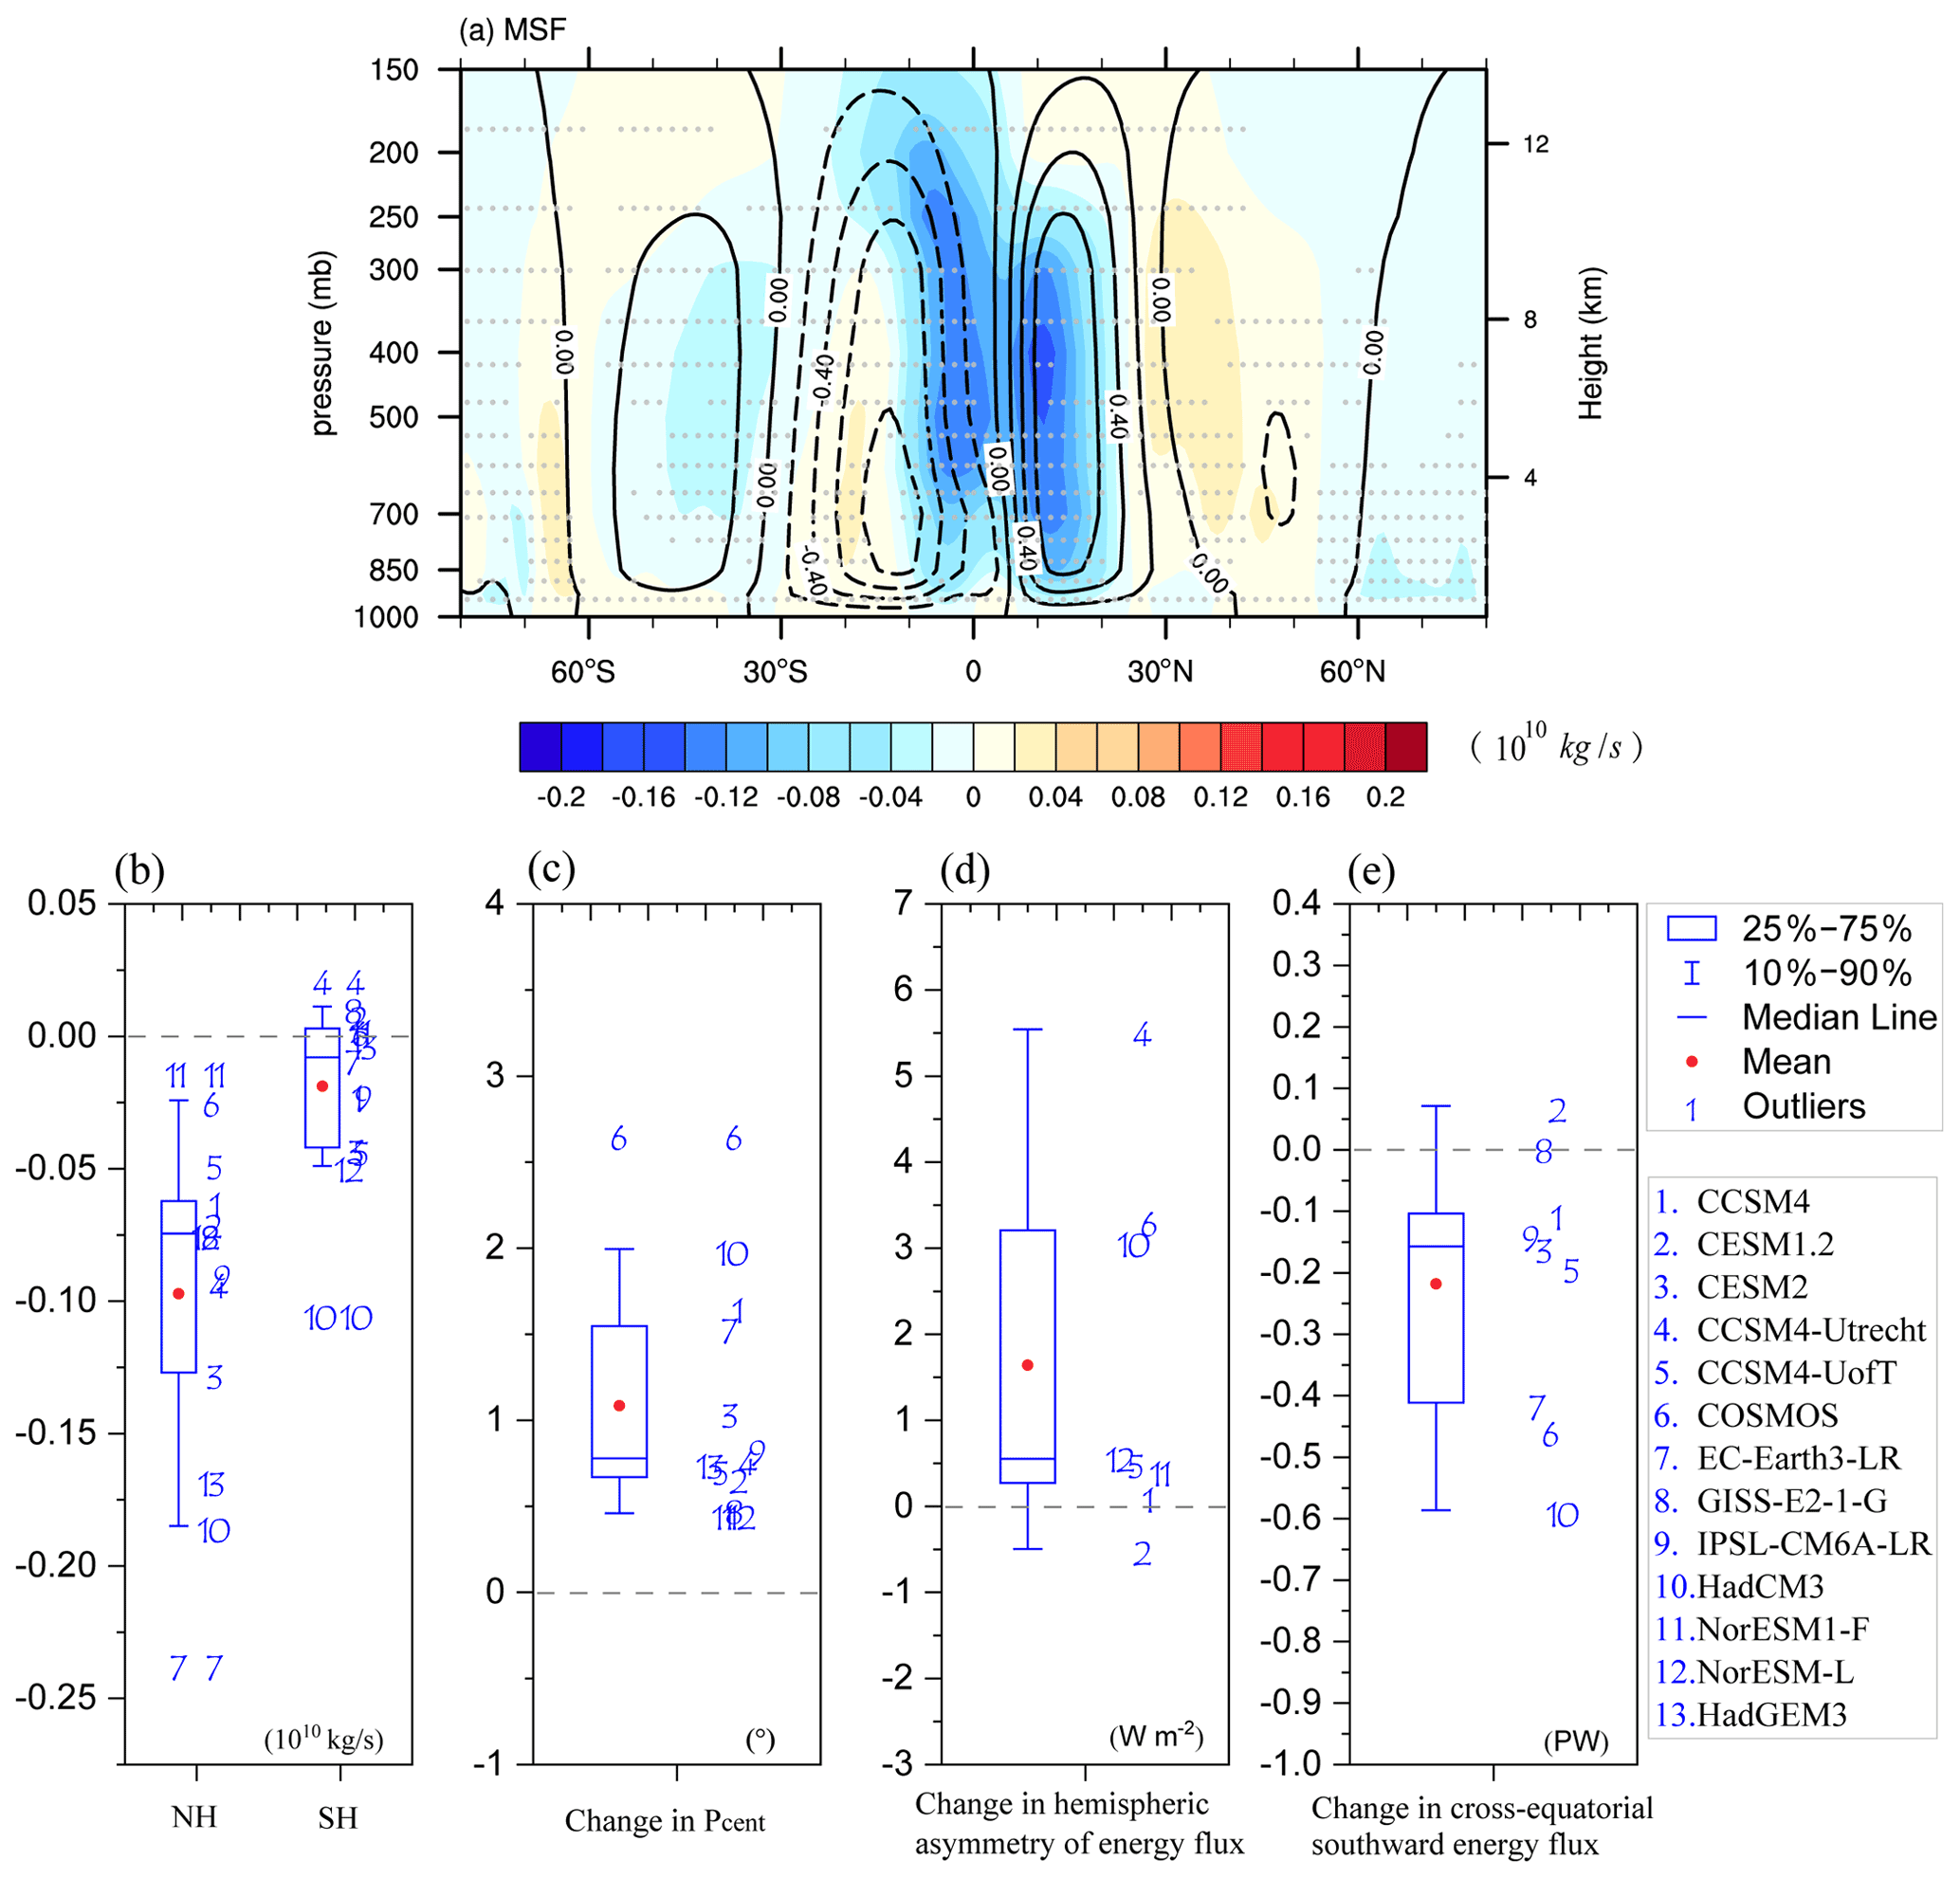
Figure 8(a) Changes in the annual mean mass stream function (MSF; shading; in 1010 kg s−1) of meridional circulation for mid-Pliocene with respect to the PI simulation, overlaid by the climate mean MSF for the PI simulation (contours). The meridional wind VM is decomposed from the 3P-DGAC method. Solid curves indicate positive values, and dashed curves indicate negative values. Stippling indicates regions where at least 10 of 13 simulations in the model group agree on the sign of the ensemble mean. (b) Changes in the annual mean intensities (in 1010 kg s−1) of meridional circulation in the NH and SH. (c) The latitudes of the center of annual mean precipitation (Pcent) between 20∘ S and 20∘ N (in ∘). (d) Hemispheric asymmetry (NH minus SH) of the energy flux into the atmosphere (in W m−2). (e) Changes in the integrated atmospheric meridional heat transport across the Equator (in PW).
5.2 Response in meridional circulation
In Sect. 4, we have demonstrated that the primary dynamic contribution to changes in PmE is a consequence of anomalous meridional circulation (the δMCDD_M term). Figure 8a shows the annual mean mass stream function (MSF) of meridional circulation for the PI simulation (contours), which is similar to present-day meridional circulation (Cheng et al., 2020). During the mid-Pliocene, the meridional circulation changes are characterized by enhanced meridional circulation in the SH tropics and weakened meridional circulation in the NH tropics (shading in Fig. 8), which is caused by the northward shift of meridional circulation in the SH, as indicated in our later discussion. To quantify meridional circulation changes, we further calculated the intensity in Fig. 8b. The intensity is defined as the maximum of the absolute average MSF between 200 and 925 hPa in the range from 30∘ S to 30∘ N (Oort and Yienger, 1996) in Fig. 8a. Models simulate a consistently weakened meridional circulation intensity in the NH and a slightly strengthened intensity in the SH (Fig. 8b), which is related to the hemispheric asymmetry of the atmospheric energy budget (Feng et al., 2020).
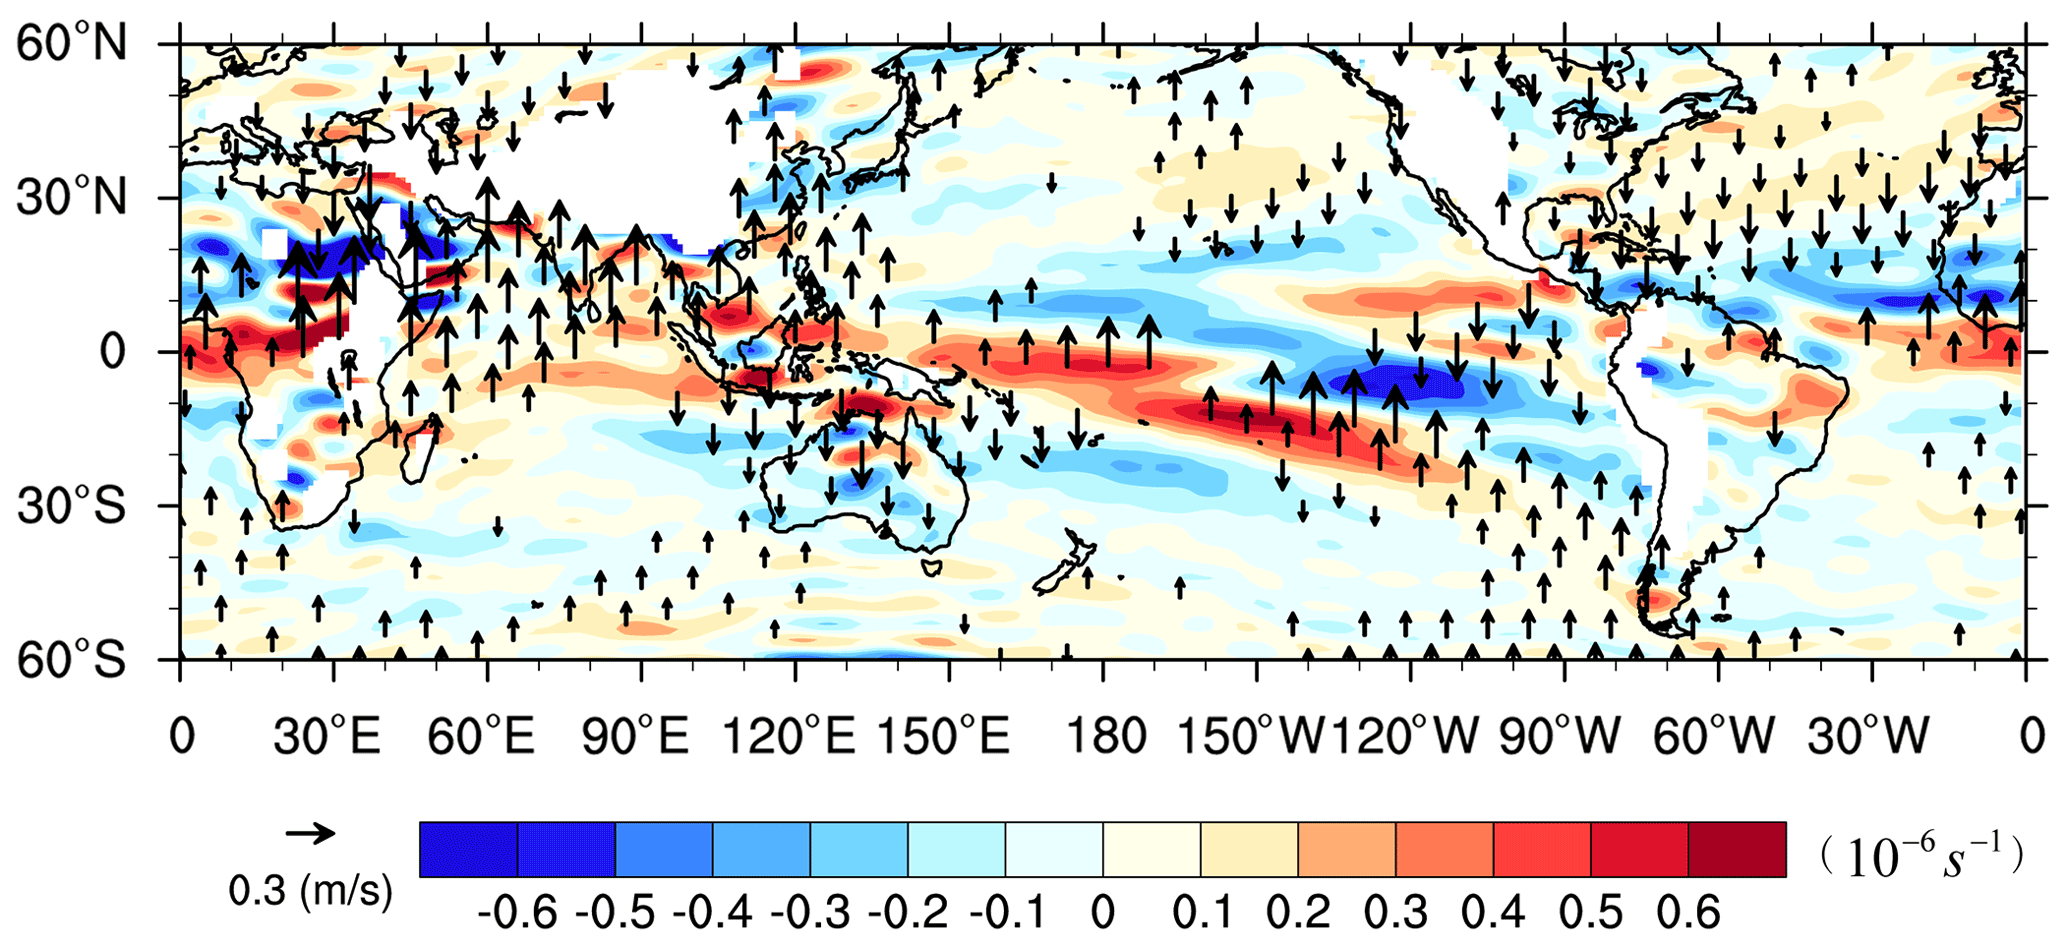
Figure 9The changes in meridional wind VM decomposed from the 3P-DGAC method at the 850 hPa level (vectors; in m s−1), overlaid by its divergent circulations (shading; in 10−6 s−1). Only vectors where at least 10 of 13 simulations in the model group agree on the sign of the ensemble mean are shown here.
As a result, meridional circulation anomalies could induce divergent/convergent circulation anomalies in the low-level troposphere (Fig. 9). The weakened local meridional circulation leads to anomalous southerly winds spanning northeastern South America eastward to the northwestern Pacific region. These meridional circulation anomalies induce the anomalous divergence (convergence) of circulation over the Indo-Pacific warm pool (adjacent to subtropical regions), resulting in a negative (positive) contribution from δMCDD_M (Figs. 9 vs. 4f). In fact, this anomalous meridional circulation is closely related to the strengthened Asian summer monsoon (not shown), consistent with previous studies (Zhang et al., 2013; Prescott et al., 2019). In addition, anomalous northerly winds exist in the western tropical Pacific, but southerly winds are located in the central Pacific (Fig. 9). These circulation anomalies could induce δMCDD_M, which favors moistening of the equatorial central Pacific and southern part of the SPCZ region but dries the SPCZ (Fig. 4f). Previous studies have indicated that these circulation anomalies are caused by the southward shift of the SPCZ, which is mainly modulated by the intensified and westward shift of the South Pacific subtropical high for the mid-Pliocene compared with the PI simulation (Pontes et al., 2020).
One question arises regarding what causes the meridional circulation changes under mid-Pliocene conditions. At low latitudes, it is worth noting that the ITCZ lies at the foot of the ascending branch of the meridional circulation, which is highly linked to the hemispheric asymmetry of the atmospheric energy budget (Frierson et al., 2013). We further quantify the shift of the ITCZ in Fig. 8c and Earth's energy budget in Fig. 8d and e. The definition of the ITCZ location is the latitude of the maximal annual mean precipitation between 20 and 20∘ S (Frierson and Hwang, 2012; Donohoe et al., 2013). On average, ensemble models show that the NH atmosphere receives 1.5 W m−2 more net radiation than the SH (Fig. 8d), which could induce an increased cross-equatorial southward energy flux of 0.22 PW (Fig. 8e). Thus, this imbalance in the atmospheric energy budget causes a 1.1∘ northward shift in the zonal-mean ITCZ latitude. Consequently, this shift of the ITCZ reorganizes atmospheric circulation (Watt-Meyer and Frierson, 2019), leading to the northward movement of the meridional circulation in the SH (Fig. 8a). This meridional circulation shift could result in a weakened (strengthened) meridional circulation in the NH (SH) (Fig. 8b) and, hence, drive δMCDD_M (Fig. 4f) and MMTD (Fig. 6c). Pontes et al. (2021) indicated that the anomalous wind over the southern Pacific is related to the El Niño–Southern Oscillation (ENSO) weakening across models, which could favor a northward shift of the ITCZ. In addition, it should be noted that the northward shift of the ITCZ exists in both the boreal summer (June–July–August) and winter (December–January–February) seasons, accompanied by the northward shift of the meridional circulation in the SH (not shown). Pontes et al. (2021) further suggested that the northward shift of the Pacific ITCZ during austral spring–summer is remarkably related to the ENSO weakening across models, which is associated with the stronger climatological circulation in the SH.
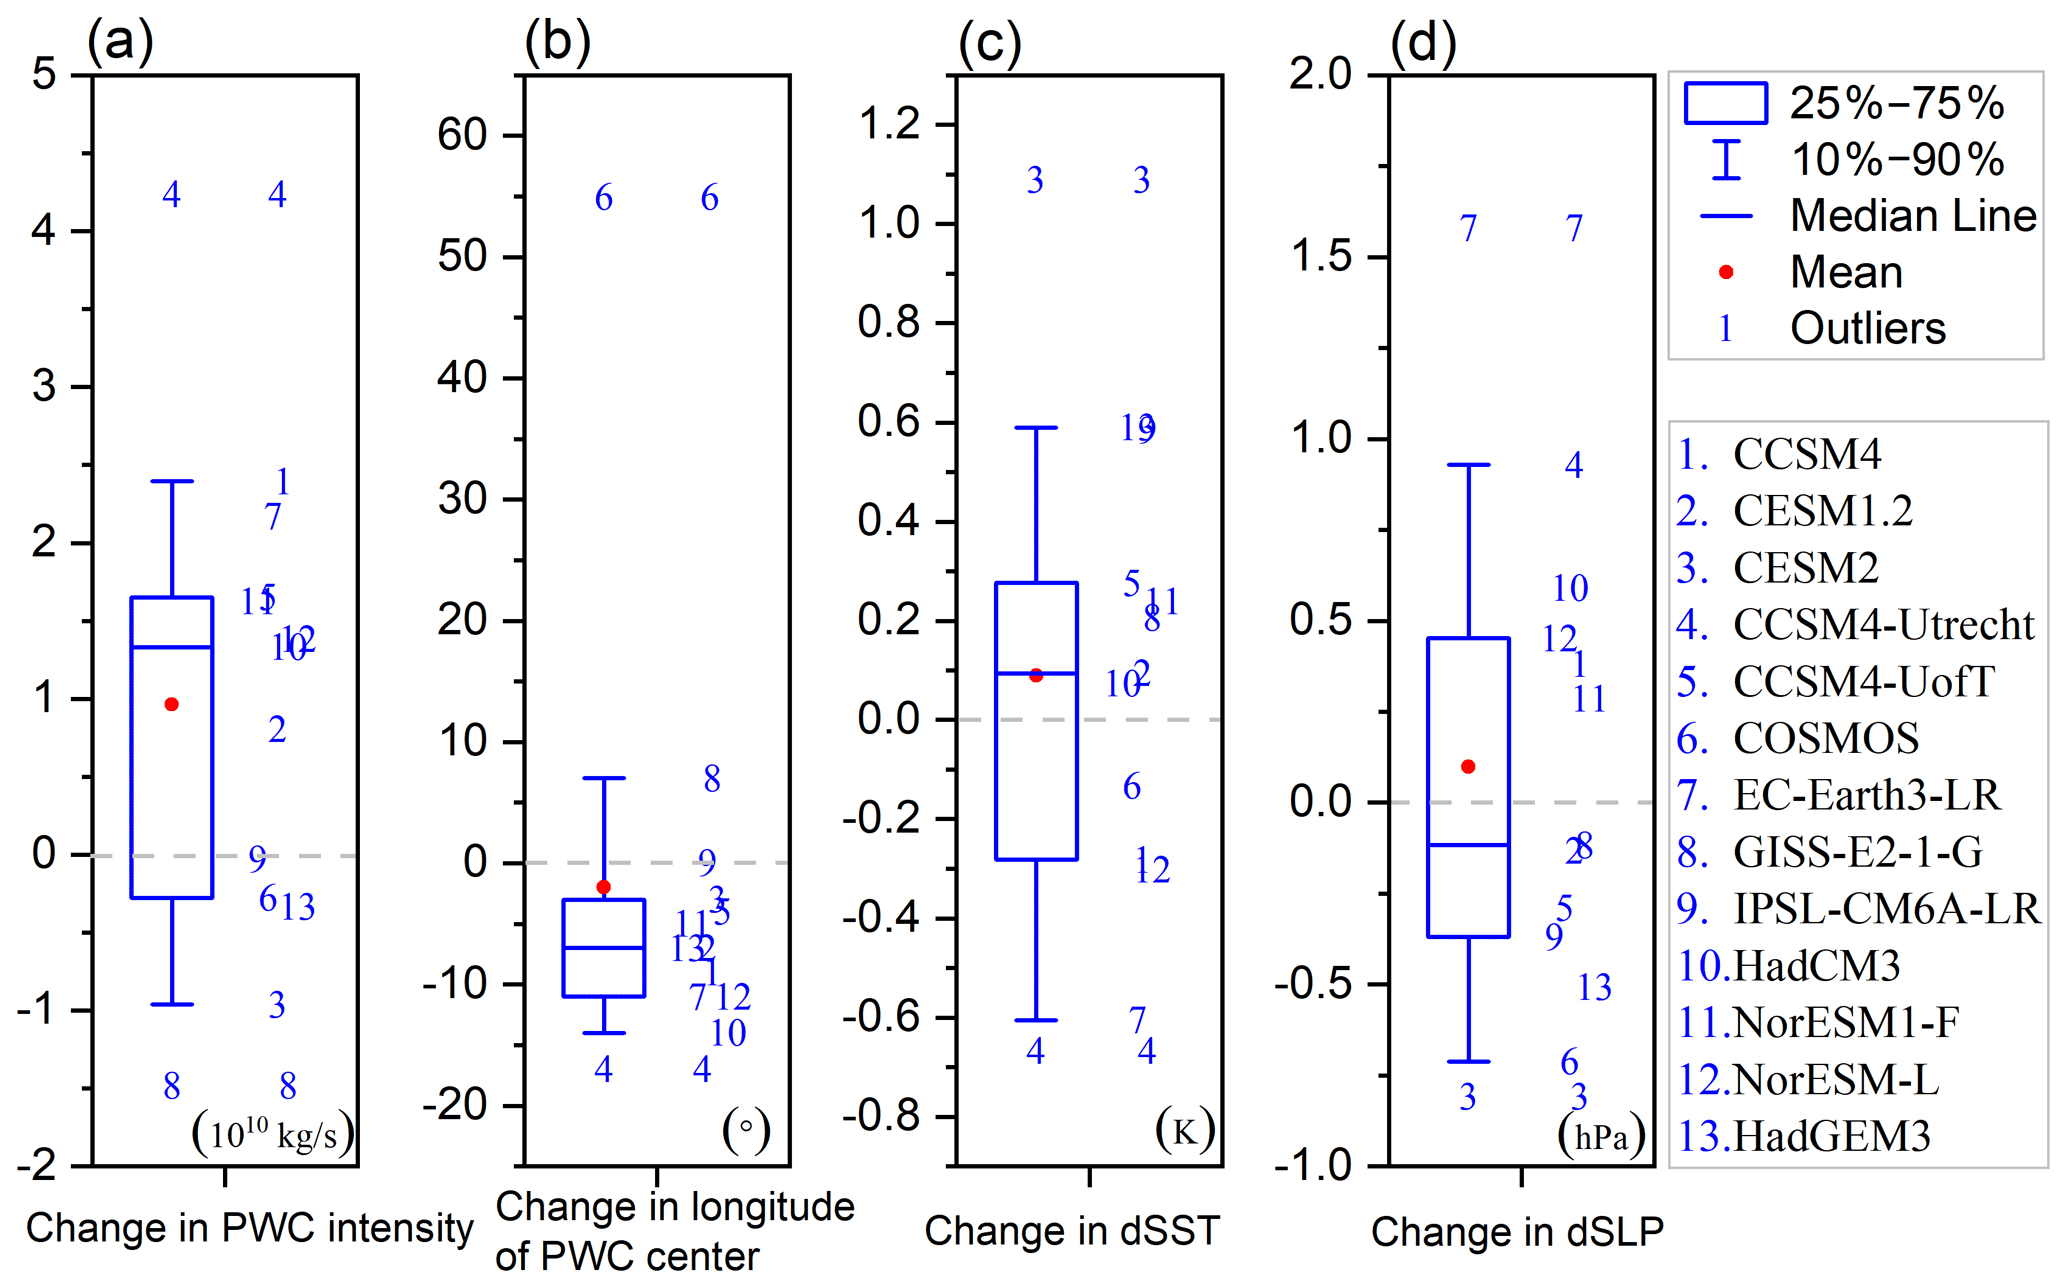
Figure 10Changes in the annual mean of the (a) intensities of the Pacific Walker circulation (PWC; in 1010 kg s−1), (b) longitude of the PWC cell center (in ∘), (c) dSST (in K), and (d) dSLP (in hPa) for mid-Pliocene simulations compared with the PI simulation. Here, the PWC intensity is defined as the vertically integrated zonal mass stream function (ZMS; Bayr et al., 2014; Schwendike et al., 2014) averaged in the equatorial Pacific (140∘ E–120∘ W), and the location of the PWC cell center is the longitude of the maximum ZMS. The dSLP and dSST are defined as the difference in SLP and SST across the equatorial Indo-Pacific (160–80∘ W, 5∘ S–5∘ N minus 80–160∘ E, 5∘ S–5∘ N).
5.3 Response in zonal circulation
As mentioned above, δMCDD_Z plays a key role in the changes in PmE over the northern Indian Ocean. As this term is linked to Walker circulation anomalies, we further discuss Walker circulation changes in the mid-Pliocene warm climate.
There is a noticeable diversity in the simulated Pacific Walker circulation (PWC) intensity across the models (Fig. 10a). In addition, previous work has suggested that the PWC intensity is closely tied to the zonal SST and sea level pressure (SLP) gradient during the mid-Piacenzian (Tierney et al., 2019). In this paper, the dSLP and dSST are defined as the difference in SLP and SST across the equatorial Indo-Pacific (160–80∘ W, 5∘ S–5∘ N minus 80–160∘ E, 5∘ S–5∘ N). As expected, the models with an enhanced zonal SST gradient across the equatorial Indo-Pacific tend to produce a weaker zonal SLP gradient and decreased PWC (not shown), with the inter-model correlations of −0.95 and −0.75, respectively. Note that the PlioMIP2 models produce a large spread in simulating the changes in dSST (Fig. 10c) and dSLP (Fig. 10d), which is consistent with the results in Fig. 10a. Previous studies have suggested that the east–west SST gradient was reduced in SST proxies (Tierney et al., 2019). This feature is captured by the CESM2, GISS-E2-1-G, and HadGEM3 models (Fig. 10a, b, c). However, other models (i.e., the CCSM4, CCSM4-Utrecht, EC-Earth3-LR, and NorESM-L models) consistently simulated stronger PWC intensity (Fig. 10a, b, c). That is, the results suggest that the model-simulated changes in the strength of PWC are probably highly model dependent, which might be affected by the different parameterizations (Tierney et al., 2019).
However, the westward shift of the PWC is a robust feature among these models, except the COSMOS and GISS-E2-1-G models (Fig. 10b). To discuss the impact of the PWC shift on atmospheric circulation in the tropics, we further calculate the changes in the zonal mass stream function (ZMS) for the mid-Pliocene with respect to the PI simulation in Fig. 11. As suggested in Fig. 7d, the ZMS in the PI simulation (contours in Fig. 11a) is characterized by ascending motion in the tropical western Pacific and Maritime Continent and descending motion in the western Indian Ocean and eastern Pacific, consistent with previous studies (Kamae et al., 2011; Bayr et al., 2014; Ma and Zhou, 2016; Han et al., 2020). Compared with the PI simulation, the most striking features in the mid-Pliocene simulation are weakened ascending motion over the Maritime Continent and tropical western Pacific and strengthened descending motion on the western Indian Ocean, indicating a westward expansion of the PWC (Fig. 11b).
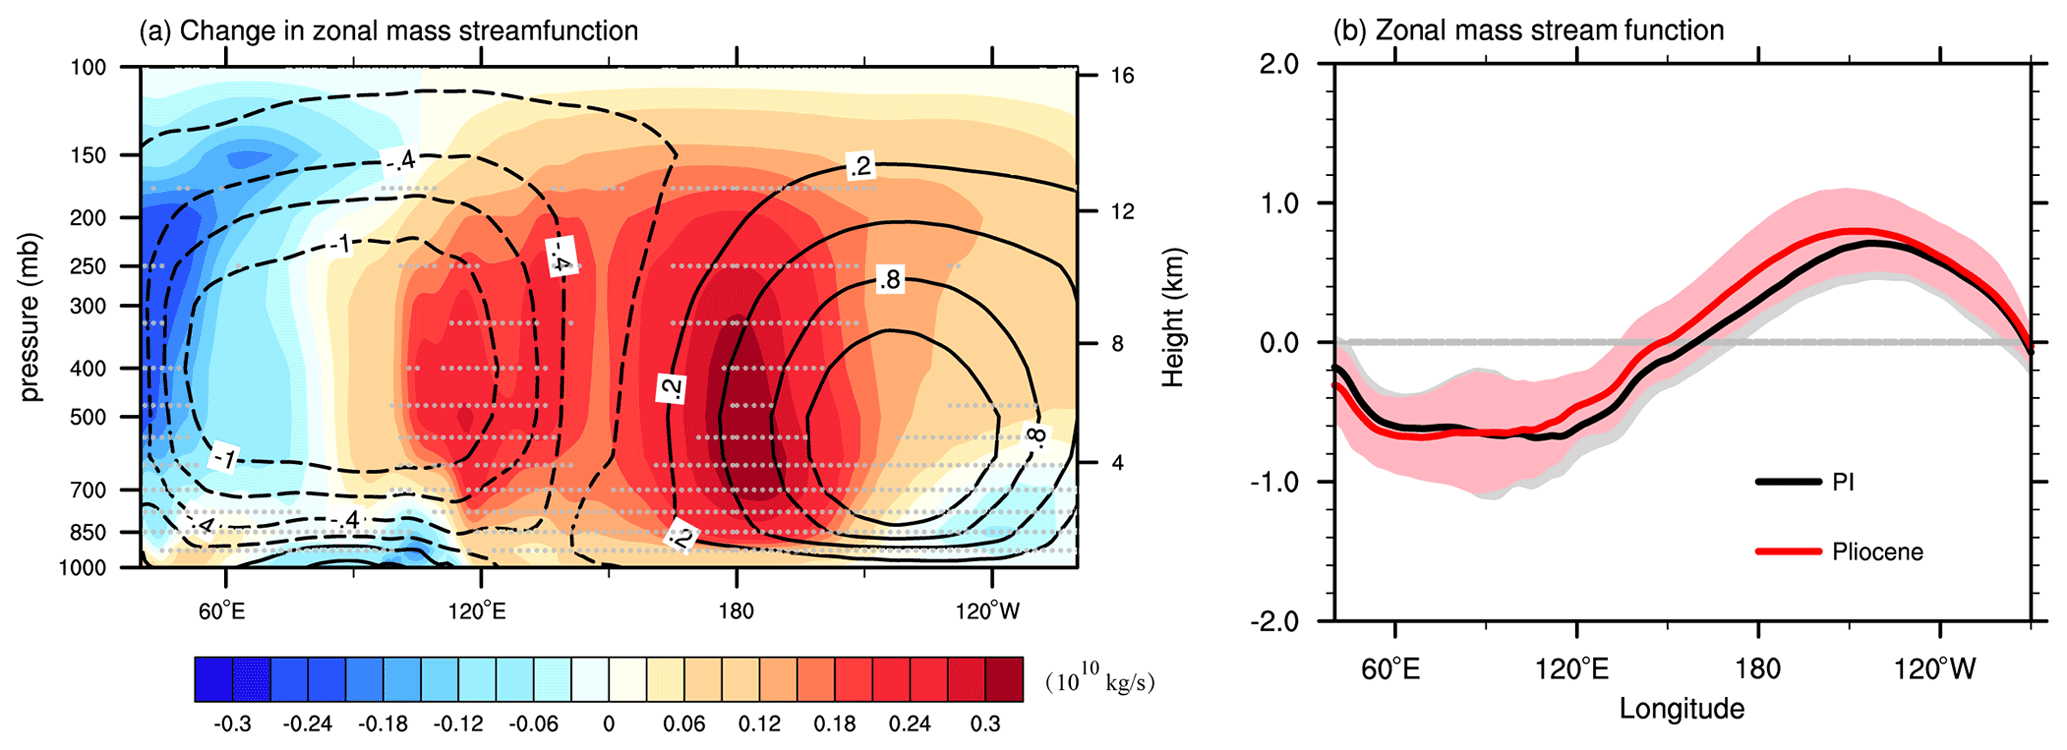
Figure 11(a) Changes in ZMS (shading; in 1010 kg s−1) averaged between 10∘ S and 10∘ N for the mid-Pliocene with respect to the PI simulation, overlaid by the climate mean ZMS for the PI simulation (contours). The zonal wind VZ is used to calculate ZMS, which is decomposed from the 3P-DGAC method. The contours represent the climate mean ZMS for the PI simulation. Solid curves indicate a positive value, and dashed curves show a negative value. Stippling indicates regions where at least 10 of 13 simulations in the model group agree on the sign of the ensemble mean. Panel (b) shows the vertically integrated ZMS from panel (a). The gray and pink shading indicates 1 standard deviation of individual models' departure from the MMM mean of the MSF for the PI and mid-Pliocene simulations, respectively.
The westward shift of the PWC can also be seen from the potential velocity (Fig. 12). This shows that the center of the anomalous positive values is located in the northern Indian Ocean. In contrast, the center of a negative value exists in the equatorial eastern Pacific and western Atlantic in the low-level troposphere (Fig. 12a). Concurrent, generally opposite anomalies can be seen in the upper-level troposphere (Fig. 12b). Indeed, these features indicate an upward (downward) motion shift from the tropical western Pacific (eastern Pacific) to the west of the Indian Ocean (central Pacific), resulting from the westward expansion of the PWC (Figs. 10b, 11). That is, when divergent/convergent circulations are combined with the climate mean specific humidity () in the lower troposphere, they can trigger a negative/positive contribution from the δMCDD_Z term to changes in PmE (Fig. 4g).
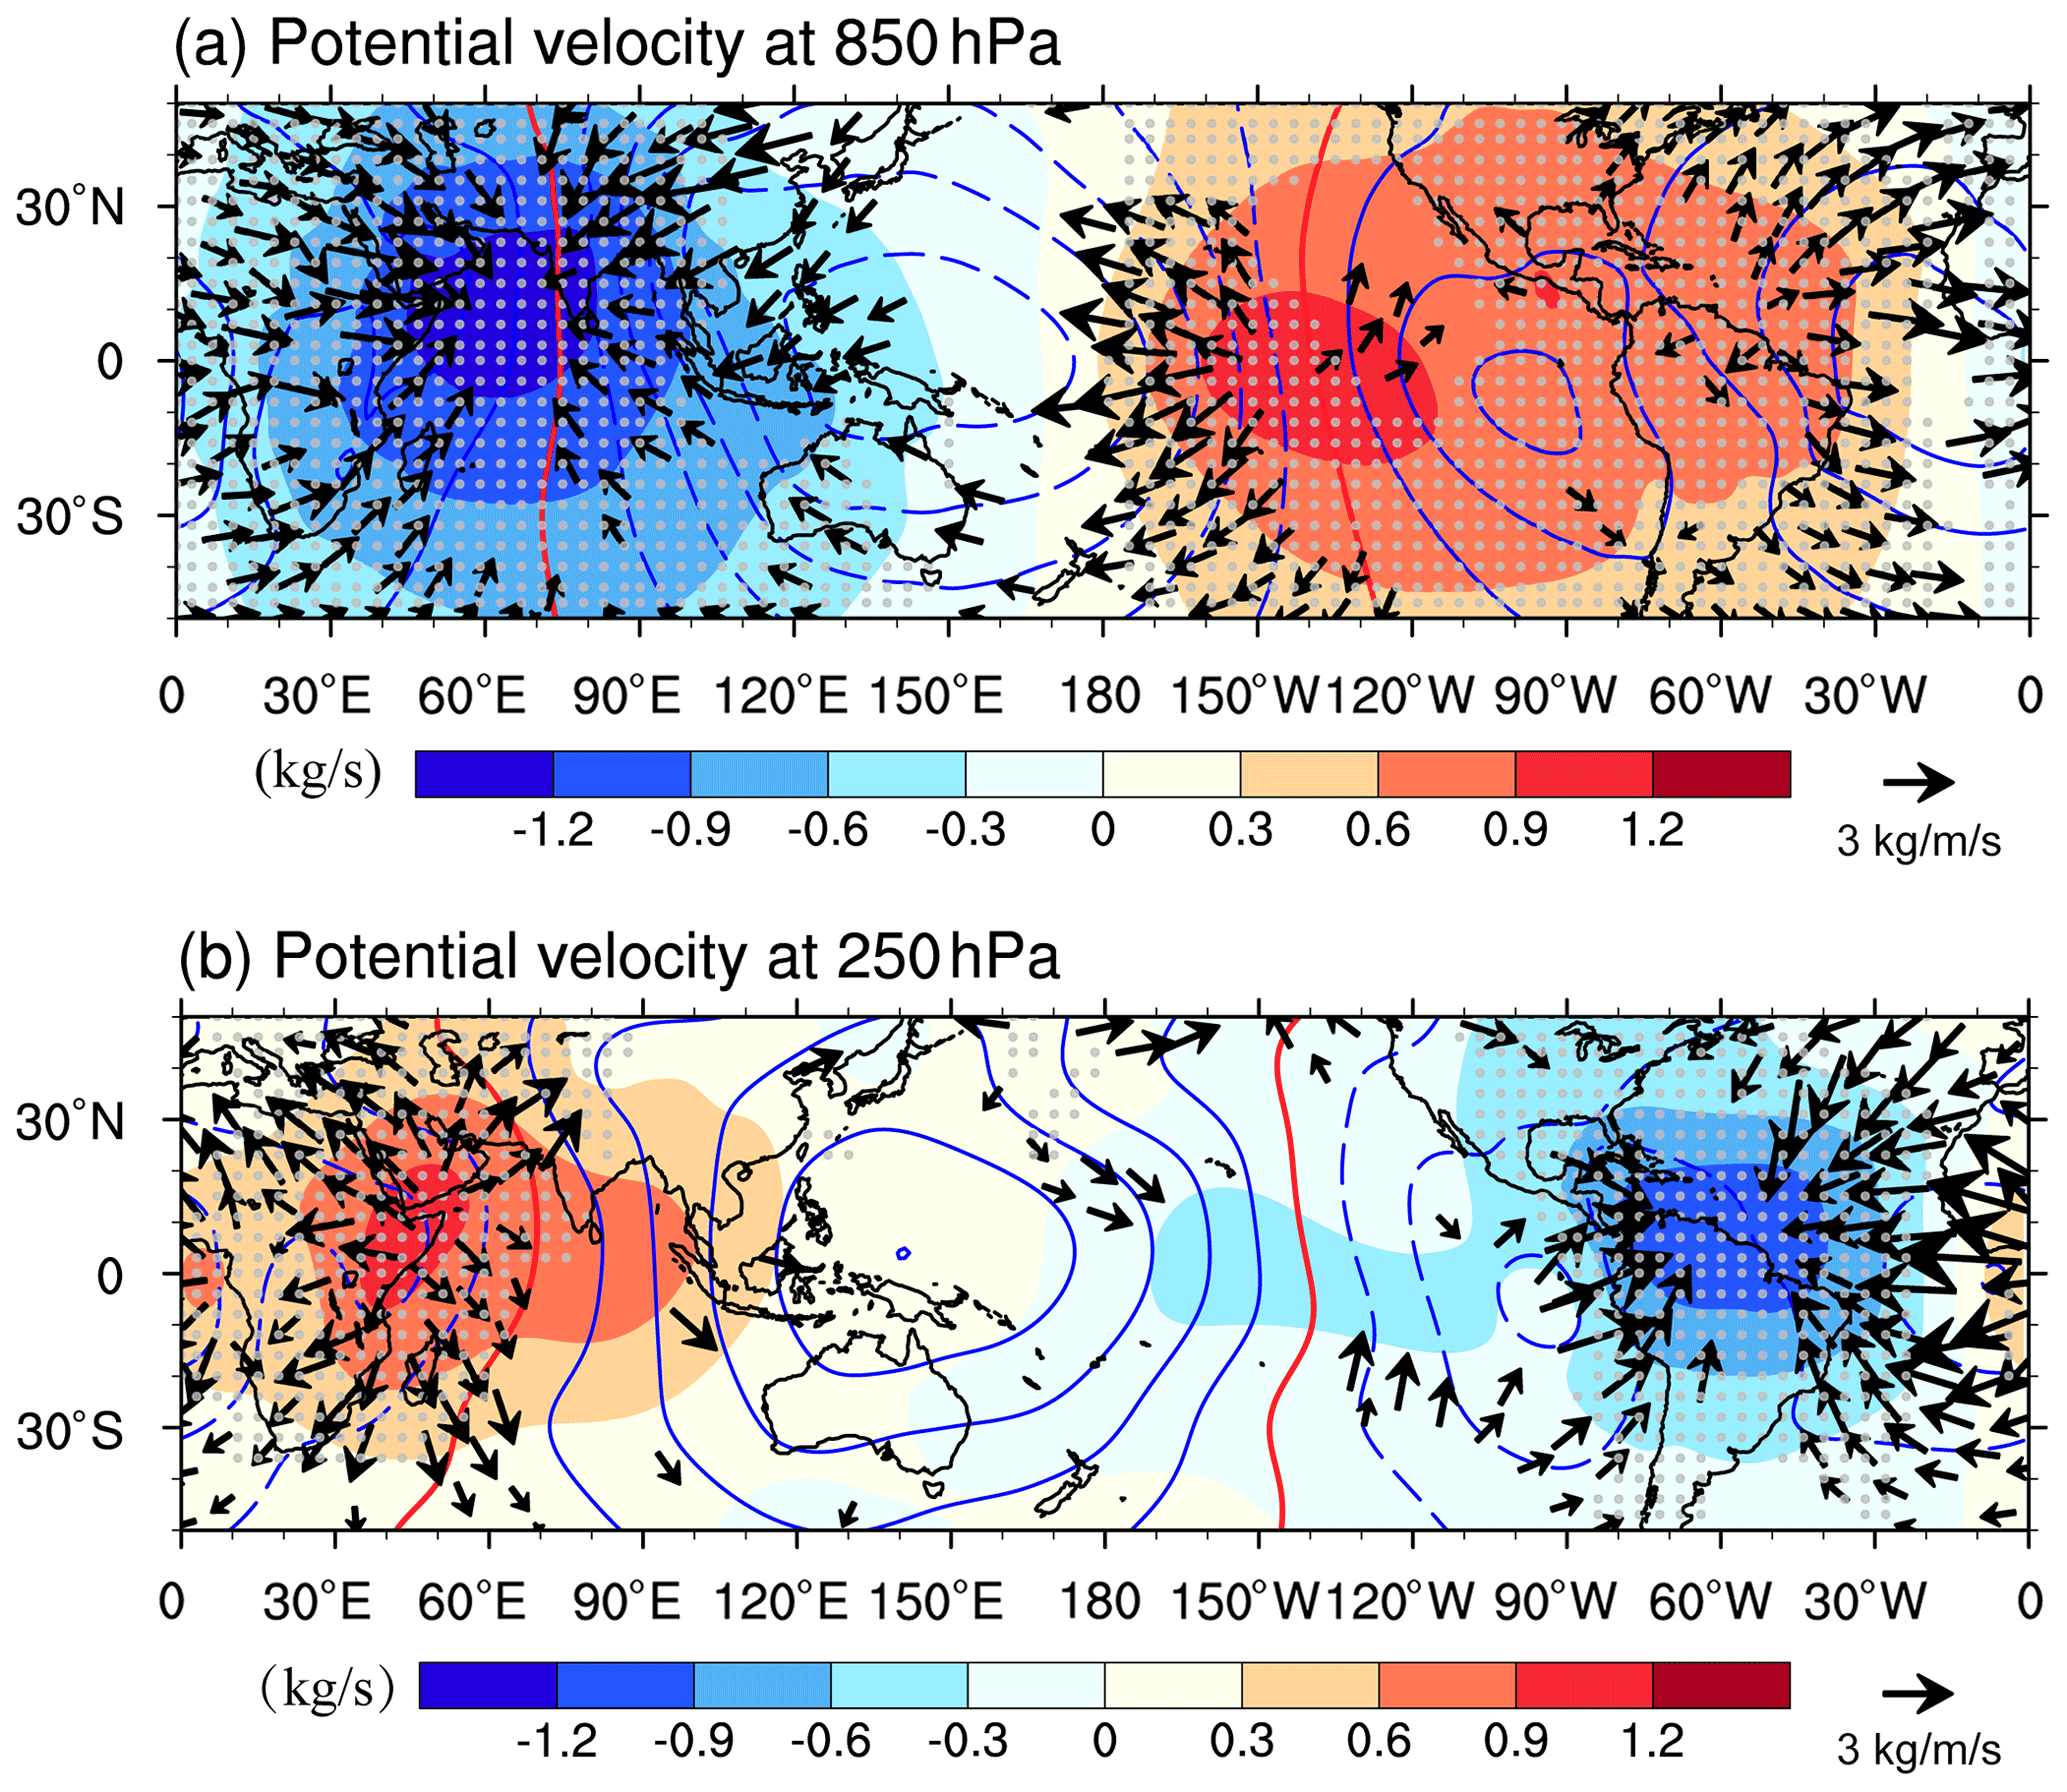
Figure 12Changes in the potential function of zonal wind VZ at (a) 850 hPa and (b) 250 hPa (shading; in kg s−1), corresponding to the divergent mode of the wind field (vectors; in kg m−1 s−1). VZ is decomposed from the 3P-DGAC method. The contours represent the climate mean of the potential function for the PI simulation. Solid curves indicate positive values, and dashed curves indicate negative values. Red solid curves represent zero values. The vectors and stippled regions are where at least 10 of 13 simulations in the model group agree on the ensemble mean.
This paper evaluates the changes in the large-scale hydrological cycle during the mid-Pliocene with respect to the PI based on 13 PlioMIP2 simulations. A diagnostic analysis using the moisture budget equation and the Earth's energy budget provides insight into the mechanisms. The main conclusions are summarized in the following.
The PlioMIP2 models show large spatial differences in PmE. The MMM generally depicts a wet regions getting wetter (i.e., the ITCZ, Maritime Continent, and monsoon regions) and dry regions getting drier (i.e., a sinking branch of the Hadley circulation) pattern during the mid-Pliocene warm climate. According to the moisture budget equation, a large part of the changes in PmE at low latitudes are due to the increased specific humidity. However, the thermodynamic component cannot fully explain the changes in PmE. The dynamic effects offset the thermodynamic effects to some extent and even determine a larger contribution to the changes in PmE in the southern tropical Pacific and northern Indian Ocean. We find increased hemispheric asymmetries of the atmospheric energy budget (larger atmospheric energy over NH than SH) during the mid-Pliocene compared with the PI period, which could induce the northward shift of the ITCZ and reorganize atmospheric circulation. These features can result in a weakening meridional circulation in the NH monsoon regions and a strengthening meridional circulation in the SH. In addition, the anomalous meridional circulation can dry the deep tropics but moisten the northern part of the ITCZ. Furthermore, these anomalies dry the SPCZ region and wet its southern part, which is associated with the southward shift of the SPCZ. We also find a robust westward shift in the PWC, which appears to moisten the northern Indian Ocean via the anomalous convergence of zonal circulation.
Our analyses provide a relatively complete understanding of the changes in the large-scale hydrological cycle within the PlioMIP2 ensemble. It is evident that the air could hold more moisture in a warmer climate; thus, the thermodynamic effects amplify the intensity of PmE but do not alter its spatial pattern (Fig. 2a; Held and Soden, 2006). Note that the hemispheric asymmetries of atmospheric energy could induce regional meridional circulation anomalies and, thus, alter the distribution of PmE anomalies during the mid-Pliocene via the δMCDD_M term at low latitudes. The PlioPMIP2 ensemble simulations suggest that hemispheric asymmetries of atmospheric energy are the key factor altering the spatial pattern of PmE via changes in the local meridional circulation. However, we should note that a noticeable inter-model spread exists in capturing the main features in the past warm climate, particularly for the changes in Walker circulation, such as the large spread in the simulated changes in the intensity of the PWC, dSST, and dSLP in Fig. 10, consistent with previous studies (Oldeman et al., 2021). Further effort to understand the inter-model uncertainty needs to be explored in future work. In addition, previous studies indicate that the storm track (transient eddy component) may play a key role in changes in PmE for middle–high latitudes (Seager et al., 2010; Han et al., 2019a, b). Due to the lack of hourly model data, we mainly discuss the relative contributions from moisture budget components to changes in PmE at low latitudes in this paper. Much more work should be conducted to study the impact of storm tracks on changes in PmE during the mid-Pliocene using hourly data in the future at middle–high latitudes.
Note that the global temperature during mid-Pliocene is controlled by the combined effects of boundary conditions (e.g., CO2 level, vegetation, and topography) (Haywood et al., 2016). Any changes in each boundary condition could induce large-scale hydrological cycling changes. For example, the role of remote biophysical effects in the northern middle–high latitudes is highlighted in driving the variation in monsoon rainfall in low latitudes and the shift of the ITCZ, as needleleaf vegetation expands greatly northward in eastern Eurasia during the mid-Pliocene (Chase et al., 2000; Swann et al., 2014; Mahmood et al., 2014; Zhang and Jiang, 2014; Burls and Fedorov, 2017). Some studies have indicated that uncertainties exist in the boundary conditions of changing South Asian summer monsoon (SASM) hydrological cycling. Sarathchandraprasad et al. (2017) indicated that the tectonically induced reorganization of the Indonesian throughflow can strengthen the SASM during the mid-Pliocene due to the increased cross-equatorial pressure gradient. Recent study by Prescott et al. (2019) highlighted the substantial influence of orbital forcing on the changes in SASM during the mid-Pliocene. The simulations suggest that tectonic uplifts in the South African plateaus can strengthen the SASM as well (Zhang and Liu, 2010). Based on these studies, the boundary conditions applied by the PlioMIP2 models can impact the low-latitude hydrological cycle during the mid-Pliocene. However, the relative impact of boundary conditions on hydrological cycling still remains uncertain. Moreover, not all models carry out the sensitivity experiments designed in PlioMIP2, increasing the difficulty related to exploring their relative contributions to PmE changes. These questions need to be considered further in the future.
To access the PlioMIP2 database, please send a request to Alan M. Haywood (a.m.haywood@leeds.ac.uk). PlioMIP2 data from CESM2, EC-Earth3-LR, GISS-E2-1-G, IPSL-CM6A-LR, and NorESM1-F can be obtained from the Earth System Grid Federation (ESGF, 2021, https://esgf-node.llnl.gov/search/cmip6/, last access: 11 November 2021). CCSM4 and CESM1.1 can be obtained from https://www.cesm.ucar.edu/models/ (last access: 11 November 2021, Feng et al., 2020, https://doi.org/10.1029/2019MS002033). The reconstructed SST from the alkenone-derived index and foraminifera calcite (McClymont et al., 2020, https://doi.org/10.5194/cp-16-1599-2020) and can be accessed from https://pliovar.github.io/km5c.html (last access: 11 November 2021).
QZ and ZH designed the work, ZH wrote the paper under the supervision of QZ. ZH carried out the analyses and programming with help from JC and QW. All of the other co-authors provided the PlioMIP2 model data and commented on the paper.
The contact author has declared that neither they nor their co-authors have any competing interests.
Publisher's note: Copernicus Publications remains neutral with regard to jurisdictional claims in published maps and institutional affiliations.
This article is part of the special issue “PlioMIP Phase 2: experimental design, implementation and scientific results”. It is not associated with a conference.
Zixuan Han acknowledges financial support from the National Natural Science Foundation of China (grant no. 42130610), the Fundamental Research Funds for the Central Universities (grant no. B210201009), and the National Key R&D Program of China (grant no. 2017YFC1502303). Jianbo Cheng acknowledges financial support from the National Natural Science Foundation of China (grant no. 42005012) and the Natural Science Foundation of Jiangsu Province (grant no. BK20201058). Qin Wen acknowledges financial support from the National Natural Science Foundation of China (grant no. 42106016) and a project funded by the China Postdoctoral Science Foundation (grant no. 2021M691623). The EC-Earth3 model simulations and the data analysis were performed using the ECMWF computing and archive facilities and the Swedish National Infrastructure for Computing (SNIC) at the National Supercomputer Centre (NSC), which is partially funded by the Swedish Research Council through grant agreement no. 2018-05973. Charles J. R. Williams acknowledges financial support from the UK Natural Environment Research Council within the framework of the SWEET (Super-Warm Early Eocene Temperatures) project (grant no. NE/P01903X/1). Natalie J. Burls acknowledges support from the National Science Foundation (NSF; grant nos. AGS-1844380 and OCN-2002448) and the Alfred P. Sloan Foundation (as a research fellow). Ran Feng acknowledges sponsorship from the U.S. National Science Foundation (grant nos. 1903650 and 1814029). The contributions of Bette L. Otto-Bliesner, Esther C. Brady, and Nan Rosenbloom are based upon work supported by the National Center for Atmospheric Research, which is a major facility sponsored by the NSF under cooperative agreement no. 1852977. The CESM project is primarily supported by the National Science Foundation (NSF). Computing and data storage resources for the CESM and CCSM4 simulations, including the Cheyenne supercomputer (https://doi.org/10.5065/D6RX99HX), were provided by the Computational and Information Systems Laboratory (CISL) at NCAR. Xiangyu Li acknowledges financial support from the National Natural Science Foundation of China (NSFC, grant no. 42005042) and the China Scholarship Council (grant no. 201804910023). The NorESM simulations benefitted from resources provided by UNINETT Sigma2 – the national infrastructure for high-performance computing and data storage in Norway. The work by Anna S. von der Heydt and Michiel L. J. Baatsen was carried out in the framework of the Netherlands Earth System Science Centre (NESSC) program, which is financially supported by the Ministry of Education, Culture and Science (OCW grant no. 024.002.001). Simulations with CCSM4-Utrecht were performed at the SURFsara Dutch national computing facilities and were sponsored by NWO-EW (Netherlands Organisation for Scientific Research, Exact Sciences; project nos. 17189 and 2020.022). Christian Stepanek and Gerrit Lohmann acknowledge computational resources from the Computing and Data Centre of the Alfred Wegener Institute, Helmholtz-Zentrum für Polar- und Meeresforschung. Christian Stepanek and Gerrit Lohmann also acknowledge funding from the Helmholtz Climate Initiative REKLIM and the Alfred Wegener Institute's “Changing Earth-Sustaining our Future” research program. The PRISM4 reconstruction and boundary conditions used in PlioMIP2 were funded by the U.S. Geological Survey Climate and Land Use Change Research and Development Program. Any use of trade, firm, or product names is for descriptive purposes only and does not imply endorsement by the US Government.
This research has been supported by the Swedish Research Council (Vetenskapsrådet; grant nos. 2013-06476 and 2017-04232).
The article processing charges for this open-access publication were covered by Stockholm University.
This paper was edited by Laurie Menviel and reviewed by Dipanjan Dey and one anonymous referee.
Allen, M. R. and Ingram, W. J.: Constraints on future changes in climate and the hydrologic cycle, Nature, 419, 224–232, https://doi.org/10.1038/nature01092, 2002.
Asokan, S. M. and Destouni, G.: Irrigation effects on hydro-climatic change: basin-wise water balance-constrained quantification and cross-regional comparison, Surv. Geophy., 35, 879–895, https://doi.org/10.1007/s10712-013-9223-5, 2014.
Baatsen, M., Von der Heydt, A., Kliphuis, M., Oldeman, A., and Weiffenbach, J.: Warm mid-Pliocene conditions using the CESM 1.0.4: the utrecht contribution to the PlioMIP2 ensemble, in preparation, 2021.
Bayr, T., Dommenget, D., Martin, T., and Power, S. B.: The eastward shift of the Walker circulation in response to global warming and its relationship to ENSO variability, Clim. Dynam., 43, 2747–2763, https://doi.org/10.1007/s00382-014-2091-y, 2014.
Bengtsson, L.: Foreword: International Space Science Institute (ISSI) workshop on the earth's hydrological cycle, in: The Earth's Hydrological Cycle, edited by: Bengtsson, L., Bonnet, R. M., Calisto, M., Destouni, G., Gurney, R., Johannessen, J., Kerr, Y., Lahoz, W. A., and Rast, M., Springer, Dordrecht, Netherlands, 485–488, https://doi.org/10.1007/978-94-017-8789-5_1, 2014.
Bonnefille, R.: Cenozoic vegetation, climate changes and hominid evolution in tropical Africa, Global Planet. Change, 72, 390–411, https://doi.org/10.1016/j.gloplacha.2010.01.015, 2010.
Burke, K. D., Williams, J. W., Chandler, M. A., Haywood, A. M., Lunt, D. J., and Otto-Bliesner, B. L.: Pliocene and Eocene provide best analogs for near-future climates, P. Natl. Acad. Sci. USA, 115, 13288, https://doi.org/10.1073/pnas.1809600115, 2018.
Burls, N. J. and Fedorov, A. V.: Wetter subtropics in a warmer world: contrasting past and future hydrological cycles, P. Natl. Acad. Sci. USA, 114, 12888, https://doi.org/10.1073/pnas.1703421114, 2017.
Chandan, D. and Peltier, W. R.: Regional and global climate for the mid-Pliocene using the University of Toronto version of CCSM4 and PlioMIP2 boundary conditions, Clim. Past, 13, 919–942, https://doi.org/10.5194/cp-13-919-2017, 2017.
Chang, Z., Xiao, J., Lü, L.. and Yao, H.: Abrupt shifts in the Indian monsoon during the Pliocene marked by high-resolution terrestrial records from the Yuanmou Basin in southwest China, J. Asian Earth Sci., 37, 166–175, 2010.
Charney, J. G.: Dynamics of deserts and drought in the Sahel, Q. J. Roy. Meteor. Soc., 101, 193–202, https://doi.org/10.1002/qj.49710142802, 1975.
Chase, T. N., Pielke Sr., R. A., Kittel, T. G. F., Nemani, R. R., and Running, S. W.: Simulated impacts of historical land cover changes on global climate in northern winter, Clim. Dynam., 16, 93–105, https://doi.org/10.1007/s003820050007, 2000.
Cheng, J., Hu, S., Gao, C., Hou, X., Xu, Z., and Feng, G.: On the discrepancies in the changes in the annual mean Hadley circulation among different regions and between CMIP5 models and reanalyses, Theor. Appl. Climatol., 141, 1475–1491, https://doi.org/10.1007/s00704-020-03292-3, 2020.
Chou, C., Neelin, J. D., Chen, C. A., and Tu, J. Y.: Evaluating the “Rich-Get-Richer” mechanism in tropical precipitation change under global warming, J. Climate, 22, 1982–2005, https://doi.org/10.1175/2008JCLI2471.1, 2009.
Corvec, S. and Fletcher, C. G.: Changes to the tropical circulation in the mid-Pliocene and their implications for future climate, Clim. Past, 13, 135–147, https://doi.org/10.5194/cp-13-135-2017, 2017.
Delaney, M. L., Bé, A. W., and Boyle, E. A.: Li, Sr, Mg, and Na in foraminiferal calcite shells from laboratory culture, sediment traps, and sediment cores, Geochim. Cosmochim. Ac., 49, 1327–1341, https://doi.org/10.1016/0016-7037(85)90284-4, 1985.
Donohoe, A., Marshall, J., Ferreira, D., and McGee, D.: The relationship between ITCZ location and cross-equatorial atmospheric heat transport: from the seasonal cycle to the last glacial maximum, J. Climate, 26, 3597–3618, https://doi.org/10.1175/JCLI-D-12-00467.1, 2013.
de Nooijer, W., Zhang, Q., Li, Q., Zhang, Q., Li, X., Zhang, Z., Guo, C., Nisancioglu, K. H., Haywood, A. M., Tindall, J. C., Hunter, S. J., Dowsett, H. J., Stepanek, C., Lohmann, G., Otto-Bliesner, B. L., Feng, R., Sohl, L. E., Chandler, M. A., Tan, N., Contoux, C., Ramstein, G., Baatsen, M. L. J., von der Heydt, A. S., Chandan, D., Peltier, W. R., Abe-Ouchi, A., Chan, W.-L., Kamae, Y., and Brierley, C. M.: Evaluation of Arctic warming in mid-Pliocene climate simulations, Clim. Past, 16, 2325–2341, https://doi.org/10.5194/cp-16-2325-2020, 2020.
Dowsett, H., Dolan, A., Rowley, D., Moucha, R., Forte, A. M., Mitrovica, J. X., Pound, M., Salzmann, U., Robinson, M., Chandler, M., Foley, K., and Haywood, A.: The PRISM4 (mid-Piacenzian) paleoenvironmental reconstruction, Clim. Past, 12, 1519–1538, https://doi.org/10.5194/cp-12-1519-2016, 2016.
Dowsett, H. J., Robinson, M. M., Haywood, A. M., Hill, D. J., Dolan, A. M., Stoll, D. K., Chan, W. L., Abe-Ouchi, A., Chandler, M. A., Rosenbloom, N. A., Otto-Bliesner, B. L., Bragg, F. J., Lunt, D. J., Foley, K. M., and Riesselman, C. R.: Assessing confidence in Pliocene sea surface temperatures to evaluate predictive models, Nat. Clim. Change, 2, 365–371, https://doi.org/10.1038/nclimate1455, 2012.
Dowsett, H. J., Foley, K. M., Stoll, D. K., Chandler, M. A., Sohl, L. E., Bentsen, M., Otto-Bliesner, B. L., Bragg, F. J., Chan, W.-L., Contoux, C., Dolan, A. M., Haywood, A. M., Jonas, J. A., Jost, A., Kamae, Y., Lohmann, G., Lunt, D. J., Nisancioglu, K. H., Abe-Ouchi, A., Ramstein, G., Riesselman, C. R., Robinson, M. M., Rosenbloom, N. A., Salzmann, U., Stepanek, C., Strother, S. L., Ueda, H., Yan, Q., and Zhang, Z.: Sea Surface Temperature of the mid-Piacenzian Ocean: A Data-Model Comparison, Sci. Rep.-UK, 3, 2013, https://doi.org/10.1038/srep02013, 2013.
Eltahir, E. A. B. and Bras, R. L.: Precipitation recycling, Rev. Geophys., 34, 367–378, https://doi.org/10.1029/96RG01927, 1996.
ESGF: WCRP Coupled Model Intercomparison Project (Phase 6), available at: https://esgf-node.llnl.gov/search/cmip6/, last access: 11 November 2021.
Feng, R., Otto-Bliesner, B. L., Fletcher, T. L., Tabor, C. R., Ballantyne, A. P., and Brady, E. C.: Amplified late Pliocene terrestrial warmth in northern high latitudes from greater radiative forcing and closed Arctic Ocean gateways, Earth Planet. Sc. Lett., 466, 129–138, https://doi.org/10.1016/j.epsl.2017.03.006, 2017.
Feng, R., Otto-Bliesner, B. L., Brady, E. C., and Rosenbloom, N.: Increased climate response and earth system sensitivity from CCSM4 to CESM2 in mid-Pliocene simulations, J. Adv. Model. Earth Sy., 12, e2019MS002033, https://doi.org/10.1029/2019MS002033, 2020 (data available at: https://www.cesm.ucar.edu/models/, last access: 11 November 2021).
Feng, R., Bhattacharya, T., Otto-bliesner, B., Brady, E., Haywood, A., Tindall, J., Hunter, S., Abe-Ouchi, A., Chan, W. L., Kageyama, M., Contoux, C., Guo, C., Li, X., Lohmann, G., Stepanek, C., Tan, N., Zhang, Q., Han, Z., Williams, C., Lunt, D., and Dowsett, H.: Past terrestrial hydroclimate driven by Earth System Feedbacks, Sci. Advances [preprint], https://doi.org/10.31223/X5P60P, in review, 2021.
Frierson, D. M. W. and Hwang, Y. T.: Extratropical influence on ITCZ shifts in slab ocean simulations of global warming, J. Climate, 25, 720–733, https://doi.org/10.1175/JCLI-D-11-00116.1, 2012.
Frierson, D. M. W., Hwang, Y. T., Fučkar, N. S., Seager, R., Kang, S. M., Donohoe, A., Maroon, E. A., Liu, X., and Battisti, D. S.: Contribution of ocean overturning circulation to tropical rainfall peak in the Northern Hemisphere, Nat. Geosci., 6, 940–944, https://doi.org/10.1038/ngeo1987, 2013.
Greve, P., Orlowsky, B., Mueller, B., Sheffield, J., Reichstein, M., and Seneviratne, S. I.: Global assessment of trends in wetting and drying over land, Nat. Geosci., 7, 716–721, https://doi.org/10.1038/ngeo2247, 2014.
Han, Z., Su, T., Huang, B., Feng, T., Qu, S., and Feng, G.: Changes in global monsoon precipitation and the related dynamic and thermodynamic mechanisms in recent decades, Int. J. Climatol., 39, 1490–1503, https://doi.org/10.1002/joc.5896, 2019a.
Han, Z., Su, T., Zhang, Q., Wen, Q., and Feng, G.: Thermodynamic and dynamic effects of increased moisture sources over the Tropical Indian Ocean in recent decades, Clim. Dynam., 53, 7081–7096, https://doi.org/10.1007/s00382-019-04977-w, 2019b.
Han, Z., Zhang, Q., Wen, Q., Lu, Z., Feng, G., Su, T., Li, Q., and Zhang, Q.: The changes in ENSO-induced tropical Pacific precipitation variability in the past warm and cold climates from the EC-Earth simulations, Clim. Dynam., 55, 503–519, https://doi.org/10.1007/s00382-020-05280-9, 2020.
Hastenrath, S.: Climate Dynamics of the Tropics, Kluwer Academic Publishers, Dordrecht, Netherlands, 1991.
Haywood, A. M., Hill, D. J., Dolan, A. M., Otto-Bliesner, B. L., Bragg, F., Chan, W.-L., Chandler, M. A., Contoux, C., Dowsett, H. J., Jost, A., Kamae, Y., Lohmann, G., Lunt, D. J., Abe-Ouchi, A., Pickering, S. J., Ramstein, G., Rosenbloom, N. A., Salzmann, U., Sohl, L., Stepanek, C., Ueda, H., Yan, Q., and Zhang, Z.: Large-scale features of Pliocene climate: results from the Pliocene Model Intercomparison Project, Clim. Past, 9, 191–209, https://doi.org/10.5194/cp-9-191-2013, 2013.
Haywood, A. M., Dowsett, H. J., Dolan, A. M., Rowley, D., Abe-Ouchi, A., Otto-Bliesner, B., Chandler, M. A., Hunter, S. J., Lunt, D. J., Pound, M., and Salzmann, U.: The Pliocene Model Intercomparison Project (PlioMIP) Phase 2: scientific objectives and experimental design, Clim. Past, 12, 663–675, https://doi.org/10.5194/cp-12-663-2016, 2016.
Haywood, A. M., Tindall, J. C., Dowsett, H. J., Dolan, A. M., Foley, K. M., Hunter, S. J., Hill, D. J., Chan, W.-L., Abe-Ouchi, A., Stepanek, C., Lohmann, G., Chandan, D., Peltier, W. R., Tan, N., Contoux, C., Ramstein, G., Li, X., Zhang, Z., Guo, C., Nisancioglu, K. H., Zhang, Q., Li, Q., Kamae, Y., Chandler, M. A., Sohl, L. E., Otto-Bliesner, B. L., Feng, R., Brady, E. C., von der Heydt, A. S., Baatsen, M. L. J., and Lunt, D. J.: The Pliocene Model Intercomparison Project Phase 2: large-scale climate features and climate sensitivity, Clim. Past, 16, 2095–2123, https://doi.org/10.5194/cp-16-2095-2020, 2020.
Held, I. M. and Soden, B. J.: Robust responses of the hydrological cycle to global warming, J. Climate, 19, 5686–5699, https://doi.org/10.1175/JCLI3990.1, 2006.
Heermance, R. V., Pullen, A., Kapp, P., Garzione, C. N., Bogue, S., Ding, L., and Song, P.: Climatic and tectonic controls on sedimentation and erosion during the Pliocene–Quaternary in the Qaidam Basin (China), GSA Bulletin, 125, 833–856, 2013.
Howell, F. W., Haywood, A. M., Dowsett, H. J., and Pickering, S. J.: Sensitivity of Pliocene Arctic climate to orbital forcing, atmospheric CO2 and sea ice albedo parameterisation, Earth Planet. Sc. Lett., 441, 133–142, https://doi.org/10.1016/j.epsl.2016.02.036, 2016.
Hu, S., Cheng, J., and Chou, J.: Novel three-pattern decomposition of global atmospheric circulation: generalization of traditional two-dimensional decomposition, Clim. Dynam., 49, 3573–3586, https://doi.org/10.1007/s00382-017-3530-3, 2017.
Hu, S., Chou, J., and Cheng, J.: Three-pattern decomposition of global atmospheric circulation: part I–decomposition model and theorems, Clim. Dynam., 50, 2355–2368, https://doi.org/10.1007/s00382-015-2818-4, 2018a.
Hu, S., Cheng, J., Xu, M., and Chou, J.: Three-pattern decomposition of global atmospheric circulation: part II–dynamical equations of horizontal, meridional and zonal circulations, Clim. Dynam., 50, 2673–2686, https://doi.org/10.1007/s00382-017-3763-1, 2018b.
Hu, Y., Huang, H., and Zhou, C.: Widening and weakening of the Hadley circulation under global warming, Sci. Bull., 63, 640–644, https://doi.org/10.1016/j.scib.2018.04.020, 2018.
Hunter, S. J., Haywood, A. M., Dolan, A. M., and Tindall, J. C.: The HadCM3 contribution to PlioMIP phase 2, Clim. Past, 15, 1691–1713, https://doi.org/10.5194/cp-15-1691-2019, 2019.
Igarashi, Y. and Yoshida, M.: History of Vegetation and Climate in the Kathmandu Valley, Proceedings of Indian National Science Academies, 54, 550–563, 1988.
Ji, S., Nie, J., Breecker, D. O., Luo, Z., and Song, Y. Intensified aridity in northern China during the middle Piacenzian warm period, J. Asian Earth Sci., 147, 222–225, 2017.
Kamae, Y., Ueda, H., and Kitoh, A.: Hadley and Walker circulations in the mid-Pliocene warm period simulated by an atmospheric general circulation model, J. Meteorol. Soc. Jpn. Ser. II, 89, 475–493, https://doi.org/10.2151/jmsj.2011-505, 2011.
Kelley, M., Schmidt, G. A., Nazarenko, L. S., et al.: GISS-E2.1: Configurations and climatology, J. Adv. Model. Earth Sy., 12, e2019MS002025, https://doi.org/10.1029/2019MS002025, 2020.
Kou, X.-Y., Ferguson, D. K., Xu, J.-X., Wang, Y.-F., and Li, C.-S.: The reconstruction of paleovegetation and paleoclimate in the Late Pliocene of West Yunnan, China, Climatic Change, 77, 431–448, 2006.
Li, G., Harrison, S. P., Bartlein, P. J., Izumi, K., and Colin Prentice, I.: Precipitation scaling with temperature in warm and cold climates: an analysis of CMIP5 simulations, Geophys. Res. Lett., 40, 4018–4024, https://doi.org/10.1002/grl.50730, 2013.
Li, X., Jiang, D., Zhang, Z., Zhang, R., Tian, Z., and Yan, Q.: Mid-Pliocene westerlies from PlioMIP simulations, Adv. Atmos. Sci., 32, 909–923, https://doi.org/10.1007/s00376-014-4171-7, 2015.
Li, X., Jiang, D., Tian, Z., and Yang, Y.: Mid-Pliocene global land monsoon from PlioMIP1 simulations, Palaeogeogr. Palaeocl., 512, 56–70, 2018.
Li, X., Guo, C., Zhang, Z., Otterå, O. H., and Zhang, R.: PlioMIP2 simulations with NorESM-L and NorESM1-F, Clim. Past, 16, 183–197, https://doi.org/10.5194/cp-16-183-2020, 2020.
Long, S. M., Xie, S. P., Zheng, X. T., and Liu, Q.: Fast and slow responses to global warming: sea surface temperature and precipitation patterns, J. Climate, 27, 285–299, https://doi.org/10.1175/JCLI-D-13-00297.1, 2014.
Long, S. M., Xie, S. P., and Liu, W.: Uncertainty in tropical rainfall projections: Atmospheric circulation effect and the ocean coupling, J. Climate, 29, 2671–2687, https://doi.org/10.1175/JCLI-D-15-0601.1, 2016.
Lu, J., Yang, H., Griffiths, M. L., Burls, N. J., Xiao, G., Yang, J., Wang, J. K., Johnson, K. R., and Xie, S.: Asian monsoon evolution linked to Pacific temperature gradients since the Late Miocene, Earth Planet. Sc. Lett., 563, 116882, https://doi.org/10.1016/j.epsl.2021.116882, 2021.
Lurton, T., Balkanski, Y., Bastrikov, V., Bekki, S., Bopp, L., Braconnot, P., Brockmann, P., Cadule, P., Contoux, C., Cozic, A., Cugnet, D., Dufresne, J. L., Éthé, C., Foujols, M. A., Ghattas, J., Hauglustaine, D., Hu, R. M., Kageyama, M., Khodri, M., Lebas, N., Levavasseur, G., Marchand, M., Ottlé, C., Peylin, P., Sima, A., Szopa, S., Thiéblemont, R., Vuichard, N., and Boucher, O.: Implementation of the CMIP6 forcing data in the IPSL-CM6A-LR model, J. Adv. Model. Earth Sy., 12, e2019MS001940, https://doi.org/10.1029/2019MS001940, 2020.
Ma, S. and Zhou, T.: Robust strengthening and westward shift of the tropical Pacific Walker circulation during 1979–2012: a comparison of 7 sets of reanalysis data and 26 CMIP5 models, J. Climate, 29, 3097–3118, https://doi.org/10.1175/JCLI-D-15-0398.1, 2016.
Mahmood, R., Pielke Sr., R. A., Hubbard, K. G., Niyogi, D., Dirmeyer, P. A., McAlpine, C., Carleton, A. M., Hale, R., Gameda, S., Beltrán-Przekurat, A., and Baker, B.: Land cover changes and their biogeophysical effects on climate, Int. J. Climatol., 34, 929–953, https://doi.org/10.1002/joc.3736, 2014.
McClymont, E. L., Ford, H. L., Ho, S. L., Tindall, J. C., Haywood, A. M., Alonso-Garcia, M., Bailey, I., Berke, M. A., Littler, K., Patterson, M. O., Petrick, B., Peterse, F., Ravelo, A. C., Risebrobakken, B., De Schepper, S., Swann, G. E. A., Thirumalai, K., Tierney, J. E., van der Weijst, C., White, S., Abe-Ouchi, A., Baatsen, M. L. J., Brady, E. C., Chan, W.-L., Chandan, D., Feng, R., Guo, C., von der Heydt, A. S., Hunter, S., Li, X., Lohmann, G., Nisancioglu, K. H., Otto-Bliesner, B. L., Peltier, W. R., Stepanek, C., and Zhang, Z.: Lessons from a high-CO2 world: an ocean view from ∼3 million years ago, Clim. Past, 16, 1599–1615, https://doi.org/10.5194/cp-16-1599-2020, 2020 (data available at: https://pliovar.github.io/km5c.html, last access: 11 November 2021).
Murray, F. W.: On the computation of saturation vapor pressure, RAND Corporation, Santa Monica, CA, 1966.
Munoz, A., Ojeda, J., and Sanchez-Valverde, B.: Sunspot-like and enso/nao-like periodicities in lacus- trinelaminated sediments of the pliocene villarroya basin (la rioja, spain), J. Paleolimnol., 27, 453–463, 2002.
Oldeman, A. M., Baatsen, M. L. J., von der Heydt, A. S., Dijkstra, H. A., Tindall, J. C., Abe-Ouchi, A., Booth, A. R., Brady, E. C., Chan, W.-L., Chandan, D., Chandler, M. A., Contoux, C., Feng, R., Guo, C., Haywood, A. M., Hunter, S. J., Kamae, Y., Li, Q., Li, X., Lohmann, G., Lunt, D. J., Nisancioglu, K. H., Otto-Bliesner, B. L., Peltier, W. R., Pontes, G. M., Ramstein, G., Sohl, L. E., Stepanek, C., Tan, N., Zhang, Q., Zhang, Z., Wainer, I., and Williams, C. J. R.: Reduced El Niño variability in the mid-Pliocene according to the PlioMIP2 ensemble, Clim. Past, 17, 2427–2450, https://doi.org/10.5194/cp-17-2427-2021, 2021.
Oort, A. H. and Yienger, J. J.: Observed interannual variability in the Hadley circulation and its connection to ENSO, J. Climate, 9, 2751–2767, https://doi.org/10.1175/1520-0442(1996)009<2751:OIVITH>2.0.CO;2, 1996.
Otto-Bliesner, B. L., Brady, E. C., Fasullo, J., Jahn, A., Landrum, L., Stevenson, S., Rosenbloom, N., Mai, A., and Strand, G.: Climate variability and change since 850 CE: an ensemble approach with the community earth system model, B. Am. Meteorol. Soc., 97, 735–754, https://doi.org/10.1175/BAMS-D-14-00233.1, 2016.
Peixoto, J. and Oort, A.: The Physics of Climate, AIP Press, New York, NY, 1992.
Peltier, W. R. and Vettoretti, G.: Dansgaard-Oeschger oscillations predicted in a comprehensive model of glacial climate: A “kicked” salt oscillator in the Atlantic, Geophys. Res. Lett., 41, 7306–7313, https://doi.org/10.1002/2014GL061413, 2014.
Pontes, G., Taschetto, A., Gupta, A.S., Santoso, A., Wainer, I., Haywood, A., Chan, W.L., Abe-Ouchi, A., Stepanek, C., Lohmann, G., Hunter, S., Tindall, J., Chandler, M., Sohl, L., Peltier, D., Chandan, D., Kamae, Y., Nisancioglu, K., Zhang, Z.S., Contoux, C., Tan, N., Zhang, Q., Otto-Bliesner, B., Brady, E., Feng, R., Heydt, A. V. D., Baatsen, M., and Oldemann, A.: Northward ITCZ shift drives reduced ENSO activity in the Mid-Pliocene Warm Period, Nature Portfolio, 2693–5015, https://doi.org/10.21203/rs.3.rs-402220/v1, 2021.
Pontes, G. M., Wainer, I., Taschetto, A. S., Sen Gupta, A., Abe-Ouchi, A., Brady, E. C., Chan, W. L., Chandan, D., Contoux, C., Feng, R., Hunter, S. J., Kame, Y., Lohmann, G., Otto-Bliesner, B. L., Peltier, W. R., Stepanek, C., Tindall, J., Tan, N., Zhang, Q., and Zhang, Z.: Drier tropical and subtropical Southern Hemisphere in the mid-Pliocene warm period, Sci. Rep., 10, 13458, https://doi.org/10.1038/s41598-020-68884-5, 2020.
Prahl, F. G. and Wakeham, S. G.: Calibration of unsaturation patterns in long-chain ketone compositions for palaeotemperature assessment, Nature, 330, 367–369, https://doi.org/10.1038/330367a0, 1987.
Prescott, C. L., Haywood, A. M., Dolan, A. M., Hunter, S. J., and Tindall, J. C.: Indian monsoon variability in response to orbital forcing during the late Pliocene, Global Planet. Change, 173, 33–46, https://doi.org/10.1016/j.gloplacha.2018.12.002, 2019.
Previdi, M. and Liepert, B. G.: Annular modes and Hadley cell expansion under global warming, Geophys. Res. Lett., 34, L22701, https://doi.org/10.1029/2007GL031243, 2007.
Root, T. L., Price, J. T., Hall, K. R., Schneider, S. H., Rosenzweig, C., and Pounds, J. A.: Fingerprints of global warming on wild animals and plants, Nature, 421, 57–60, https://doi.org/10.1038/nature01333, 2003.
Salzmann, U., Haywood, A. M., Lunt, D. J., Valdes, P. J., and Hill, D. J.: A new global biome reconstruction and data-model comparison for the middle Pliocene, Global Ecol. Biogeogr., 17, 432–447, https://doi.org/10.1111/j.1466-8238.2008.00381.x, 2008.
Salzmann, U., Dolan, A. M., Haywood, A. M., Chan, W. L., Voss, J., Hill, D. J., Abe-Ouchi, A., Otto-Bliesner, B., Bragg, F. J., Chandler, M. A., Contoux, C., Dowsett, H. J., Jost, A., Kamae, Y., Lohmann, G., Lunt, D. J., Pickering, S. J., Pound, M. J., Ramstein, G., Rosenbloom, N. A., Sohl, L., Stepanek, C., Ueda, H., and Zhang, Z.: Challenges in quantifying Pliocene terrestrial warming revealed by data–model discord, Nat. Clim. Change, 3, 969–974, https://doi.org/10.1038/nclimate2008, 2013.
Samakinwa, E., Stepanek, C., and Lohmann, G.: Sensitivity of mid-Pliocene climate to changes in orbital forcing and PlioMIP's boundary conditions, Clim. Past, 16, 1643–1665, https://doi.org/10.5194/cp-16-1643-2020, 2020.
Sanyal, P., Bhattacharya, S. K., Kumar, R., Ghosh, S. K., and Sangode, S. J.: Mio–Pliocene monsoonal record from Himalayan foreland basin (Indian Siwalik) and its relation to vegetational change, Palaeogeogr. Palaeocl., 205, 23–41, https://doi.org/10.1016/j.palaeo.2003.11.013, 2004.
Sarathchandraprasad, T., Tiwari, M., and Behera, P.: South Asian Summer Monsoon precipitation variability during late Pliocene: Role of Indonesian Throughflow, Palaeogeogr. Palaeocl., 574, 110447, https://doi.org/10.1016/j.palaeo.2021.110447, 2021.
Schwendike, J., Govekar, P., Reeder, M. J., Wardle, R., Berry, G. J., and Jakob, C.: Local partitioning of the overturning circulation in the tropics and the connection to the Hadley and Walker circulations, J. Geophys. Res.-Atmos., 119, 1322–1339, https://doi.org/10.1002/2013JD020742, 2014.
Scroxton, N., Bonham, S. G., Rickaby, R. E. M., Lawrence, S. H. F., Hermoso, M., and Haywood, A. M.: Persistent El Niño–Southern Oscillation variation during the Pliocene Epoch, Paleoceanography, 26, PA2215, https://doi.org/10.1029/2010PA002097, 2011.
Seager, R., Naik, N., and Vecchi, G. A.: Thermodynamic and dynamic mechanisms for large-scale changes in the hydrological cycle in response to global warming, J. Climate, 23, 4651–4668, https://doi.org/10.1175/2010JCLI3655.1, 2010.
Sharmila, S. and Walsh, K. J. E.: Recent poleward shift of tropical cyclone formation linked to Hadley cell expansion, Nat. Clim. Change, 8, 730–736, https://doi.org/10.1038/s41558-018-0227-5, 2018.
Smith, D. M., Screen, J. A., Deser, C., Cohen, J., Fyfe, J. C., García-Serrano, J., Jung, T., Kattsov, V., Matei, D., Msadek, R., Peings, Y., Sigmond, M., Ukita, J., Yoon, J.-H., and Zhang, X.: The Polar Amplification Model Intercomparison Project (PAMIP) contribution to CMIP6: investigating the causes and consequences of polar amplification, Geosci. Model Dev., 12, 1139–1164, https://doi.org/10.5194/gmd-12-1139-2019, 2019.
Stepanek, C., Samakinwa, E., Knorr, G., and Lohmann, G.: Contribution of the coupled atmosphere–ocean–sea ice–vegetation model COSMOS to the PlioMIP2, Clim. Past, 16, 2275–2323, https://doi.org/10.5194/cp-16-2275-2020, 2020.
Stephens, G. L. and Ellis, T. D.: Controls of global-mean precipitation increases in global warming GCM experiments, J. Climate, 21, 6141–6155, https://doi.org/10.1175/2008JCLI2144.1, 2008.
Stuecker, M. F., Bitz, C. M., Armour, K. C., Proistosescu, C., Kang, S. M., Xie, S. P., Kim, D., McGregor, S., Zhang, W., Zhao, S., Cai, W., Dong, Y., and Jin, F. F.: Polar amplification dominated by local forcing and feedbacks, Nat. Clim. Change, 8, 1076–1081, https://doi.org/10.1038/s41558-018-0339-y, 2018.
Sun, Y., An, Z., Clemens, S. C., Bloemendal, J., and Vandenberghe, J.: Seven million years of wind and precipitation variability on the Chinese Loess Plateau, Earth Planet. Sc. Lett., 297, 525–535, 2010.
Sun, Y., Ramstein, G., Contoux, C., and Zhou, T.: A comparative study of large-scale atmospheric circulation in the context of a future scenario (RCP4.5) and past warmth (mid-Pliocene), Clim. Past, 9, 1613–1627, https://doi.org/10.5194/cp-9-1613-2013, 2013a.
Sun, Y., Zhou, T., and Zhang, L.: Observational analysis and numerical simulation of the interannual variability of the boreal winter Hadley circulation over the recent 30 years, Sci. China Earth Sci., 56, 647–661, https://doi.org/10.1007/s11430-012-4497-x, 2013b.
Swann, A. L. S., Fung, I. Y., Liu, Y., and Chiang, J. C. H.: Remote vegetation feedbacks and the mid-Holocene green Sahara, J. Climate, 27, 4857–4870, https://doi.org/10.1175/JCLI-D-13-00690.1, 2014.
Tierney, J. E., Haywood, A. M., Feng, R., Bhattacharya, T., and Otto-Bliesner, B. L.: Pliocene warmth consistent with greenhouse gas forcing, Geophys. Res. Lett., 46, 9136–9144, https://doi.org/10.1029/2019GL083802, 2019.
Trauth, M. H., Maslin, M. A., Deino, A. L., Strecker, M. R., Bergner, A. G. N., and Dühnforth, M.: High- and low-latitude forcing of Plio-Pleistocene East African climate and human evolution, J. Hum. Evol., 53, 475–486, https://doi.org/10.1016/j.jhevol.2006.12.009, 2007.
Vallis, G. K., Zurita-Gotor, P., Cairns, C., and Kidston, J.: Response of the large-scale structure of the atmosphere to global warming, Q. J. Roy. Meteor. Soc., 141, 1479–1501, https://doi.org/10.1002/qj.2456, 2015.
Wan, S., Tian, J., Steinke, S., Li, A., and Li, T.: Evolution and variability of the East Asian summer monsoon during the Pliocene: evidence from clay mineral records of the South China sea, Palaeogeogr. Palaeoclimatol. Palaeoecol., 293, 237–247, https://doi.org/10.1016/j.palaeo.2010.05.025, 2010.
Wang, B., Liu, J., Kim, H. J., Webster, P. J., and Yim, S. Y.: Recent change of the global monsoon precipitation (1979–2008), Clim. Dynam., 39, 1123–1135, https://doi.org/10.1007/s00382-011-1266-z, 2012.
Wang, J., Wang, Y. J., Liu, Z. C., Li, J. Q., and Xi, P.: Cenozoic environmental evolution of the Qaidam Basin and its implications for the uplift of the Tibetan Plateau and the drying of central Asia, Palaeogeogr. Palaeocl., 152, 37–47, 1999.
Wara, M. W., Ravelo, A. C., and Delaney, M. L.: Permanent El Niño-like conditions during the Pliocene warm period, Science, 309, 758–761, https://doi.org/10.1126/science.1112596, 2005.
Watt-Meyer, O. and Frierson, D. M. W.: ITCZ width controls on Hadley cell extent and Eddy-Driven jet position and their response to warming, J. Climate, 32, 1151–1166, https://doi.org/10.1175/JCLI-D-18-0434.1, 2019.
Wentz, F. J., Ricciardulli, L., Hilburn, K., and Mears, C.: How much more rain will global warming bring?, Science, 317, 233–235, https://doi.org/10.1126/science.1140746, 2007.
Williams, C. J. R., Sellar, A. A., Ren, X., Haywood, A. M., Hopcroft, P., Hunter, S. J., Roberts, W. H. G., Smith, R. S., Stone, E. J., Tindall, J. C., and Lunt, D. J.: Simulation of the mid-Pliocene Warm Period using HadGEM3: experimental design and results from model–model and model–data comparison, Clim. Past, 17, 2139–2163, https://doi.org/10.5194/cp-17-2139-2021, 2021.
Xie, S. P., Deser, C., Vecchi, G. A., Ma, J., Teng, H., and Wittenberg, A. T.: Global warming pattern formation: sea surface temperature and rainfall, J. Climate, 23, 966–986, https://doi.org/10.1175/2009JCLI3329.1, 2010.
Xie, S., Sun, B., Wu, J., Lin, Z., Yan, D., and Xiao, L.: Palaeodimatic estimates for the late Pliocene based on leaf physiognomy from Western Yunnan, China, Turk. J. Earth Sci., 21, 251–261, https://doi.org/10.3906/yer-1003-23, 2012.
Yan, Q., Zhang, Z. S., and Gao, Y. Q.: An East Asian Monsoon in the Mid-Pliocene, Atmos. Ocean. Sci. Lett., 5, 449–454, https://doi.org/10.1080/16742834.2012.11447034, 2012.
Zhang, Q., Berntell, E., Axelsson, J., Chen, J., Han, Z., de Nooijer, W., Lu, Z., Li, Q., Zhang, Q., Wyser, K., and Yang, S.: Simulating the mid-Holocene, last interglacial and mid-Pliocene climate with EC-Earth3-LR, Geosci. Model Dev., 14, 1147–1169, https://doi.org/10.5194/gmd-14-1147-2021, 2021.
Zhang, R., Yan, Q., Zhang, Z. S., Jiang, D., Otto-Bliesner, B. L., Haywood, A. M., Hill, D. J., Dolan, A. M., Stepanek, C., Lohmann, G., Contoux, C., Bragg, F., Chan, W.-L., Chandler, M. A., Jost, A., Kamae, Y., Abe-Ouchi, A., Ramstein, G., Rosenbloom, N. A., Sohl, L., and Ueda, H.: Mid-Pliocene East Asian monsoon climate simulated in the PlioMIP, Clim. Past, 9, 2085–2099, https://doi.org/10.5194/cp-9-2085-2013, 2013.
Zhang, R. and Jiang, D.: Impact of vegetation feedback on the mid-Pliocene warm climate, Adv. Atmos. Sci., 31, 1407–1416, https://doi.org/10.1007/s00376-014-4015-5, 2014.
Zhang, R. and Liu, X. D.: The effects of tectonic uplift on the evolution of Asian summer monsoon climate since Pliocene, Chinese J. Geophys.-Ch., 53, 948–960, https://doi.org/10.1002/cjg2.1565, 2010.
Zhang, R., Zhang, Z., Jiang, D., Yan, Q., Zhou, X., and Cheng, Z.: Strengthened african summer monsoon in the mid-piacenzian, Adv. Atmos. Sci., 33, 1061–1070, https://doi.org/10.1007/s00376-016-5215-y, 2016.
Zhang, R., Jiang, D., Zhang, Z., Yan, Q., and Li, X.: Modeling the late Pliocene global monsoon response to individual boundary conditions, Clim. Dynam., 53, 4871–4886, https://doi.org/10.1007/s00382-019-04834-w, 2019.
Zhang, Z., Li, X., Guo, C., Otterå, O. H., Nisancioglu, K. H., Tan, N., Contoux, C., Ramstein, G., Feng, R., Otto-Bliesner, B. L., Brady, E., Chandan, D., Peltier, W. R., Baatsen, M. L. J., von der Heydt, A. S., Weiffenbach, J. E., Stepanek, C., Lohmann, G., Zhang, Q., Li, Q., Chandler, M. A., Sohl, L. E., Haywood, A. M., Hunter, S. J., Tindall, J. C., Williams, C., Lunt, D. J., Chan, W.-L., and Abe-Ouchi, A.: Mid-Pliocene Atlantic Meridional Overturning Circulation simulated in PlioMIP2, Clim. Past, 17, 529–543, https://doi.org/10.5194/cp-17-529-2021, 2021.
Zheng, J., Zhang, Q., Li, Q., Zhang, Q., and Cai, M.: Contribution of sea ice albedo and insulation effects to Arctic amplification in the EC-Earth Pliocene simulation, Clim. Past, 15, 291–305, https://doi.org/10.5194/cp-15-291-2019, 2019.
- Abstract
- Introduction
- Data and analytical methods
- Changes in hydroclimate during the mid-Pliocene
- Thermodynamic and dynamic contributions to changes in PmE
- Mechanisms for the changes in moisture budget components
- Discussion and conclusions
- Data availability
- Author contributions
- Competing interests
- Disclaimer
- Special issue statement
- Acknowledgements
- Financial support
- Review statement
- References