the Creative Commons Attribution 4.0 License.
the Creative Commons Attribution 4.0 License.
 | 13 Oct 2021
Dating of the GV7 East Antarctic ice core by high-resolution chemical records and focus on the accumulation rate variability in the last millennium
Raffaello Nardin
Alessandra Amore
Silvia Becagli
Francois Burgay
Laura Caiazzo
Virginia Ciardini
Giuliano Dreossi
Massimo Frezzotti
Sang-Bum Hong
Ishaq Khan
Bianca Maria Narcisi
Marco Proposito
Claudio Scarchilli
Enricomaria Selmo
Andrea Spolaor
Barbara Stenni
Rita Traversi
Ice core dating is the first step for a correct interpretation of climatic and environmental changes. In this work, we release the dating of the uppermost 197 m of the 250 m deep GV7(B) ice core (drill site, 70∘41′ S, 158∘52′ E; 1950 m a.s.l. in Oates Land, East Antarctica) with a sub-annual resolution. Chemical records of NO, MSA (methanesulfonic acid), non-sea-salt SO (nss), sea-salt ions and water stable isotopes (δ18O) were studied as candidates for dating due to their seasonal pattern. Different procedures were tested but the nss record proved to be the most reliable on the short- and long-term scales, so it was chosen for annual layer counting along the whole ice core. The dating was constrained by using volcanic signatures from historically known events as tie points, thus providing an accurate age–depth relationship for the period 1179–2009 CE. The achievement of the complete age scale allowed us to calculate the annual mean accumulation rate throughout the analyzed 197 m of the core, yielding an annually resolved history of the snow accumulation on site in the last millennium. A small yet consistent rise in accumulation rate (Tr = 1.6, p<0.001) was found for the last 830 years starting around mid-18th century.
- Article
(4540 KB) - Full-text XML
-
Supplement
(210 KB) - BibTeX
- EndNote


Ice cores represent remarkable natural archives able to provide paleoclimatic and paleoenvironmental information, and their study is of high relevance to improving our understanding of the climate system. Ice cores are nowadays one of the most valuable archives to obtain long-term, highly resolved records of the atmospheric composition and of the temperatures of the past, spanning from a few years up to hundreds of thousands of years (Abram et al., 2013; Delmonte et al., 2002; Fischer et al., 2007; Traversi et al., 2012; Watanabe et al., 1999; Wolff et al., 2010). Antarctica and the surrounding ocean play a critical role in climate dynamics (Bertler et al., 2011), but despite the huge efforts of international programs (e.g., International Trans-Antarctic Scientific Expedition, ITASE; East Antarctic International Ice Sheet Traverse, EAIIST), a large part of the Antarctic ice sheet is still unexplored and additional cores are needed to properly reconstruct the past climate and to integrate this information in climate modeling simulations. In particular, the last millennium is a critical time frame for evaluating the more recent human-related climate change into a longer temporal context and to disentangle natural versus human impacts on climate variability, but it is still poorly investigated, particularly in Antarctica. New ice core records from Antarctica are needed for a better assessment of the surface mass balance (SMB) of the Antarctic continent, which is highly relevant for understanding its role in sea-level rise in recent decades and in the near future (DeConto and Pollard, 2016; Krinner et al., 2007). Spatial coverage of climatic observation in Antarctica and the Southern Ocean is still poor (Jones et al., 2016; Neukom et al., 2018) and ice core records have the potential to investigate past SMB beyond the instrumental and satellite period. Recently, Thomas et al. (2017) investigated the Antarctic snow accumulation variability over the last millennium at regional scale using a large number of snow accumulation records, grouped and assigned to different regional Antarctic areas and compared them with modeled SMB.
In the framework of the Programma Nazionale di Ricerche in Antartide (PNRA) project “IPICS–2kyr-IT”, representing the Italian contribution to the project “The IPICS 2k Array: a network of ice core climate and climate forcing record for the last two millennia”, the latter being one of the four topics of the International Partnerships in Ice Core Sciences (IPICS), several drillings have been carried out on the Oates Coast, East Antarctica. In this framework, the site named GV7 (Fig. 1) was chosen to retrieve ice cores covering at least 1000 years of climatic and environmental history of this area of Antarctica. The drillings were accomplished through a bilateral Italy–South Korea collaboration, during the 2013/2014 Antarctic summer.

Figure 1GV7 (70∘41′17.1′′ S, 158∘51′48.9′′ E; 1950 m a.s.l.) drilling site (red square). Hercules Nevé (HN), Talos Dome (TD), GV5, GV2, D66, Dome C and Law Dome ice core drilling sites are also shown (Greene et al., 2017; Fretwell et al., 2013).
One of the most critical aspects of the study of the ice core records is the dating of each ice layer, which is fundamental for putting the records into a temporal scale. Different methods were developed since the second half of the last century (Hammer, 1980) including the identification of seasonal pattern in chemical and physical records (Alley et al., 1997; Cole-Dai et al., 1997; Extier et al., 2018; Sigl et al., 2016), ice flow models and identification of temporal horizons such as volcanic eruptions that cause spikes in the acidity of an ice layer and/or trace element concentration (Castellano et al., 2005; Igarashi et al., 2011; Winstrup et al., 2012, 2019).
Here, we focused on the identification of seasonal patterns in the ionic and isotopic composition of the core, the latter being one of the most reliable and extensively used methods used to date many ice cores. Since δ18O in falling snow varies with seasons (Dansgaard, 1964), showing maxima in summer and minima in winter, it is possible to identify an annual cycle in δ18O which is useful in the dating of a core. A similar annual pattern with either summer or winter maxima is found in both major sea-salt and non-sea-salt ions measured in ice cores and their records have been used in ice core dating (e.g., nitrate, methanesulfonic acid (MSA) and the non-marine fraction of the sulfate (nss); Pasteris et al., 2014; Piccardi et al., 1994; Stenni et al., 2002; Udisti, 1996). MSA and nss mainly arise from the atmospheric oxidation of their precursor dimethyl sulfide (DMS), which in turn is produced by metabolic activities of marine phytoplanktonic species (Stefels et al., 2007). The strong seasonality of DMS production leads to an analogous seasonal pattern of nss and MSA with the highest concentration peaks during the phytoplanktonic bloom, occurring in austral spring–summer (November–March) (Becagli et al., 2012).
Unlike MSA, which only arises from marine DMS (Gondwe et al., 2003), nss is formed also from the oxidation in the troposphere of SO2, emitted during explosive volcanic eruptions, to sulfuric acid (Delmas et al., 1985). These acidic components, thanks to tropospheric and stratospheric circulation (Delmas et al., 1985) could be deposited in polar regions during a period of 2–3 years after the event (Sigl et al., 2015), and their signal is superimposed over the biogenic background of the nss. The identification of such volcanic signatures in ice core records is commonly used to synchronize ice core timescales (Severi et al., 2007, 2012; Winski et al., 2019) and widely used to assign an absolute date to ice layers in a core (Castellano et al., 2005; Sigl et al., 2013) in conjunction with the annual layer counting. A similar seasonality (with a maximum in the austral summer) is also observed in the nitrate concentration throughout the year. As one of the most abundant ions found in the cores (Legrand et al., 1999), nitrate is considered the final sink of atmospheric NOx and due to its interaction with the main oxidant cycles in the atmosphere, it is considered one of the potential markers to reconstruct the oxidizing capacity of the past atmosphere (e.g., Dibb et al., 1998; Hastings et al., 2005). Since some of these oxidizing processes, combined with the photochemical ones, occur more intensely during summer (Erbland et al., 2013; Grannas et al., 2007), this marker can show a seasonal pattern as found in polar records (Stenni et al., 2002; Wolff, 1995). However, it must be noted that the sources, transport and preservation of nitrate in the Antarctic snow layers are still not well understood, and that the aforementioned processes are not the only factors affecting ion concentrations in the snowpack. Deposition of , post-depositional loss and recycling of (e.g., Röthlisberger et al., 2002; Shi et al., 2015; Zatko et al., 2016) are all variables influencing the final nitrate concentration in ice cores. In particular, ultraviolet photolysis of nitrate and re-evaporation of HNO3 can affect the concentration in the uppermost layers of snow, especially for sites with low snow accumulation rate (Mulvaney et al., 1998; Röthlisberger et al., 2000, 2002; Berhanu et al., 2014). Despite that these processes might partially mask the seasonal pattern, nitrate records were successfully used for annual layer counting of ice cores from both hemispheres (Rasmussen et al., 2006; Thomas et al., 2007; Wolff, 2013). An opposite seasonal trend can be found for major sea-salt ions, showing late winter concentration maxima even in the innermost regions of Antarctica (Udisti et al., 2012) due to a large influx of sea-salt aerosol during winter months (Bodhaine et al., 1986). This seasonal pattern was observed at coastal stations (Mulvaney and Wolff, 1994; Weller et al., 2011), and Na+ and Mg2+ records were successfully used in the dating of ice cores (Herron and Langway, 1979; Winski et al., 2019). However, multiple sources contribute to the concentration of sea-salt ions in an ice core, and during winter months, the increase of sea ice extent (SIE) could in principle reduce the amount of sea spray delivered to the site. Since sea-salt aerosol is generated over open water by bubble bursting (de Leeuw et al., 2011), the increase of SIE during the winter months could increase the distance from this source resulting in a loss of particles from the ocean during the long-range transport (Abram et al., 2013), potentially masking the seasonal pattern. Here, we present the dating of the uppermost 197 m of the 250 m deep ice core collected at GV7, focusing on the interpretation of ion concentration records. We investigated the seasonality of the major ion markers in order to select the most reliable ones for annual layer-counting purposes. Non-sea-salt sulfate revealed to be the most suitable parameter to point out the annual layers. For the uppermost 38 m of the ice core, the dating was corroborated by the high-resolution δ18O record. Volcanic signatures were then used to finally constrain the dating by means of the major absolute temporal horizons provided by historically known volcanic eruptions. The obtained age scale allowed us to reconstruct the snow accumulation rate variability at GV7 over the last millennium.
2.1 Sampling site and fieldwork
The GV7 drilling site is on the Oates Coast, a coastal area of the East Antarctica (Fig. 1). The site was chosen for its relatively high snow accumulation rate (241± 13 mm w.e. yr−1 over the past 50 years), the limited post-depositional processes due to the reduced intensity of katabatic winds along the ice divide (Becagli et al., 2004; Frezzotti et al., 2007; Magand et al., 2004) and the excellent chemical and isotopic stratigraphies (Caiazzo et al., 2017; Frezzotti et al., 2007). Internal layers of strong radar reflectivity observed with ground-penetrating radar (GPR) are isochronous, and surveys along continuous profiles provide detailed information on the spatial variability of snow accumulation. Estimates of snow accumulation were calculated from GPR layer (dated to 1905±9 AD) during the 2001–2002 ITASE expedition from 150 km north of GV7 up to Talos Dome (Frezzotti et al., 2007). Spatial distribution of snow accumulation from the GPR layer upstream from GV7 site shows that internal layering and surface elevation are continuous and horizontal up to 10 km from the site, revealing low ice velocity 0.3 ± 0.01 m yr−1, no distortion of isochrones due to ice flow dynamics and very low snow accumulation spatial variability (less than 5 %, Frezzotti et al., 2007). An extensive chemical dataset covering 7 years of deposition on site obtained from the analysis of two snow pits is already available (Caiazzo et al., 2017), as well as a detailed reconstruction of the past volcanic history (Nardin et al., 2020).
During the 2013/14 Antarctic campaign, six shallow firn cores (ranging in length between 5 and 50 m) and two intermediate firn-ice cores (87 and 250 m deep) were retrieved. The 250 m deep core (named GV7(B) was used in this study. The ice core was retrieved using an electromechanical drill (Eclipse ice drill instrument).
The drilling started at 3 m from the snow surface and reached a depth of 250.2 m. Drilling fluid (Exxsol D40) was used from a depth of 80 m (close-off at 75 m) and added to the borehole with a tube. A stand of 4 m of fluid was found to be ideal to aid the drilling operation and to maintain an adequate quality of the core. No casing of the borehole was used to complete this shallow drilling. The Eclipse system has experienced problems during the drilling below 100 m depth; the brittleness of the ice, breaks in the core and the presence of drilling fluids in these cracks proved to be a problem in the decontamination of the deeper sections of the core. The presence of numerous breaks prevented us from analyzing the deeper part of the core and only the upper 194 m were analyzed.
2.2 Ice core analysis
The 60 cm long ice core sections (cut and logged directly in field) were shipped to the EUROCOLD laboratory of the University of Milano–Bicocca (Italy) where they were cut longitudinally and transversally and distributed among different research groups. The cm core strips for ionic content analysis were sealed in plastic bags, shipped frozen to the cold room of the Department of Chemistry of the University of Florence (Italy) and stored at −20∘ C until the moment of analysis. Conversely, both the bag (60 cm) and the high-resolution (4 cm) samples for the isotopic analysis were melted at room temperature and transferred in 25 mL HDPE bottles at the EUROCOLD laboratory and then sent to the Ca' Foscari University of Venice and the University of Parma for the isotopic measurements.
The strips for ionic content were manually decontaminated inside the cold room of the Department of Chemistry of the University of Florence (Italy) by scraping the outermost layer of ice (approximately 1 cm) using ceramic knives to remove external contamination (Candelone et al., 1994; Chisholm et al., 1995; Tao et al., 2001; Caiazzo et al., 2016).
All decontamination procedures were carried on under a class-100 laminar-flow hood and the subsamples (mean resolution of 4.5 cm) were stored inside pre-cleaned plastic vials and analyzed within a week to avoid external contamination. Some sections of the ice core were too badly damaged to be manually decontaminated, likely due to problems in the drilling operations and handling of the ice. In this case, the fractures were logged and the sample decontaminated just before the analysis by quickly submerging it three times (10 s for the first wash, then 5 s for the remaining two) in ultrapure water (18.2 MΩ 25 ∘C) in order to remove the outer layer of ice. Each subsample was melted at room temperature under a class-100 laminar-flow hood just before the analysis. The subsamples were then analyzed for ionic content using two ion chromatographs operating simultaneously: a Thermo Dionex ICS-1000 for the determination of the cations (Li+, Na+, , K+, Mg2+, Ca2+) and a Thermo Dionex DX-500 for anions (F−, formate, methanesulfonate (MS−, referred to in the text as MSA), Cl−, and ). Further details about the separation methods used and the daily calibration procedures for each ion chromatographic system are described in Caiazzo et al. (2016) and Morganti et al. (2007).
Samples for isotopic analysis did not require any decontamination procedure. Bag samples (60 cm) were analyzed for δ18O at the University of Parma, using a Thermo-Fisher Delta Plus isotope-ratio mass spectrometer (IRMS) coupled with a HDO automatic equilibration device, following the classical water–CO2 equilibration technique described by Epstein and Mayeda (1953). High-resolution samples (4 cm) were analyzed for δ18O at the Ca' Foscari University of Venice, using both the IRMS water–CO2 equilibration technique (Thermo-Fisher Delta Plus Advantage coupled with a HDO automatic equilibration device) and the cavity ring-down spectroscopy (CRDS) technique (Picarro L1102-I). The Thermo-Fisher Delta Plus and the Delta Plus advantage are both characterized by an analytical precision of 0.05 ‰ for δ18O, while the Picarro L1102-I has an analytical precision of 0.10 ‰ for δ18O. All measurements were calibrated using internal isotopic standards periodically calibrated against the certified International Atomic Energy Agency (IAEA) standards Vienna Standard Mean Ocean Water 2 (VSMOW2) and Standard Light Antarctic Precipitation 2 (SLAP2). All the isotopic data are reported in the SMOW-SLAP δ scale.
2.3 Major ion contributions
Chemical records of the ion markers were obtained by plotting the concentration (in µg L−1) against the mid-depth of the sample, logged during the decontamination procedure. The raw data set of ion concentration was kept as close as possible to the original, and only extremely high concentration points (i.e., spikes in the concentration of a single ion) were discarded and attributed to external contamination. Hence, all the points above the 99th percentile for all the ions taken into account for the dating procedure were removed; this was chosen as a fair compromise to keep high values of concentration due to particular events (e.g., volcanic eruptions) and at the same time to remove those due to possible contamination. The nss concentration was calculated by Eq. (1).
where 0.253 is the average ratio in seawater (Bowen, 1979), tot- and Na+ are the total measured concentration of the two ions, respectively. We assumed that the only contribution for sodium is the sea spray aerosol (Legrand and Delmas, 1984; Maupetit and Delmas, 1992). Both in inland (Röthlisberger et al., 2002) and coastal sites (Benassai et al., 2005; Nyamgerel et al., 2020), the crustal contribution of sodium is found to be very low or negligible compared to the marine one. We calculated the terrestrial and marine contributions for Na+ and Ca2+ in GV7(B) core by using a simple equation system (Eq. 2) (Becagli et al., 2012; Udisti et al., 2012):
where 0.562 and 0.038 represent the ratio in the crust (Bowen, 1979) and seawater (Nozaki, 1997), respectively. The non-sea-salt fraction of Na+ was found to be about 3 % of tot-Na+ on average, supporting our choice of using tot-Na+ instead of ss-Na+ for the calculation of nss fraction.
The nss was used to identify volcanic signatures in the GV7(B) ice core using already established methods (Castellano et al., 2004, 2005; Sigl et al., 2013; Traufetter et al., 2004) on Arctic and Antarctic ice cores. The biogenic background was calculated as the running average of the nss concentrations and its standard deviation (σ) was used to set the threshold over which a sample point was to be attributed to a volcanic eruption. Both 2σ and 3σ were used as thresholds added to the average biogenic background, described more in detail in Nardin et al. (2020).
2.4 Trace element analysis
The ice samples were analyzed with an inductively coupled plasma single-quadrupole mass spectrometer (ICP-qMS, Agilent 7500 series, USA) equipped with a quartz Scott spray chamber. A 120 s rinsing step with 2 % HNO3 (Suprapure, Romil, UK) was performed after each sample to limit any possible memory effect; the vials used for standard preparation were cleaned following the same procedure adopted for ice samples. Quantification of 209Bi, 205Tl and 238U was performed using external calibration curves with acidified standards (2 % HNO3, Suprapure, Romil, UK) from dilution of certified IMS-102 multi-elemental standard (10 ppm ±1 %, Ultra Scientific). The resulting external calibration curves for the three elements always showed regression coefficients higher than 0.999. The limit of detection (LoD) for Tl and U was 0.001 µg L−1, while for Bi it was 0.004 µg L−1, calculated as 3 times the standard deviation of the blank.
2.5 Snow accumulation rate and trend analysis
On the basis of the achieved dating, the annual snow accumulation rate at the site was calculated in millimeters of water equivalent per year (mm w.e. yr−1) by using the density of the core sections and a correction of the layer thickness through a thinning function. The density (in g cm−3; see Fig. S3) was evaluated by weighting each section of the core directly in the field after logging. The effects of layer thinning due to vertical strain rate were accounted for using a linear least-squares fitting model (Dansgaard and Johnsen, 1969) considering a constant vertical strain rate on the upper 200 m and an ice thickness of 1530 m for the GV7 site. We did not consider any flow-induced layer thinning since: (1) GV7 is located on the ice divide extending from the Oates Coast to Talos Dome; (2) the ice velocity at this site is very low (max. 0.3 m yr−1) (Frezzotti et al., 2007); (3) the ice thickness upstream GV7 is nearly constant, and thus we expect a rather constant thinning function.
Trend analysis of the accumulation rate variability was based on the calculation of breakpoints between periods with significantly different trends following Tomé and Miranda (2004). The methodology consists of a least-squares approach to compute the best continuous set of straight lines that fit a given time series, subject to a number of constraints on the minimum distance between breakpoints and, optionally, on the minimum trend change at each breakpoint. We chose a period of 150 years as the minimum distance to identify trend at centennial scale. The choice is not objective but complies with the high computational request for too-small minimum distance and the risk of non-significance for too-large minimum distance. Due to possible noise connected to local spatial variability (Frezzotti et al., 2007) at the three sites (Talos Dome, GV7 and Law Dome), we applied the procedure to a 7-year smoothed average in order to make all the cores comparable among them.
The relatively high snow accumulation rate at the site (well above 200 mm w.e. yr−1, Frezzotti et al., 2007) allows for accurate dating of the core by counting successive snow layers, identifiable by markers having seasonal pattern and/or the identification of specific dated event, mainly as volcanic eruptions identified in the records as spikes of nss statistically higher than the biogenic background (Nardin et al., 2020).
3.1 Ice core dating procedure – upper section
Previous work on snow pit dating at the GV7 site (Caiazzo et al., 2017) revealed that nss and δ18O records show the clearest seasonal pattern with in phase summer maxima. Therefore, for the uppermost section of the core (38.27 m) for which the δ18O high-resolution record was available, accurate dating was obtained using nss and δ18O records (Fig. 2). The seasonal maxima in the nss record were confirmed by corresponding maxima in the δ18O profile. Minor discrepancies between the two profiles were to be expected and are probably due to the slightly different depth resolution of the two series (4.5 and 4 cm on average for nss and δ18O, respectively). The reliability of this dating was further supported when compared with the volcanic signatures identified in the nss and the trace element profiles (Fig. 2). The 1992 Pinatubo sulfate deposition (10.9–11.4 m depth) and 1964 Agung volcanic sulfate deposition (21.8–22.4 m) were used to constrain the dating.
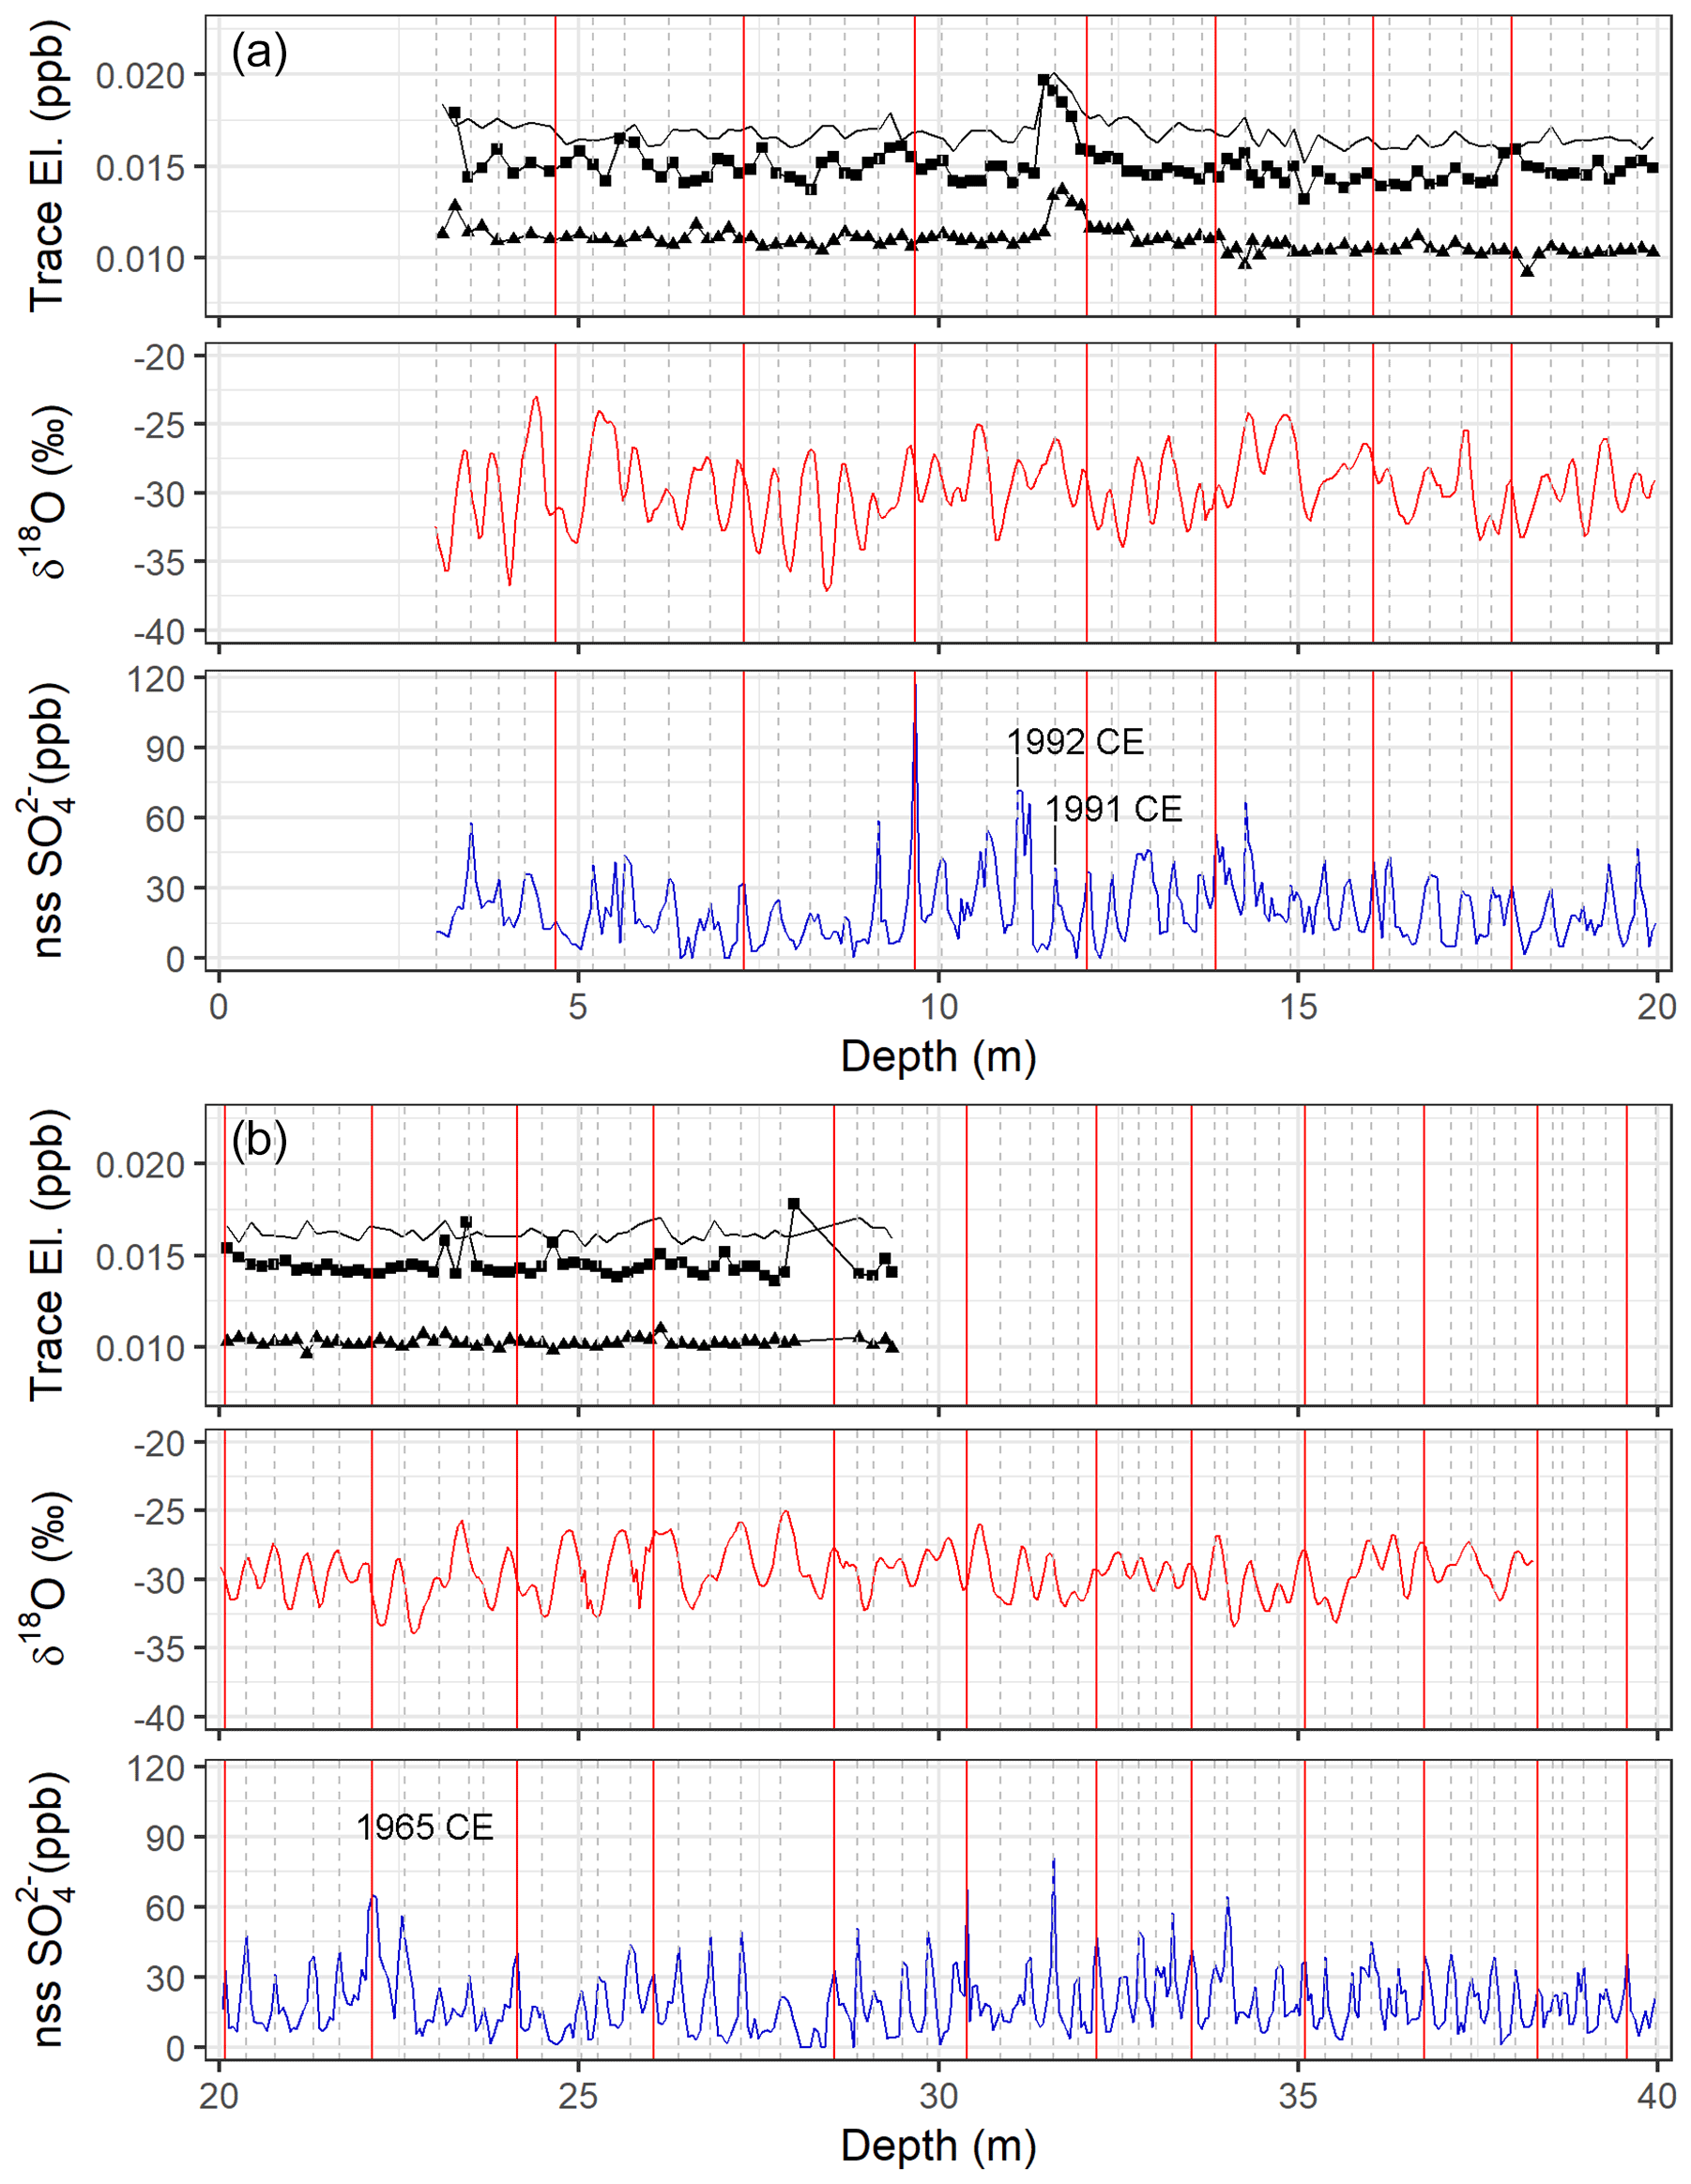
Figure 2Concentration profiles of trace elements (205Tl, solid black line, 209Bi, black squares, 238U, black triangles), δ18O (red line) and nss (blue line) along the uppermost 20 m (a) and 20–40 m intervals (b) of the GV7 (B) core. Vertical dashed gray lines and red lines mark annual and 5-year intervals, respectively. The Agung and Pinatubo/Cerro Hudson volcanic signatures are also highlighted in the nss profile with their deposition years.
As discussed in a previous study (Nardin et al., 2020), neither of these volcanic eruptions shows a prominent signal in the nss profile, and trace element records were used to support the 1992 CE tie point identification.
Trace element deposition in polar ice caps is mainly associated with dust deposition. Evidence for anthropogenic contribution in the global trace element deposition is well documented, such as the increase in lead depositional flux in connection with the introduction of lead containing gasoline. Specific trace elements such as Tl and Bi have been proposed to be enriched in deposition derived from volcanic eruptions (Candelone et al., 1995; Kellerhals et al., 2010). In fact, Bi, Tl and U show an increased concentration between 11.03 and 12.90 m (205Tl), 11.33 and 12.62 m (209Bi) and 11.03 and 13.33 m depth (238U; see Fig. 2), corresponding to the 1989–1992 CE time period, according to the annual layer-counting dating. Bi, Tl and U concentration peaks seem to be not perfectly coeval with the Pinatubo/Cerro Hudson signature in the nss-sulfate profile, being recorded at a slightly higher depth with respect to nss. This small time gap can be explained considering that dust (and therefore trace element) deposition often occurs earlier than sulfate, as reported by Hwang et al. (2019) for the same volcanic eruption recorded in snow pits from Dome Fuji area. No clear evidence of a statistically significant increment in the 205Tl, 209Bi or 238U levels was found in correspondence with the 1963 Agung eruption. For this section of the core, only the nss signal was used to constrain the dating. As a conclusion, the uppermost section of the core (3.00 to 38.27 m) was dated and was found to cover the time period (2009–1920 CE). The uncertainty of this dating is discussed further below.
3.2 Ice core dating procedure – lower section
Due to the lack of high-resolution data for δ18O for the deeper part of the core, only ion signatures could be used for the dating of the rest of the core. In order to highlight the seasonal character of each ion and to assess their reliability for dating purposes, we considered the concentration profile of each ion throughout the 89 years already dated in the above section. Each year was equally divided in four parts corresponding to the Antarctic seasons and roughly to the time periods January–March, April–June, July–September and October–December, and bin plots were produced (Fig. 3). In this way, we were able to point out the markers showing a clear seasonal pattern by using bin plots (Fig. 3). When comparing the profile of each ion to the average calculated in the considered time interval (dashed blue line in Fig. 3), all the species showed a maximum throughout the year. Anyway, as shown in Fig. 3, the most pronounced seasonal pattern was shown by nss with a high occurrence of low concentration points during winter months and a high occurrence of high concentration points at the beginning of the year. Typical sea-salt ions showed winter maxima, and especially Mg2+ (Fig. 3c), with generally higher values of concentration (up to 3.5 µg L−1 compared to an average of 1.7 µg L−1), but in general the most populated bins in the winter and summer periods showed similar concentrations, suggesting a lack of clear seasonality.
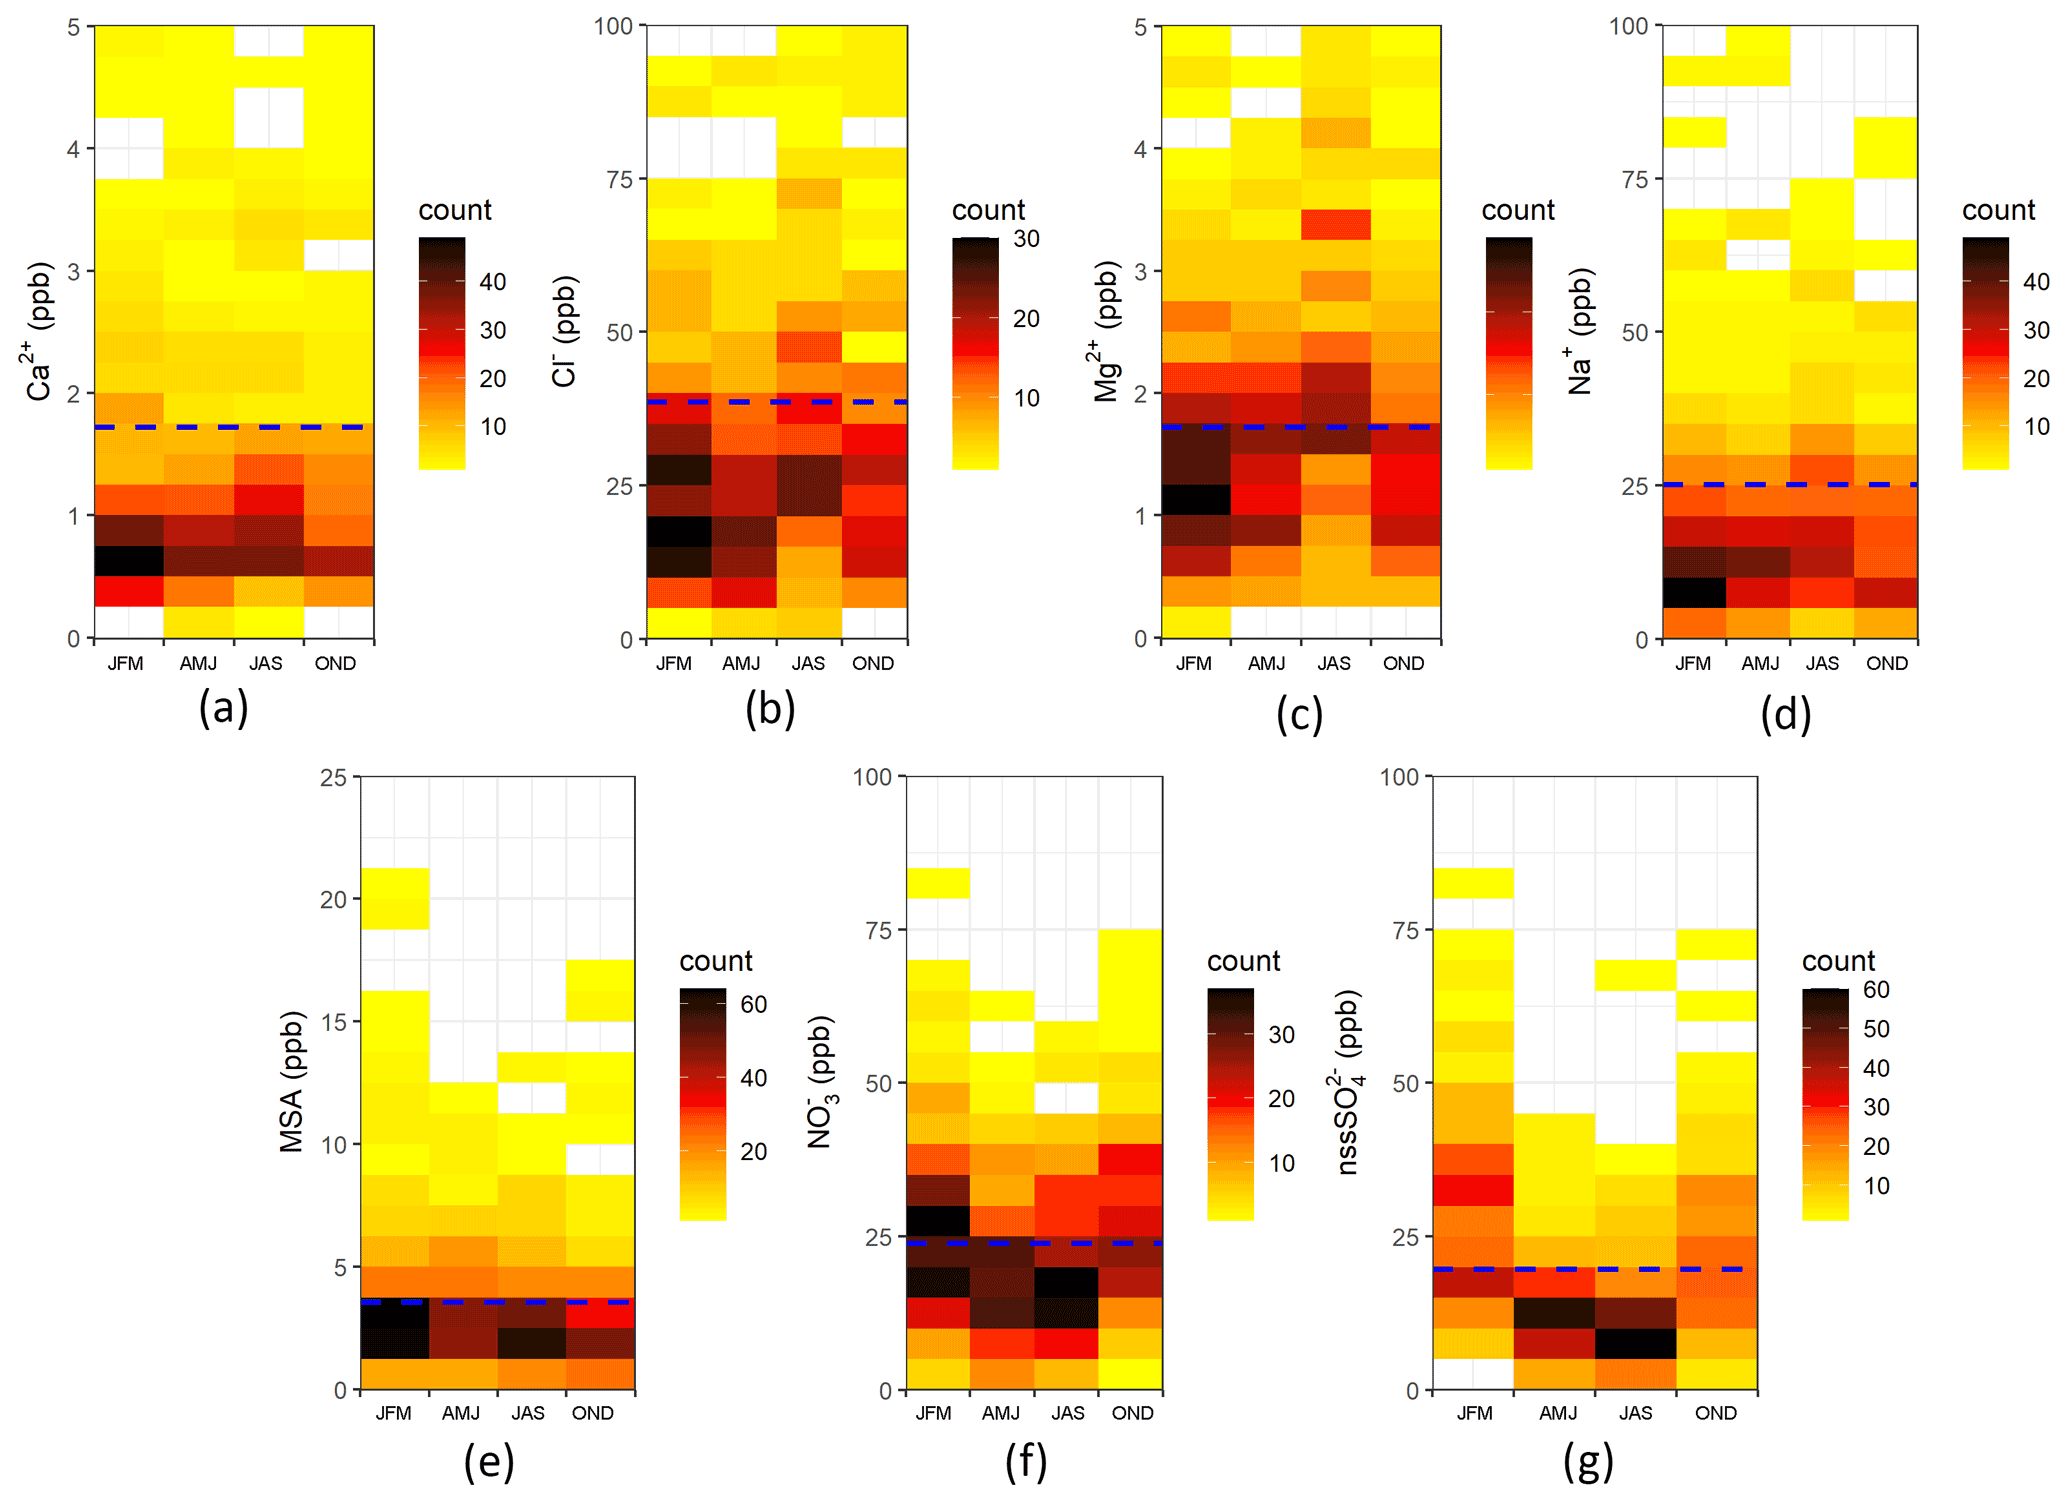
Figure 3Seasonal variability of Ca2+ (a), Cl− (b), Mg2+ (c), Na+ (d), MSA (e), nss (f) and (g) concentrations in the GV7(B) ice core. Concentration bins are 3 “months” in width (JFM, AMJ, JAS, OND) and 5 ppb in height except for MSA levels (1 ppb) and calcium and magnesium (0.25 ppb). Dashed blue lines show the average concentration of each ion in the investigated time interval.
These considerations only cover a small section of the core (approximately the 20 % of its length), but as shown in Fig. S1, neither Na+ nor Mg2+ concentration profiles seem to show a clear annual pattern at relatively high depths and not always a maximum in the nss concentration coinciding with a minimum in the other two ions concentration.
Based on the seasonality of the ionic markers (here highlighted by the bin plots), we tested several dating procedures for the GV7(B) ice core reported in the literature. We tried both single-parameter and multiparametric approaches as proposed, for instance, by Herron and Langway (1979), Udisti (1996) and Winski et al. (2019), but the nss profile solely showed the clearest seasonal signal along the whole core (Figs. S1 and S2). The dating of the core was therefore carried out with a combination of annual layer counting and the identification of volcanic signatures, both from nss profile. The known past volcanic eruptions found in other ice cores (Sigl et al., 2013, 2015, 2016; Zielinski et al., 1996) as well as a tephra layer (Narcisi et al., 2001, 2012; Narcisi and Petit, 2021) and their assigned date are reported in Table 1. The complete record of nss is reported in Fig. 4 and the final age-to-depth relationship is shown in Fig. 5. When performing annual layer counting, a rigorous evaluation of the uncertainty of the dating is difficult to be accomplished and it is usually performed by the algorithm used to identify each annual layer (Sigl et al., 2016; Winski et al., 2019) and/or by considering the uncertainty of the dating of different ice cores used as reference (Winski et al., 2019). In this work, we estimated the uncertainty of the annual layer counting as the sum of the layer uncertainties highlighted in the dating procedure, estimated to be 0.5±0.5 years (Rasmussen et al., 2006). The uncertainty was estimated between the two consecutive known volcanic signatures in the core, dated with an uncertainty of ±1 year from the recorded eruption due to the time needed to reach Antarctica.
Table 1Past known volcanic eruptions used in the dating of the core.
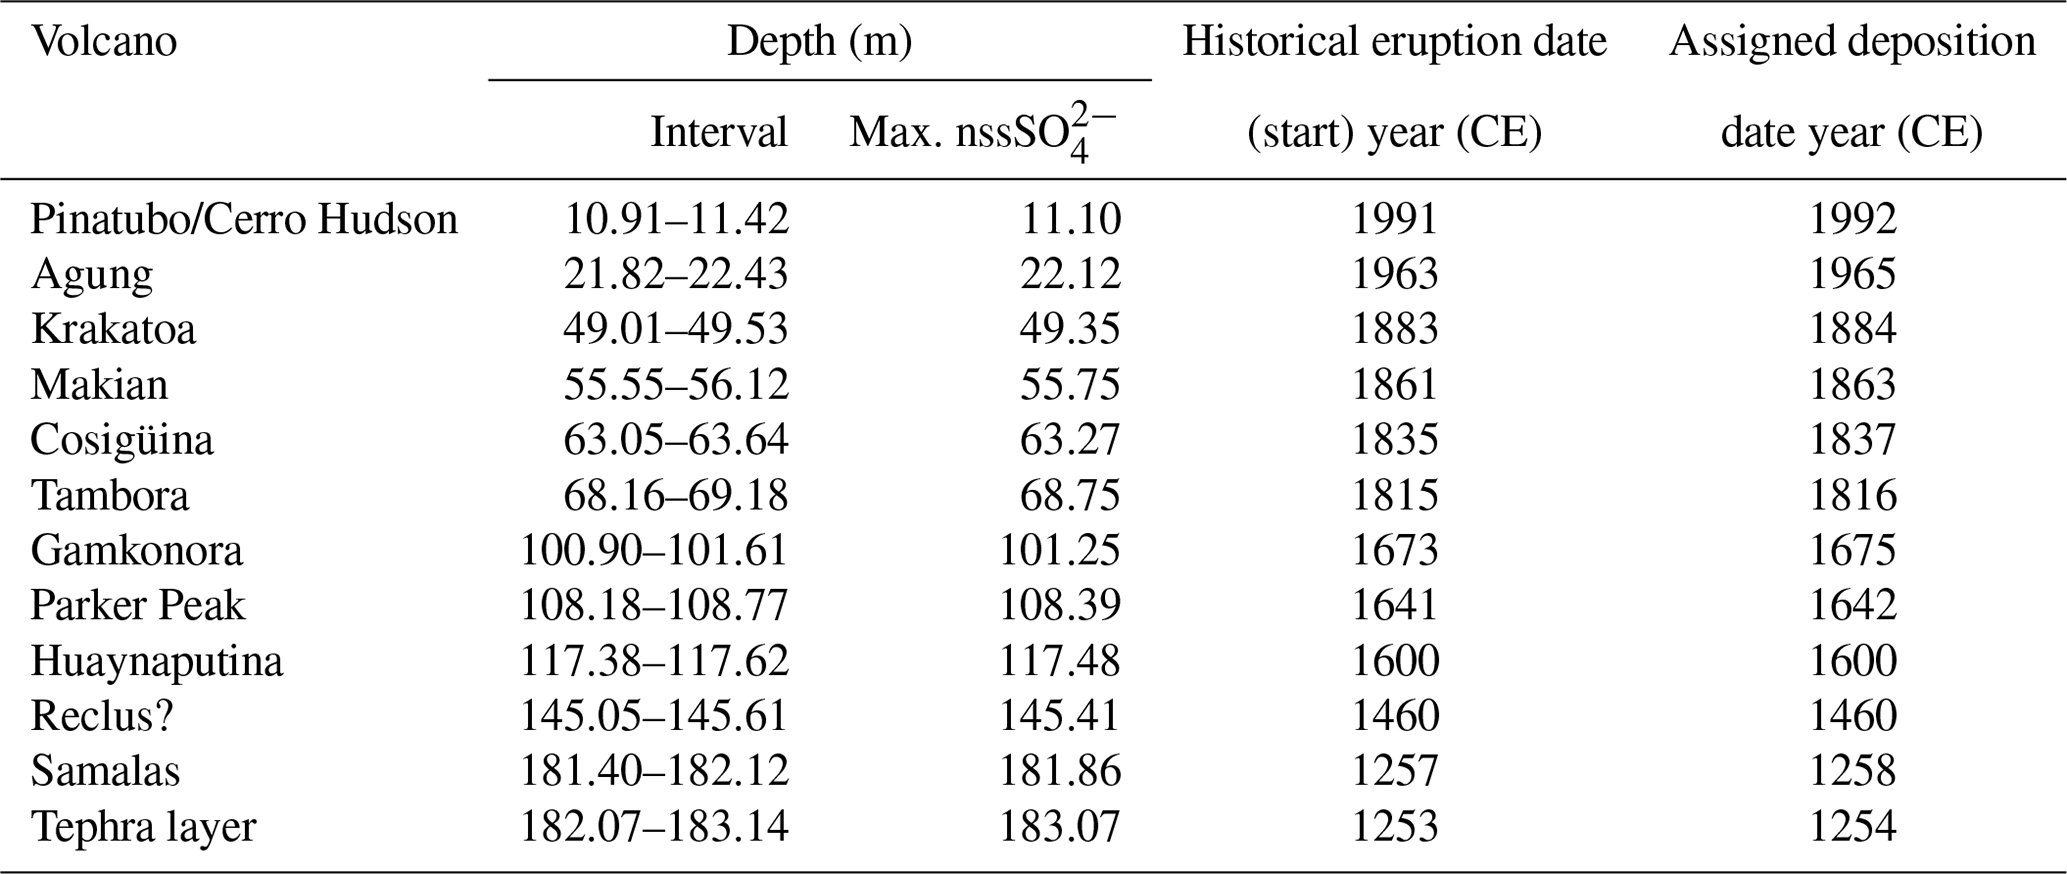
The same level of uncertainty was assigned to the missing sections of the core, where the number of years present was estimated using the average ratio between the number of years and related depth interval calculated in 10-year time span before and after the break. Uncertainty levels are reported in Table 2; the relatively higher number of uncertain layers in the lower section of the core is due to missing ice (whose percentage is reported in Table 2 as well) that led to a non-continuous profile and to a lower resolution of the core. There are fewer major eruptions in this section of the core (Table 1) and as they are further apart, the uncertainty becomes larger.
Table 2Uncertainty of the GV7(B) ice core dating in the depth intervals comprised between two consecutive volcanic eruptions. Missing sections of the core, as percentages, are also reported.

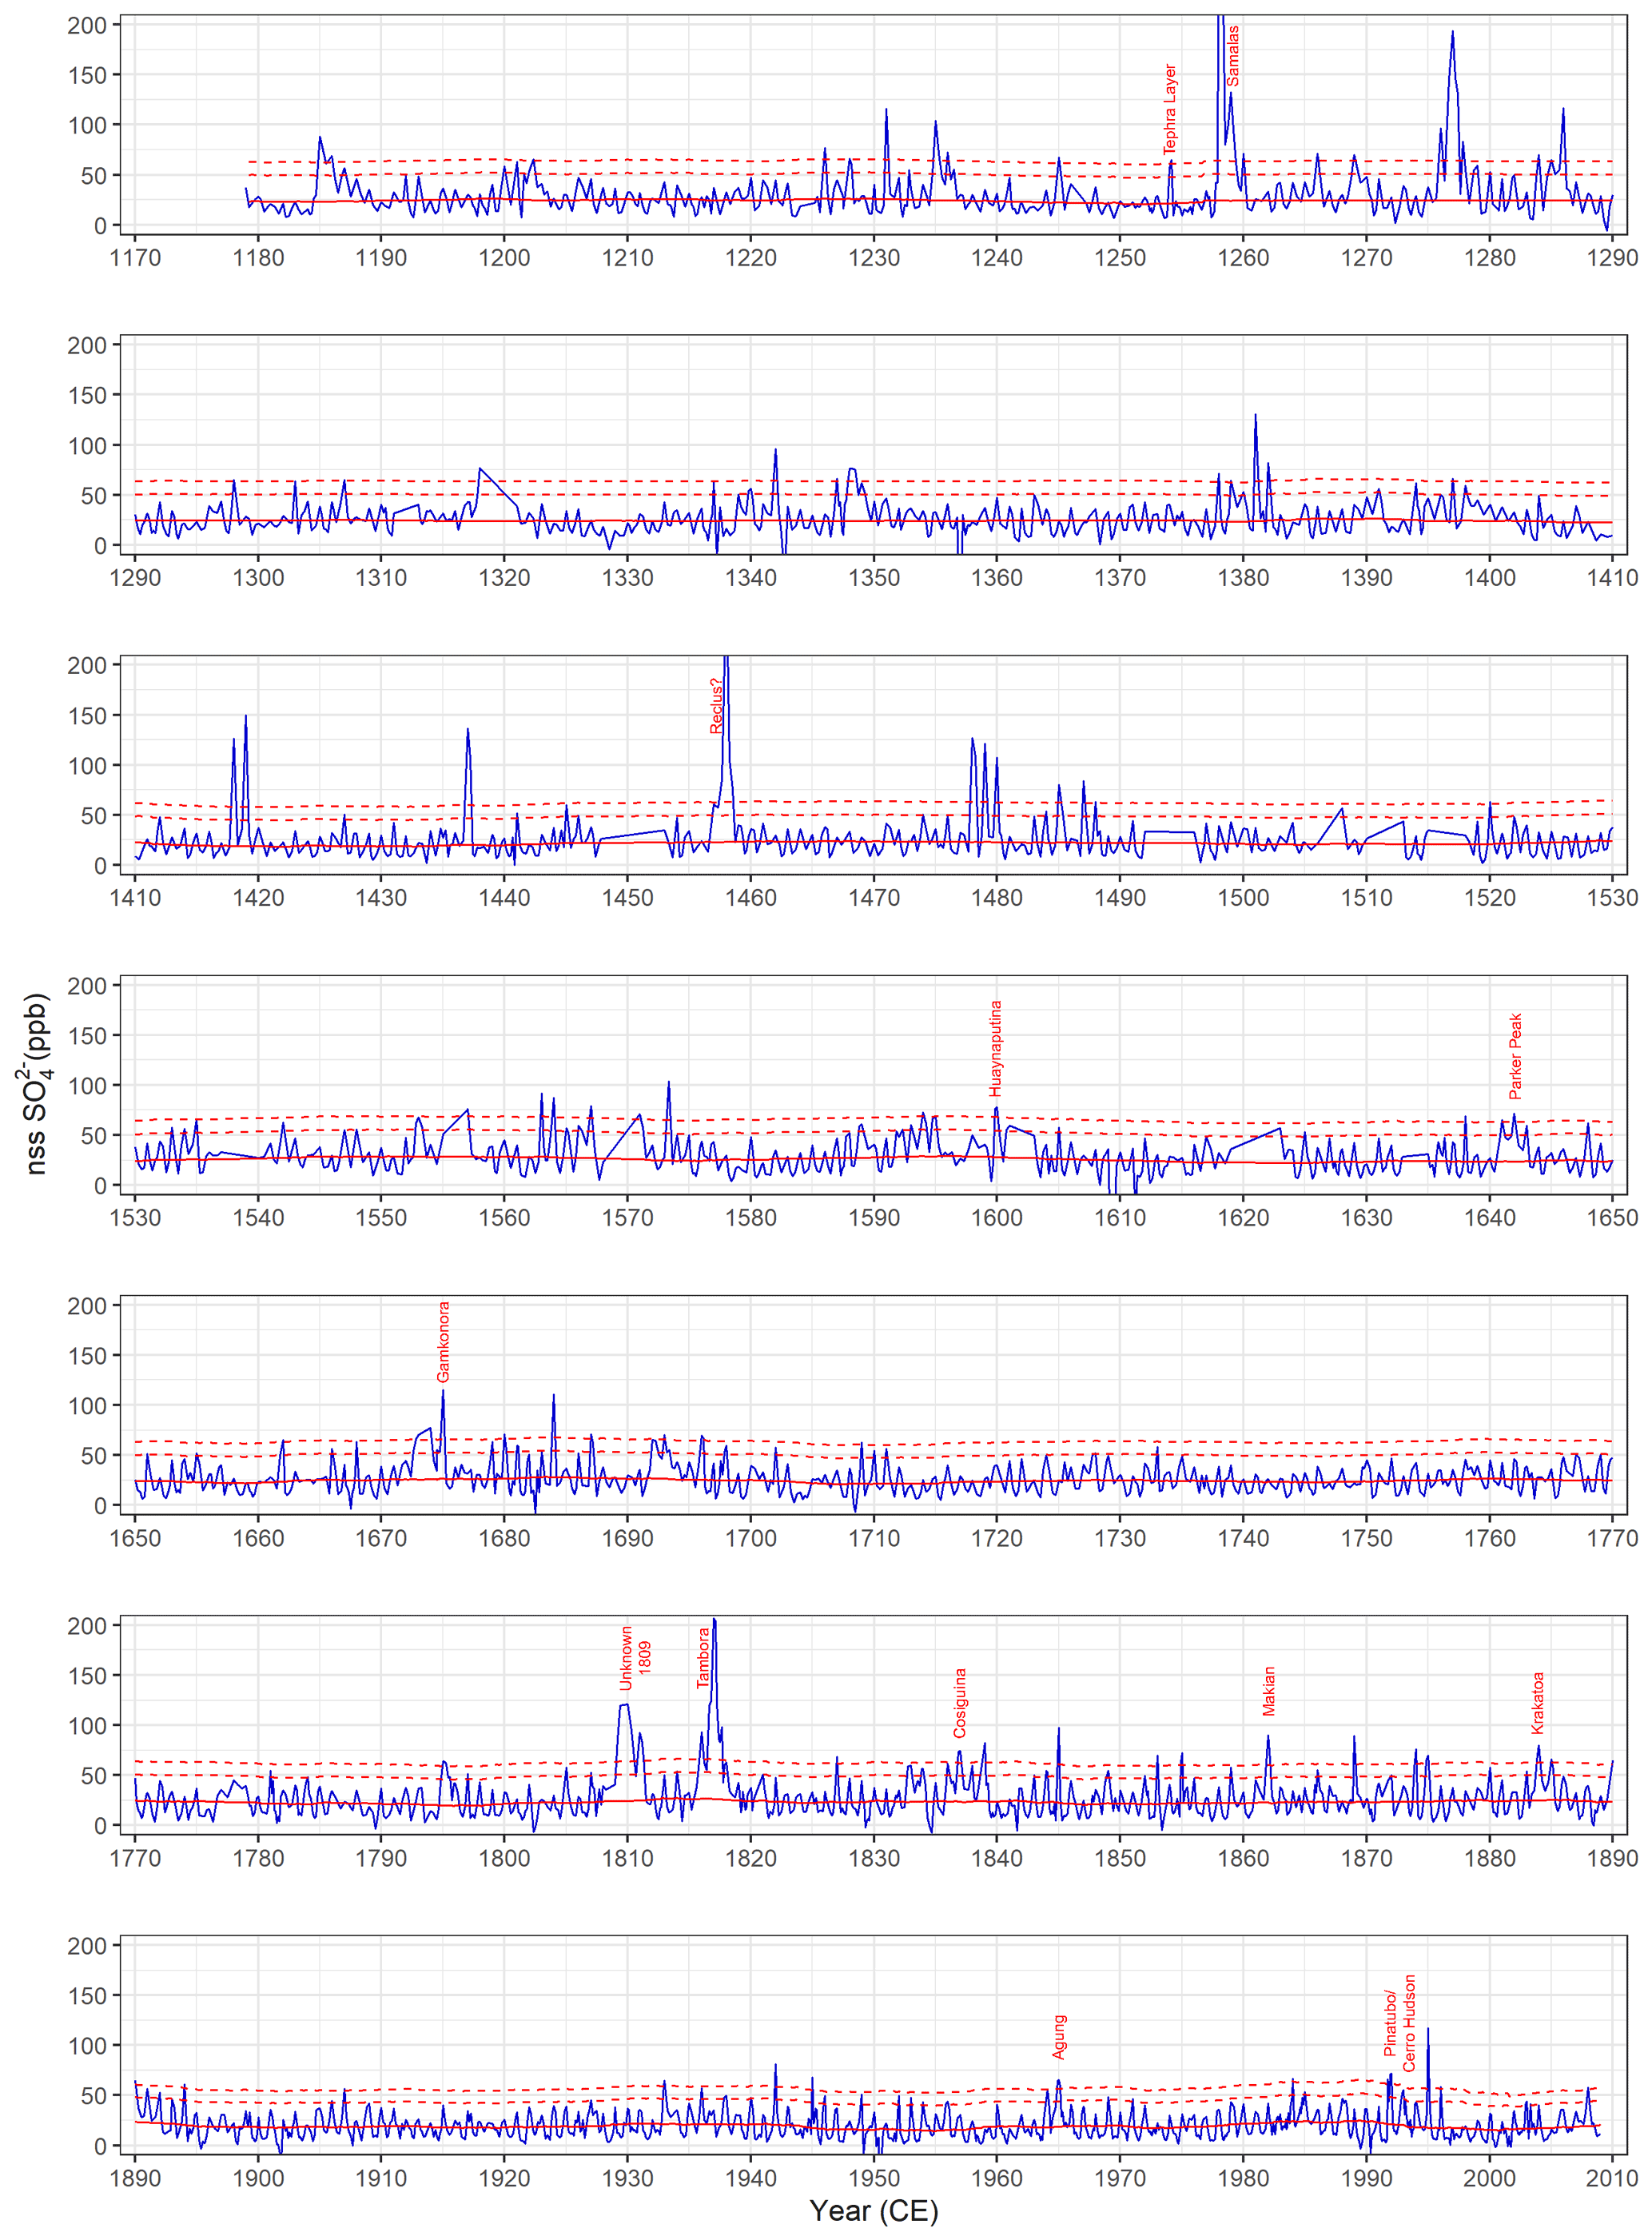
Figure 4GV7(B) nss profile plotted on the age scale produced in this paper. Biogenic background (solid red) and thresholds used to identify the volcanic signatures (2σ and 3σ, dashed red) are also reported.

Figure 5Age–depth relationship for the GV7(B) ice core. Temporal horizons used as constraints in the dating procedure are highlighted with red circles.
3.3 Mean snow accumulation rate evaluation
A mean accumulation rate of 242±71 mm w.e. yr−1 for the period 2008–2013 CE was found at the same site by Caiazzo et al. (2017). This value is very close to the accumulation rate over the previous 35 years made by Magand et al. (2004) using atomic bomb horizon markers (241±13 mm w.e. yr−1 from 1965 to 2000 CE). Frezzotti et al. (2007) reported an accumulation of 252±104 mm w.e. yr−1 for the period 2001–2004 CE using snow stake farm measurements. For a longer time period (1854–2004 CE), a mean accumulation of 237 mm w.e. yr−1 was assessed using atomic bomb markers and nss spikes from known volcanic events as age markers (Frezzotti et al, 2007).
The mean GV7(B) accumulation rates here calculated for the 1965–2000 CE and 1854–2004 CE time intervals (242±57 mm w.e. yr−1 and 233±64 mm w.e. yr−1, respectively) are in good agreement with those found in the snow pits, stake measurements and shallow ice cores previously reported. Considering the full ice core record (195 m), covering the 1179–2009 CE time interval, the mean snow accumulation resulted to be 205±63 mm w.e. yr−1, lower than the one previously measured for the last centuries.
The comparison between GV7(B) and the GV7 ITASE records (Fig. 6) highlights a similar variability in annual snow accumulation especially in the period ranging from 1900 to 2001 CE where the linear correlation between the two cores is high and significant (R=0.42, p<0.0001). On the other hand, if we consider also part of the 18th century, the correlation decreases (R=0.3 p<0.0002) due to a few inconsistencies between 1880 and 1850 CE, probably caused by the uncertainty of the two different age scales.
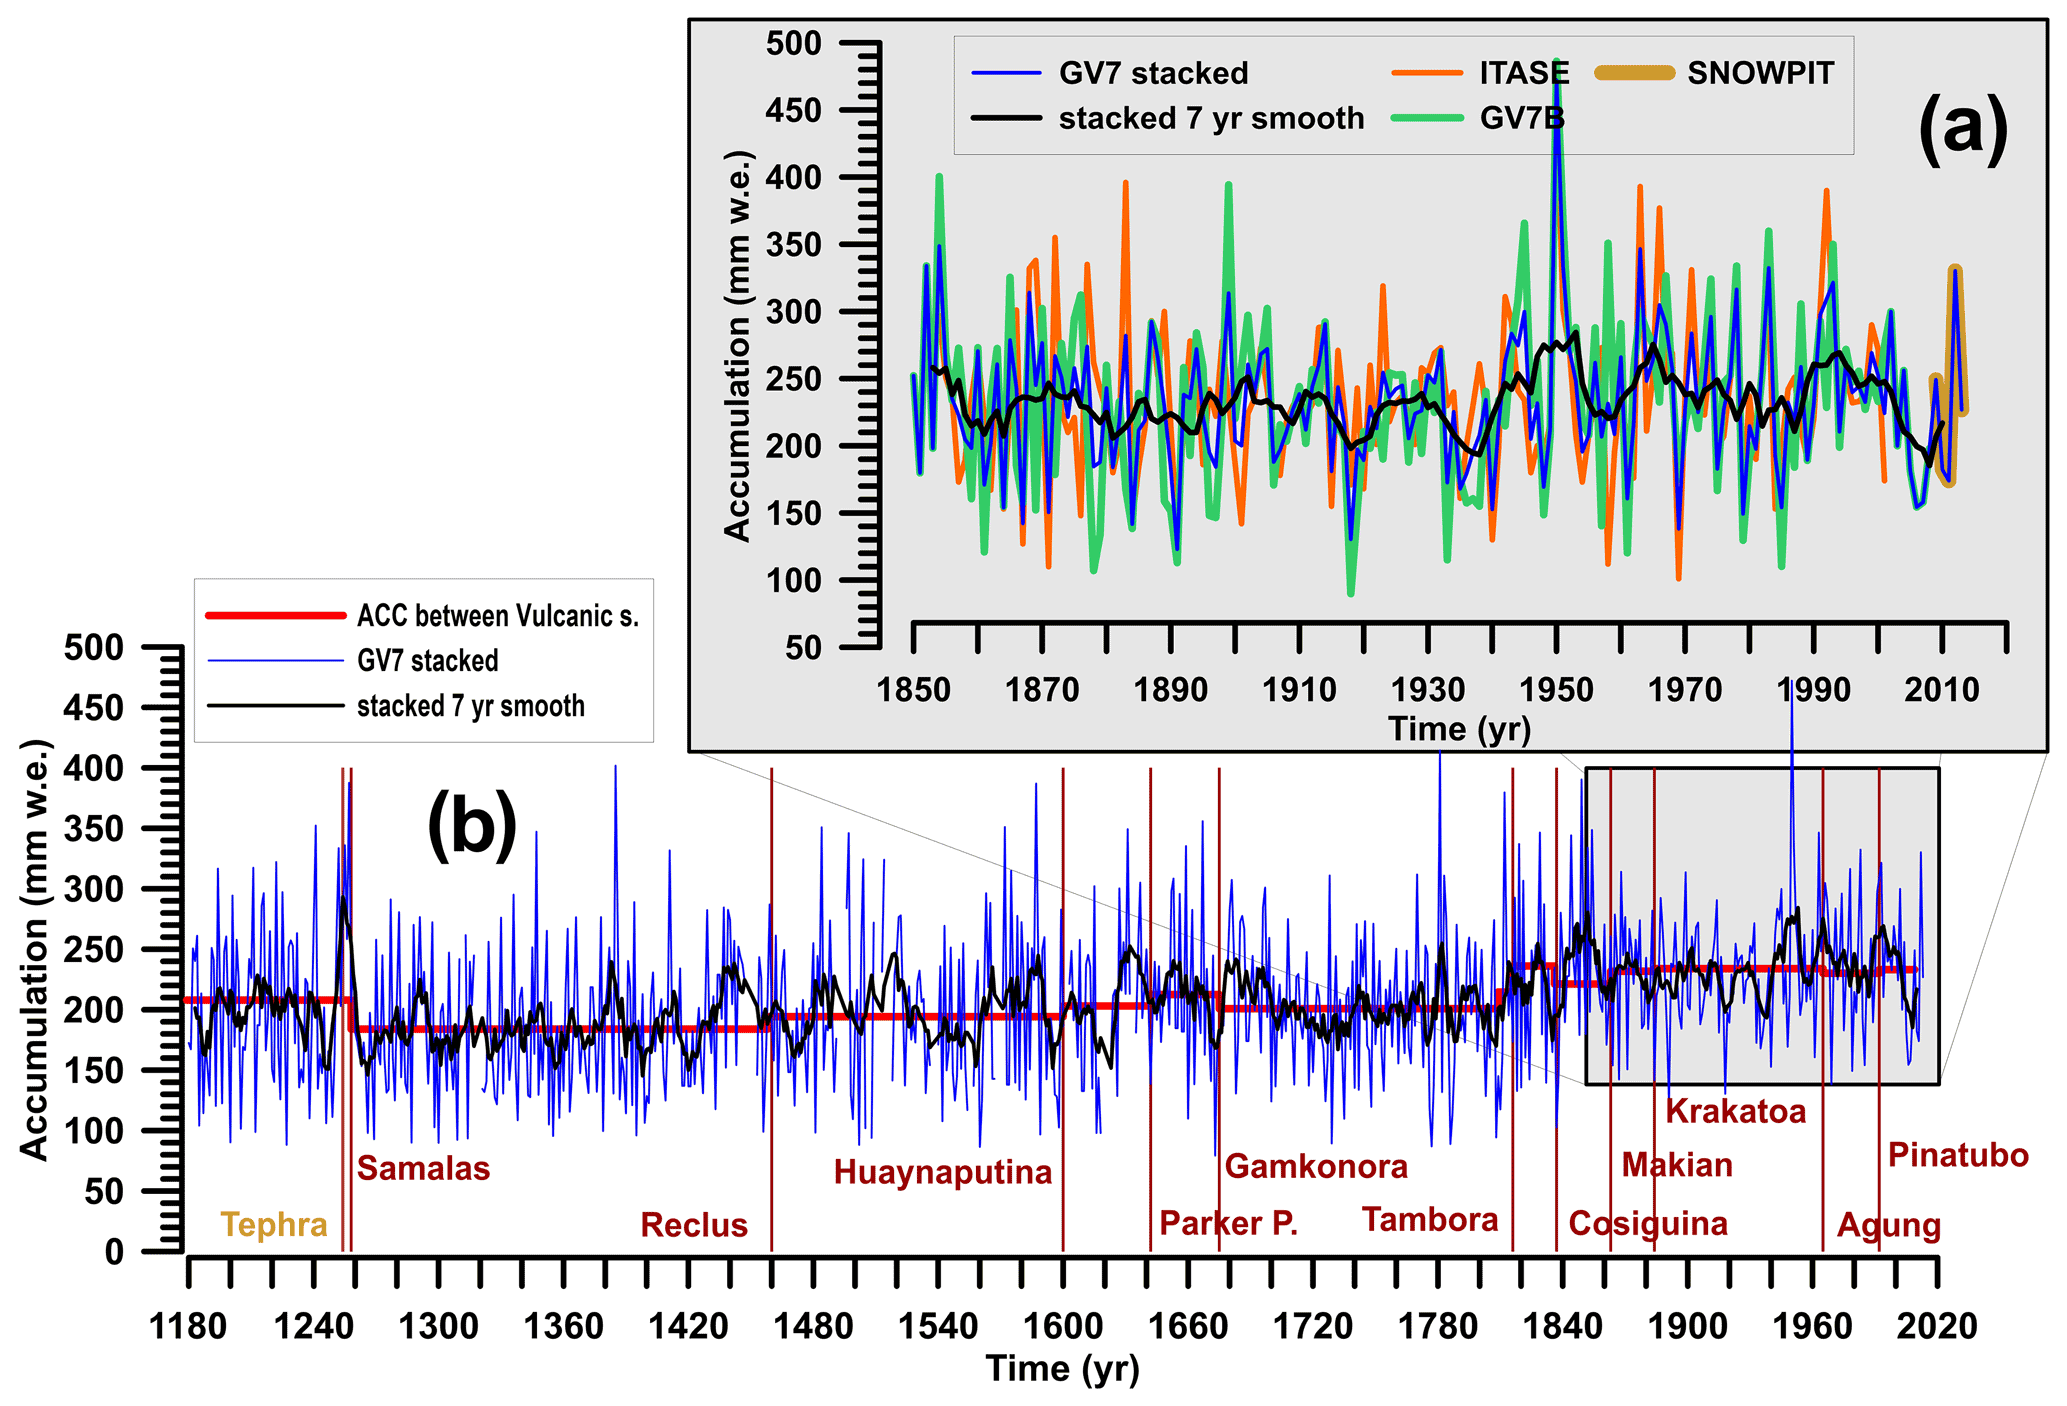
Figure 6(a) Time series from 1840 to 2020 CE of the GV7 snow pit (2008–2013 CE, gold line), the ITASE core (1849–2001 CE, orange line) and the GV7(B) core (1179–2009 CE, green line). Blue and black lines highlight the stacked record, obtained by integrating the snow pit, ITASE and GV7(B) core records, and its smoothing at 7 years, respectively. (b) GV7 stacked time record (1179–2013 CE) with a 7-year smoothing average (black line). Vertical red bars highlight volcanic eruption horizons, and the red line shows the average accumulation rate between different volcanic events.
In order to remove the possible noise due to post-depositional processes (e.g., sastrugi) (Frezzotti et al., 2007) and to reduce the error due to the underestimation (overestimation) of the yearly accumulation rate, a stacked record was obtained by combining the available records: a snow pit covering the 2008–2013 CE time interval; GV7(B) core (1079–2009 CE), stake measurements (2001–2003 CE) and GV7 ITASE core (1849–2001 CE). The new stacked record (Fig. 6) can give valuable information on snow accumulation trend in the Antarctic region through comparison with other ice cores drilled in the same sector. In the East Antarctic region, facing the Southern Indian Ocean, only three ice core records of snow accumulation cover a period longer than three centuries: GV7 stacked (1179–2013 CE, this paper), Law Dome (−22–2012 CE; Roberts et al., 2015) and Talos Dome (1217–2010 CE; Stenni et al., 2001; Thomas et al., 2017). Other cores (D66, GV5, GV2, HN) have been drilled but their records cover less than 300 years (Frezzotti et al., 2013; Thomas et al., 2017). Law Dome (DSS) is a site close to the Southern Ocean (100 km from the shoreline) at about 1400 m a.s.l. with a mean accumulation rate of 740 mm w.e. yr−1 over the last two millennia (van Ommen et al., 2004). We must take into account that the DSS site is about 1900 km west of GV7. Talos Dome is located at 2316 m a.s.l. and 250 km south inland of GV7, with a long-term accumulation rate of 80 mm w.e. yr−1 over the last 800 years (Stenni et al., 2001). The comparative analysis of the last 800 years of these three records shows a significant trend in the accumulation rate record at GV7 and Law Dome (Table 3), with a high increase in the accumulation rate at GV7 and a slight increase at Law Dome (47 and 20 mm w.e., ∼23 % and ∼ 2 % of the mean accumulation over 800 years, respectively). On the other hand, no significant trend at Talos Dome can be pointed out (Table 3). Frezzotti et al. (2013) analyzed 67 records from the entire Antarctic continent over the last 800 years to assess the temporal variability of accumulation rates. The temporal and spatial variability of the records highlights that snow accumulation changes over most of Antarctica are statistically negligible and do not exhibit a clear long-term trend. However, an increase in accumulation rate higher than 10 % was observed in coastal and slope regions, in agreement with our findings for the GV7 site. The breaking point analysis (Fig. 7) showed that each site is characterized by multi-centennial time intervals with different trends. GV7 shows a low accumulation rate from the beginning of record (1200 CE) to the middle of the 14th century; a similar decrease had been already observed at Law Dome (Roberts et al., 2015) and Talos Dome (Stenni et al., 2001) (Fig. 7). The GV7 accumulation rate record shows an increase from the middle of the 18th century up to now; the same trend can be observed for Talos Dome (Table 3), whereas at Law Dome such an increase starts about a century later. Previous studies regarding the Talos Dome–GV7 area pointed out a century-scale variability with a slight increase (of a few percent) in accumulation rates over the last two centuries, particularly since the 1960s, compared with the period 1816–1965 CE (Frezzotti et al., 2007, 2013). At GV7, the observed increase in accumulation during the last 250 years is greater than the observed range for the previous 600 years (Fig. 7). For Talos Dome, Stenni et al. (2001) pointed out a decrease during part of the Little Ice Age, 1217–1996 CE, followed by an increase of about 11 % in accumulation during the 20th century. On the other hand, Roberts et al. (2015) found out that the 2000-year (22 BCE to 2012 CE) record at Law Dome showed no long-term trend in snow accumulation rates, although several anomalous periods of accumulation rate can be spotted in the record. The accumulation variability observed at Law Dome was associated with both the El Niño–Southern Oscillation (ENSO) and Interdecadal Pacific Oscillation (IPO) (Roberts et al., 2015; Vance et al., 2015), which influence the meridional component of the large-scale circulation (van Ommen and Morgan, 2010; Roberts et al., 2015; Vance et al., 2015). Thomas et al. (2017), using 79 annually resolved snow accumulation records, showed that snow accumulation for the entire Antarctic continent increased since 1800, and the annual snow accumulation during the most recent decade (2001–2010) is higher than the annual average at the start of the 19th century. The Antarctic Peninsula is the only region where both of the most recent 50- and 100-year trends are larger than the observed range for the past 300 years. This result is coherent with the trend increase highlighted in this paper by breaking point analysis applied to the GV7 stacked record. Although in different periods some common trends are evident in the records, there is not a clear agreement among all the accumulation records. This can be explained by the different origin and atmospheric pathways of the air masses responsible of the precipitation at the three sites, despite being located in the same macro region of East Antarctica. Indeed, precipitation over the GV7 area is related to storms coming from the southern Indian Ocean (Caiazzo et al., 2017) as for Law Dome, whereas the precipitation at Talos Dome is coming only for 50 % from the southern Indian Ocean and the remainder is from the Ross Sea (Sodemann and Stohl, 2009; Scarchilli et al., 2011).
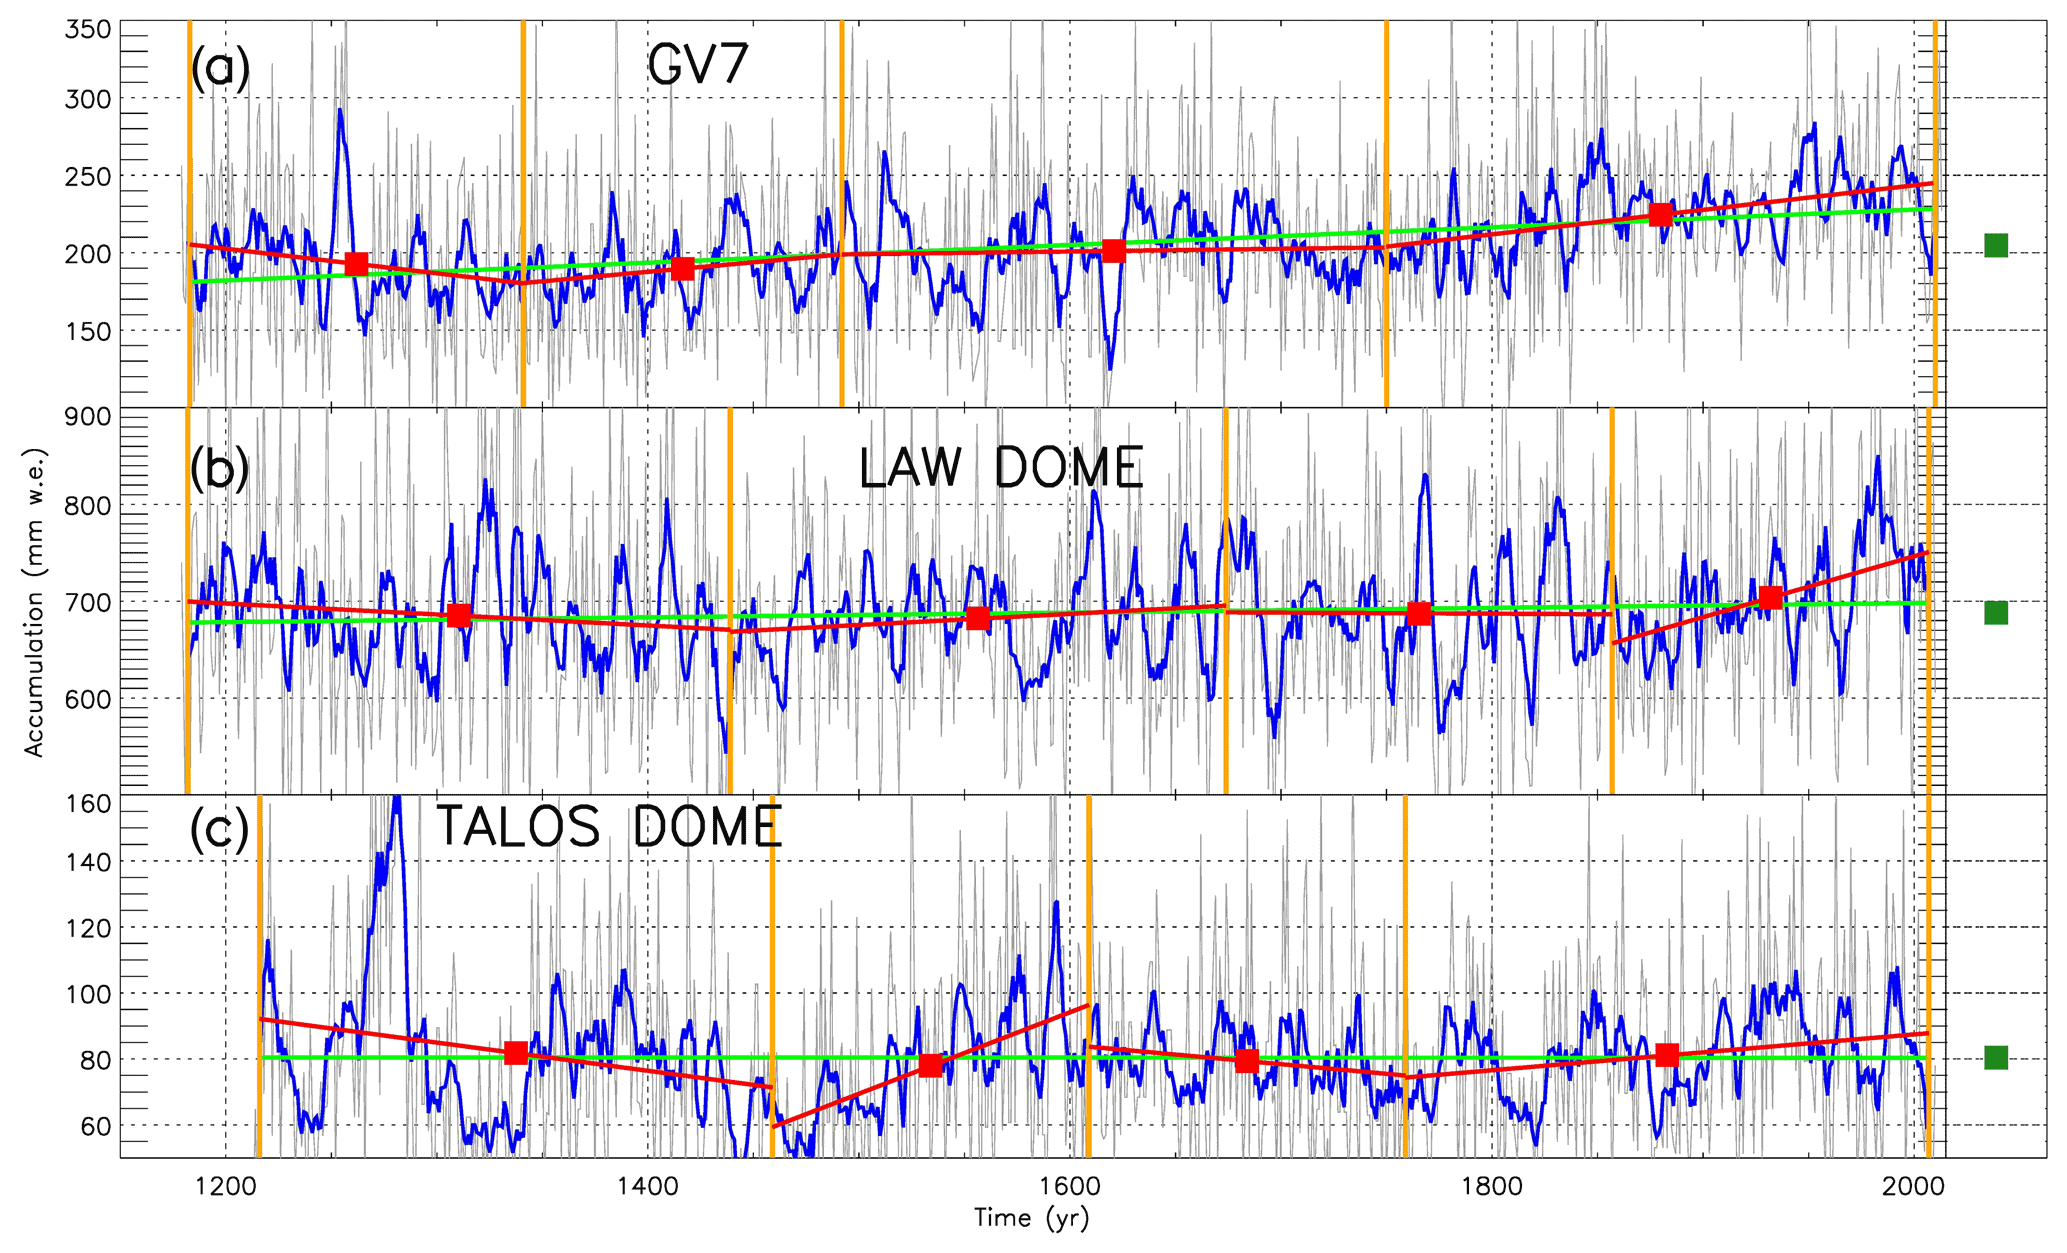
Figure 7(a) GV7 stacked record (gray line) with its 7-year smoothing average (blue line); green line represents trend for the 1179–2013 CE record. Vertical yellow bars show breaking points (1183, 1341, 1492, 1750 and 2010 CE) calculated following Tomé and Miranda (2004). Red lines and filled squares show partial trends and mean accumulation (with standard deviation error bars) for each subperiod defined by breaking points. The green-filled square with the error bar highlights mean accumulation at the site and its standard deviation, respectively, for the whole period (1179–2013 CE). (b) Same as panel (a) but for Law Dome ice core for the period 1179–2013 CE with breaking points at 1182, 1439, 1674, 1857 and 2007 CE. (c) Same as panel (a) but for Talos Dome ice core for the period 1216–2010 CE with breaking points at 1216, 1459, 1609, 1759 and 2007 CE.
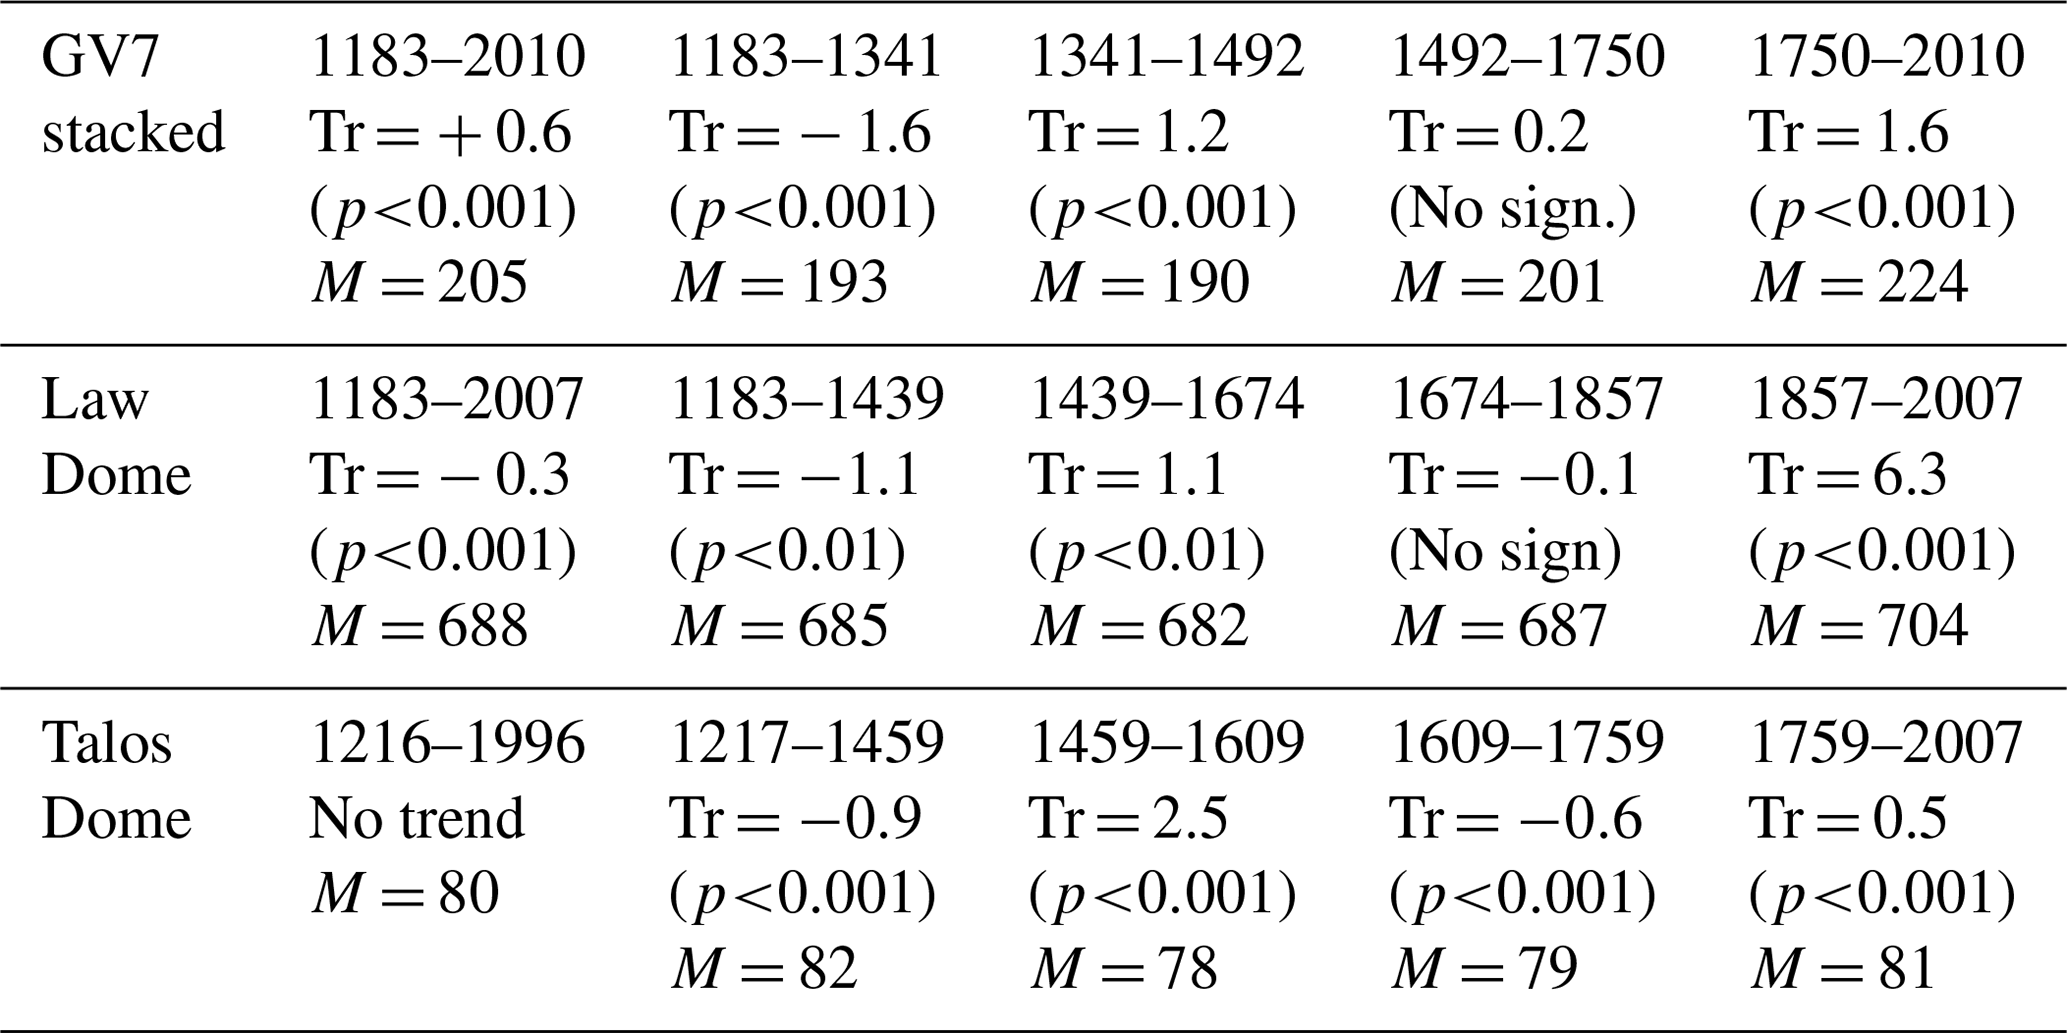
Table 3Values of trend (Tr, mm w.e. decade−1), associated significance (p value) and mean accumulation rate (M, mm w.e. yr−1) for GV7 stacked, Law Dome and Talos Dome records smoothed using a 7-year running average. The time intervals reported in the table correspond to the different periods defined by breaking point analysis.
In this work, we used the chemical stratigraphies obtained from the analysis of about 3500 discrete samples from the GV7(B) ice core to accurately date the core with a sub-annual resolution. The δ18O high-resolution record was compared to the nss profile showing negligible discrepancies. The two records were used to achieve a reliable dating of the uppermost section of the core (approximately 40 m, covering the time period between 1920 and 2009 CE).
For the deeper section of the core, different strategies were tested and compared, namely single-parameter and multi-parametric approaches by considering seasonal markers to accomplish an annual layer counting. Upon these tests, nss profile was chosen for the dating of the core because of its clearer and better-preserved seasonal pattern all along the ice core, even at higher depths, where the temporal resolution becomes lower due to the thinning of the ice layers. An accurate annual layer-counting process was applied, and the volcanic signatures identified in the GV7(B) ice core were used as temporal horizons and tie points in the dating procedure. In this way, accurate dating of the core with a sub-annual resolution for the uppermost 197 m was obtained. Unfortunately, beyond the depth of 197 m, the ice core was strongly damaged and thus heavily contaminated from the drilling fluid also in the inner part. The GV7(B) chronology covers the 1179–2009 CE period. The average annual snow accumulation for this period is 205 mm w.e. This value was compared with already available records from the same site and different cores drilled in the same region (Law Dome and Talos Dome). A similar accumulation rate was found when comparing it with another core drilled on the same site as part of the ITASE drilling campaign, with a particularly good agreement during the last 40 years. When considering the general trend of the accumulation throughout the years, an increase was found starting from the middle of the 18th century covered by the GV7(B) core. This increasing trend was observed also at other coastal slope sites. Although the data here presented only cover the last 830 years, the number of cores that are able to cover the same time period is still scarce; therefore, the present study could significantly contribute to the long-term assessment of the surface mass balance in this area.
The GV7(B) chronology, volcanic tie points, uncertainty of the age scale and supporting data sets will be made available upon request to the corresponding author.
The supplement related to this article is available online at: https://doi.org/10.5194/cp-17-2073-2021-supplement.
RN, MS, AA, SB, LC, SBH and RT took care of the IC sample decontamination and/or ion chromatographic analysis and performed the annual layer counting. FB, IK and AS analyzed the trace elements content. GD, BS and ES measured water stable isotopes. VC, MF, CS, BMN and MP took care of the accumulation rate analysis. RN, LC, SB, MS and RT wrote the paper with inputs from all authors.
Some authors are members of the editorial board of Climate of the Past. The peer-review process was guided by an independent editor, and the authors also have no other competing interests to declare.
Publisher’s note: Copernicus Publications remains neutral with regard to jurisdictional claims in published maps and institutional affiliations.
The fellowship personnel involved in the analysis of the GV7(B) core and the laboratory equipment were partially funded by Fondazione Cassa di Risparmio di Firenze, MIUR-PNRA IPICS-2kyr-Italia (PNRA 2009/A2.09) MIUR-PNRA “BE-OI” (PNRA16 00124) and “3D” (PNRA16 00212) projects and MIUR-PRIN 2017 “AMICO”.
This research has been supported by the MIUR (Italian Ministry of University and Research) – PNRA (Italian Antarctic Research Programme) through the IPICS-2kyr-It project (International Partnership for Ice Core Science, reconstructing the climate variability for the last 2 kyr, the Italian contribution). The IPICS-2kyr-It project is carried out in cooperation with KOPRI (Korea Polar Research Institute, grant no. PE21100).
This paper was edited by Elizabeth Thomas and reviewed by Anders Svensson and Daniel Emanuelsson.
Abram, N. J., Wolff, E. W., and Curran, M. A. J.: A review of sea ice proxy information from polar ice cores, Quaternary Sci. Rev., 79, 168–183, https://doi.org/10.1016/j.quascirev.2013.01.011, 2013.
Alley, R. B., Shuman, C. A., Meese, D. A., Gow, A. J., Taylor, K. C., Cuffey, K. M., Fitzpatrick, J. J., Grootes, P. M., Zielinski, G. A., Ram, M., Spinelli, G., and Elder, B.: Visual-stratigraphic dating of the GISP2 ice core: Basis, reproducibility, and application, J. Geophys. Res.-Oceans, 102, 26367–26381, https://doi.org/10.1029/96JC03837, 1997.
Becagli, S., Proposito, M., Benassai, S., Flora, O., Genoni, L., Gragnani, R., Largiuni, O., Pili, S. L., Severi, M., Stenni, B., Traversi, R., Udisti, R., and Frezzotti, M.: Chemical and isotopic snow variability in East Antarctica along the 2001/02 ITASE traverse, Ann. Glaciol., 39, 473–482, https://doi.org/10.3189/172756404781814636, 2004.
Becagli, S., Scarchilli, C., Traversi, R., Dayan, U., Severi, M., Frosini, D., Vitale, V., Mazzola, M., Lupi, A., Nava, S., and Udisti, R.: Study of present-day sources and transport processes affecting oxidised sulphur compounds in atmospheric aerosols at Dome C (Antarctica) from year-round sampling campaigns, Atmos. Environ., 52, 98–108, https://doi.org/10.1016/j.atmosenv.2011.07.053, 2012.
Benassai, S., Becagli, S., Gragnani, R., Magand, O., Proposito, M., Fattori, I., Traversi, R., and Udisti, R.: Sea-spray deposition in Antarctic coastal and plateau areas from ITASE traverses, Ann. Glaciol., 41, 32–40, https://doi.org/10.3189/172756405781813285, 2005.
Berhanu, T. A., Meusinger, C., Erbland, J., Jost. R., Bhattacharya, S. K., Johnson, M. S., and Savarino, J.: Laboratory study of nitrate photolysis in Antarctic snow. II. Isotopic effects and wavelength dependence, J. Chem. Phys., 140, 244306, https://doi.org/10.1063/1.4882899, 2014.
Bertler, N. A. N., Mayewski, P. A., and Carter, L.: Cold conditions in Antarctica during the Little Ice Age – Implications for abrupt climate change mechanisms, Earth Planet. Sci. Lett., 308, 41–51, https://doi.org/10.1016/j.epsl.2011.05.021, 2011.
Bodhaine, B. A., Deluisi, J. J., Harris, J. M., Houmere, P., and Bauman, S.: Aerosol measurements at the South Pole, Tellus B, 38B, 223–235, https://doi.org/10.1111/j.1600-0889.1986.tb00189.x, 1986.
Bowen, H. J. M.: Environmental chemistry of the elements, Academic Press, London, ISBN: 780121204501, 1979.
Caiazzo, L., Becagli, S., Frosini, D., Giardi, F., Severi, M., Traversi, R., and Udisti, R.: Spatial and temporal variability of snow chemical composition and accumulation rate at Talos Dome site (East Antarctica), Sci. Total Environ., 550, 418–430, https://doi.org/10.1016/j.scitotenv.2016.01.087, 2016.
Caiazzo, L., Baccolo, G., Barbante, C., Becagli, S., Bertò, M., Ciardini, V., Crotti, I., Delmonte, B., Dreossi, G., Frezzotti, M., Gabrieli, J., Giardi, F., Han, Y., Hong, S. B., Hur, S. D., Hwang, H., Kang, J. H., Narcisi, B., Proposito, M., Scarchilli, C., Selmo, E., Severi, M., Spolaor, A., Stenni, B., Traversi, R., and Udisti, R.: Prominent features in isotopic, chemical and dust stratigraphies from coastal East Antarctic ice sheet (Eastern Wilkes Land), Chemosphere, 176, 273–287, https://doi.org/10.1016/j.chemosphere.2017.02.115, 2017.
Candelone, J.-P., Hong, S., and Boutron, C. F.: An improved method for decontaminating polar snow or ice cores for heavy metal analysis, Anal. Chimica Acta, 299, 9–16, 1994.
Candelone, J.-P., Bolshov, M. A., Rudniev, S. N., Hong, S., and Boutron, C. F.: Bismuth in recent snow from Central Greenland: Preliminary results, Atmos. Environ., 29, 1843–1848, https://doi.org/10.1016/1352-2310(95)00058-7, 1995.
Castellano, E., Becagli, S., Jouzel, J., Migliori, A., Severi, M., Steffensen, J. P., Traversi, R., and Udisti, R.: Volcanic eruption frequency over the last 45 ky as recorded in Epica-Dome C ice core (East Antarctica) and its relationship with climatic changes, Global Planet. Change, 42, 195–205, https://doi.org/10.1016/j.gloplacha.2003.11.007, 2004.
Castellano, E., Becagli, S., Hansson, M., Hutterli, M., Petit, J. R., Rampino, M. R., Severi, M., Steffensen, J. P., Traversi, R., and Udisti, R.: Holocene volcanic history as recorded in the sulfate stratigraphy of the European Project for Ice Coring in Antarctica Dome C (EDC96) ice core, J. Geophys. Res.-Atmos., 110, 1–12, https://doi.org/10.1029/2004JD005259, 2005.
Chisholm, W., Rosman, K. J. R., Boutron, C. F., Candelone, J. P., and Hong, S.: Determination of lead isotopic ratios in Greenland and Antarctic snow and ice at picogram per gram concentrations, Anal. Chim. Acta, 311, 141–151, https://doi.org/10.1016/0003-2670(95)00181-X, 1995.
Cole-Dai, J., Mosley-Thompson, E., and Thompson, L. G.: Annually resolved southern hemisphere volcanic history from two Antarctic ice cores, J. Geophys. Res.-Atmos., 102, 16761–16771, https://doi.org/10.1029/97jd01394, 1997.
Dansgaard, W.: Stable isotopes in precipitation, Tellus, 16, 436–468, https://doi.org/10.1111/j.2153-3490.1964.tb00181.x, 1964.
Dansgaard, W. and Johnsen, S.: A flow model and a time scale for the ice core from Camp Century, Greenland, J. Glaciol., 8, 215–223, 1969.
DeConto, R. M. and Pollard, D.: Contribution of Antarctica to past and future sea-level rise, Nature, 531, 591–597, https://doi.org/10.1038/nature17145, 2016.
de Leeuw, G., Andreas, E. L., Anguelova, M. D., Fairall, C. W., Lewis, E. R., O'Dowd, C., Schulz, M., and Schwartz, S. E.: Production flux of sea salt aerosol, Rev. Geophys., 49, Rg2001, https://doi.org/10.1029/2010RG000349, 2011.
Delmas, R. J., Legrand, M., Aristarain, A. J., and Zanolini, F.: Volcanic deposits in Antarctic snow and ice., J. Geophys. Res., 90, 12901–12920, https://doi.org/10.1029/JD090iD07p12901, 1985.
Delmonte, B., Petit, J., and Maggi, V.: Glacial to Holocene implications of the new 27000-year dust record from the EPICA Dome C (East Antarctica) ice core, Clim. Dynam., 18, 647–660, https://doi.org/10.1007/s00382-001-0193-9, 2002.
Dibb, J. E., Talbot, R. W., Munger, J. W., Jacob, D. J., and Fan, S. M.: Air-snow exchange of HNO3 and NOy at Summit, Greenland, J. Geophys. Res.-Atmos., 103, 3475–3486, https://doi.org/10.1029/97JD03132, 1998.
Epstein, S. and Mayeda, T.: Variation of O18 content of waters from natural sources, Geochim. Cosmochim. Acta, 4, 213–224, https://doi.org/10.1016/0016-7037(53)90051-9, 1953.
Erbland, J., Vicars, W. C., Savarino, J., Morin, S., Frey, M. M., Frosini, D., Vince, E., and Martins, J. M. F.: Air–snow transfer of nitrate on the East Antarctic Plateau – Part 1: Isotopic evidence for a photolytically driven dynamic equilibrium in summer, Atmos. Chem. Phys., 13, 6403–6419, https://doi.org/10.5194/acp-13-6403-2013, 2013.
Extier, T., Landais, A., Bréant, C., Prié, F., Bazin, L., Dreyfus, G., Roche, D. M., and Leuenberger, M.: On the use of δ18Oatm for ice core dating, Quaternary Sci. Rev., 185, 244–257, https://doi.org/10.1016/j.quascirev.2018.02.008, 2018.
Fischer, H., Fundel, F., Ruth, U., Twarloh, B., Wegner, A., Udisti, R., Becagli, S., Castellano, E., Morganti, A., Severi, M., Wolff, E., Littot, G., Röthlisberger, R., Mulvaney, R., Hutterli, M. A., Kaufmann, P., Federer, U., Lambert, F., Bigler, M., Hansson, M., Jonsell, U., de Angelis, M., Boutron, C., Siggaard-Andersen, M. L., Steffensen, J. P., Barbante, C., Gaspari, V., Gabrielli, P., and Wagenbach, D.: Reconstruction of millennial changes in dust emission, transport and regional sea ice coverage using the deep EPICA ice cores from the Atlantic and Indian Ocean sector of Antarctica, Earth Planet. Sc. Lett., 260, 340–354, https://doi.org/10.1016/j.epsl.2007.06.014, 2007.
Fretwell, P., Pritchard, H. D., Vaughan, D. G., Bamber, J. L., Barrand, N. E., Bell, R., Bianchi, C., Bingham, R. G., Blankenship, D. D., Casassa, G., Catania, G., Callens, D., Conway, H., Cook, A. J., Corr, H. F. J., Damaske, D., Damm, V., Ferraccioli, F., Forsberg, R., Fujita, S., Gim, Y., Gogineni, P., Griggs, J. A., Hindmarsh, R. C. A., Holmlund, P., Holt, J. W., Jacobel, R. W., Jenkins, A., Jokat, W., Jordan, T., King, E. C., Kohler, J., Krabill, W., Riger-Kusk, M., Langley, K. A., Leitchenkov, G., Leuschen, C., Luyendyk, B. P., Matsuoka, K., Mouginot, J., Nitsche, F. O., Nogi, Y., Nost, O. A., Popov, S. V., Rignot, E., Rippin, D. M., Rivera, A., Roberts, J., Ross, N., Siegert, M. J., Smith, A. M., Steinhage, D., Studinger, M., Sun, B., Tinto, B. K., Welch, B. C., Wilson, D., Young, D. A., Xiangbin, C., and Zirizzotti, A.: Bedmap2: improved ice bed, surface and thickness datasets for Antarctica, The Cryosphere, 7, 375–393, https://doi.org/10.5194/tc-7-375-2013, 2013.
Frezzotti, M., Urbini, S., Proposito, M., Scarchilli, C., and Gandolfi, S.: Spatial and temporal variability of surface mass balance near Talos Dome, East Antarctica, J. Geophys. Res.-Earth, 112, F02032, https://doi.org/10.1029/2006JF000638, 2007.
Frezzotti, M., Scarchilli, C., Becagli, S., Proposito, M., and Urbini, S.: A synthesis of the Antarctic surface mass balance during the last 800 yr, The Cryosphere, 7, 303–319, https://doi.org/10.5194/tc-7-303-2013, 2013.
Gondwe, M., Krol, M., Gieskes, W., Klaassen, W., and de Baar, H.: The contribution of ocean-leaving DMS to the global atmospheric burdens of DMS, MSA, SO2, and NSS SO, Global Biogeochem. Cy., 17, 1056, https://doi.org/10.1029/2002gb001937, 2003.
Grannas, A. M., Jones, A. E., Dibb, J., Ammann, M., Anastasio, C., Beine, H. J., Bergin, M., Bottenheim, J., Boxe, C. S., Carver, G., Chen, G., Crawford, J. H., Dominé, F., Frey, M. M., Guzmán, M. I., Heard, D. E., Helmig, D., Hoffmann, M. R., Honrath, R. E., Huey, L. G., Hutterli, M., Jacobi, H. W., Klán, P., Lefer, B., McConnell, J., Plane, J., Sander, R., Savarino, J., Shepson, P. B., Simpson, W. R., Sodeau, J. R., von Glasow, R., Weller, R., Wolff, E. W., and Zhu, T.: An overview of snow photochemistry: evidence, mechanisms and impacts, Atmos. Chem. Phys., 7, 4329–4373, https://doi.org/10.5194/acp-7-4329-2007, 2007.
Greene, C. A., Gwyther, D. E., and Blankenship, D. D.: Antarctic Mapping Tools for Matlab, Comput. Geosci., 104, 151–157, 2017.
Hammer, C. U.: Acidity of Polar Ice Cores in Relation to Absolute Dating, Past Volcanism, and Radio–Echoes, J. Glaciol., 25, 359–372, 1980.
Hastings, M. G., Sigman, D. M., and Steig, E. J.: Glacial/interglacial changes in the isotopes of nitrate from the Greenland Ice Sheet Project 2 (GISP2) ice core, Global Biogeochem. Cy., 19, GB4024, https://doi.org/10.1029/2005GB002502, 2005.
Herron, M. M. and Langway, C. C.: Dating of Ross Ice Shelf Core by chemical analysis, J. Glaciol., 24, 345–357, https://doi.org/10.3189/s0022143000014866, 1979.
Hwang, H., Hur, S. D., Lee, J., Han, Y., Hong, S., and Motoyama, H.: Plutonium fallout reconstructed from an Antarctic Plateau snowpack using inductively coupled plasma sector field mass spectrometry, Sci. Tot. Environ., 669, 505–511, https://doi.org/10.1016/j.scitotenv.2019.03.105, 2019.
Igarashi, M., Nakai, Y., Motizuki, Y., Takahashi, K., Motoyama, H., and Makishima, K.: Dating of the Dome Fuji shallow ice core based on a record of volcanic eruptions from AD 1260 to AD 2001, Polar Sci., 5, 411–420, https://doi.org/10.1016/j.polar.2011.08.001, 2011.
Jones, J. M., Gille, S. T., Goosse, H., Abram, N. J., Canziani, P. O., Charman, D. J., Clem, K. R., Crosta, X., de Lavergne, C., Eisenman, I., England, M. H., Fogt, R. L., Frankcombe, L. M., Marshall, G. J., Masson-Delmotte, V., Morrison, A. K., Orsi, A. J., Raphael, M. N., Renwick, J. A., Schneider, D. P., Simpkins, G. R., Steig, E. J., Stenni, B., Swingedouw, D., and Vance, T. R.: Assessing recent trends in high-latitude Southern Hemisphere surface climate, Nat. Clim. Change, 6, 917–926, https://doi.org/10.1038/nclimate3103, 2016.
Kellerhals, T., Tobler, L., Brütsch, S., Sigl, M., Wacker, L., Gaäggeler, H. W., and Schwikowski, M.: Thallium as a Tracer for Preindustrial Volcanic Eruptions in an Ice Core Record from Illimani, Bolivia, Environ. Sci. Technol., 44, 888–893, https://doi.org/10.1021/es902492n, 2010.
Krinner, G., Magand, O., Simmonds, I., Genthon, C., and Dufresne, J. L.: Simulated Antarctic precipitation and surface mass balance at the end of the twentieth and twenty-first centuries, Clim. Dynam., 28, 215–230, https://doi.org/10.1007/s00382-006-0177-x, 2007.
Legrand, M. R. and Delmas, R. J.: The ionic balance of Antarctic snow: A 10-year detailed record, Atmos. Environ., 18, 1867–1874, 1984.
Legrand, M., Wolff, E., and Wagenbach, D.: Antarctic aerosol and snowfall chemistry: implications for deep Antarctic ice-core chemistry, Ann. Glac., 29, 66–72, 1999.
Magand, O., Frezzotti, M., Pourchet, M., Stenni, B., Genoni, L., and Fily, M.: Climate variability along latitudinal and longitudinal transects in East Antarctica, Ann. Glaciol., 39, 351–358, 2004.
Maupetit, F. and Delmas, R. J.: Chemical composition of Falling Snow at Dumont D'Urville, Antarctica, J. Atmos. Chem., 14, 31–42, 1992.
Morganti, A., Becagli, S., Castellano, E., Severi, M., Traversi, R., and Udisti, R.: An improved flow analysis-ion chromatography method for determination of cationic and anionic species at trace levels in Antarctic ice cores, Anal. Chim. Acta, 603, 190–198, https://doi.org/10.1016/j.aca.2007.09.050, 2007.
Mulvaney, R. and Wolff, E. W.: Spatial variability of the major chemistry of the Antarctic ice sheet, Ann. Glaciol., 20, 440–447, https://doi.org/10.3189/1994aog20-1-440-447, 1994.
Mulvaney, R., Wagenbach, D., and Wolff, E. W.: Postdepositional change in snowpack nitrate from observation of year-round near-surface snow in coastal Antarctica, J. Geophys. Res.-Atmos., 103, 11021–11031, 1998.
Narcisi, B. and Petit, J. R.: Englacial tephras of East Antarctica, edited by: Smellie, J., Panter, K., and Geyer, A., Geological Society, London, Memoirs, 55, 649-664, https://doi.org/10.1144/M55-2018-86, 2021.
Narcisi, B., Proposito, M., and Frezzotti, M.: Ice record of a 13th century explosive volcanic eruption in northern Victoria Land, East Antarctica, Antarct. Sci., 13, 174–181, https://doi.org/10.1017/S0954102001000268, 2001.
Narcisi, B., Petit, J. R., Delmonte, B., Scarchilli, C., and Stenni, B.: A 16,000-yr tephra framework for the Antarctic ice sheet: A contribution from the new Talos Dome core, Quaternary Sci. Rev., 49, 52–63, https://doi.org/10.1016/j.quascirev.2012.06.011, 2012.
Nardin, R., Amore, A., Becagli, S., Caiazzo, L., Frezzotti, M., Severi, M., Stenni, B., and Traversi, R.: Volcanic Fluxes Over the Last Millennium as Recorded in the GV7 Ice Core (Northern Victoria Land, Antarctica), Geosciences, 10, 38, https://doi.org/10.3390/geosciences10010038, 2020.
Neukom, R., Schurer, A. P., Steiger, Nathan. J., and Hegerl, G. C.: Possible causes of data model discrepancy in the temperature history of the last Millennium, Sci. Rep.-Uk, 8, 7572, https://doi.org/10.1038/s41598-018-25862-2, 2018.
Nozaki, Y.: A fresh look at element distribution in the North Pacific Ocean, Eos, 78, 221, https://doi.org/10.1029/97eo00148, 1997.
Nyamgerel, Y., Han, Y., Kim, S., Hong, S.-B., Lee, J., and Hur, S.: Chronological characteristics for snow accumulation on Styx Glacier in northern Victoria Land, Antarctica, J. Glaciol., 66, 916–926, https://doi.org/10.1017/jog.2020.53, 2020.
Pasteris, D. R., McConnell, J. R., Das, S. B., Criscitiello, A. S., Evans, M. J., Maselli, O. J., Sigl, M., and Layman, L.: Seasonally resolved ice core records from West Antarctica indicate a sea ice source of sea-salt aerosol and a biomass burning source of ammonium, J. Geophys. Res., 119, 9168–9182, https://doi.org/10.1002/2013JD020720, 2014.
Piccardi, G., Udisti, R., and Casella, F.: Seasonal trends and chemical composition of snow at terra nova bay (antarctica), Int. J. Environ. An. Ch., 55, 219–234, https://doi.org/10.1080/03067319408026220, 1994.
Rasmussen, S. O., Andersen, K. K., Svensson, A. M., Steffensen, J. P., Vinther, B. M., Clausen, H. B., Siggaard-Andersen, M. L., Johnsen, S. J., Larsen, L. B., Dahl-Jensen, D., Bigler, M., Röthlisberger, R., Fischer, H., Goto-Azuma, K., Hansson, M. E., and Ruth, U.: A new Greenland ice core chronology for the last glacial termination, J. Geophys. Res.-Atmos., 111, D06102, https://doi.org/10.1029/2005JD006079, 2006.
Roberts, J., Plummer, C., Vance, T., van Ommen, T., Moy, A., Poynter, S., Treverrow, A., Curran, M., and George, S.: A 2000-year annual record of snow accumulation rates for Law Dome, East Antarctica, Clim. Past, 11, 697–707, https://doi.org/10.5194/cp-11-697-2015, 2015.
Röthlisberger, R., Hutterli, M. A., Sommer, S., Wolff, E. W., and Mulvaney, R.: Factors controlling nitrate in ice cores: Evidence from the Dome C deep ice core, J. Geophys. Res.-Atmos., 105, 20565–20572, https://doi.org/10.1029/2000JD900264, 2000.
Röthlisberger, R., Hutterli, M. A., Wolff, E. W., Mulvaney, R., Fischer, H., Bigler, M., Goto-Azuma, K., Hansson, M. E., Ruth, U., Siggaard-Andersen, M.-L., and Steffensen, J. P.: Nitrate in Greenland and Antarctic ice cores: a detailed description of post-depositional processes, Ann. Glaciol., 35, 209–216, 2002.
Scarchilli, C., Frezzotti, M., and Ruti, P. M.: Snow precipitation at four ice core sites in East Antarctica: provenance, seasonality and blocking factors, Clim. Dynam., 37, 2107–2125, https://doi.org/10.1007/s00382-010-0946-4, 2011.
Severi, M., Becagli, S., Castellano, E., Morganti, A., Traversi, R., Udisti, R., Ruth, U., Fischer, H., Huybrechts, P., Wolff, E., Parrenin, F., Kaufmann, P., Lambert, F., and Steffensen, J. P.: Synchronisation of the EDML and EDC ice cores for the last 52 kyr by volcanic signature matching, Clim. Past, 3, 367–374, https://doi.org/10.5194/cp-3-367-2007, 2007.
Severi, M., Udisti, R., Becagli, S., Stenni, B., and Traversi, R.: Volcanic synchronisation of the EPICA-DC and TALDICE ice cores for the last 42 kyr BP, Clim. Past, 8, 509–517, https://doi.org/10.5194/cp-8-509-2012, 2012.
Shi, G., Chai, J., Zhu, Z., Hu, Z., Chen, Z., Yu, J., Ma, T., Ma, H., An, C., Jiang, S., Tang, X., and Hastings, M. G.: Isotope Fractionation of Nitrate During Volatilization in Snow: A Field Investigation in Antarctica, Geophys. Res. Lett., 46, 3287–3297, https://doi.org/10.1029/2019GL081968, 2015.
Sigl, M., McConnell, J. R., Layman, L., Maselli, O., McGwire, K., Pasteris, D., Dahl-Jensen, D., Steffensen, J. P., Vinther, B., Edwards, R., Mulvaney, R., and Kipfstuhl, S.: A new bipolar ice core record of volcanism from WAIS Divide and NEEM and implications for climate forcing of the last 2000 years, J. Geophys. Res.-Atmos., 118, 1151–1169, https://doi.org/10.1029/2012JD018603, 2013.
Sigl, M., Winstrup, M., McConnell, J. R., Welten, K. C., Plunkett, G., Ludlow, F., Büntgen, U., Caffee, M., Chellman, N., Dahl-Jensen, D., Fischer, H., Kipfstuhl, S., Kostick, C., Maselli, O. J., Mekhaldi, F., Mulvaney, R., Muscheler, R., Pasteris, D. R., Pilcher, J. R., Salzer, M., Schüpbach, S., Steffensen, J. P., Vinther, B. M., and Woodruff, T. E.: Timing and climate forcing of volcanic eruptions for the past 2,500 years, Nature, 523, 543–549, https://doi.org/10.1038/nature14565, 2015.
Sigl, M., Fudge, T. J., Winstrup, M., Cole-Dai, J., Ferris, D., McConnell, J. R., Taylor, K. C., Welten, K. C., Woodruff, T. E., Adolphi, F., Bisiaux, M., Brook, E. J., Buizert, C., Caffee, M. W., Dunbar, N. W., Edwards, R., Geng, L., Iverson, N., Koffman, B., Layman, L., Maselli, O. J., McGwire, K., Muscheler, R., Nishiizumi, K., Pasteris, D. R., Rhodes, R. H., and Sowers, T. A.: The WAIS Divide deep ice core WD2014 chronology – Part 2: Annual-layer counting (0–31 ka BP), Clim. Past, 12, 769–786, https://doi.org/10.5194/cp-12-769-2016, 2016.
Sodemann, H. and Stohl, A.: Asymmetries in the moisture origin of Antarctic precipitation, Geophys. Res. Lett., 36, L22803, https://doi.org/10.1029/2009GL040242, 2009.
Stefels, J., Steinke, M., Turner, S., Malin, G., and Belviso, S.: Environmental constraints on the production and removal of the climatically active gas dimethylsulphide (DMS) and implications for ecosystem modelling, Biogeochemistry, 83, 245–275, https://doi.org/10.1007/s10533-007-9091-5, 2007.
Stenni, B., Masson-Delmotte, V., Johnsen, S. J., Jouzel, J., Longinelli, A., Monnin, E., Rothlisberger, R., and Selmo, E.: An Oceanic Cold Reversal During the Last Deglaciation, Science, 293, 2074–2077, 2001.
Stenni, B., Proposito, M., Gragnani, R., Flora, O., Jouzel, J., Falourd, S., and Frezzotti, M.: Eight centuries of volcanic signal and climate change at Talos Dome (East Antarctica), J. Geophys. Res.-Atmos., 107, 4076, https://doi.org/10.1029/2000jd000317, 2002.
Tao, G., Yamada, R., Fujikawa, Y., Kudo, A., Zheng, J., Fisher, D. A., and Koerner, R. M.: Determination of trace amounts of heavy metals in arctic ice core samples using inductively coupled plasma mass spectrometry, Talanta, 55, 765–772, https://doi.org/10.1016/s0039-9140(01)00509-4, 2001.
Thomas, E. R., Wolff, E. W., Mulvaney, R., Steffensen, J. P., Johnsen, S. J., Arrowsmith, C., White, J. W. C., Vaughn, B., and Popp, T.: The 8.2 ka event from Greenland ice cores, Quaternary Sci. Rev., 26, 70–81, https://doi.org/10.1016/j.quascirev.2006.07.017, 2007.
Thomas, E. R., van Wessem, J. M., Roberts, J., Isaksson, E., Schlosser, E., Fudge, T. J., Vallelonga, P., Medley, B., Lenaerts, J., Bertler, N., van den Broeke, M. R., Dixon, D. A., Frezzotti, M., Stenni, B., Curran, M., and Ekaykin, A. A.: Regional Antarctic snow accumulation over the past 1000 years, Clim. Past, 13, 1491–1513, https://doi.org/10.5194/cp-13-1491-2017, 2017.
Tomé, A. and Miranda, P. M. A.: Piecewise linear fitting and trend changing points of climate parameters, Geophys. Res. Lett., 31, L02207, https://doi.org/10.1029/2003GL019100, 2004.
Traufetter, F., Oerter, H., Fischer, H., Weller, R., and Miller, H.: Spatio-temporal variability in volcanic sulphate deposition over the past 2 kyr in snow pits and firn cores from Amundsenisen, Antarctica, J. Glaciol., 50, 137–146, 2004.
Traversi, R., Usoskin, I. G., Solanki, S. K., Becagli, S., Frezzotti, M., Severi, M., Stenni, B., and Udisti, R.: Nitrate in Polar Ice: A New Tracer of Solar Variability, Sol. Phys., 280, 237–254, https://doi.org/10.1007/s11207-012-0060-3, 2012.
Udisti, R.: Multiparametric approach for chemical dating of snow layers from Antarctica, Int. J. Environ. Anal. Chem., 63, 225–244, https://doi.org/10.1080/03067319608026268, 1996.
Udisti, R., Dayan, U., Becagli, S., Busetto, M., Frosini, D., Legrand, M., Lucarelli, F., Preunkert, S., Severi, M., Traversi, R., and Vitale, V.: Sea spray aerosol in central Antarctica. Present atmospheric behaviour and implications for paleoclimatic reconstructions, Atmos. Environ., 52, 109–120, https://doi.org/10.1016/j.atmosenv.2011.10.018, 2012.
Vance, T. R., Roberts, J. L., Plummer, C. T., Kiem, A. S., and van Ommen, T. D.: Inderdecadal Pacific variability and eastern Australian megadroughts over the last millennium, Geophys. Res. Lett., 42, 129–137, 2015.
Van Ommen, T. and Morgan, V.: Snowfall increase in coastal East Antarctica linked with southwest Western Australian drought, Nat. Geosci., 3, 267–272, 2010.
Van Ommen, T., Morgan, V., and Curran, M.: Declacial and Holocene changes in accumulation at Law Dome, East Antarctica, Ann. Glaciol., 39, 359–365, 2004.
Watanabe, O., Kamiyama, K., Motoyama, H., Fujii, Y., Shoji, H., and Satow, K.: The paleoclimate record in the ice core at Dome Fuji station, East Antarctica, Ann. Glaciol., 29, 176–178, https://doi.org/10.3189/172756499781821553, 1999.
Weller, R., Wagenbach, D., Legrand, M., Elsässer, C., Tian-Kunze, X., and König-Langlo, G.: Continuous 25-yr aerosol records at coastal Antarctica – I: Inter-annual variability of ionic compounds links to climate indices, Tellus B, 63, 901–919, https://doi.org/10.1111/j.1600-0889.2011.00542.x, 2011.
Winski, D. A., Fudge, T. J., Ferris, D. G., Osterberg, E. C., Fegyveresi, J. M., Cole-Dai, J., Thundercloud, Z., Cox, T. S., Kreutz, K. J., Ortman, N., Buizert, C., Epifanio, J., Brook, E. J., Beaudette, R., Severinghaus, J., Sowers, T., Steig, E. J., Kahle, E. C., Jones, T. R., Morris, V., Aydin, M., Nicewonger, M. R., Casey, K. A., Alley, R. B., Waddington, E. D., Iverson, N. A., Dunbar, N. W., Bay, R. C., Souney, J. M., Sigl, M., and McConnell, J. R.: The SP19 chronology for the South Pole Ice Core – Part 1: volcanic matching and annual layer counting, Clim. Past, 15, 1793–1808, https://doi.org/10.5194/cp-15-1793-2019, 2019.
Winstrup, M., Svensson, A. M., Rasmussen, S. O., Winther, O., Steig, E. J., and Axelrod, A. E.: An automated approach for annual layer counting in ice cores, Clim. Past, 8, 1881–1895, https://doi.org/10.5194/cp-8-1881-2012, 2012.
Winstrup, M., Vallelonga, P., Kjær, H. A., Fudge, T. J., Lee, J. E., Riis, M. H., Edwards, R., Bertler, N. A. N., Blunier, T., Brook, E. J., Buizert, C., Ciobanu, G., Conway, H., Dahl-Jensen, D., Ellis, A., Emanuelsson, B. D., Hindmarsh, R. C. A., Keller, E. D., Kurbatov, A. V., Mayewski, P. A., Neff, P. D., Pyne, R. L., Simonsen, M. F., Svensson, A., Tuohy, A., Waddington, E. D., and Wheatley, S.: A 2700-year annual timescale and accumulation history for an ice core from Roosevelt Island, West Antarctica, Clim. Past, 15, 751–779, https://doi.org/10.5194/cp-15-751-2019, 2019.
Wolff, E. W.: Nitrate in Polar Ice, in: Ice Core Studies of Global Biogeochemical Cycles, Springer Berlin Heidelberg, Berlin, Heidelberg, https://doi.org/10.1007/978-3-642-51172-1_10, 1995.
Wolff, E. W.: Ice sheets and nitrogen, Philos. T. Roy. Soc. London B, 368, 20130127, https://doi.org/10.1098/rstb.2013.0127, 2013.
Wolff, E. W., Barbante, C., Becagli, S., Bigler, M., Boutron, C. F., Castellano, E., de Angelis, M., Federer, U., Fischer, H., Fundel, F., Hansson, M., Hutterli, M., Jonsell, U., Karlin, T., Kaufmann, P., Lambert, F., Littot, G. C., Mulvaney, R., Röthlisberger, R., Ruth, U., Severi, M., Siggaard-Andersen, M. L., Sime, L. C., Steffensen, J. P., Stocker, T. F., Traversi, R., Twarloh, B., Udisti, R., Wagenbach, D., and Wegner, A.: Changes in environment over the last 800,000 years from chemical analysis of the EPICA Dome C ice core, Quaternary Sci. Rev., 29, 285–295, https://doi.org/10.1016/j.quascirev.2009.06.013, 2010.
Zatko, M., Geng, L., Alexander, B., Sofen, E., and Klein, K.: The impact of snow nitrate photolysis on boundary layer chemistry and the recycling and redistribution of reactive nitrogen across Antarctica and Greenland in a global chemical transport model, Atmos. Chem. Phys., 16, 2819–2842, https://doi.org/10.5194/acp-16-2819-2016, 2016.
Zielinski, G. A., Mayewski, P. A., David Meeker, L., Whitlow, S., and Twickler, M. S.: A 110,000-Yr Record of Explosive Volcanism from the GISP2 (Greenland) Ice Core, Quaternary Res., 45, 109–118, 1996.