the Creative Commons Attribution 4.0 License.
the Creative Commons Attribution 4.0 License.
 | 01 Oct 2021
Rapid and sustained environmental responses to global warming: the Paleocene–Eocene Thermal Maximum in the eastern North Sea
Ella W. Stokke
Morgan T. Jones
Lars Riber
Haflidi Haflidason
Ivar Midtkandal
Bo Pagh Schultz
Henrik H. Svensen
The Paleocene–Eocene Thermal Maximum (PETM; ∼ 55.9 Ma) was a period of rapid and sustained global warming associated with significant carbon emissions. It coincided with the North Atlantic opening and emplacement of the North Atlantic Igneous Province (NAIP), suggesting a possible causal relationship. Only a very limited number of PETM studies exist from the North Sea, despite its ideal position for tracking the impact of both changing climate and NAIP activity. Here we present sedimentological, mineralogical, and geochemical proxy data from Denmark in the eastern North Sea, exploring the environmental response to the PETM. An increase in the chemical index of alteration and a kaolinite content up to 50 % of the clay fraction indicate an influx of terrestrial input shortly after the PETM onset and during the recovery, likely due to an intensified hydrological cycle. The volcanically derived zeolite and smectite minerals comprise up to 36 % and 90 % of the bulk and clay mineralogy respectively, highlighting the NAIP's importance as a sediment source for the North Sea and in increasing the rate of silicate weathering during the PETM. X-Ray fluorescence element core scans also reveal possible hitherto unknown NAIP ash deposition both prior to and during the PETM. Geochemical proxies show that an anoxic to sulfidic environment persisted during the PETM, particularly in the upper half of the PETM body with high concentrations of molybdenum (MoEF > 30), uranium (UEF up to 5), sulfur (∼ 4 wt %), and pyrite (∼ 7 % of bulk). At the same time, export productivity and organic-matter burial reached its maximum intensity. These new records reveal that negative feedback mechanisms including silicate weathering and organic carbon sequestration rapidly began to counteract the carbon cycle perturbations and temperature increase and remained active throughout the PETM. This study highlights the importance of shelf sections in tracking the environmental response to the PETM climatic changes and as carbon sinks driving the PETM recovery.
- Article
(12147 KB) - Full-text XML
-
Supplement
(638 KB) - BibTeX
- EndNote


The early Cenozoic was a period characterized by long-term warming, punctuated by transient periods of rapid global hyperthermal events (Zachos et al., 2008; Hollis et al., 2012; Cramwinckel et al., 2018). The most pronounced of these periods was the Paleocene–Eocene Thermal Maximum (PETM; ∼ 55.9 Ma; Kennett and Stott, 1991; Thomas and Shackleton, 1996; Westerhold et al., 2018), during which global surface temperatures rose rapidly by 4–5 ∘C (Thomas et al., 2002; Dunkley Jones et al., 2013; Frieling et al., 2017). The PETM is associated with a large input of 12C-rich carbon to the ocean–atmosphere system resulting in a 2.5 ‰–7 ‰ negative carbon isotope excursion (CIE) in the terrestrial and marine sedimentary record (McInerney and Wing, 2011). The PETM CIE lasted up to 200 kyr (Westerhold et al., 2018) and is characterized by a rapid onset (∼ 1–5 kyr; Kirtland-Turner et al., 2017), followed by a stable body (∼ 100 kyr; van der Meulen et al., 2020) and a gradual recovery towards background conditions (McInerney and Wing, 2011). There were a number of smaller-magnitude hyperthermals in the early Eocene, but the PETM differs from these events with both its greater magnitude and longer duration (Zachos et al., 2010; Bowen, 2013). However, there is still no consensus on the ultimate PETM cause or whether several mechanisms contributed to prolong the PETM duration (e.g. Zeebe et al., 2009; Bowen et al., 2015). Several 12C-enriched carbon sources may have contributed to the PETM CIE: the dissociation of methane clathrates (Dickens et al., 1995), a bolide impact activating terrestrial carbon reservoirs (Kent et al., 2003; Schaller et al., 2016), and volcanic and thermogenic degassing from the North Atlantic Igneous Province (NAIP; Fig. 1; Eldholm and Thomas, 1993; Svensen et al., 2004; Storey et al., 2007a).
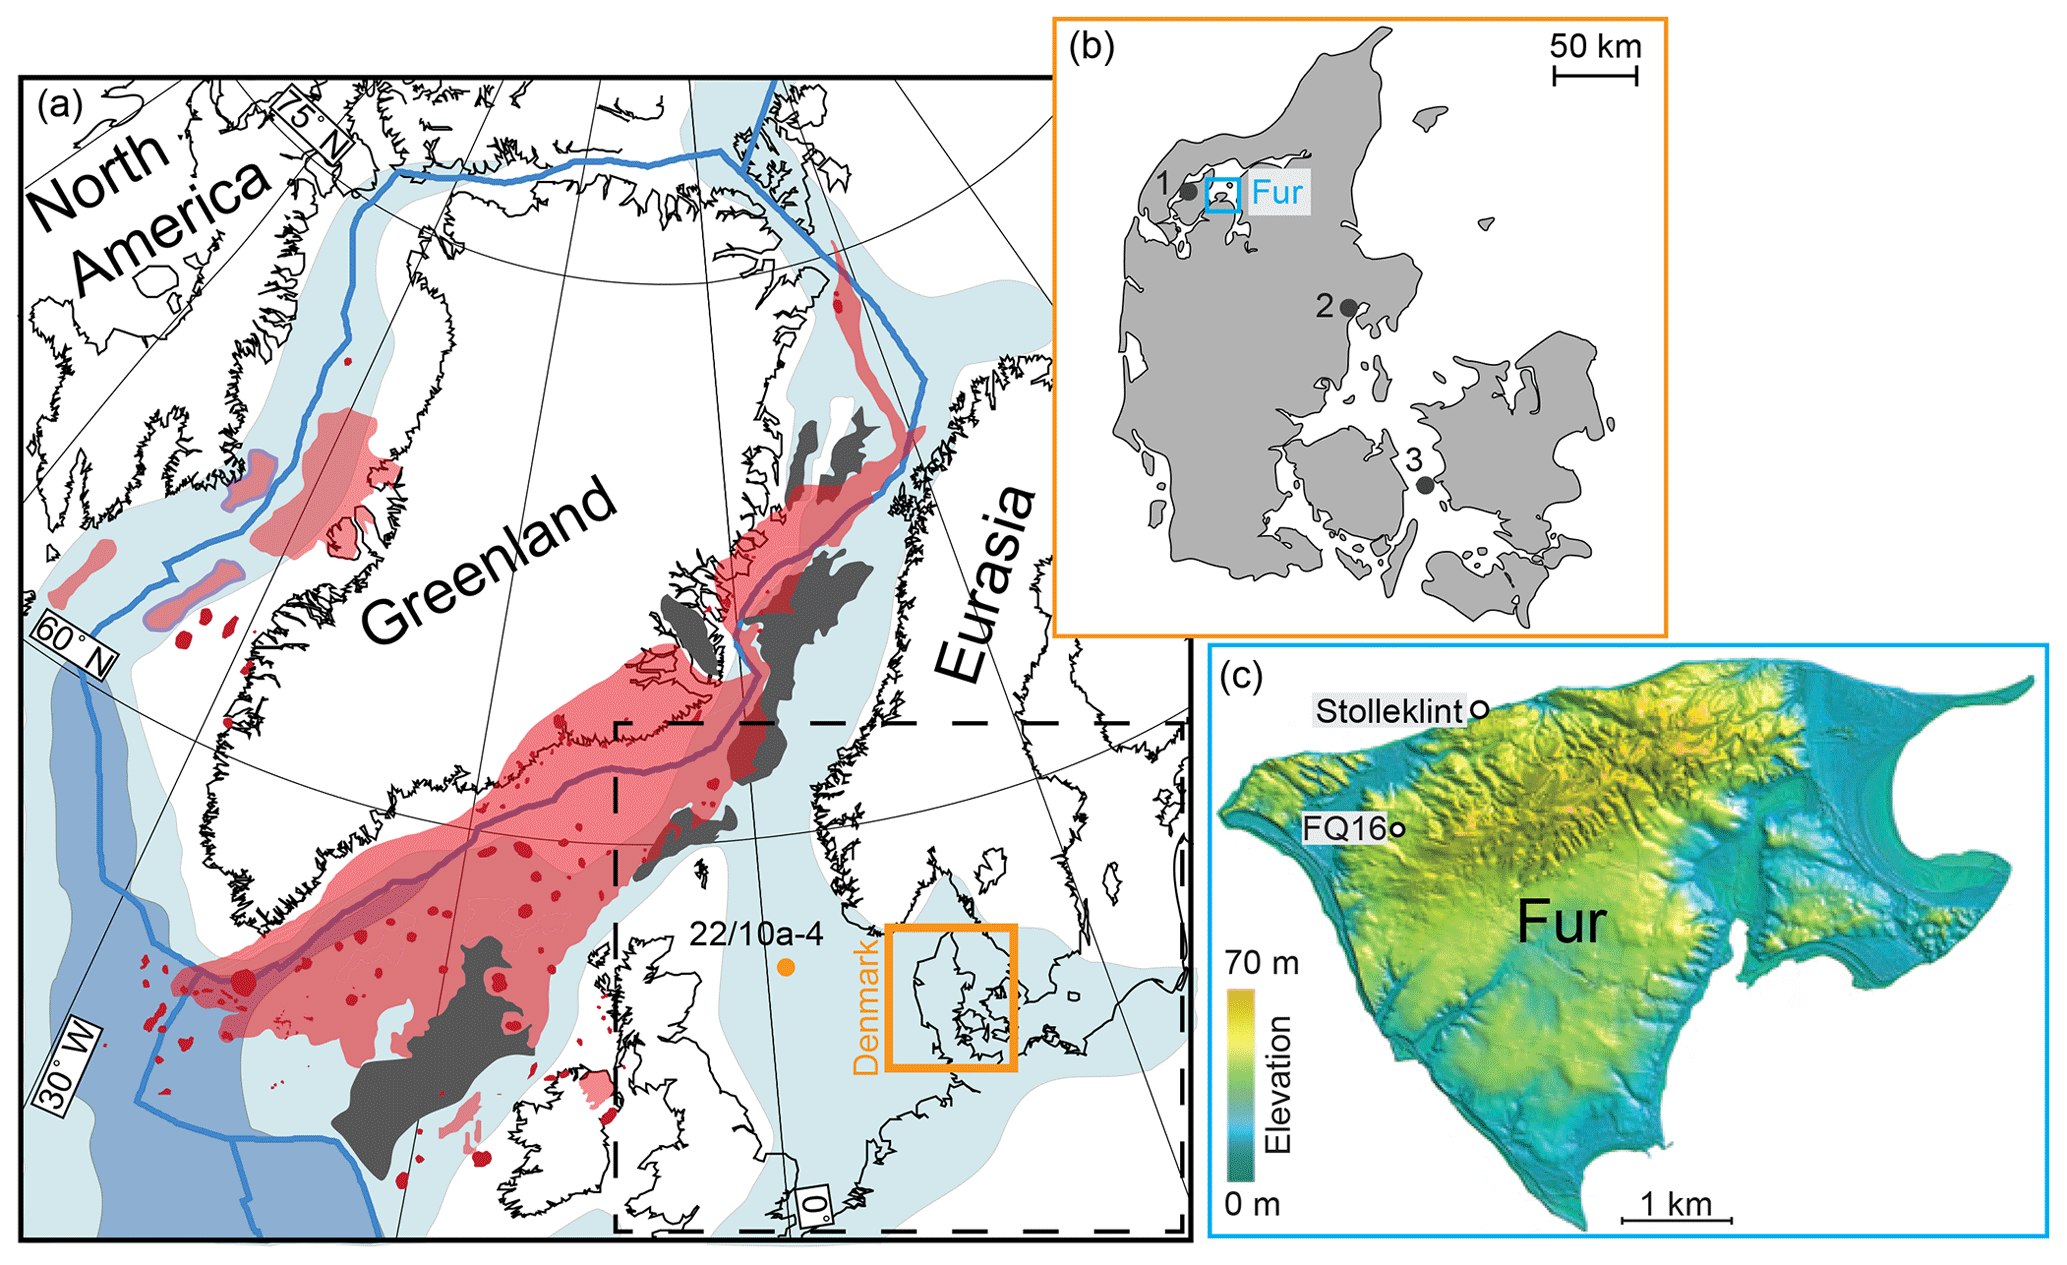
Figure 1(a) Palaeogeographic map from 56 Ma with the known NAIP extent indicated (modified from Abdelmalak et al., 2016, Horni et al., 2017, and Jones et al., 2019). The orange dot notes the position of core 22/10a-4 described by Kender et al. (2012) and Kemp et al. (2016). Blue lines: plate boundaries. Black lines: present-day coastlines. Light and dark blue areas: shelf and deep marine areas respectively. Light red areas: known extent of subaerial and submarine extrusive volcanism from the NAIP. Dark red: individual volcanic centres. Black areas: extent of known NAIP sill intrusions in sedimentary basins. The total extent of intrusions beneath the extrusive volcanism is not known. The dashed square indicates the position of Fig. 11. (b) Map of Denmark showing the location of the study area Fur. Additional locations from other relevant studies are indicated as 1 Mors, 2 Ølst, and 3 Store Bælt. (c) Topographic map of the island of Fur (22 km2) with the two sample sites indicated. The high topography in the north of the island is a partially overturned anticline of Fur Formation and upper Stolleklint Clay strata. Figure modified from Stokke et al. (2020a).
Marine uptake of increased atmospheric CO2 altered the ocean chemistry during the PETM, leading to deep ocean acidification and substantial deep-sea carbonate dissolution (Zachos et al., 2005; Babila et al., 2018). The temperature increase and ocean acidification were accompanied by transient ocean circulation changes, increased halocline stratification, and a global reduction in bottom-water oxygen (Kennet and Stott, 1991; Nunes and Norris, 2006; Kender et al., 2012; Pälike et al., 2014). This led to the extinction of 30 %–50 % of all benthic foraminifera species (Thomas, 1990; Thomas and Shackleton, 1996; Alegret et al., 2009; Nagy et al., 2013). Anoxic conditions were less extensive during the PETM than in previous ocean anoxic events (Jenkyns, 2010), and there were large regional variations in ocean oxygenation (Pälike et al., 2014). Still, globally widespread ocean deoxygenation has been recognized (Pälike et al., 2014; Zhou et al., 2014; Yao et al., 2018), with particularly prevalent anoxic to euxinic conditions observed in semi-enclosed shelf areas such as in the Tethys Ocean (Egger et al., 2003; Khozyem et al., 2013), Peri-Tethys Basin (Gavrilov et al., 1997; Speijler et al., 1997; Dickson et al., 2014), the North Sea (Schoon et al., 2015), and the Arctic Ocean (Stein et al., 2006; Harding et al., 2011).
The hydrological cycle also changed substantially during the PETM (e.g. Carmichael et al., 2017), with modelling studies suggesting an overall increase in extreme weather events (Carmichael et al., 2018). Proxy evidence indicates a more humid climate, particularly at higher latitudes and in marginal marine areas such as Antarctica (Robert and Kennett, 1994), the northeast US coast (Gibson et al., 2000; John et al., 2012), the Tethys (Bolle et al., 2000; Egger et al., 2003; Khozyem et al., 2013), the North Atlantic (Bornemann et al., 2014), the North Sea (Kender et al., 2012; Kemp et al., 2016), and the Arctic (Dypvik et al., 2011; Harding et al., 2011). In contrast, areas such as the Pyrenees (Schmitz and Pujalte, 2003) and the US interior (Kraus and Riggins, 2007) show evidence of more arid climates. There seems to be considerable regional and temporal variation in the hydrological changes, with an increased meridional transport of water vapour from low to high latitudes leading to an overall dry–dryer, wet–wetter climate response to the global warming (Carmichael et al., 2017).
The 4–5 ∘C PETM temperature increase (Thomas et al., 2002; Dunkley Jones et al., 2013; Frieling et al., 2017) is comparable to that predicted in response to the current anthropogenic carbon emissions (Riahi et al., 2017). The PETM is therefore an important natural analogue for future greenhouse conditions, as the environmental and ecological response may hold clues for the consequences of present-day global warming (Zachos et al., 2010; Alley, 2016; Penman and Zachos, 2018; Svensen et al., 2019). Model predictions suggest that the current global warming will lead to an enhanced hydrological cycle, akin to that indicated by PETM proxy records (Held and Soden, 2006; Seager et al., 2010; Trenberth, 2011). The intensification of both droughts and extreme weather events is already occurring in parts of the world, with substantial consequences for human settlements (e.g. Riahi et al., 2017). Similarly, a decrease in ocean oxygenation has been observed for the last 50 years, most likely resulting from the current global warming (Bograd et al., 2008; Stramma et al., 2012). The spread of marine anoxia is a well-known consequence of global warming, negatively affecting marine ecosystems as a whole (Stramma et al., 2008; Gilly et al., 2013). Understanding the timing and regional distribution of the environmental response to global warming in the past is therefore vital to meet the challenges of the future.
The Stolleklint section on the island of Fur in northwest Denmark offers an excellent opportunity to study the environmental response to temperature changes during the PETM in detail (Fig. 1). Denmark is placed in the eastern part of the epicontinental North Sea, which during the latest Paleocene became a highly restricted basin due to NAIP thermal uplift (Knox et al., 2010). During the PETM the North Sea was characterized by bottom-water deoxygenation (Schoon et al., 2015) and a high sedimentary input, significant surface water freshening, and the development of halocline stratification reflecting an intensified hydrological cycle (Zacke et al., 2009; Kender et al., 2012; Kemp et al., 2016). At Stolleklint, the PETM is recognized by a negative 4.5 ‰ CIE and the appearance of the diagnostic dinoflagellate Apectodinium augustum at the base of the earliest Eocene Stolleklint Clay (Fig. 2; Heilmann-Clausen, 1994; Schmitz et al., 2004; Schoon et al., 2013; Jones et al., 2019). The Stolleklint Clay – which covers the PETM interval in Denmark – is a thermally immature and expanded clay-dominated unit, making this a unique and particularly well-suited section for detailed geochemical analyses. Located in a likely downwind direction and within proximity to the NAIP, Denmark was also ideally placed to record the contemporary volcanic activity from the NAIP (Fig. 1) that lasted between ∼ 63–54 Ma (Jones et al., 2019; Stokke et al., 2020b; Wilkinson et al., 2017). This is evidenced by the hundreds of NAIP tephra layers interbedded in the Danish and North Sea stratigraphy, mainly deposited during the most voluminous phase of the NAIP between ∼ 56–54 Ma (Fig. 2; Bøggild, 1918; Knox and Morton, 1988; Larsen et al., 2003). The NAIP importance in the PETM initiation and termination is a topic of much discussion (Svensen et al., 2004; Jolley and Widdowson, 2005; Storey et al., 2007a; Frieling et al., 2016; Saunders, 2016; Gutjahr et al., 2017; Jones et al., 2019). To refine this relationship, better constraints on the relative timings of volcanic activity and climatic and environmental changes are needed.
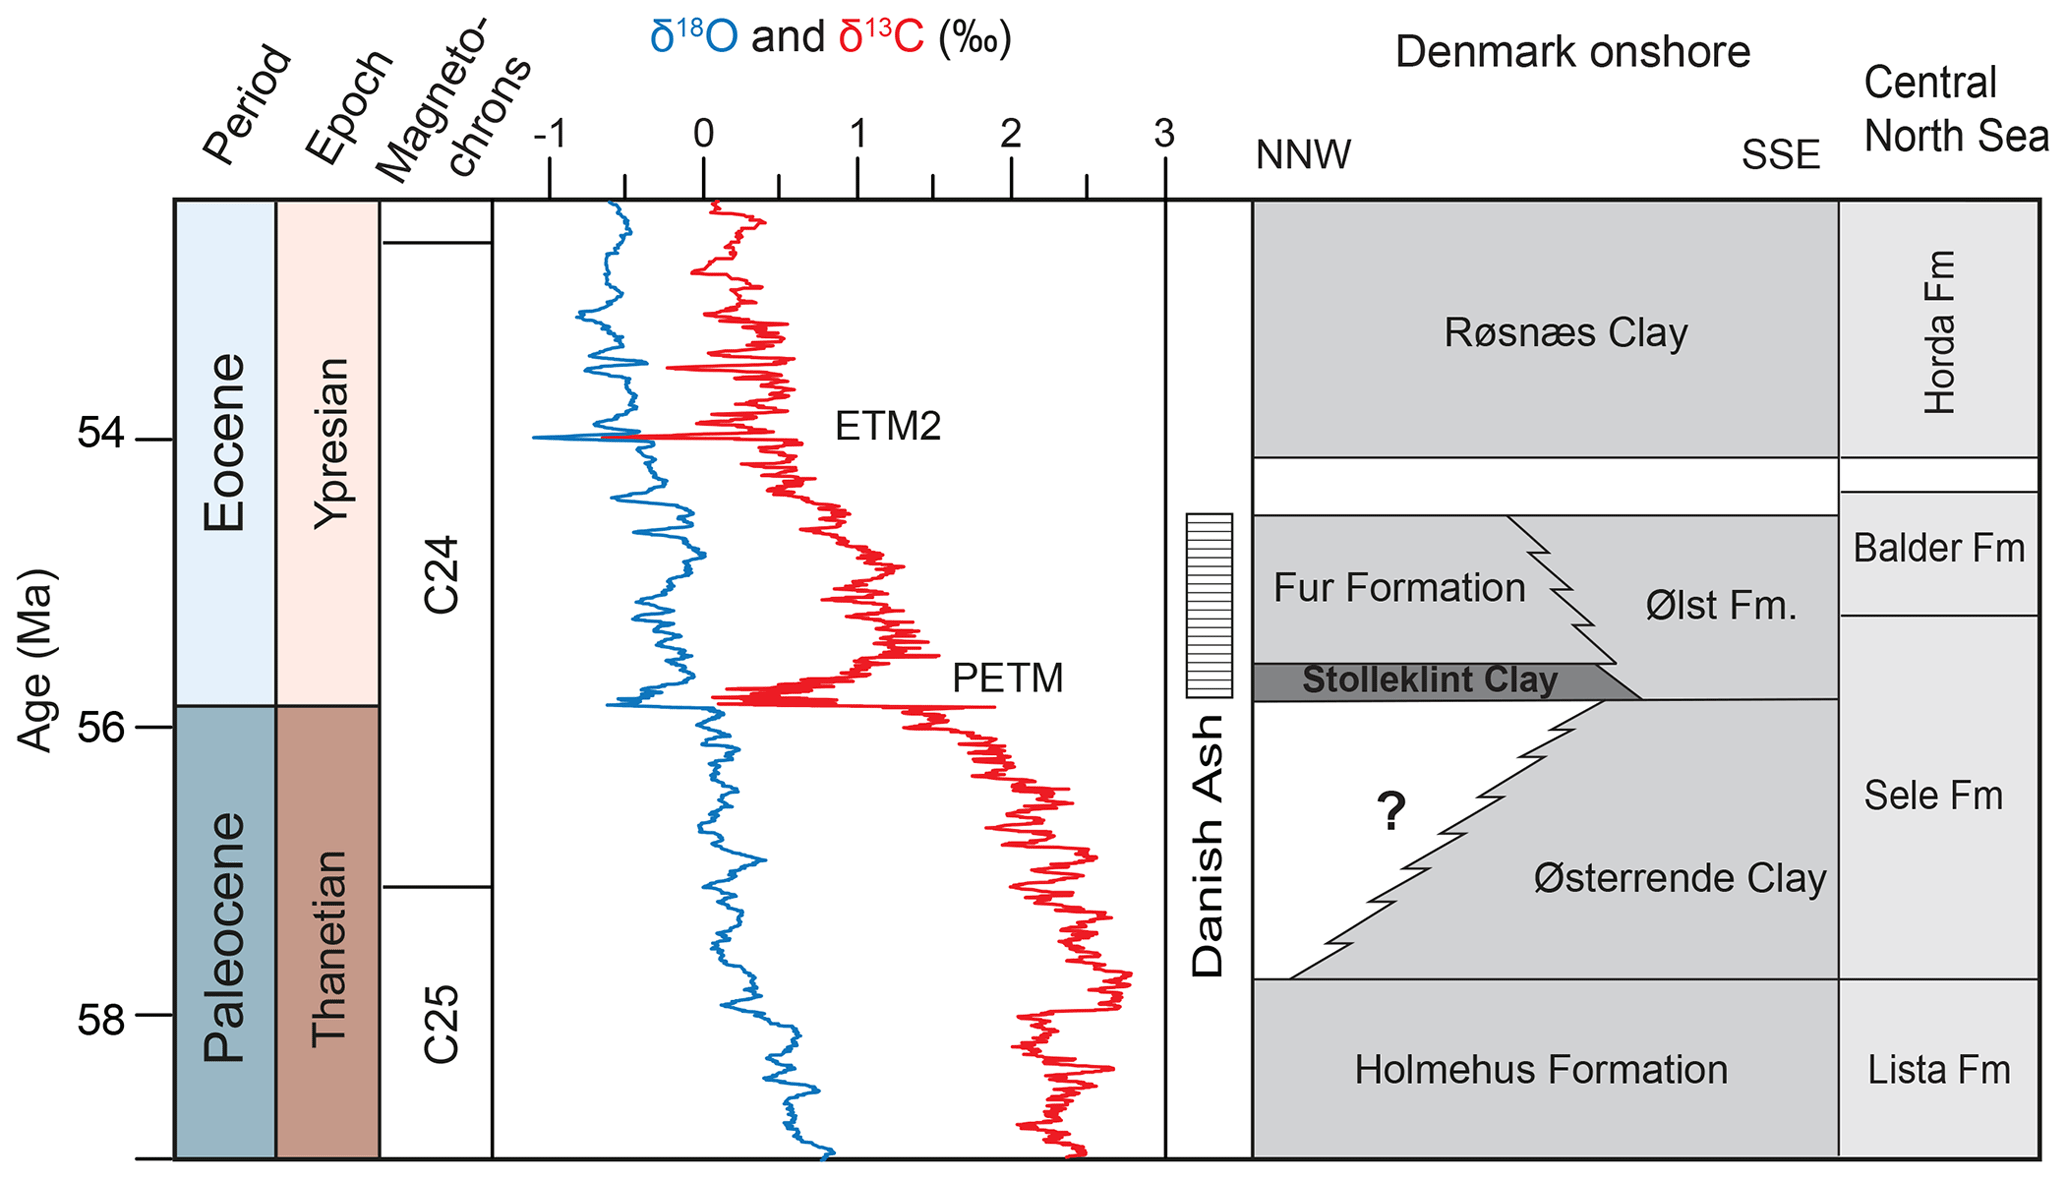
Figure 2Composite figure of the late Paleocene and early Eocene interval, indicating both the Danish stratigraphy and the correlative offshore North Sea stratigraphy. Stratigraphy from King (2016) and Schiøler et al. (2007). The δ13C and δ18O curves indicate the stratigraphic position of two periods of carbon perturbation; the Paleocene–Eocene Thermal Maximum (PETM) and the Eocene Thermal Maximum 2 (ETM2). Carbon and oxygen isotope data from Cramer et al. (2009) and Littler et al. (2014) are plotted on the GTS2012 timescale (Ogg, 2012).
A high-resolution sea surface temperature (SST) reconstruction from Stolleklint based on the organic palaeothermometer TEX86 found that SSTs increased by about 10 ∘C across the CIE onset and then gradually decreased during the CIE body and recovery (Stokke et al., 2020a). In the present study, we combine mineralogical, sedimentological, and geochemical proxies to investigate the relationship between changes in temperature and variations in both basin oxygenation and sediment input; the latter typically inferred to indicate changes in terrestrial erosion and runoff. Both increased weathering of siliciclastic rocks and enhanced sequestration of organic carbon have been proposed as important negative feedback mechanisms, potentially driving the PETM recovery (Speijer and Wagner, 2002; Bowen and Zachos, 2010; Ma et al., 2014; Penman, 2016; Dunkley Jones et al., 2018). Better constraints on the timing and global extent of increased silicate weathering and organic-matter sequestration are therefore vital for understanding the PETM termination.
Stolleklint is located on the northern shore of the island of Fur in northwest Denmark (Fig. 1). In the Palaeogene, Fur was part of the Norwegian–Danish Basin, a marginal basin in the eastern semi-enclosed epicontinental North Sea (Rasmussen et al., 2008; Knox et al., 2010). The Norwegian–Danish Basin forms a NW- to SE-striking depression, bounded by the Fennoscandian Shield and the Sorgenfrei–Tornquist Zone to the NE and basement blocks in the Ringkøbing–Fyn High to the SW (Schiøler et al., 2007). Salt diapirs of Zechstein salt create additional restricting structures within the Norwegian–Danish Basin (e.g. Petersen et al., 2008).
The base of the section at Stolleklint likely comprises the Holmehus Formation, which correspond to the Lista Formation offshore in the North Sea (Figs. 2, 3, 4). This is a hemipelagic, bioturbated fine-grained mudstone, representing the culmination of a long period of transgression in the latest Paleocene Denmark (Heilmann-Clausen, 1995). In the latest Paleocene, a combination of thermal uplift around the NAIP (Knox, 1996) and tectonic uplift along the Sorgenfrei–Tornquist Zone (Clausen et al., 2000) led to a relative sea-level fall and almost complete isolation of the North Sea Basin (Knox et al., 2010). In Denmark, this resulted in either erosion of the latest Paleocene strata, a hiatus in deposition, or deposition of the informal Østerrende clay unit above the Holmehus Formation. However, the Østerrende clay unit has a very limited regional distribution, and it is uncertain how much is present at Stolleklint despite its presence further south in Denmark (Fig. 2; Schmitz et al., 2004; King, 2016). Schoon et al. (2015) correlated the uppermost Paleocene stratigraphy at Fur with the Østerrende clay similar to that seen at Store Bælt (Fig. 1a). However, the Østerrende clay is absent in cores drilled at Mors ∼ 20 km to the west and at Ølst ∼ 80 km to the SE (Fig. 1a; Heilmann-Clausen, 1995), suggesting that a hiatus of uncertain duration followed the Holmehus Formation at Stolleklint. Still, due to the uncertainty of this boundary, we will henceforth refer to the lowermost unit as the Holmehus/Østerrende Formation.
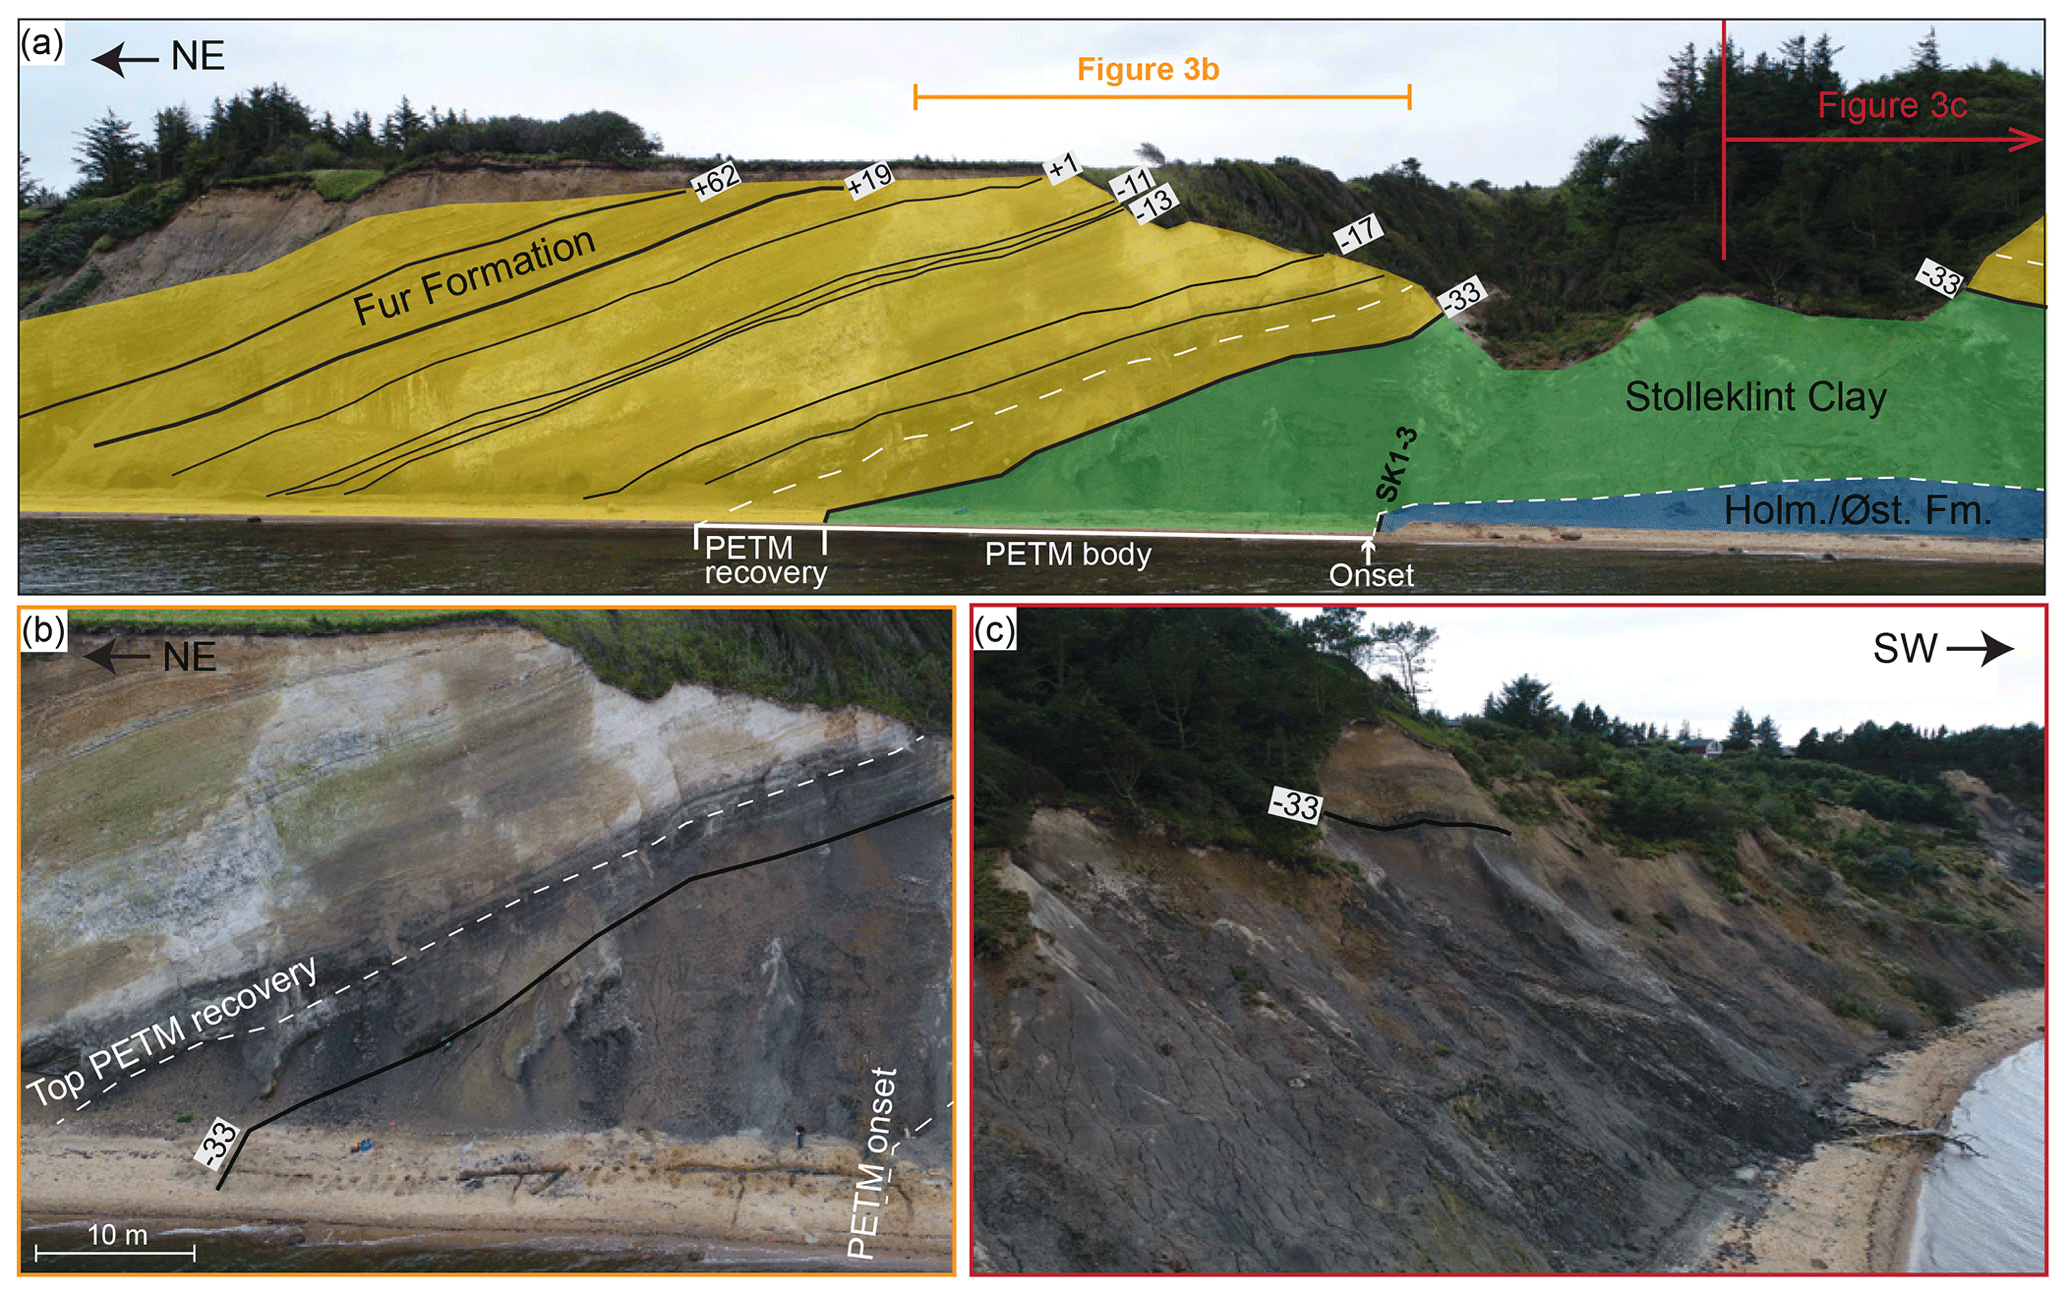
Figure 3(a) The coastal cliff at the Stolleklint beach with the main stratigraphic units shown as yellow (Fur Formation), green (Stolleklint Clay), and blue (Holmehus/Østerrende Formation). The black lines indicate certain key ash layers, and white dashed lines indicate the upper and lower bounds of the PETM CIE. (b) Close-up of the central part of the cliff face showing the colour difference between the dark PETM clays and the light post-PETM diatomites. Ash −33 and the PETM CIE are indicated. Note the 43 m long ditch on the beach where most of the samples were collected. (c) Picture of the continued cliff side towards the west, showing the extensive coastal erosion. Approximate location of Ash −33 is indicated.
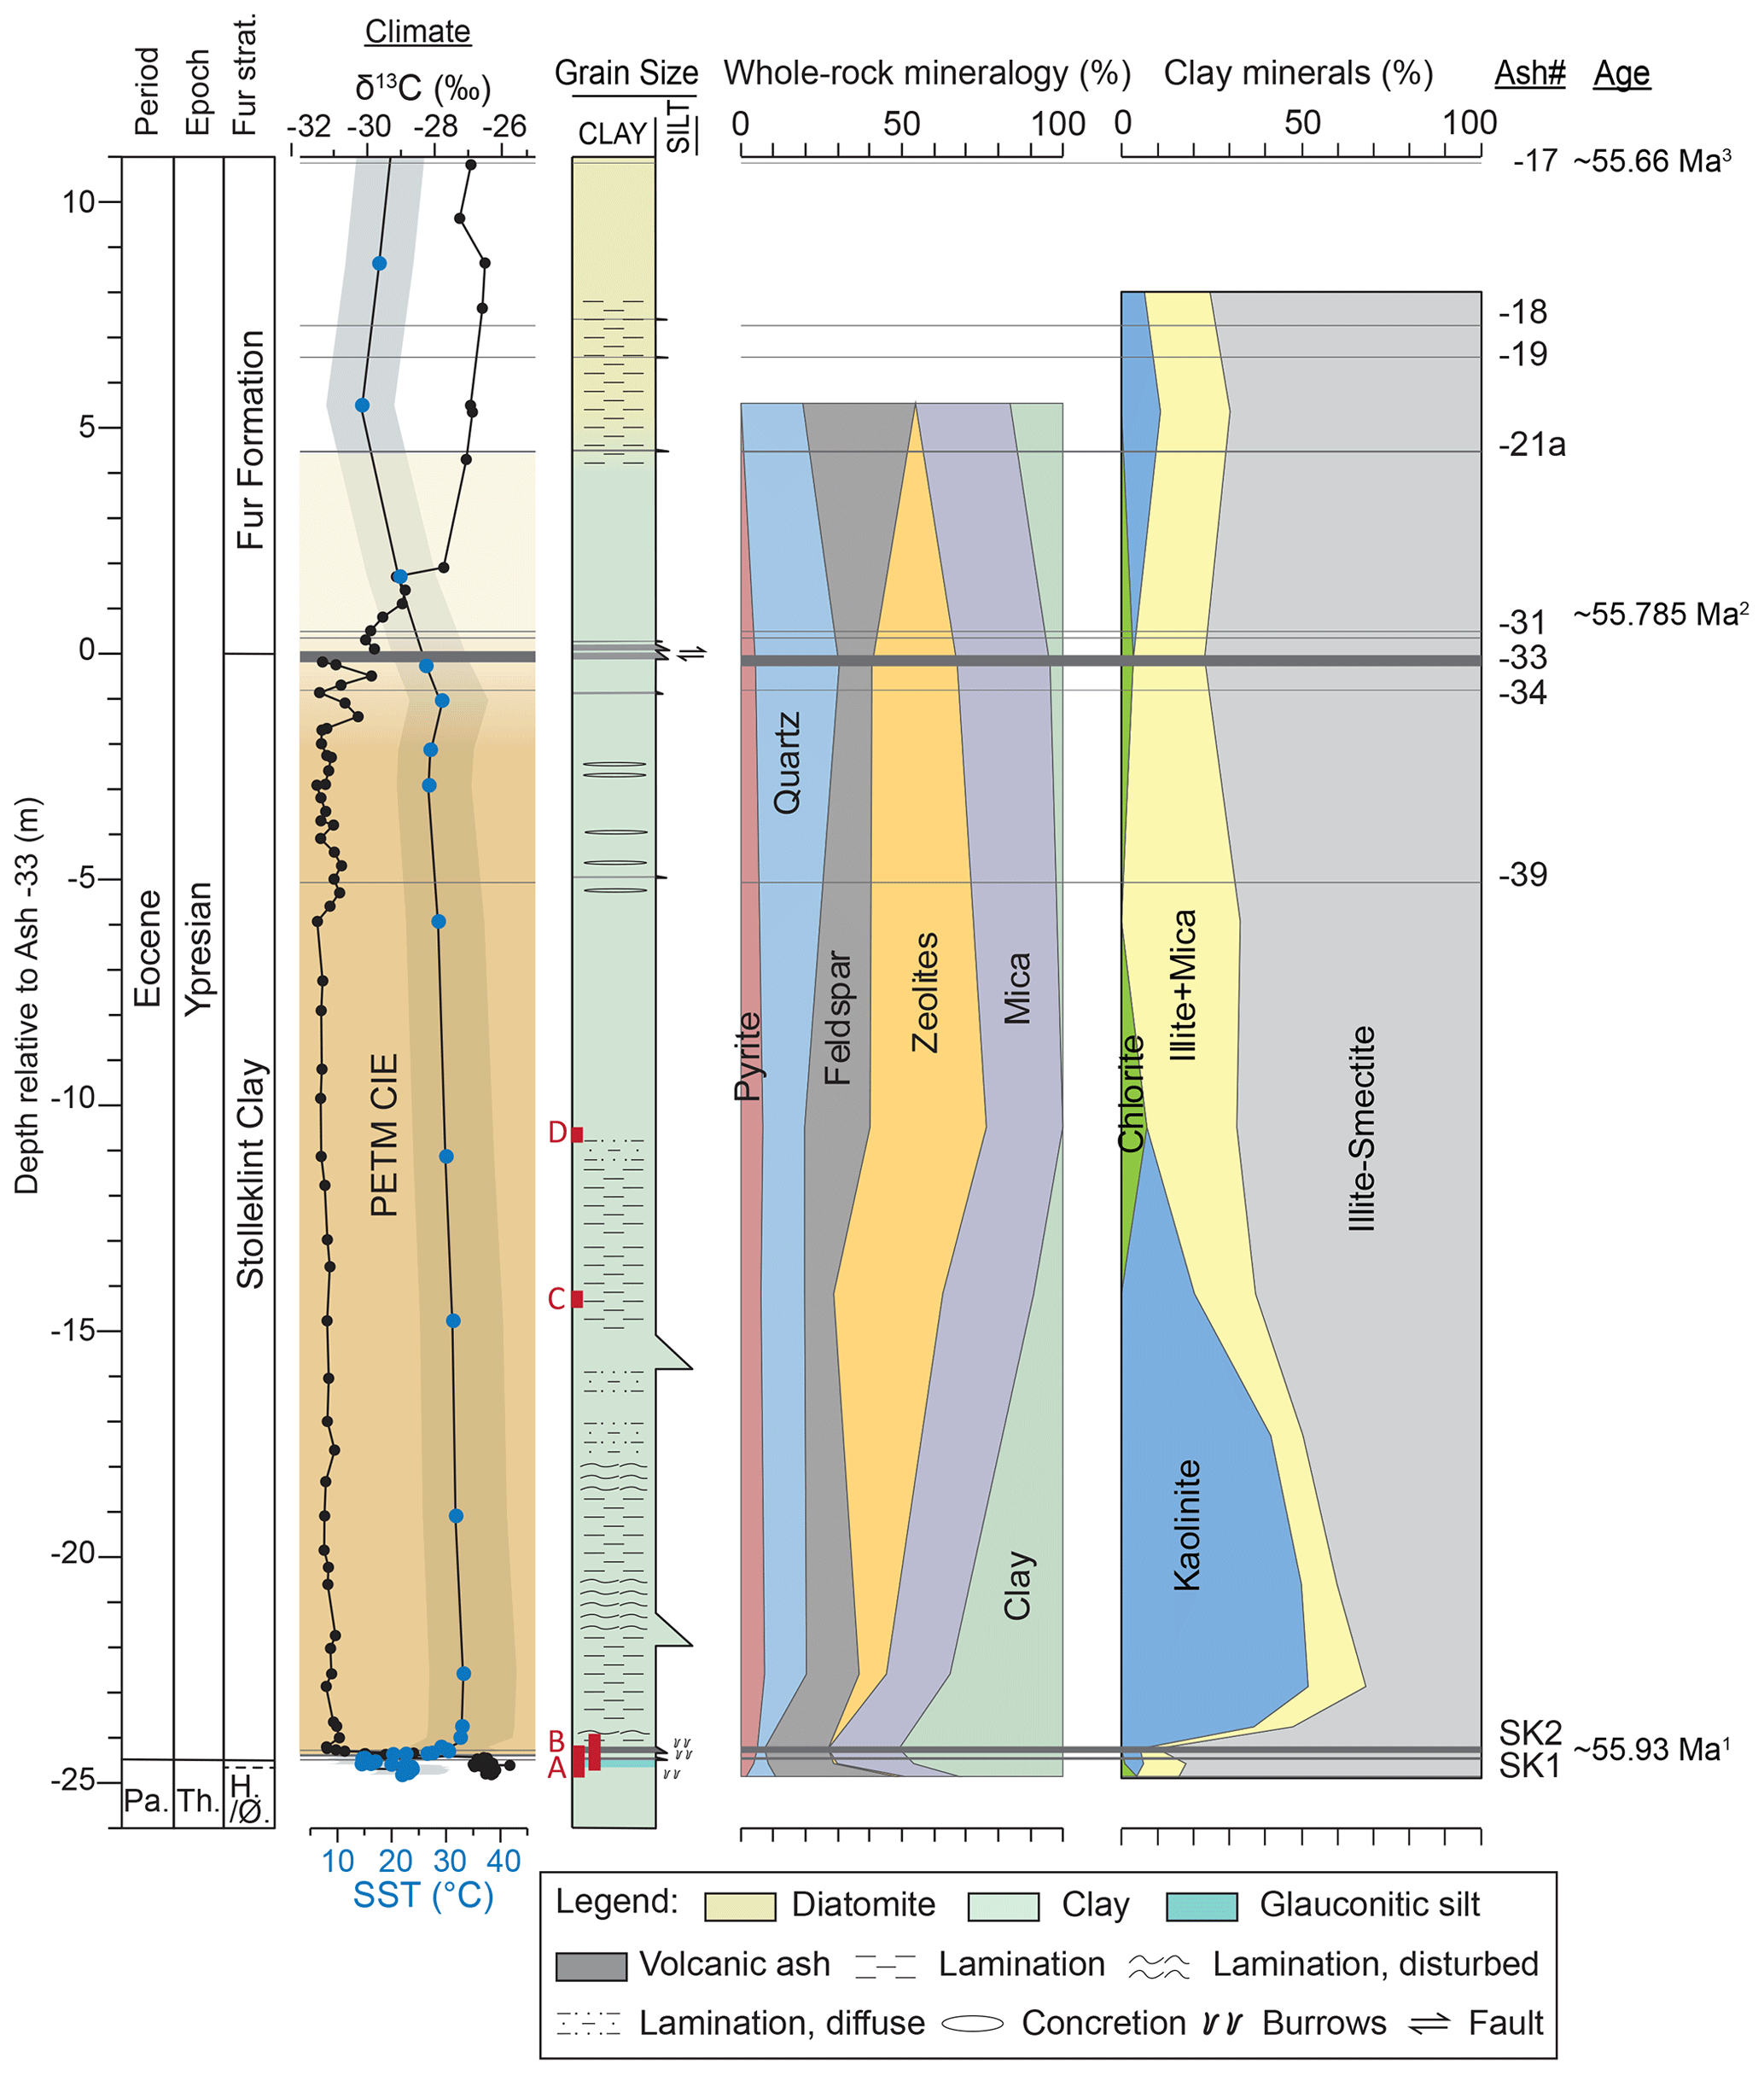
Figure 4The studied stratigraphy from the island of Fur shown on the left with the depth scale measured upwards and downwards from the main marker bed Ash −33. Strat.: stratigraphy; Pa.: Paleocene; Th.: Thanetian; H./Ø.: Holmehus/Østerrende Formation (dotted line indicate base of the glauconitic silt). Overall climate indicated is based on previously published data from the study area. The yellow column indicates the interpreted PETM CIE duration, based on the δ13C curve from Jones et al. (2019). The base of the column marks the CIE onset, and the gradually lighter colours toward the top mark the CIE recovery. Sea surface temperature (SST) variations are given as BAYSPAR (Tierney and Tingley, 2014)-calibrated TEX86 SSTs with 1σ error bar indicated by the light blue area (Stokke et al., 2020a). Sedimentological log from Stolleklint with legend below. Red squares labelled A–D indicate the stratigraphic position of XRF box-core scans shown in Figs. 5 and 6. Bulk rock mineralogy and clay fraction mineralogy (< 2 µm) is presented as percentages. Note that the clay fraction represents separate analyses with a much lower detection limit than the bulk analyses, and therefore does not directly reflect the results of the bulk mineralogy. Ages indicated on the right are based on the following sources, indicated by superscript numbers: 1 – estimated age for PETM onset from Westerhold et al. (2018); 2 – age of bentonite from Charles et al. (2011) marking the middle of the PETM recovery assuming the Svalbard and Fur CIEs timing is coeval; 3 – corrected Ar–Ar age of Ash −17 from Storey et al. (2007a) recalibrated to the Fish Canyon Tuff (FCT) calibration from Renne et al. (2010, 2011) to 55.66 ± 0.12 Ma.
The Paleocene–Eocene transition is seen as a lithological shift from the Holmehus/Østerrende Formation bioturbated clays to the dark, laminated clays of the Stolleklint Clay (Figs. 3, 4; Heilmann-Clausen et al., 1985; Heilmann-Clausen, 1995; King, 2016). The lithological change is accompanied by the almost complete absence of benthic fauna and preferential dissolution of remaining calcareous organisms within the Stolleklint Clay (Heilmann-Clausen, 1995; Mitlehner, 1996). The Stolleklint Clay is an informal unit, representing the lower Ølst Formation in northern Denmark and correlating with the offshore Sele Formation (Fig. 2; Heilmann-Clausen, 1995). A condensed, glauconite-rich silty horizon marks the Stolleklint Clay base (Heilmann-Clausen, 1995; Schmitz et al., 2004; Schoon et al., 2015). This glauconite-rich silt contains mainly authigenic and biogenic grains and was likely deposited in an upper bathyal to outer neritic environment with low sedimentation rates (Nielsen et al., 1986; Schoon et al., 2015). A relative sea-level rise is recorded in PETM sections in the Atlantic, Pacific, Tethyan, and Arctic oceans (Sluijs et al., 2008; Harding et al., 2011; Pujalte et al., 2014; Sluijs et al., 2014). It was likely caused by thermal expansion of seawater due to global warming (Sluijs et al., 2008) and may pre-date the PETM by up to 20–200 kyr (John et al., 2012). Although this transgression was overprinted by regional tectonically forced regression in the latest Paleocene, the earliest Eocene Stolleklint Clay is deposited in an outer neritic environment (between 100–200 m; Knox et al., 2010; Schoon et al., 2015) during a gradual transgression (Heilmann-Clausen, 1995). The Stolleklint Clay is overlain by the ∼ 60 m thick clay-rich Fur Formation diatomites (Figs. 3, 4), correlating to the offshore Sele and Balder formations (Fig. 2). At Stolleklint, the PETM is defined by a negative CIE of −4.5 ‰ based on stable carbon isotopes of bulk samples (δ13CTOC). The CIE is characterized by a sharp (2 cm) onset above Ash SK2 at the base of the Stolleklint Clay, a thick stable body phase (∼ 24 m), and a gradual recovery (∼ 4.5 m) from about Ash −33 to around Ash −21a (Figs. 3, 4; Jones et al., 2019). Recent glaciotectonic activity has resulted in a relatively steep bedding with internal small-scale folding and thrusting (Pedersen, 2008), complicating stratigraphic thickness estimates. Jones et al. (2019) used trigonometry to estimate a local true thickness of 24.4 ± 2 m (24.2 m excluding ash layers) for the PETM onset and body at the Stolleklint beach: from the top of Ash SK2 to the base of Ash −33. An overall sedimentation rate was then calculated for the PETM body based on the estimated true thickness and an assumed 100 kyr duration for the PETM body (van de Meulen et al., 2020). The PETM at Stolleklint is consequently associated with a substantially increased sedimentation rate from the condensed glauconitic base to a maximum sediment accumulation rate in the Stolleklint Clay of about 24 cm/kyr (Stokke et al., 2020a).
More than 180 tephras up to 20 cm thick have been identified in the stratigraphy exposed at Fur, with the majority (∼ 140) within the post-PETM Fur Formation (Fig. 2; Bøggild, 1918; Pedersen and Surlyk, 1983). Tephra is a general term for all airborne volcanic fragmented material, but the grain sizes of all the Fur tephras are < 2 mm and therefore within the ash fraction. Heavily altered ashes are called bentonites, and while this applies to some of the lowermost ashes, we will for simplicity use the term ash for all. The volcanic ashes are grouped in a negative and positive ash series based on variations in outcrop appearance and geochemistry (Bøggild, 1918), with additional ash layers SK1–4 identified later at the base of the Stolleklint Clay (Schmitz et al., 2004; Jones et al., 2019). The SK ashes and the negative series are a heterogeneous mix of ash compositions, whereas the positive series are largely comprised of tholeiitic basalts (Morton and Evans, 1988; Larsen et al., 2003). All the ashes are believed to be sourced from NAIP explosive volcanism during the northeast Atlantic opening (Larsen et al., 2003; Storey et al., 2007a; Stokke et al., 2020b). These ash layers are found throughout the North Sea and North Atlantic (Knox and Morton, 1988; Haaland et al., 2000) with some of the major layers traced all the way to Austria (Egger et al., 2000).
3.1 Sampling
Samples were mostly collected from the Stolleklint beach ( N, E; Figs. 1b, 3), with some additional samples from a quarry near Fur Camping (Quarry FQ16 at N, E; Fig. 1b). At Stolleklint, the Stolleklint Clay and the Fur Formation are exposed in the cliff side (Fig. 3). However, the base of the Stolleklint Clay and the Paleocene–Eocene transition were not exposed at the time of field work due to coastal erosion (Fig. 3c). We therefore excavated a 43 m long and 0.5 m deep trench along the beach (Fig. 3b). The estimated true thickness of 24.4 m from the top of Ash SK2 to the base of Ash −33 is used as the depth-scale for stratigraphic presentation (e.g. Fig. 4). The scale is measured as positive and negative depth relative to the base of the main marker bed Ash −33. As the PETM was the main target, samples are collected at highest resolution across the PETM onset and then at lower resolution within the PETM interval and in the post-PETM section: discrete 1 cm thick samples were collected at 1 cm intervals (i.e. 100 % sampling) from ∼ 0.25 m below to ∼ 0.9 m above Ash SK2 and then at 0.5 m intervals (0.2–0.3 m when converted to the estimated true thickness) up to Ash −33. Samples above Ash −33 were collected from the cliff face at Stolleklint at 10–20 cm intervals. Additional samples from −5.6 to +1.9 m relative to the base of Ash −33 were included from the quarry FQ16, sampled at ∼ 30 cm intervals. All samples were oven-dried at ≤ 50 ∘C and powdered in an agate hand mortar or an agate disc mill before further analysis.
The sediments' unconsolidated character enabled the collection of four box cores up-section. The box cores were collected in 50 cm long and 5 cm wide and deep aluminium boxes. These were pushed into the sediments before surrounding material was removed and the box cut away with its content intact using a steel wire. Box cores were collected in order to get complete recovery of selected intervals for XRF core scanning (Fig. 4). Two box cores were collected across the PETM onset (−24.90 to −24.40 m and −24.63 to −24.20 m stratigraphic depth intervals), and two from the PETM body with one from the lower laminated part (−14.47 to −14.17 m) and one from the more homogenous upper part (−10.81 to −10.48 m).
3.2 XRD bulk and clay mineralogy
Bulk rock mineralogy was conducted on eight samples from −24.81 to +5.35 m depth, while 13 samples were analysed for clay minerals. The mineralogy of both bulk rock and clay fraction of Fur sediment samples were determined by X-ray diffraction (XRD) analyses on a Bruker D8 ADVANCE diffractometer with a Lynxeye one-dimensional position-sensitive detector (PSD) and CuKα radiation (λ=0.154 nm; 40 mA and 40 kV) at the Department of Geosciences, University of Oslo. The bulk rock fraction was wet milled in a McCrone micronizing mill, prepared as randomly oriented samples, and analysed with a step size of 0.01∘ from 2 to 65∘ (2θ) at a count time of 0.3 s (2θ). The detection limit for bulk rock analyses is about 2 %. The software DIFFRAC-EVA (v. 2.0) was used for phase determination, and phase quantities were determined by Rietveld refinement (Rietveld, 1969) using PROFEX (v. 3.13.0; Doebelin and Kleeberg, 2015).
The clay fraction (< 2 µm) was separated from the crushed whole-rock sample (before wet milling) by gravity settling and then prepared as oriented aggregate mounts using the Millipore filter transfer method (Moore and Reynolds, 1997). As the dried samples had to be powdered prior to separation, they contain some minor contribution from the coarser fraction. XRD clay data were recorded with a step size of 0.01∘ from 2 to 65∘ (2θ) at a count time of 0.3 s (2θ) in air-dried samples and a step size of 0.01∘ from 2 to 34∘ (2θ) at a count time of 0.3 s (2θ) on treated samples. Three rounds of treatments were applied: 24 h of ethylene glycol saturation, 1 h heating at 350 ∘C, and 1 h heating at 550 ∘C. The software NewMod II (Reynolds and Reynolds, 2012) was used for semi-quantification of the XRD patterns of inter-stratified clay minerals.
3.3 XRF elemental core scanning
Non-destructive geochemical measurements and radiographic images were obtained from the box cores with an ITRAX X-ray fluorescence (XRF) core scanner (Croudace et al., 2006) from Cox Analytical Systems at the EARTHLAB facilities, Department of Earth Science, University of Bergen. The core scanner was fitted with a molybdenum X-ray tube run with power settings at 30 kV and 30 mA. The box cores were scanned with 10 s exposure time at 0.5 mm sampling intervals.
3.4 Rock-Eval pyrolysis
A total of 39 samples were analysed between −24.81 and +0.01 m depth. Analyses were conducted at the University of Oxford on a Rock-Eval 6 (Vinci Technologies SA, Nanterre, France; Behar et al., 2001) with pyrolysis and oxidation ovens, a flame ionization detector, and an infra-red cell. Powder aliquots of 50 mg were weighed into crucibles and heated first at a temperature profile of 300–650 ∘C in a pyrolysis furnace and then at 300–850 ∘C in an oxidation oven. For a detailed methodology on the Rock-Eval 6 application, see Lafargue et al. (1998).
The bulk organic-carbon characteristics including the hydrogen index (HI), oxygen index (OI), and Tmax were investigated using Rock-Eval data. The HI corresponds to the quantity of hydrocarbons per gram TOC (expressed as mgHC/gTOC), and the OI corresponds to the quantity of oxygen released as CO and CO2 per gram TOC (expressed as mgCO2/gTOC). Sediment records of HI and OI provide information on both organic-matter sources and processing. The HI typically reflects the relative distribution of terrestrially and marine derived organic matter, while the OI index indicates the degree of oxidation of the organic matter. Although the values are tentative, an HI < 100 may indicate a predominantly terrigenous source, while HI ≫ 100 indicates the presence of a significant amount of aquatic algae (marine and/or freshwater) and/or microbial biomass (e.g. Stein et al., 2006). An upper range of HI values of 200–300 mgHC/gTOC typically indicates primarily marine-derived organic matter (Hare et al., 2014). The ratio of can be used to indicate the degree of organic-matter alteration. An > 2 in sediments typically indicates fresh organic matter, while a high degree of alteration commonly result in an < 1 as oxic degradation preferentially removes hydrogen-rich compounds (Hare et al., 2014). Tmax is the temperature at which the maximum amount of S2 hydrocarbons are generated. It can be used to indicate the degree of organic-matter maturation with Tmax temperatures < 435 ∘C typically indicating immature organic matter (Peters, 1986).
3.5 ICP-MS and element analyser
Analyses were conducted on 24 samples between −24.82 to +5.50 m depth. Dried and crushed marine sediment samples were digested in hydrochloric, hydrofluoric, and nitric acids to give a total dilution of -fold by volume. Major and trace element analyses of digested bulk sediment samples were performed on a PerkinElmer NexION 350D inductively coupled plasma mass spectrometer (ICP-MS). Total sulfur concentrations were analysed on a Coulomat 702 coulometric analyser. Sample digestion and analyses were all conducted at the Department of Earth Sciences, University of Oxford. The method detection limit, accuracy, and precision of the analyses are given in the Supplement (Table 6, Supplement 1). Major elements analysed on ICP-MS were converted from elemental mass units to weight percent oxide equivalents. The trace metals Cu, Ni, Mo, U, and V were calculated as enrichment factors (EFs, Eq. 1) to account for possible dilution using standard element values of the average upper crust from McLennan (2001).
ICP-MS analyses of major elements were used to calculate the chemical index of alteration (CIA; Nesbitt and Young, 1982). The CIA is based on the relative distribution of mobile cations relative to aluminium oxide and indicates the extent of the conversion of feldspars (which dominate the upper crust) to clays such as kaolinite (Nesbitt and Young, 1982). While the CIA may directly represent the rate and intensity of weathering when measured in situ, when measured in marine sediments it becomes more complex as it also reflects changes in the type of sediment sources and the transport sorting processes (Eq. 2; Nesbitt and Young, 1982). The CIA is expressed as
where Al2O5, CaO*, K2O, and Na2O are given as whole-rock molecular proportions and CaO* is the total silicate fraction of CaO corrected for the presence of carbonates and phosphates following the approach of McLennan (1993). First, apatite was accounted for using the molecular proportions:
As we do not have measurements of CaCO3 from the source rock, we assume a ratio of = 1 (McLennan, 1993) and that samples with excess CaO are where CaOap > Na2O. We then find that CaO* equals Na2O where CaOap > Na2O and CaO* equals CaOap where CaOap≤ Na2O.
4.1 Sedimentology
The base of the beach section comprises the Holmehus/Østerrende Formation (Figs. 3, 4), which is composed of dark, blueish clay with pervasive bioturbation. It is overlain by a greenish silty layer indicative of glauconite (marked as G in Fig. 5), with up to coarse sand-sized aggregates of glauconite scattered within the silt. The silt's lower boundary is unclear, but it appears conformable and possibly gradational. The 5 cm thick ash layer SK1 is deposited above the glauconitic silt, with a sharp undulating lower boundary (Fig. 5). About 4.5 cm of structureless, grey clay conformably overlies SK1 and is followed by the ∼ 8 cm thick ash layer SK2 (Fig. 5). Both ashes are light grey and heavily altered. They are normally graded from medium sand to clay-sized particles. Both ashes are partially reworked and become gradually more clay-rich toward the top, with the highest bioturbation intensity at the top of Ash SK2 (Fig. 5). About 2 cm of strongly bioturbated and ash-rich clay overlying the ash is abruptly ended by the initiation of dark laminations (Fig. 5 section B). The exact level of the Stolleklint Clay base is uncertain as the boundary is blurred by ashes SK1 and SK2, but the start of the laminations is included in the Stolleklint Clay, placing the boundary no higher than at the base of the laminations (Fig. 5 section B). Laminated dark clay continues for ∼ 10 cm before the deposition of two ash layers SK3 and SK4, ∼ 1 cm and ∼ 0.4 cm thick respectively (Fig. 5 section B). They are separated by 2 cm of clay with slightly undulating laminations. Above the ash, laminated clay continues about half-way up the beach (Fig. 4), with increasingly folded and disturbed layering (Fig. 6 section C).
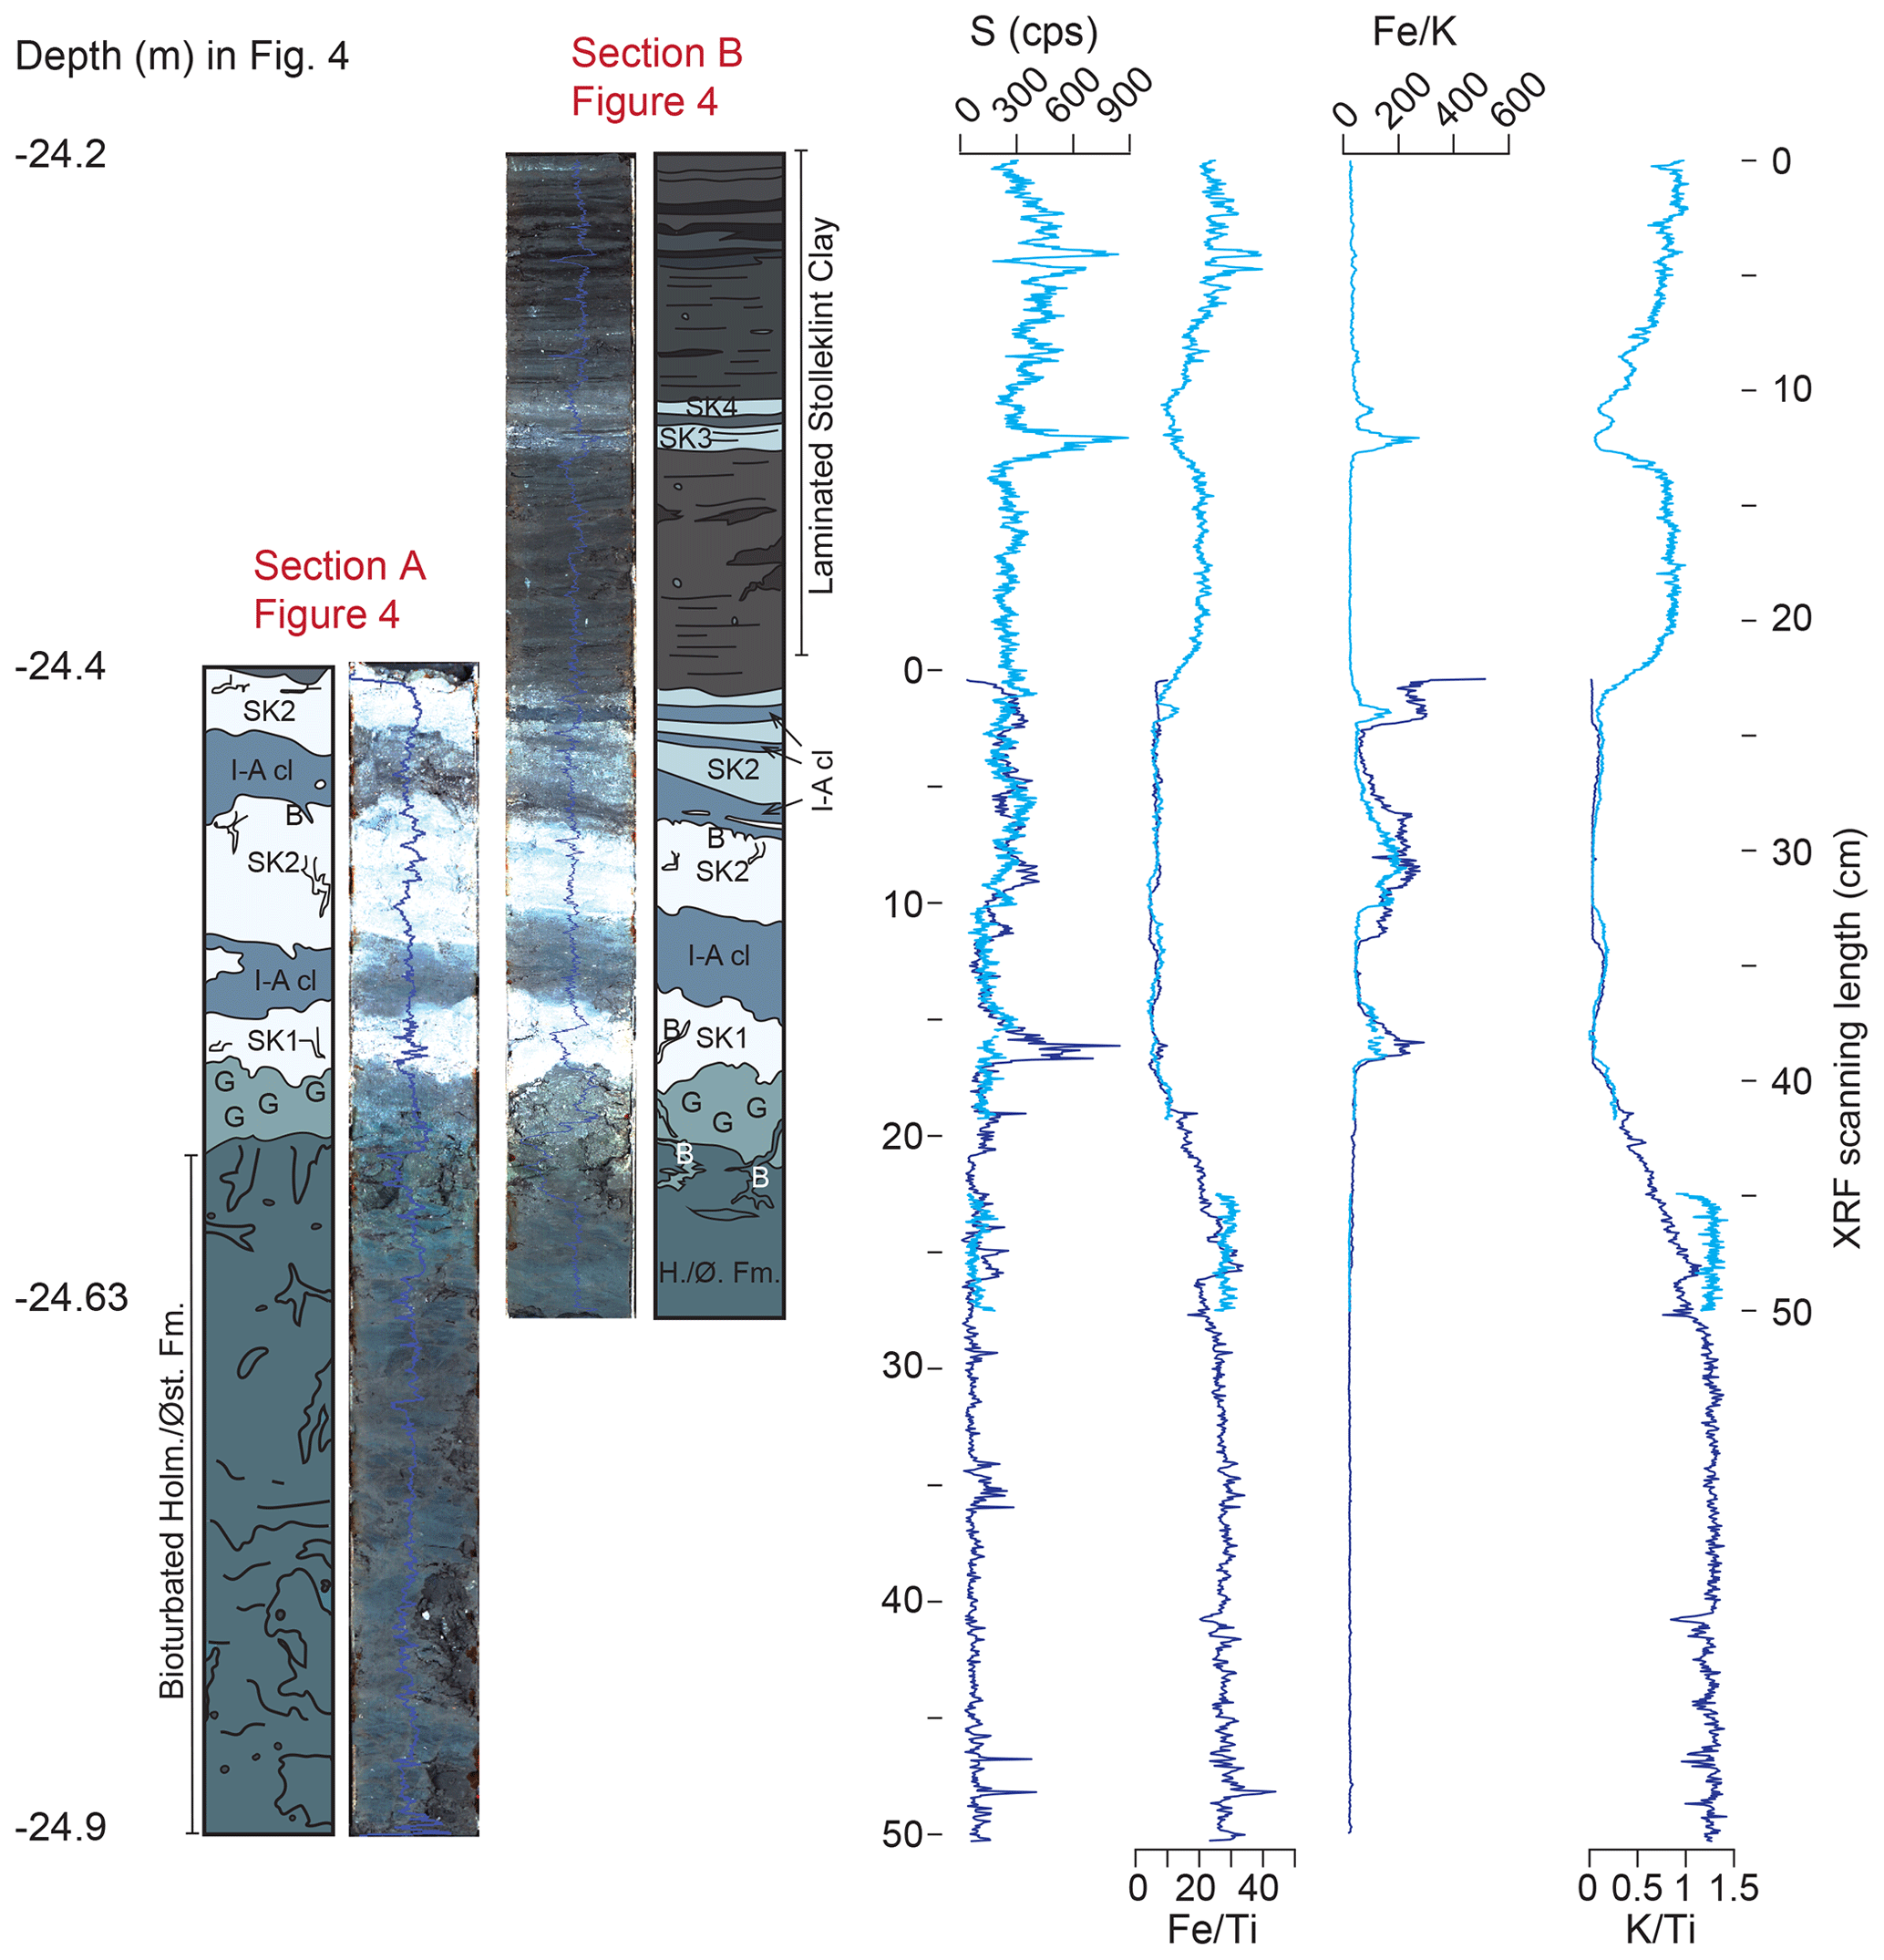
Figure 5XRF element core scans and radiographic images of two box cores crossing the PETM onset at the Stolleklint beach. Note that despite some cracks in the surface below Ash SK1, the sample preservation is overall good and XRF core scanning were conducted on a smoothed surface along the centre avoiding any substantial irregularities. Interpretive logs next to the images indicate the lithological changes. G: glauconite; B: burrow; I-A cl: inter-ash clay. The corrected stratigraphic depth relative to Ash −33 of each section is indicated on the left. XRF scanning length seen on the right indicate actual box-core length. XRF data are given as counts per second (cps) or as dimensionless ratios.
The PETM body is dominated by hemipelagic clay. Above the lower laminated part, it appears to have an upper part (from about −10 m depth) comprising very dark grey clay with no visible laminations in field exposures (Fig. 4). However, the XRF radiographic image reveals that there are intermittent diffuse laminations and patchy structures/colour differences within the clay (Fig. 6 section D). The cause of these colour patches is uncertain but could be a result of depositional variations and/or post-depositional deformation. Between about −6 and −2 m depth there are some highly pyritized concretions or likely broken up concreted layers (Fig. 4). Ash layers reappear from about −5 m depth with deposition of the thin (∼ 2 cm), black Ash −39 (Fig. 4). Ashes −34, −33, −32, and −31 are deposited relatively closely spaced between −0.85 to +0.05 m depth, with thicknesses of 2, 20, 2, and 3 cm respectively. The thickest layer, Ash −33, is repeated at the Stolleklint Beach, due to a small glaciotectonic thrust fault (Fig. 4). The boundary between the Stolleklint Clay and the Fur Formation is formally placed at Ash −33 (Heilmann-Clausen, 1995), although there is no sharp lithological boundary (Figs. 3, 4). Dark clays continue upward with a gradually increasing diatomite content. Laminations reappear at about +6 m depth, as the lithology becomes dominated by clay-rich diatomite (Fig. 4).
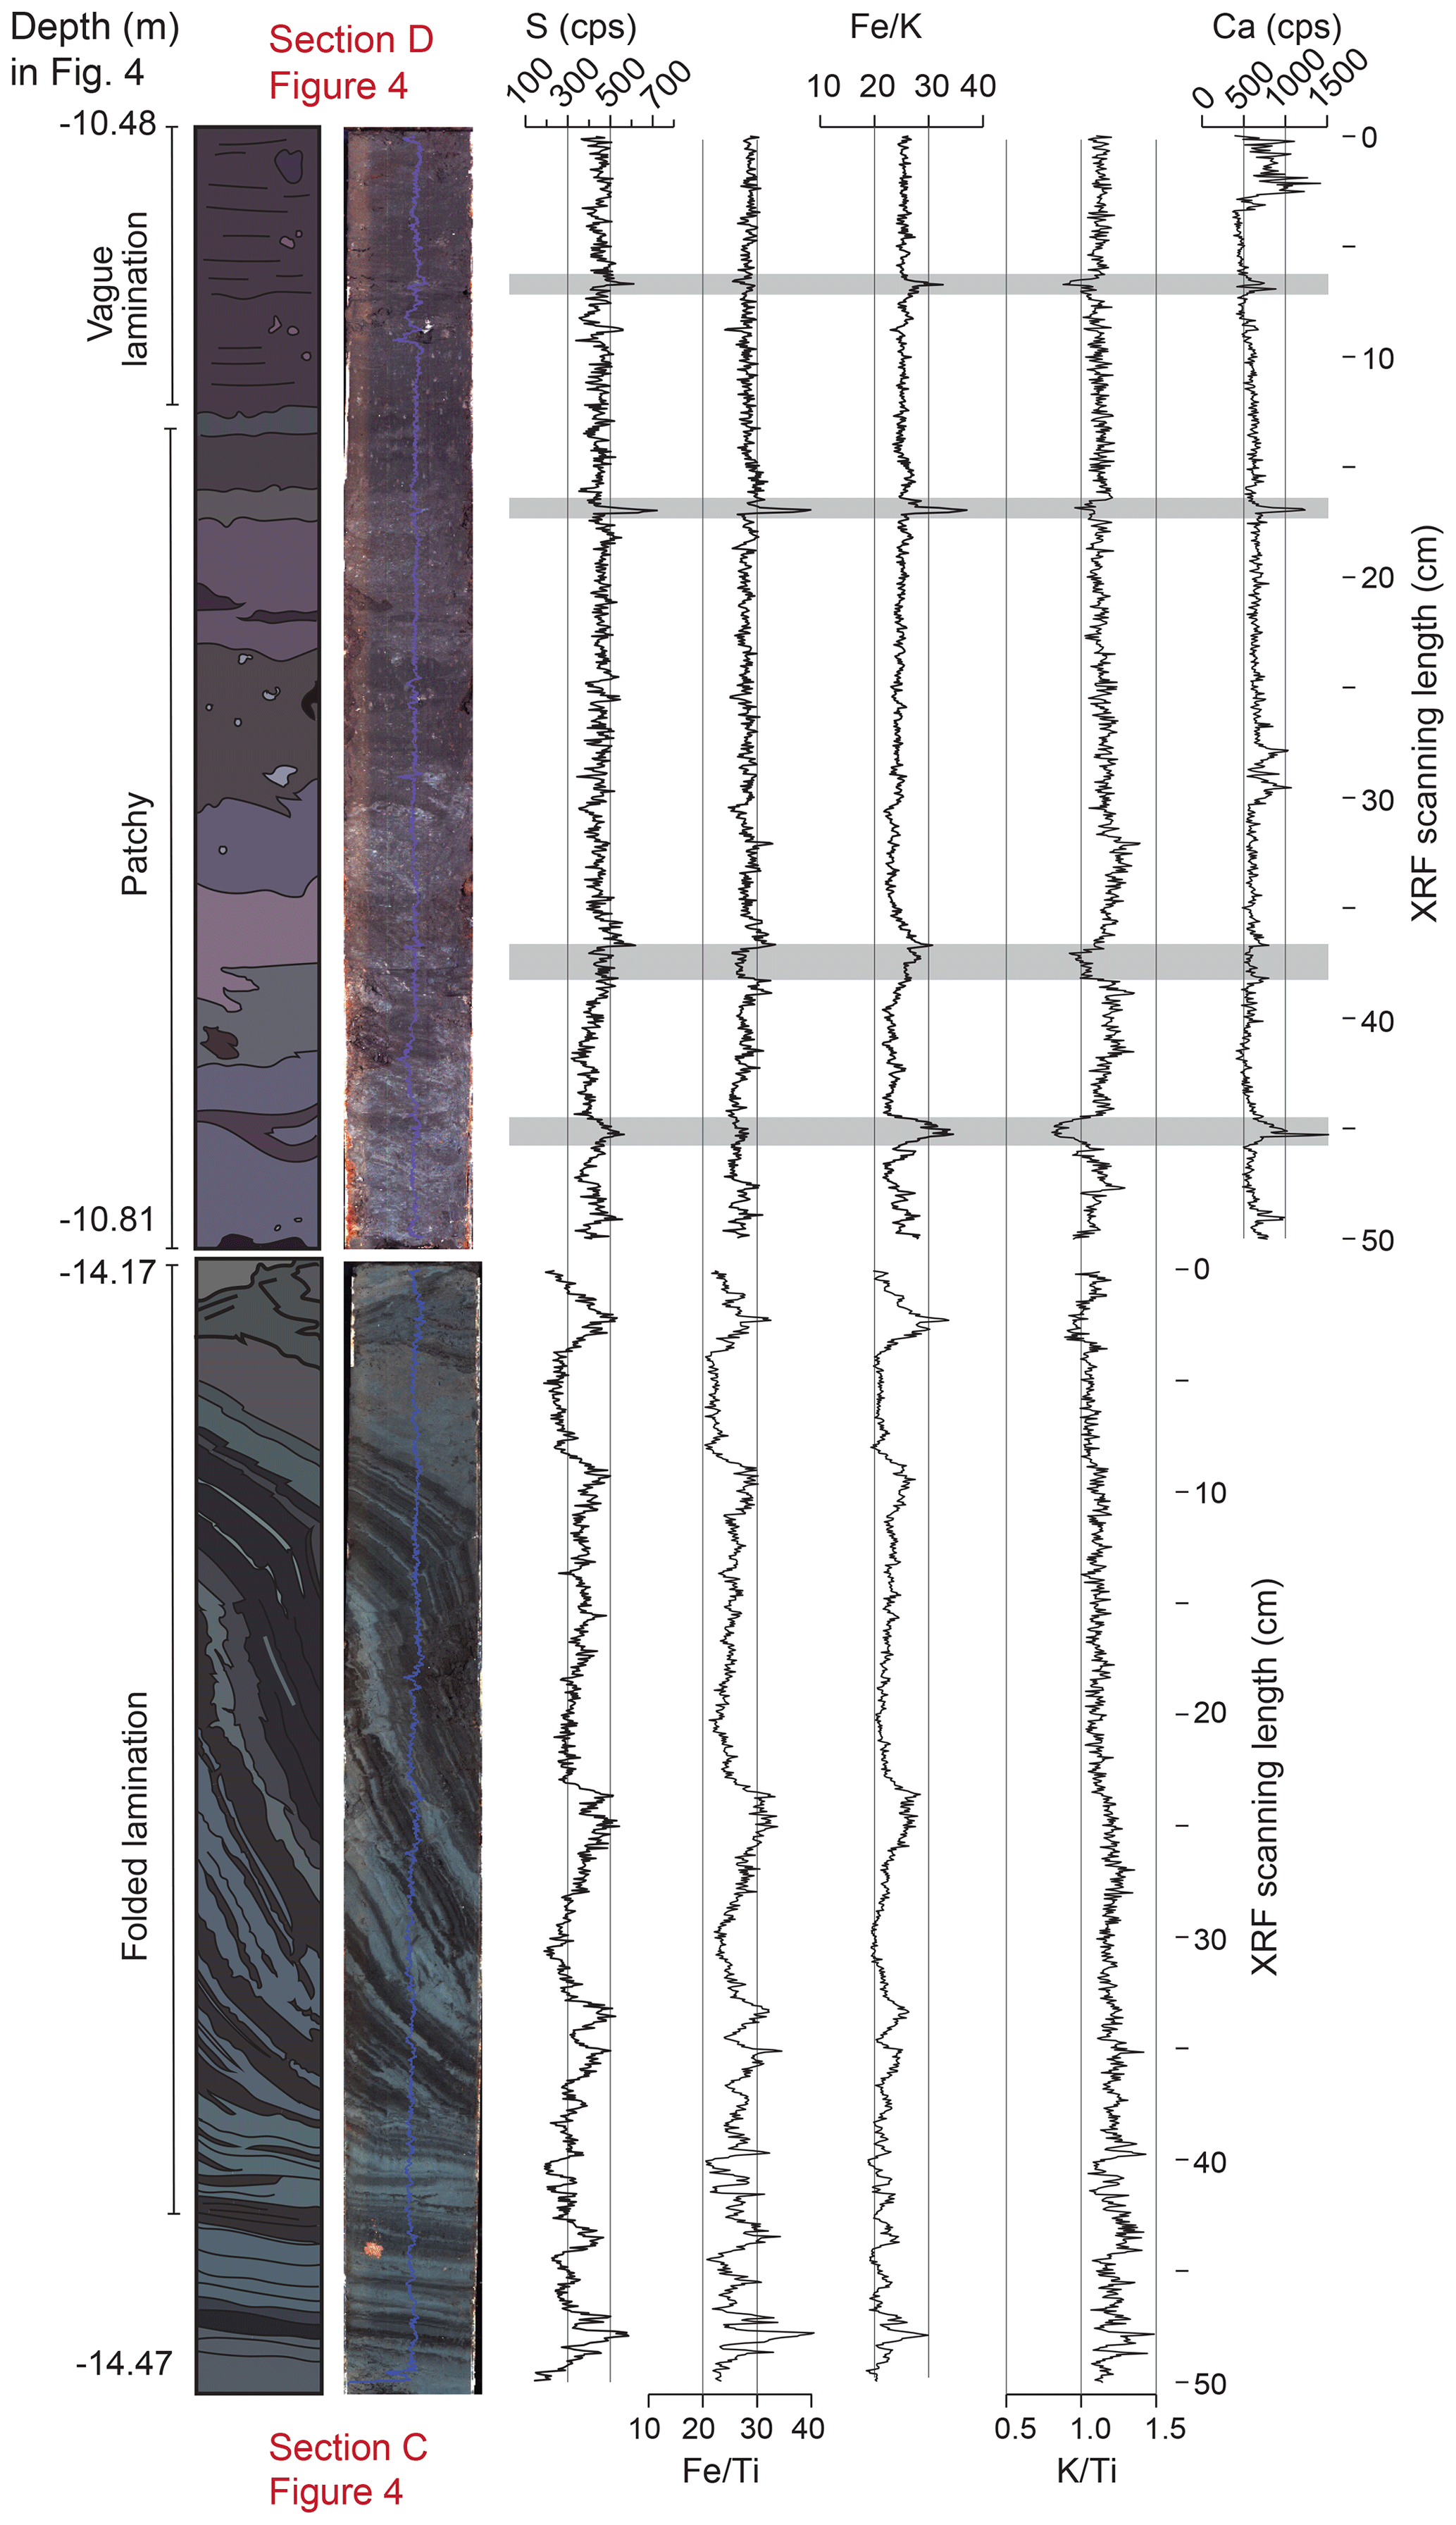
Figure 6XRF element core scans and radiographic images of two box cores within the PETM body from the Stolleklint beach. The sample preservation of these box cores was excellent with no substantial irregularities. Interpretive logs next to the images indicate the lithological changes. The corrected stratigraphic depth relative to Ash −33 for each section is indicated on the left, while the XRF scanning length on the right indicates actual box-core length. Grey bands in section D indicate potentially tephra-rich horizons. XRF data are given as counts per second (cps) or as dimensionless ratios.
4.2 Mineralogy
The bulk mineralogy comprises six main phases: zeolites, mica, clay (including smectite, chlorite, kaolin minerals, and glauconite), feldspars, quartz, and pyrite (Fig. 4; Table 1, Supplement 1). Phyllosilicates dominate the bulk mineralogy in the lower laminated part of the stratigraphy. While the mica phase remains relatively stable throughout, the clay phase reaches its maximum of 50.6 % at ∼ 13 cm above Ash SK2 and the CIE onset (−24.24 m depth), before decreasing substantially upward from about −22 m depth to nearly 0 % at −10 m depth (Fig. 4). Zeolites (of the heulandite–clinoptilolite type) dominate the CIE body, comprising up to 36 % of the bulk mineralogy at −10.48 m depth (Fig. 4). The feldspar phase is largest within the Holmehus/Østerende Formation (37 % at −24.81 m depth) and during the CIE recovery (35 % at +5.35 m depth), while quartz increases in the upper part of the stratigraphy up to 26 % at −0.28 m depth (Fig. 4). Pyrite makes up the smallest fraction of the bulk mineralogy (Fig. 4). It increases from 1.9 % in the lower Holmehus/Østerrende Formation (−24.81 m depth) to 5.3 % ∼ 13 cm above the CIE onset (−24.24 m depth). The highest fraction of pyrite (6.1 %–7.5 %) is reached during the CIE body, before values decrease during the PETM recovery to a minimum of 0.11 % at +5.35 m depth.
The clay fraction comprise grain sizes < 2 µm, and reflect the relative distribution of the different clay mineral phases, not the total amount of clay. XRD analyses identified four major clay mineral phases: kaolinite, chlorite, mixed-layer illite–smectite with only minor illite layers indicating almost pure smectite, and illite + fine-grained mica (Fig. 4; Table 2, Supplement 1). Illite–smectite is the dominating clay mineral within the studied section. It comprises 84 %–90 % of the total clay from the base and up to 13 cm above the CIE onset (−24.24 m depth), before decreasing in the lower PETM body to a minimum of 32 % about 1.5 m above the CIE onset (−22.86 m depth). The illite–smectite content increases throughout the upper CIE body and recovery with values between 50 %–77 % (Fig. 4). Illite + fine-grained mica comprise a smaller part of the total clay fraction, with 10 % during the CIE onset, and a maximum of 33 % at −5.93 m depth (Fig. 4). Kaolinite increases substantially from 5 % about 13 cm above the CIE onset (−24.24 m depth) to 37 % at 62 cm above the CIE onset (−23.75 m depth). Kaolinite dominates the clay fraction in the lower laminated PETM body with a maximum of 52 % at −20.60 m depth, before disappearing in the upper PETM body and re-emerging with 11 % during the recovery phase (+5.35 m depth; Fig. 4). Chlorite only appears in 4 of 13 samples and makes up the smallest part of the clay fraction, with a maximum of 7 % at −10.48 m depth (Fig. 4).
4.3 Box-core major element variations
Two box cores cross the PETM onset, covering the transition from Holmehus/Østerrende Formation into Stolleklint Clay, and the ash layers SK1–SK4 (Figs. 4, 5, 6; Supplement 2). Low and ratios suggest that the ashes are highly Ti-rich basalts. The gradual decrease in both and below Ash SK1 may subsequently suggests a potential gradual increase in volcanically derived material before the first ash layers in the Danish Basin appear (Fig. 5). Sulfur counts show a slight overall increase from below to above the ashes. Above Ash SK3, there are several peaks of S, , and (although the latter signal is swamped by the iron-rich ashes in Fig. 5 section B) that correlate with each other and with the dark laminations.
Principal component analysis reveal a distinct difference in chemistry between the Holmehus/Østerrende Formation and the Stolleklint Clay (Fig. 7). It also indicates that both the clay between ashes SK1 and SK2 and parts of the glauconitic silt likely include a large ash component. While the glauconitic silt is chemically closer to the underlying Holmehus/Østerrende Formation than the Stolleklint Clay, the less ash-rich inter-ash clay appears to have a composition closest to the Stolleklint Clay. This suggests that this is indeed a part of the Stolleklint Clay base, and we therefore propose that Ash SK1 marks the lower Stolleklint Clay boundary. The correlation circle indicates that differences in Ca and Ti on one hand and K on the other are the main controlling factors, reflecting the variation between volcanic and clay-dominated fractions respectively (Fig. 7).
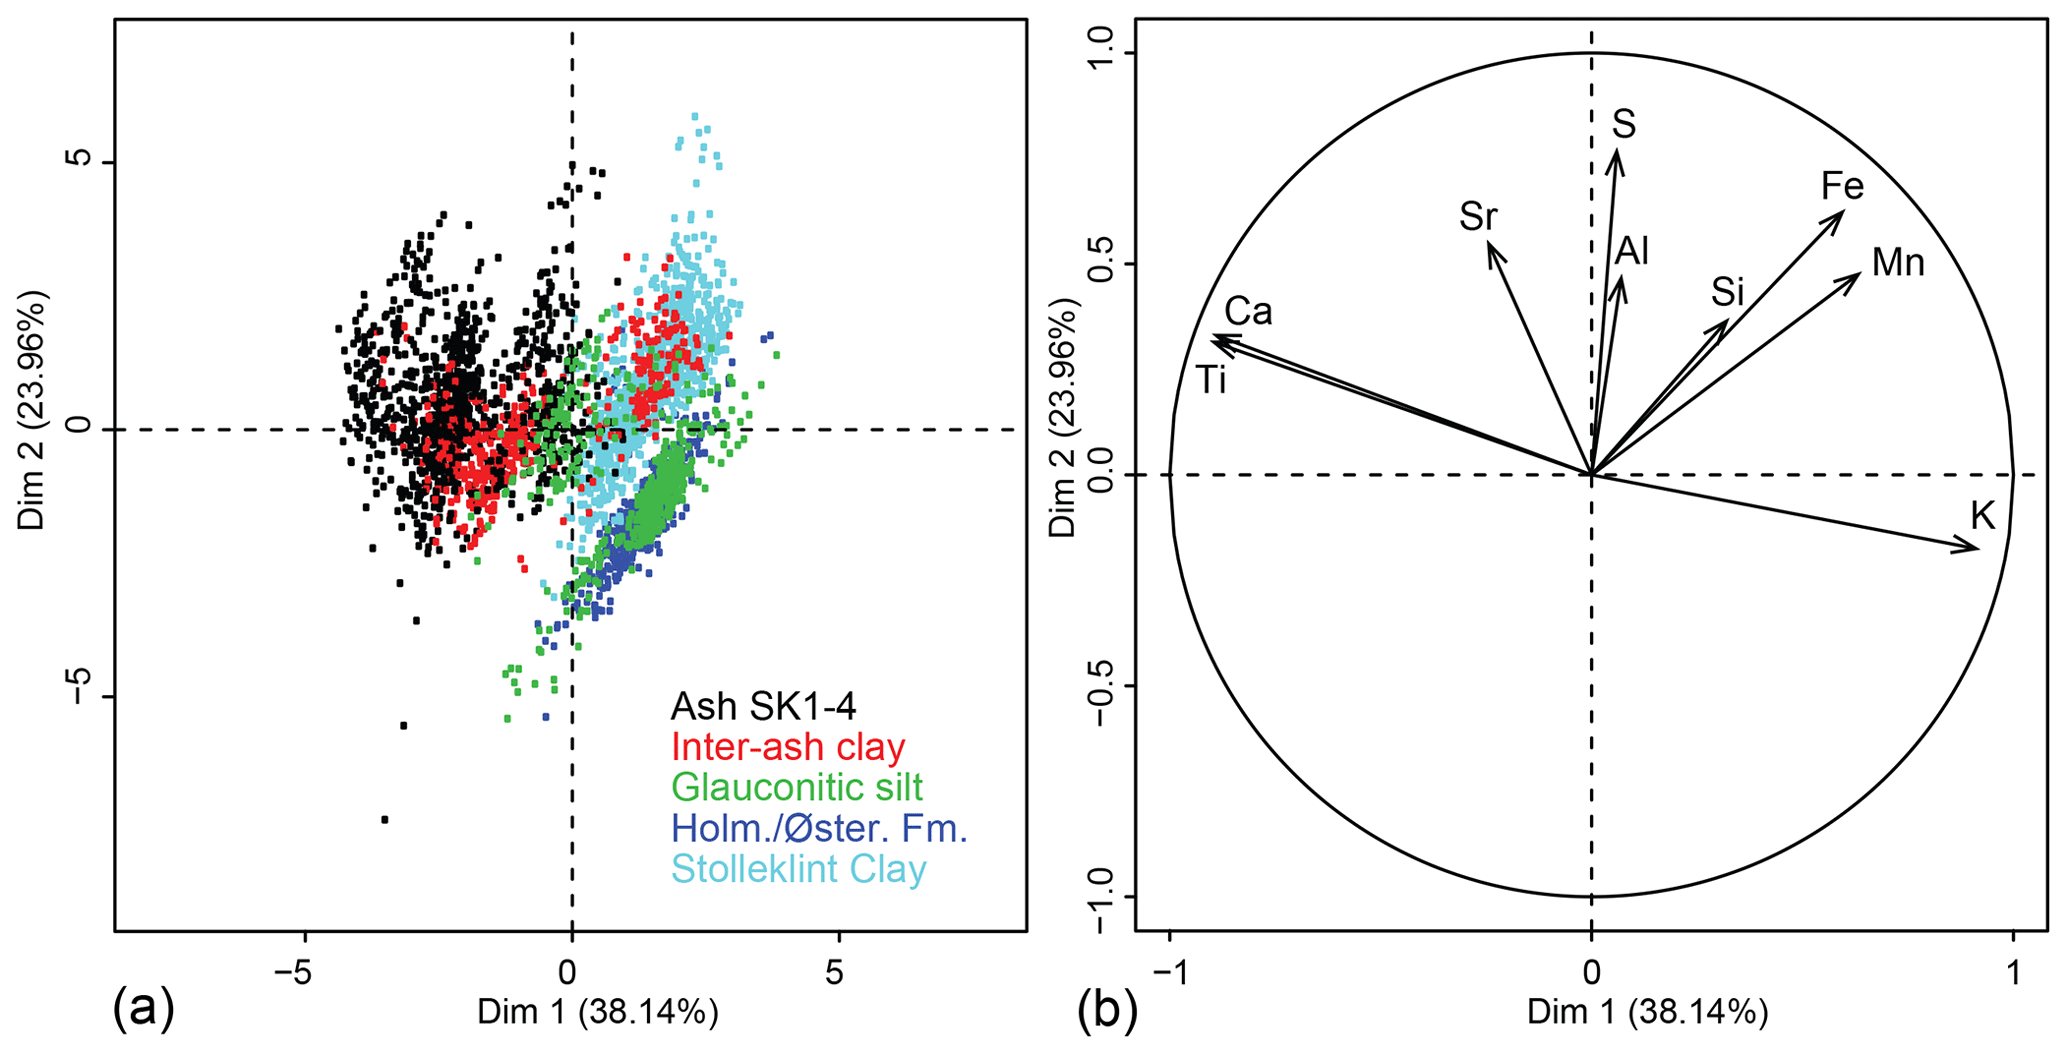
Figure 7Biplot (a) and correlation circle (b) with dimensions 1 and 2 (denoted as Dim 1 and Dim 2) of the principal component analysis applied to XRF core scanning data from box cores 1 and 2 across the PETM onset. Dimensions 1 and 2 represent 62 % of the total variability. The inter-ash clay in the biplot refers to the clay between ashes SK1 and SK2 as indicated in Fig. 5.
The box core in Fig. 6 section C, covering the lower Stolleklint Clay, shows that the sediments are strongly laminated and slightly folded. Elevated S concentrations and high and ratios correlate with the dark laminations (Fig. 6 section C) suggesting that there was some regular variability in basin oxygenation. The ratio remains relatively stable, suggesting no dramatic lithological changes. Figure 6 section D shows the non-laminated upper Stolleklint Clay, which displays relatively minor elemental variations. However, drops in the ratio could indicate areas of increased volcanically derived material, potentially as cryptotephras (Fig. 6 section D). The biplot of S and Fe (Fig. 8) shows that there is an overall increase in S upward from the pre-PETM Holmehus/Østerrende Formation and throughout the Stolleklint Clay. It also indicates that their upper PETM body has a more homogenous high sulfur content, while there is significant variation in the sulfur counts between dark and light laminations in the lower laminated PETM body, as also observed in the XRF core scans (Fig. 8 section C).
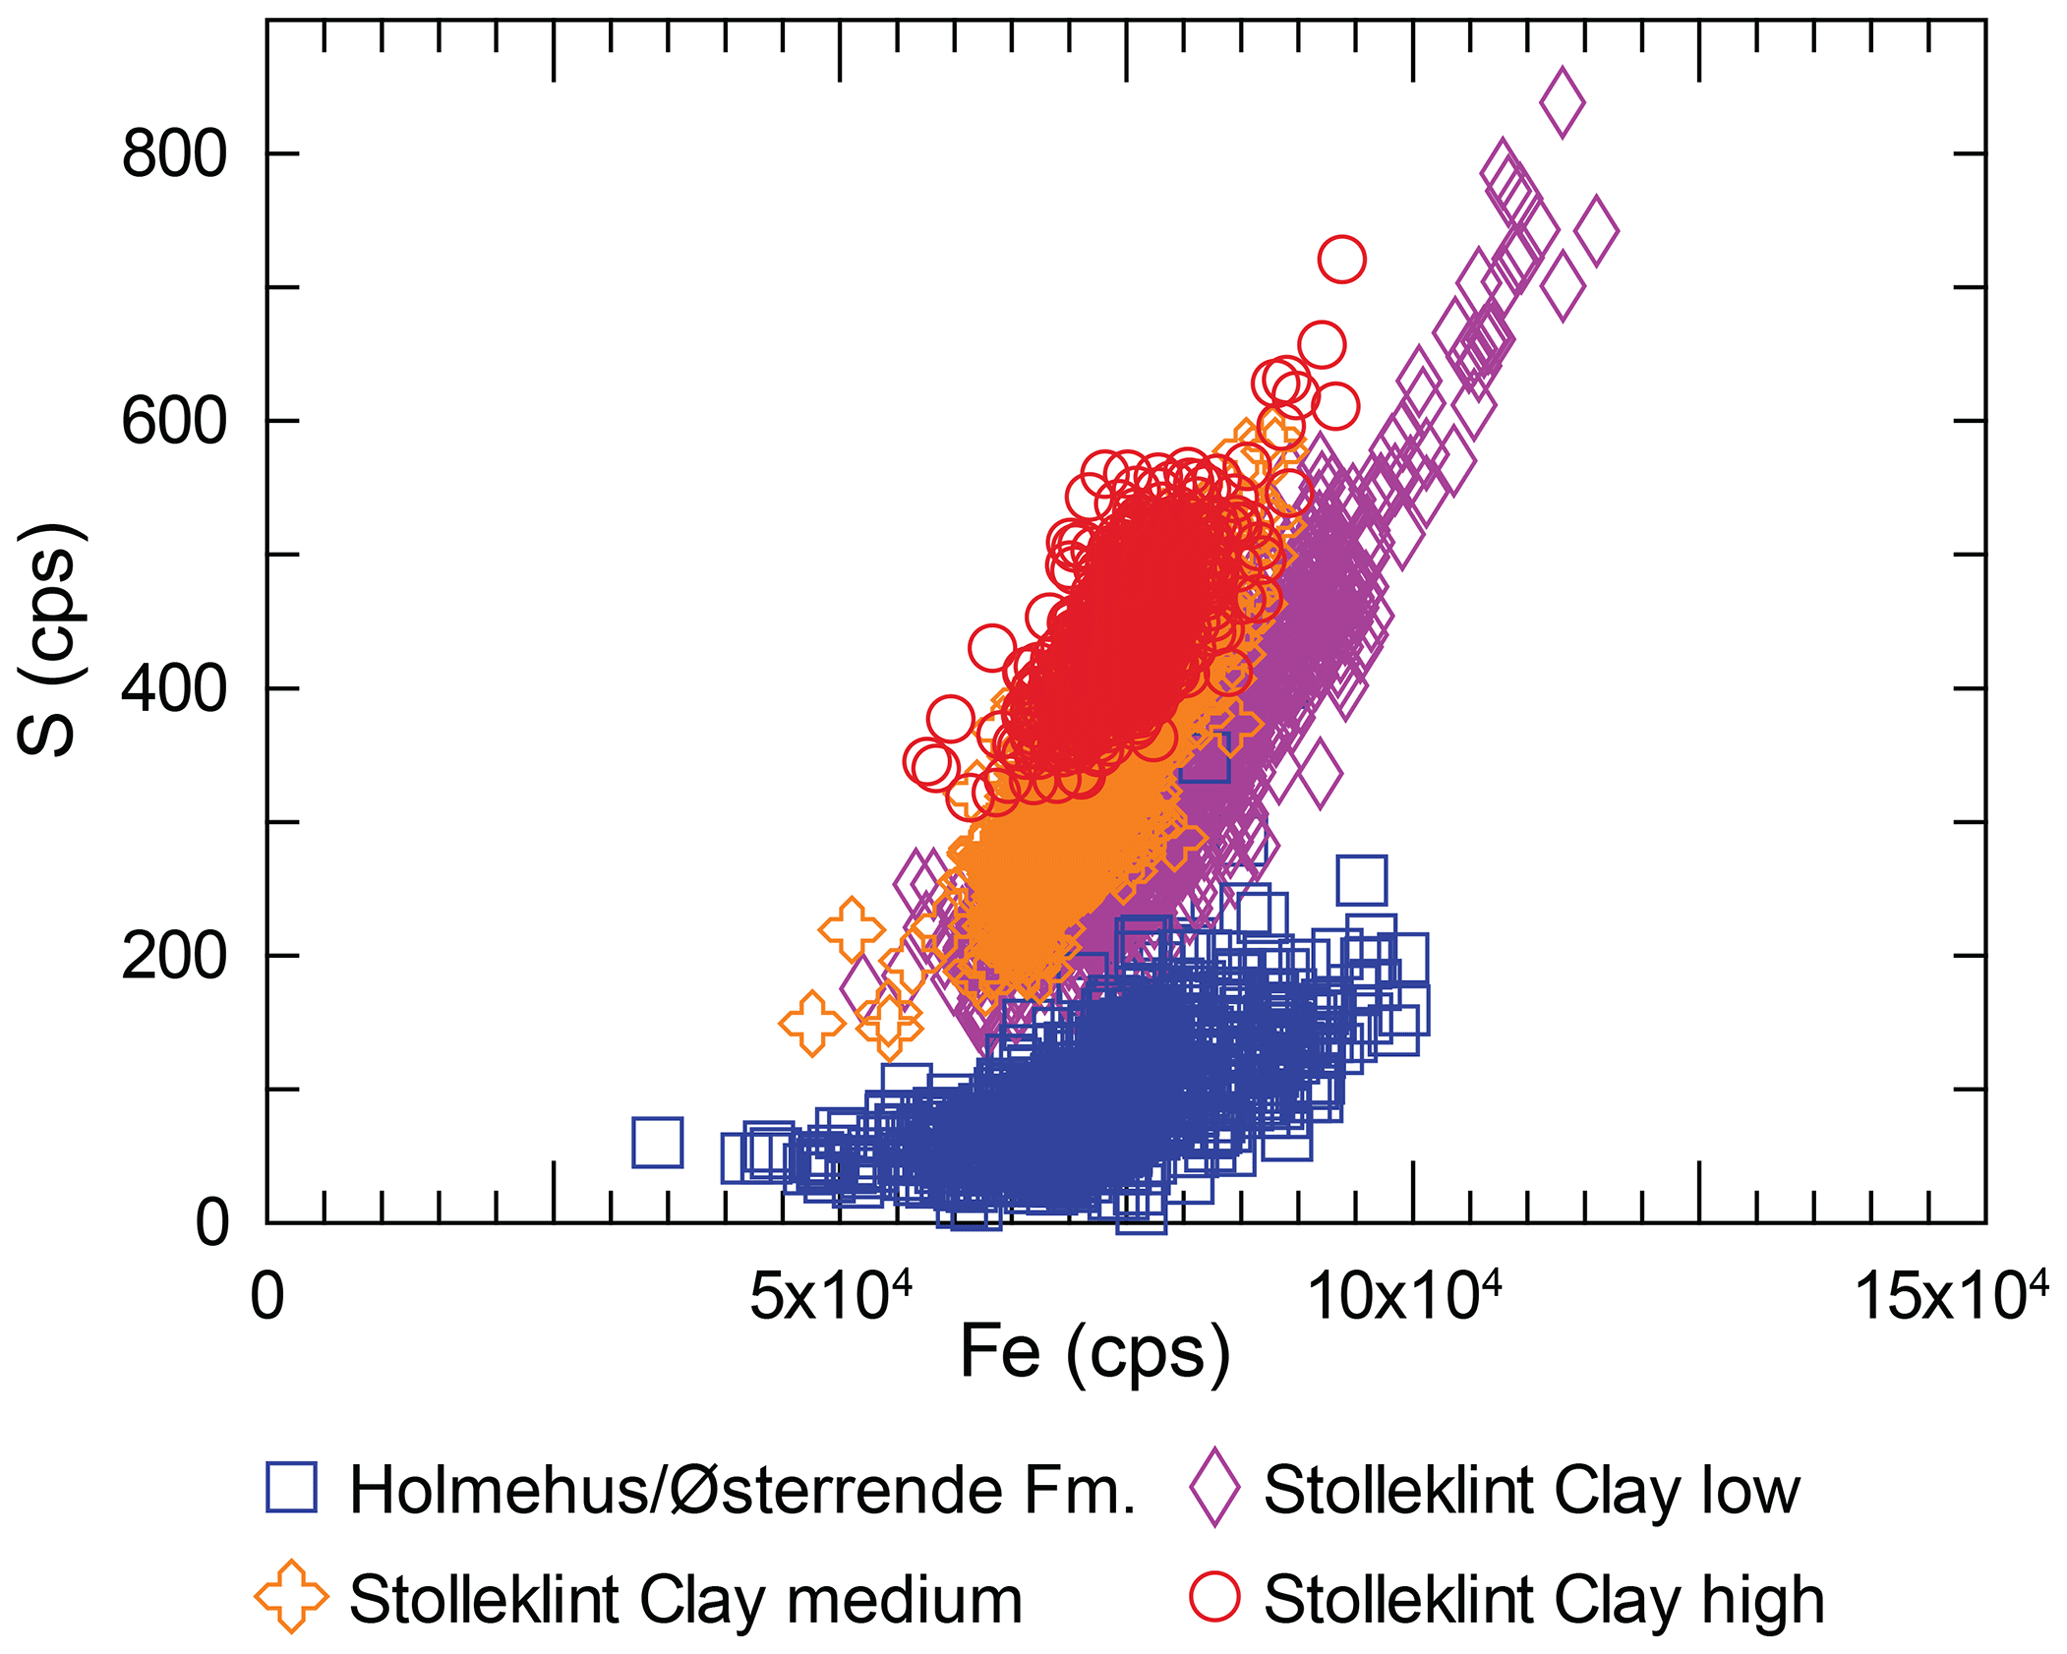
Figure 8Biplot of Fe and S. Data from XRF element core scans of all four box cores; cps: counts per second.
4.4 Organic geochemistry
The thermal immaturity of the Stolleklint Clay has previously been suggested, based on the dominating odd over even preference in long-chained n-alkanes (Stokke et al., 2020a). This immaturity is now also supported by the low Rock-Eval Tmax values of < 422 ∘C (Table 3, Supplement 1). The low degree of organic-matter alteration is also shown by the ratios consistently > 2, with the exception of a short interval covering the glauconitic silt and the PETM onset (−24.58 to −24.32 m depth) where values vary between 0.74–1.33. The HI peaks at up to 150 mgHC/gTOC in the glauconitic silt between −24.61 to −24.59 m depth, but is otherwise < 100 mgHC/gTOC pre-PETM (Fig. 9). The HI increases > 100 mgHC/gTOC about 13 cm above the CIE onset at −24.05 m depth. A second major increase in HI occurs above −14 m depth, after which values remain high and reach maximum values of 303 mgHC/gTOC at −0.78 m depth (Fig. 10). The OI values are relatively even and low with values between 25–42 mgCO2/gTOC for most of the section. The main exception is an elevated interval with OI values between 51–94 mgCO2/gTOC starting at the base of the glauconitic silt (OI rise from 37 to 78 mgCO2/gTOC at −24.58 m depth) and lasting during the PETM onset up to about −24.32 m depth.
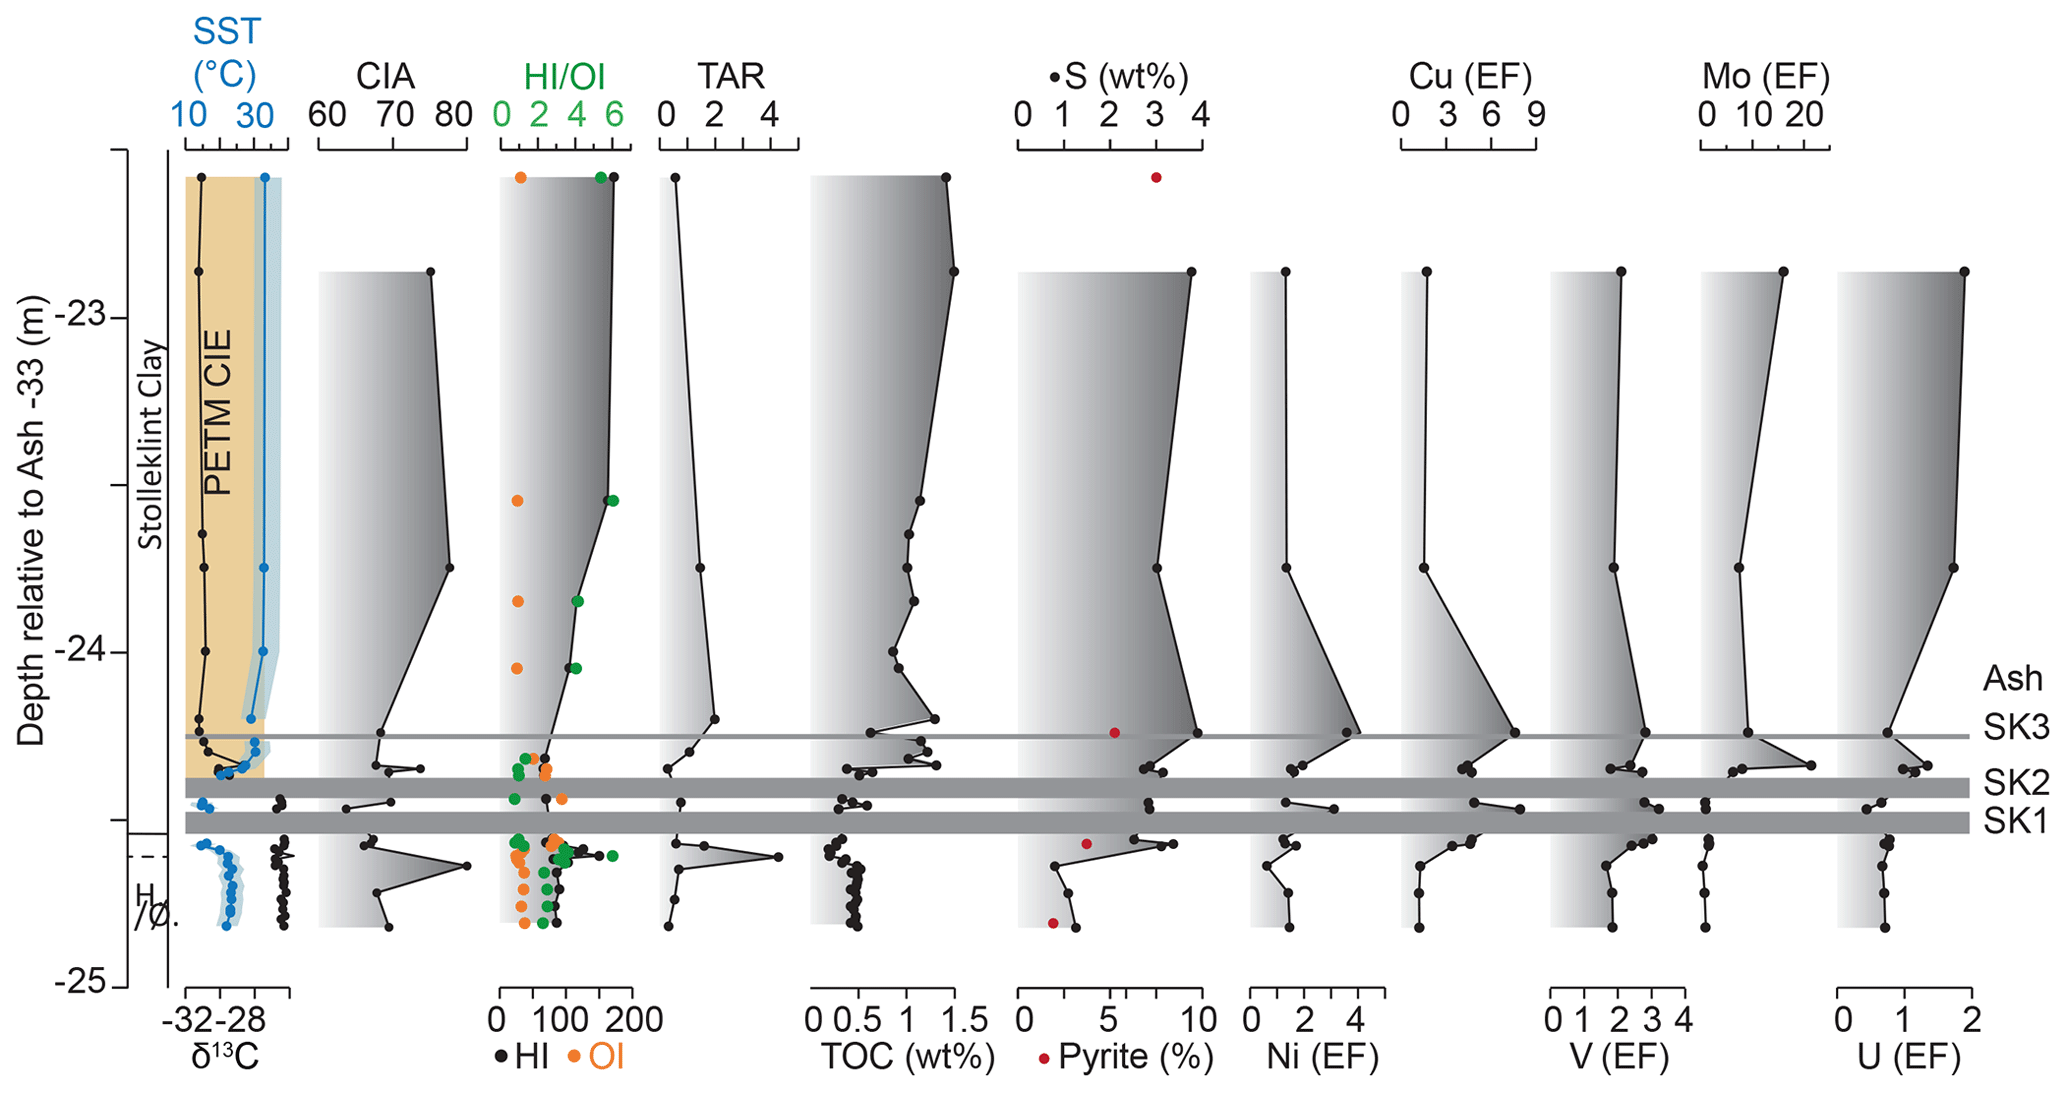
Figure 9The lowermost 2.5 m of the Stolleklint beach section showing a close-up of the CIE onset. Graphs show TEX86 data from Stokke et al. (2020a); δ13C and total organic carbon (TOC) data from Jones et al. (2019); chemical index of alteration (CIA); hydrogen index (HI) and oxygen index (OI); terrigenous aquatic ratio (TAR) from Stokke et al. (2020a); fraction of pyrite from bulk XRD analyses; S concentrations in wt %; trace metal enrichment factors of Ni, Cu, V, Mo, and U.
Both the terrigenous aquatic ratio (TAR) and TOC data are taken from Stokke et al. (2020a). TAR is defined as the ratio of the primarily land-plant-derived long-chain n-alkanes to the short-chain n-alkanes mainly derived from marine algae (Peters et al., 2005). There is a considerable peak in TAR ∼ 5 cm below Ash SK1, within the glauconitic silt. A second increase in TAR values shortly after the PETM onset (about −24.2 m depth) is followed by gradually decreasing TAR values during the PETM body and recovery. The TOC data show a pronounced increase from ∼ 0.45 to ∼ 1.3 wt % TOC about 2 cm above the PETM CIE onset (Fig. 9). TOC concentrations remain relatively stable for the lower CIE body, before increasing again in the upper CIE body (from about −13 m depth) up to a maximum of 3.9 wt % at −0.78 m depth (Fig. 10). At the start of the CIE recovery, TOC drops down again to around 1 wt %.

Figure 10The section covering the whole Stolleklint PETM, with some additional samples from the nearby quarry FQ16 (Fig. 2) between −5.6 and 2 m depth. See Fig. 9 for details on each graph.
4.5 Major and trace elements of single samples
The CIA in the pre-PETM sediments is generally at around 67 but has one peak of 80 just before the pre-PETM cooling event (−24.64 m depth; Fig. 9; Table 5, Supplement 1). Following the onset, the CIA rises to a maximum of about 79 at −20.60 m depth, before returning to pre-PETM values in the upper PETM body (Fig. 10). The recovery phase shows increasing CIA values again towards Ash −19, with 84.5 at +5.50 m depth.
Both S and pyrite concentrations start to rise before Ash SK1 and the CIE onset, with S increasing from about 1 wt % in the Holmehus/Østerrende Formation to about 3 wt % in the glauconitic silt (Fig. 9; Table 4, Supplement 1). Sulfur concentrations remain high throughout the CIE body, with maximum values of 4.6 wt % reached at −8.6 m depth (Fig. 10).
While CuEF and VEF have values consistently > 1 indicating a constant relative enrichment, NiEF shows overall lower EF values and some depletion with five samples < 1. Before the CIE onset CuEF and VEF values rise from the base of the glauconitic silt (at −24.58 m depth), while NiEF remains relatively stable (Fig. 9; Table 5, Supplement 1). Vanadium, Cu, and Ni are elements typically associated with volcanic ash, and they all show a relative enrichment within the lower ash-rich interval, with particularly Cu and Ni peaking around ash layers SK1 and SK3. All three elements decrease to lower values in the lower PETM body, before increasing in the upper half (Fig. 10). However, while CuEF and VEF continue to increase until the recovery, NiEF decreases slightly about 5 m below Ash −33.
Uranium appears to be depleted below the PETM onset with UEF values consistently < 1 and particularly low values above ash layers SK1 and SK3 (Fig. 9; Table 5, Supplement 1). Immediately above the CIE onset UEF rises > 1 (at −24.36 m depth), although it does not become consistently enriched until about −23.75 m depth. Molybdenum is also depleted in the lowermost part of the section, with MoEF rising > 1 at the base of the glauconitic silt (−24.8 m depth; Fig. 9). However, MoEF still does not increase substantially until after the CIE onset (at −24.36 m depth) similar to UEF. Both UEF and MoEF remain relatively stable around 1.3 and 10 respectively in the lower part of the PETM body but increase dramatically in the upper, non-laminated part before decreasing again during the recovery (Fig. 10). While UEF reaches maximum values of about 5.2 (at −1.34 m depth), MoEF increases substantially with values of about 30–38 between −8.56 to −0.11 m depth (Fig. 10).
5.1 Changing sediment input – tectonic and climatic influence
5.1.1 Kaolinite and changes in weathering across the PETM onset
At Fur, there is a substantial influx of kaolinite in the lowermost 10 m of the PETM CIE (Fig. 4). The pulse of kaolinite initiates shortly after the CIE onset and again in the CIE recovery, in both instances concordant with a rise in the CIA and in the bulk mineralogy clay fraction (Figs. 4, 10). As the clay fraction in the strata above and below the kaolinite pulse is dominated by smectite, it suggests some major change in climate and/or sediment supply occurs within the lower part of the PETM stratigraphy. Clay mineral assemblages have been used as indicators of palaeoclimate, most commonly using kaolinite as a proxy for humid tropical climates and smectite for warm climates with seasonal humidity and longer dry spells (Bolle et al., 2000; Thiry, 2000). However, soil formation is a slow process, and the subsequent long duration between formation and deposition in a marine basin suggests that clay mineralogy is an unreliable palaeoclimate proxy at resolutions shorter than 1 Myr (Thiry, 2000). Changes in the clay mineral assemblage in the marine sediments is therefore unlikely to reflect an increase in continental soil production induced by changing temperatures and humidity (Carmichael et al., 2017).
An increase in kaolinite content during the PETM is observed globally (Robert and Kennett, 1994; Dypvik et al., 2011; John et al., 2012; Khozyem et al., 2013; Bornemann et al., 2014; Kemp et al., 2016), yet the timing and magnitude vary considerably even within the North Sea (Kender et al., 2012; Kemp et al., 2016). In the western North Sea, the kaolinite content increases earlier before and during the CIE onset and again during the CIE recovery but is relatively low in the CIE body (Kender et al., 2012; Kemp et al., 2016). However, at Fur a rise in the kaolinite content is not observed until after the CIE onset (Fig. 4), and southward in the Bay of Biscay in the North Atlantic the kaolinite content does not significantly change until the PETM recovery (Bornemann et al., 2014). It would be expected that changes in the climate and the hydrological cycle would be broadly similar within such a narrow region. It is therefore reasonable to assume that the timing and extent of kaolinite deposition depends just as much on the availability and proximity to potential source areas as the climatic conditions. Kender et al. (2012) suggested that the initiation of the kaolinite pulse before the CIE in the central North Sea was due to the thermal uplift and short-lived regression in the latest Paleocene. A drop in sea level exposes larger areas to erosion and brings river mouths closer to the marginal marine areas, which could subsequently trigger an influx of terrestrially derived material. A peak in the HI, TAR, and CIA just below the glauconitic silt suggest that a similar short-lived regression is recorded also in Denmark (Fig. 9). However, as the kaolinite pulse at Fur occurs after the CIE and major temperature increase (Fig. 10), it substantially post-dates sea-level fall and major tectonic uplift in the latest Paleocene. This suggest that some other trigger than sea-level fall activated the shift to kaolinite deposition in Denmark.
Kaolinite particles are relatively large and heavy and typically deposited closer to the source than finer clays like smectite (Gibbs, 1977; Nielsen et al., 2015). Nielsen et al. (2015) found that deposition of kaolinite in the Paleocene–Eocene North Sea thickens substantially towards the Fennoscandian shield and suggest that this is the main source area for the Danish sediments. The Fennoscandian shield was characterized by deeply weathered bedrocks in the Paleogene, reflecting the warm tropical Mesozoic climate (Nielsen et al., 2015), and would therefore be enriched in kaolinite. Considering the typically shorter transport of kaolinite (Gibbs, 1977) and the Danish areas distal position in relation to the NAIP (Figs. 1, 11) it seems likely that the main source of kaolinite was from the Fennoscandian Shield to the north and northeast, despite the main sediment source for the North Sea as a whole during this period being from the west and northwest (Fig. 11; Jordt et al., 2000; Anell et al., 2012). A North Sea surface water freshening is suggested from palynology and shark-tooth apatite δ18O values in the central North Sea (Zacke et al., 2009; Kender et al., 2012). The global influx in kaolinite has generally been attributed to an intensified hydrological cycle leading to enhanced erosion and sediment transport of older deeply weathered bedrock and soils (Schmitz and Pujalte, 2003; John et al., 2012; Bornemann et al., 2014; Carmichael et al., 2017). It therefore seems likely that the observed influx of kaolinite, increased CIA, and rapid intensification of sedimentation rates after the CIE onset at Fur is the result of increased erosion and runoff from the deeply weathered Fennoscandian bedrock. Considering the potential time lag between increased runoff and final marine deposition, this indicates a rapid response in the hydrological cycle to changes in temperature and carbon emissions across the PETM onset.

Figure 11Close up of Fig. 1 with modifications based on Schiøler et al. (2007). See Fig. 1a for colour legend. Dashed circles indicate main sedimentary source areas for the North Sea during the Paleocene and Eocene from Anell et al. (2012). Arrows indicate the main sediment transport directions based on Jordt et al. (2000) and Anell et al. (2012).
5.1.2 Illite–smectite and zeolites – importance and origin
Smectite is the dominant clay mineral within the pre-PETM and most of the earliest Eocene strata at both Fur (Fig. 4) and generally in the North Sea (Nielsen et al., 2015). Smectite is a common weathering product of mafic volcanic material (Stefánsson and Gíslason, 2001), and previous studies have suggested that smectites in the Danish stratigraphic record are of predominantly volcanic origin (Nielsen and Heilmann-Clausen, 1988; Pedersen et al., 2004). Although smectite may precipitate in situ from hydrothermal fluids, this has largely been discounted in the North Sea due to the wide geographic extent of smectite and the overall lack of indices of hydrothermal influence (Huggett and Knox, 2006; Kemp et al., 2016). In situ post-depositional alteration of volcanic ash also probably contributed only minor amounts of smectite, as the ashes are mostly well-preserved (Nilsen et al., 2015). While clay minerals only make up a trace fraction of the bulk mineralogy in the upper PETM body (4 %–8 %), zeolites comprise up to 36 % (Fig. 4). Zeolites are another typical weathering product of volcanic materials (Stefánsson and Gíslason, 2001; Nielsen et al., 2015), supporting a volcanic provenance.
Major flood basalts were emplaced in East Greenland and the Faroe Islands between 56.0 and 55.6 Ma, producing large uplifted areas several kilometres high of easily eroded material (Larsen and Tegner, 2006; Storey et al., 2007b; Wilkinson et al., 2017). This is reflected in Os isotopes and CIA records in the Arctic Ocean, which record an influx of weathered volcanic material both prior to and during the PETM (Wieczorek et al., 2013; Dickson et al., 2015). Moreover, the first phase of ash deposition was identified within Late Paleocene strata in the North Sea, well before the PETM onset (Knox and Morton, 1988; Haaland et al., 2000). Erosion and redeposition of altered tephra deposited around the North Sea likely constituted a highly important source for the volcanic material in the North Sea basins (Pedersen et al., 2004; Nielsen et al., 2015; Kemp et al., 2016). Smectite is found in abundance throughout the North Sea stratigraphic record, and decreases as ash deposition ceases upward in the Eocene (Nielsen et al., 2015; Kemp et al., 2016). It seems likely that the dominance of smectite and abundance of zeolites reflect this extensive extrusive volcanism around the NAIP (Nielsen et al., 2015; Kemp et al., 2016), highlighting the importance of the NAIP in augmenting silicate weathering during the PETM.
5.2 Volcanic indices
Although the principal component analysis indicates that the glauconitic silt is most like the Holmehus/Østerrende Formation (Fig. 7), the gradual increase in Ti relative to Fe and K shown by the XRF element core scans suggest a gradual change in lithology towards Ash SK1 (Fig. 5). Titanium is generally considered a stable element directly reflecting the coarse-grained terrigenous fraction (Rothwell and Croudace, 2015), but the highly Ti-rich nature of the ashes SK1-4 renders Ti an unreliable proxy for terrigenous input in this particular section. Titanium can also be used to indicate volcanic provenance, where K and Ti reflect felsic and mafic sources respectively (Rothwell and Croudace, 2015). In fact, the ratio has been applied as a useful proxy for felsic/mafic provenance in the North Atlantic (Richter et al., 2006) and could indicate a gradual rise in mafic volcanic derived material prior to the main ash deposition (Fig. 5). Estimates of the timing and duration of the East Greenland lava eruptions suggests that a 5–6 km thick lava pile was emplaced between 56.0 and 55.6 Ma (Larsen and Tegner, 2006), indicating that there was voluminous mafic NAIP activity during this period. The trace metals Cu, Ni, and V are found to increase in a similar manner within the glauconitic silt (Fig. 9), all of which are typically associated with volcanic material and maintain high concentrations within the SK1–SK2 interval. An amplified influx of weathered basaltic material such as smectite could cause the gradually increased Ti flux. However, smectite is already the dominant clay phase in the Holmehus/Østerrende Formation (Fig. 4) and does not show a significant rise in the glauconitic silt. It therefore seems that the augmented Ti concentrations within the glauconitic silt were caused by an increased ash component rather than from basaltic weathering. Such volcanic ash deposits that are not visible to the naked eye are called cryptotephras and typically include glass shards and crystals together with non-volcanic deposits (Cassidy et al., 2014). It is possible that the glauconitic silt includes an increasing portion of cryptotephras prior to the large eruptions producing ashes SK1 and SK2. A previous study found that SSTs cooled prior to the PETM onset in Denmark (Stokke et al., 2020a). Although the cooling started within the glauconitic silt below Ash SK1 (Fig. 9), they proposed that it could be a result of volcanic cooling induced by SO2 aerosols from NAIP eruptions (Stokke et al., 2020a). The observation of a potentially increasing ash component already within this glauconitic unit would be supportive of a volcanically induced cooling.
The identified tephra layers in Denmark represent explosive eruptions with an unusually large magnitude in order to be transported such a long distance (Stokke et al., 2020b). The absence of visible tephra layers therefore does not automatically mean that there was no tephra producing eruptions during the PETM. Besides two thin ash layers about 10 and 12 cm above Ash SK2, there are no visible ash layers during the PETM body until the deposition of Ash −39 at about −5 m depth (Fig. 4). However, the box cores allow for a detailed and high-resolution overview that might reveal the presence of ash-rich intervals earlier. Figure 6 section D shows correlating changes in S, Ca, , , and between about −10.81 to −10.48 m depth. The presence of cryptotephra layers is particularly likely when low ratios correlate with increases in and Ca, and to some extent S. Relative changes in – and to some extent Ca – depend strongly on the source of the volcanic material. These results indicate four possible ash-rich horizons within the dark clays, which could be cryptotephras of slightly variable chemistry (Fig. 6 section D). This suggests that explosive volcanic eruptions at a scale substantial enough for some material to reach Denmark may also have occurred during the PETM body. However, much more detailed work is needed in order to confirm the presence or absence of tephra fall deposits during this interval.
5.3 Changes in basin oxygenation
The lithological shift from the bioturbated Holmehus/Østerrende Formation into the laminated Stolleklint Clay reflects a change in the oxygen content in the bottom-water environment. An increase in S, pyrite, and VEF within the glauconitic silt could indicate reducing conditions had already initiated below the laminations, prior to the CIE onset (Fig. 9). However, this is contrary to the low organic content, abundant bioturbation, and high content of glauconite, suggesting that an oxygenated environment prevailed pre-PETM at Fur. An oxic environment has also been indicated by the relatively high values of the organic biomarker pristane/phytane indicating oxidation of phytol to pristane (Stokke et al., 2020a). Sluijs et al. (2014) explained a similar co-occurrence of oxic and euxinic proxies within a section in the Gulf of Mexico as the result of seasonal to decadal variations in basin oxygenation. Alternatively, it could be attributed to post-depositional authigenic enrichment due to deposition of ash layer SK1, as volcanic tephra deposits can reduce the sediment pore water oxygen levels just below an ash layer (Hembury et al., 2012). However, the highly redox-sensitive elements Mo and U do not show a similar increase below the ashes and the CIE. On the contrary, UEF < 1 suggests that the sediments are rather depleted in U (Fig. 9). Both the high-resolution XRF element core scans and ICP-MS analyses of Ni and Cu indicate an increased ash component within the sediments just below Ash SK1. These contradictory observations could be explained by a large component of volcanic ash with the sediments, which is expected to have relatively high concentrations of both V and S.
Laminations occur only 2 cm above the CIE onset, together with an increase in S and in XRF element core scans (Fig. 5 section B). Iron and Ti in marine sediments commonly co-vary, and elevated ratios therefore indicate excess Fe over basaltic lithogenic values (Marsh et al., 2007). Fe is redox-sensitive and may reflect changes in basin oxygenation post-deposition (Rothwell and Croudace, 2015). An increase in Fe relative to Ti or K may therefore indicate suboxic conditions, particularly in concert with increased S content (e.g. Sluijs et al., 2009). TOC, MoEF, and UEF (Fig. 10) also rise substantially at the base of the laminations, with MoEF above 6. The burial rate of Mo increases by 3 orders of magnitude in sulfidic environments relative to oxic, as Mo becomes highly reactive in the presence of hydrogen sulfide (Tribovillard et al., 2004; Scott and Lyons, 2012). And, although the values are somewhat tentative, MoEF and UEF values between about 3–10 have been related to suboxic conditions (Algeo and Tribovillard, 2009; Tribovillard et al., 2012). A previous study from the exact same section at Stolleklint also found that photic zone euxinia may have occurred just after the CIE onset, indicated by the presence of sulfur bound isorenieratane; a diagenetic product of green sulfur bacteria (Schoon et al., 2015). We therefore conclude that while there may be some uncertainty as to when oxic conditions started to deteriorate due to the high content of ash, the start of laminations about 2 cm above Ash SK2 and the CIE onset indicate the initiation of anoxic to sulfidic conditions at Stolleklint. In addition, the XRF element core scans document a direct correlation between elevated S and , and the dark laminations (Fig. 6 section C), suggesting regular fluctuations in basin deoxygenation in the lower part of the PETM body.
In the upper part of the PETM body the Stolleklint Clay becomes apparently structureless and almost black. Here XRF S counts show continuous high values (Fig. 8), suggesting that reducing conditions become more or less continuous. The TOC content and the trace metals CuEF, VEF, and particularly MoEF and UEF increase similarly in the dark upper half, with MoEF up to ∼ 37 and UEF up to ∼ 5 (Fig. 10). Pyrite, S (wt %), and NiEF values show a similar increase initially but decrease above Ash −39 (Fig. 10). MoEF > 10 may indicate euxinic conditions (Algeo and Tribovillard, 2009; Tribovillard et al., 2012), although the comparatively lower enrichment of U may also suggest that some other factor is enhancing Mo enrichment in the sediments such as the “particle shuttle” effect (Algeo and Tribovillard, 2009) or enhanced Mo-trapping by sulfurized marine organic matter (Tribovillard et al., 2004; Algeo and Tribovillard, 2020). Schoon et al. (2015) argued that photic zone euxinia prevailed during the entire PETM interval both at Stolleklint and Store Bælt (Fig. 1) based on the presence of green sulfur bacteria. Unfortunately, their data from Stolleklint only cover the lowermost 2.5 m and uppermost 0.5 m of the Stolleklint Clay and therefore exclude most of the PETM body. It therefore seems there is little independent evidence in support of a euxinic environment prevailing throughout the PETM. We therefore conclude that the PETM in Denmark was characterized by an anoxic to sulfidic environment that become increasingly prevalent during the PETM body.
NAIP uplift in the latest Paleocene led to closing of ocean seaways and North Sea Basin restriction prior to the deposition of Ash SK1, resulting in poor circulation and halocline stratification that could explain an early deoxygenation (Knox et al., 2010; Kender et al., 2012). While this could explain a decrease in basin oxygenation below the SK ashes and CIE onset, there is no further evidence supporting regional uplift and North Sea Basin restriction following the PETM onset. On the contrary, high HI (Fig. 10) and low input of branched glycerol dialkyl glycerol tetraethers and long-chained n-alkanes (Stokke et al., 2020a) suggest that marine-derived organic matter increases up-stratigraphy, as the Stolleklint Clay was likely deposited during a relative sea-level rise (Heilmann-Clausen, 1995). Kender et al. (2012) found evidence of low surface water salinity and extensive stratification in the North Sea and suggested this as the main cause of anoxia during the PETM. The dark massive clays in the upper part of the PETM body are strongly enriched in organic matter (TOC up to 2.9 wt %) and Cu (CuEF up to 5.1), which both may indicate an increase in productivity (Tribovillard et al., 2006). A combination of ocean stratification and increased productivity would efficiently contribute to the increase in basin anoxia in the upper PETM body.
5.4 Carbon drawdown – the PETM recovery
At Stolleklint, temperatures rose at least 10 ∘C immediately after the onset, followed by a shift to gradually decreasing SSTs throughout the PETM body and recovery (Fig. 9; Stokke et al., 2020a). Silicate weathering is highly sensitive to runoff, temperature, and topography (Gislason and Oelkers, 2011). The warming combined with the increased runoff, indicated in the North Sea by enhanced surface water freshening (Zacke et al., 2009; Kender et al., 2012), would result in a climate ideal for increased silicate weathering and/or denudation. At Stolleklint, we see a rapid response in continental weathering and runoff to changes in carbon cycle and temperature. This is indicated by the large increase in sedimentation rate and the influx of weathered material from the Fennoscandian shield suggested by the rise in kaolinite and the CIA shortly after the PETM onset (Figs. 4, 10). While both the kaolinite content and the CIA decrease in the upper PETM body, the sedimentation rate likely remained high suggesting a relatively rapid influx of other minerals such as the volcanically derived zeolites and smectite. Fresh basaltic volcanic terrains are particularly prone to weathering and constitute one of the main sources of weathered suspended material in the world's oceans (Gislason and Oelkers, 2011). The extensive NAIP flood basalt volcanism before and during the PETM (e.g. Larsen and Tegner, 2006) may therefore have played an important role in enhancing silicate weathering during the PETM, as reflected in the dominance of smectite within the North Sea as a whole (Nielsen et al., 2015).
The augmented organic-matter burial (increased TOC) in concert with high CuEF (Fig. 10) suggest a possible rise in primary productivity in the upper PETM body. This could have been prompted by an influx of nutrients to the basin, which could have been caused by an enhanced terrestrial sediment influx. However, the low TAR values and the dominance of marine organic matter (high HI; Fig. 10) suggest that sea-level rise and a decrease in the terrigenous influx dominate upwards in the PETM body. Alternatively, the deposition of volcanic ash can work as a fertilizer, supplying key nutrients to the marine environment resulting in augmented productivity (Jones and Gislason, 2008). The post-PETM section at Fur is dominated by diatomite deposition, which could be a result of periodic rise in nutrient supply due to the voluminous ash deposition from the PETM recovery and onwards (Stokke et al., 2020a). While there is limited evidence of ash deposition during the PETM body at Stolleklint, additional ash deposition below Ash −39 has now been revealed by the possible cryptotephras in XRF element core scans (Fig. 6 section D). It could be that volcanic ash had an added fertilizing effect promoting a rise in primary productivity and organic carbon sequestration during the later stages of the PETM body and recovery.
A key PETM feature is the rapidity of the CIE recovery (e.g. Bowen and Zachos, 2010). Carbon cycle recovery occurs through a combination of natural carbon sequestration and negative feedback mechanisms reducing the atmospheric CO2 content (McInerney and Wing, 2011). Silicate weathering and denudation are perhaps the most important negative feedback mechanisms driving CO2 drawdown (Gislason and Oelkers, 2011) and have been proposed as one of the most important drivers during the PETM recovery (Kelly et al., 2005; Torfstein et al., 2010; Penman, 2016). However, Penman and Zachos (2018) found that the δ11B and records of ocean acidification recover within a similar time frame as the δ13C record and far more rapidly than suggested by carbon cycle models that rely on silicate weathering alone (e.g. Zeebe et al., 2009). Similarly, Bowen and Zachos (2010) found that the rate of recovery is an order of magnitude faster than expected for carbon drawdown by silicate weathering alone and suggested that terrestrial carbon sequestration may have played an important part. While our data can neither support not contradict this theory, we have documented a rise in nutrient supply and enhanced export productivity that would also contribute significantly to the increased organic carbon sequestration attributed to the accelerated PETM recovery (Bowen and Zachos, 2010; Komar and Zeebe, 2017; Bridgestock et al., 2019). Enhanced export productivity has also been observed in PETM sites globally (Bains et al., 2000; Egger et al., 2003; Stein et al., 2006; Soliman et al., 2011; Ma et al., 2014; Bridgestock et al., 2019), and average Ba burial rates approximately tripled during the PETM (Frieling et al., 2019). Our results show that negative feedback mechanisms responded rapidly to changes in carbon cycle and SSTs and remained highly active from PETM onset to recovery. While the δ13C values remained low until the PETM recovery, SSTs decreased gradually throughout the PETM CIE. This gradual decline may reflect a temperature response to the continued carbon drawdown by the alternating increases in both silicate weathering and export productivity during the PETM.
We present new mineralogical and geochemical data from Stolleklint, an expanded marine section at Fur in northwest Denmark covering the PETM onset, body, and recovery. Here, the PETM is defined by a negative 4.5 ‰ CIE and at least 10 ∘C temperature rise across the PETM onset.
The CIE onset is followed by an increase in kaolinite and the overall clay content, the chemical index of alteration, and substantially enhanced sedimentation rates. This reflects a rapid response in silicate weathering and transport patterns to changes in the carbon cycle and elevated temperatures, likely due to an intensified hydrological cycle leading to enhanced erosion and sediment transport from the deeply weathered Fennoscandian shield. Large volumes of easily weathered NAIP flood basalts and widespread tephra deposits likely contributed to accelerate the degree of silicate weathering and carbon drawdown. This is reflected in the dominance of volcanogenic minerals such as smectite and zeolite in large parts of the stratigraphy.
Basin deoxygenation also begins to become widespread across the PETM onset, indicated by a shift from bioturbated to laminated sediments and extensive geochemical proxy evidence. Although the exact onset of deoxygenation is somewhat blurred pre-PETM due to ash deposition, our data show anoxic to sulfidic bottom-water conditions were prevalent from the CIE onset and became increasingly pervasive throughout the PETM body. Proxy evidence also indicates augmented export productivity towards the upper PETM body, coinciding with the reappearance of volcanic ash in XRF element core scans and in field exposures. Such a correlation highlights the fertilizing effect of volcanic nutrients and its potential importance in increasing primary productivity. The continued deoxygenation throughout the PETM was likely caused by a combination of the basin's already restricted nature, increased halocline stratification, and intensified export productivity.
The results presented in this study show the potentially rapid environmental response to changes in carbon cycle and temperature. Our data also show that negative feedback mechanisms were active throughout the PETM and illustrate the important role of enhanced silicate weathering and organic-matter burial in driving the carbon drawdown leading to the PETM recovery. This highlights the importance of such marginal marine areas in carbon sequestration and recovery from carbon cycle perturbations.
All of the research data presented in this paper are publicly available in the Supplement.
The supplement related to this article is available online at: https://doi.org/10.5194/cp-17-1989-2021-supplement.
EWS, MTJ, and HHS conceptualized and laid out the methodology of the project. EWS, MTJ, LR, HH, IM, BPS, and HHS contributed to data collection and interpretations. MTJ, HH, and HHS contributed with funding acquisition. The original draft was prepared by EWS and MTJ. All authors contributed to the writing in the review and editing stage.
The authors declare that they have no conflict of interest.
Publisher's note: Copernicus Publications remains neutral with regard to jurisdictional claims in published maps and institutional affiliations.
Claus Heilmann-Clausen, Sverre Planke, Christian Tegner, Tanusha Naidoo, Phil Holdship, Stephen Wyatt, Lina Hedvig Line, and Valentin Zuchuat are all warmly thanked for their assistance. We also thank the editor Zhengtang Guo and the two anonymous referees for their constructive comments and handling of the manuscript.
This research has been supported by the Norges Forskningsråd (grant nos. 263000 and 223272).
This paper was edited by Zhengtang Guo and reviewed by two anonymous referees.
Abdelmalak, M. M., Planke, S., Faleide, J. I., Jerram, D. A., Zastrozhnov, D., Eide, S., and Myklebust, R.: The development of volcanic sequences at rifted margins: New insights from the structure and morphology of the Vøring Escarpment, mid-Norwegian Margin, J. Geophys. Res.-Sol. Ea., 121, 5212–5236, https://doi.org/10.1002/2015JB012788, 2016.
Alegret, L., Ortiz, S., and Molina, E.: Extinction and recovery of benthic foraminifera across the Paleocene–Eocene Thermal Maximum at the Alamedilla section (Southern Spain), Palaeogeogr. Palaeoclim., 279, 186–200, https://doi.org/10.1016/j.palaeo.2009.05.009, 2009.
Algeo, T. J. and Liu, J.: A re-assessment of elemental proxies for paleoredox analysis, Chem. Geol., 540, 119549, https://doi.org/10.1016/j.chemgeo.2020.119549, 2020.
Algeo, T. J. and Tribovillard, N.: Environmental analysis of paleoceanographic systems based on molybdenum–uranium covariation, Chem. Geol., 268, 211–225, https://doi.org/10.1016/j.chemgeo.2009.09.001, 2009.
Alley, R. B.: A heated mirror for future climate, Science, 352, 151–152, https://doi.org/10.1126/science.aaf4837, 2016.
Anell, I., Thybo, H., and Rasmussen, E.: A synthesis of Cenozoic sedimentation in the North Sea, Basin Res., 24, 154–179, https://doi.org/10.1111/j.1365-2117.2011.00517.x, 2012.
Babila, T. L., Penman, D. E., Hönisch, B., Kelly, D. C., Bralower, T. J., Rosenthal, Y., and Zachos, J. C.: Capturing the global signature of surface ocean acidification during the Palaeocene–Eocene Thermal Maximum, Philos. T. Roy. Soc. A, 376, 20170072, https://doi.org/10.1098/rsta.2017.0072, 2018.
Bains, S., Norris, R. D., Corfield, R. M., and Faul, K. L.: Termination of global warmth at the Palaeocene/Eocene boundary through productivity feedback, Nature, 407, 171–174, https://doi.org/10.1038/35025035, 2000.
Behar, F., Beaumont, V., and Penteado, H. D. B.: Rock-Eval 6 technology: performances and developments, Oil Gas Sci. Technol., 56, 111–134, https://doi.org/10.2516/ogst:2001013, 2001.
Bograd, S. J., Castro, C. G., Di Lorenzo, E., Palacios, D. M., Bailey, H., Gilly, W., and Chavez, F. P.: Oxygen declines and the shoaling of the hypoxic boundary in the California Current, Geophys. Res. Lett., 35, L12607, https://doi.org/10.1029/2008GL034185, 2008.
Bolle, M. P., Tantawy, A. A., Pardo, A., Adatte, T., Burns, S., and Kassab, A.: Climatic and environmental changes documented in the upper Paleocene to lower Eocene of Egypt, Eclogae Geol. Helv., 93, 33–52, https://doi.org/10.5169/seals-168806, 2000.
Bornemann, A., Norris, R. D., Lyman, J. A., D'haenens, S., Groeneveld, J., Röhl, U., and Speijer, R. P.: Persistent environmental change after the Paleocene–Eocene Thermal Maximum in the eastern North Atlantic, Earth Planet. Sc. Lett., 394, 70–81, https://doi.org/10.1016/j.epsl.2014.03.017, 2014.
Bowen, G. J.: Up in smoke: A role for organic carbon feedbacks in Paleogene hyperthermals, Global Planet. Change, 109, 18–29, https://doi.org/10.1016/j.gloplacha.2013.07.001, 2013.
Bowen, G. J. and Zachos, J. C.: Rapid carbon sequestration at the termination of the Palaeocene–Eocene Thermal Maximum, Nat. Geosci., 3, 866–869, https://doi.org/10.1038/ngeo1014, 2010.
Bowen, G. J., Maibauer, B. J., Kraus, M. J., Röhl, U., Westerhold, T., Steimke, A., and Clyde, W. C.: Two massive, rapid releases of carbon during the onset of the Plaeocene–Eocene thermal maximum, Nat. Geosci., 8, 44–47, https://doi.org/10.1038/ngeo2316, 2015.
Bridgestock, L., Hsieh, Y. T., Porcelli, D., and Henderson, G. M.: Increased export production during recovery from the Paleocene–Eocene thermal maximum constrained by sedimentary Ba isotopes, Earth Planet. Sc. Lett., 510, 53–63, https://doi.org/10.1016/j.epsl.2018.12.036, 2019.
Bøggild, O. B.: Den vulkanske Aske i Moleret samt en Oversigt over Danmarks ældre Tertiærbjergarter, B. Geol. Soc. Denmark, 33, 1–159, 1918.
Carmichael, M. J., Inglis, G. N., Badger, M. P., Naafs, B. D. A., Behrooz, L., Remmelzwaal, S., and Dickson, A. J.: Hydrological and associated biogeochemical consequences of rapid global warming during the Paleocene-Eocene Thermal Maximum, Global Planet. Change, 157, 114–138, https://doi.org/10.1016/j.gloplacha.2017.07.014, 2017.
Carmichael, M. J., Pancost, R. D., and Lunt, D. J.: Changes in the occurrence of extreme precipitation events at the Paleocene–Eocene thermal maximum, Earth Planet. Sc. Lett., 501, 24–36, https://doi.org/10.1016/j.epsl.2018.08.005, 2018.
Cassidy, M., Watt, S. F., Palmer, M. R., Trofimovs, J., Symons, W., Maclachlan, S. E., and Stinton, A. J.: Construction of volcanic records from marine sediment cores: A review and case study (Montserrat, West Indies), Earth-Sci. Rev., 138, 137–155, https://doi.org/10.1016/j.earscirev.2014.08.008, 2014.
Charles, A. J., Condon, D. J., Harding, I. C., Pälike, H., Marshall, J. E., Cui, Y., and Croudace, I. W.: Constraints on the numerical age of the Paleocene-Eocene boundary, Geochem. Geophy. Geosy., 12, Q0AA17, https://doi.org/10.1029/2010GC003426, 2011.
Clausen, O. R., Nielsen, O. B., Huuse, M., and Michelsen, O.: Geological indications for Palaeogene uplift in the eastern North Sea Basin, Global Planet. Change, 24, 175–187, https://doi.org/10.1016/S0921-8181(00)00007-2, 2000.
Cramer, B. S., Toggweiler, J. R., Wright, J. D., Katz, M. E., and Miller, K. G.: Ocean overturning since the Late Cretaceous: Inferences from a new benthic foraminiferal isotope compilation, Paleoceanography, 24, PA4216, https://doi.org/10.1029/2008PA001683, 2009.
Cramwinckel, M. J., Huber, M., Kocken, I. J., Agnini, C., Bijl, P. K., Bohaty, S. M., and Peterse, F.: Synchronous tropical and polar temperature evolution in the Eocene, Nature, 559, 382–386, https://doi.org/10.1038/s41586-018-0272-2, 2018.
Croudace, I. W., Rindby, A., and Rothwell, R. G.: ITRAX: description and evaluation of a new multi-function X-ray core scanner, in: New Techniques in Sediment Core Analysis, edited by: Rothwell, R. G., Geological Society, London, Special Publications, 267, 51–63, https://doi.org/10.1144/GSL.SP.2006.267.01.04, 2006.
Dickens, G. R., O'Neil, J. R., Rea, D. K., and Owen, R. M.: Dissociation of oceanic methane hydrate as a cause of the carbon isotope excursion at the end of the Paleocene, Paleoceanogr. Paleoclim., 10, 965–971, https://doi.org/10.1029/95PA02087, 1995.
Dickson, A. J., Rees-Owen, R. L., März, C., Coe, A. L., Cohen, A. S., Pancost, R. D., and Shcherbinina, E.: The spread of marine anoxia on the northern Tethys margin during the Paleocene-Eocene Thermal Maximum, Paleoceanography, 29, 471–488, https://doi.org/10.1002/2014PA002629, 2014.
Dickson, A. J., Cohen, A. S., Coe, A. L., Davies, M., Shcherbinina, E. A., and Gavrilov, Y. O.: Evidence for weathering and volcanism during the PETM from Arctic Ocean and Peri-Tethys osmium isotope records, Palaeogeogr. Palaeoclim., 438, 300–307, https://doi.org/10.1016/j.palaeo.2015.08.019, 2015.
Doebelin, N. and Kleeberg, R.: Profex: a graphical user interface for the Rietveld refinement program BGMN, J. Appl. Crystallogr., 48, 1573–1580, https://doi.org/10.1107/S1600576715014685, 2015.
Dunkley Jones, T., Lunt, D. J., Schmidt, D. N., Ridgwell, A., Sluijs, A., Valdes, P. J., and Maslin, M.: Climate model and proxy data constraints on ocean warming across the Paleocene–Eocene Thermal Maximum, Earth-Sci. Rev., 125, 123–145, https://doi.org/10.1016/j.earscirev.2013.07.004, 2013.
Dunkley Jones, T., Manners, H. R., Hoggett, M., Kirtland Turner, S., Westerhold, T., Leng, M. J., Pancost, R. D., Ridgwell, A., Alegret, L., Duller, R., and Grimes, S. T.: Dynamics of sediment flux to a bathyal continental margin section through the Paleocene–Eocene Thermal Maximum, Clim. Past, 14, 1035–1049, https://doi.org/10.5194/cp-14-1035-2018, 2018.
Dypvik, H., Riber, L., Burca, F., Rüther, D., Jargvoll, D., Nagy, J., and Jochmann, M.: The Paleocene–Eocene thermal maximum (PETM) in Svalbard – clay mineral and geochemical signals, Palaeogeogr. Palaeoclim., 302, 156–169,, https://doi.org/10.1016/j.palaeo.2010.12.025, 2011.
Egger, H., Heilmann-Clausen, C., and Schmitz, B.: The Paleocene/Eocene-boundary interval of a Tethyan deep-sea section (Austria) and its correlation with the North Sea Basin, B. Soc. Geol. Fr., 171, 207–216, https://doi.org/10.2113/171.2.207, 2000.
Egger, H., Fenner, J., Heilmann-Clausen, C, Rögl, F., Sachsenhofer, R. F., and Schmitz, B.: Paleoproductivity of the northwestern Tethyan margin (Anthering Sec-tion, Austria) across the Paleocene-Eocene transition, in: Causes and Consequences of Globally Warm Climates in the Early Paleogene, edited by: Wing, S. L., Gingerich, P. D., Schmitz, B., and Thomas, E., Geological Society of America Special Paper, 369, 133–146, 2003.
Eldholm, O. and Thomas, E.: Environmental impact of volcanic margin formation, Earth Planet. Sc. Lett., 117, 319–329, https://doi.org/10.1016/0012-821X(93)90087-P, 1993.
Frieling, J., Svensen, H. H., Planke, S., Cramwinckel, M. J., Selnes, H., and Sluijs, A.: Thermogenic methane release as a cause for the long duration of the PETM, P. Natl. Acad. Sci. USA, 113, 12059–12064, https://doi.org/10.1073/pnas.1603348113, 2016.
Frieling, J., Gebhardt, H., Huber, M., Adekeye, O. A., Akande, S. O., Reichart, G. J., and Sluijs, A.: Extreme warmth and heat-stressed plankton in the tropics during the Paleocene-Eocene Thermal Maximum, Sci. Adv., 3, e1600891, https://doi.org/10.1126/sciadv.1600891, 2017.
Frieling, J., Peterse, F., Lunt, D. J., Bohaty, S. M., Sinninghe-Damsté, J. S., Reichart, G. J., and Sluijs, A.: Widespread warming before and elevated barium burial during the Paleocene-Eocene Thermal Maximum: Evidence for methane hydrate release?, Paleoceanogr. Paleoclim., 34, 546–566, https://doi.org/10.1029/2018PA003425, 2019.
Gavrilov, Y. O., Kodina, L. A., Lubchenko, I. Y., and Muzylev, N. G.: The late Paleocene anoxic event in epicontinental seas of Peri-Tethys and formation of the sapropelite unit: Sedimentology and geochemistry, Lithology and Mineral Resources, 32(5), 427–450, Translated from: Litologiia I Poleznye Iskoparmye, 5, 492–517, 1997.
Gibbs, R. J.: Clay mineral segregation in the marine environment, J. Sediment. Res., 47, 237–243, https://doi.org/10.1306/212F713A-2B24-11D7-8648000102C1865D, 1977.
Gibson, T. G., Bybell, L. M., and Mason, D. B.: Stratigraphic and climatic implications of clay mineral changes around the Paleocene/Eocene boundary of the northeastern US margin, Sediment. Geol., 134, 65–92, https://doi.org/10.1016/S0037-0738(00)00014-2, 2000.
Gilly, W. F., Beman, J. M., Litvin, S. Y., and Robison, B. H.: Oceanographic and biological effects of shoaling of the oxygen minimum zone, Annu. Rev. Mar. Sci., 5, 393–420, https://doi.org/10.1146/annurev-marine-120710-100849, 2013.
Gislason, S. R. and Oelkers, E. H.: Silicate rock weathering and the global carbon cycle, in: Frontiers in Geochemistry: Contribution of Geochemistry to the Study of the Earth, edited by: Harmon, R. S. and Parker, A., 84–103, https://doi.org/10.1002/9781444329957.ch5, 2011.
Gutjahr, M., Ridgwell, A., Sexton, P. F., Anagnostou, E., Pearson, P. N., Pälike, H., and Foster, G. L.: Very large release of mostly volcanic carbon during the Palaeocene–Eocene Thermal Maximum, Nature, 548, 573–577, https://doi.org/10.1038/nature23646, 2017.
Haaland, H. J., Furnes, H., and Martinsen, O. J.: Paleogene tuffaceous intervals, Grane Field (Block 25/11), Norwegian North Sea: their depositional, petrographical, geochemical character and regional implications, Mar. Petrol. Geol., 17, 101–118, https://doi.org/10.1016/S0264-8172(99)00009-4, 2000.
Harding, I. C., Charles, A. J., Marshall, J. E., Pälike, H., Roberts, A. P., Wilson, P. A., and Pearce, R. B.: Sea-level and salinity fluctuations during the Paleocene–Eocene thermal maximum in Arctic Spitsbergen, Earth Planet. Sc. Lett., 303, 97–107, https://doi.org/10.1016/j.epsl.2010.12.043, 2011.
Hare, A. A., Kuzyk, Z. Z. A., Macdonald, R. W., Sanei, H., Barber, D., Stern, G. A., and Wang, F.: Characterization of sedimentary organic matter in recent marine sediments from Hudson Bay, Canada, by Rock-Eval pyrolysis, Org. Geochem., 68, 52–60, https://doi.org/10.1016/j.orggeochem.2014.01.007, 2014.
Heilmann-Clausen, C.: Review of Paleocene dinoflagellates from the North Sea region, Geologiska Föreningens Förhandlingar, 116, 51–53, https://doi.org/10.1080/11035899409546149, 1994.
Heilmann-Clausen, C.: Palæogene aflejringer over Danskekalken, in: Aarhus Geokompendier No. 1, edited by: Nielsen, O. B., Danmarks geologi fra Kridt til i dag, 69–114, 1995.
Heilmann-Clausen, C., Nielsen, O. B., and Gersner, F.: Lithostratigraphy and depositional environments in the Upper Paleocene and Eocene of Denmark, B. Geol. Soc. Denmark, 33, 287–323, 1985.
Held, I. M. and Soden, B. J.: Robust responses of the hydrological cycle to global warming, J. Climate, 19, 5686–5699, https://doi.org/10.1175/JCLI3990.1, 2006.
Hembury, D. J., Palmer, M. R., Fones, G. R., Mills, R. A., Marsh, R., and Jones, M. T.: Uptake of dissolved oxygen during marine diagenesis of fresh volcanic material, Geochim. Cosmochim. Ac., 84, 353–368, https://doi.org/10.1016/j.gca.2012.01.017, 2012.
Hollis, C. J., Taylor, K. W., Handley, L., Pancost, R. D., Huber, M., Creech, J. B., and Gibbs, S.: Early Paleogene temperature history of the Southwest Pacific Ocean: Reconciling proxies and models, Earth Planet. Sc. Lett., 349–350, 53–66, https://doi.org/10.1016/j.epsl.2012.06.024, 2012.
Horni, J. A., Hopper, J. R., Blischke, A., Geisler, W. H., Stewart, M., McDermott, K., Judge, M., Elerlendsson, O., and Arting, U. E.: Regional distribution of volcanism within the North Atlantic Igneous Province, in: A Reappraisal of Crustal Structure, Tectonostratigraphy and Magmatic Evolution, edited by: Peron-Pinvidic, G., Hopper, J. R., Stoker, M. S., Gaina, C., Doornenbal, J. C., Funck, T., and Arting, U. E., Geological Society, London, special publications, https://doi.org/10.1144/SP447.18, 2017.
Huggett, J. M. and Knox, R. O. B.: Clay mineralogy of the Tertiary onshore and offshore strata of the British Isles, Clay Miner., 41, 5–46, https://doi.org/10.1180/0009855064110195, 2006.
Jenkyns, H. C.: Geochemistry of oceanic anoxic events, Geochem. Geophy. Geosy., 11, Q03004, https://doi.org/10.1029/2009GC002788, 2010.
John, C. M., Banerjee, N. R., Longstaffe, F. J., Sica, C., Law, K. R., and Zachos, J. C.: Clay assemblage and oxygen isotopic constraints on the weathering response to the Paleocene-Eocene thermal maximum, east coast of North America, Geology, 40, 591–594, https://doi.org/10.1130/G32785.1, 2012.
Jolley, D. W. and Widdowson, M.: Did Paleogene North Atlantic rift-related eruptions drive early Eocene climate cooling?, Lithos, 79, 355–366, https://doi.org/10.1016/j.lithos.2004.09.007, 2005.
Jones, M. T. and Gislason, S. R.: Rapid releases of metal salts and nutrients following the deposition of volcanic ash into aqueous environments, Geochim. Cosmochim. Ac., 72, 3661–3680, https://doi.org/10.1016/j.gca.2008.05.030, 2008.
Jones, M. T., Percival, L. M. E., Stokke, E. W., Frieling, J., Mather, T. A., Riber, L., Schubert, B. A., Schultz, B., Tegner, C., Planke, S., and Svensen, H. H.: Mercury anomalies across the Palaeocene–Eocene Thermal Maximum, Clim. Past, 15, 217–236, https://doi.org/10.5194/cp-15-217-2019, 2019.
Jordt, H., Thyberg, B. I., and Nøttvedt, A.: Cenozoic evolution of the central and northern North Sea with focus on differential vertical movements of the basin floor and surrounding clastic source areas, Geol. Soc. Lon. Spec. Publ., 167, 219–243, https://doi.org/10.1144/GSL.SP.2000.167.01.09, 2000.
Kelly, D. C., Zachos, J. C., Bralower, T. J., and Schellenberg, S. A.: Enhanced terrestrial weathering/runoff and surface ocean carbonate production during the recovery stages of the Paleocene-Eocene thermal maximum, Paleoceanography, 20, PA4023, https://doi.org/10.1029/2005PA001163, 2005.
Kemp, S. J., Ellis, M. A., Mounteney, I., and Kender, S.: Palaeoclimatic implications of high-resolution clay mineral assemblages preceding and across the onset of the Palaeocene–Eocene Thermal Maximum, North Sea Basin, Clay Miner., 51, 793–813, https://doi.org/10.1180/claymin.2016.051.5.08, 2016.
Kender, S., Stephenson, M. H., Riding, J. B., Leng, M. J., Knox, R. W. B., Peck, V. L., and Jamieson, R.: Marine and terrestrial environmental changes in NW Europe preceding carbon release at the Paleocene–Eocene transition, Earth Planet. Sc. Lett., 353, 108–120, https://doi.org/10.1016/j.epsl.2012.08.011, 2012.
Kennett, J. P. and Stott, L. D.: Abrupt deep-sea warming, palaeoceanographic changes and benthic extinctions at the end of the Palaeocene, Nature, 353, 225–229, https://doi.org/10.1038/353225a0, 1991.
Kent, D. V., Cramer, B. S., Lanci, L., Wang, D., Wright, J. D., and Van der Voo, R.: A case for a comet impact trigger for the Paleocene/Eocene thermal maximum and carbon isotope excursion, Earth Planet. Sc. Lett., 211, 13–26, https://doi.org/10.1016/S0012-821X(03)00188-2, 2003.
Khozyem, H., Adatte, T., Spangenberg, J. E., Tantawy, A. A., and Keller, G.: Palaeoenvironmental and climatic changes during the Palaeocene–Eocene Thermal Maximum (PETM) at the Wadi Nukhul Section, Sinai, Egypt, J. Geol. Soc., 170, 341–352, https://doi.org/10.1144/jgs2012-046, 2013.
King, C.: A Revised Correlation of Tertiary Rocks in the British Isles and Adjacent Areas of NW Europe, edited by: Gale, A. S. and Barry, T. L., Special reports, 27, The Geological Society, London, 2016.
Kirtland Turner, S., Hull, P. M., Kump, L. R., and Ridgwell, A.: A probabilistic assessment of the rapidity of PETM onset, Nat. Commun., 8, 1–10, https://doi.org/10.1038/s41467-017-00292-2, 2017.
Knox, R. W. O'B. : Tectonic controls on sequence development in the Palaeocene and earliest Eocene of southeast England: implications for North Sea stratigraphy, in: Sequence Stratigraphy in British Geology, edited by: Hesselbo, S. P. and Parkinson, D. N., Geological Society, London, Special Publications, 103, 209–230, https://doi.org/10.1144/GSL.SP.1996.103.01.12, 1996.
Knox, R. W. O'B. and Morton, A. C.: The record of early Tertiary N Atlantic volcanism in sediments of the North Sea Basin, in: Early Tertiary Volcanism and the Opening of the NE Atlantic, edited by: Morton, A. C. and Parson, L. M., Geological Society, London, Special Publications, 39, 407–419, https://doi.org/10.1144/GSL.SP.1988.039.01.36, 1988.
Knox, R. W. O'B., Bosch, J. H. A., Rasmussen, E. S., Heilmann-Clausen, C., Hiss, M., De Lugt, I. R., Kasinski, J., King, C., Köthe, A., Slodkowska, B., Standke, G., and Vandenberghe, N.: Cenozoic, in: Petroleum Geological Atlas of the Southern Permian Basin Area, edited by: Dornenbaal, H. and Stevenson, A., EAGE Publications b.v, Houten, 211–223, 2010.
Komar, N. and Zeebe, R. E.: Redox-controlled carbon and phosphorus burial: A mechanism for enhanced organic carbon sequestration during the PETM, Earth Planet. Sc. Lett., 479, 71–82, https://doi.org/10.1016/j.epsl.2017.09.011, 2017.
Kraus, M. J. and Riggins, S.: Transient drying during the Paleocene–Eocene Thermal Maximum (PETM): analysis of paleosols in the Bighorn Basin, Wyoming, Palaeogeogr. Palaeoclim., 245, 444–461, https://doi.org/10.1016/j.palaeo.2006.09.011, 2007.
Lafargue, E., Marquis, F., and Pillot, D.: Rock-Eval 6 applications in hydrocarbon exploration, production, and soil contamination studies, Rev. l Fr. Petrol., 53, 421–437, 1998.
Larsen, L. M., Fitton, J. G., and Pedersen, A. K.: Paleogene volcanic ash layers in the Danish Basin: compositions and source areas in the North Atlantic Igneous Province, Lithos, 71, 47–80, https://doi.org/10.1016/j.lithos.2003.07.001, 2003.
Larsen, R. B. and Tegner, C.: Pressure conditions for the solidification of the Skaergaard intrusion: eruption of East Greenland flood basalts in less than 300,000 years, Lithos, 92, 181–197, https://doi.org/10.1016/j.lithos.2006.03.032, 2006.
Littler, K., Röhl, U., Westerhold, T., and Zachos, J. C.: A high-resolution benthic stable-isotope record for the South Atlantic: Implications for orbital-scale changes in Late Paleocene–Early Eocene climate and carbon cycling, Earth Planet. Sc. Lett., 401, 18–30, https://doi.org/10.1016/j.epsl.2014.05.054, 2014.
Ma, Z., Gray, E., Thomas, E., Murphy, B., Zachos, J., and Paytan, A.: Carbon sequestration during the Palaeocene–Eocene Thermal Maximum by an efficient biological pump, Nat. Geosci., 7, 382–388, https://doi.org/10.1038/ngeo2139, 2014.
Marsh, R., Mills, R. A., Green, D. R., Salter, I., and Taylor, S.: Controls on sediment geochemistry in the Crozet region, Deep-Sea Res. Pt. II, 54, 2260–2274, https://doi.org/10.1016/j.dsr2.2007.06.004, 2007.
McInerney, F. A. and Wing, S. L.: The Paleocene-Eocene Thermal Maximum: A perturbation of carbon cycle, climate, and biosphere with implications for the future, Annu. Rev. Earth Pl. Sc., 39, 489–516, https://doi.org/10.1146/annurev-earth-040610-133431, 2011.
McLennan, S. M.: Weathering and global denudation, J. Geol., 101, 295–303, https://doi.org/10.1086/648222, 1993.
McLennan, S. M.: Relationships between the trace element composition of sedimentary rocks and upper continental crust, Geochem. Geophy. Geosy., 2, 1021, https://doi.org/10.1029/2000GC000109, 2001.
Mitlehner, A. G.: Palaeoenvironments in the North Sea Basin around the Paleocene-Eocene boundary: evidence from diatoms and other siliceous microfossils, Geological Society, London, Special Publications, 101, 255–273, https://doi.org/10.1144/GSL.SP.1996.101.01.15, 1996.
Moore, D. M. and Reynolds, R. C.: X-ray Diffraction and the Identification and Analysis of Clay Minerals, Oxford University Press, Oxford, 1997.
Morton, A. C. and Evans, J. A.: Geochemistry of basaltic ash beds from the Fur Formation, Island of Fur, Denmark, B. Geol. Soc. Denmark, 37, 1–9, 1988.
Nagy, J., Jargvoll, D., Dypvik, H., Jochmann, M., and Riber, L.: Environmental changes during the Paleocene–Eocene Thermal Maximum in Spitsbergen as reflected by benthic foraminifera, Polar Res., 32, 19737, https://doi.org/10.3402/polar.v32i0.19737, 2013.
Nesbitt, H. and Young, G. M.: Early Proterozoic climates and plate motions inferred from major element chemistry of lutites, Nature, 299, 715–717, https://doi.org/10.1038/299715a0, 1982.
Nielsen, O. B. and Heilmann-Clausen, C.: Palaeogene volcanism: the sedimentary record in Denmark, Geological Society, London, Special Publications, 39, 395–405, https://doi.org/10.1144/GSL.SP.1988.039.01.35, 1988.
Nielsen, O. B., Sørensen, S., Thiede, J., and Skarbø, O.: Cenozoic differential subsidence of North Sea, AAPG Bull., 70, 276–298, https://doi.org/10.1306/94885679-1704-11D7-8645000102C1865D, 1986.
Nielsen, O. B., Rasmussen, E. S., and Thyberg, B. I.: Distribution of clay minerals in the northern North Sea Basin during the Paleogene and Neogene: a result of source-area geology and sorting processes, J. Sediment. Res., 85, 562–581, https://doi.org/10.2110/jsr.2015.40, 2015.
Nunes, F. and Norris, R. D.: Abrupt reversal in ocean overturning during the Palaeocene/Eocene warm period, Nature, 439, 60–63, https://doi.org/10.1038/nature04386, 2006.
Ogg, J.: Geomagnetic Polarity Time Scale, in: The Geologic Time Scale 2012, edited by: Gradstein, F., Ogg, J., Schmitz, M., and Ogg, G., Elsevier, 85–113, 2012.
Pälike, C., Delaney, M. L., and Zachos, J. C.: Deep-sea redox across the Paleocene-Eocene thermal maximum, Geochem. Geophy. Geosy., 15, 1038–1053, https://doi.org/10.1002/2013GC005074, 2014.
Pedersen, G. K. and Surlyk, F.: The Fur Formation, a late Paleocene ash-bearing diatomite from northern Denmark, B. Geol. Soc. Denmark, 32, 43–65, 1983.
Pedersen, G. K., Pedersen, S. A. S., Steffensen, J., and Pedersen, C. S.: Clay content of a clayey diatomite, the Early Eocene Fur Formation, Denmark, B. Geol. Soc. Denmark, 51, 159–177, 2004.
Pedersen, S. A. S.: Palaeogene diatomite deposits in Denmark: geological investigations and applied aspects, Geol. Surv. Den. Greenl., 15, 21–24, https://doi.org/10.34194/geusb.v15.5034, 2008.
Penman, D. E.: Silicate weathering and North Atlantic silica burial during the Paleocene-Eocene thermal maximum, Geology, 44, 731–734, https://doi.org/10.1130/G37704.1, 2016.
Penman, D. E. and Zachos, J. C.: New constraints on massive carbon release and recovery processes during the Paleocene-Eocene Thermal Maximum, Environ. Res. Lett., 13, 105008, https://doi.org/10.1088/1748-9326/aae285, 2018.
Peters, K. E.: Guidelines for evaluating petroleum source rock using programmed pyrolysis, AAPG Bull., 70, 318–329, https://doi.org/10.1306/94885688-1704-11D7-8645000102C1865D, 1986.
Peters, K. E., Peters, K. E., Walters, C. C., and Moldowan, J. M.: The biomarker guide, vol. 1, Cambridge University Press, Cambridge, United Kingdom, 2005.
Petersen, H. I., Nielsen, L. H., Bojesen-Koefoed, J. A., Mathiesen, A., Kristensen, L., and Dalhoff, F.: Evaluation of the quality, thermal maturity and distribution of potential source rocks in the Danish part of the Norwegian–Danish Basin, Geol. Surv. Den. Greenl., 16, 1–27, https://doi.org/10.34194/geusb.v16.4989, 2008.
Pujalte, V., Schmitz, B., and Baceta, J. I.: Sea-level changes across the Paleocene–Eocene interval in the Spanish Pyrenees, and their possible relationship with North Atlantic magmatism, Palaeogeogr. Palaeoclim., 393, 45–60, https://doi.org/10.1016/j.palaeo.2013.10.016, 2014.
Rasmussen, E. S., Heilmann-Clausen, C., Waagstein, R., and Eidvin, T.: The tertiary of Norden, Episodes, 31, 66–72, 2008.
Renne, P. R., Mundil, R., Balco, G., Min, K. and Ludwig, K. R.: Joint determination of 40K decay constants and 40Ar∗/40K for the Fish Canyon sanidine standard, and improved accuracy for 40Ar/39Ar geochronology, Geochim. Cosmochim. Ac., 74, 5349–5367, https://doi.org/10.1016/j.gca.2010.06.017, 2010.
Renne, P. R., Balco, G., Ludwig, K. R., Mundil, R., and Min, K.: Response to the comment by WH Schwarz et al. on “Joint determination of 40K decay constants and 40Ar∗/40K for the Fish Canyon sanidine standard, and improved accuracy for 40Ar/39Ar geochronology” by PR Renne et al.(2010), Geochim. Cosmochim. Ac., 75, 5097–5100, https://doi.org/10.1016/j.gca.2011.06.021, 2011.
Reynolds III, R. C. and Reynolds Jr., R. C.: NEWMOD II a computer program for the calculation of one-dimensional diffraction patterns of mixed-layered clays, 1526 Farlow Avenue. Crofton, MD, 21114, 2012.
Riahi, K., van Vuuren, D. P., Kriegler, E., Edmonds, J., O'neill, B. C., Fujimori, S., and Lutz, W.: The shared socioeconomic pathways and their energy, land use, and greenhouse gas emissions implications: an overview, Global Environ. Chang., 42, 153–168, https://doi.org/10.1016/j.gloenvcha.2016.05.009, 2017.
Richter, T. O., van der Gaast, S., Koster, B., Vaars, A., Gieles, R., de Stigter, H. C., and van Weering, T. C.: The Avaatech XRF Core Scanner: technical description and applications to NE Atlantic sediments, Geological Society, London, Special Publications, 267, 39–50, https://doi.org/10.1144/GSL.SP.2006.267.01.03, 2006.
Rietveld, H.: A profile refinement method for nuclear and magnetic structures, J. Appl. Crystallogr., 2, 65–71, https://doi.org/10.1107/S0021889869006558, 1969.
Robert, C. and Kennett, J. P.: Antarctic subtropical humid episode at the Paleocene-Eocene boundary: Clay-mineral evidence, Geology, 22, 211–214, https://doi.org/10.1130/0091-7613(1994)022<0211:ASHEAT>2.3.CO;2, 1994.
Rothwell, R. G. and Croudace, I. W.: Twenty Years of XRF Core Scanning Marine Sediments: What Do Geochemical Proxies Tell Us?, in: Micro-XRF Studies of Sediment Cores, edited by: Croudace, I. and Rothwell, R., Developments in Paleoenvironmental Research, 17, Springer, Dordrecht, 25–102, 2015.
Saunders, A. D.: Two LIPs and two Earth-system crises: the impact of the North Atlantic Igneous Province and the Siberian Traps on the Earth-surface carbon cycle, Geol. Mag., 153, 201–222, https://doi.org/10.1017/S0016756815000175, 2016.
Schaller, M. F., Fung, M. K., Wright, J. D., Katz, M. E., and Kent, D. V.: Impact ejecta at the Paleocene-Eocene boundary, Science, 354, 225–229, https://doi.org/10.1126/science.aaf5466, 2016.
Schiøler, P., Andsbjerg, J., Clausen, O. R., Dam, G., Dybkjær, K., Hamberg, L., and Rasmussen, J. A.: Lithostratigraphy of the Palaeogene–lower Neogene succession of the Danish North Sea, GEUS Bull., 12, 1–77, https://doi.org/10.34194/geusb.v12.5249, 2007.
Schmitz, B. and Pujalte, V.: Sea-level, humidity, and land-erosion records across the initial Eocene thermal maximum from a continental-marine transect in northern Spain, Geology, 31, 689–692, https://doi.org/10.1130/G19527.1, 2003.
Schmitz, B., Peucker-Ehrenbrink, B., Heilmann-Clausen, C., Åberg, G., Asaro, F., and Lee, C. T. A.: Basaltic explosive volcanism, but no comet impact, at the Paleocene–Eocene boundary: high-resolution chemical and isotopic records from Egypt, Spain and Denmark, Earth Planet. Sc. Lett., 225, 1–17, https://doi.org/10.1016/j.epsl.2004.06.017, 2004.
Schoon, P. L., Heilmann-Clausen, C., Schultz, B. P., Sluijs, A., Sinninghe-Damsté, J. S., and Schouten, S.: Recognition of Early Eocene global carbon isotope excursions using lipids of marine Thaumarchaeota, Earth Planet. Sc. Lett., 373, 160–168, https://doi.org/10.1016/j.epsl.2013.04.037, 2013.
Schoon, P. L., Heilmann-Clausen, C., Schultz, B. P., Sinninghe-Damsté, J. S., and Schouten, S.: Warming and environmental changes in the eastern North Sea Basin during the Palaeocene–Eocene Thermal Maximum as revealed by biomarker lipids, Org. Geochem., 78, 79–88, https://doi.org/10.1016/j.orggeochem.2014.11.003, 2015.
Scott, C. and Lyons, T. W.: Contrasting molybdenum cycling and isotopic properties in euxinic versus non-euxinic sediments and sedimentary rocks: Refining the paleoproxies, Chem. Geol., 324, 19–27, https://doi.org/10.1016/j.chemgeo.2012.05.012, 2012.
Seager, R., Naik, N., and Vecchi, G. A.: Thermodynamic and dynamic mechanisms for large-scale changes in the hydrological cycle in response to global warming, J. Climate, 23, 4651–4668, https://doi.org/10.1175/2010JCLI3655.1, 2010.
Sluijs, A., Brinkhuis, H., Crouch, E. M., John, C. M., Handley, L., Munsterman, D., and Pancost, R. D.: Eustatic variations during the Paleocene-Eocene greenhouse world, Paleoceanography, 23, PA4216, https://doi.org/10.1029/2008PA001615, 2008.
Sluijs, A., Schouten, S., Donders, T. H., Schoon, P. L., Röhl, U., Reichart, G. J., and Brinkhuis, H.: Warm and wet conditions in the Arctic region during Eocene Thermal Maximum 2, Nat. Geosci., 2, 777–780, https://doi.org/10.1038/ngeo668, 2009.
Sluijs, A., van Roij, L., Harrington, G. J., Schouten, S., Sessa, J. A., LeVay, L. J., Reichart, G.-J., and Slomp, C. P.: Warming, euxinia and sea level rise during the Paleocene–Eocene Thermal Maximum on the Gulf Coastal Plain: implications for ocean oxygenation and nutrient cycling, Clim. Past, 10, 1421–1439, https://doi.org/10.5194/cp-10-1421-2014, 2014.
Soliman, M. F., Aubry, M. P., Schmitz, B., and Sherrell, R. M.: Enhanced coastal paleoproductivity and nutrient supply in Upper Egypt during the Paleocene/Eocene Thermal Maximum (PETM): Mineralogical and geochemical evidence, Palaeogeogr. Palaeoclim., 310, 365–377, https://doi.org/10.1016/j.palaeo.2011.07.027, 2011.
Speijer, R. P. and Wagner, T.: Sea-level changes and black shales associated with the late Paleocene thermal maximum: Organic-geochemical and micro-paleontologic evidence from the southern Tethyan margin (Egypt-Israel), in: Catastrophic Events and Mass Extinctions: Impacts and Beyond, edited by: Koeberl, C. and MacLeod, K. G., Geological Society of America Special Paper, 356, 533–549, https://doi.org/10.1130/0-8137-2356-6.533, 2002.
Speijer, R. P., Schmitz, B., and van der Zwaan, G. J.: Benthic foraminiferal extinction and repopulation in response to latest Paleocene Tethyan anoxia, Geology, 25, 683–686, 1997.
Stefánsson, A. and Gíslason, S. R.: Chemical weathering of basalts, Southwest Iceland: effect of rock crystallinity and secondary minerals on chemical fluxes to the ocean, Am. J. Sci., 301, 513–556, https://doi.org/10.2475/ajs.301.6.513, 2001.
Stein, R., Boucsein, B., and Meyer, H.: Anoxia and high primary production in the Paleogene central Arctic Ocean: First detailed records from Lomonosov Ridge, Geophys. Res. Lett., 33, L18606, https://doi.org/10.1029/2006GL026776, 2006.
Stokke, E. W., Jones, M. T., Tierney, J. E., Svensen, H. H., and Whiteside, J. H.: Temperature changes across the Paleocene-Eocene Thermal Maximum–a new high-resolution TEX86 temperature record from the Eastern North Sea Basin, Earth Planet. Sc. Lett., 544, 116388, https://doi.org/10.1016/j.epsl.2020.116388, 2020a.
Stokke, E. W., Liu, E. J., and Jones, M. T.: Evidence of explosive hydromagmatic eruptions during the emplacement of the North Atlantic Igneous Province, Volcanica, 3, 227–250, https://doi.org/10.30909/vol.03.02.227250, 2020b.
Storey, M., Duncan, R. A., and Swisher, C. C.: Paleocene-Eocene thermal maximum and the opening of the northeast Atlantic, Science, 316, 587–589, https://doi.org/10.1126/science.1135274, 2007a.
Storey, M., Duncan, R. A., and Tegner, C.: Timing and duration of volcanism in the North Atlantic Igneous Province: Implications for geodynamics and links to the Iceland hotspot, Chem. Geol., 241, 264–281, https://doi.org/10.1016/j.chemgeo.2007.01.016, 2007b.
Stramma, L., Johnson, G. C., Sprintall, J., and Mohrholz, V.: Expanding oxygen-minimum zones in the tropical oceans, Science, 320, 655–658, https://doi.org/10.1126/science.1153847, 2008.
Stramma, L., Prince, E. D., Schmidtko, S., Luo, J., Hoolihan, J. P., Visbeck, M., and Körtzinger, A.: Expansion of oxygen minimum zones may reduce available habitat for tropical pelagic fishes, Nat. Clim. Change, 2, 33–37, https://doi.org/10.1038/nclimate1304, 2012.
Svensen, H., Planke, S., Malthe-Sørenssen, A., Jamtveit, B., Myklebust, R., Eidem, T. R., and Rey, S. S.: Release of methane from a volcanic basin as a mechanism for initial Eocene global warming, Nature, 429, 542–545, https://doi.org/10.1038/nature02566, 2004.
Svensen, H. H., Bjærke, M. R., and Kverndokk, K.: The Past as a Mirror: Deep Time Climate Change Exemplarity in the Anthropocene, Culture Unbound, 11, 330–352, https://doi.org/10.3384/cu.2000.1525.1909301, 2019.
Thiry, M.: Palaeoclimatic interpretation of clay minerals in marine deposits: an outlook from the continental origin, Earth-Sci. Rev., 49, 201–221, https://doi.org/10.1016/S0012-8252(99)00054-9, 2000.
Thomas, D. J., Zachos, J. C., Bralower, T. J., Thomas, E., and Bohaty, S.: Warming the fuel for the fire: Evidence for the thermal dissociation of methane hydrate during the Paleocene-Eocene thermal maximum, Geology, 30, 1067–1070, https://doi.org/10.1130/0091-7613(2002)030<1067:WTFFTF>2.0.CO;2, 2002.
Thomas, E.: Late Cretaceous-early Eocene mass extinctions in the deep sea, in: Global catastrophes in Earth history, An interdisciplinary conference on impacts, volcanism, and mass mortality, edited by: Sharpton, V. L. and Ward P. D., Geol. Soc. Am. Spec. Pap., 247, 481–495, 1990.
Thomas, E. and Shackleton, N. J.: The Paleocene-Eocene benthic foraminiferal extinction and stable isotope anomalies, Geological Society, London, Special Publications, 101, 401–441, https://doi.org/10.1144/GSL.SP.1996.101.01.20, 1996.
Tierney, J. E. and Tingley, M. P.: A Bayesian spatially-varying calibration model for the TEX86 proxy, Geochim. Cosmochim. Ac., 127, 83–106, https://doi.org/10.1016/j.gca.2013.11.02, 2014.
Torfstein, A., Winckler, G., and Tripati, A.: Productivity feedback did not terminate the Paleocene-Eocene Thermal Maximum (PETM), Clim. Past, 6, 265–272, https://doi.org/10.5194/cp-6-265-2010, 2010.
Trenberth, K. E.: Changes in precipitation with climate change, Clim. Res., 47, 123–138, https://doi.org/10.3354/cr00953, 2011.
Tribovillard, N., Riboulleau, A., Lyons, T., and Baudin, F.: Enhanced trapping of molybdenum by sulfurized marine organic matter of marine origin in Mesozoic limestones and shales, Chem. Geol., 213, 385–401, https://doi.org/10.1016/j.chemgeo.2004.08.011, 2004.
Tribovillard, N., Algeo, T. J., Lyons, T., and Riboulleau, A.: Trace metals as paleoredox and paleoproductivity proxies: an update, Chem. Geol., 232, 12–32, https://doi.org/10.1016/j.chemgeo.2006.02.012, 2006.
Tribovillard, N., Algeo, T. J., Baudin, F., and Riboulleau, A.: Analysis of marine environmental conditions based onmolybdenum–uranium covariation – Applications to Mesozoic paleoceanography, Chem. Geol., 324, 46–58, https://doi.org/10.1016/j.chemgeo.2011.09.009, 2012.
van der Meulen, B., Gingerich, P. D., Lourens, L. J., Meijer, N., van Broekhuizen, S., van Ginneken, S., and Abels, H. A.: Carbon isotope and mammal recovery from extreme greenhouse warming at the Paleocene–Eocene boundary in astronomically-calibrated fluvial strata, Bighorn Basin, Wyoming, USA, Earth Planet. Sc. Lett., 534, 116044, https://doi.org/10.1016/j.epsl.2019.116044, 2020.
Westerhold, T., Röhl, U., Wilkens, R. H., Gingerich, P. D., Clyde, W. C., Wing, S. L., Bowen, G. J., and Kraus, M. J.: Synchronizing early Eocene deep-sea and continental records – cyclostratigraphic age models for the Bighorn Basin Coring Project drill cores, Clim. Past, 14, 303–319, https://doi.org/10.5194/cp-14-303-2018, 2018.
Wieczorek, R., Fantle, M. S., Kump, L. R., and Ravizza, G.: Geochemical evidence for volcanic activity prior to and enhanced terrestrial weathering during the Paleocene Eocene Thermal Maximum, Geochim. Cosmochim. Ac., 119, 391–410, https://doi.org/10.1016/j.gca.2013.06.005, 2013.
Wilkinson, C. M., Ganerød, M., Hendriks, B. W., and Eide, E. A.: Compilation and appraisal of geochronological data from the North Atlantic Igneous Province (NAIP), Geological Society, London, Special Publications, 447, 69–103, https://doi.org/10.1144/SP447.10, 2017.
Yao, W., Paytan, A., and Wortmann, U. G.: Large-scale ocean deoxygenation during the Paleocene-Eocene Thermal Maximum, Science, 361, 804–806, https://doi.org/10.1126/science.aar8658, 2018.
Zachos, J. C., Röhl, U., Schellenberg, S. A., Sluijs, A., Hodell, D. A., Kelly, D. C., and McCarren, H.: Rapid acidification of the ocean during the Paleocene-Eocene thermal maximum, Science, 308, 1611–1615, https://doi.org/10.1126/science.1109004, 2005.
Zachos, J. C., Dickens, G. R., and Zeebe, R. E.: An early Cenozoic perspective on greenhouse warming and carbon-cycle dynamics, Nature, 451, 279–283, https://doi.org/10.1038/nature06588, 2008.
Zachos, J. C., McCarren, H., Murphy, B., Röhl, U., and Westerhold, T.: Tempo and scale of late Paleocene and early Eocene carbon isotope cycles: Implications for the origin of hyperthermals, Earth Planet. Sc. Lett., 299, 242–249, https://doi.org/10.1016/j.epsl.2010.09.004, 2010.
Zacke, A., Voigt, S., Joachimski, M. M., Gale, A. S., Ward, D. J., and Tütken, T.: Surface-water freshening and high-latitude river discharge in the Eocene North Sea, J. Geol. Soc., 166, 969–980, https://doi.org/10.1144/0016-76492008-068, 2009.
Zeebe, R. E., Zachos, J. C., and Dickens, G. R.: Carbon dioxide forcing alone insufficient to explain Palaeocene–Eocene Thermal Maximum warming, Nat. Geosci., 2, 576–580, https://doi.org/10.1038/ngeo578, 2009.
Zhou, X., Thomas, E., Rickaby, R. E., Winguth, A. M., and Lu, Z.: I/Ca evidence for upper ocean deoxygenation during the PETM, Paleoceanography, 29, 964–975, https://doi.org/10.1002/2014PA002702, 2014.